UNITED STATES
SECURITIES AND EXCHANGE COMMISSION
Washington, D.C. 20549
FORM N-CSR
CERTIFIED SHAREHOLDER REPORT OF REGISTERED
MANAGEMENT INVESTMENT COMPANIES
Investment Company Act file number 811-04118
Fidelity Securities Fund
(Exact name of registrant as specified in charter)
245 Summer St., Boston, Massachusetts 02210
(Address of principal executive offices) (Zip code)
Cynthia Lo Bessette, Secretary
245 Summer St.
Boston, Massachusetts 02210
(Name and address of agent for service)
Registrant's telephone number, including area code:
617-563-7000
| |
Date of fiscal year end: | July 31 |
|
|
Date of reporting period: | July 31, 2022 |
Item 1.
Reports to Stockholders
Fidelity® Blue Chip Growth Fund
Annual Report
July 31, 2022


Contents
To view a fund's proxy voting guidelines and proxy voting record for the 12-month period ended June 30, visit http://www.fidelity.com/proxyvotingresults or visit the Securities and Exchange Commission's (SEC) web site at http://www.sec.gov.
You may also call 1-800-544-8544 if you’re an individual investing directly with Fidelity, call 1-800-835-5092 if you’re a plan sponsor or participant with Fidelity as your recordkeeper or call 1-877-208-0098 on institutional accounts or if you’re an advisor or invest through one to request a free copy of the proxy voting guidelines.
Standard & Poor's, S&P and S&P 500 are registered service marks of The McGraw-Hill Companies, Inc. and have been licensed for use by Fidelity Distributors Corporation.
Other third-party marks appearing herein are the property of their respective owners.
All other marks appearing herein are registered or unregistered trademarks or service marks of FMR LLC or an affiliated company. © 2022 FMR LLC. All rights reserved.
This report and the financial statements contained herein are submitted for the general information of the shareholders of the Fund. This report is not authorized for distribution to prospective investors in the Fund unless preceded or accompanied by an effective prospectus.
A fund files its complete schedule of portfolio holdings with the SEC for the first and third quarters of each fiscal year on Form N-PORT. Forms N-PORT are available on the SEC’s web site at http://www.sec.gov. A fund's Forms N-PORT may be reviewed and copied at the SEC’s Public Reference Room in Washington, DC. Information regarding the operation of the SEC's Public Reference Room may be obtained by calling 1-800-SEC-0330.
For a complete list of a fund's portfolio holdings, view the most recent holdings listing, semiannual report, or annual report on Fidelity's web site at http://www.fidelity.com, http://www.institutional.fidelity.com, or http://www.401k.com, as applicable.
NOT FDIC INSURED •MAY LOSE VALUE •NO BANK GUARANTEE
Neither the Fund nor Fidelity Distributors Corporation is a bank.
Note to Shareholders:
Early in 2020, the outbreak and spread of COVID-19 emerged as a public health emergency that had a major influence on financial markets, primarily based on its impact on the global economy and corporate earnings. On March 11, 2020, the World Health Organization declared the COVID-19 outbreak a pandemic, citing sustained risk of further global spread. The pandemic prompted a number of measures to limit the spread of COVID-19, including travel and border restrictions, quarantines, and restrictions on large gatherings. In turn, these resulted in lower consumer activity, diminished demand for a wide range of products and services, disruption in manufacturing and supply chains, and – given the wide variability in outcomes regarding the outbreak – significant market uncertainty and volatility. To help stem the turmoil, the U.S. government took unprecedented action – in concert with the U.S. Federal Reserve and central banks around the world – to help support consumers, businesses, and the broader economy, and to limit disruption to the financial system.
In general, the overall impact of the pandemic lessened in 2021, amid a resilient economy and widespread distribution of three COVID-19 vaccines granted emergency use authorization from the U.S. Food and Drug Administration (FDA) early in the year. Still, the situation remains dynamic, and the extent and duration of its influence on financial markets and the economy is highly uncertain, due in part to a recent spike in cases based on highly contagious variants of the coronavirus.
Extreme events such as the COVID-19 crisis are exogenous shocks that can have significant adverse effects on mutual funds and their investments. Although multiple asset classes may be affected by market disruption, the duration and impact may not be the same for all types of assets. Fidelity is committed to helping you stay informed amid news about COVID-19 and during increased market volatility, and we continue to take extra steps to be responsive to customer needs. We encourage you to visit us online, where we offer ongoing updates, commentary, and analysis on the markets and our funds.
Performance: The Bottom Line
Average annual total return reflects the change in the value of an investment, assuming reinvestment of distributions from dividend income and capital gains (the profits earned upon the sale of securities that have grown in value, if any) and assuming a constant rate of performance each year. The hypothetical investment and the average annual total returns do not reflect the deduction of taxes that a shareholder would pay on fund distributions or the redemption of fund shares. During periods of reimbursement by Fidelity, a fund’s total return will be greater than it would be had the reimbursement not occurred. How a fund did yesterday is no guarantee of how it will do tomorrow.
Average Annual Total Returns
| For the periods ended July 31, 2022 | Past 1 year | Past 5 years | Past 10 years |
| Fidelity® Blue Chip Growth Fund | (22.85)% | 16.45% | 17.05% |
| Class K | (22.78)% | 16.55% | 17.17% |
$10,000 Over 10 Years
Let's say hypothetically that $10,000 was invested in Fidelity® Blue Chip Growth Fund, a class of the fund, on July 31, 2012.
The chart shows how the value of your investment would have changed, and also shows how the Russell 1000® Growth Index performed over the same period.
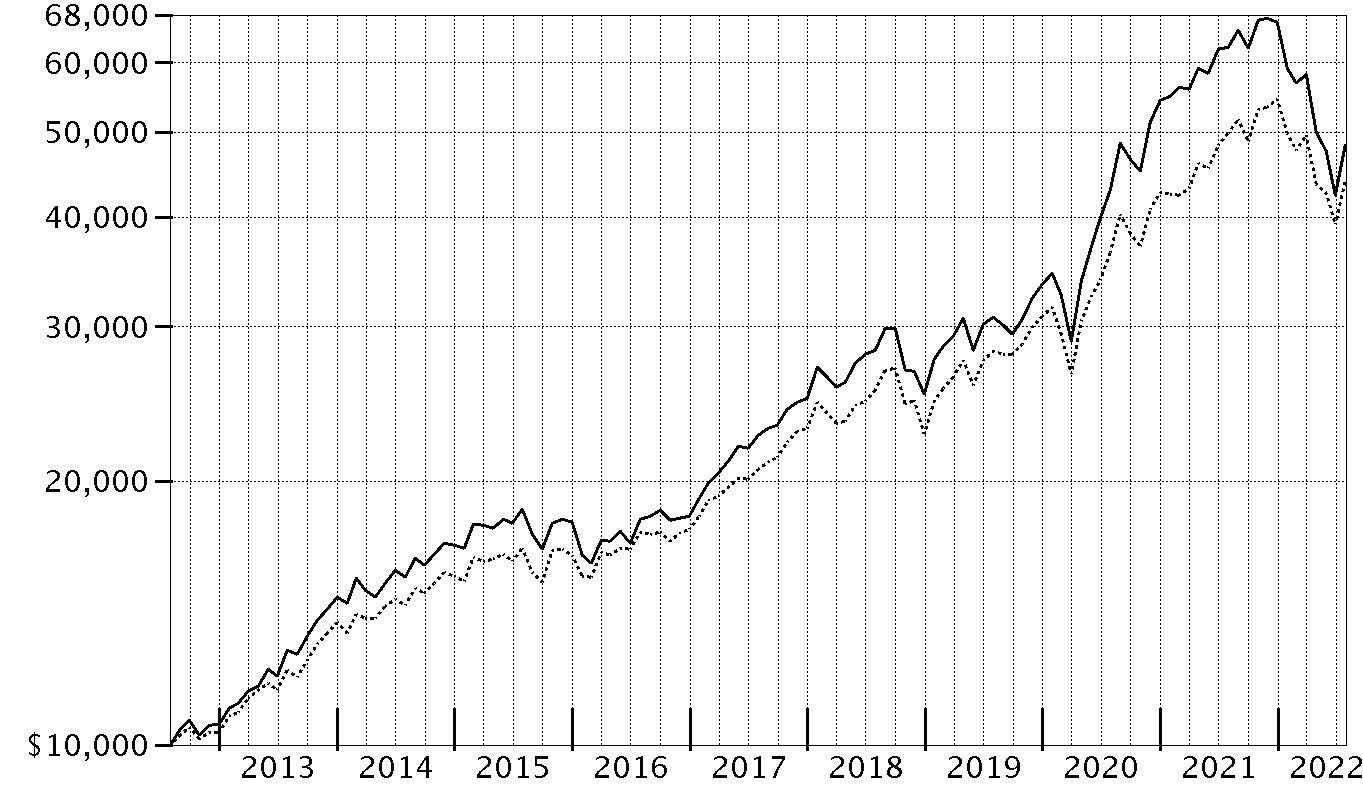
| Period Ending Values |
| $48,263 | Fidelity® Blue Chip Growth Fund |
| $43,927 | Russell 1000® Growth Index |
Management's Discussion of Fund Performance
Market Recap: The S&P 500
® index returned -4.64% for the 12 months ending July 31, 2022, as a multitude of crosscurrents challenged the global economy and financial markets. Persistently high inflation, exacerbated by energy price shocks from the Russia–Ukraine conflict, spurred the U.S. Federal Reserve to hike interest rates more aggressively than anticipated, and concerns about the outlook for economic growth sent stocks into bear market territory. In early May, the Fed approved a rare half-percentage-point interest rate increase and announced plans to shrink its $9 trillion asset portfolio. June began with the Fed allowing up to billions in Treasuries and mortgage bonds to mature every month without investing the proceeds. Two weeks later, the central bank raised rates by 0.75 percentage points, its largest increase since 1994, and said it was becoming more difficult to achieve a soft landing, in which the economy slows enough to bring down inflation while avoiding a recession. Against this volatile backdrop, the S&P 500 posted its worst first-half result (-19.96%) to begin a year since 1970. Stocks sharply reversed course in July (+9.22%), as the Fed again raised its benchmark interest rate by 0.75% but signaled that, at some point, it will likely slow the pace of tightening to assess the impact on the economy. For the full 12 months, growth-oriented communication services (-29%) and consumer discretionary (-10%) stocks lagged most. In contrast, energy (+67%) rode a surge in commodity prices and led by a wide margin, followed by the defensive utilities (+16%) and consumer staples (+7%) sectors.
Comments from Portfolio Manager Sonu Kalra: For the fiscal year ending July 31, 2022, the fund's share classes returned about -23%, underperforming the -11.93% result of the benchmark Russell 1000
® Growth Index. Versus the benchmark, security selection was the primary detractor. Weak picks in the consumer discretionary and information technology sectors hampered the fund's relative result. Also hindering our result was stock selection in the industrials sector, primarily within the transportation industry. The biggest individual relative detractor was an overweight position in Lyft (-75%). The fund's stake in Snap returned about -87%. We increased our non-benchmark stake in the company the past year. Another notable relative detractor was an overweighting in Carvana (-92%). This period we added to our stake. Conversely, the top contributor to performance versus the benchmark was an overweighting in energy. Stock selection in materials also helped. The fund's non-benchmark stake in Celsius Holdings (+30%) was a notable relative contributor. We increased our position in the company the past year. An outsized stake in Dollar Tree (+73%), a position we established this period, also contributed, as did an overweighting in energy company Hess (+49%), a position we added to during the past 12 months. Notable changes in positioning include a lower allocation to the communication services and industrials sectors.
The views expressed above reflect those of the portfolio manager(s) only through the end of the period as stated on the cover of this report and do not necessarily represent the views of Fidelity or any other person in the Fidelity organization. Any such views are subject to change at any time based upon market or other conditions and Fidelity disclaims any responsibility to update such views. These views may not be relied on as investment advice and, because investment decisions for a Fidelity fund are based on numerous factors, may not be relied on as an indication of trading intent on behalf of any Fidelity fund.
Investment Summary (Unaudited)
Top Ten Stocks as of July 31, 2022
| | % of fund's net assets |
| Apple, Inc. | 12.7 |
| Microsoft Corp. | 8.6 |
| Amazon.com, Inc. | 7.8 |
| Alphabet, Inc. Class A | 6.2 |
| NVIDIA Corp. | 5.4 |
| Tesla, Inc. | 4.7 |
| Marvell Technology, Inc. | 3.5 |
| Meta Platforms, Inc. Class A | 2.2 |
| Lowe's Companies, Inc. | 1.6 |
| NXP Semiconductors NV | 1.6 |
| | 54.3 |
Market Sectors as of July 31, 2022
| | % of fund's net assets |
| Information Technology | 41.1 |
| Consumer Discretionary | 29.8 |
| Communication Services | 10.6 |
| Health Care | 7.0 |
| Energy | 4.7 |
| Industrials | 2.7 |
| Materials | 1.5 |
| Consumer Staples | 1.4 |
| Financials | 1.0 |
| Real Estate | 0.1 |
| Utilities | 0.1 |
Asset Allocation (% of fund's net assets)
| As of July 31, 2022 |
| | Stocks | 97.8% |
| | Convertible Securities | 2.1% |
| | Other Investments | 0.1% |

Foreign investments - 7.2%
Schedule of Investments July 31, 2022
Showing Percentage of Net Assets
| Common Stocks - 97.5% | | | |
| | | Shares | Value (000s) |
| COMMUNICATION SERVICES - 10.5% | | | |
| Diversified Telecommunication Services - 0.0% | | | |
| Starry, Inc. | | 2,949,276 | $8,966 |
| Entertainment - 1.5% | | | |
| Bilibili, Inc. ADR (a)(b) | | 2,827,543 | 69,105 |
| Endeavor Group Holdings, Inc. (a) | | 1,711,779 | 39,011 |
| Netflix, Inc. (a) | | 1,959,212 | 440,627 |
| Sea Ltd. ADR (a) | | 862,324 | 65,813 |
| Universal Music Group NV | | 830,603 | 18,802 |
| | | | 633,358 |
| Interactive Media & Services - 8.9% | | | |
| Alphabet, Inc. Class A (a) | | 21,783,040 | 2,533,803 |
| Meta Platforms, Inc. Class A (a) | | 5,642,325 | 897,694 |
| Snap, Inc. Class A (a) | | 23,165,555 | 228,876 |
| | | | 3,660,373 |
| Wireless Telecommunication Services - 0.1% | | | |
| T-Mobile U.S., Inc. (a) | | 239,592 | 34,276 |
|
| TOTAL COMMUNICATION SERVICES | | | 4,336,973 |
|
| CONSUMER DISCRETIONARY - 29.2% | | | |
| Automobiles - 5.3% | | | |
| Neutron Holdings, Inc. (a)(c)(d) | | 7,152,433 | 197 |
| Rad Power Bikes, Inc. (a)(c)(d) | | 928,091 | 4,835 |
| Rivian Automotive, Inc. (e) | | 305,005 | 10,462 |
| Rivian Automotive, Inc. (b) | | 3,719,386 | 127,575 |
| Tesla, Inc. (a) | | 2,175,437 | 1,939,293 |
| XPeng, Inc. ADR (a) | | 3,465,612 | 84,665 |
| | | | 2,167,027 |
| Hotels, Restaurants & Leisure - 3.9% | | | |
| Airbnb, Inc. Class A (a)(b) | | 3,568,710 | 396,055 |
| Booking Holdings, Inc. (a) | | 40,739 | 78,858 |
| Caesars Entertainment, Inc. (a) | | 3,785,260 | 172,949 |
| Chipotle Mexican Grill, Inc. (a) | | 149,324 | 233,576 |
| Hilton Worldwide Holdings, Inc. | | 1,064,692 | 136,355 |
| Marriott International, Inc. Class A | | 1,375,360 | 218,435 |
| Penn National Gaming, Inc. (a) | | 7,213,931 | 249,241 |
| Sonder Holdings, Inc. (a) | | 891,027 | 1,381 |
| Sonder Holdings, Inc.: | | | |
| rights (a)(d) | | 16,222 | 7 |
| rights (a)(d) | | 16,221 | 6 |
| rights (a)(d) | | 16,222 | 6 |
| rights (a)(d) | | 16,221 | 5 |
| rights (a)(d) | | 16,221 | 5 |
| rights (a)(d) | | 16,221 | 4 |
| Sweetgreen, Inc. Class A(b) | | 6,887,711 | 108,206 |
| | | | 1,595,089 |
| Internet & Direct Marketing Retail - 10.4% | | | |
| Alibaba Group Holding Ltd. sponsored ADR (a) | | 850,750 | 76,032 |
| Amazon.com, Inc. (a) | | 23,712,200 | 3,199,961 |
| Deliveroo PLC Class A (a)(e) | | 11,930,913 | 13,170 |
| FSN E-Commerce Ventures Private Ltd. (a)(c) | | 6,140,430 | 97,301 |
| JD.com, Inc.: | | | |
| Class A | | 122,968 | 3,668 |
| sponsored ADR | | 1,434,834 | 85,373 |
| Lyft, Inc. (a) | | 17,847,020 | 247,360 |
| Pinduoduo, Inc. ADR (a) | | 2,224,330 | 109,014 |
| Uber Technologies, Inc. (a) | | 17,173,353 | 402,715 |
| Wayfair LLC Class A (a) | | 1,026,816 | 55,356 |
| | | | 4,289,950 |
| Multiline Retail - 1.1% | | | |
| Dollar Tree, Inc. (a) | | 2,305,048 | 381,163 |
| Ollie's Bargain Outlet Holdings, Inc. (a) | | 782,450 | 46,125 |
| Target Corp. | | 256,666 | 41,934 |
| | | | 469,222 |
| Specialty Retail - 4.6% | | | |
| American Eagle Outfitters, Inc. (b)(f) | | 9,635,167 | 116,007 |
| Burlington Stores, Inc. (a) | | 482,113 | 68,041 |
| Carvana Co. Class A (a)(b) | | 4,721,711 | 137,638 |
| Fanatics, Inc. Class A (c)(d) | | 1,693,889 | 109,459 |
| Five Below, Inc. (a) | | 1,335,420 | 169,692 |
| Floor & Decor Holdings, Inc. Class A (a)(b) | | 1,218,497 | 98,174 |
| Lowe's Companies, Inc. | | 3,485,017 | 667,485 |
| RH (a) | | 675,010 | 188,618 |
| TJX Companies, Inc. | | 3,449,022 | 210,942 |
| Victoria's Secret & Co. (a) | | 2,374,150 | 87,749 |
| Warby Parker, Inc. (a)(b) | | 3,932,771 | 48,727 |
| | | | 1,902,532 |
| Textiles, Apparel & Luxury Goods - 3.9% | | | |
| Capri Holdings Ltd. (a) | | 4,267,429 | 207,738 |
| Crocs, Inc. (a) | | 2,628,223 | 188,286 |
| Deckers Outdoor Corp. (a) | | 753,002 | 235,848 |
| Hermes International SCA | | 11,493 | 15,670 |
| lululemon athletica, Inc. (a) | | 1,407,975 | 437,190 |
| LVMH Moet Hennessy Louis Vuitton SE | | 124,961 | 86,767 |
| NIKE, Inc. Class B | | 3,061,791 | 351,861 |
| On Holding AG | | 2,530,472 | 55,088 |
| Tory Burch LLC (a)(c)(d)(g) | | 293,611 | 14,214 |
| | | | 1,592,662 |
|
| TOTAL CONSUMER DISCRETIONARY | | | 12,016,482 |
|
| CONSUMER STAPLES - 1.3% | | | |
| Beverages - 1.0% | | | |
| Boston Beer Co., Inc. Class A (a) | | 163,473 | 62,190 |
| Celsius Holdings, Inc. (a)(b) | | 3,507,810 | 312,055 |
| Constellation Brands, Inc. Class A (sub. vtg.) | | 75,200 | 18,523 |
| | | | 392,768 |
| Food & Staples Retailing - 0.2% | | | |
| Albertsons Companies, Inc. | | 797,946 | 21,425 |
| BJ's Wholesale Club Holdings, Inc. (a) | | 427,520 | 28,943 |
| Blink Health LLC Series A1 (a)(c)(d) | | 51,117 | 1,939 |
| Sysco Corp. | | 371,771 | 31,563 |
| Walmart, Inc. | | 29,836 | 3,940 |
| | | | 87,810 |
| Food Products - 0.0% | | | |
| The Real Good Food Co. LLC: | | | |
| Class B (d)(f) | | 1,262,073 | 0 |
| Class B unit (e)(f) | | 1,262,073 | 8,203 |
| The Real Good Food Co., Inc. (f) | | 48,238 | 314 |
| | | | 8,517 |
| Household Products - 0.1% | | | |
| Procter & Gamble Co. | | 307,340 | 42,693 |
| Tobacco - 0.0% | | | |
| JUUL Labs, Inc.: | | | |
| Class A (a)(c)(d) | | 21,148 | 163 |
| Class B (a)(c)(d) | | 6,625 | 51 |
| | | | 214 |
|
| TOTAL CONSUMER STAPLES | | | 532,002 |
|
| ENERGY - 4.7% | | | |
| Energy Equipment & Services - 0.1% | | | |
| Halliburton Co. | | 981,543 | 28,759 |
| Schlumberger Ltd. | | 119,800 | 4,436 |
| U.S. Silica Holdings, Inc. (a) | | 523,671 | 7,242 |
| | | | 40,437 |
| Oil, Gas & Consumable Fuels - 4.6% | | | |
| Antero Resources Corp. (a) | | 2,005,681 | 79,505 |
| Cenovus Energy, Inc. (Canada) | | 1,885,138 | 35,920 |
| Cheniere Energy, Inc. | | 289,183 | 43,256 |
| Denbury, Inc. (a) | | 705,103 | 50,704 |
| Devon Energy Corp. | | 1,822,843 | 114,566 |
| Diamondback Energy, Inc. | | 1,273,424 | 163,024 |
| EOG Resources, Inc. | | 1,606,058 | 178,626 |
| EQT Corp. | | 392,459 | 17,280 |
| Equinor ASA | | 376,771 | 14,507 |
| Exxon Mobil Corp. | | 1,212,503 | 117,528 |
| Hess Corp. | | 1,932,676 | 217,368 |
| Imperial Oil Ltd. | | 382,158 | 18,315 |
| Marathon Oil Corp. (b) | | 2,095,729 | 51,974 |
| Northern Oil & Gas, Inc. | | 511,782 | 14,755 |
| Occidental Petroleum Corp. | | 1,575,252 | 103,573 |
| Ovintiv, Inc. | | 171,330 | 8,753 |
| Phillips 66 Co. | | 1,153,260 | 102,640 |
| Pioneer Natural Resources Co. | | 684,404 | 162,170 |
| Range Resources Corp. (a) | | 228,465 | 7,555 |
| Reliance Industries Ltd. | | 6,959,093 | 221,079 |
| Reliance Industries Ltd. sponsored GDR (e) | | 291,622 | 18,401 |
| Valero Energy Corp. | | 1,222,942 | 135,465 |
| | | | 1,876,964 |
|
| TOTAL ENERGY | | | 1,917,401 |
|
| FINANCIALS - 1.0% | | | |
| Banks - 0.3% | | | |
| Kotak Mahindra Bank Ltd. | | 779,186 | 17,874 |
| Wells Fargo & Co. | | 2,364,611 | 103,735 |
| | | | 121,609 |
| Consumer Finance - 0.5% | | | |
| American Express Co. | | 1,414,549 | 217,869 |
| Diversified Financial Services - 0.1% | | | |
| Ant International Co. Ltd. Class C (a)(c)(d) | | 6,428,801 | 12,150 |
| Berkshire Hathaway, Inc. Class B (a) | | 42,267 | 12,705 |
| Rapyd Financial Network 2016 Ltd. (a)(c)(d) | | 204,327 | 14,013 |
| | | | 38,868 |
| Thrifts & Mortgage Finance - 0.1% | | | |
| Housing Development Finance Corp. Ltd. | | 697,722 | 21,032 |
|
| TOTAL FINANCIALS | | | 399,378 |
|
| HEALTH CARE - 7.0% | | | |
| Biotechnology - 1.2% | | | |
| Alnylam Pharmaceuticals, Inc. (a) | | 700,793 | 99,541 |
| Arcutis Biotherapeutics, Inc. (a) | | 468,796 | 11,373 |
| Argenx SE ADR (a) | | 89,447 | 32,577 |
| Ascendis Pharma A/S sponsored ADR (a) | | 431,406 | 36,898 |
| Avidity Biosciences, Inc. (a) | | 191,213 | 3,115 |
| Cibus Corp.: | | | |
| Series C (a)(c)(d)(g) | | 3,045,600 | 7,523 |
| Series D (a)(c)(d)(g) | | 1,716,640 | 4,240 |
| Series E (a)(c)(d)(g) | | 2,099,645 | 5,186 |
| CytomX Therapeutics, Inc. (a)(e) | | 378,621 | 541 |
| Generation Bio Co. (a) | | 797,756 | 5,090 |
| Horizon Therapeutics PLC (a) | | 1,630,728 | 135,302 |
| Instil Bio, Inc. (a) | | 538,310 | 3,036 |
| Karuna Therapeutics, Inc. (a) | | 170,670 | 22,230 |
| Regeneron Pharmaceuticals, Inc. (a) | | 99,193 | 57,700 |
| Vertex Pharmaceuticals, Inc. (a) | | 252,108 | 70,694 |
| Verve Therapeutics, Inc. (a) | | 461,600 | 11,365 |
| | | | 506,411 |
| Health Care Equipment & Supplies - 1.2% | | | |
| Axonics Modulation Technologies, Inc. (a) | | 713,323 | 46,273 |
| DexCom, Inc. (a) | | 2,347,105 | 192,650 |
| Insulet Corp. (a) | | 302,241 | 74,895 |
| Oddity Tech Ltd. (c)(d) | | 23,418 | 8,174 |
| Shockwave Medical, Inc. (a)(b) | | 866,519 | 182,775 |
| | | | 504,767 |
| Health Care Providers & Services - 1.6% | | | |
| agilon health, Inc. (a) | | 372,220 | 9,317 |
| Alignment Healthcare, Inc. (a) | | 908,865 | 13,342 |
| Centene Corp. (a) | | 318,112 | 29,575 |
| Cigna Corp. | | 27,769 | 7,646 |
| Elevance Health, Inc. | | 25,336 | 12,088 |
| Guardant Health, Inc. (a) | | 1,984,311 | 99,553 |
| LifeStance Health Group, Inc. (a) | | 1,408,577 | 8,395 |
| Surgery Partners, Inc. (a) | | 576,680 | 22,710 |
| UnitedHealth Group, Inc. | | 825,737 | 447,830 |
| | | | 650,456 |
| Health Care Technology - 0.0% | | | |
| Certara, Inc. (a) | | 381,033 | 8,760 |
| MultiPlan Corp. warrants (a)(c) | | 138,859 | 88 |
| | | | 8,848 |
| Life Sciences Tools & Services - 0.8% | | | |
| 10X Genomics, Inc. (a) | | 185,604 | 7,452 |
| Danaher Corp. | | 608,592 | 177,386 |
| ICON PLC (a) | | 100,090 | 24,147 |
| Olink Holding AB ADR (a) | | 625,354 | 8,411 |
| Seer, Inc. (a) | | 315,323 | 2,838 |
| Thermo Fisher Scientific, Inc. | | 148,042 | 88,590 |
| Veterinary Emergency Group LLC Class A (c)(d)(g) | | 524,494 | 27,470 |
| | | | 336,294 |
| Pharmaceuticals - 2.2% | | | |
| AstraZeneca PLC sponsored ADR | | 66,457 | 4,401 |
| Chiasma, Inc. warrants 12/16/24 (a)(d) | | 55,391 | 0 |
| Eli Lilly & Co. | | 1,534,868 | 506,031 |
| Nuvation Bio, Inc. (a) | | 46,151 | 127 |
| Roche Holding AG (participation certificate) | | 45,901 | 15,239 |
| Sanofi SA sponsored ADR | | 81,256 | 4,038 |
| Zoetis, Inc. Class A | | 1,922,381 | 350,931 |
| | | | 880,767 |
|
| TOTAL HEALTH CARE | | | 2,887,543 |
|
| INDUSTRIALS - 2.2% | | | |
| Aerospace & Defense - 1.1% | | | |
| Airbus Group NV | | 275,948 | 29,753 |
| General Dynamics Corp. | | 36,959 | 8,377 |
| Howmet Aerospace, Inc. | | 1,116,509 | 41,456 |
| L3Harris Technologies, Inc. | | 137,344 | 32,958 |
| Lockheed Martin Corp. | | 57,324 | 23,721 |
| Northrop Grumman Corp. | | 53,257 | 25,505 |
| Space Exploration Technologies Corp.: | | | |
| Class A (a)(c)(d) | | 2,961,836 | 207,329 |
| Class C (a)(c)(d) | | 27,830 | 1,948 |
| The Boeing Co. (a) | | 628,270 | 100,090 |
| | | | 471,137 |
| Air Freight & Logistics - 0.0% | | | |
| Delhivery Private Ltd. (c) | | 2,469,600 | 17,786 |
| Electrical Equipment - 0.5% | | | |
| Acuity Brands, Inc. | | 697,125 | 127,156 |
| Generac Holdings, Inc. (a) | | 222,771 | 59,769 |
| | | | 186,925 |
| Industrial Conglomerates - 0.1% | | | |
| General Electric Co. | | 751,170 | 55,519 |
| Machinery - 0.2% | | | |
| Deere & Co. | | 184,695 | 63,384 |
| Road & Rail - 0.3% | | | |
| Avis Budget Group, Inc. (a) | | 309,353 | 56,312 |
| Bird Global, Inc. (a)(c) | | 1,821,129 | 980 |
| Bird Global, Inc.: | | | |
| Class A (a)(b) | | 10,668,977 | 5,740 |
| rights (a)(d) | | 262,923 | 5 |
| rights (a)(d) | | 262,922 | 3 |
| rights (a)(d) | | 262,922 | 0 |
| Hertz Global Holdings, Inc. (b) | | 2,632,126 | 56,380 |
| | | | 119,420 |
|
| TOTAL INDUSTRIALS | | | 914,171 |
|
| INFORMATION TECHNOLOGY - 40.1% | | | |
| IT Services - 2.3% | | | |
| MasterCard, Inc. Class A | | 1,276,790 | 451,716 |
| MongoDB, Inc. Class A (a) | | 165,249 | 51,635 |
| Okta, Inc. (a) | | 1,451,786 | 142,928 |
| Shift4 Payments, Inc. (a)(b) | | 977,754 | 35,620 |
| Snowflake, Inc. (a)(b) | | 244,820 | 36,701 |
| Toast, Inc. | | 26,343 | 421 |
| Twilio, Inc. Class A (a) | | 1,632,351 | 138,423 |
| Visa, Inc. Class A | | 373,154 | 79,150 |
| | | | 936,594 |
| Semiconductors & Semiconductor Equipment - 13.4% | | | |
| Advanced Micro Devices, Inc. (a) | | 3,239,267 | 306,014 |
| ASML Holding NV | | 88,068 | 50,590 |
| Cirrus Logic, Inc. (a) | | 668,807 | 57,156 |
| Enphase Energy, Inc. (a) | | 20,200 | 5,740 |
| GlobalFoundries, Inc. | | 3,182,075 | 163,813 |
| Lam Research Corp. | | 155,867 | 78,013 |
| Marvell Technology, Inc. | | 25,696,431 | 1,430,777 |
| Monolithic Power Systems, Inc. | | 129,615 | 60,235 |
| NVIDIA Corp. | | 12,273,845 | 2,229,298 |
| NXP Semiconductors NV | | 3,629,074 | 667,314 |
| onsemi (a) | | 2,435,192 | 162,622 |
| SolarEdge Technologies, Inc. (a) | | 28,700 | 10,336 |
| Synaptics, Inc. (a) | | 163,391 | 23,684 |
| Taiwan Semiconductor Manufacturing Co. Ltd. sponsored ADR | | 798,763 | 70,675 |
| Teradyne, Inc. | | 1,658,914 | 167,368 |
| | | | 5,483,635 |
| Software - 11.7% | | | |
| Atlassian Corp. PLC (a) | | 109,203 | 22,858 |
| Atom Tickets LLC (a)(c)(d)(g) | | 1,204,239 | 0 |
| Bill.Com Holdings, Inc. (a)(b) | | 346,730 | 46,836 |
| Coupa Software, Inc. (a) | | 735,477 | 48,115 |
| Crowdstrike Holdings, Inc. (a)(b) | | 460,813 | 84,605 |
| Datadog, Inc. Class A (a) | | 439,209 | 44,804 |
| EngageSmart, Inc. | | 508,369 | 9,593 |
| Epic Games, Inc. (a)(c)(d) | | 6,131 | 5,702 |
| HubSpot, Inc. (a)(b) | | 414,399 | 127,635 |
| Intuit, Inc. | | 378,306 | 172,572 |
| Microsoft Corp. | | 12,559,839 | 3,526,049 |
| Paycom Software, Inc. (a) | | 99,402 | 32,851 |
| Pine Labs Private Ltd. (a)(c)(d) | | 9,912 | 5,547 |
| Riskified Ltd. Class A (e) | | 77,625 | 341 |
| Salesforce.com, Inc. (a) | | 2,558,606 | 470,835 |
| ServiceNow, Inc. (a) | | 209,828 | 93,722 |
| Stripe, Inc. Class B (a)(c)(d) | | 173,600 | 5,021 |
| Tanium, Inc. Class B (a)(c)(d) | | 554,900 | 5,455 |
| Zoom Video Communications, Inc. Class A (a)(b) | | 1,019,348 | 105,869 |
| | | | 4,808,410 |
| Technology Hardware, Storage & Peripherals - 12.7% | | | |
| Apple, Inc. | | 32,219,275 | 5,235,953 |
|
| TOTAL INFORMATION TECHNOLOGY | | | 16,464,592 |
|
| MATERIALS - 1.3% | | | |
| Chemicals - 0.9% | | | |
| Cabot Corp. | | 300,627 | 22,325 |
| CF Industries Holdings, Inc. | | 897,620 | 85,714 |
| Nutrien Ltd. (b) | | 1,650,701 | 141,306 |
| The Mosaic Co. | | 2,126,540 | 111,984 |
| | | | 361,329 |
| Metals & Mining - 0.4% | | | |
| Freeport-McMoRan, Inc. | | 5,444,001 | 171,758 |
|
| TOTAL MATERIALS | | | 533,087 |
|
| REAL ESTATE - 0.1% | | | |
| Equity Real Estate Investment Trusts (REITs) - 0.0% | | | |
| Welltower, Inc. | | 43,770 | 3,779 |
| Real Estate Management & Development - 0.1% | | | |
| WeWork, Inc. (a)(b) | | 11,722,600 | 55,917 |
|
| TOTAL REAL ESTATE | | | 59,696 |
|
| UTILITIES - 0.1% | | | |
| Electric Utilities - 0.0% | | | |
| ORSTED A/S (e) | | 86,808 | 10,106 |
| Multi-Utilities - 0.1% | | | |
| Sempra Energy | | 93,061 | 15,430 |
|
| TOTAL UTILITIES | | | 25,536 |
|
| TOTAL COMMON STOCKS | | | |
| (Cost $22,446,858) | | | 40,086,861 |
|
| Preferred Stocks - 2.3% | | | |
| Convertible Preferred Stocks - 2.0% | | | |
| COMMUNICATION SERVICES - 0.1% | | | |
| Interactive Media & Services - 0.1% | | | |
| Reddit, Inc.: | | | |
| Series B (a)(c)(d) | | 524,232 | 20,623 |
| Series E (a)(c)(d) | | 43,813 | 1,724 |
| Series F (c)(d) | | 457,142 | 17,984 |
| | | | 40,331 |
| CONSUMER DISCRETIONARY - 0.3% | | | |
| Automobiles - 0.0% | | | |
| Rad Power Bikes, Inc.: | | | |
| Series A (a)(c)(d) | | 120,997 | 630 |
| Series C (a)(c)(d) | | 476,111 | 2,481 |
| Series D (c)(d) | | 867,000 | 4,517 |
| | | | 7,628 |
| Hotels, Restaurants & Leisure - 0.1% | | | |
| Discord, Inc. Series I (c)(d) | | 6,100 | 2,336 |
| MOD Super Fast Pizza Holdings LLC: | | | |
| Series 3 (a)(c)(d)(g) | | 68,723 | 16,915 |
| Series 4 (a)(c)(d)(g) | | 6,272 | 1,470 |
| Series 5 (a)(c)(d)(g) | | 25,187 | 5,496 |
| | | | 26,217 |
| Internet & Direct Marketing Retail - 0.2% | | | |
| GoBrands, Inc.: | | | |
| Series G (a)(c)(d) | | 166,200 | 37,915 |
| Series H (c)(d) | | 104,029 | 23,732 |
| Instacart, Inc.: | | | |
| Series H (a)(c)(d) | | 245,379 | 12,890 |
| Series I (a)(c)(d) | | 118,846 | 6,243 |
| | | | 80,780 |
| Textiles, Apparel & Luxury Goods - 0.0% | | | |
| Algolia SAS Series D (c)(d) | | 276,495 | 5,079 |
| CelLink Corp. Series D (c)(d) | | 771,513 | 14,319 |
| | | | 19,398 |
| TOTAL CONSUMER DISCRETIONARY | | | 134,023 |
| CONSUMER STAPLES - 0.1% | | | |
| Food & Staples Retailing - 0.0% | | | |
| Blink Health LLC Series C (a)(c)(d) | | 170,685 | 6,476 |
| Food Products - 0.0% | | | |
| AgBiome LLC Series C (a)(c)(d) | | 1,091,300 | 6,919 |
| Bowery Farming, Inc. Series C1 (a)(c)(d) | | 161,262 | 5,339 |
| | | | 12,258 |
| Tobacco - 0.1% | | | |
| JUUL Labs, Inc.: | | | |
| Series C (a)(c)(d) | | 2,570,575 | 19,793 |
| Series D (a)(c)(d) | | 13,822 | 106 |
| Series E (a)(c)(d) | | 14,959 | 115 |
| | | | 20,014 |
| TOTAL CONSUMER STAPLES | | | 38,748 |
| HEALTH CARE - 0.0% | | | |
| Biotechnology - 0.0% | | | |
| Castle Creek Biosciences, Inc. Series D2 (c)(d) | | 5,347 | 1,089 |
| Pharmaceuticals - 0.0% | | | |
| Castle Creek Pharmaceutical Holdings, Inc. Series B (a)(c)(d) | | 3,301 | 731 |
| TOTAL HEALTH CARE | | | 1,820 |
| INDUSTRIALS - 0.5% | | | |
| Aerospace & Defense - 0.5% | | | |
| ABL Space Systems: | | | |
| Series B (a)(c)(d) | | 270,130 | 14,363 |
| Series B2 (c)(d) | | 141,569 | 7,527 |
| Relativity Space, Inc. Series E (a)(c)(d) | | 2,480,614 | 49,240 |
| Space Exploration Technologies Corp.: | | | |
| Series G (a)(c)(d) | | 97,277 | 68,094 |
| Series H (a)(c)(d) | | 25,767 | 18,037 |
| Series N (a)(c)(d) | | 79,406 | 55,584 |
| | | | 212,845 |
| Construction & Engineering - 0.0% | | | |
| Beta Technologies, Inc. Series A (a)(c)(d) | | 101,010 | 10,421 |
| TOTAL INDUSTRIALS | | | 223,266 |
| INFORMATION TECHNOLOGY - 0.8% | | | |
| Communications Equipment - 0.1% | | | |
| Meesho Series F (c)(d) | | 546,589 | 37,239 |
| Xsight Labs Ltd. Series D (a)(c)(d) | | 1,192,000 | 8,916 |
| | | | 46,155 |
| Electronic Equipment & Components - 0.1% | | | |
| Enevate Corp. Series E (a)(c)(d) | | 12,084,432 | 13,398 |
| Menlo Micro, Inc. Series C (c)(d) | | 4,680,700 | 4,926 |
| | | | 18,324 |
| IT Services - 0.1% | | | |
| AppNexus, Inc. Series E (Escrow) (a)(c)(d) | | 646,522 | 20 |
| ByteDance Ltd. Series E1 (a)(c)(d) | | 293,038 | 42,063 |
| Yanka Industries, Inc. Series F (a)(c)(d) | | 508,854 | 10,162 |
| | | | 52,245 |
| Semiconductors & Semiconductor Equipment - 0.2% | | | |
| Alif Semiconductor Series C (c)(d) | | 391,847 | 7,954 |
| Astera Labs, Inc.: | | | |
| Series A (c)(d) | | 672,992 | 6,844 |
| Series B (c)(d) | | 114,587 | 1,165 |
| Series C (c)(d) | | 1,572,300 | 15,990 |
| Series D (c)(d) | | 2,623,426 | 26,679 |
| GaN Systems, Inc.: | | | |
| Series F1 (c)(d) | | 661,660 | 4,440 |
| Series F2 (c)(d) | | 349,385 | 2,344 |
| SiMa.ai: | | | |
| Series B (a)(c)(d) | | 2,821,200 | 20,005 |
| Series B1 (c)(d) | | 188,978 | 1,340 |
| | | | 86,761 |
| Software - 0.3% | | | |
| Bolt Technology OU Series E (c)(d) | | 170,267 | 26,892 |
| Databricks, Inc.: | | | |
| Series G (a)(c)(d) | | 145,986 | 23,098 |
| Series H (c)(d) | | 91,308 | 14,447 |
| Dataminr, Inc. Series D (a)(c)(d) | | 277,250 | 6,027 |
| Delphix Corp. Series D (a)(c)(d) | | 675,445 | 4,924 |
| Jet.Com, Inc. Series B1 (Escrow) (a)(c)(d) | | 2,928,086 | 0 |
| Malwarebytes Corp. Series B (a)(c)(d) | | 1,056,193 | 20,258 |
| Mountain Digital, Inc. Series D (c)(d) | | 524,265 | 7,654 |
| Nuvia, Inc. Series B (a)(c) | | 1,606,942 | 1,313 |
| Skyryse, Inc. Series B (c)(d) | | 560,000 | 13,138 |
| Stripe, Inc. Series H (a)(c)(d) | | 73,100 | 2,114 |
| Tenstorrent, Inc. Series C1 (a)(c)(d) | | 77,800 | 4,379 |
| | | | 124,244 |
| TOTAL INFORMATION TECHNOLOGY | | | 327,729 |
| MATERIALS - 0.2% | | | |
| Metals & Mining - 0.2% | | | |
| Diamond Foundry, Inc. Series C (a)(c)(d) | | 2,271,329 | 70,729 |
| UTILITIES - 0.0% | | | |
| Independent Power and Renewable Electricity Producers - 0.0% | | | |
| Redwood Materials Series C (a)(c)(d) | | 341,408 | 11,147 |
|
| TOTAL CONVERTIBLE PREFERRED STOCKS | | | 847,793 |
|
| Nonconvertible Preferred Stocks - 0.3% | | | |
| CONSUMER DISCRETIONARY - 0.2% | | | |
| Automobiles - 0.0% | | | |
| Neutron Holdings, Inc.: | | | |
| Series 1C (a)(c)(d) | | 50,654,200 | 1,393 |
| Series 1D (a)(c)(d) | | 85,315,542 | 2,346 |
| Waymo LLC Series A2 (a)(c)(d) | | 81,316 | 5,052 |
| | | | 8,791 |
| Internet & Direct Marketing Retail - 0.2% | | | |
| Circle Internet Financial Ltd. Series E (c) | | 1,244,183 | 60,401 |
| TOTAL CONSUMER DISCRETIONARY | | | 69,192 |
| HEALTH CARE - 0.0% | | | |
| Pharmaceuticals - 0.0% | | | |
| Castle Creek Pharmaceutical Holdings, Inc. Series A4 (a)(c)(d) | | 29,758 | 6,440 |
| INFORMATION TECHNOLOGY - 0.1% | | | |
| IT Services - 0.0% | | | |
| Gupshup, Inc. (a)(c)(d) | | 709,497 | 13,104 |
| Software - 0.1% | | | |
| Pine Labs Private Ltd.: | | | |
| Series 1 (a)(c)(d) | | 23,689 | 13,256 |
| Series A (a)(c)(d) | | 5,920 | 3,313 |
| Series B (a)(c)(d) | | 6,440 | 3,604 |
| Series B2 (a)(c)(d) | | 5,209 | 2,915 |
| Series C (a)(c)(d) | | 9,690 | 5,423 |
| Series C1 (a)(c)(d) | | 2,041 | 1,142 |
| Series D (a)(c)(d) | | 2,183 | 1,222 |
| | | | 30,875 |
| TOTAL INFORMATION TECHNOLOGY | | | 43,979 |
|
| TOTAL NONCONVERTIBLE PREFERRED STOCKS | | | 119,611 |
|
| TOTAL PREFERRED STOCKS | | | |
| (Cost $857,505) | | | 967,404 |
| | | Principal Amount (000s) | Value (000s) |
|
| Convertible Bonds - 0.1% | | | |
| CONSUMER DISCRETIONARY - 0.1% | | | |
| Automobiles - 0.1% | | | |
| Neutron Holdings, Inc.: | | | |
| 4% 10/27/25 (c)(d)(h) | | 20,045 | 18,311 |
| 4% 5/22/27 (c)(d) | | 2,433 | 2,689 |
| 4% 6/12/27 (c)(d) | | 647 | 715 |
| | | | 21,715 |
| FINANCIALS - 0.0% | | | |
| Diversified Financial Services - 0.0% | | | |
| ZKH Group Ltd. 8% 12/23/22 (c)(d) | | 12,068 | 12,068 |
| TOTAL CONVERTIBLE BONDS | | | |
| (Cost $35,193) | | | 33,783 |
|
| Preferred Securities - 0.1% | | | |
| INFORMATION TECHNOLOGY - 0.1% | | | |
| Electronic Equipment & Components - 0.0% | | | |
| Enevate Corp. 0% 1/29/23 (c)(d) | | 5,145 | 5,145 |
| Semiconductors & Semiconductor Equipment - 0.1% | | | |
| GaN Systems, Inc. 0% (c)(d)(i) | | 15,508 | 15,508 |
| Software - 0.0% | | | |
| Tenstorrent, Inc. 0% (c)(d)(i) | | 4,320 | 4,320 |
| TOTAL PREFERRED SECURITIES | | | |
| (Cost $24,973) | | | 24,973 |
| | | Shares | Value (000s) |
|
| Money Market Funds - 1.9% | | | |
| Fidelity Cash Central Fund 2.01% (j) | | 233 | 0 |
| Fidelity Securities Lending Cash Central Fund 2.01% (j)(k) | | 776,371,180 | 776,449 |
| TOTAL MONEY MARKET FUNDS | | | |
| (Cost $776,449) | | | 776,449 |
| TOTAL INVESTMENT IN SECURITIES - 101.9% | | | |
| (Cost $24,140,978) | | | 41,889,470 |
| NET OTHER ASSETS (LIABILITIES) - (1.9)% | | | (782,524) |
| NET ASSETS - 100% | | | $41,106,946 |
Values shown as $0 in the Schedule of Investments may reflect amounts less than $500.
Legend
(a) Non-income producing
(b) Security or a portion of the security is on loan at period end.
(c) Restricted securities (including private placements) - Investment in securities not registered under the Securities Act of 1933 (excluding 144A issues). At the end of the period, the value of restricted securities (excluding 144A issues) amounted to $1,582,931,000 or 3.9% of net assets.
(d) Level 3 security
(e) Security exempt from registration under Rule 144A of the Securities Act of 1933. These securities may be resold in transactions exempt from registration, normally to qualified institutional buyers. At the end of the period, the value of these securities amounted to $61,224,000 or 0.1% of net assets.
(f) Affiliated company
(g) Investment is owned by a wholly-owned subsidiary (Subsidiary) that is treated as a corporation for U.S. tax purposes.
(h) Security initially issued at one coupon which converts to a higher coupon at a specified date. The rate shown is the rate at period end.
(i) Security is perpetual in nature with no stated maturity date.
(j) Affiliated fund that is generally available only to investment companies and other accounts managed by Fidelity Investments. The rate quoted is the annualized seven-day yield of the fund at period end. A complete unaudited listing of the fund's holdings as of its most recent quarter end is available upon request. In addition, each Fidelity Central Fund's financial statements, which are not covered by the Fund's Report of Independent Registered Public Accounting Firm, are available on the SEC's website or upon request.
(k) Investment made with cash collateral received from securities on loan.
Additional information on each restricted holding is as follows:
| Security | Acquisition Date | Acquisition Cost (000s) |
| ABL Space Systems Series B | 3/24/21 | $12,165 |
| ABL Space Systems Series B2 | 10/22/21 | $9,626 |
| AgBiome LLC Series C | 6/29/18 | $6,912 |
| Algolia SAS Series D | 7/23/21 | $8,086 |
| Alif Semiconductor Series C | 3/8/22 | $7,954 |
| Ant International Co. Ltd. Class C | 5/16/18 | $24,503 |
| AppNexus, Inc. Series E (Escrow) | 8/1/14 | $0 |
| Astera Labs, Inc. Series A | 5/17/22 | $6,844 |
| Astera Labs, Inc. Series B | 5/17/22 | $1,165 |
| Astera Labs, Inc. Series C | 8/24/21 | $5,286 |
| Astera Labs, Inc. Series D | 5/17/22 - 5/27/22 | $26,679 |
| Atom Tickets LLC | 8/15/17 | $7,000 |
| Beta Technologies, Inc. Series A | 4/9/21 | $7,401 |
| Bird Global, Inc. | 5/11/21 | $18,211 |
| Blink Health LLC Series A1 | 12/30/20 | $1,385 |
| Blink Health LLC Series C | 11/7/19 - 7/14/21 | $6,515 |
| Bolt Technology OU Series E | 1/3/22 | $44,235 |
| Bowery Farming, Inc. Series C1 | 5/18/21 | $9,716 |
| ByteDance Ltd. Series E1 | 11/18/20 | $32,109 |
| Castle Creek Biosciences, Inc. Series D2 | 6/28/21 | $917 |
| Castle Creek Pharmaceutical Holdings, Inc. Series A4 | 9/29/16 | $9,831 |
| Castle Creek Pharmaceutical Holdings, Inc. Series B | 10/9/18 | $1,360 |
| CelLink Corp. Series D | 1/20/22 | $16,066 |
| Cibus Corp. Series C | 2/16/18 | $6,396 |
| Cibus Corp. Series D | 5/10/19 | $2,146 |
| Cibus Corp. Series E | 6/23/21 | $3,695 |
| Circle Internet Financial Ltd. Series E | 5/11/21 | $20,193 |
| Databricks, Inc. Series G | 2/1/21 | $25,893 |
| Databricks, Inc. Series H | 8/31/21 | $20,129 |
| Dataminr, Inc. Series D | 3/6/15 | $3,535 |
| Delhivery Private Ltd. | 5/20/21 | $12,055 |
| Delphix Corp. Series D | 7/10/15 | $6,079 |
| Diamond Foundry, Inc. Series C | 3/15/21 | $54,512 |
| Discord, Inc. Series I | 9/15/21 | $3,359 |
| Enevate Corp. Series E | 1/29/21 | $13,398 |
| Enevate Corp. 0% 1/29/23 | 1/29/21 | $5,145 |
| Epic Games, Inc. | 7/30/20 | $3,525 |
| Fanatics, Inc. Class A | 8/13/20 - 12/15/21 | $60,327 |
| FSN E-Commerce Ventures Private Ltd. | 10/7/20 - 10/26/20 | $16,851 |
| GaN Systems, Inc. Series F1 | 11/30/21 | $5,611 |
| GaN Systems, Inc. Series F2 | 11/30/21 | $2,963 |
| GaN Systems, Inc. 0% | 11/30/21 | $15,508 |
| GoBrands, Inc. Series G | 3/2/21 | $41,503 |
| GoBrands, Inc. Series H | 7/22/21 | $40,414 |
| Gupshup, Inc. | 6/8/21 | $16,223 |
| Instacart, Inc. Series H | 11/13/20 | $14,723 |
| Instacart, Inc. Series I | 2/26/21 | $14,856 |
| Jet.Com, Inc. Series B1 (Escrow) | 3/19/18 | $0 |
| JUUL Labs, Inc. Class A | 12/20/17 | $453 |
| JUUL Labs, Inc. Class B | 11/21/17 | $0 |
| JUUL Labs, Inc. Series C | 5/22/15 - 7/6/18 | $0 |
| JUUL Labs, Inc. Series D | 6/25/18 - 7/6/18 | $0 |
| JUUL Labs, Inc. Series E | 12/20/17 | $321 |
| Malwarebytes Corp. Series B | 12/21/15 | $10,958 |
| Meesho Series F | 9/21/21 | $41,908 |
| Menlo Micro, Inc. Series C | 2/9/22 | $6,204 |
| MOD Super Fast Pizza Holdings LLC Series 3 | 11/3/16 | $9,415 |
| MOD Super Fast Pizza Holdings LLC Series 4 | 12/14/17 | $878 |
| MOD Super Fast Pizza Holdings LLC Series 5 | 5/15/19 | $3,590 |
| Mountain Digital, Inc. Series D | 11/5/21 | $12,040 |
| MultiPlan Corp. warrants | 10/8/20 | $0 |
| Neutron Holdings, Inc. | 2/4/21 | $72 |
| Neutron Holdings, Inc. Series 1C | 7/3/18 | $9,262 |
| Neutron Holdings, Inc. Series 1D | 1/25/19 | $20,689 |
| Neutron Holdings, Inc. 4% 10/27/25 | 10/29/21 | $20,045 |
| Neutron Holdings, Inc. 4% 5/22/27 | 6/4/20 | $2,433 |
| Neutron Holdings, Inc. 4% 6/12/27 | 6/12/20 | $647 |
| Nuvia, Inc. Series B | 3/16/21 | $1,313 |
| Oddity Tech Ltd. | 1/6/22 | $10,079 |
| Pine Labs Private Ltd. | 6/30/21 | $3,696 |
| Pine Labs Private Ltd. Series 1 | 6/30/21 | $8,833 |
| Pine Labs Private Ltd. Series A | 6/30/21 | $2,207 |
| Pine Labs Private Ltd. Series B | 6/30/21 | $2,401 |
| Pine Labs Private Ltd. Series B2 | 6/30/21 | $1,942 |
| Pine Labs Private Ltd. Series C | 6/30/21 | $3,613 |
| Pine Labs Private Ltd. Series C1 | 6/30/21 | $761 |
| Pine Labs Private Ltd. Series D | 6/30/21 | $814 |
| Rad Power Bikes, Inc. | 1/21/21 | $4,477 |
| Rad Power Bikes, Inc. Series A | 1/21/21 | $584 |
| Rad Power Bikes, Inc. Series C | 1/21/21 | $2,297 |
| Rad Power Bikes, Inc. Series D | 9/17/21 | $8,309 |
| Rapyd Financial Network 2016 Ltd. | 3/30/21 | $15,000 |
| Reddit, Inc. Series B | 7/26/17 | $7,442 |
| Reddit, Inc. Series E | 5/18/21 | $1,861 |
| Reddit, Inc. Series F | 8/11/21 | $28,249 |
| Redwood Materials Series C | 5/28/21 | $16,184 |
| Relativity Space, Inc. Series E | 5/27/21 | $56,645 |
| SiMa.ai Series B | 5/10/21 | $14,465 |
| SiMa.ai Series B1 | 4/25/22 | $1,340 |
| Skyryse, Inc. Series B | 10/21/21 | $13,821 |
| Space Exploration Technologies Corp. Class A | 10/16/15 - 5/24/22 | $55,406 |
| Space Exploration Technologies Corp. Class C | 9/11/17 | $376 |
| Space Exploration Technologies Corp. Series G | 1/20/15 | $7,535 |
| Space Exploration Technologies Corp. Series H | 8/4/17 | $3,479 |
| Space Exploration Technologies Corp. Series N | 8/4/20 | $21,440 |
| Stripe, Inc. Class B | 5/18/21 | $6,966 |
| Stripe, Inc. Series H | 3/15/21 | $2,933 |
| Tanium, Inc. Class B | 4/21/17 | $2,755 |
| Tenstorrent, Inc. Series C1 | 4/23/21 | $4,626 |
| Tenstorrent, Inc. 0% | 4/23/21 | $4,320 |
| Tory Burch LLC | 5/14/15 | $20,890 |
| Veterinary Emergency Group LLC Class A | 9/16/21 - 3/17/22 | $21,636 |
| Waymo LLC Series A2 | 5/8/20 | $6,982 |
| Xsight Labs Ltd. Series D | 2/16/21 | $9,531 |
| Yanka Industries, Inc. Series F | 4/8/21 | $16,221 |
| ZKH Group Ltd. 8% 12/23/22 | 2/24/22 | $12,068 |
Affiliated Central Funds
Fiscal year to date information regarding the Fund's investments in Fidelity Central Funds, including the ownership percentage, is presented below.
| Fund (Amounts in thousands) | Value, beginning of period | Purchases | Sales Proceeds | Dividend Income | Realized Gain/Loss | Change in Unrealized appreciation (depreciation) | Value, end of period | % ownership, end of period |
| Fidelity Cash Central Fund 2.01% | $21,837 | $2,635,627 | $2,657,464 | $26 | $-- | $-- | $-- | 0.0% |
| Fidelity Securities Lending Cash Central Fund 2.01% | 726,752 | 4,624,105 | 4,574,408 | 11,634 | -- | -- | 776,449 | 2.1% |
| Total | $748,589 | $ 7,259,732 | $ 7,231,872 | $11,660 | $-- | $-- | $776,449 | |
Amounts in the income column in the above table include any capital gain distributions from underlying funds, which are presented in the corresponding line-item in the Statement of Operations, if applicable. Amount for Fidelity Securities Lending Cash Central Fund represents the income earned on investing cash collateral, less rebates paid to borrowers and any lending agent fees associated with the loan, plus any premium payments received for lending certain types of securities.
Other Affiliated Issuers
An affiliated company is a company in which the Fund has ownership of at least 5% of the voting securities. Fiscal year to date transactions with companies which are or were affiliates are presented in the table below. Certain corporate actions, such as mergers, are excluded from the amounts in this table if applicable.
| Affiliate (Amounts in thousands) | Value, beginning of period | Purchases | Sales Proceeds(a) | Dividend Income | Realized Gain (loss) | Change in Unrealized appreciation (depreciation) | Value, end of period |
| American Eagle Outfitters, Inc. | $284,750 | $38,074 | $8,448 | $6,517 | $1,986 | $(200,355) | $116,007 |
| BARK, Inc. | -- | -- | -- | -- | -- | -- | -- |
| BARK, Inc. | 15,731 | 15,341 | 9,228 | -- | (25,656) | 3,812 | -- |
| Switchback II Corp. Class A | -- | 27,269 | 17 | -- | -- | -- | -- |
| The Real Good Food Co. LLC Class B | -- | -- | -- | -- | -- | -- | -- |
| The Real Good Food Co. LLC Class B unit | -- | -- | -- | -- | -- | -- | -- |
| The Real Good Food Co. LLC Class B unit | -- | -- | -- | -- | -- | (3,913) | 8,203 |
| The Real Good Food Co. LLC 1% | 12,116 | -- | -- | -- | -- | -- | -- |
| The Real Good Food Co., Inc. | -- | 612 | 17 | -- | (16) | (265) | 314 |
| Tupperware Brands Corp. | 91,752 | -- | 76,724 | -- | (18,415) | 3,387 | -- |
| Total | $404,349 | $81,296 | $94,434 | $6,517 | $(42,101) | $(197,334) | $124,524 |
(a) Includes the value of securities delivered through in-kind transactions, if applicable.
Investment Valuation
The following is a summary of the inputs used, as of July 31, 2022, involving the Fund's assets and liabilities carried at fair value. The inputs or methodology used for valuing securities may not be an indication of the risk associated with investing in those securities. For more information on valuation inputs, and their aggregation into the levels used below, please refer to the Investment Valuation section in the accompanying Notes to Financial Statements.
| | Valuation Inputs at Reporting Date: |
| Description | Total | Level 1 | Level 2 | Level 3 |
| (Amounts in thousands) | | | | |
| Investments in Securities: | | | | |
| Equities: | | | | |
| Communication Services | $4,377,304 | $4,309,205 | $27,768 | $40,331 |
| Consumer Discretionary | 12,219,697 | 11,700,008 | 248,137 | 271,552 |
| Consumer Staples | 570,750 | 529,849 | -- | 40,901 |
| Energy | 1,917,401 | 1,681,815 | 235,586 | -- |
| Financials | 399,378 | 334,309 | 38,906 | 26,163 |
| Health Care | 2,895,803 | 2,819,623 | 15,327 | 60,853 |
| Industrials | 1,137,437 | 657,347 | 47,539 | 432,551 |
| Information Technology | 16,836,300 | 16,444,180 | -- | 392,120 |
| Materials | 603,816 | 533,087 | -- | 70,729 |
| Real Estate | 59,696 | 59,696 | -- | -- |
| Utilities | 36,683 | 15,430 | 10,106 | 11,147 |
| Corporate Bonds | 33,783 | -- | -- | 33,783 |
| Preferred Securities | 24,973 | -- | -- | 24,973 |
| Money Market Funds | 776,449 | 776,449 | -- | -- |
| Total Investments in Securities: | $41,889,470 | $39,860,998 | $623,369 | $1,405,103 |
| Net unrealized depreciation on unfunded commitments | $(2,642) | -- | -- | (2,642) |
The following is a reconciliation of Investments in Securities for which Level 3 inputs were used in determining value:
| (Amounts in thousands) | |
| Investments in Securities: | |
| Equities - Industrials | |
| Beginning Balance | $284,618 |
| Net Realized Gain (Loss) on Investment Securities | (10,286) |
| Net Unrealized Gain (Loss) on Investment Securities | 132,323 |
| Cost of Purchases | 37,769 |
| Proceeds of Sales | (29) |
| Amortization/Accretion | -- |
| Transfers into Level 3 | -- |
| Transfers out of Level 3 | (11,844) |
| Ending Balance | $432,551 |
| The change in unrealized gain (loss) for the period attributable to Level 3 securities held at July 31, 2022 | $122,024 |
| Other Investments in Securities | |
| Beginning Balance | $1,117,834 |
| Net Realized Gain (Loss) on Investment Securities | -- |
| Net Unrealized Gain (Loss) on Investment Securities | (219,697) |
| Cost of Purchases | 371,867 |
| Proceeds of Sales | -- |
| Amortization/Accretion | -- |
| Transfers into Level 3 | 1,794 |
| Transfers out of Level 3 | (299,246) |
| Ending Balance | $972,552 |
| The change in unrealized gain (loss) for the period attributable to Level 3 securities held at July 31, 2022 | $(219,697) |
The information used in the above reconciliations represents fiscal year to date activity for any Investments in Securities identified as using Level 3 inputs at either the beginning or the end of the current fiscal period. Transfers into Level 3 were attributable to a lack of observable market data resulting from decreases in market activity, decreases in liquidity, security restructurings or corporate actions. Transfers out of Level 3 were attributable to observable market data becoming available for those securities. Cost of purchases and proceeds of sales may include securities received and/or delivered through in-kind transactions. Transfers in or out of Level 3 represent the beginning value of any Security or Instrument where a change in the pricing level occurred from the beginning to the end of the period. The cost of purchases and the proceeds of sales may include securities received or delivered through corporate actions or exchanges. Realized and unrealized gains (losses) disclosed in the reconciliations are included in Net Gain (Loss) on the Fund's Statement of Operations.
See accompanying notes which are an integral part of the financial statements.
Financial Statements
Statement of Assets and Liabilities
| Amounts in thousands (except per-share amounts) | | July 31, 2022 |
| Assets | | |
Investment in securities, at value (including securities loaned of $770,329) — See accompanying schedule:
Unaffiliated issuers (cost $23,171,096) | $40,988,497 | |
| Fidelity Central Funds (cost $776,449) | 776,449 | |
| Other affiliated issuers (cost $193,433) | 124,524 | |
| Total Investment in Securities (cost $24,140,978) | | $41,889,470 |
| Foreign currency held at value (cost $14,060) | | 14,081 |
| Receivable for investments sold | | 65,195 |
| Receivable for fund shares sold | | 28,547 |
| Dividends receivable | | 8,760 |
| Interest receivable | | 897 |
| Distributions receivable from Fidelity Central Funds | | 610 |
| Other receivables | | 1,124 |
| Total assets | | 42,008,684 |
| Liabilities | | |
| Payable to custodian bank | $1,455 | |
| Payable for investments purchased | 6,755 | |
| Unrealized depreciation on unfunded commitments | 2,642 | |
| Payable for fund shares redeemed | 25,179 | |
| Accrued management fee | 16,510 | |
| Notes payable to affiliates | 44,166 | |
| Other affiliated payables | 4,336 | |
| Other payables and accrued expenses | 24,284 | |
| Collateral on securities loaned | 776,411 | |
| Total liabilities | | 901,738 |
| Net Assets | | $41,106,946 |
| Net Assets consist of: | | |
| Paid in capital | | $23,494,140 |
| Total accumulated earnings (loss) | | 17,612,806 |
| Net Assets | | $41,106,946 |
| Net Asset Value and Maximum Offering Price | | |
| Blue Chip Growth: | | |
| Net Asset Value, offering price and redemption price per share ($36,726,496 ÷ 276,262 shares) | | $132.94 |
| Class K: | | |
| Net Asset Value, offering price and redemption price per share ($4,380,450 ÷ 32,818 shares) | | $133.48 |
See accompanying notes which are an integral part of the financial statements.
Statement of Operations
| Amounts in thousands | | Year ended July 31, 2022 |
| Investment Income | | |
| Dividends (including $6,517 earned from other affiliated issuers) | | $221,683 |
| Interest | | 787 |
| Income from Fidelity Central Funds (including $11,634 from security lending) | | 11,660 |
| Total income | | 234,130 |
| Expenses | | |
| Management fee | | |
| Basic fee | $273,342 | |
| Performance adjustment | 55,072 | |
| Transfer agent fees | 59,158 | |
| Accounting fees | 2,395 | |
| Custodian fees and expenses | 796 | |
| Independent trustees' fees and expenses | 176 | |
| Registration fees | 684 | |
| Audit | 212 | |
| Legal | 58 | |
| Interest | 146 | |
| Miscellaneous | 181 | |
| Total expenses before reductions | 392,220 | |
| Expense reductions | (1,649) | |
| Total expenses after reductions | | 390,571 |
| Net investment income (loss) | | (156,441) |
| Realized and Unrealized Gain (Loss) | | |
| Net realized gain (loss) on: | | |
| Investment securities: | | |
| Unaffiliated issuers | 1,736,681 | |
| Affiliated issuers | (42,101) | |
| Foreign currency transactions | 324 | |
| Total net realized gain (loss) | | 1,694,904 |
| Change in net unrealized appreciation (depreciation) on: | | |
| Investment securities: | | |
| Unaffiliated issuers (net of increase in deferred foreign taxes of $9,970) | (14,515,545) | |
| Affiliated issuers | (197,334) | |
| Unfunded commitments | 14,518 | |
| Assets and liabilities in foreign currencies | (228) | |
| Total change in net unrealized appreciation (depreciation) | | (14,698,589) |
| Net gain (loss) | | (13,003,685) |
| Net increase (decrease) in net assets resulting from operations | | $(13,160,126) |
See accompanying notes which are an integral part of the financial statements.
Statement of Changes in Net Assets
| Amounts in thousands | Year ended July 31, 2022 | Year ended July 31, 2021 |
| Increase (Decrease) in Net Assets | | |
| Operations | | |
| Net investment income (loss) | $(156,441) | $(208,750) |
| Net realized gain (loss) | 1,694,904 | 6,541,185 |
| Change in net unrealized appreciation (depreciation) | (14,698,589) | 11,099,412 |
| Net increase (decrease) in net assets resulting from operations | (13,160,126) | 17,431,847 |
| Distributions to shareholders | (4,919,350) | (2,930,025) |
| Share transactions - net increase (decrease) | 2,233,155 | 4,804,160 |
| Total increase (decrease) in net assets | (15,846,321) | 19,305,982 |
| Net Assets | | |
| Beginning of period | 56,953,267 | 37,647,285 |
| End of period | $41,106,946 | $56,953,267 |
See accompanying notes which are an integral part of the financial statements.
Financial Highlights
Fidelity Blue Chip Growth Fund
| Years ended July 31, | 2022 | 2021 | 2020 | 2019 | 2018 |
| Selected Per–Share Data | | | | | |
| Net asset value, beginning of period | $187.79 | $138.12 | $103.05 | $99.75 | $83.20 |
| Income from Investment Operations | | | | | |
| Net investment income (loss)A,B | (.50) | (.73) | (.17) | (.04) | .11C |
| Net realized and unrealized gain (loss) | (38.32) | 60.84 | 39.23 | 8.65 | 20.20 |
| Total from investment operations | (38.82) | 60.11 | 39.06 | 8.61 | 20.31 |
| Distributions from net investment income | – | – | – | (.11) | (.08) |
| Distributions from net realized gain | (16.03) | (10.44) | (3.99) | (5.20) | (3.68) |
| Total distributions | (16.03) | (10.44) | (3.99) | (5.31) | (3.76) |
| Net asset value, end of period | $132.94 | $187.79 | $138.12 | $103.05 | $99.75 |
| Total ReturnD | (22.85)% | 45.70% | 39.45% | 9.09% | 25.21% |
| Ratios to Average Net AssetsB,E,F | | | | | |
| Expenses before reductions | .76% | .79% | .79% | .80% | .72% |
| Expenses net of fee waivers, if any | .76% | .79% | .79% | .80% | .72% |
| Expenses net of all reductions | .76% | .78% | .78% | .80% | .72% |
| Net investment income (loss) | (.31)% | (.44)% | (.16)% | (.04)% | .12%C |
| Supplemental Data | | | | | |
| Net assets, end of period (in millions) | $36,726 | $48,318 | $31,023 | $23,023 | $20,714 |
| Portfolio turnover rateG | 34%H | 41%H | 49%H | 45%H | 41%H |
A Calculated based on average shares outstanding during the period.
B Net investment income (loss) is affected by the timing of the declaration of dividends by any underlying mutual funds or exchange-traded funds (ETFs). Net investment income (loss) of any such underlying funds is not included in the Fund's net investment income (loss) ratio.
C Net investment income per share reflects one or more large, non-recurring dividend(s) which amounted to $.09 per share. Excluding such non-recurring dividend(s), the ratio of net investment income (loss) to average net assets would have been .02%.
D Total returns would have been lower if certain expenses had not been reduced during the applicable periods shown.
E Fees and expenses of any underlying mutual funds or exchange-traded funds (ETFs) are not included in the Fund's expense ratio. The Fund indirectly bears its proportionate share of these expenses. For additional expense information related to investments in Fidelity Central Funds, please refer to the "Investments in Fidelity Central Funds" note found in the Notes to Financial Statements section of the most recent Annual or Semi-Annual report.
F Expense ratios reflect operating expenses of the class. Expenses before reductions do not reflect amounts reimbursed, waived, or reduced through arrangements with the investment adviser, brokerage services, or other offset arrangements, if applicable, and do not represent the amount paid by the class during periods when reimbursements, waivers or reductions occur.
G Amount does not include the portfolio activity of any underlying mutual funds or exchange-traded funds (ETFs).
H Portfolio turnover rate excludes securities received or delivered in-kind.
See accompanying notes which are an integral part of the financial statements.
Fidelity Blue Chip Growth Fund Class K
| Years ended July 31, | 2022 | 2021 | 2020 | 2019 | 2018 |
| Selected Per–Share Data | | | | | |
| Net asset value, beginning of period | $188.45 | $138.50 | $103.24 | $99.92 | $83.34 |
| Income from Investment Operations | | | | | |
| Net investment income (loss)A,B | (.37) | (.60) | (.08) | .05 | .20C |
| Net realized and unrealized gain (loss) | (38.45) | 61.04 | 39.33 | 8.66 | 20.22 |
| Total from investment operations | (38.82) | 60.44 | 39.25 | 8.71 | 20.42 |
| Distributions from net investment income | – | – | – | (.19) | (.16) |
| Distributions from net realized gain | (16.15) | (10.49) | (3.99) | (5.20) | (3.68) |
| Total distributions | (16.15) | (10.49) | (3.99) | (5.39) | (3.84) |
| Net asset value, end of period | $133.48 | $188.45 | $138.50 | $103.24 | $99.92 |
| Total ReturnD | (22.78)% | 45.83% | 39.57% | 9.20% | 25.33% |
| Ratios to Average Net AssetsB,E,F | | | | | |
| Expenses before reductions | .68% | .71% | .70% | .70% | .62% |
| Expenses net of fee waivers, if any | .68% | .71% | .69% | .70% | .62% |
| Expenses net of all reductions | .68% | .70% | .69% | .70% | .62% |
| Net investment income (loss) | (.23)% | (.36)% | (.07)% | .05% | .22%C |
| Supplemental Data | | | | | |
| Net assets, end of period (in millions) | $4,380 | $8,635 | $6,625 | $5,316 | $5,669 |
| Portfolio turnover rateG | 34%H | 41%H | 49%H | 45%H | 41%H |
A Calculated based on average shares outstanding during the period.
B Net investment income (loss) is affected by the timing of the declaration of dividends by any underlying mutual funds or exchange-traded funds (ETFs). Net investment income (loss) of any such underlying funds is not included in the Fund's net investment income (loss) ratio.
C Net investment income per share reflects one or more large, non-recurring dividend(s) which amounted to $.09 per share. Excluding such non-recurring dividend(s), the ratio of net investment income (loss) to average net assets would have been .12%.
D Total returns would have been lower if certain expenses had not been reduced during the applicable periods shown.
E Fees and expenses of any underlying mutual funds or exchange-traded funds (ETFs) are not included in the Fund's expense ratio. The Fund indirectly bears its proportionate share of these expenses. For additional expense information related to investments in Fidelity Central Funds, please refer to the "Investments in Fidelity Central Funds" note found in the Notes to Financial Statements section of the most recent Annual or Semi-Annual report.
F Expense ratios reflect operating expenses of the class. Expenses before reductions do not reflect amounts reimbursed, waived, or reduced through arrangements with the investment adviser, brokerage services, or other offset arrangements, if applicable, and do not represent the amount paid by the class during periods when reimbursements, waivers or reductions occur.
G Amount does not include the portfolio activity of any underlying mutual funds or exchange-traded funds (ETFs).
H Portfolio turnover rate excludes securities received or delivered in-kind.
See accompanying notes which are an integral part of the financial statements.
Notes to Financial Statements
For the period ended July 31, 2022
(Amounts in thousands except percentages)
1. Organization.
Fidelity Blue Chip Growth Fund (the Fund) is a fund of Fidelity Securities Fund (the Trust) and is authorized to issue an unlimited number of shares. The Trust is registered under the Investment Company Act of 1940, as amended (the 1940 Act), as an open-end management investment company organized as a Massachusetts business trust. The Fund offers Blue Chip Growth and Class K shares, each of which has equal rights as to assets and voting privileges. Each class has exclusive voting rights with respect to matters that affect that class.
2. Investments in Fidelity Central Funds.
Funds may invest in Fidelity Central Funds, which are open-end investment companies generally available only to other investment companies and accounts managed by the investment adviser and its affiliates. The Schedule of Investments lists any Fidelity Central Funds held as an investment as of period end, but does not include the underlying holdings of each Fidelity Central Fund. An investing fund indirectly bears its proportionate share of the expenses of the underlying Fidelity Central Funds.
Based on its investment objective, each Fidelity Central Fund may invest or participate in various investment vehicles or strategies that are similar to those of the investing fund. These strategies are consistent with the investment objectives of the investing fund and may involve certain economic risks which may cause a decline in value of each of the Fidelity Central Funds and thus a decline in the value of the investing fund.
| Fidelity Central Fund | Investment Manager | Investment Objective | Investment Practices | Expense Ratio(a) |
| Fidelity Money Market Central Funds | Fidelity Management & Research Company LLC (FMR) | Each fund seeks to obtain a high level of current income consistent with the preservation of capital and liquidity. | Short-term Investments | Less than .005% |
(a) Expenses expressed as a percentage of average net assets and are as of each underlying Central Fund's most recent annual or semi-annual shareholder report.
A complete unaudited list of holdings for each Fidelity Central Fund is available upon request or at the Securities and Exchange Commission website at www.sec.gov. In addition, the financial statements of the Fidelity Central Funds which contain the significant accounting policies (including investment valuation policies) of those funds, and are not covered by the Report of Independent Registered Public Accounting Firm, are available on the Securities and Exchange Commission website or upon request.
3. Significant Accounting Policies.
The Fund is an investment company and applies the accounting and reporting guidance of the Financial Accounting Standards Board (FASB) Accounting Standards Codification Topic 946 Financial Services - Investment Companies. The financial statements have been prepared in conformity with accounting principles generally accepted in the United States of America (GAAP), which require management to make certain estimates and assumptions at the date of the financial statements. Actual results could differ from those estimates. Subsequent events, if any, through the date that the financial statements were issued have been evaluated in the preparation of the financial statements. The Fund's Schedule of Investments lists any underlying mutual funds or exchange-traded funds (ETFs) but does not include the underlying holdings of these funds. The following summarizes the significant accounting policies of the Fund:
Investment Valuation. Investments are valued as of 4:00 p.m. Eastern time on the last calendar day of the period. The Board of Trustees (the Board) has delegated the day to day responsibility for the valuation of the Fund's investments to the Fair Value Committee (the Committee) established by the Fund's investment adviser. In accordance with valuation policies and procedures approved by the Board, the Fund attempts to obtain prices from one or more third party pricing vendors or brokers to value its investments. When current market prices, quotations or currency exchange rates are not readily available or reliable, investments will be fair valued in good faith by the Committee, in accordance with procedures adopted by the Board. Factors used in determining fair value vary by investment type and may include market or investment specific events, changes in interest rates and credit quality. The frequency with which these procedures are used cannot be predicted and they may be utilized to a significant extent. The Committee oversees the Fund's valuation policies and procedures and reports to the Board on the Committee's activities and fair value determinations. The Board monitors the appropriateness of the procedures used in valuing the Fund's investments and ratifies the fair value determinations of the Committee.
The Fund categorizes the inputs to valuation techniques used to value its investments into a disclosure hierarchy consisting of three levels as shown below:
- Level 1 – unadjusted quoted prices in active markets for identical investments
- Level 2 – other significant observable inputs (including quoted prices for similar investments, interest rates, prepayment speeds, etc.)
- Level 3 – unobservable inputs (including the Fund's own assumptions based on the best information available)
Valuation techniques used to value the Fund's investments by major category are as follows:
Equity securities, including restricted securities, for which market quotations are readily available, are valued at the last reported sale price or official closing price as reported by a third party pricing vendor on the primary market or exchange on which they are traded and are categorized as Level 1 in the hierarchy. In the event there were no sales during the day or closing prices are not available, securities are valued at the last quoted bid price or may be valued using the last available price and are generally categorized as Level 2 in the hierarchy. For foreign equity securities, when market or security specific events arise, comparisons to the valuation of American Depositary Receipts (ADRs), futures contracts, ETFs and certain indexes as well as quoted prices for similar securities may be used and would be categorized as Level 2 in the hierarchy. For equity securities, including restricted securities, where observable inputs are limited, assumptions about market activity and risk are used and these securities may be categorized as Level 3 in the hierarchy. Securities, including private placements or other restricted securities, for which observable inputs are not available are valued using alternate valuation approaches, including the market approach, the income approach and cost approach, and are categorized as Level 3 in the hierarchy. The market approach considers factors including the price of recent investments in the same or a similar security or financial metrics of comparable securities. The income approach considers factors including expected future cash flows, security specific risks and corresponding discount rates. The cost approach considers factors including the value of the security's underlying assets and liabilities.
Debt securities, including restricted securities, are valued based on evaluated prices received from third party pricing vendors or from brokers who make markets in such securities. Corporate bonds and preferred securities are valued by pricing vendors who utilize matrix pricing which considers yield or price of bonds of comparable quality, coupon, maturity and type or by broker-supplied prices. When independent prices are unavailable or unreliable, debt securities may be valued utilizing pricing methodologies which consider similar factors that would be used by third party pricing vendors. Debt securities are generally categorized as Level 2 in the hierarchy but may be Level 3 depending on the circumstances.
Investments in open-end mutual funds, including the Fidelity Central Funds, are valued at their closing net asset value (NAV) each business day and are categorized as Level 1 in the hierarchy.
The following provides information on Level 3 securities held by the Fund that were valued at period end based on unobservable inputs. These amounts exclude valuations provided by a broker.
| Asset Type | Fair Value | Valuation Technique(s) | Unobservable Input | Amount or Range/Weighted Average | Impact to Valuation from an Increase in Input(a) |
| Equities | $1,346,347 | Market approach | Discount rate | 5.3% - 20.9% / 11.0% | Decrease |
| | | | Transaction price | $1.11 - $700.00 / $253.21 | Increase |
| | | Recovery value | Recovery value | $0.00 - $0.43 / $0.00 | Increase |
| | | | Discount for lack of marketability | 5.0% | Decrease |
| | | Book value | Book value multiple | 1.7 | Increase |
| | | Market comparable | Discount rate | 30.0% | Decrease |
| | | | Enterprise value/Revenue multiple (EV/R) | 1.5 - 26.0 / 7.2 | Increase |
| | | | Enterprise value/Gross profit multiple (EV/GP) | 8.8 | Increase |
| | | | Enterprise value/EBITDA multiple (EV/EBITDA) | 9.3 - 20.0 / 13.2 | Increase |
| | | | Probability rate | 25.0% - 75.0% / 50.0% | Increase |
| | | | Liquidity preference | $218.20 - $246.13 / $232.90 | Increase |
| | | Discounted cash flow | Weighted average cost of capital (WACC) | 25.0% - 42.0% / 32.0% | Decrease |
| | | | Exit multiple | 2.3 - 5.5 / 3.6 | Increase |
| | | Black scholes | Term | 5.0 | Increase |
| | | | Volatility | 75.0% - 80.0% / 79.5% | Increase |
| Corporate Bonds | $33,783 | Market approach | Transaction price | $100.00 | Increase |
| | | Market comparable | Discount rate | 29.2% | Decrease |
| | | | Enterprise value/Revenue multiple (EV/R) | 2.8 | Increase |
| | | | Probability rate | 10.0% - 60.0% / 33.3% | Increase |
| | | Black scholes | Term | 1.0 - 1.4 / 1.2 | Increase |
| | | | Volatility | 75.0% | Increase |
| Preferred Securities | $24,973 | Market approach | Transaction price | $100.00 | Increase |
(a) Represents the directional change in the fair value of the Level 3 investments that could have resulted from an increase in the corresponding input as of period end. A decrease to the unobservable input would have had the opposite effect. Significant changes in these inputs may have resulted in a significantly higher or lower fair value measurement at period end.
Changes in valuation techniques may result in transfers in or out of an assigned level within the disclosure hierarchy. The aggregate value of investments by input level as of July 31, 2022, as well as a roll forward of Level 3 investments, is included at the end of the Fund's Schedule of Investments.
Foreign Currency. Certain Funds may use foreign currency contracts to facilitate transactions in foreign-denominated securities. Gains and losses from these transactions may arise from changes in the value of the foreign currency or if the counterparties do not perform under the contracts' terms.
Foreign-denominated assets, including investment securities, and liabilities are translated into U.S. dollars at the exchange rates at period end. Purchases and sales of investment securities, income and dividends received, and expenses denominated in foreign currencies are translated into U.S. dollars at the exchange rate in effect on the transaction date.
The effects of exchange rate fluctuations on investments are included with the net realized and unrealized gain (loss) on investment securities. Other foreign currency transactions resulting in realized and unrealized gain (loss) are disclosed separately.
Investment Transactions and Income. For financial reporting purposes, the Fund's investment holdings and NAV include trades executed through the end of the last business day of the period. The NAV per share for processing shareholder transactions is calculated as of the close of business of the New York Stock Exchange (NYSE), normally 4:00 p.m. Eastern time and includes trades executed through the end of the prior business day. Gains and losses on securities sold are determined on the basis of identified cost and include proceeds received from litigation. Commissions paid to certain brokers with whom the investment adviser, or its affiliates, places trades on behalf of a fund include an amount in addition to trade execution, which may be rebated back to a fund. Any such rebates are included in net realized gain (loss) on investments in the Statement of Operations. Dividend income is recorded on the ex-dividend date, except for certain dividends from foreign securities where the ex-dividend date may have passed, which are recorded as soon as the Fund is informed of the ex-dividend date. Non-cash dividends included in dividend income, if any, are recorded at the fair market value of the securities received. Income and capital gain distributions from Fidelity Central Funds, if any, are recorded on the ex-dividend date. Certain distributions received by the Fund represent a return of capital or capital gain. The Fund determines the components of these distributions subsequent to the ex-dividend date, based upon receipt of tax filings or other correspondence relating to the underlying investment. These distributions are recorded as a reduction of cost of investments and/or as a realized gain. Interest income is accrued as earned and includes coupon interest and amortization of premium and accretion of discount on debt securities as applicable. Investment income is recorded net of foreign taxes withheld where recovery of such taxes is uncertain. Funds may file withholding tax reclaims in certain jurisdictions to recover a portion of amounts previously withheld. Any withholding tax reclaims income is included in the Statement of Operations in dividends. Any receivables for withholding tax reclaims are included in the Statement of Assets and Liabilities in dividends receivable.
Class Allocations and Expenses. Investment income, realized and unrealized capital gains and losses, common expenses of a fund, and certain fund-level expense reductions, if any, are allocated daily on a pro-rata basis to each class based on the relative net assets of each class to the total net assets of a fund. Each class differs with respect to transfer agent and distribution and service plan fees incurred, as applicable. Certain expense reductions may also differ by class, if applicable. For the reporting period, the allocated portion of income and expenses to each class as a percent of its average net assets may vary due to the timing of recording these transactions in relation to fluctuating net assets of the classes. Expenses directly attributable to a fund are charged to that fund. Expenses attributable to more than one fund are allocated among the respective funds on the basis of relative net assets or other appropriate methods. Expenses included in the accompanying financial statements reflect the expenses of that fund and do not include any expenses associated with any underlying mutual funds or exchange-traded funds. Although not included in a fund's expenses, a fund indirectly bears its proportionate share of these expenses through the net asset value of each underlying mutual fund or exchange-traded fund. Expense estimates are accrued in the period to which they relate and adjustments are made when actual amounts are known.
Deferred Trustee Compensation. Under a Deferred Compensation Plan (the Plan) for certain Funds, certain independent Trustees have elected to defer receipt of a portion of their annual compensation. Deferred amounts are invested in affiliated mutual funds, are marked-to-market and remain in a fund until distributed in accordance with the Plan. The investment of deferred amounts and the offsetting payable to the Trustees presented below are included in the accompanying Statement of Assets and Liabilities in other receivables and other payables and accrued expenses, as applicable.
| Fidelity Blue Chip Growth Fund | $765 |
Income Tax Information and Distributions to Shareholders. Each year, the Fund intends to qualify as a regulated investment company under Subchapter M of the Internal Revenue Code, including distributing substantially all of its taxable income and realized gains. As a result, no provision for U.S. Federal income taxes is required. As of July 31, 2022, the Fund did not have any unrecognized tax benefits in the financial statements; nor is the Fund aware of any tax positions for which it is reasonably possible that the total amounts of unrecognized tax benefits will significantly change in the next twelve months. The Fund files a U.S. federal tax return, in addition to state and local tax returns as required. The Fund's federal income tax returns are subject to examination by the Internal Revenue Service (IRS) for a period of three fiscal years after they are filed. State and local tax returns may be subject to examination for an additional fiscal year depending on the jurisdiction. Foreign taxes are provided for based on the Fund's understanding of the tax rules and rates that exist in the foreign markets in which it invests. The Fund is subject to a tax imposed on capital gains by certain countries in which it invests. An estimated deferred tax liability for net unrealized appreciation on the applicable securities is included in Other payables and accrued expenses on the Statement of Assets & Liabilities.
Distributions are declared and recorded on the ex-dividend date. Income and capital gain distributions are declared separately for each class. Income and capital gain distributions are determined in accordance with income tax regulations, which may differ from GAAP. In addition, the Fund claimed a portion of the payment made to redeeming shareholders as a distribution for income tax purposes.
Capital accounts within the financial statements are adjusted for permanent book-tax differences. These adjustments have no impact on net assets or the results of operations. Capital accounts are not adjusted for temporary book-tax differences which will reverse in a subsequent period.
Book-tax differences are primarily due to foreign currency transactions, certain foreign taxes, passive foreign investment companies (PFIC), redemptions in-kind, partnerships, deferred Trustee compensation, net operating losses, losses deferred due to wash sales and excise tax regulations.
As of period end, the cost and unrealized appreciation (depreciation) in securities, and derivatives if applicable, for federal income tax purposes were as follows:
| Gross unrealized appreciation | $21,204,914 |
| Gross unrealized depreciation | (3,694,637) |
| Net unrealized appreciation (depreciation) | $17,510,277 |
| Tax Cost | $24,376,552 |
The tax-based components of distributable earnings as of period end were as follows:
| Undistributed long-term capital gain | $195,298 |
| Net unrealized appreciation (depreciation) on securities and other investments | $17,510,127 |
The Fund intends to elect to defer to its next fiscal year $68,789 of ordinary losses recognized during the period January 1, 2022 to July 31, 2022.
The tax character of distributions paid was as follows:
| | July 31, 2022 | July 31, 2021 |
| Ordinary Income | $408,457 | $ 91,335 |
| Long-term Capital Gains | 4,510,893 | 2,838,690 |
| Total | $4,919,350 | $ 2,930,025 |
Restricted Securities (including Private Placements). Funds may invest in securities that are subject to legal or contractual restrictions on resale. These securities generally may be resold in transactions exempt from registration or to the public if the securities are registered. Disposal of these securities may involve time-consuming negotiations and expense, and prompt sale at an acceptable price may be difficult. Information regarding restricted securities held at period end is included at the end of the Schedule of Investments, if applicable.
Commitments. A commitment is an agreement to acquire an investment at a future date (subject to conditions) in connection with a potential public or non-public offering. Commitments outstanding at period end are presented in the table below. Unrealized appreciation (depreciation) on any commitments outstanding at period end is separately presented in the Statements of Assets and Liabilities as Unrealized appreciation (depreciation) on unfunded commitments, and any change in unrealized appreciation (depreciation) on unfunded commitments during the period is separately presented in the Statement of Operations, as applicable based on contractual conditions of each commitment.
| | Investment to be Acquired | Commitment Amount | Unrealized Appreciation (Depreciation) |
| Fidelity Blue Chip Growth Fund | Twitter, Inc. | $19,661 | - |
| | Stripe, Inc. | $2,642 | $(2,642) |
Special Purpose Acquisition Companies. Funds may invest in stock, warrants, and other securities of special purpose acquisition companies (SPACs) or similar special purpose entities. A SPAC is a publicly traded company that raises investment capital via an initial public offering (IPO) for the purpose of acquiring the equity securities of one or more existing companies via merger, business combination, acquisition or other similar transactions within a designated time frame.
Private Investment in Public Equity. Funds may acquire equity securities of an issuer through a private investment in a public equity (PIPE) transaction, including through commitments to purchase securities on a when-issued basis. A PIPE typically involves the purchase of securities directly from a publicly traded company in a private placement transaction. Securities purchased through PIPE transactions will be restricted from trading and considered illiquid until a resale registration statement for the shares is filed and declared effective.
At the current and/or prior period end, the Fund had commitments to purchase when-issued securities through PIPE transactions with SPACs. The commitments are contingent upon the SPACs acquiring the securities of target companies. Unrealized appreciation (depreciation) on any commitments outstanding at period end is separately presented in the Statements of Assets and Liabilities as Unrealized appreciation (depreciation) on unfunded commitments, and any change in unrealized appreciation (depreciation) on unfunded commitments during the period is separately presented in the Statement of Operations, as applicable.
Consolidated Subsidiary. The Funds included in the table below hold certain investments through a wholly-owned subsidiary ("Subsidiary"), which may be subject to federal and state taxes upon disposition.
As of period end, investments in Subsidiaries were as follows:
| | $ Amount | % of Net Assets |
| Fidelity Blue Chip Growth Fund | 82,514 | .20 |
The financial statements have been consolidated to include the Subsidiary accounts where applicable. Accordingly, all inter-company transactions and balances have been eliminated.
At period end, any estimated tax liability for these investments is presented as "Deferred taxes" in the Statement of Assets and Liabilities and included in "Change in net unrealized appreciation (depreciation) on investment securities" in the Statement of Operations. The tax liability incurred may differ materially depending on conditions when these investments are disposed. Any cash held by a Subsidiary is restricted as to its use and is presented as "Restricted cash" in the Statement of Assets and Liabilities, if applicable.
4. Purchases and Sales of Investments.
Purchases and sales of securities, other than short-term securities and in-kind transactions, as applicable, are noted in the table below.
| | Purchases ($) | Sales ($) |
| Fidelity Blue Chip Growth Fund | 17,903,317 | 19,337,115 |
Unaffiliated Redemptions In-Kind. Shares that were redeemed in-kind for investments, including accrued interest and cash, if any, are shown in the table below. The net realized gain or loss on investments delivered through in-kind redemptions is included in the accompanying Statement of Operations. The amount of the in-kind redemptions is included in share transactions in the accompanying Statement of Changes in Net Assets. There was no gain or loss for federal income tax purposes.
| | Shares | Total net realized gain or loss
($) | Total Proceeds
($) | Participating classes |
| Fidelity Blue Chip Growth Fund | 10,273 | 673,294 | 1,424,375 | Blue Chip Growth, Class K |
Prior Fiscal Year Unaffiliated Redemptions In-Kind. Shares that were redeemed in-kind for investments, including accrued interest and cash, if any, are shown in the table below; along with realized gain or loss on investments delivered through in-kind redemptions. The amount of the in-kind redemptions is included in share transactions in the accompanying Statement of Changes in Net Assets. There was no gain or loss for federal income tax purposes.
| | Shares | Total net realized gain or loss
($) | Total Proceeds
($) | Participating classes |
| Fidelity Blue Chip Growth Fund | 3,999 | 470,324 | 671,180 | Blue Chip Growth, Class K |
5. Fees and Other Transactions with Affiliates.
Management Fee. Fidelity Management & Research Company LLC (the investment adviser) and its affiliates provide the Fund with investment management related services for which the Fund pays a monthly management fee. The management fee is the sum of an individual fund fee rate that is based on an annual rate of .30% of the Fund's average net assets and an annualized group fee rate that averaged .22% during the period. The group fee rate is based upon the monthly average net assets of a group of registered investment companies with which the investment adviser has management contracts. The group fee rate decreases as assets under management increase and increases as assets under management decrease. In addition, the management fee is subject to a performance adjustment (up to a maximum of +/- .20 % of the Fund's average net assets over a 36 month performance period). The upward or downward adjustment to the management fee is based on the relative investment performance of Blue Chip Growth as compared to its benchmark index, the Russell 1000 Growth Index, over the same 36 month performance period. For the reporting period, the total annual management fee rate, including the performance adjustment, was .63% of the Fund's average net assets. The performance adjustment included in the management fee rate may be higher or lower than the maximum performance adjustment rate due to the difference between the average net assets for the reporting and performance periods.
Transfer Agent Fees. Fidelity Investments Institutional Operations Company LLC (FIIOC), an affiliate of the investment adviser, is the transfer, dividend disbursing and shareholder servicing agent for each class of the Fund. FIIOC receives account fees and asset-based fees that vary according to the account size and type of account of the shareholders of the respective classes of the Fund, except for Class K. FIIOC receives an asset-based fee of Class K's average net assets. FIIOC pays for typesetting, printing and mailing of shareholder reports, except proxy statements.
For the period, transfer agent fees for each class were as follows:
| | Amount | % of Class-Level Average Net Assets |
| Blue Chip Growth | $56,297 | .12 |
| Class K | 2,861 | .04 |
| | $59,158 | |
Accounting Fees. Fidelity Service Company, Inc. (FSC), an affiliate of the investment adviser, maintains the Fund's accounting records. The accounting fee is based on the level of average net assets for each month. For the period, the fees were equivalent to the following annual rates:
| | % of Average Net Assets |
| Fidelity Blue Chip Growth Fund | –(a) |
(a) Amount represents less than 0.005%
Brokerage Commissions. A portion of portfolio transactions were placed with brokerage firms which are affiliates of the investment adviser. Brokerage commissions are included in net realized gain (loss) and change in net unrealized appreciation (depreciation) in the Statement of Operations. The commissions paid to these affiliated firms were as follows:
| | Amount |
| Fidelity Blue Chip Growth Fund | $430 |
Interfund Lending Program. Pursuant to an Exemptive Order issued by the Securities and Exchange Commission (the SEC), the Fund, along with other registered investment companies having management contracts with Fidelity Management & Research Company LLC (FMR), or other affiliated entities of FMR, may participate in an interfund lending program. This program provides an alternative credit facility allowing the Fund to borrow from, or lend money to, other participating affiliated funds. Any open loans, including accrued interest, at period end are presented under the caption "Notes payable to affiliates" in the Statement of Assets and Liabilities. Activity in this program during the period for which loans were outstanding was as follows:
| | Borrower or Lender | Average Loan Balance | Weighted Average Interest Rate | Interest Expense |
| Fidelity Blue Chip Growth Fund | Borrower | $20,694 | .61% | $138 |
Interfund Trades. Funds may purchase from or sell securities to other Fidelity Funds under procedures adopted by the Board. The procedures have been designed to ensure these interfund trades are executed in accordance with Rule 17a-7 of the 1940 Act. Any interfund trades are included within the respective purchases and sales amounts shown in the Purchases and Sales of Investments note. Interfund trades during the period are noted in the table below.
| | Purchases ($) | Sales ($) | Realized Gain (Loss) ($) |
| Fidelity Blue Chip Growth Fund | 1,663,091 | 1,040,190 | 26,673 |
Other. During the period, the investment adviser reimbursed the Fund for certain losses as follows:
| | Amount ($) |
| Fidelity Blue Chip Growth Fund | 122 |
6. Committed Line of Credit.
Certain Funds participate with other funds managed by the investment adviser or an affiliate in a $4.25 billion credit facility (the "line of credit") to be utilized for temporary or emergency purposes to fund shareholder redemptions or for other short-term liquidity purposes. The participating funds have agreed to pay commitment fees on their pro-rata portion of the line of credit, which are reflected in Miscellaneous expenses on the Statement of Operations, and are listed below. During the period, there were no borrowings on this line of credit.
| | Amount |
| Fidelity Blue Chip Growth Fund | $70 |
7. Security Lending.
Funds lend portfolio securities from time to time in order to earn additional income. Lending agents are used, including National Financial Services (NFS), an affiliate of the investment adviser. Pursuant to a securities lending agreement, NFS will receive a fee, which is capped at 9.9% of a fund's daily lending revenue, for its services as lending agent. A fund may lend securities to certain qualified borrowers, including NFS. On the settlement date of the loan, a fund receives collateral (in the form of U.S. Treasury obligations, letters of credit and/or cash) against the loaned securities and maintains collateral in an amount not less than 100% of the market value of the loaned securities during the period of the loan. The market value of the loaned securities is determined at the close of business of a fund and any additional required collateral is delivered to a fund on the next business day. A fund or borrower may terminate the loan at any time, and if the borrower defaults on its obligation to return the securities loaned because of insolvency or other reasons, a fund may apply collateral received from the borrower against the obligation. A fund may experience delays and costs in recovering the securities loaned. Any cash collateral received is invested in the Fidelity Securities Lending Cash Central Fund. Any loaned securities are identified as such in the Schedule of Investments, and the value of loaned securities and cash collateral at period end, as applicable, are presented in the Statement of Assets and Liabilities. Security lending income represents the income earned on investing cash collateral, less rebates paid to borrowers and any lending agent fees associated with the loan, plus any premium payments received for lending certain types of securities. Security lending income is presented in the Statement of Operations as a component of income from Fidelity Central Funds. Affiliated security lending activity, if any, was as follows:
| | Total Security Lending Fees Paid to NFS | Security Lending Income From Securities Loaned to NFS | Value of Securities Loaned to NFS at Period End |
| Fidelity Blue Chip Growth Fund | $1,225 | $311 | $7,267 |
8. Bank Borrowings.
The Fund is permitted to have bank borrowings for temporary or emergency purposes to fund shareholder redemptions or for other short-term liquidity requirements. The Fund has established borrowing arrangements with certain banks. The interest rate on the borrowings is the bank's base rate, as revised from time to time. Any open loans, including accrued interest, at period end are presented under the caption "Notes payable" in the Statement of Assets and Liabilities, if applicable. Activity in this program during the period for which loans were outstanding was as follows:
| | Average Loan Balance | Weighted Average Interest Rate | Interest Expense |
| Fidelity Blue Chip Growth Fund | $18,004 | .82% | $8 |
9. Expense Reductions.
In addition, during the period the investment adviser or an affiliate reimbursed and/or waived a portion of fund-level operating expenses in the amount of $1,649.
10. Distributions to Shareholders.
Distributions to shareholders of each class were as follows:
| | Year ended
July 31, 2022 | Year ended
July 31, 2021 |
| Fidelity Blue Chip Growth Fund | | |
| Distributions to shareholders | | |
| Blue Chip Growth | $4,200,150 | $2,429,319 |
| Class K | 719,200 | 500,706 |
| Total | $4,919,350 | $2,930,025 |
11. Share Transactions.
Share transactions for each class were as follows and may contain in-kind transactions, automatic conversions between classes or exchanges between affiliated funds:
| | Shares | Shares | Dollars | Dollars |
| | Year ended July 31, 2022 | Year ended July 31, 2021 | Year ended July 31, 2022 | Year ended July 31, 2021 |
| Fidelity Blue Chip Growth Fund | | | | |
| Blue Chip Growth | | | | |
| Shares sold | 59,594 | 70,865 | $9,796,348 | $11,644,088 |
| Reinvestment of distributions | 21,851 | 15,428 | 3,946,089 | 2,291,021 |
| Shares redeemed | (62,488) | (53,595) | (9,722,466) | (8,742,664) |
| Net increase (decrease) | 18,957 | 32,698 | $4,019,971 | $5,192,445 |
| Class K | | | | |
| Shares sold | 6,939 | 11,284 | $1,053,095 | $1,843,570 |
| Reinvestment of distributions | 3,969 | 3,365 | 719,197 | 500,706 |
| Shares redeemed | (23,912) | (16,657) | (3,559,108) | (2,732,561) |
| Net increase (decrease) | (13,004) | (2,008) | $(1,786,816) | $(388,285) |
12. Other.
A fund's organizational documents provide former and current trustees and officers with a limited indemnification against liabilities arising in connection with the performance of their duties to the fund. In the normal course of business, a fund may also enter into contracts that provide general indemnifications. A fund's maximum exposure under these arrangements is unknown as this would be dependent on future claims that may be made against a fund. The risk of material loss from such claims is considered remote.
13. Coronavirus (COVID-19) Pandemic.
An outbreak of COVID-19 first detected in China during December 2019 has since spread globally and was declared a pandemic by the World Health Organization during March 2020. Developments that disrupt global economies and financial markets, such as the COVID-19 pandemic, may magnify factors that affect the Fund's performance.
Report of Independent Registered Public Accounting Firm
To the Board of Trustees of Fidelity Securities Fund and Shareholders of Fidelity Blue Chip Growth Fund
Opinion on the Financial Statements and Financial Highlights
We have audited the accompanying statement of assets and liabilities of Fidelity Blue Chip Growth Fund (the "Fund"), a fund of Fidelity Securities Fund, including the schedule of investments, as of July 31, 2022, the related statement of operations for the year then ended, the statement of changes in net assets for each of the two years in the period then ended, the financial highlights for each of the five years in the period then ended, and the related notes. In our opinion, the financial statements and financial highlights present fairly, in all material respects, the financial position of the Fund as of July 31, 2022, and the results of its operations for the year then ended, the changes in its net assets for each of the two years in the period then ended, and the financial highlights for each of the five years in the period then ended in conformity with accounting principles generally accepted in the United States of America.
Basis for Opinion
These financial statements and financial highlights are the responsibility of the Fund's management. Our responsibility is to express an opinion on the Fund's financial statements and financial highlights based on our audits. We are a public accounting firm registered with the Public Company Accounting Oversight Board (United States) (PCAOB) and are required to be independent with respect to the Fund in accordance with the U.S. federal securities laws and the applicable rules and regulations of the Securities and Exchange Commission and the PCAOB.
We conducted our audits in accordance with the standards of the PCAOB. Those standards require that we plan and perform the audit to obtain reasonable assurance about whether the financial statements and financial highlights are free of material misstatement, whether due to error or fraud. The Fund is not required to have, nor were we engaged to perform, an audit of its internal control over financial reporting. As part of our audits we are required to obtain an understanding of internal control over financial reporting but not for the purpose of expressing an opinion on the effectiveness of the Fund’s internal control over financial reporting. Accordingly, we express no such opinion.
Our audits included performing procedures to assess the risks of material misstatement of the financial statements and financial highlights, whether due to error or fraud, and performing procedures that respond to those risks. Such procedures included examining, on a test basis, evidence regarding the amounts and disclosures in the financial statements and financial highlights. Our audits also included evaluating the accounting principles used and significant estimates made by management, as well as evaluating the overall presentation of the financial statements and financial highlights. Our procedures included confirmation of securities owned as of July 31, 2022, by correspondence with the custodian and brokers; when replies were not received from brokers, we performed other auditing procedures. We believe that our audits provide a reasonable basis for our opinion.
/s/ Deloitte & Touche LLP
Boston, Massachusetts
September 14, 2022
We have served as the auditor of one or more of the Fidelity investment companies since 1999.
Trustees and Officers
The Trustees, Members of the Advisory Board (if any), and officers of the trust and fund, as applicable, are listed below. The Board of Trustees governs the fund and is responsible for protecting the interests of shareholders. The Trustees are experienced executives who meet periodically throughout the year to oversee the fund's activities, review contractual arrangements with companies that provide services to the fund, oversee management of the risks associated with such activities and contractual arrangements, and review the fund's performance. Except for Jonathan Chiel, each of the Trustees oversees 316 funds. Mr. Chiel oversees 184 funds.
The Trustees hold office without limit in time except that (a) any Trustee may resign; (b) any Trustee may be removed by written instrument, signed by at least two-thirds of the number of Trustees prior to such removal; (c) any Trustee who requests to be retired or who has become incapacitated by illness or injury may be retired by written instrument signed by a majority of the other Trustees; and (d) any Trustee may be removed at any special meeting of shareholders by a two-thirds vote of the outstanding voting securities of the trust. Each Trustee who is not an interested person (as defined in the 1940 Act) of the trust and the fund is referred to herein as an Independent Trustee. Each Independent Trustee shall retire not later than the last day of the calendar year in which his or her 75th birthday occurs. The Independent Trustees may waive this mandatory retirement age policy with respect to individual Trustees. Officers and Advisory Board Members hold office without limit in time, except that any officer or Advisory Board Member may resign or may be removed by a vote of a majority of the Trustees at any regular meeting or any special meeting of the Trustees. Except as indicated, each individual has held the office shown or other offices in the same company for the past five years.
The fund's Statement of Additional Information (SAI) includes more information about the Trustees. To request a free copy, call Fidelity at 1-800-544-8544 if you’re an individual investing directly with Fidelity, call 1-800-835-5092 if you’re a plan sponsor or participant with Fidelity as your recordkeeper or call 1-877-208-0098 on institutional accounts or if you’re an advisor or invest through one.
Experience, Skills, Attributes, and Qualifications of the Trustees. The Governance and Nominating Committee has adopted a statement of policy that describes the experience, qualifications, attributes, and skills that are necessary and desirable for potential Independent Trustee candidates (Statement of Policy). The Board believes that each Trustee satisfied at the time he or she was initially elected or appointed a Trustee, and continues to satisfy, the standards contemplated by the Statement of Policy. The Governance and Nominating Committee also engages professional search firms to help identify potential Independent Trustee candidates who have the experience, qualifications, attributes, and skills consistent with the Statement of Policy. From time to time, additional criteria based on the composition and skills of the current Independent Trustees, as well as experience or skills that may be appropriate in light of future changes to board composition, business conditions, and regulatory or other developments, have also been considered by the professional search firms and the Governance and Nominating Committee. In addition, the Board takes into account the Trustees' commitment and participation in Board and committee meetings, as well as their leadership of standing and ad hoc committees throughout their tenure.
In determining that a particular Trustee was and continues to be qualified to serve as a Trustee, the Board has considered a variety of criteria, none of which, in isolation, was controlling. The Board believes that, collectively, the Trustees have balanced and diverse experience, qualifications, attributes, and skills, which allow the Board to operate effectively in governing the fund and protecting the interests of shareholders. Information about the specific experience, skills, attributes, and qualifications of each Trustee, which in each case led to the Board's conclusion that the Trustee should serve (or continue to serve) as a trustee of the fund, is provided below.
Board Structure and Oversight Function. Robert A. Lawrence is an interested person and currently serves as Chair. The Trustees have determined that an interested Chair is appropriate and benefits shareholders because an interested Chair has a personal and professional stake in the quality and continuity of services provided to the fund. Independent Trustees exercise their informed business judgment to appoint an individual of their choosing to serve as Chair, regardless of whether the Trustee happens to be independent or a member of management. The Independent Trustees have determined that they can act independently and effectively without having an Independent Trustee serve as Chair and that a key structural component for assuring that they are in a position to do so is for the Independent Trustees to constitute a substantial majority for the Board. The Independent Trustees also regularly meet in executive session. David M. Thomas serves as Lead Independent Trustee and as such (i) acts as a liaison between the Independent Trustees and management with respect to matters important to the Independent Trustees and (ii) with management prepares agendas for Board meetings.
Fidelity® funds are overseen by different Boards of Trustees. The fund's Board oversees Fidelity's high income and certain equity funds, and other Boards oversee Fidelity's investment-grade bond, money market, asset allocation, and other equity funds. The asset allocation funds may invest in Fidelity® funds overseen by the fund's Board. The use of separate Boards, each with its own committee structure, allows the Trustees of each group of Fidelity® funds to focus on the unique issues of the funds they oversee, including common research, investment, and operational issues. On occasion, the separate Boards establish joint committees to address issues of overlapping consequences for the Fidelity® funds overseen by each Board.
The Trustees operate using a system of committees to facilitate the timely and efficient consideration of all matters of importance to the Trustees, the fund, and fund shareholders and to facilitate compliance with legal and regulatory requirements and oversight of the fund's activities and associated risks. The Board, acting through its committees, has charged FMR and its affiliates with (i) identifying events or circumstances the occurrence of which could have demonstrably adverse effects on the fund's business and/or reputation; (ii) implementing processes and controls to lessen the possibility that such events or circumstances occur or to mitigate the effects of such events or circumstances if they do occur; and (iii) creating and maintaining a system designed to evaluate continuously business and market conditions in order to facilitate the identification and implementation processes described in (i) and (ii) above. Because the day-to-day operations and activities of the fund are carried out by or through FMR, its affiliates, and other service providers, the fund's exposure to risks is mitigated but not eliminated by the processes overseen by the Trustees. While each of the Board's committees has responsibility for overseeing different aspects of the fund's activities, oversight is exercised primarily through the Operations, Audit, and Compliance Committees. Appropriate personnel, including but not limited to the fund's Chief Compliance Officer (CCO), FMR's internal auditor, the independent accountants, the fund's Treasurer and portfolio management personnel, make periodic reports to the Board's committees, as appropriate, including an annual review of Fidelity's risk management program for the Fidelity® funds. The responsibilities of each standing committee, including their oversight responsibilities, are described further under "Standing Committees of the Trustees."
Interested Trustees*:
Correspondence intended for a Trustee who is an interested person may be sent to Fidelity Investments, 245 Summer Street, Boston, Massachusetts 02210.
Name, Year of Birth; Principal Occupations and Other Relevant Experience+
Jonathan Chiel (1957)
Year of Election or Appointment: 2016
Trustee
Mr. Chiel also serves as Trustee of other Fidelity® funds. Mr. Chiel is Executive Vice President and General Counsel for FMR LLC (diversified financial services company, 2012-present). Previously, Mr. Chiel served as general counsel (2004-2012) and senior vice president and deputy general counsel (2000-2004) for John Hancock Financial Services; a partner with Choate, Hall & Stewart (1996-2000) (law firm); and an Assistant United States Attorney for the United States Attorney’s Office of the District of Massachusetts (1986-95), including Chief of the Criminal Division (1993-1995). Mr. Chiel is a director on the boards of the Boston Bar Foundation and the Maimonides School.
Bettina Doulton (1964)
Year of Election or Appointment: 2021
Trustee
Ms. Doulton also serves as Trustee of other Fidelity® funds. Prior to her retirement, Ms. Doulton served in a variety of positions at Fidelity Investments, including as a managing director of research (2006-2007), portfolio manager to certain Fidelity® funds (1993-2005), equity analyst and portfolio assistant (1990-1993), and research assistant (1987-1990). Ms. Doulton currently owns and operates Phi Builders + Architects and Cellardoor Winery. Previously, Ms. Doulton served as a member of the Board of Brown Capital Management, LLC (2014-2018).
Robert A. Lawrence (1952)
Year of Election or Appointment: 2020
Trustee
Chair of the Board of Trustees
Mr. Lawrence also serves as Trustee of other funds. Previously, Mr. Lawrence served as a Trustee and Member of the Advisory Board of certain funds. Prior to his retirement in 2008, Mr. Lawrence served as Vice President of certain Fidelity® funds (2006-2008), Senior Vice President, Head of High Income Division of Fidelity Management & Research Company (investment adviser firm, 2006-2008), and President of Fidelity Strategic Investments (investment adviser firm, 2002-2005).
* Determined to be an “Interested Trustee” by virtue of, among other things, his or her affiliation with the trust or various entities under common control with FMR.
+ The information includes the Trustee's principal occupation during the last five years and other information relating to the experience, attributes, and skills relevant to the Trustee's qualifications to serve as a Trustee, which led to the conclusion that the Trustee should serve as a Trustee for the fund.
Independent Trustees:
Correspondence intended for an Independent Trustee may be sent to Fidelity Investments, P.O. Box 55235, Boston, Massachusetts 02205-5235.
Name, Year of Birth; Principal Occupations and Other Relevant Experience+
Thomas P. Bostick (1956)
Year of Election or Appointment: 2021
Trustee
Lieutenant General Bostick also serves as Trustee of other Fidelity® funds. Prior to his retirement, General Bostick (United States Army, Retired) held a variety of positions within the U.S. Army, including Commanding General and Chief of Engineers, U.S. Army Corps of Engineers (2012-2016) and Deputy Chief of Staff and Director of Human Resources, U.S. Army (2009-2012). General Bostick currently serves as a member of the Board and Finance and Governance Committees of CSX Corporation (transportation, 2020-present) and a member of the Board and Corporate Governance and Nominating Committee of Perma-Fix Environmental Services, Inc. (nuclear waste management, 2020-present). General Bostick serves as Chief Executive Officer of Bostick Global Strategies, LLC (consulting, 2016-present) and as a member of the Board of HireVue, Inc. (video interview and assessment, 2020-present). Previously, General Bostick served as a Member of the Advisory Board of certain Fidelity® funds (2021), President, Intrexon Bioengineering (2018-2020) and Chief Operating Officer (2017-2020) and Senior Vice President of the Environment Sector (2016-2017) of Intrexon Corporation (biopharmaceutical company).
Dennis J. Dirks (1948)
Year of Election or Appointment: 2005
Trustee
Mr. Dirks also serves as Trustee of other Fidelity® funds. Prior to his retirement in May 2003, Mr. Dirks served as Chief Operating Officer and as a member of the Board of The Depository Trust & Clearing Corporation (financial markets infrastructure), President, Chief Operating Officer and a member of the Board of The Depository Trust Company (DTC), President and a member of the Board of the National Securities Clearing Corporation (NSCC), Chief Executive Officer and a member of the Board of the Government Securities Clearing Corporation and Chief Executive Officer and a member of the Board of the Mortgage-Backed Securities Clearing Corporation. Mr. Dirks currently serves as a member of the Finance Committee (2016-present) and Board (2017-present) and is Treasurer (2018-present) of the Asolo Repertory Theatre.
Donald F. Donahue (1950)
Year of Election or Appointment: 2018
Trustee
Mr. Donahue also serves as Trustee of other Fidelity® funds. Mr. Donahue serves as President and Chief Executive Officer of Miranda Partners, LLC (risk consulting for the financial services industry, 2012-present). Previously, Mr. Donahue served as Chief Executive Officer (2006-2012), Chief Operating Officer (2003-2006) and Managing Director, Customer Marketing and Development (1999-2003) of The Depository Trust & Clearing Corporation (financial markets infrastructure). Mr. Donahue currently serves as a member (2007-present) and Co-Chairman (2016-present) of the Board of United Way of New York and a member of the Board of The Leadership Academy (previously NYC Leadership Academy) (2012-present). Mr. Donahue previously served as a member of the Advisory Board of certain Fidelity® funds (2015-2018).
Vicki L. Fuller (1957)
Year of Election or Appointment: 2020
Trustee
Ms. Fuller also serves as Trustee of other Fidelity® funds. Previously, Ms. Fuller served as a member of the Advisory Board of certain Fidelity® funds (2018-2020), Chief Investment Officer of the New York State Common Retirement Fund (2012-2018) and held a variety of positions at AllianceBernstein L.P. (global asset management, 1985-2012), including Managing Director (2006-2012) and Senior Vice President and Senior Portfolio Manager (2001-2006). Ms. Fuller currently serves as a member of the Board, Audit Committee and Nominating and Governance Committee of two Blackstone business development companies (2020-present), as a member of the Board of Treliant, LLC (consulting, 2019-present), as a member of the Advisory Board of Ariel Alternatives, LLC (private equity, 2021-present) and as a member of the Board and Chair of the Audit Committee of Gusto, Inc. (software, 2021-present). In addition, Ms. Fuller currently serves as a member of the Board of Roosevelt University (2019-present) and as a member of the Executive Board of New York University’s Stern School of Business. Ms. Fuller previously served as a member of the Board, Audit Committee and Nominating and Governance Committee of The Williams Companies, Inc. (natural gas infrastructure, 2018-2021).
Patricia L. Kampling (1959)
Year of Election or Appointment: 2020
Trustee
Ms. Kampling also serves as Trustee of other Fidelity® funds. Prior to her retirement, Ms. Kampling served as Chairman of the Board and Chief Executive Officer (2012-2019), President and Chief Operating Officer (2011-2012) and Executive Vice President and Chief Financial Officer (2010-2011) of Alliant Energy Corporation. Ms. Kampling currently serves as a member of the Board, Finance Committee and Governance, Compensation and Nominating Committee of Xcel Energy Inc. (utilities company, 2020-present) and as a member of the Board, Audit, Finance and Risk Committee and Safety, Environmental, Technology and Operations Committee and Chair of the Executive Development and Compensation Committee of American Water Works Company, Inc. (utilities company, 2019-present). In addition, Ms. Kampling currently serves as a member of the Board of the Nature Conservancy, Wisconsin Chapter (2019-present). Previously, Ms. Kampling served as a Member of the Advisory Board of certain Fidelity® funds (2020), a member of the Board, Compensation Committee and Executive Committee and Chair of the Audit Committee of Briggs & Stratton Corporation (manufacturing, 2011-2021), a member of the Board of Interstate Power and Light Company (2012-2019) and Wisconsin Power and Light Company (2012-2019) (each a subsidiary of Alliant Energy Corporation) and as a member of the Board and Workforce Development Committee of the Business Roundtable (2018-2019).
Thomas A. Kennedy (1955)
Year of Election or Appointment: 2021
Trustee
Mr. Kennedy also serves as Trustee of other Fidelity® funds. Previously, Mr. Kennedy served as a Member of the Advisory Board of certain Fidelity® funds (2020) and held a variety of positions at Raytheon Company (aerospace and defense, 1983-2020), including Chairman and Chief Executive Officer (2014-2020) and Executive Vice President and Chief Operating Officer (2013-2014). Mr. Kennedy currently serves as Executive Chairman of the Board of Directors of Raytheon Technologies Corporation (aerospace and defense, 2020-present). He is also a member of the Rutgers School of Engineering Industry Advisory Board (2011-present) and a member of the UCLA Engineering Dean’s Executive Board (2016-present).
Oscar Munoz (1959)
Year of Election or Appointment: 2021
Trustee
Mr. Munoz also serves as Trustee of other Fidelity® funds. Prior to his retirement, Mr. Munoz served as Executive Chairman (2020-2021), Chief Executive Officer (2015-2020), President (2015-2016) and a member of the Board (2010-2021) of United Airlines Holdings, Inc. Mr. Munoz currently serves as a member of the Board of CBRE Group, Inc. (commercial real estate, 2020-present), a member of the Board of Univision Communications, Inc. (Hispanic media, 2020-present) and a member of the Advisory Board of Salesforce.com, Inc. (cloud-based software, 2020-present). Previously, Mr. Munoz served as a Member of the Advisory Board of certain Fidelity® funds (2021).
Garnett A. Smith (1947)
Year of Election or Appointment: 2018
Trustee
Mr. Smith also serves as Trustee of other Fidelity® funds. Prior to his retirement, Mr. Smith served as Chairman and Chief Executive Officer (1990-1997) and President (1986-1990) of Inbrand Corp. (manufacturer of personal absorbent products). Prior to his employment with Inbrand Corp., he was employed by a retail fabric chain and North Carolina National Bank (now Bank of America). Mr. Smith previously served as a member of the Advisory Board of certain Fidelity® funds (2012-2013).
David M. Thomas (1949)
Year of Election or Appointment: 2008
Trustee
Lead Independent Trustee
Mr. Thomas also serves as Trustee of other Fidelity® funds. Previously, Mr. Thomas served as Executive Chairman (2005-2006) and Chairman and Chief Executive Officer (2000-2005) of IMS Health, Inc. (pharmaceutical and healthcare information solutions). Mr. Thomas currently serves as a member of the Board of Fortune Brands Home and Security (home and security products, 2004-present) and as Director (2013-present) and Non-Executive Chairman of the Board (2022-present) of Interpublic Group of Companies, Inc. (marketing communication).
Susan Tomasky (1953)
Year of Election or Appointment: 2020
Trustee
Ms. Tomasky also serves as Trustee of other Fidelity® funds. Prior to her retirement, Ms. Tomasky served in various executive officer positions at American Electric Power Company, Inc. (1998-2011), including most recently as President of AEP Transmission (2007-2011). Ms. Tomasky currently serves as a member of the Board and Sustainability Committee and as Chair of the Audit Committee of Marathon Petroleum Corporation (2018-present) and as a member of the Board, Executive Committee, Corporate Governance Committee and Organization and Compensation Committee and as Chair of the Audit Committee of Public Service Enterprise Group, Inc. (utilities company, 2012-present) and as a member of the Board of its subsidiary company, Public Service Electric and Gas Co. (2021-present). In addition, Ms. Tomasky currently serves as a member (2009-present) and President (2020-present) of the Board of the Royal Shakespeare Company – America (2009-present), as a member of the Board of the Columbus Association for the Performing Arts (2011-present) and as a member of the Board and Kenyon in the World Committee of Kenyon College (2016-present). Previously, Ms. Tomasky served as a Member of the Advisory Board of certain Fidelity® funds (2020), as a member of the Board of the Columbus Regional Airport Authority (2007-2020), as a member of the Board (2011-2018) and Lead Independent Director (2015-2018) of Andeavor Corporation (previously Tesoro Corporation) (independent oil refiner and marketer) and as a member of the Board of Summit Midstream Partners LP (energy, 2012-2018).
Michael E. Wiley (1950)
Year of Election or Appointment: 2020
Trustee
Mr. Wiley also serves as Trustee of other Fidelity® funds. Previously, Mr. Wiley served as a member of the Advisory Board of certain Fidelity® funds (2018-2020), Chairman, President and CEO of Baker Hughes, Inc. (oilfield services, 2000-2004). Mr. Wiley also previously served as a member of the Board of Andeavor Corporation (independent oil refiner and marketer, 2005-2018), a member of the Board of Andeavor Logistics LP (natural resources logistics, 2015-2018) and a member of the Board of High Point Resources (exploration and production, 2005-2020).
+ The information includes the Trustee's principal occupation during the last five years and other information relating to the experience, attributes, and skills relevant to the Trustee's qualifications to serve as a Trustee, which led to the conclusion that the Trustee should serve as a Trustee for the fund.
Advisory Board Members and Officers:
Correspondence intended for a Member of the Advisory Board (if any) may be sent to Fidelity Investments, P.O. Box 55235, Boston, Massachusetts 02205-5235. Correspondence intended for an officer or Peter S. Lynch may be sent to Fidelity Investments, 245 Summer Street, Boston, Massachusetts 02210. Officers appear below in alphabetical order.
Name, Year of Birth; Principal Occupation
Peter S. Lynch (1944)
Year of Election or Appointment: 2003
Member of the Advisory Board
Mr. Lynch also serves as a Member of the Advisory Board of other Fidelity® funds. Mr. Lynch is Vice Chairman and a Director of Fidelity Management & Research Company LLC (investment adviser firm). In addition, Mr. Lynch serves as a Trustee of Boston College and as the Chairman of the Inner-City Scholarship Fund. Previously, Mr. Lynch served as Vice Chairman and a Director of FMR Co., Inc. (investment adviser firm) and on the Special Olympics International Board of Directors (1997-2006).
Craig S. Brown (1977)
Year of Election or Appointment: 2019
Assistant Treasurer
Mr. Brown also serves as an officer of other funds. Mr. Brown serves as Assistant Treasurer of FIMM, LLC (2021-present) and is an employee of Fidelity Investments (2013-present).
John J. Burke III (1964)
Year of Election or Appointment: 2018
Chief Financial Officer
Mr. Burke also serves as Chief Financial Officer of other funds. Mr. Burke serves as Head of Investment Operations for Fidelity Fund and Investment Operations (2018-present) and is an employee of Fidelity Investments (1998-present). Previously Mr. Burke served as head of Asset Management Investment Operations (2012-2018).
William C. Coffey (1969)
Year of Election or Appointment: 2019
Assistant Secretary
Mr. Coffey also serves as Assistant Secretary of other funds. He is Senior Vice President and Deputy General Counsel of FMR LLC (diversified financial services company, 2010-present), and is an employee of Fidelity Investments. Previously, Mr. Coffey served as Secretary and CLO of certain funds (2018-2019); CLO, Secretary, and Senior Vice President of Fidelity Management & Research Company and FMR Co., Inc. (investment adviser firms, 2018-2019); Secretary of Fidelity SelectCo, LLC and Fidelity Investments Money Management, Inc. (investment adviser firms, 2018-2019); CLO of Fidelity Management & Research (Hong Kong) Limited, FMR Investment Management (UK) Limited, and Fidelity Management & Research (Japan) Limited (investment adviser firms, 2018-2019); and Assistant Secretary of certain funds (2009-2018).
Timothy M. Cohen (1969)
Year of Election or Appointment: 2018
Vice President
Mr. Cohen also serves as Vice President of other funds. Mr. Cohen serves as Co-Head of Equity (2018-present), a Director of Fidelity Management & Research (Japan) Limited (investment adviser firm, 2016-present), and is an employee of Fidelity Investments. Previously, Mr. Cohen served as Executive Vice President of Fidelity SelectCo, LLC (2019), Head of Global Equity Research (2016-2018), Chief Investment Officer - Equity and a Director of Fidelity Management & Research (U.K.) Inc. (investment adviser firm, 2013-2015) and as a Director of Fidelity Management & Research (Hong Kong) Limited (investment adviser firm, 2017).
Jonathan Davis (1968)
Year of Election or Appointment: 2010
Assistant Treasurer
Mr. Davis also serves as an officer of other funds. Mr. Davis serves as Assistant Treasurer of FIMM, LLC (2021-present), FMR Capital, Inc. (2017-present), FD Funds GP LLC (2021-present), FD Funds Holding LLC (2021-present), and FD Funds Management LLC (2021-present); and is an employee of Fidelity Investments. Previously, Mr. Davis served as Vice President and Associate General Counsel of FMR LLC (diversified financial services company, 2003-2010).
Laura M. Del Prato (1964)
Year of Election or Appointment: 2018
Assistant Treasurer
Ms. Del Prato also serves as an officer of other funds. Ms. Del Prato serves as Assistant Treasurer of FIMM, LLC (2021-present) and is an employee of Fidelity Investments (2017-present). Previously, Ms. Del Prato served as President and Treasurer of The North Carolina Capital Management Trust: Cash Portfolio and Term Portfolio (2018-2020). Prior to joining Fidelity Investments, Ms. Del Prato served as a Managing Director and Treasurer of the JPMorgan Mutual Funds (2014-2017). Prior to JPMorgan, Ms. Del Prato served as a partner at Cohen Fund Audit Services (accounting firm, 2012-2013) and KPMG LLP (accounting firm, 2004-2012).
Colm A. Hogan (1973)
Year of Election or Appointment: 2020
Assistant Treasurer
Mr. Hogan also serves as an officer of other funds. Mr. Hogan serves as Assistant Treasurer of FIMM, LLC (2021-present) and FMR Capital, Inc. (2017-present) and is an employee of Fidelity Investments (2005-present). Previously, Mr. Hogan served as Deputy Treasurer of certain Fidelity® funds (2016-2020) and Assistant Treasurer of certain Fidelity® funds (2016-2018).
Pamela R. Holding (1964)
Year of Election or Appointment: 2018
Vice President
Ms. Holding also serves as Vice President of other funds. Ms. Holding serves as Co-Head of Equity (2018-present) and is an employee of Fidelity Investments (2013-present). Previously, Ms. Holding served as Executive Vice President of Fidelity SelectCo, LLC (2019) and as Chief Investment Officer of Fidelity Institutional Asset Management (2013-2018).
Cynthia Lo Bessette (1969)
Year of Election or Appointment: 2019
Secretary and Chief Legal Officer (CLO)
Ms. Lo Bessette also serves as an officer of other funds. Ms. Lo Bessette serves as CLO, Secretary, and Senior Vice President of Fidelity Management & Research Company LLC (investment adviser firm, 2019-present); CLO of Fidelity Management & Research (Hong Kong) Limited, FMR Investment Management (UK) Limited, and Fidelity Management & Research (Japan) Limited (investment adviser firms, 2019-present); Secretary of FD Funds GP LLC (2021-present), FD Funds Holding LLC (2021-present), and FD Funds Management LLC (2021-present); and Assistant Secretary of FIMM, LLC (2019-present). She is a Senior Vice President and Deputy General Counsel of FMR LLC (diversified financial services company, 2019-present), and is an employee of Fidelity Investments. Previously, Ms. Lo Bessette served as CLO, Secretary, and Senior Vice President of FMR Co., Inc. (investment adviser firm, 2019); Secretary of Fidelity SelectCo, LLC and Fidelity Investments Money Management, Inc. (investment adviser firms, 2019). Prior to joining Fidelity Investments, Ms. Lo Bessette was Executive Vice President, General Counsel (2016-2019) and Senior Vice President, Deputy General Counsel (2015-2016) of OppenheimerFunds (investment management company) and Deputy Chief Legal Officer (2013-2015) of Jennison Associates LLC (investment adviser firm).
Chris Maher (1972)
Year of Election or Appointment: 2020
Deputy Treasurer
Mr. Maher also serves as an officer of other funds. Mr. Maher serves as Assistant Treasurer of FIMM, LLC (2021-present) and FMR Capital, Inc. (2017-present), and is an employee of Fidelity Investments (2008-present). Previously, Mr. Maher served as Assistant Treasurer of certain funds (2013-2020); Vice President of Asset Management Compliance (2013), Vice President of the Program Management Group of FMR (investment adviser firm, 2010-2013), and Vice President of Valuation Oversight (2008-2010).
Jason P. Pogorelec (1975)
Year of Election or Appointment: 2020
Chief Compliance Officer
Mr. Pogorelec also serves as Chief Compliance Officer of other funds. Mr. Pogorelec is a senior Vice President of Asset Management Compliance for Fidelity Investments and is an employee of Fidelity Investments (2006-present). Previously, Mr. Pogorelec served as Vice President, Associate General Counsel for Fidelity Investments (2010-2020) and Assistant Secretary of certain Fidelity funds (2015-2020).
Brett Segaloff (1972)
Year of Election or Appointment: 2021
Anti-Money Laundering (AML) Officer
Mr. Segaloff also serves as an AML Officer of other funds and other related entities. He is Director, Anti-Money Laundering (2007-present) of FMR LLC (diversified financial services company) and is an employee of Fidelity Investments (1996-present).
Stacie M. Smith (1974)
Year of Election or Appointment: 2016
President and Treasurer
Ms. Smith also serves as an officer of other funds. Ms. Smith serves as Assistant Treasurer of FIMM, LLC (2021-present) and FMR Capital, Inc. (2017-present), is an employee of Fidelity Investments (2009-present), and has served in other fund officer roles. Prior to joining Fidelity Investments, Ms. Smith served as Senior Audit Manager of Ernst & Young LLP (accounting firm, 1996-2009). Previously, Ms. Smith served as Assistant Treasurer (2013-2019) and Deputy Treasurer (2013-2016) of certain Fidelity® funds.
Jim Wegmann (1979)
Year of Election or Appointment: 2019
Assistant Treasurer
Mr. Wegmann also serves as an officer of other funds. Mr. Wegmann serves as Assistant Treasurer of FIMM, LLC (2021-present) and is an employee of Fidelity Investments (2011-present). Previously, Mr. Wegmann served as Assistant Treasurer of certain Fidelity® funds (2019-2021).
Shareholder Expense Example
As a shareholder, you incur two types of costs: (1) transaction costs, which may include sales charges (loads) on purchase payments or redemption proceeds, as applicable and (2) ongoing costs, which generally include management fees, distribution and/or service (12b-1) fees and other Fund expenses. This Example is intended to help you understand your ongoing costs (in dollars) of investing in a fund and to compare these costs with the ongoing costs of investing in other mutual funds.
The Example is based on an investment of $1,000 invested at the beginning of the period and held for the entire period (February 1, 2022 to July 31, 2022).
Actual Expenses
The first line of the accompanying table provides information about actual account values and actual expenses. You may use the information in this line, together with the amount you invested, to estimate the expenses that you paid over the period. Simply divide your account value by $1,000.00 (for example, an $8,600 account value divided by $1,000.00 = 8.6), then multiply the result by the number in the first line for a class/Fund under the heading entitled "Expenses Paid During Period" to estimate the expenses you paid on your account during this period. If any fund is a shareholder of any underlying mutual funds or exchange-traded funds (ETFs) (the Underlying Funds), such fund indirectly bears its proportional share of the expenses of the Underlying Funds in addition to the direct expenses incurred presented in the table. These fees and expenses are not included in the annualized expense ratio used to calculate the expense estimate in the table below.
Hypothetical Example for Comparison Purposes
The second line of the accompanying table provides information about hypothetical account values and hypothetical expenses based on the actual expense ratio and an assumed rate of return of 5% per year before expenses, which is not the actual return. The hypothetical account values and expenses may not be used to estimate the actual ending account balance or expenses you paid for the period. You may use this information to compare the ongoing costs of investing in the Fund and other funds. To do so, compare this 5% hypothetical example with the 5% hypothetical examples that appear in the shareholder reports of the other funds. If any fund is a shareholder of any Underlying Funds, such fund indirectly bears its proportional share of the expenses of the Underlying Funds in addition to the direct expenses as presented in the table. These fees and expenses are not included in the annualized expense ratio used to calculate the expense estimate in the table below.
Please note that the expenses shown in the table are meant to highlight your ongoing costs only and do not reflect any transaction costs. Therefore, the second line of the table is useful in comparing ongoing costs only, and will not help you determine the relative total costs of owning different funds. In addition, if these transactional costs were included, your costs would have been higher.
| | Annualized Expense Ratio-A | Beginning
Account Value
February 1, 2022 | Ending
Account Value
July 31, 2022 | Expenses Paid
During Period-B
February 1, 2022
to July 31, 2022 |
| Fidelity Blue Chip Growth Fund | | | | |
| Blue Chip Growth | .74% | | | |
| Actual | | $1,000.00 | $817.20 | $3.33 |
| Hypothetical-C | | $1,000.00 | $1,021.12 | $3.71 |
| Class K | .65% | | | |
| Actual | | $1,000.00 | $817.60 | $2.93 |
| Hypothetical-C | | $1,000.00 | $1,021.57 | $3.26 |
A Annualized expense ratio reflects expenses net of applicable fee waivers.
B Expenses are equal to the annualized expense ratio, multiplied by the average account value over the period, multiplied by 181/ 365 (to reflect the one-half year period). The fees and expenses of any Underlying Funds are not included in each annualized expense ratio.
C 5% return per year before expenses
Distributions (Unaudited)
The dividend and capital gains distributions for the fund(s) are available on Fidelity.com or Institutional.Fidelity.com.
The fund hereby designates as a capital gain dividend with respect to the taxable year ended July 31, 2022, $1,185,772,125, or, if subsequently determined to be different, the net capital gain of such year.
The fund designates 100% of the short-term capital gain dividend distributed in September during the fiscal year as qualifying to be taxed as short-term capital gain dividends for nonresident alien shareholders.
Blue Chip Growth designates 18%; and Class K designates 17%; of the dividend distributed in September during the fiscal year as qualifying for the dividends–received deduction for corporate shareholders.
Blue Chip Growth designates 22%; and Class K designates 21%; of the dividend distributed in September during the fiscal year as amounts which may be taken into account as a dividend for purposes of the maximum rate under section 1(h)(11) of the Internal Revenue Code.
The fund will notify shareholders in January 2023 of amounts for use in preparing 2022 income tax returns.
Board Approval of Investment Advisory Contracts and Management Fees
Fidelity Blue Chip Growth Fund
Each year, the Board of Trustees, including the Independent Trustees (together, the Board), votes on the renewal of the management contract with Fidelity Management & Research Company LLC (FMR) and the sub-advisory agreements (together, the Advisory Contracts) for the fund. FMR and the sub-advisers are referred to herein as the Investment Advisers. The Board, assisted by the advice of fund counsel and Independent Trustees' counsel, requests and considers a broad range of information relevant to the renewal of the Advisory Contracts throughout the year.
The Board meets regularly and, at each of its meetings, covers an extensive agenda of topics and materials and considers factors that are relevant to its annual consideration of the renewal of the fund's Advisory Contracts, including the services and support provided to the fund and its shareholders. The Board has established various standing committees (Committees), each composed of and chaired by Independent Trustees with varying backgrounds, to which the Board has assigned specific subject matter responsibilities in order to enhance effective decision-making by the Board. The Board, acting directly and through its Committees, requests and receives information concerning the annual consideration of the renewal of the fund's Advisory Contracts. The Board also meets as needed to review matters specifically related to the Board's annual consideration of the renewal of the Advisory Contracts. Members of the Board may also meet with trustees of other Fidelity funds through joint ad hoc committees to discuss certain matters relevant to all of the Fidelity funds.
At its May 2022 meeting, the Board unanimously determined to renew the fund's Advisory Contracts. In reaching its determination, the Board considered all factors it believed relevant, including (i) the nature, extent, and quality of the services provided to the fund and its shareholders (including the investment performance of the fund); (ii) the competitiveness relative to peer funds of the fund's management fee and the total expense ratio of a representative class (retail class); (iii) the total costs of the services provided by and the profits realized by Fidelity from its relationships with the fund; and (iv) the extent to which, if any, economies of scale exist and are realized as the fund grows, and whether any economies of scale are appropriately shared with fund shareholders.
In considering whether to renew the Advisory Contracts for the fund, the Board reached a determination, with the assistance of fund counsel and Independent Trustees' counsel and through the exercise of its business judgment, that the renewal of the Advisory Contracts was in the best interests of the fund and its shareholders and that the compensation payable under the Advisory Contracts was fair and reasonable. The Board's decision to renew the Advisory Contracts was not based on any single factor, but rather was based on a comprehensive consideration of all the information provided to the Board at its meetings throughout the year. The Board, in reaching its determination to renew the Advisory Contracts, was aware that shareholders of the fund have a broad range of investment choices available to them, including a wide choice among funds offered by Fidelity's competitors, and that the fund's shareholders, who have the opportunity to review and weigh the disclosure provided by the fund in its prospectus and other public disclosures, have chosen to invest in this fund, which is part of the Fidelity family of funds.
Nature, Extent, and Quality of Services Provided. The Board considered Fidelity's staffing as it relates to the fund, including the backgrounds of investment personnel of Fidelity, and also considered the fund's investment objective, strategies, and related investment philosophy. The Independent Trustees also had discussions with senior management of Fidelity's investment operations and investment groups. The Board considered the structure of the investment personnel compensation program and whether this structure provides appropriate incentives to act in the best interests of the fund. Additionally, the Board considered the portfolio managers' investments, if any, in the funds that they manage. The Board also considered the steps Fidelity had taken to ensure the continued provision of high quality services to the Fidelity funds during the COVID-19 pandemic, including the expansion of staff in client facing positions to maintain service levels in periods of high volumes and volatility.
Resources Dedicated to Investment Management and Support Services. The Board and the Fund Oversight and Research Committees reviewed the general qualifications and capabilities of Fidelity's investment staff, including its size, education, experience, and resources, as well as Fidelity's approach to recruiting, training, managing, and compensating investment personnel. The Board noted the resources devoted to expansion of Fidelity's global investment organization, and that Fidelity's analysts have extensive resources, tools, and capabilities that allow them to conduct sophisticated quantitative and fundamental analysis, as well as credit analysis of issuers, counterparties, and guarantors. Further, the Board considered that Fidelity's investment professionals have sufficient access to global information and data so as to provide competitive investment results over time, and that those professionals also have access to sophisticated tools that permit them to assess portfolio construction and risk and performance attribution characteristics continuously, as well as to transmit new information and research conclusions rapidly around the world. Additionally, in its deliberations, the Board considered Fidelity's trading, risk management, compliance, and technology and operations capabilities and resources, which are integral parts of the investment management process.
Shareholder and Administrative Services. The Board considered (i) the nature, extent, quality, and cost of advisory, administrative, and shareholder services performed by the Investment Advisers and their affiliates under the Advisory Contracts and under separate agreements covering transfer agency, pricing and bookkeeping, and securities lending services for the fund; (ii) the nature and extent of the supervision of third party service providers, principally custodians, subcustodians, and pricing vendors; and (iii) the resources devoted to, and the record of compliance with, the fund's compliance policies and procedures. The Board also reviewed the allocation of fund brokerage, including allocations to brokers affiliated with the Investment Advisers, the use of brokerage commissions to pay fund expenses, and the use of "soft" commission dollars to pay for research services.
The Board noted that the growth of fund assets over time across the complex allows Fidelity to reinvest in the development of services designed to enhance the value and convenience of the Fidelity funds as investment vehicles. These services include 24-hour access to account information and market information over the Internet and through telephone representatives, investor education materials, and asset allocation tools. The Board also considered that it reviews customer service metrics such as telephone response times, continuity of services on the website and metrics addressing services at Fidelity Investor Centers.
Investment in a Large Fund Family. The Board considered the benefits to shareholders of investing in a Fidelity fund, including the benefits of investing in a fund that is part of a large family of funds offering a variety of investment disciplines and providing a large variety of mutual fund investor services. The Board noted that Fidelity had taken, or had made recommendations that resulted in the Fidelity funds taking, a number of actions over the previous year that benefited particular funds, including: (i) continuing to dedicate additional resources to Fidelity's investment research process, which includes meetings with management of issuers of securities in which the funds invest; (ii) continuing efforts to enhance Fidelity's global research capabilities; (iii) launching new funds and ETFs with innovative structures, strategies and pricing and making other enhancements to meet client needs; (iv) launching new share classes of existing funds; (v) eliminating purchase minimums and broadening eligibility requirements for certain funds and share classes; (vi) reducing management fees and total expenses for certain target date funds and classes and index funds; (vii) lowering expenses for certain existing funds and classes by implementing or lowering expense caps; (viii) rationalizing product lines and gaining increased efficiencies from fund mergers and liquidations; (ix) continuing to develop, acquire and implement systems and technology to improve services to the funds and shareholders, strengthen information security, and increase efficiency; and (x) continuing to implement enhancements to further strengthen Fidelity's product line to increase investors' probability of success in achieving their investment goals, including retirement income goals.
Investment Performance. The Board considered whether the fund has operated in accordance with its investment objective, as well as its record of compliance with its investment restrictions and its performance history.
The Board took into account discussions that occur at Board meetings throughout the year with representatives of the Investment Advisers about fund investment performance. In this regard the Board noted that as part of regularly scheduled fund reviews and other reports to the Board on fund performance, the Board considers annualized return information for the fund for different time periods, measured against an appropriate securities market index (benchmark index) and an appropriate peer group of funds with similar objectives (peer group). The Board also reviews and considers information about performance attribution. In its evaluation of fund investment performance, the Board gave particular attention to information indicating changes in performance of certain Fidelity funds for specific time periods and discussed with the Investment Advisers the reasons for any overperformance or underperformance.
In addition to reviewing absolute and relative fund performance, the Independent Trustees periodically consider the appropriateness of fund performance metrics in evaluating the results achieved. In general, the Independent Trustees believe that fund performance should be evaluated based on net performance (after fees and expenses) of the representative class, compared to appropriate benchmark indices, over appropriate time periods that may include full market cycles, and compared to peer groups, as applicable, over the same periods, taking into account relevant factors including the following: general market conditions; issuer-specific information; and fund cash flows and other factors.
The Independent Trustees recognize that shareholders evaluate performance on a net basis over their own holding periods, for which one-, three-, and five-year periods are often used as a proxy. For this reason, the performance information reviewed by the Board also included net cumulative total return information for the fund and an appropriate benchmark index and peer group for the most recent one-, three-, and five-year periods ended September 30, 2021, as shown below. Returns are shown compared to the 25th percentile (top of box, 75% beaten) and 75th percentile (bottom of box, 25% beaten) of the peer universe.
Fidelity Blue Chip Growth Fund
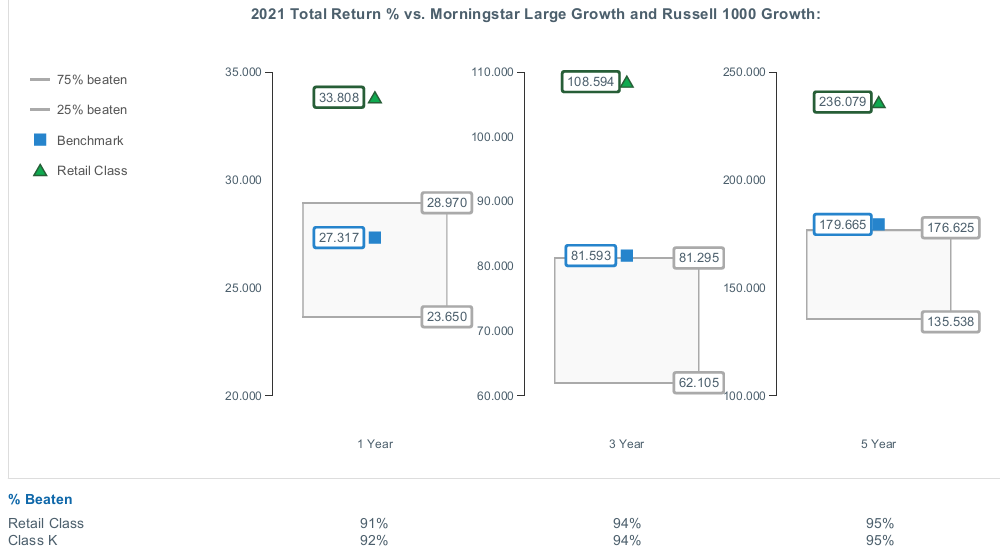
Based on its review, the Board concluded that the nature, extent, and quality of services provided to the fund under the Advisory Contracts should continue to benefit the shareholders of the fund.
Competitiveness of Management Fee and Total Expense Ratio. The Board considered the fund's management fee and total expense ratio compared to "mapped groups" of competitive funds and classes created for the purpose of facilitating the Trustees' competitive analysis of management fees and total expenses. Fidelity creates "mapped groups" by combining similar Lipper investment objective categories that have comparable investment mandates. Combining Lipper investment objective categories aids the Board's management fee and total expense ratio comparisons by broadening the competitive group used for comparison.
Management Fee. The Board considered two proprietary management fee comparisons for the 12-month periods ended September 30 (June 30 for periods ended 2019 and 2018 and December 31 for periods prior to 2018) shown in basis points (BP) in the chart below. The group of Lipper funds used by the Board for management fee comparisons is referred to below as the "Total Mapped Group." The Total Mapped Group comparison focuses on a fund's standing in terms of gross management fees before expense reimbursements or caps, and without giving effect to the fund's performance adjustment, relative to the total universe of funds with comparable investment mandates, regardless of whether their management fee structures also are comparable. Funds with comparable investment mandates offer exposure to similar types of securities. Funds with comparable management fee structures have similar management fee contractual arrangements (
e.g., flat rate charged for advisory services, all-inclusive fee rate,
etc.). "TMG %" represents the percentage of funds in the Total Mapped Group that had management fees that were lower than the fund's. For example, a hypothetical TMG % of 20% would mean that 80% of the funds in the Total Mapped Group had higher, and 20% had lower, management fees than the fund. The fund's actual TMG %s and the number of funds in the Total Mapped Group are in the chart below. The "Asset-Sized Peer Group" (ASPG) comparison focuses on a fund's standing relative to a subset of non-Fidelity funds within the Total Mapped Group that are similar in size and management fee structure without taking into account performance adjustments, if any. For example, if a fund is in the first quartile of the ASPG, the fund's management fee ranks in the least expensive or lowest 25% of funds in the ASPG. The ASPG represents at least 15% of the funds in the Total Mapped Group with comparable asset size and management fee structures, subject to a minimum of 50 funds (or all funds in the Total Mapped Group if fewer than 50). Additional information, such as the ASPG quartile in which the fund's management fee rate ranked and the impact of the fund's performance adjustment, is also included in the chart and was considered by the Board.
Fidelity Blue Chip Growth Fund

The Board noted that the fund's management fee rate ranked below the median of its Total Mapped Group and below the median of its ASPG for the 12-month period ended September 30, 2021. The Board also noted the effect of the fund's performance adjustment, if any, on the fund's management fee ranking.
The Board also considered that, for funds subject to the group fee, FMR agreed to voluntarily waive fees over a specified period of time in amounts designed to account for assets converted from certain funds to certain collective investment trusts.
Based on its review, the Board concluded that the fund's management fee is fair and reasonable in light of the services that the fund receives and the other factors considered.
Total Expense Ratio. In its review of the total expense ratio of the representative class (retail class), the Board considered the fund's management fee rate as well as other fund or class expenses, as applicable, such as transfer agent fees, pricing and bookkeeping fees, and custodial, legal, and audit fees. The Board noted the impact of the fund's performance adjustment. The Board also noted that Fidelity may agree to waive fees or reimburse expenses from time to time, and the extent to which, if any, it has done so for the fund. The fund's representative class is compared to those funds and classes in the Total Mapped Group (used by the Board for management fee comparisons) that have a similar sales load structure. The Board also considered a total expense ASPG comparison, which focuses on the total expenses of the representative class relative to a subset of non-Fidelity funds within the total expense similar sales load structure group. The total expense ASPG is limited to 15 larger and 15 smaller classes in fund average assets for a total of 30 classes, where possible. The total expense ASPG comparison excludes performance adjustments and fund-paid 12b-1 fees to eliminate variability in fee structures.
The Board noted that the total net expense ratio of the retail class ranked below the similar sales load structure group competitive median and below the ASPG competitive median for the 12-month period ended September 30, 2021.
Fees Charged to Other Fidelity Clients. The Board also considered Fidelity fee structures and other information with respect to clients of Fidelity, such as other funds advised or subadvised by Fidelity, pension plan clients, and other institutional clients with similar mandates. The Board noted that a joint ad hoc committee created by it and the boards of other Fidelity funds periodically reviews and compares Fidelity's institutional investment advisory business with its business of providing services to the Fidelity funds and also noted the most recent findings of the committee. The Board noted that the committee's review included a consideration of the differences in services provided, fees charged, and costs incurred, as well as competition in the markets serving the different categories of clients.
Based on its review of total expense ratios and fees charged to other Fidelity clients, the Board concluded that the total expense ratio of each class of the fund was reasonable in light of the services that the fund and its shareholders receive and the other factors considered.
Costs of the Services and Profitability. The Board considered the revenues earned and the expenses incurred by Fidelity in conducting the business of developing, marketing, distributing, managing, administering and servicing the fund and servicing the fund's shareholders. The Board also considered the level of Fidelity's profits in respect of all the Fidelity funds.
On an annual basis, Fidelity presents to the Board information about the profitability of its relationships with the fund. Fidelity calculates profitability information for each fund, as well as aggregate profitability information for groups of Fidelity funds and all Fidelity funds, using a series of detailed revenue and cost allocation methodologies which originate with the books and records of Fidelity on which Fidelity's audited financial statements are based. The Audit Committee of the Board reviews any significant changes from the prior year's methodologies and the full Board approves such changes.
A public accounting firm has been engaged annually by the Board as part of the Board's assessment of Fidelity's profitability analysis. The engagement includes the review and assessment of the methodologies used by Fidelity in determining the revenues and expenses attributable to Fidelity's mutual fund business, and completion of agreed-upon procedures in respect of the mathematical accuracy of certain fund profitability information and its conformity to established allocation methodologies. After considering the reports issued under the engagement and information provided by Fidelity, the Board concluded that while other allocation methods may also be reasonable, Fidelity's profitability methodologies are reasonable in all material respects.
The Board also reviewed Fidelity's non-fund businesses and potential indirect benefits such businesses may have received as a result of their association with Fidelity's mutual fund business (i.e., fall-out benefits) as well as cases where Fidelity's affiliates may benefit from the funds' business. The Board considered areas where potential indirect benefits to the Fidelity funds from their relationships with Fidelity may exist. The Board's consideration of these matters was informed by the findings of a joint ad hoc committee created by it and the boards of other Fidelity funds to evaluate potential fall-out benefits.
The Board considered the costs of the services provided by and the profits realized by Fidelity in connection with the operation of the fund and was satisfied that the profitability was not excessive.
Economies of Scale. The Board considered whether there have been economies of scale in respect of the management of the Fidelity funds, whether the Fidelity funds (including the fund) have appropriately benefited from any such economies of scale, and whether there is potential for realization of any further economies of scale. The Board considered the extent to which the fund will benefit from economies of scale as assets grow through increased services to the fund, through waivers or reimbursements, or through fee or expense ratio reductions. The Board also noted that a committee (the Economies of Scale Committee) created by it and the boards of other Fidelity funds periodically analyzes whether Fidelity attains economies of scale in respect of the management and servicing of the Fidelity funds, whether the Fidelity funds have appropriately benefited from such economies of scale, and whether there is potential for realization of any further economies of scale.
The Board recognized that the fund's management contract incorporates a "group fee" structure, which provides for lower group fee rates as total "group assets" increase, and for higher group fee rates as total "group assets" decrease ("group assets" as defined in the management contract). FMR calculates the group fee rates based on a tiered asset "breakpoint" schedule that varies based on asset class. The Board considered that the group fee is designed to deliver the benefits of economies of scale to fund shareholders when total Fidelity fund assets increase, even if assets of any particular fund are unchanged or have declined, because some portion of Fidelity's costs are attributable to services provided to all Fidelity funds, and all funds benefit if those costs can be allocated among more assets. The Board further considered that Fidelity agreed to impose a temporary fee waiver in the form of additional breakpoints to the current breakpoint schedule. The Board concluded that, given the group fee structure, fund shareholders will benefit from lower management fees as "group assets" increase at the fund complex level, regardless of whether Fidelity achieves any such economies of scale.
The Board concluded, taking into account the analysis of the Economies of Scale Committee, that economies of scale, if any, are being appropriately shared between fund shareholders and Fidelity.
Additional Information Requested by the Board. In order to develop fully the factual basis for consideration of the Fidelity funds' advisory contracts, the Board requested and received additional information on certain topics, including: (i) fund flow and performance trends, in particular the underperformance of certain funds and strategies, and Fidelity's long-term strategies for certain funds, including any consideration of fund liquidations or mergers; (ii) the operation of performance fees, competitor use of performance fees, and consideration of the expansion of performance fees to additional funds; (iii) Fidelity's pricing philosophy compared to competitors; (iv) fund profitability methodology and data; (v) evaluation of competitive fund data and peer group classifications and fee and expense comparisons; (vi) the management fee and expense structures for different funds and classes and information about the differences between various fee and expense structures; (vii) group fee breakpoints and related voluntary fee waivers; and (viii) information regarding other accounts managed by Fidelity and the funds' sub-advisory arrangements.
Based on its evaluation of all of the conclusions noted above, and after considering all factors it believed relevant, the Board concluded that the advisory fee arrangements are fair and reasonable and that the fund's Advisory Contracts should be renewed.
Liquidity Risk Management Program
The Securities and Exchange Commission adopted Rule 22e-4 under the Investment Company Act of 1940 (the Liquidity Rule) to promote effective liquidity risk management throughout the open-end investment company industry, thereby reducing the risk that funds will be unable to meet their redemption obligations and mitigating dilution of the interests of fund shareholders.
The Fund has adopted and implemented a liquidity risk management program pursuant to the Liquidity Rule (the Program) effective December 1, 2018. The Program is reasonably designed to assess and manage the Fund’s liquidity risk and to comply with the requirements of the Liquidity Rule. The Fund’s Board of Trustees (the Board) has designated the Fund’s investment adviser as administrator of the Program. The Fidelity advisers have established a Liquidity Risk Management Committee (the LRM Committee) to manage the Program for each of the Fidelity Funds. The LRM Committee monitors the adequacy and effectiveness of implementation of the Program and on a periodic basis assesses each Fund’s liquidity risk based on a variety of factors including (1) the Fund’s investment strategy, (2) portfolio liquidity and cash flow projections during normal and reasonably foreseeable stressed conditions, (3) shareholder redemptions, (4) borrowings and other funding sources and (5) in the case of exchange-traded funds, certain additional factors including the effect of the Fund’s prices and spreads, market participants, and basket compositions on the overall liquidity of the Fund’s portfolio, as applicable.
In accordance with the Program, each of the Fund’s portfolio investments is classified into one of four liquidity categories described below based on a determination of a reasonable expectation for how long it would take to convert the investment to cash (or sell or dispose of the investment) without significantly changing its market value.
- Highly liquid investments – cash or convertible to cash within three business days or less
- Moderately liquid investments – convertible to cash in three to seven calendar days
- Less liquid investments – can be sold or disposed of, but not settled, within seven calendar days
- Illiquid investments – cannot be sold or disposed of within seven calendar days
Liquidity classification determinations take into account a variety of factors including various market, trading and investment-specific considerations, as well as market depth, and generally utilize analysis from a third-party liquidity metrics service.
The Liquidity Rule places a 15% limit on a fund’s illiquid investments and requires funds that do not primarily hold assets that are highly liquid investments to determine and maintain a minimum percentage of the fund’s net assets to be invested in highly liquid investments (highly liquid investment minimum or HLIM). The Program includes provisions reasonably designed to comply with the 15% limit on illiquid investments and for determining, periodically reviewing and complying with the HLIM requirement as applicable.
At a recent meeting of the Fund’s Board of Trustees, the LRM Committee provided a written report to the Board pertaining to the operation, adequacy, and effectiveness of implementation of the Program for the annual period from December 1, 2020 through November 30, 2021. The report concluded that the Program has been implemented and is operating effectively and is reasonably designed to assess and manage the Fund’s liquidity risk.

BCF-ANN-0922
1.536058.125
Fidelity® Blue Chip Growth K6 Fund
Annual Report
July 31, 2022
Contents
To view a fund's proxy voting guidelines and proxy voting record for the 12-month period ended June 30, visit http://www.fidelity.com/proxyvotingresults or visit the Securities and Exchange Commission's (SEC) web site at http://www.sec.gov.
You may also call 1-800-835-5092 to request a free copy of the proxy voting guidelines.
Standard & Poor's, S&P and S&P 500 are registered service marks of The McGraw-Hill Companies, Inc. and have been licensed for use by Fidelity Distributors Corporation.
Other third-party marks appearing herein are the property of their respective owners.
All other marks appearing herein are registered or unregistered trademarks or service marks of FMR LLC or an affiliated company. © 2022 FMR LLC. All rights reserved.
This report and the financial statements contained herein are submitted for the general information of the shareholders of the Fund. This report is not authorized for distribution to prospective investors in the Fund unless preceded or accompanied by an effective prospectus.
A fund files its complete schedule of portfolio holdings with the SEC for the first and third quarters of each fiscal year on Form N-PORT. Forms N-PORT are available on the SEC’s web site at http://www.sec.gov. A fund's Forms N-PORT may be reviewed and copied at the SEC’s Public Reference Room in Washington, DC. Information regarding the operation of the SEC's Public Reference Room may be obtained by calling 1-800-SEC-0330.
For a complete list of a fund's portfolio holdings, view the most recent holdings listing, semiannual report, or annual report on Fidelity's web site at http://www.fidelity.com, http://www.institutional.fidelity.com, or http://www.401k.com, as applicable.
NOT FDIC INSURED •MAY LOSE VALUE •NO BANK GUARANTEE
Neither the Fund nor Fidelity Distributors Corporation is a bank.
Note to Shareholders:
Early in 2020, the outbreak and spread of COVID-19 emerged as a public health emergency that had a major influence on financial markets, primarily based on its impact on the global economy and corporate earnings. On March 11, 2020, the World Health Organization declared the COVID-19 outbreak a pandemic, citing sustained risk of further global spread. The pandemic prompted a number of measures to limit the spread of COVID-19, including travel and border restrictions, quarantines, and restrictions on large gatherings. In turn, these resulted in lower consumer activity, diminished demand for a wide range of products and services, disruption in manufacturing and supply chains, and – given the wide variability in outcomes regarding the outbreak – significant market uncertainty and volatility. To help stem the turmoil, the U.S. government took unprecedented action – in concert with the U.S. Federal Reserve and central banks around the world – to help support consumers, businesses, and the broader economy, and to limit disruption to the financial system.
In general, the overall impact of the pandemic lessened in 2021, amid a resilient economy and widespread distribution of three COVID-19 vaccines granted emergency use authorization from the U.S. Food and Drug Administration (FDA) early in the year. Still, the situation remains dynamic, and the extent and duration of its influence on financial markets and the economy is highly uncertain, due in part to a recent spike in cases based on highly contagious variants of the coronavirus.
Extreme events such as the COVID-19 crisis are exogenous shocks that can have significant adverse effects on mutual funds and their investments. Although multiple asset classes may be affected by market disruption, the duration and impact may not be the same for all types of assets. Fidelity is committed to helping you stay informed amid news about COVID-19 and during increased market volatility, and we continue to take extra steps to be responsive to customer needs. We encourage you to visit us online, where we offer ongoing updates, commentary, and analysis on the markets and our funds.
Performance: The Bottom Line
Average annual total return reflects the change in the value of an investment, assuming reinvestment of distributions from dividend income and capital gains (the profits earned upon the sale of securities that have grown in value, if any) and assuming a constant rate of performance each year. The hypothetical investment and the average annual total returns do not reflect the deduction of taxes that a shareholder would pay on fund distributions or the redemption of fund shares. During periods of reimbursement by Fidelity, a fund’s total return will be greater than it would be had the reimbursement not occurred. How a fund did yesterday is no guarantee of how it will do tomorrow.
Average Annual Total Returns
| For the periods ended July 31, 2022 | Past 1 year | Past 5 years | Life of fundA |
| Fidelity® Blue Chip Growth K6 Fund | (22.62)% | 16.40% | 16.47% |
A From May 25, 2017
$10,000 Over Life of Fund
Let's say hypothetically that $10,000 was invested in Fidelity® Blue Chip Growth K6 Fund on May 25, 2017, when the fund started.
The chart shows how the value of your investment would have changed, and also shows how the Russell 1000® Growth Index performed over the same period.
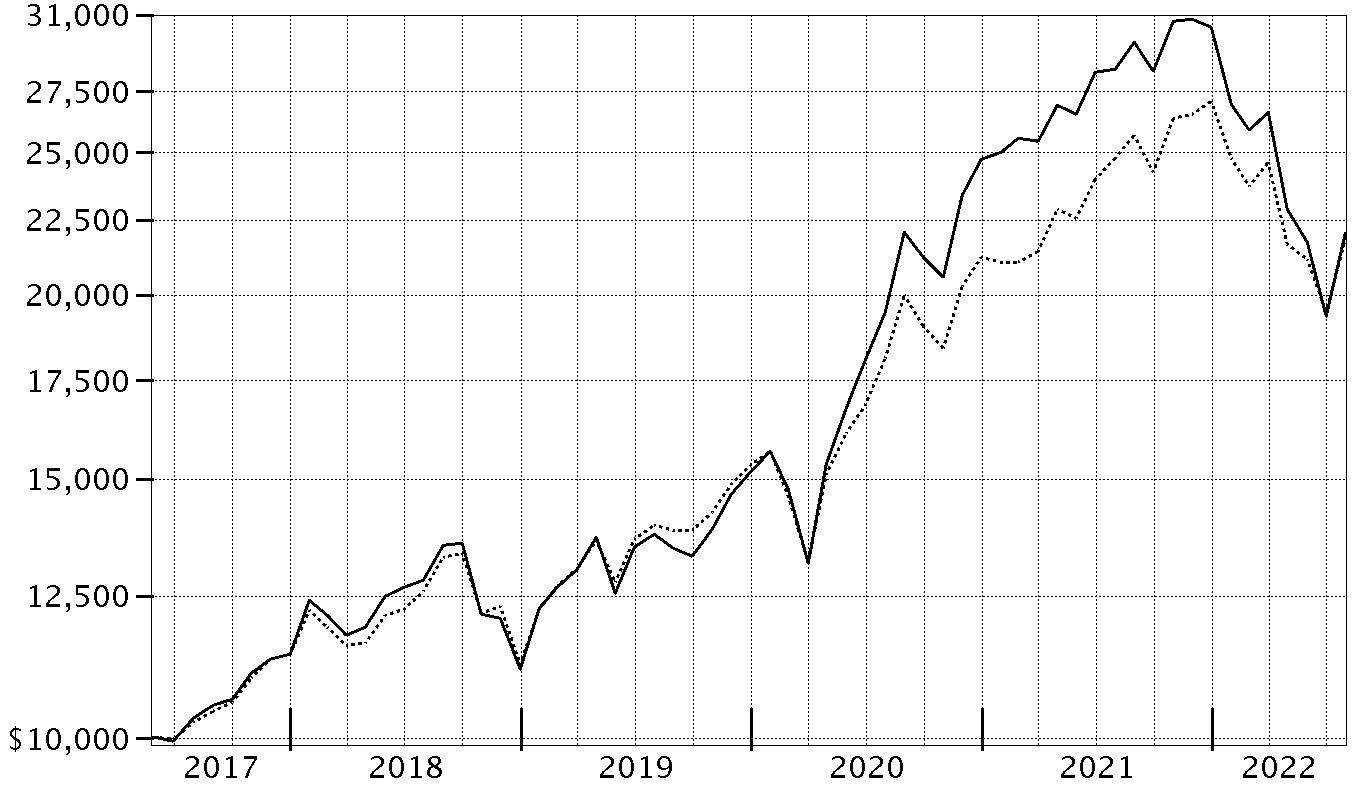
| Period Ending Values |
| $22,052 | Fidelity® Blue Chip Growth K6 Fund |
| $21,819 | Russell 1000® Growth Index |
Management's Discussion of Fund Performance
Market Recap: The S&P 500
® index returned -4.64% for the 12 months ending July 31, 2022, as a multitude of crosscurrents challenged the global economy and financial markets. Persistently high inflation, exacerbated by energy price shocks from the Russia–Ukraine conflict, spurred the U.S. Federal Reserve to hike interest rates more aggressively than anticipated, and concerns about the outlook for economic growth sent stocks into bear market territory. In early May, the Fed approved a rare half-percentage-point interest rate increase and announced plans to shrink its $9 trillion asset portfolio. June began with the Fed allowing up to billions in Treasuries and mortgage bonds to mature every month without investing the proceeds. Two weeks later, the central bank raised rates by 0.75 percentage points, its largest increase since 1994, and said it was becoming more difficult to achieve a soft landing, in which the economy slows enough to bring down inflation while avoiding a recession. Against this volatile backdrop, the S&P 500 posted its worst first-half result (-19.96%) to begin a year since 1970. Stocks sharply reversed course in July (+9.22%), as the Fed again raised its benchmark interest rate by 0.75% but signaled that, at some point, it will likely slow the pace of tightening to assess the impact on the economy. For the full 12 months, growth-oriented communication services (-29%) and consumer discretionary (-10%) stocks lagged most. In contrast, energy (+67%) rode a surge in commodity prices and led by a wide margin, followed by the defensive utilities (+16%) and consumer staples (+7%) sectors.
Comments from Portfolio Manager Sonu Kalra: For the fiscal year ending July 31, 2022, the fund returned -22.62%, trailing the -11.93% result of the benchmark Russell 1000
® Growth Index. Versus the benchmark, security selection was the primary detractor. Weak picks in the consumer discretionary and industrials sectors hindered the fund's relative result. Also hampering performance were stock picks in the information technology sector, especially within the software & services industry. The fund's biggest individual relative detractor was an overweighting in Lyft, which returned -75% the past year. Another notable relative detractor was an out-of-benchmark stake in Snap (-87%). We added to our stake in the company the past year. Also hurting performance was our outsized stake in Carvana, which returned -92%. We increased our position the past 12 months. In contrast, the top contributor to performance versus the benchmark was an overweighting in energy. Stock selection in materials also lifted the fund's relative performance. Lastly, the fund's position in cash was a contributor. Our non-benchmark stake in Celsius Holdings was the fund's largest individual relative contributor, driven by a gain of approximately 29%. We added to our stake in the company in the past year. An outsized stake in Dollar Tree (+73%), a position we established this period, also contributed, as did an overweighting in semiconductor company Nvidia (-7%), a position we added to during the past 12 months. Notable changes in positioning include a lower allocation to the communication services and industrials sectors.
The views expressed above reflect those of the portfolio manager(s) only through the end of the period as stated on the cover of this report and do not necessarily represent the views of Fidelity or any other person in the Fidelity organization. Any such views are subject to change at any time based upon market or other conditions and Fidelity disclaims any responsibility to update such views. These views may not be relied on as investment advice and, because investment decisions for a Fidelity fund are based on numerous factors, may not be relied on as an indication of trading intent on behalf of any Fidelity fund.
Investment Summary (Unaudited)
Top Ten Stocks as of July 31, 2022
| | % of fund's net assets |
| Apple, Inc. | 11.2 |
| Microsoft Corp. | 7.5 |
| Amazon.com, Inc. | 6.6 |
| NVIDIA Corp. | 5.2 |
| Tesla, Inc. | 4.7 |
| Alphabet, Inc. Class A | 4.5 |
| Marvell Technology, Inc. | 4.0 |
| Meta Platforms, Inc. Class A | 2.7 |
| NXP Semiconductors NV | 1.8 |
| Lowe's Companies, Inc. | 1.8 |
| | 50.0 |
Market Sectors as of July 31, 2022
| | % of fund's net assets |
| Information Technology | 39.7 |
| Consumer Discretionary | 29.7 |
| Communication Services | 9.7 |
| Health Care | 8.1 |
| Energy | 4.8 |
| Industrials | 2.2 |
| Materials | 1.6 |
| Consumer Staples | 1.4 |
| Financials | 1.1 |
| Real Estate | 0.1 |
| Utilities | 0.1 |
Asset Allocation (% of fund's net assets)
| As of July 31, 2022* |
| | Stocks | 97.3% |
| | Convertible Securities | 1.2% |
| | Short-Term Investments and Net Other Assets (Liabilities) | 1.5% |

* Foreign investments - 7.4%
Schedule of Investments July 31, 2022
Showing Percentage of Net Assets
| Common Stocks - 97.1% | | | |
| | | Shares | Value |
| COMMUNICATION SERVICES - 9.6% | | | |
| Diversified Telecommunication Services - 0.0% | | | |
| Starry, Inc. | | 199,782 | $607,337 |
| Entertainment - 1.7% | | | |
| Bilibili, Inc. ADR (a) | | 511,426 | 12,499,251 |
| Endeavor Group Holdings, Inc. (a) | | 178,452 | 4,066,921 |
| Netflix, Inc. (a) | | 363,634 | 81,781,287 |
| Sea Ltd. ADR (a) | | 218,977 | 16,712,325 |
| Universal Music Group NV | | 147,536 | 3,339,702 |
| | | | 118,399,486 |
| Interactive Media & Services - 7.8% | | | |
| Alphabet, Inc. Class A (a) | | 2,661,700 | 309,608,944 |
| Meta Platforms, Inc. Class A (a) | | 1,149,375 | 182,865,563 |
| Snap, Inc. Class A (a) | | 4,080,143 | 40,311,813 |
| | | | 532,786,320 |
| Wireless Telecommunication Services - 0.1% | | | |
| T-Mobile U.S., Inc. (a) | | 43,891 | 6,279,046 |
|
| TOTAL COMMUNICATION SERVICES | | | 658,072,189 |
|
| CONSUMER DISCRETIONARY - 29.3% | | | |
| Automobiles - 5.2% | | | |
| Neutron Holdings, Inc. (a)(b)(c) | | 491,550 | 13,518 |
| Rad Power Bikes, Inc. (a)(b)(c) | | 101,681 | 529,758 |
| Rivian Automotive, Inc. | | 592,847 | 20,334,652 |
| Rivian Automotive, Inc. (d) | | 34,190 | 1,172,717 |
| Tesla, Inc. (a) | | 358,120 | 319,246,074 |
| XPeng, Inc. ADR (a) | | 622,763 | 15,214,100 |
| | | | 356,510,819 |
| Hotels, Restaurants & Leisure - 4.2% | | | |
| Airbnb, Inc. Class A (a) | | 648,564 | 71,977,633 |
| Booking Holdings, Inc. (a) | | 7,798 | 15,094,511 |
| Caesars Entertainment, Inc. (a) | | 691,855 | 31,610,855 |
| Chipotle Mexican Grill, Inc. (a) | | 27,265 | 42,648,458 |
| Hilton Worldwide Holdings, Inc. | | 198,840 | 25,465,439 |
| Marriott International, Inc. Class A | | 252,676 | 40,130,002 |
| Penn National Gaming, Inc. (a) | | 1,317,928 | 45,534,412 |
| Sonder Holdings, Inc. (a) | | 69,768 | 108,140 |
| Sonder Holdings, Inc.: | | | |
| rights (a)(c) | | 1,448 | 623 |
| rights (a)(c) | | 1,447 | 550 |
| rights (a)(c) | | 1,447 | 506 |
| rights (a)(c) | | 1,447 | 463 |
| rights (a)(c) | | 1,447 | 420 |
| rights (a)(c) | | 1,447 | 391 |
| Sweetgreen, Inc. Class A | | 998,394 | 15,684,770 |
| | | | 288,257,173 |
| Internet & Direct Marketing Retail - 9.4% | | | |
| Alibaba Group Holding Ltd. sponsored ADR (a) | | 153,884 | 13,752,613 |
| Amazon.com, Inc. (a) | | 3,329,440 | 449,307,928 |
| Deliveroo PLC Class A (a)(d) | | 1,133,995 | 1,251,719 |
| FSN E-Commerce Ventures Private Ltd. (a)(b) | | 629,400 | 9,973,425 |
| JD.com, Inc.: | | | |
| Class A | | 21,869 | 652,408 |
| sponsored ADR | | 259,330 | 15,430,135 |
| Lyft, Inc. (a) | | 3,206,204 | 44,437,987 |
| Pinduoduo, Inc. ADR (a) | | 402,285 | 19,715,988 |
| Uber Technologies, Inc. (a) | | 3,276,746 | 76,839,694 |
| Wayfair LLC Class A (a) | | 184,684 | 9,956,314 |
| | | | 641,318,211 |
| Multiline Retail - 1.3% | | | |
| Dollar Tree, Inc. (a) | | 418,304 | 69,170,749 |
| Ollie's Bargain Outlet Holdings, Inc. (a) | | 138,425 | 8,160,154 |
| Target Corp. | | 46,601 | 7,613,671 |
| | | | 84,944,574 |
| Specialty Retail - 5.0% | | | |
| American Eagle Outfitters, Inc. | | 1,657,135 | 19,951,905 |
| Burlington Stores, Inc. (a) | | 97,428 | 13,750,014 |
| Carvana Co. Class A (a)(e) | | 801,563 | 23,365,561 |
| Fanatics, Inc. Class A (b)(c) | | 183,732 | 11,872,762 |
| Five Below, Inc. (a) | | 243,055 | 30,884,999 |
| Floor & Decor Holdings, Inc. Class A (a)(e) | | 229,546 | 18,494,521 |
| Lowe's Companies, Inc. | | 639,988 | 122,576,902 |
| RH (a) | | 126,010 | 35,210,974 |
| TJX Companies, Inc. | | 623,678 | 38,144,146 |
| Victoria's Secret & Co. (a) | | 446,732 | 16,511,215 |
| Warby Parker, Inc. (a)(e) | | 703,069 | 8,711,025 |
| | | | 339,474,024 |
| Textiles, Apparel & Luxury Goods - 4.2% | | | |
| Capri Holdings Ltd. (a) | | 752,637 | 36,638,369 |
| Crocs, Inc. (a) | | 475,460 | 34,061,954 |
| Deckers Outdoor Corp. (a) | | 133,738 | 41,888,079 |
| Hermes International SCA | | 1,994 | 2,718,649 |
| lululemon athletica, Inc. (a) | | 243,292 | 75,544,599 |
| LVMH Moet Hennessy Louis Vuitton SE | | 21,551 | 14,964,041 |
| NIKE, Inc. Class B | | 624,699 | 71,790,409 |
| On Holding AG | | 457,404 | 9,957,685 |
| | | | 287,563,785 |
|
| TOTAL CONSUMER DISCRETIONARY | | | 1,998,068,586 |
|
| CONSUMER STAPLES - 1.4% | | | |
| Beverages - 1.1% | | | |
| Boston Beer Co., Inc. Class A (a) | | 29,090 | 11,066,709 |
| Celsius Holdings, Inc. (a)(e) | | 640,611 | 56,988,755 |
| Constellation Brands, Inc. Class A (sub. vtg.) | | 12,300 | 3,029,613 |
| | | | 71,085,077 |
| Food & Staples Retailing - 0.2% | | | |
| Albertsons Companies, Inc. | | 146,286 | 3,927,779 |
| BJ's Wholesale Club Holdings, Inc. (a) | | 87,353 | 5,913,798 |
| Blink Health LLC Series A1 (a)(b)(c) | | 5,757 | 218,421 |
| Sysco Corp. | | 66,980 | 5,686,602 |
| Walmart, Inc. | | 4,800 | 633,840 |
| | | | 16,380,440 |
| Food Products - 0.0% | | | |
| The Real Good Food Co. LLC: | | | |
| Class B (c) | | 139,521 | 1 |
| Class B unit (d) | | 139,521 | 906,887 |
| The Real Good Food Co., Inc. | | 8,674 | 56,381 |
| | | | 963,269 |
| Household Products - 0.1% | | | |
| Procter & Gamble Co. | | 54,687 | 7,596,571 |
| Tobacco - 0.0% | | | |
| JUUL Labs, Inc. Class A (a)(b)(c) | | 23,134 | 178,132 |
|
| TOTAL CONSUMER STAPLES | | | 96,203,489 |
|
| ENERGY - 4.8% | | | |
| Energy Equipment & Services - 0.1% | | | |
| Halliburton Co. | | 222,525 | 6,519,983 |
| Schlumberger Ltd. | | 19,700 | 729,491 |
| Tenaris SA sponsored ADR | | 38,596 | 1,083,004 |
| U.S. Silica Holdings, Inc. (a) | | 91,813 | 1,269,774 |
| | | | 9,602,252 |
| Oil, Gas & Consumable Fuels - 4.7% | | | |
| Antero Resources Corp. (a) | | 350,489 | 13,893,384 |
| Cenovus Energy, Inc. (Canada) | | 336,650 | 6,414,634 |
| Cheniere Energy, Inc. | | 50,257 | 7,517,442 |
| Denbury, Inc. (a) | | 125,451 | 9,021,181 |
| Devon Energy Corp. | | 324,554 | 20,398,219 |
| Diamondback Energy, Inc. | | 229,801 | 29,419,124 |
| EOG Resources, Inc. | | 290,840 | 32,347,225 |
| EQT Corp. | | 70,865 | 3,120,186 |
| Equinor ASA | | 68,162 | 2,624,504 |
| Exxon Mobil Corp. | | 216,427 | 20,978,269 |
| Hess Corp. | | 353,175 | 39,721,592 |
| Imperial Oil Ltd. | | 67,217 | 3,221,356 |
| Marathon Oil Corp. | | 373,222 | 9,255,906 |
| Northern Oil & Gas, Inc. | | 84,313 | 2,430,744 |
| Occidental Petroleum Corp. | | 272,947 | 17,946,265 |
| Ovintiv, Inc. | | 27,200 | 1,389,648 |
| Phillips 66 Co. | | 203,572 | 18,117,908 |
| Pioneer Natural Resources Co. | | 121,610 | 28,815,490 |
| Range Resources Corp. (a) | | 36,300 | 1,200,441 |
| Reliance Industries Ltd. | | 747,491 | 23,746,566 |
| Reliance Industries Ltd. sponsored GDR (d) | | 48,925 | 3,087,168 |
| Valero Energy Corp. | | 217,041 | 24,041,632 |
| | | | 318,708,884 |
|
| TOTAL ENERGY | | | 328,311,136 |
|
| FINANCIALS - 1.1% | | | |
| Banks - 0.4% | | | |
| Kotak Mahindra Bank Ltd. | | 72,602 | 1,665,485 |
| Wells Fargo & Co. | | 545,787 | 23,943,676 |
| | | | 25,609,161 |
| Consumer Finance - 0.6% | | | |
| American Express Co. | | 267,838 | 41,252,409 |
| Diversified Financial Services - 0.1% | | | |
| Ant International Co. Ltd. Class C (a)(b)(c) | | 403,977 | 763,517 |
| Berkshire Hathaway, Inc. Class B (a) | | 7,669 | 2,305,301 |
| | | | 3,068,818 |
| Insurance - 0.0% | | | |
| The Travelers Companies, Inc. | | 2 | 317 |
| Thrifts & Mortgage Finance - 0.0% | | | |
| Housing Development Finance Corp. Ltd. | | 65,160 | 1,964,163 |
|
| TOTAL FINANCIALS | | | 71,894,868 |
|
| HEALTH CARE - 8.1% | | | |
| Biotechnology - 1.3% | | | |
| Alnylam Pharmaceuticals, Inc. (a) | | 116,056 | 16,484,594 |
| Arcutis Biotherapeutics, Inc. (a) | | 77,091 | 1,870,228 |
| Argenx SE ADR (a) | | 14,215 | 5,177,245 |
| Ascendis Pharma A/S sponsored ADR (a) | | 68,372 | 5,847,857 |
| Avidity Biosciences, Inc. (a) | | 31,654 | 515,644 |
| Cibus Corp.: | | | |
| Series C (a)(b)(c)(f) | | 133,810 | 330,511 |
| Series D (a)(b)(c)(f) | | 134,400 | 331,968 |
| Series E (a)(b)(c)(f) | | 232,441 | 574,129 |
| Day One Biopharmaceuticals, Inc. (a) | | 315 | 5,396 |
| Generation Bio Co. (a) | | 114,301 | 729,240 |
| Horizon Therapeutics PLC (a) | | 298,870 | 24,797,244 |
| Immunocore Holdings PLC ADR (a) | | 118 | 5,445 |
| Instil Bio, Inc. (a) | | 92,341 | 520,803 |
| Karuna Therapeutics, Inc. (a) | | 26,770 | 3,486,793 |
| Regeneron Pharmaceuticals, Inc. (a) | | 17,732 | 10,314,527 |
| Vertex Pharmaceuticals, Inc. (a) | | 44,392 | 12,447,961 |
| Verve Therapeutics, Inc. (a) | | 79,103 | 1,947,516 |
| | | | 85,387,101 |
| Health Care Equipment & Supplies - 1.2% | | | |
| Axonics Modulation Technologies, Inc. (a) | | 114,166 | 7,405,948 |
| DexCom, Inc. (a) | | 444,124 | 36,453,698 |
| Insulet Corp. (a) | | 45,046 | 11,162,399 |
| Oddity Tech Ltd. (b)(c) | | 2,786 | 972,398 |
| Shockwave Medical, Inc. (a)(e) | | 138,392 | 29,191,025 |
| | | | 85,185,468 |
| Health Care Providers & Services - 2.2% | | | |
| agilon health, Inc. (a) | | 62,131 | 1,555,139 |
| Alignment Healthcare, Inc. (a) | | 148,109 | 2,174,240 |
| Centene Corp. (a) | | 55,475 | 5,157,511 |
| Cigna Corp. | | 4,500 | 1,239,120 |
| Elevance Health, Inc. | | 4,494 | 2,144,087 |
| Guardant Health, Inc. (a) | | 348,608 | 17,489,663 |
| LifeStance Health Group, Inc. (a) | | 265,869 | 1,584,579 |
| Surgery Partners, Inc. (a) | | 100,279 | 3,948,987 |
| UnitedHealth Group, Inc. | | 206,581 | 112,037,140 |
| | | | 147,330,466 |
| Health Care Technology - 0.0% | | | |
| Certara, Inc. (a) | | 66,277 | 1,523,708 |
| MultiPlan Corp. warrants (a)(b) | | 13,856 | 8,735 |
| | | | 1,532,443 |
| Life Sciences Tools & Services - 0.9% | | | |
| 10X Genomics, Inc. (a) | | 31,446 | 1,262,557 |
| Danaher Corp. | | 110,710 | 32,268,644 |
| ICON PLC (a) | | 17,730 | 4,277,363 |
| Olink Holding AB ADR (a) | | 108,305 | 1,456,702 |
| Seer, Inc. (a) | | 53,872 | 484,848 |
| Thermo Fisher Scientific, Inc. | | 24,935 | 14,921,353 |
| Veterinary Emergency Group LLC Class A (b)(c)(f) | | 62,379 | 3,267,025 |
| | | | 57,938,492 |
| Pharmaceuticals - 2.5% | | | |
| AstraZeneca PLC sponsored ADR | | 8,600 | 569,578 |
| Eli Lilly & Co. | | 317,896 | 104,807,132 |
| Roche Holding AG (participation certificate) | | 8,350 | 2,772,238 |
| Sanofi SA sponsored ADR | | 14,869 | 738,989 |
| Zoetis, Inc. Class A | | 349,573 | 63,814,551 |
| | | | 172,702,488 |
|
| TOTAL HEALTH CARE | | | 550,076,458 |
|
| INDUSTRIALS - 2.0% | | | |
| Aerospace & Defense - 0.8% | | | |
| Airbus Group NV | | 47,479 | 5,119,267 |
| General Dynamics Corp. | | 6,597 | 1,495,342 |
| Howmet Aerospace, Inc. | | 193,583 | 7,187,737 |
| L3Harris Technologies, Inc. | | 22,470 | 5,392,126 |
| Lockheed Martin Corp. | | 9,582 | 3,965,127 |
| Northrop Grumman Corp. | | 9,458 | 4,529,436 |
| Space Exploration Technologies Corp. Class A (a)(b)(c) | | 108,282 | 7,579,740 |
| The Boeing Co. (a) | | 108,967 | 17,359,533 |
| | | | 52,628,308 |
| Air Freight & Logistics - 0.0% | | | |
| Delhivery Private Ltd. (b) | | 271,900 | 1,958,272 |
| Electrical Equipment - 0.5% | | | |
| Acuity Brands, Inc. | | 120,882 | 22,048,877 |
| Generac Holdings, Inc. (a) | | 40,494 | 10,864,540 |
| | | | 32,913,417 |
| Industrial Conglomerates - 0.2% | | | |
| General Electric Co. | | 164,018 | 12,122,570 |
| Machinery - 0.2% | | | |
| Deere & Co. | | 37,016 | 12,703,151 |
| Road & Rail - 0.3% | | | |
| Avis Budget Group, Inc. (a) | | 54,554 | 9,930,465 |
| Bird Global, Inc. (a)(b) | | 201,367 | 108,335 |
| Bird Global, Inc.: | | | |
| Class A (a)(e) | | 1,735,744 | 933,830 |
| rights (a)(c) | | 25,742 | 515 |
| rights (a)(c) | | 25,742 | 257 |
| rights (a)(c) | | 25,741 | 0 |
| Hertz Global Holdings, Inc. (e) | | 508,490 | 10,891,856 |
| | | | 21,865,258 |
|
| TOTAL INDUSTRIALS | | | 134,190,976 |
|
| INFORMATION TECHNOLOGY - 39.1% | | | |
| IT Services - 2.7% | | | |
| MasterCard, Inc. Class A | | 270,726 | 95,780,152 |
| MongoDB, Inc. Class A (a) | | 34,727 | 10,851,146 |
| Okta, Inc. (a) | | 251,628 | 24,772,777 |
| Shift4 Payments, Inc. (a)(e) | | 173,295 | 6,313,137 |
| Snowflake, Inc. (a) | | 45,052 | 6,753,745 |
| Toast, Inc. | | 3,400 | 54,332 |
| Twilio, Inc. Class A (a) | | 299,370 | 25,386,576 |
| Visa, Inc. Class A | | 66,236 | 14,049,318 |
| | | | 183,961,183 |
| Semiconductors & Semiconductor Equipment - 14.0% | | | |
| Advanced Micro Devices, Inc. (a) | | 582,114 | 54,992,310 |
| ASML Holding NV | | 15,895 | 9,130,724 |
| Cirrus Logic, Inc. (a) | | 112,221 | 9,590,407 |
| Enphase Energy, Inc. (a) | | 3,300 | 937,794 |
| GlobalFoundries, Inc. | | 593,513 | 30,554,049 |
| Lam Research Corp. | | 25,451 | 12,738,480 |
| Marvell Technology, Inc. | | 4,848,375 | 269,957,520 |
| Monolithic Power Systems, Inc. | | 20,316 | 9,441,252 |
| NVIDIA Corp. | | 1,946,471 | 353,537,528 |
| NXP Semiconductors NV | | 668,453 | 122,915,138 |
| onsemi (a) | | 446,236 | 29,799,640 |
| SolarEdge Technologies, Inc. (a) | | 4,800 | 1,728,624 |
| Synaptics, Inc. (a) | | 26,650 | 3,862,918 |
| Taiwan Semiconductor Manufacturing Co. Ltd. sponsored ADR | | 144,874 | 12,818,452 |
| Teradyne, Inc. | | 302,951 | 30,564,726 |
| | | | 952,569,562 |
| Software - 11.2% | | | |
| Atlassian Corp. PLC (a) | | 22,475 | 4,704,467 |
| Bill.Com Holdings, Inc. (a) | | 61,556 | 8,314,984 |
| Coupa Software, Inc. (a) | | 131,855 | 8,625,954 |
| Crowdstrike Holdings, Inc. (a) | | 83,845 | 15,393,942 |
| Datadog, Inc. Class A (a) | | 77,301 | 7,885,475 |
| EngageSmart, Inc. | | 102,915 | 1,942,006 |
| Epic Games, Inc. (a)(b)(c) | | 607 | 564,510 |
| HubSpot, Inc. (a) | | 75,488 | 23,250,304 |
| Intuit, Inc. | | 82,585 | 37,672,799 |
| Microsoft Corp. | | 1,821,808 | 511,454,378 |
| Paycom Software, Inc. (a) | | 15,700 | 5,188,693 |
| Pine Labs Private Ltd. (a)(b)(c) | | 1,109 | 620,596 |
| Riskified Ltd. Class A (d) | | 6,825 | 29,962 |
| Salesforce.com, Inc. (a) | | 553,330 | 101,823,787 |
| ServiceNow, Inc. (a) | | 41,161 | 18,384,972 |
| Stripe, Inc. Class B (a)(b)(c) | | 19,200 | 555,264 |
| Zoom Video Communications, Inc. Class A (a) | | 192,795 | 20,023,689 |
| | | | 766,435,782 |
| Technology Hardware, Storage & Peripherals - 11.2% | | | |
| Apple, Inc. | | 4,724,365 | 767,756,550 |
|
| TOTAL INFORMATION TECHNOLOGY | | | 2,670,723,077 |
|
| MATERIALS - 1.5% | | | |
| Chemicals - 1.0% | | | |
| Cabot Corp. | | 64,687 | 4,803,657 |
| CF Industries Holdings, Inc. | | 180,353 | 17,221,908 |
| Nutrien Ltd. | | 324,034 | 27,738,555 |
| The Mosaic Co. | | 409,845 | 21,582,438 |
| | | | 71,346,558 |
| Metals & Mining - 0.5% | | | |
| Freeport-McMoRan, Inc. | | 992,514 | 31,313,817 |
|
| TOTAL MATERIALS | | | 102,660,375 |
|
| REAL ESTATE - 0.1% | | | |
| Equity Real Estate Investment Trusts (REITs) - 0.0% | | | |
| Welltower, Inc. | | 8,036 | 693,828 |
| Real Estate Management & Development - 0.1% | | | |
| WeWork, Inc. (a)(e) | | 2,031,531 | 9,690,403 |
|
| TOTAL REAL ESTATE | | | 10,384,231 |
|
| UTILITIES - 0.1% | | | |
| Electric Utilities - 0.0% | | | |
| ORSTED A/S (d) | | 15,754 | 1,834,028 |
| Multi-Utilities - 0.1% | | | |
| Sempra Energy | | 16,876 | 2,798,041 |
|
| TOTAL UTILITIES | | | 4,632,069 |
|
| TOTAL COMMON STOCKS | | | |
| (Cost $5,342,666,173) | | | 6,625,217,454 |
|
| Preferred Stocks - 1.3% | | | |
| Convertible Preferred Stocks - 1.1% | | | |
| COMMUNICATION SERVICES - 0.1% | | | |
| Interactive Media & Services - 0.1% | | | |
| Reddit, Inc.: | | | |
| Series E (a)(b)(c) | | 4,835 | 190,209 |
| Series F (b)(c) | | 51,156 | 2,012,477 |
| | | | 2,202,686 |
| CONSUMER DISCRETIONARY - 0.2% | | | |
| Automobiles - 0.0% | | | |
| Rad Power Bikes, Inc.: | | | |
| Series A (a)(b)(c) | | 13,256 | 69,064 |
| Series C (a)(b)(c) | | 52,162 | 271,764 |
| Series D (b)(c) | | 102,800 | 535,588 |
| | | | 876,416 |
| Hotels, Restaurants & Leisure - 0.0% | | | |
| Discord, Inc. Series I (b)(c) | | 700 | 268,093 |
| Internet & Direct Marketing Retail - 0.1% | | | |
| GoBrands, Inc.: | | | |
| Series G (a)(b)(c) | | 18,300 | 4,174,779 |
| Series H (b)(c) | | 11,467 | 2,615,967 |
| Instacart, Inc.: | | | |
| Series H (a)(b)(c) | | 27,205 | 1,429,079 |
| Series I (a)(b)(c) | | 13,064 | 686,252 |
| | | | 8,906,077 |
| Textiles, Apparel & Luxury Goods - 0.1% | | | |
| Algolia SAS Series D (b)(c) | | 30,436 | 559,109 |
| CelLink Corp. Series D (b)(c) | | 92,760 | 1,721,626 |
| | | | 2,280,735 |
| TOTAL CONSUMER DISCRETIONARY | | | 12,331,321 |
| CONSUMER STAPLES - 0.0% | | | |
| Food & Staples Retailing - 0.0% | | | |
| Blink Health LLC Series C (a)(b)(c) | | 16,970 | 643,842 |
| Food Products - 0.0% | | | |
| AgBiome LLC Series C (a)(b)(c) | | 68,700 | 435,558 |
| Bowery Farming, Inc. Series C1 (a)(b)(c) | | 17,874 | 591,808 |
| | | | 1,027,366 |
| Tobacco - 0.0% | | | |
| JUUL Labs, Inc. Series E (a)(b)(c) | | 12,508 | 96,312 |
| TOTAL CONSUMER STAPLES | | | 1,767,520 |
| INDUSTRIALS - 0.2% | | | |
| Aerospace & Defense - 0.2% | | | |
| ABL Space Systems: | | | |
| Series B (a)(b)(c) | | 29,724 | 1,580,425 |
| Series B2 (b)(c) | | 17,155 | 912,131 |
| Relativity Space, Inc. Series E (a)(b)(c) | | 276,014 | 5,478,878 |
| Space Exploration Technologies Corp. Series N (a)(b)(c) | | 8,141 | 5,698,700 |
| | | | 13,670,134 |
| Construction & Engineering - 0.0% | | | |
| Beta Technologies, Inc. Series A (a)(b)(c) | | 11,104 | 1,145,600 |
| TOTAL INDUSTRIALS | | | 14,815,734 |
| INFORMATION TECHNOLOGY - 0.5% | | | |
| Communications Equipment - 0.1% | | | |
| Meesho Series F (b)(c) | | 63,600 | 4,333,068 |
| Xsight Labs Ltd. Series D (a)(b)(c) | | 130,900 | 979,132 |
| | | | 5,312,200 |
| Electronic Equipment & Components - 0.0% | | | |
| Enevate Corp. Series E (a)(b)(c) | | 1,325,513 | 1,469,575 |
| Menlo Micro, Inc. Series C (b)(c) | | 560,500 | 589,926 |
| | | | 2,059,501 |
| IT Services - 0.1% | | | |
| ByteDance Ltd. Series E1 (a)(b)(c) | | 31,950 | 4,586,103 |
| Yanka Industries, Inc. Series F (a)(b)(c) | | 55,991 | 1,118,140 |
| | | | 5,704,243 |
| Semiconductors & Semiconductor Equipment - 0.1% | | | |
| Alif Semiconductor Series C (b)(c) | | 47,598 | 966,170 |
| Astera Labs, Inc.: | | | |
| Series A (b)(c) | | 84,721 | 861,570 |
| Series B (b)(c) | | 14,425 | 146,695 |
| Series C (b)(c) | | 180,900 | 1,839,663 |
| Series D (b)(c) | | 330,609 | 3,362,128 |
| GaN Systems, Inc.: | | | |
| Series F1 (b)(c) | | 78,477 | 526,581 |
| Series F2 (b)(c) | | 41,439 | 278,056 |
| SiMa.ai: | | | |
| Series B (a)(b)(c) | | 313,000 | 2,219,452 |
| Series B1 (b)(c) | | 20,966 | 148,668 |
| | | | 10,348,983 |
| Software - 0.2% | | | |
| Bolt Technology OU Series E (b)(c) | | 20,165 | 3,184,807 |
| Databricks, Inc.: | | | |
| Series G (a)(b)(c) | | 16,000 | 2,531,520 |
| Series H (b)(c) | | 10,524 | 1,665,107 |
| Mountain Digital, Inc. Series D (b)(c) | | 62,139 | 907,229 |
| Nuvia, Inc. Series B (a)(b) | | 178,648 | 145,995 |
| Skyryse, Inc. Series B (b)(c) | | 67,400 | 1,581,204 |
| Stripe, Inc. Series H (a)(b)(c) | | 8,086 | 233,847 |
| Tenstorrent, Inc. Series C1 (a)(b)(c) | | 8,600 | 484,008 |
| | | | 10,733,717 |
| TOTAL INFORMATION TECHNOLOGY | | | 34,158,644 |
| MATERIALS - 0.1% | | | |
| Metals & Mining - 0.1% | | | |
| Diamond Foundry, Inc. Series C (a)(b)(c) | | 249,802 | 7,778,834 |
| UTILITIES - 0.0% | | | |
| Independent Power and Renewable Electricity Producers - 0.0% | | | |
| Redwood Materials Series C (a)(b)(c) | | 37,990 | 1,240,374 |
|
| TOTAL CONVERTIBLE PREFERRED STOCKS | | | 74,295,113 |
|
| Nonconvertible Preferred Stocks - 0.2% | | | |
| CONSUMER DISCRETIONARY - 0.1% | | | |
| Automobiles - 0.0% | | | |
| Neutron Holdings, Inc.: | | | |
| Series 1C (a)(b)(c) | | 3,178,083 | 87,397 |
| Series 1D (a)(b)(c) | | 5,904,173 | 162,365 |
| Waymo LLC Series A2 (a)(b)(c) | | 7,817 | 485,670 |
| | | | 735,432 |
| Internet & Direct Marketing Retail - 0.1% | | | |
| Circle Internet Financial Ltd. Series E (b) | | 137,547 | 6,677,480 |
| TOTAL CONSUMER DISCRETIONARY | | | 7,412,912 |
| INFORMATION TECHNOLOGY - 0.1% | | | |
| IT Services - 0.0% | | | |
| Gupshup, Inc. (a)(b)(c) | | 78,911 | 1,457,486 |
| Software - 0.1% | | | |
| Pine Labs Private Ltd.: | | | |
| Series 1 (a)(b)(c) | | 2,652 | 1,484,059 |
| Series A (a)(b)(c) | | 663 | 371,015 |
| Series B (a)(b)(c) | | 721 | 403,472 |
| Series B2 (a)(b)(c) | | 583 | 326,247 |
| Series C (a)(b)(c) | | 1,085 | 607,166 |
| Series C1 (a)(b)(c) | | 228 | 127,589 |
| Series D (a)(b)(c) | | 244 | 136,542 |
| | | | 3,456,090 |
| TOTAL INFORMATION TECHNOLOGY | | | 4,913,576 |
|
| TOTAL NONCONVERTIBLE PREFERRED STOCKS | | | 12,326,488 |
|
| TOTAL PREFERRED STOCKS | | | |
| (Cost $87,911,844) | | | 86,621,601 |
| | | Principal Amount | Value |
|
| Convertible Bonds - 0.1% | | | |
| CONSUMER DISCRETIONARY - 0.1% | | | |
| Automobiles - 0.1% | | | |
| Neutron Holdings, Inc.: | | | |
| 4% 10/27/25 (b)(c)(g) | | 2,430,300 | 2,220,079 |
| 4% 5/22/27 (b)(c) | | 237,400 | 262,446 |
| 4% 6/12/27 (b)(c) | | 64,200 | 70,973 |
| | | | 2,553,498 |
| FINANCIALS - 0.0% | | | |
| Diversified Financial Services - 0.0% | | | |
| ZKH Group Ltd. 8% 12/23/22 (b)(c) | | 1,427,037 | 1,427,037 |
| TOTAL CONVERTIBLE BONDS | | | |
| (Cost $4,158,937) | | | 3,980,535 |
|
| Preferred Securities - 0.0% | | | |
| INFORMATION TECHNOLOGY - 0.0% | | | |
| Electronic Equipment & Components - 0.0% | | | |
| Enevate Corp. 0% 1/29/23 (b)(c) | | 564,345 | 564,345 |
| Semiconductors & Semiconductor Equipment - 0.0% | | | |
| GaN Systems, Inc. 0% (b)(c)(h) | | 1,839,388 | 1,839,388 |
| Software - 0.0% | | | |
| Tenstorrent, Inc. 0% (b)(c)(h) | | 480,000 | 480,000 |
| TOTAL INFORMATION TECHNOLOGY | | | |
| (Cost $2,883,733) | | | 2,883,733 |
| | | Shares | Value |
|
| Money Market Funds - 2.6% | | | |
| Fidelity Cash Central Fund 2.01% (i) | | 91,370,850 | 91,389,124 |
| Fidelity Securities Lending Cash Central Fund 2.01% (i)(j) | | 83,999,697 | 84,008,097 |
| TOTAL MONEY MARKET FUNDS | | | |
| (Cost $175,397,221) | | | 175,397,221 |
| TOTAL INVESTMENT IN SECURITIES - 101.1% | | | |
| (Cost $5,613,017,908) | | | 6,894,100,544 |
| NET OTHER ASSETS (LIABILITIES) - (1.1)% | | | (72,816,063) |
| NET ASSETS - 100% | | | $6,821,284,481 |
Legend
(a) Non-income producing
(b) Restricted securities (including private placements) - Investment in securities not registered under the Securities Act of 1933 (excluding 144A issues). At the end of the period, the value of restricted securities (excluding 144A issues) amounted to $133,906,885 or 2.0% of net assets.
(c) Level 3 security
(d) Security exempt from registration under Rule 144A of the Securities Act of 1933. These securities may be resold in transactions exempt from registration, normally to qualified institutional buyers. At the end of the period, the value of these securities amounted to $8,282,481 or 0.1% of net assets.
(e) Security or a portion of the security is on loan at period end.
(f) Investment is owned by a wholly-owned subsidiary (Subsidiary) that is treated as a corporation for U.S. tax purposes.
(g) Security initially issued at one coupon which converts to a higher coupon at a specified date. The rate shown is the rate at period end.
(h) Security is perpetual in nature with no stated maturity date.
(i) Affiliated fund that is generally available only to investment companies and other accounts managed by Fidelity Investments. The rate quoted is the annualized seven-day yield of the fund at period end. A complete unaudited listing of the fund's holdings as of its most recent quarter end is available upon request. In addition, each Fidelity Central Fund's financial statements, which are not covered by the Fund's Report of Independent Registered Public Accounting Firm, are available on the SEC's website or upon request.
(j) Investment made with cash collateral received from securities on loan.
Additional information on each restricted holding is as follows:
| Security | Acquisition Date | Acquisition Cost |
| ABL Space Systems Series B | 3/24/21 | $1,338,638 |
| ABL Space Systems Series B2 | 10/22/21 | $1,166,473 |
| AgBiome LLC Series C | 6/29/18 | $435,125 |
| Algolia SAS Series D | 7/23/21 | $890,102 |
| Alif Semiconductor Series C | 3/8/22 | $966,170 |
| Ant International Co. Ltd. Class C | 5/16/18 | $1,539,709 |
| Astera Labs, Inc. Series A | 5/17/22 | $861,570 |
| Astera Labs, Inc. Series B | 5/17/22 | $146,695 |
| Astera Labs, Inc. Series C | 8/24/21 | $608,150 |
| Astera Labs, Inc. Series D | 5/17/22 - 5/27/22 | $3,362,128 |
| Beta Technologies, Inc. Series A | 4/9/21 | $813,590 |
| Bird Global, Inc. | 5/11/21 | $2,013,670 |
| Blink Health LLC Series A1 | 12/30/20 | $155,957 |
| Blink Health LLC Series C | 11/7/19 - 7/14/21 | $647,847 |
| Bolt Technology OU Series E | 1/3/22 | $5,238,796 |
| Bowery Farming, Inc. Series C1 | 5/18/21 | $1,076,896 |
| ByteDance Ltd. Series E1 | 11/18/20 | $3,500,895 |
| CelLink Corp. Series D | 1/20/22 | $1,931,625 |
| Cibus Corp. Series C | 2/16/18 | $281,001 |
| Cibus Corp. Series D | 5/10/19 | $168,000 |
| Cibus Corp. Series E | 6/23/21 | $409,096 |
| Circle Internet Financial Ltd. Series E | 5/11/21 | $2,232,400 |
| Databricks, Inc. Series G | 2/1/21 | $2,837,886 |
| Databricks, Inc. Series H | 8/31/21 | $2,320,041 |
| Delhivery Private Ltd. | 5/20/21 | $1,327,209 |
| Diamond Foundry, Inc. Series C | 3/15/21 | $5,995,248 |
| Discord, Inc. Series I | 9/15/21 | $385,437 |
| Enevate Corp. Series E | 1/29/21 | $1,469,576 |
| Enevate Corp. 0% 1/29/23 | 1/29/21 | $564,345 |
| Epic Games, Inc. | 7/30/20 | $349,025 |
| Fanatics, Inc. Class A | 8/13/20 - 12/15/21 | $6,838,362 |
| FSN E-Commerce Ventures Private Ltd. | 10/7/20 - 10/26/20 | $1,727,162 |
| GaN Systems, Inc. Series F1 | 11/30/21 | $665,485 |
| GaN Systems, Inc. Series F2 | 11/30/21 | $351,403 |
| GaN Systems, Inc. 0% | 11/30/21 | $1,839,388 |
| GoBrands, Inc. Series G | 3/2/21 | $4,569,827 |
| GoBrands, Inc. Series H | 7/22/21 | $4,454,821 |
| Gupshup, Inc. | 6/8/21 | $1,804,316 |
| Instacart, Inc. Series H | 11/13/20 | $1,632,300 |
| Instacart, Inc. Series I | 2/26/21 | $1,633,000 |
| JUUL Labs, Inc. Class A | 12/20/17 - 7/6/18 | $645,585 |
| JUUL Labs, Inc. Series E | 12/20/17 - 7/6/18 | $342,963 |
| Meesho Series F | 9/21/21 | $4,876,358 |
| Menlo Micro, Inc. Series C | 2/9/22 | $742,943 |
| Mountain Digital, Inc. Series D | 11/5/21 | $1,427,041 |
| MultiPlan Corp. warrants | 10/8/20 | $0 |
| Neutron Holdings, Inc. | 2/4/21 | $4,916 |
| Neutron Holdings, Inc. Series 1C | 7/3/18 | $581,081 |
| Neutron Holdings, Inc. Series 1D | 1/25/19 | $1,431,762 |
| Neutron Holdings, Inc. 4% 10/27/25 | 10/29/21 | $2,430,300 |
| Neutron Holdings, Inc. 4% 5/22/27 | 6/4/20 | $237,400 |
| Neutron Holdings, Inc. 4% 6/12/27 | 6/12/20 | $64,200 |
| Nuvia, Inc. Series B | 3/16/21 | $145,994 |
| Oddity Tech Ltd. | 1/6/22 | $1,199,122 |
| Pine Labs Private Ltd. | 6/30/21 | $413,502 |
| Pine Labs Private Ltd. Series 1 | 6/30/21 | $988,825 |
| Pine Labs Private Ltd. Series A | 6/30/21 | $247,206 |
| Pine Labs Private Ltd. Series B | 6/30/21 | $268,832 |
| Pine Labs Private Ltd. Series B2 | 6/30/21 | $217,377 |
| Pine Labs Private Ltd. Series C | 6/30/21 | $404,553 |
| Pine Labs Private Ltd. Series C1 | 6/30/21 | $85,012 |
| Pine Labs Private Ltd. Series D | 6/30/21 | $90,978 |
| Rad Power Bikes, Inc. | 1/21/21 | $490,493 |
| Rad Power Bikes, Inc. Series A | 1/21/21 | $63,945 |
| Rad Power Bikes, Inc. Series C | 1/21/21 | $251,621 |
| Rad Power Bikes, Inc. Series D | 9/17/21 | $985,215 |
| Reddit, Inc. Series E | 5/18/21 | $205,363 |
| Reddit, Inc. Series F | 8/11/21 | $3,161,154 |
| Redwood Materials Series C | 5/28/21 | $1,800,858 |
| Relativity Space, Inc. Series E | 5/27/21 | $6,302,807 |
| SiMa.ai Series B | 5/10/21 | $1,604,876 |
| SiMa.ai Series B1 | 4/25/22 | $148,668 |
| Skyryse, Inc. Series B | 10/21/21 | $1,663,430 |
| Space Exploration Technologies Corp. Class A | 2/16/21 - 5/24/22 | $6,963,718 |
| Space Exploration Technologies Corp. Series N | 8/4/20 | $2,198,070 |
| Stripe, Inc. Class B | 5/18/21 | $770,465 |
| Stripe, Inc. Series H | 3/15/21 | $324,451 |
| Tenstorrent, Inc. Series C1 | 4/23/21 | $511,307 |
| Tenstorrent, Inc. 0% | 4/23/21 | $480,000 |
| Veterinary Emergency Group LLC Class A | 9/16/21 - 3/17/22 | $2,587,644 |
| Waymo LLC Series A2 | 5/8/20 | $671,224 |
| Xsight Labs Ltd. Series D | 2/16/21 | $1,046,676 |
| Yanka Industries, Inc. Series F | 4/8/21 | $1,784,814 |
| ZKH Group Ltd. 8% 12/23/22 | 2/24/22 | $1,427,037 |
Affiliated Central Funds
Fiscal year to date information regarding the Fund's investments in Fidelity Central Funds, including the ownership percentage, is presented below.
| Fund | Value, beginning of period | Purchases | Sales Proceeds | Dividend Income | Realized Gain/Loss | Change in Unrealized appreciation (depreciation) | Value, end of period | % ownership, end of period |
| Fidelity Cash Central Fund 2.01% | $145,904,096 | $1,386,584,548 | $1,441,099,520 | $347,882 | $-- | $-- | $91,389,124 | 0.2% |
| Fidelity Securities Lending Cash Central Fund 2.01% | 76,396,587 | 1,249,766,406 | 1,242,154,896 | 1,516,739 | -- | -- | 84,008,097 | 0.2% |
| Total | $222,300,683 | $2,636,350,954 | $2,683,254,416 | $1,864,621 | $-- | $-- | $175,397,221 | |
Amounts in the income column in the above table include any capital gain distributions from underlying funds, which are presented in the corresponding line-item in the Statement of Operations, if applicable. Amount for Fidelity Securities Lending Cash Central Fund represents the income earned on investing cash collateral, less rebates paid to borrowers and any lending agent fees associated with the loan, plus any premium payments received for lending certain types of securities.
Investment Valuation
The following is a summary of the inputs used, as of July 31, 2022, involving the Fund's assets and liabilities carried at fair value. The inputs or methodology used for valuing securities may not be an indication of the risk associated with investing in those securities. For more information on valuation inputs, and their aggregation into the levels used below, please refer to the Investment Valuation section in the accompanying Notes to Financial Statements.
| | Valuation Inputs at Reporting Date: |
| Description | Total | Level 1 | Level 2 | Level 3 |
| Investments in Securities: | | | | |
| Equities: | | | | |
| Communication Services | $660,274,875 | $654,125,150 | $3,947,039 | $2,202,686 |
| Consumer Discretionary | 2,017,812,819 | 1,960,059,721 | 32,267,354 | 25,485,744 |
| Consumer Staples | 97,971,009 | 95,806,935 | -- | 2,164,074 |
| Energy | 328,311,136 | 301,940,066 | 26,371,070 | -- |
| Financials | 71,894,868 | 67,501,703 | 3,629,648 | 763,517 |
| Health Care | 550,076,458 | 541,819,454 | 2,780,973 | 5,476,031 |
| Industrials | 149,006,710 | 119,532,925 | 7,077,539 | 22,396,246 |
| Information Technology | 2,709,795,297 | 2,669,128,702 | -- | 40,666,595 |
| Materials | 110,439,209 | 102,660,375 | -- | 7,778,834 |
| Real Estate | 10,384,231 | 10,384,231 | -- | -- |
| Utilities | 5,872,443 | 2,798,041 | 1,834,028 | 1,240,374 |
| Corporate Bonds | 3,980,535 | -- | -- | 3,980,535 |
| Preferred Securities | 2,883,733 | -- | -- | 2,883,733 |
| Money Market Funds | 175,397,221 | 175,397,221 | -- | -- |
| Total Investments in Securities: | $6,894,100,544 | $6,701,154,524 | $77,907,651 | $115,038,369 |
| Net Unrealized Depreciation on Unfunded Commitments | $(291,212) | $-- | $-- | $(291,212) |
The following is a reconciliation of Investments in Securities for which Level 3 inputs were used in determining value:
| Investments in Securities: | |
| Beginning Balance | $99,867,208 |
| Net Realized Gain (Loss) on Investment Securities | -- |
| Net Unrealized Gain (Loss) on Investment Securities | (7,286,824) |
| Cost of Purchases | 51,694,924 |
| Proceeds of Sales | -- |
| Amortization/Accretion | -- |
| Transfers into Level 3 | 74,895 |
| Transfers out of Level 3 | (29,311,834) |
| Ending Balance | $115,038,369 |
| The change in unrealized gain (loss) for the period attributable to Level 3 securities held at July 31, 2022 | $(7,136,200) |
The information used in the above reconciliation represents fiscal year to date activity for any Investments in Securities identified as using Level 3 inputs at either the beginning or the end of the current fiscal period. Transfers into Level 3 were attributable to a lack of observable market data resulting from decreases in market activity, decreases in liquidity, security restructurings or corporate actions. Transfers out of Level 3 were attributable to observable market data becoming available for those securities. Cost of purchases and proceeds of sales may include securities received and/or delivered through in-kind transactions. Transfers in or out of Level 3 represent the beginning value of any Security or Instrument where a change in the pricing level occurred from the beginning to the end of the period. The cost of purchases and the proceeds of sales may include securities received or delivered through corporate actions or exchanges. Realized and unrealized gains (losses) disclosed in the reconciliation are included in Net Gain (Loss) on the Fund's Statement of Operations.
See accompanying notes which are an integral part of the financial statements.
Financial Statements
Statement of Assets and Liabilities
| | | July 31, 2022 |
| Assets | | |
Investment in securities, at value (including securities loaned of $83,523,650) — See accompanying schedule:
Unaffiliated issuers (cost $5,437,620,687) | $6,718,703,323 | |
| Fidelity Central Funds (cost $175,397,221) | 175,397,221 | |
| Total Investment in Securities (cost $5,613,017,908) | | $6,894,100,544 |
| Foreign currency held at value (cost $1,554,830) | | 1,557,740 |
| Receivable for investments sold | | 8,774,892 |
| Receivable for fund shares sold | | 9,669,277 |
| Dividends receivable | | 1,398,768 |
| Interest receivable | | 101,335 |
| Distributions receivable from Fidelity Central Funds | | 251,980 |
| Total assets | | 6,915,854,536 |
| Liabilities | | |
| Payable for investments purchased | $1,099,213 | |
| Unrealized depreciation on unfunded commitments | 291,212 | |
| Payable for fund shares redeemed | 4,701,392 | |
| Accrued management fee | 2,354,111 | |
| Other payables and accrued expenses | 2,113,302 | |
| Collateral on securities loaned | 84,010,825 | |
| Total liabilities | | 94,570,055 |
| Net Assets | | $6,821,284,481 |
| Net Assets consist of: | | |
| Paid in capital | | $5,784,327,376 |
| Total accumulated earnings (loss) | | 1,036,957,105 |
| Net Assets | | $6,821,284,481 |
| Net Asset Value, offering price and redemption price per share ($6,821,284,481 ÷ 337,791,111 shares) | | $20.19 |
See accompanying notes which are an integral part of the financial statements.
Statement of Operations
| | | Year ended July 31, 2022 |
| Investment Income | | |
| Dividends | | $28,124,825 |
| Interest | | 90,966 |
| Income from Fidelity Central Funds (including $1,516,739 from security lending) | | 1,864,621 |
| Total income | | 30,080,412 |
| Expenses | | |
| Management fee | $29,343,358 | |
| Independent trustees' fees and expenses | 21,382 | |
| Interest | 846 | |
| Total expenses before reductions | 29,365,586 | |
| Expense reductions | (211) | |
| Total expenses after reductions | | 29,365,375 |
| Net investment income (loss) | | 715,037 |
| Realized and Unrealized Gain (Loss) | | |
| Net realized gain (loss) on: | | |
| Investment securities: | | |
| Unaffiliated issuers (net of foreign taxes of $422,476) | (122,803,919) | |
| Foreign currency transactions | 18,761 | |
| Total net realized gain (loss) | | (122,785,158) |
| Change in net unrealized appreciation (depreciation) on: | | |
| Investment securities: | | |
| Unaffiliated issuers (net of increase in deferred foreign taxes of $461,946) | (1,444,753,691) | |
| Unfunded commitments | 1,594,331 | |
| Assets and liabilities in foreign currencies | (2,894) | |
| Total change in net unrealized appreciation (depreciation) | | (1,443,162,254) |
| Net gain (loss) | | (1,565,947,412) |
| Net increase (decrease) in net assets resulting from operations | | $(1,565,232,375) |
See accompanying notes which are an integral part of the financial statements.
Statement of Changes in Net Assets
| | Year ended July 31, 2022 | Year ended July 31, 2021 |
| Increase (Decrease) in Net Assets | | |
| Operations | | |
| Net investment income (loss) | $715,037 | $(5,562,556) |
| Net realized gain (loss) | (122,785,158) | 624,106,868 |
| Change in net unrealized appreciation (depreciation) | (1,443,162,254) | 1,305,751,766 |
| Net increase (decrease) in net assets resulting from operations | (1,565,232,375) | 1,924,296,078 |
| Distributions to shareholders | (450,387,568) | (67,572,204) |
| Share transactions | | |
| Proceeds from sales of shares | 3,628,936,951 | 2,518,663,293 |
| Reinvestment of distributions | 450,387,568 | 67,572,204 |
| Cost of shares redeemed | (1,698,109,014) | (1,841,618,316) |
| Net increase (decrease) in net assets resulting from share transactions | 2,381,215,505 | 744,617,181 |
| Total increase (decrease) in net assets | 365,595,562 | 2,601,341,055 |
| Net Assets | | |
| Beginning of period | 6,455,688,919 | 3,854,347,864 |
| End of period | $6,821,284,481 | $6,455,688,919 |
| Other Information | | |
| Shares | | |
| Sold | 162,418,203 | 104,587,712 |
| Issued in reinvestment of distributions | 16,489,637 | 2,932,429 |
| Redeemed | (72,616,870) | (75,489,262) |
| Net increase (decrease) | 106,290,970 | 32,030,879 |
See accompanying notes which are an integral part of the financial statements.
Financial Highlights
Fidelity Blue Chip Growth K6 Fund
| | | | | | |
| Years ended July 31, | 2022 | 2021 | 2020 | 2019 | 2018 |
| Selected Per–Share Data | | | | | |
| Net asset value, beginning of period | $27.89 | $19.32 | $13.69 | $12.79 | $10.32 |
| Income from Investment Operations | | | | | |
| Net investment income (loss)A,B | –C | (.03) | .03 | .04 | .05D |
| Net realized and unrealized gain (loss) | (5.83) | 8.91 | 5.64 | .91 | 2.44 |
| Total from investment operations | (5.83) | 8.88 | 5.67 | .95 | 2.49 |
| Distributions from net investment income | – | (.02) | (.04) | (.05) | (.01) |
| Distributions from net realized gain | (1.87) | (.29) | –C | – | –C |
| Total distributions | (1.87) | (.31) | (.04) | (.05) | (.02)E |
| Net asset value, end of period | $20.19 | $27.89 | $19.32 | $13.69 | $12.79 |
| Total ReturnF,G | (22.62)% | 46.28% | 41.55% | 7.48% | 24.10% |
| Ratios to Average Net AssetsB,H,I | | | | | |
| Expenses before reductions | .45% | .45% | .45% | .45% | .45% |
| Expenses net of fee waivers, if any | .45% | .45% | .45% | .45% | .45% |
| Expenses net of all reductions | .45% | .45% | .45% | .45% | .45% |
| Net investment income (loss) | .01% | (.10)% | .19% | .34% | .45%D |
| Supplemental Data | | | | | |
| Net assets, end of period (000 omitted) | $6,821,284 | $6,455,689 | $3,854,348 | $2,290,237 | $1,680,044 |
| Portfolio turnover rateJ | 37%K | 44%K | 49%K | 51%K | 40%K |
A Calculated based on average shares outstanding during the period.
B Net investment income (loss) is affected by the timing of the declaration of dividends by any underlying mutual funds or exchange-traded funds (ETFs). Net investment income (loss) of any such underlying funds is not included in the Fund's net investment income (loss) ratio.
C Amount represents less than $.005 per share.
D Net investment income per share reflects one or more large, non-recurring dividend(s) which amounted to $.02 per share. Excluding such non-recurring dividend(s), the ratio of net investment income (loss) to average net assets would have been .29%.
E Total distributions per share do not sum due to rounding.
F Total returns for periods of less than one year are not annualized.
G Total returns would have been lower if certain expenses had not been reduced during the applicable periods shown.
H Fees and expenses of any underlying mutual funds or exchange-traded funds (ETFs) are not included in the Fund's expense ratio. The Fund indirectly bears its proportionate share of these expenses. For additional expense information related to investments in Fidelity Central Funds, please refer to the "Investments in Fidelity Central Funds" note found in the Notes to Financial Statements section of the most recent Annual or Semi-Annual report.
I Expense ratios reflect operating expenses of the class. Expenses before reductions do not reflect amounts reimbursed, waived, or reduced through arrangements with the investment adviser, brokerage services, or other offset arrangements, if applicable, and do not represent the amount paid by the class during periods when reimbursements, waivers or reductions occur.
J Amount does not include the portfolio activity of any underlying mutual funds or exchange-traded funds (ETFs).
K Portfolio turnover rate excludes securities received or delivered in-kind.
See accompanying notes which are an integral part of the financial statements.
Notes to Financial Statements
For the period ended July 31, 2022
1. Organization.
Fidelity Blue Chip Growth K6 Fund (the Fund) is a fund of Fidelity Securities Fund (the Trust) and is authorized to issue an unlimited number of shares. Share transactions on the Statement of Changes in Net Assets may contain exchanges between affiliated funds. The Trust is registered under the Investment Company Act of 1940, as amended (the 1940 Act), as an open-end management investment company organized as a Massachusetts business trust. Shares generally are available only to employer-sponsored retirement plans that are recordkept by Fidelity, or to certain employer-sponsored retirement plans that are not recordkept by Fidelity.
2. Investments in Fidelity Central Funds.
Funds may invest in Fidelity Central Funds, which are open-end investment companies generally available only to other investment companies and accounts managed by the investment adviser and its affiliates. The Schedule of Investments lists any Fidelity Central Funds held as an investment as of period end, but does not include the underlying holdings of each Fidelity Central Fund. An investing fund indirectly bears its proportionate share of the expenses of the underlying Fidelity Central Funds.
Based on its investment objective, each Fidelity Central Fund may invest or participate in various investment vehicles or strategies that are similar to those of the investing fund. These strategies are consistent with the investment objectives of the investing fund and may involve certain economic risks which may cause a decline in value of each of the Fidelity Central Funds and thus a decline in the value of the investing fund.
| Fidelity Central Fund | Investment Manager | Investment Objective | Investment Practices | Expense Ratio(a) |
| Fidelity Money Market Central Funds | Fidelity Management & Research Company LLC (FMR) | Each fund seeks to obtain a high level of current income consistent with the preservation of capital and liquidity. | Short-term Investments | Less than .005% |
(a) Expenses expressed as a percentage of average net assets and are as of each underlying Central Fund's most recent annual or semi-annual shareholder report.
A complete unaudited list of holdings for each Fidelity Central Fund is available upon request or at the Securities and Exchange Commission website at www.sec.gov. In addition, the financial statements of the Fidelity Central Funds which contain the significant accounting policies (including investment valuation policies) of those funds, and are not covered by the Report of Independent Registered Public Accounting Firm, are available on the Securities and Exchange Commission website or upon request.
3. Significant Accounting Policies.
The Fund is an investment company and applies the accounting and reporting guidance of the Financial Accounting Standards Board (FASB) Accounting Standards Codification Topic 946 Financial Services - Investment Companies. The financial statements have been prepared in conformity with accounting principles generally accepted in the United States of America (GAAP), which require management to make certain estimates and assumptions at the date of the financial statements. Actual results could differ from those estimates. Subsequent events, if any, through the date that the financial statements were issued have been evaluated in the preparation of the financial statements. The Fund's Schedule of Investments lists any underlying mutual funds or exchange-traded funds (ETFs) but does not include the underlying holdings of these funds. The following summarizes the significant accounting policies of the Fund:
Investment Valuation. Investments are valued as of 4:00 p.m. Eastern time on the last calendar day of the period. The Board of Trustees (the Board) has delegated the day to day responsibility for the valuation of the Fund's investments to the Fair Value Committee (the Committee) established by the Fund's investment adviser. In accordance with valuation policies and procedures approved by the Board, the Fund attempts to obtain prices from one or more third party pricing vendors or brokers to value its investments. When current market prices, quotations or currency exchange rates are not readily available or reliable, investments will be fair valued in good faith by the Committee, in accordance with procedures adopted by the Board. Factors used in determining fair value vary by investment type and may include market or investment specific events, changes in interest rates and credit quality. The frequency with which these procedures are used cannot be predicted and they may be utilized to a significant extent. The Committee oversees the Fund's valuation policies and procedures and reports to the Board on the Committee's activities and fair value determinations. The Board monitors the appropriateness of the procedures used in valuing the Fund's investments and ratifies the fair value determinations of the Committee.
The Fund categorizes the inputs to valuation techniques used to value its investments into a disclosure hierarchy consisting of three levels as shown below:
- Level 1 – unadjusted quoted prices in active markets for identical investments
- Level 2 – other significant observable inputs (including quoted prices for similar investments, interest rates, prepayment speeds, etc.)
- Level 3 – unobservable inputs (including the Fund's own assumptions based on the best information available)
Valuation techniques used to value the Fund's investments by major category are as follows:
Equity securities, including restricted securities, for which market quotations are readily available, are valued at the last reported sale price or official closing price as reported by a third party pricing vendor on the primary market or exchange on which they are traded and are categorized as Level 1 in the hierarchy. In the event there were no sales during the day or closing prices are not available, securities are valued at the last quoted bid price or may be valued using the last available price and are generally categorized as Level 2 in the hierarchy. For foreign equity securities, when market or security specific events arise, comparisons to the valuation of American Depositary Receipts (ADRs), futures contracts, ETFs and certain indexes as well as quoted prices for similar securities may be used and would be categorized as Level 2 in the hierarchy. For equity securities, including restricted securities, where observable inputs are limited, assumptions about market activity and risk are used and these securities may be categorized as Level 3 in the hierarchy. Securities, including private placements or other restricted securities, for which observable inputs are not available are valued using alternate valuation approaches, including the market approach, the income approach and cost approach, and are categorized as Level 3 in the hierarchy. The market approach considers factors including the price of recent investments in the same or a similar security or financial metrics of comparable securities. The income approach considers factors including expected future cash flows, security specific risks and corresponding discount rates. The cost approach considers factors including the value of the security's underlying assets and liabilities.
Debt securities, including restricted securities, are valued based on evaluated prices received from third party pricing vendors or from brokers who make markets in such securities. Corporate bonds and preferred securities are valued by pricing vendors who utilize matrix pricing which considers yield or price of bonds of comparable quality, coupon, maturity and type or by broker-supplied prices. When independent prices are unavailable or unreliable, debt securities may be valued utilizing pricing methodologies which consider similar factors that would be used by third party pricing vendors. Debt securities are generally categorized as Level 2 in the hierarchy but may be Level 3 depending on the circumstances.
Investments in open-end mutual funds, including the Fidelity Central Funds, are valued at their closing net asset value (NAV) each business day and are categorized as Level 1 in the hierarchy.
The following provides information on Level 3 securities held by the Fund that were valued at period end based on unobservable inputs. These amounts exclude valuations provided by a broker.
| Asset Type | Fair Value | Valuation Technique(s) | Unobservable Input | Amount or Range/Weighted Average | Impact to Valuation from an Increase in Input(a) |
| Equities | $ 108,174,101 | Market approach | Discount rate | 5.3% - 20.9% / 13.2% | Decrease |
| | | | Transaction price | $1.11 - $700.00 / $203.02 | Increase |
| | | Recovery value | Recovery value | $0.00 - $0.43 / $0.00 | Increase |
| | | | Discount for lack of marketability | 5.0% | Decrease |
| | | Book value | Book value multiple | 1.7 | Increase |
| | | Market comparable | Discount rate | 30.0% | Decrease |
| | | | Enterprise value/Revenue multiple (EV/R) | 1.5 - 26.0 / 7.0 | Increase |
| | | | Enterprise value/Gross profit multiple (EV/GP) | 8.8 | Increase |
| | | | Enterprise value/EBITDA multiple (EV/EBITDA) | 20.0 | Increase |
| | | | Probability rate | 25.0% - 75.0% / 50.0% | Increase |
| | | Discounted cash flow | Weighted average cost of capital (WACC) | 25.0% - 42.0% / 31.2% | Decrease |
| | | | Exit multiple | 2.3 - 5.5 / 3.5 | Increase |
| | | Black scholes | Term | 5.0 | Increase |
| | | | Volatility | 75.0% - 80.0% / 79.6% | Increase |
| Corporate Bonds | $ 3,980,535 | Market approach | Transaction price | $100.00 | Increase |
| | | Market comparable | Discount rate | 29.2% | Decrease |
| | | | Enterprise value/Revenue multiple (EV/R) | 2.8 | Increase |
| | | | Probability rate | 10.0% - 60.0% / 33.3% | Increase |
| | | Black scholes | Term | 1.0 - 1.4 / 1.2 | Increase |
| | | | Volatility | 75.0% | Increase |
| Preferred Securities | $ 2,883,733 | Market approach | Transaction price | $100.00 | Increase |
(a) Represents the directional change in the fair value of the Level 3 investments that could have resulted from an increase in the corresponding input as of period end. A decrease to the unobservable input would have had the opposite effect. Significant changes in these inputs may have resulted in a significantly higher or lower fair value measurement at period end.
Changes in valuation techniques may result in transfers in or out of an assigned level within the disclosure hierarchy. The aggregate value of investments by input level as of July 31, 2022, as well as a roll forward of Level 3 investments, is included at the end of the Fund's Schedule of Investments.
Foreign Currency. Certain Funds may use foreign currency contracts to facilitate transactions in foreign-denominated securities. Gains and losses from these transactions may arise from changes in the value of the foreign currency or if the counterparties do not perform under the contracts' terms.
Foreign-denominated assets, including investment securities, and liabilities are translated into U.S. dollars at the exchange rates at period end. Purchases and sales of investment securities, income and dividends received, and expenses denominated in foreign currencies are translated into U.S. dollars at the exchange rate in effect on the transaction date.
The effects of exchange rate fluctuations on investments are included with the net realized and unrealized gain (loss) on investment securities. Other foreign currency transactions resulting in realized and unrealized gain (loss) are disclosed separately.
Investment Transactions and Income. For financial reporting purposes, the Fund's investment holdings and NAV include trades executed through the end of the last business day of the period. The NAV per share for processing shareholder transactions is calculated as of the close of business of the New York Stock Exchange (NYSE), normally 4:00 p.m. Eastern time and includes trades executed through the end of the prior business day. Gains and losses on securities sold are determined on the basis of identified cost and include proceeds received from litigation. Commissions paid to certain brokers with whom the investment adviser, or its affiliates, places trades on behalf of a fund include an amount in addition to trade execution, which may be rebated back to a fund. Any such rebates are included in net realized gain (loss) on investments in the Statement of Operations. Dividend income is recorded on the ex-dividend date, except for certain dividends from foreign securities where the ex-dividend date may have passed, which are recorded as soon as the Fund is informed of the ex-dividend date. Non-cash dividends included in dividend income, if any, are recorded at the fair market value of the securities received. Income and capital gain distributions from Fidelity Central Funds, if any, are recorded on the ex-dividend date. Certain distributions received by the Fund represent a return of capital or capital gain. The Fund determines the components of these distributions subsequent to the ex-dividend date, based upon receipt of tax filings or other correspondence relating to the underlying investment. These distributions are recorded as a reduction of cost of investments and/or as a realized gain. Interest income is accrued as earned and includes coupon interest and amortization of premium and accretion of discount on debt securities as applicable. Investment income is recorded net of foreign taxes withheld where recovery of such taxes is uncertain. Funds may file withholding tax reclaims in certain jurisdictions to recover a portion of amounts previously withheld. Any withholding tax reclaims income is included in the Statement of Operations in dividends. Any receivables for withholding tax reclaims are included in the Statement of Assets and Liabilities in dividends receivable.
Expenses. Expenses directly attributable to a fund are charged to that fund. Expenses attributable to more than one fund are allocated among the respective funds on the basis of relative net assets or other appropriate methods. Expenses included in the accompanying financial statements reflect the expenses of that fund and do not include any expenses associated with any underlying mutual funds or exchange-traded funds. Although not included in a fund's expenses, a fund indirectly bears its proportionate share of these expenses through the net asset value of each underlying mutual fund or exchange-traded fund. Expense estimates are accrued in the period to which they relate and adjustments are made when actual amounts are known.
Income Tax Information and Distributions to Shareholders. Each year, the Fund intends to qualify as a regulated investment company under Subchapter M of the Internal Revenue Code, including distributing substantially all of its taxable income and realized gains. As a result, no provision for U.S. Federal income taxes is required. As of July 31, 2022, the Fund did not have any unrecognized tax benefits in the financial statements; nor is the Fund aware of any tax positions for which it is reasonably possible that the total amounts of unrecognized tax benefits will significantly change in the next twelve months. The Fund files a U.S. federal tax return, in addition to state and local tax returns as required. The Fund's federal income tax returns are subject to examination by the Internal Revenue Service (IRS) for a period of three fiscal years after they are filed. State and local tax returns may be subject to examination for an additional fiscal year depending on the jurisdiction. Foreign taxes are provided for based on the Fund's understanding of the tax rules and rates that exist in the foreign markets in which it invests. The Fund is subject to a tax imposed on capital gains by certain countries in which it invests. An estimated deferred tax liability for net unrealized appreciation on the applicable securities is included in Other payables and accrued expenses on the Statement of Assets & Liabilities.
Distributions are declared and recorded on the ex-dividend date. Income and capital gain distributions are determined in accordance with income tax regulations, which may differ from GAAP.
Capital accounts within the financial statements are adjusted for permanent book-tax differences. These adjustments have no impact on net assets or the results of operations. Capital accounts are not adjusted for temporary book-tax differences which will reverse in a subsequent period.
Book-tax differences are primarily due to foreign currency transactions, certain foreign taxes, passive foreign investment companies (PFIC), redemptions in-kind, partnerships and losses deferred due to wash sales and excise tax regulations.
As of period end, the cost and unrealized appreciation (depreciation) in securities, and derivatives if applicable, for federal income tax purposes were as follows:
| Gross unrealized appreciation | $1,880,450,174 |
| Gross unrealized depreciation | (639,489,784) |
| Net unrealized appreciation (depreciation) | $1,240,960,390 |
| Tax Cost | $5,652,848,942 |
The tax-based components of distributable earnings as of period end were as follows:
| Net unrealized appreciation (depreciation) on securities and other investments | $1,240,960,511 |
The Fund intends to elect to defer to its next fiscal year $201,890,077 of capital losses recognized during the period November 1, 2021 to July 31, 2022.
The tax character of distributions paid was as follows:
| | July 31, 2022 | July 31, 2021 |
| Ordinary Income | $96,227,267 | $12,379,228 |
| Long-term Capital Gains | 354,160,301 | 55,192,976 |
| Total | $450,387,568 | $67,572,204 |
Restricted Securities (including Private Placements). Funds may invest in securities that are subject to legal or contractual restrictions on resale. These securities generally may be resold in transactions exempt from registration or to the public if the securities are registered. Disposal of these securities may involve time-consuming negotiations and expense, and prompt sale at an acceptable price may be difficult. Information regarding restricted securities held at period end is included at the end of the Schedule of Investments, if applicable.
Commitments. A commitment is an agreement to acquire an investment at a future date (subject to conditions) in connection with a potential public or non-public offering. Commitments outstanding at period end are presented in the table below. Unrealized appreciation (depreciation) on any commitments outstanding at period end is separately presented in the Statements of Assets and Liabilities as Unrealized appreciation (depreciation) on unfunded commitments, and any change in unrealized appreciation (depreciation) on unfunded commitments during the period is separately presented in the Statement of Operations, as applicable based on contractual conditions of each commitment.
| | Investment to be Acquired | Commitment Amount | Unrealized Appreciation (Depreciation) |
| Fidelity Blue Chip Growth K6 Fund | Twitter, Inc. | $2,471,086 | -- |
| | Stripe, Inc. | $291,212 | $(291,212) |
Special Purpose Acquisition Companies. Funds may invest in stock, warrants, and other securities of special purpose acquisition companies (SPACs) or similar special purpose entities. A SPAC is a publicly traded company that raises investment capital via an initial public offering (IPO) for the purpose of acquiring the equity securities of one or more existing companies via merger, business combination, acquisition or other similar transactions within a designated time frame.
Private Investment in Public Equity. Funds may acquire equity securities of an issuer through a private investment in a public equity (PIPE) transaction, including through commitments to purchase securities on a when-issued basis. A PIPE typically involves the purchase of securities directly from a publicly traded company in a private placement transaction. Securities purchased through PIPE transactions will be restricted from trading and considered illiquid until a resale registration statement for the shares is filed and declared effective.
At the current and/or prior period end, the Fund had commitments to purchase when-issued securities through PIPE transactions with SPACs. The commitments are contingent upon the SPACs acquiring the securities of target companies. Unrealized appreciation (depreciation) on any commitments outstanding at period end is separately presented in the Statements of Assets and Liabilities as Unrealized appreciation (depreciation) on unfunded commitments, and any change in unrealized appreciation (depreciation) on unfunded commitments during the period is separately presented in the Statement of Operations, as applicable.
Consolidated Subsidiary. The Funds included in the table below hold certain investments through a wholly-owned subsidiary ("Subsidiary"), which may be subject to federal and state taxes upon disposition.
As of period end, investments in Subsidiaries were as follows:
| | $ Amount | % of Net Assets |
| Fidelity Blue Chip Growth K6 Fund | 4,503,633 | .07 |
The financial statements have been consolidated to include the Subsidiary accounts where applicable. Accordingly, all inter-company transactions and balances have been eliminated.
At period end, any estimated tax liability for these investments is presented as "Deferred taxes" in the Statement of Assets and Liabilities and included in "Change in net unrealized appreciation (depreciation) on investment securities" in the Statement of Operations. The tax liability incurred may differ materially depending on conditions when these investments are disposed. Any cash held by a Subsidiary is restricted as to its use and is presented as "Restricted cash" in the Statement of Assets and Liabilities, if applicable.
4. Purchases and Sales of Investments.
Purchases and sales of securities, other than short-term securities and in-kind transactions, as applicable, are noted in the table below.
| | Purchases ($) | Sales ($) |
| Fidelity Blue Chip Growth K6 Fund | 3,070,538,777 | 2,342,447,505 |
Unaffiliated Redemptions In-Kind. Shares that were redeemed in-kind for investments, including accrued interest and cash, if any, are shown in the table below. The net realized gain or loss on investments delivered through in-kind redemptions is included in the accompanying Statement of Operations. The amount of the in-kind redemptions is included in share transactions in the accompanying Statement of Changes in Net Assets. There was no gain or loss for federal income tax purposes.
| | Shares | Total net realized gain or loss
($) | Total Proceeds
($) |
| Fidelity Blue Chip Growth K6 Fund | 3,743,610 | 60,349,449 | 101,901,059 |
Unaffiliated Exchanges In-Kind. Shares that were exchanged for investments, including accrued interest and cash, if any, are shown in the table below. The amount of in-kind exchanges is included in share transactions in the accompanying Statement of Changes in Net Assets.
| | Shares | Total Proceeds
($) |
| Fidelity Blue Chip Growth K6 Fund | 63,577,402 | 1,334,865,017 |
Prior Fiscal Year Unaffiliated Redemptions In-Kind. Shares that were redeemed in-kind for investments, including accrued interest and cash, if any, are shown in the table below; along with realized gain or loss on investments delivered through in-kind redemptions. The amount of the in-kind redemptions is included in share transactions in the accompanying Statement of Changes in Net Assets. There was no gain or loss for federal income tax purposes.
| | Shares | Total net realized gain or loss
($) | Total Proceeds
($) |
| Fidelity Blue Chip Growth K6 Fund | 8,383,867 | 140,556,215 | 228,833,036 |
Prior Year Unaffiliated Exchanges In-Kind. Shares that were exchanged for investments, including accrued interest and cash, if any, are shown in the table below. The amount of in-kind exchanges is included in share transactions in the accompanying Statement of Changes in Net Assets.
| | Shares | Total Proceeds
($) |
| Fidelity Blue Chip Growth K6 Fund | 9,520,954 | 232,997,303 |
5. Fees and Other Transactions with Affiliates.
Management Fee. Fidelity Management & Research Company LLC (the investment adviser) and its affiliates provide the Fund with investment management related services for which the Fund pays a monthly management fee that is based on an annual rate of .45% of average net assets. Under the management contract, the investment adviser or an affiliate pays all other expenses of the Fund, excluding fees and expenses of the independent Trustees, and certain miscellaneous expenses such as proxy and shareholder meeting expenses.
Brokerage Commissions. A portion of portfolio transactions were placed with brokerage firms which are affiliates of the investment adviser. Brokerage commissions are included in net realized gain (loss) and change in net unrealized appreciation (depreciation) in the Statement of Operations. The commissions paid to these affiliated firms were as follows:
| | Amount |
| Fidelity Blue Chip Growth K6 Fund | $56,392 |
Interfund Lending Program. Pursuant to an Exemptive Order issued by the Securities and Exchange Commission (the SEC), the Fund, along with other registered investment companies having management contracts with Fidelity Management & Research Company LLC (FMR), or other affiliated entities of FMR, may participate in an interfund lending program. This program provides an alternative credit facility allowing the Fund to borrow from, or lend money to, other participating affiliated funds. At period end, there were no interfund loans outstanding. Activity in this program during the period for which loans were outstanding was as follows:
| | Borrower or Lender | Average Loan Balance | Weighted Average Interest Rate | Interest Expense |
| Fidelity Blue Chip Growth K6 Fund | Borrower | $12,088,000 | .32% | $846 |
Interfund Trades. Funds may purchase from or sell securities to other Fidelity Funds under procedures adopted by the Board. The procedures have been designed to ensure these interfund trades are executed in accordance with Rule 17a-7 of the 1940 Act. Any interfund trades are included within the respective purchases and sales amounts shown in the Purchases and Sales of Investments note. Interfund trades during the period are noted in the table below.
| | Purchases ($) | Sales ($) | Realized Gain (Loss) ($) |
| Fidelity Blue Chip Growth K6 Fund | 215,875,826 | 111,696,209 | (11,187,297) |
Other. During the period, the investment adviser reimbursed the Fund for certain losses as follows:
| | Amount ($) |
| Fidelity Blue Chip Growth K6 Fund | 12,884 |
6. Committed Line of Credit.
Certain Funds participate with other funds managed by the investment adviser or an affiliate in a $4.25 billion credit facility (the "line of credit") to be utilized for temporary or emergency purposes to fund shareholder redemptions or for other short-term liquidity purposes. The commitment fees on the pro-rata portion of the line of credit are borne by the investment adviser. During the period, there were no borrowings on this line of credit.
7. Security Lending.
Funds lend portfolio securities from time to time in order to earn additional income. Lending agents are used, including National Financial Services (NFS), an affiliate of the investment adviser. Pursuant to a securities lending agreement, NFS will receive a fee, which is capped at 9.9% of a fund's daily lending revenue, for its services as lending agent. A fund may lend securities to certain qualified borrowers, including NFS. On the settlement date of the loan, a fund receives collateral (in the form of U.S. Treasury obligations, letters of credit and/or cash) against the loaned securities and maintains collateral in an amount not less than 100% of the market value of the loaned securities during the period of the loan. The market value of the loaned securities is determined at the close of business of a fund and any additional required collateral is delivered to a fund on the next business day. A fund or borrower may terminate the loan at any time, and if the borrower defaults on its obligation to return the securities loaned because of insolvency or other reasons, a fund may apply collateral received from the borrower against the obligation. A fund may experience delays and costs in recovering the securities loaned. Any cash collateral received is invested in the Fidelity Securities Lending Cash Central Fund. Any loaned securities are identified as such in the Schedule of Investments, and the value of loaned securities and cash collateral at period end, as applicable, are presented in the Statement of Assets and Liabilities. Security lending income represents the income earned on investing cash collateral, less rebates paid to borrowers and any lending agent fees associated with the loan, plus any premium payments received for lending certain types of securities. Security lending income is presented in the Statement of Operations as a component of income from Fidelity Central Funds. Affiliated security lending activity, if any, was as follows:
| | Total Security Lending Fees Paid to NFS | Security Lending Income From Securities Loaned to NFS | Value of Securities Loaned to NFS at Period End |
| Fidelity Blue Chip Growth K6 Fund | $162,333 | $79,839 | $72,953 |
8. Expense Reductions.
Through arrangements with the Fund's custodian, credits realized as a result of certain uninvested cash balances were used to reduce the Fund's expenses by $211.
9. Other.
A fund's organizational documents provide former and current trustees and officers with a limited indemnification against liabilities arising in connection with the performance of their duties to the fund. In the normal course of business, a fund may also enter into contracts that provide general indemnifications. A fund's maximum exposure under these arrangements is unknown as this would be dependent on future claims that may be made against a fund. The risk of material loss from such claims is considered remote.
10. Coronavirus (COVID-19) Pandemic.
An outbreak of COVID-19 first detected in China during December 2019 has since spread globally and was declared a pandemic by the World Health Organization during March 2020. Developments that disrupt global economies and financial markets, such as the COVID-19 pandemic, may magnify factors that affect the Fund's performance.
Report of Independent Registered Public Accounting Firm
To the Board of Trustees of Fidelity Securities Fund and Shareholders of Fidelity Blue Chip Growth K6 Fund
Opinion on the Financial Statements and Financial Highlights
We have audited the accompanying statement of assets and liabilities of Fidelity Blue Chip Growth K6 Fund (the "Fund"), a fund of Fidelity Securities Fund, including the schedule of investments, as of July 31, 2022, the related statement of operations for the year then ended, the statement of changes in net assets for each of the two years in the period then ended, the financial highlights for each of the five years in the period then ended, and the related notes. In our opinion, the financial statements and financial highlights present fairly, in all material respects, the financial position of the Fund as of July 31, 2022, and the results of its operations for the year then ended, the changes in its net assets for each of the two years in the period then ended, and the financial highlights for each of the five years in the period then ended in conformity with accounting principles generally accepted in the United States of America.
Basis for Opinion
These financial statements and financial highlights are the responsibility of the Fund's management. Our responsibility is to express an opinion on the Fund's financial statements and financial highlights based on our audits. We are a public accounting firm registered with the Public Company Accounting Oversight Board (United States) (PCAOB) and are required to be independent with respect to the Fund in accordance with the U.S. federal securities laws and the applicable rules and regulations of the Securities and Exchange Commission and the PCAOB.
We conducted our audits in accordance with the standards of the PCAOB. Those standards require that we plan and perform the audit to obtain reasonable assurance about whether the financial statements and financial highlights are free of material misstatement, whether due to error or fraud. The Fund is not required to have, nor were we engaged to perform, an audit of its internal control over financial reporting. As part of our audits we are required to obtain an understanding of internal control over financial reporting but not for the purpose of expressing an opinion on the effectiveness of the Fund’s internal control over financial reporting. Accordingly, we express no such opinion.
Our audits included performing procedures to assess the risks of material misstatement of the financial statements and financial highlights, whether due to error or fraud, and performing procedures that respond to those risks. Such procedures included examining, on a test basis, evidence regarding the amounts and disclosures in the financial statements and financial highlights. Our audits also included evaluating the accounting principles used and significant estimates made by management, as well as evaluating the overall presentation of the financial statements and financial highlights. Our procedures included confirmation of securities owned as of July 31, 2022, by correspondence with the custodian and brokers; when replies were not received from brokers, we performed other auditing procedures. We believe that our audits provide a reasonable basis for our opinion.
/s/ Deloitte & Touche LLP
Boston, Massachusetts
September 14, 2022
We have served as the auditor of one or more of the Fidelity investment companies since 1999.
Trustees and Officers
The Trustees, Members of the Advisory Board (if any), and officers of the trust and fund, as applicable, are listed below. The Board of Trustees governs the fund and is responsible for protecting the interests of shareholders. The Trustees are experienced executives who meet periodically throughout the year to oversee the fund's activities, review contractual arrangements with companies that provide services to the fund, oversee management of the risks associated with such activities and contractual arrangements, and review the fund's performance. Except for Jonathan Chiel, each of the Trustees oversees 316 funds. Mr. Chiel oversees 184 funds.
The Trustees hold office without limit in time except that (a) any Trustee may resign; (b) any Trustee may be removed by written instrument, signed by at least two-thirds of the number of Trustees prior to such removal; (c) any Trustee who requests to be retired or who has become incapacitated by illness or injury may be retired by written instrument signed by a majority of the other Trustees; and (d) any Trustee may be removed at any special meeting of shareholders by a two-thirds vote of the outstanding voting securities of the trust. Each Trustee who is not an interested person (as defined in the 1940 Act) of the trust and the fund is referred to herein as an Independent Trustee. Each Independent Trustee shall retire not later than the last day of the calendar year in which his or her 75th birthday occurs. The Independent Trustees may waive this mandatory retirement age policy with respect to individual Trustees. Officers and Advisory Board Members hold office without limit in time, except that any officer or Advisory Board Member may resign or may be removed by a vote of a majority of the Trustees at any regular meeting or any special meeting of the Trustees. Except as indicated, each individual has held the office shown or other offices in the same company for the past five years.
The fund’s Statement of Additional Information (SAI) includes more information about the Trustees. To request a free copy, call Fidelity at 1-800-835-5092.
Experience, Skills, Attributes, and Qualifications of the Trustees. The Governance and Nominating Committee has adopted a statement of policy that describes the experience, qualifications, attributes, and skills that are necessary and desirable for potential Independent Trustee candidates (Statement of Policy). The Board believes that each Trustee satisfied at the time he or she was initially elected or appointed a Trustee, and continues to satisfy, the standards contemplated by the Statement of Policy. The Governance and Nominating Committee also engages professional search firms to help identify potential Independent Trustee candidates who have the experience, qualifications, attributes, and skills consistent with the Statement of Policy. From time to time, additional criteria based on the composition and skills of the current Independent Trustees, as well as experience or skills that may be appropriate in light of future changes to board composition, business conditions, and regulatory or other developments, have also been considered by the professional search firms and the Governance and Nominating Committee. In addition, the Board takes into account the Trustees' commitment and participation in Board and committee meetings, as well as their leadership of standing and ad hoc committees throughout their tenure.
In determining that a particular Trustee was and continues to be qualified to serve as a Trustee, the Board has considered a variety of criteria, none of which, in isolation, was controlling. The Board believes that, collectively, the Trustees have balanced and diverse experience, qualifications, attributes, and skills, which allow the Board to operate effectively in governing the fund and protecting the interests of shareholders. Information about the specific experience, skills, attributes, and qualifications of each Trustee, which in each case led to the Board's conclusion that the Trustee should serve (or continue to serve) as a trustee of the fund, is provided below.
Board Structure and Oversight Function. Robert A. Lawrence is an interested person and currently serves as Chair. The Trustees have determined that an interested Chair is appropriate and benefits shareholders because an interested Chair has a personal and professional stake in the quality and continuity of services provided to the fund. Independent Trustees exercise their informed business judgment to appoint an individual of their choosing to serve as Chair, regardless of whether the Trustee happens to be independent or a member of management. The Independent Trustees have determined that they can act independently and effectively without having an Independent Trustee serve as Chair and that a key structural component for assuring that they are in a position to do so is for the Independent Trustees to constitute a substantial majority for the Board. The Independent Trustees also regularly meet in executive session. David M. Thomas serves as Lead Independent Trustee and as such (i) acts as a liaison between the Independent Trustees and management with respect to matters important to the Independent Trustees and (ii) with management prepares agendas for Board meetings.
Fidelity® funds are overseen by different Boards of Trustees. The fund's Board oversees Fidelity's high income and certain equity funds, and other Boards oversee Fidelity's investment-grade bond, money market, asset allocation, and other equity funds. The asset allocation funds may invest in Fidelity® funds overseen by the fund's Board. The use of separate Boards, each with its own committee structure, allows the Trustees of each group of Fidelity® funds to focus on the unique issues of the funds they oversee, including common research, investment, and operational issues. On occasion, the separate Boards establish joint committees to address issues of overlapping consequences for the Fidelity® funds overseen by each Board.
The Trustees operate using a system of committees to facilitate the timely and efficient consideration of all matters of importance to the Trustees, the fund, and fund shareholders and to facilitate compliance with legal and regulatory requirements and oversight of the fund's activities and associated risks. The Board, acting through its committees, has charged FMR and its affiliates with (i) identifying events or circumstances the occurrence of which could have demonstrably adverse effects on the fund's business and/or reputation; (ii) implementing processes and controls to lessen the possibility that such events or circumstances occur or to mitigate the effects of such events or circumstances if they do occur; and (iii) creating and maintaining a system designed to evaluate continuously business and market conditions in order to facilitate the identification and implementation processes described in (i) and (ii) above. Because the day-to-day operations and activities of the fund are carried out by or through FMR, its affiliates, and other service providers, the fund's exposure to risks is mitigated but not eliminated by the processes overseen by the Trustees. While each of the Board's committees has responsibility for overseeing different aspects of the fund's activities, oversight is exercised primarily through the Operations, Audit, and Compliance Committees. Appropriate personnel, including but not limited to the fund's Chief Compliance Officer (CCO), FMR's internal auditor, the independent accountants, the fund's Treasurer and portfolio management personnel, make periodic reports to the Board's committees, as appropriate, including an annual review of Fidelity's risk management program for the Fidelity® funds. The responsibilities of each standing committee, including their oversight responsibilities, are described further under "Standing Committees of the Trustees."
Interested Trustees*:
Correspondence intended for a Trustee who is an interested person may be sent to Fidelity Investments, 245 Summer Street, Boston, Massachusetts 02210.
Name, Year of Birth; Principal Occupations and Other Relevant Experience+
Jonathan Chiel (1957)
Year of Election or Appointment: 2016
Trustee
Mr. Chiel also serves as Trustee of other Fidelity® funds. Mr. Chiel is Executive Vice President and General Counsel for FMR LLC (diversified financial services company, 2012-present). Previously, Mr. Chiel served as general counsel (2004-2012) and senior vice president and deputy general counsel (2000-2004) for John Hancock Financial Services; a partner with Choate, Hall & Stewart (1996-2000) (law firm); and an Assistant United States Attorney for the United States Attorney’s Office of the District of Massachusetts (1986-95), including Chief of the Criminal Division (1993-1995). Mr. Chiel is a director on the boards of the Boston Bar Foundation and the Maimonides School.
Bettina Doulton (1964)
Year of Election or Appointment: 2021
Trustee
Ms. Doulton also serves as Trustee of other Fidelity® funds. Prior to her retirement, Ms. Doulton served in a variety of positions at Fidelity Investments, including as a managing director of research (2006-2007), portfolio manager to certain Fidelity® funds (1993-2005), equity analyst and portfolio assistant (1990-1993), and research assistant (1987-1990). Ms. Doulton currently owns and operates Phi Builders + Architects and Cellardoor Winery. Previously, Ms. Doulton served as a member of the Board of Brown Capital Management, LLC (2014-2018).
Robert A. Lawrence (1952)
Year of Election or Appointment: 2020
Trustee
Chair of the Board of Trustees
Mr. Lawrence also serves as Trustee of other funds. Previously, Mr. Lawrence served as a Trustee and Member of the Advisory Board of certain funds. Prior to his retirement in 2008, Mr. Lawrence served as Vice President of certain Fidelity® funds (2006-2008), Senior Vice President, Head of High Income Division of Fidelity Management & Research Company (investment adviser firm, 2006-2008), and President of Fidelity Strategic Investments (investment adviser firm, 2002-2005).
* Determined to be an “Interested Trustee” by virtue of, among other things, his or her affiliation with the trust or various entities under common control with FMR.
+ The information includes the Trustee's principal occupation during the last five years and other information relating to the experience, attributes, and skills relevant to the Trustee's qualifications to serve as a Trustee, which led to the conclusion that the Trustee should serve as a Trustee for the fund.
Independent Trustees:
Correspondence intended for an Independent Trustee may be sent to Fidelity Investments, P.O. Box 55235, Boston, Massachusetts 02205-5235.
Name, Year of Birth; Principal Occupations and Other Relevant Experience+
Thomas P. Bostick (1956)
Year of Election or Appointment: 2021
Trustee
Lieutenant General Bostick also serves as Trustee of other Fidelity® funds. Prior to his retirement, General Bostick (United States Army, Retired) held a variety of positions within the U.S. Army, including Commanding General and Chief of Engineers, U.S. Army Corps of Engineers (2012-2016) and Deputy Chief of Staff and Director of Human Resources, U.S. Army (2009-2012). General Bostick currently serves as a member of the Board and Finance and Governance Committees of CSX Corporation (transportation, 2020-present) and a member of the Board and Corporate Governance and Nominating Committee of Perma-Fix Environmental Services, Inc. (nuclear waste management, 2020-present). General Bostick serves as Chief Executive Officer of Bostick Global Strategies, LLC (consulting, 2016-present) and as a member of the Board of HireVue, Inc. (video interview and assessment, 2020-present). Previously, General Bostick served as a Member of the Advisory Board of certain Fidelity® funds (2021), President, Intrexon Bioengineering (2018-2020) and Chief Operating Officer (2017-2020) and Senior Vice President of the Environment Sector (2016-2017) of Intrexon Corporation (biopharmaceutical company).
Dennis J. Dirks (1948)
Year of Election or Appointment: 2005
Trustee
Mr. Dirks also serves as Trustee of other Fidelity® funds. Prior to his retirement in May 2003, Mr. Dirks served as Chief Operating Officer and as a member of the Board of The Depository Trust & Clearing Corporation (financial markets infrastructure), President, Chief Operating Officer and a member of the Board of The Depository Trust Company (DTC), President and a member of the Board of the National Securities Clearing Corporation (NSCC), Chief Executive Officer and a member of the Board of the Government Securities Clearing Corporation and Chief Executive Officer and a member of the Board of the Mortgage-Backed Securities Clearing Corporation. Mr. Dirks currently serves as a member of the Finance Committee (2016-present) and Board (2017-present) and is Treasurer (2018-present) of the Asolo Repertory Theatre.
Donald F. Donahue (1950)
Year of Election or Appointment: 2018
Trustee
Mr. Donahue also serves as Trustee of other Fidelity® funds. Mr. Donahue serves as President and Chief Executive Officer of Miranda Partners, LLC (risk consulting for the financial services industry, 2012-present). Previously, Mr. Donahue served as Chief Executive Officer (2006-2012), Chief Operating Officer (2003-2006) and Managing Director, Customer Marketing and Development (1999-2003) of The Depository Trust & Clearing Corporation (financial markets infrastructure). Mr. Donahue currently serves as a member (2007-present) and Co-Chairman (2016-present) of the Board of United Way of New York and a member of the Board of The Leadership Academy (previously NYC Leadership Academy) (2012-present). Mr. Donahue previously served as a member of the Advisory Board of certain Fidelity® funds (2015-2018).
Vicki L. Fuller (1957)
Year of Election or Appointment: 2020
Trustee
Ms. Fuller also serves as Trustee of other Fidelity® funds. Previously, Ms. Fuller served as a member of the Advisory Board of certain Fidelity® funds (2018-2020), Chief Investment Officer of the New York State Common Retirement Fund (2012-2018) and held a variety of positions at AllianceBernstein L.P. (global asset management, 1985-2012), including Managing Director (2006-2012) and Senior Vice President and Senior Portfolio Manager (2001-2006). Ms. Fuller currently serves as a member of the Board, Audit Committee and Nominating and Governance Committee of two Blackstone business development companies (2020-present), as a member of the Board of Treliant, LLC (consulting, 2019-present), as a member of the Advisory Board of Ariel Alternatives, LLC (private equity, 2021-present) and as a member of the Board and Chair of the Audit Committee of Gusto, Inc. (software, 2021-present). In addition, Ms. Fuller currently serves as a member of the Board of Roosevelt University (2019-present) and as a member of the Executive Board of New York University’s Stern School of Business. Ms. Fuller previously served as a member of the Board, Audit Committee and Nominating and Governance Committee of The Williams Companies, Inc. (natural gas infrastructure, 2018-2021).
Patricia L. Kampling (1959)
Year of Election or Appointment: 2020
Trustee
Ms. Kampling also serves as Trustee of other Fidelity® funds. Prior to her retirement, Ms. Kampling served as Chairman of the Board and Chief Executive Officer (2012-2019), President and Chief Operating Officer (2011-2012) and Executive Vice President and Chief Financial Officer (2010-2011) of Alliant Energy Corporation. Ms. Kampling currently serves as a member of the Board, Finance Committee and Governance, Compensation and Nominating Committee of Xcel Energy Inc. (utilities company, 2020-present) and as a member of the Board, Audit, Finance and Risk Committee and Safety, Environmental, Technology and Operations Committee and Chair of the Executive Development and Compensation Committee of American Water Works Company, Inc. (utilities company, 2019-present). In addition, Ms. Kampling currently serves as a member of the Board of the Nature Conservancy, Wisconsin Chapter (2019-present). Previously, Ms. Kampling served as a Member of the Advisory Board of certain Fidelity® funds (2020), a member of the Board, Compensation Committee and Executive Committee and Chair of the Audit Committee of Briggs & Stratton Corporation (manufacturing, 2011-2021), a member of the Board of Interstate Power and Light Company (2012-2019) and Wisconsin Power and Light Company (2012-2019) (each a subsidiary of Alliant Energy Corporation) and as a member of the Board and Workforce Development Committee of the Business Roundtable (2018-2019).
Thomas A. Kennedy (1955)
Year of Election or Appointment: 2021
Trustee
Mr. Kennedy also serves as Trustee of other Fidelity® funds. Previously, Mr. Kennedy served as a Member of the Advisory Board of certain Fidelity® funds (2020) and held a variety of positions at Raytheon Company (aerospace and defense, 1983-2020), including Chairman and Chief Executive Officer (2014-2020) and Executive Vice President and Chief Operating Officer (2013-2014). Mr. Kennedy currently serves as Executive Chairman of the Board of Directors of Raytheon Technologies Corporation (aerospace and defense, 2020-present). He is also a member of the Rutgers School of Engineering Industry Advisory Board (2011-present) and a member of the UCLA Engineering Dean’s Executive Board (2016-present).
Oscar Munoz (1959)
Year of Election or Appointment: 2021
Trustee
Mr. Munoz also serves as Trustee of other Fidelity® funds. Prior to his retirement, Mr. Munoz served as Executive Chairman (2020-2021), Chief Executive Officer (2015-2020), President (2015-2016) and a member of the Board (2010-2021) of United Airlines Holdings, Inc. Mr. Munoz currently serves as a member of the Board of CBRE Group, Inc. (commercial real estate, 2020-present), a member of the Board of Univision Communications, Inc. (Hispanic media, 2020-present) and a member of the Advisory Board of Salesforce.com, Inc. (cloud-based software, 2020-present). Previously, Mr. Munoz served as a Member of the Advisory Board of certain Fidelity® funds (2021).
Garnett A. Smith (1947)
Year of Election or Appointment: 2018
Trustee
Mr. Smith also serves as Trustee of other Fidelity® funds. Prior to his retirement, Mr. Smith served as Chairman and Chief Executive Officer (1990-1997) and President (1986-1990) of Inbrand Corp. (manufacturer of personal absorbent products). Prior to his employment with Inbrand Corp., he was employed by a retail fabric chain and North Carolina National Bank (now Bank of America). Mr. Smith previously served as a member of the Advisory Board of certain Fidelity® funds (2012-2013).
David M. Thomas (1949)
Year of Election or Appointment: 2008
Trustee
Lead Independent Trustee
Mr. Thomas also serves as Trustee of other Fidelity® funds. Previously, Mr. Thomas served as Executive Chairman (2005-2006) and Chairman and Chief Executive Officer (2000-2005) of IMS Health, Inc. (pharmaceutical and healthcare information solutions). Mr. Thomas currently serves as a member of the Board of Fortune Brands Home and Security (home and security products, 2004-present) and as Director (2013-present) and Non-Executive Chairman of the Board (2022-present) of Interpublic Group of Companies, Inc. (marketing communication).
Susan Tomasky (1953)
Year of Election or Appointment: 2020
Trustee
Ms. Tomasky also serves as Trustee of other Fidelity® funds. Prior to her retirement, Ms. Tomasky served in various executive officer positions at American Electric Power Company, Inc. (1998-2011), including most recently as President of AEP Transmission (2007-2011). Ms. Tomasky currently serves as a member of the Board and Sustainability Committee and as Chair of the Audit Committee of Marathon Petroleum Corporation (2018-present) and as a member of the Board, Executive Committee, Corporate Governance Committee and Organization and Compensation Committee and as Chair of the Audit Committee of Public Service Enterprise Group, Inc. (utilities company, 2012-present) and as a member of the Board of its subsidiary company, Public Service Electric and Gas Co. (2021-present). In addition, Ms. Tomasky currently serves as a member (2009-present) and President (2020-present) of the Board of the Royal Shakespeare Company – America (2009-present), as a member of the Board of the Columbus Association for the Performing Arts (2011-present) and as a member of the Board and Kenyon in the World Committee of Kenyon College (2016-present). Previously, Ms. Tomasky served as a Member of the Advisory Board of certain Fidelity® funds (2020), as a member of the Board of the Columbus Regional Airport Authority (2007-2020), as a member of the Board (2011-2018) and Lead Independent Director (2015-2018) of Andeavor Corporation (previously Tesoro Corporation) (independent oil refiner and marketer) and as a member of the Board of Summit Midstream Partners LP (energy, 2012-2018).
Michael E. Wiley (1950)
Year of Election or Appointment: 2020
Trustee
Mr. Wiley also serves as Trustee of other Fidelity® funds. Previously, Mr. Wiley served as a member of the Advisory Board of certain Fidelity® funds (2018-2020), Chairman, President and CEO of Baker Hughes, Inc. (oilfield services, 2000-2004). Mr. Wiley also previously served as a member of the Board of Andeavor Corporation (independent oil refiner and marketer, 2005-2018), a member of the Board of Andeavor Logistics LP (natural resources logistics, 2015-2018) and a member of the Board of High Point Resources (exploration and production, 2005-2020).
+ The information includes the Trustee's principal occupation during the last five years and other information relating to the experience, attributes, and skills relevant to the Trustee's qualifications to serve as a Trustee, which led to the conclusion that the Trustee should serve as a Trustee for the fund.
Advisory Board Members and Officers:
Correspondence intended for a Member of the Advisory Board (if any) may be sent to Fidelity Investments, P.O. Box 55235, Boston, Massachusetts 02205-5235. Correspondence intended for an officer or Peter S. Lynch may be sent to Fidelity Investments, 245 Summer Street, Boston, Massachusetts 02210. Officers appear below in alphabetical order.
Name, Year of Birth; Principal Occupation
Peter S. Lynch (1944)
Year of Election or Appointment: 2003
Member of the Advisory Board
Mr. Lynch also serves as a Member of the Advisory Board of other Fidelity® funds. Mr. Lynch is Vice Chairman and a Director of Fidelity Management & Research Company LLC (investment adviser firm). In addition, Mr. Lynch serves as a Trustee of Boston College and as the Chairman of the Inner-City Scholarship Fund. Previously, Mr. Lynch served as Vice Chairman and a Director of FMR Co., Inc. (investment adviser firm) and on the Special Olympics International Board of Directors (1997-2006).
Craig S. Brown (1977)
Year of Election or Appointment: 2019
Assistant Treasurer
Mr. Brown also serves as an officer of other funds. Mr. Brown serves as Assistant Treasurer of FIMM, LLC (2021-present) and is an employee of Fidelity Investments (2013-present).
John J. Burke III (1964)
Year of Election or Appointment: 2018
Chief Financial Officer
Mr. Burke also serves as Chief Financial Officer of other funds. Mr. Burke serves as Head of Investment Operations for Fidelity Fund and Investment Operations (2018-present) and is an employee of Fidelity Investments (1998-present). Previously Mr. Burke served as head of Asset Management Investment Operations (2012-2018).
William C. Coffey (1969)
Year of Election or Appointment: 2019
Assistant Secretary
Mr. Coffey also serves as Assistant Secretary of other funds. He is Senior Vice President and Deputy General Counsel of FMR LLC (diversified financial services company, 2010-present), and is an employee of Fidelity Investments. Previously, Mr. Coffey served as Secretary and CLO of certain funds (2018-2019); CLO, Secretary, and Senior Vice President of Fidelity Management & Research Company and FMR Co., Inc. (investment adviser firms, 2018-2019); Secretary of Fidelity SelectCo, LLC and Fidelity Investments Money Management, Inc. (investment adviser firms, 2018-2019); CLO of Fidelity Management & Research (Hong Kong) Limited, FMR Investment Management (UK) Limited, and Fidelity Management & Research (Japan) Limited (investment adviser firms, 2018-2019); and Assistant Secretary of certain funds (2009-2018).
Timothy M. Cohen (1969)
Year of Election or Appointment: 2018
Vice President
Mr. Cohen also serves as Vice President of other funds. Mr. Cohen serves as Co-Head of Equity (2018-present), a Director of Fidelity Management & Research (Japan) Limited (investment adviser firm, 2016-present), and is an employee of Fidelity Investments. Previously, Mr. Cohen served as Executive Vice President of Fidelity SelectCo, LLC (2019), Head of Global Equity Research (2016-2018), Chief Investment Officer - Equity and a Director of Fidelity Management & Research (U.K.) Inc. (investment adviser firm, 2013-2015) and as a Director of Fidelity Management & Research (Hong Kong) Limited (investment adviser firm, 2017).
Jonathan Davis (1968)
Year of Election or Appointment: 2010
Assistant Treasurer
Mr. Davis also serves as an officer of other funds. Mr. Davis serves as Assistant Treasurer of FIMM, LLC (2021-present), FMR Capital, Inc. (2017-present), FD Funds GP LLC (2021-present), FD Funds Holding LLC (2021-present), and FD Funds Management LLC (2021-present); and is an employee of Fidelity Investments. Previously, Mr. Davis served as Vice President and Associate General Counsel of FMR LLC (diversified financial services company, 2003-2010).
Laura M. Del Prato (1964)
Year of Election or Appointment: 2018
Assistant Treasurer
Ms. Del Prato also serves as an officer of other funds. Ms. Del Prato serves as Assistant Treasurer of FIMM, LLC (2021-present) and is an employee of Fidelity Investments (2017-present). Previously, Ms. Del Prato served as President and Treasurer of The North Carolina Capital Management Trust: Cash Portfolio and Term Portfolio (2018-2020). Prior to joining Fidelity Investments, Ms. Del Prato served as a Managing Director and Treasurer of the JPMorgan Mutual Funds (2014-2017). Prior to JPMorgan, Ms. Del Prato served as a partner at Cohen Fund Audit Services (accounting firm, 2012-2013) and KPMG LLP (accounting firm, 2004-2012).
Colm A. Hogan (1973)
Year of Election or Appointment: 2020
Assistant Treasurer
Mr. Hogan also serves as an officer of other funds. Mr. Hogan serves as Assistant Treasurer of FIMM, LLC (2021-present) and FMR Capital, Inc. (2017-present) and is an employee of Fidelity Investments (2005-present). Previously, Mr. Hogan served as Deputy Treasurer of certain Fidelity® funds (2016-2020) and Assistant Treasurer of certain Fidelity® funds (2016-2018).
Pamela R. Holding (1964)
Year of Election or Appointment: 2018
Vice President
Ms. Holding also serves as Vice President of other funds. Ms. Holding serves as Co-Head of Equity (2018-present) and is an employee of Fidelity Investments (2013-present). Previously, Ms. Holding served as Executive Vice President of Fidelity SelectCo, LLC (2019) and as Chief Investment Officer of Fidelity Institutional Asset Management (2013-2018).
Cynthia Lo Bessette (1969)
Year of Election or Appointment: 2019
Secretary and Chief Legal Officer (CLO)
Ms. Lo Bessette also serves as an officer of other funds. Ms. Lo Bessette serves as CLO, Secretary, and Senior Vice President of Fidelity Management & Research Company LLC (investment adviser firm, 2019-present); CLO of Fidelity Management & Research (Hong Kong) Limited, FMR Investment Management (UK) Limited, and Fidelity Management & Research (Japan) Limited (investment adviser firms, 2019-present); Secretary of FD Funds GP LLC (2021-present), FD Funds Holding LLC (2021-present), and FD Funds Management LLC (2021-present); and Assistant Secretary of FIMM, LLC (2019-present). She is a Senior Vice President and Deputy General Counsel of FMR LLC (diversified financial services company, 2019-present), and is an employee of Fidelity Investments. Previously, Ms. Lo Bessette served as CLO, Secretary, and Senior Vice President of FMR Co., Inc. (investment adviser firm, 2019); Secretary of Fidelity SelectCo, LLC and Fidelity Investments Money Management, Inc. (investment adviser firms, 2019). Prior to joining Fidelity Investments, Ms. Lo Bessette was Executive Vice President, General Counsel (2016-2019) and Senior Vice President, Deputy General Counsel (2015-2016) of OppenheimerFunds (investment management company) and Deputy Chief Legal Officer (2013-2015) of Jennison Associates LLC (investment adviser firm).
Chris Maher (1972)
Year of Election or Appointment: 2020
Deputy Treasurer
Mr. Maher also serves as an officer of other funds. Mr. Maher serves as Assistant Treasurer of FIMM, LLC (2021-present) and FMR Capital, Inc. (2017-present), and is an employee of Fidelity Investments (2008-present). Previously, Mr. Maher served as Assistant Treasurer of certain funds (2013-2020); Vice President of Asset Management Compliance (2013), Vice President of the Program Management Group of FMR (investment adviser firm, 2010-2013), and Vice President of Valuation Oversight (2008-2010).
Jason P. Pogorelec (1975)
Year of Election or Appointment: 2020
Chief Compliance Officer
Mr. Pogorelec also serves as Chief Compliance Officer of other funds. Mr. Pogorelec is a senior Vice President of Asset Management Compliance for Fidelity Investments and is an employee of Fidelity Investments (2006-present). Previously, Mr. Pogorelec served as Vice President, Associate General Counsel for Fidelity Investments (2010-2020) and Assistant Secretary of certain Fidelity funds (2015-2020).
Brett Segaloff (1972)
Year of Election or Appointment: 2021
Anti-Money Laundering (AML) Officer
Mr. Segaloff also serves as an AML Officer of other funds and other related entities. He is Director, Anti-Money Laundering (2007-present) of FMR LLC (diversified financial services company) and is an employee of Fidelity Investments (1996-present).
Stacie M. Smith (1974)
Year of Election or Appointment: 2016
President and Treasurer
Ms. Smith also serves as an officer of other funds. Ms. Smith serves as Assistant Treasurer of FIMM, LLC (2021-present) and FMR Capital, Inc. (2017-present), is an employee of Fidelity Investments (2009-present), and has served in other fund officer roles. Prior to joining Fidelity Investments, Ms. Smith served as Senior Audit Manager of Ernst & Young LLP (accounting firm, 1996-2009). Previously, Ms. Smith served as Assistant Treasurer (2013-2019) and Deputy Treasurer (2013-2016) of certain Fidelity® funds.
Jim Wegmann (1979)
Year of Election or Appointment: 2019
Assistant Treasurer
Mr. Wegmann also serves as an officer of other funds. Mr. Wegmann serves as Assistant Treasurer of FIMM, LLC (2021-present) and is an employee of Fidelity Investments (2011-present). Previously, Mr. Wegmann served as Assistant Treasurer of certain Fidelity® funds (2019-2021).
Shareholder Expense Example
As a shareholder, you incur two types of costs: (1) transaction costs, which may include sales charges (loads) on purchase payments or redemption proceeds, as applicable and (2) ongoing costs, which generally include management fees, distribution and/or service (12b-1) fees and other Fund expenses. This Example is intended to help you understand your ongoing costs (in dollars) of investing in a fund and to compare these costs with the ongoing costs of investing in other mutual funds.
The Example is based on an investment of $1,000 invested at the beginning of the period and held for the entire period (February 1, 2022 to July 31, 2022).
Actual Expenses
The first line of the accompanying table provides information about actual account values and actual expenses. You may use the information in this line, together with the amount you invested, to estimate the expenses that you paid over the period. Simply divide your account value by $1,000.00 (for example, an $8,600 account value divided by $1,000.00 = 8.6), then multiply the result by the number in the first line for a class/Fund under the heading entitled "Expenses Paid During Period" to estimate the expenses you paid on your account during this period. If any fund is a shareholder of any underlying mutual funds or exchange-traded funds (ETFs) (the Underlying Funds), such fund indirectly bears its proportional share of the expenses of the Underlying Funds in addition to the direct expenses incurred presented in the table. These fees and expenses are not included in the annualized expense ratio used to calculate the expense estimate in the table below.
Hypothetical Example for Comparison Purposes
The second line of the accompanying table provides information about hypothetical account values and hypothetical expenses based on the actual expense ratio and an assumed rate of return of 5% per year before expenses, which is not the actual return. The hypothetical account values and expenses may not be used to estimate the actual ending account balance or expenses you paid for the period. You may use this information to compare the ongoing costs of investing in the Fund and other funds. To do so, compare this 5% hypothetical example with the 5% hypothetical examples that appear in the shareholder reports of the other funds. If any fund is a shareholder of any Underlying Funds, such fund indirectly bears its proportional share of the expenses of the Underlying Funds in addition to the direct expenses as presented in the table. These fees and expenses are not included in the annualized expense ratio used to calculate the expense estimate in the table below.
Please note that the expenses shown in the table are meant to highlight your ongoing costs only and do not reflect any transaction costs. Therefore, the second line of the table is useful in comparing ongoing costs only, and will not help you determine the relative total costs of owning different funds. In addition, if these transactional costs were included, your costs would have been higher.
| | Annualized Expense Ratio-A | Beginning
Account Value
February 1, 2022 | Ending
Account Value
July 31, 2022 | Expenses Paid
During Period-B
February 1, 2022
to July 31, 2022 |
| Fidelity Blue Chip Growth K6 Fund | .45% | | | |
| Actual | | $1,000.00 | $818.10 | $2.03 |
| Hypothetical-C | | $1,000.00 | $1,022.56 | $2.26 |
A Annualized expense ratio reflects expenses net of applicable fee waivers.
B Expenses are equal to the annualized expense ratio, multiplied by the average account value over the period, multiplied by 181/ 365 (to reflect the one-half year period). The fees and expenses of any Underlying Funds are not included in each annualized expense ratio.
C 5% return per year before expenses
Distributions (Unaudited)
The dividend and capital gains distributions for the fund(s) are available on Fidelity.com or Institutional.Fidelity.com.
The fund hereby designates as a capital gain dividend with respect to the taxable year ended July 31,2022, $46,495,653, or, if subsequently determined to be different, the net capital gain of such year.
The fund designates 99.76% of the short-term capital gain dividends distributed in September, during the fiscal year as qualifying to be taxed as short-term capital gain dividends for nonresident alien shareholders.
The fund designates 9% of the dividends distributed in September, during the fiscal year as qualifying for the dividends–received deduction for corporate shareholders.
The fund designates 11% of the dividends distributed in September, during the fiscal year as amounts which may be taken into account as a dividend for the purposes of the maximum rate under section 1(h)(11) of the Internal Revenue Code.
The fund will notify shareholders in January 2023 of amounts for use in preparing 2022 income tax returns.
Board Approval of Investment Advisory Contracts and Management Fees
Fidelity Blue Chip Growth K6 Fund
Each year, the Board of Trustees, including the Independent Trustees (together, the Board), votes on the renewal of the management contract with Fidelity Management & Research Company LLC (FMR) and the sub-advisory agreements (together, the Advisory Contracts) for the fund. FMR and the sub-advisers are referred to herein as the Investment Advisers. The Board, assisted by the advice of fund counsel and Independent Trustees' counsel, requests and considers a broad range of information relevant to the renewal of the Advisory Contracts throughout the year.
The Board meets regularly and, at each of its meetings, covers an extensive agenda of topics and materials and considers factors that are relevant to its annual consideration of the renewal of the fund's Advisory Contracts, including the services and support provided to the fund and its shareholders. The Board has established various standing committees (Committees), each composed of and chaired by Independent Trustees with varying backgrounds, to which the Board has assigned specific subject matter responsibilities in order to enhance effective decision-making by the Board. The Board, acting directly and through its Committees, requests and receives information concerning the annual consideration of the renewal of the fund's Advisory Contracts. The Board also meets as needed to review matters specifically related to the Board's annual consideration of the renewal of the Advisory Contracts. Members of the Board may also meet with trustees of other Fidelity funds through joint ad hoc committees to discuss certain matters relevant to all of the Fidelity funds.
At its May 2022 meeting, the Board unanimously determined to renew the fund's Advisory Contracts. In reaching its determination, the Board considered all factors it believed relevant, including (i) the nature, extent, and quality of the services provided to the fund and its shareholders (including the investment performance of the fund); (ii) the competitiveness relative to peer funds of the fund's management fee and total expense ratio; (iii) the total costs of the services provided by and the profits realized by Fidelity from its relationships with the fund; and (iv) the extent to which, if any, economies of scale exist and are realized as the fund grows, and whether any economies of scale are appropriately shared with fund shareholders.
In considering whether to renew the Advisory Contracts for the fund, the Board reached a determination, with the assistance of fund counsel and Independent Trustees' counsel and through the exercise of its business judgment, that the renewal of the Advisory Contracts was in the best interests of the fund and its shareholders and that the compensation payable under the Advisory Contracts was fair and reasonable. The Board's decision to renew the Advisory Contracts was not based on any single factor, but rather was based on a comprehensive consideration of all the information provided to the Board at its meetings throughout the year. The Board, in reaching its determination to renew the Advisory Contracts, was aware that shareholders of the fund have a broad range of investment choices available to them, including a wide choice among funds offered by Fidelity's competitors, and that the fund's shareholders, who have the opportunity to review and weigh the disclosure provided by the fund in its prospectus and other public disclosures, have chosen to invest in this fund, which is part of the Fidelity family of funds.
Nature, Extent, and Quality of Services Provided. The Board considered Fidelity's staffing as it relates to the fund, including the backgrounds of investment personnel of Fidelity, and also considered the fund's investment objective, strategies, and related investment philosophy. The Independent Trustees also had discussions with senior management of Fidelity's investment operations and investment groups. The Board considered the structure of the investment personnel compensation program and whether this structure provides appropriate incentives to act in the best interests of the fund. Additionally, the Board considered the portfolio managers' investments, if any, in the funds that they manage. The Board also considered the steps Fidelity had taken to ensure the continued provision of high quality services to the Fidelity funds during the COVID-19 pandemic, including the expansion of staff in client facing positions to maintain service levels in periods of high volumes and volatility.
Resources Dedicated to Investment Management and Support Services. The Board and the Fund Oversight and Research Committees reviewed the general qualifications and capabilities of Fidelity's investment staff, including its size, education, experience, and resources, as well as Fidelity's approach to recruiting, training, managing, and compensating investment personnel. The Board noted the resources devoted to expansion of Fidelity's global investment organization, and that Fidelity's analysts have extensive resources, tools, and capabilities that allow them to conduct sophisticated quantitative and fundamental analysis, as well as credit analysis of issuers, counterparties, and guarantors. Further, the Board considered that Fidelity's investment professionals have sufficient access to global information and data so as to provide competitive investment results over time, and that those professionals also have access to sophisticated tools that permit them to assess portfolio construction and risk and performance attribution characteristics continuously, as well as to transmit new information and research conclusions rapidly around the world. Additionally, in its deliberations, the Board considered Fidelity's trading, risk management, compliance, and technology and operations capabilities and resources, which are integral parts of the investment management process.
Shareholder and Administrative Services. The Board considered (i) the nature, extent, quality, and cost of advisory, administrative, and shareholder services performed by the Investment Advisers and their affiliates under the Advisory Contracts and under separate agreements covering transfer agency, pricing and bookkeeping, and securities lending services for the fund; (ii) the nature and extent of the supervision of third party service providers, principally custodians, subcustodians, and pricing vendors; and (iii) the resources devoted to, and the record of compliance with, the fund's compliance policies and procedures. The Board also reviewed the allocation of fund brokerage, including allocations to brokers affiliated with the Investment Advisers, the use of brokerage commissions to pay fund expenses, and the use of "soft" commission dollars to pay for research services.
The Board noted that the growth of fund assets over time across the complex allows Fidelity to reinvest in the development of services designed to enhance the value and convenience of the Fidelity funds as investment vehicles. These services include 24-hour access to account information and market information over the Internet and through telephone representatives, investor education materials, and asset allocation tools. The Board also considered that it reviews customer service metrics such as telephone response times, continuity of services on the website and metrics addressing services at Fidelity Investor Centers.
Investment in a Large Fund Family. The Board considered the benefits to shareholders of investing in a Fidelity fund, including the benefits of investing in a fund that is part of a large family of funds offering a variety of investment disciplines and providing a large variety of mutual fund investor services. The Board noted that Fidelity had taken, or had made recommendations that resulted in the Fidelity funds taking, a number of actions over the previous year that benefited particular funds, including: (i) continuing to dedicate additional resources to Fidelity's investment research process, which includes meetings with management of issuers of securities in which the funds invest; (ii) continuing efforts to enhance Fidelity's global research capabilities; (iii) launching new funds and ETFs with innovative structures, strategies and pricing and making other enhancements to meet client needs; (iv) launching new share classes of existing funds; (v) eliminating purchase minimums and broadening eligibility requirements for certain funds and share classes; (vi) reducing management fees and total expenses for certain target date funds and classes and index funds; (vii) lowering expenses for certain existing funds and classes by implementing or lowering expense caps; (viii) rationalizing product lines and gaining increased efficiencies from fund mergers and liquidations; (ix) continuing to develop, acquire and implement systems and technology to improve services to the funds and shareholders, strengthen information security, and increase efficiency; and (x) continuing to implement enhancements to further strengthen Fidelity's product line to increase investors' probability of success in achieving their investment goals, including retirement income goals.
Investment Performance. The Board considered whether the fund has operated in accordance with its investment objective, as well as its record of compliance with its investment restrictions and its performance history.
The Board took into account discussions that occur at Board meetings throughout the year with representatives of the Investment Advisers about fund investment performance. In this regard the Board noted that as part of regularly scheduled fund reviews and other reports to the Board on fund performance, the Board considers annualized return information for the fund for different time periods, measured against an appropriate securities market index (benchmark index) and an appropriate peer group of funds with similar objectives (peer group). The Board also reviews and considers information about performance attribution. In its evaluation of fund investment performance, the Board gave particular attention to information indicating changes in performance of certain Fidelity funds for specific time periods and discussed with the Investment Advisers the reasons for any overperformance or underperformance.
In addition to reviewing absolute and relative fund performance, the Independent Trustees periodically consider the appropriateness of fund performance metrics in evaluating the results achieved. In general, the Independent Trustees believe that fund performance should be evaluated based on net performance (after fees and expenses) of the fund compared to appropriate benchmark indices, over appropriate time periods that may include full market cycles, and compared to peer groups, as applicable, over the same periods, taking into account relevant factors including the following: general market conditions; issuer-specific information; and fund cash flows and other factors.
The Independent Trustees recognize that shareholders evaluate performance on a net basis over their own holding periods, for which one-, three-, and five-year periods are often used as a proxy. For this reason, the performance information reviewed by the Board also included net cumulative total return information for the fund and an appropriate benchmark index and peer group for the most recent one- and three-year periods ended September 30, 2021, as shown below. Returns are shown compared to the 25th percentile (top of box, 75% beaten) and 75th percentile (bottom of box, 25% beaten) of the peer universe.
Fidelity Blue Chip Growth K6 Fund
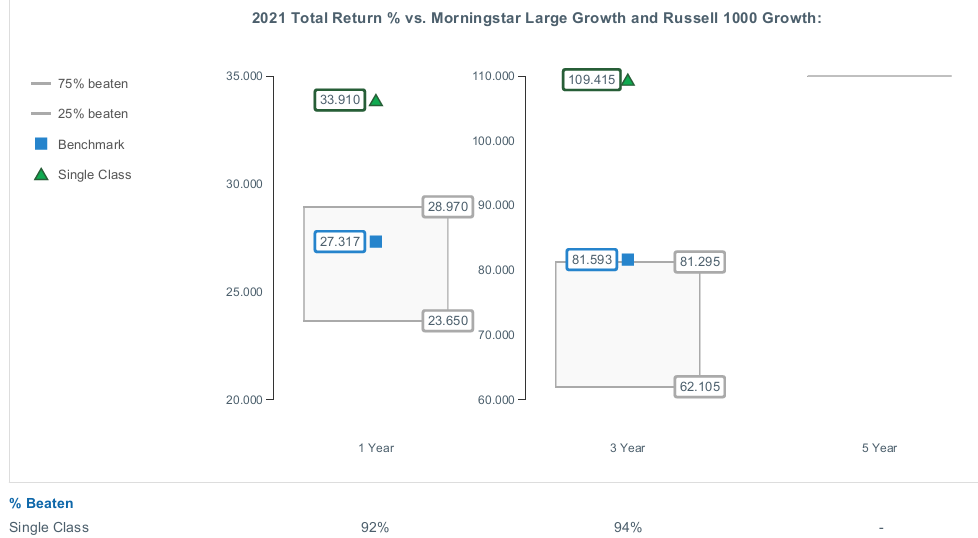
Based on its review, the Board concluded that the nature, extent, and quality of services provided to the fund under the Advisory Contracts should continue to benefit the shareholders of the fund.
Competitiveness of Management Fee and Total Expense Ratio. The Board considered the fund's management fee and total expense ratio compared to "mapped groups" of competitive funds and classes created for the purpose of facilitating the Trustees' competitive analysis of management fees and total expenses. Fidelity creates "mapped groups" by combining similar Lipper investment objective categories that have comparable investment mandates. Combining Lipper investment objective categories aids the Board's management fee and total expense ratio comparisons by broadening the competitive group used for comparison.
Management Fee. The Board considered two proprietary management fee comparisons for the 12-month (or shorter) periods ended September 30 (June 30 for periods ended 2019 and 2018) shown in basis points (BP) in the chart below. The group of Lipper funds used by the Board for management fee comparisons is referred to below as the "Total Mapped Group." The Total Mapped Group comparison focuses on a fund's standing in terms of gross management fees before expense reimbursements or caps relative to the total universe of funds with comparable investment mandates, regardless of whether their management fee structures also are comparable. Funds with comparable investment mandates offer exposure to similar types of securities. Funds with comparable management fee structures have similar management fee contractual arrangements (
e.g., flat rate charged for advisory services, all-inclusive fee rate,
etc.). "TMG %" represents the percentage of funds in the Total Mapped Group that had management fees that were lower than the fund's. For example, a hypothetical TMG % of 20% would mean that 80% of the funds in the Total Mapped Group had higher, and 20% had lower, management fees than the fund. The fund's actual TMG %s and the number of funds in the Total Mapped Group are in the chart below. The "Asset-Sized Peer Group" (ASPG) comparison focuses on a fund's standing relative to a subset of non-Fidelity funds within the Total Mapped Group that are similar in size and management fee structure. For example, if a fund is in the first quartile of the ASPG, the fund's management fee ranks in the least expensive or lowest 25% of funds in the ASPG. The ASPG represents at least 15% of the funds in the Total Mapped Group with comparable asset size and management fee structures, subject to a minimum of 50 funds (or all funds in the Total Mapped Group if fewer than 50). Additional information, such as the ASPG quartile in which the fund's management fee rate ranked, is also included in the chart and was considered by the Board.
Fidelity Blue Chip Growth K6 Fund

The Board noted that the fund's management fee rate ranked below the median of its Total Mapped Group and below the median of its ASPG for the 12-month period ended September 30, 2021.
The Board also considered that, for funds subject to the group fee, FMR agreed to voluntarily waive fees over a specified period of time in amounts designed to account for assets converted from certain funds to certain collective investment trusts.
Based on its review, the Board concluded that the fund's management fee is fair and reasonable in light of the services that the fund receives and the other factors considered.
Total Expense Ratio. In its review of the fund's total expense ratio, the Board considered the fund's unitary fee rate as well as other fund expenses paid by FMR under the fund's management contract, such as transfer agent fees, pricing and bookkeeping fees, and custodial, legal, and audit fees. The Board also noted that Fidelity may agree to waive fees or reimburse expenses from time to time, and the extent to which, if any, it has done so for the fund. The fund is compared to those funds and classes in the Total Mapped Group (used by the Board for management fee comparisons) that have a similar sales load structure. The Board also considered a total expense ASPG comparison for the fund, which focuses on the total expenses of the fund relative to a subset of non-Fidelity funds within the total expense similar sales load structure group. The total expense ASPG is limited to 15 larger and 15 smaller classes in fund average assets for a total of 30 classes, where possible. The total expense ASPG comparison excludes performance adjustments and fund-paid 12b-1 fees to eliminate variability in fee structures.
The Board noted that the fund's total net expense ratio ranked below the similar sales load structure group competitive median and below the ASPG competitive median for the 12-month period ended September 30, 2021.
Fees Charged to Other Fidelity Clients. The Board also considered Fidelity fee structures and other information with respect to clients of Fidelity, such as other funds advised or subadvised by Fidelity, pension plan clients, and other institutional clients with similar mandates. The Board noted that a joint ad hoc committee created by it and the boards of other Fidelity funds periodically reviews and compares Fidelity's institutional investment advisory business with its business of providing services to the Fidelity funds and also noted the most recent findings of the committee. The Board noted that the committee's review included a consideration of the differences in services provided, fees charged, and costs incurred, as well as competition in the markets serving the different categories of clients.
Based on its review of total expense ratios and fees charged to other Fidelity clients, the Board concluded that the fund's total expense ratio was reasonable in light of the services that the fund and its shareholders receive and the other factors considered.
Costs of the Services and Profitability. The Board considered the revenues earned and the expenses incurred by Fidelity in conducting the business of developing, marketing, distributing, managing, administering and servicing the fund and servicing the fund's shareholders. The Board also considered the level of Fidelity's profits in respect of all the Fidelity funds.
On an annual basis, Fidelity presents to the Board information about the profitability of its relationships with the fund. Fidelity calculates profitability information for each fund, as well as aggregate profitability information for groups of Fidelity funds and all Fidelity funds, using a series of detailed revenue and cost allocation methodologies which originate with the books and records of Fidelity on which Fidelity's audited financial statements are based. The Audit Committee of the Board reviews any significant changes from the prior year's methodologies and the full Board approves such changes.
A public accounting firm has been engaged annually by the Board as part of the Board's assessment of Fidelity's profitability analysis. The engagement includes the review and assessment of the methodologies used by Fidelity in determining the revenues and expenses attributable to Fidelity's mutual fund business, and completion of agreed-upon procedures in respect of the mathematical accuracy of certain fund profitability information and its conformity to established allocation methodologies. After considering the reports issued under the engagement and information provided by Fidelity, the Board concluded that while other allocation methods may also be reasonable, Fidelity's profitability methodologies are reasonable in all material respects.
The Board also reviewed Fidelity's non-fund businesses and potential indirect benefits such businesses may have received as a result of their association with Fidelity's mutual fund business (i.e., fall-out benefits) as well as cases where Fidelity's affiliates may benefit from the funds' business. The Board considered areas where potential indirect benefits to the Fidelity funds from their relationships with Fidelity may exist. The Board's consideration of these matters was informed by the findings of a joint ad hoc committee created by it and the boards of other Fidelity funds to evaluate potential fall-out benefits.
The Board considered the costs of the services provided by and the profits realized by Fidelity in connection with the operation of the fund and was satisfied that the profitability was not excessive.
Economies of Scale. The Board considered whether there have been economies of scale in respect of the management of the Fidelity funds, whether the Fidelity funds (including the fund) have appropriately benefited from any such economies of scale, and whether there is potential for realization of any further economies of scale. The Board considered the extent to which the fund will benefit from economies of scale as assets grow through increased services to the fund, through waivers or reimbursements, or through fee or expense ratio reductions. The Board recognized that, due to the fund's current contractual arrangements, its expense ratio will not decline if the fund's operating costs decrease as assets grow, or rise as assets decrease. The Board also noted that a committee (the Economies of Scale Committee) created by it and the boards of other Fidelity funds periodically analyzes whether Fidelity attains economies of scale in respect of the management and servicing of the Fidelity funds, whether the Fidelity funds have appropriately benefited from such economies of scale, and whether there is potential for realization of any further economies of scale.
The Board concluded, taking into account the analysis of the Economies of Scale Committee, that economies of scale, if any, are being appropriately shared between fund shareholders and Fidelity.
Additional Information Requested by the Board. In order to develop fully the factual basis for consideration of the Fidelity funds' advisory contracts, the Board requested and received additional information on certain topics, including: (i) fund flow and performance trends, in particular the underperformance of certain funds and strategies, and Fidelity's long-term strategies for certain funds, including any consideration of fund liquidations or mergers; (ii) the operation of performance fees, competitor use of performance fees, and consideration of the expansion of performance fees to additional funds; (iii) Fidelity's pricing philosophy compared to competitors; (iv) fund profitability methodology and data; (v) evaluation of competitive fund data and peer group classifications and fee and expense comparisons; (vi) the management fee and expense structures for different funds and classes and information about the differences between various fee and expense structures; (vii) group fee breakpoints and related voluntary fee waivers; and (viii) information regarding other accounts managed by Fidelity and the funds' sub-advisory arrangements.
Based on its evaluation of all of the conclusions noted above, and after considering all factors it believed relevant, the Board concluded that the advisory fee arrangements are fair and reasonable and that the fund's Advisory Contracts should be renewed.
Liquidity Risk Management Program
The Securities and Exchange Commission adopted Rule 22e-4 under the Investment Company Act of 1940 (the Liquidity Rule) to promote effective liquidity risk management throughout the open-end investment company industry, thereby reducing the risk that funds will be unable to meet their redemption obligations and mitigating dilution of the interests of fund shareholders.
The Fund has adopted and implemented a liquidity risk management program pursuant to the Liquidity Rule (the Program) effective December 1, 2018. The Program is reasonably designed to assess and manage the Fund’s liquidity risk and to comply with the requirements of the Liquidity Rule. The Fund’s Board of Trustees (the Board) has designated the Fund’s investment adviser as administrator of the Program. The Fidelity advisers have established a Liquidity Risk Management Committee (the LRM Committee) to manage the Program for each of the Fidelity Funds. The LRM Committee monitors the adequacy and effectiveness of implementation of the Program and on a periodic basis assesses each Fund’s liquidity risk based on a variety of factors including (1) the Fund’s investment strategy, (2) portfolio liquidity and cash flow projections during normal and reasonably foreseeable stressed conditions, (3) shareholder redemptions, (4) borrowings and other funding sources and (5) in the case of exchange-traded funds, certain additional factors including the effect of the Fund’s prices and spreads, market participants, and basket compositions on the overall liquidity of the Fund’s portfolio, as applicable.
In accordance with the Program, each of the Fund’s portfolio investments is classified into one of four liquidity categories described below based on a determination of a reasonable expectation for how long it would take to convert the investment to cash (or sell or dispose of the investment) without significantly changing its market value.
- Highly liquid investments – cash or convertible to cash within three business days or less
- Moderately liquid investments – convertible to cash in three to seven calendar days
- Less liquid investments – can be sold or disposed of, but not settled, within seven calendar days
- Illiquid investments – cannot be sold or disposed of within seven calendar days
Liquidity classification determinations take into account a variety of factors including various market, trading and investment-specific considerations, as well as market depth, and generally utilize analysis from a third-party liquidity metrics service.
The Liquidity Rule places a 15% limit on a fund’s illiquid investments and requires funds that do not primarily hold assets that are highly liquid investments to determine and maintain a minimum percentage of the fund’s net assets to be invested in highly liquid investments (highly liquid investment minimum or HLIM). The Program includes provisions reasonably designed to comply with the 15% limit on illiquid investments and for determining, periodically reviewing and complying with the HLIM requirement as applicable.
At a recent meeting of the Fund’s Board of Trustees, the LRM Committee provided a written report to the Board pertaining to the operation, adequacy, and effectiveness of implementation of the Program for the annual period from December 1, 2020 through November 30, 2021. The report concluded that the Program has been implemented and is operating effectively and is reasonably designed to assess and manage the Fund’s liquidity risk.
BCFK6-ANN-0922
1.9884007.105
Fidelity® Blue Chip Value Fund
Annual Report
July 31, 2022
Contents
To view a fund's proxy voting guidelines and proxy voting record for the 12-month period ended June 30, visit http://www.fidelity.com/proxyvotingresults or visit the Securities and Exchange Commission's (SEC) web site at http://www.sec.gov.
You may also call 1-800-544-8544 to request a free copy of the proxy voting guidelines.
Standard & Poor's, S&P and S&P 500 are registered service marks of The McGraw-Hill Companies, Inc. and have been licensed for use by Fidelity Distributors Corporation.
Other third-party marks appearing herein are the property of their respective owners.
All other marks appearing herein are registered or unregistered trademarks or service marks of FMR LLC or an affiliated company. © 2022 FMR LLC. All rights reserved.
This report and the financial statements contained herein are submitted for the general information of the shareholders of the Fund. This report is not authorized for distribution to prospective investors in the Fund unless preceded or accompanied by an effective prospectus.
A fund files its complete schedule of portfolio holdings with the SEC for the first and third quarters of each fiscal year on Form N-PORT. Forms N-PORT are available on the SEC’s web site at http://www.sec.gov. A fund's Forms N-PORT may be reviewed and copied at the SEC’s Public Reference Room in Washington, DC. Information regarding the operation of the SEC's Public Reference Room may be obtained by calling 1-800-SEC-0330.
For a complete list of a fund's portfolio holdings, view the most recent holdings listing, semiannual report, or annual report on Fidelity's web site at http://www.fidelity.com, http://www.institutional.fidelity.com, or http://www.401k.com, as applicable.
NOT FDIC INSURED •MAY LOSE VALUE •NO BANK GUARANTEE
Neither the Fund nor Fidelity Distributors Corporation is a bank.
Note to Shareholders:
Early in 2020, the outbreak and spread of COVID-19 emerged as a public health emergency that had a major influence on financial markets, primarily based on its impact on the global economy and corporate earnings. On March 11, 2020, the World Health Organization declared the COVID-19 outbreak a pandemic, citing sustained risk of further global spread. The pandemic prompted a number of measures to limit the spread of COVID-19, including travel and border restrictions, quarantines, and restrictions on large gatherings. In turn, these resulted in lower consumer activity, diminished demand for a wide range of products and services, disruption in manufacturing and supply chains, and – given the wide variability in outcomes regarding the outbreak – significant market uncertainty and volatility. To help stem the turmoil, the U.S. government took unprecedented action – in concert with the U.S. Federal Reserve and central banks around the world – to help support consumers, businesses, and the broader economy, and to limit disruption to the financial system.
In general, the overall impact of the pandemic lessened in 2021, amid a resilient economy and widespread distribution of three COVID-19 vaccines granted emergency use authorization from the U.S. Food and Drug Administration (FDA) early in the year. Still, the situation remains dynamic, and the extent and duration of its influence on financial markets and the economy is highly uncertain, due in part to a recent spike in cases based on highly contagious variants of the coronavirus.
Extreme events such as the COVID-19 crisis are exogenous shocks that can have significant adverse effects on mutual funds and their investments. Although multiple asset classes may be affected by market disruption, the duration and impact may not be the same for all types of assets. Fidelity is committed to helping you stay informed amid news about COVID-19 and during increased market volatility, and we continue to take extra steps to be responsive to customer needs. We encourage you to visit us online, where we offer ongoing updates, commentary, and analysis on the markets and our funds.
Performance: The Bottom Line
Average annual total return reflects the change in the value of an investment, assuming reinvestment of distributions from dividend income and capital gains (the profits earned upon the sale of securities that have grown in value, if any) and assuming a constant rate of performance each year. The hypothetical investment and the average annual total returns do not reflect the deduction of taxes that a shareholder would pay on fund distributions or the redemption of fund shares. During periods of reimbursement by Fidelity, a fund’s total return will be greater than it would be had the reimbursement not occurred. How a fund did yesterday is no guarantee of how it will do tomorrow.
Average Annual Total Returns
| For the periods ended July 31, 2022 | Past 1 year | Past 5 years | Past 10 years |
| Fidelity® Blue Chip Value Fund | 4.28% | 6.33% | 10.42% |
$10,000 Over 10 Years
Let's say hypothetically that $10,000 was invested in Fidelity® Blue Chip Value Fund on July 31, 2012.
The chart shows how the value of your investment would have changed, and also shows how the Russell 1000® Value Index performed over the same period.
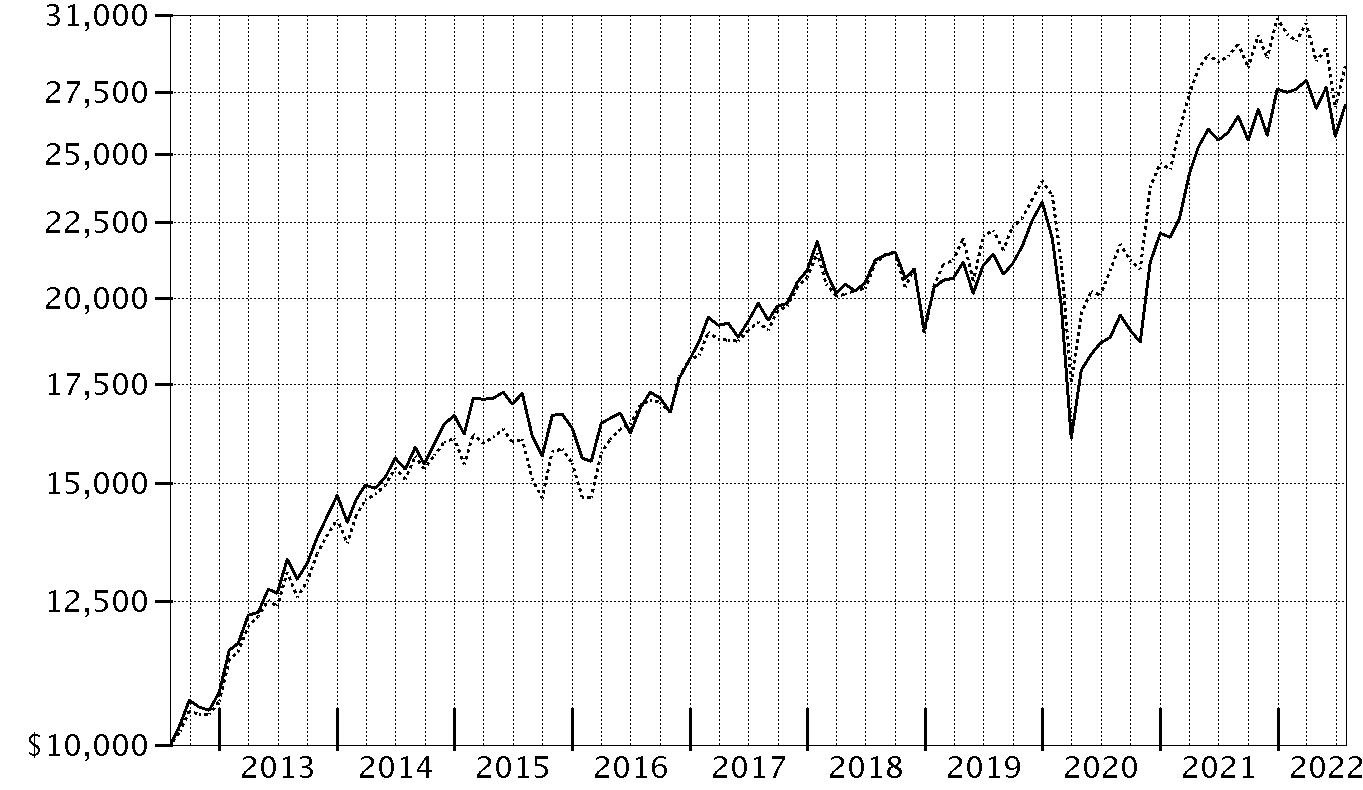
| Period Ending Values |
| $26,954 | Fidelity® Blue Chip Value Fund |
| $28,643 | Russell 1000® Value Index |
Management's Discussion of Fund Performance
Market Recap: The S&P 500
® index returned -4.64% for the 12 months ending July 31, 2022, as a multitude of crosscurrents challenged the global economy and financial markets. Persistently high inflation, exacerbated by energy price shocks from the Russia–Ukraine conflict, spurred the U.S. Federal Reserve to hike interest rates more aggressively than anticipated, and concerns about the outlook for economic growth sent stocks into bear market territory. In early May, the Fed approved a rare half-percentage-point interest rate increase and announced plans to shrink its $9 trillion asset portfolio. June began with the Fed allowing up to billions in Treasuries and mortgage bonds to mature every month without investing the proceeds. Two weeks later, the central bank raised rates by 0.75 percentage points, its largest increase since 1994, and said it was becoming more difficult to achieve a soft landing, in which the economy slows enough to bring down inflation while avoiding a recession. Against this volatile backdrop, the S&P 500 posted its worst first-half result (-19.96%) to begin a year since 1970. Stocks sharply reversed course in July (+9.22%), as the Fed again raised its benchmark interest rate by 0.75% but signaled that, at some point, it will likely slow the pace of tightening to assess the impact on the economy. For the full 12 months, growth-oriented communication services (-29%) and consumer discretionary (-10%) stocks lagged most. In contrast, energy (+67%) rode a surge in commodity prices and led by a wide margin, followed by the defensive utilities (+16%) and consumer staples (+7%) sectors.
Comments from Portfolio Manager Sean Gavin: For the fiscal year ending July 31, 2022, the fund gained 4.28%, outperforming the -1.43% result of the benchmark Russell 1000
® Value Index. Versus the benchmark, security selection was the primary contributor. Favorable picks and an overweighting in the strong-performing utilities sector, along with investment choices in financials, bolstered the fund's relative result. The biggest individual relative contributor was an overweight stake in Exxon Mobil (+52%), one of our biggest holdings. Also adding value was an outsized position in Centene, which gained 35%. We increased our allocation in the company the past 12 months. Another notable relative contributor was a larger-than-benchmark position in Cigna (+23%), where we added to our stake this period. In contrast, the biggest detractor from performance versus the benchmark was an underweighting in energy. Stock selection in consumer staples and an overweighting in communication services also hurt the portfolio's relative return, as did the fund’s foreign holdings, hampered in part by continued U.S. dollar strength. The biggest individual relative detractor was our outsized exposure to Comcast (-35%), though we increased our position in the stock. The fund's non-benchmark stake in Samsung Electronics (-29%), one of its largest holdings, proved detrimental as well. Avoiding Chevron, a benchmark component that gained 68%, further weighed on the portfolio’s relative performance. Notable changes in positioning include increased exposure to the utilities sector and a lower allocation to information technology stocks.
The views expressed above reflect those of the portfolio manager(s) only through the end of the period as stated on the cover of this report and do not necessarily represent the views of Fidelity or any other person in the Fidelity organization. Any such views are subject to change at any time based upon market or other conditions and Fidelity disclaims any responsibility to update such views. These views may not be relied on as investment advice and, because investment decisions for a Fidelity fund are based on numerous factors, may not be relied on as an indication of trading intent on behalf of any Fidelity fund.
Investment Summary (Unaudited)
Top Ten Stocks as of July 31, 2022
| | % of fund's net assets |
| Exxon Mobil Corp. | 5.9 |
| Berkshire Hathaway, Inc. Class B | 5.1 |
| Centene Corp. | 4.8 |
| Cigna Corp. | 4.8 |
| Comcast Corp. Class A | 4.4 |
| Activision Blizzard, Inc. | 3.1 |
| Samsung Electronics Co. Ltd. | 3.0 |
| UnitedHealth Group, Inc. | 2.9 |
| Verizon Communications, Inc. | 2.7 |
| PG&E Corp. | 2.4 |
| | 39.1 |
Market Sectors as of July 31, 2022
| | % of fund's net assets |
| Health Care | 21.8 |
| Financials | 17.8 |
| Utilities | 12.4 |
| Communication Services | 12.3 |
| Information Technology | 6.9 |
| Industrials | 6.7 |
| Energy | 6.7 |
| Consumer Staples | 6.0 |
| Consumer Discretionary | 3.2 |
| Materials | 2.2 |
Asset Allocation (% of fund's net assets)
| As of July 31, 2022 * |
| | Stocks | 96.0% |
| | Short-Term Investments and Net Other Assets (Liabilities) | 4.0% |

* Foreign investments - 16.2%
Geographic Diversification (% of fund's net assets)
| As of July 31, 2022 |
| | United States of America* | 83.8% |
| | United Kingdom | 5.4% |
| | Switzerland | 3.2% |
| | Korea (South) | 3.0% |
| | Canada | 1.6% |
| | France | 1.5% |
| | Bailiwick of Guernsey | 1.5% |

* Includes Short-Term investments and Net Other Assets (Liabilities).
Percentages are based on country or territory of incorporation and are adjusted for the effect of futures contracts, if applicable.
Schedule of Investments July 31, 2022
Showing Percentage of Net Assets
| Common Stocks - 93.0% | | | |
| | | Shares | Value |
| COMMUNICATION SERVICES - 12.3% | | | |
| Diversified Telecommunication Services - 2.7% | | | |
| Verizon Communications, Inc. | | 434,200 | $20,055,698 |
| Entertainment - 3.1% | | | |
| Activision Blizzard, Inc. | | 288,100 | 23,033,595 |
| Interactive Media & Services - 2.1% | | | |
| Alphabet, Inc. Class A (a) | | 134,000 | 15,586,880 |
| Media - 4.4% | | | |
| Comcast Corp. Class A | | 854,600 | 32,064,592 |
|
| TOTAL COMMUNICATION SERVICES | | | 90,740,765 |
|
| CONSUMER DISCRETIONARY - 3.2% | | | |
| Diversified Consumer Services - 1.7% | | | |
| H&R Block, Inc. | | 315,700 | 12,615,372 |
| Specialty Retail - 1.5% | | | |
| Ross Stores, Inc. | | 132,300 | 10,750,698 |
|
| TOTAL CONSUMER DISCRETIONARY | | | 23,366,070 |
|
| CONSUMER STAPLES - 6.0% | | | |
| Food Products - 2.0% | | | |
| Mondelez International, Inc. | | 227,900 | 14,594,716 |
| Household Products - 4.0% | | | |
| Reckitt Benckiser Group PLC | | 175,500 | 14,235,645 |
| Spectrum Brands Holdings, Inc. | | 92,700 | 6,446,358 |
| The Clorox Co. | | 66,400 | 9,418,176 |
| | | | 30,100,179 |
|
| TOTAL CONSUMER STAPLES | | | 44,694,895 |
|
| ENERGY - 6.7% | | | |
| Oil, Gas & Consumable Fuels - 6.7% | | | |
| Exxon Mobil Corp. | | 450,200 | 43,637,887 |
| Parex Resources, Inc. | | 333,600 | 6,210,631 |
| | | | 49,848,518 |
| FINANCIALS - 17.8% | | | |
| Banks - 7.5% | | | |
| Bank of America Corp. | | 471,400 | 15,938,034 |
| JPMorgan Chase & Co. | | 151,100 | 17,430,896 |
| M&T Bank Corp. | | 72,300 | 12,829,635 |
| PNC Financial Services Group, Inc. | | 57,000 | 9,458,580 |
| | | | 55,657,145 |
| Diversified Financial Services - 5.1% | | | |
| Berkshire Hathaway, Inc. Class B (a) | | 126,500 | 38,025,900 |
| Insurance - 5.2% | | | |
| Chubb Ltd. | | 75,200 | 14,185,728 |
| The Travelers Companies, Inc. | | 69,000 | 10,950,300 |
| Willis Towers Watson PLC | | 64,700 | 13,389,018 |
| | | | 38,525,046 |
|
| TOTAL FINANCIALS | | | 132,208,091 |
|
| HEALTH CARE - 21.8% | | | |
| Biotechnology - 0.9% | | | |
| Regeneron Pharmaceuticals, Inc. (a) | | 11,200 | 6,514,928 |
| Health Care Providers & Services - 16.4% | | | |
| Centene Corp. (a) | | 385,600 | 35,849,232 |
| Cigna Corp. | | 129,300 | 35,604,048 |
| Elevance Health, Inc. | | 33,800 | 16,125,980 |
| Humana, Inc. | | 26,700 | 12,869,400 |
| UnitedHealth Group, Inc. | | 39,500 | 21,422,430 |
| | | | 121,871,090 |
| Pharmaceuticals - 4.5% | | | |
| AstraZeneca PLC sponsored ADR | | 186,567 | 12,356,332 |
| Roche Holding AG (participation certificate) | | 30,040 | 9,973,416 |
| Sanofi SA sponsored ADR | | 224,400 | 11,152,680 |
| | | | 33,482,428 |
|
| TOTAL HEALTH CARE | | | 161,868,446 |
|
| INDUSTRIALS - 6.7% | | | |
| Aerospace & Defense - 4.0% | | | |
| Northrop Grumman Corp. | | 29,600 | 14,175,440 |
| The Boeing Co. (a) | | 97,400 | 15,516,794 |
| | | | 29,692,234 |
| Electrical Equipment - 1.3% | | | |
| Regal Rexnord Corp. | | 71,100 | 9,548,730 |
| Machinery - 1.4% | | | |
| Oshkosh Corp. | | 123,300 | 10,616,130 |
|
| TOTAL INDUSTRIALS | | | 49,857,094 |
|
| INFORMATION TECHNOLOGY - 3.9% | | | |
| IT Services - 2.7% | | | |
| Amdocs Ltd. | | 127,000 | 11,056,620 |
| Cognizant Technology Solutions Corp. Class A | | 134,500 | 9,140,620 |
| | | | 20,197,240 |
| Software - 1.2% | | | |
| NortonLifeLock, Inc. | | 342,700 | 8,406,431 |
|
| TOTAL INFORMATION TECHNOLOGY | | | 28,603,671 |
|
| MATERIALS - 2.2% | | | |
| Chemicals - 1.4% | | | |
| DuPont de Nemours, Inc. | | 164,800 | 10,090,704 |
| Metals & Mining - 0.8% | | | |
| Lundin Mining Corp. | | 1,125,200 | 6,344,105 |
|
| TOTAL MATERIALS | | | 16,434,809 |
|
| UTILITIES - 12.4% | | | |
| Electric Utilities - 11.4% | | | |
| Constellation Energy Corp. | | 249,833 | 16,513,961 |
| Evergy, Inc. | | 116,700 | 7,965,942 |
| Exelon Corp. | | 270,500 | 12,575,545 |
| NextEra Energy, Inc. | | 91,800 | 7,756,182 |
| PG&E Corp. (a) | | 1,617,200 | 17,562,792 |
| PPL Corp. | | 222,600 | 6,473,208 |
| Southern Co. | | 198,300 | 15,247,287 |
| | | | 84,094,917 |
| Independent Power and Renewable Electricity Producers - 1.0% | | | |
| The AES Corp. | | 334,900 | 7,441,478 |
|
| TOTAL UTILITIES | | | 91,536,395 |
|
| TOTAL COMMON STOCKS | | | |
| (Cost $588,314,525) | | | 689,158,754 |
|
| Nonconvertible Preferred Stocks - 3.0% | | | |
| INFORMATION TECHNOLOGY - 3.0% | | | |
| Technology Hardware, Storage & Peripherals - 3.0% | | | |
| Samsung Electronics Co. Ltd. | | | |
| (Cost $22,461,558) | | 502,300 | 21,993,295 |
|
| Money Market Funds - 3.7% | | | |
| Fidelity Cash Central Fund 2.01% (b) | | | |
| (Cost $27,866,227) | | 27,860,655 | 27,866,227 |
| TOTAL INVESTMENT IN SECURITIES - 99.7% | | | |
| (Cost $638,642,310) | | | 739,018,276 |
| NET OTHER ASSETS (LIABILITIES) - 0.3% | | | 1,966,930 |
| NET ASSETS - 100% | | | $740,985,206 |
Legend
(a) Non-income producing
(b) Affiliated fund that is generally available only to investment companies and other accounts managed by Fidelity Investments. The rate quoted is the annualized seven-day yield of the fund at period end. A complete unaudited listing of the fund's holdings as of its most recent quarter end is available upon request. In addition, each Fidelity Central Fund's financial statements, which are not covered by the Fund's Report of Independent Registered Public Accounting Firm, are available on the SEC's website or upon request.
Affiliated Central Funds
Fiscal year to date information regarding the Fund's investments in Fidelity Central Funds, including the ownership percentage, is presented below.
| Fund | Value, beginning of period | Purchases | Sales Proceeds | Dividend Income | Realized Gain/Loss | Change in Unrealized appreciation (depreciation) | Value, end of period | % ownership, end of period |
| Fidelity Cash Central Fund 2.01% | $16,453,065 | $210,315,133 | $198,901,971 | $103,254 | $-- | $-- | $27,866,227 | 0.1% |
| Fidelity Securities Lending Cash Central Fund 2.01% | 508,500 | 46,977,277 | 47,485,777 | 2,863 | -- | -- | -- | 0.0% |
| Total | $16,961,565 | $257,292,410 | $246,387,748 | $106,117 | $-- | $-- | $27,866,227 | |
Amounts in the income column in the above table include any capital gain distributions from underlying funds, which are presented in the corresponding line-item in the Statement of Operations, if applicable. Amount for Fidelity Securities Lending Cash Central Fund represents the income earned on investing cash collateral, less rebates paid to borrowers and any lending agent fees associated with the loan, plus any premium payments received for lending certain types of securities.
Investment Valuation
The following is a summary of the inputs used, as of July 31, 2022, involving the Fund's assets and liabilities carried at fair value. The inputs or methodology used for valuing securities may not be an indication of the risk associated with investing in those securities. For more information on valuation inputs, and their aggregation into the levels used below, please refer to the Investment Valuation section in the accompanying Notes to Financial Statements.
| | Valuation Inputs at Reporting Date: |
| Description | Total | Level 1 | Level 2 | Level 3 |
| Investments in Securities: | | | | |
| Equities: | | | | |
| Communication Services | $90,740,765 | $90,740,765 | $-- | $-- |
| Consumer Discretionary | 23,366,070 | 23,366,070 | -- | -- |
| Consumer Staples | 44,694,895 | 30,459,250 | 14,235,645 | -- |
| Energy | 49,848,518 | 49,848,518 | -- | -- |
| Financials | 132,208,091 | 132,208,091 | -- | -- |
| Health Care | 161,868,446 | 151,895,030 | 9,973,416 | -- |
| Industrials | 49,857,094 | 49,857,094 | -- | -- |
| Information Technology | 50,596,966 | 28,603,671 | 21,993,295 | -- |
| Materials | 16,434,809 | 16,434,809 | -- | -- |
| Utilities | 91,536,395 | 91,536,395 | -- | -- |
| Money Market Funds | 27,866,227 | 27,866,227 | -- | -- |
| Total Investments in Securities: | $739,018,276 | $692,815,920 | $46,202,356 | $-- |
See accompanying notes which are an integral part of the financial statements.
Financial Statements
Statement of Assets and Liabilities
| | | July 31, 2022 |
| Assets | | |
Investment in securities, at value — See accompanying schedule:
Unaffiliated issuers (cost $610,776,083) | $711,152,049 | |
| Fidelity Central Funds (cost $27,866,227) | 27,866,227 | |
| Total Investment in Securities (cost $638,642,310) | | $739,018,276 |
| Receivable for fund shares sold | | 1,683,134 |
| Dividends receivable | | 781,629 |
| Reclaims receivable | | 398,268 |
| Distributions receivable from Fidelity Central Funds | | 37,633 |
| Other receivables | | 30,921 |
| Total assets | | 741,949,861 |
| Liabilities | | |
| Payable for fund shares redeemed | $518,329 | |
| Accrued management fee | 287,397 | |
| Transfer agent fee payable | 91,485 | |
| Other affiliated payables | 18,933 | |
| Other payables and accrued expenses | 48,511 | |
| Total liabilities | | 964,655 |
| Net Assets | | $740,985,206 |
| Net Assets consist of: | | |
| Paid in capital | | $624,744,183 |
| Total accumulated earnings (loss) | | 116,241,023 |
| Net Assets | | $740,985,206 |
| Net Asset Value, offering price and redemption price per share ($740,985,206 ÷ 31,151,081 shares) | | $23.79 |
See accompanying notes which are an integral part of the financial statements.
Statement of Operations
| | | Year ended July 31, 2022 |
| Investment Income | | |
| Dividends | | $11,914,334 |
| Income from Fidelity Central Funds (including $2,863 from security lending) | | 106,117 |
| Total income | | 12,020,451 |
| Expenses | | |
| Management fee | | |
| Basic fee | $3,141,773 | |
| Performance adjustment | (688,420) | |
| Transfer agent fees | 957,588 | |
| Accounting fees | 217,497 | |
| Custodian fees and expenses | 16,624 | |
| Independent trustees' fees and expenses | 1,914 | |
| Registration fees | 60,878 | |
| Audit | 57,549 | |
| Legal | 2,723 | |
| Miscellaneous | 1,810 | |
| Total expenses before reductions | 3,769,936 | |
| Expense reductions | (18,641) | |
| Total expenses after reductions | | 3,751,295 |
| Net investment income (loss) | | 8,269,156 |
| Realized and Unrealized Gain (Loss) | | |
| Net realized gain (loss) on: | | |
| Investment securities: | | |
| Unaffiliated issuers | 43,551,024 | |
| Foreign currency transactions | (561) | |
| Total net realized gain (loss) | | 43,550,463 |
| Change in net unrealized appreciation (depreciation) on: | | |
| Investment securities: | | |
| Unaffiliated issuers | (27,902,510) | |
| Assets and liabilities in foreign currencies | (18,556) | |
| Total change in net unrealized appreciation (depreciation) | | (27,921,066) |
| Net gain (loss) | | 15,629,397 |
| Net increase (decrease) in net assets resulting from operations | | $23,898,553 |
See accompanying notes which are an integral part of the financial statements.
Statement of Changes in Net Assets
| | Year ended July 31, 2022 | Year ended July 31, 2021 |
| Increase (Decrease) in Net Assets | | |
| Operations | | |
| Net investment income (loss) | $8,269,156 | $6,251,929 |
| Net realized gain (loss) | 43,550,463 | (6,264,172) |
| Change in net unrealized appreciation (depreciation) | (27,921,066) | 142,840,460 |
| Net increase (decrease) in net assets resulting from operations | 23,898,553 | 142,828,217 |
| Distributions to shareholders | (7,053,848) | (4,701,233) |
| Share transactions | | |
| Proceeds from sales of shares | 365,164,911 | 195,046,443 |
| Reinvestment of distributions | 5,127,250 | 3,381,384 |
| Cost of shares redeemed | (171,960,863) | (186,531,345) |
| Net increase (decrease) in net assets resulting from share transactions | 198,331,298 | 11,896,482 |
| Total increase (decrease) in net assets | 215,176,003 | 150,023,466 |
| Net Assets | | |
| Beginning of period | 525,809,203 | 375,785,737 |
| End of period | $740,985,206 | $525,809,203 |
| Other Information | | |
| Shares | | |
| Sold | 15,508,949 | 9,600,833 |
| Issued in reinvestment of distributions | 216,360 | 185,697 |
| Redeemed | (7,331,297) | (9,106,809) |
| Net increase (decrease) | 8,394,012 | 679,721 |
See accompanying notes which are an integral part of the financial statements.
Financial Highlights
Fidelity Blue Chip Value Fund
| | | | | | |
| Years ended July 31, | 2022 | 2021 | 2020 | 2019 | 2018 |
| Selected Per–Share Data | | | | | |
| Net asset value, beginning of period | $23.11 | $17.02 | $19.71 | $19.90 | $18.85 |
| Income from Investment Operations | | | | | |
| Net investment income (loss)A,B | .33 | .27 | .31 | .32 | .26 |
| Net realized and unrealized gain (loss) | .66 | 6.03 | (2.63) | (.14)C | 1.01 |
| Total from investment operations | .99 | 6.30 | (2.32) | .18 | 1.27 |
| Distributions from net investment income | (.31) | (.21) | (.31) | (.29) | (.21) |
| Distributions from net realized gain | – | – | (.06) | (.09) | –D |
| Total distributions | (.31) | (.21) | (.37) | (.37)E | (.22)E |
| Net asset value, end of period | $23.79 | $23.11 | $17.02 | $19.71 | $19.90 |
| Total ReturnF | 4.28% | 37.36% | (12.03)% | .99%C | 6.79% |
| Ratios to Average Net AssetsB,G,H | | | | | |
| Expenses before reductions | .63% | .58% | .63% | .65% | .70% |
| Expenses net of fee waivers, if any | .63% | .58% | .63% | .65% | .70% |
| Expenses net of all reductions | .63% | .58% | .61% | .65% | .70% |
| Net investment income (loss) | 1.38% | 1.35% | 1.71% | 1.67% | 1.34% |
| Supplemental Data | | | | | |
| Net assets, end of period (000 omitted) | $740,985 | $525,809 | $375,786 | $477,706 | $393,503 |
| Portfolio turnover rateI | 41% | 52% | 119% | 44% | 45% |
A Calculated based on average shares outstanding during the period.
B Net investment income (loss) is affected by the timing of the declaration of dividends by any underlying mutual funds or exchange-traded funds (ETFs). Net investment income (loss) of any such underlying funds is not included in the Fund's net investment income (loss) ratio.
C Net realized and unrealized gain (loss) per share reflects proceeds received from litigation which amounted to $.02 per share. Excluding these litigation proceeds, the total return would have been .91%.
D Amount represents less than $.005 per share.
E Total distributions per share do not sum due to rounding.
F Total returns would have been lower if certain expenses had not been reduced during the applicable periods shown.
G Fees and expenses of any underlying mutual funds or exchange-traded funds (ETFs) are not included in the Fund's expense ratio. The Fund indirectly bears its proportionate share of these expenses. For additional expense information related to investments in Fidelity Central Funds, please refer to the "Investments in Fidelity Central Funds" note found in the Notes to Financial Statements section of the most recent Annual or Semi-Annual report.
H Expense ratios reflect operating expenses of the class. Expenses before reductions do not reflect amounts reimbursed, waived, or reduced through arrangements with the investment adviser, brokerage services, or other offset arrangements, if applicable, and do not represent the amount paid by the class during periods when reimbursements, waivers or reductions occur.
I Amount does not include the portfolio activity of any underlying mutual funds or exchange-traded funds (ETFs).
See accompanying notes which are an integral part of the financial statements.
Notes to Financial Statements
For the period ended July 31, 2022
1. Organization.
Fidelity Blue Chip Value Fund (the Fund) is a fund of Fidelity Securities Fund (the Trust) and is authorized to issue an unlimited number of shares. Share transactions on the Statement of Changes in Net Assets may contain exchanges between affiliated funds. The Trust is registered under the Investment Company Act of 1940, as amended (the 1940 Act), as an open-end management investment company organized as a Massachusetts business trust.
2. Investments in Fidelity Central Funds.
Funds may invest in Fidelity Central Funds, which are open-end investment companies generally available only to other investment companies and accounts managed by the investment adviser and its affiliates. The Schedule of Investments lists any Fidelity Central Funds held as an investment as of period end, but does not include the underlying holdings of each Fidelity Central Fund. An investing fund indirectly bears its proportionate share of the expenses of the underlying Fidelity Central Funds.
Based on its investment objective, each Fidelity Central Fund may invest or participate in various investment vehicles or strategies that are similar to those of the investing fund. These strategies are consistent with the investment objectives of the investing fund and may involve certain economic risks which may cause a decline in value of each of the Fidelity Central Funds and thus a decline in the value of the investing fund.
| Fidelity Central Fund | Investment Manager | Investment Objective | Investment Practices | Expense Ratio(a) |
| Fidelity Money Market Central Funds | Fidelity Management & Research Company LLC (FMR) | Each fund seeks to obtain a high level of current income consistent with the preservation of capital and liquidity. | Short-term Investments | Less than .005% |
(a) Expenses expressed as a percentage of average net assets and are as of each underlying Central Fund's most recent annual or semi-annual shareholder report.
A complete unaudited list of holdings for each Fidelity Central Fund is available upon request or at the Securities and Exchange Commission website at www.sec.gov. In addition, the financial statements of the Fidelity Central Funds which contain the significant accounting policies (including investment valuation policies) of those funds, and are not covered by the Report of Independent Registered Public Accounting Firm, are available on the Securities and Exchange Commission website or upon request.
3. Significant Accounting Policies.
The Fund is an investment company and applies the accounting and reporting guidance of the Financial Accounting Standards Board (FASB) Accounting Standards Codification Topic 946 Financial Services - Investment Companies. The financial statements have been prepared in conformity with accounting principles generally accepted in the United States of America (GAAP), which require management to make certain estimates and assumptions at the date of the financial statements. Actual results could differ from those estimates. Subsequent events, if any, through the date that the financial statements were issued have been evaluated in the preparation of the financial statements. The Fund's Schedule of Investments lists any underlying mutual funds or exchange-traded funds (ETFs) but does not include the underlying holdings of these funds. The following summarizes the significant accounting policies of the Fund:
Investment Valuation. Investments are valued as of 4:00 p.m. Eastern time on the last calendar day of the period. The Board of Trustees (the Board) has delegated the day to day responsibility for the valuation of the Fund's investments to the Fair Value Committee (the Committee) established by the Fund's investment adviser. In accordance with valuation policies and procedures approved by the Board, the Fund attempts to obtain prices from one or more third party pricing vendors or brokers to value its investments. When current market prices, quotations or currency exchange rates are not readily available or reliable, investments will be fair valued in good faith by the Committee, in accordance with procedures adopted by the Board. Factors used in determining fair value vary by investment type and may include market or investment specific events. The frequency with which these procedures are used cannot be predicted and they may be utilized to a significant extent. The Committee oversees the Fund's valuation policies and procedures and reports to the Board on the Committee's activities and fair value determinations. The Board monitors the appropriateness of the procedures used in valuing the Fund's investments and ratifies the fair value determinations of the Committee.
The Fund categorizes the inputs to valuation techniques used to value its investments into a disclosure hierarchy consisting of three levels as shown below:
- Level 1 – unadjusted quoted prices in active markets for identical investments
- Level 2 – other significant observable inputs (including quoted prices for similar investments, interest rates, prepayment speeds, etc.)
- Level 3 – unobservable inputs (including the Fund's own assumptions based on the best information available)
Valuation techniques used to value the Fund's investments by major category are as follows:
Equity securities, including restricted securities, for which market quotations are readily available, are valued at the last reported sale price or official closing price as reported by a third party pricing vendor on the primary market or exchange on which they are traded and are categorized as Level 1 in the hierarchy. In the event there were no sales during the day or closing prices are not available, securities are valued at the last quoted bid price or may be valued using the last available price and are generally categorized as Level 2 in the hierarchy. For foreign equity securities, when market or security specific events arise, comparisons to the valuation of American Depositary Receipts (ADRs), futures contracts, ETFs and certain indexes as well as quoted prices for similar securities may be used and would be categorized as Level 2 in the hierarchy. For equity securities, including restricted securities, where observable inputs are limited, assumptions about market activity and risk are used and these securities may be categorized as Level 3 in the hierarchy.
Investments in open-end mutual funds, including the Fidelity Central Funds, are valued at their closing net asset value (NAV) each business day and are categorized as Level 1 in the hierarchy.
Changes in valuation techniques may result in transfers in or out of an assigned level within the disclosure hierarchy. The aggregate value of investments by input level as of July 31, 2022 is included at the end of the Fund's Schedule of Investments.
Foreign Currency. Certain Funds may use foreign currency contracts to facilitate transactions in foreign-denominated securities. Gains and losses from these transactions may arise from changes in the value of the foreign currency or if the counterparties do not perform under the contracts' terms.
Foreign-denominated assets, including investment securities, and liabilities are translated into U.S. dollars at the exchange rates at period end. Purchases and sales of investment securities, income and dividends received, and expenses denominated in foreign currencies are translated into U.S. dollars at the exchange rate in effect on the transaction date.
The effects of exchange rate fluctuations on investments are included with the net realized and unrealized gain (loss) on investment securities. Other foreign currency transactions resulting in realized and unrealized gain (loss) are disclosed separately.
Investment Transactions and Income. For financial reporting purposes, the Fund's investment holdings and NAV include trades executed through the end of the last business day of the period. The NAV per share for processing shareholder transactions is calculated as of the close of business of the New York Stock Exchange (NYSE), normally 4:00 p.m. Eastern time and includes trades executed through the end of the prior business day. Gains and losses on securities sold are determined on the basis of identified cost and include proceeds received from litigation. Commissions paid to certain brokers with whom the investment adviser, or its affiliates, places trades on behalf of a fund include an amount in addition to trade execution, which may be rebated back to a fund. Any such rebates are included in net realized gain (loss) on investments in the Statement of Operations. Dividend income is recorded on the ex-dividend date, except for certain dividends from foreign securities where the ex-dividend date may have passed, which are recorded as soon as the Fund is informed of the ex-dividend date. Non-cash dividends included in dividend income, if any, are recorded at the fair market value of the securities received. Income and capital gain distributions from Fidelity Central Funds, if any, are recorded on the ex-dividend date. Certain distributions received by the Fund represent a return of capital or capital gain. The Fund determines the components of these distributions subsequent to the ex-dividend date, based upon receipt of tax filings or other correspondence relating to the underlying investment. These distributions are recorded as a reduction of cost of investments and/or as a realized gain. Investment income is recorded net of foreign taxes withheld where recovery of such taxes is uncertain. Funds may file withholding tax reclaims in certain jurisdictions to recover a portion of amounts previously withheld. Any withholding tax reclaims income is included in the Statement of Operations in dividends. Any receivables for withholding tax reclaims are included in the Statement of Assets and Liabilities in reclaims receivable.
Expenses. Expenses directly attributable to a fund are charged to that fund. Expenses attributable to more than one fund are allocated among the respective funds on the basis of relative net assets or other appropriate methods. Expenses included in the accompanying financial statements reflect the expenses of that fund and do not include any expenses associated with any underlying mutual funds or exchange-traded funds. Although not included in a fund's expenses, a fund indirectly bears its proportionate share of these expenses through the net asset value of each underlying mutual fund or exchange-traded fund. Expense estimates are accrued in the period to which they relate and adjustments are made when actual amounts are known.
Income Tax Information and Distributions to Shareholders. Each year, the Fund intends to qualify as a regulated investment company under Subchapter M of the Internal Revenue Code, including distributing substantially all of its taxable income and realized gains. As a result, no provision for U.S. Federal income taxes is required. As of July 31, 2022, the Fund did not have any unrecognized tax benefits in the financial statements; nor is the Fund aware of any tax positions for which it is reasonably possible that the total amounts of unrecognized tax benefits will significantly change in the next twelve months. The Fund files a U.S. federal tax return, in addition to state and local tax returns as required. The Fund's federal income tax returns are subject to examination by the Internal Revenue Service (IRS) for a period of three fiscal years after they are filed. State and local tax returns may be subject to examination for an additional fiscal year depending on the jurisdiction. Foreign taxes are provided for based on the Fund's understanding of the tax rules and rates that exist in the foreign markets in which it invests.
Distributions are declared and recorded on the ex-dividend date. Income and capital gain distributions are determined in accordance with income tax regulations, which may differ from GAAP. In addition, the Fund claimed a portion of the payment made to redeeming shareholders as a distribution for income tax purposes.
Capital accounts within the financial statements are adjusted for permanent book-tax differences. These adjustments have no impact on net assets or the results of operations. Capital accounts are not adjusted for temporary book-tax differences which will reverse in a subsequent period.
Book-tax differences are primarily due to foreign currency transactions, capital loss carryforwards and losses deferred due to wash sales.
As of period end, the cost and unrealized appreciation (depreciation) in securities, and derivatives if applicable, for federal income tax purposes were as follows:
| Gross unrealized appreciation | $125,016,943 |
| Gross unrealized depreciation | (24,731,768) |
| Net unrealized appreciation (depreciation) | $100,285,175 |
| Tax Cost | $638,733,101 |
The tax-based components of distributable earnings as of period end were as follows:
| Undistributed ordinary income | $4,363,148 |
| Undistributed long-term capital gain | $11,596,428 |
| Net unrealized appreciation (depreciation) on securities and other investments | $100,281,448 |
The tax character of distributions paid was as follows:
| | July 31, 2022 | July 31, 2021 |
| Ordinary Income | $7,053,848 | $ 4,701,233 |
| Total | $7,053,848 | $ 4,701,233 |
4. Purchases and Sales of Investments.
Purchases and sales of securities, other than short-term securities and in-kind transactions, as applicable, are noted in the table below.
| | Purchases ($) | Sales ($) |
| Fidelity Blue Chip Value Fund | 428,719,130 | 241,584,670 |
5. Fees and Other Transactions with Affiliates.
Management Fee. Fidelity Management & Research Company LLC (the investment adviser) and its affiliates provide the Fund with investment management related services for which the Fund pays a monthly management fee. The management fee is the sum of an individual fund fee rate that is based on an annual rate of .30% of the Fund's average net assets and an annualized group fee rate that averaged .22% during the period. The group fee rate is based upon the monthly average net assets of a group of registered investment companies with which the investment adviser has management contracts. The group fee rate decreases as assets under management increase and increases as assets under management decrease. In addition, the management fee is subject to a performance adjustment (up to a maximum of +/- .20% of the Fund's average net assets over a 36 month performance period). The upward or downward adjustment to the management fee is based on the Fund's relative investment performance as compared to its benchmark index, the Russell 1000 Value Index, over the same 36 month performance period. For the reporting period, the total annual management fee rate, including the performance adjustment, was .41% of the Fund's average net assets. The performance adjustment included in the management fee rate may be higher or lower than the maximum performance adjustment rate due to the difference between the average net assets for the reporting and performance periods.
Transfer Agent Fees. Fidelity Investments Institutional Operations Company LLC (FIIOC), an affiliate of the investment adviser, is the Fund's transfer, dividend disbursing and shareholder servicing agent. FIIOC receives account fees and asset-based fees that vary according to account size and type of account. FIIOC pays for typesetting, printing and mailing of shareholder reports, except proxy statements. For the period, the transfer agent fees were equivalent to an annual rate of .16% of average net assets.
Accounting Fees. Fidelity Service Company, Inc. (FSC), an affiliate of the investment adviser, maintains the Fund's accounting records. The accounting fee is based on the level of average net assets for each month. For the period, the fees were equivalent to the following annual rates:
| | % of Average Net Assets |
| Fidelity Blue Chip Value Fund | .04 |
Brokerage Commissions. A portion of portfolio transactions were placed with brokerage firms which are affiliates of the investment adviser. Brokerage commissions are included in net realized gain (loss) and change in net unrealized appreciation (depreciation) in the Statement of Operations. The commissions paid to these affiliated firms were as follows:
| | Amount |
| Fidelity Blue Chip Value Fund | $4,531 |
Interfund Trades. Funds may purchase from or sell securities to other Fidelity Funds under procedures adopted by the Board. The procedures have been designed to ensure these interfund trades are executed in accordance with Rule 17a-7 of the 1940 Act. Any interfund trades are included within the respective purchases and sales amounts shown in the Purchases and Sales of Investments note. Interfund trades during the period are noted in the table below.
| | Purchases ($) | Sales ($) | Realized Gain (Loss) ($) |
| Fidelity Blue Chip Value Fund | 50,486,141 | 14,487,362 | 2,737,327 |
6. Committed Line of Credit.
Certain Funds participate with other funds managed by the investment adviser or an affiliate in a $4.25 billion credit facility (the "line of credit") to be utilized for temporary or emergency purposes to fund shareholder redemptions or for other short-term liquidity purposes. The participating funds have agreed to pay commitment fees on their pro-rata portion of the line of credit, which are reflected in Miscellaneous expenses on the Statement of Operations, and are listed below. During the period, there were no borrowings on this line of credit.
| | Amount |
| Fidelity Blue Chip Value Fund | $686 |
7. Security Lending.
Funds lend portfolio securities from time to time in order to earn additional income. Lending agents are used, including National Financial Services (NFS), an affiliate of the investment adviser. Pursuant to a securities lending agreement, NFS will receive a fee, which is capped at 9.9% of a fund's daily lending revenue, for its services as lending agent. A fund may lend securities to certain qualified borrowers, including NFS. On the settlement date of the loan, a fund receives collateral (in the form of U.S. Treasury obligations, letters of credit and/or cash) against the loaned securities and maintains collateral in an amount not less than 100% of the market value of the loaned securities during the period of the loan. The market value of the loaned securities is determined at the close of business of a fund and any additional required collateral is delivered to a fund on the next business day. A fund or borrower may terminate the loan at any time, and if the borrower defaults on its obligation to return the securities loaned because of insolvency or other reasons, a fund may apply collateral received from the borrower against the obligation. A fund may experience delays and costs in recovering the securities loaned. Any cash collateral received is invested in the Fidelity Securities Lending Cash Central Fund. Any loaned securities are identified as such in the Schedule of Investments, and the value of loaned securities and cash collateral at period end, as applicable, are presented in the Statement of Assets and Liabilities. Security lending income represents the income earned on investing cash collateral, less rebates paid to borrowers and any lending agent fees associated with the loan, plus any premium payments received for lending certain types of securities. Security lending income is presented in the Statement of Operations as a component of income from Fidelity Central Funds. Affiliated security lending activity, if any, was as follows:
| | Total Security Lending Fees Paid to NFS | Security Lending Income From Securities Loaned to NFS | Value of Securities Loaned to NFS at Period End |
| Fidelity Blue Chip Value Fund | $277 | $– | $– |
8. Expense Reductions.
During the period the investment adviser or an affiliate reimbursed and/or waived a portion of operating expenses in the amount of $18,641.
9. Other.
A fund's organizational documents provide former and current trustees and officers with a limited indemnification against liabilities arising in connection with the performance of their duties to the fund. In the normal course of business, a fund may also enter into contracts that provide general indemnifications. A fund's maximum exposure under these arrangements is unknown as this would be dependent on future claims that may be made against a fund. The risk of material loss from such claims is considered remote.
10. Coronavirus (COVID-19) Pandemic.
An outbreak of COVID-19 first detected in China during December 2019 has since spread globally and was declared a pandemic by the World Health Organization during March 2020. Developments that disrupt global economies and financial markets, such as the COVID-19 pandemic, may magnify factors that affect the Fund's performance.
Report of Independent Registered Public Accounting Firm
To the Board of Trustees of Fidelity Securities Fund and Shareholders of Fidelity Blue Chip Value Fund
Opinion on the Financial Statements
We have audited the accompanying statement of assets and liabilities, including the schedule of investments, of Fidelity Blue Chip Value Fund (one of the funds constituting Fidelity Securities Fund, referred to hereafter as the “Fund”) as of July 31, 2022, the related statement of operations for the year ended July 31, 2022, the statement of changes in net assets for each of the two years in the period ended July 31, 2022, including the related notes, and the financial highlights for each of the five years in the period ended July 31, 2022 (collectively referred to as the “financial statements”). In our opinion, the financial statements present fairly, in all material respects, the financial position of the Fund as of July 31, 2022, the results of its operations for the year then ended, the changes in its net assets for each of the two years in the period ended July 31, 2022 and the financial highlights for each of the five years in the period ended July 31, 2022 in conformity with accounting principles generally accepted in the United States of America.
Basis for Opinion
These financial statements are the responsibility of the Fund’s management. Our responsibility is to express an opinion on the Fund’s financial statements based on our audits. We are a public accounting firm registered with the Public Company Accounting Oversight Board (United States) (PCAOB) and are required to be independent with respect to the Fund in accordance with the U.S. federal securities laws and the applicable rules and regulations of the Securities and Exchange Commission and the PCAOB.
We conducted our audits of these financial statements in accordance with the standards of the PCAOB. Those standards require that we plan and perform the audit to obtain reasonable assurance about whether the financial statements are free of material misstatement, whether due to error or fraud.
Our audits included performing procedures to assess the risks of material misstatement of the financial statements, whether due to error or fraud, and performing procedures that respond to those risks. Such procedures included examining, on a test basis, evidence regarding the amounts and disclosures in the financial statements. Our audits also included evaluating the accounting principles used and significant estimates made by management, as well as evaluating the overall presentation of the financial statements. Our procedures included confirmation of securities owned as of July 31, 2022 by correspondence with the custodian. We believe that our audits provide a reasonable basis for our opinion.
/s/ PricewaterhouseCoopers LLP
Boston, Massachusetts
September 15, 2022
We have served as the auditor of one or more investment companies in the Fidelity group of funds since 1932.
Trustees and Officers
The Trustees, Members of the Advisory Board (if any), and officers of the trust and fund, as applicable, are listed below. The Board of Trustees governs the fund and is responsible for protecting the interests of shareholders. The Trustees are experienced executives who meet periodically throughout the year to oversee the fund's activities, review contractual arrangements with companies that provide services to the fund, oversee management of the risks associated with such activities and contractual arrangements, and review the fund's performance. Except for Jonathan Chiel, each of the Trustees oversees 316 funds. Mr Chiel oversees 184 funds.
The Trustees hold office without limit in time except that (a) any Trustee may resign; (b) any Trustee may be removed by written instrument, signed by at least two-thirds of the number of Trustees prior to such removal; (c) any Trustee who requests to be retired or who has become incapacitated by illness or injury may be retired by written instrument signed by a majority of the other Trustees; and (d) any Trustee may be removed at any special meeting of shareholders by a two-thirds vote of the outstanding voting securities of the trust. Each Trustee who is not an interested person (as defined in the 1940 Act) of the trust and the fund is referred to herein as an Independent Trustee. Each Independent Trustee shall retire not later than the last day of the calendar year in which his or her 75th birthday occurs. The Independent Trustees may waive this mandatory retirement age policy with respect to individual Trustees. Officers and Advisory Board Members hold office without limit in time, except that any officer or Advisory Board Member may resign or may be removed by a vote of a majority of the Trustees at any regular meeting or any special meeting of the Trustees. Except as indicated, each individual has held the office shown or other offices in the same company for the past five years.
The fund’s Statement of Additional Information (SAI) includes more information about the Trustees. To request a free copy, call Fidelity at 1-800-544-8544.
Experience, Skills, Attributes, and Qualifications of the Trustees. The Governance and Nominating Committee has adopted a statement of policy that describes the experience, qualifications, attributes, and skills that are necessary and desirable for potential Independent Trustee candidates (Statement of Policy). The Board believes that each Trustee satisfied at the time he or she was initially elected or appointed a Trustee, and continues to satisfy, the standards contemplated by the Statement of Policy. The Governance and Nominating Committee also engages professional search firms to help identify potential Independent Trustee candidates who have the experience, qualifications, attributes, and skills consistent with the Statement of Policy. From time to time, additional criteria based on the composition and skills of the current Independent Trustees, as well as experience or skills that may be appropriate in light of future changes to board composition, business conditions, and regulatory or other developments, have also been considered by the professional search firms and the Governance and Nominating Committee. In addition, the Board takes into account the Trustees' commitment and participation in Board and committee meetings, as well as their leadership of standing and ad hoc committees throughout their tenure.
In determining that a particular Trustee was and continues to be qualified to serve as a Trustee, the Board has considered a variety of criteria, none of which, in isolation, was controlling. The Board believes that, collectively, the Trustees have balanced and diverse experience, qualifications, attributes, and skills, which allow the Board to operate effectively in governing the fund and protecting the interests of shareholders. Information about the specific experience, skills, attributes, and qualifications of each Trustee, which in each case led to the Board's conclusion that the Trustee should serve (or continue to serve) as a trustee of the fund, is provided below.
Board Structure and Oversight Function. Robert A. Lawrence is an interested person and currently serves as Chair. The Trustees have determined that an interested Chair is appropriate and benefits shareholders because an interested Chair has a personal and professional stake in the quality and continuity of services provided to the fund. Independent Trustees exercise their informed business judgment to appoint an individual of their choosing to serve as Chair, regardless of whether the Trustee happens to be independent or a member of management. The Independent Trustees have determined that they can act independently and effectively without having an Independent Trustee serve as Chair and that a key structural component for assuring that they are in a position to do so is for the Independent Trustees to constitute a substantial majority for the Board. The Independent Trustees also regularly meet in executive session. David M. Thomas serves as Lead Independent Trustee and as such (i) acts as a liaison between the Independent Trustees and management with respect to matters important to the Independent Trustees and (ii) with management prepares agendas for Board meetings.
Fidelity® funds are overseen by different Boards of Trustees. The fund's Board oversees Fidelity's high income and certain equity funds, and other Boards oversee Fidelity's investment-grade bond, money market, asset allocation, and other equity funds. The asset allocation funds may invest in Fidelity® funds overseen by the fund's Board. The use of separate Boards, each with its own committee structure, allows the Trustees of each group of Fidelity® funds to focus on the unique issues of the funds they oversee, including common research, investment, and operational issues. On occasion, the separate Boards establish joint committees to address issues of overlapping consequences for the Fidelity® funds overseen by each Board.
The Trustees operate using a system of committees to facilitate the timely and efficient consideration of all matters of importance to the Trustees, the fund, and fund shareholders and to facilitate compliance with legal and regulatory requirements and oversight of the fund's activities and associated risks. The Board, acting through its committees, has charged FMR and its affiliates with (i) identifying events or circumstances the occurrence of which could have demonstrably adverse effects on the fund's business and/or reputation; (ii) implementing processes and controls to lessen the possibility that such events or circumstances occur or to mitigate the effects of such events or circumstances if they do occur; and (iii) creating and maintaining a system designed to evaluate continuously business and market conditions in order to facilitate the identification and implementation processes described in (i) and (ii) above. Because the day-to-day operations and activities of the fund are carried out by or through FMR, its affiliates, and other service providers, the fund's exposure to risks is mitigated but not eliminated by the processes overseen by the Trustees. While each of the Board's committees has responsibility for overseeing different aspects of the fund's activities, oversight is exercised primarily through the Operations, Audit, and Compliance Committees. Appropriate personnel, including but not limited to the fund's Chief Compliance Officer (CCO), FMR's internal auditor, the independent accountants, the fund's Treasurer and portfolio management personnel, make periodic reports to the Board's committees, as appropriate, including an annual review of Fidelity's risk management program for the Fidelity® funds. The responsibilities of each standing committee, including their oversight responsibilities, are described further under "Standing Committees of the Trustees."
Interested Trustees*:
Correspondence intended for a Trustee who is an interested person may be sent to Fidelity Investments, 245 Summer Street, Boston, Massachusetts 02210.
Name, Year of Birth; Principal Occupations and Other Relevant Experience+
Jonathan Chiel (1957)
Year of Election or Appointment: 2016
Trustee
Mr. Chiel also serves as Trustee of other Fidelity® funds. Mr. Chiel is Executive Vice President and General Counsel for FMR LLC (diversified financial services company, 2012-present). Previously, Mr. Chiel served as general counsel (2004-2012) and senior vice president and deputy general counsel (2000-2004) for John Hancock Financial Services; a partner with Choate, Hall & Stewart (1996-2000) (law firm); and an Assistant United States Attorney for the United States Attorney’s Office of the District of Massachusetts (1986-95), including Chief of the Criminal Division (1993-1995). Mr. Chiel is a director on the boards of the Boston Bar Foundation and the Maimonides School.
Bettina Doulton (1964)
Year of Election or Appointment: 2021
Trustee
Ms. Doulton also serves as Trustee of other Fidelity® funds. Prior to her retirement, Ms. Doulton served in a variety of positions at Fidelity Investments, including as a managing director of research (2006-2007), portfolio manager to certain Fidelity® funds (1993-2005), equity analyst and portfolio assistant (1990-1993), and research assistant (1987-1990). Ms. Doulton currently owns and operates Phi Builders + Architects and Cellardoor Winery. Previously, Ms. Doulton served as a member of the Board of Brown Capital Management, LLC (2014-2018).
Robert A. Lawrence (1952)
Year of Election or Appointment: 2020
Trustee
Chair of the Board of Trustees
Mr. Lawrence also serves as Trustee of other funds. Previously, Mr. Lawrence served as a Trustee and Member of the Advisory Board of certain funds. Prior to his retirement in 2008, Mr. Lawrence served as Vice President of certain Fidelity® funds (2006-2008), Senior Vice President, Head of High Income Division of Fidelity Management & Research Company (investment adviser firm, 2006-2008), and President of Fidelity Strategic Investments (investment adviser firm, 2002-2005).
* Determined to be an “Interested Trustee” by virtue of, among other things, his or her affiliation with the trust or various entities under common control with FMR.
+ The information includes the Trustee's principal occupation during the last five years and other information relating to the experience, attributes, and skills relevant to the Trustee's qualifications to serve as a Trustee, which led to the conclusion that the Trustee should serve as a Trustee for the fund.
Independent Trustees:
Correspondence intended for an Independent Trustee may be sent to Fidelity Investments, P.O. Box 55235, Boston, Massachusetts 02205-5235.
Name, Year of Birth; Principal Occupations and Other Relevant Experience+
Thomas P. Bostick (1956)
Year of Election or Appointment: 2021
Trustee
Lieutenant General Bostick also serves as Trustee of other Fidelity® funds. Prior to his retirement, General Bostick (United States Army, Retired) held a variety of positions within the U.S. Army, including Commanding General and Chief of Engineers, U.S. Army Corps of Engineers (2012-2016) and Deputy Chief of Staff and Director of Human Resources, U.S. Army (2009-2012). General Bostick currently serves as a member of the Board and Finance and Governance Committees of CSX Corporation (transportation, 2020-present) and a member of the Board and Corporate Governance and Nominating Committee of Perma-Fix Environmental Services, Inc. (nuclear waste management, 2020-present). General Bostick serves as Chief Executive Officer of Bostick Global Strategies, LLC (consulting, 2016-present) and as a member of the Board of HireVue, Inc. (video interview and assessment, 2020-present). Previously, General Bostick served as a Member of the Advisory Board of certain Fidelity® funds (2021), President, Intrexon Bioengineering (2018-2020) and Chief Operating Officer (2017-2020) and Senior Vice President of the Environment Sector (2016-2017) of Intrexon Corporation (biopharmaceutical company).
Dennis J. Dirks (1948)
Year of Election or Appointment: 2005
Trustee
Mr. Dirks also serves as Trustee of other Fidelity® funds. Prior to his retirement in May 2003, Mr. Dirks served as Chief Operating Officer and as a member of the Board of The Depository Trust & Clearing Corporation (financial markets infrastructure), President, Chief Operating Officer and a member of the Board of The Depository Trust Company (DTC), President and a member of the Board of the National Securities Clearing Corporation (NSCC), Chief Executive Officer and a member of the Board of the Government Securities Clearing Corporation and Chief Executive Officer and a member of the Board of the Mortgage-Backed Securities Clearing Corporation. Mr. Dirks currently serves as a member of the Finance Committee (2016-present) and Board (2017-present) and is Treasurer (2018-present) of the Asolo Repertory Theatre.
Donald F. Donahue (1950)
Year of Election or Appointment: 2018
Trustee
Mr. Donahue also serves as Trustee of other Fidelity® funds. Mr. Donahue serves as President and Chief Executive Officer of Miranda Partners, LLC (risk consulting for the financial services industry, 2012-present). Previously, Mr. Donahue served as Chief Executive Officer (2006-2012), Chief Operating Officer (2003-2006) and Managing Director, Customer Marketing and Development (1999-2003) of The Depository Trust & Clearing Corporation (financial markets infrastructure). Mr. Donahue currently serves as a member (2007-present) and Co-Chairman (2016-present) of the Board of United Way of New York and a member of the Board of The Leadership Academy (previously NYC Leadership Academy) (2012-present). Mr. Donahue previously served as a member of the Advisory Board of certain Fidelity® funds (2015-2018).
Vicki L. Fuller (1957)
Year of Election or Appointment: 2020
Trustee
Ms. Fuller also serves as Trustee of other Fidelity® funds. Previously, Ms. Fuller served as a member of the Advisory Board of certain Fidelity® funds (2018-2020), Chief Investment Officer of the New York State Common Retirement Fund (2012-2018) and held a variety of positions at AllianceBernstein L.P. (global asset management, 1985-2012), including Managing Director (2006-2012) and Senior Vice President and Senior Portfolio Manager (2001-2006). Ms. Fuller currently serves as a member of the Board, Audit Committee and Nominating and Governance Committee of two Blackstone business development companies (2020-present), as a member of the Board of Treliant, LLC (consulting, 2019-present), as a member of the Advisory Board of Ariel Alternatives, LLC (private equity, 2021-present) and as a member of the Board and Chair of the Audit Committee of Gusto, Inc. (software, 2021-present). In addition, Ms. Fuller currently serves as a member of the Board of Roosevelt University (2019-present) and as a member of the Executive Board of New York University’s Stern School of Business. Ms. Fuller previously served as a member of the Board, Audit Committee and Nominating and Governance Committee of The Williams Companies, Inc. (natural gas infrastructure, 2018-2021).
Patricia L. Kampling (1959)
Year of Election or Appointment: 2020
Trustee
Ms. Kampling also serves as Trustee of other Fidelity® funds. Prior to her retirement, Ms. Kampling served as Chairman of the Board and Chief Executive Officer (2012-2019), President and Chief Operating Officer (2011-2012) and Executive Vice President and Chief Financial Officer (2010-2011) of Alliant Energy Corporation. Ms. Kampling currently serves as a member of the Board, Finance Committee and Governance, Compensation and Nominating Committee of Xcel Energy Inc. (utilities company, 2020-present) and as a member of the Board, Audit, Finance and Risk Committee and Safety, Environmental, Technology and Operations Committee and Chair of the Executive Development and Compensation Committee of American Water Works Company, Inc. (utilities company, 2019-present). In addition, Ms. Kampling currently serves as a member of the Board of the Nature Conservancy, Wisconsin Chapter (2019-present). Previously, Ms. Kampling served as a Member of the Advisory Board of certain Fidelity® funds (2020), a member of the Board, Compensation Committee and Executive Committee and Chair of the Audit Committee of Briggs & Stratton Corporation (manufacturing, 2011-2021), a member of the Board of Interstate Power and Light Company (2012-2019) and Wisconsin Power and Light Company (2012-2019) (each a subsidiary of Alliant Energy Corporation) and as a member of the Board and Workforce Development Committee of the Business Roundtable (2018-2019).
Thomas A. Kennedy (1955)
Year of Election or Appointment: 2021
Trustee
Mr. Kennedy also serves as Trustee of other Fidelity® funds. Previously, Mr. Kennedy served as a Member of the Advisory Board of certain Fidelity® funds (2020) and held a variety of positions at Raytheon Company (aerospace and defense, 1983-2020), including Chairman and Chief Executive Officer (2014-2020) and Executive Vice President and Chief Operating Officer (2013-2014). Mr. Kennedy currently serves as Executive Chairman of the Board of Directors of Raytheon Technologies Corporation (aerospace and defense, 2020-present). He is also a member of the Rutgers School of Engineering Industry Advisory Board (2011-present) and a member of the UCLA Engineering Dean’s Executive Board (2016-present).
Oscar Munoz (1959)
Year of Election or Appointment: 2021
Trustee
Mr. Munoz also serves as Trustee of other Fidelity® funds. Prior to his retirement, Mr. Munoz served as Executive Chairman (2020-2021), Chief Executive Officer (2015-2020), President (2015-2016) and a member of the Board (2010-2021) of United Airlines Holdings, Inc. Mr. Munoz currently serves as a member of the Board of CBRE Group, Inc. (commercial real estate, 2020-present), a member of the Board of Univision Communications, Inc. (Hispanic media, 2020-present) and a member of the Advisory Board of Salesforce.com, Inc. (cloud-based software, 2020-present). Previously, Mr. Munoz served as a Member of the Advisory Board of certain Fidelity® funds (2021).
Garnett A. Smith (1947)
Year of Election or Appointment: 2018
Trustee
Mr. Smith also serves as Trustee of other Fidelity® funds. Prior to his retirement, Mr. Smith served as Chairman and Chief Executive Officer (1990-1997) and President (1986-1990) of Inbrand Corp. (manufacturer of personal absorbent products). Prior to his employment with Inbrand Corp., he was employed by a retail fabric chain and North Carolina National Bank (now Bank of America). Mr. Smith previously served as a member of the Advisory Board of certain Fidelity® funds (2012-2013).
David M. Thomas (1949)
Year of Election or Appointment: 2008
Trustee
Lead Independent Trustee
Mr. Thomas also serves as Trustee of other Fidelity® funds. Previously, Mr. Thomas served as Executive Chairman (2005-2006) and Chairman and Chief Executive Officer (2000-2005) of IMS Health, Inc. (pharmaceutical and healthcare information solutions). Mr. Thomas currently serves as a member of the Board of Fortune Brands Home and Security (home and security products, 2004-present) and as Director (2013-present) and Non-Executive Chairman of the Board (2022-present) of Interpublic Group of Companies, Inc. (marketing communication).
Susan Tomasky (1953)
Year of Election or Appointment: 2020
Trustee
Ms. Tomasky also serves as Trustee of other Fidelity® funds. Prior to her retirement, Ms. Tomasky served in various executive officer positions at American Electric Power Company, Inc. (1998-2011), including most recently as President of AEP Transmission (2007-2011). Ms. Tomasky currently serves as a member of the Board and Sustainability Committee and as Chair of the Audit Committee of Marathon Petroleum Corporation (2018-present) and as a member of the Board, Executive Committee, Corporate Governance Committee and Organization and Compensation Committee and as Chair of the Audit Committee of Public Service Enterprise Group, Inc. (utilities company, 2012-present) and as a member of the Board of its subsidiary company, Public Service Electric and Gas Co. (2021-present). In addition, Ms. Tomasky currently serves as a member (2009-present) and President (2020-present) of the Board of the Royal Shakespeare Company – America (2009-present), as a member of the Board of the Columbus Association for the Performing Arts (2011-present) and as a member of the Board and Kenyon in the World Committee of Kenyon College (2016-present). Previously, Ms. Tomasky served as a Member of the Advisory Board of certain Fidelity® funds (2020), as a member of the Board of the Columbus Regional Airport Authority (2007-2020), as a member of the Board (2011-2018) and Lead Independent Director (2015-2018) of Andeavor Corporation (previously Tesoro Corporation) (independent oil refiner and marketer) and as a member of the Board of Summit Midstream Partners LP (energy, 2012-2018).
Michael E. Wiley (1950)
Year of Election or Appointment: 2020
Trustee
Mr. Wiley also serves as Trustee of other Fidelity® funds. Previously, Mr. Wiley served as a member of the Advisory Board of certain Fidelity® funds (2018-2020), Chairman, President and CEO of Baker Hughes, Inc. (oilfield services, 2000-2004). Mr. Wiley also previously served as a member of the Board of Andeavor Corporation (independent oil refiner and marketer, 2005-2018), a member of the Board of Andeavor Logistics LP (natural resources logistics, 2015-2018) and a member of the Board of High Point Resources (exploration and production, 2005-2020).
+ The information includes the Trustee's principal occupation during the last five years and other information relating to the experience, attributes, and skills relevant to the Trustee's qualifications to serve as a Trustee, which led to the conclusion that the Trustee should serve as a Trustee for the fund.
Advisory Board Members and Officers:
Correspondence intended for a Member of the Advisory Board (if any) may be sent to Fidelity Investments, P.O. Box 55235, Boston, Massachusetts 02205-5235. Correspondence intended for an officer or Peter S. Lynch may be sent to Fidelity Investments, 245 Summer Street, Boston, Massachusetts 02210. Officers appear below in alphabetical order.
Name, Year of Birth; Principal Occupation
Peter S. Lynch (1944)
Year of Election or Appointment: 2003
Member of the Advisory Board
Mr. Lynch also serves as a Member of the Advisory Board of other Fidelity® funds. Mr. Lynch is Vice Chairman and a Director of Fidelity Management & Research Company LLC (investment adviser firm). In addition, Mr. Lynch serves as a Trustee of Boston College and as the Chairman of the Inner-City Scholarship Fund. Previously, Mr. Lynch served as Vice Chairman and a Director of FMR Co., Inc. (investment adviser firm) and on the Special Olympics International Board of Directors (1997-2006).
Craig S. Brown (1977)
Year of Election or Appointment: 2019
Assistant Treasurer
Mr. Brown also serves as an officer of other funds. Mr. Brown serves as Assistant Treasurer of FIMM, LLC (2021-present) and is an employee of Fidelity Investments (2013-present).
John J. Burke III (1964)
Year of Election or Appointment: 2018
Chief Financial Officer
Mr. Burke also serves as Chief Financial Officer of other funds. Mr. Burke serves as Head of Investment Operations for Fidelity Fund and Investment Operations (2018-present) and is an employee of Fidelity Investments (1998-present). Previously Mr. Burke served as head of Asset Management Investment Operations (2012-2018).
William C. Coffey (1969)
Year of Election or Appointment: 2019
Assistant Secretary
Mr. Coffey also serves as Assistant Secretary of other funds. He is Senior Vice President and Deputy General Counsel of FMR LLC (diversified financial services company, 2010-present), and is an employee of Fidelity Investments. Previously, Mr. Coffey served as Secretary and CLO of certain funds (2018-2019); CLO, Secretary, and Senior Vice President of Fidelity Management & Research Company and FMR Co., Inc. (investment adviser firms, 2018-2019); Secretary of Fidelity SelectCo, LLC and Fidelity Investments Money Management, Inc. (investment adviser firms, 2018-2019); CLO of Fidelity Management & Research (Hong Kong) Limited, FMR Investment Management (UK) Limited, and Fidelity Management & Research (Japan) Limited (investment adviser firms, 2018-2019); and Assistant Secretary of certain funds (2009-2018).
Timothy M. Cohen (1969)
Year of Election or Appointment: 2018
Vice President
Mr. Cohen also serves as Vice President of other funds. Mr. Cohen serves as Co-Head of Equity (2018-present), a Director of Fidelity Management & Research (Japan) Limited (investment adviser firm, 2016-present), and is an employee of Fidelity Investments. Previously, Mr. Cohen served as Executive Vice President of Fidelity SelectCo, LLC (2019), Head of Global Equity Research (2016-2018), Chief Investment Officer - Equity and a Director of Fidelity Management & Research (U.K.) Inc. (investment adviser firm, 2013-2015) and as a Director of Fidelity Management & Research (Hong Kong) Limited (investment adviser firm, 2017).
Jonathan Davis (1968)
Year of Election or Appointment: 2010
Assistant Treasurer
Mr. Davis also serves as an officer of other funds. Mr. Davis serves as Assistant Treasurer of FIMM, LLC (2021-present), FMR Capital, Inc. (2017-present), FD Funds GP LLC (2021-present), FD Funds Holding LLC (2021-present), and FD Funds Management LLC (2021-present); and is an employee of Fidelity Investments. Previously, Mr. Davis served as Vice President and Associate General Counsel of FMR LLC (diversified financial services company, 2003-2010).
Laura M. Del Prato (1964)
Year of Election or Appointment: 2018
Assistant Treasurer
Ms. Del Prato also serves as an officer of other funds. Ms. Del Prato serves as Assistant Treasurer of FIMM, LLC (2021-present) and is an employee of Fidelity Investments (2017-present). Previously, Ms. Del Prato served as President and Treasurer of The North Carolina Capital Management Trust: Cash Portfolio and Term Portfolio (2018-2020). Prior to joining Fidelity Investments, Ms. Del Prato served as a Managing Director and Treasurer of the JPMorgan Mutual Funds (2014-2017). Prior to JPMorgan, Ms. Del Prato served as a partner at Cohen Fund Audit Services (accounting firm, 2012-2013) and KPMG LLP (accounting firm, 2004-2012).
Colm A. Hogan (1973)
Year of Election or Appointment: 2020
Assistant Treasurer
Mr. Hogan also serves as an officer of other funds. Mr. Hogan serves as Assistant Treasurer of FIMM, LLC (2021-present) and FMR Capital, Inc. (2017-present) and is an employee of Fidelity Investments (2005-present). Previously, Mr. Hogan served as Deputy Treasurer of certain Fidelity® funds (2016-2020) and Assistant Treasurer of certain Fidelity® funds (2016-2018).
Pamela R. Holding (1964)
Year of Election or Appointment: 2018
Vice President
Ms. Holding also serves as Vice President of other funds. Ms. Holding serves as Co-Head of Equity (2018-present) and is an employee of Fidelity Investments (2013-present). Previously, Ms. Holding served as Executive Vice President of Fidelity SelectCo, LLC (2019) and as Chief Investment Officer of Fidelity Institutional Asset Management (2013-2018).
Cynthia Lo Bessette (1969)
Year of Election or Appointment: 2019
Secretary and Chief Legal Officer (CLO)
Ms. Lo Bessette also serves as an officer of other funds. Ms. Lo Bessette serves as CLO, Secretary, and Senior Vice President of Fidelity Management & Research Company LLC (investment adviser firm, 2019-present); CLO of Fidelity Management & Research (Hong Kong) Limited, FMR Investment Management (UK) Limited, and Fidelity Management & Research (Japan) Limited (investment adviser firms, 2019-present); Secretary of FD Funds GP LLC (2021-present), FD Funds Holding LLC (2021-present), and FD Funds Management LLC (2021-present); and Assistant Secretary of FIMM, LLC (2019-present). She is a Senior Vice President and Deputy General Counsel of FMR LLC (diversified financial services company, 2019-present), and is an employee of Fidelity Investments. Previously, Ms. Lo Bessette served as CLO, Secretary, and Senior Vice President of FMR Co., Inc. (investment adviser firm, 2019); Secretary of Fidelity SelectCo, LLC and Fidelity Investments Money Management, Inc. (investment adviser firms, 2019). Prior to joining Fidelity Investments, Ms. Lo Bessette was Executive Vice President, General Counsel (2016-2019) and Senior Vice President, Deputy General Counsel (2015-2016) of OppenheimerFunds (investment management company) and Deputy Chief Legal Officer (2013-2015) of Jennison Associates LLC (investment adviser firm).
Chris Maher (1972)
Year of Election or Appointment: 2020
Deputy Treasurer
Mr. Maher also serves as an officer of other funds. Mr. Maher serves as Assistant Treasurer of FIMM, LLC (2021-present) and FMR Capital, Inc. (2017-present), and is an employee of Fidelity Investments (2008-present). Previously, Mr. Maher served as Assistant Treasurer of certain funds (2013-2020); Vice President of Asset Management Compliance (2013), Vice President of the Program Management Group of FMR (investment adviser firm, 2010-2013), and Vice President of Valuation Oversight (2008-2010).
Jason P. Pogorelec (1975)
Year of Election or Appointment: 2020
Chief Compliance Officer
Mr. Pogorelec also serves as Chief Compliance Officer of other funds. Mr. Pogorelec is a senior Vice President of Asset Management Compliance for Fidelity Investments and is an employee of Fidelity Investments (2006-present). Previously, Mr. Pogorelec served as Vice President, Associate General Counsel for Fidelity Investments (2010-2020) and Assistant Secretary of certain Fidelity funds (2015-2020).
Brett Segaloff (1972)
Year of Election or Appointment: 2021
Anti-Money Laundering (AML) Officer
Mr. Segaloff also serves as an AML Officer of other funds and other related entities. He is Director, Anti-Money Laundering (2007-present) of FMR LLC (diversified financial services company) and is an employee of Fidelity Investments (1996-present).
Stacie M. Smith (1974)
Year of Election or Appointment: 2016
President and Treasurer
Ms. Smith also serves as an officer of other funds. Ms. Smith serves as Assistant Treasurer of FIMM, LLC (2021-present) and FMR Capital, Inc. (2017-present), is an employee of Fidelity Investments (2009-present), and has served in other fund officer roles. Prior to joining Fidelity Investments, Ms. Smith served as Senior Audit Manager of Ernst & Young LLP (accounting firm, 1996-2009). Previously, Ms. Smith served as Assistant Treasurer (2013-2019) and Deputy Treasurer (2013-2016) of certain Fidelity® funds.
Jim Wegmann (1979)
Year of Election or Appointment: 2019
Assistant Treasurer
Mr. Wegmann also serves as an officer of other funds. Mr. Wegmann serves as Assistant Treasurer of FIMM, LLC (2021-present) and is an employee of Fidelity Investments (2011-present). Previously, Mr. Wegmann served as Assistant Treasurer of certain Fidelity® funds (2019-2021).
Shareholder Expense Example
As a shareholder, you incur two types of costs: (1) transaction costs, which may include sales charges (loads) on purchase payments or redemption proceeds, as applicable and (2) ongoing costs, which generally include management fees, distribution and/or service (12b-1) fees and other Fund expenses. This Example is intended to help you understand your ongoing costs (in dollars) of investing in a fund and to compare these costs with the ongoing costs of investing in other mutual funds.
The Example is based on an investment of $1,000 invested at the beginning of the period and held for the entire period (February 1, 2022 to July 31, 2022).
Actual Expenses
The first line of the accompanying table provides information about actual account values and actual expenses. You may use the information in this line, together with the amount you invested, to estimate the expenses that you paid over the period. Simply divide your account value by $1,000.00 (for example, an $8,600 account value divided by $1,000.00 = 8.6), then multiply the result by the number in the first line for a class/Fund under the heading entitled "Expenses Paid During Period" to estimate the expenses you paid on your account during this period. If any fund is a shareholder of any underlying mutual funds or exchange-traded funds (ETFs) (the Underlying Funds), such fund indirectly bears its proportional share of the expenses of the Underlying Funds in addition to the direct expenses incurred presented in the table. These fees and expenses are not included in the annualized expense ratio used to calculate the expense estimate in the table below.
Hypothetical Example for Comparison Purposes
The second line of the accompanying table provides information about hypothetical account values and hypothetical expenses based on the actual expense ratio and an assumed rate of return of 5% per year before expenses, which is not the actual return. The hypothetical account values and expenses may not be used to estimate the actual ending account balance or expenses you paid for the period. You may use this information to compare the ongoing costs of investing in the Fund and other funds. To do so, compare this 5% hypothetical example with the 5% hypothetical examples that appear in the shareholder reports of the other funds. If any fund is a shareholder of any Underlying Funds, such fund indirectly bears its proportional share of the expenses of the Underlying Funds in addition to the direct expenses as presented in the table. These fees and expenses are not included in the annualized expense ratio used to calculate the expense estimate in the table below.
Please note that the expenses shown in the table are meant to highlight your ongoing costs only and do not reflect any transaction costs. Therefore, the second line of the table is useful in comparing ongoing costs only, and will not help you determine the relative total costs of owning different funds. In addition, if these transactional costs were included, your costs would have been higher.
| | Annualized Expense Ratio-A | Beginning
Account Value
February 1, 2022 | Ending
Account Value
July 31, 2022 | Expenses Paid
During Period-B
February 1, 2022
to July 31, 2022 |
| Fidelity Blue Chip Value Fund | .67% | | | |
| Actual | | $1,000.00 | $979.40 | $3.29 |
| Hypothetical-C | | $1,000.00 | $1,021.47 | $3.36 |
A Annualized expense ratio reflects expenses net of applicable fee waivers.
B Expenses are equal to the annualized expense ratio, multiplied by the average account value over the period, multiplied by 181/ 365 (to reflect the one-half year period). The fees and expenses of any Underlying Funds are not included in each annualized expense ratio.
C 5% return per year before expenses
Distributions (Unaudited)
The dividend and capital gains distributions for the fund(s) are available on Fidelity.com or Institutional.Fidelity.com.
The fund hereby designates as a capital gain dividend with respect to the taxable year ended July 31, 2022, $13,762,177, or, if subsequently determined to be different, the net capital gain of such year.
The fund designates 100% of the dividends distributed during the fiscal year as qualifying for the dividends–received deduction for corporate shareholders.
The fund designates 100% of the dividends distributed during the fiscal year as amounts which may be taken into account as a dividend for the purposes of the maximum rate under section 1(h)(11) of the Internal Revenue Code.
The fund will notify shareholders in January 2023 of amounts for use in preparing 2022 income tax returns.
Board Approval of Investment Advisory Contracts and Management Fees
Fidelity Blue Chip Value Fund
Each year, the Board of Trustees, including the Independent Trustees (together, the Board), votes on the renewal of the management contract with Fidelity Management & Research Company LLC (FMR) and the sub-advisory agreements (together, the Advisory Contracts) for the fund. FMR and the sub-advisers are referred to herein as the Investment Advisers. The Board, assisted by the advice of fund counsel and Independent Trustees' counsel, requests and considers a broad range of information relevant to the renewal of the Advisory Contracts throughout the year.
The Board meets regularly and, at each of its meetings, covers an extensive agenda of topics and materials and considers factors that are relevant to its annual consideration of the renewal of the fund's Advisory Contracts, including the services and support provided to the fund and its shareholders. The Board has established various standing committees (Committees), each composed of and chaired by Independent Trustees with varying backgrounds, to which the Board has assigned specific subject matter responsibilities in order to enhance effective decision-making by the Board. The Board, acting directly and through its Committees, requests and receives information concerning the annual consideration of the renewal of the fund's Advisory Contracts. The Board also meets as needed to review matters specifically related to the Board's annual consideration of the renewal of the Advisory Contracts. Members of the Board may also meet with trustees of other Fidelity funds through joint ad hoc committees to discuss certain matters relevant to all of the Fidelity funds.
At its May 2022 meeting, the Board unanimously determined to renew the fund's Advisory Contracts. In reaching its determination, the Board considered all factors it believed relevant, including (i) the nature, extent, and quality of the services provided to the fund and its shareholders (including the investment performance of the fund); (ii) the competitiveness relative to peer funds of the fund's management fee and total expense ratio; (iii) the total costs of the services provided by and the profits realized by Fidelity from its relationships with the fund; and (iv) the extent to which, if any, economies of scale exist and are realized as the fund grows, and whether any economies of scale are appropriately shared with fund shareholders.
In considering whether to renew the Advisory Contracts for the fund, the Board reached a determination, with the assistance of fund counsel and Independent Trustees' counsel and through the exercise of its business judgment, that the renewal of the Advisory Contracts was in the best interests of the fund and its shareholders and that the compensation payable under the Advisory Contracts was fair and reasonable. The Board's decision to renew the Advisory Contracts was not based on any single factor, but rather was based on a comprehensive consideration of all the information provided to the Board at its meetings throughout the year. The Board, in reaching its determination to renew the Advisory Contracts, was aware that shareholders of the fund have a broad range of investment choices available to them, including a wide choice among funds offered by Fidelity's competitors, and that the fund's shareholders, who have the opportunity to review and weigh the disclosure provided by the fund in its prospectus and other public disclosures, have chosen to invest in this fund, which is part of the Fidelity family of funds.
Nature, Extent, and Quality of Services Provided. The Board considered Fidelity's staffing as it relates to the fund, including the backgrounds of investment personnel of Fidelity, and also considered the fund's investment objective, strategies, and related investment philosophy. The Independent Trustees also had discussions with senior management of Fidelity's investment operations and investment groups. The Board considered the structure of the investment personnel compensation program and whether this structure provides appropriate incentives to act in the best interests of the fund. Additionally, the Board considered the portfolio managers' investments, if any, in the funds that they manage. The Board also considered the steps Fidelity had taken to ensure the continued provision of high quality services to the Fidelity funds during the COVID-19 pandemic, including the expansion of staff in client facing positions to maintain service levels in periods of high volumes and volatility.
Resources Dedicated to Investment Management and Support Services. The Board and the Fund Oversight and Research Committees reviewed the general qualifications and capabilities of Fidelity's investment staff, including its size, education, experience, and resources, as well as Fidelity's approach to recruiting, training, managing, and compensating investment personnel. The Board noted the resources devoted to expansion of Fidelity's global investment organization, and that Fidelity's analysts have extensive resources, tools, and capabilities that allow them to conduct sophisticated quantitative and fundamental analysis, as well as credit analysis of issuers, counterparties, and guarantors. Further, the Board considered that Fidelity's investment professionals have sufficient access to global information and data so as to provide competitive investment results over time, and that those professionals also have access to sophisticated tools that permit them to assess portfolio construction and risk and performance attribution characteristics continuously, as well as to transmit new information and research conclusions rapidly around the world. Additionally, in its deliberations, the Board considered Fidelity's trading, risk management, compliance, and technology and operations capabilities and resources, which are integral parts of the investment management process.
Shareholder and Administrative Services. The Board considered (i) the nature, extent, quality, and cost of advisory, administrative, and shareholder services performed by the Investment Advisers and their affiliates under the Advisory Contracts and under separate agreements covering transfer agency, pricing and bookkeeping, and securities lending services for the fund; (ii) the nature and extent of the supervision of third party service providers, principally custodians, subcustodians, and pricing vendors; and (iii) the resources devoted to, and the record of compliance with, the fund's compliance policies and procedures. The Board also reviewed the allocation of fund brokerage, including allocations to brokers affiliated with the Investment Advisers, the use of brokerage commissions to pay fund expenses, and the use of "soft" commission dollars to pay for research services.
The Board noted that the growth of fund assets over time across the complex allows Fidelity to reinvest in the development of services designed to enhance the value and convenience of the Fidelity funds as investment vehicles. These services include 24-hour access to account information and market information over the Internet and through telephone representatives, investor education materials, and asset allocation tools. The Board also considered that it reviews customer service metrics such as telephone response times, continuity of services on the website and metrics addressing services at Fidelity Investor Centers.
Investment in a Large Fund Family. The Board considered the benefits to shareholders of investing in a Fidelity fund, including the benefits of investing in a fund that is part of a large family of funds offering a variety of investment disciplines and providing a large variety of mutual fund investor services. The Board noted that Fidelity had taken, or had made recommendations that resulted in the Fidelity funds taking, a number of actions over the previous year that benefited particular funds, including: (i) continuing to dedicate additional resources to Fidelity's investment research process, which includes meetings with management of issuers of securities in which the funds invest; (ii) continuing efforts to enhance Fidelity's global research capabilities; (iii) launching new funds and ETFs with innovative structures, strategies and pricing and making other enhancements to meet client needs; (iv) launching new share classes of existing funds; (v) eliminating purchase minimums and broadening eligibility requirements for certain funds and share classes; (vi) reducing management fees and total expenses for certain target date funds and classes and index funds; (vii) lowering expenses for certain existing funds and classes by implementing or lowering expense caps; (viii) rationalizing product lines and gaining increased efficiencies from fund mergers and liquidations; (ix) continuing to develop, acquire and implement systems and technology to improve services to the funds and shareholders, strengthen information security, and increase efficiency; and (x) continuing to implement enhancements to further strengthen Fidelity's product line to increase investors' probability of success in achieving their investment goals, including retirement income goals.
Investment Performance. The Board considered whether the fund has operated in accordance with its investment objective, as well as its record of compliance with its investment restrictions and its performance history.
The Board took into account discussions that occur at Board meetings throughout the year with representatives of the Investment Advisers about fund investment performance. In this regard the Board noted that as part of regularly scheduled fund reviews and other reports to the Board on fund performance, the Board considers annualized return information for the fund for different time periods, measured against an appropriate securities market index (benchmark index) and an appropriate peer group of funds with similar objectives (peer group). The Board also reviews and considers information about performance attribution. In its evaluation of fund investment performance, the Board gave particular attention to information indicating changes in performance of certain Fidelity funds for specific time periods and discussed with the Investment Advisers the reasons for any overperformance or underperformance.
In addition to reviewing absolute and relative fund performance, the Independent Trustees periodically consider the appropriateness of fund performance metrics in evaluating the results achieved. In general, the Independent Trustees believe that fund performance should be evaluated based on net performance (after fees and expenses) of the fund compared to appropriate benchmark indices, over appropriate time periods that may include full market cycles, and compared to peer groups, as applicable, over the same periods, taking into account relevant factors including the following: general market conditions; issuer-specific information; and fund cash flows and other factors.
The Independent Trustees recognize that shareholders evaluate performance on a net basis over their own holding periods, for which one-, three-, and five-year periods are often used as a proxy. For this reason, the performance information reviewed by the Board also included net cumulative total return information for the fund and an appropriate benchmark index and peer group for the most recent one-, three-, and five-year periods ended September 30, 2021, as shown below. Returns are shown compared to the 25th percentile (top of box, 75% beaten) and 75th percentile (bottom of box, 25% beaten) of the peer universe.
Fidelity Blue Chip Value Fund
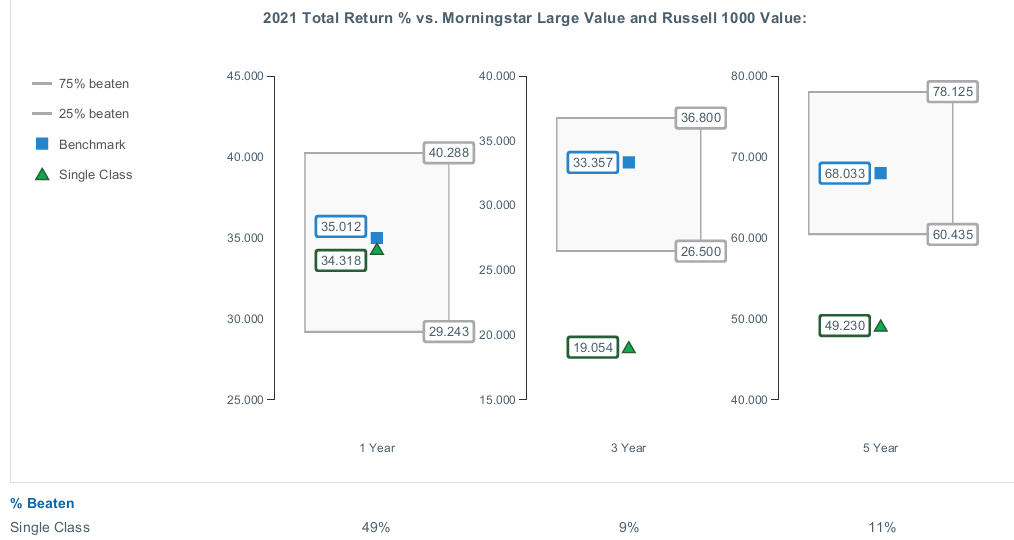
The Board considered the fund's underperformance for different time periods ended September 30, 2021 and for different time periods ended December 31, 2021 (which periods are not reflected in the chart above). The Board noted that the fund's underperformance has continued since the Board approved the management contract in January 2020 and May 2021. The Board's discussions with FMR regarding underperformance cover topics including, but not limited to: the longer-term track record of a fund's portfolio manager(s); broader trends in the market that may adversely impact a fund's performance; and attribution reports on contributors to the fund's underperformance. The Board engages with FMR on steps that might be taken to address a fund's underperformance. For a fund with underperformance over longer periods of time, the Board typically monitors the fund's performance more closely.
The Board also considered that the fund's management fee is subject to upward or downward adjustment depending upon whether, and to what extent, the fund's investment performance for the performance period (a rolling 36-month period) exceeds, or is exceeded by, a securities index, thus leading to a performance adjustment for the same period. The Board noted that the performance adjustment provides FMR with a strong economic incentive to seek to achieve superior long-term performance for the fund's shareholders and helps to more closely align the interests of FMR and the shareholders of the fund.
Based on its review, the Board concluded that the nature, extent, and quality of services provided to the fund under the Advisory Contracts should continue to benefit the shareholders of the fund.
Competitiveness of Management Fee and Total Expense Ratio. The Board considered the fund's management fee and total expense ratio compared to "mapped groups" of competitive funds and classes created for the purpose of facilitating the Trustees' competitive analysis of management fees and total expenses. Fidelity creates "mapped groups" by combining similar Lipper investment objective categories that have comparable investment mandates. Combining Lipper investment objective categories aids the Board's management fee and total expense ratio comparisons by broadening the competitive group used for comparison.
Management Fee. The Board considered two proprietary management fee comparisons for the 12-month periods ended September 30 (June 30 for periods ended 2019 and 2018 and December 31 for periods prior to 2018) shown in basis points (BP) in the chart below. The group of Lipper funds used by the Board for management fee comparisons is referred to below as the "Total Mapped Group." The Total Mapped Group comparison focuses on a fund's standing in terms of gross management fees before expense reimbursements or caps, and without giving effect to the fund's performance adjustment, relative to the total universe of funds with comparable investment mandates, regardless of whether their management fee structures also are comparable. Funds with comparable investment mandates offer exposure to similar types of securities. Funds with comparable management fee structures have similar management fee contractual arrangements (
e.g., flat rate charged for advisory services, all-inclusive fee rate,
etc.). "TMG %" represents the percentage of funds in the Total Mapped Group that had management fees that were lower than the fund's. For example, a hypothetical TMG % of 20% would mean that 80% of the funds in the Total Mapped Group had higher, and 20% had lower, management fees than the fund. The fund's actual TMG %s and the number of funds in the Total Mapped Group are in the chart below. The "Asset-Sized Peer Group" (ASPG) comparison focuses on a fund's standing relative to a subset of non-Fidelity funds within the Total Mapped Group that are similar in size and management fee structure without taking into account performance adjustments, if any. For example, if a fund is in the first quartile of the ASPG, the fund's management fee ranks in the least expensive or lowest 25% of funds in the ASPG. The ASPG represents at least 15% of the funds in the Total Mapped Group with comparable asset size and management fee structures, subject to a minimum of 50 funds (or all funds in the Total Mapped Group if fewer than 50). Additional information, such as the ASPG quartile in which the fund's management fee rate ranked and the impact of the fund's performance adjustment, is also included in the chart and was considered by the Board.
Fidelity Blue Chip Value Fund
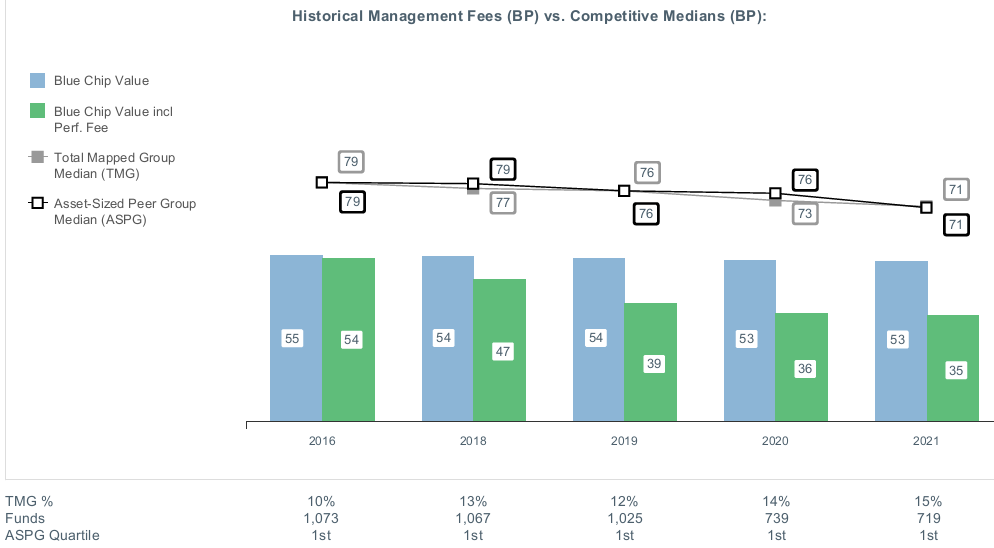
The Board noted that the fund's management fee rate ranked below the median of its Total Mapped Group and below the median of its ASPG for the 12-month period ended September 30, 2021. The Board also noted the effect of the fund's performance adjustment, if any, on the fund's management fee ranking.
The Board also considered that, for funds subject to the group fee, FMR agreed to voluntarily waive fees over a specified period of time in amounts designed to account for assets converted from certain funds to certain collective investment trusts.
Based on its review, the Board concluded that the fund's management fee is fair and reasonable in light of the services that the fund receives and the other factors considered.
Total Expense Ratio. In its review of the fund's total expense ratio, the Board considered the fund's management fee rate as well as other fund expenses, such as transfer agent fees, pricing and bookkeeping fees, and custodial, legal, and audit fees. The Board noted the impact of the fund's performance adjustment. The Board also noted that Fidelity may agree to waive fees or reimburse expenses from time to time, and the extent to which, if any, it has done so for the fund. The fund is compared to those funds and classes in the Total Mapped Group (used by the Board for management fee comparisons) that have a similar sales load structure. The Board also considered a total expense ASPG comparison for the fund, which focuses on the total expenses of the fund relative to a subset of non-Fidelity funds within the total expense similar sales load structure group. The total expense ASPG is limited to 15 larger and 15 smaller classes in fund average assets for a total of 30 classes, where possible. The total expense ASPG comparison excludes performance adjustments and fund-paid 12b-1 fees to eliminate variability in fee structures.
The Board noted that the fund's total net expense ratio ranked below the similar sales load structure group competitive median and below the ASPG competitive median for the 12-month period ended September 30, 2021.
Fees Charged to Other Fidelity Clients. The Board also considered Fidelity fee structures and other information with respect to clients of Fidelity, such as other funds advised or subadvised by Fidelity, pension plan clients, and other institutional clients with similar mandates. The Board noted that a joint ad hoc committee created by it and the boards of other Fidelity funds periodically reviews and compares Fidelity's institutional investment advisory business with its business of providing services to the Fidelity funds and also noted the most recent findings of the committee. The Board noted that the committee's review included a consideration of the differences in services provided, fees charged, and costs incurred, as well as competition in the markets serving the different categories of clients.
Based on its review of total expense ratios and fees charged to other Fidelity clients, the Board concluded that the fund's total expense ratio was reasonable in light of the services that the fund and its shareholders receive and the other factors considered.
Costs of the Services and Profitability. The Board considered the revenues earned and the expenses incurred by Fidelity in conducting the business of developing, marketing, distributing, managing, administering and servicing the fund and servicing the fund's shareholders. The Board also considered the level of Fidelity's profits in respect of all the Fidelity funds.
On an annual basis, Fidelity presents to the Board information about the profitability of its relationships with the fund. Fidelity calculates profitability information for each fund, as well as aggregate profitability information for groups of Fidelity funds and all Fidelity funds, using a series of detailed revenue and cost allocation methodologies which originate with the books and records of Fidelity on which Fidelity's audited financial statements are based. The Audit Committee of the Board reviews any significant changes from the prior year's methodologies and the full Board approves such changes.
A public accounting firm has been engaged annually by the Board as part of the Board's assessment of Fidelity's profitability analysis. The engagement includes the review and assessment of the methodologies used by Fidelity in determining the revenues and expenses attributable to Fidelity's mutual fund business, and completion of agreed-upon procedures in respect of the mathematical accuracy of certain fund profitability information and its conformity to established allocation methodologies. After considering the reports issued under the engagement and information provided by Fidelity, the Board concluded that while other allocation methods may also be reasonable, Fidelity's profitability methodologies are reasonable in all material respects.
The Board also reviewed Fidelity's non-fund businesses and potential indirect benefits such businesses may have received as a result of their association with Fidelity's mutual fund business (i.e., fall-out benefits) as well as cases where Fidelity's affiliates may benefit from the funds' business. The Board considered areas where potential indirect benefits to the Fidelity funds from their relationships with Fidelity may exist. The Board's consideration of these matters was informed by the findings of a joint ad hoc committee created by it and the boards of other Fidelity funds to evaluate potential fall-out benefits.
The Board considered the costs of the services provided by and the profits realized by Fidelity in connection with the operation of the fund and was satisfied that the profitability was not excessive.
Economies of Scale. The Board considered whether there have been economies of scale in respect of the management of the Fidelity funds, whether the Fidelity funds (including the fund) have appropriately benefited from any such economies of scale, and whether there is potential for realization of any further economies of scale. The Board considered the extent to which the fund will benefit from economies of scale as assets grow through increased services to the fund, through waivers or reimbursements, or through fee or expense ratio reductions. The Board also noted that a committee (the Economies of Scale Committee) created by it and the boards of other Fidelity funds periodically analyzes whether Fidelity attains economies of scale in respect of the management and servicing of the Fidelity funds, whether the Fidelity funds have appropriately benefited from such economies of scale, and whether there is potential for realization of any further economies of scale.
The Board recognized that the fund's management contract incorporates a "group fee" structure, which provides for lower group fee rates as total "group assets" increase, and for higher group fee rates as total "group assets" decrease ("group assets" as defined in the management contract). FMR calculates the group fee rates based on a tiered asset "breakpoint" schedule that varies based on asset class. The Board considered that the group fee is designed to deliver the benefits of economies of scale to fund shareholders when total Fidelity fund assets increase, even if assets of any particular fund are unchanged or have declined, because some portion of Fidelity's costs are attributable to services provided to all Fidelity funds, and all funds benefit if those costs can be allocated among more assets. The Board further considered that Fidelity agreed to impose a temporary fee waiver in the form of additional breakpoints to the current breakpoint schedule. The Board concluded that, given the group fee structure, fund shareholders will benefit from lower management fees as "group assets" increase at the fund complex level, regardless of whether Fidelity achieves any such economies of scale.
The Board concluded, taking into account the analysis of the Economies of Scale Committee, that economies of scale, if any, are being appropriately shared between fund shareholders and Fidelity.
Additional Information Requested by the Board. In order to develop fully the factual basis for consideration of the Fidelity funds' advisory contracts, the Board requested and received additional information on certain topics, including: (i) fund flow and performance trends, in particular the underperformance of certain funds and strategies, and Fidelity's long-term strategies for certain funds, including any consideration of fund liquidations or mergers; (ii) the operation of performance fees, competitor use of performance fees, and consideration of the expansion of performance fees to additional funds; (iii) Fidelity's pricing philosophy compared to competitors; (iv) fund profitability methodology and data; (v) evaluation of competitive fund data and peer group classifications and fee and expense comparisons; (vi) the management fee and expense structures for different funds and classes and information about the differences between various fee and expense structures; (vii) group fee breakpoints and related voluntary fee waivers; and (viii) information regarding other accounts managed by Fidelity and the funds' sub-advisory arrangements.
Based on its evaluation of all of the conclusions noted above, and after considering all factors it believed relevant, the Board concluded that the advisory fee arrangements are fair and reasonable and that the fund's Advisory Contracts should be renewed.
Liquidity Risk Management Program
The Securities and Exchange Commission adopted Rule 22e-4 under the Investment Company Act of 1940 (the Liquidity Rule) to promote effective liquidity risk management throughout the open-end investment company industry, thereby reducing the risk that funds will be unable to meet their redemption obligations and mitigating dilution of the interests of fund shareholders.
The Fund has adopted and implemented a liquidity risk management program pursuant to the Liquidity Rule (the Program) effective December 1, 2018. The Program is reasonably designed to assess and manage the Fund’s liquidity risk and to comply with the requirements of the Liquidity Rule. The Fund’s Board of Trustees (the Board) has designated the Fund’s investment adviser as administrator of the Program. The Fidelity advisers have established a Liquidity Risk Management Committee (the LRM Committee) to manage the Program for each of the Fidelity Funds. The LRM Committee monitors the adequacy and effectiveness of implementation of the Program and on a periodic basis assesses each Fund’s liquidity risk based on a variety of factors including (1) the Fund’s investment strategy, (2) portfolio liquidity and cash flow projections during normal and reasonably foreseeable stressed conditions, (3) shareholder redemptions, (4) borrowings and other funding sources and (5) in the case of exchange-traded funds, certain additional factors including the effect of the Fund’s prices and spreads, market participants, and basket compositions on the overall liquidity of the Fund’s portfolio, as applicable.
In accordance with the Program, each of the Fund’s portfolio investments is classified into one of four liquidity categories described below based on a determination of a reasonable expectation for how long it would take to convert the investment to cash (or sell or dispose of the investment) without significantly changing its market value.
- Highly liquid investments – cash or convertible to cash within three business days or less
- Moderately liquid investments – convertible to cash in three to seven calendar days
- Less liquid investments – can be sold or disposed of, but not settled, within seven calendar days
- Illiquid investments – cannot be sold or disposed of within seven calendar days
Liquidity classification determinations take into account a variety of factors including various market, trading and investment-specific considerations, as well as market depth, and generally utilize analysis from a third-party liquidity metrics service.
The Liquidity Rule places a 15% limit on a fund’s illiquid investments and requires funds that do not primarily hold assets that are highly liquid investments to determine and maintain a minimum percentage of the fund’s net assets to be invested in highly liquid investments (highly liquid investment minimum or HLIM). The Program includes provisions reasonably designed to comply with the 15% limit on illiquid investments and for determining, periodically reviewing and complying with the HLIM requirement as applicable.
At a recent meeting of the Fund’s Board of Trustees, the LRM Committee provided a written report to the Board pertaining to the operation, adequacy, and effectiveness of implementation of the Program for the annual period from December 1, 2020 through November 30, 2021. The report concluded that the Program has been implemented and is operating effectively and is reasonably designed to assess and manage the Fund’s liquidity risk.
BCV-ANN-0922
1.788861.119
Fidelity® Dividend Growth Fund
Annual Report
July 31, 2022
Contents
To view a fund's proxy voting guidelines and proxy voting record for the 12-month period ended June 30, visit http://www.fidelity.com/proxyvotingresults or visit the Securities and Exchange Commission's (SEC) web site at http://www.sec.gov.
You may also call 1-800-544-8544 if you’re an individual investing directly with Fidelity, call 1-800-835-5092 if you’re a plan sponsor or participant with Fidelity as your recordkeeper or call 1-877-208-0098 on institutional accounts or if you’re an advisor or invest through one to request a free copy of the proxy voting guidelines.
Standard & Poor's, S&P and S&P 500 are registered service marks of The McGraw-Hill Companies, Inc. and have been licensed for use by Fidelity Distributors Corporation.
Other third-party marks appearing herein are the property of their respective owners.
All other marks appearing herein are registered or unregistered trademarks or service marks of FMR LLC or an affiliated company. © 2022 FMR LLC. All rights reserved.
This report and the financial statements contained herein are submitted for the general information of the shareholders of the Fund. This report is not authorized for distribution to prospective investors in the Fund unless preceded or accompanied by an effective prospectus.
A fund files its complete schedule of portfolio holdings with the SEC for the first and third quarters of each fiscal year on Form N-PORT. Forms N-PORT are available on the SEC’s web site at http://www.sec.gov. A fund's Forms N-PORT may be reviewed and copied at the SEC’s Public Reference Room in Washington, DC. Information regarding the operation of the SEC's Public Reference Room may be obtained by calling 1-800-SEC-0330.
For a complete list of a fund's portfolio holdings, view the most recent holdings listing, semiannual report, or annual report on Fidelity's web site at http://www.fidelity.com, http://www.institutional.fidelity.com, or http://www.401k.com, as applicable.
NOT FDIC INSURED •MAY LOSE VALUE •NO BANK GUARANTEE
Neither the Fund nor Fidelity Distributors Corporation is a bank.
Notes to Shareholders:
Early in 2020, the outbreak and spread of COVID-19 emerged as a public health emergency that had a major influence on financial markets, primarily based on its impact on the global economy and corporate earnings. On March 11, 2020, the World Health Organization declared the COVID-19 outbreak a pandemic, citing sustained risk of further global spread. The pandemic prompted a number of measures to limit the spread of COVID-19, including travel and border restrictions, quarantines, and restrictions on large gatherings. In turn, these resulted in lower consumer activity, diminished demand for a wide range of products and services, disruption in manufacturing and supply chains, and – given the wide variability in outcomes regarding the outbreak – significant market uncertainty and volatility. To help stem the turmoil, the U.S. government took unprecedented action – in concert with the U.S. Federal Reserve and central banks around the world – to help support consumers, businesses, and the broader economy, and to limit disruption to the financial system.
In general, the overall impact of the pandemic lessened in 2021, amid a resilient economy and widespread distribution of three COVID-19 vaccines granted emergency use authorization from the U.S. Food and Drug Administration (FDA) early in the year. Still, the situation remains dynamic, and the extent and duration of its influence on financial markets and the economy is highly uncertain, due in part to a recent spike in cases based on highly contagious variants of the coronavirus.
Extreme events such as the COVID-19 crisis are exogenous shocks that can have significant adverse effects on mutual funds and their investments. Although multiple asset classes may be affected by market disruption, the duration and impact may not be the same for all types of assets. Fidelity is committed to helping you stay informed amid news about COVID-19 and during increased market volatility, and we continue to take extra steps to be responsive to customer needs. We encourage you to visit us online, where we offer ongoing updates, commentary, and analysis on the markets and our funds.
In July 2021, the Board of Trustees approved modifying the fund's investment policies to better reflect the focus on companies with current/historical dividends versus current/potential for dividends. On October 1, 2021, Fidelity added the Morningstar U.S. Dividend Growth Index as a supplemental benchmark to signal the fund's commitment to dividend-paying companies.
On October 1, 2021, Fidelity increased dividend distribution frequency for the fund because it includes income as a component of its investment strategy. Dividend distributions will be paid four times a year: April, July, October, and December. Quarterly dividend distributions will commence in April 2022. Please note that there are no changes to the frequency of capital gain distributions.
Performance: The Bottom Line
Average annual total return reflects the change in the value of an investment, assuming reinvestment of distributions from dividend income and capital gains (the profits earned upon the sale of securities that have grown in value, if any) and assuming a constant rate of performance each year. The hypothetical investment and the average annual total returns do not reflect the deduction of taxes that a shareholder would pay on fund distributions or the redemption of fund shares. During periods of reimbursement by Fidelity, a fund’s total return will be greater than it would be had the reimbursement not occurred. How a fund did yesterday is no guarantee of how it will do tomorrow.
Average Annual Total Returns
| For the periods ended July 31, 2022 | Past 1 year | Past 5 years | Past 10 years |
| Fidelity® Dividend Growth Fund | (2.83)% | 9.21% | 11.11% |
| Class K | (2.75)% | 9.31% | 11.24% |
$10,000 Over 10 Years
Let's say hypothetically that $10,000 was invested in Fidelity® Dividend Growth Fund, a class of the fund, on July 31, 2012.
The chart shows how the value of your investment would have changed, and also shows how the S&P 500® Index performed over the same period.
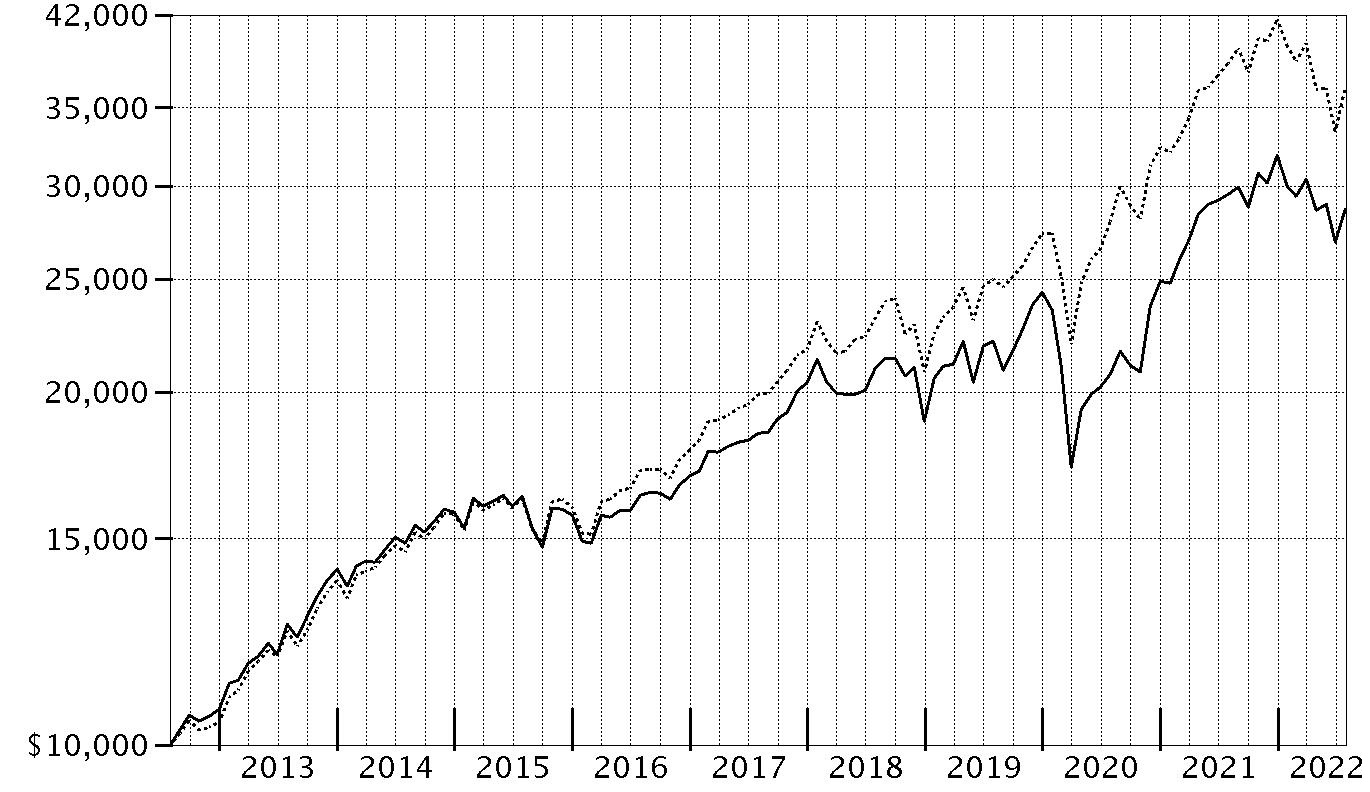
| Period Ending Values |
| $28,688 | Fidelity® Dividend Growth Fund |
| $36,428 | S&P 500® Index |
Management's Discussion of Fund Performance
Market Recap: The S&P 500
® index returned -4.64% for the 12 months ending July 31, 2022, as a multitude of crosscurrents challenged the global economy and financial markets. Persistently high inflation, exacerbated by energy price shocks from the Russia–Ukraine conflict, spurred the U.S. Federal Reserve to hike interest rates more aggressively than anticipated, and concerns about the outlook for economic growth sent stocks into bear-market territory. In early May, the Fed approved a rare half-percentage-point interest rate increase and announced plans to shrink its $9 trillion asset portfolio. June began with the Fed allowing up to billions in Treasuries and mortgage bonds to mature every month without investing the proceeds. Two weeks later, the central bank raised rates by 0.75 percentage points, its largest increase since 1994, and said it was becoming more difficult to achieve a soft landing, in which the economy slows enough to bring down inflation while avoiding a recession. Against this volatile backdrop, the S&P 500
® posted its worst first-half result (-19.96%) to begin a year since 1970. Stocks sharply reversed course in July (+9.22%), as the Fed again raised its benchmark interest rate by 0.75% but signaled that, at some point, it will likely slow the pace of tightening to assess the impact on the economy. For the full 12 months, growth-oriented communication services (-29%) and consumer discretionary (-10%) stocks lagged most. In contrast, energy (+67%) rode a surge in commodity prices and led by a wide margin, followed by the defensive utilities (+16%) and consumer staples (+7%) sectors.
Comments from Portfolio Manager Zach Turner: For the fiscal year ending July 31, 2022, the fund's share classes returned roughly -3%, outperforming the -4.64% result of the benchmark S&P 500
® index. The largest contributor to performance versus the benchmark was stock selection in the health care sector, primarily driven by the health care equipment & services industry. Also bolstering the portfolio's relative result was an underweighting and security selection among communication services stocks, along with positioning in the utilities sector. Not owning PayPal Holdings, a benchmark component that returned about -69%, was the top individual relative contributor. Adding further value on a relative basis this period was our decision to avoid Amazon.com, a sizable benchmark component that returned -19%. A smaller-than-benchmark stake in Meta Platforms (-55%) helped as well. Conversely, the largest detractor from performance versus the benchmark was security selection in industrials. Subpar investment choices among energy and materials firms also hurt. The fund's largest individual relative detractor was an underweight stake in benchmark heavyweight Apple, which gained roughly 12% the past year and was among our biggest holdings. The portfolio’s second-largest relative detractor this period was avoiding Tesla, a benchmark component that gained about 30%. Also holding back performance was our outsized exposure to Newmont, which returned roughly -41% in the portfolio. Notable changes in positioning the past 12 months include a higher allocation to the utilities and consumer staples sectors.
The views expressed above reflect those of the portfolio manager(s) only through the end of the period as stated on the cover of this report and do not necessarily represent the views of Fidelity or any other person in the Fidelity organization. Any such views are subject to change at any time based upon market or other conditions and Fidelity disclaims any responsibility to update such views. These views may not be relied on as investment advice and, because investment decisions for a Fidelity fund are based on numerous factors, may not be relied on as an indication of trading intent on behalf of any Fidelity fund.
Investment Summary (Unaudited)
Top Ten Stocks as of July 31, 2022
| | % of fund's net assets |
| Microsoft Corp. | 7.0 |
| UnitedHealth Group, Inc. | 2.3 |
| Cigna Corp. | 2.0 |
| Bristol-Myers Squibb Co. | 1.8 |
| Apple, Inc. | 1.8 |
| Verizon Communications, Inc. | 1.7 |
| Visa, Inc. Class A | 1.5 |
| Keurig Dr. Pepper, Inc. | 1.4 |
| Genpact Ltd. | 1.3 |
| The Coca-Cola Co. | 1.3 |
| | 22.1 |
Market Sectors as of July 31, 2022
| | % of fund's net assets |
| Information Technology | 21.1 |
| Health Care | 13.5 |
| Consumer Staples | 9.4 |
| Industrials | 8.6 |
| Utilities | 8.3 |
| Financials | 7.7 |
| Consumer Discretionary | 7.5 |
| Energy | 6.7 |
| Communication Services | 6.6 |
| Real Estate | 4.2 |
| Materials | 3.5 |
Asset Allocation (% of fund's net assets)
| As of July 31, 2022 * |
| | Stocks | 97.1% |
| | Short-Term Investments and Net Other Assets (Liabilities) | 2.9% |

* Foreign investments - 13.8%
Geographic Diversification (% of fund's net assets)
| As of July 31, 2022 |
| | United States of America* | 86.2% |
| | Canada | 6.1% |
| | Bermuda | 1.3% |
| | Sweden | 0.9% |
| | Bailiwick of Jersey | 0.8% |
| | India | 0.7% |
| | Spain | 0.6% |
| | Germany | 0.6% |
| | Switzerland | 0.5% |
| | Other | 2.3% |

* Includes Short-Term investments and Net Other Assets (Liabilities).
Percentages are based on country or territory of incorporation and are adjusted for the effect of futures contracts, if applicable.
Schedule of Investments July 31, 2022
Showing Percentage of Net Assets
| Common Stocks - 97.1% | | | |
| | | Shares | Value (000s) |
| COMMUNICATION SERVICES - 6.6% | | | |
| Diversified Telecommunication Services - 2.8% | | | |
| Cellnex Telecom SA (a) | | 884,500 | $39,563 |
| Deutsche Telekom AG | | 1,534,600 | 29,156 |
| Verizon Communications, Inc. | | 2,212,400 | 102,191 |
| | | | 170,910 |
| Entertainment - 1.3% | | | |
| Activision Blizzard, Inc. | | 732,200 | 58,539 |
| Electronic Arts, Inc. | | 166,500 | 21,850 |
| | | | 80,389 |
| Interactive Media & Services - 1.5% | | | |
| Alphabet, Inc. Class A (b) | | 451,400 | 52,507 |
| Meta Platforms, Inc. Class A (b) | | 265,100 | 42,177 |
| | | | 94,684 |
| Media - 1.0% | | | |
| Comcast Corp. Class A | | 1,614,592 | 60,579 |
|
| TOTAL COMMUNICATION SERVICES | | | 406,562 |
|
| CONSUMER DISCRETIONARY - 7.5% | | | |
| Diversified Consumer Services - 0.2% | | | |
| H&R Block, Inc. | | 328,000 | 13,107 |
| Hotels, Restaurants & Leisure - 2.1% | | | |
| Churchill Downs, Inc. | | 109,600 | 22,994 |
| Domino's Pizza, Inc. | | 86,700 | 33,996 |
| Expedia, Inc. (b) | | 198,400 | 21,040 |
| Hilton Worldwide Holdings, Inc. | | 64,200 | 8,222 |
| Krispy Kreme, Inc. (c) | | 585,200 | 8,357 |
| Marriott International, Inc. Class A | | 29,600 | 4,701 |
| Restaurant Brands International, Inc. (c) | | 575,400 | 30,847 |
| Starbucks Corp. | | 800 | 68 |
| | | | 130,225 |
| Household Durables - 2.0% | | | |
| D.R. Horton, Inc. | | 710,800 | 55,464 |
| Lennar Corp. Class A | | 801,000 | 68,085 |
| | | | 123,549 |
| Multiline Retail - 1.4% | | | |
| Dollar General Corp. | | 312,800 | 77,709 |
| Target Corp. | | 64,100 | 10,473 |
| | | | 88,182 |
| Specialty Retail - 1.8% | | | |
| Camping World Holdings, Inc. (c) | | 196,800 | 5,321 |
| Lowe's Companies, Inc. | | 311,200 | 59,604 |
| TJX Companies, Inc. | | 501,500 | 30,672 |
| Williams-Sonoma, Inc. (c) | | 103,900 | 15,005 |
| | | | 110,602 |
|
| TOTAL CONSUMER DISCRETIONARY | | | 465,665 |
|
| CONSUMER STAPLES - 9.4% | | | |
| Beverages - 3.6% | | | |
| Constellation Brands, Inc. Class A (sub. vtg.) | | 221,400 | 54,533 |
| Keurig Dr. Pepper, Inc. | | 2,259,100 | 87,518 |
| The Coca-Cola Co. | | 1,236,700 | 79,359 |
| | | | 221,410 |
| Food & Staples Retailing - 1.8% | | | |
| Alimentation Couche-Tard, Inc. Class A (multi-vtg.) | | 1,039,700 | 46,450 |
| Sysco Corp. | | 70,600 | 5,994 |
| Walmart, Inc. | | 431,500 | 56,980 |
| | | | 109,424 |
| Food Products - 0.7% | | | |
| Archer Daniels Midland Co. | | 164,500 | 13,616 |
| The J.M. Smucker Co. | | 223,100 | 29,521 |
| | | | 43,137 |
| Household Products - 1.2% | | | |
| Reynolds Consumer Products, Inc. (c) | | 2,109,000 | 61,288 |
| Spectrum Brands Holdings, Inc. | | 225,175 | 15,659 |
| | | | 76,947 |
| Tobacco - 2.1% | | | |
| Altria Group, Inc. | | 1,399,814 | 61,396 |
| Philip Morris International, Inc. | | 167,600 | 16,282 |
| Swedish Match Co. AB | | 5,221,700 | 54,663 |
| | | | 132,341 |
|
| TOTAL CONSUMER STAPLES | | | 583,259 |
|
| ENERGY - 6.7% | | | |
| Energy Equipment & Services - 0.3% | | | |
| Baker Hughes Co. Class A | | 648,500 | 16,660 |
| Oil, Gas & Consumable Fuels - 6.4% | | | |
| ARC Resources Ltd. | | 3,508,900 | 49,213 |
| Cameco Corp. (c) | | 693,700 | 17,877 |
| Canadian Natural Resources Ltd. (c) | | 878,100 | 48,471 |
| Cool Co. Ltd. (b) | | 958,100 | 8,861 |
| Energy Transfer LP | | 4,031,300 | 45,594 |
| Enterprise Products Partners LP | | 2,611,900 | 69,816 |
| Exxon Mobil Corp. | | 756,397 | 73,318 |
| Reliance Industries Ltd. sponsored GDR (a) | | 711,400 | 44,889 |
| Viper Energy Partners LP | | 1,262,722 | 38,816 |
| | | | 396,855 |
|
| TOTAL ENERGY | | | 413,515 |
|
| FINANCIALS - 7.7% | | | |
| Banks - 1.7% | | | |
| Bank of America Corp. | | 826,500 | 27,944 |
| Wells Fargo & Co. | | 1,780,493 | 78,110 |
| | | | 106,054 |
| Capital Markets - 2.5% | | | |
| BlackRock, Inc. Class A | | 47,600 | 31,853 |
| Brookfield Asset Management, Inc. Class A | | 500,400 | 24,845 |
| Intercontinental Exchange, Inc. | | 688,100 | 70,179 |
| S&P Global, Inc. | | 72,468 | 27,315 |
| | | | 154,192 |
| Diversified Financial Services - 0.4% | | | |
| Apollo Global Management, Inc. (c) | | 467,600 | 26,700 |
| Insurance - 3.1% | | | |
| Arthur J. Gallagher & Co. | | 420,300 | 75,229 |
| Brookfield Asset Management Reinsurance Partners Ltd. | | 2,825 | 140 |
| Marsh & McLennan Companies, Inc. | | 270,900 | 44,417 |
| The Travelers Companies, Inc. | | 453,800 | 72,018 |
| | | | 191,804 |
|
| TOTAL FINANCIALS | | | 478,750 |
|
| HEALTH CARE - 13.5% | | | |
| Biotechnology - 0.5% | | | |
| AbbVie, Inc. | | 205,500 | 29,491 |
| Health Care Equipment & Supplies - 1.0% | | | |
| Baxter International, Inc. | | 426,300 | 25,007 |
| Becton, Dickinson & Co. | | 142,400 | 34,790 |
| | | | 59,797 |
| Health Care Providers & Services - 6.1% | | | |
| Cigna Corp. | | 439,000 | 120,883 |
| CVS Health Corp. | | 416,700 | 39,870 |
| Humana, Inc. | | 145,600 | 70,179 |
| UnitedHealth Group, Inc. | | 267,006 | 144,808 |
| | | | 375,740 |
| Life Sciences Tools & Services - 1.5% | | | |
| Danaher Corp. | | 66,600 | 19,412 |
| Thermo Fisher Scientific, Inc. | | 127,400 | 76,237 |
| | | | 95,649 |
| Pharmaceuticals - 4.4% | | | |
| AstraZeneca PLC (United Kingdom) | | 174,500 | 22,954 |
| Bristol-Myers Squibb Co. | | 1,541,800 | 113,754 |
| Eli Lilly & Co. | | 182,200 | 60,070 |
| Merck KGaA | | 20,200 | 3,847 |
| Perrigo Co. PLC | | 361,800 | 15,149 |
| Pfizer, Inc. | | 237,900 | 12,016 |
| Roche Holding AG (participation certificate) | | 96,260 | 31,959 |
| Sanofi SA | | 99,200 | 9,858 |
| UCB SA | | 63,800 | 4,975 |
| | | | 274,582 |
|
| TOTAL HEALTH CARE | | | 835,259 |
|
| INDUSTRIALS - 8.6% | | | |
| Aerospace & Defense - 2.1% | | | |
| Airbus Group NV | | 114,100 | 12,302 |
| L3Harris Technologies, Inc. | | 76,200 | 18,286 |
| Lockheed Martin Corp. | | 44,300 | 18,332 |
| Northrop Grumman Corp. | | 98,900 | 47,363 |
| The Boeing Co. (b) | | 213,500 | 34,013 |
| | | | 130,296 |
| Air Freight & Logistics - 0.2% | | | |
| United Parcel Service, Inc. Class B | | 78,800 | 15,357 |
| Airlines - 0.1% | | | |
| Copa Holdings SA Class A (b)(c) | | 70,600 | 4,746 |
| Building Products - 0.1% | | | |
| Fortune Brands Home & Security, Inc. | | 124,900 | 8,703 |
| Commercial Services & Supplies - 0.9% | | | |
| GFL Environmental, Inc. | | 2,012,700 | 55,703 |
| Industrial Conglomerates - 1.4% | | | |
| General Electric Co. | | 957,850 | 70,795 |
| Hitachi Ltd. | | 257,800 | 13,052 |
| | | | 83,847 |
| Machinery - 2.2% | | | |
| Allison Transmission Holdings, Inc. | | 1,620,202 | 67,838 |
| Caterpillar, Inc. | | 58,100 | 11,518 |
| Deere & Co. | | 105,400 | 36,171 |
| Fortive Corp. | | 133,300 | 8,591 |
| Toro Co. | | 137,100 | 11,789 |
| | | | 135,907 |
| Marine - 0.2% | | | |
| 2020 Bulkers Ltd. (d) | | 1,128,200 | 13,190 |
| Professional Services - 0.5% | | | |
| Equifax, Inc. | | 122,300 | 25,550 |
| Leidos Holdings, Inc. | | 63,300 | 6,773 |
| | | | 32,323 |
| Road & Rail - 0.9% | | | |
| Canadian Pacific Railway Ltd. (c) | | 417,800 | 32,952 |
| TFI International, Inc. (Canada) | | 226,100 | 22,583 |
| | | | 55,535 |
|
| TOTAL INDUSTRIALS | | | 535,607 |
|
| INFORMATION TECHNOLOGY - 21.1% | | | |
| Electronic Equipment & Components - 0.2% | | | |
| Jabil, Inc. | | 247,000 | 14,657 |
| Vontier Corp. | | 6,702 | 173 |
| | | | 14,830 |
| IT Services - 6.0% | | | |
| Cognizant Technology Solutions Corp. Class A | | 380,800 | 25,879 |
| DXC Technology Co. (b) | | 266,500 | 8,421 |
| Fidelity National Information Services, Inc. | | 559,300 | 57,138 |
| Genpact Ltd. | | 1,656,000 | 79,620 |
| Global Payments, Inc. | | 115,600 | 14,140 |
| MasterCard, Inc. Class A | | 63,200 | 22,360 |
| SS&C Technologies Holdings, Inc. | | 1,212,200 | 71,726 |
| Visa, Inc. Class A | | 452,100 | 95,895 |
| | | | 375,179 |
| Semiconductors & Semiconductor Equipment - 3.8% | | | |
| Broadcom, Inc. | | 83,500 | 44,713 |
| KLA Corp. | | 45,900 | 17,604 |
| Lam Research Corp. | | 39,800 | 19,920 |
| Marvell Technology, Inc. | | 1,299,600 | 72,362 |
| Microchip Technology, Inc. | | 82,700 | 5,695 |
| NVIDIA Corp. | | 187,300 | 34,019 |
| NXP Semiconductors NV | | 84,400 | 15,519 |
| Teradyne, Inc. | | 221,300 | 22,327 |
| Universal Display Corp. | | 35,400 | 4,087 |
| | | | 236,246 |
| Software - 8.9% | | | |
| Intuit, Inc. | | 149,300 | 68,106 |
| Microsoft Corp. | | 1,550,200 | 435,206 |
| Oracle Corp. | | 625,400 | 48,681 |
| | | | 551,993 |
| Technology Hardware, Storage & Peripherals - 2.2% | | | |
| Apple, Inc. | | 677,272 | 110,063 |
| Samsung Electronics Co. Ltd. | | 502,690 | 23,706 |
| | | | 133,769 |
|
| TOTAL INFORMATION TECHNOLOGY | | | 1,312,017 |
|
| MATERIALS - 3.5% | | | |
| Chemicals - 1.3% | | | |
| CF Industries Holdings, Inc. | | 257,100 | 24,550 |
| Valvoline, Inc. | | 1,645,800 | 53,028 |
| | | | 77,578 |
| Metals & Mining - 2.2% | | | |
| Barrick Gold Corp. | | 769,200 | 12,107 |
| Freeport-McMoRan, Inc. | | 844,700 | 26,650 |
| Glencore Xstrata PLC | | 9,375,700 | 53,139 |
| Newmont Corp. | | 1,051,300 | 47,603 |
| | | | 139,499 |
|
| TOTAL MATERIALS | | | 217,077 |
|
| REAL ESTATE - 4.2% | | | |
| Equity Real Estate Investment Trusts (REITs) - 4.2% | | | |
| American Tower Corp. | | 226,900 | 61,451 |
| Crown Castle International Corp. | | 130,000 | 23,486 |
| CubeSmart | | 283,200 | 12,990 |
| Digital Realty Trust, Inc. | | 279,800 | 37,060 |
| Four Corners Property Trust, Inc. | | 1,029,500 | 30,092 |
| National Retail Properties, Inc. | | 508,300 | 24,200 |
| Park Hotels & Resorts, Inc. | | 770,300 | 12,009 |
| Public Storage | | 65,400 | 21,347 |
| Simon Property Group, Inc. | | 326,000 | 35,417 |
| | | | 258,052 |
| UTILITIES - 8.3% | | | |
| Electric Utilities - 4.3% | | | |
| Constellation Energy Corp. | | 233,576 | 15,439 |
| Duke Energy Corp. | | 85,200 | 9,366 |
| Edison International | | 973,700 | 65,988 |
| Exelon Corp. | | 1,263,330 | 58,732 |
| FirstEnergy Corp. | | 844,800 | 34,721 |
| NextEra Energy, Inc. | | 298,300 | 25,203 |
| PG&E Corp. (b) | | 283,324 | 3,077 |
| Southern Co. | | 733,400 | 56,391 |
| | | | 268,917 |
| Gas Utilities - 0.5% | | | |
| Brookfield Infrastructure Corp. A Shares | | 643,200 | 29,465 |
| Independent Power and Renewable Electricity Producers - 1.8% | | | |
| NextEra Energy Partners LP | | 484,200 | 40,063 |
| The AES Corp. | | 2,339,200 | 51,977 |
| Vistra Corp. | | 894,300 | 23,118 |
| | | | 115,158 |
| Multi-Utilities - 1.7% | | | |
| CenterPoint Energy, Inc. | | 1,804,700 | 57,191 |
| Dominion Energy, Inc. | | 557,800 | 45,728 |
| | | | 102,919 |
|
| TOTAL UTILITIES | | | 516,459 |
|
| TOTAL COMMON STOCKS | | | |
| (Cost $5,145,265) | | | 6,022,222 |
|
| Money Market Funds - 4.7% | | | |
| Fidelity Cash Central Fund 2.01% (e) | | 176,891,293 | 176,927 |
| Fidelity Securities Lending Cash Central Fund 2.01% (e)(f) | | 114,731,938 | 114,743 |
| TOTAL MONEY MARKET FUNDS | | | |
| (Cost $291,670) | | | 291,670 |
| TOTAL INVESTMENT IN SECURITIES - 101.8% | | | |
| (Cost $5,436,935) | | | 6,313,892 |
| NET OTHER ASSETS (LIABILITIES) - (1.8)% | | | (110,476) |
| NET ASSETS - 100% | | | $6,203,416 |
Legend
(a) Security exempt from registration under Rule 144A of the Securities Act of 1933. These securities may be resold in transactions exempt from registration, normally to qualified institutional buyers. At the end of the period, the value of these securities amounted to $84,452,000 or 1.4% of net assets.
(b) Non-income producing
(c) Security or a portion of the security is on loan at period end.
(d) Affiliated company
(e) Affiliated fund that is generally available only to investment companies and other accounts managed by Fidelity Investments. The rate quoted is the annualized seven-day yield of the fund at period end. A complete unaudited listing of the fund's holdings as of its most recent quarter end is available upon request. In addition, each Fidelity Central Fund's financial statements, which are not covered by the Fund's Report of Independent Registered Public Accounting Firm, are available on the SEC's website or upon request.
(f) Investment made with cash collateral received from securities on loan.
Affiliated Central Funds
Fiscal year to date information regarding the Fund's investments in Fidelity Central Funds, including the ownership percentage, is presented below.
| Fund (Amounts in thousands) | Value, beginning of period | Purchases | Sales Proceeds | Dividend Income | Realized Gain/Loss | Change in Unrealized appreciation (depreciation) | Value, end of period | % ownership, end of period |
| Fidelity Cash Central Fund 2.01% | $3,046 | $989,306 | $815,425 | $669 | $-- | $-- | $176,927 | 0.3% |
| Fidelity Securities Lending Cash Central Fund 2.01% | 62,875 | 1,103,235 | 1,051,367 | 488 | -- | -- | 114,743 | 0.3% |
| Total | $65,921 | $2,092,541 | $1,866,792 | $1,157 | $-- | $-- | $291,670 | |
Amounts in the income column in the above table include any capital gain distributions from underlying funds, which are presented in the corresponding line-item in the Statement of Operations, if applicable. Amount for Fidelity Securities Lending Cash Central Fund represents the income earned on investing cash collateral, less rebates paid to borrowers and any lending agent fees associated with the loan, plus any premium payments received for lending certain types of securities.
Other Affiliated Issuers
An affiliated company is a company in which the Fund has ownership of at least 5% of the voting securities. Fiscal year to date transactions with companies which are or were affiliates are presented in the table below. Certain corporate actions, such as mergers, are excluded from the amounts in this table if applicable.
| Affiliate (Amounts in thousands) | Value, beginning of period | Purchases | Sales Proceeds | Dividend Income | Realized Gain (loss) | Change in Unrealized appreciation (depreciation) | Value, end of period |
| 2020 Bulkers Ltd. | $-- | $13,411 | $-- | $1,681 | $-- | $(221) | $13,190 |
| Total | $-- | $13,411 | $-- | $1,681 | $-- | $(221) | $13,190 |
Investment Valuation
The following is a summary of the inputs used, as of July 31, 2022, involving the Fund's assets and liabilities carried at fair value. The inputs or methodology used for valuing securities may not be an indication of the risk associated with investing in those securities. For more information on valuation inputs, and their aggregation into the levels used below, please refer to the Investment Valuation section in the accompanying Notes to Financial Statements.
| | Valuation Inputs at Reporting Date: |
| Description | Total | Level 1 | Level 2 | Level 3 |
| (Amounts in thousands) | | | | |
| Investments in Securities: | | | | |
| Equities: | | | | |
| Communication Services | $406,562 | $337,843 | $68,719 | $-- |
| Consumer Discretionary | 465,665 | 465,665 | -- | -- |
| Consumer Staples | 583,259 | 528,596 | 54,663 | -- |
| Energy | 413,515 | 413,515 | -- | -- |
| Financials | 478,750 | 478,750 | -- | -- |
| Health Care | 835,259 | 766,641 | 68,618 | -- |
| Industrials | 535,607 | 510,253 | 25,354 | -- |
| Information Technology | 1,312,017 | 1,288,311 | 23,706 | -- |
| Materials | 217,077 | 163,938 | 53,139 | -- |
| Real Estate | 258,052 | 258,052 | -- | -- |
| Utilities | 516,459 | 516,459 | -- | -- |
| Money Market Funds | 291,670 | 291,670 | -- | -- |
| Total Investments in Securities: | $6,313,892 | $6,019,693 | $294,199 | $-- |
See accompanying notes which are an integral part of the financial statements.
Financial Statements
Statement of Assets and Liabilities
| Amounts in thousands (except per-share amounts) | | July 31, 2022 |
| Assets | | |
Investment in securities, at value (including securities loaned of $114,313) — See accompanying schedule:
Unaffiliated issuers (cost $5,131,854) | $6,009,032 | |
| Fidelity Central Funds (cost $291,670) | 291,670 | |
| Other affiliated issuers (cost $13,411) | 13,190 | |
| Total Investment in Securities (cost $5,436,935) | | $6,313,892 |
| Cash | | 1,147 |
| Foreign currency held at value (cost $209) | | 209 |
| Receivable for investments sold | | 14,723 |
| Receivable for fund shares sold | | 1,279 |
| Dividends receivable | | 8,876 |
| Distributions receivable from Fidelity Central Funds | | 317 |
| Other receivables | | 592 |
| Total assets | | 6,341,035 |
| Liabilities | | |
| Payable for investments purchased | $17,810 | |
| Payable for fund shares redeemed | 2,404 | |
| Accrued management fee | 1,509 | |
| Other affiliated payables | 729 | |
| Other payables and accrued expenses | 428 | |
| Collateral on securities loaned | 114,739 | |
| Total liabilities | | 137,619 |
| Net Assets | | $6,203,416 |
| Net Assets consist of: | | |
| Paid in capital | | $4,792,026 |
| Total accumulated earnings (loss) | | 1,411,390 |
| Net Assets | | $6,203,416 |
| Net Asset Value and Maximum Offering Price | | |
| Dividend Growth: | | |
| Net Asset Value, offering price and redemption price per share ($5,660,951 ÷ 172,491 shares) | | $32.82 |
| Class K: | | |
| Net Asset Value, offering price and redemption price per share ($542,465 ÷ 16,554 shares) | | $32.77 |
See accompanying notes which are an integral part of the financial statements.
Statement of Operations
| Amounts in thousands | | Year ended July 31, 2022 |
| Investment Income | | |
| Dividends (including $1,681 earned from other affiliated issuers) | | $112,805 |
| Income from Fidelity Central Funds (including $488 from security lending) | | 1,157 |
| Total income | | 113,962 |
| Expenses | | |
| Management fee | | |
| Basic fee | $34,414 | |
| Performance adjustment | (13,258) | |
| Transfer agent fees | 8,038 | |
| Accounting fees | 1,124 | |
| Custodian fees and expenses | 101 | |
| Independent trustees' fees and expenses | 22 | |
| Registration fees | 84 | |
| Audit | 70 | |
| Legal | 10 | |
| Interest | 4 | |
| Miscellaneous | 21 | |
| Total expenses before reductions | 30,630 | |
| Expense reductions | (206) | |
| Total expenses after reductions | | 30,424 |
| Net investment income (loss) | | 83,538 |
| Realized and Unrealized Gain (Loss) | | |
| Net realized gain (loss) on: | | |
| Investment securities: | | |
| Unaffiliated issuers | 672,975 | |
| Foreign currency transactions | 158 | |
| Total net realized gain (loss) | | 673,133 |
| Change in net unrealized appreciation (depreciation) on: | | |
| Investment securities: | | |
| Unaffiliated issuers | (939,809) | |
| Affiliated issuers | (221) | |
| Assets and liabilities in foreign currencies | (172) | |
| Total change in net unrealized appreciation (depreciation) | | (940,202) |
| Net gain (loss) | | (267,069) |
| Net increase (decrease) in net assets resulting from operations | | $(183,531) |
See accompanying notes which are an integral part of the financial statements.
Statement of Changes in Net Assets
| Amounts in thousands | Year ended July 31, 2022 | Year ended July 31, 2021 |
| Increase (Decrease) in Net Assets | | |
| Operations | | |
| Net investment income (loss) | $83,538 | $87,646 |
| Net realized gain (loss) | 673,133 | 407,543 |
| Change in net unrealized appreciation (depreciation) | (940,202) | 1,823,885 |
| Net increase (decrease) in net assets resulting from operations | (183,531) | 2,319,074 |
| Distributions to shareholders | (571,295) | (129,527) |
| Share transactions - net increase (decrease) | 37,007 | (1,180,808) |
| Total increase (decrease) in net assets | (717,819) | 1,008,739 |
| Net Assets | | |
| Beginning of period | 6,921,235 | 5,912,496 |
| End of period | $6,203,416 | $6,921,235 |
See accompanying notes which are an integral part of the financial statements.
Financial Highlights
Fidelity Dividend Growth Fund
| Years ended July 31, | 2022 | 2021 | 2020 | 2019 | 2018 |
| Selected Per–Share Data | | | | | |
| Net asset value, beginning of period | $36.80 | $26.38 | $29.59 | $33.79 | $35.06 |
| Income from Investment Operations | | | | | |
| Net investment income (loss)A,B | .44 | .42 | .58 | .59 | .65 |
| Net realized and unrealized gain (loss) | (1.37) | 10.59 | (2.29) | 1.01C | 3.72 |
| Total from investment operations | (.93) | 11.01 | (1.71) | 1.60 | 4.37 |
| Distributions from net investment income | (.55) | (.59) | (.49) | (.60) | (.60) |
| Distributions from net realized gain | (2.50) | – | (1.01) | (5.20) | (5.04) |
| Total distributions | (3.05) | (.59) | (1.50) | (5.80) | (5.64) |
| Net asset value, end of period | $32.82 | $36.80 | $26.38 | $29.59 | $33.79 |
| Total ReturnD | (2.83)% | 42.42% | (6.24)% | 5.38%C | 13.60% |
| Ratios to Average Net AssetsB,E,F | | | | | |
| Expenses before reductions | .48% | .49% | .49% | .50% | .50% |
| Expenses net of fee waivers, if any | .47% | .49% | .49% | .50% | .50% |
| Expenses net of all reductions | .47% | .48% | .48% | .49% | .49% |
| Net investment income (loss) | 1.27% | 1.31% | 2.11% | 2.05% | 1.94% |
| Supplemental Data | | | | | |
| Net assets, end of period (in millions) | $5,661 | $6,114 | $4,685 | $5,728 | $6,055 |
| Portfolio turnover rateG | 52% | 93% | 69% | 101% | 115% |
A Calculated based on average shares outstanding during the period.
B Net investment income (loss) is affected by the timing of the declaration of dividends by any underlying mutual funds or exchange-traded funds (ETFs). Net investment income (loss) of any such underlying funds is not included in the Fund's net investment income (loss) ratio.
C Net realized and unrealized gain (loss) per share reflects proceeds received from litigation which amounted to $.05 per share. Excluding these litigation proceeds, the total return would have been 5.19%.
D Total returns would have been lower if certain expenses had not been reduced during the applicable periods shown.
E Fees and expenses of any underlying mutual funds or exchange-traded funds (ETFs) are not included in the Fund's expense ratio. The Fund indirectly bears its proportionate share of these expenses. For additional expense information related to investments in Fidelity Central Funds, please refer to the "Investments in Fidelity Central Funds" note found in the Notes to Financial Statements section of the most recent Annual or Semi-Annual report.
F Expense ratios reflect operating expenses of the class. Expenses before reductions do not reflect amounts reimbursed, waived, or reduced through arrangements with the investment adviser, brokerage services, or other offset arrangements, if applicable, and do not represent the amount paid by the class during periods when reimbursements, waivers or reductions occur.
G Amount does not include the portfolio activity of any underlying mutual funds or exchange-traded funds (ETFs).
See accompanying notes which are an integral part of the financial statements.
Fidelity Dividend Growth Fund Class K
| Years ended July 31, | 2022 | 2021 | 2020 | 2019 | 2018 |
| Selected Per–Share Data | | | | | |
| Net asset value, beginning of period | $36.76 | $26.36 | $29.56 | $33.76 | $35.04 |
| Income from Investment Operations | | | | | |
| Net investment income (loss)A,B | .47 | .44 | .61 | .63 | .69 |
| Net realized and unrealized gain (loss) | (1.37) | 10.57 | (2.28) | 1.01C | 3.71 |
| Total from investment operations | (.90) | 11.01 | (1.67) | 1.64 | 4.40 |
| Distributions from net investment income | (.59) | (.61) | (.52) | (.63) | (.64) |
| Distributions from net realized gain | (2.50) | – | (1.01) | (5.20) | (5.04) |
| Total distributions | (3.09) | (.61) | (1.53) | (5.84)D | (5.68) |
| Net asset value, end of period | $32.77 | $36.76 | $26.36 | $29.56 | $33.76 |
| Total ReturnE | (2.75)% | 42.53% | (6.11)% | 5.50%C | 13.70% |
| Ratios to Average Net AssetsB,F,G | | | | | |
| Expenses before reductions | .38% | .39% | .39% | .40% | .40% |
| Expenses net of fee waivers, if any | .38% | .39% | .39% | .39% | .40% |
| Expenses net of all reductions | .38% | .38% | .38% | .38% | .39% |
| Net investment income (loss) | 1.36% | 1.41% | 2.22% | 2.16% | 2.05% |
| Supplemental Data | | | | | |
| Net assets, end of period (in millions) | $542 | $807 | $1,228 | $1,480 | $1,212 |
| Portfolio turnover rateH | 52% | 93% | 69% | 101% | 115% |
A Calculated based on average shares outstanding during the period.
B Net investment income (loss) is affected by the timing of the declaration of dividends by any underlying mutual funds or exchange-traded funds (ETFs). Net investment income (loss) of any such underlying funds is not included in the Fund's net investment income (loss) ratio.
C Net realized and unrealized gain (loss) per share reflects proceeds received from litigation which amounted to $.05 per share. Excluding these litigation proceeds, the total return would have been 5.31%.
D Total distributions per share do not sum due to rounding.
E Total returns would have been lower if certain expenses had not been reduced during the applicable periods shown.
F Fees and expenses of any underlying mutual funds or exchange-traded funds (ETFs) are not included in the Fund's expense ratio. The Fund indirectly bears its proportionate share of these expenses. For additional expense information related to investments in Fidelity Central Funds, please refer to the "Investments in Fidelity Central Funds" note found in the Notes to Financial Statements section of the most recent Annual or Semi-Annual report.
G Expense ratios reflect operating expenses of the class. Expenses before reductions do not reflect amounts reimbursed, waived, or reduced through arrangements with the investment adviser, brokerage services, or other offset arrangements, if applicable, and do not represent the amount paid by the class during periods when reimbursements, waivers or reductions occur.
H Amount does not include the portfolio activity of any underlying mutual funds or exchange-traded funds (ETFs).
See accompanying notes which are an integral part of the financial statements.
Notes to Financial Statements
For the period ended July 31, 2022
(Amounts in thousands except percentages)
1. Organization.
Fidelity Dividend Growth Fund (the Fund) is a fund of Fidelity Securities Fund (the Trust) and is authorized to issue an unlimited number of shares. The Trust is registered under the Investment Company Act of 1940, as amended (the 1940 Act), as an open-end management investment company organized as a Massachusetts business trust. The Fund offers Dividend Growth and Class K shares, each of which has equal rights as to assets and voting privileges. Each class has exclusive voting rights with respect to matters that affect that class.
2. Investments in Fidelity Central Funds.
Funds may invest in Fidelity Central Funds, which are open-end investment companies generally available only to other investment companies and accounts managed by the investment adviser and its affiliates. The Schedule of Investments lists any Fidelity Central Funds held as an investment as of period end, but does not include the underlying holdings of each Fidelity Central Fund. An investing fund indirectly bears its proportionate share of the expenses of the underlying Fidelity Central Funds.
Based on its investment objective, each Fidelity Central Fund may invest or participate in various investment vehicles or strategies that are similar to those of the investing fund. These strategies are consistent with the investment objectives of the investing fund and may involve certain economic risks which may cause a decline in value of each of the Fidelity Central Funds and thus a decline in the value of the investing fund.
| Fidelity Central Fund | Investment Manager | Investment Objective | Investment Practices | Expense Ratio(a) |
| Fidelity Money Market Central Funds | Fidelity Management & Research Company LLC (FMR) | Each fund seeks to obtain a high level of current income consistent with the preservation of capital and liquidity. | Short-term Investments | Less than .005% |
(a) Expenses expressed as a percentage of average net assets and are as of each underlying Central Fund's most recent annual or semi-annual shareholder report.
A complete unaudited list of holdings for each Fidelity Central Fund is available upon request or at the Securities and Exchange Commission website at www.sec.gov. In addition, the financial statements of the Fidelity Central Funds which contain the significant accounting policies (including investment valuation policies) of those funds, and are not covered by the Report of Independent Registered Public Accounting Firm, are available on the Securities and Exchange Commission website or upon request.
3. Significant Accounting Policies.
The Fund is an investment company and applies the accounting and reporting guidance of the Financial Accounting Standards Board (FASB) Accounting Standards Codification Topic 946 Financial Services - Investment Companies. The financial statements have been prepared in conformity with accounting principles generally accepted in the United States of America (GAAP), which require management to make certain estimates and assumptions at the date of the financial statements. Actual results could differ from those estimates. Subsequent events, if any, through the date that the financial statements were issued have been evaluated in the preparation of the financial statements. The Fund's Schedule of Investments lists any underlying mutual funds or exchange-traded funds (ETFs) but does not include the underlying holdings of these funds. The following summarizes the significant accounting policies of the Fund:
Investment Valuation. Investments are valued as of 4:00 p.m. Eastern time on the last calendar day of the period. The Board of Trustees (the Board) has delegated the day to day responsibility for the valuation of the Fund's investments to the Fair Value Committee (the Committee) established by the Fund's investment adviser. In accordance with valuation policies and procedures approved by the Board, the Fund attempts to obtain prices from one or more third party pricing vendors or brokers to value its investments. When current market prices, quotations or currency exchange rates are not readily available or reliable, investments will be fair valued in good faith by the Committee, in accordance with procedures adopted by the Board. Factors used in determining fair value vary by investment type and may include market or investment specific events. The frequency with which these procedures are used cannot be predicted and they may be utilized to a significant extent. The Committee oversees the Fund's valuation policies and procedures and reports to the Board on the Committee's activities and fair value determinations. The Board monitors the appropriateness of the procedures used in valuing the Fund's investments and ratifies the fair value determinations of the Committee.
The Fund categorizes the inputs to valuation techniques used to value its investments into a disclosure hierarchy consisting of three levels as shown below:
- Level 1 – unadjusted quoted prices in active markets for identical investments
- Level 2 – other significant observable inputs (including quoted prices for similar investments, interest rates, prepayment speeds, etc.)
- Level 3 – unobservable inputs (including the Fund's own assumptions based on the best information available)
Valuation techniques used to value the Fund's investments by major category are as follows:
Equity securities, including restricted securities, for which market quotations are readily available, are valued at the last reported sale price or official closing price as reported by a third party pricing vendor on the primary market or exchange on which they are traded and are categorized as Level 1 in the hierarchy. In the event there were no sales during the day or closing prices are not available, securities are valued at the last quoted bid price or may be valued using the last available price and are generally categorized as Level 2 in the hierarchy. For foreign equity securities, when market or security specific events arise, comparisons to the valuation of American Depositary Receipts (ADRs), futures contracts, ETFs and certain indexes as well as quoted prices for similar securities may be used and would be categorized as Level 2 in the hierarchy. For equity securities, including restricted securities, where observable inputs are limited, assumptions about market activity and risk are used and these securities may be categorized as Level 3 in the hierarchy.
Investments in open-end mutual funds, including the Fidelity Central Funds, are valued at their closing net asset value (NAV) each business day and are categorized as Level 1 in the hierarchy.
Changes in valuation techniques may result in transfers in or out of an assigned level within the disclosure hierarchy. The aggregate value of investments by input level as of July 31, 2022 is included at the end of the Fund's Schedule of Investments.
Foreign Currency. Certain Funds may use foreign currency contracts to facilitate transactions in foreign-denominated securities. Gains and losses from these transactions may arise from changes in the value of the foreign currency or if the counterparties do not perform under the contracts' terms.
Foreign-denominated assets, including investment securities, and liabilities are translated into U.S. dollars at the exchange rates at period end. Purchases and sales of investment securities, income and dividends received, and expenses denominated in foreign currencies are translated into U.S. dollars at the exchange rate in effect on the transaction date.
The effects of exchange rate fluctuations on investments are included with the net realized and unrealized gain (loss) on investment securities. Other foreign currency transactions resulting in realized and unrealized gain (loss) are disclosed separately.
Investment Transactions and Income. For financial reporting purposes, the Fund's investment holdings and NAV include trades executed through the end of the last business day of the period. The NAV per share for processing shareholder transactions is calculated as of the close of business of the New York Stock Exchange (NYSE), normally 4:00 p.m. Eastern time and includes trades executed through the end of the prior business day. Gains and losses on securities sold are determined on the basis of identified cost and include proceeds received from litigation. Commissions paid to certain brokers with whom the investment adviser, or its affiliates, places trades on behalf of a fund include an amount in addition to trade execution, which may be rebated back to a fund. Any such rebates are included in net realized gain (loss) on investments in the Statement of Operations. Dividend income is recorded on the ex-dividend date, except for certain dividends from foreign securities where the ex-dividend date may have passed, which are recorded as soon as the Fund is informed of the ex-dividend date. Non-cash dividends included in dividend income, if any, are recorded at the fair market value of the securities received. Income and capital gain distributions from Fidelity Central Funds, if any, are recorded on the ex-dividend date. Certain distributions received by the Fund represent a return of capital or capital gain. The Fund determines the components of these distributions subsequent to the ex-dividend date, based upon receipt of tax filings or other correspondence relating to the underlying investment. These distributions are recorded as a reduction of cost of investments and/or as a realized gain. Investment income is recorded net of foreign taxes withheld where recovery of such taxes is uncertain. Funds may file withholding tax reclaims in certain jurisdictions to recover a portion of amounts previously withheld. Any withholding tax reclaims income is included in the Statement of Operations in dividends. Any receivables for withholding tax reclaims are included in the Statement of Assets and Liabilities in dividends receivable.
Class Allocations and Expenses. Investment income, realized and unrealized capital gains and losses, common expenses of a fund, and certain fund-level expense reductions, if any, are allocated daily on a pro-rata basis to each class based on the relative net assets of each class to the total net assets of a fund. Each class differs with respect to transfer agent and distribution and service plan fees incurred, as applicable. Certain expense reductions may also differ by class, if applicable. For the reporting period, the allocated portion of income and expenses to each class as a percent of its average net assets may vary due to the timing of recording these transactions in relation to fluctuating net assets of the classes. Expenses directly attributable to a fund are charged to that fund. Expenses attributable to more than one fund are allocated among the respective funds on the basis of relative net assets or other appropriate methods. Expenses included in the accompanying financial statements reflect the expenses of that fund and do not include any expenses associated with any underlying mutual funds or exchange-traded funds. Although not included in a fund's expenses, a fund indirectly bears its proportionate share of these expenses through the net asset value of each underlying mutual fund or exchange-traded fund. Expense estimates are accrued in the period to which they relate and adjustments are made when actual amounts are known.
Deferred Trustee Compensation. Under a Deferred Compensation Plan (the Plan) for certain Funds, certain independent Trustees have elected to defer receipt of a portion of their annual compensation. Deferred amounts are invested in affiliated mutual funds, are marked-to-market and remain in a fund until distributed in accordance with the Plan. The investment of deferred amounts and the offsetting payable to the Trustees presented below are included in the accompanying Statement of Assets and Liabilities in other receivables and other payables and accrued expenses, as applicable.
| Fidelity Dividend Growth Fund | $347 |
Income Tax Information and Distributions to Shareholders. Each year, the Fund intends to qualify as a regulated investment company under Subchapter M of the Internal Revenue Code, including distributing substantially all of its taxable income and realized gains. As a result, no provision for U.S. Federal income taxes is required. As of July 31, 2022, the Fund did not have any unrecognized tax benefits in the financial statements; nor is the Fund aware of any tax positions for which it is reasonably possible that the total amounts of unrecognized tax benefits will significantly change in the next twelve months. The Fund files a U.S. federal tax return, in addition to state and local tax returns as required. The Fund's federal income tax returns are subject to examination by the Internal Revenue Service (IRS) for a period of three fiscal years after they are filed. State and local tax returns may be subject to examination for an additional fiscal year depending on the jurisdiction. Foreign taxes are provided for based on the Fund's understanding of the tax rules and rates that exist in the foreign markets in which it invests.
Distributions are declared and recorded on the ex-dividend date. Income and capital gain distributions are declared separately for each class. Income and capital gain distributions are determined in accordance with income tax regulations, which may differ from GAAP. In addition, the Fund claimed a portion of the payment made to redeeming shareholders as a distribution for income tax purposes.
Capital accounts within the financial statements are adjusted for permanent book-tax differences. These adjustments have no impact on net assets or the results of operations. Capital accounts are not adjusted for temporary book-tax differences which will reverse in a subsequent period.
Book-tax differences are primarily due to foreign currency transactions, deferred Trustee compensation, partnerships and losses deferred due to wash sales.
As of period end, the cost and unrealized appreciation (depreciation) in securities, and derivatives if applicable, for federal income tax purposes were as follows:
| Gross unrealized appreciation | $1,126,358 |
| Gross unrealized depreciation | (247,716) |
| Net unrealized appreciation (depreciation) | $878,642 |
| Tax Cost | $5,435,250 |
The tax-based components of distributable earnings as of period end were as follows:
| Undistributed ordinary income | $9,913 |
| Undistributed long-term capital gain | $525,833 |
| Net unrealized appreciation (depreciation) on securities and other investments | $875,848 |
The tax character of distributions paid was as follows:
| | July 31, 2022 | July 31, 2021 |
| Ordinary Income | $319,003 | $ 129,527 |
| Long-term Capital Gains | 252,292 | – |
| Total | $571,295 | $ 129,527 |
Restricted Securities (including Private Placements). Funds may invest in securities that are subject to legal or contractual restrictions on resale. These securities generally may be resold in transactions exempt from registration or to the public if the securities are registered. Disposal of these securities may involve time-consuming negotiations and expense, and prompt sale at an acceptable price may be difficult. Information regarding restricted securities held at period end is included at the end of the Schedule of Investments, if applicable.
4. Purchases and Sales of Investments.
Purchases and sales of securities, other than short-term securities and in-kind transactions, as applicable, are noted in the table below.
| | Purchases ($) | Sales ($) |
| Fidelity Dividend Growth Fund | 3,378,741 | 4,002,387 |
5. Fees and Other Transactions with Affiliates.
Management Fee. Fidelity Management & Research Company LLC (the investment adviser) and its affiliates provide the Fund with investment management related services for which the Fund pays a monthly management fee. The management fee is the sum of an individual fund fee rate that is based on an annual rate of .30% of the Fund's average net assets and an annualized group fee rate that averaged .22% during the period. The group fee rate is based upon the monthly average net assets of a group of registered investment companies with which the investment adviser has management contracts. The group fee rate decreases as assets under management increase and increases as assets under management decrease. In addition, the management fee is subject to a performance adjustment (up to a maximum of +/- .20% of the Fund's average net assets over a 36 month performance period). The upward or downward adjustment to the management fee is based on the relative investment performance of Dividend Growth as compared to its benchmark index, the S&P 500 Index, over the same 36 month performance period. For the reporting period, the total annual management fee rate, including the performance adjustment, was .32% of the Fund's average net assets. The performance adjustment included in the management fee rate may be higher or lower than the maximum performance adjustment rate due to the difference between the average net assets for the reporting and performance periods.
Transfer Agent Fees. Fidelity Investments Institutional Operations Company LLC (FIIOC), an affiliate of the investment adviser, is the transfer, dividend disbursing and shareholder servicing agent for each class of the Fund. FIIOC receives account fees and asset-based fees that vary according to the account size and type of account of the shareholders of Dividend Growth, except for Class K. FIIOC receives an asset-based fee of Class K's average net assets. FIIOC pays for typesetting, printing and mailing of shareholder reports, except proxy statements.
For the period, transfer agent fees for each class were as follows:
| | Amount | % of Class-Level Average Net Assets |
| Dividend Growth | $7,800 | .13 |
| Class K | 238 | .04 |
| | $8,038 | |
Accounting Fees. Fidelity Service Company, Inc. (FSC), an affiliate of the investment adviser, maintains the Fund's accounting records. The accounting fee is based on the level of average net assets for each month. For the period, the fees were equivalent to the following annual rates:
| | % of Average Net Assets |
| Fidelity Dividend Growth Fund | .02 |
Brokerage Commissions. A portion of portfolio transactions were placed with brokerage firms which are affiliates of the investment adviser. Brokerage commissions are included in net realized gain (loss) and change in net unrealized appreciation (depreciation) in the Statement of Operations. The commissions paid to these affiliated firms were as follows:
| | Amount |
| Fidelity Dividend Growth Fund | $82 |
Interfund Lending Program. Pursuant to an Exemptive Order issued by the Securities and Exchange Commission (the SEC), the Fund, along with other registered investment companies having management contracts with Fidelity Management & Research Company LLC (FMR), or other affiliated entities of FMR, may participate in an interfund lending program. This program provides an alternative credit facility allowing the Fund to borrow from, or lend money to, other participating affiliated funds. At period end, there were no interfund loans outstanding. Activity in this program during the period for which loans were outstanding was as follows:
| | Borrower or Lender | Average Loan Balance | Weighted Average Interest Rate | Interest Expense |
| Fidelity Dividend Growth Fund | Borrower | $12,038 | .32% | $4 |
Interfund Trades. Funds may purchase from or sell securities to other Fidelity Funds under procedures adopted by the Board. The procedures have been designed to ensure these interfund trades are executed in accordance with Rule 17a-7 of the 1940 Act. Any interfund trades are included within the respective purchases and sales amounts shown in the Purchases and Sales of Investments note. Interfund trades during the period are noted in the table below.
| | Purchases ($) | Sales ($) | Realized Gain (Loss) ($) |
| Fidelity Dividend Growth Fund | 229,513 | 410,051 | 48,140 |
6. Committed Line of Credit.
Certain Funds participate with other funds managed by the investment adviser or an affiliate in a $4.25 billion credit facility (the "line of credit") to be utilized for temporary or emergency purposes to fund shareholder redemptions or for other short-term liquidity purposes. The participating funds have agreed to pay commitment fees on their pro-rata portion of the line of credit, which are reflected in Miscellaneous expenses on the Statement of Operations, and are listed below. During the period, there were no borrowings on this line of credit.
| | Amount |
| Fidelity Dividend Growth Fund | $8 |
7. Security Lending.
Funds lend portfolio securities from time to time in order to earn additional income. Lending agents are used, including National Financial Services (NFS), an affiliate of the investment adviser. Pursuant to a securities lending agreement, NFS will receive a fee, which is capped at 9.9% of a fund's daily lending revenue, for its services as lending agent. A fund may lend securities to certain qualified borrowers, including NFS. On the settlement date of the loan, a fund receives collateral (in the form of U.S. Treasury obligations, letters of credit and/or cash) against the loaned securities and maintains collateral in an amount not less than 100% of the market value of the loaned securities during the period of the loan. The market value of the loaned securities is determined at the close of business of a fund and any additional required collateral is delivered to a fund on the next business day. A fund or borrower may terminate the loan at any time, and if the borrower defaults on its obligation to return the securities loaned because of insolvency or other reasons, a fund may apply collateral received from the borrower against the obligation. A fund may experience delays and costs in recovering the securities loaned. Any cash collateral received is invested in the Fidelity Securities Lending Cash Central Fund. Any loaned securities are identified as such in the Schedule of Investments, and the value of loaned securities and cash collateral at period end, as applicable, are presented in the Statement of Assets and Liabilities. Security lending income represents the income earned on investing cash collateral, less rebates paid to borrowers and any lending agent fees associated with the loan, plus any premium payments received for lending certain types of securities. Security lending income is presented in the Statement of Operations as a component of income from Fidelity Central Funds. Affiliated security lending activity, if any, was as follows:
| | Total Security Lending Fees Paid to NFS | Security Lending Income From Securities Loaned to NFS | Value of Securities Loaned to NFS at Period End |
| Fidelity Dividend Growth Fund | $51 | $9 | $– |
8. Bank Borrowings.
The Fund is permitted to have bank borrowings for temporary or emergency purposes to fund shareholder redemptions or for other short-term liquidity requirements. The Fund has established borrowing arrangements with certain banks. The interest rate on the borrowings is the bank's base rate, as revised from time to time. Any open loans, including accrued interest, at period end are presented under the caption "Notes payable" in the Statement of Assets and Liabilities, if applicable. Activity in this program during the period for which loans were outstanding was as follows:
| | Average Loan Balance | Weighted Average Interest Rate | Interest Expense |
| Fidelity Dividend Growth Fund | $1,935 | .58% | $–(a) |
(a) In the amount of less than five hundred dollars.
9. Expense Reductions.
During the period the investment adviser or an affiliate reimbursed and/or waived a portion of fund-level operating expenses in the amount of $206.
10. Distributions to Shareholders.
Distributions to shareholders of each class were as follows:
| | Year ended
July 31, 2022 | Year ended
July 31, 2021 |
| Fidelity Dividend Growth Fund | | |
| Distributions to shareholders | | |
| Dividend Growth | $510,637 | $101,466 |
| Class K | 60,658 | 28,061 |
| Total | $571,295 | $129,527 |
11. Share Transactions.
Share transactions for each class were as follows and may contain in-kind transactions, automatic conversions between classes or exchanges between affiliated funds:
| | Shares | Shares | Dollars | Dollars |
| | Year ended July 31, 2022 | Year ended July 31, 2021 | Year ended July 31, 2022 | Year ended July 31, 2021 |
| Fidelity Dividend Growth Fund | | | | |
| Dividend Growth | | | | |
| Shares sold | 9,180 | 8,974 | $317,840 | $287,945 |
| Reinvestment of distributions | 14,043 | 3,455 | 487,723 | 96,813 |
| Shares redeemed | (16,893) | (23,848) | (581,352) | (736,056) |
| Net increase (decrease) | 6,330 | (11,419) | $224,211 | $(351,298) |
| Class K | | | | |
| Shares sold | 3,443 | 7,248 | $117,316 | $222,321 |
| Reinvestment of distributions | 1,749 | 1,002 | 60,658 | 28,061 |
| Shares redeemed | (10,595) | (32,868) | (365,178) | (1,079,892) |
| Net increase (decrease) | (5,403) | (24,618) | $(187,204) | $(829,510) |
12. Other.
A fund's organizational documents provide former and current trustees and officers with a limited indemnification against liabilities arising in connection with the performance of their duties to the fund. In the normal course of business, a fund may also enter into contracts that provide general indemnifications. A fund's maximum exposure under these arrangements is unknown as this would be dependent on future claims that may be made against a fund. The risk of material loss from such claims is considered remote.
13. Coronavirus (COVID-19) Pandemic.
An outbreak of COVID-19 first detected in China during December 2019 has since spread globally and was declared a pandemic by the World Health Organization during March 2020. Developments that disrupt global economies and financial markets, such as the COVID-19 pandemic, may magnify factors that affect the Fund's performance.
Report of Independent Registered Public Accounting Firm
To the Board of Trustees of Fidelity Securities Fund and Shareholders of Fidelity Dividend Growth Fund
Opinion on the Financial Statements
We have audited the accompanying statement of assets and liabilities, including the schedule of investments, of Fidelity Dividend Growth Fund (one of the funds constituting Fidelity Securities Fund, referred to hereafter as the “Fund”) as of July 31, 2022, the related statement of operations for the year ended July 31, 2022, the statement of changes in net assets for each of the two years in the period ended July 31, 2022, including the related notes, and the financial highlights for each of the five years in the period ended July 31, 2022 (collectively referred to as the “financial statements”). In our opinion, the financial statements present fairly, in all material respects, the financial position of the Fund as of July 31, 2022, the results of its operations for the year then ended, the changes in its net assets for each of the two years in the period ended July 31, 2022 and the financial highlights for each of the five years in the period ended July 31, 2022 in conformity with accounting principles generally accepted in the United States of America.
Basis for Opinion
These financial statements are the responsibility of the Fund’s management. Our responsibility is to express an opinion on the Fund’s financial statements based on our audits. We are a public accounting firm registered with the Public Company Accounting Oversight Board (United States) (PCAOB) and are required to be independent with respect to the Fund in accordance with the U.S. federal securities laws and the applicable rules and regulations of the Securities and Exchange Commission and the PCAOB.
We conducted our audits of these financial statements in accordance with the standards of the PCAOB. Those standards require that we plan and perform the audit to obtain reasonable assurance about whether the financial statements are free of material misstatement, whether due to error or fraud.
Our audits included performing procedures to assess the risks of material misstatement of the financial statements, whether due to error or fraud, and performing procedures that respond to those risks. Such procedures included examining, on a test basis, evidence regarding the amounts and disclosures in the financial statements. Our audits also included evaluating the accounting principles used and significant estimates made by management, as well as evaluating the overall presentation of the financial statements. Our procedures included confirmation of securities owned as of July 31, 2022 by correspondence with the custodians and brokers; when replies were not received from brokers, we performed other auditing procedures. We believe that our audits provide a reasonable basis for our opinion.
/s/ PricewaterhouseCoopers LLP
Boston, Massachusetts
September 14, 2022
We have served as the auditor of one or more investment companies in the Fidelity group of funds since 1932.
Trustees and Officers
The Trustees, Members of the Advisory Board (if any), and officers of the trust and fund, as applicable, are listed below. The Board of Trustees governs the fund and is responsible for protecting the interests of shareholders. The Trustees are experienced executives who meet periodically throughout the year to oversee the fund's activities, review contractual arrangements with companies that provide services to the fund, oversee management of the risks associated with such activities and contractual arrangements, and review the fund's performance. Except for Jonathan Chiel, each of the Trustees oversees 316 funds. Mr. Chiel oversees 184 funds.
The Trustees hold office without limit in time except that (a) any Trustee may resign; (b) any Trustee may be removed by written instrument, signed by at least two-thirds of the number of Trustees prior to such removal; (c) any Trustee who requests to be retired or who has become incapacitated by illness or injury may be retired by written instrument signed by a majority of the other Trustees; and (d) any Trustee may be removed at any special meeting of shareholders by a two-thirds vote of the outstanding voting securities of the trust. Each Trustee who is not an interested person (as defined in the 1940 Act) of the trust and the fund is referred to herein as an Independent Trustee. Each Independent Trustee shall retire not later than the last day of the calendar year in which his or her 75th birthday occurs. The Independent Trustees may waive this mandatory retirement age policy with respect to individual Trustees. Officers and Advisory Board Members hold office without limit in time, except that any officer or Advisory Board Member may resign or may be removed by a vote of a majority of the Trustees at any regular meeting or any special meeting of the Trustees. Except as indicated, each individual has held the office shown or other offices in the same company for the past five years.
The fund's Statement of Additional Information (SAI) includes more information about the Trustees. To request a free copy, call Fidelity at 1-800-544-8544 if you’re an individual investing directly with Fidelity, call 1-800-835-5092 if you’re a plan sponsor or participant with Fidelity as your recordkeeper or call 1-877-208-0098 on institutional accounts or if you’re an advisor or invest through one.
Experience, Skills, Attributes, and Qualifications of the Trustees. The Governance and Nominating Committee has adopted a statement of policy that describes the experience, qualifications, attributes, and skills that are necessary and desirable for potential Independent Trustee candidates (Statement of Policy). The Board believes that each Trustee satisfied at the time he or she was initially elected or appointed a Trustee, and continues to satisfy, the standards contemplated by the Statement of Policy. The Governance and Nominating Committee also engages professional search firms to help identify potential Independent Trustee candidates who have the experience, qualifications, attributes, and skills consistent with the Statement of Policy. From time to time, additional criteria based on the composition and skills of the current Independent Trustees, as well as experience or skills that may be appropriate in light of future changes to board composition, business conditions, and regulatory or other developments, have also been considered by the professional search firms and the Governance and Nominating Committee. In addition, the Board takes into account the Trustees' commitment and participation in Board and committee meetings, as well as their leadership of standing and ad hoc committees throughout their tenure.
In determining that a particular Trustee was and continues to be qualified to serve as a Trustee, the Board has considered a variety of criteria, none of which, in isolation, was controlling. The Board believes that, collectively, the Trustees have balanced and diverse experience, qualifications, attributes, and skills, which allow the Board to operate effectively in governing the fund and protecting the interests of shareholders. Information about the specific experience, skills, attributes, and qualifications of each Trustee, which in each case led to the Board's conclusion that the Trustee should serve (or continue to serve) as a trustee of the fund, is provided below.
Board Structure and Oversight Function. Robert A. Lawrence is an interested person and currently serves as Chair. The Trustees have determined that an interested Chair is appropriate and benefits shareholders because an interested Chair has a personal and professional stake in the quality and continuity of services provided to the fund. Independent Trustees exercise their informed business judgment to appoint an individual of their choosing to serve as Chair, regardless of whether the Trustee happens to be independent or a member of management. The Independent Trustees have determined that they can act independently and effectively without having an Independent Trustee serve as Chair and that a key structural component for assuring that they are in a position to do so is for the Independent Trustees to constitute a substantial majority for the Board. The Independent Trustees also regularly meet in executive session. David M. Thomas serves as Lead Independent Trustee and as such (i) acts as a liaison between the Independent Trustees and management with respect to matters important to the Independent Trustees and (ii) with management prepares agendas for Board meetings.
Fidelity® funds are overseen by different Boards of Trustees. The fund's Board oversees Fidelity's high income and certain equity funds, and other Boards oversee Fidelity's investment-grade bond, money market, asset allocation, and other equity funds. The asset allocation funds may invest in Fidelity® funds overseen by the fund's Board. The use of separate Boards, each with its own committee structure, allows the Trustees of each group of Fidelity® funds to focus on the unique issues of the funds they oversee, including common research, investment, and operational issues. On occasion, the separate Boards establish joint committees to address issues of overlapping consequences for the Fidelity® funds overseen by each Board.
The Trustees operate using a system of committees to facilitate the timely and efficient consideration of all matters of importance to the Trustees, the fund, and fund shareholders and to facilitate compliance with legal and regulatory requirements and oversight of the fund's activities and associated risks. The Board, acting through its committees, has charged FMR and its affiliates with (i) identifying events or circumstances the occurrence of which could have demonstrably adverse effects on the fund's business and/or reputation; (ii) implementing processes and controls to lessen the possibility that such events or circumstances occur or to mitigate the effects of such events or circumstances if they do occur; and (iii) creating and maintaining a system designed to evaluate continuously business and market conditions in order to facilitate the identification and implementation processes described in (i) and (ii) above. Because the day-to-day operations and activities of the fund are carried out by or through FMR, its affiliates, and other service providers, the fund's exposure to risks is mitigated but not eliminated by the processes overseen by the Trustees. While each of the Board's committees has responsibility for overseeing different aspects of the fund's activities, oversight is exercised primarily through the Operations, Audit, and Compliance Committees. Appropriate personnel, including but not limited to the fund's Chief Compliance Officer (CCO), FMR's internal auditor, the independent accountants, the fund's Treasurer and portfolio management personnel, make periodic reports to the Board's committees, as appropriate, including an annual review of Fidelity's risk management program for the Fidelity® funds. The responsibilities of each standing committee, including their oversight responsibilities, are described further under "Standing Committees of the Trustees."
Interested Trustees*:
Correspondence intended for a Trustee who is an interested person may be sent to Fidelity Investments, 245 Summer Street, Boston, Massachusetts 02210.
Name, Year of Birth; Principal Occupations and Other Relevant Experience+
Jonathan Chiel (1957)
Year of Election or Appointment: 2016
Trustee
Mr. Chiel also serves as Trustee of other Fidelity® funds. Mr. Chiel is Executive Vice President and General Counsel for FMR LLC (diversified financial services company, 2012-present). Previously, Mr. Chiel served as general counsel (2004-2012) and senior vice president and deputy general counsel (2000-2004) for John Hancock Financial Services; a partner with Choate, Hall & Stewart (1996-2000) (law firm); and an Assistant United States Attorney for the United States Attorney’s Office of the District of Massachusetts (1986-95), including Chief of the Criminal Division (1993-1995). Mr. Chiel is a director on the boards of the Boston Bar Foundation and the Maimonides School.
Bettina Doulton (1964)
Year of Election or Appointment: 2021
Trustee
Ms. Doulton also serves as Trustee of other Fidelity® funds. Prior to her retirement, Ms. Doulton served in a variety of positions at Fidelity Investments, including as a managing director of research (2006-2007), portfolio manager to certain Fidelity® funds (1993-2005), equity analyst and portfolio assistant (1990-1993), and research assistant (1987-1990). Ms. Doulton currently owns and operates Phi Builders + Architects and Cellardoor Winery. Previously, Ms. Doulton served as a member of the Board of Brown Capital Management, LLC (2014-2018).
Robert A. Lawrence (1952)
Year of Election or Appointment: 2020
Trustee
Chair of the Board of Trustees
Mr. Lawrence also serves as Trustee of other funds. Previously, Mr. Lawrence served as a Trustee and Member of the Advisory Board of certain funds. Prior to his retirement in 2008, Mr. Lawrence served as Vice President of certain Fidelity® funds (2006-2008), Senior Vice President, Head of High Income Division of Fidelity Management & Research Company (investment adviser firm, 2006-2008), and President of Fidelity Strategic Investments (investment adviser firm, 2002-2005).
* Determined to be an “Interested Trustee” by virtue of, among other things, his or her affiliation with the trust or various entities under common control with FMR.
+ The information includes the Trustee's principal occupation during the last five years and other information relating to the experience, attributes, and skills relevant to the Trustee's qualifications to serve as a Trustee, which led to the conclusion that the Trustee should serve as a Trustee for the fund.
Independent Trustees:
Correspondence intended for an Independent Trustee may be sent to Fidelity Investments, P.O. Box 55235, Boston, Massachusetts 02205-5235.
Name, Year of Birth; Principal Occupations and Other Relevant Experience+
Thomas P. Bostick (1956)
Year of Election or Appointment: 2021
Trustee
Lieutenant General Bostick also serves as Trustee of other Fidelity® funds. Prior to his retirement, General Bostick (United States Army, Retired) held a variety of positions within the U.S. Army, including Commanding General and Chief of Engineers, U.S. Army Corps of Engineers (2012-2016) and Deputy Chief of Staff and Director of Human Resources, U.S. Army (2009-2012). General Bostick currently serves as a member of the Board and Finance and Governance Committees of CSX Corporation (transportation, 2020-present) and a member of the Board and Corporate Governance and Nominating Committee of Perma-Fix Environmental Services, Inc. (nuclear waste management, 2020-present). General Bostick serves as Chief Executive Officer of Bostick Global Strategies, LLC (consulting, 2016-present) and as a member of the Board of HireVue, Inc. (video interview and assessment, 2020-present). Previously, General Bostick served as a Member of the Advisory Board of certain Fidelity® funds (2021), President, Intrexon Bioengineering (2018-2020) and Chief Operating Officer (2017-2020) and Senior Vice President of the Environment Sector (2016-2017) of Intrexon Corporation (biopharmaceutical company).
Dennis J. Dirks (1948)
Year of Election or Appointment: 2005
Trustee
Mr. Dirks also serves as Trustee of other Fidelity® funds. Prior to his retirement in May 2003, Mr. Dirks served as Chief Operating Officer and as a member of the Board of The Depository Trust & Clearing Corporation (financial markets infrastructure), President, Chief Operating Officer and a member of the Board of The Depository Trust Company (DTC), President and a member of the Board of the National Securities Clearing Corporation (NSCC), Chief Executive Officer and a member of the Board of the Government Securities Clearing Corporation and Chief Executive Officer and a member of the Board of the Mortgage-Backed Securities Clearing Corporation. Mr. Dirks currently serves as a member of the Finance Committee (2016-present) and Board (2017-present) and is Treasurer (2018-present) of the Asolo Repertory Theatre.
Donald F. Donahue (1950)
Year of Election or Appointment: 2018
Trustee
Mr. Donahue also serves as Trustee of other Fidelity® funds. Mr. Donahue serves as President and Chief Executive Officer of Miranda Partners, LLC (risk consulting for the financial services industry, 2012-present). Previously, Mr. Donahue served as Chief Executive Officer (2006-2012), Chief Operating Officer (2003-2006) and Managing Director, Customer Marketing and Development (1999-2003) of The Depository Trust & Clearing Corporation (financial markets infrastructure). Mr. Donahue currently serves as a member (2007-present) and Co-Chairman (2016-present) of the Board of United Way of New York and a member of the Board of The Leadership Academy (previously NYC Leadership Academy) (2012-present). Mr. Donahue previously served as a member of the Advisory Board of certain Fidelity® funds (2015-2018).
Vicki L. Fuller (1957)
Year of Election or Appointment: 2020
Trustee
Ms. Fuller also serves as Trustee of other Fidelity® funds. Previously, Ms. Fuller served as a member of the Advisory Board of certain Fidelity® funds (2018-2020), Chief Investment Officer of the New York State Common Retirement Fund (2012-2018) and held a variety of positions at AllianceBernstein L.P. (global asset management, 1985-2012), including Managing Director (2006-2012) and Senior Vice President and Senior Portfolio Manager (2001-2006). Ms. Fuller currently serves as a member of the Board, Audit Committee and Nominating and Governance Committee of two Blackstone business development companies (2020-present), as a member of the Board of Treliant, LLC (consulting, 2019-present), as a member of the Advisory Board of Ariel Alternatives, LLC (private equity, 2021-present) and as a member of the Board and Chair of the Audit Committee of Gusto, Inc. (software, 2021-present). In addition, Ms. Fuller currently serves as a member of the Board of Roosevelt University (2019-present) and as a member of the Executive Board of New York University’s Stern School of Business. Ms. Fuller previously served as a member of the Board, Audit Committee and Nominating and Governance Committee of The Williams Companies, Inc. (natural gas infrastructure, 2018-2021).
Patricia L. Kampling (1959)
Year of Election or Appointment: 2020
Trustee
Ms. Kampling also serves as Trustee of other Fidelity® funds. Prior to her retirement, Ms. Kampling served as Chairman of the Board and Chief Executive Officer (2012-2019), President and Chief Operating Officer (2011-2012) and Executive Vice President and Chief Financial Officer (2010-2011) of Alliant Energy Corporation. Ms. Kampling currently serves as a member of the Board, Finance Committee and Governance, Compensation and Nominating Committee of Xcel Energy Inc. (utilities company, 2020-present) and as a member of the Board, Audit, Finance and Risk Committee and Safety, Environmental, Technology and Operations Committee and Chair of the Executive Development and Compensation Committee of American Water Works Company, Inc. (utilities company, 2019-present). In addition, Ms. Kampling currently serves as a member of the Board of the Nature Conservancy, Wisconsin Chapter (2019-present). Previously, Ms. Kampling served as a Member of the Advisory Board of certain Fidelity® funds (2020), a member of the Board, Compensation Committee and Executive Committee and Chair of the Audit Committee of Briggs & Stratton Corporation (manufacturing, 2011-2021), a member of the Board of Interstate Power and Light Company (2012-2019) and Wisconsin Power and Light Company (2012-2019) (each a subsidiary of Alliant Energy Corporation) and as a member of the Board and Workforce Development Committee of the Business Roundtable (2018-2019).
Thomas A. Kennedy (1955)
Year of Election or Appointment: 2021
Trustee
Mr. Kennedy also serves as Trustee of other Fidelity® funds. Previously, Mr. Kennedy served as a Member of the Advisory Board of certain Fidelity® funds (2020) and held a variety of positions at Raytheon Company (aerospace and defense, 1983-2020), including Chairman and Chief Executive Officer (2014-2020) and Executive Vice President and Chief Operating Officer (2013-2014). Mr. Kennedy currently serves as Executive Chairman of the Board of Directors of Raytheon Technologies Corporation (aerospace and defense, 2020-present). He is also a member of the Rutgers School of Engineering Industry Advisory Board (2011-present) and a member of the UCLA Engineering Dean’s Executive Board (2016-present).
Oscar Munoz (1959)
Year of Election or Appointment: 2021
Trustee
Mr. Munoz also serves as Trustee of other Fidelity® funds. Prior to his retirement, Mr. Munoz served as Executive Chairman (2020-2021), Chief Executive Officer (2015-2020), President (2015-2016) and a member of the Board (2010-2021) of United Airlines Holdings, Inc. Mr. Munoz currently serves as a member of the Board of CBRE Group, Inc. (commercial real estate, 2020-present), a member of the Board of Univision Communications, Inc. (Hispanic media, 2020-present) and a member of the Advisory Board of Salesforce.com, Inc. (cloud-based software, 2020-present). Previously, Mr. Munoz served as a Member of the Advisory Board of certain Fidelity® funds (2021).
Garnett A. Smith (1947)
Year of Election or Appointment: 2018
Trustee
Mr. Smith also serves as Trustee of other Fidelity® funds. Prior to his retirement, Mr. Smith served as Chairman and Chief Executive Officer (1990-1997) and President (1986-1990) of Inbrand Corp. (manufacturer of personal absorbent products). Prior to his employment with Inbrand Corp., he was employed by a retail fabric chain and North Carolina National Bank (now Bank of America). Mr. Smith previously served as a member of the Advisory Board of certain Fidelity® funds (2012-2013).
David M. Thomas (1949)
Year of Election or Appointment: 2008
Trustee
Lead Independent Trustee
Mr. Thomas also serves as Trustee of other Fidelity® funds. Previously, Mr. Thomas served as Executive Chairman (2005-2006) and Chairman and Chief Executive Officer (2000-2005) of IMS Health, Inc. (pharmaceutical and healthcare information solutions). Mr. Thomas currently serves as a member of the Board of Fortune Brands Home and Security (home and security products, 2004-present) and as Director (2013-present) and Non-Executive Chairman of the Board (2022-present) of Interpublic Group of Companies, Inc. (marketing communication).
Susan Tomasky (1953)
Year of Election or Appointment: 2020
Trustee
Ms. Tomasky also serves as Trustee of other Fidelity® funds. Prior to her retirement, Ms. Tomasky served in various executive officer positions at American Electric Power Company, Inc. (1998-2011), including most recently as President of AEP Transmission (2007-2011). Ms. Tomasky currently serves as a member of the Board and Sustainability Committee and as Chair of the Audit Committee of Marathon Petroleum Corporation (2018-present) and as a member of the Board, Executive Committee, Corporate Governance Committee and Organization and Compensation Committee and as Chair of the Audit Committee of Public Service Enterprise Group, Inc. (utilities company, 2012-present) and as a member of the Board of its subsidiary company, Public Service Electric and Gas Co. (2021-present). In addition, Ms. Tomasky currently serves as a member (2009-present) and President (2020-present) of the Board of the Royal Shakespeare Company – America (2009-present), as a member of the Board of the Columbus Association for the Performing Arts (2011-present) and as a member of the Board and Kenyon in the World Committee of Kenyon College (2016-present). Previously, Ms. Tomasky served as a Member of the Advisory Board of certain Fidelity® funds (2020), as a member of the Board of the Columbus Regional Airport Authority (2007-2020), as a member of the Board (2011-2018) and Lead Independent Director (2015-2018) of Andeavor Corporation (previously Tesoro Corporation) (independent oil refiner and marketer) and as a member of the Board of Summit Midstream Partners LP (energy, 2012-2018).
Michael E. Wiley (1950)
Year of Election or Appointment: 2020
Trustee
Mr. Wiley also serves as Trustee of other Fidelity® funds. Previously, Mr. Wiley served as a member of the Advisory Board of certain Fidelity® funds (2018-2020), Chairman, President and CEO of Baker Hughes, Inc. (oilfield services, 2000-2004). Mr. Wiley also previously served as a member of the Board of Andeavor Corporation (independent oil refiner and marketer, 2005-2018), a member of the Board of Andeavor Logistics LP (natural resources logistics, 2015-2018) and a member of the Board of High Point Resources (exploration and production, 2005-2020).
+ The information includes the Trustee's principal occupation during the last five years and other information relating to the experience, attributes, and skills relevant to the Trustee's qualifications to serve as a Trustee, which led to the conclusion that the Trustee should serve as a Trustee for the fund.
Advisory Board Members and Officers:
Correspondence intended for a Member of the Advisory Board (if any) may be sent to Fidelity Investments, P.O. Box 55235, Boston, Massachusetts 02205-5235. Correspondence intended for an officer or Peter S. Lynch may be sent to Fidelity Investments, 245 Summer Street, Boston, Massachusetts 02210. Officers appear below in alphabetical order.
Name, Year of Birth; Principal Occupation
Peter S. Lynch (1944)
Year of Election or Appointment: 2003
Member of the Advisory Board
Mr. Lynch also serves as a Member of the Advisory Board of other Fidelity® funds. Mr. Lynch is Vice Chairman and a Director of Fidelity Management & Research Company LLC (investment adviser firm). In addition, Mr. Lynch serves as a Trustee of Boston College and as the Chairman of the Inner-City Scholarship Fund. Previously, Mr. Lynch served as Vice Chairman and a Director of FMR Co., Inc. (investment adviser firm) and on the Special Olympics International Board of Directors (1997-2006).
Craig S. Brown (1977)
Year of Election or Appointment: 2019
Assistant Treasurer
Mr. Brown also serves as an officer of other funds. Mr. Brown serves as Assistant Treasurer of FIMM, LLC (2021-present) and is an employee of Fidelity Investments (2013-present).
John J. Burke III (1964)
Year of Election or Appointment: 2018
Chief Financial Officer
Mr. Burke also serves as Chief Financial Officer of other funds. Mr. Burke serves as Head of Investment Operations for Fidelity Fund and Investment Operations (2018-present) and is an employee of Fidelity Investments (1998-present). Previously Mr. Burke served as head of Asset Management Investment Operations (2012-2018).
William C. Coffey (1969)
Year of Election or Appointment: 2019
Assistant Secretary
Mr. Coffey also serves as Assistant Secretary of other funds. He is Senior Vice President and Deputy General Counsel of FMR LLC (diversified financial services company, 2010-present), and is an employee of Fidelity Investments. Previously, Mr. Coffey served as Secretary and CLO of certain funds (2018-2019); CLO, Secretary, and Senior Vice President of Fidelity Management & Research Company and FMR Co., Inc. (investment adviser firms, 2018-2019); Secretary of Fidelity SelectCo, LLC and Fidelity Investments Money Management, Inc. (investment adviser firms, 2018-2019); CLO of Fidelity Management & Research (Hong Kong) Limited, FMR Investment Management (UK) Limited, and Fidelity Management & Research (Japan) Limited (investment adviser firms, 2018-2019); and Assistant Secretary of certain funds (2009-2018).
Timothy M. Cohen (1969)
Year of Election or Appointment: 2018
Vice President
Mr. Cohen also serves as Vice President of other funds. Mr. Cohen serves as Co-Head of Equity (2018-present), a Director of Fidelity Management & Research (Japan) Limited (investment adviser firm, 2016-present), and is an employee of Fidelity Investments. Previously, Mr. Cohen served as Executive Vice President of Fidelity SelectCo, LLC (2019), Head of Global Equity Research (2016-2018), Chief Investment Officer - Equity and a Director of Fidelity Management & Research (U.K.) Inc. (investment adviser firm, 2013-2015) and as a Director of Fidelity Management & Research (Hong Kong) Limited (investment adviser firm, 2017).
Jonathan Davis (1968)
Year of Election or Appointment: 2010
Assistant Treasurer
Mr. Davis also serves as an officer of other funds. Mr. Davis serves as Assistant Treasurer of FIMM, LLC (2021-present), FMR Capital, Inc. (2017-present), FD Funds GP LLC (2021-present), FD Funds Holding LLC (2021-present), and FD Funds Management LLC (2021-present); and is an employee of Fidelity Investments. Previously, Mr. Davis served as Vice President and Associate General Counsel of FMR LLC (diversified financial services company, 2003-2010).
Laura M. Del Prato (1964)
Year of Election or Appointment: 2018
Assistant Treasurer
Ms. Del Prato also serves as an officer of other funds. Ms. Del Prato serves as Assistant Treasurer of FIMM, LLC (2021-present) and is an employee of Fidelity Investments (2017-present). Previously, Ms. Del Prato served as President and Treasurer of The North Carolina Capital Management Trust: Cash Portfolio and Term Portfolio (2018-2020). Prior to joining Fidelity Investments, Ms. Del Prato served as a Managing Director and Treasurer of the JPMorgan Mutual Funds (2014-2017). Prior to JPMorgan, Ms. Del Prato served as a partner at Cohen Fund Audit Services (accounting firm, 2012-2013) and KPMG LLP (accounting firm, 2004-2012).
Colm A. Hogan (1973)
Year of Election or Appointment: 2020
Assistant Treasurer
Mr. Hogan also serves as an officer of other funds. Mr. Hogan serves as Assistant Treasurer of FIMM, LLC (2021-present) and FMR Capital, Inc. (2017-present) and is an employee of Fidelity Investments (2005-present). Previously, Mr. Hogan served as Deputy Treasurer of certain Fidelity® funds (2016-2020) and Assistant Treasurer of certain Fidelity® funds (2016-2018).
Pamela R. Holding (1964)
Year of Election or Appointment: 2018
Vice President
Ms. Holding also serves as Vice President of other funds. Ms. Holding serves as Co-Head of Equity (2018-present) and is an employee of Fidelity Investments (2013-present). Previously, Ms. Holding served as Executive Vice President of Fidelity SelectCo, LLC (2019) and as Chief Investment Officer of Fidelity Institutional Asset Management (2013-2018).
Cynthia Lo Bessette (1969)
Year of Election or Appointment: 2019
Secretary and Chief Legal Officer (CLO)
Ms. Lo Bessette also serves as an officer of other funds. Ms. Lo Bessette serves as CLO, Secretary, and Senior Vice President of Fidelity Management & Research Company LLC (investment adviser firm, 2019-present); CLO of Fidelity Management & Research (Hong Kong) Limited, FMR Investment Management (UK) Limited, and Fidelity Management & Research (Japan) Limited (investment adviser firms, 2019-present); Secretary of FD Funds GP LLC (2021-present), FD Funds Holding LLC (2021-present), and FD Funds Management LLC (2021-present); and Assistant Secretary of FIMM, LLC (2019-present). She is a Senior Vice President and Deputy General Counsel of FMR LLC (diversified financial services company, 2019-present), and is an employee of Fidelity Investments. Previously, Ms. Lo Bessette served as CLO, Secretary, and Senior Vice President of FMR Co., Inc. (investment adviser firm, 2019); Secretary of Fidelity SelectCo, LLC and Fidelity Investments Money Management, Inc. (investment adviser firms, 2019). Prior to joining Fidelity Investments, Ms. Lo Bessette was Executive Vice President, General Counsel (2016-2019) and Senior Vice President, Deputy General Counsel (2015-2016) of OppenheimerFunds (investment management company) and Deputy Chief Legal Officer (2013-2015) of Jennison Associates LLC (investment adviser firm).
Chris Maher (1972)
Year of Election or Appointment: 2020
Deputy Treasurer
Mr. Maher also serves as an officer of other funds. Mr. Maher serves as Assistant Treasurer of FIMM, LLC (2021-present) and FMR Capital, Inc. (2017-present), and is an employee of Fidelity Investments (2008-present). Previously, Mr. Maher served as Assistant Treasurer of certain funds (2013-2020); Vice President of Asset Management Compliance (2013), Vice President of the Program Management Group of FMR (investment adviser firm, 2010-2013), and Vice President of Valuation Oversight (2008-2010).
Jason P. Pogorelec (1975)
Year of Election or Appointment: 2020
Chief Compliance Officer
Mr. Pogorelec also serves as Chief Compliance Officer of other funds. Mr. Pogorelec is a senior Vice President of Asset Management Compliance for Fidelity Investments and is an employee of Fidelity Investments (2006-present). Previously, Mr. Pogorelec served as Vice President, Associate General Counsel for Fidelity Investments (2010-2020) and Assistant Secretary of certain Fidelity funds (2015-2020).
Brett Segaloff (1972)
Year of Election or Appointment: 2021
Anti-Money Laundering (AML) Officer
Mr. Segaloff also serves as an AML Officer of other funds and other related entities. He is Director, Anti-Money Laundering (2007-present) of FMR LLC (diversified financial services company) and is an employee of Fidelity Investments (1996-present).
Stacie M. Smith (1974)
Year of Election or Appointment: 2016
President and Treasurer
Ms. Smith also serves as an officer of other funds. Ms. Smith serves as Assistant Treasurer of FIMM, LLC (2021-present) and FMR Capital, Inc. (2017-present), is an employee of Fidelity Investments (2009-present), and has served in other fund officer roles. Prior to joining Fidelity Investments, Ms. Smith served as Senior Audit Manager of Ernst & Young LLP (accounting firm, 1996-2009). Previously, Ms. Smith served as Assistant Treasurer (2013-2019) and Deputy Treasurer (2013-2016) of certain Fidelity® funds.
Jim Wegmann (1979)
Year of Election or Appointment: 2019
Assistant Treasurer
Mr. Wegmann also serves as an officer of other funds. Mr. Wegmann serves as Assistant Treasurer of FIMM, LLC (2021-present) and is an employee of Fidelity Investments (2011-present). Previously, Mr. Wegmann served as Assistant Treasurer of certain Fidelity® funds (2019-2021).
Shareholder Expense Example
As a shareholder, you incur two types of costs: (1) transaction costs, which may include sales charges (loads) on purchase payments or redemption proceeds, as applicable and (2) ongoing costs, which generally include management fees, distribution and/or service (12b-1) fees and other Fund expenses. This Example is intended to help you understand your ongoing costs (in dollars) of investing in a fund and to compare these costs with the ongoing costs of investing in other mutual funds.
The Example is based on an investment of $1,000 invested at the beginning of the period and held for the entire period (February 1, 2022 to July 31, 2022).
Actual Expenses
The first line of the accompanying table provides information about actual account values and actual expenses. You may use the information in this line, together with the amount you invested, to estimate the expenses that you paid over the period. Simply divide your account value by $1,000.00 (for example, an $8,600 account value divided by $1,000.00 = 8.6), then multiply the result by the number in the first line for a class/Fund under the heading entitled "Expenses Paid During Period" to estimate the expenses you paid on your account during this period. If any fund is a shareholder of any underlying mutual funds or exchange-traded funds (ETFs) (the Underlying Funds), such fund indirectly bears its proportional share of the expenses of the Underlying Funds in addition to the direct expenses incurred presented in the table. These fees and expenses are not included in the annualized expense ratio used to calculate the expense estimate in the table below.
Hypothetical Example for Comparison Purposes
The second line of the accompanying table provides information about hypothetical account values and hypothetical expenses based on the actual expense ratio and an assumed rate of return of 5% per year before expenses, which is not the actual return. The hypothetical account values and expenses may not be used to estimate the actual ending account balance or expenses you paid for the period. You may use this information to compare the ongoing costs of investing in the Fund and other funds. To do so, compare this 5% hypothetical example with the 5% hypothetical examples that appear in the shareholder reports of the other funds. If any fund is a shareholder of any Underlying Funds, such fund indirectly bears its proportional share of the expenses of the Underlying Funds in addition to the direct expenses as presented in the table. These fees and expenses are not included in the annualized expense ratio used to calculate the expense estimate in the table below.
Please note that the expenses shown in the table are meant to highlight your ongoing costs only and do not reflect any transaction costs. Therefore, the second line of the table is useful in comparing ongoing costs only, and will not help you determine the relative total costs of owning different funds. In addition, if these transactional costs were included, your costs would have been higher.
| | Annualized Expense Ratio-A | Beginning
Account Value
February 1, 2022 | Ending
Account Value
July 31, 2022 | Expenses Paid
During Period-B
February 1, 2022
to July 31, 2022 |
| Fidelity Dividend Growth Fund | | | | |
| Dividend Growth | .47% | | | |
| Actual | | $1,000.00 | $955.60 | $2.28 |
| Hypothetical-C | | $1,000.00 | $1,022.46 | $2.36 |
| Class K | .37% | | | |
| Actual | | $1,000.00 | $956.00 | $1.79 |
| Hypothetical-C | | $1,000.00 | $1,022.96 | $1.86 |
A Annualized expense ratio reflects expenses net of applicable fee waivers.
B Expenses are equal to the annualized expense ratio, multiplied by the average account value over the period, multiplied by 181/ 365 (to reflect the one-half year period). The fees and expenses of any Underlying Funds are not included in each annualized expense ratio.
C 5% return per year before expenses
Distributions (Unaudited)
The dividend and capital gains distributions for the fund(s) are available on Fidelity.com or Institutional.Fidelity.com.
The fund hereby designates as a capital gain dividend with respect to the taxable year ended July 31, 2022, $669,674,851, or, if subsequently determined to be different, the net capital gain of such year.
The fund designates 100% of the short-term capital gain dividend distributed in September during the fiscal year as qualifying to be taxed as short-term capital gain dividends for nonresident alien shareholders.
Dividend Growth designates 17%, 99%, 100%, and 100% Class K designates 17%, 93%, 100% and 100%; of the dividends distributed in September, December, April, and July, respectively during the fiscal year as qualifying for the dividends–received deduction for corporate shareholders.
Dividend Growth designates 24%, 100%, 100%, and 100%; Class K designates 24%, 100%, 100%, and 100%; of the dividends distributed in September, December, April, and July, respectively during the fiscal year as amounts which may be taken into account as a dividend for purposes of the maximum rate under section 1(h)(11) of the Internal Revenue Code.
Dividend Growth and Class K designate 2% of the dividends distributed in September during the fiscal year as a section 199A dividend.
The fund will notify shareholders in January 2023 of amounts for use in preparing 2022 income tax returns.
Board Approval of Investment Advisory Contracts and Management Fees
Fidelity Dividend Growth Fund
Each year, the Board of Trustees, including the Independent Trustees (together, the Board), votes on the renewal of the management contract with Fidelity Management & Research Company LLC (FMR) and the sub-advisory agreements (together, the Advisory Contracts) for the fund. FMR and the sub-advisers are referred to herein as the Investment Advisers. The Board, assisted by the advice of fund counsel and Independent Trustees' counsel, requests and considers a broad range of information relevant to the renewal of the Advisory Contracts throughout the year.
The Board meets regularly and, at each of its meetings, covers an extensive agenda of topics and materials and considers factors that are relevant to its annual consideration of the renewal of the fund's Advisory Contracts, including the services and support provided to the fund and its shareholders. The Board has established various standing committees (Committees), each composed of and chaired by Independent Trustees with varying backgrounds, to which the Board has assigned specific subject matter responsibilities in order to enhance effective decision-making by the Board. The Board, acting directly and through its Committees, requests and receives information concerning the annual consideration of the renewal of the fund's Advisory Contracts. The Board also meets as needed to review matters specifically related to the Board's annual consideration of the renewal of the Advisory Contracts. Members of the Board may also meet with trustees of other Fidelity funds through joint ad hoc committees to discuss certain matters relevant to all of the Fidelity funds.
At its May 2022 meeting, the Board unanimously determined to renew the fund's Advisory Contracts. In reaching its determination, the Board considered all factors it believed relevant, including (i) the nature, extent, and quality of the services provided to the fund and its shareholders (including the investment performance of the fund); (ii) the competitiveness relative to peer funds of the fund's management fee and the total expense ratio of a representative class (retail class); (iii) the total costs of the services provided by and the profits realized by Fidelity from its relationships with the fund; and (iv) the extent to which, if any, economies of scale exist and are realized as the fund grows, and whether any economies of scale are appropriately shared with fund shareholders.
In considering whether to renew the Advisory Contracts for the fund, the Board reached a determination, with the assistance of fund counsel and Independent Trustees' counsel and through the exercise of its business judgment, that the renewal of the Advisory Contracts was in the best interests of the fund and its shareholders and that the compensation payable under the Advisory Contracts was fair and reasonable. The Board's decision to renew the Advisory Contracts was not based on any single factor, but rather was based on a comprehensive consideration of all the information provided to the Board at its meetings throughout the year. The Board, in reaching its determination to renew the Advisory Contracts, was aware that shareholders of the fund have a broad range of investment choices available to them, including a wide choice among funds offered by Fidelity's competitors, and that the fund's shareholders, who have the opportunity to review and weigh the disclosure provided by the fund in its prospectus and other public disclosures, have chosen to invest in this fund, which is part of the Fidelity family of funds.
Nature, Extent, and Quality of Services Provided. The Board considered Fidelity's staffing as it relates to the fund, including the backgrounds of investment personnel of Fidelity, and also considered the fund's investment objective, strategies, and related investment philosophy. The Independent Trustees also had discussions with senior management of Fidelity's investment operations and investment groups. The Board considered the structure of the investment personnel compensation program and whether this structure provides appropriate incentives to act in the best interests of the fund. Additionally, the Board considered the portfolio managers' investments, if any, in the funds that they manage. The Board also considered the steps Fidelity had taken to ensure the continued provision of high quality services to the Fidelity funds during the COVID-19 pandemic, including the expansion of staff in client facing positions to maintain service levels in periods of high volumes and volatility.
Resources Dedicated to Investment Management and Support Services. The Board and the Fund Oversight and Research Committees reviewed the general qualifications and capabilities of Fidelity's investment staff, including its size, education, experience, and resources, as well as Fidelity's approach to recruiting, training, managing, and compensating investment personnel. The Board noted the resources devoted to expansion of Fidelity's global investment organization, and that Fidelity's analysts have extensive resources, tools, and capabilities that allow them to conduct sophisticated quantitative and fundamental analysis, as well as credit analysis of issuers, counterparties, and guarantors. Further, the Board considered that Fidelity's investment professionals have sufficient access to global information and data so as to provide competitive investment results over time, and that those professionals also have access to sophisticated tools that permit them to assess portfolio construction and risk and performance attribution characteristics continuously, as well as to transmit new information and research conclusions rapidly around the world. Additionally, in its deliberations, the Board considered Fidelity's trading, risk management, compliance, and technology and operations capabilities and resources, which are integral parts of the investment management process.
Shareholder and Administrative Services. The Board considered (i) the nature, extent, quality, and cost of advisory, administrative, and shareholder services performed by the Investment Advisers and their affiliates under the Advisory Contracts and under separate agreements covering transfer agency, pricing and bookkeeping, and securities lending services for the fund; (ii) the nature and extent of the supervision of third party service providers, principally custodians, subcustodians, and pricing vendors; and (iii) the resources devoted to, and the record of compliance with, the fund's compliance policies and procedures. The Board also reviewed the allocation of fund brokerage, including allocations to brokers affiliated with the Investment Advisers, the use of brokerage commissions to pay fund expenses, and the use of "soft" commission dollars to pay for research services.
The Board noted that the growth of fund assets over time across the complex allows Fidelity to reinvest in the development of services designed to enhance the value and convenience of the Fidelity funds as investment vehicles. These services include 24-hour access to account information and market information over the Internet and through telephone representatives, investor education materials and asset allocation tools. The Board also considered that it reviews customer service metrics such as telephone response times, continuity of services on the website and metrics addressing services at Fidelity Investor Centers.
Investment in a Large Fund Family. The Board considered the benefits to shareholders of investing in a Fidelity fund, including the benefits of investing in a fund that is part of a large family of funds offering a variety of investment disciplines and providing a large variety of mutual fund investor services. The Board noted that Fidelity had taken, or had made recommendations that resulted in the Fidelity funds taking, a number of actions over the previous year that benefited particular funds, including: (i) continuing to dedicate additional resources to Fidelity's investment research process, which includes meetings with management of issuers of securities in which the funds invest; (ii) continuing efforts to enhance Fidelity's global research capabilities; (iii) launching new funds and ETFs with innovative structures, strategies and pricing and making other enhancements to meet client needs; (iv) launching new share classes of existing funds; (v) eliminating purchase minimums and broadening eligibility requirements for certain funds and share classes; (vi) reducing management fees and total expenses for certain target date funds and classes and index funds; (vii) lowering expenses for certain existing funds and classes by implementing or lowering expense caps; (viii) rationalizing product lines and gaining increased efficiencies from fund mergers and liquidations; (ix) continuing to develop, acquire and implement systems and technology to improve services to the funds and shareholders, strengthen information security, and increase efficiency; and (x) continuing to implement enhancements to further strengthen Fidelity's product line to increase investors' probability of success in achieving their investment goals, including retirement income goals.
Investment Performance. The Board considered whether the fund has operated in accordance with its investment objective, as well as its record of compliance with its investment restrictions and its performance history. The Board noted that the fund had a portfolio manager change in January 2021. The Board will continue to monitor closely the fund's performance, taking into account the portfolio manager change.
The Board took into account discussions that occur at Board meetings throughout the year with representatives of the Investment Advisers about fund investment performance. In this regard the Board noted that as part of regularly scheduled fund reviews and other reports to the Board on fund performance, the Board considers annualized return information for the fund for different time periods, measured against an appropriate securities market index (benchmark index) and an appropriate peer group of funds with similar objectives (peer group). The Board also reviews and considers information about performance attribution. In its evaluation of fund investment performance, the Board gave particular attention to information indicating changes in performance of certain Fidelity funds for specific time periods and discussed with the Investment Advisers the reasons for any overperformance or underperformance.
In addition to reviewing absolute and relative fund performance, the Independent Trustees periodically consider the appropriateness of fund performance metrics in evaluating the results achieved. In general, the Independent Trustees believe that fund performance should be evaluated based on net performance (after fees and expenses) of the representative class, compared to appropriate benchmark indices, over appropriate time periods that may include full market cycles, and compared to peer groups, as applicable, over the same periods, taking into account relevant factors including the following: general market conditions; issuer-specific information; and fund cash flows and other factors.
The Independent Trustees recognize that shareholders evaluate performance on a net basis over their own holding periods, for which one-, three-, and five-year periods are often used as a proxy. For this reason, the performance information reviewed by the Board also included net cumulative total return information for the fund and an appropriate benchmark index and peer group for the most recent one-, three-, and five-year periods ended September 30, 2021, as shown below. Returns are shown compared to the 25th percentile (top of box, 75% beaten) and 75th percentile (bottom of box, 25% beaten) of the peer universe.
Fidelity Dividend Growth Fund
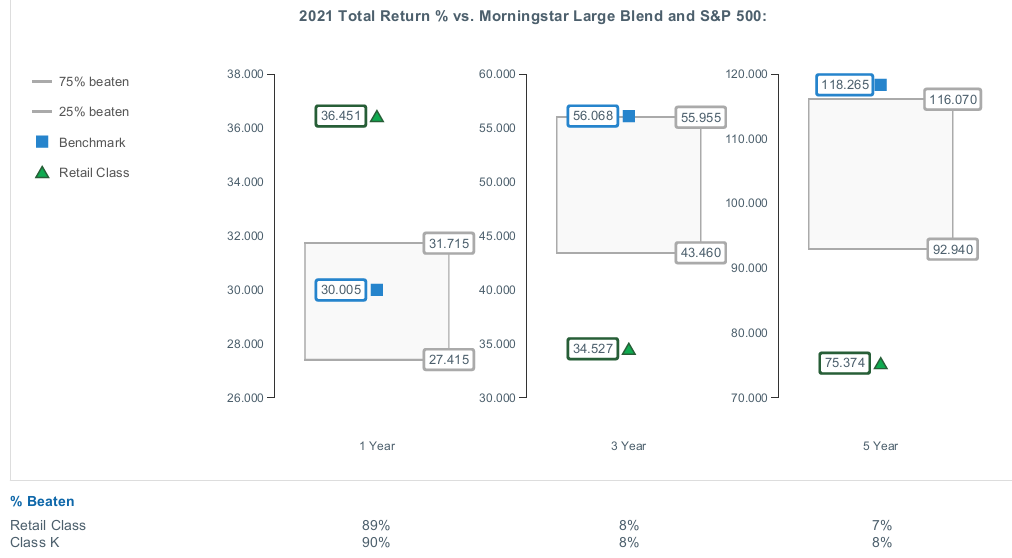
The Board also considered that the fund's management fee is subject to upward or downward adjustment depending upon whether, and to what extent, the fund's investment performance for the performance period (a rolling 36-month period) exceeds, or is exceeded by, a securities index, thus leading to a performance adjustment for the same period. The Board noted that the performance adjustment provides FMR with a strong economic incentive to seek to achieve superior long-term performance for the fund's shareholders and helps to more closely align the interests of FMR and the shareholders of the fund.
Based on its review, the Board concluded that the nature, extent, and quality of services provided to the fund under the Advisory Contracts should continue to benefit the shareholders of the fund.
Competitiveness of Management Fee and Total Expense Ratio. The Board considered the fund's management fee and total expense ratio compared to "mapped groups" of competitive funds and classes created for the purpose of facilitating the Trustees' competitive analysis of management fees and total expenses. Fidelity creates "mapped groups" by combining similar Lipper investment objective categories that have comparable investment mandates. Combining Lipper investment objective categories aids the Board's management fee and total expense ratio comparisons by broadening the competitive group used for comparison.
Management Fee. The Board considered two proprietary management fee comparisons for the 12-month periods ended September 30 (June 30 for periods ended 2019 and 2018 and December 31 for periods prior to 2018) shown in basis points (BP) in the chart below. The group of Lipper funds used by the Board for management fee comparisons is referred to below as the "Total Mapped Group." The Total Mapped Group comparison focuses on a fund's standing in terms of gross management fees before expense reimbursements or caps, and without giving effect to the fund's performance adjustment, relative to the total universe of funds with comparable investment mandates, regardless of whether their management fee structures also are comparable. Funds with comparable investment mandates offer exposure to similar types of securities. Funds with comparable management fee structures have similar management fee contractual arrangements (
e.g., flat rate charged for advisory services, all-inclusive fee rate,
etc.). "TMG %" represents the percentage of funds in the Total Mapped Group that had management fees that were lower than the fund's. For example, a hypothetical TMG % of 20% would mean that 80% of the funds in the Total Mapped Group had higher, and 20% had lower, management fees than the fund. The fund's actual TMG %s and the number of funds in the Total Mapped Group are in the chart below. The "Asset-Sized Peer Group" (ASPG) comparison focuses on a fund's standing relative to a subset of non-Fidelity funds within the Total Mapped Group that are similar in size and management fee structure without taking into account performance adjustments, if any. For example, if a fund is in the first quartile of the ASPG, the fund's management fee ranks in the least expensive or lowest 25% of funds in the ASPG. The ASPG represents at least 15% of the funds in the Total Mapped Group with comparable asset size and management fee structures, subject to a minimum of 50 funds (or all funds in the Total Mapped Group if fewer than 50). Additional information, such as the ASPG quartile in which the fund's management fee rate ranked and the impact of the fund's performance adjustment, is also included in the chart and was considered by the Board.
Fidelity Dividend Growth Fund
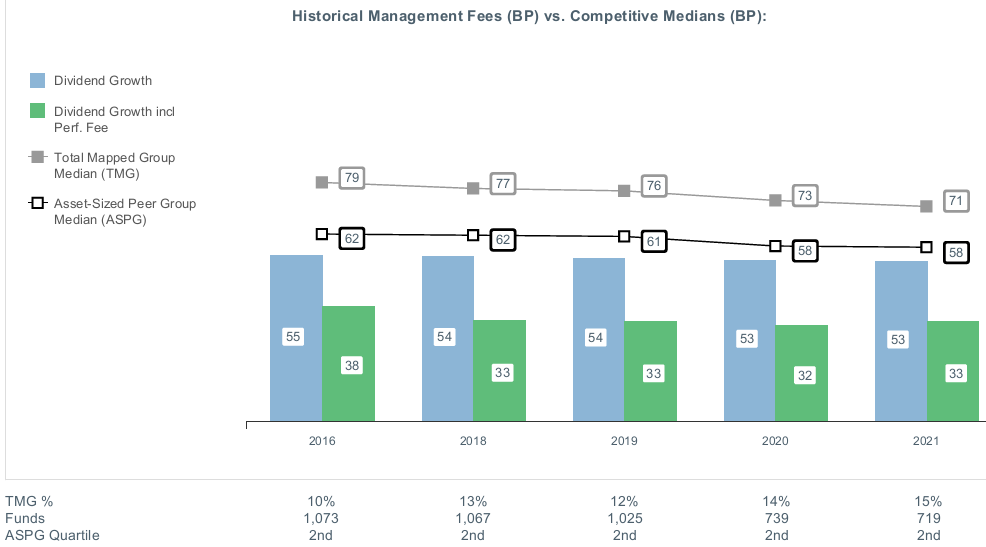
The Board noted that the fund's management fee rate ranked below the median of its Total Mapped Group and below the median of its ASPG for the 12-month period ended September 30, 2021. The Board also noted the effect of the fund's performance adjustment, if any, on the fund's management fee ranking.
The Board also considered that, for funds subject to the group fee, FMR agreed to voluntarily waive fees over a specified period of time in amounts designed to account for assets converted from certain funds to certain collective investment trusts.
Based on its review, the Board concluded that the fund's management fee is fair and reasonable in light of the services that the fund receives and the other factors considered.
Total Expense Ratio. In its review of each class's total expense ratio of the representative class (retail class), the Board considered the fund's management fee rate as well as other fund or class expenses, as applicable, such as transfer agent fees, pricing and bookkeeping fees, and custodial, legal, and audit fees. The Board noted the impact of the fund's performance adjustment. The Board also noted that Fidelity may agree to waive fees or reimburse expenses from time to time, and the extent to which, if any, it has done so for the fund. The fund's representative class is compared to those funds and classes in the Total Mapped Group (used by the Board for management fee comparisons) that have a similar sales load structure. The Board also considered a total expense ASPG comparison for the representative class, which focuses on the total expenses of the representative class relative to a subset of non-Fidelity funds within the total expense similar sales load structure group. The total expense ASPG is limited to 15 larger and 15 smaller classes in fund average assets for a total of 30 classes, where possible. The total expense ASPG comparison excludes performance adjustments and fund-paid 12b-1 fees to eliminate variability in fee structures.
The Board noted that the total net expense ratio of the retail class ranked below the similar sales load structure group competitive median and below the ASPG competitive median for the 12-month period ended September 30, 2021.
Fees Charged to Other Fidelity Clients. The Board also considered Fidelity fee structures and other information with respect to clients of Fidelity, such as other funds advised or subadvised by Fidelity, pension plan clients, and other institutional clients with similar mandates. The Board noted that a joint ad hoc committee created by it and the boards of other Fidelity funds periodically reviews and compares Fidelity's institutional investment advisory business with its business of providing services to the Fidelity funds and also noted the most recent findings of the committee. The Board noted that the committee's review included a consideration of the differences in services provided, fees charged, and costs incurred, as well as competition in the markets serving the different categories of clients.
Based on its review of total expense ratios and fees charged to other Fidelity clients, the Board concluded that the total expense ratio of each class of the fund was reasonable in light of the services that the fund and its shareholders receive and the other factors considered.
Costs of the Services and Profitability. The Board considered the revenues earned and the expenses incurred by Fidelity in conducting the business of developing, marketing, distributing, managing, administering and servicing the fund and servicing the fund's shareholders. The Board also considered the level of Fidelity's profits in respect of all the Fidelity funds.
On an annual basis, Fidelity presents to the Board information about the profitability of its relationships with the fund. Fidelity calculates profitability information for each fund, as well as aggregate profitability information for groups of Fidelity funds and all Fidelity funds, using a series of detailed revenue and cost allocation methodologies which originate with the books and records of Fidelity on which Fidelity's audited financial statements are based. The Audit Committee of the Board reviews any significant changes from the prior year's methodologies and the full Board approves such changes.
A public accounting firm has been engaged annually by the Board as part of the Board's assessment of Fidelity's profitability analysis. The engagement includes the review and assessment of the methodologies used by Fidelity in determining the revenues and expenses attributable to Fidelity's mutual fund business, and completion of agreed-upon procedures in respect of the mathematical accuracy of certain fund profitability information and its conformity to established allocation methodologies. After considering the reports issued under the engagement and information provided by Fidelity, the Board concluded that while other allocation methods may also be reasonable, Fidelity's profitability methodologies are reasonable in all material respects.
The Board also reviewed Fidelity's non-fund businesses and potential indirect benefits such businesses may have received as a result of their association with Fidelity's mutual fund business (i.e., fall-out benefits) as well as cases where Fidelity's affiliates may benefit from the funds' business. The Board considered areas where potential indirect benefits to the Fidelity funds from their relationships with Fidelity may exist. The Board's consideration of these matters was informed by the findings of a joint ad hoc committee created by it and the boards of other Fidelity funds to evaluate potential fall-out benefits.
The Board considered the costs of the services provided by and the profits realized by Fidelity in connection with the operation of the fund and was satisfied that the profitability was not excessive.
Economies of Scale. The Board considered whether there have been economies of scale in respect of the management of the Fidelity funds, whether the Fidelity funds (including the fund) have appropriately benefited from any such economies of scale, and whether there is potential for realization of any further economies of scale. The Board considered the extent to which the fund will benefit from economies of scale as assets grow through increased services to the fund, through waivers or reimbursements, or through fee or expense ratio reductions. The Board also noted that a committee (the Economies of Scale Committee) created by it and the boards of other Fidelity funds periodically analyzes whether Fidelity attains economies of scale in respect of the management and servicing of the Fidelity funds, whether the Fidelity funds have appropriately benefited from such economies of scale, and whether there is potential for realization of any further economies of scale.
The Board recognized that the fund's management contract incorporates a "group fee" structure, which provides for lower group fee rates as total "group assets" increase, and for higher group fee rates as total "group assets" decrease ("group assets" as defined in the management contract). FMR calculates the group fee rates based on a tiered asset "breakpoint" schedule that varies based on asset class. The Board considered that the group fee is designed to deliver the benefits of economies of scale to fund shareholders when total Fidelity fund assets increase, even if assets of any particular fund are unchanged or have declined, because some portion of Fidelity's costs are attributable to services provided to all Fidelity funds, and all funds benefit if those costs can be allocated among more assets. The Board further considered that Fidelity agreed to impose a temporary fee waiver in the form of additional breakpoints to the current breakpoint schedule. The Board concluded that, given the group fee structure, fund shareholders will benefit from lower management fees as "group assets" increase at the fund complex level, regardless of whether Fidelity achieves any such economies of scale.
The Board concluded, taking into account the analysis of the Economies of Scale Committee, that economies of scale, if any, are being appropriately shared between fund shareholders and Fidelity.
Additional Information Requested by the Board. In order to develop fully the factual basis for consideration of the Fidelity funds' advisory contracts, the Board requested and received additional information on certain topics, including: (i) fund flow and performance trends, in particular the underperformance of certain funds and strategies, and Fidelity's long-term strategies for certain funds, including any consideration of fund liquidations or mergers; (ii) the operation of performance fees, competitor use of performance fees, and consideration of the expansion of performance fees to additional funds; (iii) Fidelity's pricing philosophy compared to competitors; (iv) fund profitability methodology and data; (v) evaluation of competitive fund data and peer group classifications and fee and expense comparisons; (vi) the management fee and expense structures for different funds and classes and information about the differences between various fee and expense structures; (vii) group fee breakpoints and related voluntary fee waivers; and (viii) information regarding other accounts managed by Fidelity and the funds' sub-advisory arrangements.
Based on its evaluation of all of the conclusions noted above, and after considering all factors it believed relevant, the Board concluded that the advisory fee arrangements are fair and reasonable and that the fund's Advisory Contracts should be renewed.
Liquidity Risk Management Program
The Securities and Exchange Commission adopted Rule 22e-4 under the Investment Company Act of 1940 (the Liquidity Rule) to promote effective liquidity risk management throughout the open-end investment company industry, thereby reducing the risk that funds will be unable to meet their redemption obligations and mitigating dilution of the interests of fund shareholders.
The Fund has adopted and implemented a liquidity risk management program pursuant to the Liquidity Rule (the Program) effective December 1, 2018. The Program is reasonably designed to assess and manage the Fund’s liquidity risk and to comply with the requirements of the Liquidity Rule. The Fund’s Board of Trustees (the Board) has designated the Fund’s investment adviser as administrator of the Program. The Fidelity advisers have established a Liquidity Risk Management Committee (the LRM Committee) to manage the Program for each of the Fidelity Funds. The LRM Committee monitors the adequacy and effectiveness of implementation of the Program and on a periodic basis assesses each Fund’s liquidity risk based on a variety of factors including (1) the Fund’s investment strategy, (2) portfolio liquidity and cash flow projections during normal and reasonably foreseeable stressed conditions, (3) shareholder redemptions, (4) borrowings and other funding sources and (5) in the case of exchange-traded funds, certain additional factors including the effect of the Fund’s prices and spreads, market participants, and basket compositions on the overall liquidity of the Fund’s portfolio, as applicable.
In accordance with the Program, each of the Fund’s portfolio investments is classified into one of four liquidity categories described below based on a determination of a reasonable expectation for how long it would take to convert the investment to cash (or sell or dispose of the investment) without significantly changing its market value.
- Highly liquid investments – cash or convertible to cash within three business days or less
- Moderately liquid investments – convertible to cash in three to seven calendar days
- Less liquid investments – can be sold or disposed of, but not settled, within seven calendar days
- Illiquid investments – cannot be sold or disposed of within seven calendar days
Liquidity classification determinations take into account a variety of factors including various market, trading and investment-specific considerations, as well as market depth, and generally utilize analysis from a third-party liquidity metrics service.
The Liquidity Rule places a 15% limit on a fund’s illiquid investments and requires funds that do not primarily hold assets that are highly liquid investments to determine and maintain a minimum percentage of the fund’s net assets to be invested in highly liquid investments (highly liquid investment minimum or HLIM). The Program includes provisions reasonably designed to comply with the 15% limit on illiquid investments and for determining, periodically reviewing and complying with the HLIM requirement as applicable.
At a recent meeting of the Fund’s Board of Trustees, the LRM Committee provided a written report to the Board pertaining to the operation, adequacy, and effectiveness of implementation of the Program for the annual period from December 1, 2020 through November 30, 2021. The report concluded that the Program has been implemented and is operating effectively and is reasonably designed to assess and manage the Fund’s liquidity risk.
DGF-ANN-0922
1.536090.125
Fidelity® Growth & Income Portfolio
Annual Report
July 31, 2022
Contents
To view a fund's proxy voting guidelines and proxy voting record for the 12-month period ended June 30, visit http://www.fidelity.com/proxyvotingresults or visit the Securities and Exchange Commission's (SEC) web site at http://www.sec.gov.
You may also call 1-800-544-8544 if you’re an individual investing directly with Fidelity, call 1-800-835-5092 if you’re a plan sponsor or participant with Fidelity as your recordkeeper or call 1-877-208-0098 on institutional accounts or if you’re an advisor or invest through one to request a free copy of the proxy voting guidelines.
Standard & Poor's, S&P and S&P 500 are registered service marks of The McGraw-Hill Companies, Inc. and have been licensed for use by Fidelity Distributors Corporation.
Other third-party marks appearing herein are the property of their respective owners.
All other marks appearing herein are registered or unregistered trademarks or service marks of FMR LLC or an affiliated company. © 2022 FMR LLC. All rights reserved.
This report and the financial statements contained herein are submitted for the general information of the shareholders of the Fund. This report is not authorized for distribution to prospective investors in the Fund unless preceded or accompanied by an effective prospectus.
A fund files its complete schedule of portfolio holdings with the SEC for the first and third quarters of each fiscal year on Form N-PORT. Forms N-PORT are available on the SEC’s web site at http://www.sec.gov. A fund's Forms N-PORT may be reviewed and copied at the SEC’s Public Reference Room in Washington, DC. Information regarding the operation of the SEC's Public Reference Room may be obtained by calling 1-800-SEC-0330.
For a complete list of a fund's portfolio holdings, view the most recent holdings listing, semiannual report, or annual report on Fidelity's web site at http://www.fidelity.com, http://www.institutional.fidelity.com, or http://www.401k.com, as applicable.
NOT FDIC INSURED •MAY LOSE VALUE •NO BANK GUARANTEE
Neither the Fund nor Fidelity Distributors Corporation is a bank.
Note to Shareholders:
Early in 2020, the outbreak and spread of COVID-19 emerged as a public health emergency that had a major influence on financial markets, primarily based on its impact on the global economy and corporate earnings. On March 11, 2020, the World Health Organization declared the COVID-19 outbreak a pandemic, citing sustained risk of further global spread. The pandemic prompted a number of measures to limit the spread of COVID-19, including travel and border restrictions, quarantines, and restrictions on large gatherings. In turn, these resulted in lower consumer activity, diminished demand for a wide range of products and services, disruption in manufacturing and supply chains, and – given the wide variability in outcomes regarding the outbreak – significant market uncertainty and volatility. To help stem the turmoil, the U.S. government took unprecedented action – in concert with the U.S. Federal Reserve and central banks around the world – to help support consumers, businesses, and the broader economy, and to limit disruption to the financial system.
In general, the overall impact of the pandemic lessened in 2021, amid a resilient economy and widespread distribution of three COVID-19 vaccines granted emergency use authorization from the U.S. Food and Drug Administration (FDA) early in the year. Still, the situation remains dynamic, and the extent and duration of its influence on financial markets and the economy is highly uncertain, due in part to a recent spike in cases based on highly contagious variants of the coronavirus.
Extreme events such as the COVID-19 crisis are exogenous shocks that can have significant adverse effects on mutual funds and their investments. Although multiple asset classes may be affected by market disruption, the duration and impact may not be the same for all types of assets. Fidelity is committed to helping you stay informed amid news about COVID-19 and during increased market volatility, and we continue to take extra steps to be responsive to customer needs. We encourage you to visit us online, where we offer ongoing updates, commentary, and analysis on the markets and our funds.
Performance: The Bottom Line
Average annual total return reflects the change in the value of an investment, assuming reinvestment of distributions from dividend income and capital gains (the profits earned upon the sale of securities that have grown in value, if any) and assuming a constant rate of performance each year. The hypothetical investment and the average annual total returns do not reflect the deduction of taxes that a shareholder would pay on fund distributions or the redemption of fund shares. During periods of reimbursement by Fidelity, a fund’s total return will be greater than it would be had the reimbursement not occurred. How a fund did yesterday is no guarantee of how it will do tomorrow.
Average Annual Total Returns
| For the periods ended July 31, 2022 | Past 1 year | Past 5 years | Past 10 years |
| Fidelity® Growth & Income Portfolio | 0.26% | 10.72% | 12.33% |
| Class K | 0.33% | 10.83% | 12.45% |
$10,000 Over 10 Years
Let's say hypothetically that $10,000 was invested in Fidelity® Growth & Income Portfolio, a class of the fund, on July 31, 2012.
The chart shows how the value of your investment would have changed, and also shows how the S&P 500® Index performed over the same period.

| Period Ending Values |
| $31,992 | Fidelity® Growth & Income Portfolio |
| $36,428 | S&P 500® Index |
Management's Discussion of Fund Performance
Market Recap: The S&P 500
® index returned -4.64% for the 12 months ending July 31, 2022, as a multitude of crosscurrents challenged the global economy and financial markets. Persistently high inflation, exacerbated by energy price shocks from the Russia–Ukraine conflict, spurred the U.S. Federal Reserve to hike interest rates more aggressively than anticipated, and concerns about the outlook for economic growth sent stocks into bear market territory. In early May, the Fed approved a rare half-percentage-point interest rate increase and announced plans to shrink its $9 trillion asset portfolio. June began with the Fed allowing up to billions in Treasuries and mortgage bonds to mature every month without investing the proceeds. Two weeks later, the central bank raised rates by 0.75 percentage points, its largest increase since 1994, and said it was becoming more difficult to achieve a soft landing, in which the economy slows enough to bring down inflation while avoiding a recession. Against this volatile backdrop, the S&P 500 posted its worst first-half result (-19.96%) to begin a year since 1970. Stocks sharply reversed course in July (+9.22%), as the Fed again raised its benchmark interest rate by 0.75% but signaled that, at some point, it will likely slow the pace of tightening to assess the impact on the economy. For the full 12 months, growth-oriented communication services (-29%) and consumer discretionary (-10%) stocks lagged most. In contrast, energy (+67%) rode a surge in commodity prices and led by a wide margin, followed by the defensive utilities (+16%) and consumer staples (+7%) sectors.
Comments from Portfolio Manager Matt Fruhan: For the fiscal year ending July 31, 2022, the fund's share classes returned about 0%, outperforming the -4.64% result of the benchmark S&P 500
® index. The primary contributors to performance versus the benchmark were an overweighting and stock selection in energy. Strong picks in the health care sector, especially within the health care equipment & services industry, also bolstered the fund's relative result. Also helping relative performance was an underweight in the communication services sector, primarily driven by the media & entertainment industry. The fund's foreign holdings also contributed overall, despite continued U.S.-dollar strength. The biggest individual relative contributor by far was an overweight position in Exxon Mobil (+77%). Exxon Mobil was the fund's largest holding as of period end. Our second-largest relative contributor this period was avoiding Meta Platforms, a benchmark component that returned approximately -55%. The fund's non-benchmark stake in Cenovus Energy gained 130% and helped relative performance. Conversely, the biggest detractor from performance versus the benchmark was security selection in industrials. An underweighting in utilities and stock selection in materials also hindered the fund's relative performance. The biggest individual relative detractor was an overweight position in General Electric (-28%). General Electric was among our biggest holdings. Another notable relative detractor was an outsized stake in Comcast (-35%), which was among the fund's largest holdings. Avoiding Tesla, a benchmark component that gained about 30%, also hurt relative performance. Notable changes in positioning include increased exposure to the energy sector and a lower allocation to communication services.
The views expressed above reflect those of the portfolio manager(s) only through the end of the period as stated on the cover of this report and do not necessarily represent the views of Fidelity or any other person in the Fidelity organization. Any such views are subject to change at any time based upon market or other conditions and Fidelity disclaims any responsibility to update such views. These views may not be relied on as investment advice and, because investment decisions for a Fidelity fund are based on numerous factors, may not be relied on as an indication of trading intent on behalf of any Fidelity fund.
Investment Summary (Unaudited)
Top Ten Stocks as of July 31, 2022
| | % of fund's net assets |
| Exxon Mobil Corp. | 7.4 |
| Microsoft Corp. | 6.4 |
| Wells Fargo & Co. | 5.4 |
| General Electric Co. | 4.4 |
| Apple, Inc. | 3.5 |
| Bank of America Corp. | 2.8 |
| Comcast Corp. Class A | 2.0 |
| Bristol-Myers Squibb Co.(a) | 1.9 |
| Hess Corp.(a) | 1.8 |
| Visa, Inc. Class A | 1.7 |
| | 37.3 |
(a) Security or a portion of the security is pledged as collateral for call options written.
Market Sectors as of July 31, 2022
| | % of fund's net assets |
| Information Technology | 19.5 |
| Financials | 16.5 |
| Industrials | 15.5 |
| Health Care | 13.8 |
| Energy | 12.8 |
| Consumer Staples | 6.2 |
| Communication Services | 5.1 |
| Consumer Discretionary | 2.7 |
| Materials | 2.3 |
| Utilities | 1.5 |
| Real Estate | 1.1 |
Asset Allocation (% of fund's net assets)
| As of July 31, 2022*,** |
| | Stocks | 96.6% |
| | Convertible Securities | 0.3% |
| | Other Investments | 0.1% |
| | Short-Term Investments and Net Other Assets (Liabilities) | 3.0% |

* Foreign investments - 14.1%
** Written options - (0.0)%
Geographic Diversification (% of fund's net assets)
| As of July 31, 2022 |
| | United States of America* | 85.9% |
| | Canada | 4.0% |
| | United Kingdom | 1.9% |
| | Netherlands | 1.7% |
| | Germany | 1.6% |
| | France | 1.1% |
| | Spain | 0.8% |
| | Switzerland | 0.5% |
| | Sweden | 0.5% |
| | Other | 2.0% |

* Includes Short-Term investments and Net Other Assets (Liabilities).
Percentages are based on country or territory of incorporation and are adjusted for the effect of futures contracts, if applicable.
Percentages shown as 0.0% may reflect amounts less than 0.05%.
Schedule of Investments July 31, 2022
Showing Percentage of Net Assets
| Common Stocks - 96.6% | | | |
| | | Shares | Value (000s) |
| COMMUNICATION SERVICES - 5.1% | | | |
| Diversified Telecommunication Services - 0.8% | | | |
| Cellnex Telecom SA (a) | | 459,900 | $20,571 |
| Elisa Corp. (A Shares) | | 113,800 | 6,285 |
| Verizon Communications, Inc. | | 767,174 | 35,436 |
| | | | 62,292 |
| Entertainment - 1.7% | | | |
| Activision Blizzard, Inc. | | 168,450 | 13,468 |
| Nintendo Co. Ltd. ADR | | 261,200 | 14,627 |
| The Walt Disney Co. (b) | | 457,090 | 48,497 |
| Universal Music Group NV | | 1,751,900 | 39,657 |
| Warner Music Group Corp. Class A | | 411,600 | 12,348 |
| | | | 128,597 |
| Media - 2.6% | | | |
| Comcast Corp. Class A | | 4,109,612 | 154,193 |
| Interpublic Group of Companies, Inc. | | 1,618,531 | 48,346 |
| | | | 202,539 |
|
| TOTAL COMMUNICATION SERVICES | | | 393,428 |
|
| CONSUMER DISCRETIONARY - 2.7% | | | |
| Auto Components - 0.4% | | | |
| BorgWarner, Inc. | | 742,652 | 28,562 |
| Hotels, Restaurants & Leisure - 0.7% | | | |
| Churchill Downs, Inc. | | 106,100 | 22,260 |
| Marriott International, Inc. Class A | | 109,923 | 17,458 |
| Starbucks Corp. | | 143,260 | 12,146 |
| | | | 51,864 |
| Household Durables - 0.2% | | | |
| Sony Group Corp. sponsored ADR | | 128,714 | 10,991 |
| Whirlpool Corp. | | 34,394 | 5,946 |
| | | | 16,937 |
| Multiline Retail - 0.1% | | | |
| Target Corp. | | 65,900 | 10,767 |
| Specialty Retail - 1.2% | | | |
| Lowe's Companies, Inc. | | 451,314 | 86,440 |
| TJX Companies, Inc. | | 12,200 | 746 |
| Williams-Sonoma, Inc. | | 11,200 | 1,618 |
| | | | 88,804 |
| Textiles, Apparel & Luxury Goods - 0.1% | | | |
| NIKE, Inc. Class B | | 28,100 | 3,229 |
| Puma AG | | 90,754 | 6,087 |
| Tapestry, Inc. | | 3,700 | 124 |
| | | | 9,440 |
|
| TOTAL CONSUMER DISCRETIONARY | | | 206,374 |
|
| CONSUMER STAPLES - 6.2% | | | |
| Beverages - 2.5% | | | |
| Diageo PLC sponsored ADR | | 216,911 | 41,517 |
| Keurig Dr. Pepper, Inc. | | 982,600 | 38,066 |
| Pernod Ricard SA | | 62,400 | 12,213 |
| Remy Cointreau SA | | 36,314 | 7,148 |
| Remy Cointreau SA rights 9/19/22 (b)(c) | | 36,314 | 37 |
| The Coca-Cola Co. | | 1,406,710 | 90,269 |
| | | | 189,250 |
| Food & Staples Retailing - 1.2% | | | |
| Alimentation Couche-Tard, Inc. Class A (multi-vtg.) | | 44,400 | 1,984 |
| Sysco Corp. | | 744,636 | 63,220 |
| Walmart, Inc. | | 240,800 | 31,798 |
| | | | 97,002 |
| Food Products - 0.3% | | | |
| Lamb Weston Holdings, Inc. | | 308,360 | 24,564 |
| Household Products - 0.3% | | | |
| Colgate-Palmolive Co. | | 62,300 | 4,906 |
| Kimberly-Clark Corp. | | 12,500 | 1,647 |
| Spectrum Brands Holdings, Inc. | | 228,683 | 15,903 |
| | | | 22,456 |
| Personal Products - 0.2% | | | |
| Haleon PLC sponsored ADR (b) | | 1,998,911 | 14,052 |
| Tobacco - 1.7% | | | |
| Altria Group, Inc. | | 2,091,767 | 91,745 |
| Swedish Match Co. AB | | 3,942,600 | 41,273 |
| | | | 133,018 |
|
| TOTAL CONSUMER STAPLES | | | 480,342 |
|
| ENERGY - 12.7% | | | |
| Energy Equipment & Services - 0.0% | | | |
| Baker Hughes Co. Class A | | 59,500 | 1,529 |
| Oil, Gas & Consumable Fuels - 12.7% | | | |
| Canadian Natural Resources Ltd. | | 514,415 | 28,405 |
| Cenovus Energy, Inc. (Canada) | | 5,365,573 | 102,237 |
| Energy Transfer LP | | 138,600 | 1,568 |
| Enterprise Products Partners LP | | 103,500 | 2,767 |
| Exxon Mobil Corp. | | 5,821,399 | 564,269 |
| Hess Corp. (d) | | 1,229,364 | 138,267 |
| Imperial Oil Ltd. | | 788,126 | 37,771 |
| Kosmos Energy Ltd. (b) | | 4,011,375 | 25,432 |
| Phillips 66 Co. | | 179,987 | 16,019 |
| Tourmaline Oil Corp. | | 887,600 | 55,611 |
| | | | 972,346 |
|
| TOTAL ENERGY | | | 973,875 |
|
| FINANCIALS - 16.5% | | | |
| Banks - 11.9% | | | |
| Bank of America Corp. | | 6,327,036 | 213,917 |
| JPMorgan Chase & Co. | | 543,275 | 62,672 |
| M&T Bank Corp. | | 119,194 | 21,151 |
| PNC Financial Services Group, Inc. | | 496,701 | 82,423 |
| Truist Financial Corp. | | 1,395,932 | 70,453 |
| U.S. Bancorp | | 1,053,237 | 49,713 |
| Wells Fargo & Co. | | 9,468,070 | 415,364 |
| | | | 915,693 |
| Capital Markets - 3.1% | | | |
| Ashmore Group PLC | | 1,225,000 | 3,219 |
| Brookfield Asset Management, Inc. Class A | | 300,902 | 14,940 |
| Intercontinental Exchange, Inc. | | 12,600 | 1,285 |
| KKR & Co. LP | | 505,852 | 28,055 |
| Morgan Stanley | | 342,151 | 28,843 |
| Northern Trust Corp. | | 791,653 | 78,991 |
| Raymond James Financial, Inc. | | 386,170 | 38,026 |
| S&P Global, Inc. | | 1,100 | 415 |
| State Street Corp. | | 638,291 | 45,344 |
| | | | 239,118 |
| Consumer Finance - 0.2% | | | |
| Discover Financial Services | | 128,468 | 12,975 |
| Insurance - 0.9% | | | |
| American Financial Group, Inc. | | 40,800 | 5,454 |
| Brookfield Asset Management Reinsurance Partners Ltd. | | 2,086 | 104 |
| Chubb Ltd. | | 119,756 | 22,591 |
| Marsh & McLennan Companies, Inc. | | 162,070 | 26,573 |
| Old Republic International Corp. | | 213,800 | 4,975 |
| The Travelers Companies, Inc. | | 82,627 | 13,113 |
| | | | 72,810 |
| Thrifts & Mortgage Finance - 0.4% | | | |
| Essent Group Ltd. | | 246,323 | 10,286 |
| Radian Group, Inc. | | 741,568 | 16,589 |
| | | | 26,875 |
|
| TOTAL FINANCIALS | | | 1,267,471 |
|
| HEALTH CARE - 13.5% | | | |
| Biotechnology - 0.0% | | | |
| Intercept Pharmaceuticals, Inc. (b) | | 204,504 | 2,609 |
| Health Care Equipment & Supplies - 1.4% | | | |
| Abbott Laboratories | | 42,500 | 4,626 |
| Becton, Dickinson & Co. | | 102,086 | 24,941 |
| Boston Scientific Corp. (b) | | 1,274,696 | 52,326 |
| GN Store Nord A/S | | 48,000 | 1,664 |
| Koninklijke Philips Electronics NV (depositary receipt) (NY Reg.) | | 858,851 | 17,813 |
| Sonova Holding AG | | 24,692 | 8,846 |
| | | | 110,216 |
| Health Care Providers & Services - 6.1% | | | |
| Cardinal Health, Inc. | | 781,711 | 46,559 |
| Cigna Corp. | | 362,154 | 99,723 |
| CVS Health Corp. | | 798,112 | 76,363 |
| Humana, Inc. | | 37,100 | 17,882 |
| McKesson Corp. | | 279,834 | 95,586 |
| UnitedHealth Group, Inc. | | 237,687 | 128,907 |
| | | | 465,020 |
| Life Sciences Tools & Services - 0.4% | | | |
| Danaher Corp. | | 95,103 | 27,720 |
| Pharmaceuticals - 5.6% | | | |
| Bayer AG | | 800,735 | 46,707 |
| Bristol-Myers Squibb Co. (d) | | 1,987,636 | 146,648 |
| Eli Lilly & Co. | | 85,448 | 28,171 |
| GSK PLC sponsored ADR | | 1,599,128 | 67,435 |
| Johnson & Johnson | | 616,089 | 107,520 |
| Sanofi SA sponsored ADR | | 290,597 | 14,443 |
| UCB SA | | 248,600 | 19,386 |
| Viatris, Inc. | | 86,400 | 837 |
| | | | 431,147 |
|
| TOTAL HEALTH CARE | | | 1,036,712 |
|
| INDUSTRIALS - 15.5% | | | |
| Aerospace & Defense - 3.0% | | | |
| Airbus Group NV | | 356,400 | 38,428 |
| General Dynamics Corp. | | 138,461 | 31,385 |
| Huntington Ingalls Industries, Inc. | | 103,184 | 22,374 |
| MTU Aero Engines AG | | 51,500 | 9,901 |
| Raytheon Technologies Corp. | | 189,325 | 17,647 |
| Safran SA | | 117,300 | 12,893 |
| The Boeing Co. (b) | | 607,720 | 96,816 |
| | | | 229,444 |
| Air Freight & Logistics - 2.1% | | | |
| DSV A/S | | 37,500 | 6,319 |
| Expeditors International of Washington, Inc. | | 8,400 | 893 |
| FedEx Corp. | | 106,674 | 24,865 |
| United Parcel Service, Inc. Class B | | 649,199 | 126,522 |
| | | | 158,599 |
| Airlines - 0.0% | | | |
| Copa Holdings SA Class A (b) | | 30,400 | 2,043 |
| Building Products - 0.4% | | | |
| A.O. Smith Corp. | | 103,800 | 6,567 |
| Johnson Controls International PLC | | 447,411 | 24,120 |
| | | | 30,687 |
| Commercial Services & Supplies - 0.5% | | | |
| GFL Environmental, Inc. | | 1,054,800 | 29,192 |
| Healthcare Services Group, Inc. | | 704,598 | 10,104 |
| Ritchie Bros. Auctioneers, Inc. | | 15,600 | 1,124 |
| | | | 40,420 |
| Electrical Equipment - 1.0% | | | |
| Acuity Brands, Inc. | | 137,915 | 25,156 |
| Hubbell, Inc. Class B | | 130,472 | 28,576 |
| Regal Rexnord Corp. | | 21,000 | 2,820 |
| Rockwell Automation, Inc. | | 19,318 | 4,931 |
| Vertiv Holdings Co. | | 1,544,000 | 17,632 |
| | | | 79,115 |
| Industrial Conglomerates - 4.6% | | | |
| 3M Co. | | 110,466 | 15,823 |
| General Electric Co. | | 4,617,811 | 341,302 |
| | | | 357,125 |
| Machinery - 1.9% | | | |
| Allison Transmission Holdings, Inc. | | 287,900 | 12,054 |
| Caterpillar, Inc. | | 35,023 | 6,943 |
| Cummins, Inc. | | 54,176 | 11,990 |
| Donaldson Co., Inc. | | 619,612 | 33,713 |
| Epiroc AB (A Shares) | | 32,700 | 578 |
| Flowserve Corp. | | 342,178 | 11,579 |
| Fortive Corp. | | 273,088 | 17,601 |
| Kardex AG | | 6,600 | 1,317 |
| Nordson Corp. | | 99,127 | 22,897 |
| Otis Worldwide Corp. | | 87,573 | 6,846 |
| Stanley Black & Decker, Inc. | | 54,118 | 5,267 |
| Westinghouse Air Brake Tech Co. | | 128,247 | 11,987 |
| | | | 142,772 |
| Professional Services - 0.5% | | | |
| Equifax, Inc. | | 58,223 | 12,163 |
| RELX PLC (London Stock Exchange) | | 856,066 | 25,348 |
| Robert Half International, Inc. | | 9,500 | 752 |
| | | | 38,263 |
| Road & Rail - 0.5% | | | |
| Knight-Swift Transportation Holdings, Inc. Class A | | 748,309 | 41,120 |
| Trading Companies & Distributors - 0.9% | | | |
| Brenntag SE | | 74,700 | 5,247 |
| Fastenal Co. | | 126,376 | 6,491 |
| MSC Industrial Direct Co., Inc. Class A | | 7,200 | 595 |
| Watsco, Inc. | | 197,991 | 54,240 |
| | | | 66,573 |
| Transportation Infrastructure - 0.1% | | | |
| Aena SME SA (a)(b) | | 49,200 | 6,223 |
|
| TOTAL INDUSTRIALS | | | 1,192,384 |
|
| INFORMATION TECHNOLOGY - 19.5% | | | |
| Electronic Equipment & Components - 0.3% | | | |
| CDW Corp. | | 105,964 | 19,236 |
| IT Services - 4.4% | | | |
| Amadeus IT Holding SA Class A (b) | | 560,200 | 32,665 |
| DXC Technology Co. (b) | | 112,900 | 3,568 |
| Edenred SA | | 640,600 | 32,802 |
| Fidelity National Information Services, Inc. | | 478,132 | 48,846 |
| Genpact Ltd. | | 525,271 | 25,255 |
| Global Payments, Inc. | | 121,500 | 14,862 |
| IBM Corp. | | 196,242 | 25,666 |
| MasterCard, Inc. Class A | | 33,667 | 11,911 |
| Unisys Corp. (b) | | 805,430 | 11,050 |
| Visa, Inc. Class A | | 626,375 | 132,860 |
| | | | 339,485 |
| Semiconductors & Semiconductor Equipment - 3.5% | | | |
| Analog Devices, Inc. | | 153,108 | 26,328 |
| Applied Materials, Inc. | | 147,200 | 15,600 |
| Intel Corp. | | 678,516 | 24,637 |
| Lam Research Corp. | | 32,530 | 16,282 |
| Marvell Technology, Inc. | | 480,900 | 26,777 |
| NVIDIA Corp. | | 15,300 | 2,779 |
| NXP Semiconductors NV | | 208,226 | 38,289 |
| Qualcomm, Inc. | | 777,872 | 112,838 |
| Teradyne, Inc. | | 78,000 | 7,869 |
| | | | 271,399 |
| Software - 7.7% | | | |
| Intuit, Inc. | | 57,900 | 26,412 |
| Microsoft Corp. | | 1,761,482 | 494,518 |
| Open Text Corp. | | 165,128 | 6,754 |
| SAP SE sponsored ADR | | 569,745 | 53,106 |
| Temenos Group AG | | 116,330 | 9,166 |
| | | | 589,956 |
| Technology Hardware, Storage & Peripherals - 3.6% | | | |
| Apple, Inc. | | 1,654,012 | 268,793 |
| FUJIFILM Holdings Corp. | | 62,600 | 3,576 |
| Samsung Electronics Co. Ltd. | | 162,180 | 7,648 |
| | | | 280,017 |
|
| TOTAL INFORMATION TECHNOLOGY | | | 1,500,093 |
|
| MATERIALS - 2.3% | | | |
| Chemicals - 0.7% | | | |
| DuPont de Nemours, Inc. | | 704,198 | 43,118 |
| PPG Industries, Inc. | | 54,322 | 7,023 |
| | | | 50,141 |
| Metals & Mining - 1.6% | | | |
| First Quantum Minerals Ltd. | | 1,520,500 | 27,785 |
| Freeport-McMoRan, Inc. | | 1,953,412 | 61,630 |
| Glencore Xstrata PLC | | 5,966,100 | 33,814 |
| | | | 123,229 |
|
| TOTAL MATERIALS | | | 173,370 |
|
| REAL ESTATE - 1.1% | | | |
| Equity Real Estate Investment Trusts (REITs) - 1.1% | | | |
| American Tower Corp. | | 140,978 | 38,181 |
| Equinix, Inc. | | 1,100 | 774 |
| Public Storage | | 2,400 | 783 |
| Simon Property Group, Inc. | | 406,060 | 44,114 |
| | | | 83,852 |
| UTILITIES - 1.5% | | | |
| Electric Utilities - 1.3% | | | |
| Constellation Energy Corp. | | 47,813 | 3,160 |
| Duke Energy Corp. | | 116,721 | 12,831 |
| Entergy Corp. | | 134,863 | 15,527 |
| Exelon Corp. | | 143,440 | 6,669 |
| NextEra Energy, Inc. | | 31,300 | 2,645 |
| PG&E Corp. (b) | | 1,096,300 | 11,906 |
| Southern Co. | | 620,366 | 47,700 |
| | | | 100,438 |
| Multi-Utilities - 0.2% | | | |
| Sempra Energy | | 68,596 | 11,373 |
|
| TOTAL UTILITIES | | | 111,811 |
|
| TOTAL COMMON STOCKS | | | |
| (Cost $5,081,210) | | | 7,419,712 |
|
| Convertible Preferred Stocks - 0.2% | | | |
| HEALTH CARE - 0.2% | | | |
| Health Care Equipment & Supplies - 0.2% | | | |
| Becton, Dickinson & Co. 6.50% | | 154,800 | 7,686 |
| Boston Scientific Corp. Series A, 5.50% | | 92,400 | 10,071 |
| TOTAL CONVERTIBLE PREFERRED STOCKS | | | |
| (Cost $16,980) | | | 17,757 |
| | | Principal Amount (000s) | Value (000s) |
|
| Convertible Bonds - 0.1% | | | |
| COMMUNICATION SERVICES - 0.0% | | | |
| Interactive Media & Services - 0.0% | | | |
| Snap, Inc. 0.125% 3/1/28 (a) | | 5,478 | 3,684 |
| HEALTH CARE - 0.1% | | | |
| Biotechnology - 0.1% | | | |
| Intercept Pharmaceuticals, Inc. 2% 5/15/26 | | 13,148 | 8,555 |
| TOTAL CONVERTIBLE BONDS | | | |
| (Cost $14,509) | | | 12,239 |
| | | Shares | Value (000s) |
|
| Other - 0.1% | | | |
| Energy - Oil, Gas & Consumable Fuels - 0.1% | | | |
| Utica Shale Drilling Program (non-operating revenue interest) (e)(f)(g) | | | |
| (Cost $18,052) | | 18,052,449 | 5,387 |
|
| Money Market Funds - 2.8% | | | |
| Fidelity Cash Central Fund 2.01% (h) | | | |
| (Cost $214,836) | | 214,793,320 | 214,836 |
| TOTAL INVESTMENT IN SECURITIES - 99.8% | | | |
| (Cost $5,345,587) | | | 7,669,931 |
| NET OTHER ASSETS (LIABILITIES) - 0.2% | | | 13,800 |
| NET ASSETS - 100% | | | $7,683,731 |
| Written Options | | | | | | |
| | Counterparty | Number of Contracts | Notional Amount (000s) | Exercise Price | Expiration Date | Value (000s) |
| Call Options | | | | | | |
| Bristol-Myers Squibb Co. | Chicago Board Options Exchange | 970 | $7,157 | $80.00 | 9/16/22 | $(35) |
| Hess Corp. | Chicago Board Options Exchange | 1,191 | 13,395 | 125.00 | 8/19/22 | (98) |
| TOTAL WRITTEN OPTIONS | | | | | | $(133) |
For the period, the average monthly contracts for written options in the aggregate was 7,019.
Legend
(a) Security exempt from registration under Rule 144A of the Securities Act of 1933. These securities may be resold in transactions exempt from registration, normally to qualified institutional buyers. At the end of the period, the value of these securities amounted to $30,478,000 or 0.4% of net assets.
(b) Non-income producing
(c) Security or a portion of the security purchased on a delayed delivery or when-issued basis.
(d) Security or a portion of the security is pledged as collateral for call options written. At period end, the value of securities pledged amounted to $20,552,000.
(e) Investment is owned by a wholly-owned subsidiary (Subsidiary) that is treated as a corporation for U.S. tax purposes.
(f) Restricted securities (including private placements) - Investment in securities not registered under the Securities Act of 1933 (excluding 144A issues). At the end of the period, the value of restricted securities (excluding 144A issues) amounted to $5,387,000 or 0.1% of net assets.
(g) Level 3 security
(h) Affiliated fund that is generally available only to investment companies and other accounts managed by Fidelity Investments. The rate quoted is the annualized seven-day yield of the fund at period end. A complete unaudited listing of the fund's holdings as of its most recent quarter end is available upon request. In addition, each Fidelity Central Fund's financial statements, which are not covered by the Fund's Report of Independent Registered Public Accounting Firm, are available on the SEC's website or upon request.
Additional information on each restricted holding is as follows:
| Security | Acquisition Date | Acquisition Cost (000s) |
| Utica Shale Drilling Program (non-operating revenue interest) | 10/5/16 - 9/1/17 | $18,052 |
Affiliated Central Funds
Fiscal year to date information regarding the Fund's investments in Fidelity Central Funds, including the ownership percentage, is presented below.
| Fund (Amounts in thousands) | Value, beginning of period | Purchases | Sales Proceeds | Dividend Income | Realized Gain/Loss | Change in Unrealized appreciation (depreciation) | Value, end of period | % ownership, end of period |
| Fidelity Cash Central Fund 2.01% | $13,016 | $729,457 | $527,637 | $758 | $-- | $-- | $214,836 | 0.4% |
| Fidelity Securities Lending Cash Central Fund 2.01% | 105,352 | 231,674 | 337,026 | 4,158 | -- | -- | -- | 0.0% |
| Total | $118,368 | $961,131 | $864,663 | $4,916 | $-- | $-- | $214,836 | |
Amounts in the income column in the above table include any capital gain distributions from underlying funds, which are presented in the corresponding line-item in the Statement of Operations, if applicable. Amount for Fidelity Securities Lending Cash Central Fund represents the income earned on investing cash collateral, less rebates paid to borrowers and any lending agent fees associated with the loan, plus any premium payments received for lending certain types of securities.
Investment Valuation
The following is a summary of the inputs used, as of July 31, 2022, involving the Fund's assets and liabilities carried at fair value. The inputs or methodology used for valuing securities may not be an indication of the risk associated with investing in those securities. For more information on valuation inputs, and their aggregation into the levels used below, please refer to the Investment Valuation section in the accompanying Notes to Financial Statements.
| | Valuation Inputs at Reporting Date: |
| Description | Total | Level 1 | Level 2 | Level 3 |
| (Amounts in thousands) | | | | |
| Investments in Securities: | | | | |
| Equities: | | | | |
| Communication Services | $393,428 | $333,200 | $60,228 | $-- |
| Consumer Discretionary | 206,374 | 206,374 | -- | -- |
| Consumer Staples | 480,342 | 439,032 | 41,310 | -- |
| Energy | 973,875 | 973,875 | -- | -- |
| Financials | 1,267,471 | 1,267,471 | -- | -- |
| Health Care | 1,054,469 | 990,005 | 64,464 | -- |
| Industrials | 1,192,384 | 1,097,348 | 95,036 | -- |
| Information Technology | 1,500,093 | 1,456,204 | 43,889 | -- |
| Materials | 173,370 | 139,556 | 33,814 | -- |
| Real Estate | 83,852 | 83,852 | -- | -- |
| Utilities | 111,811 | 111,811 | -- | -- |
| Corporate Bonds | 12,239 | -- | 12,239 | -- |
| Other | 5,387 | -- | -- | 5,387 |
| Money Market Funds | 214,836 | 214,836 | -- | -- |
| Total Investments in Securities: | $7,669,931 | $7,313,564 | $350,980 | $5,387 |
| Derivative Instruments: | | | | |
| Liabilities | | | | |
| Written Options | $(133) | $(133) | $-- | $-- |
| Total Liabilities | $(133) | $(133) | $-- | $-- |
| Total Derivative Instruments: | $(133) | $(133) | $-- | $-- |
Value of Derivative Instruments
The following table is a summary of the Fund's value of derivative instruments by primary risk exposure as of July 31, 2022. For additional information on derivative instruments, please refer to the Derivative Instruments section in the accompanying Notes to Financial Statements.
| Primary Risk Exposure / Derivative Type | Value |
| | Asset | Liability |
| (Amounts in thousands) | | |
| Equity Risk | | |
| Written Options(a) | $0 | $(133) |
| Total Equity Risk | 0 | (133) |
| Total Value of Derivatives | $0 | $(133) |
(a) Gross value is presented in the Statement of Assets and Liabilities in the written options, at value line-item.
See accompanying notes which are an integral part of the financial statements.
Financial Statements
Statement of Assets and Liabilities
| Amounts in thousands (except per-share amounts) | | July 31, 2022 |
| Assets | | |
Investment in securities, at value — See accompanying schedule:
Unaffiliated issuers (cost $5,130,751) | $7,455,095 | |
| Fidelity Central Funds (cost $214,836) | 214,836 | |
| Total Investment in Securities (cost $5,345,587) | | $7,669,931 |
| Cash | | 11 |
| Restricted cash | | 474 |
| Foreign currency held at value (cost $1) | | 1 |
| Receivable for investments sold | | 10,527 |
| Receivable for fund shares sold | | 2,372 |
| Dividends receivable | | 7,064 |
| Interest receivable | | 59 |
| Distributions receivable from Fidelity Central Funds | | 305 |
| Other receivables | | 398 |
| Total assets | | 7,691,142 |
| Liabilities | | |
| Payable for investments purchased on a delayed delivery basis | $37 | |
| Payable for fund shares redeemed | 3,306 | |
| Accrued management fee | 2,591 | |
| Transfer agent fee payable | 813 | |
| Written options, at value (premium received $1,003) | 133 | |
| Other affiliated payables | 88 | |
| Other payables and accrued expenses | 443 | |
| Total liabilities | | 7,411 |
| Net Assets | | $7,683,731 |
| Net Assets consist of: | | |
| Paid in capital | | $5,249,464 |
| Total accumulated earnings (loss) | | 2,434,267 |
| Net Assets | | $7,683,731 |
| Net Asset Value and Maximum Offering Price | | |
| Growth and Income: | | |
| Net Asset Value, offering price and redemption price per share ($7,360,433 ÷ 150,473.0 shares) | | $48.92 |
| Class K: | | |
| Net Asset Value, offering price and redemption price per share ($323,298 ÷ 6,616.2 shares) | | $48.86 |
See accompanying notes which are an integral part of the financial statements.
Statement of Operations
| Amounts in thousands | | Year ended July 31, 2022 |
| Investment Income | | |
| Dividends | | $168,498 |
| Interest | | 820 |
| Income from Fidelity Central Funds (including $4,158 from security lending) | | 4,916 |
| Income before foreign taxes withheld | | 174,234 |
| Less foreign taxes withheld | | (10,029) |
| Total income | | 164,205 |
| Expenses | | |
| Management fee | $33,594 | |
| Transfer agent fees | 9,751 | |
| Accounting fees | 1,180 | |
| Custodian fees and expenses | 120 | |
| Independent trustees' fees and expenses | 26 | |
| Registration fees | 143 | |
| Audit | 82 | |
| Legal | 11 | |
| Interest | 3 | |
| Miscellaneous | 27 | |
| Total expenses before reductions | 44,937 | |
| Expense reductions | (247) | |
| Total expenses after reductions | | 44,690 |
| Net investment income (loss) | | 119,515 |
| Realized and Unrealized Gain (Loss) | | |
| Net realized gain (loss) on: | | |
| Investment securities: | | |
| Unaffiliated issuers | 269,114 | |
| Foreign currency transactions | 78 | |
| Written options | 7,286 | |
| Total net realized gain (loss) | | 276,478 |
| Change in net unrealized appreciation (depreciation) on: | | |
| Investment securities: | | |
| Unaffiliated issuers | (391,650) | |
| Assets and liabilities in foreign currencies | (155) | |
| Written options | (1,024) | |
| Total change in net unrealized appreciation (depreciation) | | (392,829) |
| Net gain (loss) | | (116,351) |
| Net increase (decrease) in net assets resulting from operations | | $3,164 |
See accompanying notes which are an integral part of the financial statements.
Statement of Changes in Net Assets
| Amounts in thousands | Year ended July 31, 2022 | Year ended July 31, 2021 |
| Increase (Decrease) in Net Assets | | |
| Operations | | |
| Net investment income (loss) | $119,515 | $129,001 |
| Net realized gain (loss) | 276,478 | 282,937 |
| Change in net unrealized appreciation (depreciation) | (392,829) | 2,126,751 |
| Net increase (decrease) in net assets resulting from operations | 3,164 | 2,538,689 |
| Distributions to shareholders | (483,440) | (256,518) |
| Share transactions - net increase (decrease) | 94,863 | (684,045) |
| Total increase (decrease) in net assets | (385,413) | 1,598,126 |
| Net Assets | | |
| Beginning of period | 8,069,144 | 6,471,018 |
| End of period | $7,683,731 | $8,069,144 |
See accompanying notes which are an integral part of the financial statements.
Financial Highlights
Fidelity Growth & Income Portfolio
| Years ended July 31, | 2022 | 2021 | 2020 | 2019 | 2018 |
| Selected Per–Share Data | | | | | |
| Net asset value, beginning of period | $51.87 | $38.15 | $38.98 | $39.34 | $35.31 |
| Income from Investment Operations | | | | | |
| Net investment income (loss)A,B | .76 | .78 | .83 | .87 | .65 |
| Net realized and unrealized gain (loss) | (.61) | 14.49 | (.37) | (.05)C | 4.12 |
| Total from investment operations | .15 | 15.27 | .46 | .82 | 4.77 |
| Distributions from net investment income | (1.06) | (.79) | (.84) | (.77) | (.74) |
| Distributions from net realized gain | (2.05) | (.75) | (.46) | (.42) | – |
| Total distributions | (3.10)D | (1.55)D | (1.29)D | (1.18)D | (.74) |
| Net asset value, end of period | $48.92 | $51.87 | $38.15 | $38.98 | $39.34 |
| Total ReturnE | .26% | 41.01% | 1.27% | 2.26%C | 13.66% |
| Ratios to Average Net AssetsB,F,G | | | | | |
| Expenses before reductions | .57% | .58% | .60% | .61% | .61% |
| Expenses net of fee waivers, if any | .57% | .58% | .60% | .61% | .61% |
| Expenses net of all reductions | .57% | .58% | .60% | .61% | .61% |
| Net investment income (loss) | 1.51% | 1.71% | 2.18% | 2.31% | 1.76% |
| Supplemental Data | | | | | |
| Net assets, end of period (in millions) | $7,360 | $7,219 | $5,451 | $5,927 | $6,280 |
| Portfolio turnover rateH | 12% | 16% | 32% | 36% | 38% |
A Calculated based on average shares outstanding during the period.
B Net investment income (loss) is affected by the timing of the declaration of dividends by any underlying mutual funds or exchange-traded funds (ETFs). Net investment income (loss) of any such underlying funds is not included in the Fund's net investment income (loss) ratio.
C Net realized and unrealized gain (loss) per share reflects proceeds received from litigation which amounted to $.05 per share. Excluding these litigation proceeds, the total return would have been 2.14%
D Total distributions per share do not sum due to rounding.
E Total returns would have been lower if certain expenses had not been reduced during the applicable periods shown.
F Fees and expenses of any underlying mutual funds or exchange-traded funds (ETFs) are not included in the Fund's expense ratio. The Fund indirectly bears its proportionate share of these expenses. For additional expense information related to investments in Fidelity Central Funds, please refer to the "Investments in Fidelity Central Funds" note found in the Notes to Financial Statements section of the most recent Annual or Semi-Annual report.
G Expense ratios reflect operating expenses of the class. Expenses before reductions do not reflect amounts reimbursed, waived, or reduced through arrangements with the investment adviser, brokerage services, or other offset arrangements, if applicable, and do not represent the amount paid by the class during periods when reimbursements, waivers or reductions occur.
H Amount does not include the portfolio activity of any underlying mutual funds or exchange-traded funds (ETFs).
See accompanying notes which are an integral part of the financial statements.
Fidelity Growth & Income Portfolio Class K
| Years ended July 31, | 2022 | 2021 | 2020 | 2019 | 2018 |
| Selected Per–Share Data | | | | | |
| Net asset value, beginning of period | $51.82 | $38.11 | $38.94 | $39.31 | $35.28 |
| Income from Investment Operations | | | | | |
| Net investment income (loss)A,B | .81 | .81 | .86 | .91 | .69 |
| Net realized and unrealized gain (loss) | (.62) | 14.48 | (.35) | (.06)C | 4.12 |
| Total from investment operations | .19 | 15.29 | .51 | .85 | 4.81 |
| Distributions from net investment income | (1.10) | (.83) | (.88) | (.81) | (.78) |
| Distributions from net realized gain | (2.05) | (.75) | (.46) | (.42) | – |
| Total distributions | (3.15) | (1.58) | (1.34) | (1.22)D | (.78) |
| Net asset value, end of period | $48.86 | $51.82 | $38.11 | $38.94 | $39.31 |
| Total ReturnE | .33% | 41.15% | 1.39% | 2.35%C | 13.79% |
| Ratios to Average Net AssetsB,F,G | | | | | |
| Expenses before reductions | .49% | .49% | .50% | .51% | .51% |
| Expenses net of fee waivers, if any | .48% | .49% | .50% | .51% | .51% |
| Expenses net of all reductions | .48% | .49% | .50% | .50% | .50% |
| Net investment income (loss) | 1.60% | 1.80% | 2.28% | 2.41% | 1.86% |
| Supplemental Data | | | | | |
| Net assets, end of period (in millions) | $323 | $850 | $1,020 | $497 | $591 |
| Portfolio turnover rateH | 12% | 16% | 32% | 36% | 38% |
A Calculated based on average shares outstanding during the period.
B Net investment income (loss) is affected by the timing of the declaration of dividends by any underlying mutual funds or exchange-traded funds (ETFs). Net investment income (loss) of any such underlying funds is not included in the Fund's net investment income (loss) ratio.
C Net realized and unrealized gain (loss) per share reflects proceeds received from litigation which amounted to $.05 per share. Excluding these litigation proceeds, the total return would have been 2.23%
D Total distributions per share do not sum due to rounding.
E Total returns would have been lower if certain expenses had not been reduced during the applicable periods shown.
F Fees and expenses of any underlying mutual funds or exchange-traded funds (ETFs) are not included in the Fund's expense ratio. The Fund indirectly bears its proportionate share of these expenses. For additional expense information related to investments in Fidelity Central Funds, please refer to the "Investments in Fidelity Central Funds" note found in the Notes to Financial Statements section of the most recent Annual or Semi-Annual report.
G Expense ratios reflect operating expenses of the class. Expenses before reductions do not reflect amounts reimbursed, waived, or reduced through arrangements with the investment adviser, brokerage services, or other offset arrangements, if applicable, and do not represent the amount paid by the class during periods when reimbursements, waivers or reductions occur.
H Amount does not include the portfolio activity of any underlying mutual funds or exchange-traded funds (ETFs).
See accompanying notes which are an integral part of the financial statements.
Notes to Financial Statements
For the period ended July 31, 2022
(Amounts in thousands except percentages)
1. Organization.
Fidelity Growth & Income Portfolio (the Fund) is a fund of Fidelity Securities Fund (the Trust) and is authorized to issue an unlimited number of shares. The Trust is registered under the Investment Company Act of 1940, as amended (the 1940 Act), as an open-end management investment company organized as a Massachusetts business trust. The Fund offers Growth & Income and Class K shares, each of which has equal rights as to assets and voting privileges. Each class has exclusive voting rights with respect to matters that affect that class.
2. Investments in Fidelity Central Funds.
Funds may invest in Fidelity Central Funds, which are open-end investment companies generally available only to other investment companies and accounts managed by the investment adviser and its affiliates. The Schedule of Investments lists any Fidelity Central Funds held as an investment as of period end, but does not include the underlying holdings of each Fidelity Central Fund. An investing fund indirectly bears its proportionate share of the expenses of the underlying Fidelity Central Funds.
Based on its investment objective, each Fidelity Central Fund may invest or participate in various investment vehicles or strategies that are similar to those of the investing fund. These strategies are consistent with the investment objectives of the investing fund and may involve certain economic risks which may cause a decline in value of each of the Fidelity Central Funds and thus a decline in the value of the investing fund.
| Fidelity Central Fund | Investment Manager | Investment Objective | Investment Practices | Expense Ratio(a) |
| Fidelity Money Market Central Funds | Fidelity Management & Research Company LLC (FMR) | Each fund seeks to obtain a high level of current income consistent with the preservation of capital and liquidity. | Short-term Investments | Less than .005% |
(a) Expenses expressed as a percentage of average net assets and are as of each underlying Central Fund's most recent annual or semi-annual shareholder report.
A complete unaudited list of holdings for each Fidelity Central Fund is available upon request or at the Securities and Exchange Commission website at www.sec.gov. In addition, the financial statements of the Fidelity Central Funds which contain the significant accounting policies (including investment valuation policies) of those funds, and are not covered by the Report of Independent Registered Public Accounting Firm, are available on the Securities and Exchange Commission website or upon request.
3. Significant Accounting Policies.
The Fund is an investment company and applies the accounting and reporting guidance of the Financial Accounting Standards Board (FASB) Accounting Standards Codification Topic 946 Financial Services - Investment Companies. The financial statements have been prepared in conformity with accounting principles generally accepted in the United States of America (GAAP), which require management to make certain estimates and assumptions at the date of the financial statements. Actual results could differ from those estimates. Subsequent events, if any, through the date that the financial statements were issued have been evaluated in the preparation of the financial statements. The Fund's Schedule of Investments lists any underlying mutual funds or exchange-traded funds (ETFs) but does not include the underlying holdings of these funds. The following summarizes the significant accounting policies of the Fund:
Investment Valuation. Investments are valued as of 4:00 p.m. Eastern time on the last calendar day of the period. The Board of Trustees (the Board) has delegated the day to day responsibility for the valuation of the Fund's investments to the Fair Value Committee (the Committee) established by the Fund's investment adviser. In accordance with valuation policies and procedures approved by the Board, the Fund attempts to obtain prices from one or more third party pricing vendors or brokers to value its investments. When current market prices, quotations or currency exchange rates are not readily available or reliable, investments will be fair valued in good faith by the Committee, in accordance with procedures adopted by the Board. Factors used in determining fair value vary by investment type and may include market or investment specific events, changes in interest rates and credit quality. The frequency with which these procedures are used cannot be predicted and they may be utilized to a significant extent. The Committee oversees the Fund's valuation policies and procedures and reports to the Board on the Committee's activities and fair value determinations. The Board monitors the appropriateness of the procedures used in valuing the Fund's investments and ratifies the fair value determinations of the Committee.
The Fund categorizes the inputs to valuation techniques used to value its investments into a disclosure hierarchy consisting of three levels as shown below:
- Level 1 – unadjusted quoted prices in active markets for identical investments
- Level 2 – other significant observable inputs (including quoted prices for similar investments, interest rates, prepayment speeds, etc.)
- Level 3 – unobservable inputs (including the Fund's own assumptions based on the best information available)
Valuation techniques used to value the Fund's investments by major category are as follows:
Equity securities, including restricted securities, for which market quotations are readily available, are valued at the last reported sale price or official closing price as reported by a third party pricing vendor on the primary market or exchange on which they are traded and are categorized as Level 1 in the hierarchy. In the event there were no sales during the day or closing prices are not available, securities are valued at the last quoted bid price or may be valued using the last available price and are generally categorized as Level 2 in the hierarchy. For foreign equity securities, when market or security specific events arise, comparisons to the valuation of American Depositary Receipts (ADRs), futures contracts, ETFs and certain indexes as well as quoted prices for similar securities may be used and would be categorized as Level 2 in the hierarchy. For equity securities, including restricted securities, where observable inputs are limited, assumptions about market activity and risk are used and these securities may be categorized as Level 3 in the hierarchy.
Debt securities, including restricted securities, are valued based on evaluated prices received from third party pricing vendors or from brokers who make markets in such securities. Corporate bonds are valued by pricing vendors who utilize matrix pricing which considers yield or price of bonds of comparable quality, coupon, maturity and type or by broker-supplied prices. When independent prices are unavailable or unreliable, debt securities may be valued utilizing pricing methodologies which consider similar factors that would be used by third party pricing vendors. Debt securities are generally categorized as Level 2 in the hierarchy but may be Level 3 depending on the circumstances.
Exchange-traded options are valued using the last sale price or, in the absence of a sale, the last offering price and are categorized as Level 1 in the hierarchy. Investments in open-end mutual funds, including the Fidelity Central Funds, are valued at their closing net asset value (NAV) each business day and are categorized as Level 1 in the hierarchy.
Changes in valuation techniques may result in transfers in or out of an assigned level within the disclosure hierarchy. The aggregate value of investments by input level as of July 31, 2022 is included at the end of the Fund's Schedule of Investments.
Foreign Currency. Certain Funds may use foreign currency contracts to facilitate transactions in foreign-denominated securities. Gains and losses from these transactions may arise from changes in the value of the foreign currency or if the counterparties do not perform under the contracts' terms.
Foreign-denominated assets, including investment securities, and liabilities are translated into U.S. dollars at the exchange rates at period end. Purchases and sales of investment securities, income and dividends received, and expenses denominated in foreign currencies are translated into U.S. dollars at the exchange rate in effect on the transaction date.
The effects of exchange rate fluctuations on investments are included with the net realized and unrealized gain (loss) on investment securities. Other foreign currency transactions resulting in realized and unrealized gain (loss) are disclosed separately.
Investment Transactions and Income. For financial reporting purposes, the Fund's investment holdings and NAV include trades executed through the end of the last business day of the period. The NAV per share for processing shareholder transactions is calculated as of the close of business of the New York Stock Exchange (NYSE), normally 4:00 p.m. Eastern time and includes trades executed through the end of the prior business day. Gains and losses on securities sold are determined on the basis of identified cost and include proceeds received from litigation. Commissions paid to certain brokers with whom the investment adviser, or its affiliates, places trades on behalf of a fund include an amount in addition to trade execution, which may be rebated back to a fund. Any such rebates are included in net realized gain (loss) on investments in the Statement of Operations. Dividend income is recorded on the ex-dividend date, except for certain dividends from foreign securities where the ex-dividend date may have passed, which are recorded as soon as the Fund is informed of the ex-dividend date. Non-cash dividends included in dividend income, if any, are recorded at the fair market value of the securities received. Income and capital gain distributions from Fidelity Central Funds, if any, are recorded on the ex-dividend date. Certain distributions received by the Fund represent a return of capital or capital gain. The Fund determines the components of these distributions subsequent to the ex-dividend date, based upon receipt of tax filings or other correspondence relating to the underlying investment. These distributions are recorded as a reduction of cost of investments and/or as a realized gain. Interest income is accrued as earned and includes coupon interest and amortization of premium and accretion of discount on debt securities as applicable. Investment income is recorded net of foreign taxes withheld where recovery of such taxes is uncertain. Funds may file withholding tax reclaims in certain jurisdictions to recover a portion of amounts previously withheld. Any withholding tax reclaims income is included in the Statement of Operations in foreign taxes withheld. Any receivables for withholding tax reclaims are included in the Statement of Assets and Liabilities in dividends receivable.
Class Allocations and Expenses. Investment income, realized and unrealized capital gains and losses, common expenses of a fund, and certain fund-level expense reductions, if any, are allocated daily on a pro-rata basis to each class based on the relative net assets of each class to the total net assets of a fund. Each class differs with respect to transfer agent and distribution and service plan fees incurred, as applicable. Certain expense reductions may also differ by class, if applicable. For the reporting period, the allocated portion of income and expenses to each class as a percent of its average net assets may vary due to the timing of recording these transactions in relation to fluctuating net assets of the classes. Expenses directly attributable to a fund are charged to that fund. Expenses attributable to more than one fund are allocated among the respective funds on the basis of relative net assets or other appropriate methods. Expenses included in the accompanying financial statements reflect the expenses of that fund and do not include any expenses associated with any underlying mutual funds or exchange-traded funds. Although not included in a fund's expenses, a fund indirectly bears its proportionate share of these expenses through the net asset value of each underlying mutual fund or exchange-traded fund. Expense estimates are accrued in the period to which they relate and adjustments are made when actual amounts are known.
Deferred Trustee Compensation. Under a Deferred Compensation Plan (the Plan) for certain Funds, certain independent Trustees have elected to defer receipt of a portion of their annual compensation. Deferred amounts are invested in affiliated mutual funds, are marked-to-market and remain in a fund until distributed in accordance with the Plan. The investment of deferred amounts and the offsetting payable to the Trustees presented below are included in the accompanying Statement of Assets and Liabilities in other receivables and other payables and accrued expenses, as applicable.
| Fidelity Growth & Income Portfolio | $357 |
Income Tax Information and Distributions to Shareholders. Each year, the Fund intends to qualify as a regulated investment company under Subchapter M of the Internal Revenue Code, including distributing substantially all of its taxable income and realized gains. As a result, no provision for U.S. Federal income taxes is required. As of July 31, 2022, the Fund did not have any unrecognized tax benefits in the financial statements; nor is the Fund aware of any tax positions for which it is reasonably possible that the total amounts of unrecognized tax benefits will significantly change in the next twelve months. The Fund files a U.S. federal tax return, in addition to state and local tax returns as required. The Fund's federal income tax returns are subject to examination by the Internal Revenue Service (IRS) for a period of three fiscal years after they are filed. State and local tax returns may be subject to examination for an additional fiscal year depending on the jurisdiction. Foreign taxes are provided for based on the Fund's understanding of the tax rules and rates that exist in the foreign markets in which it invests.
Distributions are declared and recorded on the ex-dividend date. Income and capital gain distributions are declared separately for each class. Income and capital gain distributions are determined in accordance with income tax regulations, which may differ from GAAP. In addition, the Fund claimed a portion of the payment made to redeeming shareholders as a distribution for income tax purposes.
Capital accounts within the financial statements are adjusted for permanent book-tax differences. These adjustments have no impact on net assets or the results of operations. Capital accounts are not adjusted for temporary book-tax differences which will reverse in a subsequent period.
Book-tax differences are primarily due to foreign currency transactions, partnerships, deferred trustees compensation, and losses deferred due to wash sales.
As of period end, the cost and unrealized appreciation (depreciation) in securities, and derivatives if applicable, for federal income tax purposes were as follows:
| Gross unrealized appreciation | $2,622,368 |
| Gross unrealized depreciation | (326,877) |
| Net unrealized appreciation (depreciation) | $2,295,491 |
| Tax Cost | $5,374,307 |
The tax-based components of distributable earnings as of period end were as follows:
| Undistributed ordinary income | $8,854 |
| Undistributed long-term capital gain | $130,237 |
| Net unrealized appreciation (depreciation) on securities and other investments | $2,295,380 |
The tax character of distributions paid was as follows:
| | July 31, 2022 | July 31, 2021 |
| Ordinary Income | $207,211 | $ 135,840 |
| Long-term Capital Gains | 276,229 | 120,678 |
| Total | $483,440 | $ 256,518 |
Delayed Delivery Transactions and When-Issued Securities. During the period, certain Funds transacted in securities on a delayed delivery or when-issued basis. Payment and delivery may take place after the customary settlement period for that security. The price of the underlying securities and the date when the securities will be delivered and paid for are fixed at the time the transaction is negotiated. Securities purchased on a delayed delivery or when-issued basis are identified as such in the Schedule of Investments. Compensation for interest forgone in the purchase of a delayed delivery or when-issued debt security may be received. With respect to purchase commitments, each applicable Fund identifies securities as segregated in its records with a value at least equal to the amount of the commitment. Payables and receivables associated with the purchases and sales of delayed delivery securities having the same coupon, settlement date and broker are offset. Delayed delivery or when-issued securities that have been purchased from and sold to different brokers are reflected as both payables and receivables in the Statement of Assets and Liabilities under the caption "Delayed delivery", as applicable. Losses may arise due to changes in the value of the underlying securities or if the counterparty does not perform under the contract's terms, or if the issuer does not issue the securities due to political, economic, or other factors.
Restricted Securities (including Private Placements). Funds may invest in securities that are subject to legal or contractual restrictions on resale. These securities generally may be resold in transactions exempt from registration or to the public if the securities are registered. Disposal of these securities may involve time-consuming negotiations and expense, and prompt sale at an acceptable price may be difficult. Information regarding restricted securities held at period end is included at the end of the Schedule of Investments, if applicable.
Consolidated Subsidiary. The Funds included in the table below hold certain investments through a wholly-owned subsidiary ("Subsidiary"), which may be subject to federal and state taxes upon disposition.
As of period end, investments in Subsidiaries were as follows:
| | ($) Amount | % of Net Assets |
| Fidelity Growth & Income Portfolio | 5,861 | .08 |
The financial statements have been consolidated to include the Subsidiary accounts where applicable. Accordingly, all inter-company transactions and balances have been eliminated.
At period end, any estimated tax liability for these investments is presented as "Deferred taxes" in the Statement of Assets and Liabilities and included in "Change in net unrealized appreciation (depreciation) on investment securities" in the Statement of Operations. The tax liability incurred may differ materially depending on conditions when these investments are disposed. Any cash held by a Subsidiary is restricted as to its use and is presented as "Restricted cash" in the Statement of Assets and Liabilities, if applicable.
4. Derivative Instruments.
Risk Exposures and the Use of Derivative Instruments. Investment objectives allow a fund to enter into various types of derivative contracts, including options. Derivatives are investments whose value is primarily derived from underlying assets, indices or reference rates and may be transacted on an exchange or over-the-counter (OTC). Derivatives may involve a future commitment to buy or sell a specified asset based on specified terms, to exchange future cash flows at periodic intervals based on a notional principal amount, or for one party to make one or more payments upon the occurrence of specified events in exchange for periodic payments from the other party.
Derivatives were used to increase returns and to manage exposure to certain risks as defined below. The success of any strategy involving derivatives depends on analysis of numerous economic factors, and if the strategies for investment do not work as intended, the objectives may not be achieved.
Derivatives were used to increase or decrease exposure to the following risk:
| Equity Risk | Equity risk relates to the fluctuations in the value of financial instruments as a result of changes in market prices (other than those arising from interest rate risk or foreign exchange risk), whether caused by factors specific to an individual investment, its issuer, or all factors affecting all instruments traded in a market or market segment.
|
Funds are also exposed to additional risks from investing in derivatives, such as liquidity risk and counterparty credit risk. Liquidity risk is the risk that a fund will be unable to close out the derivative in the open market in a timely manner. Counterparty credit risk is the risk that the counterparty will not be able to fulfill its obligation to a fund. Exchange-traded contracts are not covered by the ISDA Master Agreement; however counterparty credit risk related to these contracts may be mitigated by the protection provided by the exchange on which they trade.
Investing in derivatives may involve greater risks than investing in the underlying assets directly and, to varying degrees, may involve risk of loss in excess of any initial investment and collateral received and amounts recognized in the Statement of Assets and Liabilities. In addition, there may be the risk that the change in value of the derivative contract does not correspond to the change in value of the underlying instrument.
Options. Options give the purchaser the right, but not the obligation, to buy (call) or sell (put) an underlying security or financial instrument at an agreed exercise or strike price between or on certain dates. Options obligate the seller (writer) to buy (put) or sell (call) an underlying instrument at the exercise or strike price or cash settle an underlying derivative instrument if the holder exercises the option on or before the expiration date.
Exchange-traded written covered call options were used to manage exposure to the market. When a fund writes a covered call option, a fund holds the underlying instrument which must be delivered to the holder upon the exercise of the option.
Upon entering into a written options contract, a fund will receive a premium. Premiums received are reflected as a liability on the Statement of Assets and Liabilities. Options are valued daily and any unrealized appreciation (depreciation) is reflected on the Statement of Assets and Liabilities. When a written option is exercised, the premium is added to the proceeds from the sale of the underlying instrument in determining the gain or loss realized on that investment. When an option is closed, a gain or loss is realized depending on whether the proceeds or amount paid for the closing sale transaction are greater or less than the premium received. When an option expires, gains and losses are realized to the extent of premiums received. The net realized gain (loss) on closed and expired written options and the change in net unrealized appreciation (depreciation) on written options are presented in the Statement of Operations.
Writing call options tends to decrease exposure to the underlying instrument and risk of loss is the change in value in excess of the premium received.
Any open options at period end are presented in the Schedule of Investments under the caption "Written Options", and are representative of volume of activity during the period unless an average contracts amount is presented.
5. Purchases and Sales of Investments.
Purchases and sales of securities, other than short-term securities and in-kind transactions, as applicable, are noted in the table below.
| | Purchases ($) | Sales ($) |
| Fidelity Growth & Income Portfolio | 948,449 | 1,375,258 |
6. Fees and Other Transactions with Affiliates.
Management Fee. Fidelity Management & Research Company LLC (the investment adviser) and its affiliates provide the Fund with investment management related services for which the Fund pays a monthly management fee. The management fee is the sum of an individual fund fee rate that is based on an annual rate of .20% of the Fund's average net assets and an annualized group fee rate that averaged .22% during the period. The group fee rate is based upon the monthly average net assets of a group of registered investment companies with which the investment adviser has management contracts. The group fee rate decreases as assets under management increase and increases as assets under management decrease. For the reporting period, the total annual management fee rate was .42% of the Fund's average net assets.
Transfer Agent Fees. Fidelity Investments Institutional Operations Company LLC (FIIOC), an affiliate of the investment adviser, is the transfer, dividend disbursing and shareholder servicing agent for each class of the Fund. FIIOC receives account fees and asset-based fees that vary according to the account size and type of account of the shareholders of Growth & Income, except for Class K. FIIOC receives an asset-based fee of Class K's average net assets. FIIOC pays for typesetting, printing and mailing of shareholder reports, except proxy statements.
For the period, transfer agent fees for each class were as follows:
| | Amount | % of Class-Level Average Net Assets |
| Growth and Income | $9,558 | .13 |
| Class K | 193 | .04 |
| | $9,751 | |
Accounting Fees. Fidelity Service Company, Inc. (FSC), an affiliate of the investment adviser, maintains the Fund's accounting records. The accounting fee is based on the level of average net assets for each month. For the period, the fees were equivalent to the following annual rates:
| | % of Average Net Assets |
| Fidelity Growth & Income Portfolio | .01 |
Brokerage Commissions. A portion of portfolio transactions were placed with brokerage firms which are affiliates of the investment adviser. Brokerage commissions are included in net realized gain (loss) and change in net unrealized appreciation (depreciation) in the Statement of Operations. The commissions paid to these affiliated firms were as follows:
| | Amount |
| Fidelity Growth & Income Portfolio | $18 |
Interfund Lending Program. Pursuant to an Exemptive Order issued by the Securities and Exchange Commission (the SEC), the Fund, along with other registered investment companies having management contracts with Fidelity Management & Research Company LLC (FMR), or other affiliated entities of FMR, may participate in an interfund lending program. This program provides an alternative credit facility allowing the Fund to borrow from, or lend money to, other participating affiliated funds. At period end, there were no interfund loans outstanding. Activity in this program during the period for which loans were outstanding was as follows:
| | Borrower or Lender | Average Loan Balance | Weighted Average Interest Rate | Interest Expense |
| Fidelity Growth & Income Portfolio | Borrower | $47,135 | .32% | $3 |
Interfund Trades. Funds may purchase from or sell securities to other Fidelity Funds under procedures adopted by the Board. The procedures have been designed to ensure these interfund trades are executed in accordance with Rule 17a-7 of the 1940 Act. Any interfund trades are included within the respective purchases and sales amounts shown in the Purchases and Sales of Investments note. Interfund trades during the period are noted in the table below.
| | Purchases ($) | Sales ($) | Realized Gain (Loss) ($) |
| Fidelity Growth & Income Portfolio | 92,462 | 84,815 | 19,220 |
Other. During the period, the investment adviser reimbursed the Fund for certain losses as follows:
| | Amount ($) |
| Fidelity Growth & Income Portfolio | 558 |
7. Committed Line of Credit.
Certain Funds participate with other funds managed by the investment adviser or an affiliate in a $4.25 billion credit facility (the "line of credit") to be utilized for temporary or emergency purposes to fund shareholder redemptions or for other short-term liquidity purposes. The participating funds have agreed to pay commitment fees on their pro-rata portion of the line of credit, which are reflected in Miscellaneous expenses on the Statement of Operations, and are listed below. During the period, there were no borrowings on this line of credit.
| | Amount |
| Fidelity Growth & Income Portfolio | $10 |
8. Security Lending.
Funds lend portfolio securities from time to time in order to earn additional income. Lending agents are used, including National Financial Services (NFS), an affiliate of the investment adviser. Pursuant to a securities lending agreement, NFS will receive a fee, which is capped at 9.9% of a fund's daily lending revenue, for its services as lending agent. A fund may lend securities to certain qualified borrowers, including NFS. On the settlement date of the loan, a fund receives collateral (in the form of U.S. Treasury obligations, letters of credit and/or cash) against the loaned securities and maintains collateral in an amount not less than 100% of the market value of the loaned securities during the period of the loan. The market value of the loaned securities is determined at the close of business of a fund and any additional required collateral is delivered to a fund on the next business day. A fund or borrower may terminate the loan at any time, and if the borrower defaults on its obligation to return the securities loaned because of insolvency or other reasons, a fund may apply collateral received from the borrower against the obligation. A fund may experience delays and costs in recovering the securities loaned. Any cash collateral received is invested in the Fidelity Securities Lending Cash Central Fund. Any loaned securities are identified as such in the Schedule of Investments, and the value of loaned securities and cash collateral at period end, as applicable, are presented in the Statement of Assets and Liabilities. Security lending income represents the income earned on investing cash collateral, less rebates paid to borrowers and any lending agent fees associated with the loan, plus any premium payments received for lending certain types of securities. Security lending income is presented in the Statement of Operations as a component of income from Fidelity Central Funds. Affiliated security lending activity, if any, was as follows:
| | Total Security Lending Fees Paid to NFS | Security Lending Income From Securities Loaned to NFS | Value of Securities Loaned to NFS at Period End |
| Fidelity Growth & Income Portfolio | $188 | $– | $– |
9. Expense Reductions.
During the period the investment adviser or an affiliate reimbursed and/or waived a portion of fund-level operating expenses in the amount of $247.
10. Distributions to Shareholders.
Distributions to shareholders of each class were as follows:
| | Year ended
July 31, 2022 | Year ended
July 31, 2021 |
| Fidelity Growth & Income Portfolio | | |
| Distributions to shareholders | | |
| Growth and Income | $441,736 | $217,556 |
| Class K | 41,704 | 38,962 |
| Total | $483,440 | $256,518 |
11. Share Transactions.
Share transactions for each class were as follows and may contain in-kind transactions, automatic conversions between classes or exchanges between affiliated funds:
| | Shares | Shares | Dollars | Dollars |
| | Year ended July 31, 2022 | Year ended July 31, 2021 | Year ended July 31, 2022 | Year ended July 31, 2021 |
| Fidelity Growth & Income Portfolio | | | | |
| Growth and Income | | | | |
| Shares sold | 18,506 | 6,082 | $948,009 | $285,882 |
| Reinvestment of distributions | 8,279 | 4,876 | 415,917 | 205,315 |
| Shares redeemed | (15,495) | (14,649) | (779,035) | (650,432) |
| Net increase (decrease) | 11,290 | (3,691) | $584,891 | $(159,235) |
| Class K | | | | |
| Shares sold | 1,472 | 4,151 | $75,794 | $182,762 |
| Reinvestment of distributions | 827 | 937 | 41,704 | 38,962 |
| Shares redeemed | (12,089) | (15,439) | (607,526) | (746,534) |
| Net increase (decrease) | (9,790) | (10,351) | $(490,028) | $(524,810) |
12. Other.
A fund's organizational documents provide former and current trustees and officers with a limited indemnification against liabilities arising in connection with the performance of their duties to the fund. In the normal course of business, a fund may also enter into contracts that provide general indemnifications. A fund's maximum exposure under these arrangements is unknown as this would be dependent on future claims that may be made against a fund. The risk of material loss from such claims is considered remote.
13. Coronavirus (COVID-19) Pandemic.
An outbreak of COVID-19 first detected in China during December 2019 has since spread globally and was declared a pandemic by the World Health Organization during March 2020. Developments that disrupt global economies and financial markets, such as the COVID-19 pandemic, may magnify factors that affect the Fund's performance.
Report of Independent Registered Public Accounting Firm
To the Board of Trustees of Fidelity Securities Fund and Shareholders of Fidelity Growth & Income Portfolio
Opinion on the Financial Statements
We have audited the accompanying statement of assets and liabilities, including the schedule of investments, of Fidelity Growth & Income Portfolio (one of the funds constituting Fidelity Securities Fund, referred to hereafter as the “Fund”) as of July 31, 2022, the related statement of operations for the year ended July 31, 2022, the statement of changes in net assets for each of the two years in the period ended July 31, 2022, including the related notes, and the financial highlights for each of the five years in the period ended July 31, 2022 (collectively referred to as the “financial statements”). In our opinion, the financial statements present fairly, in all material respects, the financial position of the Fund as of July 31, 2022, the results of its operations for the year then ended, the changes in its net assets for each of the two years in the period ended July 31, 2022 and the financial highlights for each of the five years in the period ended July 31, 2022 in conformity with accounting principles generally accepted in the United States of America.
Basis for Opinion
These financial statements are the responsibility of the Fund’s management. Our responsibility is to express an opinion on the Fund’s financial statements based on our audits. We are a public accounting firm registered with the Public Company Accounting Oversight Board (United States) (PCAOB) and are required to be independent with respect to the Fund in accordance with the U.S. federal securities laws and the applicable rules and regulations of the Securities and Exchange Commission and the PCAOB.
We conducted our audits of these financial statements in accordance with the standards of the PCAOB. Those standards require that we plan and perform the audit to obtain reasonable assurance about whether the financial statements are free of material misstatement, whether due to error or fraud.
Our audits included performing procedures to assess the risks of material misstatement of the financial statements, whether due to error or fraud, and performing procedures that respond to those risks. Such procedures included examining, on a test basis, evidence regarding the amounts and disclosures in the financial statements. Our audits also included evaluating the accounting principles used and significant estimates made by management, as well as evaluating the overall presentation of the financial statements. Our procedures included confirmation of securities owned as of July 31, 2022 by correspondence with the custodian, issuers of privately offered securities and brokers; when replies were not received from brokers, we performed other auditing procedures. We believe that our audits provide a reasonable basis for our opinion.
/s/ PricewaterhouseCoopers LLP
Boston, Massachusetts
September 14, 2022
We have served as the auditor of one or more investment companies in the Fidelity group of funds since 1932.
Trustees and Officers
The Trustees, Members of the Advisory Board (if any), and officers of the trust and fund, as applicable, are listed below. The Board of Trustees governs the fund and is responsible for protecting the interests of shareholders. The Trustees are experienced executives who meet periodically throughout the year to oversee the fund's activities, review contractual arrangements with companies that provide services to the fund, oversee management of the risks associated with such activities and contractual arrangements, and review the fund's performance. Except for Jonathan Chiel, each of the Trustees oversees 316 funds. Mr. Chiel oversees 184 funds.
The Trustees hold office without limit in time except that (a) any Trustee may resign; (b) any Trustee may be removed by written instrument, signed by at least two-thirds of the number of Trustees prior to such removal; (c) any Trustee who requests to be retired or who has become incapacitated by illness or injury may be retired by written instrument signed by a majority of the other Trustees; and (d) any Trustee may be removed at any special meeting of shareholders by a two-thirds vote of the outstanding voting securities of the trust. Each Trustee who is not an interested person (as defined in the 1940 Act) of the trust and the fund is referred to herein as an Independent Trustee. Each Independent Trustee shall retire not later than the last day of the calendar year in which his or her 75th birthday occurs. The Independent Trustees may waive this mandatory retirement age policy with respect to individual Trustees. Officers and Advisory Board Members hold office without limit in time, except that any officer or Advisory Board Member may resign or may be removed by a vote of a majority of the Trustees at any regular meeting or any special meeting of the Trustees. Except as indicated, each individual has held the office shown or other offices in the same company for the past five years.
The fund's Statement of Additional Information (SAI) includes more information about the Trustees. To request a free copy, call Fidelity at 1-800-544-8544 if you’re an individual investing directly with Fidelity, call 1-800-835-5092 if you’re a plan sponsor or participant with Fidelity as your recordkeeper or call 1-877-208-0098 on institutional accounts or if you’re an advisor or invest through one.
Experience, Skills, Attributes, and Qualifications of the Trustees. The Governance and Nominating Committee has adopted a statement of policy that describes the experience, qualifications, attributes, and skills that are necessary and desirable for potential Independent Trustee candidates (Statement of Policy). The Board believes that each Trustee satisfied at the time he or she was initially elected or appointed a Trustee, and continues to satisfy, the standards contemplated by the Statement of Policy. The Governance and Nominating Committee also engages professional search firms to help identify potential Independent Trustee candidates who have the experience, qualifications, attributes, and skills consistent with the Statement of Policy. From time to time, additional criteria based on the composition and skills of the current Independent Trustees, as well as experience or skills that may be appropriate in light of future changes to board composition, business conditions, and regulatory or other developments, have also been considered by the professional search firms and the Governance and Nominating Committee. In addition, the Board takes into account the Trustees' commitment and participation in Board and committee meetings, as well as their leadership of standing and ad hoc committees throughout their tenure.
In determining that a particular Trustee was and continues to be qualified to serve as a Trustee, the Board has considered a variety of criteria, none of which, in isolation, was controlling. The Board believes that, collectively, the Trustees have balanced and diverse experience, qualifications, attributes, and skills, which allow the Board to operate effectively in governing the fund and protecting the interests of shareholders. Information about the specific experience, skills, attributes, and qualifications of each Trustee, which in each case led to the Board's conclusion that the Trustee should serve (or continue to serve) as a trustee of the fund, is provided below.
Board Structure and Oversight Function. Robert A. Lawrence is an interested person and currently serves as Chair. The Trustees have determined that an interested Chair is appropriate and benefits shareholders because an interested Chair has a personal and professional stake in the quality and continuity of services provided to the fund. Independent Trustees exercise their informed business judgment to appoint an individual of their choosing to serve as Chair, regardless of whether the Trustee happens to be independent or a member of management. The Independent Trustees have determined that they can act independently and effectively without having an Independent Trustee serve as Chair and that a key structural component for assuring that they are in a position to do so is for the Independent Trustees to constitute a substantial majority for the Board. The Independent Trustees also regularly meet in executive session. David M. Thomas serves as Lead Independent Trustee and as such (i) acts as a liaison between the Independent Trustees and management with respect to matters important to the Independent Trustees and (ii) with management prepares agendas for Board meetings.
Fidelity® funds are overseen by different Boards of Trustees. The fund's Board oversees Fidelity's high income and certain equity funds, and other Boards oversee Fidelity's investment-grade bond, money market, asset allocation, and other equity funds. The asset allocation funds may invest in Fidelity® funds overseen by the fund's Board. The use of separate Boards, each with its own committee structure, allows the Trustees of each group of Fidelity® funds to focus on the unique issues of the funds they oversee, including common research, investment, and operational issues. On occasion, the separate Boards establish joint committees to address issues of overlapping consequences for the Fidelity® funds overseen by each Board.
The Trustees operate using a system of committees to facilitate the timely and efficient consideration of all matters of importance to the Trustees, the fund, and fund shareholders and to facilitate compliance with legal and regulatory requirements and oversight of the fund's activities and associated risks. The Board, acting through its committees, has charged FMR and its affiliates with (i) identifying events or circumstances the occurrence of which could have demonstrably adverse effects on the fund's business and/or reputation; (ii) implementing processes and controls to lessen the possibility that such events or circumstances occur or to mitigate the effects of such events or circumstances if they do occur; and (iii) creating and maintaining a system designed to evaluate continuously business and market conditions in order to facilitate the identification and implementation processes described in (i) and (ii) above. Because the day-to-day operations and activities of the fund are carried out by or through FMR, its affiliates, and other service providers, the fund's exposure to risks is mitigated but not eliminated by the processes overseen by the Trustees. While each of the Board's committees has responsibility for overseeing different aspects of the fund's activities, oversight is exercised primarily through the Operations, Audit, and Compliance Committees. Appropriate personnel, including but not limited to the fund's Chief Compliance Officer (CCO), FMR's internal auditor, the independent accountants, the fund's Treasurer and portfolio management personnel, make periodic reports to the Board's committees, as appropriate, including an annual review of Fidelity's risk management program for the Fidelity® funds. The responsibilities of each standing committee, including their oversight responsibilities, are described further under "Standing Committees of the Trustees."
Interested Trustees*:
Correspondence intended for a Trustee who is an interested person may be sent to Fidelity Investments, 245 Summer Street, Boston, Massachusetts 02210.
Name, Year of Birth; Principal Occupations and Other Relevant Experience+
Jonathan Chiel (1957)
Year of Election or Appointment: 2016
Trustee
Mr. Chiel also serves as Trustee of other Fidelity® funds. Mr. Chiel is Executive Vice President and General Counsel for FMR LLC (diversified financial services company, 2012-present). Previously, Mr. Chiel served as general counsel (2004-2012) and senior vice president and deputy general counsel (2000-2004) for John Hancock Financial Services; a partner with Choate, Hall & Stewart (1996-2000) (law firm); and an Assistant United States Attorney for the United States Attorney’s Office of the District of Massachusetts (1986-95), including Chief of the Criminal Division (1993-1995). Mr. Chiel is a director on the boards of the Boston Bar Foundation and the Maimonides School.
Bettina Doulton (1964)
Year of Election or Appointment: 2021
Trustee
Ms. Doulton also serves as Trustee of other Fidelity® funds. Prior to her retirement, Ms. Doulton served in a variety of positions at Fidelity Investments, including as a managing director of research (2006-2007), portfolio manager to certain Fidelity® funds (1993-2005), equity analyst and portfolio assistant (1990-1993), and research assistant (1987-1990). Ms. Doulton currently owns and operates Phi Builders + Architects and Cellardoor Winery. Previously, Ms. Doulton served as a member of the Board of Brown Capital Management, LLC (2014-2018).
Robert A. Lawrence (1952)
Year of Election or Appointment: 2020
Trustee
Chair of the Board of Trustees
Mr. Lawrence also serves as Trustee of other funds. Previously, Mr. Lawrence served as a Trustee and Member of the Advisory Board of certain funds. Prior to his retirement in 2008, Mr. Lawrence served as Vice President of certain Fidelity® funds (2006-2008), Senior Vice President, Head of High Income Division of Fidelity Management & Research Company (investment adviser firm, 2006-2008), and President of Fidelity Strategic Investments (investment adviser firm, 2002-2005).
* Determined to be an “Interested Trustee” by virtue of, among other things, his or her affiliation with the trust or various entities under common control with FMR.
+ The information includes the Trustee's principal occupation during the last five years and other information relating to the experience, attributes, and skills relevant to the Trustee's qualifications to serve as a Trustee, which led to the conclusion that the Trustee should serve as a Trustee for the fund.
Independent Trustees:
Correspondence intended for an Independent Trustee may be sent to Fidelity Investments, P.O. Box 55235, Boston, Massachusetts 02205-5235.
Name, Year of Birth; Principal Occupations and Other Relevant Experience+
Thomas P. Bostick (1956)
Year of Election or Appointment: 2021
Trustee
Lieutenant General Bostick also serves as Trustee of other Fidelity® funds. Prior to his retirement, General Bostick (United States Army, Retired) held a variety of positions within the U.S. Army, including Commanding General and Chief of Engineers, U.S. Army Corps of Engineers (2012-2016) and Deputy Chief of Staff and Director of Human Resources, U.S. Army (2009-2012). General Bostick currently serves as a member of the Board and Finance and Governance Committees of CSX Corporation (transportation, 2020-present) and a member of the Board and Corporate Governance and Nominating Committee of Perma-Fix Environmental Services, Inc. (nuclear waste management, 2020-present). General Bostick serves as Chief Executive Officer of Bostick Global Strategies, LLC (consulting, 2016-present) and as a member of the Board of HireVue, Inc. (video interview and assessment, 2020-present). Previously, General Bostick served as a Member of the Advisory Board of certain Fidelity® funds (2021), President, Intrexon Bioengineering (2018-2020) and Chief Operating Officer (2017-2020) and Senior Vice President of the Environment Sector (2016-2017) of Intrexon Corporation (biopharmaceutical company).
Dennis J. Dirks (1948)
Year of Election or Appointment: 2005
Trustee
Mr. Dirks also serves as Trustee of other Fidelity® funds. Prior to his retirement in May 2003, Mr. Dirks served as Chief Operating Officer and as a member of the Board of The Depository Trust & Clearing Corporation (financial markets infrastructure), President, Chief Operating Officer and a member of the Board of The Depository Trust Company (DTC), President and a member of the Board of the National Securities Clearing Corporation (NSCC), Chief Executive Officer and a member of the Board of the Government Securities Clearing Corporation and Chief Executive Officer and a member of the Board of the Mortgage-Backed Securities Clearing Corporation. Mr. Dirks currently serves as a member of the Finance Committee (2016-present) and Board (2017-present) and is Treasurer (2018-present) of the Asolo Repertory Theatre.
Donald F. Donahue (1950)
Year of Election or Appointment: 2018
Trustee
Mr. Donahue also serves as Trustee of other Fidelity® funds. Mr. Donahue serves as President and Chief Executive Officer of Miranda Partners, LLC (risk consulting for the financial services industry, 2012-present). Previously, Mr. Donahue served as Chief Executive Officer (2006-2012), Chief Operating Officer (2003-2006) and Managing Director, Customer Marketing and Development (1999-2003) of The Depository Trust & Clearing Corporation (financial markets infrastructure). Mr. Donahue currently serves as a member (2007-present) and Co-Chairman (2016-present) of the Board of United Way of New York and a member of the Board of The Leadership Academy (previously NYC Leadership Academy) (2012-present). Mr. Donahue previously served as a member of the Advisory Board of certain Fidelity® funds (2015-2018).
Vicki L. Fuller (1957)
Year of Election or Appointment: 2020
Trustee
Ms. Fuller also serves as Trustee of other Fidelity® funds. Previously, Ms. Fuller served as a member of the Advisory Board of certain Fidelity® funds (2018-2020), Chief Investment Officer of the New York State Common Retirement Fund (2012-2018) and held a variety of positions at AllianceBernstein L.P. (global asset management, 1985-2012), including Managing Director (2006-2012) and Senior Vice President and Senior Portfolio Manager (2001-2006). Ms. Fuller currently serves as a member of the Board, Audit Committee and Nominating and Governance Committee of two Blackstone business development companies (2020-present), as a member of the Board of Treliant, LLC (consulting, 2019-present), as a member of the Advisory Board of Ariel Alternatives, LLC (private equity, 2021-present) and as a member of the Board and Chair of the Audit Committee of Gusto, Inc. (software, 2021-present). In addition, Ms. Fuller currently serves as a member of the Board of Roosevelt University (2019-present) and as a member of the Executive Board of New York University’s Stern School of Business. Ms. Fuller previously served as a member of the Board, Audit Committee and Nominating and Governance Committee of The Williams Companies, Inc. (natural gas infrastructure, 2018-2021).
Patricia L. Kampling (1959)
Year of Election or Appointment: 2020
Trustee
Ms. Kampling also serves as Trustee of other Fidelity® funds. Prior to her retirement, Ms. Kampling served as Chairman of the Board and Chief Executive Officer (2012-2019), President and Chief Operating Officer (2011-2012) and Executive Vice President and Chief Financial Officer (2010-2011) of Alliant Energy Corporation. Ms. Kampling currently serves as a member of the Board, Finance Committee and Governance, Compensation and Nominating Committee of Xcel Energy Inc. (utilities company, 2020-present) and as a member of the Board, Audit, Finance and Risk Committee and Safety, Environmental, Technology and Operations Committee and Chair of the Executive Development and Compensation Committee of American Water Works Company, Inc. (utilities company, 2019-present). In addition, Ms. Kampling currently serves as a member of the Board of the Nature Conservancy, Wisconsin Chapter (2019-present). Previously, Ms. Kampling served as a Member of the Advisory Board of certain Fidelity® funds (2020), a member of the Board, Compensation Committee and Executive Committee and Chair of the Audit Committee of Briggs & Stratton Corporation (manufacturing, 2011-2021), a member of the Board of Interstate Power and Light Company (2012-2019) and Wisconsin Power and Light Company (2012-2019) (each a subsidiary of Alliant Energy Corporation) and as a member of the Board and Workforce Development Committee of the Business Roundtable (2018-2019).
Thomas A. Kennedy (1955)
Year of Election or Appointment: 2021
Trustee
Mr. Kennedy also serves as Trustee of other Fidelity® funds. Previously, Mr. Kennedy served as a Member of the Advisory Board of certain Fidelity® funds (2020) and held a variety of positions at Raytheon Company (aerospace and defense, 1983-2020), including Chairman and Chief Executive Officer (2014-2020) and Executive Vice President and Chief Operating Officer (2013-2014). Mr. Kennedy currently serves as Executive Chairman of the Board of Directors of Raytheon Technologies Corporation (aerospace and defense, 2020-present). He is also a member of the Rutgers School of Engineering Industry Advisory Board (2011-present) and a member of the UCLA Engineering Dean’s Executive Board (2016-present).
Oscar Munoz (1959)
Year of Election or Appointment: 2021
Trustee
Mr. Munoz also serves as Trustee of other Fidelity® funds. Prior to his retirement, Mr. Munoz served as Executive Chairman (2020-2021), Chief Executive Officer (2015-2020), President (2015-2016) and a member of the Board (2010-2021) of United Airlines Holdings, Inc. Mr. Munoz currently serves as a member of the Board of CBRE Group, Inc. (commercial real estate, 2020-present), a member of the Board of Univision Communications, Inc. (Hispanic media, 2020-present) and a member of the Advisory Board of Salesforce.com, Inc. (cloud-based software, 2020-present). Previously, Mr. Munoz served as a Member of the Advisory Board of certain Fidelity® funds (2021).
Garnett A. Smith (1947)
Year of Election or Appointment: 2018
Trustee
Mr. Smith also serves as Trustee of other Fidelity® funds. Prior to his retirement, Mr. Smith served as Chairman and Chief Executive Officer (1990-1997) and President (1986-1990) of Inbrand Corp. (manufacturer of personal absorbent products). Prior to his employment with Inbrand Corp., he was employed by a retail fabric chain and North Carolina National Bank (now Bank of America). Mr. Smith previously served as a member of the Advisory Board of certain Fidelity® funds (2012-2013).
David M. Thomas (1949)
Year of Election or Appointment: 2008
Trustee
Lead Independent Trustee
Mr. Thomas also serves as Trustee of other Fidelity® funds. Previously, Mr. Thomas served as Executive Chairman (2005-2006) and Chairman and Chief Executive Officer (2000-2005) of IMS Health, Inc. (pharmaceutical and healthcare information solutions). Mr. Thomas currently serves as a member of the Board of Fortune Brands Home and Security (home and security products, 2004-present) and as Director (2013-present) and Non-Executive Chairman of the Board (2022-present) of Interpublic Group of Companies, Inc. (marketing communication).
Susan Tomasky (1953)
Year of Election or Appointment: 2020
Trustee
Ms. Tomasky also serves as Trustee of other Fidelity® funds. Prior to her retirement, Ms. Tomasky served in various executive officer positions at American Electric Power Company, Inc. (1998-2011), including most recently as President of AEP Transmission (2007-2011). Ms. Tomasky currently serves as a member of the Board and Sustainability Committee and as Chair of the Audit Committee of Marathon Petroleum Corporation (2018-present) and as a member of the Board, Executive Committee, Corporate Governance Committee and Organization and Compensation Committee and as Chair of the Audit Committee of Public Service Enterprise Group, Inc. (utilities company, 2012-present) and as a member of the Board of its subsidiary company, Public Service Electric and Gas Co. (2021-present). In addition, Ms. Tomasky currently serves as a member (2009-present) and President (2020-present) of the Board of the Royal Shakespeare Company – America (2009-present), as a member of the Board of the Columbus Association for the Performing Arts (2011-present) and as a member of the Board and Kenyon in the World Committee of Kenyon College (2016-present). Previously, Ms. Tomasky served as a Member of the Advisory Board of certain Fidelity® funds (2020), as a member of the Board of the Columbus Regional Airport Authority (2007-2020), as a member of the Board (2011-2018) and Lead Independent Director (2015-2018) of Andeavor Corporation (previously Tesoro Corporation) (independent oil refiner and marketer) and as a member of the Board of Summit Midstream Partners LP (energy, 2012-2018).
Michael E. Wiley (1950)
Year of Election or Appointment: 2020
Trustee
Mr. Wiley also serves as Trustee of other Fidelity® funds. Previously, Mr. Wiley served as a member of the Advisory Board of certain Fidelity® funds (2018-2020), Chairman, President and CEO of Baker Hughes, Inc. (oilfield services, 2000-2004). Mr. Wiley also previously served as a member of the Board of Andeavor Corporation (independent oil refiner and marketer, 2005-2018), a member of the Board of Andeavor Logistics LP (natural resources logistics, 2015-2018) and a member of the Board of High Point Resources (exploration and production, 2005-2020).
+ The information includes the Trustee's principal occupation during the last five years and other information relating to the experience, attributes, and skills relevant to the Trustee's qualifications to serve as a Trustee, which led to the conclusion that the Trustee should serve as a Trustee for the fund.
Advisory Board Members and Officers:
Correspondence intended for a Member of the Advisory Board (if any) may be sent to Fidelity Investments, P.O. Box 55235, Boston, Massachusetts 02205-5235. Correspondence intended for an officer or Peter S. Lynch may be sent to Fidelity Investments, 245 Summer Street, Boston, Massachusetts 02210. Officers appear below in alphabetical order.
Name, Year of Birth; Principal Occupation
Peter S. Lynch (1944)
Year of Election or Appointment: 2003
Member of the Advisory Board
Mr. Lynch also serves as a Member of the Advisory Board of other Fidelity® funds. Mr. Lynch is Vice Chairman and a Director of Fidelity Management & Research Company LLC (investment adviser firm). In addition, Mr. Lynch serves as a Trustee of Boston College and as the Chairman of the Inner-City Scholarship Fund. Previously, Mr. Lynch served as Vice Chairman and a Director of FMR Co., Inc. (investment adviser firm) and on the Special Olympics International Board of Directors (1997-2006).
Craig S. Brown (1977)
Year of Election or Appointment: 2019
Assistant Treasurer
Mr. Brown also serves as an officer of other funds. Mr. Brown serves as Assistant Treasurer of FIMM, LLC (2021-present) and is an employee of Fidelity Investments (2013-present).
John J. Burke III (1964)
Year of Election or Appointment: 2018
Chief Financial Officer
Mr. Burke also serves as Chief Financial Officer of other funds. Mr. Burke serves as Head of Investment Operations for Fidelity Fund and Investment Operations (2018-present) and is an employee of Fidelity Investments (1998-present). Previously Mr. Burke served as head of Asset Management Investment Operations (2012-2018).
William C. Coffey (1969)
Year of Election or Appointment: 2019
Assistant Secretary
Mr. Coffey also serves as Assistant Secretary of other funds. He is Senior Vice President and Deputy General Counsel of FMR LLC (diversified financial services company, 2010-present), and is an employee of Fidelity Investments. Previously, Mr. Coffey served as Secretary and CLO of certain funds (2018-2019); CLO, Secretary, and Senior Vice President of Fidelity Management & Research Company and FMR Co., Inc. (investment adviser firms, 2018-2019); Secretary of Fidelity SelectCo, LLC and Fidelity Investments Money Management, Inc. (investment adviser firms, 2018-2019); CLO of Fidelity Management & Research (Hong Kong) Limited, FMR Investment Management (UK) Limited, and Fidelity Management & Research (Japan) Limited (investment adviser firms, 2018-2019); and Assistant Secretary of certain funds (2009-2018).
Timothy M. Cohen (1969)
Year of Election or Appointment: 2018
Vice President
Mr. Cohen also serves as Vice President of other funds. Mr. Cohen serves as Co-Head of Equity (2018-present), a Director of Fidelity Management & Research (Japan) Limited (investment adviser firm, 2016-present), and is an employee of Fidelity Investments. Previously, Mr. Cohen served as Executive Vice President of Fidelity SelectCo, LLC (2019), Head of Global Equity Research (2016-2018), Chief Investment Officer - Equity and a Director of Fidelity Management & Research (U.K.) Inc. (investment adviser firm, 2013-2015) and as a Director of Fidelity Management & Research (Hong Kong) Limited (investment adviser firm, 2017).
Jonathan Davis (1968)
Year of Election or Appointment: 2010
Assistant Treasurer
Mr. Davis also serves as an officer of other funds. Mr. Davis serves as Assistant Treasurer of FIMM, LLC (2021-present), FMR Capital, Inc. (2017-present), FD Funds GP LLC (2021-present), FD Funds Holding LLC (2021-present), and FD Funds Management LLC (2021-present); and is an employee of Fidelity Investments. Previously, Mr. Davis served as Vice President and Associate General Counsel of FMR LLC (diversified financial services company, 2003-2010).
Laura M. Del Prato (1964)
Year of Election or Appointment: 2018
Assistant Treasurer
Ms. Del Prato also serves as an officer of other funds. Ms. Del Prato serves as Assistant Treasurer of FIMM, LLC (2021-present) and is an employee of Fidelity Investments (2017-present). Previously, Ms. Del Prato served as President and Treasurer of The North Carolina Capital Management Trust: Cash Portfolio and Term Portfolio (2018-2020). Prior to joining Fidelity Investments, Ms. Del Prato served as a Managing Director and Treasurer of the JPMorgan Mutual Funds (2014-2017). Prior to JPMorgan, Ms. Del Prato served as a partner at Cohen Fund Audit Services (accounting firm, 2012-2013) and KPMG LLP (accounting firm, 2004-2012).
Colm A. Hogan (1973)
Year of Election or Appointment: 2020
Assistant Treasurer
Mr. Hogan also serves as an officer of other funds. Mr. Hogan serves as Assistant Treasurer of FIMM, LLC (2021-present) and FMR Capital, Inc. (2017-present) and is an employee of Fidelity Investments (2005-present). Previously, Mr. Hogan served as Deputy Treasurer of certain Fidelity® funds (2016-2020) and Assistant Treasurer of certain Fidelity® funds (2016-2018).
Pamela R. Holding (1964)
Year of Election or Appointment: 2018
Vice President
Ms. Holding also serves as Vice President of other funds. Ms. Holding serves as Co-Head of Equity (2018-present) and is an employee of Fidelity Investments (2013-present). Previously, Ms. Holding served as Executive Vice President of Fidelity SelectCo, LLC (2019) and as Chief Investment Officer of Fidelity Institutional Asset Management (2013-2018).
Cynthia Lo Bessette (1969)
Year of Election or Appointment: 2019
Secretary and Chief Legal Officer (CLO)
Ms. Lo Bessette also serves as an officer of other funds. Ms. Lo Bessette serves as CLO, Secretary, and Senior Vice President of Fidelity Management & Research Company LLC (investment adviser firm, 2019-present); CLO of Fidelity Management & Research (Hong Kong) Limited, FMR Investment Management (UK) Limited, and Fidelity Management & Research (Japan) Limited (investment adviser firms, 2019-present); Secretary of FD Funds GP LLC (2021-present), FD Funds Holding LLC (2021-present), and FD Funds Management LLC (2021-present); and Assistant Secretary of FIMM, LLC (2019-present). She is a Senior Vice President and Deputy General Counsel of FMR LLC (diversified financial services company, 2019-present), and is an employee of Fidelity Investments. Previously, Ms. Lo Bessette served as CLO, Secretary, and Senior Vice President of FMR Co., Inc. (investment adviser firm, 2019); Secretary of Fidelity SelectCo, LLC and Fidelity Investments Money Management, Inc. (investment adviser firms, 2019). Prior to joining Fidelity Investments, Ms. Lo Bessette was Executive Vice President, General Counsel (2016-2019) and Senior Vice President, Deputy General Counsel (2015-2016) of OppenheimerFunds (investment management company) and Deputy Chief Legal Officer (2013-2015) of Jennison Associates LLC (investment adviser firm).
Chris Maher (1972)
Year of Election or Appointment: 2020
Deputy Treasurer
Mr. Maher also serves as an officer of other funds. Mr. Maher serves as Assistant Treasurer of FIMM, LLC (2021-present) and FMR Capital, Inc. (2017-present), and is an employee of Fidelity Investments (2008-present). Previously, Mr. Maher served as Assistant Treasurer of certain funds (2013-2020); Vice President of Asset Management Compliance (2013), Vice President of the Program Management Group of FMR (investment adviser firm, 2010-2013), and Vice President of Valuation Oversight (2008-2010).
Jason P. Pogorelec (1975)
Year of Election or Appointment: 2020
Chief Compliance Officer
Mr. Pogorelec also serves as Chief Compliance Officer of other funds. Mr. Pogorelec is a senior Vice President of Asset Management Compliance for Fidelity Investments and is an employee of Fidelity Investments (2006-present). Previously, Mr. Pogorelec served as Vice President, Associate General Counsel for Fidelity Investments (2010-2020) and Assistant Secretary of certain Fidelity funds (2015-2020).
Brett Segaloff (1972)
Year of Election or Appointment: 2021
Anti-Money Laundering (AML) Officer
Mr. Segaloff also serves as an AML Officer of other funds and other related entities. He is Director, Anti-Money Laundering (2007-present) of FMR LLC (diversified financial services company) and is an employee of Fidelity Investments (1996-present).
Stacie M. Smith (1974)
Year of Election or Appointment: 2016
President and Treasurer
Ms. Smith also serves as an officer of other funds. Ms. Smith serves as Assistant Treasurer of FIMM, LLC (2021-present) and FMR Capital, Inc. (2017-present), is an employee of Fidelity Investments (2009-present), and has served in other fund officer roles. Prior to joining Fidelity Investments, Ms. Smith served as Senior Audit Manager of Ernst & Young LLP (accounting firm, 1996-2009). Previously, Ms. Smith served as Assistant Treasurer (2013-2019) and Deputy Treasurer (2013-2016) of certain Fidelity® funds.
Jim Wegmann (1979)
Year of Election or Appointment: 2019
Assistant Treasurer
Mr. Wegmann also serves as an officer of other funds. Mr. Wegmann serves as Assistant Treasurer of FIMM, LLC (2021-present) and is an employee of Fidelity Investments (2011-present). Previously, Mr. Wegmann served as Assistant Treasurer of certain Fidelity® funds (2019-2021).
Shareholder Expense Example
As a shareholder, you incur two types of costs: (1) transaction costs, which may include sales charges (loads) on purchase payments or redemption proceeds, as applicable and (2) ongoing costs, which generally include management fees, distribution and/or service (12b-1) fees and other Fund expenses. This Example is intended to help you understand your ongoing costs (in dollars) of investing in a fund and to compare these costs with the ongoing costs of investing in other mutual funds.
The Example is based on an investment of $1,000 invested at the beginning of the period and held for the entire period (February 1, 2022 to July 31, 2022).
Actual Expenses
The first line of the accompanying table provides information about actual account values and actual expenses. You may use the information in this line, together with the amount you invested, to estimate the expenses that you paid over the period. Simply divide your account value by $1,000.00 (for example, an $8,600 account value divided by $1,000.00 = 8.6), then multiply the result by the number in the first line for a class/Fund under the heading entitled "Expenses Paid During Period" to estimate the expenses you paid on your account during this period. If any fund is a shareholder of any underlying mutual funds or exchange-traded funds (ETFs) (the Underlying Funds), such fund indirectly bears its proportional share of the expenses of the Underlying Funds in addition to the direct expenses incurred presented in the table. These fees and expenses are not included in the annualized expense ratio used to calculate the expense estimate in the table below.
Hypothetical Example for Comparison Purposes
The second line of the accompanying table provides information about hypothetical account values and hypothetical expenses based on the actual expense ratio and an assumed rate of return of 5% per year before expenses, which is not the actual return. The hypothetical account values and expenses may not be used to estimate the actual ending account balance or expenses you paid for the period. You may use this information to compare the ongoing costs of investing in the Fund and other funds. To do so, compare this 5% hypothetical example with the 5% hypothetical examples that appear in the shareholder reports of the other funds. If any fund is a shareholder of any Underlying Funds, such fund indirectly bears its proportional share of the expenses of the Underlying Funds in addition to the direct expenses as presented in the table. These fees and expenses are not included in the annualized expense ratio used to calculate the expense estimate in the table below.
Please note that the expenses shown in the table are meant to highlight your ongoing costs only and do not reflect any transaction costs. Therefore, the second line of the table is useful in comparing ongoing costs only, and will not help you determine the relative total costs of owning different funds. In addition, if these transactional costs were included, your costs would have been higher.
| | Annualized Expense Ratio-A | Beginning
Account Value
February 1, 2022 | Ending
Account Value
July 31, 2022 | Expenses Paid
During Period-B
February 1, 2022
to July 31, 2022 |
| Fidelity Growth & Income Portfolio | | | | |
| Growth and Income | .58% | | | |
| Actual | | $1,000.00 | $946.30 | $2.80 |
| Hypothetical-C | | $1,000.00 | $1,021.92 | $2.91 |
| Class K | .49% | | | |
| Actual | | $1,000.00 | $946.50 | $2.36 |
| Hypothetical-C | | $1,000.00 | $1,022.36 | $2.46 |
A Annualized expense ratio reflects expenses net of applicable fee waivers.
B Expenses are equal to the annualized expense ratio, multiplied by the average account value over the period, multiplied by 181/ 365 (to reflect the one-half year period). The fees and expenses of any Underlying Funds are not included in each annualized expense ratio.
C 5% return per year before expenses
Distributions (Unaudited)
The dividend and capital gains distributions for the fund(s) are available on Fidelity.com or Institutional.Fidelity.com.
The fund hereby designates as a capital gain dividend with respect to the taxable year ended July 31, 2022, $231,252,339, or, if subsequently determined to be different, the net capital gain of such year.
The fund designates 100% of the short-term capital gain dividends distributed in September during the fiscal year as qualifying to be taxed as short-term capital gain dividends for nonresident alien shareholders.
Growth and Income designates 30%, 59%, 62%, 100%, and 100%; Class K designates 30%, 58%, 58%, 100% and 100%; of the dividends distributed in September, October, December, April, and July, respectively during the fiscal year as qualifying for the dividends–received deduction for corporate shareholders.
Growth and Income designates 70%, 76%, 77%, 100%, and 100%; Class K designates 70%, 74%, 72%, 100%, and 100%; of the dividends distributed in September, October, December, April, and July, respectively during the fiscal year as amounts which may be taken into account as a dividend for purposes of the maximum rate under section 1(h)(11) of the Internal Revenue Code.
Growth and Income designates 4%, 2%, and 2%; Class K designates 4%, 2%, and 2%; of the dividends distributed in September, October and December, respectively during the fiscal year as a section 199A dividend.
The fund will notify shareholders in January 2023 of amounts for use in preparing 2022 income tax returns.
Board Approval of Investment Advisory Contracts and Management Fees
Fidelity Growth & Income Portfolio
Each year, the Board of Trustees, including the Independent Trustees (together, the Board), votes on the renewal of the management contract with Fidelity Management & Research Company LLC (FMR) and the sub-advisory agreements (together, the Advisory Contracts) for the fund. FMR and the sub-advisers are referred to herein as the Investment Advisers. The Board, assisted by the advice of fund counsel and Independent Trustees' counsel, requests and considers a broad range of information relevant to the renewal of the Advisory Contracts throughout the year.
The Board meets regularly and, at each of its meetings, covers an extensive agenda of topics and materials and considers factors that are relevant to its annual consideration of the renewal of the fund's Advisory Contracts, including the services and support provided to the fund and its shareholders. The Board has established various standing committees (Committees), each composed of and chaired by Independent Trustees with varying backgrounds, to which the Board has assigned specific subject matter responsibilities in order to enhance effective decision-making by the Board. The Board, acting directly and through its Committees, requests and receives information concerning the annual consideration of the renewal of the fund's Advisory Contracts. The Board also meets as needed to review matters specifically related to the Board's annual consideration of the renewal of the Advisory Contracts. Members of the Board may also meet with trustees of other Fidelity funds through joint ad hoc committees to discuss certain matters relevant to all of the Fidelity funds.
At its May 2022 meeting, the Board unanimously determined to renew the fund's Advisory Contracts. In reaching its determination, the Board considered all factors it believed relevant, including (i) the nature, extent, and quality of the services provided to the fund and its shareholders (including the investment performance of the fund); (ii) the competitiveness relative to peer funds of the fund's management fee and the total expense ratio of a representative class (retail class); (iii) the total costs of the services provided by and the profits realized by Fidelity from its relationships with the fund; and (iv) the extent to which, if any, economies of scale exist and are realized as the fund grows, and whether any economies of scale are appropriately shared with fund shareholders.
In considering whether to renew the Advisory Contracts for the fund, the Board reached a determination, with the assistance of fund counsel and Independent Trustees' counsel and through the exercise of its business judgment, that the renewal of the Advisory Contracts was in the best interests of the fund and its shareholders and that the compensation payable under the Advisory Contracts was fair and reasonable. The Board's decision to renew the Advisory Contracts was not based on any single factor, but rather was based on a comprehensive consideration of all the information provided to the Board at its meetings throughout the year. The Board, in reaching its determination to renew the Advisory Contracts, was aware that shareholders of the fund have a broad range of investment choices available to them, including a wide choice among funds offered by Fidelity's competitors, and that the fund's shareholders, who have the opportunity to review and weigh the disclosure provided by the fund in its prospectus and other public disclosures, have chosen to invest in this fund, which is part of the Fidelity family of funds.
Nature, Extent, and Quality of Services Provided. The Board considered Fidelity's staffing as it relates to the fund, including the backgrounds of investment personnel of Fidelity, and also considered the fund's investment objective, strategies, and related investment philosophy. The Independent Trustees also had discussions with senior management of Fidelity's investment operations and investment groups. The Board considered the structure of the investment personnel compensation program and whether this structure provides appropriate incentives to act in the best interests of the fund. Additionally, the Board considered the portfolio managers' investments, if any, in the funds that they manage. The Board also considered the steps Fidelity had taken to ensure the continued provision of high quality services to the Fidelity funds during the COVID-19 pandemic, including the expansion of staff in client facing positions to maintain service levels in periods of high volumes and volatility.
Resources Dedicated to Investment Management and Support Services. The Board and the Fund Oversight and Research Committees reviewed the general qualifications and capabilities of Fidelity's investment staff, including its size, education, experience, and resources, as well as Fidelity's approach to recruiting, training, managing, and compensating investment personnel. The Board noted the resources devoted to expansion of Fidelity's global investment organization, and that Fidelity's analysts have extensive resources, tools, and capabilities that allow them to conduct sophisticated quantitative and fundamental analysis, as well as credit analysis of issuers, counterparties, and guarantors. Further, the Board considered that Fidelity's investment professionals have sufficient access to global information and data so as to provide competitive investment results over time, and that those professionals also have access to sophisticated tools that permit them to assess portfolio construction and risk and performance attribution characteristics continuously, as well as to transmit new information and research conclusions rapidly around the world. Additionally, in its deliberations, the Board considered Fidelity's trading, risk management, compliance, and technology and operations capabilities and resources, which are integral parts of the investment management process.
Shareholder and Administrative Services. The Board considered (i) the nature, extent, quality, and cost of advisory, administrative, and shareholder services performed by the Investment Advisers and their affiliates under the Advisory Contracts and under separate agreements covering transfer agency, pricing and bookkeeping, and securities lending services for the fund; (ii) the nature and extent of the supervision of third party service providers, principally custodians, subcustodians, and pricing vendors; and (iii) the resources devoted to, and the record of compliance with, the fund's compliance policies and procedures. The Board also reviewed the allocation of fund brokerage, including allocations to brokers affiliated with the Investment Advisers, the use of brokerage commissions to pay fund expenses, and the use of "soft" commission dollars to pay for research services.
The Board noted that the growth of fund assets over time across the complex allows Fidelity to reinvest in the development of services designed to enhance the value and convenience of the Fidelity funds as investment vehicles. These services include 24-hour access to account information and market information over the Internet and through telephone representatives, investor education materials, and asset allocation tools. The Board also considered that it reviews customer service metrics such as telephone response times, continuity of services on the website and metrics addressing services at Fidelity Investor Centers.
Investment in a Large Fund Family. The Board considered the benefits to shareholders of investing in a Fidelity fund, including the benefits of investing in a fund that is part of a large family of funds offering a variety of investment disciplines and providing a large variety of mutual fund investor services. The Board noted that Fidelity had taken, or had made recommendations that resulted in the Fidelity funds taking, a number of actions over the previous year that benefited particular funds, including: (i) continuing to dedicate additional resources to Fidelity's investment research process, which includes meetings with management of issuers of securities in which the funds invest; (ii) continuing efforts to enhance Fidelity's global research capabilities; (iii) launching new funds and ETFs with innovative structures, strategies and pricing and making other enhancements to meet client needs; (iv) launching new share classes of existing funds; (v) eliminating purchase minimums and broadening eligibility requirements for certain funds and share classes; (vi) reducing management fees and total expenses for certain target date funds and classes and index funds; (vii) lowering expenses for certain existing funds and classes by implementing or lowering expense caps; (viii) rationalizing product lines and gaining increased efficiencies from fund mergers and liquidations; (ix) continuing to develop, acquire and implement systems and technology to improve services to the funds and shareholders, strengthen information security, and increase efficiency; and (x) continuing to implement enhancements to further strengthen Fidelity's product line to increase investors' probability of success in achieving their investment goals, including retirement income goals.
Investment Performance. The Board considered whether the fund has operated in accordance with its investment objective, as well as its record of compliance with its investment restrictions and its performance history.
The Board took into account discussions that occur at Board meetings throughout the year with representatives of the Investment Advisers about fund investment performance. In this regard the Board noted that as part of regularly scheduled fund reviews and other reports to the Board on fund performance, the Board considers annualized return information for the fund for different time periods, measured against an appropriate securities market index (benchmark index) and an appropriate peer group of funds with similar objectives (peer group). The Board also reviews and considers information about performance attribution. In its evaluation of fund investment performance, the Board gave particular attention to information indicating changes in performance of certain Fidelity funds for specific time periods and discussed with the Investment Advisers the reasons for any overperformance or underperformance.
In addition to reviewing absolute and relative fund performance, the Independent Trustees periodically consider the appropriateness of fund performance metrics in evaluating the results achieved. In general, the Independent Trustees believe that fund performance should be evaluated based on net performance (after fees and expenses) of the representative class, compared to appropriate benchmark indices, over appropriate time periods that may include full market cycles, and compared to peer groups, as applicable, over the same periods, taking into account relevant factors including the following: general market conditions; issuer-specific information; and fund cash flows and other factors.
The Independent Trustees recognize that shareholders evaluate performance on a net basis over their own holding periods, for which one-, three-, and five-year periods are often used as a proxy. For this reason, the performance information reviewed by the Board also included net cumulative total return information for the fund and an appropriate benchmark index and peer group for the most recent one-, three-, and five-year periods ended September 30, 2021, as shown below. Returns are shown compared to the 25th percentile (top of box, 75% beaten) and 75th percentile (bottom of box, 25% beaten) of the peer universe.
Fidelity Growth & Income Portfolio
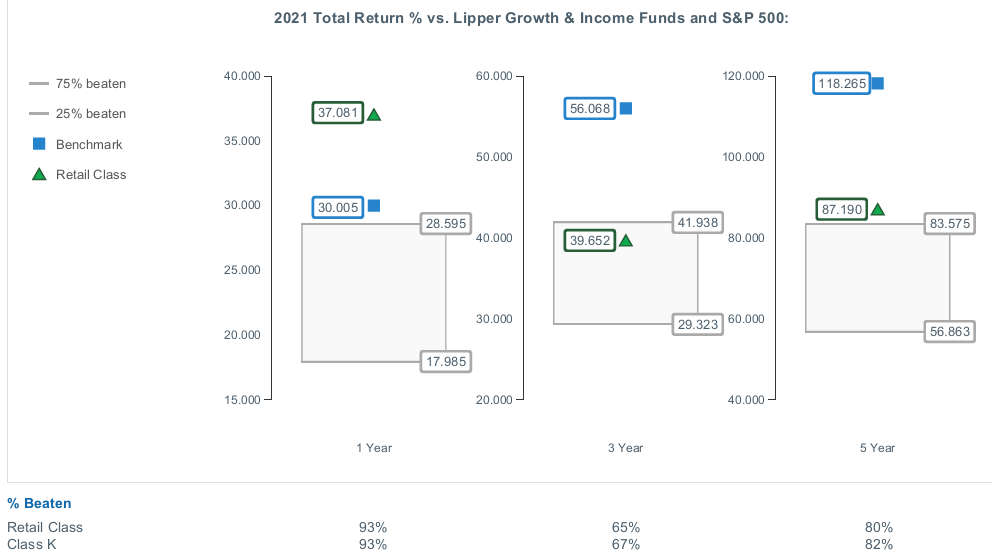
The Based on its review, the Board concluded that the nature, extent, and quality of services provided to the fund under the Advisory Contracts should continue to benefit the shareholders of the fund.
Competitiveness of Management Fee and Total Expense Ratio. The Board considered the fund's management fee and total expense ratio compared to "mapped groups" of competitive funds and classes created for the purpose of facilitating the Trustees' competitive analysis of management fees and total expenses. Fidelity creates "mapped groups" by combining similar Lipper investment objective categories that have comparable investment mandates. Combining Lipper investment objective categories aids the Board's management fee and total expense ratio comparisons by broadening the competitive group used for comparison.
Management Fee. The Board considered two proprietary management fee comparisons for the 12-month periods ended September 30 (June 30 for periods ended 2019 and 2018 and December 31 for periods prior to 2018) shown in basis points (BP) in the chart below. The group of Lipper funds used by the Board for management fee comparisons is referred to below as the "Total Mapped Group." The Total Mapped Group comparison focuses on a fund's standing in terms of gross management fees before expense reimbursements or caps relative to the total universe of funds with comparable investment mandates, regardless of whether their management fee structures also are comparable. Funds with comparable investment mandates offer exposure to similar types of securities. Funds with comparable management fee structures have similar management fee contractual arrangements (
e.g., flat rate charged for advisory services, all-inclusive fee rate,
etc.). "TMG %" represents the percentage of funds in the Total Mapped Group that had management fees that were lower than the fund's. For example, a hypothetical TMG % of 20% would mean that 80% of the funds in the Total Mapped Group had higher, and 20% had lower, management fees than the fund. The fund's actual TMG %s and the number of funds in the Total Mapped Group are in the chart below. The "Asset-Sized Peer Group" (ASPG) comparison focuses on a fund's standing relative to a subset of non-Fidelity funds within the Total Mapped Group that are similar in size and management fee structure. For example, if a fund is in the first quartile of the ASPG, the fund's management fee ranks in the least expensive or lowest 25% of funds in the ASPG. The ASPG represents at least 15% of the funds in the Total Mapped Group with comparable asset size and management fee structures, subject to a minimum of 50 funds (or all funds in the Total Mapped Group if fewer than 50). Additional information, such as the ASPG quartile in which the fund's management fee rate ranked, is also included in the chart and was considered by the Board.
Fidelity Growth & Income Portfolio

The Board noted that the fund's management fee rate ranked below the median of its Total Mapped Group and below the median of its ASPG for the 12-month period ended September 30, 2021.
The Board also considered that, for funds subject to the group fee, FMR agreed to voluntarily waive fees over a specified period of time in amounts designed to account for assets converted from certain funds to certain collective investment trusts.
Based on its review, the Board concluded that the fund's management fee is fair and reasonable in light of the services that the fund receives and the other factors considered.
Total Expense Ratio. In its review of the total expense ratio of the representative class (retail class), the Board considered the fund's management fee rate as well as other fund or class expenses, as applicable, such as transfer agent fees, pricing and bookkeeping fees, and custodial, legal, and audit fees. The Board also noted that Fidelity may agree to waive fees or reimburse expenses from time to time, and the extent to which, if any, it has done so for the fund. The fund's representative class is compared to those funds and classes in the Total Mapped Group (used by the Board for management fee comparisons) that have a similar sales load structure. The Board also considered a total expense ASPG comparison, which focuses on the total expenses of the representative class relative to a subset of non-Fidelity funds within the total expense the representative class. The total expense ASPG is limited to 15 larger and 15 smaller classes in fund average assets for a total of 30 classes, where possible. The total expense ASPG comparison excludes performance adjustments and fund-paid 12b-1 fees to eliminate variability in fee structures.
The Board noted that the total net expense ratio of the retail class ranked below the similar sales load structure group competitive median and below the ASPG competitive median for the 12-month period ended September 30, 2021.
Fees Charged to Other Fidelity Clients. The Board also considered Fidelity fee structures and other information with respect to clients of Fidelity, such as other funds advised or subadvised by Fidelity, pension plan clients, and other institutional clients with similar mandates. The Board noted that a joint ad hoc committee created by it and the boards of other Fidelity funds periodically reviews and compares Fidelity's institutional investment advisory business with its business of providing services to the Fidelity funds and also noted the most recent findings of the committee. The Board noted that the committee's review included a consideration of the differences in services provided, fees charged, and costs incurred, as well as competition in the markets serving the different categories of clients.
Based on its review of total expense ratios and fees charged to other Fidelity clients, the Board concluded that the total expense ratio of each class of the fund was reasonable in light of the services that the fund and its shareholders receive and the other factors considered.
Costs of the Services and Profitability. The Board considered the revenues earned and the expenses incurred by Fidelity in conducting the business of developing, marketing, distributing, managing, administering and servicing the fund and servicing the fund's shareholders. The Board also considered the level of Fidelity's profits in respect of all the Fidelity funds.
On an annual basis, Fidelity presents to the Board information about the profitability of its relationships with the fund. Fidelity calculates profitability information for each fund, as well as aggregate profitability information for groups of Fidelity funds and all Fidelity funds, using a series of detailed revenue and cost allocation methodologies which originate with the books and records of Fidelity on which Fidelity's audited financial statements are based. The Audit Committee of the Board reviews any significant changes from the prior year's methodologies and the full Board approves such changes.
A public accounting firm has been engaged annually by the Board as part of the Board's assessment of Fidelity's profitability analysis. The engagement includes the review and assessment of the methodologies used by Fidelity in determining the revenues and expenses attributable to Fidelity's mutual fund business, and completion of agreed-upon procedures in respect of the mathematical accuracy of certain fund profitability information and its conformity to established allocation methodologies. After considering the reports issued under the engagement and information provided by Fidelity, the Board concluded that while other allocation methods may also be reasonable, Fidelity's profitability methodologies are reasonable in all material respects.
The Board also reviewed Fidelity's non-fund businesses and potential indirect benefits such businesses may have received as a result of their association with Fidelity's mutual fund business (i.e., fall-out benefits) as well as cases where Fidelity's affiliates may benefit from the funds' business. The Board considered areas where potential indirect benefits to the Fidelity funds from their relationships with Fidelity may exist. The Board's consideration of these matters was informed by the findings of a joint ad hoc committee created by it and the boards of other Fidelity funds to evaluate potential fall-out benefits.
The Board considered the costs of the services provided by and the profits realized by Fidelity in connection with the operation of the fund and was satisfied that the profitability was not excessive.
Economies of Scale. The Board considered whether there have been economies of scale in respect of the management of the Fidelity funds, whether the Fidelity funds (including the fund) have appropriately benefited from any such economies of scale, and whether there is potential for realization of any further economies of scale. The Board considered the extent to which the fund will benefit from economies of scale as assets grow through increased services to the fund, through waivers or reimbursements, or through fee or expense ratio reductions. The Board also noted that a committee (the Economies of Scale Committee) created by it and the boards of other Fidelity funds periodically analyzes whether Fidelity attains economies of scale in respect of the management and servicing of the Fidelity funds, whether the Fidelity funds have appropriately benefited from such economies of scale, and whether there is potential for realization of any further economies of scale.
The Board recognized that the fund's management contract incorporates a "group fee" structure, which provides for lower group fee rates as total "group assets" increase, and for higher group fee rates as total "group assets" decrease ("group assets" as defined in the management contract). FMR calculates the group fee rates based on a tiered asset "breakpoint" schedule that varies based on asset class. The Board considered that the group fee is designed to deliver the benefits of economies of scale to fund shareholders when total Fidelity fund assets increase, even if assets of any particular fund are unchanged or have declined, because some portion of Fidelity's costs are attributable to services provided to all Fidelity funds, and all funds benefit if those costs can be allocated among more assets. The Board further considered that Fidelity agreed to impose a temporary fee waiver in the form of additional breakpoints to the current breakpoint schedule. The Board concluded that, given the group fee structure, fund shareholders will benefit from lower management fees as "group assets" increase at the fund complex level, regardless of whether Fidelity achieves any such economies of scale.
The Board concluded, taking into account the analysis of the Economies of Scale Committee, that economies of scale, if any, are being appropriately shared between fund shareholders and Fidelity.
Additional Information Requested by the Board. In order to develop fully the factual basis for consideration of the Fidelity funds' advisory contracts, the Board requested and received additional information on certain topics, including: (i) fund flow and performance trends, in particular the underperformance of certain funds and strategies, and Fidelity's long-term strategies for certain funds, including any consideration of fund liquidations or mergers; (ii) the operation of performance fees, competitor use of performance fees, and consideration of the expansion of performance fees to additional funds; (iii) Fidelity's pricing philosophy compared to competitors; (iv) fund profitability methodology and data; (v) evaluation of competitive fund data and peer group classifications and fee and expense comparisons; (vi) the management fee and expense structures for different funds and classes and information about the differences between various fee and expense structures; (vii) group fee breakpoints and related voluntary fee waivers; and (viii) information regarding other accounts managed by Fidelity and the funds' sub-advisory arrangements.
Based on its evaluation of all of the conclusions noted above, and after considering all factors it believed relevant, the Board concluded that the advisory fee arrangements are fair and reasonable and that the fund's Advisory Contracts should be renewed.
Liquidity Risk Management Program
The Securities and Exchange Commission adopted Rule 22e-4 under the Investment Company Act of 1940 (the Liquidity Rule) to promote effective liquidity risk management throughout the open-end investment company industry, thereby reducing the risk that funds will be unable to meet their redemption obligations and mitigating dilution of the interests of fund shareholders.
The Fund has adopted and implemented a liquidity risk management program pursuant to the Liquidity Rule (the Program) effective December 1, 2018. The Program is reasonably designed to assess and manage the Fund’s liquidity risk and to comply with the requirements of the Liquidity Rule. The Fund’s Board of Trustees (the Board) has designated the Fund’s investment adviser as administrator of the Program. The Fidelity advisers have established a Liquidity Risk Management Committee (the LRM Committee) to manage the Program for each of the Fidelity Funds. The LRM Committee monitors the adequacy and effectiveness of implementation of the Program and on a periodic basis assesses each Fund’s liquidity risk based on a variety of factors including (1) the Fund’s investment strategy, (2) portfolio liquidity and cash flow projections during normal and reasonably foreseeable stressed conditions, (3) shareholder redemptions, (4) borrowings and other funding sources and (5) in the case of exchange-traded funds, certain additional factors including the effect of the Fund’s prices and spreads, market participants, and basket compositions on the overall liquidity of the Fund’s portfolio, as applicable.
In accordance with the Program, each of the Fund’s portfolio investments is classified into one of four liquidity categories described below based on a determination of a reasonable expectation for how long it would take to convert the investment to cash (or sell or dispose of the investment) without significantly changing its market value.
- Highly liquid investments – cash or convertible to cash within three business days or less
- Moderately liquid investments – convertible to cash in three to seven calendar days
- Less liquid investments – can be sold or disposed of, but not settled, within seven calendar days
- Illiquid investments – cannot be sold or disposed of within seven calendar days
Liquidity classification determinations take into account a variety of factors including various market, trading and investment-specific considerations, as well as market depth, and generally utilize analysis from a third-party liquidity metrics service.
The Liquidity Rule places a 15% limit on a fund’s illiquid investments and requires funds that do not primarily hold assets that are highly liquid investments to determine and maintain a minimum percentage of the fund’s net assets to be invested in highly liquid investments (highly liquid investment minimum or HLIM). The Program includes provisions reasonably designed to comply with the 15% limit on illiquid investments and for determining, periodically reviewing and complying with the HLIM requirement as applicable.
At a recent meeting of the Fund’s Board of Trustees, the LRM Committee provided a written report to the Board pertaining to the operation, adequacy, and effectiveness of implementation of the Program for the annual period from December 1, 2020 through November 30, 2021. The report concluded that the Program has been implemented and is operating effectively and is reasonably designed to assess and manage the Fund’s liquidity risk.
GAI-ANN-0922
1.536189.125
Fidelity® Leveraged Company Stock Fund
Annual Report
July 31, 2022
Contents
To view a fund's proxy voting guidelines and proxy voting record for the 12-month period ended June 30, visit http://www.fidelity.com/proxyvotingresults or visit the Securities and Exchange Commission's (SEC) web site at http://www.sec.gov.
You may also call 1-800-544-8544 if you’re an individual investing directly with Fidelity, call 1-800-835-5092 if you’re a plan sponsor or participant with Fidelity as your recordkeeper or call 1-877-208-0098 on institutional accounts or if you’re an advisor or invest through one to request a free copy of the proxy voting guidelines.
Standard & Poor's, S&P and S&P 500 are registered service marks of The McGraw-Hill Companies, Inc. and have been licensed for use by Fidelity Distributors Corporation.
Other third-party marks appearing herein are the property of their respective owners.
All other marks appearing herein are registered or unregistered trademarks or service marks of FMR LLC or an affiliated company. © 2022 FMR LLC. All rights reserved.
This report and the financial statements contained herein are submitted for the general information of the shareholders of the Fund. This report is not authorized for distribution to prospective investors in the Fund unless preceded or accompanied by an effective prospectus.
A fund files its complete schedule of portfolio holdings with the SEC for the first and third quarters of each fiscal year on Form N-PORT. Forms N-PORT are available on the SEC’s web site at http://www.sec.gov. A fund's Forms N-PORT may be reviewed and copied at the SEC’s Public Reference Room in Washington, DC. Information regarding the operation of the SEC's Public Reference Room may be obtained by calling 1-800-SEC-0330.
For a complete list of a fund's portfolio holdings, view the most recent holdings listing, semiannual report, or annual report on Fidelity's web site at http://www.fidelity.com, http://www.institutional.fidelity.com, or http://www.401k.com, as applicable.
NOT FDIC INSURED •MAY LOSE VALUE •NO BANK GUARANTEE
Neither the Fund nor Fidelity Distributors Corporation is a bank.
Note to Shareholders:
Early in 2020, the outbreak and spread of COVID-19 emerged as a public health emergency that had a major influence on financial markets, primarily based on its impact on the global economy and corporate earnings. On March 11, 2020, the World Health Organization declared the COVID-19 outbreak a pandemic, citing sustained risk of further global spread. The pandemic prompted a number of measures to limit the spread of COVID-19, including travel and border restrictions, quarantines, and restrictions on large gatherings. In turn, these resulted in lower consumer activity, diminished demand for a wide range of products and services, disruption in manufacturing and supply chains, and – given the wide variability in outcomes regarding the outbreak – significant market uncertainty and volatility. To help stem the turmoil, the U.S. government took unprecedented action – in concert with the U.S. Federal Reserve and central banks around the world – to help support consumers, businesses, and the broader economy, and to limit disruption to the financial system.
In general, the overall impact of the pandemic lessened in 2021, amid a resilient economy and widespread distribution of three COVID-19 vaccines granted emergency use authorization from the U.S. Food and Drug Administration (FDA) early in the year. Still, the situation remains dynamic, and the extent and duration of its influence on financial markets and the economy is highly uncertain, due in part to a recent spike in cases based on highly contagious variants of the coronavirus.
Extreme events such as the COVID-19 crisis are exogenous shocks that can have significant adverse effects on mutual funds and their investments. Although multiple asset classes may be affected by market disruption, the duration and impact may not be the same for all types of assets. Fidelity is committed to helping you stay informed amid news about COVID-19 and during increased market volatility, and we continue to take extra steps to be responsive to customer needs. We encourage you to visit us online, where we offer ongoing updates, commentary, and analysis on the markets and our funds.
Performance: The Bottom Line
Average annual total return reflects the change in the value of an investment, assuming reinvestment of distributions from dividend income and capital gains (the profits earned upon the sale of securities that have grown in value, if any) and assuming a constant rate of performance each year. The hypothetical investment and the average annual total returns do not reflect the deduction of taxes that a shareholder would pay on fund distributions or the redemption of fund shares. During periods of reimbursement by Fidelity, a fund’s total return will be greater than it would be had the reimbursement not occurred. How a fund did yesterday is no guarantee of how it will do tomorrow.
Average Annual Total Returns
| For the periods ended July 31, 2022 | Past 1 year | Past 5 years | Past 10 years |
| Fidelity® Leveraged Company Stock Fund | (10.85)% | 10.29% | 11.65% |
| Class K | (10.77)% | 10.41% | 11.77% |
$10,000 Over 10 Years
Let's say hypothetically that $10,000 was invested in Fidelity® Leveraged Company Stock Fund, a class of the fund, on July 31, 2012.
The chart shows how the value of your investment would have changed, and also shows how the Russell Midcap® Index performed over the same period.
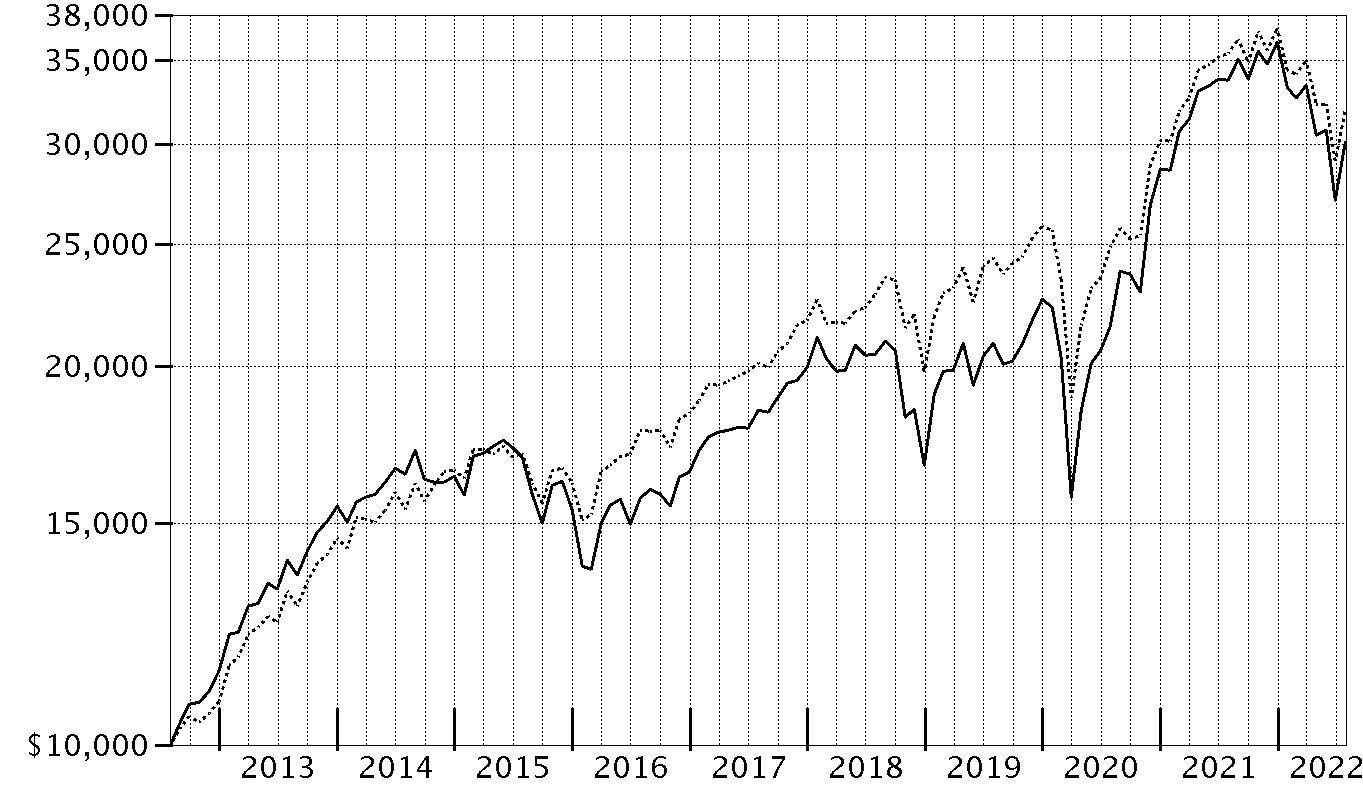
| Period Ending Values |
| $30,090 | Fidelity® Leveraged Company Stock Fund |
| $31,950 | Russell Midcap® Index |
Management's Discussion of Fund Performance
Market Recap: The S&P 500
® index returned -4.64% for the 12 months ending July 31, 2022, as a multitude of crosscurrents challenged the global economy and financial markets. Persistently high inflation, exacerbated by energy price shocks from the Russia–Ukraine conflict, spurred the U.S. Federal Reserve to hike interest rates more aggressively than anticipated, and concerns about the outlook for economic growth sent stocks into bear market territory. In early May, the Fed approved a rare half-percentage-point interest rate increase and announced plans to shrink its $9 trillion asset portfolio. June began with the Fed allowing up to billions in Treasuries and mortgage bonds to mature every month without investing the proceeds. Two weeks later, the central bank raised rates by 0.75 percentage points, its largest increase since 1994, and said it was becoming more difficult to achieve a soft landing, in which the economy slows enough to bring down inflation while avoiding a recession. Against this volatile backdrop, the S&P 500 posted its worst first-half result (-19.96%) to begin a year since 1970. Stocks sharply reversed course in July (+9.22%), as the Fed again raised its benchmark interest rate by 0.75% but signaled that, at some point, it will likely slow the pace of tightening to assess the impact on the economy. For the full 12 months, growth-oriented communication services (-29%) and consumer discretionary (-10%) stocks lagged most. In contrast, energy (+67%) rode a surge in commodity prices and led by a wide margin, followed by the defensive utilities (+16%) and consumer staples (+7%) sectors.
Comments from Co-Managers Mark Notkin and Brian Chang: For the fiscal year, the fund's share classes returned roughly -11%, trailing the -9.83% result of the benchmark, the Russell MidCap
® Index, as well as the Fidelity U.S. Leveraged Stock Linked Index. Versus the benchmark, market selection was the primary detractor, especially an overweighting within the communication services sector. An overweighting and stock picking in the consumer discretionary sector, primarily within the consumer services industry, also hurt. Also hampering our result was an overweighting in information technology. The fund's largest individual relative detractor was an outsized stake in Caesars Entertainment, which returned -48% the past year. The company was among our biggest holdings. The fund's non-benchmark stake in Meta Platforms returned approximately -57% and hurt our relative result. We decreased our stake in the company the past 12 months. The fund's non-benchmark stake in PayPal Holdings, a position not held at period end, returned about -51% and detracted. In contrast, the largest contributor to performance versus the benchmark were stock picks in health care. Security selection in communication services also helped the fund's relative performance. The top individual relative contributor was an overweighting in CF Industries Holdings, which gained 107% the past year. Also lifting performance was our outsized stake in Nexstar Broadcasting Group, which gained roughly 31%. Nexstar was among the fund's largest holdings at period end. Another notable relative contributor was an overweighting in Cheniere Energy (+78%), a sizable holding as of July 31. Notable changes in positioning include higher allocations to the energy, materials and health care sectors.
The views expressed above reflect those of the portfolio manager(s) only through the end of the period as stated on the cover of this report and do not necessarily represent the views of Fidelity or any other person in the Fidelity organization. Any such views are subject to change at any time based upon market or other conditions and Fidelity disclaims any responsibility to update such views. These views may not be relied on as investment advice and, because investment decisions for a Fidelity fund are based on numerous factors, may not be relied on as an indication of trading intent on behalf of any Fidelity fund.
Investment Summary (Unaudited)
Top Ten Stocks as of July 31, 2022
| | % of fund's net assets |
| Microsoft Corp. | 3.9 |
| IQVIA Holdings, Inc. | 3.6 |
| Alphabet, Inc. Class A | 3.5 |
| Nexstar Broadcasting Group, Inc. Class A | 3.5 |
| Thermo Fisher Scientific, Inc. | 3.3 |
| Cheniere Energy, Inc. | 3.1 |
| UnitedHealth Group, Inc. | 3.0 |
| JBS SA | 2.9 |
| Caesars Entertainment, Inc. | 2.8 |
| Adobe, Inc. | 2.7 |
| | 32.3 |
Market Sectors as of July 31, 2022
| | % of fund's net assets |
| Information Technology | 24.5 |
| Health Care | 15.3 |
| Consumer Discretionary | 12.0 |
| Communication Services | 9.3 |
| Materials | 7.5 |
| Energy | 7.2 |
| Consumer Staples | 5.5 |
| Financials | 4.9 |
| Industrials | 3.8 |
| Utilities | 3.7 |
| Real Estate | 0.5 |
Asset Allocation (% of fund's net assets)
| As of July 31, 2022 * |
| | Stocks | 94.2% |
| | Short-Term Investments and Net Other Assets (Liabilities) | 5.8% |

* Foreign investments - 5.0%
Schedule of Investments July 31, 2022
Showing Percentage of Net Assets
| Common Stocks - 94.2% | | | |
| | | Shares | Value (000s) |
| COMMUNICATION SERVICES - 9.3% | | | |
| Interactive Media & Services - 4.6% | | | |
| Alphabet, Inc. Class A (a) | | 676,000 | $78,632 |
| Cars.com, Inc. (a) | | 497,300 | 5,848 |
| Meta Platforms, Inc. Class A (a) | | 109,400 | 17,406 |
| | | | 101,886 |
| Media - 3.5% | | | |
| Nexstar Broadcasting Group, Inc. Class A (b) | | 409,098 | 77,062 |
| Wireless Telecommunication Services - 1.2% | | | |
| T-Mobile U.S., Inc. (a) | | 182,500 | 26,108 |
|
| TOTAL COMMUNICATION SERVICES | | | 205,056 |
|
| CONSUMER DISCRETIONARY - 12.0% | | | |
| Automobiles - 2.3% | | | |
| Tesla, Inc. (a) | | 56,500 | 50,367 |
| Hotels, Restaurants & Leisure - 5.7% | | | |
| Airbnb, Inc. Class A (a) | | 7,700 | 855 |
| Boyd Gaming Corp. | | 1,057,399 | 58,696 |
| Caesars Entertainment, Inc. (a) | | 1,369,780 | 62,585 |
| Studio City International Holdings Ltd.: | | | |
| ADR (c) | | 631,958 | 1,258 |
| (NYSE) ADR (a) | | 695,700 | 1,384 |
| | | | 124,778 |
| Household Durables - 1.5% | | | |
| Lennar Corp. Class A | | 73,300 | 6,231 |
| Tempur Sealy International, Inc. | | 990,732 | 27,225 |
| | | | 33,456 |
| Specialty Retail - 1.9% | | | |
| Lowe's Companies, Inc. | | 115,400 | 22,103 |
| Ulta Beauty, Inc. (a) | | 28,900 | 11,239 |
| Victoria's Secret & Co. (a) | | 64,200 | 2,373 |
| Williams-Sonoma, Inc. (b) | | 45,800 | 6,614 |
| | | | 42,329 |
| Textiles, Apparel & Luxury Goods - 0.6% | | | |
| Tapestry, Inc. | | 402,500 | 13,536 |
|
| TOTAL CONSUMER DISCRETIONARY | | | 264,466 |
|
| CONSUMER STAPLES - 5.5% | | | |
| Food & Staples Retailing - 1.2% | | | |
| Albertsons Companies, Inc. | | 346,200 | 9,295 |
| BJ's Wholesale Club Holdings, Inc. (a) | | 246,200 | 16,668 |
| | | | 25,963 |
| Food Products - 4.3% | | | |
| Darling Ingredients, Inc. (a) | | 446,483 | 30,932 |
| JBS SA | | 10,456,300 | 64,547 |
| | | | 95,479 |
|
| TOTAL CONSUMER STAPLES | | | 121,442 |
|
| ENERGY - 7.2% | | | |
| Oil, Gas & Consumable Fuels - 7.2% | | | |
| Antero Resources Corp. (a) | | 829,200 | 32,869 |
| Cheniere Energy, Inc. | | 462,300 | 69,151 |
| Chesapeake Energy Corp. (b) | | 262,000 | 24,673 |
| Denbury, Inc. (a) | | 285,900 | 20,559 |
| Occidental Petroleum Corp. | | 195,500 | 12,854 |
| | | | 160,106 |
| FINANCIALS - 4.9% | | | |
| Banks - 2.0% | | | |
| Bank of America Corp. | | 652,399 | 22,058 |
| JPMorgan Chase & Co. | | 199,700 | 23,037 |
| | | | 45,095 |
| Consumer Finance - 1.3% | | | |
| OneMain Holdings, Inc. | | 760,200 | 28,279 |
| Insurance - 1.6% | | | |
| Arthur J. Gallagher & Co. | | 191,700 | 34,312 |
|
| TOTAL FINANCIALS | | | 107,686 |
|
| HEALTH CARE - 15.3% | | | |
| Biotechnology - 0.7% | | | |
| Regeneron Pharmaceuticals, Inc. (a) | | 25,000 | 14,542 |
| Health Care Providers & Services - 5.6% | | | |
| HCA Holdings, Inc. | | 87,700 | 18,629 |
| Humana, Inc. | | 60,200 | 29,016 |
| Tenet Healthcare Corp. (a) | | 170,409 | 11,267 |
| UnitedHealth Group, Inc. | | 121,800 | 66,057 |
| | | | 124,969 |
| Life Sciences Tools & Services - 8.3% | | | |
| Charles River Laboratories International, Inc. (a) | | 122,900 | 30,791 |
| IQVIA Holdings, Inc. (a) | | 333,500 | 80,130 |
| Thermo Fisher Scientific, Inc. | | 119,900 | 71,749 |
| | | | 182,670 |
| Pharmaceuticals - 0.7% | | | |
| Bristol-Myers Squibb Co. | | 208,000 | 15,346 |
|
| TOTAL HEALTH CARE | | | 337,527 |
|
| INDUSTRIALS - 3.8% | | | |
| Building Products - 0.8% | | | |
| Builders FirstSource, Inc. (a) | | 120,900 | 8,221 |
| Carrier Global Corp. | | 258,900 | 10,493 |
| | | | 18,714 |
| Electrical Equipment - 0.0% | | | |
| Array Technologies, Inc. (a) | | 45,100 | 760 |
| Marine - 0.0% | | | |
| Genco Shipping & Trading Ltd. | | 831 | 16 |
| Professional Services - 1.3% | | | |
| ASGN, Inc. (a) | | 278,300 | 28,876 |
| Road & Rail - 0.3% | | | |
| XPO Logistics, Inc. (a) | | 111,600 | 6,667 |
| Trading Companies & Distributors - 1.4% | | | |
| United Rentals, Inc. (a) | | 93,200 | 30,073 |
|
| TOTAL INDUSTRIALS | | | 85,106 |
|
| INFORMATION TECHNOLOGY - 24.5% | | | |
| Electronic Equipment & Components - 2.3% | | | |
| CDW Corp. | | 213,000 | 38,666 |
| Zebra Technologies Corp. Class A (a) | | 33,100 | 11,840 |
| | | | 50,506 |
| IT Services - 4.1% | | | |
| Global Payments, Inc. | | 357,200 | 43,693 |
| SS&C Technologies Holdings, Inc. | | 438,297 | 25,934 |
| Visa, Inc. Class A | | 96,300 | 20,426 |
| | | | 90,053 |
| Semiconductors & Semiconductor Equipment - 9.1% | | | |
| KLA Corp. | | 33,800 | 12,964 |
| Lam Research Corp. | | 71,700 | 35,887 |
| Marvell Technology, Inc. | | 502,700 | 27,990 |
| Microchip Technology, Inc. | | 509,000 | 35,050 |
| NVIDIA Corp. | | 100,100 | 18,181 |
| NXP Semiconductors NV | | 121,700 | 22,378 |
| onsemi (a) | | 723,500 | 48,315 |
| | | | 200,765 |
| Software - 9.0% | | | |
| Adobe, Inc. (a) | | 144,400 | 59,221 |
| Microsoft Corp. | | 308,900 | 86,726 |
| Palo Alto Networks, Inc. (a) | | 63,900 | 31,892 |
| Salesforce.com, Inc. (a) | | 120,800 | 22,230 |
| | | | 200,069 |
|
| TOTAL INFORMATION TECHNOLOGY | | | 541,393 |
|
| MATERIALS - 7.5% | | | |
| Chemicals - 4.2% | | | |
| CF Industries Holdings, Inc. | | 449,000 | 42,875 |
| The Chemours Co. LLC | | 1,387,728 | 49,389 |
| | | | 92,264 |
| Containers & Packaging - 2.3% | | | |
| Berry Global Group, Inc. (a) | | 407,300 | 23,481 |
| WestRock Co. | | 659,700 | 27,945 |
| | | | 51,426 |
| Metals & Mining - 1.0% | | | |
| Cleveland-Cliffs, Inc. (a) | | 183,300 | 3,246 |
| First Quantum Minerals Ltd. | | 1,069,400 | 19,542 |
| | | | 22,788 |
|
| TOTAL MATERIALS | | | 166,478 |
|
| REAL ESTATE - 0.5% | | | |
| Equity Real Estate Investment Trusts (REITs) - 0.5% | | | |
| Crown Castle International Corp. | | 63,000 | 11,382 |
| UTILITIES - 3.7% | | | |
| Electric Utilities - 2.6% | | | |
| NRG Energy, Inc. | | 610,148 | 23,033 |
| PG&E Corp. (a) | | 3,118,902 | 33,871 |
| | | | 56,904 |
| Independent Power and Renewable Electricity Producers - 1.1% | | | |
| Vistra Corp. | | 955,800 | 24,707 |
|
| TOTAL UTILITIES | | | 81,611 |
|
| TOTAL COMMON STOCKS | | | |
| (Cost $1,270,518) | | | 2,082,253 |
|
| Money Market Funds - 7.6% | | | |
| Fidelity Cash Central Fund 2.01% (d) | | 129,437,121 | 129,463 |
| Fidelity Securities Lending Cash Central Fund 2.01% (d)(e) | | 39,223,145 | 39,227 |
| TOTAL MONEY MARKET FUNDS | | | |
| (Cost $168,687) | | | 168,690 |
| TOTAL INVESTMENT IN SECURITIES - 101.8% | | | |
| (Cost $1,439,205) | | | 2,250,943 |
| NET OTHER ASSETS (LIABILITIES) - (1.8)% | | | (40,571) |
| NET ASSETS - 100% | | | $2,210,372 |
Legend
(a) Non-income producing
(b) Security or a portion of the security is on loan at period end.
(c) Security exempt from registration under Rule 144A of the Securities Act of 1933. These securities may be resold in transactions exempt from registration, normally to qualified institutional buyers. At the end of the period, the value of these securities amounted to $1,258,000 or 0.1% of net assets.
(d) Affiliated fund that is generally available only to investment companies and other accounts managed by Fidelity Investments. The rate quoted is the annualized seven-day yield of the fund at period end. A complete unaudited listing of the fund's holdings as of its most recent quarter end is available upon request. In addition, each Fidelity Central Fund's financial statements, which are not covered by the Fund's Report of Independent Registered Public Accounting Firm, are available on the SEC's website or upon request.
(e) Investment made with cash collateral received from securities on loan.
Affiliated Central Funds
Fiscal year to date information regarding the Fund's investments in Fidelity Central Funds, including the ownership percentage, is presented below.
| Fund (Amounts in thousands) | Value, beginning of period | Purchases | Sales Proceeds | Dividend Income | Realized Gain/Loss | Change in Unrealized appreciation (depreciation) | Value, end of period | % ownership, end of period |
| Fidelity Cash Central Fund 2.01% | $81,374 | $632,953 | $584,864 | $439 | $-- | $-- | $129,463 | 0.2% |
| Fidelity Securities Lending Cash Central Fund 2.01% | 12,633 | 517,673 | 491,079 | 30 | -- | -- | 39,227 | 0.1% |
| Total | $94,007 | $1,150,626 | $1,075,943 | $469 | $-- | $-- | $168,690 | |
Amounts in the income column in the above table include any capital gain distributions from underlying funds, which are presented in the corresponding line-item in the Statement of Operations, if applicable. Amount for Fidelity Securities Lending Cash Central Fund represents the income earned on investing cash collateral, less rebates paid to borrowers and any lending agent fees associated with the loan, plus any premium payments received for lending certain types of securities.
Investment Valuation
The following is a summary of the inputs used, as of July 31, 2022, involving the Fund's assets and liabilities carried at fair value. The inputs or methodology used for valuing securities may not be an indication of the risk associated with investing in those securities. For more information on valuation inputs, and their aggregation into the levels used below, please refer to the Investment Valuation section in the accompanying Notes to Financial Statements.
| | Valuation Inputs at Reporting Date: |
| Description | Total | Level 1 | Level 2 | Level 3 |
| (Amounts in thousands) | | | | |
| Investments in Securities: | | | | |
| Equities: | | | | |
| Communication Services | $205,056 | $205,056 | $-- | $-- |
| Consumer Discretionary | 264,466 | 264,466 | -- | -- |
| Consumer Staples | 121,442 | 121,442 | -- | -- |
| Energy | 160,106 | 160,106 | -- | -- |
| Financials | 107,686 | 107,686 | -- | -- |
| Health Care | 337,527 | 337,527 | -- | -- |
| Industrials | 85,106 | 85,106 | -- | -- |
| Information Technology | 541,393 | 541,393 | -- | -- |
| Materials | 166,478 | 166,478 | -- | -- |
| Real Estate | 11,382 | 11,382 | -- | -- |
| Utilities | 81,611 | 81,611 | -- | -- |
| Money Market Funds | 168,690 | 168,690 | -- | -- |
| Total Investments in Securities: | $2,250,943 | $2,250,943 | $-- | $-- |
See accompanying notes which are an integral part of the financial statements.
Financial Statements
Statement of Assets and Liabilities
| Amounts in thousands (except per-share amounts) | | July 31, 2022 |
| Assets | | |
Investment in securities, at value (including securities loaned of $38,577) — See accompanying schedule:
Unaffiliated issuers (cost $1,270,518) | $2,082,253 | |
| Fidelity Central Funds (cost $168,687) | 168,690 | |
| Total Investment in Securities (cost $1,439,205) | | $2,250,943 |
| Receivable for fund shares sold | | 174 |
| Dividends receivable | | 792 |
| Distributions receivable from Fidelity Central Funds | | 184 |
| Total assets | | 2,252,093 |
| Liabilities | | |
| Payable for fund shares redeemed | $1,174 | |
| Accrued management fee | 992 | |
| Other affiliated payables | 272 | |
| Other payables and accrued expenses | 56 | |
| Collateral on securities loaned | 39,227 | |
| Total liabilities | | 41,721 |
| Net Assets | | $2,210,372 |
| Net Assets consist of: | | |
| Paid in capital | | $1,189,248 |
| Total accumulated earnings (loss) | | 1,021,124 |
| Net Assets | | $2,210,372 |
| Net Asset Value and Maximum Offering Price | | |
| Leveraged Company Stock: | | |
| Net Asset Value, offering price and redemption price per share ($1,936,630 ÷ 48,840 shares) | | $39.65 |
| Class K: | | |
| Net Asset Value, offering price and redemption price per share ($273,742 ÷ 6,871 shares) | | $39.84 |
See accompanying notes which are an integral part of the financial statements.
Statement of Operations
| Amounts in thousands | | Year ended July 31, 2022 |
| Investment Income | | |
| Dividends | | $28,692 |
| Income from Fidelity Central Funds (including $30 from security lending) | | 469 |
| Total income | | 29,161 |
| Expenses | | |
| Management fee | $14,988 | |
| Transfer agent fees | 3,077 | |
| Accounting fees | 762 | |
| Custodian fees and expenses | 50 | |
| Independent trustees' fees and expenses | 9 | |
| Registration fees | 59 | |
| Audit | 59 | |
| Legal | 8 | |
| Miscellaneous | 10 | |
| Total expenses before reductions | 19,022 | |
| Expense reductions | (83) | |
| Total expenses after reductions | | 18,939 |
| Net investment income (loss) | | 10,222 |
| Realized and Unrealized Gain (Loss) | | |
| Net realized gain (loss) on: | | |
| Investment securities: | | |
| Unaffiliated issuers | 320,152 | |
| Foreign currency transactions | (40) | |
| Total net realized gain (loss) | | 320,112 |
| Change in net unrealized appreciation (depreciation) on: | | |
| Investment securities: | | |
| Unaffiliated issuers | (607,749) | |
| Assets and liabilities in foreign currencies | (5) | |
| Total change in net unrealized appreciation (depreciation) | | (607,754) |
| Net gain (loss) | | (287,642) |
| Net increase (decrease) in net assets resulting from operations | | $(277,420) |
See accompanying notes which are an integral part of the financial statements.
Statement of Changes in Net Assets
| Amounts in thousands | Year ended July 31, 2022 | Year ended July 31, 2021 |
| Increase (Decrease) in Net Assets | | |
| Operations | | |
| Net investment income (loss) | $10,222 | $1,874 |
| Net realized gain (loss) | 320,112 | 206,382 |
| Change in net unrealized appreciation (depreciation) | (607,754) | 856,332 |
| Net increase (decrease) in net assets resulting from operations | (277,420) | 1,064,588 |
| Distributions to shareholders | (239,412) | (3,020) |
| Share transactions - net increase (decrease) | (168,539) | (81,410) |
| Total increase (decrease) in net assets | (685,371) | 980,158 |
| Net Assets | | |
| Beginning of period | 2,895,743 | 1,915,585 |
| End of period | $2,210,372 | $2,895,743 |
See accompanying notes which are an integral part of the financial statements.
Financial Highlights
Fidelity Leveraged Company Stock Fund
| Years ended July 31, | 2022 | 2021 | 2020 | 2019 | 2018 |
| Selected Per–Share Data | | | | | |
| Net asset value, beginning of period | $48.37 | $30.88 | $29.94 | $34.31 | $37.25 |
| Income from Investment Operations | | | | | |
| Net investment income (loss)A,B | .17 | .03C | .08D | (.02) | .02 |
| Net realized and unrealized gain (loss) | (4.89) | 17.50 | .89 | .42 | 3.42E |
| Total from investment operations | (4.72) | 17.53 | .97 | .40 | 3.44 |
| Distributions from net investment income | (.12) | (.04) | (.03) | – | (.07) |
| Distributions from net realized gain | (3.89) | – | – | (4.77) | (6.32) |
| Total distributions | (4.00)F | (.04) | (.03) | (4.77) | (6.38)F |
| Net asset value, end of period | $39.65 | $48.37 | $30.88 | $29.94 | $34.31 |
| Total ReturnG | (10.85)% | 56.84% | 3.24% | 1.93% | 10.91%E |
| Ratios to Average Net AssetsB,H,I | | | | | |
| Expenses before reductions | .74% | .75% | .78% | .78% | .78% |
| Expenses net of fee waivers, if any | .74% | .75% | .78% | .78% | .78% |
| Expenses net of all reductions | .74% | .75% | .77% | .78% | .77% |
| Net investment income (loss) | .38% | .06%C | .27%D | (.06)% | .07% |
| Supplemental Data | | | | | |
| Net assets, end of period (in millions) | $1,937 | $2,534 | $1,631 | $1,945 | $2,372 |
| Portfolio turnover rateJ | 26% | 15% | 31% | 53% | 67% |
A Calculated based on average shares outstanding during the period.
B Net investment income (loss) is affected by the timing of the declaration of dividends by any underlying mutual funds or exchange-traded funds (ETFs). Net investment income (loss) of any such underlying funds is not included in the Fund's net investment income (loss) ratio.
C Net investment income per share reflects one or more large, non-recurring dividend(s) which amounted to $.05 per share. Excluding such non-recurring dividend(s), the ratio of net investment income (loss) to average net assets would have been (.05) %.
D Net investment income per share reflects one or more large, non-recurring dividend(s) which amounted to $.03 per share. Excluding such non-recurring dividend(s), the ratio of net investment income (loss) to average net assets would have been .16%.
E Amount includes a reimbursement from the investment adviser for an operational error which amounted to less than $.06 per share. Excluding this reimbursement, the total return would have been 10.73%.
F Total distributions per share do not sum due to rounding.
G Total returns would have been lower if certain expenses had not been reduced during the applicable periods shown.
H Fees and expenses of any underlying mutual funds or exchange-traded funds (ETFs) are not included in the Fund's expense ratio. The Fund indirectly bears its proportionate share of these expenses. For additional expense information related to investments in Fidelity Central Funds, please refer to the "Investments in Fidelity Central Funds" note found in the Notes to Financial Statements section of the most recent Annual or Semi-Annual report.
I Expense ratios reflect operating expenses of the class. Expenses before reductions do not reflect amounts reimbursed, waived, or reduced through arrangements with the investment adviser, brokerage services, or other offset arrangements, if applicable, and do not represent the amount paid by the class during periods when reimbursements, waivers or reductions occur.
J Amount does not include the portfolio activity of any underlying mutual funds or exchange-traded funds (ETFs).
See accompanying notes which are an integral part of the financial statements.
Fidelity Leveraged Company Stock Fund Class K
| Years ended July 31, | 2022 | 2021 | 2020 | 2019 | 2018 |
| Selected Per–Share Data | | | | | |
| Net asset value, beginning of period | $48.58 | $31.01 | $30.04 | $34.40 | $37.34 |
| Income from Investment Operations | | | | | |
| Net investment income (loss)A,B | .21 | .06C | .11D | .01 | .06 |
| Net realized and unrealized gain (loss) | (4.91) | 17.59 | .91 | .42 | 3.42E |
| Total from investment operations | (4.70) | 17.65 | 1.02 | .43 | 3.48 |
| Distributions from net investment income | (.16) | (.08) | (.05) | – | (.11) |
| Distributions from net realized gain | (3.89) | – | – | (4.79) | (6.32) |
| Total distributions | (4.04)F | (.08) | (.05) | (4.79) | (6.42)F |
| Net asset value, end of period | $39.84 | $48.58 | $31.01 | $30.04 | $34.40 |
| Total ReturnG | (10.77)% | 57.00% | 3.38% | 2.03% | 11.01%E |
| Ratios to Average Net AssetsB,H,I | | | | | |
| Expenses before reductions | .65% | .66% | .67% | .67% | .67% |
| Expenses net of fee waivers, if any | .65% | .66% | .67% | .67% | .67% |
| Expenses net of all reductions | .65% | .66% | .66% | .67% | .66% |
| Net investment income (loss) | .47% | .15%C | .38%D | .05% | .18% |
| Supplemental Data | | | | | |
| Net assets, end of period (in millions) | $274 | $362 | $285 | $347 | $431 |
| Portfolio turnover rateJ | 26% | 15% | 31% | 53% | 67% |
A Calculated based on average shares outstanding during the period.
B Net investment income (loss) is affected by the timing of the declaration of dividends by any underlying mutual funds or exchange-traded funds (ETFs). Net investment income (loss) of any such underlying funds is not included in the Fund's net investment income (loss) ratio.
C Net investment income per share reflects one or more large, non-recurring dividend(s) which amounted to $.05 per share. Excluding such non-recurring dividend(s), the ratio of net investment income (loss) to average net assets would have been .05%.
D Net investment income per share reflects one or more large, non-recurring dividend(s) which amounted to $.03 per share. Excluding such non-recurring dividend(s), the ratio of net investment income (loss) to average net assets would have been .27%.
E Amount includes a reimbursement from the investment adviser for an operational error which amounted to less than $.06 per share. Excluding this reimbursement, the total return would have been 10.83%.
F Total distributions per share do not sum due to rounding.
G Total returns would have been lower if certain expenses had not been reduced during the applicable periods shown.
H Fees and expenses of any underlying mutual funds or exchange-traded funds (ETFs) are not included in the Fund's expense ratio. The Fund indirectly bears its proportionate share of these expenses. For additional expense information related to investments in Fidelity Central Funds, please refer to the "Investments in Fidelity Central Funds" note found in the Notes to Financial Statements section of the most recent Annual or Semi-Annual report.
I Expense ratios reflect operating expenses of the class. Expenses before reductions do not reflect amounts reimbursed, waived, or reduced through arrangements with the investment adviser, brokerage services, or other offset arrangements, if applicable, and do not represent the amount paid by the class during periods when reimbursements, waivers or reductions occur.
J Amount does not include the portfolio activity of any underlying mutual funds or exchange-traded funds (ETFs).
See accompanying notes which are an integral part of the financial statements.
Notes to Financial Statements
For the period ended July 31, 2022
(Amounts in thousands except percentages)
1. Organization.
Fidelity Leveraged Company Stock Fund (the Fund) is a fund of Fidelity Securities Fund (the Trust) and is authorized to issue an unlimited number of shares. The Trust is registered under the Investment Company Act of 1940, as amended (the 1940 Act), as an open-end management investment company organized as a Massachusetts business trust. The Fund offers Leveraged Company Stock and Class K shares, each of which has equal rights as to assets and voting privileges. Each class has exclusive voting rights with respect to matters that affect that class.
2. Investments in Fidelity Central Funds.
Funds may invest in Fidelity Central Funds, which are open-end investment companies generally available only to other investment companies and accounts managed by the investment adviser and its affiliates. The Schedule of Investments lists any Fidelity Central Funds held as an investment as of period end, but does not include the underlying holdings of each Fidelity Central Fund. An investing fund indirectly bears its proportionate share of the expenses of the underlying Fidelity Central Funds.
Based on its investment objective, each Fidelity Central Fund may invest or participate in various investment vehicles or strategies that are similar to those of the investing fund. These strategies are consistent with the investment objectives of the investing fund and may involve certain economic risks which may cause a decline in value of each of the Fidelity Central Funds and thus a decline in the value of the investing fund.
| Fidelity Central Fund | Investment Manager | Investment Objective | Investment Practices | Expense Ratio(a) |
| Fidelity Money Market Central Funds | Fidelity Management & Research Company LLC (FMR) | Each fund seeks to obtain a high level of current income consistent with the preservation of capital and liquidity. | Short-term Investments | Less than .005% |
(a) Expenses expressed as a percentage of average net assets and are as of each underlying Central Fund's most recent annual or semi-annual shareholder report.
A complete unaudited list of holdings for each Fidelity Central Fund is available upon request or at the Securities and Exchange Commission website at www.sec.gov. In addition, the financial statements of the Fidelity Central Funds which contain the significant accounting policies (including investment valuation policies) of those funds, and are not covered by the Report of Independent Registered Public Accounting Firm, are available on the Securities and Exchange Commission website or upon request.
3. Significant Accounting Policies.
The Fund is an investment company and applies the accounting and reporting guidance of the Financial Accounting Standards Board (FASB) Accounting Standards Codification Topic 946 Financial Services - Investment Companies. The financial statements have been prepared in conformity with accounting principles generally accepted in the United States of America (GAAP), which require management to make certain estimates and assumptions at the date of the financial statements. Actual results could differ from those estimates. Subsequent events, if any, through the date that the financial statements were issued have been evaluated in the preparation of the financial statements. The Fund's Schedule of Investments lists any underlying mutual funds or exchange-traded funds (ETFs) but does not include the underlying holdings of these funds. The following summarizes the significant accounting policies of the Fund:
Investment Valuation. Investments are valued as of 4:00 p.m. Eastern time on the last calendar day of the period. The Board of Trustees (the Board) has delegated the day to day responsibility for the valuation of the Fund's investments to the Fair Value Committee (the Committee) established by the Fund's investment adviser. In accordance with valuation policies and procedures approved by the Board, the Fund attempts to obtain prices from one or more third party pricing vendors or brokers to value its investments. When current market prices, quotations or currency exchange rates are not readily available or reliable, investments will be fair valued in good faith by the Committee, in accordance with procedures adopted by the Board. Factors used in determining fair value vary by investment type and may include market or investment specific events. The frequency with which these procedures are used cannot be predicted and they may be utilized to a significant extent. The Committee oversees the Fund's valuation policies and procedures and reports to the Board on the Committee's activities and fair value determinations. The Board monitors the appropriateness of the procedures used in valuing the Fund's investments and ratifies the fair value determinations of the Committee.
The Fund categorizes the inputs to valuation techniques used to value its investments into a disclosure hierarchy consisting of three levels as shown below:
- Level 1 – unadjusted quoted prices in active markets for identical investments
- Level 2 – other significant observable inputs (including quoted prices for similar investments, interest rates, prepayment speeds, etc.)
- Level 3 – unobservable inputs (including the Fund's own assumptions based on the best information available)
Valuation techniques used to value the Fund's investments by major category are as follows:
Equity securities, including restricted securities, for which market quotations are readily available, are valued at the last reported sale price or official closing price as reported by a third party pricing vendor on the primary market or exchange on which they are traded and are categorized as Level 1 in the hierarchy. In the event there were no sales during the day or closing prices are not available, securities are valued at the last quoted bid price or may be valued using the last available price and are generally categorized as Level 2 in the hierarchy. For foreign equity securities, when market or security specific events arise, comparisons to the valuation of American Depositary Receipts (ADRs), futures contracts, ETFs and certain indexes as well as quoted prices for similar securities may be used and would be categorized as Level 2 in the hierarchy. For equity securities, including restricted securities, where observable inputs are limited, assumptions about market activity and risk are used and these securities may be categorized as Level 3 in the hierarchy.
Investments in open-end mutual funds, including the Fidelity Central Funds, are valued at their closing net asset value (NAV) each business day and are categorized as Level 1 in the hierarchy.
Changes in valuation techniques may result in transfers in or out of an assigned level within the disclosure hierarchy. The aggregate value of investments by input level as of July 31, 2022 is included at the end of the Fund's Schedule of Investments.
Foreign Currency. Certain Funds may use foreign currency contracts to facilitate transactions in foreign-denominated securities. Gains and losses from these transactions may arise from changes in the value of the foreign currency or if the counterparties do not perform under the contracts' terms.
Foreign-denominated assets, including investment securities, and liabilities are translated into U.S. dollars at the exchange rates at period end. Purchases and sales of investment securities, income and dividends received, and expenses denominated in foreign currencies are translated into U.S. dollars at the exchange rate in effect on the transaction date.
The effects of exchange rate fluctuations on investments are included with the net realized and unrealized gain (loss) on investment securities. Other foreign currency transactions resulting in realized and unrealized gain (loss) are disclosed separately.
Investment Transactions and Income. For financial reporting purposes, the Fund's investment holdings and NAV include trades executed through the end of the last business day of the period. The NAV per share for processing shareholder transactions is calculated as of the close of business of the New York Stock Exchange (NYSE), normally 4:00 p.m. Eastern time and includes trades executed through the end of the prior business day. Gains and losses on securities sold are determined on the basis of identified cost and include proceeds received from litigation. Commissions paid to certain brokers with whom the investment adviser, or its affiliates, places trades on behalf of a fund include an amount in addition to trade execution, which may be rebated back to a fund. Any such rebates are included in net realized gain (loss) on investments in the Statement of Operations. Dividend income is recorded on the ex-dividend date, except for certain dividends from foreign securities where the ex-dividend date may have passed, which are recorded as soon as the Fund is informed of the ex-dividend date. Non-cash dividends included in dividend income, if any, are recorded at the fair market value of the securities received. Income and capital gain distributions from Fidelity Central Funds, if any, are recorded on the ex-dividend date. Certain distributions received by the Fund represent a return of capital or capital gain. The Fund determines the components of these distributions subsequent to the ex-dividend date, based upon receipt of tax filings or other correspondence relating to the underlying investment. These distributions are recorded as a reduction of cost of investments and/or as a realized gain. Investment income is recorded net of foreign taxes withheld where recovery of such taxes is uncertain. Funds may file withholding tax reclaims in certain jurisdictions to recover a portion of amounts previously withheld. Any withholding tax reclaims income is included in the Statement of Operations in dividends. Any receivables for withholding tax reclaims are included in the Statement of Assets and Liabilities in dividends receivable.
Class Allocations and Expenses. Investment income, realized and unrealized capital gains and losses, common expenses of a fund, and certain fund-level expense reductions, if any, are allocated daily on a pro-rata basis to each class based on the relative net assets of each class to the total net assets of a fund. Each class differs with respect to transfer agent and distribution and service plan fees incurred, as applicable. Certain expense reductions may also differ by class, if applicable. For the reporting period, the allocated portion of income and expenses to each class as a percent of its average net assets may vary due to the timing of recording these transactions in relation to fluctuating net assets of the classes. Expenses directly attributable to a fund are charged to that fund. Expenses attributable to more than one fund are allocated among the respective funds on the basis of relative net assets or other appropriate methods. Expenses included in the accompanying financial statements reflect the expenses of that fund and do not include any expenses associated with any underlying mutual funds or exchange-traded funds. Although not included in a fund's expenses, a fund indirectly bears its proportionate share of these expenses through the net asset value of each underlying mutual fund or exchange-traded fund. Expense estimates are accrued in the period to which they relate and adjustments are made when actual amounts are known.
Income Tax Information and Distributions to Shareholders. Each year, the Fund intends to qualify as a regulated investment company under Subchapter M of the Internal Revenue Code, including distributing substantially all of its taxable income and realized gains. As a result, no provision for U.S. Federal income taxes is required. As of July 31, 2022, the Fund did not have any unrecognized tax benefits in the financial statements; nor is the Fund aware of any tax positions for which it is reasonably possible that the total amounts of unrecognized tax benefits will significantly change in the next twelve months. The Fund files a U.S. federal tax return, in addition to state and local tax returns as required. The Fund's federal income tax returns are subject to examination by the Internal Revenue Service (IRS) for a period of three fiscal years after they are filed. State and local tax returns may be subject to examination for an additional fiscal year depending on the jurisdiction. Foreign taxes are provided for based on the Fund's understanding of the tax rules and rates that exist in the foreign markets in which it invests.
Distributions are declared and recorded on the ex-dividend date. Income and capital gain distributions are declared separately for each class. Income and capital gain distributions are determined in accordance with income tax regulations, which may differ from GAAP. In addition, the Fund claimed a portion of the payment made to redeeming shareholders as a distribution for income tax purposes.
Capital accounts within the financial statements are adjusted for permanent book-tax differences. These adjustments have no impact on net assets or the results of operations. Capital accounts are not adjusted for temporary book-tax differences which will reverse in a subsequent period.
Book-tax differences are primarily due to foreign currency transactions and losses deferred due to wash sales and excise tax regulations.
As of period end, the cost and unrealized appreciation (depreciation) in securities, and derivatives if applicable, for federal income tax purposes were as follows:
| Gross unrealized appreciation | $872,630 |
| Gross unrealized depreciation | (70,947) |
| Net unrealized appreciation (depreciation) | $801,683 |
| Tax Cost | $1,449,260 |
The tax-based components of distributable earnings as of period end were as follows:
| Undistributed ordinary income | $3,996 |
| Undistributed long-term capital gain | $251,837 |
| Net unrealized appreciation (depreciation) on securities and other investments | $801,678 |
The Fund intends to elect to defer to its next fiscal year $36,386 of capital losses recognized during the period November 1, 2021 to July 31, 2022.
The tax character of distributions paid was as follows:
| | July 31, 2022 | July 31, 2021 |
| Ordinary Income | $10,485 | $ 3,020 |
| Long-term Capital Gains | 228,927 | - |
| Total | $239,412 | $ 3,020 |
Restricted Securities (including Private Placements). Funds may invest in securities that are subject to legal or contractual restrictions on resale. These securities generally may be resold in transactions exempt from registration or to the public if the securities are registered. Disposal of these securities may involve time-consuming negotiations and expense, and prompt sale at an acceptable price may be difficult. Information regarding restricted securities held at period end is included at the end of the Schedule of Investments, if applicable.
4. Purchases and Sales of Investments.
Purchases and sales of securities, other than short-term securities and in-kind transactions, as applicable, are noted in the table below.
| | Purchases ($) | Sales ($) |
| Fidelity Leveraged Company Stock Fund | 642,924 | 1,088,620 |
5. Fees and Other Transactions with Affiliates.
Management Fee. Fidelity Management & Research Company LLC (the investment adviser) and its affiliates provide the Fund with investment management related services for which the Fund pays a monthly management fee. The management fee is the sum of an individual fund fee rate that is based on an annual rate of .35% of the Fund's average net assets and an annualized group fee rate that averaged .22% during the period. The group fee rate is based upon the monthly average net assets of a group of registered investment companies with which the investment adviser has management contracts. The group fee rate decreases as assets under management increase and increases as assets under management decrease. For the reporting period, the total annual management fee rate was .57% of the Fund's average net assets.
Transfer Agent Fees. Fidelity Investments Institutional Operations Company LLC (FIIOC), an affiliate of the investment adviser, is the transfer, dividend disbursing and shareholder servicing agent for each class of the Fund. FIIOC receives account fees and asset-based fees that vary according to the account size and type of account of the shareholders of Leveraged Company Stock, except for Class K. FIIOC receives an asset-based fee of Class K's average net assets. FIIOC pays for typesetting, printing and mailing of shareholder reports, except proxy statements.
For the period, transfer agent fees for each class were as follows:
| | Amount | % of Class-Level Average Net Assets |
| Leveraged Company Stock | $2,947 | .13 |
| Class K | 130 | .04 |
| | $3,077 | |
Accounting Fees. Fidelity Service Company, Inc. (FSC), an affiliate of the investment adviser, maintains the Fund's accounting records. The accounting fee is based on the level of average net assets for each month. For the period, the fees were equivalent to the following annual rates:
| | % of Average Net Assets |
| Fidelity Leveraged Company Stock Fund | .03 |
Brokerage Commissions. A portion of portfolio transactions were placed with brokerage firms which are affiliates of the investment adviser. Brokerage commissions are included in net realized gain (loss) and change in net unrealized appreciation (depreciation) in the Statement of Operations. The commissions paid to these affiliated firms were as follows:
| | Amount |
| Fidelity Leveraged Company Stock Fund | $10 |
Interfund Trades. Funds may purchase from or sell securities to other Fidelity Funds under procedures adopted by the Board. The procedures have been designed to ensure these interfund trades are executed in accordance with Rule 17a-7 of the 1940 Act. Any interfund trades are included within the respective purchases and sales amounts shown in the Purchases and Sales of Investments note. Interfund trades during the period are noted in the table below.
| | Purchases ($) | Sales ($) | Realized Gain (Loss) ($) |
| Fidelity Leveraged Company Stock Fund | 35,741 | 69,746 | 39,160 |
6. Committed Line of Credit.
Certain Funds participate with other funds managed by the investment adviser or an affiliate in a $4.25 billion credit facility (the "line of credit") to be utilized for temporary or emergency purposes to fund shareholder redemptions or for other short-term liquidity purposes. The participating funds have agreed to pay commitment fees on their pro-rata portion of the line of credit, which are reflected in Miscellaneous expenses on the Statement of Operations, and are listed below. During the period, there were no borrowings on this line of credit.
| | Amount |
| Fidelity Leveraged Company Stock Fund | $3 |
7. Security Lending.
Funds lend portfolio securities from time to time in order to earn additional income. Lending agents are used, including National Financial Services (NFS), an affiliate of the investment adviser. Pursuant to a securities lending agreement, NFS will receive a fee, which is capped at 9.9% of a fund's daily lending revenue, for its services as lending agent. A fund may lend securities to certain qualified borrowers, including NFS. On the settlement date of the loan, a fund receives collateral (in the form of U.S. Treasury obligations, letters of credit and/or cash) against the loaned securities and maintains collateral in an amount not less than 100% of the market value of the loaned securities during the period of the loan. The market value of the loaned securities is determined at the close of business of a fund and any additional required collateral is delivered to a fund on the next business day. A fund or borrower may terminate the loan at any time, and if the borrower defaults on its obligation to return the securities loaned because of insolvency or other reasons, a fund may apply collateral received from the borrower against the obligation. A fund may experience delays and costs in recovering the securities loaned. Any cash collateral received is invested in the Fidelity Securities Lending Cash Central Fund. Any loaned securities are identified as such in the Schedule of Investments, and the value of loaned securities and cash collateral at period end, as applicable, are presented in the Statement of Assets and Liabilities. Security lending income represents the income earned on investing cash collateral, less rebates paid to borrowers and any lending agent fees associated with the loan, plus any premium payments received for lending certain types of securities. Security lending income is presented in the Statement of Operations as a component of income from Fidelity Central Funds. Affiliated security lending activity, if any, was as follows:
| | Total Security Lending Fees Paid to NFS | Security Lending Income From Securities Loaned to NFS | Value of Securities Loaned to NFS at Period End |
| Fidelity Leveraged Company Stock Fund | $3 | $– | $– |
8. Expense Reductions.
During the period the investment adviser or an affiliate reimbursed and/or waived a portion of fund-level operating expenses in the amount of $83.
9. Distributions to Shareholders.
Distributions to shareholders of each class were as follows:
| | Year ended
July 31, 2022 | Year ended
July 31, 2021 |
| Fidelity Leveraged Company Stock Fund | | |
| Distributions to shareholders | | |
| Leveraged Company Stock | $209,842 | $2,357 |
| Class K | 29,570 | 663 |
| Total | $239,412 | $3,020 |
10. Share Transactions.
Share transactions for each class were as follows and may contain in-kind transactions, automatic conversions between classes or exchanges between affiliated funds:
| | Shares | Shares | Dollars | Dollars |
| | Year ended July 31, 2022 | Year ended July 31, 2021 | Year ended July 31, 2022 | Year ended July 31, 2021 |
| Fidelity Leveraged Company Stock Fund | | | | |
| Leveraged Company Stock | | | | |
| Shares sold | 1,890 | 7,227 | $85,159 | $292,008 |
| Reinvestment of distributions | 4,268 | 65 | 199,167 | 2,241 |
| Shares redeemed | (9,699) | (7,729) | (427,361) | (312,433) |
| Net increase (decrease) | (3,541) | (437) | $(143,035) | $(18,184) |
| Class K | | | | |
| Shares sold | 517 | 1,225 | $23,487 | $52,765 |
| Reinvestment of distributions | 631 | 19 | 29,570 | 663 |
| Shares redeemed | (1,729) | (2,968) | (78,561) | (116,654) |
| Net increase (decrease) | (581) | (1,724) | $(25,504) | $(63,226) |
11. Other.
A fund's organizational documents provide former and current trustees and officers with a limited indemnification against liabilities arising in connection with the performance of their duties to the fund. In the normal course of business, a fund may also enter into contracts that provide general indemnifications. A fund's maximum exposure under these arrangements is unknown as this would be dependent on future claims that may be made against a fund. The risk of material loss from such claims is considered remote.
12. Coronavirus (COVID-19) Pandemic.
An outbreak of COVID-19 first detected in China during December 2019 has since spread globally and was declared a pandemic by the World Health Organization during March 2020. Developments that disrupt global economies and financial markets, such as the COVID-19 pandemic, may magnify factors that affect the Fund's performance.
Report of Independent Registered Public Accounting Firm
To the Board of Trustees of Fidelity Securities Fund and Shareholders of Fidelity Leveraged Company Stock Fund
Opinion on the Financial Statements
We have audited the accompanying statement of assets and liabilities, including the schedule of investments, of Fidelity Leveraged Company Stock Fund (one of the funds constituting Fidelity Securities Fund, referred to hereafter as the “Fund”) as of July 31, 2022, the related statement of operations for the year ended July 31, 2022, the statement of changes in net assets for each of the two years in the period ended July 31, 2022, including the related notes, and the financial highlights for each of the five years in the period ended July 31, 2022 (collectively referred to as the “financial statements”). In our opinion, the financial statements present fairly, in all material respects, the financial position of the Fund as of July 31, 2022, the results of its operations for the year then ended, the changes in its net assets for each of the two years in the period ended July 31, 2022 and the financial highlights for each of the five years in the period ended July 31, 2022 in conformity with accounting principles generally accepted in the United States of America.
Basis for Opinion
These financial statements are the responsibility of the Fund’s management. Our responsibility is to express an opinion on the Fund’s financial statements based on our audits. We are a public accounting firm registered with the Public Company Accounting Oversight Board (United States) (PCAOB) and are required to be independent with respect to the Fund in accordance with the U.S. federal securities laws and the applicable rules and regulations of the Securities and Exchange Commission and the PCAOB.
We conducted our audits of these financial statements in accordance with the standards of the PCAOB. Those standards require that we plan and perform the audit to obtain reasonable assurance about whether the financial statements are free of material misstatement, whether due to error or fraud.
Our audits included performing procedures to assess the risks of material misstatement of the financial statements, whether due to error or fraud, and performing procedures that respond to those risks. Such procedures included examining, on a test basis, evidence regarding the amounts and disclosures in the financial statements. Our audits also included evaluating the accounting principles used and significant estimates made by management, as well as evaluating the overall presentation of the financial statements. Our procedures included confirmation of securities owned as of July 31, 2022 by correspondence with the custodian. We believe that our audits provide a reasonable basis for our opinion.
/s/ PricewaterhouseCoopers LLP
Boston, Massachusetts
September 13, 2022
We have served as the auditor of one or more investment companies in the Fidelity group of funds since 1932.
Trustees and Officers
The Trustees, Members of the Advisory Board (if any), and officers of the trust and fund, as applicable, are listed below. The Board of Trustees governs the fund and is responsible for protecting the interests of shareholders. The Trustees are experienced executives who meet periodically throughout the year to oversee the fund's activities, review contractual arrangements with companies that provide services to the fund, oversee management of the risks associated with such activities and contractual arrangements, and review the fund's performance. Except for Jonathan Chiel, each of the Trustees oversees 316 funds. Mr. Chiel oversees 184 funds.
The Trustees hold office without limit in time except that (a) any Trustee may resign; (b) any Trustee may be removed by written instrument, signed by at least two-thirds of the number of Trustees prior to such removal; (c) any Trustee who requests to be retired or who has become incapacitated by illness or injury may be retired by written instrument signed by a majority of the other Trustees; and (d) any Trustee may be removed at any special meeting of shareholders by a two-thirds vote of the outstanding voting securities of the trust. Each Trustee who is not an interested person (as defined in the 1940 Act) of the trust and the fund is referred to herein as an Independent Trustee. Each Independent Trustee shall retire not later than the last day of the calendar year in which his or her 75th birthday occurs. The Independent Trustees may waive this mandatory retirement age policy with respect to individual Trustees. Officers and Advisory Board Members hold office without limit in time, except that any officer or Advisory Board Member may resign or may be removed by a vote of a majority of the Trustees at any regular meeting or any special meeting of the Trustees. Except as indicated, each individual has held the office shown or other offices in the same company for the past five years.
The fund's Statement of Additional Information (SAI) includes more information about the Trustees. To request a free copy, call Fidelity at 1-800-544-8544 if you’re an individual investing directly with Fidelity, call 1-800-835-5092 if you’re a plan sponsor or participant with Fidelity as your recordkeeper or call 1-877-208-0098 on institutional accounts or if you’re an advisor or invest through one.
Experience, Skills, Attributes, and Qualifications of the Trustees. The Governance and Nominating Committee has adopted a statement of policy that describes the experience, qualifications, attributes, and skills that are necessary and desirable for potential Independent Trustee candidates (Statement of Policy). The Board believes that each Trustee satisfied at the time he or she was initially elected or appointed a Trustee, and continues to satisfy, the standards contemplated by the Statement of Policy. The Governance and Nominating Committee also engages professional search firms to help identify potential Independent Trustee candidates who have the experience, qualifications, attributes, and skills consistent with the Statement of Policy. From time to time, additional criteria based on the composition and skills of the current Independent Trustees, as well as experience or skills that may be appropriate in light of future changes to board composition, business conditions, and regulatory or other developments, have also been considered by the professional search firms and the Governance and Nominating Committee. In addition, the Board takes into account the Trustees' commitment and participation in Board and committee meetings, as well as their leadership of standing and ad hoc committees throughout their tenure.
In determining that a particular Trustee was and continues to be qualified to serve as a Trustee, the Board has considered a variety of criteria, none of which, in isolation, was controlling. The Board believes that, collectively, the Trustees have balanced and diverse experience, qualifications, attributes, and skills, which allow the Board to operate effectively in governing the fund and protecting the interests of shareholders. Information about the specific experience, skills, attributes, and qualifications of each Trustee, which in each case led to the Board's conclusion that the Trustee should serve (or continue to serve) as a trustee of the fund, is provided below.
Board Structure and Oversight Function. Robert A. Lawrence is an interested person and currently serves as Chair. The Trustees have determined that an interested Chair is appropriate and benefits shareholders because an interested Chair has a personal and professional stake in the quality and continuity of services provided to the fund. Independent Trustees exercise their informed business judgment to appoint an individual of their choosing to serve as Chair, regardless of whether the Trustee happens to be independent or a member of management. The Independent Trustees have determined that they can act independently and effectively without having an Independent Trustee serve as Chair and that a key structural component for assuring that they are in a position to do so is for the Independent Trustees to constitute a substantial majority for the Board. The Independent Trustees also regularly meet in executive session. David M. Thomas serves as Lead Independent Trustee and as such (i) acts as a liaison between the Independent Trustees and management with respect to matters important to the Independent Trustees and (ii) with management prepares agendas for Board meetings.
Fidelity® funds are overseen by different Boards of Trustees. The fund's Board oversees Fidelity's high income and certain equity funds, and other Boards oversee Fidelity's investment-grade bond, money market, asset allocation, and other equity funds. The asset allocation funds may invest in Fidelity® funds overseen by the fund's Board. The use of separate Boards, each with its own committee structure, allows the Trustees of each group of Fidelity® funds to focus on the unique issues of the funds they oversee, including common research, investment, and operational issues. On occasion, the separate Boards establish joint committees to address issues of overlapping consequences for the Fidelity® funds overseen by each Board.
The Trustees operate using a system of committees to facilitate the timely and efficient consideration of all matters of importance to the Trustees, the fund, and fund shareholders and to facilitate compliance with legal and regulatory requirements and oversight of the fund's activities and associated risks. The Board, acting through its committees, has charged FMR and its affiliates with (i) identifying events or circumstances the occurrence of which could have demonstrably adverse effects on the fund's business and/or reputation; (ii) implementing processes and controls to lessen the possibility that such events or circumstances occur or to mitigate the effects of such events or circumstances if they do occur; and (iii) creating and maintaining a system designed to evaluate continuously business and market conditions in order to facilitate the identification and implementation processes described in (i) and (ii) above. Because the day-to-day operations and activities of the fund are carried out by or through FMR, its affiliates, and other service providers, the fund's exposure to risks is mitigated but not eliminated by the processes overseen by the Trustees. While each of the Board's committees has responsibility for overseeing different aspects of the fund's activities, oversight is exercised primarily through the Operations, Audit, and Compliance Committees. Appropriate personnel, including but not limited to the fund's Chief Compliance Officer (CCO), FMR's internal auditor, the independent accountants, the fund's Treasurer and portfolio management personnel, make periodic reports to the Board's committees, as appropriate, including an annual review of Fidelity's risk management program for the Fidelity® funds. The responsibilities of each standing committee, including their oversight responsibilities, are described further under "Standing Committees of the Trustees."
Interested Trustees*:
Correspondence intended for a Trustee who is an interested person may be sent to Fidelity Investments, 245 Summer Street, Boston, Massachusetts 02210.
Name, Year of Birth; Principal Occupations and Other Relevant Experience+
Jonathan Chiel (1957)
Year of Election or Appointment: 2016
Trustee
Mr. Chiel also serves as Trustee of other Fidelity® funds. Mr. Chiel is Executive Vice President and General Counsel for FMR LLC (diversified financial services company, 2012-present). Previously, Mr. Chiel served as general counsel (2004-2012) and senior vice president and deputy general counsel (2000-2004) for John Hancock Financial Services; a partner with Choate, Hall & Stewart (1996-2000) (law firm); and an Assistant United States Attorney for the United States Attorney’s Office of the District of Massachusetts (1986-95), including Chief of the Criminal Division (1993-1995). Mr. Chiel is a director on the boards of the Boston Bar Foundation and the Maimonides School.
Bettina Doulton (1964)
Year of Election or Appointment: 2021
Trustee
Ms. Doulton also serves as Trustee of other Fidelity® funds. Prior to her retirement, Ms. Doulton served in a variety of positions at Fidelity Investments, including as a managing director of research (2006-2007), portfolio manager to certain Fidelity® funds (1993-2005), equity analyst and portfolio assistant (1990-1993), and research assistant (1987-1990). Ms. Doulton currently owns and operates Phi Builders + Architects and Cellardoor Winery. Previously, Ms. Doulton served as a member of the Board of Brown Capital Management, LLC (2014-2018).
Robert A. Lawrence (1952)
Year of Election or Appointment: 2020
Trustee
Chair of the Board of Trustees
Mr. Lawrence also serves as Trustee of other funds. Previously, Mr. Lawrence served as a Trustee and Member of the Advisory Board of certain funds. Prior to his retirement in 2008, Mr. Lawrence served as Vice President of certain Fidelity® funds (2006-2008), Senior Vice President, Head of High Income Division of Fidelity Management & Research Company (investment adviser firm, 2006-2008), and President of Fidelity Strategic Investments (investment adviser firm, 2002-2005).
* Determined to be an “Interested Trustee” by virtue of, among other things, his or her affiliation with the trust or various entities under common control with FMR.
+ The information includes the Trustee's principal occupation during the last five years and other information relating to the experience, attributes, and skills relevant to the Trustee's qualifications to serve as a Trustee, which led to the conclusion that the Trustee should serve as a Trustee for the fund.
Independent Trustees:
Correspondence intended for an Independent Trustee may be sent to Fidelity Investments, P.O. Box 55235, Boston, Massachusetts 02205-5235.
Name, Year of Birth; Principal Occupations and Other Relevant Experience+
Thomas P. Bostick (1956)
Year of Election or Appointment: 2021
Trustee
Lieutenant General Bostick also serves as Trustee of other Fidelity® funds. Prior to his retirement, General Bostick (United States Army, Retired) held a variety of positions within the U.S. Army, including Commanding General and Chief of Engineers, U.S. Army Corps of Engineers (2012-2016) and Deputy Chief of Staff and Director of Human Resources, U.S. Army (2009-2012). General Bostick currently serves as a member of the Board and Finance and Governance Committees of CSX Corporation (transportation, 2020-present) and a member of the Board and Corporate Governance and Nominating Committee of Perma-Fix Environmental Services, Inc. (nuclear waste management, 2020-present). General Bostick serves as Chief Executive Officer of Bostick Global Strategies, LLC (consulting, 2016-present) and as a member of the Board of HireVue, Inc. (video interview and assessment, 2020-present). Previously, General Bostick served as a Member of the Advisory Board of certain Fidelity® funds (2021), President, Intrexon Bioengineering (2018-2020) and Chief Operating Officer (2017-2020) and Senior Vice President of the Environment Sector (2016-2017) of Intrexon Corporation (biopharmaceutical company).
Dennis J. Dirks (1948)
Year of Election or Appointment: 2005
Trustee
Mr. Dirks also serves as Trustee of other Fidelity® funds. Prior to his retirement in May 2003, Mr. Dirks served as Chief Operating Officer and as a member of the Board of The Depository Trust & Clearing Corporation (financial markets infrastructure), President, Chief Operating Officer and a member of the Board of The Depository Trust Company (DTC), President and a member of the Board of the National Securities Clearing Corporation (NSCC), Chief Executive Officer and a member of the Board of the Government Securities Clearing Corporation and Chief Executive Officer and a member of the Board of the Mortgage-Backed Securities Clearing Corporation. Mr. Dirks currently serves as a member of the Finance Committee (2016-present) and Board (2017-present) and is Treasurer (2018-present) of the Asolo Repertory Theatre.
Donald F. Donahue (1950)
Year of Election or Appointment: 2018
Trustee
Mr. Donahue also serves as Trustee of other Fidelity® funds. Mr. Donahue serves as President and Chief Executive Officer of Miranda Partners, LLC (risk consulting for the financial services industry, 2012-present). Previously, Mr. Donahue served as Chief Executive Officer (2006-2012), Chief Operating Officer (2003-2006) and Managing Director, Customer Marketing and Development (1999-2003) of The Depository Trust & Clearing Corporation (financial markets infrastructure). Mr. Donahue currently serves as a member (2007-present) and Co-Chairman (2016-present) of the Board of United Way of New York and a member of the Board of The Leadership Academy (previously NYC Leadership Academy) (2012-present). Mr. Donahue previously served as a member of the Advisory Board of certain Fidelity® funds (2015-2018).
Vicki L. Fuller (1957)
Year of Election or Appointment: 2020
Trustee
Ms. Fuller also serves as Trustee of other Fidelity® funds. Previously, Ms. Fuller served as a member of the Advisory Board of certain Fidelity® funds (2018-2020), Chief Investment Officer of the New York State Common Retirement Fund (2012-2018) and held a variety of positions at AllianceBernstein L.P. (global asset management, 1985-2012), including Managing Director (2006-2012) and Senior Vice President and Senior Portfolio Manager (2001-2006). Ms. Fuller currently serves as a member of the Board, Audit Committee and Nominating and Governance Committee of two Blackstone business development companies (2020-present), as a member of the Board of Treliant, LLC (consulting, 2019-present), as a member of the Advisory Board of Ariel Alternatives, LLC (private equity, 2021-present) and as a member of the Board and Chair of the Audit Committee of Gusto, Inc. (software, 2021-present). In addition, Ms. Fuller currently serves as a member of the Board of Roosevelt University (2019-present) and as a member of the Executive Board of New York University’s Stern School of Business. Ms. Fuller previously served as a member of the Board, Audit Committee and Nominating and Governance Committee of The Williams Companies, Inc. (natural gas infrastructure, 2018-2021).
Patricia L. Kampling (1959)
Year of Election or Appointment: 2020
Trustee
Ms. Kampling also serves as Trustee of other Fidelity® funds. Prior to her retirement, Ms. Kampling served as Chairman of the Board and Chief Executive Officer (2012-2019), President and Chief Operating Officer (2011-2012) and Executive Vice President and Chief Financial Officer (2010-2011) of Alliant Energy Corporation. Ms. Kampling currently serves as a member of the Board, Finance Committee and Governance, Compensation and Nominating Committee of Xcel Energy Inc. (utilities company, 2020-present) and as a member of the Board, Audit, Finance and Risk Committee and Safety, Environmental, Technology and Operations Committee and Chair of the Executive Development and Compensation Committee of American Water Works Company, Inc. (utilities company, 2019-present). In addition, Ms. Kampling currently serves as a member of the Board of the Nature Conservancy, Wisconsin Chapter (2019-present). Previously, Ms. Kampling served as a Member of the Advisory Board of certain Fidelity® funds (2020), a member of the Board, Compensation Committee and Executive Committee and Chair of the Audit Committee of Briggs & Stratton Corporation (manufacturing, 2011-2021), a member of the Board of Interstate Power and Light Company (2012-2019) and Wisconsin Power and Light Company (2012-2019) (each a subsidiary of Alliant Energy Corporation) and as a member of the Board and Workforce Development Committee of the Business Roundtable (2018-2019).
Thomas A. Kennedy (1955)
Year of Election or Appointment: 2021
Trustee
Mr. Kennedy also serves as Trustee of other Fidelity® funds. Previously, Mr. Kennedy served as a Member of the Advisory Board of certain Fidelity® funds (2020) and held a variety of positions at Raytheon Company (aerospace and defense, 1983-2020), including Chairman and Chief Executive Officer (2014-2020) and Executive Vice President and Chief Operating Officer (2013-2014). Mr. Kennedy currently serves as Executive Chairman of the Board of Directors of Raytheon Technologies Corporation (aerospace and defense, 2020-present). He is also a member of the Rutgers School of Engineering Industry Advisory Board (2011-present) and a member of the UCLA Engineering Dean’s Executive Board (2016-present).
Oscar Munoz (1959)
Year of Election or Appointment: 2021
Trustee
Mr. Munoz also serves as Trustee of other Fidelity® funds. Prior to his retirement, Mr. Munoz served as Executive Chairman (2020-2021), Chief Executive Officer (2015-2020), President (2015-2016) and a member of the Board (2010-2021) of United Airlines Holdings, Inc. Mr. Munoz currently serves as a member of the Board of CBRE Group, Inc. (commercial real estate, 2020-present), a member of the Board of Univision Communications, Inc. (Hispanic media, 2020-present) and a member of the Advisory Board of Salesforce.com, Inc. (cloud-based software, 2020-present). Previously, Mr. Munoz served as a Member of the Advisory Board of certain Fidelity® funds (2021).
Garnett A. Smith (1947)
Year of Election or Appointment: 2018
Trustee
Mr. Smith also serves as Trustee of other Fidelity® funds. Prior to his retirement, Mr. Smith served as Chairman and Chief Executive Officer (1990-1997) and President (1986-1990) of Inbrand Corp. (manufacturer of personal absorbent products). Prior to his employment with Inbrand Corp., he was employed by a retail fabric chain and North Carolina National Bank (now Bank of America). Mr. Smith previously served as a member of the Advisory Board of certain Fidelity® funds (2012-2013).
David M. Thomas (1949)
Year of Election or Appointment: 2008
Trustee
Lead Independent Trustee
Mr. Thomas also serves as Trustee of other Fidelity® funds. Previously, Mr. Thomas served as Executive Chairman (2005-2006) and Chairman and Chief Executive Officer (2000-2005) of IMS Health, Inc. (pharmaceutical and healthcare information solutions). Mr. Thomas currently serves as a member of the Board of Fortune Brands Home and Security (home and security products, 2004-present) and as Director (2013-present) and Non-Executive Chairman of the Board (2022-present) of Interpublic Group of Companies, Inc. (marketing communication).
Susan Tomasky (1953)
Year of Election or Appointment: 2020
Trustee
Ms. Tomasky also serves as Trustee of other Fidelity® funds. Prior to her retirement, Ms. Tomasky served in various executive officer positions at American Electric Power Company, Inc. (1998-2011), including most recently as President of AEP Transmission (2007-2011). Ms. Tomasky currently serves as a member of the Board and Sustainability Committee and as Chair of the Audit Committee of Marathon Petroleum Corporation (2018-present) and as a member of the Board, Executive Committee, Corporate Governance Committee and Organization and Compensation Committee and as Chair of the Audit Committee of Public Service Enterprise Group, Inc. (utilities company, 2012-present) and as a member of the Board of its subsidiary company, Public Service Electric and Gas Co. (2021-present). In addition, Ms. Tomasky currently serves as a member (2009-present) and President (2020-present) of the Board of the Royal Shakespeare Company – America (2009-present), as a member of the Board of the Columbus Association for the Performing Arts (2011-present) and as a member of the Board and Kenyon in the World Committee of Kenyon College (2016-present). Previously, Ms. Tomasky served as a Member of the Advisory Board of certain Fidelity® funds (2020), as a member of the Board of the Columbus Regional Airport Authority (2007-2020), as a member of the Board (2011-2018) and Lead Independent Director (2015-2018) of Andeavor Corporation (previously Tesoro Corporation) (independent oil refiner and marketer) and as a member of the Board of Summit Midstream Partners LP (energy, 2012-2018).
Michael E. Wiley (1950)
Year of Election or Appointment: 2020
Trustee
Mr. Wiley also serves as Trustee of other Fidelity® funds. Previously, Mr. Wiley served as a member of the Advisory Board of certain Fidelity® funds (2018-2020), Chairman, President and CEO of Baker Hughes, Inc. (oilfield services, 2000-2004). Mr. Wiley also previously served as a member of the Board of Andeavor Corporation (independent oil refiner and marketer, 2005-2018), a member of the Board of Andeavor Logistics LP (natural resources logistics, 2015-2018) and a member of the Board of High Point Resources (exploration and production, 2005-2020).
+ The information includes the Trustee's principal occupation during the last five years and other information relating to the experience, attributes, and skills relevant to the Trustee's qualifications to serve as a Trustee, which led to the conclusion that the Trustee should serve as a Trustee for the fund.
Advisory Board Members and Officers:
Correspondence intended for a Member of the Advisory Board (if any) may be sent to Fidelity Investments, P.O. Box 55235, Boston, Massachusetts 02205-5235. Correspondence intended for an officer or Peter S. Lynch may be sent to Fidelity Investments, 245 Summer Street, Boston, Massachusetts 02210. Officers appear below in alphabetical order.
Name, Year of Birth; Principal Occupation
Peter S. Lynch (1944)
Year of Election or Appointment: 2003
Member of the Advisory Board
Mr. Lynch also serves as a Member of the Advisory Board of other Fidelity® funds. Mr. Lynch is Vice Chairman and a Director of Fidelity Management & Research Company LLC (investment adviser firm). In addition, Mr. Lynch serves as a Trustee of Boston College and as the Chairman of the Inner-City Scholarship Fund. Previously, Mr. Lynch served as Vice Chairman and a Director of FMR Co., Inc. (investment adviser firm) and on the Special Olympics International Board of Directors (1997-2006).
Craig S. Brown (1977)
Year of Election or Appointment: 2019
Assistant Treasurer
Mr. Brown also serves as an officer of other funds. Mr. Brown serves as Assistant Treasurer of FIMM, LLC (2021-present) and is an employee of Fidelity Investments (2013-present).
John J. Burke III (1964)
Year of Election or Appointment: 2018
Chief Financial Officer
Mr. Burke also serves as Chief Financial Officer of other funds. Mr. Burke serves as Head of Investment Operations for Fidelity Fund and Investment Operations (2018-present) and is an employee of Fidelity Investments (1998-present). Previously Mr. Burke served as head of Asset Management Investment Operations (2012-2018).
William C. Coffey (1969)
Year of Election or Appointment: 2019
Assistant Secretary
Mr. Coffey also serves as Assistant Secretary of other funds. He is Senior Vice President and Deputy General Counsel of FMR LLC (diversified financial services company, 2010-present), and is an employee of Fidelity Investments. Previously, Mr. Coffey served as Secretary and CLO of certain funds (2018-2019); CLO, Secretary, and Senior Vice President of Fidelity Management & Research Company and FMR Co., Inc. (investment adviser firms, 2018-2019); Secretary of Fidelity SelectCo, LLC and Fidelity Investments Money Management, Inc. (investment adviser firms, 2018-2019); CLO of Fidelity Management & Research (Hong Kong) Limited, FMR Investment Management (UK) Limited, and Fidelity Management & Research (Japan) Limited (investment adviser firms, 2018-2019); and Assistant Secretary of certain funds (2009-2018).
Timothy M. Cohen (1969)
Year of Election or Appointment: 2018
Vice President
Mr. Cohen also serves as Vice President of other funds. Mr. Cohen serves as Co-Head of Equity (2018-present), a Director of Fidelity Management & Research (Japan) Limited (investment adviser firm, 2016-present), and is an employee of Fidelity Investments. Previously, Mr. Cohen served as Executive Vice President of Fidelity SelectCo, LLC (2019), Head of Global Equity Research (2016-2018), Chief Investment Officer - Equity and a Director of Fidelity Management & Research (U.K.) Inc. (investment adviser firm, 2013-2015) and as a Director of Fidelity Management & Research (Hong Kong) Limited (investment adviser firm, 2017).
Jonathan Davis (1968)
Year of Election or Appointment: 2010
Assistant Treasurer
Mr. Davis also serves as an officer of other funds. Mr. Davis serves as Assistant Treasurer of FIMM, LLC (2021-present), FMR Capital, Inc. (2017-present), FD Funds GP LLC (2021-present), FD Funds Holding LLC (2021-present), and FD Funds Management LLC (2021-present); and is an employee of Fidelity Investments. Previously, Mr. Davis served as Vice President and Associate General Counsel of FMR LLC (diversified financial services company, 2003-2010).
Laura M. Del Prato (1964)
Year of Election or Appointment: 2018
Assistant Treasurer
Ms. Del Prato also serves as an officer of other funds. Ms. Del Prato serves as Assistant Treasurer of FIMM, LLC (2021-present) and is an employee of Fidelity Investments (2017-present). Previously, Ms. Del Prato served as President and Treasurer of The North Carolina Capital Management Trust: Cash Portfolio and Term Portfolio (2018-2020). Prior to joining Fidelity Investments, Ms. Del Prato served as a Managing Director and Treasurer of the JPMorgan Mutual Funds (2014-2017). Prior to JPMorgan, Ms. Del Prato served as a partner at Cohen Fund Audit Services (accounting firm, 2012-2013) and KPMG LLP (accounting firm, 2004-2012).
Colm A. Hogan (1973)
Year of Election or Appointment: 2020
Assistant Treasurer
Mr. Hogan also serves as an officer of other funds. Mr. Hogan serves as Assistant Treasurer of FIMM, LLC (2021-present) and FMR Capital, Inc. (2017-present) and is an employee of Fidelity Investments (2005-present). Previously, Mr. Hogan served as Deputy Treasurer of certain Fidelity® funds (2016-2020) and Assistant Treasurer of certain Fidelity® funds (2016-2018).
Pamela R. Holding (1964)
Year of Election or Appointment: 2018
Vice President
Ms. Holding also serves as Vice President of other funds. Ms. Holding serves as Co-Head of Equity (2018-present) and is an employee of Fidelity Investments (2013-present). Previously, Ms. Holding served as Executive Vice President of Fidelity SelectCo, LLC (2019) and as Chief Investment Officer of Fidelity Institutional Asset Management (2013-2018).
Cynthia Lo Bessette (1969)
Year of Election or Appointment: 2019
Secretary and Chief Legal Officer (CLO)
Ms. Lo Bessette also serves as an officer of other funds. Ms. Lo Bessette serves as CLO, Secretary, and Senior Vice President of Fidelity Management & Research Company LLC (investment adviser firm, 2019-present); CLO of Fidelity Management & Research (Hong Kong) Limited, FMR Investment Management (UK) Limited, and Fidelity Management & Research (Japan) Limited (investment adviser firms, 2019-present); Secretary of FD Funds GP LLC (2021-present), FD Funds Holding LLC (2021-present), and FD Funds Management LLC (2021-present); and Assistant Secretary of FIMM, LLC (2019-present). She is a Senior Vice President and Deputy General Counsel of FMR LLC (diversified financial services company, 2019-present), and is an employee of Fidelity Investments. Previously, Ms. Lo Bessette served as CLO, Secretary, and Senior Vice President of FMR Co., Inc. (investment adviser firm, 2019); Secretary of Fidelity SelectCo, LLC and Fidelity Investments Money Management, Inc. (investment adviser firms, 2019). Prior to joining Fidelity Investments, Ms. Lo Bessette was Executive Vice President, General Counsel (2016-2019) and Senior Vice President, Deputy General Counsel (2015-2016) of OppenheimerFunds (investment management company) and Deputy Chief Legal Officer (2013-2015) of Jennison Associates LLC (investment adviser firm).
Chris Maher (1972)
Year of Election or Appointment: 2020
Deputy Treasurer
Mr. Maher also serves as an officer of other funds. Mr. Maher serves as Assistant Treasurer of FIMM, LLC (2021-present) and FMR Capital, Inc. (2017-present), and is an employee of Fidelity Investments (2008-present). Previously, Mr. Maher served as Assistant Treasurer of certain funds (2013-2020); Vice President of Asset Management Compliance (2013), Vice President of the Program Management Group of FMR (investment adviser firm, 2010-2013), and Vice President of Valuation Oversight (2008-2010).
Jason P. Pogorelec (1975)
Year of Election or Appointment: 2020
Chief Compliance Officer
Mr. Pogorelec also serves as Chief Compliance Officer of other funds. Mr. Pogorelec is a senior Vice President of Asset Management Compliance for Fidelity Investments and is an employee of Fidelity Investments (2006-present). Previously, Mr. Pogorelec served as Vice President, Associate General Counsel for Fidelity Investments (2010-2020) and Assistant Secretary of certain Fidelity funds (2015-2020).
Brett Segaloff (1972)
Year of Election or Appointment: 2021
Anti-Money Laundering (AML) Officer
Mr. Segaloff also serves as an AML Officer of other funds and other related entities. He is Director, Anti-Money Laundering (2007-present) of FMR LLC (diversified financial services company) and is an employee of Fidelity Investments (1996-present).
Stacie M. Smith (1974)
Year of Election or Appointment: 2016
President and Treasurer
Ms. Smith also serves as an officer of other funds. Ms. Smith serves as Assistant Treasurer of FIMM, LLC (2021-present) and FMR Capital, Inc. (2017-present), is an employee of Fidelity Investments (2009-present), and has served in other fund officer roles. Prior to joining Fidelity Investments, Ms. Smith served as Senior Audit Manager of Ernst & Young LLP (accounting firm, 1996-2009). Previously, Ms. Smith served as Assistant Treasurer (2013-2019) and Deputy Treasurer (2013-2016) of certain Fidelity® funds.
Jim Wegmann (1979)
Year of Election or Appointment: 2019
Assistant Treasurer
Mr. Wegmann also serves as an officer of other funds. Mr. Wegmann serves as Assistant Treasurer of FIMM, LLC (2021-present) and is an employee of Fidelity Investments (2011-present). Previously, Mr. Wegmann served as Assistant Treasurer of certain Fidelity® funds (2019-2021).
Shareholder Expense Example
As a shareholder, you incur two types of costs: (1) transaction costs, which may include sales charges (loads) on purchase payments or redemption proceeds, as applicable and (2) ongoing costs, which generally include management fees, distribution and/or service (12b-1) fees and other Fund expenses. This Example is intended to help you understand your ongoing costs (in dollars) of investing in a fund and to compare these costs with the ongoing costs of investing in other mutual funds.
The Example is based on an investment of $1,000 invested at the beginning of the period and held for the entire period (February 1, 2022 to July 31, 2022).
Actual Expenses
The first line of the accompanying table provides information about actual account values and actual expenses. You may use the information in this line, together with the amount you invested, to estimate the expenses that you paid over the period. Simply divide your account value by $1,000.00 (for example, an $8,600 account value divided by $1,000.00 = 8.6), then multiply the result by the number in the first line for a class/Fund under the heading entitled "Expenses Paid During Period" to estimate the expenses you paid on your account during this period. If any fund is a shareholder of any underlying mutual funds or exchange-traded funds (ETFs) (the Underlying Funds), such fund indirectly bears its proportional share of the expenses of the Underlying Funds in addition to the direct expenses incurred presented in the table. These fees and expenses are not included in the annualized expense ratio used to calculate the expense estimate in the table below.
Hypothetical Example for Comparison Purposes
The second line of the accompanying table provides information about hypothetical account values and hypothetical expenses based on the actual expense ratio and an assumed rate of return of 5% per year before expenses, which is not the actual return. The hypothetical account values and expenses may not be used to estimate the actual ending account balance or expenses you paid for the period. You may use this information to compare the ongoing costs of investing in the Fund and other funds. To do so, compare this 5% hypothetical example with the 5% hypothetical examples that appear in the shareholder reports of the other funds. If any fund is a shareholder of any Underlying Funds, such fund indirectly bears its proportional share of the expenses of the Underlying Funds in addition to the direct expenses as presented in the table. These fees and expenses are not included in the annualized expense ratio used to calculate the expense estimate in the table below.
Please note that the expenses shown in the table are meant to highlight your ongoing costs only and do not reflect any transaction costs. Therefore, the second line of the table is useful in comparing ongoing costs only, and will not help you determine the relative total costs of owning different funds. In addition, if these transactional costs were included, your costs would have been higher.
| | Annualized Expense Ratio-A | Beginning
Account Value
February 1, 2022 | Ending
Account Value
July 31, 2022 | Expenses Paid
During Period-B
February 1, 2022
to July 31, 2022 |
| Fidelity Leveraged Company Stock Fund | | | | |
| Leveraged Company Stock | .74% | | | |
| Actual | | $1,000.00 | $903.60 | $3.49 |
| Hypothetical-C | | $1,000.00 | $1,021.12 | $3.71 |
| Class K | .65% | | | |
| Actual | | $1,000.00 | $904.20 | $3.07 |
| Hypothetical-C | | $1,000.00 | $1,021.57 | $3.26 |
A Annualized expense ratio reflects expenses net of applicable fee waivers.
B Expenses are equal to the annualized expense ratio, multiplied by the average account value over the period, multiplied by 181/ 365 (to reflect the one-half year period). The fees and expenses of any Underlying Funds are not included in each annualized expense ratio.
C 5% return per year before expenses
Distributions (Unaudited)
The dividend and capital gains distributions for the fund(s) are available on Fidelity.com or Institutional.Fidelity.com.
The fund hereby designates as a capital gain dividend with respect to the taxable year ended July 31, 2022, $362,837,687, or, if subsequently determined to be different, the net capital gain of such year.
The fund designates 100% of the short-term capital gain dividends distributed during the fiscal year as qualifying to be taxed as short-term capital gain dividends for nonresident alien shareholders.
Leveraged Company Stock and Class K designates 100% of the dividends distributed during the fiscal year as qualifying for the dividends–received deduction for corporate shareholders.
Leveraged Company Stock and Class K designates 100% of the dividends distributed during the fiscal year as amounts which may be taken into account as a dividend for purposes of the maximum rate under section 1(h)(11) of the Internal Revenue Code.
The fund will notify shareholders in January 2023 of amounts for use in preparing 2022 income tax returns.
Board Approval of Investment Advisory Contracts and Management Fees
Fidelity Leveraged Company Stock Fund
Each year, the Board of Trustees, including the Independent Trustees (together, the Board), votes on the renewal of the management contract with Fidelity Management & Research Company LLC (FMR) and the sub-advisory agreements (together, the Advisory Contracts) for the fund. FMR and the sub-advisers are referred to herein as the Investment Advisers. The Board, assisted by the advice of fund counsel and Independent Trustees' counsel, requests and considers a broad range of information relevant to the renewal of the Advisory Contracts throughout the year.
The Board meets regularly and, at each of its meetings, covers an extensive agenda of topics and materials and considers factors that are relevant to its annual consideration of the renewal of the fund's Advisory Contracts, including the services and support provided to the fund and its shareholders. The Board has established various standing committees (Committees), each composed of and chaired by Independent Trustees with varying backgrounds, to which the Board has assigned specific subject matter responsibilities in order to enhance effective decision-making by the Board. The Board, acting directly and through its Committees, requests and receives information concerning the annual consideration of the renewal of the fund's Advisory Contracts. The Board also meets as needed to review matters specifically related to the Board's annual consideration of the renewal of the Advisory Contracts. Members of the Board may also meet with trustees of other Fidelity funds through joint ad hoc committees to discuss certain matters relevant to all of the Fidelity funds.
At its May 2022 meeting, the Board unanimously determined to renew the fund's Advisory Contracts. In reaching its determination, the Board considered all factors it believed relevant, including (i) the nature, extent, and quality of the services provided to the fund and its shareholders (including the investment performance of the fund); (ii) the competitiveness relative to peer funds of the fund's management fee and the total expense ratio of a representative class (retail class); (iii) the total costs of the services provided by and the profits realized by Fidelity from its relationships with the fund; and (iv) the extent to which, if any, economies of scale exist and are realized as the fund grows, and whether any economies of scale are appropriately shared with fund shareholders.
In considering whether to renew the Advisory Contracts for the fund, the Board reached a determination, with the assistance of fund counsel and Independent Trustees' counsel and through the exercise of its business judgment, that the renewal of the Advisory Contracts was in the best interests of the fund and its shareholders and that the compensation payable under the Advisory Contracts was fair and reasonable. The Board's decision to renew the Advisory Contracts was not based on any single factor, but rather was based on a comprehensive consideration of all the information provided to the Board at its meetings throughout the year. The Board, in reaching its determination to renew the Advisory Contracts, was aware that shareholders of the fund have a broad range of investment choices available to them, including a wide choice among funds offered by Fidelity's competitors, and that the fund's shareholders, who have the opportunity to review and weigh the disclosure provided by the fund in its prospectus and other public disclosures, have chosen to invest in this fund, which is part of the Fidelity family of funds.
Nature, Extent, and Quality of Services Provided. The Board considered Fidelity's staffing as it relates to the fund, including the backgrounds of investment personnel of Fidelity, and also considered the fund's investment objective, strategies, and related investment philosophy. The Independent Trustees also had discussions with senior management of Fidelity's investment operations and investment groups. The Board considered the structure of the investment personnel compensation program and whether this structure provides appropriate incentives to act in the best interests of the fund. Additionally, the Board considered the portfolio managers' investments, if any, in the funds that they manage. The Board also considered the steps Fidelity had taken to ensure the continued provision of high quality services to the Fidelity funds during the COVID-19 pandemic, including the expansion of staff in client facing positions to maintain service levels in periods of high volumes and volatility.
Resources Dedicated to Investment Management and Support Services. The Board and the Fund Oversight and Research Committees reviewed the general qualifications and capabilities of Fidelity's investment staff, including its size, education, experience, and resources, as well as Fidelity's approach to recruiting, training, managing, and compensating investment personnel. The Board noted the resources devoted to expansion of Fidelity's global investment organization, and that Fidelity's analysts have extensive resources, tools, and capabilities that allow them to conduct sophisticated quantitative and fundamental analysis, as well as credit analysis of issuers, counterparties, and guarantors. Further, the Board considered that Fidelity's investment professionals have sufficient access to global information and data so as to provide competitive investment results over time, and that those professionals also have access to sophisticated tools that permit them to assess portfolio construction and risk and performance attribution characteristics continuously, as well as to transmit new information and research conclusions rapidly around the world. Additionally, in its deliberations, the Board considered Fidelity's trading, risk management, compliance, and technology and operations capabilities and resources, which are integral parts of the investment management process.
Shareholder and Administrative Services. The Board considered (i) the nature, extent, quality, and cost of advisory, administrative, and shareholder services performed by the Investment Advisers and their affiliates under the Advisory Contracts and under separate agreements covering transfer agency, pricing and bookkeeping, and securities lending services for the fund; (ii) the nature and extent of the supervision of third party service providers, principally custodians, subcustodians, and pricing vendors; and (iii) the resources devoted to, and the record of compliance with, the fund's compliance policies and procedures. The Board also reviewed the allocation of fund brokerage, including allocations to brokers affiliated with the Investment Advisers, the use of brokerage commissions to pay fund expenses, and the use of "soft" commission dollars to pay for research services.
The Board noted that the growth of fund assets over time across the complex allows Fidelity to reinvest in the development of services designed to enhance the value and convenience of the Fidelity funds as investment vehicles. These services include 24-hour access to account information and market information over the Internet and through telephone representatives, investor education materials, and asset allocation tools. The Board also considered that it reviews customer service metrics such as telephone response times, continuity of services on the website and metrics addressing services at Fidelity Investor Centers.
Investment in a Large Fund Family. The Board considered the benefits to shareholders of investing in a Fidelity fund, including the benefits of investing in a fund that is part of a large family of funds offering a variety of investment disciplines and providing a large variety of mutual fund investor services. The Board noted that Fidelity had taken, or had made recommendations that resulted in the Fidelity funds taking, a number of actions over the previous year that benefited particular funds, including: (i) continuing to dedicate additional resources to Fidelity's investment research process, which includes meetings with management of issuers of securities in which the funds invest; (ii) continuing efforts to enhance Fidelity's global research capabilities; (iii) launching new funds and ETFs with innovative structures, strategies and pricing and making other enhancements to meet client needs; (iv) launching new share classes of existing funds; (v) eliminating purchase minimums and broadening eligibility requirements for certain funds and share classes; (vi) reducing management fees and total expenses for certain target date funds and classes and index funds; (vii) lowering expenses for certain existing funds and classes by implementing or lowering expense caps; (viii) rationalizing product lines and gaining increased efficiencies from fund mergers and liquidations; (ix) continuing to develop, acquire and implement systems and technology to improve services to the funds and shareholders, strengthen information security, and increase efficiency; and (x) continuing to implement enhancements to further strengthen Fidelity's product line to increase investors' probability of success in achieving their investment goals, including retirement income goals.
Investment Performance. The Board considered whether the fund has operated in accordance with its investment objective, as well as its record of compliance with its investment restrictions and its performance history. The Board noted that the fund had a portfolio manager change in October 2019. The Board will continue to monitor closely the fund's performance, taking into account the portfolio manager change.
The Board took into account discussions that occur at Board meetings throughout the year with representatives of the Investment Advisers about fund investment performance. In this regard the Board noted that as part of regularly scheduled fund reviews and other reports to the Board on fund performance, the Board considers annualized return information for the fund for different time periods, measured against an appropriate securities market index (benchmark index) and an appropriate peer group of funds with similar objectives (peer group). The Board also reviews and considers information about performance attribution. In its evaluation of fund investment performance, the Board gave particular attention to information indicating changes in performance of certain Fidelity funds for specific time periods and discussed with the Investment Advisers the reasons for any overperformance or underperformance.
In addition to reviewing absolute and relative fund performance, the Independent Trustees periodically consider the appropriateness of fund performance metrics in evaluating the results achieved. In general, the Independent Trustees believe that fund performance should be evaluated based on net performance (after fees and expenses) of the representative class, compared to appropriate benchmark indices, over appropriate time periods that may include full market cycles, and compared to peer groups, as applicable, over the same periods, taking into account relevant factors including the following: general market conditions; issuer-specific information; and fund cash flows and other factors.
The Independent Trustees recognize that shareholders evaluate performance on a net basis over their own holding periods, for which one-, three-, and five-year periods are often used as a proxy. For this reason, the performance information reviewed by the Board also included net cumulative total return information for the fund and an appropriate benchmark index and peer group for the most recent one-, three-, and five-year periods ended September 30, 2021, as shown below. Returns are shown compared to the 25th percentile (top of box, 75% beaten) and 75th percentile (bottom of box, 25% beaten) of the peer universe.
Fidelity Leveraged Company Stock Fund
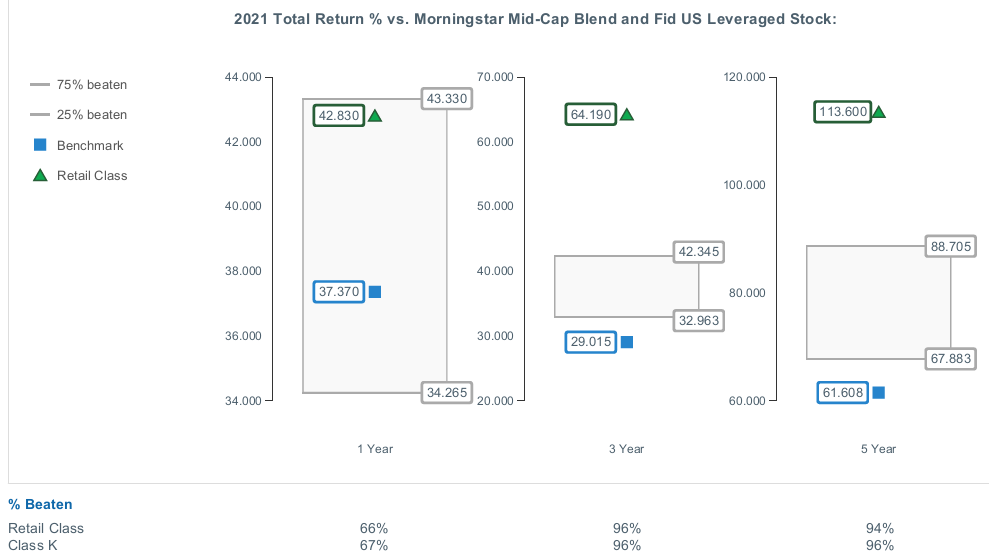
Based on its review, the Board concluded that the nature, extent, and quality of services provided to the fund under the Advisory Contracts should continue to benefit the shareholders of the fund.
Competitiveness of Management Fee and Total Expense Ratio. The Board considered the fund's management fee and total expense ratio compared to "mapped groups" of competitive funds and classes created for the purpose of facilitating the Trustees' competitive analysis of management fees and total expenses. Fidelity creates "mapped groups" by combining similar Lipper investment objective categories that have comparable investment mandates. Combining Lipper investment objective categories aids the Board's management fee and total expense ratio comparisons by broadening the competitive group used for comparison.
Management Fee. The Board considered two proprietary management fee comparisons for the 12-month periods ended September 30 (June 30 for periods ended 2019 and 2018 and December 31 for periods prior to 2018) shown in basis points (BP) in the chart below. The group of Lipper funds used by the Board for management fee comparisons is referred to below as the "Total Mapped Group." The Total Mapped Group comparison focuses on a fund's standing in terms of gross management fees before expense reimbursements or caps relative to the total universe of funds with comparable investment mandates, regardless of whether their management fee structures also are comparable. Funds with comparable investment mandates offer exposure to similar types of securities. Funds with comparable management fee structures have similar management fee contractual arrangements (
e.g., flat rate charged for advisory services, all-inclusive fee rate,
etc.). "TMG %" represents the percentage of funds in the Total Mapped Group that had management fees that were lower than the fund's. For example, a hypothetical TMG % of 20% would mean that 80% of the funds in the Total Mapped Group had higher, and 20% had lower, management fees than the fund. The fund's actual TMG %s and the number of funds in the Total Mapped Group are in the chart below. The "Asset-Sized Peer Group" (ASPG) comparison focuses on a fund's standing relative to a subset of non-Fidelity funds within the Total Mapped Group that are similar in size and management fee structure. For example, if a fund is in the first quartile of the ASPG, the fund's management fee ranks in the least expensive or lowest 25% of funds in the ASPG. The ASPG represents at least 15% of the funds in the Total Mapped Group with comparable asset size and management fee structures, subject to a minimum of 50 funds (or all funds in the Total Mapped Group if fewer than 50). Additional information, such as the ASPG quartile in which the fund's management fee rate ranked, is also included in the chart and was considered by the Board.
Fidelity Leveraged Company Stock Fund
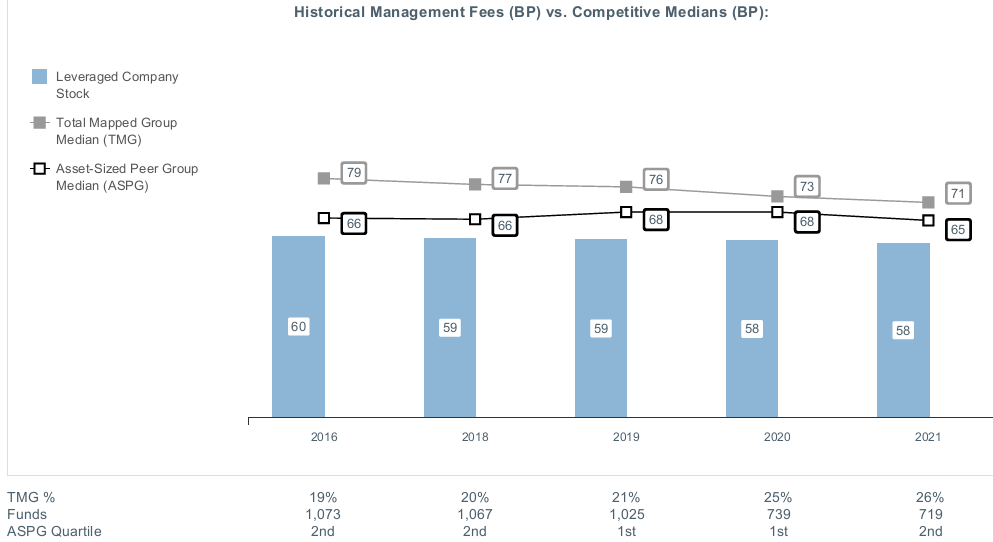
The Board noted that the fund's management fee rate ranked below the median of its Total Mapped Group and below the median of its ASPG for the 12-month period ended September 30, 2021.
The Board also considered that, for funds subject to the group fee, FMR agreed to voluntarily waive fees over a specified period of time in amounts designed to account for assets converted from certain funds to certain collective investment trusts.
Based on its review, the Board concluded that the fund's management fee is fair and reasonable in light of the services that the fund receives and the other factors considered.
Total Expense Ratio. In its review of the total expense ratio of the representative class (retail class), the Board considered the fund's management fee rate as well as other fund or class expenses, as applicable, such as transfer agent fees, pricing and bookkeeping fees, and custodial, legal, and audit fees. The Board also noted that Fidelity may agree to waive fees or reimburse expenses from time to time, and the extent to which, if any, it has done so for the fund. The fund's representative class is compared to those funds and classes in the Total Mapped Group (used by the Board for management fee comparisons) that have a similar sales load structure. The Board also considered a total expense ASPG comparison, which focuses on the total expenses of the representative class relative to a subset of non-Fidelity funds within the total expense similar sales load structure group. The total expense ASPG is limited to 15 larger and 15 smaller classes in fund average assets for a total of 30 classes, where possible. The total expense ASPG comparison excludes performance adjustments and fund-paid 12b-1 fees to eliminate variability in fee structures.
The Board noted that the total net expense ratio of the retail class ranked below the similar sales load structure group competitive median and below the ASPG competitive median for the 12-month period ended September 30, 2021.
Fees Charged to Other Fidelity Clients. The Board also considered Fidelity fee structures and other information with respect to clients of Fidelity, such as other funds advised or subadvised by Fidelity, pension plan clients, and other institutional clients with similar mandates. The Board noted that a joint ad hoc committee created by it and the boards of other Fidelity funds periodically reviews and compares Fidelity's institutional investment advisory business with its business of providing services to the Fidelity funds and also noted the most recent findings of the committee. The Board noted that the committee's review included a consideration of the differences in services provided, fees charged, and costs incurred, as well as competition in the markets serving the different categories of clients.
Based on its review of total expense ratios and fees charged to other Fidelity clients, the Board concluded that the total expense ratio of each class of the fund was reasonable in light of the services that the fund and its shareholders receive and the other factors considered.
Costs of the Services and Profitability. The Board considered the revenues earned and the expenses incurred by Fidelity in conducting the business of developing, marketing, distributing, managing, administering and servicing the fund and servicing the fund's shareholders. The Board also considered the level of Fidelity's profits in respect of all the Fidelity funds.
On an annual basis, Fidelity presents to the Board information about the profitability of its relationships with the fund. Fidelity calculates profitability information for each fund, as well as aggregate profitability information for groups of Fidelity funds and all Fidelity funds, using a series of detailed revenue and cost allocation methodologies which originate with the books and records of Fidelity on which Fidelity's audited financial statements are based. The Audit Committee of the Board reviews any significant changes from the prior year's methodologies and the full Board approves such changes.
A public accounting firm has been engaged annually by the Board as part of the Board's assessment of Fidelity's profitability analysis. The engagement includes the review and assessment of the methodologies used by Fidelity in determining the revenues and expenses attributable to Fidelity's mutual fund business, and completion of agreed-upon procedures in respect of the mathematical accuracy of certain fund profitability information and its conformity to established allocation methodologies. After considering the reports issued under the engagement and information provided by Fidelity, the Board concluded that while other allocation methods may also be reasonable, Fidelity's profitability methodologies are reasonable in all material respects.
The Board also reviewed Fidelity's non-fund businesses and potential indirect benefits such businesses may have received as a result of their association with Fidelity's mutual fund business (i.e., fall-out benefits) as well as cases where Fidelity's affiliates may benefit from the funds' business. The Board considered areas where potential indirect benefits to the Fidelity funds from their relationships with Fidelity may exist. The Board's consideration of these matters was informed by the findings of a joint ad hoc committee created by it and the boards of other Fidelity funds to evaluate potential fall-out benefits.
The Board considered the costs of the services provided by and the profits realized by Fidelity in connection with the operation of the fund and was satisfied that the profitability was not excessive.
Economies of Scale. The Board considered whether there have been economies of scale in respect of the management of the Fidelity funds, whether the Fidelity funds (including the fund) have appropriately benefited from any such economies of scale, and whether there is potential for realization of any further economies of scale. The Board considered the extent to which the fund will benefit from economies of scale as assets grow through increased services to the fund, through waivers or reimbursements, or through fee or expense ratio reductions. The Board also noted that a committee (the Economies of Scale Committee) created by it and the boards of other Fidelity funds periodically analyzes whether Fidelity attains economies of scale in respect of the management and servicing of the Fidelity funds, whether the Fidelity funds have appropriately benefited from such economies of scale, and whether there is potential for realization of any further economies of scale.
The Board recognized that the fund's management contract incorporates a "group fee" structure, which provides for lower group fee rates as total "group assets" increase, and for higher group fee rates as total "group assets" decrease ("group assets" as defined in the management contract). FMR calculates the group fee rates based on a tiered asset "breakpoint" schedule that varies based on asset class. The Board considered that the group fee is designed to deliver the benefits of economies of scale to fund shareholders when total Fidelity fund assets increase, even if assets of any particular fund are unchanged or have declined, because some portion of Fidelity's costs are attributable to services provided to all Fidelity funds, and all funds benefit if those costs can be allocated among more assets. The Board further considered that Fidelity agreed to impose a temporary fee waiver in the form of additional breakpoints to the current breakpoint schedule. The Board concluded that, given the group fee structure, fund shareholders will benefit from lower management fees as "group assets" increase at the fund complex level, regardless of whether Fidelity achieves any such economies of scale.
The Board concluded, taking into account the analysis of the Economies of Scale Committee, that economies of scale, if any, are being appropriately shared between fund shareholders and Fidelity.
Additional Information Requested by the Board. In order to develop fully the factual basis for consideration of the Fidelity funds' advisory contracts, the Board requested and received additional information on certain topics, including: (i) fund flow and performance trends, in particular the underperformance of certain funds and strategies, and Fidelity's long-term strategies for certain funds, including any consideration of fund liquidations or mergers; (ii) the operation of performance fees, competitor use of performance fees, and consideration of the expansion of performance fees to additional funds; (iii) Fidelity's pricing philosophy compared to competitors; (iv) fund profitability methodology and data; (v) evaluation of competitive fund data and peer group classifications and fee and expense comparisons; (vi) the management fee and expense structures for different funds and classes and information about the differences between various fee and expense structures; (vii) group fee breakpoints and related voluntary fee waivers; and (viii) information regarding other accounts managed by Fidelity and the funds' sub-advisory arrangements.
Based on its evaluation of all of the conclusions noted above, and after considering all factors it believed relevant, the Board concluded that the advisory fee arrangements are fair and reasonable and that the fund's Advisory Contracts should be renewed.
Liquidity Risk Management Program
The Securities and Exchange Commission adopted Rule 22e-4 under the Investment Company Act of 1940 (the Liquidity Rule) to promote effective liquidity risk management throughout the open-end investment company industry, thereby reducing the risk that funds will be unable to meet their redemption obligations and mitigating dilution of the interests of fund shareholders.
The Fund has adopted and implemented a liquidity risk management program pursuant to the Liquidity Rule (the Program) effective December 1, 2018. The Program is reasonably designed to assess and manage the Fund’s liquidity risk and to comply with the requirements of the Liquidity Rule. The Fund’s Board of Trustees (the Board) has designated the Fund’s investment adviser as administrator of the Program. The Fidelity advisers have established a Liquidity Risk Management Committee (the LRM Committee) to manage the Program for each of the Fidelity Funds. The LRM Committee monitors the adequacy and effectiveness of implementation of the Program and on a periodic basis assesses each Fund’s liquidity risk based on a variety of factors including (1) the Fund’s investment strategy, (2) portfolio liquidity and cash flow projections during normal and reasonably foreseeable stressed conditions, (3) shareholder redemptions, (4) borrowings and other funding sources and (5) in the case of exchange-traded funds, certain additional factors including the effect of the Fund’s prices and spreads, market participants, and basket compositions on the overall liquidity of the Fund’s portfolio, as applicable.
In accordance with the Program, each of the Fund’s portfolio investments is classified into one of four liquidity categories described below based on a determination of a reasonable expectation for how long it would take to convert the investment to cash (or sell or dispose of the investment) without significantly changing its market value.
- Highly liquid investments – cash or convertible to cash within three business days or less
- Moderately liquid investments – convertible to cash in three to seven calendar days
- Less liquid investments – can be sold or disposed of, but not settled, within seven calendar days
- Illiquid investments – cannot be sold or disposed of within seven calendar days
Liquidity classification determinations take into account a variety of factors including various market, trading and investment-specific considerations, as well as market depth, and generally utilize analysis from a third-party liquidity metrics service.
The Liquidity Rule places a 15% limit on a fund’s illiquid investments and requires funds that do not primarily hold assets that are highly liquid investments to determine and maintain a minimum percentage of the fund’s net assets to be invested in highly liquid investments (highly liquid investment minimum or HLIM). The Program includes provisions reasonably designed to comply with the 15% limit on illiquid investments and for determining, periodically reviewing and complying with the HLIM requirement as applicable.
At a recent meeting of the Fund’s Board of Trustees, the LRM Committee provided a written report to the Board pertaining to the operation, adequacy, and effectiveness of implementation of the Program for the annual period from December 1, 2020 through November 30, 2021. The report concluded that the Program has been implemented and is operating effectively and is reasonably designed to assess and manage the Fund’s liquidity risk.
LSF-ANN-0922
1.762413.121
Fidelity® OTC Portfolio
Annual Report
July 31, 2022
Contents
To view a fund's proxy voting guidelines and proxy voting record for the 12-month period ended June 30, visit http://www.fidelity.com/proxyvotingresults or visit the Securities and Exchange Commission's (SEC) web site at http://www.sec.gov.
You may also call 1-800-544-8544 if you’re an individual investing directly with Fidelity, call 1-800-835-5092 if you’re a plan sponsor or participant with Fidelity as your recordkeeper or call 1-877-208-0098 on institutional accounts or if you’re an advisor or invest through one to request a free copy of the proxy voting guidelines.
Standard & Poor's, S&P and S&P 500 are registered service marks of The McGraw-Hill Companies, Inc. and have been licensed for use by Fidelity Distributors Corporation.
Other third-party marks appearing herein are the property of their respective owners.
All other marks appearing herein are registered or unregistered trademarks or service marks of FMR LLC or an affiliated company. © 2022 FMR LLC. All rights reserved.
This report and the financial statements contained herein are submitted for the general information of the shareholders of the Fund. This report is not authorized for distribution to prospective investors in the Fund unless preceded or accompanied by an effective prospectus.
A fund files its complete schedule of portfolio holdings with the SEC for the first and third quarters of each fiscal year on Form N-PORT. Forms N-PORT are available on the SEC’s web site at http://www.sec.gov. A fund's Forms N-PORT may be reviewed and copied at the SEC’s Public Reference Room in Washington, DC. Information regarding the operation of the SEC's Public Reference Room may be obtained by calling 1-800-SEC-0330.
For a complete list of a fund's portfolio holdings, view the most recent holdings listing, semiannual report, or annual report on Fidelity's web site at http://www.fidelity.com, http://www.institutional.fidelity.com, or http://www.401k.com, as applicable.
NOT FDIC INSURED •MAY LOSE VALUE •NO BANK GUARANTEE
Neither the Fund nor Fidelity Distributors Corporation is a bank.
Note to Shareholders:
Early in 2020, the outbreak and spread of COVID-19 emerged as a public health emergency that had a major influence on financial markets, primarily based on its impact on the global economy and corporate earnings. On March 11, 2020, the World Health Organization declared the COVID-19 outbreak a pandemic, citing sustained risk of further global spread. The pandemic prompted a number of measures to limit the spread of COVID-19, including travel and border restrictions, quarantines, and restrictions on large gatherings. In turn, these resulted in lower consumer activity, diminished demand for a wide range of products and services, disruption in manufacturing and supply chains, and – given the wide variability in outcomes regarding the outbreak – significant market uncertainty and volatility. To help stem the turmoil, the U.S. government took unprecedented action – in concert with the U.S. Federal Reserve and central banks around the world – to help support consumers, businesses, and the broader economy, and to limit disruption to the financial system.
In general, the overall impact of the pandemic lessened in 2021, amid a resilient economy and widespread distribution of three COVID-19 vaccines granted emergency use authorization from the U.S. Food and Drug Administration (FDA) early in the year. Still, the situation remains dynamic, and the extent and duration of its influence on financial markets and the economy is highly uncertain, due in part to a recent spike in cases based on highly contagious variants of the coronavirus.
Extreme events such as the COVID-19 crisis are exogenous shocks that can have significant adverse effects on mutual funds and their investments. Although multiple asset classes may be affected by market disruption, the duration and impact may not be the same for all types of assets. Fidelity is committed to helping you stay informed amid news about COVID-19 and during increased market volatility, and we continue to take extra steps to be responsive to customer needs. We encourage you to visit us online, where we offer ongoing updates, commentary, and analysis on the markets and our funds.
Performance: The Bottom Line
Average annual total return reflects the change in the value of an investment, assuming reinvestment of distributions from dividend income and capital gains (the profits earned upon the sale of securities that have grown in value, if any) and assuming a constant rate of performance each year. The hypothetical investment and the average annual total returns do not reflect the deduction of taxes that a shareholder would pay on fund distributions or the redemption of fund shares. During periods of reimbursement by Fidelity, a fund’s total return will be greater than it would be had the reimbursement not occurred. How a fund did yesterday is no guarantee of how it will do tomorrow.
Average Annual Total Returns
| For the periods ended July 31, 2022 | Past 1 year | Past 5 years | Past 10 years |
| Fidelity® OTC Portfolio | (20.30)% | 15.24% | 18.20% |
| Class K | (20.21)% | 15.36% | 18.33% |
$10,000 Over 10 Years
Let's say hypothetically that $10,000 was invested in Fidelity® OTC Portfolio, a class of the fund, on July 31, 2012.
The chart shows how the value of your investment would have changed, and also shows how the Nasdaq Composite Index® performed over the same period.
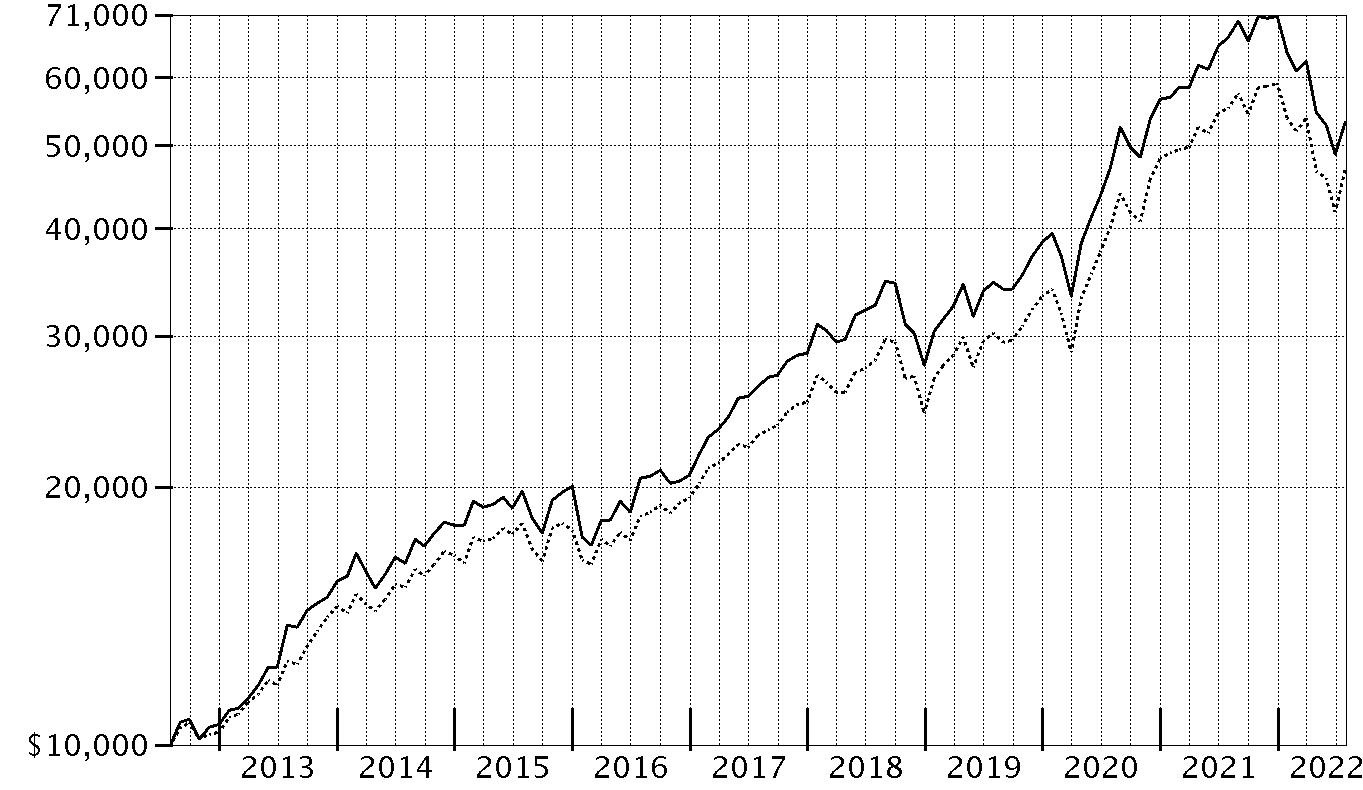
| Period Ending Values |
| $53,237 | Fidelity® OTC Portfolio |
| $46,971 | Nasdaq Composite Index® |
Management's Discussion of Fund Performance
Market Recap: The S&P 500
® index returned -4.64% for the 12 months ending July 31, 2022, as a multitude of crosscurrents challenged the global economy and financial markets. Persistently high inflation, exacerbated by energy price shocks from the Russia–Ukraine conflict, spurred the U.S. Federal Reserve to hike interest rates more aggressively than anticipated, and concerns about the outlook for economic growth sent stocks into bear market territory. In early May, the Fed approved a rare half-percentage-point interest rate increase and announced plans to shrink its $9 trillion asset portfolio. June began with the Fed allowing up to billions in Treasuries and mortgage bonds to mature every month without investing the proceeds. Two weeks later, the central bank raised rates by 0.75 percentage points, its largest increase since 1994, and said it was becoming more difficult to achieve a soft landing, in which the economy slows enough to bring down inflation while avoiding a recession. Against this volatile backdrop, the S&P 500
® posted its worst first-half result (-19.96%) to begin a year since 1970. Stocks sharply reversed course in July (+9.22%), as the Fed again raised its benchmark interest rate by 0.75% but signaled that, at some point, it will likely slow the pace of tightening to assess the impact on the economy. For the full 12 months, growth-oriented communication services (-29%) and consumer discretionary (-10%) stocks lagged most. In contrast, energy (+67%) rode a surge in commodity prices and led by a wide margin, followed by the defensive utilities (+16%) and consumer staples (+7%) sectors.
Comments from Portfolio Manager Christopher Lin: For the fiscal year ending July 31, 2022, the fund's share classes returned about -20%, underperforming the -14.95% result of the benchmark NASDAQ Composite Index. The primary detractors from performance versus the benchmark were stock picks and an overweighting in the communication services sector, especially within the media & entertainment industry. Security selection in consumer discretionary and energy also hurt. Our smaller-than-benchmark stake in Tesla (+30%), a position we established this period, was the fund's biggest individual relative detractor the past 12 months. Shares of Snap returned -87% and further pressured performance the past year, though we increased our non-benchmark position in the company. Out-of-benchmark exposure to Twitter, one of the fund's largest holdings, also hurt, given its approximately -40% return. In contrast, the largest contributor to performance versus the benchmark was an overweighting in energy. Also bolstering the portfolio's relative result was an underweighting and stock picks in both the health care and industrials sectors. Our top individual relative contributor was an out-of-benchmark stake in Reliance Industries (+15%), one of the fund’s biggest holdings on July 31. Further aiding performance was our smaller-than-benchmark holding in PayPal, which returned about -69%. We decreased our stake in the company the past 12 months. Nvidia, one of the portfolio's largest holdings, returned -8% this period and lifted relative performance as well. Notable changes in positioning include increased exposure to the health care sector and a lower allocation to communication services stocks.
The views expressed above reflect those of the portfolio manager(s) only through the end of the period as stated on the cover of this report and do not necessarily represent the views of Fidelity or any other person in the Fidelity organization. Any such views are subject to change at any time based upon market or other conditions and Fidelity disclaims any responsibility to update such views. These views may not be relied on as investment advice and, because investment decisions for a Fidelity fund are based on numerous factors, may not be relied on as an indication of trading intent on behalf of any Fidelity fund.
Investment Summary (Unaudited)
Top Ten Stocks as of July 31, 2022
| | % of fund's net assets |
| Apple, Inc. | 13.2 |
| Microsoft Corp. | 12.0 |
| Amazon.com, Inc. | 6.0 |
| Alphabet, Inc. Class A | 5.4 |
| Alphabet, Inc. Class C | 3.3 |
| Meta Platforms, Inc. Class A | 2.7 |
| Marvell Technology, Inc. | 2.5 |
| Reliance Industries Ltd. | 1.8 |
| Comcast Corp. Class A | 1.8 |
| Twitter, Inc. | 1.8 |
| | 50.5 |
Market Sectors as of July 31, 2022
| | % of fund's net assets |
| Information Technology | 42.3 |
| Communication Services | 19.8 |
| Consumer Discretionary | 14.7 |
| Health Care | 8.8 |
| Energy | 4.8 |
| Consumer Staples | 4.6 |
| Industrials | 2.3 |
| Financials | 2.2 |
| Real Estate | 0.1 |
Asset Allocation (% of fund's net assets)
| As of July 31, 2022 * |
| | Stocks | 98.0% |
| | Convertible Securities | 1.6% |
| | Short-Term Investments and Net Other Assets (Liabilities) | 0.4% |

* Foreign investments - 10.6%
Geographic Diversification (% of fund's net assets)
| As of July 31, 2022 |
| | United States of America* | 89.4% |
| | Cayman Islands | 2.4% |
| | India | 2.3% |
| | Netherlands | 1.5% |
| | Taiwan | 1.3% |
| | United Kingdom | 1.1% |
| | France | 0.8% |
| | Curacao | 0.5% |
| | Norway | 0.2% |
| | Other | 0.5% |

* Includes Short-Term investments and Net Other Assets (Liabilities).
Percentages are based on country or territory of incorporation and are adjusted for the effect of futures contracts, if applicable.
Schedule of Investments July 31, 2022
Showing Percentage of Net Assets
| Common Stocks - 97.6% | | | |
| | | Shares | Value (000s) |
| COMMUNICATION SERVICES - 19.1% | | | |
| Diversified Telecommunication Services - 0.0% | | | |
| Starry, Inc. | | 333,389 | $1,014 |
| Entertainment - 1.3% | | | |
| Activision Blizzard, Inc. | | 645,391 | 51,599 |
| Electronic Arts, Inc. | | 2,333 | 306 |
| NetEase, Inc. ADR | | 14,663 | 1,363 |
| Netflix, Inc. (a) | | 1,038,313 | 233,517 |
| Take-Two Interactive Software, Inc. (a) | | 11,546 | 1,533 |
| | | | 288,318 |
| Interactive Media & Services - 14.6% | | | |
| Alphabet, Inc.: | | | |
| Class A (a) | | 10,365,540 | 1,205,720 |
| Class C (a) | | 6,273,540 | 731,746 |
| Match Group, Inc. (a) | | 232,013 | 17,009 |
| Meta Platforms, Inc. Class A (a) | | 3,722,233 | 592,207 |
| Snap, Inc. Class A (a) | | 10,884,639 | 107,540 |
| Taboola.com Ltd. (a) | | 5,163,914 | 13,529 |
| Tencent Holdings Ltd. | | 180,648 | 6,982 |
| Tencent Holdings Ltd. sponsored ADR (b) | | 4,315,326 | 166,831 |
| Twitter, Inc. (a) | | 9,676,120 | 402,623 |
| Vimeo, Inc. (a) | | 282,453 | 1,570 |
| Yandex NV Series A (a)(b)(c) | | 2,813,567 | 9,650 |
| | | | 3,255,407 |
| Media - 3.2% | | | |
| Charter Communications, Inc. Class A (a) | | 732,156 | 316,365 |
| Comcast Corp. Class A | | 10,843,573 | 406,851 |
| | | | 723,216 |
| Wireless Telecommunication Services - 0.0% | | | |
| T-Mobile U.S., Inc. (a) | | 62,654 | 8,963 |
|
| TOTAL COMMUNICATION SERVICES | | | 4,276,918 |
|
| CONSUMER DISCRETIONARY - 14.2% | | | |
| Automobiles - 0.5% | | | |
| Rivian Automotive, Inc. | | 13,057 | 448 |
| Tesla, Inc. (a) | | 112,391 | 100,191 |
| | | | 100,639 |
| Hotels, Restaurants & Leisure - 1.2% | | | |
| Airbnb, Inc. Class A (a) | | 343,988 | 38,176 |
| Churchill Downs, Inc. | | 1,056,572 | 221,669 |
| Marriott International, Inc. Class A | | 42,691 | 6,780 |
| Vail Resorts, Inc. | | 19,934 | 4,727 |
| Wynn Resorts Ltd. (a) | | 122,334 | 7,766 |
| | | | 279,118 |
| Internet & Direct Marketing Retail - 7.7% | | | |
| Alibaba Group Holding Ltd. sponsored ADR (a) | | 1,193,886 | 106,698 |
| Amazon.com, Inc. (a) | | 9,952,923 | 1,343,147 |
| ContextLogic, Inc. (a)(b) | | 147,504 | 221 |
| Etsy, Inc. (a) | | 137,294 | 14,240 |
| Global-e Online Ltd. (a)(b) | | 250,153 | 5,693 |
| JD.com, Inc. Class A | | 8,613 | 257 |
| Meituan Class B (a)(d) | | 7,063,223 | 158,452 |
| Pinduoduo, Inc. ADR (a) | | 1,633,754 | 80,070 |
| thredUP, Inc. (a) | | 86,947 | 196 |
| Zomato Ltd. (a) | | 7,745,200 | 4,598 |
| | | | 1,713,572 |
| Multiline Retail - 0.2% | | | |
| Dollar Tree, Inc. (a) | | 288,676 | 47,735 |
| Specialty Retail - 2.4% | | | |
| Five Below, Inc. (a) | | 1,045,046 | 132,794 |
| Lowe's Companies, Inc. | | 936,802 | 179,426 |
| Ross Stores, Inc. | | 2,514,077 | 204,294 |
| TJX Companies, Inc. | | 346,918 | 21,218 |
| | | | 537,732 |
| Textiles, Apparel & Luxury Goods - 2.2% | | | |
| Kontoor Brands, Inc. | | 5,845 | 213 |
| lululemon athletica, Inc. (a) | | 980,679 | 304,511 |
| LVMH Moet Hennessy Louis Vuitton SE | | 262,614 | 182,347 |
| NIKE, Inc. Class B | | 102,399 | 11,768 |
| | | | 498,839 |
|
| TOTAL CONSUMER DISCRETIONARY | | | 3,177,635 |
|
| CONSUMER STAPLES - 4.6% | | | |
| Beverages - 3.1% | | | |
| Diageo PLC | | 2,692,661 | 127,556 |
| Keurig Dr. Pepper, Inc. | | 6,570,215 | 254,530 |
| Monster Beverage Corp. (a) | | 2,532,665 | 252,304 |
| The Coca-Cola Co. | | 868,334 | 55,721 |
| | | | 690,111 |
| Food & Staples Retailing - 0.3% | | | |
| Costco Wholesale Corp. | | 121,302 | 65,661 |
| Food Products - 1.2% | | | |
| Mondelez International, Inc. | | 4,105,426 | 262,911 |
| Personal Products - 0.0% | | | |
| The Honest Co., Inc. (a) | | 158,581 | 530 |
|
| TOTAL CONSUMER STAPLES | | | 1,019,213 |
|
| ENERGY - 4.8% | | | |
| Energy Equipment & Services - 1.2% | | | |
| Halliburton Co. | | 3,552,473 | 104,087 |
| Schlumberger Ltd. | | 3,172,303 | 117,470 |
| TGS ASA ADR | | 2,334,835 | 34,569 |
| | | | 256,126 |
| Oil, Gas & Consumable Fuels - 3.6% | | | |
| Cenovus Energy, Inc. (Canada) | | 165,991 | 3,163 |
| Diamondback Energy, Inc. | | 1,367,613 | 175,082 |
| EOG Resources, Inc. | | 13,766 | 1,531 |
| Hess Corp. | | 982,365 | 110,487 |
| Reliance Industries Ltd. | | 12,875,917 | 409,047 |
| Reliance Industries Ltd. sponsored GDR (d) | | 1,787,087 | 112,765 |
| | | | 812,075 |
|
| TOTAL ENERGY | | | 1,068,201 |
|
| FINANCIALS - 1.9% | | | |
| Banks - 1.8% | | | |
| Bank of America Corp. | | 1,949,800 | 65,923 |
| Fifth Third Bancorp | | 2,956,559 | 100,878 |
| Huntington Bancshares, Inc. | | 12,947,706 | 172,075 |
| Wells Fargo & Co. | | 1,268,500 | 55,649 |
| Wintrust Financial Corp. | | 44,038 | 3,789 |
| | | | 398,314 |
| Capital Markets - 0.0% | | | |
| S&P Global, Inc. | | 683 | 257 |
| Diversified Financial Services - 0.1% | | | |
| Ant International Co. Ltd. Class C (a)(c)(e) | | 10,036,067 | 18,968 |
|
| TOTAL FINANCIALS | | | 417,539 |
|
| HEALTH CARE - 8.8% | | | |
| Biotechnology - 4.9% | | | |
| Alnylam Pharmaceuticals, Inc. (a) | | 1,421,956 | 201,975 |
| Amgen, Inc. | | 1,125,331 | 278,486 |
| Arcutis Biotherapeutics, Inc. (a) | | 721,471 | 17,503 |
| Ascendis Pharma A/S sponsored ADR (a) | | 272,923 | 23,343 |
| ChemoCentryx, Inc. (a) | | 568,352 | 13,424 |
| GenSight Biologics SA (a)(b) | | 213,121 | 601 |
| Ionis Pharmaceuticals, Inc. (a) | | 31,813 | 1,195 |
| Regeneron Pharmaceuticals, Inc. (a) | | 541,274 | 314,854 |
| Relay Therapeutics, Inc. (a) | | 1,107,742 | 21,069 |
| Trevena, Inc. (a)(b) | | 447,961 | 111 |
| Vertex Pharmaceuticals, Inc. (a) | | 638,944 | 179,166 |
| Xencor, Inc. (a) | | 1,142,016 | 32,764 |
| | | | 1,084,491 |
| Health Care Equipment & Supplies - 1.1% | | | |
| DexCom, Inc. (a) | | 601,820 | 49,397 |
| Figs, Inc. Class A (a) | | 45,277 | 479 |
| Insulet Corp. (a) | | 747,897 | 185,329 |
| Neuronetics, Inc. (a)(b) | | 38,752 | 162 |
| Outset Medical, Inc. (a) | | 40,172 | 621 |
| Pulmonx Corp. (a) | | 26,213 | 447 |
| Tandem Diabetes Care, Inc. (a) | | 192,436 | 12,741 |
| | | | 249,176 |
| Health Care Providers & Services - 1.2% | | | |
| agilon health, Inc. (a) | | 435,791 | 10,908 |
| Cigna Corp. | | 75,305 | 20,736 |
| Guardant Health, Inc. (a) | | 2,095,199 | 105,116 |
| Humana, Inc. | | 252,429 | 121,671 |
| | | | 258,431 |
| Health Care Technology - 0.0% | | | |
| Certara, Inc. (a) | | 224,025 | 5,150 |
| Life Sciences Tools & Services - 1.1% | | | |
| 10X Genomics, Inc. (a) | | 701,376 | 28,160 |
| Bruker Corp. | | 2,471,173 | 169,399 |
| Illumina, Inc. (a) | | 39,023 | 8,456 |
| Nanostring Technologies, Inc. (a)(f) | | 2,428,494 | 31,085 |
| Olink Holding AB ADR (a) | | 1,060,811 | 14,268 |
| Seer, Inc. (a) | | 590,887 | 5,318 |
| | | | 256,686 |
| Pharmaceuticals - 0.5% | | | |
| AstraZeneca PLC sponsored ADR | | 1,513,316 | 100,227 |
| Elanco Animal Health, Inc. (a) | | 89,101 | 1,805 |
| TherapeuticsMD, Inc. (a) | | 6,869 | 43 |
| | | | 102,075 |
|
| TOTAL HEALTH CARE | | | 1,956,009 |
|
| INDUSTRIALS - 1.9% | | | |
| Aerospace & Defense - 0.6% | | | |
| Space Exploration Technologies Corp.: | | | |
| Class A (a)(c)(e) | | 2,034,880 | 142,442 |
| Class C (a)(c)(e) | | 70,920 | 4,964 |
| | | | 147,406 |
| Airlines - 0.0% | | | |
| Wheels Up Experience, Inc.: | | | |
| Class A (a) | | 807,791 | 1,809 |
| rights (a)(c) | | 11,102 | 6 |
| rights (a)(c) | | 11,102 | 5 |
| rights (a)(c) | | 11,103 | 4 |
| | | | 1,824 |
| Professional Services - 1.2% | | | |
| Equifax, Inc. | | 173,159 | 36,175 |
| Verisk Analytics, Inc. | | 1,212,856 | 230,746 |
| | | | 266,921 |
| Road & Rail - 0.1% | | | |
| Canadian Pacific Railway Ltd. | | 149,600 | 11,799 |
| CSX Corp. | | 287,428 | 9,293 |
| | | | 21,092 |
|
| TOTAL INDUSTRIALS | | | 437,243 |
|
| INFORMATION TECHNOLOGY - 42.2% | | | |
| Communications Equipment - 0.4% | | | |
| Cisco Systems, Inc. | | 1,770,949 | 80,348 |
| IT Services - 2.9% | | | |
| Gartner, Inc. (a) | | 1,144,236 | 303,772 |
| MasterCard, Inc. Class A | | 894,500 | 316,465 |
| MongoDB, Inc. Class A (a) | | 42,000 | 13,124 |
| PayPal Holdings, Inc. (a) | | 171,221 | 14,816 |
| Twilio, Inc. Class A (a) | | 116,853 | 9,909 |
| | | | 658,086 |
| Semiconductors & Semiconductor Equipment - 9.4% | | | |
| Advanced Micro Devices, Inc. (a) | | 1,197,999 | 113,175 |
| Analog Devices, Inc. | | 220,475 | 37,913 |
| Applied Materials, Inc. | | 1,422,596 | 150,767 |
| ASML Holding NV | | 436,679 | 250,846 |
| Lam Research Corp. | | 278,818 | 139,551 |
| Marvell Technology, Inc. | | 10,096,314 | 562,163 |
| NVIDIA Corp. | | 1,760,169 | 319,699 |
| NXP Semiconductors NV | | 540,802 | 99,443 |
| Skyworks Solutions, Inc. | | 93,587 | 10,190 |
| SolarEdge Technologies, Inc. (a) | | 80,900 | 29,135 |
| Taiwan Semiconductor Manufacturing Co. Ltd. sponsored ADR | | 3,155,728 | 279,219 |
| Texas Instruments, Inc. | | 589,700 | 105,491 |
| | | | 2,097,592 |
| Software - 16.2% | | | |
| Adobe, Inc. (a) | | 238,096 | 97,648 |
| ANSYS, Inc. (a) | | 185,839 | 51,847 |
| Aspen Technology, Inc. (a) | | 933,084 | 190,433 |
| Atom Tickets LLC (a)(c)(e)(g) | | 516,103 | 0 |
| Autodesk, Inc. (a) | | 382,775 | 82,802 |
| Cadence Design Systems, Inc. (a) | | 879,832 | 163,719 |
| CCC Intelligent Solutions Holdings, Inc. Class A (a)(b) | | 3,932,216 | 39,283 |
| Dropbox, Inc. Class A (a) | | 193,155 | 4,392 |
| Duck Creek Technologies, Inc. (a)(b) | | 24,811 | 342 |
| Dynatrace, Inc. (a) | | 9,175 | 345 |
| Epic Games, Inc. (a)(c)(e) | | 77,600 | 72,168 |
| HIVE Blockchain Technologies Ltd. (a)(b) | | 504,079 | 2,275 |
| Intuit, Inc. | | 305,262 | 139,251 |
| Microsoft Corp. | | 9,539,260 | 2,678,052 |
| Salesforce.com, Inc. (a) | | 71,419 | 13,143 |
| Stripe, Inc. Class B (a)(c)(e) | | 91,800 | 2,655 |
| Synopsys, Inc. (a) | | 170,258 | 62,570 |
| Workday, Inc. Class A (a) | | 70,548 | 10,942 |
| | | | 3,611,867 |
| Technology Hardware, Storage & Peripherals - 13.3% | | | |
| Apple, Inc. | | 18,199,560 | 2,957,605 |
| Western Digital Corp. (a) | | 286,207 | 14,053 |
| | | | 2,971,658 |
|
| TOTAL INFORMATION TECHNOLOGY | | | 9,419,551 |
|
| REAL ESTATE - 0.1% | | | |
| Equity Real Estate Investment Trusts (REITs) - 0.1% | | | |
| Equinix, Inc. | | 44,820 | 31,542 |
| TOTAL COMMON STOCKS | | | |
| (Cost $12,704,850) | | | 21,803,851 |
|
| Preferred Stocks - 1.7% | | | |
| Convertible Preferred Stocks - 1.3% | | | |
| COMMUNICATION SERVICES - 0.7% | | | |
| Interactive Media & Services - 0.7% | | | |
| Reddit, Inc.: | | | |
| Series B (a)(c)(e) | | 1,337,584 | 52,621 |
| Series C (a)(c)(e) | | 300,673 | 11,828 |
| Series D (a)(c)(e) | | 929,200 | 36,555 |
| Series E (a)(c)(e) | | 33,800 | 1,330 |
| Series F (c)(e) | | 1,250,100 | 49,179 |
| | | | 151,513 |
| CONSUMER DISCRETIONARY - 0.1% | | | |
| Hotels, Restaurants & Leisure - 0.0% | | | |
| Discord, Inc. Series I (c)(e) | | 3,300 | 1,264 |
| Internet & Direct Marketing Retail - 0.1% | | | |
| Circle Internet Financial Ltd. Series F (e) | | 391,560 | 19,009 |
| TOTAL CONSUMER DISCRETIONARY | | | 20,273 |
| INDUSTRIALS - 0.4% | | | |
| Aerospace & Defense - 0.4% | | | |
| Space Exploration Technologies Corp.: | | | |
| Series G (a)(c)(e) | | 62,037 | 43,426 |
| Series H (a)(c)(e) | | 65,670 | 45,969 |
| | | | 89,395 |
| INFORMATION TECHNOLOGY - 0.1% | | | |
| IT Services - 0.1% | | | |
| AppNexus, Inc.: | | | |
| Series E (Escrow) (a)(c)(e) | | 1,416,796 | 44 |
| Series F (Escrow) (a)(c)(e) | | 90,913 | 25 |
| ByteDance Ltd. Series E1 (a)(c)(e) | | 174,336 | 25,024 |
| | | | 25,093 |
| Software - 0.0% | | | |
| Jet.Com, Inc. Series B1 (Escrow) (a)(c)(e) | | 4,896,249 | 0 |
| Stripe, Inc. Series H (a)(c)(e) | | 39,000 | 1,128 |
| Tenstorrent, Inc. Series C1 (a)(c)(e) | | 41,000 | 2,307 |
| | | | 3,435 |
| TOTAL INFORMATION TECHNOLOGY | | | 28,528 |
|
| TOTAL CONVERTIBLE PREFERRED STOCKS | | | 289,709 |
|
| Nonconvertible Preferred Stocks - 0.4% | | | |
| CONSUMER DISCRETIONARY - 0.4% | | | |
| Automobiles - 0.1% | | | |
| Waymo LLC: | | | |
| Series A2 (a)(c)(e) | | 103,940 | 6,458 |
| Series B2 (a)(c)(e) | | 178,470 | 11,526 |
| | | | 17,984 |
| Internet & Direct Marketing Retail - 0.3% | | | |
| Circle Internet Financial Ltd. Series E (e) | | 1,272,556 | 61,779 |
| TOTAL CONSUMER DISCRETIONARY | | | 79,763 |
| HEALTH CARE - 0.0% | | | |
| Pharmaceuticals - 0.0% | | | |
| Castle Creek Pharmaceutical Holdings, Inc. Series A4 (a)(c)(e) | | 30,303 | 6,558 |
|
| TOTAL NONCONVERTIBLE PREFERRED STOCKS | | | 86,321 |
|
| TOTAL PREFERRED STOCKS | | | |
| (Cost $233,661) | | | 376,030 |
| | | Principal Amount (000s) | Value (000s) |
|
| Convertible Bonds - 0.3% | | | |
| FINANCIALS - 0.3% | | | |
| Capital Markets - 0.3% | | | |
Coinbase Global, Inc. 0.5% 6/1/26
(Cost $59,897) | | 89,459 | 54,436 |
|
| Preferred Securities - 0.0% | | | |
| INFORMATION TECHNOLOGY - 0.0% | | | |
| Software - 0.0% | | | |
Tenstorrent, Inc. 0%
(Cost $2,280)(c)(e)(h) | | 2,280 | 2,280 |
| | | Shares | Value (000s) |
|
| Money Market Funds - 1.6% | | | |
| Fidelity Cash Central Fund 2.01% (i) | | 214,555,721 | 214,599 |
| Fidelity Securities Lending Cash Central Fund 2.01% (i)(j) | | 148,092,026 | 148,107 |
| TOTAL MONEY MARKET FUNDS | | | |
| (Cost $362,706) | | | 362,706 |
| TOTAL INVESTMENT IN SECURITIES - 101.2% | | | |
| (Cost $13,363,394) | | | 22,599,303 |
| NET OTHER ASSETS (LIABILITIES) - (1.2)% | | | (265,970) |
| NET ASSETS - 100% | | | $22,333,333 |
Values shown as $0 in the Schedule of Investments may reflect amounts less than $500.
Legend
(a) Non-income producing
(b) Security or a portion of the security is on loan at period end.
(c) Level 3 security
(d) Security exempt from registration under Rule 144A of the Securities Act of 1933. These securities may be resold in transactions exempt from registration, normally to qualified institutional buyers. At the end of the period, the value of these securities amounted to $271,217,000 or 1.2% of net assets.
(e) Restricted securities (including private placements) - Investment in securities not registered under the Securities Act of 1933 (excluding 144A issues). At the end of the period, the value of restricted securities (excluding 144A issues) amounted to $619,507,000 or 2.8% of net assets.
(f) Affiliated company
(g) Investment is owned by a wholly-owned subsidiary (Subsidiary) that is treated as a corporation for U.S. tax purposes.
(h) Security is perpetual in nature with no stated maturity date.
(i) Affiliated fund that is generally available only to investment companies and other accounts managed by Fidelity Investments. The rate quoted is the annualized seven-day yield of the fund at period end. A complete unaudited listing of the fund's holdings as of its most recent quarter end is available upon request. In addition, each Fidelity Central Fund's financial statements, which are not covered by the Fund's Report of Independent Registered Public Accounting Firm, are available on the SEC's website or upon request.
(j) Investment made with cash collateral received from securities on loan.
Additional information on each restricted holding is as follows:
| Security | Acquisition Date | Acquisition Cost (000s) |
| Ant International Co. Ltd. Class C | 5/16/18 | $38,251 |
| AppNexus, Inc. Series E (Escrow) | 8/1/14 - 9/17/14 | $0 |
| AppNexus, Inc. Series F (Escrow) | 8/23/16 | $40 |
| Atom Tickets LLC | 8/15/17 | $3,000 |
| ByteDance Ltd. Series E1 | 11/18/20 | $19,103 |
| Castle Creek Pharmaceutical Holdings, Inc. Series A4 | 9/29/16 | $10,011 |
| Circle Internet Financial Ltd. Series E | 5/11/21 | $20,654 |
| Circle Internet Financial Ltd. Series F | 5/9/22 | $16,500 |
| Discord, Inc. Series I | 9/15/21 | $1,817 |
| Epic Games, Inc. | 7/13/20 - 3/29/21 | $61,546 |
| Jet.Com, Inc. Series B1 (Escrow) | 3/19/18 | $0 |
| Reddit, Inc. Series B | 7/26/17 | $18,989 |
| Reddit, Inc. Series C | 7/24/17 | $4,743 |
| Reddit, Inc. Series D | 2/4/19 | $20,151 |
| Reddit, Inc. Series E | 5/18/21 | $1,436 |
| Reddit, Inc. Series F | 8/11/21 | $77,249 |
| Space Exploration Technologies Corp. Class A | 10/16/15 - 9/11/17 | $21,156 |
| Space Exploration Technologies Corp. Class C | 9/11/17 | $957 |
| Space Exploration Technologies Corp. Series G | 1/20/15 | $4,805 |
| Space Exploration Technologies Corp. Series H | 8/4/17 | $8,865 |
| Stripe, Inc. Class B | 5/18/21 | $3,684 |
| Stripe, Inc. Series H | 3/15/21 | $1,565 |
| Tenstorrent, Inc. Series C1 | 4/23/21 | $2,438 |
| Tenstorrent, Inc. 0% | 4/23/21 | $2,280 |
| Waymo LLC Series A2 | 5/8/20 | $8,925 |
| Waymo LLC Series B2 | 6/11/21 | $16,370 |
Affiliated Central Funds
Fiscal year to date information regarding the Fund's investments in Fidelity Central Funds, including the ownership percentage, is presented below.
| Fund (Amounts in thousands) | Value, beginning of period | Purchases | Sales Proceeds | Dividend Income | Realized Gain/Loss | Change in Unrealized appreciation (depreciation) | Value, end of period | % ownership, end of period |
| Fidelity Cash Central Fund 2.01% | $177,437 | $3,180,691 | $3,143,529 | $314 | $-- | $-- | $214,599 | 0.4% |
| Fidelity Securities Lending Cash Central Fund 2.01% | 78,878 | 1,975,341 | 1,906,112 | 862 | -- | -- | 148,107 | 0.4% |
| Total | $256,315 | $5,156,032 | $5,049,641 | $1,176 | $-- | $-- | $362,706 | |
Amounts in the income column in the above table include any capital gain distributions from underlying funds, which are presented in the corresponding line-item in the Statement of Operations, if applicable. Amount for Fidelity Securities Lending Cash Central Fund represents the income earned on investing cash collateral, less rebates paid to borrowers and any lending agent fees associated with the loan, plus any premium payments received for lending certain types of securities.
Other Affiliated Issuers
An affiliated company is a company in which the Fund has ownership of at least 5% of the voting securities. Fiscal year to date transactions with companies which are or were affiliates are presented in the table below. Certain corporate actions, such as mergers, are excluded from the amounts in this table if applicable.
| Affiliate (Amounts in thousands) | Value, beginning of period | Purchases | Sales Proceeds(a) | Dividend Income | Realized Gain (loss) | Change in Unrealized appreciation (depreciation) | Value, end of period |
| Nanostring Technologies, Inc. | $151,325 | $-- | $568 | $-- | $125 | $(119,797) | $31,085 |
| Total | $151,325 | $-- | $568 | $-- | $125 | $(119,797) | $31,085 |
(a) Includes the value of securities delivered through in-kind transactions, if applicable.
Investment Valuation
The following is a summary of the inputs used, as of July 31, 2022, involving the Fund's assets and liabilities carried at fair value. The inputs or methodology used for valuing securities may not be an indication of the risk associated with investing in those securities. For more information on valuation inputs, and their aggregation into the levels used below, please refer to the Investment Valuation section in the accompanying Notes to Financial Statements.
| | Valuation Inputs at Reporting Date: |
| Description | Total | Level 1 | Level 2 | Level 3 |
| (Amounts in thousands) | | | | |
| Investments in Securities: | | | | |
| Equities: | | | | |
| Communication Services | $4,428,431 | $4,259,272 | $7,996 | $161,163 |
| Consumer Discretionary | 3,277,671 | 2,831,981 | 426,442 | 19,248 |
| Consumer Staples | 1,019,213 | 891,657 | 127,556 | -- |
| Energy | 1,068,201 | 659,154 | 409,047 | -- |
| Financials | 417,539 | 398,571 | -- | 18,968 |
| Health Care | 1,962,567 | 1,956,009 | -- | 6,558 |
| Industrials | 526,638 | 289,822 | -- | 236,816 |
| Information Technology | 9,448,079 | 9,344,728 | -- | 103,351 |
| Real Estate | 31,542 | 31,542 | -- | -- |
| Corporate Bonds | 54,436 | -- | 54,436 | -- |
| Preferred Securities | 2,280 | -- | -- | 2,280 |
| Money Market Funds | 362,706 | 362,706 | -- | -- |
| Total Investments in Securities: | $22,599,303 | $21,025,442 | $1,025,477 | $548,384 |
| Net Unrealized Depreciation on Unfunded Commitments | $(2,381) | $ | $ | $(2,381) |
The following is a reconciliation of Investments in Securities for which Level 3 inputs were used in determining value:
| (Amounts in thousands) | |
| Investments in Securities: | |
| Equities - Industrials | |
| Beginning Balance | $142,086 |
| Net Realized Gain (Loss) on Investment Securities | (4,986) |
| Net Unrealized Gain (Loss) on Investment Securities | 99,677 |
| Cost of Purchases | -- |
| Proceeds of Sales | (14) |
| Amortization/Accretion | -- |
| Transfers into Level 3 | 53 |
| Transfers out of Level 3 | -- |
| Ending Balance | $236,816 |
| The change in unrealized gain (loss) for the period attributable to Level 3 securities held at July 31, 2022 | $94,684 |
| Other Investments in Securities | |
| Beginning Balance | $346,733 |
| Net Realized Gain (Loss) on Investment Securities | (181) |
| Net Unrealized Gain (Loss) on Investment Securities | (281,774) |
| Cost of Purchases | 79,116 |
| Proceeds of Sales | (903) |
| Amortization/Accretion | -- |
| Transfers into Level 3 | 192,274 |
| Transfers out of Level 3 | (23,697) |
| Ending Balance | $311,568 |
| The change in unrealized gain (loss) for the period attributable to Level 3 securities held at July 31, 2022 | $(281,915) |
The information used in the above reconciliations represents fiscal year to date activity for any Investments in Securities identified as using Level 3 inputs at either the beginning or the end of the current fiscal period. Transfers into Level 3 were attributable to a lack of observable market data resulting from decreases in market activity, decreases in liquidity, security restructurings or corporate actions. Transfers out of Level 3 were attributable to observable market data becoming available for those securities. Cost of purchases and proceeds of sales may include securities received and/or delivered through in-kind transactions. Transfers in or out of Level 3 represent the beginning value of any Security or Instrument where a change in the pricing level occurred from the beginning to the end of the period. The cost of purchases and the proceeds of sales may include securities received or delivered through corporate actions or exchanges. Realized and unrealized gains (losses) disclosed in the reconciliations are included in Net Gain (Loss) on the Fund's Statement of Operations.
See accompanying notes which are an integral part of the financial statements.
Financial Statements
Statement of Assets and Liabilities
| Amounts in thousands (except per-share amounts) | | July 31, 2022 |
| Assets | | |
Investment in securities, at value (including securities loaned of $139,008) — See accompanying schedule:
Unaffiliated issuers (cost $12,901,986) | $22,205,512 | |
| Fidelity Central Funds (cost $362,706) | 362,706 | |
| Other affiliated issuers (cost $98,702) | 31,085 | |
| Total Investment in Securities (cost $13,363,394) | | $22,599,303 |
| Receivable for fund shares sold | | 9,942 |
| Dividends receivable | | 2,463 |
| Interest receivable | | 75 |
| Distributions receivable from Fidelity Central Funds | | 344 |
| Other receivables | | 423 |
| Total assets | | 22,612,550 |
| Liabilities | | |
| Payable for investments purchased | $88,045 | |
| Unrealized depreciation on unfunded commitments | 2,381 | |
| Payable for fund shares redeemed | 9,474 | |
| Accrued management fee | 9,770 | |
| Other affiliated payables | 2,149 | |
| Other payables and accrued expenses | 19,315 | |
| Collateral on securities loaned | 148,083 | |
| Total liabilities | | 279,217 |
| Net Assets | | $22,333,333 |
| Net Assets consist of: | | |
| Paid in capital | | $12,620,459 |
| Total accumulated earnings (loss) | | 9,712,874 |
| Net Assets | | $22,333,333 |
| Net Asset Value and Maximum Offering Price | | |
| OTC: | | |
| Net Asset Value, offering price and redemption price per share ($16,626,164 ÷ 1,127,732 shares) | | $14.74 |
| Class K: | | |
| Net Asset Value, offering price and redemption price per share ($5,707,169 ÷ 379,053 shares) | | $15.06 |
See accompanying notes which are an integral part of the financial statements.
Statement of Operations
| Amounts in thousands | | Year ended July 31, 2022 |
| Investment Income | | |
| Dividends | | $118,082 |
| Interest | | 1,185 |
| Income from Fidelity Central Funds (including $862 from security lending) | | 1,176 |
| Total income | | 120,443 |
| Expenses | | |
| Management fee | | |
| Basic fee | $157,782 | |
| Performance adjustment | 28,370 | |
| Transfer agent fees | 28,311 | |
| Accounting fees | 1,909 | |
| Custodian fees and expenses | 673 | |
| Independent trustees' fees and expenses | 93 | |
| Registration fees | 227 | |
| Audit | 111 | |
| Legal | 30 | |
| Interest | 18 | |
| Miscellaneous | 92 | |
| Total expenses before reductions | 217,616 | |
| Expense reductions | (869) | |
| Total expenses after reductions | | 216,747 |
| Net investment income (loss) | | (96,304) |
| Realized and Unrealized Gain (Loss) | | |
| Net realized gain (loss) on: | | |
| Investment securities: | | |
| Unaffiliated issuers (net of foreign taxes of $13,486) | 1,602,392 | |
| Affiliated issuers | 125 | |
| Foreign currency transactions | (897) | |
| Total net realized gain (loss) | | 1,601,620 |
| Change in net unrealized appreciation (depreciation) on: | | |
| Investment securities: | | |
| Unaffiliated issuers (net of decrease in deferred foreign taxes of $3,775) | (7,314,839) | |
| Affiliated issuers | (119,797) | |
| Unfunded commitments | (2,381) | |
| Assets and liabilities in foreign currencies | (10) | |
| Total change in net unrealized appreciation (depreciation) | | (7,437,027) |
| Net gain (loss) | | (5,835,407) |
| Net increase (decrease) in net assets resulting from operations | | $(5,931,711) |
See accompanying notes which are an integral part of the financial statements.
Statement of Changes in Net Assets
| Amounts in thousands | Year ended July 31, 2022 | Year ended July 31, 2021 |
| Increase (Decrease) in Net Assets | | |
| Operations | | |
| Net investment income (loss) | $(96,304) | $(84,064) |
| Net realized gain (loss) | 1,601,620 | 3,914,563 |
| Change in net unrealized appreciation (depreciation) | (7,437,027) | 5,606,765 |
| Net increase (decrease) in net assets resulting from operations | (5,931,711) | 9,437,264 |
| Distributions to shareholders | (3,357,390) | (1,653,656) |
| Share transactions - net increase (decrease) | 1,278,068 | (1,330,230) |
| Total increase (decrease) in net assets | (8,011,033) | 6,453,378 |
| Net Assets | | |
| Beginning of period | 30,344,366 | 23,890,988 |
| End of period | $22,333,333 | $30,344,366 |
See accompanying notes which are an integral part of the financial statements.
Financial Highlights
Fidelity OTC Portfolio
| Years ended July 31, | 2022 | 2021 | 2020 | 2019 | 2018 A |
| Selected Per–Share Data | | | | | |
| Net asset value, beginning of period | $20.67 | $15.61 | $12.45 | $12.50 | $10.57 |
| Income from Investment Operations | | | | | |
| Net investment income (loss)B,C | (.07) | (.06) | (.01) | (.01) | (.02) |
| Net realized and unrealized gain (loss) | (3.60) | 6.21 | 4.14 | .75 | 2.48 |
| Total from investment operations | (3.67) | 6.15 | 4.13 | .74 | 2.46 |
| Distributions from net investment income | – | (.01) | – | – | – |
| Distributions from net realized gain | (2.26) | (1.08) | (.97) | (.79) | (.53) |
| Total distributions | (2.26) | (1.09) | (.97) | (.79) | (.53) |
| Net asset value, end of period | $14.74 | $20.67 | $15.61 | $12.45 | $12.50 |
| Total ReturnD | (20.30)% | 41.90% | 35.79% | 6.43% | 24.34% |
| Ratios to Average Net AssetsC,E,F | | | | | |
| Expenses before reductions | .81% | .80% | .87% | .88% | .88% |
| Expenses net of fee waivers, if any | .81% | .80% | .87% | .88% | .88% |
| Expenses net of all reductions | .81% | .80% | .87% | .88% | .88% |
| Net investment income (loss) | (.37)% | (.33)% | (.07)% | (.10)% | (.17)% |
| Supplemental Data | | | | | |
| Net assets, end of period (in millions) | $16,626 | $22,273 | $16,817 | $13,166 | $13,340 |
| Portfolio turnover rateG,H | 32% | 28% | 48% | 34% | 38% |
A Per share amounts have been adjusted to reflect the impact of the 10 for 1 share split that occurred on May 11, 2018.
B Calculated based on average shares outstanding during the period.
C Net investment income (loss) is affected by the timing of the declaration of dividends by any underlying mutual funds or exchange-traded funds (ETFs). Net investment income (loss) of any such underlying funds is not included in the Fund's net investment income (loss) ratio.
D Total returns would have been lower if certain expenses had not been reduced during the applicable periods shown.
E Fees and expenses of any underlying mutual funds or exchange-traded funds (ETFs) are not included in the Fund's expense ratio. The Fund indirectly bears its proportionate share of these expenses. For additional expense information related to investments in Fidelity Central Funds, please refer to the "Investments in Fidelity Central Funds" note found in the Notes to Financial Statements section of the most recent Annual or Semi-Annual report.
F Expense ratios reflect operating expenses of the class. Expenses before reductions do not reflect amounts reimbursed, waived, or reduced through arrangements with the investment adviser, brokerage services, or other offset arrangements, if applicable, and do not represent the amount paid by the class during periods when reimbursements, waivers or reductions occur.
G Portfolio turnover rate excludes securities received or delivered in-kind.
H Amount does not include the portfolio activity of any underlying mutual funds or exchange-traded funds (ETFs).
See accompanying notes which are an integral part of the financial statements.
Fidelity OTC Portfolio Class K
| Years ended July 31, | 2022 | 2021 | 2020 | 2019 | 2018 A |
| Selected Per–Share Data | | | | | |
| Net asset value, beginning of period | $21.06 | $15.88 | $12.64 | $12.67 | $10.70 |
| Income from Investment Operations | | | | | |
| Net investment income (loss)B,C | (.05) | (.05) | –D | –D | (.01) |
| Net realized and unrealized gain (loss) | (3.68) | 6.33 | 4.21 | .76 | 2.52 |
| Total from investment operations | (3.73) | 6.28 | 4.21 | .76 | 2.51 |
| Distributions from net investment income | – | (.01) | –D | – | – |
| Distributions from net realized gain | (2.27) | (1.09) | (.97) | (.79) | (.54) |
| Total distributions | (2.27) | (1.10) | (.97) | (.79) | (.54) |
| Net asset value, end of period | $15.06 | $21.06 | $15.88 | $12.64 | $12.67 |
| Total ReturnE | (20.21)% | 42.05% | 35.94% | 6.50% | 24.48% |
| Ratios to Average Net AssetsC,F,G | | | | | |
| Expenses before reductions | .73% | .72% | .78% | .79% | .78% |
| Expenses net of fee waivers, if any | .73% | .71% | .78% | .79% | .78% |
| Expenses net of all reductions | .73% | .71% | .78% | .78% | .77% |
| Net investment income (loss) | (.29)% | (.25)% | .03% | (.01)% | (.07)% |
| Supplemental Data | | | | | |
| Net assets, end of period (in millions) | $5,707 | $8,072 | $7,074 | $6,752 | $7,288 |
| Portfolio turnover rateH,I | 32% | 28% | 48% | 34% | 38% |
A Per share amounts have been adjusted to reflect the impact of the 10 for 1 share split that occurred on May 11, 2018.
B Calculated based on average shares outstanding during the period.
C Net investment income (loss) is affected by the timing of the declaration of dividends by any underlying mutual funds or exchange-traded funds (ETFs). Net investment income (loss) of any such underlying funds is not included in the Fund's net investment income (loss) ratio.
D Amount represents less than $.005 per share.
E Total returns would have been lower if certain expenses had not been reduced during the applicable periods shown.
F Fees and expenses of any underlying mutual funds or exchange-traded funds (ETFs) are not included in the Fund's expense ratio. The Fund indirectly bears its proportionate share of these expenses. For additional expense information related to investments in Fidelity Central Funds, please refer to the "Investments in Fidelity Central Funds" note found in the Notes to Financial Statements section of the most recent Annual or Semi-Annual report.
G Expense ratios reflect operating expenses of the class. Expenses before reductions do not reflect amounts reimbursed, waived, or reduced through arrangements with the investment adviser, brokerage services, or other offset arrangements, if applicable, and do not represent the amount paid by the class during periods when reimbursements, waivers or reductions occur.
H Portfolio turnover rate excludes securities received or delivered in-kind.
I Amount does not include the portfolio activity of any underlying mutual funds or exchange-traded funds (ETFs).
See accompanying notes which are an integral part of the financial statements.
Notes to Financial Statements
For the period ended July 31, 2022
(Amounts in thousands except percentages)
1. Organization.
Fidelity OTC Portfolio (the Fund) is a non-diversified fund of Fidelity Securities Fund (the Trust) and is authorized to issue an unlimited number of shares. The Trust is registered under the Investment Company Act of 1940, as amended (the 1940 Act), as an open-end management investment company organized as a Massachusetts business trust. The Fund offers OTC and Class K shares, each of which has equal rights as to assets and voting privileges. Each class has exclusive voting rights with respect to matters that affect that class.
2. Investments in Fidelity Central Funds.
Funds may invest in Fidelity Central Funds, which are open-end investment companies generally available only to other investment companies and accounts managed by the investment adviser and its affiliates. The Schedule of Investments lists any Fidelity Central Funds held as an investment as of period end, but does not include the underlying holdings of each Fidelity Central Fund. An investing fund indirectly bears its proportionate share of the expenses of the underlying Fidelity Central Funds.
Based on its investment objective, each Fidelity Central Fund may invest or participate in various investment vehicles or strategies that are similar to those of the investing fund. These strategies are consistent with the investment objectives of the investing fund and may involve certain economic risks which may cause a decline in value of each of the Fidelity Central Funds and thus a decline in the value of the investing fund.
| Fidelity Central Fund | Investment Manager | Investment Objective | Investment Practices | Expense Ratio(a) |
| Fidelity Money Market Central Funds | Fidelity Management & Research Company LLC (FMR) | Each fund seeks to obtain a high level of current income consistent with the preservation of capital and liquidity. | Short-term Investments | Less than .005% |
(a) Expenses expressed as a percentage of average net assets and are as of each underlying Central Fund's most recent annual or semi-annual shareholder report.
A complete unaudited list of holdings for each Fidelity Central Fund is available upon request or at the Securities and Exchange Commission website at www.sec.gov. In addition, the financial statements of the Fidelity Central Funds which contain the significant accounting policies (including investment valuation policies) of those funds, and are not covered by the Report of Independent Registered Public Accounting Firm, are available on the Securities and Exchange Commission website or upon request.
3. Significant Accounting Policies.
The Fund is an investment company and applies the accounting and reporting guidance of the Financial Accounting Standards Board (FASB) Accounting Standards Codification Topic 946 Financial Services - Investment Companies. The financial statements have been prepared in conformity with accounting principles generally accepted in the United States of America (GAAP), which require management to make certain estimates and assumptions at the date of the financial statements. Actual results could differ from those estimates. Subsequent events, if any, through the date that the financial statements were issued have been evaluated in the preparation of the financial statements. The Fund's Schedule of Investments lists any underlying mutual funds or exchange-traded funds (ETFs) but does not include the underlying holdings of these funds. The following summarizes the significant accounting policies of the Fund:
Investment Valuation. Investments are valued as of 4:00 p.m. Eastern time on the last calendar day of the period. The Board of Trustees (the Board) has delegated the day to day responsibility for the valuation of the Fund's investments to the Fair Value Committee (the Committee) established by the Fund's investment adviser. In accordance with valuation policies and procedures approved by the Board, the Fund attempts to obtain prices from one or more third party pricing vendors or brokers to value its investments. When current market prices, quotations or currency exchange rates are not readily available or reliable, investments will be fair valued in good faith by the Committee, in accordance with procedures adopted by the Board. Factors used in determining fair value vary by investment type and may include market or investment specific events, changes in interest rates and credit quality. The frequency with which these procedures are used cannot be predicted and they may be utilized to a significant extent. The Committee oversees the Fund's valuation policies and procedures and reports to the Board on the Committee's activities and fair value determinations. The Board monitors the appropriateness of the procedures used in valuing the Fund's investments and ratifies the fair value determinations of the Committee.
The Fund categorizes the inputs to valuation techniques used to value its investments into a disclosure hierarchy consisting of three levels as shown below:
- Level 1 – unadjusted quoted prices in active markets for identical investments
- Level 2 – other significant observable inputs (including quoted prices for similar investments, interest rates, prepayment speeds, etc.)
- Level 3 – unobservable inputs (including the Fund's own assumptions based on the best information available)
Valuation techniques used to value the Fund's investments by major category are as follows:
Equity securities, including restricted securities, for which market quotations are readily available, are valued at the last reported sale price or official closing price as reported by a third party pricing vendor on the primary market or exchange on which they are traded and are categorized as Level 1 in the hierarchy. In the event there were no sales during the day or closing prices are not available, securities are valued at the last quoted bid price or may be valued using the last available price and are generally categorized as Level 2 in the hierarchy. For foreign equity securities, when market or security specific events arise, comparisons to the valuation of American Depositary Receipts (ADRs), futures contracts, ETFs and certain indexes as well as quoted prices for similar securities may be used and would be categorized as Level 2 in the hierarchy. For equity securities, including restricted securities, where observable inputs are limited, assumptions about market activity and risk are used and these securities may be categorized as Level 3 in the hierarchy. Securities, including private placements or other restricted securities, for which observable inputs are not available are valued using alternate valuation approaches, including the market approach, the income approach and cost approach, and are categorized as Level 3 in the hierarchy. Securities, including private placements or other restricted securities, for which observable inputs are not available are valued using alternate valuation approaches, including the market approach, the income approach and cost approach, and are categorized as Level 3 in the hierarchy. The market approach considers factors including the price of recent investments in the same or a similar security or financial metrics of comparable securities. The income approach considers factors including expected future cash flows, security specific risks and corresponding discount rates. The cost approach considers factors including the value of the security's underlying assets and liabilities.
Debt securities, including restricted securities, are valued based on evaluated prices received from third party pricing vendors or from brokers who make markets in such securities. Corporate bonds and preferred securities are valued by pricing vendors who utilize matrix pricing which considers yield or price of bonds of comparable quality, coupon, maturity and type or by broker-supplied prices. When independent prices are unavailable or unreliable, debt securities may be valued utilizing pricing methodologies which consider similar factors that would be used by third party pricing vendors. Debt securities are generally categorized as Level 2 in the hierarchy but may be Level 3 depending on the circumstances.
Investments in open-end mutual funds, including the Fidelity Central Funds, are valued at their closing net asset value (NAV) each business day and are categorized as Level 1 in the hierarchy.
The following provides information on Level 3 securities held by the Fund that were valued at period end based on unobservable inputs. These amounts exclude valuations provided by a broker.
| Asset Type | Fair Value | Valuation Technique(s) | Unobservable Input | Amount or Range/Weighted Average | Impact to Valuation from an Increase in Input(a) |
| Equities | $ 546,104 | Market approach | Discount rate | 5.3% - 50.0% / 28.6% | Decrease |
| | | | Transaction price | $59.45 - $700.00 / $303.02 | Increase |
| | | Recovery value | Recovery value | $0.00 - $0.52 / $0.17 | Increase |
| | | | Discount for lack of marketability | 5.0% | Decrease |
| | | Book value | Book value multiple | 1.7 | Increase |
| | | Market comparable | Discount rate | 30.0% | Decrease |
| | | | Enterprise value/Revenue multiple (EV/R) | 3.6 - 20.5 / 8.3 | Increase |
| | | Black scholes | Term | 5.0 | Increase |
| | | | Volatility | 75.0% | Increase |
| Preferred Securities | $2,280 | Market approach | Transaction price | $100.00 | Increase |
(a) Represents the directional change in the fair value of the Level 3 investments that could have resulted from an increase in the corresponding input as of period end. A decrease to the unobservable input would have had the opposite effect. Significant changes in these inputs may have resulted in a significantly higher or lower fair value measurement at period end.
Changes in valuation techniques may result in transfers in or out of an assigned level within the disclosure hierarchy. The aggregate value of investments by input level as of July 31, 2022, as well as a roll forward of Level 3 investments, is included at the end of the Fund's Schedule of Investments.
Foreign Currency. Certain Funds may use foreign currency contracts to facilitate transactions in foreign-denominated securities. Gains and losses from these transactions may arise from changes in the value of the foreign currency or if the counterparties do not perform under the contracts' terms.
Foreign-denominated assets, including investment securities, and liabilities are translated into U.S. dollars at the exchange rates at period end. Purchases and sales of investment securities, income and dividends received, and expenses denominated in foreign currencies are translated into U.S. dollars at the exchange rate in effect on the transaction date.
The effects of exchange rate fluctuations on investments are included with the net realized and unrealized gain (loss) on investment securities. Other foreign currency transactions resulting in realized and unrealized gain (loss) are disclosed separately.
Investment Transactions and Income. For financial reporting purposes, the Fund's investment holdings and NAV include trades executed through the end of the last business day of the period. The NAV per share for processing shareholder transactions is calculated as of the close of business of the New York Stock Exchange (NYSE), normally 4:00 p.m. Eastern time and includes trades executed through the end of the prior business day. Gains and losses on securities sold are determined on the basis of identified cost and include proceeds received from litigation. Commissions paid to certain brokers with whom the investment adviser, or its affiliates, places trades on behalf of a fund include an amount in addition to trade execution, which may be rebated back to a fund. Any such rebates are included in net realized gain (loss) on investments in the Statement of Operations. Dividend income is recorded on the ex-dividend date, except for certain dividends from foreign securities where the ex-dividend date may have passed, which are recorded as soon as the Fund is informed of the ex-dividend date. Non-cash dividends included in dividend income, if any, are recorded at the fair market value of the securities received. Income and capital gain distributions from Fidelity Central Funds, if any, are recorded on the ex-dividend date. Certain distributions received by the Fund represent a return of capital or capital gain. The Fund determines the components of these distributions subsequent to the ex-dividend date, based upon receipt of tax filings or other correspondence relating to the underlying investment. These distributions are recorded as a reduction of cost of investments and/or as a realized gain. Interest income is accrued as earned and includes coupon interest and amortization of premium and accretion of discount on debt securities as applicable. Investment income is recorded net of foreign taxes withheld where recovery of such taxes is uncertain. Funds may file withholding tax reclaims in certain jurisdictions to recover a portion of amounts previously withheld. Any withholding tax reclaims income is included in the Statement of Operations in dividends. Any receivables for withholding tax reclaims are included in the Statement of Assets and Liabilities in dividends receivable.
Class Allocations and Expenses. Investment income, realized and unrealized capital gains and losses, common expenses of a fund, and certain fund-level expense reductions, if any, are allocated daily on a pro-rata basis to each class based on the relative net assets of each class to the total net assets of a fund. Each class differs with respect to transfer agent and distribution and service plan fees incurred, as applicable. Certain expense reductions may also differ by class, if applicable. For the reporting period, the allocated portion of income and expenses to each class as a percent of its average net assets may vary due to the timing of recording these transactions in relation to fluctuating net assets of the classes. Expenses directly attributable to a fund are charged to that fund. Expenses attributable to more than one fund are allocated among the respective funds on the basis of relative net assets or other appropriate methods. Expenses included in the accompanying financial statements reflect the expenses of that fund and do not include any expenses associated with any underlying mutual funds or exchange-traded funds. Although not included in a fund's expenses, a fund indirectly bears its proportionate share of these expenses through the net asset value of each underlying mutual fund or exchange-traded fund. Expense estimates are accrued in the period to which they relate and adjustments are made when actual amounts are known.
Deferred Trustee Compensation. Under a Deferred Compensation Plan (the Plan) for certain Funds, certain independent Trustees have elected to defer receipt of a portion of their annual compensation. Deferred amounts are invested in affiliated mutual funds, are marked-to-market and remain in a fund until distributed in accordance with the Plan. The investment of deferred amounts and the offsetting payable to the Trustees presented below are included in the accompanying Statement of Assets and Liabilities in other receivables and other payables and accrued expenses, as applicable.
| Fidelity OTC Portfolio | $399 |
Income Tax Information and Distributions to Shareholders. Each year, the Fund intends to qualify as a regulated investment company under Subchapter M of the Internal Revenue Code, including distributing substantially all of its taxable income and realized gains. As a result, no provision for U.S. Federal income taxes is required. As of July 31, 2022, the Fund did not have any unrecognized tax benefits in the financial statements; nor is the Fund aware of any tax positions for which it is reasonably possible that the total amounts of unrecognized tax benefits will significantly change in the next twelve months. The Fund files a U.S. federal tax return, in addition to state and local tax returns as required. The Fund's federal income tax returns are subject to examination by the Internal Revenue Service (IRS) for a period of three fiscal years after they are filed. State and local tax returns may be subject to examination for an additional fiscal year depending on the jurisdiction. Foreign taxes are provided for based on the Fund's understanding of the tax rules and rates that exist in the foreign markets in which it invests. The Fund is subject to a tax imposed on capital gains by certain countries in which it invests. An estimated deferred tax liability for net unrealized appreciation on the applicable securities is included in Other payables and accrued expenses on the Statement of Assets & Liabilities.
Distributions are declared and recorded on the ex-dividend date. Income and capital gain distributions are declared separately for each class. Income and capital gain distributions are determined in accordance with income tax regulations, which may differ from GAAP. In addition, the Fund claimed a portion of the payment made to redeeming shareholders as a distribution for income tax purposes.
Capital accounts within the financial statements are adjusted for permanent book-tax differences. These adjustments have no impact on net assets or the results of operations. Capital accounts are not adjusted for temporary book-tax differences which will reverse in a subsequent period.
Book-tax differences are primarily due to foreign currency transactions, redemptions in-kind, net operating losses, certain foreign taxes, deferred Trustee compensation and losses deferred due to wash sales and excise tax regulations.
As of period end, the cost and unrealized appreciation (depreciation) in securities, and derivatives if applicable, for federal income tax purposes were as follows:
| Gross unrealized appreciation | $10,943,535 |
| Gross unrealized depreciation | (1,940,097) |
| Net unrealized appreciation (depreciation) | $9,003,438 |
| Tax Cost | $13,593,484 |
The tax-based components of distributable earnings as of period end were as follows:
| Undistributed long-term capital gain | $779,138 |
| Net unrealized appreciation (depreciation) on securities and other investments | $9,003,401 |
The Fund intends to elect to defer to its next fiscal year $51,086 of ordinary losses recognized during the period January 1, 2022 to July 31, 2022.
The tax character of distributions paid was as follows:
| | July 31, 2022 | July 31, 2021 |
| Ordinary Income | $1,171,743 | $ 94,647 |
| Long-term Capital Gains | 2,185,647 | 1,559,009 |
| Total | $3,357,390 | $ 1,653,656 |
Restricted Securities (including Private Placements). Funds may invest in securities that are subject to legal or contractual restrictions on resale. These securities generally may be resold in transactions exempt from registration or to the public if the securities are registered. Disposal of these securities may involve time-consuming negotiations and expense, and prompt sale at an acceptable price may be difficult. Information regarding restricted securities held at period end is included at the end of the Schedule of Investments, if applicable.
Commitments. A commitment is an agreement to acquire an investment at a future date (subject to conditions) in connection with a potential public or non-public offering. Commitments outstanding at period end are presented in the table below. Unrealized appreciation (depreciation) on any commitments outstanding at period end is separately presented in the Statements of Assets and Liabilities as Unrealized appreciation (depreciation) on unfunded commitments, and any change in unrealized appreciation (depreciation) on unfunded commitments during the period is separately presented in the Statement of Operations, as applicable based on contractual conditions of each commitment.
| | Investment to be Acquired | Commitment Amount | Unrealized Appreciation (Depreciation) |
| Fidelity OTC Portfolio | Twitter, Inc. | $70,915 | $ -- |
| | Stripe, Inc. | $2,381 | $(2,381) |
Consolidated Subsidiary. The Funds included in the table below hold certain investments through a wholly-owned subsidiary ("Subsidiary"), which may be subject to federal and state taxes upon disposition.
As of period end, investments in Subsidiaries were as follows:
| | $ Amount | % of Net Assets |
| Fidelity OTC Portfolio | –(a) | –(b) |
(a) In the amount of less than five hundred dollars.
(b) In the amount of less than 0.005%.
The financial statements have been consolidated to include the Subsidiary accounts where applicable. Accordingly, all inter-company transactions and balances have been eliminated.
At period end, any estimated tax liability for these investments is presented as "Deferred taxes" in the Statement of Assets and Liabilities and included in "Change in net unrealized appreciation (depreciation) on investment securities" in the Statement of Operations. The tax liability incurred may differ materially depending on conditions when these investments are disposed. Any cash held by a Subsidiary is restricted as to its use and is presented as "Restricted cash" in the Statement of Assets and Liabilities, if applicable.
4. Purchases and Sales of Investments.
Purchases and sales of securities, other than short-term securities and in-kind transactions, as applicable, are noted in the table below.
| | Purchases ($) | Sales ($) |
| Fidelity OTC Portfolio | 8,679,000 | 10,647,942 |
Unaffiliated Redemptions In-Kind. Shares that were redeemed in-kind for investments, including accrued interest and cash, if any, are shown in the table below. The net realized gain or loss on investments delivered through in-kind redemptions is included in the accompanying Statement of Operations. The amount of the in-kind redemptions is included in share transactions in the accompanying Statement of Changes in Net Assets. There was no gain or loss for federal income tax purposes.
| | Shares | Total net realized gain or loss
($) | Total Proceeds
($) | Participating classes |
| Fidelity OTC Portfolio | 8,242 | 94,841 | 144,799 | Class K |
Prior Fiscal Year Unaffiliated Redemptions In-Kind. Shares that were redeemed in-kind for investments, including accrued interest and cash, if any, are shown in the table below; along with realized gain or loss on investments delivered through in-kind redemptions. The amount of the in-kind redemptions is included in share transactions in the accompanying Statement of Changes in Net Assets. There was no gain or loss for federal income tax purposes.
| | Shares | Total net realized gain or loss
($) | Total Proceeds
($) | Participating classes |
| Fidelity OTC Portfolio | 69,813 | 901,736 | 1,292,840 | OTC and Class K |
5. Fees and Other Transactions with Affiliates.
Management Fee. Fidelity Management & Research Company LLC (the investment adviser) and its affiliates provide the Fund with investment management related services for which the Fund pays a monthly management fee. The management fee is the sum of an individual fund fee rate that is based on an annual rate of .35% of the Fund's average net assets and an annualized group fee rate that averaged .22% during the period. The group fee rate is based upon the monthly average net assets of a group of registered investment companies with which the investment adviser has management contracts. The group fee rate decreases as assets under management increase and increases as assets under management decrease. In addition, the management fee is subject to a performance adjustment (up to a maximum of +/- .20% of the Fund's average net assets over a 36 month performance period). The upward or downward adjustment to the management fee is based on the relative investment performance of OTC as compared to its benchmark index, the Nasdaq Composite Index, over the same 36 month performance period. For the reporting period, the total annual management fee rate, including the performance adjustment, was .68% of the Fund's average net assets. The performance adjustment included in the management fee rate may be higher or lower than the maximum performance adjustment rate due to the difference between the average net assets for the reporting and performance periods.
Transfer Agent Fees. Fidelity Investments Institutional Operations Company LLC (FIIOC), an affiliate of the investment adviser, is the transfer, dividend disbursing and shareholder servicing agent for each class of the Fund. FIIOC receives account fees and asset-based fees that vary according to the account size and type of account of the shareholders of OTC, except for Class K. FIIOC receives an asset-based fee of Class K's average net assets. FIIOC pays for typesetting, printing and mailing of shareholder reports, except proxy statements.
For the period, transfer agent fees for each class were as follows:
| | Amount | % of Class-Level Average Net Assets |
| OTC | $25,366 | .12 |
| Class K | 2,945 | .04 |
| | $28,311 | |
Accounting Fees. Fidelity Service Company, Inc. (FSC), an affiliate of the investment adviser, maintains the Fund's accounting records. The accounting fee is based on the level of average net assets for each month. For the period, the fees were equivalent to the following annual rates:
| | % of Average Net Assets |
| Fidelity OTC Portfolio | .01 |
Brokerage Commissions. A portion of portfolio transactions were placed with brokerage firms which are affiliates of the investment adviser. Brokerage commissions are included in net realized gain (loss) and change in net unrealized appreciation (depreciation) in the Statement of Operations. The commissions paid to these affiliated firms were as follows:
| | Amount |
| Fidelity OTC Portfolio | $147 |
Interfund Lending Program. Pursuant to an Exemptive Order issued by the Securities and Exchange Commission (the SEC), the Fund, along with other registered investment companies having management contracts with Fidelity Management & Research Company LLC (FMR), or other affiliated entities of FMR, may participate in an interfund lending program. This program provides an alternative credit facility allowing the Fund to borrow from, or lend money to, other participating affiliated funds. At period end, there were no interfund loans outstanding. Activity in this program during the period for which loans were outstanding was as follows:
| | Borrower or Lender | Average Loan Balance | Weighted Average Interest Rate | Interest Expense |
| Fidelity OTC Portfolio | Borrower | $19,444 | .42% | $18 |
Interfund Trades. Funds may purchase from or sell securities to other Fidelity Funds under procedures adopted by the Board. The procedures have been designed to ensure these interfund trades are executed in accordance with Rule 17a-7 of the 1940 Act. Any interfund trades are included within the respective purchases and sales amounts shown in the Purchases and Sales of Investments note. Interfund trades during the period are noted in the table below.
| | Purchases ($) | Sales ($) | Realized Gain (Loss) ($) |
| Fidelity OTC Portfolio | 686,502 | 579,273 | 20,552 |
Other. During the period, the investment adviser reimbursed the Fund for certain losses as follows:
| | Amount ($) |
| Fidelity OTC Portfolio | 3 |
6. Committed Line of Credit.
Certain Funds participate with other funds managed by the investment adviser or an affiliate in a $4.25 billion credit facility (the "line of credit") to be utilized for temporary or emergency purposes to fund shareholder redemptions or for other short-term liquidity purposes. The participating funds have agreed to pay commitment fees on their pro-rata portion of the line of credit, which are reflected in Miscellaneous expenses on the Statement of Operations, and are listed below. During the period, there were no borrowings on this line of credit.
| | Amount |
| Fidelity OTC Portfolio | $37 |
7. Security Lending.
Funds lend portfolio securities from time to time in order to earn additional income. Lending agents are used, including National Financial Services (NFS), an affiliate of the investment adviser. Pursuant to a securities lending agreement, NFS will receive a fee, which is capped at 9.9% of a fund's daily lending revenue, for its services as lending agent. A fund may lend securities to certain qualified borrowers, including NFS. On the settlement date of the loan, a fund receives collateral (in the form of U.S. Treasury obligations, letters of credit and/or cash) against the loaned securities and maintains collateral in an amount not less than 100% of the market value of the loaned securities during the period of the loan. The market value of the loaned securities is determined at the close of business of a fund and any additional required collateral is delivered to a fund on the next business day. A fund or borrower may terminate the loan at any time, and if the borrower defaults on its obligation to return the securities loaned because of insolvency or other reasons, a fund may apply collateral received from the borrower against the obligation. A fund may experience delays and costs in recovering the securities loaned. Any cash collateral received is invested in the Fidelity Securities Lending Cash Central Fund. Any loaned securities are identified as such in the Schedule of Investments, and the value of loaned securities and cash collateral at period end, as applicable, are presented in the Statement of Assets and Liabilities. Security lending income represents the income earned on investing cash collateral, less rebates paid to borrowers and any lending agent fees associated with the loan, plus any premium payments received for lending certain types of securities. Security lending income is presented in the Statement of Operations as a component of income from Fidelity Central Funds. Affiliated security lending activity, if any, was as follows:
| | Total Security Lending Fees Paid to NFS | Security Lending Income From Securities Loaned to NFS | Value of Securities Loaned to NFS at Period End |
| Fidelity OTC Portfolio | $93 | $–(a) | $49 |
(a) In the amount of less than five hundred dollars.
8. Expense Reductions.
During the period the investment adviser or an affiliate reimbursed and/or waived a portion of fund-level operating expenses in the amount of $869.
9. Distributions to Shareholders.
Distributions to shareholders of each class were as follows:
| | Year ended
July 31, 2022 | Year ended
July 31, 2021 |
| Fidelity OTC Portfolio | | |
| Distributions to shareholders | | |
| OTC | $2,483,169 | $1,174,209 |
| Class K | 874,221 | 479,447 |
| Total | $3,357,390 | $1,653,656 |
10. Share Transactions.
Share transactions for each class were as follows and may contain in-kind transactions, automatic conversions between classes or exchanges between affiliated funds:
| | Shares | Shares | Dollars | Dollars |
| | Year ended July 31, 2022 | Year ended July 31, 2021 | Year ended July 31, 2022 | Year ended July 31, 2021 |
| Fidelity OTC Portfolio | | | | |
| OTC | | | | |
| Shares sold | 125,949 | 167,526 | $2,274,041 | $2,960,401 |
| Reinvestment of distributions | 119,609 | 72,811 | 2,344,237 | 1,115,245 |
| Shares redeemed | (195,138) | (240,686) | (3,377,430) | (4,251,031) |
| Net increase (decrease) | 50,420 | (349) | $1,240,848 | $(175,385) |
| Class K | | | | |
| Shares sold | 23,252 | 40,584 | $425,759 | $730,836 |
| Reinvestment of distributions | 43,712 | 30,755 | 874,221 | 479,447 |
| Shares redeemed | (71,161) | (133,642) | (1,262,760) | (2,365,128) |
| Net increase (decrease) | (4,197) | (62,303) | $37,220 | $(1,154,845) |
11. Other.
A fund's organizational documents provide former and current trustees and officers with a limited indemnification against liabilities arising in connection with the performance of their duties to the fund. In the normal course of business, a fund may also enter into contracts that provide general indemnifications. A fund's maximum exposure under these arrangements is unknown as this would be dependent on future claims that may be made against a fund. The risk of material loss from such claims is considered remote.
12. Coronavirus (COVID-19) Pandemic.
An outbreak of COVID-19 first detected in China during December 2019 has since spread globally and was declared a pandemic by the World Health Organization during March 2020. Developments that disrupt global economies and financial markets, such as the COVID-19 pandemic, may magnify factors that affect the Fund's performance.
Report of Independent Registered Public Accounting Firm
To the Board of Trustees of Fidelity Securities Fund and Shareholders of Fidelity OTC Portfolio
Opinion on the Financial Statements and Financial Highlights
We have audited the accompanying statement of assets and liabilities of Fidelity OTC Portfolio (the "Fund"), a fund of Fidelity Securities Fund, including the schedule of investments, as of July 31, 2022, the related statement of operations for the year then ended, the statement of changes in net assets for each of the two years in the period then ended, the financial highlights for each of the five years in the period then ended, and the related notes. In our opinion, the financial statements and financial highlights present fairly, in all material respects, the financial position of the Fund as of July 31, 2022, and the results of its operations for the year then ended, the changes in its net assets for each of the two years in the period then ended, and the financial highlights for each of the five years in the period then ended in conformity with accounting principles generally accepted in the United States of America.
Basis for Opinion
These financial statements and financial highlights are the responsibility of the Fund's management. Our responsibility is to express an opinion on the Fund's financial statements and financial highlights based on our audits. We are a public accounting firm registered with the Public Company Accounting Oversight Board (United States) (PCAOB) and are required to be independent with respect to the Fund in accordance with the U.S. federal securities laws and the applicable rules and regulations of the Securities and Exchange Commission and the PCAOB.
We conducted our audits in accordance with the standards of the PCAOB. Those standards require that we plan and perform the audit to obtain reasonable assurance about whether the financial statements and financial highlights are free of material misstatement, whether due to error or fraud. The Fund is not required to have, nor were we engaged to perform, an audit of its internal control over financial reporting. As part of our audits we are required to obtain an understanding of internal control over financial reporting but not for the purpose of expressing an opinion on the effectiveness of the Fund’s internal control over financial reporting. Accordingly, we express no such opinion.
Our audits included performing procedures to assess the risks of material misstatement of the financial statements and financial highlights, whether due to error or fraud, and performing procedures that respond to those risks. Such procedures included examining, on a test basis, evidence regarding the amounts and disclosures in the financial statements and financial highlights. Our audits also included evaluating the accounting principles used and significant estimates made by management, as well as evaluating the overall presentation of the financial statements and financial highlights. Our procedures included confirmation of securities owned as of July 31, 2022, by correspondence with the custodian and brokers; when replies were not received from brokers, we performed other auditing procedures. We believe that our audits provide a reasonable basis for our opinion.
/s/ Deloitte & Touche LLP
Boston, Massachusetts
September 14, 2022
We have served as the auditor of one or more of the Fidelity investment companies since 1999.
Trustees and Officers
The Trustees, Members of the Advisory Board (if any), and officers of the trust and fund, as applicable, are listed below. The Board of Trustees governs the fund and is responsible for protecting the interests of shareholders. The Trustees are experienced executives who meet periodically throughout the year to oversee the fund's activities, review contractual arrangements with companies that provide services to the fund, oversee management of the risks associated with such activities and contractual arrangements, and review the fund's performance. Except for Jonathan Chiel, each of the Trustees oversees 316 funds. Mr. Chiel oversees 184 funds.
The Trustees hold office without limit in time except that (a) any Trustee may resign; (b) any Trustee may be removed by written instrument, signed by at least two-thirds of the number of Trustees prior to such removal; (c) any Trustee who requests to be retired or who has become incapacitated by illness or injury may be retired by written instrument signed by a majority of the other Trustees; and (d) any Trustee may be removed at any special meeting of shareholders by a two-thirds vote of the outstanding voting securities of the trust. Each Trustee who is not an interested person (as defined in the 1940 Act) of the trust and the fund is referred to herein as an Independent Trustee. Each Independent Trustee shall retire not later than the last day of the calendar year in which his or her 75th birthday occurs. The Independent Trustees may waive this mandatory retirement age policy with respect to individual Trustees. Officers and Advisory Board Members hold office without limit in time, except that any officer or Advisory Board Member may resign or may be removed by a vote of a majority of the Trustees at any regular meeting or any special meeting of the Trustees. Except as indicated, each individual has held the office shown or other offices in the same company for the past five years.
The fund's Statement of Additional Information (SAI) includes more information about the Trustees. To request a free copy, call Fidelity at 1-800-544-8544 if you’re an individual investing directly with Fidelity, call 1-800-835-5092 if you’re a plan sponsor or participant with Fidelity as your recordkeeper or call 1-877-208-0098 on institutional accounts or if you’re an advisor or invest through one.
Experience, Skills, Attributes, and Qualifications of the Trustees. The Governance and Nominating Committee has adopted a statement of policy that describes the experience, qualifications, attributes, and skills that are necessary and desirable for potential Independent Trustee candidates (Statement of Policy). The Board believes that each Trustee satisfied at the time he or she was initially elected or appointed a Trustee, and continues to satisfy, the standards contemplated by the Statement of Policy. The Governance and Nominating Committee also engages professional search firms to help identify potential Independent Trustee candidates who have the experience, qualifications, attributes, and skills consistent with the Statement of Policy. From time to time, additional criteria based on the composition and skills of the current Independent Trustees, as well as experience or skills that may be appropriate in light of future changes to board composition, business conditions, and regulatory or other developments, have also been considered by the professional search firms and the Governance and Nominating Committee. In addition, the Board takes into account the Trustees' commitment and participation in Board and committee meetings, as well as their leadership of standing and ad hoc committees throughout their tenure.
In determining that a particular Trustee was and continues to be qualified to serve as a Trustee, the Board has considered a variety of criteria, none of which, in isolation, was controlling. The Board believes that, collectively, the Trustees have balanced and diverse experience, qualifications, attributes, and skills, which allow the Board to operate effectively in governing the fund and protecting the interests of shareholders. Information about the specific experience, skills, attributes, and qualifications of each Trustee, which in each case led to the Board's conclusion that the Trustee should serve (or continue to serve) as a trustee of the fund, is provided below.
Board Structure and Oversight Function. Robert A. Lawrence is an interested person and currently serves as Chair. The Trustees have determined that an interested Chair is appropriate and benefits shareholders because an interested Chair has a personal and professional stake in the quality and continuity of services provided to the fund. Independent Trustees exercise their informed business judgment to appoint an individual of their choosing to serve as Chair, regardless of whether the Trustee happens to be independent or a member of management. The Independent Trustees have determined that they can act independently and effectively without having an Independent Trustee serve as Chair and that a key structural component for assuring that they are in a position to do so is for the Independent Trustees to constitute a substantial majority for the Board. The Independent Trustees also regularly meet in executive session. David M. Thomas serves as Lead Independent Trustee and as such (i) acts as a liaison between the Independent Trustees and management with respect to matters important to the Independent Trustees and (ii) with management prepares agendas for Board meetings.
Fidelity® funds are overseen by different Boards of Trustees. The fund's Board oversees Fidelity's high income and certain equity funds, and other Boards oversee Fidelity's investment-grade bond, money market, asset allocation, and other equity funds. The asset allocation funds may invest in Fidelity® funds overseen by the fund's Board. The use of separate Boards, each with its own committee structure, allows the Trustees of each group of Fidelity® funds to focus on the unique issues of the funds they oversee, including common research, investment, and operational issues. On occasion, the separate Boards establish joint committees to address issues of overlapping consequences for the Fidelity® funds overseen by each Board.
The Trustees operate using a system of committees to facilitate the timely and efficient consideration of all matters of importance to the Trustees, the fund, and fund shareholders and to facilitate compliance with legal and regulatory requirements and oversight of the fund's activities and associated risks. The Board, acting through its committees, has charged FMR and its affiliates with (i) identifying events or circumstances the occurrence of which could have demonstrably adverse effects on the fund's business and/or reputation; (ii) implementing processes and controls to lessen the possibility that such events or circumstances occur or to mitigate the effects of such events or circumstances if they do occur; and (iii) creating and maintaining a system designed to evaluate continuously business and market conditions in order to facilitate the identification and implementation processes described in (i) and (ii) above. Because the day-to-day operations and activities of the fund are carried out by or through FMR, its affiliates, and other service providers, the fund's exposure to risks is mitigated but not eliminated by the processes overseen by the Trustees. While each of the Board's committees has responsibility for overseeing different aspects of the fund's activities, oversight is exercised primarily through the Operations, Audit, and Compliance Committees. Appropriate personnel, including but not limited to the fund's Chief Compliance Officer (CCO), FMR's internal auditor, the independent accountants, the fund's Treasurer and portfolio management personnel, make periodic reports to the Board's committees, as appropriate, including an annual review of Fidelity's risk management program for the Fidelity® funds. The responsibilities of each standing committee, including their oversight responsibilities, are described further under "Standing Committees of the Trustees."
Interested Trustees*:
Correspondence intended for a Trustee who is an interested person may be sent to Fidelity Investments, 245 Summer Street, Boston, Massachusetts 02210.
Name, Year of Birth; Principal Occupations and Other Relevant Experience+
Jonathan Chiel (1957)
Year of Election or Appointment: 2016
Trustee
Mr. Chiel also serves as Trustee of other Fidelity® funds. Mr. Chiel is Executive Vice President and General Counsel for FMR LLC (diversified financial services company, 2012-present). Previously, Mr. Chiel served as general counsel (2004-2012) and senior vice president and deputy general counsel (2000-2004) for John Hancock Financial Services; a partner with Choate, Hall & Stewart (1996-2000) (law firm); and an Assistant United States Attorney for the United States Attorney’s Office of the District of Massachusetts (1986-95), including Chief of the Criminal Division (1993-1995). Mr. Chiel is a director on the boards of the Boston Bar Foundation and the Maimonides School.
Bettina Doulton (1964)
Year of Election or Appointment: 2021
Trustee
Ms. Doulton also serves as Trustee of other Fidelity® funds. Prior to her retirement, Ms. Doulton served in a variety of positions at Fidelity Investments, including as a managing director of research (2006-2007), portfolio manager to certain Fidelity® funds (1993-2005), equity analyst and portfolio assistant (1990-1993), and research assistant (1987-1990). Ms. Doulton currently owns and operates Phi Builders + Architects and Cellardoor Winery. Previously, Ms. Doulton served as a member of the Board of Brown Capital Management, LLC (2014-2018).
Robert A. Lawrence (1952)
Year of Election or Appointment: 2020
Trustee
Chair of the Board of Trustees
Mr. Lawrence also serves as Trustee of other funds. Previously, Mr. Lawrence served as a Trustee and Member of the Advisory Board of certain funds. Prior to his retirement in 2008, Mr. Lawrence served as Vice President of certain Fidelity® funds (2006-2008), Senior Vice President, Head of High Income Division of Fidelity Management & Research Company (investment adviser firm, 2006-2008), and President of Fidelity Strategic Investments (investment adviser firm, 2002-2005).
* Determined to be an “Interested Trustee” by virtue of, among other things, his or her affiliation with the trust or various entities under common control with FMR.
+ The information includes the Trustee's principal occupation during the last five years and other information relating to the experience, attributes, and skills relevant to the Trustee's qualifications to serve as a Trustee, which led to the conclusion that the Trustee should serve as a Trustee for the fund.
Independent Trustees:
Correspondence intended for an Independent Trustee may be sent to Fidelity Investments, P.O. Box 55235, Boston, Massachusetts 02205-5235.
Name, Year of Birth; Principal Occupations and Other Relevant Experience+
Thomas P. Bostick (1956)
Year of Election or Appointment: 2021
Trustee
Lieutenant General Bostick also serves as Trustee of other Fidelity® funds. Prior to his retirement, General Bostick (United States Army, Retired) held a variety of positions within the U.S. Army, including Commanding General and Chief of Engineers, U.S. Army Corps of Engineers (2012-2016) and Deputy Chief of Staff and Director of Human Resources, U.S. Army (2009-2012). General Bostick currently serves as a member of the Board and Finance and Governance Committees of CSX Corporation (transportation, 2020-present) and a member of the Board and Corporate Governance and Nominating Committee of Perma-Fix Environmental Services, Inc. (nuclear waste management, 2020-present). General Bostick serves as Chief Executive Officer of Bostick Global Strategies, LLC (consulting, 2016-present) and as a member of the Board of HireVue, Inc. (video interview and assessment, 2020-present). Previously, General Bostick served as a Member of the Advisory Board of certain Fidelity® funds (2021), President, Intrexon Bioengineering (2018-2020) and Chief Operating Officer (2017-2020) and Senior Vice President of the Environment Sector (2016-2017) of Intrexon Corporation (biopharmaceutical company).
Dennis J. Dirks (1948)
Year of Election or Appointment: 2005
Trustee
Mr. Dirks also serves as Trustee of other Fidelity® funds. Prior to his retirement in May 2003, Mr. Dirks served as Chief Operating Officer and as a member of the Board of The Depository Trust & Clearing Corporation (financial markets infrastructure), President, Chief Operating Officer and a member of the Board of The Depository Trust Company (DTC), President and a member of the Board of the National Securities Clearing Corporation (NSCC), Chief Executive Officer and a member of the Board of the Government Securities Clearing Corporation and Chief Executive Officer and a member of the Board of the Mortgage-Backed Securities Clearing Corporation. Mr. Dirks currently serves as a member of the Finance Committee (2016-present) and Board (2017-present) and is Treasurer (2018-present) of the Asolo Repertory Theatre.
Donald F. Donahue (1950)
Year of Election or Appointment: 2018
Trustee
Mr. Donahue also serves as Trustee of other Fidelity® funds. Mr. Donahue serves as President and Chief Executive Officer of Miranda Partners, LLC (risk consulting for the financial services industry, 2012-present). Previously, Mr. Donahue served as Chief Executive Officer (2006-2012), Chief Operating Officer (2003-2006) and Managing Director, Customer Marketing and Development (1999-2003) of The Depository Trust & Clearing Corporation (financial markets infrastructure). Mr. Donahue currently serves as a member (2007-present) and Co-Chairman (2016-present) of the Board of United Way of New York and a member of the Board of The Leadership Academy (previously NYC Leadership Academy) (2012-present). Mr. Donahue previously served as a member of the Advisory Board of certain Fidelity® funds (2015-2018).
Vicki L. Fuller (1957)
Year of Election or Appointment: 2020
Trustee
Ms. Fuller also serves as Trustee of other Fidelity® funds. Previously, Ms. Fuller served as a member of the Advisory Board of certain Fidelity® funds (2018-2020), Chief Investment Officer of the New York State Common Retirement Fund (2012-2018) and held a variety of positions at AllianceBernstein L.P. (global asset management, 1985-2012), including Managing Director (2006-2012) and Senior Vice President and Senior Portfolio Manager (2001-2006). Ms. Fuller currently serves as a member of the Board, Audit Committee and Nominating and Governance Committee of two Blackstone business development companies (2020-present), as a member of the Board of Treliant, LLC (consulting, 2019-present), as a member of the Advisory Board of Ariel Alternatives, LLC (private equity, 2021-present) and as a member of the Board and Chair of the Audit Committee of Gusto, Inc. (software, 2021-present). In addition, Ms. Fuller currently serves as a member of the Board of Roosevelt University (2019-present) and as a member of the Executive Board of New York University’s Stern School of Business. Ms. Fuller previously served as a member of the Board, Audit Committee and Nominating and Governance Committee of The Williams Companies, Inc. (natural gas infrastructure, 2018-2021).
Patricia L. Kampling (1959)
Year of Election or Appointment: 2020
Trustee
Ms. Kampling also serves as Trustee of other Fidelity® funds. Prior to her retirement, Ms. Kampling served as Chairman of the Board and Chief Executive Officer (2012-2019), President and Chief Operating Officer (2011-2012) and Executive Vice President and Chief Financial Officer (2010-2011) of Alliant Energy Corporation. Ms. Kampling currently serves as a member of the Board, Finance Committee and Governance, Compensation and Nominating Committee of Xcel Energy Inc. (utilities company, 2020-present) and as a member of the Board, Audit, Finance and Risk Committee and Safety, Environmental, Technology and Operations Committee and Chair of the Executive Development and Compensation Committee of American Water Works Company, Inc. (utilities company, 2019-present). In addition, Ms. Kampling currently serves as a member of the Board of the Nature Conservancy, Wisconsin Chapter (2019-present). Previously, Ms. Kampling served as a Member of the Advisory Board of certain Fidelity® funds (2020), a member of the Board, Compensation Committee and Executive Committee and Chair of the Audit Committee of Briggs & Stratton Corporation (manufacturing, 2011-2021), a member of the Board of Interstate Power and Light Company (2012-2019) and Wisconsin Power and Light Company (2012-2019) (each a subsidiary of Alliant Energy Corporation) and as a member of the Board and Workforce Development Committee of the Business Roundtable (2018-2019).
Thomas A. Kennedy (1955)
Year of Election or Appointment: 2021
Trustee
Mr. Kennedy also serves as Trustee of other Fidelity® funds. Previously, Mr. Kennedy served as a Member of the Advisory Board of certain Fidelity® funds (2020) and held a variety of positions at Raytheon Company (aerospace and defense, 1983-2020), including Chairman and Chief Executive Officer (2014-2020) and Executive Vice President and Chief Operating Officer (2013-2014). Mr. Kennedy currently serves as Executive Chairman of the Board of Directors of Raytheon Technologies Corporation (aerospace and defense, 2020-present). He is also a member of the Rutgers School of Engineering Industry Advisory Board (2011-present) and a member of the UCLA Engineering Dean’s Executive Board (2016-present).
Oscar Munoz (1959)
Year of Election or Appointment: 2021
Trustee
Mr. Munoz also serves as Trustee of other Fidelity® funds. Prior to his retirement, Mr. Munoz served as Executive Chairman (2020-2021), Chief Executive Officer (2015-2020), President (2015-2016) and a member of the Board (2010-2021) of United Airlines Holdings, Inc. Mr. Munoz currently serves as a member of the Board of CBRE Group, Inc. (commercial real estate, 2020-present), a member of the Board of Univision Communications, Inc. (Hispanic media, 2020-present) and a member of the Advisory Board of Salesforce.com, Inc. (cloud-based software, 2020-present). Previously, Mr. Munoz served as a Member of the Advisory Board of certain Fidelity® funds (2021).
Garnett A. Smith (1947)
Year of Election or Appointment: 2018
Trustee
Mr. Smith also serves as Trustee of other Fidelity® funds. Prior to his retirement, Mr. Smith served as Chairman and Chief Executive Officer (1990-1997) and President (1986-1990) of Inbrand Corp. (manufacturer of personal absorbent products). Prior to his employment with Inbrand Corp., he was employed by a retail fabric chain and North Carolina National Bank (now Bank of America). Mr. Smith previously served as a member of the Advisory Board of certain Fidelity® funds (2012-2013).
David M. Thomas (1949)
Year of Election or Appointment: 2008
Trustee
Lead Independent Trustee
Mr. Thomas also serves as Trustee of other Fidelity® funds. Previously, Mr. Thomas served as Executive Chairman (2005-2006) and Chairman and Chief Executive Officer (2000-2005) of IMS Health, Inc. (pharmaceutical and healthcare information solutions). Mr. Thomas currently serves as a member of the Board of Fortune Brands Home and Security (home and security products, 2004-present) and as Director (2013-present) and Non-Executive Chairman of the Board (2022-present) of Interpublic Group of Companies, Inc. (marketing communication).
Susan Tomasky (1953)
Year of Election or Appointment: 2020
Trustee
Ms. Tomasky also serves as Trustee of other Fidelity® funds. Prior to her retirement, Ms. Tomasky served in various executive officer positions at American Electric Power Company, Inc. (1998-2011), including most recently as President of AEP Transmission (2007-2011). Ms. Tomasky currently serves as a member of the Board and Sustainability Committee and as Chair of the Audit Committee of Marathon Petroleum Corporation (2018-present) and as a member of the Board, Executive Committee, Corporate Governance Committee and Organization and Compensation Committee and as Chair of the Audit Committee of Public Service Enterprise Group, Inc. (utilities company, 2012-present) and as a member of the Board of its subsidiary company, Public Service Electric and Gas Co. (2021-present). In addition, Ms. Tomasky currently serves as a member (2009-present) and President (2020-present) of the Board of the Royal Shakespeare Company – America (2009-present), as a member of the Board of the Columbus Association for the Performing Arts (2011-present) and as a member of the Board and Kenyon in the World Committee of Kenyon College (2016-present). Previously, Ms. Tomasky served as a Member of the Advisory Board of certain Fidelity® funds (2020), as a member of the Board of the Columbus Regional Airport Authority (2007-2020), as a member of the Board (2011-2018) and Lead Independent Director (2015-2018) of Andeavor Corporation (previously Tesoro Corporation) (independent oil refiner and marketer) and as a member of the Board of Summit Midstream Partners LP (energy, 2012-2018).
Michael E. Wiley (1950)
Year of Election or Appointment: 2020
Trustee
Mr. Wiley also serves as Trustee of other Fidelity® funds. Previously, Mr. Wiley served as a member of the Advisory Board of certain Fidelity® funds (2018-2020), Chairman, President and CEO of Baker Hughes, Inc. (oilfield services, 2000-2004). Mr. Wiley also previously served as a member of the Board of Andeavor Corporation (independent oil refiner and marketer, 2005-2018), a member of the Board of Andeavor Logistics LP (natural resources logistics, 2015-2018) and a member of the Board of High Point Resources (exploration and production, 2005-2020).
+ The information includes the Trustee's principal occupation during the last five years and other information relating to the experience, attributes, and skills relevant to the Trustee's qualifications to serve as a Trustee, which led to the conclusion that the Trustee should serve as a Trustee for the fund.
Advisory Board Members and Officers:
Correspondence intended for a Member of the Advisory Board (if any) may be sent to Fidelity Investments, P.O. Box 55235, Boston, Massachusetts 02205-5235. Correspondence intended for an officer or Peter S. Lynch may be sent to Fidelity Investments, 245 Summer Street, Boston, Massachusetts 02210. Officers appear below in alphabetical order.
Name, Year of Birth; Principal Occupation
Peter S. Lynch (1944)
Year of Election or Appointment: 2003
Member of the Advisory Board
Mr. Lynch also serves as a Member of the Advisory Board of other Fidelity® funds. Mr. Lynch is Vice Chairman and a Director of Fidelity Management & Research Company LLC (investment adviser firm). In addition, Mr. Lynch serves as a Trustee of Boston College and as the Chairman of the Inner-City Scholarship Fund. Previously, Mr. Lynch served as Vice Chairman and a Director of FMR Co., Inc. (investment adviser firm) and on the Special Olympics International Board of Directors (1997-2006).
Craig S. Brown (1977)
Year of Election or Appointment: 2019
Assistant Treasurer
Mr. Brown also serves as an officer of other funds. Mr. Brown serves as Assistant Treasurer of FIMM, LLC (2021-present) and is an employee of Fidelity Investments (2013-present).
John J. Burke III (1964)
Year of Election or Appointment: 2018
Chief Financial Officer
Mr. Burke also serves as Chief Financial Officer of other funds. Mr. Burke serves as Head of Investment Operations for Fidelity Fund and Investment Operations (2018-present) and is an employee of Fidelity Investments (1998-present). Previously Mr. Burke served as head of Asset Management Investment Operations (2012-2018).
William C. Coffey (1969)
Year of Election or Appointment: 2019
Assistant Secretary
Mr. Coffey also serves as Assistant Secretary of other funds. He is Senior Vice President and Deputy General Counsel of FMR LLC (diversified financial services company, 2010-present), and is an employee of Fidelity Investments. Previously, Mr. Coffey served as Secretary and CLO of certain funds (2018-2019); CLO, Secretary, and Senior Vice President of Fidelity Management & Research Company and FMR Co., Inc. (investment adviser firms, 2018-2019); Secretary of Fidelity SelectCo, LLC and Fidelity Investments Money Management, Inc. (investment adviser firms, 2018-2019); CLO of Fidelity Management & Research (Hong Kong) Limited, FMR Investment Management (UK) Limited, and Fidelity Management & Research (Japan) Limited (investment adviser firms, 2018-2019); and Assistant Secretary of certain funds (2009-2018).
Timothy M. Cohen (1969)
Year of Election or Appointment: 2018
Vice President
Mr. Cohen also serves as Vice President of other funds. Mr. Cohen serves as Co-Head of Equity (2018-present), a Director of Fidelity Management & Research (Japan) Limited (investment adviser firm, 2016-present), and is an employee of Fidelity Investments. Previously, Mr. Cohen served as Executive Vice President of Fidelity SelectCo, LLC (2019), Head of Global Equity Research (2016-2018), Chief Investment Officer - Equity and a Director of Fidelity Management & Research (U.K.) Inc. (investment adviser firm, 2013-2015) and as a Director of Fidelity Management & Research (Hong Kong) Limited (investment adviser firm, 2017).
Jonathan Davis (1968)
Year of Election or Appointment: 2010
Assistant Treasurer
Mr. Davis also serves as an officer of other funds. Mr. Davis serves as Assistant Treasurer of FIMM, LLC (2021-present), FMR Capital, Inc. (2017-present), FD Funds GP LLC (2021-present), FD Funds Holding LLC (2021-present), and FD Funds Management LLC (2021-present); and is an employee of Fidelity Investments. Previously, Mr. Davis served as Vice President and Associate General Counsel of FMR LLC (diversified financial services company, 2003-2010).
Laura M. Del Prato (1964)
Year of Election or Appointment: 2018
Assistant Treasurer
Ms. Del Prato also serves as an officer of other funds. Ms. Del Prato serves as Assistant Treasurer of FIMM, LLC (2021-present) and is an employee of Fidelity Investments (2017-present). Previously, Ms. Del Prato served as President and Treasurer of The North Carolina Capital Management Trust: Cash Portfolio and Term Portfolio (2018-2020). Prior to joining Fidelity Investments, Ms. Del Prato served as a Managing Director and Treasurer of the JPMorgan Mutual Funds (2014-2017). Prior to JPMorgan, Ms. Del Prato served as a partner at Cohen Fund Audit Services (accounting firm, 2012-2013) and KPMG LLP (accounting firm, 2004-2012).
Colm A. Hogan (1973)
Year of Election or Appointment: 2020
Assistant Treasurer
Mr. Hogan also serves as an officer of other funds. Mr. Hogan serves as Assistant Treasurer of FIMM, LLC (2021-present) and FMR Capital, Inc. (2017-present) and is an employee of Fidelity Investments (2005-present). Previously, Mr. Hogan served as Deputy Treasurer of certain Fidelity® funds (2016-2020) and Assistant Treasurer of certain Fidelity® funds (2016-2018).
Pamela R. Holding (1964)
Year of Election or Appointment: 2018
Vice President
Ms. Holding also serves as Vice President of other funds. Ms. Holding serves as Co-Head of Equity (2018-present) and is an employee of Fidelity Investments (2013-present). Previously, Ms. Holding served as Executive Vice President of Fidelity SelectCo, LLC (2019) and as Chief Investment Officer of Fidelity Institutional Asset Management (2013-2018).
Cynthia Lo Bessette (1969)
Year of Election or Appointment: 2019
Secretary and Chief Legal Officer (CLO)
Ms. Lo Bessette also serves as an officer of other funds. Ms. Lo Bessette serves as CLO, Secretary, and Senior Vice President of Fidelity Management & Research Company LLC (investment adviser firm, 2019-present); CLO of Fidelity Management & Research (Hong Kong) Limited, FMR Investment Management (UK) Limited, and Fidelity Management & Research (Japan) Limited (investment adviser firms, 2019-present); Secretary of FD Funds GP LLC (2021-present), FD Funds Holding LLC (2021-present), and FD Funds Management LLC (2021-present); and Assistant Secretary of FIMM, LLC (2019-present). She is a Senior Vice President and Deputy General Counsel of FMR LLC (diversified financial services company, 2019-present), and is an employee of Fidelity Investments. Previously, Ms. Lo Bessette served as CLO, Secretary, and Senior Vice President of FMR Co., Inc. (investment adviser firm, 2019); Secretary of Fidelity SelectCo, LLC and Fidelity Investments Money Management, Inc. (investment adviser firms, 2019). Prior to joining Fidelity Investments, Ms. Lo Bessette was Executive Vice President, General Counsel (2016-2019) and Senior Vice President, Deputy General Counsel (2015-2016) of OppenheimerFunds (investment management company) and Deputy Chief Legal Officer (2013-2015) of Jennison Associates LLC (investment adviser firm).
Chris Maher (1972)
Year of Election or Appointment: 2020
Deputy Treasurer
Mr. Maher also serves as an officer of other funds. Mr. Maher serves as Assistant Treasurer of FIMM, LLC (2021-present) and FMR Capital, Inc. (2017-present), and is an employee of Fidelity Investments (2008-present). Previously, Mr. Maher served as Assistant Treasurer of certain funds (2013-2020); Vice President of Asset Management Compliance (2013), Vice President of the Program Management Group of FMR (investment adviser firm, 2010-2013), and Vice President of Valuation Oversight (2008-2010).
Jason P. Pogorelec (1975)
Year of Election or Appointment: 2020
Chief Compliance Officer
Mr. Pogorelec also serves as Chief Compliance Officer of other funds. Mr. Pogorelec is a senior Vice President of Asset Management Compliance for Fidelity Investments and is an employee of Fidelity Investments (2006-present). Previously, Mr. Pogorelec served as Vice President, Associate General Counsel for Fidelity Investments (2010-2020) and Assistant Secretary of certain Fidelity funds (2015-2020).
Brett Segaloff (1972)
Year of Election or Appointment: 2021
Anti-Money Laundering (AML) Officer
Mr. Segaloff also serves as an AML Officer of other funds and other related entities. He is Director, Anti-Money Laundering (2007-present) of FMR LLC (diversified financial services company) and is an employee of Fidelity Investments (1996-present).
Stacie M. Smith (1974)
Year of Election or Appointment: 2016
President and Treasurer
Ms. Smith also serves as an officer of other funds. Ms. Smith serves as Assistant Treasurer of FIMM, LLC (2021-present) and FMR Capital, Inc. (2017-present), is an employee of Fidelity Investments (2009-present), and has served in other fund officer roles. Prior to joining Fidelity Investments, Ms. Smith served as Senior Audit Manager of Ernst & Young LLP (accounting firm, 1996-2009). Previously, Ms. Smith served as Assistant Treasurer (2013-2019) and Deputy Treasurer (2013-2016) of certain Fidelity® funds.
Jim Wegmann (1979)
Year of Election or Appointment: 2019
Assistant Treasurer
Mr. Wegmann also serves as an officer of other funds. Mr. Wegmann serves as Assistant Treasurer of FIMM, LLC (2021-present) and is an employee of Fidelity Investments (2011-present). Previously, Mr. Wegmann served as Assistant Treasurer of certain Fidelity® funds (2019-2021).
Shareholder Expense Example
As a shareholder, you incur two types of costs: (1) transaction costs, which may include sales charges (loads) on purchase payments or redemption proceeds, as applicable and (2) ongoing costs, which generally include management fees, distribution and/or service (12b-1) fees and other Fund expenses. This Example is intended to help you understand your ongoing costs (in dollars) of investing in a fund and to compare these costs with the ongoing costs of investing in other mutual funds.
The Example is based on an investment of $1,000 invested at the beginning of the period and held for the entire period (February 1, 2022 to July 31, 2022).
Actual Expenses
The first line of the accompanying table provides information about actual account values and actual expenses. You may use the information in this line, together with the amount you invested, to estimate the expenses that you paid over the period. Simply divide your account value by $1,000.00 (for example, an $8,600 account value divided by $1,000.00 = 8.6), then multiply the result by the number in the first line for a class/Fund under the heading entitled "Expenses Paid During Period" to estimate the expenses you paid on your account during this period. If any fund is a shareholder of any underlying mutual funds or exchange-traded funds (ETFs) (the Underlying Funds), such fund indirectly bears its proportional share of the expenses of the Underlying Funds in addition to the direct expenses incurred presented in the table. These fees and expenses are not included in the annualized expense ratio used to calculate the expense estimate in the table below.
Hypothetical Example for Comparison Purposes
The second line of the accompanying table provides information about hypothetical account values and hypothetical expenses based on the actual expense ratio and an assumed rate of return of 5% per year before expenses, which is not the actual return. The hypothetical account values and expenses may not be used to estimate the actual ending account balance or expenses you paid for the period. You may use this information to compare the ongoing costs of investing in the Fund and other funds. To do so, compare this 5% hypothetical example with the 5% hypothetical examples that appear in the shareholder reports of the other funds. If any fund is a shareholder of any Underlying Funds, such fund indirectly bears its proportional share of the expenses of the Underlying Funds in addition to the direct expenses as presented in the table. These fees and expenses are not included in the annualized expense ratio used to calculate the expense estimate in the table below.
Please note that the expenses shown in the table are meant to highlight your ongoing costs only and do not reflect any transaction costs. Therefore, the second line of the table is useful in comparing ongoing costs only, and will not help you determine the relative total costs of owning different funds. In addition, if these transactional costs were included, your costs would have been higher.
| | Annualized Expense Ratio-A | Beginning
Account Value
February 1, 2022 | Ending
Account Value
July 31, 2022 | Expenses Paid
During Period-B
February 1, 2022
to July 31, 2022 |
| Fidelity OTC Portfolio | | | | |
| OTC | .78% | | | |
| Actual | | $1,000.00 | $831.80 | $3.54 |
| Hypothetical-C | | $1,000.00 | $1,020.93 | $3.91 |
| Class K | .69% | | | |
| Actual | | $1,000.00 | $832.50 | $3.14 |
| Hypothetical-C | | $1,000.00 | $1,021.37 | $3.46 |
A Annualized expense ratio reflects expenses net of applicable fee waivers.
B Expenses are equal to the annualized expense ratio, multiplied by the average account value over the period, multiplied by 181/ 365 (to reflect the one-half year period). The fees and expenses of any Underlying Funds are not included in each annualized expense ratio.
C 5% return per year before expenses
Distributions (Unaudited)
The dividend and capital gains distributions for the fund are available on Fidelity.com or Institutional.Fidelity.com.
The fund hereby designates as a capital gain dividend with respect to the taxable year ended July 31, 2022, $1,729,615,353, or, if subsequently determined to be different, the net capital gain of such year.
The fund designates 100% and 97.53% of the short-term capital gain dividends distributed in September and December, respectively during the fiscal year as qualifying to be taxed as short-term capital gain dividends for nonresident alien shareholders.
OTC and Class K designate 7% and 9% of the dividends distributed in September and December, respectively during the fiscal year as qualifying for the dividends–received deduction for corporate shareholders.
OTC and Class K designate 9% and 11% of the dividends distributed in September and December, respectively during the fiscal year as amounts which may be taken into account as a dividend for the purposes of the maximum rate under section 1(h)(11) of the Internal Revenue Code.
OTC and Class K designate 1% and 0% of the dividends distributed in September and December, respectively during the fiscal year as a section 199A dividend.
The fund will notify shareholders in January 2023 of amounts for use in preparing 2022 income tax returns.
Board Approval of Investment Advisory Contracts and Management Fees
Fidelity OTC Portfolio
Each year, the Board of Trustees, including the Independent Trustees (together, the Board), votes on the renewal of the management contract with Fidelity Management & Research Company LLC (FMR) and the sub-advisory agreements (together, the Advisory Contracts) for the fund. FMR and the sub-advisers are referred to herein as the Investment Advisers. The Board, assisted by the advice of fund counsel and Independent Trustees' counsel, requests and considers a broad range of information relevant to the renewal of the Advisory Contracts throughout the year.
The Board meets regularly and, at each of its meetings, covers an extensive agenda of topics and materials and considers factors that are relevant to its annual consideration of the renewal of the fund's Advisory Contracts, including the services and support provided to the fund and its shareholders. The Board has established various standing committees (Committees), each composed of and chaired by Independent Trustees with varying backgrounds, to which the Board has assigned specific subject matter responsibilities in order to enhance effective decision-making by the Board. The Board, acting directly and through its Committees, requests and receives information concerning the annual consideration of the renewal of the fund's Advisory Contracts. The Board also meets as needed to review matters specifically related to the Board's annual consideration of the renewal of the Advisory Contracts. Members of the Board may also meet with trustees of other Fidelity funds through joint ad hoc committees to discuss certain matters relevant to all of the Fidelity funds.
At its May 2022 meeting, the Board unanimously determined to renew the fund's Advisory Contracts. In reaching its determination, the Board considered all factors it believed relevant, including (i) the nature, extent, and quality of the services provided to the fund and its shareholders (including the investment performance of the fund); (ii) the competitiveness relative to peer funds of the fund's management fee and the total expense ratio of a representative class (retail class); (iii) the total costs of the services provided by and the profits realized by Fidelity from its relationships with the fund; and (iv) the extent to which, if any, economies of scale exist and are realized as the fund grows, and whether any economies of scale are appropriately shared with fund shareholders.
In considering whether to renew the Advisory Contracts for the fund, the Board reached a determination, with the assistance of fund counsel and Independent Trustees' counsel and through the exercise of its business judgment, that the renewal of the Advisory Contracts was in the best interests of the fund and its shareholders and that the compensation payable under the Advisory Contracts was fair and reasonable. The Board's decision to renew the Advisory Contracts was not based on any single factor, but rather was based on a comprehensive consideration of all the information provided to the Board at its meetings throughout the year. The Board, in reaching its determination to renew the Advisory Contracts, was aware that shareholders of the fund have a broad range of investment choices available to them, including a wide choice among funds offered by Fidelity's competitors, and that the fund's shareholders, who have the opportunity to review and weigh the disclosure provided by the fund in its prospectus and other public disclosures, have chosen to invest in this fund, which is part of the Fidelity family of funds.
Nature, Extent, and Quality of Services Provided. The Board considered Fidelity's staffing as it relates to the fund, including the backgrounds of investment personnel of Fidelity, and also considered the fund's investment objective, strategies, and related investment philosophy. The Independent Trustees also had discussions with senior management of Fidelity's investment operations and investment groups. The Board considered the structure of the investment personnel compensation program and whether this structure provides appropriate incentives to act in the best interests of the fund. Additionally, the Board considered the portfolio managers' investments, if any, in the funds that they manage. The Board also considered the steps Fidelity had taken to ensure the continued provision of high quality services to the Fidelity funds during the COVID-19 pandemic, including the expansion of staff in client facing positions to maintain service levels in periods of high volumes and volatility.
Resources Dedicated to Investment Management and Support Services. The Board and the Fund Oversight and Research Committees reviewed the general qualifications and capabilities of Fidelity's investment staff, including its size, education, experience, and resources, as well as Fidelity's approach to recruiting, training, managing, and compensating investment personnel. The Board noted the resources devoted to expansion of Fidelity's global investment organization, and that Fidelity's analysts have extensive resources, tools, and capabilities that allow them to conduct sophisticated quantitative and fundamental analysis, as well as credit analysis of issuers, counterparties, and guarantors. Further, the Board considered that Fidelity's investment professionals have sufficient access to global information and data so as to provide competitive investment results over time, and that those professionals also have access to sophisticated tools that permit them to assess portfolio construction and risk and performance attribution characteristics continuously, as well as to transmit new information and research conclusions rapidly around the world. Additionally, in its deliberations, the Board considered Fidelity's trading, risk management, compliance, and technology and operations capabilities and resources, which are integral parts of the investment management process.
Shareholder and Administrative Services. The Board considered (i) the nature, extent, quality, and cost of advisory, administrative, and shareholder services performed by the Investment Advisers and their affiliates under the Advisory Contracts and under separate agreements covering transfer agency, pricing and bookkeeping, and securities lending services for the fund; (ii) the nature and extent of the supervision of third party service providers, principally custodians, subcustodians, and pricing vendors; and (iii) the resources devoted to, and the record of compliance with, the fund's compliance policies and procedures. The Board also reviewed the allocation of fund brokerage, including allocations to brokers affiliated with the Investment Advisers, the use of brokerage commissions to pay fund expenses, and the use of "soft" commission dollars to pay for research services.
The Board noted that the growth of fund assets over time across the complex allows Fidelity to reinvest in the development of services designed to enhance the value and convenience of the Fidelity funds as investment vehicles. These services include 24-hour access to account information and market information over the Internet and through telephone representatives, investor education materials, and asset allocation tools. The Board also considered that it reviews customer service metrics such as telephone response times, continuity of services on the website and metrics addressing services at Fidelity Investor Centers.
Investment in a Large Fund Family. The Board considered the benefits to shareholders of investing in a Fidelity fund, including the benefits of investing in a fund that is part of a large family of funds offering a variety of investment disciplines and providing a large variety of mutual fund investor services. The Board noted that Fidelity had taken, or had made recommendations that resulted in the Fidelity funds taking, a number of actions over the previous year that benefited particular funds, including: (i) continuing to dedicate additional resources to Fidelity's investment research process, which includes meetings with management of issuers of securities in which the funds invest; (ii) continuing efforts to enhance Fidelity's global research capabilities; (iii) launching new funds and ETFs with innovative structures, strategies and pricing and making other enhancements to meet client needs; (iv) launching new share classes of existing funds; (v) eliminating purchase minimums and broadening eligibility requirements for certain funds and share classes; (vi) reducing management fees and total expenses for certain target date funds and classes and index funds; (vii) lowering expenses for certain existing funds and classes by implementing or lowering expense caps; (viii) rationalizing product lines and gaining increased efficiencies from fund mergers and liquidations; (ix) continuing to develop, acquire and implement systems and technology to improve services to the funds and shareholders, strengthen information security, and increase efficiency; and (x) continuing to implement enhancements to further strengthen Fidelity's product line to increase investors' probability of success in achieving their investment goals, including retirement income goals.
Investment Performance. The Board considered whether the fund has operated in accordance with its investment objective, as well as its record of compliance with its investment restrictions and its performance history. The Board noted that the fund had a portfolio manager change in January 2019. The Board will continue to monitor closely the fund's performance, taking into account the portfolio management change.
The Board took into account discussions that occur at Board meetings throughout the year with representatives of the Investment Advisers about fund investment performance. In this regard the Board noted that as part of regularly scheduled fund reviews and other reports to the Board on fund performance, the Board considers annualized return information for the fund for different time periods, measured against an appropriate securities market index (benchmark index) and an appropriate peer group of funds with similar objectives (peer group). The Board also reviews and considers information about performance attribution. In its evaluation of fund investment performance, the Board gave particular attention to information indicating changes in performance of certain Fidelity funds for specific time periods and discussed with the Investment Advisers the reasons for any overperformance or underperformance.
In addition to reviewing absolute and relative fund performance, the Independent Trustees periodically consider the appropriateness of fund performance metrics in evaluating the results achieved. In general, the Independent Trustees believe that fund performance should be evaluated based on net performance (after fees and expenses) of the representative class, compared to appropriate benchmark indices, over appropriate time periods that may include full market cycles, and compared to peer groups, as applicable, over the same periods, taking into account relevant factors including the following: general market conditions; issuer-specific information; and fund cash flows and other factors.
The Independent Trustees recognize that shareholders evaluate performance on a net basis over their own holding periods, for which one-, three-, and five-year periods are often used as a proxy. For this reason, the performance information reviewed by the Board also included net cumulative total return information for the fund and an appropriate benchmark index and peer group for the most recent one-, three-, and five-year periods ended September 30, 2021, as shown below. Returns are shown compared to the 25th percentile (top of box, 75% beaten) and 75th percentile (bottom of box, 25% beaten) of the peer universe.
Fidelity OTC Portfolio

The Board also considered that the fund's management fee is subject to upward or downward adjustment depending upon whether, and to what extent, the fund's investment performance for the performance period (a rolling 36-month period) exceeds, or is exceeded by, a securities index, thus leading to a performance adjustment for the same period. The Board noted that the performance adjustment provides FMR with a strong economic incentive to seek to achieve superior long-term performance for the fund's shareholders and helps to more closely align the interests of FMR and the shareholders of the fund.
Based on its review, the Board concluded that the nature, extent, and quality of services provided to the fund under the Advisory Contracts should continue to benefit the shareholders of the fund.
Competitiveness of Management Fee and Total Expense Ratio. The Board considered the fund's management fee and total expense ratio compared to "mapped groups" of competitive funds and classes created for the purpose of facilitating the Trustees' competitive analysis of management fees and total expenses. Fidelity creates "mapped groups" by combining similar Lipper investment objective categories that have comparable investment mandates. Combining Lipper investment objective categories aids the Board's management fee and total expense ratio comparisons by broadening the competitive group used for comparison.
Management Fee. The Board considered two proprietary management fee comparisons for the 12-month periods ended September 30 (June 30 for periods ended 2019 and 2018 and December 31 for periods prior to 2018) shown in basis points (BP) in the chart below. The group of Lipper funds used by the Board for management fee comparisons is referred to below as the "Total Mapped Group." The Total Mapped Group comparison focuses on a fund's standing in terms of gross management fees before expense reimbursements or caps, and without giving effect to the fund's performance adjustment, relative to the total universe of funds with comparable investment mandates, regardless of whether their management fee structures also are comparable. Funds with comparable investment mandates offer exposure to similar types of securities. Funds with comparable management fee structures have similar management fee contractual arrangements (
e.g., flat rate charged for advisory services, all-inclusive fee rate,
etc.). "TMG %" represents the percentage of funds in the Total Mapped Group that had management fees that were lower than the fund's. For example, a hypothetical TMG % of 20% would mean that 80% of the funds in the Total Mapped Group had higher, and 20% had lower, management fees than the fund. The fund's actual TMG %s and the number of funds in the Total Mapped Group are in the chart below. The "Asset-Sized Peer Group" (ASPG) comparison focuses on a fund's standing relative to a subset of non-Fidelity funds within the Total Mapped Group that are similar in size and management fee structure without taking into account performance adjustments, if any. For example, if a fund is in the first quartile of the ASPG, the fund's management fee ranks in the least expensive or lowest 25% of funds in the ASPG. The ASPG represents at least 15% of the funds in the Total Mapped Group with comparable asset size and management fee structures, subject to a minimum of 50 funds (or all funds in the Total Mapped Group if fewer than 50). Additional information, such as the ASPG quartile in which the fund's management fee rate ranked and the impact of the fund's performance adjustment, is also included in the chart and was considered by the Board.
Fidelity OTC Portfolio
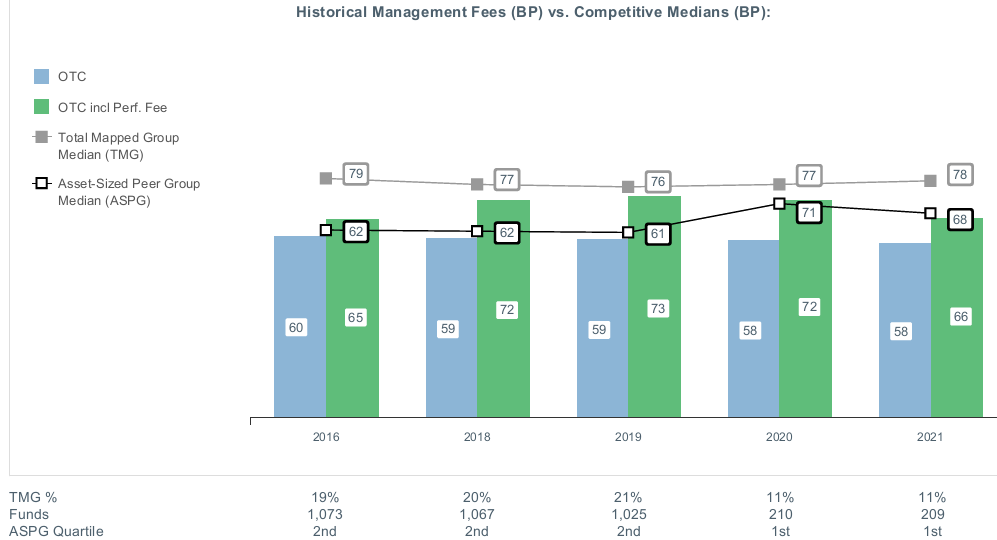
The Board noted that the fund's management fee rate ranked below the median of its Total Mapped Group and below the median of its ASPG for the 12-month period ended September 30, 2021. The Board also noted the effect of the fund's performance adjustment, if any, on the fund's management fee ranking.
The Board also considered that, for funds subject to the group fee, FMR agreed to voluntarily waive fees over a specified period of time in amounts designed to account for assets converted from certain funds to certain collective investment trusts.
Based on its review, the Board concluded that the fund's management fee is fair and reasonable in light of the services that the fund receives and the other factors considered.
Total Expense Ratio. In its review of the total expense ratio of the representative class (retail class), the Board considered the fund's management fee rate as well as other fund or class expenses, as applicable, such as transfer agent fees, pricing and bookkeeping fees, and custodial, legal, and audit fees. The Board noted the impact of the fund's performance adjustment. The Board also noted that Fidelity may agree to waive fees or reimburse expenses from time to time, and the extent to which, if any, it has done so for the fund. The fund's representative class is compared to those funds and classes in the Total Mapped Group (used by the Board for management fee comparisons) that have a similar sales load structure. The Board also considered a total expense ASPG comparison, which focuses on the total expenses of the representative class relative to a subset of non-Fidelity funds within the total expense similar sales load structure group. The total expense ASPG is limited to 15 larger and 15 smaller classes in fund average assets for a total of 30 classes, where possible. The total expense ASPG comparison excludes performance adjustments and fund-paid 12b-1 fees to eliminate variability in fee structures.
The Board noted that the total net expense ratio of the retail class ranked below the similar sales load structure group competitive median and below the ASPG competitive median for the 12-month period ended September 30, 2021.
Fees Charged to Other Fidelity Clients. The Board also considered Fidelity fee structures and other information with respect to clients of Fidelity, such as other funds advised or subadvised by Fidelity, pension plan clients, and other institutional clients with similar mandates. The Board noted that a joint ad hoc committee created by it and the boards of other Fidelity funds periodically reviews and compares Fidelity's institutional investment advisory business with its business of providing services to the Fidelity funds and also noted the most recent findings of the committee. The Board noted that the committee's review included a consideration of the differences in services provided, fees charged, and costs incurred, as well as competition in the markets serving the different categories of clients.
Based on its review of total expense ratios and fees charged to other Fidelity clients, the Board concluded that the total expense ratio of each class of the fund was reasonable in light of the services that the fund and its shareholders receive and the other factors considered.
Costs of the Services and Profitability. The Board considered the revenues earned and the expenses incurred by Fidelity in conducting the business of developing, marketing, distributing, managing, administering and servicing the fund and servicing the fund's shareholders. The Board also considered the level of Fidelity's profits in respect of all the Fidelity funds.
On an annual basis, Fidelity presents to the Board information about the profitability of its relationships with the fund. Fidelity calculates profitability information for each fund, as well as aggregate profitability information for groups of Fidelity funds and all Fidelity funds, using a series of detailed revenue and cost allocation methodologies which originate with the books and records of Fidelity on which Fidelity's audited financial statements are based. The Audit Committee of the Board reviews any significant changes from the prior year's methodologies and the full Board approves such changes.
A public accounting firm has been engaged annually by the Board as part of the Board's assessment of Fidelity's profitability analysis. The engagement includes the review and assessment of the methodologies used by Fidelity in determining the revenues and expenses attributable to Fidelity's mutual fund business, and completion of agreed-upon procedures in respect of the mathematical accuracy of certain fund profitability information and its conformity to established allocation methodologies. After considering the reports issued under the engagement and information provided by Fidelity, the Board concluded that while other allocation methods may also be reasonable, Fidelity's profitability methodologies are reasonable in all material respects.
The Board also reviewed Fidelity's non-fund businesses and potential indirect benefits such businesses may have received as a result of their association with Fidelity's mutual fund business (i.e., fall-out benefits) as well as cases where Fidelity's affiliates may benefit from the funds' business. The Board considered areas where potential indirect benefits to the Fidelity funds from their relationships with Fidelity may exist. The Board's consideration of these matters was informed by the findings of a joint ad hoc committee created by it and the boards of other Fidelity funds to evaluate potential fall-out benefits.
The Board considered the costs of the services provided by and the profits realized by Fidelity in connection with the operation of the fund and was satisfied that the profitability was not excessive.
Economies of Scale. The Board considered whether there have been economies of scale in respect of the management of the Fidelity funds, whether the Fidelity funds (including the fund) have appropriately benefited from any such economies of scale, and whether there is potential for realization of any further economies of scale. The Board considered the extent to which the fund will benefit from economies of scale as assets grow through increased services to the fund, through waivers or reimbursements, or through fee or expense ratio reductions. The Board also noted that a committee (the Economies of Scale Committee) created by it and the boards of other Fidelity funds periodically analyzes whether Fidelity attains economies of scale in respect of the management and servicing of the Fidelity funds, whether the Fidelity funds have appropriately benefited from such economies of scale, and whether there is potential for realization of any further economies of scale.
The Board recognized that the fund's management contract incorporates a "group fee" structure, which provides for lower group fee rates as total "group assets" increase, and for higher group fee rates as total "group assets" decrease ("group assets" as defined in the management contract). FMR calculates the group fee rates based on a tiered asset "breakpoint" schedule that varies based on asset class. The Board considered that the group fee is designed to deliver the benefits of economies of scale to fund shareholders when total Fidelity fund assets increase, even if assets of any particular fund are unchanged or have declined, because some portion of Fidelity's costs are attributable to services provided to all Fidelity funds, and all funds benefit if those costs can be allocated among more assets. The Board further considered that Fidelity agreed to impose a temporary fee waiver in the form of additional breakpoints to the current breakpoint schedule. The Board concluded that, given the group fee structure, fund shareholders will benefit from lower management fees as "group assets" increase at the fund complex level, regardless of whether Fidelity achieves any such economies of scale.
The Board concluded, taking into account the analysis of the Economies of Scale Committee, that economies of scale, if any, are being appropriately shared between fund shareholders and Fidelity.
Additional Information Requested by the Board. In order to develop fully the factual basis for consideration of the Fidelity funds' advisory contracts, the Board requested and received additional information on certain topics, including: (i) fund flow and performance trends, in particular the underperformance of certain funds and strategies, and Fidelity's long-term strategies for certain funds, including any consideration of fund liquidations or mergers; (ii) the operation of performance fees, competitor use of performance fees, and consideration of the expansion of performance fees to additional funds; (iii) Fidelity's pricing philosophy compared to competitors; (iv) fund profitability methodology and data; (v) evaluation of competitive fund data and peer group classifications and fee and expense comparisons; (vi) the management fee and expense structures for different funds and classes and information about the differences between various fee and expense structures; (vii) group fee breakpoints and related voluntary fee waivers; and (viii) information regarding other accounts managed by Fidelity and the funds' sub-advisory arrangements.
Based on its evaluation of all of the conclusions noted above, and after considering all factors it believed relevant, the Board concluded that the advisory fee arrangements are fair and reasonable and that the fund's Advisory Contracts should be renewed.
Liquidity Risk Management Program
The Securities and Exchange Commission adopted Rule 22e-4 under the Investment Company Act of 1940 (the Liquidity Rule) to promote effective liquidity risk management throughout the open-end investment company industry, thereby reducing the risk that funds will be unable to meet their redemption obligations and mitigating dilution of the interests of fund shareholders.
The Fund has adopted and implemented a liquidity risk management program pursuant to the Liquidity Rule (the Program) effective December 1, 2018. The Program is reasonably designed to assess and manage the Fund’s liquidity risk and to comply with the requirements of the Liquidity Rule. The Fund’s Board of Trustees (the Board) has designated the Fund’s investment adviser as administrator of the Program. The Fidelity advisers have established a Liquidity Risk Management Committee (the LRM Committee) to manage the Program for each of the Fidelity Funds. The LRM Committee monitors the adequacy and effectiveness of implementation of the Program and on a periodic basis assesses each Fund’s liquidity risk based on a variety of factors including (1) the Fund’s investment strategy, (2) portfolio liquidity and cash flow projections during normal and reasonably foreseeable stressed conditions, (3) shareholder redemptions, (4) borrowings and other funding sources and (5) in the case of exchange-traded funds, certain additional factors including the effect of the Fund’s prices and spreads, market participants, and basket compositions on the overall liquidity of the Fund’s portfolio, as applicable.
In accordance with the Program, each of the Fund’s portfolio investments is classified into one of four liquidity categories described below based on a determination of a reasonable expectation for how long it would take to convert the investment to cash (or sell or dispose of the investment) without significantly changing its market value.
- Highly liquid investments – cash or convertible to cash within three business days or less
- Moderately liquid investments – convertible to cash in three to seven calendar days
- Less liquid investments – can be sold or disposed of, but not settled, within seven calendar days
- Illiquid investments – cannot be sold or disposed of within seven calendar days
Liquidity classification determinations take into account a variety of factors including various market, trading and investment-specific considerations, as well as market depth, and generally utilize analysis from a third-party liquidity metrics service.
The Liquidity Rule places a 15% limit on a fund’s illiquid investments and requires funds that do not primarily hold assets that are highly liquid investments to determine and maintain a minimum percentage of the fund’s net assets to be invested in highly liquid investments (highly liquid investment minimum or HLIM). The Program includes provisions reasonably designed to comply with the 15% limit on illiquid investments and for determining, periodically reviewing and complying with the HLIM requirement as applicable.
At a recent meeting of the Fund’s Board of Trustees, the LRM Committee provided a written report to the Board pertaining to the operation, adequacy, and effectiveness of implementation of the Program for the annual period from December 1, 2020 through November 30, 2021. The report concluded that the Program has been implemented and is operating effectively and is reasonably designed to assess and manage the Fund’s liquidity risk.
OTC-ANN-0922
1.536191.125
Fidelity® OTC K6 Portfolio
Annual Report
July 31, 2022
Contents
To view a fund's proxy voting guidelines and proxy voting record for the 12-month period ended June 30, visit http://www.fidelity.com/proxyvotingresults or visit the Securities and Exchange Commission's (SEC) web site at http://www.sec.gov.
You may also call 1-800-835-5092 to request a free copy of the proxy voting guidelines.
Standard & Poor's, S&P and S&P 500 are registered service marks of The McGraw-Hill Companies, Inc. and have been licensed for use by Fidelity Distributors Corporation.
Other third-party marks appearing herein are the property of their respective owners.
All other marks appearing herein are registered or unregistered trademarks or service marks of FMR LLC or an affiliated company. © 2022 FMR LLC. All rights reserved.
This report and the financial statements contained herein are submitted for the general information of the shareholders of the Fund. This report is not authorized for distribution to prospective investors in the Fund unless preceded or accompanied by an effective prospectus.
A fund files its complete schedule of portfolio holdings with the SEC for the first and third quarters of each fiscal year on Form N-PORT. Forms N-PORT are available on the SEC’s web site at http://www.sec.gov. A fund's Forms N-PORT may be reviewed and copied at the SEC’s Public Reference Room in Washington, DC. Information regarding the operation of the SEC's Public Reference Room may be obtained by calling 1-800-SEC-0330.
For a complete list of a fund's portfolio holdings, view the most recent holdings listing, semiannual report, or annual report on Fidelity's web site at http://www.fidelity.com, http://www.institutional.fidelity.com, or http://www.401k.com, as applicable.
NOT FDIC INSURED •MAY LOSE VALUE •NO BANK GUARANTEE
Neither the Fund nor Fidelity Distributors Corporation is a bank.
Note to Shareholders:
Early in 2020, the outbreak and spread of COVID-19 emerged as a public health emergency that had a major influence on financial markets, primarily based on its impact on the global economy and corporate earnings. On March 11, 2020, the World Health Organization declared the COVID-19 outbreak a pandemic, citing sustained risk of further global spread. The pandemic prompted a number of measures to limit the spread of COVID-19, including travel and border restrictions, quarantines, and restrictions on large gatherings. In turn, these resulted in lower consumer activity, diminished demand for a wide range of products and services, disruption in manufacturing and supply chains, and – given the wide variability in outcomes regarding the outbreak – significant market uncertainty and volatility. To help stem the turmoil, the U.S. government took unprecedented action – in concert with the U.S. Federal Reserve and central banks around the world – to help support consumers, businesses, and the broader economy, and to limit disruption to the financial system.
In general, the overall impact of the pandemic lessened in 2021, amid a resilient economy and widespread distribution of three COVID-19 vaccines granted emergency use authorization from the U.S. Food and Drug Administration (FDA) early in the year. Still, the situation remains dynamic, and the extent and duration of its influence on financial markets and the economy is highly uncertain, due in part to a recent spike in cases based on highly contagious variants of the coronavirus.
Extreme events such as the COVID-19 crisis are exogenous shocks that can have significant adverse effects on mutual funds and their investments. Although multiple asset classes may be affected by market disruption, the duration and impact may not be the same for all types of assets. Fidelity is committed to helping you stay informed amid news about COVID-19 and during increased market volatility, and we continue to take extra steps to be responsive to customer needs. We encourage you to visit us online, where we offer ongoing updates, commentary, and analysis on the markets and our funds.
Performance: The Bottom Line
Average annual total return reflects the change in the value of an investment, assuming reinvestment of distributions from dividend income and capital gains (the profits earned upon the sale of securities that have grown in value, if any) and assuming a constant rate of performance each year. The hypothetical investment and the average annual total returns do not reflect the deduction of taxes that a shareholder would pay on fund distributions or the redemption of fund shares. During periods of reimbursement by Fidelity, a fund’s total return will be greater than it would be had the reimbursement not occurred. How a fund did yesterday is no guarantee of how it will do tomorrow.
Average Annual Total Returns
| For the periods ended July 31, 2022 | Past 1 year | Life of fundA |
| Fidelity® OTC K6 Portfolio | (20.27)% | 17.00% |
A From June 13, 2019
$10,000 Over Life of Fund
Let's say hypothetically that $10,000 was invested in Fidelity® OTC K6 Portfolio on June 13, 2019, when the fund started.
The chart shows how the value of your investment would have changed, and also shows how the Nasdaq Composite Index® performed over the same period.

| Period Ending Values |
| $16,358 | Fidelity® OTC K6 Portfolio |
| $16,213 | Nasdaq Composite Index® |
Management's Discussion of Fund Performance
Market Recap: The S&P 500
® index returned -4.64% for the 12 months ending July 31, 2022, as a multitude of crosscurrents challenged the global economy and financial markets. Persistently high inflation, exacerbated by energy price shocks from the Russia–Ukraine conflict, spurred the U.S. Federal Reserve to hike interest rates more aggressively than anticipated, and concerns about the outlook for economic growth sent stocks into bear market territory. In early May, the Fed approved a rare half-percentage-point interest rate increase and announced plans to shrink its $9 trillion asset portfolio. June began with the Fed allowing up to billions in Treasuries and mortgage bonds to mature every month without investing the proceeds. Two weeks later, the central bank raised rates by 0.75 percentage points, its largest increase since 1994, and said it was becoming more difficult to achieve a soft landing, in which the economy slows enough to bring down inflation while avoiding a recession. Against this volatile backdrop, the S&P 500
® posted its worst first-half result (-19.96%) to begin a year since 1970. Stocks sharply reversed course in July (+9.22%), as the Fed again raised its benchmark interest rate by 0.75% but signaled that, at some point, it will likely slow the pace of tightening to assess the impact on the economy. For the full 12 months, growth-oriented communication services (-29%) and consumer discretionary (-10%) stocks lagged most. In contrast, energy (+67%) rode a surge in commodity prices and led by a wide margin, followed by the defensive utilities (+16%) and consumer staples (+7%) sectors.
Comments from Portfolio Manager Christopher Lin: For the fiscal year ending July 31, 2022, the fund returned -20.27%, trailing the -14.95% result of the benchmark NASDAQ Composite Index. The largest detractors from performance versus the benchmark were stock picks and an overweighting in the communication services sector, primarily within the media & entertainment industry. Weak security selection among consumer discretionary and energy firms also hurt. An underweighting in Tesla, a stake we established this period, proved to be the fund's biggest individual relative detractor, gaining roughly 10% the past 12 months. Shares of Snap returned -87% and further pressured performance, although we added to our non-benchmark position in the company during the period. The fund's non-benchmark stake in Twitter, one of our largest holdings, returned -40% and also detracted meaningfully. In contrast, the biggest contributor to performance versus the benchmark was an overweighting in energy. An underweighting and investment choices in health care also lifted the fund's relative result. Our non-benchmark exposure to Reliance Industries was the fund's top individual relative contributor, driven by a rise of about 15%. This was among the fund's biggest holdings at the end of the period. Also bolstering performance was an underweighting in PayPal, which returned roughly -69% and where we meaningfully decreased our stake this period. Nvidia returned about -8% the past year and boosted relative performance as well, although we significantly reduced our position here as well. Notable changes in positioning include increased exposure to the energy, consumer staples and health care sectors, and a lower allocation to communication services stocks.
The views expressed above reflect those of the portfolio manager(s) only through the end of the period as stated on the cover of this report and do not necessarily represent the views of Fidelity or any other person in the Fidelity organization. Any such views are subject to change at any time based upon market or other conditions and Fidelity disclaims any responsibility to update such views. These views may not be relied on as investment advice and, because investment decisions for a Fidelity fund are based on numerous factors, may not be relied on as an indication of trading intent on behalf of any Fidelity fund.
Investment Summary (Unaudited)
Top Ten Stocks as of July 31, 2022
| | % of fund's net assets |
| Apple, Inc. | 13.5 |
| Microsoft Corp. | 12.3 |
| Amazon.com, Inc. | 5.9 |
| Alphabet, Inc. Class A | 5.2 |
| Alphabet, Inc. Class C | 3.4 |
| Meta Platforms, Inc. Class A | 2.8 |
| Marvell Technology, Inc. | 2.6 |
| Comcast Corp. Class A | 1.9 |
| Twitter, Inc. | 1.8 |
| Reliance Industries Ltd. | 1.8 |
| | 51.2 |
Market Sectors as of July 31, 2022
| | % of fund's net assets |
| Information Technology | 43.1 |
| Communication Services | 19.5 |
| Consumer Discretionary | 14.6 |
| Health Care | 8.9 |
| Energy | 4.8 |
| Consumer Staples | 4.7 |
| Financials | 2.1 |
| Industrials | 1.3 |
| Real Estate | 0.1 |
Asset Allocation (% of fund's net assets)
| As of July 31, 2022 * |
| | Stocks | 98.4% |
| | Convertible Securities | 0.7% |
| | Short-Term Investments and Net Other Assets (Liabilities) | 0.9% |

* Foreign investments - 10.7%
Geographic Diversification (% of fund's net assets)
| As of July 31, 2022 |
| | United States of America* | 89.3% |
| | Cayman Islands | 2.4% |
| | India | 2.3% |
| | Netherlands | 1.6% |
| | Taiwan | 1.3% |
| | United Kingdom | 1.1% |
| | France | 0.8% |
| | Curacao | 0.5% |
| | Norway | 0.2% |
| | Other | 0.5% |

* Includes Short-Term investments and Net Other Assets (Liabilities).
Percentages are based on country or territory of incorporation and are adjusted for the effect of futures contracts, if applicable.
Schedule of Investments July 31, 2022
Showing Percentage of Net Assets
| Common Stocks - 98.1% | | | |
| | | Shares | Value |
| COMMUNICATION SERVICES - 19.3% | | | |
| Entertainment - 1.3% | | | |
| Activision Blizzard, Inc. | | 56,850 | $4,545,158 |
| Electronic Arts, Inc. | | 186 | 24,409 |
| NetEase, Inc. ADR | | 1,234 | 114,737 |
| Netflix, Inc. (a) | | 91,087 | 20,485,466 |
| Take-Two Interactive Software, Inc. (a) | | 1,760 | 233,605 |
| | | | 25,403,375 |
| Interactive Media & Services - 14.7% | | | |
| Alphabet, Inc.: | | | |
| Class A (a) | | 863,780 | 100,474,890 |
| Class C (a) | | 552,380 | 64,429,603 |
| Match Group, Inc. (a) | | 21,562 | 1,580,710 |
| Meta Platforms, Inc. Class A (a) | | 332,941 | 52,970,913 |
| Snap, Inc. Class A (a) | | 954,581 | 9,431,260 |
| Taboola.com Ltd. (a)(b) | | 463,490 | 1,214,344 |
| Tencent Holdings Ltd. | | 16,852 | 651,310 |
| Tencent Holdings Ltd. sponsored ADR (b) | | 379,422 | 14,668,455 |
| Twitter, Inc. (a) | | 850,691 | 35,397,253 |
| Vimeo, Inc. (a) | | 26,756 | 148,763 |
| Yandex NV Series A (a)(b)(c) | | 253,404 | 869,135 |
| | | | 281,836,636 |
| Media - 3.3% | | | |
| Charter Communications, Inc. Class A (a) | | 64,344 | 27,803,042 |
| Comcast Corp. Class A | | 950,827 | 35,675,029 |
| | | | 63,478,071 |
| Wireless Telecommunication Services - 0.0% | | | |
| T-Mobile U.S., Inc. (a) | | 5,854 | 837,473 |
|
| TOTAL COMMUNICATION SERVICES | | | 371,555,555 |
|
| CONSUMER DISCRETIONARY - 14.2% | | | |
| Automobiles - 0.5% | | | |
| Rivian Automotive, Inc. | | 1,343 | 46,065 |
| Tesla, Inc. (a) | | 9,847 | 8,778,108 |
| | | | 8,824,173 |
| Hotels, Restaurants & Leisure - 1.3% | | | |
| Airbnb, Inc. Class A (a) | | 30,876 | 3,426,618 |
| Churchill Downs, Inc. | | 97,628 | 20,482,354 |
| Marriott International, Inc. Class A | | 4,180 | 663,868 |
| Vail Resorts, Inc. | | 1,766 | 418,772 |
| Wynn Resorts Ltd. (a) | | 9,969 | 632,832 |
| | | | 25,624,444 |
| Internet & Direct Marketing Retail - 7.6% | | | |
| Alibaba Group Holding Ltd. sponsored ADR (a) | | 104,995 | 9,383,403 |
| Amazon.com, Inc. (a) | | 840,137 | 113,376,488 |
| ContextLogic, Inc. (a)(b) | | 18,385 | 27,578 |
| Etsy, Inc. (a) | | 12,206 | 1,266,006 |
| Global-e Online Ltd. (a)(b) | | 18,447 | 419,854 |
| JD.com, Inc. Class A | | 791 | 23,598 |
| Meituan Class B (a)(d) | | 620,977 | 13,930,597 |
| Pinduoduo, Inc. ADR (a) | | 143,946 | 7,054,793 |
| thredUP, Inc. (a) | | 8,053 | 18,119 |
| Zomato Ltd. (a) | | 368,500 | 218,785 |
| | | | 145,719,221 |
| Multiline Retail - 0.2% | | | |
| Dollar Tree, Inc. (a) | | 25,372 | 4,195,514 |
| Specialty Retail - 2.5% | | | |
| Five Below, Inc. (a) | | 91,871 | 11,674,048 |
| Lowe's Companies, Inc. | | 82,309 | 15,764,643 |
| Ross Stores, Inc. | | 221,023 | 17,960,329 |
| TJX Companies, Inc. | | 30,182 | 1,845,931 |
| | | | 47,244,951 |
| Textiles, Apparel & Luxury Goods - 2.1% | | | |
| Kontoor Brands, Inc. | | 507 | 18,506 |
| lululemon athletica, Inc. (a) | | 76,890 | 23,875,114 |
| LVMH Moet Hennessy Louis Vuitton SE | | 23,119 | 16,052,789 |
| NIKE, Inc. Class B | | 9,001 | 1,034,395 |
| | | | 40,980,804 |
|
| TOTAL CONSUMER DISCRETIONARY | | | 272,589,107 |
|
| CONSUMER STAPLES - 4.7% | | | |
| Beverages - 3.2% | | | |
| Diageo PLC | | 236,697 | 11,212,778 |
| Keurig Dr. Pepper, Inc. | | 577,585 | 22,375,643 |
| Monster Beverage Corp. (a) | | 222,695 | 22,184,876 |
| The Coca-Cola Co. | | 75,466 | 4,842,653 |
| | | | 60,615,950 |
| Food & Staples Retailing - 0.3% | | | |
| Costco Wholesale Corp. | | 10,554 | 5,712,880 |
| Food Products - 1.2% | | | |
| Mondelez International, Inc. | | 360,974 | 23,116,775 |
| Personal Products - 0.0% | | | |
| The Honest Co., Inc. (a) | | 524 | 1,750 |
|
| TOTAL CONSUMER STAPLES | | | 89,447,355 |
|
| ENERGY - 4.8% | | | |
| Energy Equipment & Services - 1.2% | | | |
| Halliburton Co. | | 313,127 | 9,174,621 |
| Schlumberger Ltd. | | 279,497 | 10,349,774 |
| TGS ASA ADR | | 210,865 | 3,122,036 |
| | | | 22,646,431 |
| Oil, Gas & Consumable Fuels - 3.6% | | | |
| Cenovus Energy, Inc. (Canada) | | 13,282 | 253,079 |
| Diamondback Energy, Inc. | | 120,187 | 15,386,340 |
| EOG Resources, Inc. | | 1,059 | 117,782 |
| Hess Corp. | | 87,035 | 9,788,826 |
| Reliance Industries Ltd. | | 1,073,613 | 34,106,928 |
| Reliance Industries Ltd. sponsored GDR (d) | | 159,544 | 10,067,226 |
| | | | 69,720,181 |
|
| TOTAL ENERGY | | | 92,366,612 |
|
| FINANCIALS - 1.8% | | | |
| Banks - 1.8% | | | |
| Bank of America Corp. | | 167,500 | 5,663,175 |
| Fifth Third Bancorp | | 260,241 | 8,879,423 |
| Huntington Bancshares, Inc. | | 1,137,683 | 15,119,807 |
| Wells Fargo & Co. | | 108,900 | 4,777,443 |
| Wintrust Financial Corp. | | 3,262 | 280,662 |
| | | | 34,720,510 |
| Capital Markets - 0.0% | | | |
| S&P Global, Inc. | | 165 | 62,193 |
|
| TOTAL FINANCIALS | | | 34,782,703 |
|
| HEALTH CARE - 8.9% | | | |
| Biotechnology - 4.9% | | | |
| Alnylam Pharmaceuticals, Inc. (a) | | 125,028 | 17,758,977 |
| Amgen, Inc. | | 98,973 | 24,492,848 |
| Arcutis Biotherapeutics, Inc. (a) | | 62,705 | 1,521,223 |
| Ascendis Pharma A/S sponsored ADR (a) | | 23,618 | 2,020,048 |
| ChemoCentryx, Inc. (a) | | 22,321 | 527,222 |
| GenSight Biologics SA (a)(b) | | 17,030 | 48,039 |
| Ionis Pharmaceuticals, Inc. (a) | | 2,582 | 96,980 |
| Regeneron Pharmaceuticals, Inc. (a) | | 47,620 | 27,700,078 |
| Relay Therapeutics, Inc. (a) | | 131,168 | 2,494,815 |
| Trevena, Inc. (a)(b) | | 35,814 | 8,885 |
| Vertex Pharmaceuticals, Inc. (a) | | 56,200 | 15,759,042 |
| Xencor, Inc. (a) | | 102,767 | 2,948,385 |
| | | | 95,376,542 |
| Health Care Equipment & Supplies - 1.1% | | | |
| DexCom, Inc. (a) | | 53,380 | 4,381,430 |
| Figs, Inc. Class A (a) | | 4,223 | 44,637 |
| Insulet Corp. (a) | | 62,941 | 15,596,780 |
| Neuronetics, Inc. (a)(b) | | 3,103 | 12,940 |
| Outset Medical, Inc. (a) | | 3,376 | 52,159 |
| Pulmonx Corp. (a) | | 3,128 | 53,301 |
| Tandem Diabetes Care, Inc. (a) | | 16,278 | 1,077,766 |
| | | | 21,219,013 |
| Health Care Providers & Services - 1.2% | | | |
| agilon health, Inc. (a) | | 40,409 | 1,011,437 |
| Cigna Corp. | | 6,802 | 1,872,999 |
| Guardant Health, Inc. (a) | | 180,525 | 9,056,939 |
| Humana, Inc. | | 22,328 | 10,762,096 |
| | | | 22,703,471 |
| Health Care Technology - 0.0% | | | |
| Certara, Inc. (a) | | 22,712 | 522,149 |
| Life Sciences Tools & Services - 1.2% | | | |
| 10X Genomics, Inc. (a) | | 62,422 | 2,506,243 |
| Bruker Corp. | | 217,279 | 14,894,475 |
| Illumina, Inc. (a) | | 3,377 | 731,728 |
| Nanostring Technologies, Inc. (a) | | 236,169 | 3,022,963 |
| Olink Holding AB ADR (a) | | 99,889 | 1,343,507 |
| Seer, Inc. (a) | | 62,395 | 561,555 |
| | | | 23,060,471 |
| Pharmaceuticals - 0.5% | | | |
| AstraZeneca PLC sponsored ADR | | 133,231 | 8,823,889 |
| Elanco Animal Health, Inc. (a) | | 7,107 | 143,988 |
| TherapeuticsMD, Inc. (a) | | 551 | 3,433 |
| | | | 8,971,310 |
|
| TOTAL HEALTH CARE | | | 171,852,956 |
|
| INDUSTRIALS - 1.3% | | | |
| Airlines - 0.0% | | | |
| Wheels Up Experience, Inc. Class A (a) | | 75,873 | 169,956 |
| Professional Services - 1.2% | | | |
| Equifax, Inc. | | 15,141 | 3,163,106 |
| Verisk Analytics, Inc. | | 106,653 | 20,290,733 |
| | | | 23,453,839 |
| Road & Rail - 0.1% | | | |
| Canadian Pacific Railway Ltd. | | 12,600 | 993,762 |
| CSX Corp. | | 22,916 | 740,874 |
| | | | 1,734,636 |
|
| TOTAL INDUSTRIALS | | | 25,358,431 |
|
| INFORMATION TECHNOLOGY - 43.0% | | | |
| Communications Equipment - 0.4% | | | |
| Cisco Systems, Inc. | | 157,051 | 7,125,404 |
| IT Services - 3.0% | | | |
| Gartner, Inc. (a) | | 100,639 | 26,717,642 |
| MasterCard, Inc. Class A | | 78,620 | 27,814,970 |
| MongoDB, Inc. Class A (a) | | 3,538 | 1,105,519 |
| PayPal Holdings, Inc. (a) | | 14,582 | 1,261,780 |
| Twilio, Inc. Class A (a) | | 10,047 | 851,986 |
| | | | 57,751,897 |
| Semiconductors & Semiconductor Equipment - 9.6% | | | |
| Advanced Micro Devices, Inc. (a) | | 103,201 | 9,749,398 |
| Analog Devices, Inc. | | 19,514 | 3,355,627 |
| Applied Materials, Inc. | | 125,157 | 13,264,139 |
| ASML Holding NV | | 38,297 | 21,999,329 |
| Lam Research Corp. | | 24,513 | 12,269,002 |
| Marvell Technology, Inc. | | 887,659 | 49,424,853 |
| NVIDIA Corp. | | 154,663 | 28,091,441 |
| NXP Semiconductors NV | | 47,389 | 8,713,889 |
| Skyworks Solutions, Inc. | | 8,801 | 958,253 |
| SolarEdge Technologies, Inc. (a) | | 7,500 | 2,700,975 |
| Taiwan Semiconductor Manufacturing Co. Ltd. sponsored ADR | | 274,822 | 24,316,251 |
| Texas Instruments, Inc. | | 50,600 | 9,051,834 |
| | | | 183,894,991 |
| Software - 16.4% | | | |
| Adobe, Inc. (a) | | 21,073 | 8,642,459 |
| ANSYS, Inc. (a) | | 16,375 | 4,568,461 |
| Aspen Technology, Inc. (a) | | 82,080 | 16,751,707 |
| Autodesk, Inc. (a) | | 34,074 | 7,370,888 |
| Cadence Design Systems, Inc. (a) | | 77,305 | 14,384,914 |
| CCC Intelligent Solutions Holdings, Inc. Class A (a)(b) | | 348,682 | 3,483,333 |
| Dropbox, Inc. Class A (a) | | 20,395 | 463,782 |
| Duck Creek Technologies, Inc. (a) | | 2,014 | 27,793 |
| Dynatrace, Inc. (a) | | 3,380 | 127,189 |
| Epic Games, Inc. (a)(c)(e) | | 5,200 | 4,836,000 |
| HIVE Blockchain Technologies Ltd. (a)(b) | | 41,555 | 187,566 |
| Intuit, Inc. | | 26,811 | 12,230,374 |
| Microsoft Corp. | | 840,058 | 235,837,883 |
| Salesforce.com, Inc. (a) | | 6,086 | 1,119,946 |
| Stripe, Inc. Class B (a)(c)(e) | | 7,800 | 225,576 |
| Synopsys, Inc. (a) | | 14,902 | 5,476,485 |
| Workday, Inc. Class A (a) | | 5,677 | 880,503 |
| | | | 316,614,859 |
| Technology Hardware, Storage & Peripherals - 13.6% | | | |
| Apple, Inc. | | 1,600,104 | 260,032,904 |
| Western Digital Corp. (a) | | 24,493 | 1,202,606 |
| | | | 261,235,510 |
|
| TOTAL INFORMATION TECHNOLOGY | | | 826,622,661 |
|
| REAL ESTATE - 0.1% | | | |
| Equity Real Estate Investment Trusts (REITs) - 0.1% | | | |
| Equinix, Inc. | | 3,994 | 2,810,738 |
| TOTAL COMMON STOCKS | | | |
| (Cost $1,678,323,505) | | | 1,887,386,118 |
|
| Preferred Stocks - 0.7% | | | |
| Convertible Preferred Stocks - 0.4% | | | |
| COMMUNICATION SERVICES - 0.2% | | | |
| Interactive Media & Services - 0.2% | | | |
| Reddit, Inc.: | | | |
| Series E (a)(c)(e) | | 2,900 | 114,086 |
| Series F (c)(e) | | 108,712 | 4,276,730 |
| | | | 4,390,816 |
| CONSUMER DISCRETIONARY - 0.1% | | | |
| Hotels, Restaurants & Leisure - 0.0% | | | |
| Discord, Inc. Series I (c)(e) | | 300 | 114,897 |
| Internet & Direct Marketing Retail - 0.1% | | | |
| Circle Internet Financial Ltd. Series F (e) | | 33,481 | 1,625,399 |
| TOTAL CONSUMER DISCRETIONARY | | | 1,740,296 |
| INFORMATION TECHNOLOGY - 0.1% | | | |
| IT Services - 0.1% | | | |
| ByteDance Ltd. Series E1 (a)(c)(e) | | 8,180 | 1,174,157 |
| Software - 0.0% | | | |
| Stripe, Inc. Series H (a)(c)(e) | | 3,000 | 86,760 |
| Tenstorrent, Inc. Series C1 (a)(c)(e) | | 3,400 | 191,352 |
| | | | 278,112 |
| TOTAL INFORMATION TECHNOLOGY | | | 1,452,269 |
|
| TOTAL CONVERTIBLE PREFERRED STOCKS | | | 7,583,381 |
|
| Nonconvertible Preferred Stocks - 0.3% | | | |
| CONSUMER DISCRETIONARY - 0.3% | | | |
| Automobiles - 0.0% | | | |
| Waymo LLC: | | | |
| Series A2 (a)(c)(e) | | 2,467 | 153,275 |
| Series B2 (a)(c)(e) | | 15,200 | 981,616 |
| | | | 1,134,891 |
| Internet & Direct Marketing Retail - 0.3% | | | |
| Circle Internet Financial Ltd. Series E (e) | | 108,317 | 5,258,455 |
| TOTAL CONSUMER DISCRETIONARY | | | 6,393,346 |
| TOTAL PREFERRED STOCKS | | | |
| (Cost $12,999,889) | | | 13,976,727 |
| | | Principal Amount | Value |
|
| Convertible Bonds - 0.3% | | | |
| FINANCIALS - 0.3% | | | |
| Capital Markets - 0.3% | | | |
Coinbase Global, Inc. 0.5% 6/1/26
(Cost $5,342,497) | | 7,864,589 | 4,785,602 |
|
| Preferred Securities - 0.0% | | | |
| INFORMATION TECHNOLOGY - 0.0% | | | |
| Software - 0.0% | | | |
Tenstorrent, Inc. 0%
(Cost $190,000)(c)(e)(f) | | 190,000 | 190,000 |
| | | Shares | Value |
|
| Money Market Funds - 2.6% | | | |
| Fidelity Cash Central Fund 2.01% (g) | | 25,862,546 | 25,867,719 |
| Fidelity Securities Lending Cash Central Fund 2.01% (g)(h) | | 24,753,402 | 24,755,878 |
| TOTAL MONEY MARKET FUNDS | | | |
| (Cost $50,623,597) | | | 50,623,597 |
| TOTAL INVESTMENT IN SECURITIES - 101.7% | | | |
| (Cost $1,747,479,488) | | | 1,956,962,044 |
| NET OTHER ASSETS (LIABILITIES) - (1.7)% | | | (32,613,215) |
| NET ASSETS - 100% | | | $1,924,348,829 |
Legend
(a) Non-income producing
(b) Security or a portion of the security is on loan at period end.
(c) Level 3 security
(d) Security exempt from registration under Rule 144A of the Securities Act of 1933. These securities may be resold in transactions exempt from registration, normally to qualified institutional buyers. At the end of the period, the value of these securities amounted to $23,997,823 or 1.2% of net assets.
(e) Restricted securities (including private placements) - Investment in securities not registered under the Securities Act of 1933 (excluding 144A issues). At the end of the period, the value of restricted securities (excluding 144A issues) amounted to $19,228,303 or 1.0% of net assets.
(f) Security is perpetual in nature with no stated maturity date.
(g) Affiliated fund that is generally available only to investment companies and other accounts managed by Fidelity Investments. The rate quoted is the annualized seven-day yield of the fund at period end. A complete unaudited listing of the fund's holdings as of its most recent quarter end is available upon request. In addition, each Fidelity Central Fund's financial statements, which are not covered by the Fund's Report of Independent Registered Public Accounting Firm, are available on the SEC's website or upon request.
(h) Investment made with cash collateral received from securities on loan.
Additional information on each restricted holding is as follows:
| Security | Acquisition Date | Acquisition Cost |
| ByteDance Ltd. Series E1 | 11/18/20 | $896,317 |
| Circle Internet Financial Ltd. Series E | 5/11/21 | $1,758,000 |
| Circle Internet Financial Ltd. Series F | 5/9/22 | $1,410,889 |
| Discord, Inc. Series I | 9/15/21 | $165,187 |
| Epic Games, Inc. | 7/13/20 - 3/29/21 | $4,292,000 |
| Reddit, Inc. Series E | 5/18/21 | $123,175 |
| Reddit, Inc. Series F | 8/11/21 | $6,717,793 |
| Stripe, Inc. Class B | 5/18/21 | $313,001 |
| Stripe, Inc. Series H | 3/15/21 | $120,375 |
| Tenstorrent, Inc. Series C1 | 4/23/21 | $202,145 |
| Tenstorrent, Inc. 0% | 4/23/21 | $190,000 |
| Waymo LLC Series A2 | 5/8/20 | $211,834 |
| Waymo LLC Series B2 | 6/11/21 | $1,394,174 |
Affiliated Central Funds
Fiscal year to date information regarding the Fund's investments in Fidelity Central Funds, including the ownership percentage, is presented below.
| Fund | Value, beginning of period | Purchases | Sales Proceeds | Dividend Income | Realized Gain/Loss | Change in Unrealized appreciation (depreciation) | Value, end of period | % ownership, end of period |
| Fidelity Cash Central Fund 2.01% | $7,857,015 | $491,413,780 | $473,403,076 | $44,279 | $-- | $-- | $25,867,719 | 0.0% |
| Fidelity Securities Lending Cash Central Fund 2.01% | 24,430,254 | 707,010,474 | 706,684,850 | 193,464 | -- | -- | 24,755,878 | 0.1% |
| Total | $32,287,269 | $1,198,424,254 | $1,180,087,926 | $237,743 | $-- | $-- | $50,623,597 | |
Amounts in the income column in the above table include any capital gain distributions from underlying funds, which are presented in the corresponding line-item in the Statement of Operations, if applicable. Amount for Fidelity Securities Lending Cash Central Fund represents the income earned on investing cash collateral, less rebates paid to borrowers and any lending agent fees associated with the loan, plus any premium payments received for lending certain types of securities.
Investment Valuation
The following is a summary of the inputs used, as of July 31, 2022, involving the Fund's assets and liabilities carried at fair value. The inputs or methodology used for valuing securities may not be an indication of the risk associated with investing in those securities. For more information on valuation inputs, and their aggregation into the levels used below, please refer to the Investment Valuation section in the accompanying Notes to Financial Statements.
| | Valuation Inputs at Reporting Date: |
| Description | Total | Level 1 | Level 2 | Level 3 |
| Investments in Securities: | | | | |
| Equities: | | | | |
| Communication Services | $375,946,371 | $370,035,110 | $651,310 | $5,259,951 |
| Consumer Discretionary | 280,722,749 | 242,363,338 | 37,109,623 | 1,249,788 |
| Consumer Staples | 89,447,355 | 78,234,577 | 11,212,778 | -- |
| Energy | 92,366,612 | 58,259,684 | 34,106,928 | -- |
| Financials | 34,782,703 | 34,782,703 | -- | -- |
| Health Care | 171,852,956 | 171,852,956 | -- | -- |
| Industrials | 25,358,431 | 25,358,431 | -- | -- |
| Information Technology | 828,074,930 | 821,561,085 | -- | 6,513,845 |
| Real Estate | 2,810,738 | 2,810,738 | -- | -- |
| Corporate Bonds | 4,785,602 | -- | 4,785,602 | -- |
| Preferred Securities | 190,000 | -- | -- | 190,000 |
| Money Market Funds | 50,623,597 | 50,623,597 | -- | -- |
| Total Investments in Securities: | $1,956,962,044 | $1,855,882,219 | $87,866,241 | $13,213,584 |
| Net Unrealized Depreciation on Unfunded Commitments | $(182,425) | $-- | $-- | $(182,425) |
See accompanying notes which are an integral part of the financial statements.
Financial Statements
Statement of Assets and Liabilities
| | | July 31, 2022 |
| Assets | | |
Investment in securities, at value (including securities loaned of $22,560,653) — See accompanying schedule:
Unaffiliated issuers (cost $1,696,855,891) | $1,906,338,447 | |
| Fidelity Central Funds (cost $50,623,597) | 50,623,597 | |
| Total Investment in Securities (cost $1,747,479,488) | | $1,956,962,044 |
| Cash | | 187,007 |
| Receivable for fund shares sold | | 1,303,521 |
| Dividends receivable | | 214,031 |
| Interest receivable | | 6,558 |
| Distributions receivable from Fidelity Central Funds | | 52,640 |
| Other receivables | | 445,713 |
| Total assets | | 1,959,171,514 |
| Liabilities | | |
| Payable to custodian bank | $2 | |
| Payable for investments purchased | 7,717,605 | |
| Unrealized depreciation on unfunded commitments | 182,425 | |
| Payable for fund shares redeemed | 967,740 | |
| Accrued management fee | 758,404 | |
| Other payables and accrued expenses | 440,350 | |
| Collateral on securities loaned | 24,756,159 | |
| Total liabilities | | 34,822,685 |
| Net Assets | | $1,924,348,829 |
| Net Assets consist of: | | |
| Paid in capital | | $1,806,967,429 |
| Total accumulated earnings (loss) | | 117,381,400 |
| Net Assets | | $1,924,348,829 |
| Net Asset Value, offering price and redemption price per share ($1,924,348,829 ÷ 123,155,401 shares) | | $15.63 |
See accompanying notes which are an integral part of the financial statements.
Statement of Operations
| | | Year ended July 31, 2022 |
| Investment Income | | |
| Dividends | | $10,264,814 |
| Interest | | 110,822 |
| Income from Fidelity Central Funds (including $193,464 from security lending) | | 237,743 |
| Total income | | 10,613,379 |
| Expenses | | |
| Management fee | $11,840,541 | |
| Independent trustees' fees and expenses | 8,003 | |
| Interest | 3,212 | |
| Total expenses before reductions | 11,851,756 | |
| Expense reductions | (58) | |
| Total expenses after reductions | | 11,851,698 |
| Net investment income (loss) | | (1,238,319) |
| Realized and Unrealized Gain (Loss) | | |
| Net realized gain (loss) on: | | |
| Investment securities: | | |
| Unaffiliated issuers (net of foreign taxes of $571,409) | (63,928,895) | |
| Foreign currency transactions | (166,487) | |
| Total net realized gain (loss) | | (64,095,382) |
| Change in net unrealized appreciation (depreciation) on: | | |
| Investment securities: | | |
| Unaffiliated issuers (net of decrease in deferred foreign taxes of $394,381) | (428,299,821) | |
| Unfunded commitments | (182,425) | |
| Assets and liabilities in foreign currencies | 99,327 | |
| Total change in net unrealized appreciation (depreciation) | | (428,382,919) |
| Net gain (loss) | | (492,478,301) |
| Net increase (decrease) in net assets resulting from operations | | $(493,716,620) |
See accompanying notes which are an integral part of the financial statements.
Statement of Changes in Net Assets
| | Year ended July 31, 2022 | Year ended July 31, 2021 |
| Increase (Decrease) in Net Assets | | |
| Operations | | |
| Net investment income (loss) | $(1,238,319) | $(849,937) |
| Net realized gain (loss) | (64,095,382) | 115,247,310 |
| Change in net unrealized appreciation (depreciation) | (428,382,919) | 450,605,649 |
| Net increase (decrease) in net assets resulting from operations | (493,716,620) | 565,003,022 |
| Distributions to shareholders | (102,430,536) | (4,991,250) |
| Share transactions | | |
| Proceeds from sales of shares | 603,778,476 | 1,548,721,347 |
| Reinvestment of distributions | 102,430,536 | 4,991,250 |
| Cost of shares redeemed | (816,272,268) | (509,276,228) |
| Net increase (decrease) in net assets resulting from share transactions | (110,063,256) | 1,044,436,369 |
| Total increase (decrease) in net assets | (706,210,412) | 1,604,448,141 |
| Net Assets | | |
| Beginning of period | 2,630,559,241 | 1,026,111,100 |
| End of period | $1,924,348,829 | $2,630,559,241 |
| Other Information | | |
| Shares | | |
| Sold | 33,021,590 | 86,429,066 |
| Issued in reinvestment of distributions | 4,958,146 | 329,033 |
| Redeemed | (44,040,760) | (29,368,972) |
| Net increase (decrease) | (6,061,024) | 57,389,127 |
See accompanying notes which are an integral part of the financial statements.
Financial Highlights
Fidelity OTC K6 Portfolio
| | | | | |
| Years ended July 31, | 2022 | 2021 | 2020 | 2019 A |
| Selected Per–Share Data | | | | |
| Net asset value, beginning of period | $20.36 | $14.29 | $10.50 | $10.00 |
| Income from Investment Operations | | | | |
| Net investment income (loss)B,C | (.01) | (.01) | .02 | –D |
| Net realized and unrealized gain (loss) | (3.93) | 6.15 | 3.81 | .50 |
| Total from investment operations | (3.94) | 6.14 | 3.83 | .50 |
| Distributions from net investment income | – | (.01) | (.01) | – |
| Distributions from net realized gain | (.79) | (.06) | (.02) | – |
| Total distributions | (.79) | (.07) | (.04)E | – |
| Net asset value, end of period | $15.63 | $20.36 | $14.29 | $10.50 |
| Total ReturnF,G | (20.27)% | 43.11% | 36.54% | 5.00% |
| Ratios to Average Net AssetsC,H,I | | | | |
| Expenses before reductions | .50% | .50% | .50% | .50%J |
| Expenses net of fee waivers, if any | .50% | .50% | .50% | .50%J |
| Expenses net of all reductions | .50% | .50% | .49% | .50%J |
| Net investment income (loss) | (.05)% | (.05)% | .16% | .08%J |
| Supplemental Data | | | | |
| Net assets, end of period (000 omitted) | $1,924,349 | $2,630,559 | $1,026,111 | $1,050 |
| Portfolio turnover rateK | 39%L | 36%L | 102%L | 5%M |
A For the period June 13, 2019 (commencement of operations) through July 31, 2019.
B Calculated based on average shares outstanding during the period.
C Net investment income (loss) is affected by the timing of the declaration of dividends by any underlying mutual funds or exchange-traded funds (ETFs). Net investment income (loss) of any such underlying funds is not included in the Fund's net investment income (loss) ratio.
D Amount represents less than $.005 per share.
E Total distributions per share do not sum due to rounding.
F Total returns for periods of less than one year are not annualized.
G Total returns would have been lower if certain expenses had not been reduced during the applicable periods shown.
H Fees and expenses of any underlying mutual funds or exchange-traded funds (ETFs) are not included in the Fund's expense ratio. The Fund indirectly bears its proportionate share of these expenses. For additional expense information related to investments in Fidelity Central Funds, please refer to the "Investments in Fidelity Central Funds" note found in the Notes to Financial Statements section of the most recent Annual or Semi-Annual report.
I Expense ratios reflect operating expenses of the class. Expenses before reductions do not reflect amounts reimbursed, waived, or reduced through arrangements with the investment adviser, brokerage services, or other offset arrangements, if applicable, and do not represent the amount paid by the class during periods when reimbursements, waivers or reductions occur.
J Annualized
K Amount does not include the portfolio activity of any underlying mutual funds or exchange-traded funds (ETFs).
L Portfolio turnover rate excludes securities received or delivered in-kind.
M Amount not annualized.
See accompanying notes which are an integral part of the financial statements.
Notes to Financial Statements
For the period ended July 31, 2022
1. Organization.
Fidelity OTC K6 Portfolio (the Fund) is a non-diversified fund of Fidelity Securities Fund (the Trust) and is authorized to issue an unlimited number of shares. Share transactions on the Statement of Changes in Net Assets may contain exchanges between affiliated funds. The Trust is registered under the Investment Company Act of 1940, as amended (the 1940 Act), as an open-end management investment company organized as a Massachusetts business trust. Shares generally are available only to employer-sponsored retirement plans that are recordkept by Fidelity, or to certain employer-sponsored retirement plans that are not recordkept by Fidelity.
2. Investments in Fidelity Central Funds.
Funds may invest in Fidelity Central Funds, which are open-end investment companies generally available only to other investment companies and accounts managed by the investment adviser and its affiliates. The Schedule of Investments lists any Fidelity Central Funds held as an investment as of period end, but does not include the underlying holdings of each Fidelity Central Fund. An investing fund indirectly bears its proportionate share of the expenses of the underlying Fidelity Central Funds.
Based on its investment objective, each Fidelity Central Fund may invest or participate in various investment vehicles or strategies that are similar to those of the investing fund. These strategies are consistent with the investment objectives of the investing fund and may involve certain economic risks which may cause a decline in value of each of the Fidelity Central Funds and thus a decline in the value of the investing fund.
| Fidelity Central Fund | Investment Manager | Investment Objective | Investment Practices | Expense Ratio(a) |
| Fidelity Money Market Central Funds | Fidelity Management & Research Company LLC (FMR) | Each fund seeks to obtain a high level of current income consistent with the preservation of capital and liquidity. | Short-term Investments | Less than .005% |
(a) Expenses expressed as a percentage of average net assets and are as of each underlying Central Fund's most recent annual or semi-annual shareholder report.
A complete unaudited list of holdings for each Fidelity Central Fund is available upon request or at the Securities and Exchange Commission website at www.sec.gov. In addition, the financial statements of the Fidelity Central Funds which contain the significant accounting policies (including investment valuation policies) of those funds, and are not covered by the Report of Independent Registered Public Accounting Firm, are available on the Securities and Exchange Commission website or upon request.
3. Significant Accounting Policies.
The Fund is an investment company and applies the accounting and reporting guidance of the Financial Accounting Standards Board (FASB) Accounting Standards Codification Topic 946 Financial Services - Investment Companies. The financial statements have been prepared in conformity with accounting principles generally accepted in the United States of America (GAAP), which require management to make certain estimates and assumptions at the date of the financial statements. Actual results could differ from those estimates. Subsequent events, if any, through the date that the financial statements were issued have been evaluated in the preparation of the financial statements. The Fund's Schedule of Investments lists any underlying mutual funds or exchange-traded funds (ETFs) but does not include the underlying holdings of these funds. The following summarizes the significant accounting policies of the Fund:
Investment Valuation. Investments are valued as of 4:00 p.m. Eastern time on the last calendar day of the period. The Board of Trustees (the Board) has delegated the day to day responsibility for the valuation of the Fund's investments to the Fair Value Committee (the Committee) established by the Fund's investment adviser. In accordance with valuation policies and procedures approved by the Board, the Fund attempts to obtain prices from one or more third party pricing vendors or brokers to value its investments. When current market prices, quotations or currency exchange rates are not readily available or reliable, investments will be fair valued in good faith by the Committee, in accordance with procedures adopted by the Board. Factors used in determining fair value vary by investment type and may include market or investment specific events, changes in interest rates and credit quality. The frequency with which these procedures are used cannot be predicted and they may be utilized to a significant extent. The Committee oversees the Fund's valuation policies and procedures and reports to the Board on the Committee's activities and fair value determinations. The Board monitors the appropriateness of the procedures used in valuing the Fund's investments and ratifies the fair value determinations of the Committee.
The Fund categorizes the inputs to valuation techniques used to value its investments into a disclosure hierarchy consisting of three levels as shown below:
- Level 1 – unadjusted quoted prices in active markets for identical investments
- Level 2 – other significant observable inputs (including quoted prices for similar investments, interest rates, prepayment speeds, etc.)
- Level 3 – unobservable inputs (including the Fund's own assumptions based on the best information available)
Valuation techniques used to value the Fund's investments by major category are as follows:
Equity securities, including restricted securities, for which market quotations are readily available, are valued at the last reported sale price or official closing price as reported by a third party pricing vendor on the primary market or exchange on which they are traded and are categorized as Level 1 in the hierarchy. In the event there were no sales during the day or closing prices are not available, securities are valued at the last quoted bid price or may be valued using the last available price and are generally categorized as Level 2 in the hierarchy. For foreign equity securities, when market or security specific events arise, comparisons to the valuation of American Depositary Receipts (ADRs), futures contracts, ETFs and certain indexes as well as quoted prices for similar securities may be used and would be categorized as Level 2 in the hierarchy. For equity securities, including restricted securities, where observable inputs are limited, assumptions about market activity and risk are used and these securities may be categorized as Level 3 in the hierarchy. Securities, including private placements or other restricted securities, for which observable inputs are not available are valued using alternate valuation approaches, including the market approach, the income approach and cost approach, and are categorized as Level 3 in the hierarchy. The market approach considers factors including the price of recent investments in the same or a similar security or financial metrics of comparable securities. The income approach considers factors including expected future cash flows, security specific risks and corresponding discount rates. The cost approach considers factors including the value of the security's underlying assets and liabilities.
Debt securities, including restricted securities, are valued based on evaluated prices received from third party pricing vendors or from brokers who make markets in such securities. Corporate bonds and preferred securities are valued by pricing vendors who utilize matrix pricing which considers yield or price of bonds of comparable quality, coupon, maturity and type or by broker-supplied prices. When independent prices are unavailable or unreliable, debt securities may be valued utilizing pricing methodologies which consider similar factors that would be used by third party pricing vendors. Debt securities are generally categorized as Level 2 in the hierarchy but may be Level 3 depending on the circumstances.
Investments in open-end mutual funds, including the Fidelity Central Funds, are valued at their closing net asset value (NAV) each business day and are categorized as Level 1 in the hierarchy.
Changes in valuation techniques may result in transfers in or out of an assigned level within the disclosure hierarchy. The aggregate value of investments by input level as of July 31, 2022 is included at the end of the Fund's Schedule of Investments.
Foreign Currency. Certain Funds may use foreign currency contracts to facilitate transactions in foreign-denominated securities. Gains and losses from these transactions may arise from changes in the value of the foreign currency or if the counterparties do not perform under the contracts' terms.
Foreign-denominated assets, including investment securities, and liabilities are translated into U.S. dollars at the exchange rates at period end. Purchases and sales of investment securities, income and dividends received, and expenses denominated in foreign currencies are translated into U.S. dollars at the exchange rate in effect on the transaction date.
The effects of exchange rate fluctuations on investments are included with the net realized and unrealized gain (loss) on investment securities. Other foreign currency transactions resulting in realized and unrealized gain (loss) are disclosed separately.
Investment Transactions and Income. For financial reporting purposes, the Fund's investment holdings and NAV include trades executed through the end of the last business day of the period. The NAV per share for processing shareholder transactions is calculated as of the close of business of the New York Stock Exchange (NYSE), normally 4:00 p.m. Eastern time and includes trades executed through the end of the prior business day. Gains and losses on securities sold are determined on the basis of identified cost. Commissions paid to certain brokers with whom the investment adviser, or its affiliates, places trades on behalf of a fund include an amount in addition to trade execution, which may be rebated back to a fund. Any such rebates are included in net realized gain (loss) on investments in the Statement of Operations. Dividend income is recorded on the ex-dividend date, except for certain dividends from foreign securities where the ex-dividend date may have passed, which are recorded as soon as the Fund is informed of the ex-dividend date. Non-cash dividends included in dividend income, if any, are recorded at the fair market value of the securities received. Income and capital gain distributions from Fidelity Central Funds, if any, are recorded on the ex-dividend date. Interest income is accrued as earned and includes coupon interest and amortization of premium and accretion of discount on debt securities as applicable. Investment income is recorded net of foreign taxes withheld where recovery of such taxes is uncertain.
Expenses. Expenses directly attributable to a fund are charged to that fund. Expenses attributable to more than one fund are allocated among the respective funds on the basis of relative net assets or other appropriate methods. Expenses included in the accompanying financial statements reflect the expenses of that fund and do not include any expenses associated with any underlying mutual funds or exchange-traded funds. Although not included in a fund's expenses, a fund indirectly bears its proportionate share of these expenses through the net asset value of each underlying mutual fund or exchange-traded fund. Expense estimates are accrued in the period to which they relate and adjustments are made when actual amounts are known.
Income Tax Information and Distributions to Shareholders. Each year, the Fund intends to qualify as a regulated investment company under Subchapter M of the Internal Revenue Code, including distributing substantially all of its taxable income and realized gains. As a result, no provision for U.S. Federal income taxes is required. As of July 31, 2022, the Fund did not have any unrecognized tax benefits in the financial statements; nor is the Fund aware of any tax positions for which it is reasonably possible that the total amounts of unrecognized tax benefits will significantly change in the next twelve months. The Fund files a U.S. federal tax return, in addition to state and local tax returns as required. The Fund's federal income tax returns are subject to examination by the Internal Revenue Service (IRS) for a period of three fiscal years after they are filed. State and local tax returns may be subject to examination for an additional fiscal year depending on the jurisdiction. Foreign taxes are provided for based on the Fund's understanding of the tax rules and rates that exist in the foreign markets in which it invests. The Fund is subject to a tax imposed on capital gains by certain countries in which it invests. An estimated deferred tax liability for net unrealized appreciation on the applicable securities is included in Other payables and accrued expenses on the Statement of Assets & Liabilities.
Distributions are declared and recorded on the ex-dividend date. Income and capital gain distributions are determined in accordance with income tax regulations, which may differ from GAAP.
Capital accounts within the financial statements are adjusted for permanent book-tax differences. These adjustments have no impact on net assets or the results of operations. Capital accounts are not adjusted for temporary book-tax differences which will reverse in a subsequent period.
Book-tax differences are primarily due to foreign currency transactions, certain foreign taxes, net operating losses, losses deferred due to wash sales and excise tax regulations.
As of period end, the cost and unrealized appreciation (depreciation) in securities, and derivatives if applicable, for federal income tax purposes were as follows:
| Gross unrealized appreciation | $396,181,066 |
| Gross unrealized depreciation | (215,371,885) |
| Net unrealized appreciation (depreciation) | $180,809,181 |
| Tax Cost | $1,775,970,438 |
The tax-based components of distributable earnings as of period end were as follows:
| Net unrealized appreciation (depreciation) on securities and other investments | $180,909,192 |
The Fund intends to elect to defer to its next fiscal year $62,425,355 of capital losses recognized during the period November 1, 2021 to July 31, 2022. The Fund intends to elect to defer to its next fiscal year $662,092 of ordinary losses recognized during the period January 1, 2022 to July 31, 2022.
The tax character of distributions paid was as follows:
| | July 31, 2022 | July 31, 2021 |
| Ordinary Income | $38,446,292 | $ 4,215,020 |
| Long-term Capital Gains | 63,984,244 | 776,230 |
| Total | $102,430,536 | $ 4,991,250 |
Restricted Securities (including Private Placements). Funds may invest in securities that are subject to legal or contractual restrictions on resale. These securities generally may be resold in transactions exempt from registration or to the public if the securities are registered. Disposal of these securities may involve time-consuming negotiations and expense, and prompt sale at an acceptable price may be difficult. Information regarding restricted securities held at period end is included at the end of the Schedule of Investments, if applicable.
Commitments. A commitment is an agreement to acquire an investment at a future date (subject to conditions) in connection with a potential public or non-public offering. Commitments outstanding at period end are presented in the table below. Unrealized appreciation (depreciation) on any commitments outstanding at period end is separately presented in the Statements of Assets and Liabilities as Unrealized appreciation (depreciation) on unfunded commitments, and any change in unrealized appreciation (depreciation) on unfunded commitments during the period is separately presented in the Statement of Operations, as applicable based on contractual conditions of each commitment.
| | Investment to be Acquired | Commitment Amount | Unrealized Appreciation (Depreciation) |
| Fidelity OTC K6 Portfolio | Twitter, Inc. | $ 5,783,465 | $-- |
| | Stripe, Inc. | $ 182,425 | $(182,425) |
4. Purchases and Sales of Investments.
Purchases and sales of securities, other than short-term securities and in-kind transactions, as applicable, are noted in the table below.
| | Purchases ($) | Sales ($) |
| Fidelity OTC K6 Portfolio | 914,890,586 | 1,283,500,341 |
Unaffiliated Exchanges In-Kind. Shares that were exchanged for investments, including accrued interest and cash, if any, are shown in the table below. The amount of in-kind exchanges is included in share transactions in the accompanying Statement of Changes in Net Assets.
| | Shares | Total Proceeds
($) |
| Fidelity OTC K6 Portfolio | 8,003,342 | 144,799,277 |
Prior Fiscal Year Unaffiliated Redemptions In-Kind. Shares that were redeemed in-kind for investments, including accrued interest and cash, if any, are shown in the table below; along with realized gain or loss on investments delivered through in-kind redemptions. The amount of the in-kind redemptions is included in share transactions in the accompanying Statement of Changes in Net Assets. There was no gain or loss for federal income tax purposes.
| | Shares | Total net realized gain or loss
($) | Total Proceeds
($) |
| Fidelity OTC K6 Portfolio | 4,189,900 | 33,010,502 | 73,155,655 |
Prior Year Unaffiliated Exchanges In-Kind. Shares that were exchanged for investments, including accrued interest and cash, if any, are shown in the table below. The amount of in-kind exchanges is included in share transactions in the accompanying Statement of Changes in Net Assets.
| | Shares | Total Proceeds
($) |
| Fidelity OTC K6 Portfolio | 47,775,932 | 884,784,797 |
5. Fees and Other Transactions with Affiliates.
Management Fee. Fidelity Management & Research Company LLC (the investment adviser) and its affiliates provide the Fund with investment management related services for which the Fund pays a monthly management fee that is based on an annual rate of .50% of average net assets. Under the management contract, the investment adviser or an affiliate pays all other expenses of the Fund, excluding fees and expenses of the independent Trustees, and certain miscellaneous expenses such as proxy and shareholder meeting expenses.
Brokerage Commissions. A portion of portfolio transactions were placed with brokerage firms which are affiliates of the investment adviser. Brokerage commissions are included in net realized gain (loss) and change in net unrealized appreciation (depreciation) in the Statement of Operations. The commissions paid to these affiliated firms were as follows:
| | Amount |
| Fidelity OTC K6 Portfolio | $14,706 |
Interfund Lending Program. Pursuant to an Exemptive Order issued by the Securities and Exchange Commission (the SEC), the Fund, along with other registered investment companies having management contracts with Fidelity Management & Research Company LLC (FMR), or other affiliated entities of FMR, may participate in an interfund lending program. This program provides an alternative credit facility allowing the Fund to borrow from, or lend money to, other participating affiliated funds. At period end, there were no interfund loans outstanding. Activity in this program during the period for which loans were outstanding was as follows:
| | Borrower or Lender | Average Loan Balance | Weighted Average Interest Rate | Interest Expense |
| Fidelity OTC K6 Portfolio | Borrower | $15,573,842 | .39% | $3,212 |
Interfund Trades. Funds may purchase from or sell securities to other Fidelity Funds under procedures adopted by the Board. The procedures have been designed to ensure these interfund trades are executed in accordance with Rule 17a-7 of the 1940 Act. Any interfund trades are included within the respective purchases and sales amounts shown in the Purchases and Sales of Investments note. Interfund trades during the period are noted in the table below.
| | Purchases ($) | Sales ($) | Realized Gain (Loss) ($) |
| Fidelity OTC K6 Portfolio | 66,257,420 | 104,387,168 | (2,200,618) |
6. Committed Line of Credit.
Certain Funds participate with other funds managed by the investment adviser or an affiliate in a $4.25 billion credit facility (the "line of credit") to be utilized for temporary or emergency purposes to fund shareholder redemptions or for other short-term liquidity purposes. The commitment fees on the pro-rata portion of the line of credit are borne by the investment adviser. During the period, there were no borrowings on this line of credit.
7. Security Lending.
Funds lend portfolio securities from time to time in order to earn additional income. Lending agents are used, including National Financial Services (NFS), an affiliate of the investment adviser. Pursuant to a securities lending agreement, NFS will receive a fee, which is capped at 9.9% of a fund's daily lending revenue, for its services as lending agent. A fund may lend securities to certain qualified borrowers, including NFS. On the settlement date of the loan, a fund receives collateral (in the form of U.S. Treasury obligations, letters of credit and/or cash) against the loaned securities and maintains collateral in an amount not less than 100% of the market value of the loaned securities during the period of the loan. The market value of the loaned securities is determined at the close of business of a fund and any additional required collateral is delivered to a fund on the next business day. A fund or borrower may terminate the loan at any time, and if the borrower defaults on its obligation to return the securities loaned because of insolvency or other reasons, a fund may apply collateral received from the borrower against the obligation. A fund may experience delays and costs in recovering the securities loaned. Any cash collateral received is invested in the Fidelity Securities Lending Cash Central Fund. Any loaned securities are identified as such in the Schedule of Investments, and the value of loaned securities and cash collateral at period end, as applicable, are presented in the Statement of Assets and Liabilities. Security lending income represents the income earned on investing cash collateral, less rebates paid to borrowers and any lending agent fees associated with the loan, plus any premium payments received for lending certain types of securities. Security lending income is presented in the Statement of Operations as a component of income from Fidelity Central Funds. Affiliated security lending activity, if any, was as follows:
| | Total Security Lending Fees Paid to NFS | Security Lending Income From Securities Loaned to NFS | Value of Securities Loaned to NFS at Period End |
| Fidelity OTC K6 Portfolio | $20,567 | $372 | $3,796 |
8. Expense Reductions.
Through arrangements with the Fund's custodian, credits realized as a result of certain uninvested cash balances were used to reduce the Fund's expenses by $58.
9. Other.
A fund's organizational documents provide former and current trustees and officers with a limited indemnification against liabilities arising in connection with the performance of their duties to the fund. In the normal course of business, a fund may also enter into contracts that provide general indemnifications. A fund's maximum exposure under these arrangements is unknown as this would be dependent on future claims that may be made against a fund. The risk of material loss from such claims is considered remote.
10. Coronavirus (COVID-19) Pandemic.
An outbreak of COVID-19 first detected in China during December 2019 has since spread globally and was declared a pandemic by the World Health Organization during March 2020. Developments that disrupt global economies and financial markets, such as the COVID-19 pandemic, may magnify factors that affect the Fund's performance.
Report of Independent Registered Public Accounting Firm
To the Board of Trustees of Fidelity Securities Fund and Shareholders of Fidelity OTC K6 Portfolio
Opinion on the Financial Statements and Financial Highlights
We have audited the accompanying statement of assets and liabilities of Fidelity OTC K6 Portfolio (the "Fund"), a fund of Fidelity Securities Fund, including the schedule of investments, as of July 31, 2022, the related statement of operations for the year then ended, the statement of changes in net assets for each of the two years in the period then ended and the financial highlights for each of the three years in the period then ended and for the period from June 13, 2019 (commencement of operations) through July 31, 2019, and the related notes. In our opinion, the financial statements and financial highlights present fairly, in all material respects, the financial position of the Fund as of July 31, 2022, and the results of its operations for the year then ended, the changes in its net assets for each of the two years in the period then ended and the financial highlights for each of the three years in the period then ended and for the period from June 13, 2019 (commencement of operations) through July 31, 2019, in conformity with accounting principles generally accepted in the United States of America.
Basis for Opinion
These financial statements and financial highlights are the responsibility of the Fund's management. Our responsibility is to express an opinion on the Fund's financial statements and financial highlights based on our audits. We are a public accounting firm registered with the Public Company Accounting Oversight Board (United States) (PCAOB) and are required to be independent with respect to the Fund in accordance with the U.S. federal securities laws and the applicable rules and regulations of the Securities and Exchange Commission and the PCAOB.
We conducted our audits in accordance with the standards of the PCAOB. Those standards require that we plan and perform the audit to obtain reasonable assurance about whether the financial statements and financial highlights are free of material misstatement, whether due to error or fraud. The Fund is not required to have, nor were we engaged to perform, an audit of its internal control over financial reporting. As part of our audits we are required to obtain an understanding of internal control over financial reporting but not for the purpose of expressing an opinion on the effectiveness of the Fund’s internal control over financial reporting. Accordingly, we express no such opinion.
Our audits included performing procedures to assess the risks of material misstatement of the financial statements and financial highlights, whether due to error or fraud, and performing procedures that respond to those risks. Such procedures included examining, on a test basis, evidence regarding the amounts and disclosures in the financial statements and financial highlights. Our audits also included evaluating the accounting principles used and significant estimates made by management, as well as evaluating the overall presentation of the financial statements and financial highlights. Our procedures included confirmation of securities owned as of July 31, 2022, by correspondence with the custodian and brokers; when replies were not received from brokers, we performed other auditing procedures. We believe that our audits provide a reasonable basis for our opinion.
/s/ Deloitte & Touche LLP
Boston, Massachusetts
September 12, 2022
We have served as the auditor of one or more of the Fidelity investment companies since 1999.
Trustees and Officers
The Trustees, Members of the Advisory Board (if any), and officers of the trust and fund, as applicable, are listed below. The Board of Trustees governs the fund and is responsible for protecting the interests of shareholders. The Trustees are experienced executives who meet periodically throughout the year to oversee the fund's activities, review contractual arrangements with companies that provide services to the fund, oversee management of the risks associated with such activities and contractual arrangements, and review the fund's performance. Except for Jonathan Chiel, each of the Trustees oversees 316 funds. Mr. Chiel oversees 184 funds.
The Trustees hold office without limit in time except that (a) any Trustee may resign; (b) any Trustee may be removed by written instrument, signed by at least two-thirds of the number of Trustees prior to such removal; (c) any Trustee who requests to be retired or who has become incapacitated by illness or injury may be retired by written instrument signed by a majority of the other Trustees; and (d) any Trustee may be removed at any special meeting of shareholders by a two-thirds vote of the outstanding voting securities of the trust. Each Trustee who is not an interested person (as defined in the 1940 Act) of the trust and the fund is referred to herein as an Independent Trustee. Each Independent Trustee shall retire not later than the last day of the calendar year in which his or her 75th birthday occurs. The Independent Trustees may waive this mandatory retirement age policy with respect to individual Trustees. Officers and Advisory Board Members hold office without limit in time, except that any officer or Advisory Board Member may resign or may be removed by a vote of a majority of the Trustees at any regular meeting or any special meeting of the Trustees. Except as indicated, each individual has held the office shown or other offices in the same company for the past five years.
The fund’s Statement of Additional Information (SAI) includes more information about the Trustees. To request a free copy, call Fidelity at 1-800-835-5092.
Experience, Skills, Attributes, and Qualifications of the Trustees. The Governance and Nominating Committee has adopted a statement of policy that describes the experience, qualifications, attributes, and skills that are necessary and desirable for potential Independent Trustee candidates (Statement of Policy). The Board believes that each Trustee satisfied at the time he or she was initially elected or appointed a Trustee, and continues to satisfy, the standards contemplated by the Statement of Policy. The Governance and Nominating Committee also engages professional search firms to help identify potential Independent Trustee candidates who have the experience, qualifications, attributes, and skills consistent with the Statement of Policy. From time to time, additional criteria based on the composition and skills of the current Independent Trustees, as well as experience or skills that may be appropriate in light of future changes to board composition, business conditions, and regulatory or other developments, have also been considered by the professional search firms and the Governance and Nominating Committee. In addition, the Board takes into account the Trustees' commitment and participation in Board and committee meetings, as well as their leadership of standing and ad hoc committees throughout their tenure.
In determining that a particular Trustee was and continues to be qualified to serve as a Trustee, the Board has considered a variety of criteria, none of which, in isolation, was controlling. The Board believes that, collectively, the Trustees have balanced and diverse experience, qualifications, attributes, and skills, which allow the Board to operate effectively in governing the fund and protecting the interests of shareholders. Information about the specific experience, skills, attributes, and qualifications of each Trustee, which in each case led to the Board's conclusion that the Trustee should serve (or continue to serve) as a trustee of the fund, is provided below.
Board Structure and Oversight Function. Robert A. Lawrence is an interested person and currently serves as Chair. The Trustees have determined that an interested Chair is appropriate and benefits shareholders because an interested Chair has a personal and professional stake in the quality and continuity of services provided to the fund. Independent Trustees exercise their informed business judgment to appoint an individual of their choosing to serve as Chair, regardless of whether the Trustee happens to be independent or a member of management. The Independent Trustees have determined that they can act independently and effectively without having an Independent Trustee serve as Chair and that a key structural component for assuring that they are in a position to do so is for the Independent Trustees to constitute a substantial majority for the Board. The Independent Trustees also regularly meet in executive session. David M. Thomas serves as Lead Independent Trustee and as such (i) acts as a liaison between the Independent Trustees and management with respect to matters important to the Independent Trustees and (ii) with management prepares agendas for Board meetings.
Fidelity® funds are overseen by different Boards of Trustees. The fund's Board oversees Fidelity's high income and certain equity funds, and other Boards oversee Fidelity's investment-grade bond, money market, asset allocation, and other equity funds. The asset allocation funds may invest in Fidelity® funds overseen by the fund's Board. The use of separate Boards, each with its own committee structure, allows the Trustees of each group of Fidelity® funds to focus on the unique issues of the funds they oversee, including common research, investment, and operational issues. On occasion, the separate Boards establish joint committees to address issues of overlapping consequences for the Fidelity® funds overseen by each Board.
The Trustees operate using a system of committees to facilitate the timely and efficient consideration of all matters of importance to the Trustees, the fund, and fund shareholders and to facilitate compliance with legal and regulatory requirements and oversight of the fund's activities and associated risks. The Board, acting through its committees, has charged FMR and its affiliates with (i) identifying events or circumstances the occurrence of which could have demonstrably adverse effects on the fund's business and/or reputation; (ii) implementing processes and controls to lessen the possibility that such events or circumstances occur or to mitigate the effects of such events or circumstances if they do occur; and (iii) creating and maintaining a system designed to evaluate continuously business and market conditions in order to facilitate the identification and implementation processes described in (i) and (ii) above. Because the day-to-day operations and activities of the fund are carried out by or through FMR, its affiliates, and other service providers, the fund's exposure to risks is mitigated but not eliminated by the processes overseen by the Trustees. While each of the Board's committees has responsibility for overseeing different aspects of the fund's activities, oversight is exercised primarily through the Operations, Audit, and Compliance Committees. Appropriate personnel, including but not limited to the fund's Chief Compliance Officer (CCO), FMR's internal auditor, the independent accountants, the fund's Treasurer and portfolio management personnel, make periodic reports to the Board's committees, as appropriate, including an annual review of Fidelity's risk management program for the Fidelity® funds. The responsibilities of each standing committee, including their oversight responsibilities, are described further under "Standing Committees of the Trustees."
Interested Trustees*:
Correspondence intended for a Trustee who is an interested person may be sent to Fidelity Investments, 245 Summer Street, Boston, Massachusetts 02210.
Name, Year of Birth; Principal Occupations and Other Relevant Experience+
Jonathan Chiel (1957)
Year of Election or Appointment: 2016
Trustee
Mr. Chiel also serves as Trustee of other Fidelity® funds. Mr. Chiel is Executive Vice President and General Counsel for FMR LLC (diversified financial services company, 2012-present). Previously, Mr. Chiel served as general counsel (2004-2012) and senior vice president and deputy general counsel (2000-2004) for John Hancock Financial Services; a partner with Choate, Hall & Stewart (1996-2000) (law firm); and an Assistant United States Attorney for the United States Attorney’s Office of the District of Massachusetts (1986-95), including Chief of the Criminal Division (1993-1995). Mr. Chiel is a director on the boards of the Boston Bar Foundation and the Maimonides School.
Bettina Doulton (1964)
Year of Election or Appointment: 2021
Trustee
Ms. Doulton also serves as Trustee of other Fidelity® funds. Prior to her retirement, Ms. Doulton served in a variety of positions at Fidelity Investments, including as a managing director of research (2006-2007), portfolio manager to certain Fidelity® funds (1993-2005), equity analyst and portfolio assistant (1990-1993), and research assistant (1987-1990). Ms. Doulton currently owns and operates Phi Builders + Architects and Cellardoor Winery. Previously, Ms. Doulton served as a member of the Board of Brown Capital Management, LLC (2014-2018).
Robert A. Lawrence (1952)
Year of Election or Appointment: 2020
Trustee
Chair of the Board of Trustees
Mr. Lawrence also serves as Trustee of other funds. Previously, Mr. Lawrence served as a Trustee and Member of the Advisory Board of certain funds. Prior to his retirement in 2008, Mr. Lawrence served as Vice President of certain Fidelity® funds (2006-2008), Senior Vice President, Head of High Income Division of Fidelity Management & Research Company (investment adviser firm, 2006-2008), and President of Fidelity Strategic Investments (investment adviser firm, 2002-2005).
* Determined to be an “Interested Trustee” by virtue of, among other things, his or her affiliation with the trust or various entities under common control with FMR.
+ The information includes the Trustee's principal occupation during the last five years and other information relating to the experience, attributes, and skills relevant to the Trustee's qualifications to serve as a Trustee, which led to the conclusion that the Trustee should serve as a Trustee for the fund.
Independent Trustees:
Correspondence intended for an Independent Trustee may be sent to Fidelity Investments, P.O. Box 55235, Boston, Massachusetts 02205-5235.
Name, Year of Birth; Principal Occupations and Other Relevant Experience+
Thomas P. Bostick (1956)
Year of Election or Appointment: 2021
Trustee
Lieutenant General Bostick also serves as Trustee of other Fidelity® funds. Prior to his retirement, General Bostick (United States Army, Retired) held a variety of positions within the U.S. Army, including Commanding General and Chief of Engineers, U.S. Army Corps of Engineers (2012-2016) and Deputy Chief of Staff and Director of Human Resources, U.S. Army (2009-2012). General Bostick currently serves as a member of the Board and Finance and Governance Committees of CSX Corporation (transportation, 2020-present) and a member of the Board and Corporate Governance and Nominating Committee of Perma-Fix Environmental Services, Inc. (nuclear waste management, 2020-present). General Bostick serves as Chief Executive Officer of Bostick Global Strategies, LLC (consulting, 2016-present) and as a member of the Board of HireVue, Inc. (video interview and assessment, 2020-present). Previously, General Bostick served as a Member of the Advisory Board of certain Fidelity® funds (2021), President, Intrexon Bioengineering (2018-2020) and Chief Operating Officer (2017-2020) and Senior Vice President of the Environment Sector (2016-2017) of Intrexon Corporation (biopharmaceutical company).
Dennis J. Dirks (1948)
Year of Election or Appointment: 2005
Trustee
Mr. Dirks also serves as Trustee of other Fidelity® funds. Prior to his retirement in May 2003, Mr. Dirks served as Chief Operating Officer and as a member of the Board of The Depository Trust & Clearing Corporation (financial markets infrastructure), President, Chief Operating Officer and a member of the Board of The Depository Trust Company (DTC), President and a member of the Board of the National Securities Clearing Corporation (NSCC), Chief Executive Officer and a member of the Board of the Government Securities Clearing Corporation and Chief Executive Officer and a member of the Board of the Mortgage-Backed Securities Clearing Corporation. Mr. Dirks currently serves as a member of the Finance Committee (2016-present) and Board (2017-present) and is Treasurer (2018-present) of the Asolo Repertory Theatre.
Donald F. Donahue (1950)
Year of Election or Appointment: 2018
Trustee
Mr. Donahue also serves as Trustee of other Fidelity® funds. Mr. Donahue serves as President and Chief Executive Officer of Miranda Partners, LLC (risk consulting for the financial services industry, 2012-present). Previously, Mr. Donahue served as Chief Executive Officer (2006-2012), Chief Operating Officer (2003-2006) and Managing Director, Customer Marketing and Development (1999-2003) of The Depository Trust & Clearing Corporation (financial markets infrastructure). Mr. Donahue currently serves as a member (2007-present) and Co-Chairman (2016-present) of the Board of United Way of New York and a member of the Board of The Leadership Academy (previously NYC Leadership Academy) (2012-present). Mr. Donahue previously served as a member of the Advisory Board of certain Fidelity® funds (2015-2018).
Vicki L. Fuller (1957)
Year of Election or Appointment: 2020
Trustee
Ms. Fuller also serves as Trustee of other Fidelity® funds. Previously, Ms. Fuller served as a member of the Advisory Board of certain Fidelity® funds (2018-2020), Chief Investment Officer of the New York State Common Retirement Fund (2012-2018) and held a variety of positions at AllianceBernstein L.P. (global asset management, 1985-2012), including Managing Director (2006-2012) and Senior Vice President and Senior Portfolio Manager (2001-2006). Ms. Fuller currently serves as a member of the Board, Audit Committee and Nominating and Governance Committee of two Blackstone business development companies (2020-present), as a member of the Board of Treliant, LLC (consulting, 2019-present), as a member of the Advisory Board of Ariel Alternatives, LLC (private equity, 2021-present) and as a member of the Board and Chair of the Audit Committee of Gusto, Inc. (software, 2021-present). In addition, Ms. Fuller currently serves as a member of the Board of Roosevelt University (2019-present) and as a member of the Executive Board of New York University’s Stern School of Business. Ms. Fuller previously served as a member of the Board, Audit Committee and Nominating and Governance Committee of The Williams Companies, Inc. (natural gas infrastructure, 2018-2021).
Patricia L. Kampling (1959)
Year of Election or Appointment: 2020
Trustee
Ms. Kampling also serves as Trustee of other Fidelity® funds. Prior to her retirement, Ms. Kampling served as Chairman of the Board and Chief Executive Officer (2012-2019), President and Chief Operating Officer (2011-2012) and Executive Vice President and Chief Financial Officer (2010-2011) of Alliant Energy Corporation. Ms. Kampling currently serves as a member of the Board, Finance Committee and Governance, Compensation and Nominating Committee of Xcel Energy Inc. (utilities company, 2020-present) and as a member of the Board, Audit, Finance and Risk Committee and Safety, Environmental, Technology and Operations Committee and Chair of the Executive Development and Compensation Committee of American Water Works Company, Inc. (utilities company, 2019-present). In addition, Ms. Kampling currently serves as a member of the Board of the Nature Conservancy, Wisconsin Chapter (2019-present). Previously, Ms. Kampling served as a Member of the Advisory Board of certain Fidelity® funds (2020), a member of the Board, Compensation Committee and Executive Committee and Chair of the Audit Committee of Briggs & Stratton Corporation (manufacturing, 2011-2021), a member of the Board of Interstate Power and Light Company (2012-2019) and Wisconsin Power and Light Company (2012-2019) (each a subsidiary of Alliant Energy Corporation) and as a member of the Board and Workforce Development Committee of the Business Roundtable (2018-2019).
Thomas A. Kennedy (1955)
Year of Election or Appointment: 2021
Trustee
Mr. Kennedy also serves as Trustee of other Fidelity® funds. Previously, Mr. Kennedy served as a Member of the Advisory Board of certain Fidelity® funds (2020) and held a variety of positions at Raytheon Company (aerospace and defense, 1983-2020), including Chairman and Chief Executive Officer (2014-2020) and Executive Vice President and Chief Operating Officer (2013-2014). Mr. Kennedy currently serves as Executive Chairman of the Board of Directors of Raytheon Technologies Corporation (aerospace and defense, 2020-present). He is also a member of the Rutgers School of Engineering Industry Advisory Board (2011-present) and a member of the UCLA Engineering Dean’s Executive Board (2016-present).
Oscar Munoz (1959)
Year of Election or Appointment: 2021
Trustee
Mr. Munoz also serves as Trustee of other Fidelity® funds. Prior to his retirement, Mr. Munoz served as Executive Chairman (2020-2021), Chief Executive Officer (2015-2020), President (2015-2016) and a member of the Board (2010-2021) of United Airlines Holdings, Inc. Mr. Munoz currently serves as a member of the Board of CBRE Group, Inc. (commercial real estate, 2020-present), a member of the Board of Univision Communications, Inc. (Hispanic media, 2020-present) and a member of the Advisory Board of Salesforce.com, Inc. (cloud-based software, 2020-present). Previously, Mr. Munoz served as a Member of the Advisory Board of certain Fidelity® funds (2021).
Garnett A. Smith (1947)
Year of Election or Appointment: 2018
Trustee
Mr. Smith also serves as Trustee of other Fidelity® funds. Prior to his retirement, Mr. Smith served as Chairman and Chief Executive Officer (1990-1997) and President (1986-1990) of Inbrand Corp. (manufacturer of personal absorbent products). Prior to his employment with Inbrand Corp., he was employed by a retail fabric chain and North Carolina National Bank (now Bank of America). Mr. Smith previously served as a member of the Advisory Board of certain Fidelity® funds (2012-2013).
David M. Thomas (1949)
Year of Election or Appointment: 2008
Trustee
Lead Independent Trustee
Mr. Thomas also serves as Trustee of other Fidelity® funds. Previously, Mr. Thomas served as Executive Chairman (2005-2006) and Chairman and Chief Executive Officer (2000-2005) of IMS Health, Inc. (pharmaceutical and healthcare information solutions). Mr. Thomas currently serves as a member of the Board of Fortune Brands Home and Security (home and security products, 2004-present) and as Director (2013-present) and Non-Executive Chairman of the Board (2022-present) of Interpublic Group of Companies, Inc. (marketing communication).
Susan Tomasky (1953)
Year of Election or Appointment: 2020
Trustee
Ms. Tomasky also serves as Trustee of other Fidelity® funds. Prior to her retirement, Ms. Tomasky served in various executive officer positions at American Electric Power Company, Inc. (1998-2011), including most recently as President of AEP Transmission (2007-2011). Ms. Tomasky currently serves as a member of the Board and Sustainability Committee and as Chair of the Audit Committee of Marathon Petroleum Corporation (2018-present) and as a member of the Board, Executive Committee, Corporate Governance Committee and Organization and Compensation Committee and as Chair of the Audit Committee of Public Service Enterprise Group, Inc. (utilities company, 2012-present) and as a member of the Board of its subsidiary company, Public Service Electric and Gas Co. (2021-present). In addition, Ms. Tomasky currently serves as a member (2009-present) and President (2020-present) of the Board of the Royal Shakespeare Company – America (2009-present), as a member of the Board of the Columbus Association for the Performing Arts (2011-present) and as a member of the Board and Kenyon in the World Committee of Kenyon College (2016-present). Previously, Ms. Tomasky served as a Member of the Advisory Board of certain Fidelity® funds (2020), as a member of the Board of the Columbus Regional Airport Authority (2007-2020), as a member of the Board (2011-2018) and Lead Independent Director (2015-2018) of Andeavor Corporation (previously Tesoro Corporation) (independent oil refiner and marketer) and as a member of the Board of Summit Midstream Partners LP (energy, 2012-2018).
Michael E. Wiley (1950)
Year of Election or Appointment: 2020
Trustee
Mr. Wiley also serves as Trustee of other Fidelity® funds. Previously, Mr. Wiley served as a member of the Advisory Board of certain Fidelity® funds (2018-2020), Chairman, President and CEO of Baker Hughes, Inc. (oilfield services, 2000-2004). Mr. Wiley also previously served as a member of the Board of Andeavor Corporation (independent oil refiner and marketer, 2005-2018), a member of the Board of Andeavor Logistics LP (natural resources logistics, 2015-2018) and a member of the Board of High Point Resources (exploration and production, 2005-2020).
+ The information includes the Trustee's principal occupation during the last five years and other information relating to the experience, attributes, and skills relevant to the Trustee's qualifications to serve as a Trustee, which led to the conclusion that the Trustee should serve as a Trustee for the fund.
Advisory Board Members and Officers:
Correspondence intended for a Member of the Advisory Board (if any) may be sent to Fidelity Investments, P.O. Box 55235, Boston, Massachusetts 02205-5235. Correspondence intended for an officer or Peter S. Lynch may be sent to Fidelity Investments, 245 Summer Street, Boston, Massachusetts 02210. Officers appear below in alphabetical order.
Name, Year of Birth; Principal Occupation
Peter S. Lynch (1944)
Year of Election or Appointment: 2003
Member of the Advisory Board
Mr. Lynch also serves as a Member of the Advisory Board of other Fidelity® funds. Mr. Lynch is Vice Chairman and a Director of Fidelity Management & Research Company LLC (investment adviser firm). In addition, Mr. Lynch serves as a Trustee of Boston College and as the Chairman of the Inner-City Scholarship Fund. Previously, Mr. Lynch served as Vice Chairman and a Director of FMR Co., Inc. (investment adviser firm) and on the Special Olympics International Board of Directors (1997-2006).
Craig S. Brown (1977)
Year of Election or Appointment: 2019
Assistant Treasurer
Mr. Brown also serves as an officer of other funds. Mr. Brown serves as Assistant Treasurer of FIMM, LLC (2021-present) and is an employee of Fidelity Investments (2013-present).
John J. Burke III (1964)
Year of Election or Appointment: 2018
Chief Financial Officer
Mr. Burke also serves as Chief Financial Officer of other funds. Mr. Burke serves as Head of Investment Operations for Fidelity Fund and Investment Operations (2018-present) and is an employee of Fidelity Investments (1998-present). Previously Mr. Burke served as head of Asset Management Investment Operations (2012-2018).
William C. Coffey (1969)
Year of Election or Appointment: 2019
Assistant Secretary
Mr. Coffey also serves as Assistant Secretary of other funds. He is Senior Vice President and Deputy General Counsel of FMR LLC (diversified financial services company, 2010-present), and is an employee of Fidelity Investments. Previously, Mr. Coffey served as Secretary and CLO of certain funds (2018-2019); CLO, Secretary, and Senior Vice President of Fidelity Management & Research Company and FMR Co., Inc. (investment adviser firms, 2018-2019); Secretary of Fidelity SelectCo, LLC and Fidelity Investments Money Management, Inc. (investment adviser firms, 2018-2019); CLO of Fidelity Management & Research (Hong Kong) Limited, FMR Investment Management (UK) Limited, and Fidelity Management & Research (Japan) Limited (investment adviser firms, 2018-2019); and Assistant Secretary of certain funds (2009-2018).
Timothy M. Cohen (1969)
Year of Election or Appointment: 2018
Vice President
Mr. Cohen also serves as Vice President of other funds. Mr. Cohen serves as Co-Head of Equity (2018-present), a Director of Fidelity Management & Research (Japan) Limited (investment adviser firm, 2016-present), and is an employee of Fidelity Investments. Previously, Mr. Cohen served as Executive Vice President of Fidelity SelectCo, LLC (2019), Head of Global Equity Research (2016-2018), Chief Investment Officer - Equity and a Director of Fidelity Management & Research (U.K.) Inc. (investment adviser firm, 2013-2015) and as a Director of Fidelity Management & Research (Hong Kong) Limited (investment adviser firm, 2017).
Jonathan Davis (1968)
Year of Election or Appointment: 2010
Assistant Treasurer
Mr. Davis also serves as an officer of other funds. Mr. Davis serves as Assistant Treasurer of FIMM, LLC (2021-present), FMR Capital, Inc. (2017-present), FD Funds GP LLC (2021-present), FD Funds Holding LLC (2021-present), and FD Funds Management LLC (2021-present); and is an employee of Fidelity Investments. Previously, Mr. Davis served as Vice President and Associate General Counsel of FMR LLC (diversified financial services company, 2003-2010).
Laura M. Del Prato (1964)
Year of Election or Appointment: 2018
Assistant Treasurer
Ms. Del Prato also serves as an officer of other funds. Ms. Del Prato serves as Assistant Treasurer of FIMM, LLC (2021-present) and is an employee of Fidelity Investments (2017-present). Previously, Ms. Del Prato served as President and Treasurer of The North Carolina Capital Management Trust: Cash Portfolio and Term Portfolio (2018-2020). Prior to joining Fidelity Investments, Ms. Del Prato served as a Managing Director and Treasurer of the JPMorgan Mutual Funds (2014-2017). Prior to JPMorgan, Ms. Del Prato served as a partner at Cohen Fund Audit Services (accounting firm, 2012-2013) and KPMG LLP (accounting firm, 2004-2012).
Colm A. Hogan (1973)
Year of Election or Appointment: 2020
Assistant Treasurer
Mr. Hogan also serves as an officer of other funds. Mr. Hogan serves as Assistant Treasurer of FIMM, LLC (2021-present) and FMR Capital, Inc. (2017-present) and is an employee of Fidelity Investments (2005-present). Previously, Mr. Hogan served as Deputy Treasurer of certain Fidelity® funds (2016-2020) and Assistant Treasurer of certain Fidelity® funds (2016-2018).
Pamela R. Holding (1964)
Year of Election or Appointment: 2018
Vice President
Ms. Holding also serves as Vice President of other funds. Ms. Holding serves as Co-Head of Equity (2018-present) and is an employee of Fidelity Investments (2013-present). Previously, Ms. Holding served as Executive Vice President of Fidelity SelectCo, LLC (2019) and as Chief Investment Officer of Fidelity Institutional Asset Management (2013-2018).
Cynthia Lo Bessette (1969)
Year of Election or Appointment: 2019
Secretary and Chief Legal Officer (CLO)
Ms. Lo Bessette also serves as an officer of other funds. Ms. Lo Bessette serves as CLO, Secretary, and Senior Vice President of Fidelity Management & Research Company LLC (investment adviser firm, 2019-present); CLO of Fidelity Management & Research (Hong Kong) Limited, FMR Investment Management (UK) Limited, and Fidelity Management & Research (Japan) Limited (investment adviser firms, 2019-present); Secretary of FD Funds GP LLC (2021-present), FD Funds Holding LLC (2021-present), and FD Funds Management LLC (2021-present); and Assistant Secretary of FIMM, LLC (2019-present). She is a Senior Vice President and Deputy General Counsel of FMR LLC (diversified financial services company, 2019-present), and is an employee of Fidelity Investments. Previously, Ms. Lo Bessette served as CLO, Secretary, and Senior Vice President of FMR Co., Inc. (investment adviser firm, 2019); Secretary of Fidelity SelectCo, LLC and Fidelity Investments Money Management, Inc. (investment adviser firms, 2019). Prior to joining Fidelity Investments, Ms. Lo Bessette was Executive Vice President, General Counsel (2016-2019) and Senior Vice President, Deputy General Counsel (2015-2016) of OppenheimerFunds (investment management company) and Deputy Chief Legal Officer (2013-2015) of Jennison Associates LLC (investment adviser firm).
Chris Maher (1972)
Year of Election or Appointment: 2020
Deputy Treasurer
Mr. Maher also serves as an officer of other funds. Mr. Maher serves as Assistant Treasurer of FIMM, LLC (2021-present) and FMR Capital, Inc. (2017-present), and is an employee of Fidelity Investments (2008-present). Previously, Mr. Maher served as Assistant Treasurer of certain funds (2013-2020); Vice President of Asset Management Compliance (2013), Vice President of the Program Management Group of FMR (investment adviser firm, 2010-2013), and Vice President of Valuation Oversight (2008-2010).
Jason P. Pogorelec (1975)
Year of Election or Appointment: 2020
Chief Compliance Officer
Mr. Pogorelec also serves as Chief Compliance Officer of other funds. Mr. Pogorelec is a senior Vice President of Asset Management Compliance for Fidelity Investments and is an employee of Fidelity Investments (2006-present). Previously, Mr. Pogorelec served as Vice President, Associate General Counsel for Fidelity Investments (2010-2020) and Assistant Secretary of certain Fidelity funds (2015-2020).
Brett Segaloff (1972)
Year of Election or Appointment: 2021
Anti-Money Laundering (AML) Officer
Mr. Segaloff also serves as an AML Officer of other funds and other related entities. He is Director, Anti-Money Laundering (2007-present) of FMR LLC (diversified financial services company) and is an employee of Fidelity Investments (1996-present).
Stacie M. Smith (1974)
Year of Election or Appointment: 2016
President and Treasurer
Ms. Smith also serves as an officer of other funds. Ms. Smith serves as Assistant Treasurer of FIMM, LLC (2021-present) and FMR Capital, Inc. (2017-present), is an employee of Fidelity Investments (2009-present), and has served in other fund officer roles. Prior to joining Fidelity Investments, Ms. Smith served as Senior Audit Manager of Ernst & Young LLP (accounting firm, 1996-2009). Previously, Ms. Smith served as Assistant Treasurer (2013-2019) and Deputy Treasurer (2013-2016) of certain Fidelity® funds.
Jim Wegmann (1979)
Year of Election or Appointment: 2019
Assistant Treasurer
Mr. Wegmann also serves as an officer of other funds. Mr. Wegmann serves as Assistant Treasurer of FIMM, LLC (2021-present) and is an employee of Fidelity Investments (2011-present). Previously, Mr. Wegmann served as Assistant Treasurer of certain Fidelity® funds (2019-2021).
Shareholder Expense Example
As a shareholder, you incur two types of costs: (1) transaction costs, which may include sales charges (loads) on purchase payments or redemption proceeds, as applicable and (2) ongoing costs, which generally include management fees, distribution and/or service (12b-1) fees and other Fund expenses. This Example is intended to help you understand your ongoing costs (in dollars) of investing in a fund and to compare these costs with the ongoing costs of investing in other mutual funds.
The Example is based on an investment of $1,000 invested at the beginning of the period and held for the entire period (February 1, 2022 to July 31, 2022).
Actual Expenses
The first line of the accompanying table provides information about actual account values and actual expenses. You may use the information in this line, together with the amount you invested, to estimate the expenses that you paid over the period. Simply divide your account value by $1,000.00 (for example, an $8,600 account value divided by $1,000.00 = 8.6), then multiply the result by the number in the first line for a class/Fund under the heading entitled "Expenses Paid During Period" to estimate the expenses you paid on your account during this period. If any fund is a shareholder of any underlying mutual funds or exchange-traded funds (ETFs) (the Underlying Funds), such fund indirectly bears its proportional share of the expenses of the Underlying Funds in addition to the direct expenses incurred presented in the table. These fees and expenses are not included in the annualized expense ratio used to calculate the expense estimate in the table below.
Hypothetical Example for Comparison Purposes
The second line of the accompanying table provides information about hypothetical account values and hypothetical expenses based on the actual expense ratio and an assumed rate of return of 5% per year before expenses, which is not the actual return. The hypothetical account values and expenses may not be used to estimate the actual ending account balance or expenses you paid for the period. You may use this information to compare the ongoing costs of investing in the Fund and other funds. To do so, compare this 5% hypothetical example with the 5% hypothetical examples that appear in the shareholder reports of the other funds. If any fund is a shareholder of any Underlying Funds, such fund indirectly bears its proportional share of the expenses of the Underlying Funds in addition to the direct expenses as presented in the table. These fees and expenses are not included in the annualized expense ratio used to calculate the expense estimate in the table below.
Please note that the expenses shown in the table are meant to highlight your ongoing costs only and do not reflect any transaction costs. Therefore, the second line of the table is useful in comparing ongoing costs only, and will not help you determine the relative total costs of owning different funds. In addition, if these transactional costs were included, your costs would have been higher.
| | Annualized Expense Ratio-A | Beginning
Account Value
February 1, 2022 | Ending
Account Value
July 31, 2022 | Expenses Paid
During Period-B
February 1, 2022
to July 31, 2022 |
| Fidelity OTC K6 Portfolio | .50% | | | |
| Actual | | $1,000.00 | $831.40 | $2.27 |
| Hypothetical-C | | $1,000.00 | $1,022.32 | $2.51 |
A Annualized expense ratio reflects expenses net of applicable fee waivers.
B Expenses are equal to the annualized expense ratio, multiplied by the average account value over the period, multiplied by 181/ 365 (to reflect the one-half year period). The fees and expenses of any Underlying Funds are not included in each annualized expense ratio.
C 5% return per year before expenses
Distributions (Unaudited)
The dividend and capital gains distributions for the fund are available on Fidelity.com or Institutional.Fidelity.com.
The fund hereby designates as a capital gain dividend with respect to the taxable year ended July 31, 2022, $20,390,636, or, if subsequently determined to be different, the net capital gain of such year.
The fund designates 99.84% and 95.26% of the short-term capital gain dividends distributed in September and December, respectively during the fiscal year as qualifying to be taxed as short-term capital gain dividends for nonresident alien shareholders.
The fund designates 15% and 100% of the dividends distributed in September and December, respectively during the fiscal year as qualifying for the dividends–received deduction for corporate shareholders.
The fund designates 19% and 100% of the dividends distributed in September and December, respectively during the fiscal year as amounts which may be taken into account as a dividend for the purposes of the maximum rate under section 1(h)(11) of the Internal Revenue Code.
The fund designates 1% of the dividend distributed in September, during the fiscal year as a section 199A dividend.
The fund will notify shareholders in January 2023 of amounts for use in preparing 2022 income tax returns.
Board Approval of Investment Advisory Contracts and Management Fees
Fidelity OTC K6 Portfolio
Each year, the Board of Trustees, including the Independent Trustees (together, the Board), votes on the renewal of the management contract with Fidelity Management & Research Company LLC (FMR) and the sub-advisory agreements (together, the Advisory Contracts) for the fund. FMR and the sub-advisers are referred to herein as the Investment Advisers. The Board, assisted by the advice of fund counsel and Independent Trustees' counsel, requests and considers a broad range of information relevant to the renewal of the Advisory Contracts throughout the year.
The Board meets regularly and, at each of its meetings, covers an extensive agenda of topics and materials and considers factors that are relevant to its annual consideration of the renewal of the fund's Advisory Contracts, including the services and support provided to the fund and its shareholders. The Board has established various standing committees (Committees), each composed of and chaired by Independent Trustees with varying backgrounds, to which the Board has assigned specific subject matter responsibilities in order to enhance effective decision-making by the Board. The Board, acting directly and through its Committees, requests and receives information concerning the annual consideration of the renewal of the fund's Advisory Contracts. The Board also meets as needed to review matters specifically related to the Board's annual consideration of the renewal of the Advisory Contracts. Members of the Board may also meet with trustees of other Fidelity funds through joint ad hoc committees to discuss certain matters relevant to all of the Fidelity funds.
At its May 2022 meeting, the Board unanimously determined to renew the fund's Advisory Contracts. In reaching its determination, the Board considered all factors it believed relevant, including (i) the nature, extent, and quality of the services provided to the fund and its shareholders (including the investment performance of the fund); (ii) the competitiveness relative to peer funds of the fund's management fee and total expense ratio; (iii) the total costs of the services provided by and the profits realized by Fidelity from its relationships with the fund; and (iv) the extent to which, if any, economies of scale exist and are realized as the fund grows, and whether any economies of scale are appropriately shared with fund shareholders.
In considering whether to renew the Advisory Contracts for the fund, the Board reached a determination, with the assistance of fund counsel and Independent Trustees' counsel and through the exercise of its business judgment, that the renewal of the Advisory Contracts was in the best interests of the fund and its shareholders and that the compensation payable under the Advisory Contracts was fair and reasonable. The Board's decision to renew the Advisory Contracts was not based on any single factor, but rather was based on a comprehensive consideration of all the information provided to the Board at its meetings throughout the year. The Board, in reaching its determination to renew the Advisory Contracts, was aware that shareholders of the fund have a broad range of investment choices available to them, including a wide choice among funds offered by Fidelity's competitors, and that the fund's shareholders, who have the opportunity to review and weigh the disclosure provided by the fund in its prospectus and other public disclosures, have chosen to invest in this fund, which is part of the Fidelity family of funds.
Nature, Extent, and Quality of Services Provided. The Board considered Fidelity's staffing as it relates to the fund, including the backgrounds of investment personnel of Fidelity, and also considered the fund's investment objective, strategies, and related investment philosophy. The Independent Trustees also had discussions with senior management of Fidelity's investment operations and investment groups. The Board considered the structure of the investment personnel compensation program and whether this structure provides appropriate incentives to act in the best interests of the fund. Additionally, the Board considered the portfolio managers' investments, if any, in the funds that they manage. The Board also considered the steps Fidelity had taken to ensure the continued provision of high quality services to the Fidelity funds during the COVID-19 pandemic, including the expansion of staff in client facing positions to maintain service levels in periods of high volumes and volatility.
Resources Dedicated to Investment Management and Support Services. The Board and the Fund Oversight and Research Committees reviewed the general qualifications and capabilities of Fidelity's investment staff, including its size, education, experience, and resources, as well as Fidelity's approach to recruiting, training, managing, and compensating investment personnel. The Board noted the resources devoted to expansion of Fidelity's global investment organization and that Fidelity's analysts have extensive resources, tools, and capabilities that allow them to conduct sophisticated quantitative and fundamental analysis, as well as credit analysis of issuers, counterparties, and guarantors. Further, the Board considered that Fidelity's investment professionals have sufficient access to global information and data so as to provide competitive investment results over time, and that those professionals also have access to sophisticated tools that permit them to assess portfolio construction and risk and performance attribution characteristics continuously, as well as to transmit new information and research conclusions rapidly around the world. Additionally, in its deliberations, the Board considered Fidelity's trading, risk management, compliance, and technology and operations capabilities and resources, which are integral parts of the investment management process.
Shareholder and Administrative Services. The Board considered (i) the nature, extent, quality, and cost of advisory, administrative, and shareholder services performed by the Investment Advisers and their affiliates under the Advisory Contracts and under separate agreements covering transfer agency, pricing and bookkeeping, and securities lending services for the fund; (ii) the nature and extent of the supervision of third party service providers, principally custodians, subcustodians, and pricing vendors; and (iii) the resources devoted to, and the record of compliance with, the fund's compliance policies and procedures. The Board also reviewed the allocation of fund brokerage, including allocations to brokers affiliated with the Investment Advisers, the use of brokerage commissions to pay fund expenses, and the use of "soft" commission dollars to pay for research services.
Investment in a Large Fund Family. The Board considered the benefits to shareholders of investing in a Fidelity fund, including the benefits of investing in a fund that is part of a large family of funds offering a variety of investment disciplines and providing a large variety of mutual fund investor services. The Board noted that Fidelity had taken, or had made recommendations that resulted in the Fidelity funds taking, a number of actions over the previous year that benefited particular funds, including: (i) continuing to dedicate additional resources to Fidelity's investment research process, which includes meetings with management of issuers of securities in which the funds invest; (ii) continuing efforts to enhance Fidelity's global research capabilities; (iii) launching new funds and ETFs with innovative structures, strategies and pricing and making other enhancements to meet client needs; (iv) launching new share classes of existing funds; (v) eliminating purchase minimums and broadening eligibility requirements for certain funds and share classes; (vi) reducing management fees and total expenses for certain target date funds and classes and index funds; (vii) lowering expenses for certain existing funds and classes by implementing or lowering expense caps; (viii) rationalizing product lines and gaining increased efficiencies from fund mergers and liquidations; (ix) continuing to develop, acquire and implement systems and technology to improve services to the funds and shareholders, strengthen information security, and increase efficiency; and (x) continuing to implement enhancements to further strengthen Fidelity's product line to increase investors' probability of success in achieving their investment goals, including retirement income goals.
Investment Performance. The Board considered whether the fund has operated in accordance with its investment objective, as well as its record of compliance with its investment restrictions and its performance history.
The Board took into account discussions that occur at Board meetings throughout the year with representatives of the Investment Advisers about fund investment performance. In this regard the Board noted that as part of regularly scheduled fund reviews and other reports to the Board on fund performance, the Board considers annualized return information for the fund for different time periods, measured against an appropriate securities market index (benchmark index) and an appropriate peer group of funds with similar objectives (peer group). The Board also reviews and considers information about performance attribution. In its evaluation of fund investment performance, the Board gave particular attention to information indicating changes in performance of certain Fidelity funds for specific time periods and discussed with the Investment Advisers the reasons for any overperformance or underperformance.
In addition to reviewing absolute and relative fund performance, the Independent Trustees periodically consider the appropriateness of fund performance metrics in evaluating the results achieved. In general, the Independent Trustees believe that fund performance should be evaluated based on net performance (after fees and expenses) of the fund, compared to appropriate benchmark indices, over appropriate time periods that may include full market cycles, and compared to peer groups, as applicable, over the same periods, taking into account relevant factors including the following: general market conditions; issuer-specific information; and fund cash flows and other factors.
The Independent Trustees recognize that shareholders evaluate performance on a net basis over their own holding periods, for which one-, three-, and five-year periods are often used as a proxy. For this reason, the performance information reviewed by the Board also included net total return information for the fund and an appropriate benchmark index and peer group for the most recent one-year period ended September 30, 2021, as shown below. Returns are shown compared to the 25th percentile (top of box, 75% beaten) and 75th percentile (bottom of box, 25% beaten) of the peer universe.
Fidelity OTC K6 Portfolio
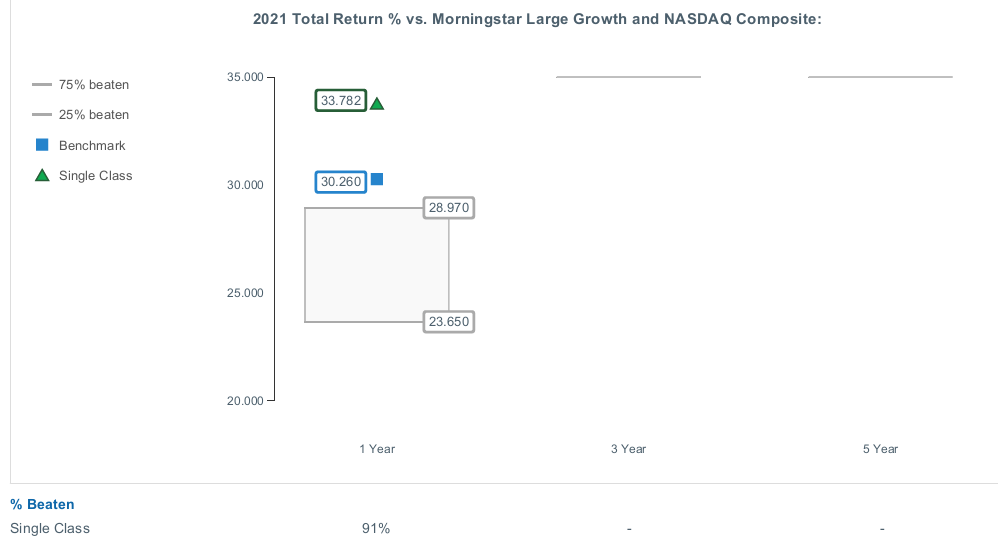
Based on its review, the Board concluded that the nature, extent, and quality of services provided to the fund under the Advisory Contracts should continue to benefit the shareholders of the fund.
Competitiveness of Management Fee and Total Expense Ratio. The Board considered the fund's management fee and total expense ratio compared to "mapped groups" of competitive funds and classes created for the purpose of facilitating the Trustees' competitive analysis of management fees and total expenses. Fidelity creates "mapped groups" by combining similar Lipper investment objective categories that have comparable investment mandates. Combining Lipper investment objective categories aids the Board's management fee and total expense ratio comparisons by broadening the competitive group used for comparison.
Management Fee. The Board considered two proprietary management fee comparisons for the 12-month (or shorter) periods ended September 30 (June 30 for the period ended 2019) shown in basis points (BP) in the chart below. The group of Lipper funds used by the Board for management fee comparisons is referred to below as the "Total Mapped Group." The Total Mapped Group comparison focuses on a fund's standing in terms of gross management fees before expense reimbursements or caps relative to the total universe of funds with comparable investment mandates, regardless of whether their management fee structures also are comparable. Funds with comparable investment mandates offer exposure to similar types of securities. Funds with comparable management fee structures have similar management fee contractual arrangements (e.g., flat rate charged for advisory services, all-inclusive fee rate, etc.). "TMG %" represents the percentage of funds in the Total Mapped Group that had management fees that were lower than the fund's. For example, a hypothetical TMG % of 20% would mean that 80% of the funds in the Total Mapped Group had higher, and 20% had lower, management fees than the fund. The fund's actual TMG %s and the number of funds in the Total Mapped Group are in the chart below. The "Asset-Sized Peer Group" (ASPG) comparison focuses on a fund's standing relative to a subset of non-Fidelity funds within the Total Mapped Group that are similar in size and management fee structure. For example, if a fund is in the first quartile of the ASPG, the fund's management fee ranks in the least expensive or lowest 25% of funds in the ASPG. The ASPG represents at least 15% of the funds in the Total Mapped Group with comparable asset size and management fee structures, subject to a minimum of 50 funds (or all funds in the Total Mapped Group if fewer than 50). Additional information, such as the ASPG quartile in which the fund's management fee rate ranked is also included in the chart and was considered by the Board.
Fidelity OTC K6 Portfolio
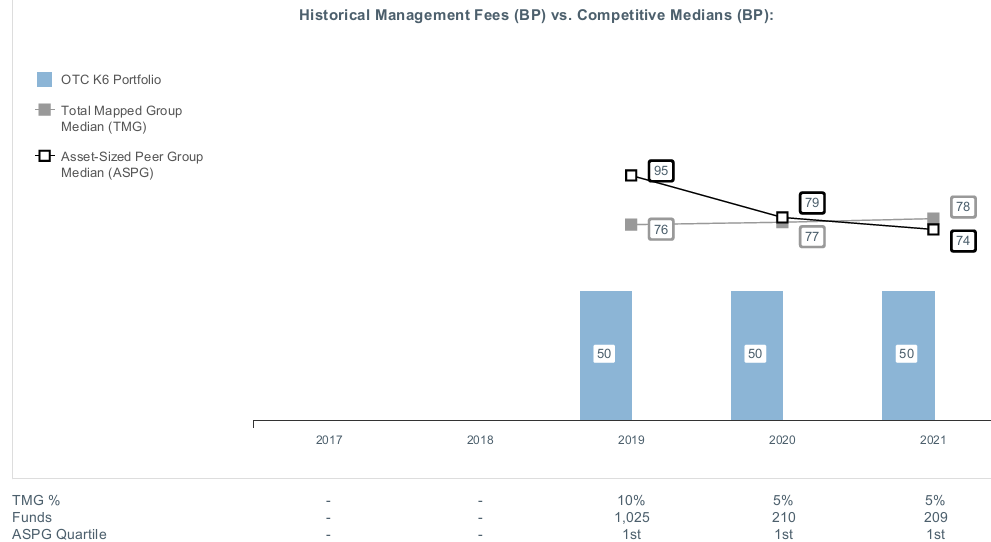
The Board noted that the fund's management fee rate ranked below the median of its Total Mapped Group and below the median of its ASPG for the 12-month period ended September 30, 2021.
The Board also considered that, for funds subject to the group fee, FMR agreed to voluntarily waive fees over a specified period of time in amounts designed to account for assets converted from certain funds to certain collective investment trusts.
Based on its review, the Board concluded that the fund's management fee is fair and reasonable in light of the services that the fund receives and the other factors considered.
Total Expense Ratio. In its review of the fund's total expense ratio, the Board considered the fund's unitary fee rate as well as other fund expenses paid by FMR under the fund's management contract, such as transfer agent fees, pricing and bookkeeping fees, and custodial, legal, and audit fees. The Board also noted that Fidelity may agree to waive fees or reimburse expenses from time to time, and the extent to which, if any, it has done so for the fund The fund is compared to those funds and classes in the Total Mapped Group (used by the Board for management fee comparisons) that have a similar sales load structure. The Board also considered a total expense ASPG comparison for the fund, which focuses on the total expenses of the fund relative to a subset of non-Fidelity funds within the total expense similar sales load structure group. The total expense ASPG is limited to 15 larger and 15 smaller classes in fund average assets for a total of 30 classes, where possible. The total expense ASPG comparison excludes performance adjustments and fund-paid 12b-1 fees to eliminate variability in fee structures.
The Board noted that the fund's total net expense ratio ranked below the similar sales load structure group competitive median and below the ASPG competitive median for the 12-month period ended September 30, 2021.
Fees Charged to Other Fidelity Clients. The Board also considered Fidelity fee structures and other information with respect to clients of Fidelity, such as other funds advised or subadvised by Fidelity, pension plan clients, and other institutional clients with similar mandates. The Board noted that a joint ad hoc committee created by it and the boards of other Fidelity funds periodically reviews and compares Fidelity's institutional investment advisory business with its business of providing services to the Fidelity funds and also noted the most recent findings of the committee. The Board noted that the committee's review included a consideration of the differences in services provided, fees charged, and costs incurred, as well as competition in the markets serving the different categories of clients.
Based on its review of total expense ratios and fees charged to other Fidelity clients, the Board concluded that the fund's total expense ratio was reasonable in light of the services that the fund and its shareholders receive and the other factors considered.
Costs of the Services and Profitability. The Board considered the revenues earned and the expenses incurred by Fidelity in conducting the business of developing, marketing, distributing, managing, administering and servicing the fund and servicing the fund's shareholders. The Board also considered the level of Fidelity's profits in respect of all the Fidelity funds.
On an annual basis, Fidelity presents to the Board information about the profitability of its relationships with the fund. Fidelity calculates profitability information for each fund, as well as aggregate profitability information for groups of Fidelity funds and all Fidelity funds, using a series of detailed revenue and cost allocation methodologies which originate with the books and records of Fidelity on which Fidelity's audited financial statements are based. The Audit Committee of the Board reviews any significant changes from the prior year's methodologies and the full Board approves such changes.
A public accounting firm has been engaged annually by the Board as part of the Board's assessment of Fidelity's profitability analysis. The engagement includes the review and assessment of the methodologies used by Fidelity in determining the revenues and expenses attributable to Fidelity's mutual fund business, and completion of agreed-upon procedures in respect of the mathematical accuracy of certain fund profitability information and its conformity to established allocation methodologies. After considering the reports issued under the engagement and information provided by Fidelity, the Board concluded that while other allocation methods may also be reasonable, Fidelity's profitability methodologies are reasonable in all material respects.
The Board also reviewed Fidelity's non-fund businesses and potential indirect benefits such businesses may have received as a result of their association with Fidelity's mutual fund business (i.e., fall-out benefits) as well as cases where Fidelity's affiliates may benefit from the funds' business. The Board's consideration of these matters was informed by the findings of a joint ad hoc committee created by it and the boards of other Fidelity funds to evaluate potential fall-out benefits.
The Board considered the costs of the services provided by and the profits realized by Fidelity in connection with the operation of the fund and was satisfied that the profitability was not excessive.
Economies of Scale. The Board considered whether there have been economies of scale in respect of the management of the Fidelity funds, whether the Fidelity funds (including the fund) have appropriately benefited from any such economies of scale, and whether there is potential for realization of any further economies of scale. The Board considered the extent to which the fund will benefit from economies of scale as assets grow through increased services to the fund, through waivers or reimbursements, or through fee or expense ratio reductions. The Board recognized that, due to the fund's current contractual arrangements, its expense ratio will not decline if the fund's operating costs decrease as assets grow, or rise as assets decrease. The Board also noted that a committee (the Economies of Scale Committee) created by it and the boards of other Fidelity funds periodically analyzes whether Fidelity attains economies of scale in respect of the management and servicing of the Fidelity funds, whether the Fidelity funds have appropriately benefited from such economies of scale, and whether there is potential for realization of any further economies of scale.
The Board concluded, taking into account the analysis of the Economies of Scale Committee, that economies of scale, if any, are being appropriately shared between fund shareholders and Fidelity.
Additional Information Requested by the Board. In order to develop fully the factual basis for consideration of the Fidelity funds' advisory contracts, the Board requested and received additional information on certain topics, including: (i) fund flow and performance trends, in particular the underperformance of certain funds and strategies, and Fidelity's long-term strategies for certain funds, including any consideration of fund liquidations or mergers; (ii) the operation of performance fees, competitor use of performance fees, and consideration of the expansion of performance fees to additional funds; (iii) Fidelity's pricing philosophy compared to competitors; (iv) fund profitability methodology and data; (v) evaluation of competitive fund data and peer group classifications and fee and expense comparisons; (vi) the management fee and expense structures for different funds and classes and information about the differences between various fee and expense structures; (vii) group fee breakpoints and related voluntary fee waivers; and (viii) information regarding other accounts managed by Fidelity and the funds' sub-advisory arrangements.
Based on its evaluation of all of the conclusions noted above, and after considering all factors it believed relevant, the Board concluded that the advisory fee arrangements are fair and reasonable and that the fund's Advisory Contracts should be renewed.
Liquidity Risk Management Program
The Securities and Exchange Commission adopted Rule 22e-4 under the Investment Company Act of 1940 (the Liquidity Rule) to promote effective liquidity risk management throughout the open-end investment company industry, thereby reducing the risk that funds will be unable to meet their redemption obligations and mitigating dilution of the interests of fund shareholders.
The Fund has adopted and implemented a liquidity risk management program pursuant to the Liquidity Rule (the Program) effective December 1, 2018. The Program is reasonably designed to assess and manage the Fund’s liquidity risk and to comply with the requirements of the Liquidity Rule. The Fund’s Board of Trustees (the Board) has designated the Fund’s investment adviser as administrator of the Program. The Fidelity advisers have established a Liquidity Risk Management Committee (the LRM Committee) to manage the Program for each of the Fidelity Funds. The LRM Committee monitors the adequacy and effectiveness of implementation of the Program and on a periodic basis assesses each Fund’s liquidity risk based on a variety of factors including (1) the Fund’s investment strategy, (2) portfolio liquidity and cash flow projections during normal and reasonably foreseeable stressed conditions, (3) shareholder redemptions, (4) borrowings and other funding sources and (5) in the case of exchange-traded funds, certain additional factors including the effect of the Fund’s prices and spreads, market participants, and basket compositions on the overall liquidity of the Fund’s portfolio, as applicable.
In accordance with the Program, each of the Fund’s portfolio investments is classified into one of four liquidity categories described below based on a determination of a reasonable expectation for how long it would take to convert the investment to cash (or sell or dispose of the investment) without significantly changing its market value.
- Highly liquid investments – cash or convertible to cash within three business days or less
- Moderately liquid investments – convertible to cash in three to seven calendar days
- Less liquid investments – can be sold or disposed of, but not settled, within seven calendar days
- Illiquid investments – cannot be sold or disposed of within seven calendar days
Liquidity classification determinations take into account a variety of factors including various market, trading and investment-specific considerations, as well as market depth, and generally utilize analysis from a third-party liquidity metrics service.
The Liquidity Rule places a 15% limit on a fund’s illiquid investments and requires funds that do not primarily hold assets that are highly liquid investments to determine and maintain a minimum percentage of the fund’s net assets to be invested in highly liquid investments (highly liquid investment minimum or HLIM). The Program includes provisions reasonably designed to comply with the 15% limit on illiquid investments and for determining, periodically reviewing and complying with the HLIM requirement as applicable.
At a recent meeting of the Fund’s Board of Trustees, the LRM Committee provided a written report to the Board pertaining to the operation, adequacy, and effectiveness of implementation of the Program for the annual period from December 1, 2020 through November 30, 2021. The report concluded that the Program has been implemented and is operating effectively and is reasonably designed to assess and manage the Fund’s liquidity risk.
OTC-K6-ANN-0922
1.9893897.103
Fidelity® Real Estate Income Fund
Annual Report
July 31, 2022
Includes Fidelity and Fidelity Advisor share classes
Contents
To view a fund's proxy voting guidelines and proxy voting record for the 12-month period ended June 30, visit http://www.fidelity.com/proxyvotingresults or visit the Securities and Exchange Commission's (SEC) web site at http://www.sec.gov.
You may also call 1-800-544-8544 if you’re an individual investing directly with Fidelity, call 1-800-835-5092 if you’re a plan sponsor or participant with Fidelity as your recordkeeper or call 1-877-208-0098 on institutional accounts or if you’re an advisor or invest through one to request a free copy of the proxy voting guidelines.
Standard & Poor's, S&P and S&P 500 are registered service marks of The McGraw-Hill Companies, Inc. and have been licensed for use by Fidelity Distributors Corporation.
Other third-party marks appearing herein are the property of their respective owners.
All other marks appearing herein are registered or unregistered trademarks or service marks of FMR LLC or an affiliated company. © 2022 FMR LLC. All rights reserved.
This report and the financial statements contained herein are submitted for the general information of the shareholders of the Fund. This report is not authorized for distribution to prospective investors in the Fund unless preceded or accompanied by an effective prospectus.
A fund files its complete schedule of portfolio holdings with the SEC for the first and third quarters of each fiscal year on Form N-PORT. Forms N-PORT are available on the SEC’s web site at http://www.sec.gov. A fund's Forms N-PORT may be reviewed and copied at the SEC’s Public Reference Room in Washington, DC. Information regarding the operation of the SEC's Public Reference Room may be obtained by calling 1-800-SEC-0330.
For a complete list of a fund's portfolio holdings, view the most recent holdings listing, semiannual report, or annual report on Fidelity's web site at http://www.fidelity.com, http://www.institutional.fidelity.com, or http://www.401k.com, as applicable.
NOT FDIC INSURED •MAY LOSE VALUE •NO BANK GUARANTEE
Neither the Fund nor Fidelity Distributors Corporation is a bank.
Note to Shareholders:
Early in 2020, the outbreak and spread of COVID-19 emerged as a public health emergency that had a major influence on financial markets, primarily based on its impact on the global economy and corporate earnings. On March 11, 2020, the World Health Organization declared the COVID-19 outbreak a pandemic, citing sustained risk of further global spread. The pandemic prompted a number of measures to limit the spread of COVID-19, including travel and border restrictions, quarantines, and restrictions on large gatherings. In turn, these resulted in lower consumer activity, diminished demand for a wide range of products and services, disruption in manufacturing and supply chains, and – given the wide variability in outcomes regarding the outbreak – significant market uncertainty and volatility. To help stem the turmoil, the U.S. government took unprecedented action – in concert with the U.S. Federal Reserve and central banks around the world – to help support consumers, businesses, and the broader economy, and to limit disruption to the financial system.
In general, the overall impact of the pandemic lessened in 2021, amid a resilient economy and widespread distribution of three COVID-19 vaccines granted emergency use authorization from the U.S. Food and Drug Administration (FDA) early in the year. Still, the situation remains dynamic, and the extent and duration of its influence on financial markets and the economy is highly uncertain, due in part to a recent spike in cases based on highly contagious variants of the coronavirus.
Extreme events such as the COVID-19 crisis are exogenous shocks that can have significant adverse effects on mutual funds and their investments. Although multiple asset classes may be affected by market disruption, the duration and impact may not be the same for all types of assets. Fidelity is committed to helping you stay informed amid news about COVID-19 and during increased market volatility, and we continue to take extra steps to be responsive to customer needs. We encourage you to visit us online, where we offer ongoing updates, commentary, and analysis on the markets and our funds.
Performance: The Bottom Line
Average annual total return reflects the change in the value of an investment, assuming reinvestment of distributions from dividend income and capital gains (the profits earned upon the sale of securities that have grown in value, if any) and assuming a constant rate of performance each year. The hypothetical investment and the average annual total returns do not reflect the deduction of taxes that a shareholder would pay on fund distributions or the redemption of fund shares. During periods of reimbursement by Fidelity, a fund’s total return will be greater than it would be had the reimbursement not occurred. How a fund did yesterday is no guarantee of how it will do tomorrow.
Average Annual Total Returns
| For the periods ended July 31, 2022 | Past 1 year | Past 5 years | Past 10 years |
| Class A (incl. 4.00% sales charge) | (8.64)% | 3.92% | 5.92% |
| Class M (incl. 4.00% sales charge) | (8.65)% | 3.90% | 5.90% |
| Class C (incl. contingent deferred sales charge) | (6.47)% | 3.99% | 5.73% |
| Fidelity® Real Estate Income Fund | (4.56)% | 5.05% | 6.62% |
| Class I | (4.57)% | 5.06% | 6.64% |
| Class Z | (4.44)% | 5.16% | 6.69% |
Class C shares' contingent deferred sales charges included in the past one year, past five years and past ten years total return figures are 1%, 0% and 0%, respectively.
The initial offering of Class Z shares took place on October 2, 2018. Returns prior to October 2, 2018, are those of Class I.
$10,000 Over 10 Years
Let's say hypothetically that $10,000 was invested in Fidelity® Real Estate Income Fund, a class of the fund, on July 31, 2012.
The chart shows how the value of your investment would have changed, and also shows how the S&P 500® Index performed over the same period.
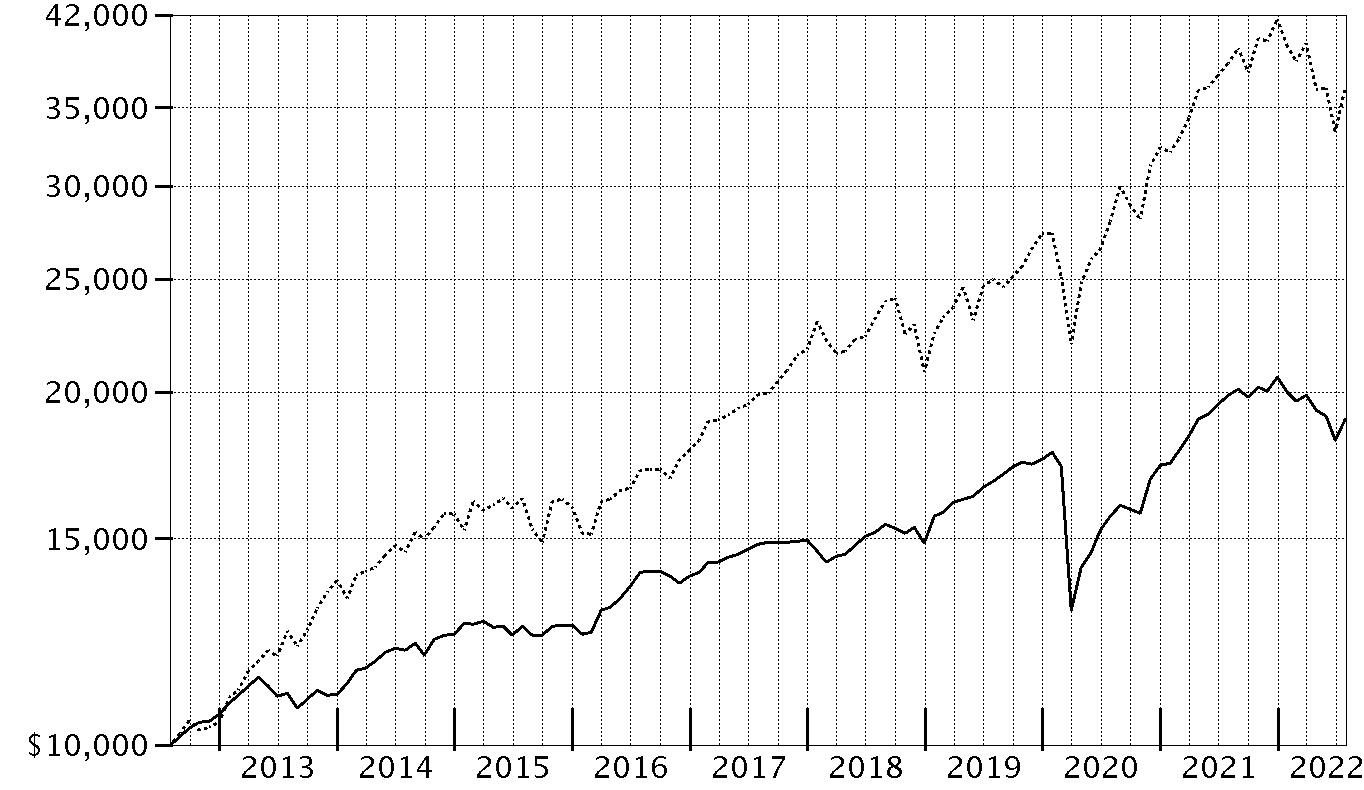
| Period Ending Values |
| $18,988 | Fidelity® Real Estate Income Fund |
| $36,428 | S&P 500® Index |
Management's Discussion of Fund Performance
Market Recap: For the 12 months ending July 31, 2022, a multitude of crosscurrents challenged the global economy and financial markets. Persistently high inflation, exacerbated by energy price shocks from the Russia–Ukraine conflict, spurred the U.S. Federal Reserve to hike interest rates more aggressively than anticipated, and concerns about the outlook for economic growth sent broader equities into bear market territory. For the 12-month period, real estate investment trust (REIT) common stocks, as measured by the FTSE
® NAREIT
® All REITs Index, returned -2.47%. The REIT market, alongside most other asset types, fell sharply in the first half of 2022, after gaining 43% in 2021. In a challenging market environment, most segments of the index lost ground for the 12 months, even as REITs seen as stable growers, such as industrial and cell-tower property owners, fared better. Meanwhile, real estate preferred stocks returned -7.48%, according to the MSCI REIT Preferred Index. Real estate bonds, captured by the ICE BofA
® US Real Estate Index – a market-capitalization-weighted measure of investment-grade corporate debt in the domestic real estate sector – returned -11.82%, hampered by rising interest rates. Bond issues with lower credit ratings modestly outperformed higher-quality credits, reflecting their higher coupons and reduced sensitivity to interest rates.
Comments from Portfolio Manager William Maclay: For the fiscal year, the fund's share classes (excluding sales charges, if applicable) returned roughly -6% to -4%, outperforming the -8.04% result of the Fidelity Real Estate Income Composite Index℠. The Composite index is a 40/40/20 blend of the MSCI REIT Preferred Index, the ICE BofA
® U.S. Real Estate Index and the FTSE
® NAREIT
® All REITs Index. Compared with the Composite index, security selection, especially in the fund's bond portfolio, was the main contributor. We pay close attention to limiting interest rate risk in this fund, so our general avoidance of the securities that were most highly sensitive to rising rates significantly helped our relative result. Focusing on the bonds of fundamentally well-positioned property types, such as industrial REITs, while limiting exposure to bonds of companies in less-well-positioned areas, such as office REITs, boosted relative performance. Security selection among preferred stocks also contributed, again largely due to our focus on limiting the fund's interest rate exposure, in part by owning floating-rate preferreds, whose higher coupons gave them a degree of protection from rising rates. Also contributing was the fund's overweighting in the outperforming real estate common stock area, as well as a cash allocation of 9%, on average, which boosted relative performance. In a strong investing environment for the fund, positive performance factors far outweighed the negative factors. The fund did, however, see a modest detrimental impact from our security selection among real estate common stocks, while a large underweighting in preferred securities detracted a bit, given that preferreds underperformed the Composite index by 0.56 percentage points.
The views expressed above reflect those of the portfolio manager(s) only through the end of the period as stated on the cover of this report and do not necessarily represent the views of Fidelity or any other person in the Fidelity organization. Any such views are subject to change at any time based upon market or other conditions and Fidelity disclaims any responsibility to update such views. These views may not be relied on as investment advice and, because investment decisions for a Fidelity fund are based on numerous factors, may not be relied on as an indication of trading intent on behalf of any Fidelity fund.
Investment Summary (Unaudited)
Top Ten Stocks as of July 31, 2022
| | % of fund's net assets |
| American Tower Corp. | 2.7 |
| Equity Lifestyle Properties, Inc. | 2.7 |
| Crown Castle International Corp. | 1.4 |
| Prologis (REIT), Inc. | 1.1 |
| Equinix, Inc. | 1.1 |
| Mid-America Apartment Communities, Inc. | 1.1 |
| Public Storage | 1.1 |
| Welltower, Inc. | 1.0 |
| LXP Industrial Trust (REIT) | 1.0 |
| Ventas, Inc. | 0.9 |
| | 14.1 |
Top Bonds as of July 31, 2022
| | % of fund's net assets |
| Senior Housing Properties Trust 4.75% 5/1/24 | 0.6 |
| Redwood Trust, Inc. 5.625% 7/15/24 | 0.6 |
| BX Trust floater Series 2021-XL2 Class J, 1 month U.S. LIBOR + 3.890% 5.889% 10/15/38 | 0.6 |
| MED Trust floater Series 2021-MDLN Class G, 1 month U.S. LIBOR + 5.250% 7.25% 11/15/38 | 0.6 |
| RWT Holdings, Inc. 5.75% 10/1/25 | 0.5 |
| Home Partners of America Trust Series 2021-2 Class G, 4.505% 12/17/26 | 0.5 |
| Veritas Multifamily Portfolio 1 month U.S. LIBOR + 8.500% 10.4992% 11/15/22 | 0.5 |
| BX Commercial Mortgage Trust floater Series 2021-CIP Class G, 1 month U.S. LIBOR + 3.960% 5.968% 12/15/38 | 0.5 |
| BX Commercial Mortgage Trust floater Series 2021-VINO Class G, 1 month U.S. LIBOR + 3.950% 5.9513% 5/15/38 | 0.5 |
| VICI Properties LP 5.125% 5/15/32 | 0.5 |
| | 5.4 |
Top REIT Sectors as of July 31, 2022
| | % of fund's net assets |
| REITs - Diversified | 13.3 |
| REITs - Mortgage | 11.8 |
| REITs - Management/Investment | 5.2 |
| REITs - Health Care | 4.4 |
| REITs - Apartments | 4.4 |
Asset Allocation (% of fund's net assets)
| As of July 31, 2022 * |
| | Stocks | 44.0% |
| | Bonds | 38.3% |
| | Convertible Securities | 2.9% |
| | Other Investments | 1.7% |
| | Short-Term Investments and Net Other Assets (Liabilities) | 13.1% |

* Foreign investments - 0.8%
Schedule of Investments July 31, 2022
Showing Percentage of Net Assets
| Common Stocks - 25.7% | | | |
| | | Shares | Value |
| FINANCIALS - 1.1% | | | |
| Capital Markets - 0.1% | | | |
| Brookfield Asset Management, Inc. (Canada) Class A | | 87,100 | $4,321,841 |
| Mortgage Real Estate Investment Trusts - 1.0% | | | |
| Great Ajax Corp. (a) | | 1,663,364 | 18,330,271 |
| MFA Financial, Inc. | | 2,554,785 | 33,110,014 |
| Rithm Capital Corp. | | 707,199 | 7,715,541 |
| | | | 59,155,826 |
|
| TOTAL FINANCIALS | | | 63,477,667 |
|
| INDUSTRIALS - 0.3% | | | |
| Construction & Engineering - 0.3% | | | |
| Willscot Mobile Mini Holdings (b) | | 424,300 | 16,382,223 |
| INFORMATION TECHNOLOGY - 0.1% | | | |
| IT Services - 0.1% | | | |
| Cyxtera Technologies, Inc. Class A (b) | | 803,700 | 9,797,103 |
| REAL ESTATE - 24.2% | | | |
| Equity Real Estate Investment Trusts (REITs) - 24.0% | | | |
| Acadia Realty Trust (SBI) | | 510,426 | 8,743,597 |
| American Homes 4 Rent Class A | | 803,500 | 30,436,580 |
| American Tower Corp. | | 596,400 | 161,523,002 |
| AvalonBay Communities, Inc. | | 170,600 | 36,498,164 |
| Crown Castle International Corp. | | 474,210 | 85,670,779 |
| CubeSmart | | 414,900 | 19,031,463 |
| Digital Realty Trust, Inc. | | 69,400 | 9,192,030 |
| Douglas Emmett, Inc. | | 364,700 | 8,621,508 |
| Duke Realty Corp. | | 442,800 | 27,701,568 |
| Easterly Government Properties, Inc. | | 1,161,600 | 23,545,632 |
| EastGroup Properties, Inc. | | 68,600 | 11,699,044 |
| Equinix, Inc. | | 96,500 | 67,910,910 |
| Equity Lifestyle Properties, Inc. | | 2,161,496 | 158,913,186 |
| Equity Residential (SBI) | | 119,700 | 9,383,283 |
| Essex Property Trust, Inc. | | 145,000 | 41,546,850 |
| Extra Space Storage, Inc. | | 137,200 | 26,002,144 |
| Farmland Partners, Inc. | | 312,456 | 4,636,847 |
| Gaming & Leisure Properties | | 959,646 | 49,891,996 |
| Healthcare Trust of America, Inc. | | 209,860 | 5,508,825 |
| Invitation Homes, Inc. | | 596,800 | 23,293,104 |
| iStar Financial, Inc. | | 77,413 | 1,293,571 |
| Lamar Advertising Co. Class A | | 207,000 | 20,919,420 |
| Life Storage, Inc. | | 155,800 | 19,613,662 |
| LXP Industrial Trust (REIT) | | 5,265,874 | 57,766,638 |
| Mid-America Apartment Communities, Inc. | | 341,006 | 63,335,044 |
| National Retail Properties, Inc. | | 115,400 | 5,494,194 |
| NexPoint Residential Trust, Inc. | | 32,800 | 2,182,512 |
| Postal Realty Trust, Inc. | | 878,500 | 14,829,080 |
| Prologis (REIT), Inc. | | 513,100 | 68,016,536 |
| Public Storage | | 191,100 | 62,376,951 |
| Retail Value, Inc. | | 274,131 | 38,241 |
| Rexford Industrial Realty, Inc. | | 67,700 | 4,428,257 |
| RLJ Lodging Trust | | 421,300 | 5,262,037 |
| Sabra Health Care REIT, Inc. | | 719,375 | 11,071,181 |
| SITE Centers Corp. | | 1,379,438 | 20,153,589 |
| Spirit Realty Capital, Inc. | | 748,600 | 33,192,924 |
| Sunstone Hotel Investors, Inc. | | 372,700 | 4,222,691 |
| Terreno Realty Corp. | | 380,828 | 23,858,874 |
| UDR, Inc. | | 162,200 | 7,850,480 |
| UMH Properties, Inc. | | 365,323 | 7,785,033 |
| Ventas, Inc. | | 1,042,886 | 56,086,409 |
| VICI Properties, Inc. | | 1,249,900 | 42,734,081 |
| Washington REIT (SBI) | | 914,047 | 20,264,422 |
| Welltower, Inc. | | 709,200 | 61,232,328 |
| Weyerhaeuser Co. | | 193,700 | 7,035,184 |
| | | | 1,430,793,851 |
| Real Estate Management & Development - 0.2% | | | |
| Cushman & Wakefield PLC (b) | | 201,400 | 3,383,520 |
| Digitalbridge Group, Inc. (b) | | 1,566,855 | 8,586,365 |
| | | | 11,969,885 |
|
| TOTAL REAL ESTATE | | | 1,442,763,736 |
|
| TOTAL COMMON STOCKS | | | |
| (Cost $1,015,924,305) | | | 1,532,420,729 |
|
| Preferred Stocks - 19.0% | | | |
| Convertible Preferred Stocks - 0.7% | | | |
| FINANCIALS - 0.2% | | | |
| Mortgage Real Estate Investment Trusts - 0.2% | | | |
| Great Ajax Corp. 7.25% (a) | | 611,442 | 15,139,304 |
| REAL ESTATE - 0.5% | | | |
| Equity Real Estate Investment Trusts (REITs) - 0.5% | | | |
| Braemar Hotels & Resorts, Inc. 5.50% | | 78,550 | 1,347,133 |
| LXP Industrial Trust (REIT) Series C, 6.50% | | 440,102 | 24,275,040 |
| RLJ Lodging Trust Series A, 1.95% | | 31,585 | 826,895 |
| Wheeler REIT, Inc. 8.75% (b) | | 121,100 | 1,590,179 |
| | | | 28,039,247 |
|
| TOTAL CONVERTIBLE PREFERRED STOCKS | | | 43,178,551 |
|
| Nonconvertible Preferred Stocks - 18.3% | | | |
| ENERGY - 0.8% | | | |
| Oil, Gas & Consumable Fuels - 0.8% | | | |
| DCP Midstream Partners LP: | | | |
| 7.95% (c) | | 328,262 | 8,252,507 |
| Series B, 7.875% (c) | | 256,314 | 6,223,304 |
| Enbridge, Inc.: | | | |
| Series 1, 5 year U.S. Treasury Index + 3.140% 5.949% (c)(d) | | 498,275 | 11,500,187 |
| Series L, 5 year U.S. Treasury Index + 3.150% 4.959% (c)(d) | | 111,400 | 2,656,890 |
| Energy Transfer LP 7.60% (c) | | 525,651 | 12,426,390 |
| Global Partners LP: | | | |
| 9.75% (c) | | 161,507 | 4,234,714 |
| Series B, 9.50% | | 67,800 | 1,728,561 |
| | | | 47,022,553 |
| FINANCIALS - 9.8% | | | |
| Mortgage Real Estate Investment Trusts - 9.6% | | | |
| Acres Commercial Realty Corp. 8.625% (c) | | 47,183 | 945,075 |
| AG Mortgage Investment Trust, Inc.: | | | |
| 8.00% | | 551,142 | 10,859,867 |
| Series C, 8.00% (c) | | 517,638 | 10,301,048 |
| AGNC Investment Corp.: | | | |
| 6.125% (c) | | 952,600 | 21,233,454 |
| 6.875% (c) | | 673,972 | 14,726,288 |
| Series C, 7.00% (c) | | 678,202 | 16,419,270 |
| Series E, 6.50% (c) | | 1,449,834 | 32,780,747 |
| Annaly Capital Management, Inc.: | | | |
| 6.75% (c) | | 192,992 | 4,554,611 |
| Series F, 6.95% (c) | | 1,710,043 | 41,297,538 |
| Series G, 6.50% (c) | | 1,135,399 | 25,432,938 |
| Arbor Realty Trust, Inc.: | | | |
| Series D, 6.375% | | 77,100 | 1,646,085 |
| Series F, 6.25% (c) | | 511,736 | 10,475,236 |
| Arlington Asset Investment Corp. 8.25% (c) | | 84,234 | 1,726,797 |
| Armour Residential REIT, Inc. Series C 7.00% | | 55,228 | 1,232,689 |
| Cherry Hill Mortgage Investment Corp.: | | | |
| 8.25% (c) | | 196,120 | 4,361,709 |
| Series A, 8.20% | | 171,232 | 3,861,282 |
| Chimera Investment Corp.: | | | |
| 8.00% (c) | | 900,931 | 19,586,240 |
| Series A, 8.00% | | 8,084 | 179,465 |
| Series B, 8.00% (c) | | 1,848,804 | 40,673,688 |
| Series C, 7.75% (c) | | 2,211,586 | 48,212,575 |
| Dynex Capital, Inc. Series C 6.90% (c) | | 223,683 | 5,102,209 |
| Ellington Financial LLC 6.75% (c) | | 229,185 | 4,897,683 |
| Franklin BSP Realty Trust, Inc. 7.50% | | 439,062 | 9,233,474 |
| KKR Real Estate Finance Trust, Inc. 6.50% | | 205,359 | 4,637,006 |
| MFA Financial, Inc.: | | | |
| 6.50% (c) | | 1,299,323 | 25,609,656 |
| Series B, 7.50% | | 552,215 | 11,706,958 |
| New York Mortgage Trust, Inc. Series D, 8.00% (c) | | 65,726 | 1,332,923 |
| PennyMac Mortgage Investment Trust: | | | |
| 6.75% | | 240,000 | 5,107,200 |
| 8.125% (c) | | 410,254 | 10,178,402 |
| Series B, 8.00% (c) | | 729,408 | 18,556,140 |
| Ready Capital Corp.: | | | |
| 5.75% | | 52,288 | 1,244,454 |
| Series C, 6.20% | | 264,250 | 6,421,275 |
| Rithm Capital Corp.: | | | |
| 7.125% (c) | | 1,446,757 | 32,421,824 |
| Series A, 7.50% (c) | | 731,427 | 16,691,164 |
| Series C, 6.375% (c) | | 1,149,554 | 23,106,035 |
| Series D, 7.00% (c) | | 151,200 | 3,364,200 |
| Two Harbors Investment Corp.: | | | |
| Series A, 8.125% (c) | | 669,796 | 16,061,708 |
| Series B, 7.625% (c) | | 1,395,117 | 31,208,767 |
| Series C, 7.25% (c) | | 1,644,079 | 35,199,731 |
| | | | 572,587,411 |
| Real Estate Management & Development - 0.2% | | | |
| Brookfield Properties Corp. Series EE, 5.10% (c) | | 679,025 | 10,430,223 |
| TOTAL FINANCIALS | | | 583,017,634 |
| REAL ESTATE - 7.7% | | | |
| Equity Real Estate Investment Trusts (REITs) - 6.3% | | | |
| Agree Realty Corp. 4.375% | | 240,000 | 4,718,400 |
| American Homes 4 Rent: | | | |
| 6.25% | | 98,905 | 2,561,640 |
| Series G, 5.875% | | 199,750 | 5,069,655 |
| Armada Hoffler Properties, Inc. 6.75% | | 255,050 | 6,580,290 |
| Ashford Hospitality Trust, Inc.: | | | |
| Series D, 8.45% | | 190,073 | 4,162,599 |
| Series F, 7.375% | | 317,554 | 5,506,386 |
| Series G, 7.375% | | 229,188 | 3,964,952 |
| Series H, 7.50% | | 231,565 | 3,938,921 |
| Series I, 7.50% | | 304,176 | 5,472,126 |
| Bluerock Residential Growth (REIT), Inc.: | | | |
| Series C, 7.625% | | 252,994 | 6,347,619 |
| Series D, 7.125% | | 168,100 | 4,205,862 |
| Braemar Hotels & Resorts, Inc. Series D, 8.25% | | 173,050 | 4,334,903 |
| Cedar Realty Trust, Inc.: | | | |
| 7.25% | | 150,821 | 1,446,373 |
| Series C, 6.50% | | 291,600 | 1,997,460 |
| Centerspace Series C, 6.625% | | 317,300 | 8,360,855 |
| City Office REIT, Inc. Series A, 6.625% | | 178,475 | 4,204,871 |
| CTO Realty Growth, Inc. 6.375% | | 120,000 | 2,878,800 |
| DiamondRock Hospitality Co. 8.25% | | 443,231 | 11,914,049 |
| Digital Realty Trust, Inc.: | | | |
| 5.25% | | 28,900 | 732,615 |
| Series L, 5.20% | | 29,700 | 745,767 |
| Gladstone Commercial Corp.: | | | |
| 6.625% | | 108,675 | 2,717,962 |
| Series G, 6.00% | | 516,000 | 11,610,000 |
| Gladstone Land Corp. Series D, 5.00% | | 30,000 | 741,000 |
| Global Medical REIT, Inc. Series A, 7.50% | | 150,848 | 3,875,285 |
| Global Net Lease, Inc.: | | | |
| Series A, 7.25% | | 531,595 | 13,683,255 |
| Series B 6.875% | | 294,000 | 7,329,420 |
| Healthcare Trust, Inc.: | | | |
| 7.125% | | 190,000 | 4,275,000 |
| Series A 7.375% | | 364,800 | 9,101,760 |
| Hersha Hospitality Trust: | | | |
| Series C, 6.875% | | 49,450 | 1,042,653 |
| Series D, 6.50% | | 197,750 | 4,168,570 |
| Hudson Pacific Properties, Inc. Series C, 4.75% | | 790,100 | 16,663,209 |
| iStar Financial, Inc.: | | | |
| Series D, 8.00% | | 332,421 | 8,566,489 |
| Series G, 7.65% | | 355,973 | 8,792,533 |
| Series I, 7.50% | | 552,696 | 13,878,197 |
| Kimco Realty Corp. Series M, 5.25% | | 32,100 | 807,797 |
| National Storage Affiliates Trust Series A, 6.00% | | 91,575 | 2,302,196 |
| Necessity Retail (REIT), Inc./The: | | | |
| 7.50% | | 874,787 | 21,344,803 |
| Series C 7.375% | | 379,839 | 9,302,257 |
| Pebblebrook Hotel Trust: | | | |
| 6.30% | | 271,897 | 6,172,062 |
| 6.375% | | 372,994 | 9,093,594 |
| 6.375% | | 666,800 | 15,449,756 |
| Series H, 5.70% | | 692,200 | 14,411,604 |
| Pennsylvania (REIT): | | | |
| Series B, 7.375% (b) | | 99,385 | 346,854 |
| Series C, 7.20% (b) | | 50,325 | 172,615 |
| Series D, 6.875% (b) | | 150,100 | 489,326 |
| Plymouth Industrial REIT, Inc. Series A, 7.50% | | 171,625 | 4,393,600 |
| Prologis (REIT), Inc. Series Q, 8.54% | | 93,396 | 5,650,458 |
| Public Storage: | | | |
| 4.00% | | 295,000 | 5,873,450 |
| Series G, 5.05% | | 29,000 | 736,310 |
| Series L, 4.625% | | 31,600 | 765,668 |
| Series S, 4.10% | | 200,000 | 4,054,000 |
| Rexford Industrial Realty, Inc.: | | | |
| Series B, 5.875% | | 78,600 | 2,002,728 |
| Series C, 5.625% | | 68,225 | 1,705,625 |
| Saul Centers, Inc.: | | | |
| Series D, 6.125% | | 82,775 | 1,999,844 |
| Series E, 6.00% | | 76,841 | 1,911,804 |
| SITE Centers Corp. 6.375% | | 102,400 | 2,657,792 |
| Sotherly Hotels, Inc.: | | | |
| Series B, 8.00% (b) | | 67,250 | 1,405,525 |
| Series C, 7.875% (b) | | 107,000 | 2,225,600 |
| Spirit Realty Capital, Inc. Series A, 6.00% | | 94,125 | 2,445,368 |
| Summit Hotel Properties, Inc.: | | | |
| Series E, 6.25% | | 457,602 | 9,454,195 |
| Series F, 5.875% | | 377,000 | 7,660,640 |
| Sunstone Hotel Investors, Inc.: | | | |
| Series H, 6.125% | | 180,000 | 4,176,000 |
| Series I, 5.70% | | 240,000 | 5,332,800 |
| UMH Properties, Inc. Series D, 6.375% | | 601,125 | 15,316,665 |
| Urstadt Biddle Properties, Inc.: | | | |
| Series H, 6.25% | | 281,325 | 6,845,903 |
| Series K 5.875% | | 69,225 | 1,579,721 |
| Vornado Realty Trust: | | | |
| Series L, 5.40% | | 30,100 | 719,089 |
| Series N, 5.25% | | 147,400 | 3,371,038 |
| Series O, 4.45% | | 342,900 | 6,508,242 |
| | | | 374,274,405 |
| Real Estate Management & Development - 1.4% | | | |
| Brookfield Property Partners LP: | | | |
| 5.75% | | 43,000 | 853,980 |
| 6.50% | | 34,125 | 766,448 |
| Digitalbridge Group, Inc.: | | | |
| Series H, 7.125% | | 965,305 | 23,138,361 |
| Series I, 7.15% | | 1,074,492 | 25,873,767 |
| Series J, 7.15% | | 1,387,346 | 33,226,937 |
| Seritage Growth Properties Series A, 7.00% | | 91,986 | 2,089,002 |
| | | | 85,948,495 |
| TOTAL REAL ESTATE | | | 460,222,900 |
|
| TOTAL NONCONVERTIBLE PREFERRED STOCKS | | | 1,090,263,087 |
|
| TOTAL PREFERRED STOCKS | | | |
| (Cost $1,219,593,950) | | | 1,133,441,638 |
| | | Principal Amount | Value |
|
| Corporate Bonds - 15.8% | | | |
| Convertible Bonds - 2.2% | | | |
| FINANCIALS - 1.8% | | | |
| Mortgage Real Estate Investment Trusts - 1.8% | | | |
| Granite Point Mortgage Trust, Inc. 6.375% 10/1/23 | | 3,366,000 | 3,239,775 |
| MFA Financial, Inc. 6.25% 6/15/24 | | 11,700,000 | 10,533,932 |
| PennyMac Corp.: | | | |
| 5.5% 11/1/24 | | 23,577,000 | 22,796,012 |
| 5.5% 3/15/26 | | 2,000,000 | 1,790,000 |
| Redwood Trust, Inc. 5.625% 7/15/24 | | 41,580,000 | 37,003,810 |
| RWT Holdings, Inc. 5.75% 10/1/25 | | 34,474,000 | 29,523,786 |
| Two Harbors Investment Corp. 6.25% 1/15/26 | | 4,896,000 | 4,401,504 |
| | | | 109,288,819 |
| REAL ESTATE - 0.4% | | | |
| Real Estate Management & Development - 0.4% | | | |
| Digitalbridge Group, Inc. 5% 4/15/23 | | 21,416,000 | 20,929,718 |
|
| TOTAL CONVERTIBLE BONDS | | | 130,218,537 |
|
| Nonconvertible Bonds - 13.6% | | | |
| COMMUNICATION SERVICES - 0.4% | | | |
| Media - 0.4% | | | |
| Clear Channel Outdoor Holdings, Inc.: | | | |
| 7.5% 6/1/29 (e) | | 15,965,000 | 12,851,825 |
| 7.75% 4/15/28 (e) | | 12,445,000 | 10,009,762 |
| | | | 22,861,587 |
| CONSUMER DISCRETIONARY - 2.7% | | | |
| Hotels, Restaurants & Leisure - 1.2% | | | |
| Caesars Entertainment, Inc. 8.125% 7/1/27 (e) | | 17,465,000 | 17,465,000 |
| Hilton Domestic Operating Co., Inc.: | | | |
| 3.625% 2/15/32 (e) | | 5,965,000 | 5,144,813 |
| 4% 5/1/31 (e) | | 3,000,000 | 2,692,920 |
| Hilton Grand Vacations Borrower Escrow LLC 4.875% 7/1/31 (e) | | 22,890,000 | 19,227,600 |
| Marriott Ownership Resorts, Inc. 4.5% 6/15/29 (e) | | 20,315,000 | 17,635,655 |
| Sugarhouse HSP Gaming Prop Mezz LP/Sugarhouse HSP Gaming Finance Corp. 5.875% 5/15/25 (e) | | 8,000,000 | 7,438,366 |
| Times Square Hotel Trust 8.528% 8/1/26 (e) | | 3,783,407 | 3,880,213 |
| | | | 73,484,567 |
| Household Durables - 1.5% | | | |
| Adams Homes, Inc. 7.5% 2/15/25 (e) | | 9,530,000 | 8,338,750 |
| Ashton Woods U.S.A. LLC/Ashton Woods Finance Co.: | | | |
| 4.625% 8/1/29 (e) | | 4,015,000 | 3,112,202 |
| 4.625% 4/1/30 (e) | | 6,840,000 | 5,193,382 |
| 6.625% 1/15/28 (e) | | 9,925,000 | 8,683,581 |
| Brookfield Residential Properties, Inc./Brookfield Residential U.S. Corp. 5% 6/15/29 (e) | | 3,000,000 | 2,305,500 |
| Century Communities, Inc.: | | | |
| 3.875% 8/15/29 (e) | | 13,005,000 | 11,072,775 |
| 6.75% 6/1/27 | | 4,670,000 | 4,745,934 |
| LGI Homes, Inc. 4% 7/15/29 (e) | | 13,310,000 | 10,962,382 |
| M/I Homes, Inc. 3.95% 2/15/30 | | 19,070,000 | 15,825,442 |
| New Home Co., Inc. 7.25% 10/15/25 (e) | | 8,180,000 | 6,626,769 |
| Picasso Finance Sub, Inc. 6.125% 6/15/25 (e) | | 3,240,000 | 3,282,039 |
| TRI Pointe Homes, Inc. 5.25% 6/1/27 | | 11,458,000 | 11,001,714 |
| | | | 91,150,470 |
| TOTAL CONSUMER DISCRETIONARY | | | 164,635,037 |
| ENERGY - 0.2% | | | |
| Oil, Gas & Consumable Fuels - 0.2% | | | |
| EG Global Finance PLC: | | | |
| 6.75% 2/7/25 (e) | | 6,030,000 | 5,743,575 |
| 8.5% 10/30/25 (e) | | 1,682,000 | 1,647,115 |
| Global Partners LP/GLP Finance Corp. 7% 8/1/27 | | 3,955,000 | 3,616,490 |
| | | | 11,007,180 |
| FINANCIALS - 0.1% | | | |
| Diversified Financial Services - 0.1% | | | |
| Icahn Enterprises LP/Icahn Enterprises Finance Corp. 5.25% 5/15/27 | | 5,000,000 | 4,800,000 |
| HEALTH CARE - 0.3% | | | |
| Health Care Providers & Services - 0.3% | | | |
| Sabra Health Care LP: | | | |
| 3.9% 10/15/29 | | 989,000 | 889,783 |
| 5.125% 8/15/26 | | 20,264,000 | 19,917,536 |
| | | | 20,807,319 |
| INDUSTRIALS - 0.1% | | | |
| Trading Companies & Distributors - 0.1% | | | |
| Williams Scotsman International, Inc. 4.625% 8/15/28 (e) | | 4,250,000 | 3,985,034 |
| REAL ESTATE - 9.8% | | | |
| Equity Real Estate Investment Trusts (REITs) - 7.3% | | | |
| American Finance Trust, Inc./American Finance Operating Partnership LP 4.5% 9/30/28 (e) | | 30,405,000 | 24,462,951 |
| American Homes 4 Rent LP: | | | |
| 2.375% 7/15/31 | | 7,000,000 | 5,768,913 |
| 3.625% 4/15/32 | | 7,000,000 | 6,346,897 |
| American Tower Corp.: | | | |
| 2.7% 4/15/31 | | 2,000,000 | 1,731,549 |
| 3.8% 8/15/29 | | 5,000,000 | 4,781,606 |
| 4.05% 3/15/32 | | 27,000,000 | 25,844,257 |
| Boston Properties, Inc. 3.25% 1/30/31 | | 2,000,000 | 1,774,003 |
| CBL & Associates LP: | | | |
| 4.6% 10/15/24 (f)(g) | | 18,229,000 | 2 |
| 5.25% 12/1/23 (f)(g) | | 11,371,000 | 1 |
| 5.95% 12/15/26 (f)(g) | | 10,317,000 | 1 |
| Crown Castle International Corp.: | | | |
| 2.25% 1/15/31 | | 5,000,000 | 4,239,486 |
| 2.5% 7/15/31 | | 5,000,000 | 4,282,684 |
| CTR Partnership LP/CareTrust Capital Corp. 3.875% 6/30/28 (e) | | 26,490,000 | 23,405,504 |
| EPR Properties: | | | |
| 3.6% 11/15/31 | | 2,000,000 | 1,644,666 |
| 4.95% 4/15/28 | | 4,000,000 | 3,732,611 |
| Equinix, Inc.: | | | |
| 3.2% 11/18/29 | | 5,000,000 | 4,608,132 |
| 3.9% 4/15/32 | | 2,000,000 | 1,894,923 |
| Global Net Lease, Inc. / Global Net Lease Operating Partnership LP 3.75% 12/15/27 (e) | | 5,075,000 | 4,449,525 |
| GLP Capital LP/GLP Financing II, Inc. 5.3% 1/15/29 | | 10,193,000 | 9,961,313 |
| Invitation Homes Operating Partnership LP 4.15% 4/15/32 | | 25,000,000 | 23,440,213 |
| iStar Financial, Inc.: | | | |
| 4.25% 8/1/25 | | 12,720,000 | 12,131,700 |
| 4.75% 10/1/24 | | 20,425,000 | 20,144,156 |
| 5.5% 2/15/26 | | 16,985,000 | 16,675,881 |
| MPT Operating Partnership LP/MPT Finance Corp.: | | | |
| 4.625% 8/1/29 | | 19,835,000 | 18,595,313 |
| 5% 10/15/27 | | 5,000,000 | 4,810,500 |
| Office Properties Income Trust: | | | |
| 4.25% 5/15/24 | | 4,974,000 | 4,794,670 |
| 4.5% 2/1/25 | | 21,056,000 | 19,802,956 |
| Omega Healthcare Investors, Inc.: | | | |
| 4.5% 4/1/27 | | 2,434,000 | 2,347,221 |
| 4.95% 4/1/24 | | 2,866,000 | 2,875,622 |
| Park Intermediate Holdings LLC 4.875% 5/15/29 (e) | | 12,000,000 | 11,050,140 |
| Realty Income Corp. 4.875% 6/1/26 | | 436,000 | 450,648 |
| RLJ Lodging Trust LP: | | | |
| 3.75% 7/1/26 (e) | | 8,000,000 | 7,504,400 |
| 4% 9/15/29 (e) | | 24,550,000 | 21,757,438 |
| Senior Housing Properties Trust: | | | |
| 4.75% 5/1/24 | | 40,903,000 | 37,320,184 |
| 4.75% 2/15/28 | | 9,933,000 | 7,468,605 |
| Service Properties Trust: | | | |
| 4.65% 3/15/24 | | 3,500,000 | 3,182,865 |
| 7.5% 9/15/25 | | 7,950,000 | 7,708,002 |
| Sun Communities Operating LP 4.2% 4/15/32 | | 439,000 | 410,035 |
| Uniti Group LP / Uniti Group Finance, Inc. 6.5% 2/15/29 (e) | | 31,820,000 | 24,495,354 |
| Uniti Group, Inc.: | | | |
| 6% 1/15/30 (e) | | 18,035,000 | 12,878,347 |
| 7.875% 2/15/25 (e) | | 5,000,000 | 5,031,250 |
| VICI Properties LP 5.125% 5/15/32 | | 27,000,000 | 26,832,870 |
| VICI Properties LP / VICI Note Co. 4.625% 12/1/29 (e) | | 2,000,000 | 1,905,080 |
| XHR LP: | | | |
| 4.875% 6/1/29 (e) | | 10,000,000 | 9,018,800 |
| 6.375% 8/15/25 (e) | | 4,250,000 | 4,280,218 |
| | | | 435,841,492 |
| Real Estate Management & Development - 2.5% | | | |
| DTZ U.S. Borrower LLC 6.75% 5/15/28 (e) | | 8,165,000 | 8,080,166 |
| Five Point Operation Co. LP 7.875% 11/15/25 (e) | | 16,798,000 | 14,278,300 |
| Forestar Group, Inc.: | | | |
| 3.85% 5/15/26 (e) | | 9,000,000 | 7,955,192 |
| 5% 3/1/28 (e) | | 5,000,000 | 4,386,350 |
| Greystar Real Estate Partners 5.75% 12/1/25 (e) | | 6,885,000 | 6,878,735 |
| Howard Hughes Corp.: | | | |
| 4.125% 2/1/29 (e) | | 16,960,000 | 14,588,757 |
| 4.375% 2/1/31 (e) | | 22,625,000 | 19,159,192 |
| 5.375% 8/1/28 (e) | | 11,900,000 | 11,142,446 |
| Kennedy-Wilson, Inc.: | | | |
| 4.75% 3/1/29 | | 19,075,000 | 16,833,688 |
| 4.75% 2/1/30 | | 26,715,000 | 22,959,405 |
| 5% 3/1/31 | | 6,960,000 | 5,933,400 |
| Realogy Group LLC/Realogy Co-Issuer Corp. 5.75% 1/15/29 (e) | | 4,965,000 | 4,034,063 |
| Realogy Group LLC/Realogy Co.-Issuer Corp. 5.25% 4/15/30 (e) | | 15,000,000 | 11,964,000 |
| Taylor Morrison Communities, Inc./Monarch Communities, Inc. 5.875% 6/15/27 (e) | | 1,798,000 | 1,836,208 |
| | | | 150,029,902 |
| TOTAL REAL ESTATE | | | 585,871,394 |
|
| TOTAL NONCONVERTIBLE BONDS | | | 813,967,551 |
|
| TOTAL CORPORATE BONDS | | | |
| (Cost $1,037,238,565) | | | 944,186,088 |
|
| Asset-Backed Securities - 1.6% | | | |
| American Homes 4 Rent: | | | |
| Series 2015-SFR1 Class F, 5.885% 4/17/52 (e) | | 2,000,000 | 1,979,203 |
| Series 2015-SFR2: | | | |
| Class E, 6.07% 10/17/52 (e) | | 8,259,000 | 8,496,739 |
| Class XS, 0% 10/17/52 (c)(e)(g)(h) | | 4,541,275 | 45 |
| Capital Trust RE CDO Ltd. Series 2005-1A Class D, 1 month U.S. LIBOR + 1.500% 3.3464% 3/20/50 (c)(d)(e)(g) | | 2,250,000 | 225 |
| Conseco Finance Securitizations Corp. Series 2002-2 Class M2, 9.163% 3/1/33 | | 374,663 | 341,133 |
| DataBank Issuer, LLC Series 2021-1A Class C, 4.43% 2/27/51 (e) | | 2,300,000 | 2,042,225 |
| Diamond Infrastructure Funding LLC Series 2021-1A Class C, 3.475% 4/15/49 (e) | | 6,311,000 | 5,497,058 |
| DigitalBridge Issuer, LLC / DigitalBridge Co.-Issuer, LLC Series 2021-1A Class A2, 3.933% 9/25/51 (e) | | 7,000,000 | 6,390,678 |
| GPMT Ltd. Series 2019-FL2 Class D, 1 month U.S. LIBOR + 2.950% 5.1116% 2/22/36 (c)(d)(e) | | 2,142,000 | 2,095,340 |
| Green Tree Financial Corp.: | | | |
| Series 1996-4 Class M1, 7.75% 6/15/27 (c) | | 277,218 | 275,093 |
| Series 1997-3 Class M1, 7.53% 3/15/28 | | 2,532,571 | 2,439,621 |
| Home Partners of America Trust: | | | |
| Series 2019-2 Class F, 3.866% 10/19/39 (e) | | 2,783,131 | 2,516,513 |
| Series 2021-1 Class F, 3.325% 9/17/41 (e) | | 6,986,314 | 5,913,030 |
| Series 2021-2 Class G, 4.505% 12/17/26 (e) | | 33,083,238 | 29,151,547 |
| Series 2021-3 Class F, 4.242% 1/17/41 (e) | | 10,286,250 | 9,121,184 |
| Lehman ABS Manufactured Housing Contract Trust Series 2001-B Class M2, 7.17% 4/15/40 | | 503,690 | 347,802 |
| Merit Securities Corp. Series 13 Class M1, 7.88% 12/28/33 (c) | | 815,884 | 819,556 |
| Progress Residential Trust Series 2019-SFR3 Class F, 3.867% 9/17/36 (e) | | 1,000,000 | 978,498 |
| Tricon American Homes: | | | |
| Series 2017-SFR2 Class F, 5.104% 1/17/36 (e) | | 3,785,000 | 3,731,909 |
| Series 2018-SFR1 Class F, 4.96% 5/17/37 (e) | | 8,282,000 | 8,049,444 |
| Tricon Residential Trust Series 2021-SFR1 Class G, 4.133% 7/17/38 (e) | | 3,000,000 | 2,672,830 |
| TOTAL ASSET-BACKED SECURITIES | | | |
| (Cost $102,882,968) | | | 92,859,673 |
|
| Collateralized Mortgage Obligations - 0.0% | | | |
| U.S. Government Agency - 0.0% | | | |
| Fannie Mae REMIC Trust: | | | |
| Series 2002-W1 subordinate REMIC pass thru certificates, Class 3B3, 3.2582% 2/25/42 (c)(e) | | 25,997 | 6,546 |
| Series 2003-W10 subordinate REMIC pass thru certificates, Class 2B3, 3.2493% 6/25/43 (c)(e)(g) | | 46,107 | 34,728 |
| TOTAL COLLATERALIZED MORTGAGE OBLIGATIONS | | | |
| (cost $54,292) | | | 41,274 |
|
| Commercial Mortgage Securities - 23.1% | | | |
| ALEN Mortgage Trust floater Series 2021-ACEN Class F, 1 month U.S. LIBOR + 5.000% 6.999% 4/15/34 (c)(d)(e) | | 3,384,000 | 2,736,192 |
| BANK: | | | |
| sequential payer: | | | |
| Series 2019-BN19 Class A3, 3.183% 8/15/61 | | 17,000,000 | 16,263,351 |
| Series 2021-BN33 Class A5, 2.556% 5/15/64 | | 14,931,000 | 13,464,583 |
| Series 2022-BNK39 Class A4, 2.928% 2/15/55 | | 13,750,000 | 12,732,537 |
| Series 2022-BNK42 Class D, 2.5% 6/15/55 (e) | | 2,000,000 | 1,278,942 |
| Series 2017-BNK8 Class E, 2.8% 11/15/50 (e) | | 11,374,393 | 6,973,628 |
| Series 2018-BN12 Class D, 3% 5/15/61 (e) | | 1,682,000 | 1,210,936 |
| Series 2020-BN30 Class MCDG, 2.9182% 12/15/53 (c) | | 2,000,000 | 1,408,858 |
| Series 2021-BN38 Class C, 3.2169% 12/15/64 (c) | | 3,505,000 | 2,870,442 |
| Series 2022-BNK41, Class C, 3.7899% 4/15/65 (c) | | 4,433,000 | 3,733,686 |
| Series 2022-BNK42 Class C, 4.7214% 6/15/55 (c) | | 6,500,000 | 5,898,594 |
| Barclays Commercial Mortgage Securities sequential payer Series 2021-C12 Class A5, 2.689% 11/15/54 | | 25,000,000 | 22,675,408 |
| BBCMS Series 2022-C15 Class C, 3.8313% 4/15/55 (c) | | 3,094,000 | 2,631,615 |
| BBCMS Mortgage Trust: | | | |
| Series 2019-C3 Class C, 4.178% 5/15/52 | | 4,675,000 | 4,189,681 |
| Series 2022-C16 Class C, 4.6% 6/15/55 (c) | | 5,250,000 | 4,720,095 |
| BCP Trust Series 2021-330N Class E, 1 month U.S. LIBOR + 3.630% 5.637% 6/15/38 (c)(d)(e) | | 5,000,000 | 4,465,418 |
| Benchmark Mortgage Trust: | | | |
| sequential payer: | | | |
| Series 2019-B13 Class A4, 2.952% 8/15/57 | | 19,715,000 | 18,550,051 |
| Series 2019-B14: | | | |
| Class 225D, 3.2943% 12/15/62 (c)(e) | | 3,427,000 | 2,930,824 |
| Class 225E, 3.2943% 12/15/62 (c)(e) | | 5,141,000 | 4,356,410 |
| Series 2021-B28 Class A5, 2.2237% 8/15/54 | | 10,000,000 | 8,747,284 |
| Series 2020-B18 Class AGNG, 4.3885% 7/15/53 (c)(e) | | 11,379,000 | 9,372,093 |
| Series 2022-B32 Class A5, 3.0019% 1/15/55 | | 20,000,000 | 18,591,438 |
| Series 2022-B35: | | | |
| Class C, 4.4457% 5/15/55 (c) | | 9,500,000 | 8,312,030 |
| Class D, 2.5% 5/15/55 (e)(g) | | 3,500,000 | 2,225,610 |
| BX Commercial Mortgage Trust: | | | |
| floater: | | | |
| Series 2021-CIP: | | | |
| Class F, 1 month U.S. LIBOR + 3.210% 5.218% 12/15/38 (c)(d)(e) | | 7,790,000 | 7,281,922 |
| Class G, 1 month U.S. LIBOR + 3.960% 5.968% 12/15/38 (c)(d)(e) | | 31,246,000 | 28,845,470 |
| Series 2021-PAC Class G, 1 month U.S. LIBOR + 2.940% 4.9461% 10/15/36 (c)(d)(e) | | 17,232,000 | 15,943,295 |
| Series 2021-VINO Class G, 1 month U.S. LIBOR + 3.950% 5.9513% 5/15/38 (c)(d)(e) | | 28,979,000 | 27,381,762 |
| Series 2020-VIVA Class E, 3.5488% 3/11/44 (c)(e) | | 20,338,990 | 16,223,629 |
| BX Trust: | | | |
| floater: | | | |
| Series 2019-IMC Class G, 1 month U.S. LIBOR + 3.600% 5.599% 4/15/34 (c)(d)(e) | | 5,181,000 | 4,778,786 |
| Series 2019-XL: | | | |
| Class G, 1 month U.S. LIBOR + 2.300% 4.299% 10/15/36 (c)(d)(e) | | 13,391,750 | 12,859,804 |
| Class J, 1 month U.S. LIBOR + 2.650% 4.649% 10/15/36 (c)(d)(e) | | 15,217,550 | 14,462,813 |
| Series 2021-21M Class H, 1 month U.S. LIBOR + 4.010% 6.009% 10/15/36 (c)(d)(e) | | 16,916,000 | 15,343,658 |
| Series 2021-ACNT Class G, 1 month U.S. LIBOR + 3.290% 5.295% 11/15/38 (c)(d)(e) | | 20,581,000 | 19,377,174 |
| Series 2021-ARIA Class G, 1 month U.S. LIBOR + 3.140% 5.1411% 10/15/36 (c)(d)(e) | | 7,246,000 | 6,665,148 |
| Series 2021-BXMF Class G, 1 month U.S. LIBOR + 3.340% 5.3485% 10/15/26 (c)(d)(e) | | 23,874,000 | 21,977,547 |
| Series 2021-SOAR Class J, 5.75% 6/15/38 (c)(e) | | 18,862,116 | 17,760,425 |
| Series 2021-VOLT Class G, 1 month U.S. LIBOR + 2.850% 4.8492% 9/15/36 (c)(d)(e) | | 5,000,000 | 4,624,052 |
| Series 2021-XL2 Class J, 1 month U.S. LIBOR + 3.890% 5.889% 10/15/38 (c)(d)(e) | | 37,345,950 | 34,924,741 |
| Series 2022-LBA6: | | | |
| Class F, CME Term SOFR 1 Month Index + 3.350% 5.3086% 1/15/39 (c)(d)(e) | | 6,200,000 | 5,813,073 |
| Class G, CME Term SOFR 1 Month Index + 4.200% 6.1586% 1/15/39 (c)(d)(e) | | 11,340,000 | 10,632,756 |
| Series 2022-LP2 Class G, CME Term SOFR 1 Month Index + 4.100% 6.2068% 2/15/39 (c)(d)(e) | | 5,136,038 | 4,707,645 |
| Series 2022-VAMF Class F, CME Term SOFR 1 Month Index + 3.290% 5.2576% 1/15/39 (c)(d)(e) | | 4,367,000 | 4,074,961 |
| floater sequential payer Series 2021-LGCY Class J, 1 month U.S. LIBOR + 3.190% 5.192% 10/15/23 (c)(d)(e) | | 19,151,000 | 17,321,871 |
| Series 2019-OC11 Class E, 4.0755% 12/9/41 (c)(e) | | 22,521,000 | 19,293,261 |
| BXP Trust Series 2021-601L Class E, 2.7755% 1/15/44 (c)(e) | | 5,754,000 | 3,858,634 |
| CALI Mortgage Trust Series 2019-101C Class F, 4.3244% 3/10/39 (c)(e) | | 4,099,000 | 3,289,932 |
| CAMB Commercial Mortgage Trust floater Series 2019-LIFE Class G, 1 month U.S. LIBOR + 3.250% 5.249% 12/15/37 (c)(d)(e) | | 14,973,000 | 14,251,176 |
| CD Mortgage Trust Series 2017-CD3 Class D, 3.25% 2/10/50 (e) | | 3,353,000 | 2,391,531 |
| CHC Commercial Mortgage Trust floater Series 2019-CHC Class F, 1 month U.S. LIBOR + 2.600% 4.6072% 6/15/34 (c)(d)(e) | | 1,488,758 | 1,416,475 |
| Citigroup Commercial Mortgage Trust: | | | |
| Series 2013-GC15 Class D, 5.1734% 9/10/46 (c)(e) | | 5,254,000 | 5,010,178 |
| Series 2016-C3 Class D, 3% 11/15/49 (e) | | 7,010,000 | 5,006,546 |
| Series 2022-GC48: | | | |
| Class D, 2.5% 6/15/55 (e) | | 4,000,000 | 2,568,618 |
| Class E, 2.5% 6/15/55 (e) | | 2,000,000 | 1,171,040 |
| Cologix Data Centers U.S. Issuer, LLC / Cologix Data Centers U.S. Co.-Issuer, LLC Series 2021-1A Class C, 5.99% 12/26/51 (e) | | 6,400,000 | 5,815,418 |
| COMM Mortgage Trust: | | | |
| floater Series 2018-HCLV: | | | |
| Class F, 1 month U.S. LIBOR + 3.050% 5.049% 9/15/33 (c)(d)(e) | | 4,265,000 | 3,765,992 |
| Class G, 1 month U.S. LIBOR + 5.050% 7.0553% 9/15/33 (c)(d)(e) | | 4,265,000 | 3,606,844 |
| sequential payer Series 2013-LC6 Class E, 3.5% 1/10/46 (e)(g) | | 4,741,000 | 4,124,670 |
| Series 2012-CR1: | | | |
| Class D, 5.2815% 5/15/45 (c)(e) | | 5,550,000 | 4,856,250 |
| Class G, 2.462% 5/15/45 (e) | | 6,346,000 | 1,537,210 |
| Series 2013-CR10 Class D, 4.8693% 8/10/46 (c)(e) | | 4,544,000 | 4,360,543 |
| Series 2014-CR17 Class E, 4.8455% 5/10/47 (c)(e) | | 3,098,000 | 2,303,467 |
| Series 2014-UBS2 Class D, 4.9798% 3/10/47 (c)(e) | | 3,713,000 | 3,471,034 |
| Series 2017-CD4 Class D, 3.3% 5/10/50 (e) | | 2,769,000 | 2,204,087 |
| Series 2019-CD4 Class C, 4.3497% 5/10/50 (c) | | 3,000,000 | 2,705,413 |
| COMM Trust Series 2017-COR2 Class D, 3% 9/10/50 (e) | | 2,769,000 | 2,174,726 |
| Commercial Mortgage Trust pass-thru certificates Series 2012-CR2: | | | |
| Class D, 4.917% 8/15/45 (c)(e) | | 4,500,000 | 4,425,228 |
| Class E, 4.917% 8/15/45 (c)(e) | | 8,000,000 | 7,144,000 |
| Class F, 4.25% 8/15/45 (e) | | 2,000,000 | 1,595,400 |
| Credit Suisse Commercial Mortgage Trust floater Series 2021-SOP2 Class F, 1 month U.S. LIBOR + 4.210% 6.216% 6/15/34 (d)(e) | | 7,120,000 | 6,598,907 |
| Credit Suisse Mortgage Trust: | | | |
| floater: | | | |
| Series 2021-4SZN Class A, CME Term SOFR 1 Month Index + 3.960% 5.9255% 11/15/23 (c)(d)(e) | | 24,906,000 | 24,114,921 |
| Series 2021-BPNY Class A, 1 month U.S. LIBOR + 3.710% 5.7144% 8/15/23 (c)(d)(e) | | 18,000,000 | 17,130,415 |
| Series 2020-NET: | | | |
| Class E, 3.7042% 8/15/37 (c)(e) | | 9,400,000 | 8,467,001 |
| Class F, 3.7042% 8/15/37 (c)(e) | | 7,050,000 | 6,301,634 |
| Series 2021-BRIT Class A, CME Term SOFR 1 Month Index + 3.570% 5.5327% 5/15/23 (c)(d)(e) | | 9,280,000 | 8,764,399 |
| CRSNT Trust floater Series 2021-MOON: | | | |
| Class F, 1 month U.S. LIBOR + 3.500% 5.5% 4/15/36 (c)(d)(e) | | 4,844,000 | 4,542,764 |
| Class G, 1 month U.S. LIBOR + 4.500% 6.5% 4/15/36 (c)(d)(e) | | 2,787,000 | 2,616,788 |
| CSAIL Commercial Mortgage Trust: | | | |
| sequential payer Series 2019-C15 Class A4, 4.0529% 3/15/52 | | 9,425,000 | 9,408,224 |
| Series 2017-C8 Class D, 4.4407% 6/15/50 (c)(e) | | 4,297,000 | 3,309,663 |
| Series 2017-CX9 Class D, 4.0704% 9/15/50 (c)(e) | | 2,539,000 | 1,953,427 |
| DBCCRE Mortgage Trust Series 2014-ARCP Class E, 4.9345% 1/10/34 (c)(e) | | 10,732,000 | 9,935,415 |
| DBUBS Mortgage Trust Series 2011-LC3A Class D, 5.3628% 8/10/44 (c)(e) | | 2,970,114 | 2,788,343 |
| ELP Commercial Mortgage Trust floater Series 2021-ELP Class J, 1 month U.S. LIBOR + 3.610% 5.6149% 11/15/38 (c)(d)(e) | | 15,448,000 | 14,360,147 |
| Extended Stay America Trust floater Series 2021-ESH Class F, 1 month U.S. LIBOR + 3.700% 5.7% 7/15/38 (c)(d)(e) | | 15,845,479 | 15,566,983 |
| GS Mortgage Securities Corp. Trust floater Series 2019-70P Class E, 1 month U.S. LIBOR + 2.200% 4.199% 10/15/36 (c)(d)(e) | | 7,437,000 | 6,712,920 |
| GS Mortgage Securities Trust: | | | |
| floater Series 2018-RIVR Class G, 1 month U.S. LIBOR + 2.600% 4.599% 7/15/35 (c)(d)(e) | | 3,808,000 | 2,978,823 |
| sequential payer: | | | |
| Series 2019-GSA1 Class A4, 3.0479% 11/10/52 | | 25,860,000 | 24,382,667 |
| Series 2021-GSA3 Class A5, 2.6183% 12/15/54 | | 12,657,000 | 11,220,725 |
| Series 2011-GC5: | | | |
| Class C, 5.1588% 8/10/44 (c)(e) | | 8,899,000 | 7,386,170 |
| Class D, 5.1588% 8/10/44 (c)(e) | | 2,733,635 | 1,164,529 |
| Class E, 5.1588% 8/10/44 (c)(e)(g) | | 8,138,000 | 716,144 |
| Class F, 4.5% 8/10/44 (e)(g) | | 7,897,000 | 27,702 |
| Series 2012-GCJ9: | | | |
| Class D, 4.6624% 11/10/45 (c)(e) | | 5,503,000 | 5,321,004 |
| Class E, 4.6624% 11/10/45 (c)(e) | | 1,908,000 | 1,567,666 |
| Series 2013-GC16: | | | |
| Class D, 5.3107% 11/10/46 (c)(e) | | 3,708,000 | 3,567,106 |
| Class F, 3.5% 11/10/46 (e)(g) | | 7,221,000 | 5,527,424 |
| Series 2021-RENT Class G, 1 month U.S. LIBOR + 5.700% 7.8616% 11/21/35 (c)(d)(e) | | 6,938,114 | 6,351,693 |
| Hilton U.S.A. Trust Series 2016-HHV Class F, 4.1935% 11/5/38 (c)(e) | | 20,270,000 | 17,422,428 |
| IMT Trust Series 2017-APTS Class EFX, 3.4966% 6/15/34 (c)(e) | | 9,213,000 | 8,609,897 |
| Independence Plaza Trust Series 2018-INDP Class E, 4.996% 7/10/35 (e) | | 2,896,000 | 2,658,014 |
| Intown Mortgage Trust floater Series 2022-STAY Class E, CME Term SOFR 1 Month Index + 5.030% 7.2814% 8/15/37 (c)(d)(e) | | 2,000,000 | 1,989,995 |
| JPMBB Commercial Mortgage Securities Trust: | | | |
| Series 2014-C23 Class UH5, 4.7094% 9/15/47 (e) | | 8,640,000 | 6,693,729 |
| Series 2014-C26 Class D, 3.8792% 1/15/48 (c)(e) | | 3,398,000 | 3,004,606 |
| JPMCC Commercial Mortgage Securities Trust Series 2016-JP4 Class D, 3.3866% 12/15/49 (c)(e) | | 10,126,000 | 7,908,517 |
| JPMDB Commercial Mortgage Securities Trust: | | | |
| sequential payer Series 2019-COR6 Class A4, 3.0565% 11/13/52 | | 13,000,000 | 12,169,490 |
| Series 2018-C8 Class D, 3.2171% 6/15/51 (c)(e) | | 1,698,000 | 1,224,422 |
| JPMorgan Chase Commercial Mortgage Securities Trust: | | | |
| sequential payer Series 2021-1MEM Class E, 2.6535% 10/9/42 (c)(e) | | 9,552,000 | 7,300,583 |
| Series 2011-C3: | | | |
| Class E, 5.5244% 2/15/46 (c)(e) | | 13,774,000 | 4,763,845 |
| Class G, 4.409% 2/15/46 (c)(e) | | 4,671,000 | 323,737 |
| Class H, 4.409% 2/15/46 (c)(e)(g) | | 7,077,000 | 326,437 |
| Series 2011-C4 Class F, 3.873% 7/15/46 (e) | | 1,400,000 | 1,312,092 |
| Series 2012-CBX: | | | |
| Class E, 4.7843% 6/15/45 (c)(e) | | 5,892,000 | 5,302,800 |
| Class F, 4% 6/15/45 (e)(g) | | 8,192,000 | 2,019,001 |
| Class G 4% 6/15/45 (e)(g) | | 4,044,000 | 392,457 |
| Series 2013-LC11: | | | |
| Class D, 4.1593% 4/15/46 (c) | | 7,722,000 | 5,907,012 |
| Class E, 3.25% 4/15/46 (c)(e) | | 472,000 | 305,198 |
| Class F, 3.25% 4/15/46 (c)(e) | | 2,518,000 | 843,782 |
| Series 2014-DSTY Class E, 3.8046% 6/10/27 (c)(e)(g) | | 8,161,000 | 408,288 |
| Series 2018-AON Class F, 4.6132% 7/5/31 (c)(e) | | 5,039,000 | 4,093,256 |
| Series 2020-NNN Class FFX, 4.6254% 1/16/37 (e) | | 2,000,000 | 1,809,592 |
| KNDR Trust floater Series 2021-KIND Class F, 1 month U.S. LIBOR + 3.950% 5.949% 8/15/38 (c)(d)(e) | | 14,155,000 | 13,173,971 |
| MED Trust floater Series 2021-MDLN Class G, 1 month U.S. LIBOR + 5.250% 7.25% 11/15/38 (c)(d)(e) | | 34,897,000 | 32,629,861 |
| Merit floater Series 2021-STOR Class J, 1 month U.S. LIBOR + 3.950% 5.949% 7/15/38 (c)(d)(e) | | 3,476,000 | 3,284,819 |
| MHC Commercial Mortgage Trust floater Series 2021-MHC Class G, 1 month U.S. LIBOR + 3.200% 5.2% 4/15/38 (c)(d)(e) | | 20,601,000 | 19,467,953 |
| MHP Commercial Mortgage Trust floater Series 2022-MHIL: | | | |
| Class F, CME Term SOFR 1 Month Index + 3.250% 5.2178% 1/15/27 (c)(d)(e) | | 4,305,000 | 4,013,639 |
| Class G, CME Term SOFR 1 Month Index + 3.950% 5.9161% 1/15/27 (c)(d)(e) | | 19,424,000 | 17,929,286 |
| Morgan Stanley BAML Trust: | | | |
| Series 2012-C6 Class D, 4.5738% 11/15/45 (c)(e) | | 2,000,000 | 1,980,623 |
| Series 2012-C6, Class F, 4.5738% 11/15/45 (c)(e)(g) | | 2,500,000 | 2,333,795 |
| Series 2013-C12 Class D, 4.7622% 10/15/46 (c)(e) | | 7,164,000 | 6,502,931 |
| Series 2013-C13: | | | |
| Class D, 4.896% 11/15/46 (c)(e) | | 6,218,000 | 5,684,611 |
| Class E, 4.896% 11/15/46 (c)(e) | | 3,341,000 | 2,836,671 |
| Series 2013-C9: | | | |
| Class C, 4.018% 5/15/46 (c) | | 3,302,000 | 3,192,833 |
| Class D, 4.106% 5/15/46 (c)(e) | | 5,137,000 | 4,791,438 |
| Series 2016-C30 Class D, 3% 9/15/49 (e) | | 2,726,000 | 1,867,304 |
| Morgan Stanley Capital I Trust: | | | |
| Series 1998-CF1 Class G, 7.35% 7/15/32 (c)(e) | | 38,848 | 38,479 |
| Series 2011-C2: | | | |
| Class D, 5.2113% 6/15/44 (c)(e) | | 3,685,789 | 3,483,061 |
| Class F, 5.2113% 6/15/44 (c)(e)(g) | | 4,440,000 | 2,886,000 |
| Class XB, 0.4386% 6/15/44 (c)(e)(h) | | 29,276,678 | 115,693 |
| Series 2011-C3: | | | |
| Class D, 5.0842% 7/15/49 (c)(e) | | 7,317,000 | 7,013,814 |
| Class E, 5.0842% 7/15/49 (c)(e)(g) | | 3,456,000 | 3,039,434 |
| Class F, 5.0842% 7/15/49 (c)(e)(g) | | 5,624,050 | 3,895,083 |
| Class G, 5.0842% 7/15/49 (c)(e)(g) | | 5,049,500 | 2,655,908 |
| Series 2012-C4 Class D, 5.1638% 3/15/45 (c)(e) | | 3,699,751 | 3,537,886 |
| Series 2015-MS1 Class D, 4.024% 5/15/48 (c)(e) | | 10,833,000 | 9,143,867 |
| Series 2015-UBS8 Class D, 3.18% 12/15/48 (e) | | 3,051,000 | 2,250,151 |
| Series 2016-BNK2 Class C, 3% 11/15/49 (e) | | 2,966,000 | 2,306,694 |
| Series 2017-H1: | | | |
| Class C, 4.281% 6/15/50 | | 2,000,000 | 1,877,080 |
| Class D, 2.546% 6/15/50 (e) | | 2,000,000 | 1,542,595 |
| Series 2018-H4 Class A4, 4.31% 12/15/51 | | 14,240,929 | 14,426,817 |
| Series 2020-L4, Class C, 3.536% 2/15/53 | | 2,765,000 | 2,377,872 |
| Motel 6 Trust floater Series 2021-MTL6: | | | |
| Class G, 1 month U.S. LIBOR + 4.700% 6.6991% 9/15/38 (c)(d)(e) | | 5,093,062 | 5,044,444 |
| Class H, 1 month U.S. LIBOR + 6.000% 7.9991% 9/15/38 (c)(d)(e) | | 3,435,600 | 3,369,119 |
| MRCD Mortgage Trust Series 2019-PARK Class G, 2.7175% 12/15/36 (e) | | 2,000,000 | 1,725,865 |
| MSC sequential payer Series 2021-L7 Class A5, 2.574% 10/15/54 | | 10,055,000 | 8,958,176 |
| MSJP Commercial Securities Mortgage Trust Series 2015-HAUL Class E, 4.851% 9/5/47 (c)(e) | | 1,500,000 | 1,140,876 |
| MTN Commercial Mortgage Trust floater Series 2022-LPFL Class F, CME Term SOFR 1 Month Index + 5.280% 7.2437% 3/15/39 (c)(d)(e) | | 5,000,000 | 4,720,539 |
| Natixis Commercial Mortgage Securities Trust: | | | |
| floater Series 2018-FL1 Class WAN2, 1 month U.S. LIBOR + 3.750% 5.7491% 6/15/35 (c)(d)(e) | | 651,000 | 503,876 |
| Series 2020-2PAC Class AMZ3, 3.5% 1/15/37 (c)(e) | | 2,502,675 | 2,275,448 |
| OPG Trust floater Series 2021-PORT: | | | |
| Class G, 1 month U.S. LIBOR + 2.390% 4.397% 10/15/36 (c)(d)(e) | | 5,769,089 | 5,271,513 |
| Class J, 1 month U.S. LIBOR + 3.340% 5.345% 10/15/36 (c)(d)(e) | | 10,332,870 | 9,557,909 |
| PKHL Commercial Mortgage Trust floater Series 2021-MF: | | | |
| Class E, 1 month U.S. LIBOR + 2.600% 4.6% 7/15/38 (c)(d)(e) | | 500,000 | 466,987 |
| Class G, 1 month U.S. LIBOR + 4.350% 6.35% 7/15/38 (c)(d)(e) | | 5,944,000 | 5,613,613 |
| Prima Capital CRE Securitization Ltd. Series 2020-8A Class C, 3% 12/1/70 (e) | | 9,277,000 | 7,230,864 |
| Providence Place Group Ltd. Partnership Series 2000-C1 Class A2, 7.75% 7/20/28 (e) | | 3,115,026 | 3,392,905 |
| ReadyCap Commercial Mortgage Trust floater Series 2019-FL3 Class D, 1 month U.S. LIBOR + 2.900% 5.159% 3/25/34 (c)(d)(e) | | 3,401,000 | 3,271,338 |
| SFO Commercial Mortgage Trust floater Series 2021-555 Class F, 1 month U.S. LIBOR + 3.650% 5.649% 5/15/38 (c)(d)(e) | | 3,720,000 | 3,393,041 |
| SG Commercial Mortgage Securities Trust Series 2020-COVE Class F, 3.7276% 3/15/37 (c)(e) | | 5,000,000 | 4,413,966 |
| SLG Office Trust: | | | |
| sequential payer Series 2021-OVA Class A, 2.5854% 7/15/41 (e) | | 13,377,000 | 11,805,811 |
| Series 2021-OVA Class G, 2.8506% 7/15/41 (e) | | 5,000,000 | 3,535,130 |
| SMRT Commercial Mortgage Trust floater Series 2022-MINI Class F, CME Term SOFR 1 Month Index + 3.350% 5.309% 1/15/39 (c)(d)(e) | | 27,615,000 | 25,494,753 |
| SREIT Trust floater: | | | |
| Series 2021-IND Class G, 1 month U.S. LIBOR + 3.260% 5.2648% 10/15/38 (c)(d)(e) | | 21,754,000 | 19,615,832 |
| Series 2021-MFP Class G, 1 month U.S. LIBOR + 2.970% 4.9729% 11/15/38 (c)(d)(e) | | 13,874,000 | 12,902,820 |
| Series 2021-MFP2 Class J, 1 month U.S. LIBOR + 3.910% 5.9145% 11/15/36 (c)(d)(e) | | 22,872,000 | 21,592,421 |
| STWD Trust floater sequential payer Series 2021-LIH: | | | |
| Class E, 1 month U.S. LIBOR + 2.900% 4.902% 11/15/36 (c)(d)(e) | | 4,985,000 | 4,575,720 |
| Class F, 1 month U.S. LIBOR + 3.550% 5.55% 11/15/36 (c)(d)(e) | | 15,282,000 | 14,016,678 |
| Class G, 1 month U.S. LIBOR + 4.200% 6.199% 11/15/36 (c)(d)(e) | | 9,177,000 | 8,442,567 |
| SUMIT Mortgage Trust Series 2022-BVUE: | | | |
| Class D, 2.8925% 2/12/41 (c)(e) | | 6,000,000 | 4,757,048 |
| Class F, 2.8925% 2/12/41 (c)(e) | | 3,211,000 | 2,395,275 |
| TPGI Trust floater Series 2021-DGWD Class G, 1 month U.S. LIBOR + 3.850% 5.85% 6/15/26 (c)(d)(e) | | 7,308,000 | 6,686,702 |
| UBS Commercial Mortgage Trust Series 2012-C1: | | | |
| Class D, 6.4444% 5/10/45 (c)(e) | | 321,258 | 292,345 |
| Class E, 5% 5/10/45 (c)(e)(g) | | 6,268,000 | 2,444,520 |
| Class F, 5% 5/10/45 (c)(e) | | 2,221,350 | 113,533 |
| UBS-BAMLL Trust Series 12-WRM Class D, 4.238% 6/10/30 (c)(e)(g) | | 2,143,000 | 1,626,556 |
| UBS-Citigroup Commercial Mortgage Trust Series 2011-C1 Class C, 6.4484% 1/10/45 (c)(e)(g) | | 3,236,202 | 3,009,668 |
| VASA Trust: | | | |
| floater Series 2021-VASA Class G, 1 month U.S. LIBOR + 5.000% 6.999% 7/15/39 (c)(d)(e) | | 800,000 | 756,437 |
| floater sequential payer Series 2021-VASA Class F, 1 month U.S. LIBOR + 3.900% 5.899% 7/15/39 (c)(d)(e) | | 6,685,000 | 6,311,621 |
| VMC Finance Ltd. floater Series 2021-HT1 Class B, 1 month U.S. LIBOR + 4.500% 6.656% 1/18/37 (c)(d)(e) | | 24,580,000 | 22,948,021 |
| Wells Fargo Commercial Mortgage Trust: | | | |
| Series 2012-LC5: | | | |
| Class E, 4.7272% 10/15/45 (c)(e) | | 8,347,000 | 8,187,044 |
| Class F, 4.7272% 10/15/45 (c)(e) | | 2,000,000 | 1,798,673 |
| Series 2016-BNK1 Class D, 3% 8/15/49 (e) | | 6,979,000 | 4,392,272 |
| Series 2016-NXS6 Class D, 3.059% 11/15/49 (e) | | 5,037,000 | 4,039,886 |
| Series 2019-C52 Class C, 3.561% 8/15/52 | | 883,000 | 757,711 |
| WF-RBS Commercial Mortgage Trust: | | | |
| sequential payer Series 2011-C4I Class G, 5% 6/15/44 (c)(g) | | 3,955,000 | 145,326 |
| Series 2011-C3: | | | |
| Class D, 22.8133% 3/15/44 (c)(e) | | 1,543,667 | 657,602 |
| Class E, 5% 3/15/44 (e)(g) | | 2,966,000 | 14,830 |
| Series 2011-C5: | | | |
| Class E, 5.5193% 11/15/44 (c)(e) | | 2,160,343 | 2,154,611 |
| Class F, 5.25% 11/15/44 (c)(e) | | 3,500,000 | 3,210,990 |
| Class G, 5.25% 11/15/44 (c)(e) | | 2,000,000 | 1,774,327 |
| Series 2012-C7: | | | |
| Class D, 4.6935% 6/15/45 (c)(e)(g) | | 2,380,000 | 1,106,700 |
| Class F, 4.5% 6/15/45 (e)(g) | | 1,988,787 | 9,944 |
| Series 2012-C8 Class E, 4.8877% 8/15/45 (c)(e) | | 1,218,230 | 1,215,640 |
| Series 2013-C11: | | | |
| Class D, 4.2295% 3/15/45 (c)(e) | | 5,765,000 | 5,566,007 |
| Class E, 4.2295% 3/15/45 (c)(e)(g) | | 4,727,000 | 4,449,140 |
| Series 2013-C13 Class D, 4.1453% 5/15/45 (c)(e) | | 3,955,000 | 3,768,512 |
| Series 2013-C16 Class D, 4.9824% 9/15/46 (c)(e) | | 3,686,000 | 3,452,739 |
| Series 2013-UBS1 Class D, 5.0243% 3/15/46 (c)(e) | | 4,538,000 | 4,379,093 |
| WP Glimcher Mall Trust Series 2015-WPG: | | | |
| Class PR1, 3.516% 6/5/35 (c)(e) | | 6,725,000 | 5,525,167 |
| Class PR2, 3.516% 6/5/35 (c)(e) | | 2,541,000 | 1,940,703 |
| TOTAL COMMERCIAL MORTGAGE SECURITIES | | | |
| (Cost $1,529,562,653) | | | 1,375,761,716 |
|
| Bank Loan Obligations - 1.6% | | | |
| CONSUMER DISCRETIONARY - 0.2% | | | |
| Hotels, Restaurants & Leisure - 0.2% | | | |
| BRE/Everbright M6 Borrower LLC Tranche B 1LN, term loan 1 month U.S. LIBOR + 5.000% 7.346% 9/9/26 (c)(d)(i) | | 9,855,525 | 9,551,679 |
| FINANCIALS - 1.3% | | | |
| Diversified Financial Services - 1.3% | | | |
| Agellan Portfolio 9% 8/7/25 (c)(g)(i) | | 6,611,000 | 6,611,000 |
| Mhp 2022-Mhil Mezz U.S. Secured Overnight Fin. Rate (SOFR) Indx + 5.000% 6.9586% 1/9/24 (c)(d)(g)(i) | | 25,400,000 | 24,638,000 |
| Sunbelt Mezz U.S. Secured Overnight Fin. Rate (SOFR) Indx + 4.450% 6.163% 1/21/27 (c)(d)(g)(i) | | 18,837,337 | 18,837,337 |
| Veritas Multifamily Portfolio 1 month U.S. LIBOR + 8.500% 10.4992% 11/15/22 (c)(d)(g)(i) | | 29,336,049 | 28,896,009 |
| | | | 78,982,346 |
| REAL ESTATE - 0.1% | | | |
| Real Estate Management & Development - 0.1% | | | |
| DTZ U.S. Borrower LLC Tranche B 1LN, term loan 1 month U.S. LIBOR + 2.750% 5.1223% 8/21/25 (c)(d)(i) | | 5,000,000 | 4,833,050 |
| TOTAL BANK LOAN OBLIGATIONS | | | |
| (Cost $94,828,325) | | | 93,367,075 |
|
| Preferred Securities - 0.1% | | | |
| ENERGY - 0.1% | | | |
| Oil, Gas & Consumable Fuels - 0.1% | | | |
| Energy Transfer LP 7.125% (c)(j) | | 6,000,000 | 5,489,439 |
| FINANCIALS - 0.0% | | | |
| Diversified Financial Services - 0.0% | | | |
| Crest Dartmouth Street 2003-1 Ltd. Series 2003-1A Class PS, 6/28/38 (e)(g) | | 1,220,000 | 122 |
| Thrifts & Mortgage Finance - 0.0% | | | |
| Crest Clarendon Street 2002-1 Ltd. Series 2002-1A Class PS, 12/28/35 (d)(e)(g) | | 500,000 | 10,000 |
|
| TOTAL FINANCIALS | | | 10,122 |
|
| TOTAL PREFERRED SECURITIES | | | |
| (Cost $7,297,768) | | | 5,499,561 |
| | | Shares | Value |
|
| Money Market Funds - 12.6% | | | |
| Fidelity Cash Central Fund 2.01% (k) | | | |
| (Cost $750,665,427) | | 750,562,333 | 750,712,446 |
| TOTAL INVESTMENT IN SECURITIES - 99.5% | | | |
| (Cost $5,758,048,253) | | | 5,928,290,200 |
| NET OTHER ASSETS (LIABILITIES) - 0.5% | | | 30,866,775 |
| NET ASSETS - 100% | | | $5,959,156,975 |
Legend
(a) Affiliated company
(b) Non-income producing
(c) Coupon rates for floating and adjustable rate securities reflect the rates in effect at period end.
(d) Coupon is indexed to a floating interest rate which may be multiplied by a specified factor and/or subject to caps or floors.
(e) Security exempt from registration under Rule 144A of the Securities Act of 1933. These securities may be resold in transactions exempt from registration, normally to qualified institutional buyers. At the end of the period, the value of these securities amounted to $1,643,972,255 or 27.6% of net assets.
(f) Non-income producing - Security is in default.
(g) Level 3 security
(h) Interest Only (IO) security represents the right to receive only monthly interest payments on an underlying pool of mortgages or assets. Principal shown is the outstanding par amount of the pool as of the end of the period.
(i) Remaining maturities of bank loan obligations may be less than the stated maturities shown as a result of contractual or optional prepayments by the borrower. Such prepayments cannot be predicted with certainty.
(j) Security is perpetual in nature with no stated maturity date.
(k) Affiliated fund that is generally available only to investment companies and other accounts managed by Fidelity Investments. The rate quoted is the annualized seven-day yield of the fund at period end. A complete unaudited listing of the fund's holdings as of its most recent quarter end is available upon request. In addition, each Fidelity Central Fund's financial statements, which are not covered by the Fund's Report of Independent Registered Public Accounting Firm, are available on the SEC's website or upon request.
Affiliated Central Funds
Fiscal year to date information regarding the Fund's investments in Fidelity Central Funds, including the ownership percentage, is presented below.
| Fund | Value, beginning of period | Purchases | Sales Proceeds | Dividend Income | Realized Gain/Loss | Change in Unrealized appreciation (depreciation) | Value, end of period | % ownership, end of period |
| Fidelity Cash Central Fund 2.01% | $900,242,010 | $2,807,769,871 | $2,957,299,435 | $1,918,932 | $1,648 | $(1,648) | $750,712,446 | 1.4% |
| Fidelity Securities Lending Cash Central Fund 2.01% | 97,387,058 | 211,962,586 | 309,349,644 | 158,734 | -- | -- | -- | 0.0% |
| Total | $997,629,068 | $3,019,732,457 | $3,266,649,079 | $2,077,666 | $1,648 | $(1,648) | $750,712,446 | |
Amounts in the income column in the above table include any capital gain distributions from underlying funds, which are presented in the corresponding line-item in the Statement of Operations, if applicable. Amount for Fidelity Securities Lending Cash Central Fund represents the income earned on investing cash collateral, less rebates paid to borrowers and any lending agent fees associated with the loan, plus any premium payments received for lending certain types of securities.
Other Affiliated Issuers
An affiliated company is a company in which the Fund has ownership of at least 5% of the voting securities. Fiscal year to date transactions with companies which are or were affiliates are presented in the table below. Certain corporate actions, such as mergers, are excluded from the amounts in this table if applicable.
| Affiliate | Value, beginning of period | Purchases | Sales Proceeds | Dividend Income | Realized Gain (loss) | Change in Unrealized appreciation (depreciation) | Value, end of period |
| Great Ajax Corp. | $21,091,456 | $-- | $-- | $1,647,267 | $132,532 | $(2,937,505) | $18,330,271 |
| Great Ajax Corp. 7.25% | 15,866,920 | -- | -- | 1,108,239 | -- | (727,616) | 15,139,304 |
| iStar Financial, Inc. | 99,011,364 | -- | 69,362,283 | 717,341 | 19,497,349 | (47,773,093) | -- |
| iStar Financial, Inc. Series D, 8.00% | 9,002,613 | -- | 209,391 | 333,650 | 360,589 | (587,322) | -- |
| iStar Financial, Inc. Series G, 7.65% | 10,125,593 | -- | 769,738 | 352,494 | 430,539 | (993,861) | -- |
| iStar Financial, Inc. Series I, 7.50% | 14,635,390 | -- | -- | 518,152 | 518,153 | (1,275,346) | -- |
| Total | $169,733,336 | $-- | $70,341,412 | $4,677,143 | $20,939,162 | $(54,294,743) | $33,469,575 |
Investment Valuation
The following is a summary of the inputs used, as of July 31, 2022, involving the Fund's assets and liabilities carried at fair value. The inputs or methodology used for valuing securities may not be an indication of the risk associated with investing in those securities. For more information on valuation inputs, and their aggregation into the levels used below, please refer to the Investment Valuation section in the accompanying Notes to Financial Statements.
| | Valuation Inputs at Reporting Date: |
| Description | Total | Level 1 | Level 2 | Level 3 |
| Investments in Securities: | | | | |
| Equities: | | | | |
| Energy | $47,022,553 | $47,022,553 | $-- | $-- |
| Financials | 661,634,605 | 646,495,301 | 15,139,304 | -- |
| Industrials | 16,382,223 | 16,382,223 | -- | -- |
| Information Technology | 9,797,103 | 9,797,103 | -- | -- |
| Real Estate | 1,931,025,883 | 1,902,986,636 | 28,039,247 | -- |
| Corporate Bonds | 944,186,088 | -- | 944,186,084 | 4 |
| Asset-Backed Securities | 92,859,673 | -- | 92,859,403 | 270 |
| Collateralized Mortgage Obligations | 41,274 | -- | 6,546 | 34,728 |
| Commercial Mortgage Securities | 1,375,761,716 | -- | 1,332,377,079 | 43,384,637 |
| Bank Loan Obligations | 93,367,075 | -- | 14,384,729 | 78,982,346 |
| Preferred Securities | 5,499,561 | -- | 5,489,439 | 10,122 |
| Money Market Funds | 750,712,446 | 750,712,446 | -- | -- |
| Total Investments in Securities: | $5,928,290,200 | $3,373,396,262 | $2,432,481,831 | $122,412,107 |
The following is a reconciliation of Investments in Securities for which Level 3 inputs were used in determining value:
| Investments in Securities: | |
| Bank Loan Obligations | |
| Beginning Balance | $62,599,936 |
| Net Realized Gain (Loss) on Investment Securities | (754,542) |
| Net Unrealized Gain (Loss) on Investment Securities | (1,307,528) |
| Cost of Purchases | 70,615,015 |
| Proceeds of Sales | (52,181,134) |
| Amortization/Accretion | 10,599 |
| Transfers into Level 3 | -- |
| Transfers out of Level 3 | -- |
| Ending Balance | $78,982,346 |
| The change in unrealized gain (loss) for the period attributable to Level 3 securities held at July 31, 2022 | $(1,316,404) |
| Other Investments in Securities | |
| Beginning Balance | $28,255,015 |
| Net Realized Gain (Loss) on Investment Securities | (9,775,230) |
| Net Unrealized Gain (Loss) on Investment Securities | 15,883,688 |
| Cost of Purchases | 2,332,987 |
| Proceeds of Sales | (28,642,256) |
| Amortization/Accretion | (2,283,787) |
| Transfers into Level 3 | 44,339,019 |
| Transfers out of Level 3 | (6,679,675) |
| Ending Balance | $43,429,791 |
| The change in unrealized gain (loss) for the period attributable to Level 3 securities held at July 31, 2022 | $15,883,688 |
The information used in the above reconciliations represents fiscal year to date activity for any Investments in Securities identified as using Level 3 inputs at either the beginning or the end of the current fiscal period. Transfers into Level 3 were attributable to a lack of observable market data resulting from decreases in market activity, decreases in liquidity, security restructurings or corporate actions. Transfers out of Level 3 were attributable to observable market data becoming available for those securities. Cost of purchases and proceeds of sales may include securities received and/or delivered through in-kind transactions. Transfers in or out of Level 3 represent the beginning value of any Security or Instrument where a change in the pricing level occurred from the beginning to the end of the period. The cost of purchases and the proceeds of sales may include securities received or delivered through corporate actions or exchanges. Realized and unrealized gains (losses) disclosed in the reconciliations are included in Net Gain (Loss) on the Fund's Statement of Operations.
Other Information
The composition of credit quality ratings as a percentage of Total Net Assets is as follows (Unaudited):
| U.S. Government and U.S. Government Agency Obligations | 0.0% |
| AAA,AA,A | 3.5% |
| BBB | 2.9% |
| BB | 8.5% |
| B | 6.9% |
| CCC,CC,C | 1.9% |
| Not Rated | 18.5% |
| Equities | 44.7% |
| Short-Term Investments and Net Other Assets | 13.1% |
| | 100.0% |
We have used ratings from Moody's Investors Service, Inc. Where Moody's® ratings are not available, we have used S&P® ratings. All ratings are as of the date indicated and do not reflect subsequent changes.
See accompanying notes which are an integral part of the financial statements.
Financial Statements
Statement of Assets and Liabilities
| | | July 31, 2022 |
| Assets | | |
Investment in securities, at value — See accompanying schedule:
Unaffiliated issuers (cost $4,971,344,209) | $5,144,108,179 | |
| Fidelity Central Funds (cost $750,665,427) | 750,712,446 | |
| Other affiliated issuers (cost $36,038,617) | 33,469,575 | |
| Total Investment in Securities (cost $5,758,048,253) | | $5,928,290,200 |
| Foreign currency held at value (cost $22) | | 22 |
| Receivable for investments sold | | 34,081,258 |
| Receivable for fund shares sold | | 5,683,206 |
| Dividends receivable | | 5,632,193 |
| Interest receivable | | 21,122,788 |
| Distributions receivable from Fidelity Central Funds | | 893,564 |
| Total assets | | 5,995,703,231 |
| Liabilities | | |
| Payable to custodian bank | $454,476 | |
| Payable for investments purchased | 27,768,348 | |
| Payable for fund shares redeemed | 4,723,014 | |
| Accrued management fee | 2,545,283 | |
| Distribution and service plan fees payable | 157,755 | |
| Other affiliated payables | 801,385 | |
| Other payables and accrued expenses | 95,995 | |
| Total liabilities | | 36,546,256 |
| Net Assets | | $5,959,156,975 |
| Net Assets consist of: | | |
| Paid in capital | | $5,657,114,971 |
| Total accumulated earnings (loss) | | 302,042,004 |
| Net Assets | | $5,959,156,975 |
| Net Asset Value and Maximum Offering Price | | |
| Class A: | | |
| Net Asset Value and redemption price per share ($364,443,321 ÷ 29,177,843 shares)(a) | | $12.49 |
| Maximum offering price per share (100/96.00 of $12.49) | | $13.01 |
| Class M: | | |
| Net Asset Value and redemption price per share ($52,918,829 ÷ 4,235,559 shares)(a) | | $12.49 |
| Maximum offering price per share (100/96.00 of $12.49) | | $13.01 |
| Class C: | | |
| Net Asset Value and offering price per share ($89,134,560 ÷ 7,263,560 shares)(a) | | $12.27 |
| Real Estate Income: | | |
| Net Asset Value, offering price and redemption price per share ($1,898,344,574 ÷ 150,852,231 shares) | | $12.58 |
| Class I: | | |
| Net Asset Value, offering price and redemption price per share ($1,946,852,211 ÷ 155,376,367 shares) | | $12.53 |
| Class Z: | | |
| Net Asset Value, offering price and redemption price per share ($1,607,463,480 ÷ 128,302,249 shares) | | $12.53 |
(a) Redemption price per share is equal to net asset value less any applicable contingent deferred sales charge.
See accompanying notes which are an integral part of the financial statements.
Statement of Operations
| | | Year ended July 31, 2022 |
| Investment Income | | |
| Dividends (including $4,677,143 earned from other affiliated issuers) | | $127,056,161 |
| Interest | | 148,767,969 |
| Income from Fidelity Central Funds (including $158,734 from security lending) | | 2,077,666 |
| Total income | | 277,901,796 |
| Expenses | | |
| Management fee | $36,893,187 | |
| Transfer agent fees | 9,385,620 | |
| Distribution and service plan fees | 2,172,500 | |
| Accounting fees | 1,437,972 | |
| Custodian fees and expenses | 42,663 | |
| Independent trustees' fees and expenses | 23,295 | |
| Registration fees | 222,162 | |
| Audit | 101,789 | |
| Legal | 5,520 | |
| Miscellaneous | 30,411 | |
| Total expenses before reductions | 50,315,119 | |
| Expense reductions | (224,659) | |
| Total expenses after reductions | | 50,090,460 |
| Net investment income (loss) | | 227,811,336 |
| Realized and Unrealized Gain (Loss) | | |
| Net realized gain (loss) on: | | |
| Investment securities: | | |
| Unaffiliated issuers | 96,953,907 | |
| Fidelity Central Funds | 1,648 | |
| Other affiliated issuers | 20,939,162 | |
| Foreign currency transactions | 81,596 | |
| Total net realized gain (loss) | | 117,976,313 |
| Change in net unrealized appreciation (depreciation) on: | | |
| Investment securities: | | |
| Unaffiliated issuers | (636,791,596) | |
| Fidelity Central Funds | (1,648) | |
| Other affiliated issuers | (54,294,743) | |
| Assets and liabilities in foreign currencies | (393) | |
| Total change in net unrealized appreciation (depreciation) | | (691,088,380) |
| Net gain (loss) | | (573,112,067) |
| Net increase (decrease) in net assets resulting from operations | | $(345,300,731) |
See accompanying notes which are an integral part of the financial statements.
Statement of Changes in Net Assets
| | Year ended July 31, 2022 | Year ended July 31, 2021 |
| Increase (Decrease) in Net Assets | | |
| Operations | | |
| Net investment income (loss) | $227,811,336 | $173,083,539 |
| Net realized gain (loss) | 117,976,313 | 62,884,184 |
| Change in net unrealized appreciation (depreciation) | (691,088,380) | 1,137,122,779 |
| Net increase (decrease) in net assets resulting from operations | (345,300,731) | 1,373,090,502 |
| Distributions to shareholders | (182,301,772) | (214,833,122) |
| Share transactions - net increase (decrease) | (582,517,493) | 605,814,975 |
| Total increase (decrease) in net assets | (1,110,119,996) | 1,764,072,355 |
| Net Assets | | |
| Beginning of period | 7,069,276,971 | 5,305,204,616 |
| End of period | $5,959,156,975 | $7,069,276,971 |
See accompanying notes which are an integral part of the financial statements.
Financial Highlights
Fidelity Real Estate Income Fund Class A
| Years ended July 31, | 2022 | 2021 | 2020 | 2019 | 2018 |
| Selected Per–Share Data | | | | | |
| Net asset value, beginning of period | $13.43 | $11.02 | $12.43 | $11.99 | $12.32 |
| Income from Investment Operations | | | | | |
| Net investment income (loss)A,B | .39 | .33 | .45 | .51 | .47 |
| Net realized and unrealized gain (loss) | (1.03) | 2.53 | (1.25) | .65 | (.22) |
| Total from investment operations | (.64) | 2.86 | (.80) | 1.16 | .25 |
| Distributions from net investment income | (.28) | (.42)C | (.44) | (.51) | (.45) |
| Distributions from net realized gain | (.02) | (.03)C | (.16) | (.21) | (.13) |
| Total distributions | (.30) | (.45) | (.61)D | (.72) | (.58) |
| Redemption fees added to paid in capitalA | – | – | – | – | –E |
| Net asset value, end of period | $12.49 | $13.43 | $11.02 | $12.43 | $11.99 |
| Total ReturnF,G | (4.83)% | 26.64% | (6.88)% | 10.15% | 2.13% |
| Ratios to Average Net AssetsB,H,I | | | | | |
| Expenses before reductions | .98% | .99% | 1.01% | 1.01% | 1.02% |
| Expenses net of fee waivers, if any | .98% | .99% | 1.01% | 1.01% | 1.02% |
| Expenses net of all reductions | .98% | .99% | 1.00% | 1.01% | 1.01% |
| Net investment income (loss) | 2.97% | 2.75% | 3.85% | 4.29% | 3.98% |
| Supplemental Data | | | | | |
| Net assets, end of period (000 omitted) | $364,443 | $384,382 | $324,031 | $325,296 | $297,722 |
| Portfolio turnover rateJ | 42% | 26% | 32%K | 17% | 27% |
A Calculated based on average shares outstanding during the period.
B Net investment income (loss) is affected by the timing of the declaration of dividends by any underlying mutual funds or exchange-traded funds (ETFs). Net investment income (loss) of any such underlying funds is not included in the Fund's net investment income (loss) ratio.
C The amount shown reflects reclassifications related to book to tax differences that were made in the year shown.
D Total distributions per share do not sum due to rounding.
E Amount represents less than $.005 per share.
F Total returns would have been lower if certain expenses had not been reduced during the applicable periods shown.
G Total returns do not include the effect of the sales charges.
H Fees and expenses of any underlying mutual funds or exchange-traded funds (ETFs) are not included in the Fund's expense ratio. The Fund indirectly bears its proportionate share of these expenses. For additional expense information related to investments in Fidelity Central Funds, please refer to the "Investments in Fidelity Central Funds" note found in the Notes to Financial Statements section of the most recent Annual or Semi-Annual report.
I Expense ratios reflect operating expenses of the class. Expenses before reductions do not reflect amounts reimbursed, waived, or reduced through arrangements with the investment adviser, brokerage services, or other offset arrangements, if applicable, and do not represent the amount paid by the class during periods when reimbursements, waivers or reductions occur.
J Amount does not include the portfolio activity of any underlying mutual funds or exchange-traded funds (ETFs).
K Portfolio turnover rate excludes securities received or delivered in-kind.
See accompanying notes which are an integral part of the financial statements.
Fidelity Real Estate Income Fund Class M
| Years ended July 31, | 2022 | 2021 | 2020 | 2019 | 2018 |
| Selected Per–Share Data | | | | | |
| Net asset value, beginning of period | $13.43 | $11.02 | $12.43 | $11.99 | $12.32 |
| Income from Investment Operations | | | | | |
| Net investment income (loss)A,B | .39 | .33 | .45 | .51 | .47 |
| Net realized and unrealized gain (loss) | (1.03) | 2.53 | (1.26) | .65 | (.22) |
| Total from investment operations | (.64) | 2.86 | (.81) | 1.16 | .25 |
| Distributions from net investment income | (.28) | (.42)C | (.44) | (.51) | (.45) |
| Distributions from net realized gain | (.02) | (.03)C | (.16) | (.21) | (.13) |
| Total distributions | (.30) | (.45) | (.60) | (.72) | (.58) |
| Redemption fees added to paid in capitalA | – | – | – | – | –D |
| Net asset value, end of period | $12.49 | $13.43 | $11.02 | $12.43 | $11.99 |
| Total ReturnE,F | (4.85)% | 26.62% | (6.89)% | 10.12% | 2.10% |
| Ratios to Average Net AssetsB,G,H | | | | | |
| Expenses before reductions | .99% | 1.01% | 1.03% | 1.04% | 1.04% |
| Expenses net of fee waivers, if any | .99% | 1.01% | 1.03% | 1.04% | 1.04% |
| Expenses net of all reductions | .99% | 1.01% | 1.03% | 1.04% | 1.04% |
| Net investment income (loss) | 2.97% | 2.73% | 3.82% | 4.26% | 3.95% |
| Supplemental Data | | | | | |
| Net assets, end of period (000 omitted) | $52,919 | $57,338 | $49,387 | $60,540 | $55,175 |
| Portfolio turnover rateI | 42% | 26% | 32%J | 17% | 27% |
A Calculated based on average shares outstanding during the period.
B Net investment income (loss) is affected by the timing of the declaration of dividends by any underlying mutual funds or exchange-traded funds (ETFs). Net investment income (loss) of any such underlying funds is not included in the Fund's net investment income (loss) ratio.
C The amount shown reflects reclassifications related to book to tax differences that were made in the year shown.
D Amount represents less than $.005 per share.
E Total returns would have been lower if certain expenses had not been reduced during the applicable periods shown.
F Total returns do not include the effect of the sales charges.
G Fees and expenses of any underlying mutual funds or exchange-traded funds (ETFs) are not included in the Fund's expense ratio. The Fund indirectly bears its proportionate share of these expenses. For additional expense information related to investments in Fidelity Central Funds, please refer to the "Investments in Fidelity Central Funds" note found in the Notes to Financial Statements section of the most recent Annual or Semi-Annual report.
H Expense ratios reflect operating expenses of the class. Expenses before reductions do not reflect amounts reimbursed, waived, or reduced through arrangements with the investment adviser, brokerage services, or other offset arrangements, if applicable, and do not represent the amount paid by the class during periods when reimbursements, waivers or reductions occur.
I Amount does not include the portfolio activity of any underlying mutual funds or exchange-traded funds (ETFs).
J Portfolio turnover rate excludes securities received or delivered in-kind.
See accompanying notes which are an integral part of the financial statements.
Fidelity Real Estate Income Fund Class C
| Years ended July 31, | 2022 | 2021 | 2020 | 2019 | 2018 |
| Selected Per–Share Data | | | | | |
| Net asset value, beginning of period | $13.21 | $10.88 | $12.28 | $11.85 | $12.20 |
| Income from Investment Operations | | | | | |
| Net investment income (loss)A,B | .29 | .24 | .36 | .42 | .38 |
| Net realized and unrealized gain (loss) | (1.01) | 2.48 | (1.23) | .64 | (.22) |
| Total from investment operations | (.72) | 2.72 | (.87) | 1.06 | .16 |
| Distributions from net investment income | (.20) | (.36)C | (.36) | (.42) | (.37) |
| Distributions from net realized gain | (.02) | (.03)C | (.16) | (.21) | (.13) |
| Total distributions | (.22) | (.39) | (.53)D | (.63) | (.51)D |
| Redemption fees added to paid in capitalA | – | – | – | – | –E |
| Net asset value, end of period | $12.27 | $13.21 | $10.88 | $12.28 | $11.85 |
| Total ReturnF,G | (5.54)% | 25.64% | (7.50)% | 9.34% | 1.31% |
| Ratios to Average Net AssetsB,H,I | | | | | |
| Expenses before reductions | 1.72% | 1.74% | 1.76% | 1.76% | 1.76% |
| Expenses net of fee waivers, if any | 1.72% | 1.74% | 1.76% | 1.76% | 1.76% |
| Expenses net of all reductions | 1.72% | 1.74% | 1.76% | 1.76% | 1.76% |
| Net investment income (loss) | 2.23% | 2.00% | 3.09% | 3.54% | 3.23% |
| Supplemental Data | | | | | |
| Net assets, end of period (000 omitted) | $89,135 | $120,072 | $150,653 | $210,156 | $227,458 |
| Portfolio turnover rateJ | 42% | 26% | 32%K | 17% | 27% |
A Calculated based on average shares outstanding during the period.
B Net investment income (loss) is affected by the timing of the declaration of dividends by any underlying mutual funds or exchange-traded funds (ETFs). Net investment income (loss) of any such underlying funds is not included in the Fund's net investment income (loss) ratio.
C The amount shown reflects reclassifications related to book to tax differences that were made in the year shown.
D Total distributions per share do not sum due to rounding.
E Amount represents less than $.005 per share.
F Total returns would have been lower if certain expenses had not been reduced during the applicable periods shown.
G Total returns do not include the effect of the contingent deferred sales charge.
H Fees and expenses of any underlying mutual funds or exchange-traded funds (ETFs) are not included in the Fund's expense ratio. The Fund indirectly bears its proportionate share of these expenses. For additional expense information related to investments in Fidelity Central Funds, please refer to the "Investments in Fidelity Central Funds" note found in the Notes to Financial Statements section of the most recent Annual or Semi-Annual report.
I Expense ratios reflect operating expenses of the class. Expenses before reductions do not reflect amounts reimbursed, waived, or reduced through arrangements with the investment adviser, brokerage services, or other offset arrangements, if applicable, and do not represent the amount paid by the class during periods when reimbursements, waivers or reductions occur.
J Amount does not include the portfolio activity of any underlying mutual funds or exchange-traded funds (ETFs).
K Portfolio turnover rate excludes securities received or delivered in-kind.
See accompanying notes which are an integral part of the financial statements.
Fidelity Real Estate Income Fund
| Years ended July 31, | 2022 | 2021 | 2020 | 2019 | 2018 |
| Selected Per–Share Data | | | | | |
| Net asset value, beginning of period | $13.52 | $11.09 | $12.50 | $12.05 | $12.38 |
| Income from Investment Operations | | | | | |
| Net investment income (loss)A,B | .43 | .37 | .48 | .54 | .51 |
| Net realized and unrealized gain (loss) | (1.03) | 2.53 | (1.25) | .66 | (.22) |
| Total from investment operations | (.60) | 2.90 | (.77) | 1.20 | .29 |
| Distributions from net investment income | (.32) | (.44)C | (.48) | (.54) | (.48) |
| Distributions from net realized gain | (.02) | (.03)C | (.16) | (.21) | (.13) |
| Total distributions | (.34) | (.47) | (.64) | (.75) | (.62)D |
| Redemption fees added to paid in capitalA | – | – | – | – | –E |
| Net asset value, end of period | $12.58 | $13.52 | $11.09 | $12.50 | $12.05 |
| Total ReturnF | (4.56)% | 26.88% | (6.58)% | 10.47% | 2.40% |
| Ratios to Average Net AssetsB,G,H | | | | | |
| Expenses before reductions | .71% | .72% | .73% | .75% | .75% |
| Expenses net of fee waivers, if any | .71% | .72% | .73% | .75% | .75% |
| Expenses net of all reductions | .71% | .72% | .73% | .75% | .75% |
| Net investment income (loss) | 3.24% | 3.02% | 4.12% | 4.55% | 4.24% |
| Supplemental Data | | | | | |
| Net assets, end of period (000 omitted) | $1,898,345 | $2,777,243 | $2,205,319 | $2,691,820 | $2,531,397 |
| Portfolio turnover rateI | 42% | 26% | 32%J | 17% | 27% |
A Calculated based on average shares outstanding during the period.
B Net investment income (loss) is affected by the timing of the declaration of dividends by any underlying mutual funds or exchange-traded funds (ETFs). Net investment income (loss) of any such underlying funds is not included in the Fund's net investment income (loss) ratio.
C The amount shown reflects reclassifications related to book to tax differences that were made in the year shown.
D Total distributions per share do not sum due to rounding.
E Amount represents less than $.005 per share.
F Total returns would have been lower if certain expenses had not been reduced during the applicable periods shown.
G Fees and expenses of any underlying mutual funds or exchange-traded funds (ETFs) are not included in the Fund's expense ratio. The Fund indirectly bears its proportionate share of these expenses. For additional expense information related to investments in Fidelity Central Funds, please refer to the "Investments in Fidelity Central Funds" note found in the Notes to Financial Statements section of the most recent Annual or Semi-Annual report.
H Expense ratios reflect operating expenses of the class. Expenses before reductions do not reflect amounts reimbursed, waived, or reduced through arrangements with the investment adviser, brokerage services, or other offset arrangements, if applicable, and do not represent the amount paid by the class during periods when reimbursements, waivers or reductions occur.
I Amount does not include the portfolio activity of any underlying mutual funds or exchange-traded funds (ETFs).
J Portfolio turnover rate excludes securities received or delivered in-kind.
See accompanying notes which are an integral part of the financial statements.
Fidelity Real Estate Income Fund Class I
| Years ended July 31, | 2022 | 2021 | 2020 | 2019 | 2018 |
| Selected Per–Share Data | | | | | |
| Net asset value, beginning of period | $13.47 | $11.04 | $12.45 | $12.01 | $12.34 |
| Income from Investment Operations | | | | | |
| Net investment income (loss)A,B | .43 | .37 | .48 | .54 | .51 |
| Net realized and unrealized gain (loss) | (1.03) | 2.53 | (1.25) | .65 | (.22) |
| Total from investment operations | (.60) | 2.90 | (.77) | 1.19 | .29 |
| Distributions from net investment income | (.32) | (.44)C | (.47) | (.54) | (.49) |
| Distributions from net realized gain | (.02) | (.03)C | (.16) | (.21) | (.13) |
| Total distributions | (.34) | (.47) | (.64)D | (.75) | (.62) |
| Redemption fees added to paid in capitalA | – | – | – | – | –E |
| Net asset value, end of period | $12.53 | $13.47 | $11.04 | $12.45 | $12.01 |
| Total ReturnF | (4.57)% | 27.03% | (6.62)% | 10.43% | 2.41% |
| Ratios to Average Net AssetsB,G,H | | | | | |
| Expenses before reductions | .71% | .71% | .74% | .75% | .75% |
| Expenses net of fee waivers, if any | .71% | .71% | .74% | .74% | .75% |
| Expenses net of all reductions | .71% | .71% | .74% | .74% | .75% |
| Net investment income (loss) | 3.24% | 3.03% | 4.11% | 4.55% | 4.25% |
| Supplemental Data | | | | | |
| Net assets, end of period (000 omitted) | $1,946,852 | $2,810,475 | $1,782,594 | $2,386,308 | $2,142,260 |
| Portfolio turnover rateI | 42% | 26% | 32%J | 17% | 27% |
A Calculated based on average shares outstanding during the period.
B Net investment income (loss) is affected by the timing of the declaration of dividends by any underlying mutual funds or exchange-traded funds (ETFs). Net investment income (loss) of any such underlying funds is not included in the Fund's net investment income (loss) ratio.
C The amount shown reflects reclassifications related to book to tax differences that were made in the year shown.
D Total distributions per share do not sum due to rounding.
E Amount represents less than $.005 per share.
F Total returns would have been lower if certain expenses had not been reduced during the applicable periods shown.
G Fees and expenses of any underlying mutual funds or exchange-traded funds (ETFs) are not included in the Fund's expense ratio. The Fund indirectly bears its proportionate share of these expenses. For additional expense information related to investments in Fidelity Central Funds, please refer to the "Investments in Fidelity Central Funds" note found in the Notes to Financial Statements section of the most recent Annual or Semi-Annual report.
H Expense ratios reflect operating expenses of the class. Expenses before reductions do not reflect amounts reimbursed, waived, or reduced through arrangements with the investment adviser, brokerage services, or other offset arrangements, if applicable, and do not represent the amount paid by the class during periods when reimbursements, waivers or reductions occur.
I Amount does not include the portfolio activity of any underlying mutual funds or exchange-traded funds (ETFs).
J Portfolio turnover rate excludes securities received or delivered in-kind.
See accompanying notes which are an integral part of the financial statements.
Fidelity Real Estate Income Fund Class Z
| Years ended July 31, | 2022 | 2021 | 2020 | 2019 A |
| Selected Per–Share Data | | | | |
| Net asset value, beginning of period | $13.47 | $11.04 | $12.45 | $11.74 |
| Income from Investment Operations | | | | |
| Net investment income (loss)B,C | .44 | .38 | .49 | .47 |
| Net realized and unrealized gain (loss) | (1.02) | 2.53 | (1.25) | .67 |
| Total from investment operations | (.58) | 2.91 | (.76) | 1.14 |
| Distributions from net investment income | (.34) | (.45)D | (.49) | (.42) |
| Distributions from net realized gain | (.02) | (.03)D | (.16) | (.02) |
| Total distributions | (.36) | (.48) | (.65) | (.43)E |
| Net asset value, end of period | $12.53 | $13.47 | $11.04 | $12.45 |
| Total ReturnF,G | (4.44)% | 27.15% | (6.50)% | 10.00% |
| Ratios to Average Net AssetsC,H,I | | | | |
| Expenses before reductions | .59% | .60% | .62% | .62%J |
| Expenses net of fee waivers, if any | .59% | .60% | .62% | .62%J |
| Expenses net of all reductions | .59% | .60% | .61% | .62%J |
| Net investment income (loss) | 3.36% | 3.14% | 4.24% | 4.71%J |
| Supplemental Data | | | | |
| Net assets, end of period (000 omitted) | $1,607,463 | $919,766 | $793,220 | $467,324 |
| Portfolio turnover rateK | 42% | 26% | 32%L | 17% |
A For the period October 2, 2018 (commencement of sale of shares) through July 31, 2019.
B Calculated based on average shares outstanding during the period.
C Net investment income (loss) is affected by the timing of the declaration of dividends by any underlying mutual funds or exchange-traded funds (ETFs). Net investment income (loss) of any such underlying funds is not included in the Fund's net investment income (loss) ratio.
D The amount shown reflects reclassifications related to book to tax differences that were made in the year shown.
E Total distributions per share do not sum due to rounding.
F Total returns for periods of less than one year are not annualized.
G Total returns would have been lower if certain expenses had not been reduced during the applicable periods shown.
H Fees and expenses of any underlying mutual funds or exchange-traded funds (ETFs) are not included in the Fund's expense ratio. The Fund indirectly bears its proportionate share of these expenses. For additional expense information related to investments in Fidelity Central Funds, please refer to the "Investments in Fidelity Central Funds" note found in the Notes to Financial Statements section of the most recent Annual or Semi-Annual report.
I Expense ratios reflect operating expenses of the class. Expenses before reductions do not reflect amounts reimbursed, waived, or reduced through arrangements with the investment adviser, brokerage services, or other offset arrangements, if applicable, and do not represent the amount paid by the class during periods when reimbursements, waivers or reductions occur.
J Annualized
K Amount does not include the portfolio activity of any underlying mutual funds or exchange-traded funds (ETFs).
L Portfolio turnover rate excludes securities received or delivered in-kind.
See accompanying notes which are an integral part of the financial statements.
Notes to Financial Statements
For the period ended July 31, 2022
1. Organization.
Fidelity Real Estate Income Fund (the Fund) is a fund of Fidelity Securities Fund (the Trust) and is authorized to issue an unlimited number of shares. The Trust is registered under the Investment Company Act of 1940, as amended (the 1940 Act), as an open-end management investment company organized as a Massachusetts business trust. The Fund offers Class A, Class M, Class C, Real Estate Income, Class I and Class Z shares, each of which has equal rights as to assets and voting privileges. Each class has exclusive voting rights with respect to matters that affect that class. Class C shares will automatically convert to Class A shares after a holding period of eight years from the initial date of purchase, with certain exceptions.
2. Investments in Fidelity Central Funds.
Funds may invest in Fidelity Central Funds, which are open-end investment companies generally available only to other investment companies and accounts managed by the investment adviser and its affiliates. The Schedule of Investments lists any Fidelity Central Funds held as an investment as of period end, but does not include the underlying holdings of each Fidelity Central Fund. An investing fund indirectly bears its proportionate share of the expenses of the underlying Fidelity Central Funds.
Based on its investment objective, each Fidelity Central Fund may invest or participate in various investment vehicles or strategies that are similar to those of the investing fund. These strategies are consistent with the investment objectives of the investing fund and may involve certain economic risks which may cause a decline in value of each of the Fidelity Central Funds and thus a decline in the value of the investing fund.
| Fidelity Central Fund | Investment Manager | Investment Objective | Investment Practices | Expense Ratio(a) |
| Fidelity Money Market Central Funds | Fidelity Management & Research Company LLC (FMR) | Each fund seeks to obtain a high level of current income consistent with the preservation of capital and liquidity. | Short-term Investments | Less than .005% |
(a) Expenses expressed as a percentage of average net assets and are as of each underlying Central Fund's most recent annual or semi-annual shareholder report.
A complete unaudited list of holdings for each Fidelity Central Fund is available upon request or at the Securities and Exchange Commission website at www.sec.gov. In addition, the financial statements of the Fidelity Central Funds which contain the significant accounting policies (including investment valuation policies) of those funds, and are not covered by the Report of Independent Registered Public Accounting Firm, are available on the Securities and Exchange Commission website or upon request.
3. Significant Accounting Policies.
The Fund is an investment company and applies the accounting and reporting guidance of the Financial Accounting Standards Board (FASB) Accounting Standards Codification Topic 946 Financial Services - Investment Companies. The financial statements have been prepared in conformity with accounting principles generally accepted in the United States of America (GAAP), which require management to make certain estimates and assumptions at the date of the financial statements. Actual results could differ from those estimates. Subsequent events, if any, through the date that the financial statements were issued have been evaluated in the preparation of the financial statements. The Fund's Schedule of Investments lists any underlying mutual funds or exchange-traded funds (ETFs) but does not include the underlying holdings of these funds. The following summarizes the significant accounting policies of the Fund:
Investment Valuation. Investments are valued as of 4:00 p.m. Eastern time on the last calendar day of the period. The Board of Trustees (the Board) has delegated the day to day responsibility for the valuation of the Fund's investments to the Fair Value Committee (the Committee) established by the Fund's investment adviser. In accordance with valuation policies and procedures approved by the Board, the Fund attempts to obtain prices from one or more third party pricing vendors or brokers to value its investments. When current market prices, quotations or currency exchange rates are not readily available or reliable, investments will be fair valued in good faith by the Committee, in accordance with procedures adopted by the Board. Factors used in determining fair value vary by investment type and may include market or investment specific events, changes in interest rates and credit quality. The frequency with which these procedures are used cannot be predicted and they may be utilized to a significant extent. The Committee oversees the Fund's valuation policies and procedures and reports to the Board on the Committee's activities and fair value determinations. The Board monitors the appropriateness of the procedures used in valuing the Fund's investments and ratifies the fair value determinations of the Committee.
The Fund categorizes the inputs to valuation techniques used to value its investments into a disclosure hierarchy consisting of three levels as shown below:
- Level 1 – unadjusted quoted prices in active markets for identical investments
- Level 2 – other significant observable inputs (including quoted prices for similar investments, interest rates, prepayment speeds, etc.)
- Level 3 – unobservable inputs (including the Fund's own assumptions based on the best information available)
Valuation techniques used to value the Fund's investments by major category are as follows:
Equity securities, including restricted securities, for which market quotations are readily available, are valued at the last reported sale price or official closing price as reported by a third party pricing vendor on the primary market or exchange on which they are traded and are categorized as Level 1 in the hierarchy. In the event there were no sales during the day or closing prices are not available, securities are valued at the last quoted bid price or may be valued using the last available price and are generally categorized as Level 2 in the hierarchy. For foreign equity securities, when market or security specific events arise, comparisons to the valuation of American Depositary Receipts (ADRs), futures contracts, ETFs and certain indexes as well as quoted prices for similar securities may be used and would be categorized as Level 2 in the hierarchy. For equity securities, including restricted securities, where observable inputs are limited, assumptions about market activity and risk are used and these securities may be categorized as Level 3 in the hierarchy. Securities, including private placements or other restricted securities, for which observable inputs are not available are valued using alternate valuation approaches, including the market approach, the income approach and cost approach, and are categorized as Level 3 in the hierarchy. The market approach considers factors including the price of recent investments in the same or a similar security or financial metrics of comparable securities. The income approach considers factors including expected future cash flows, security specific risks and corresponding discount rates. The cost approach considers factors including the value of the security's underlying assets and liabilities.
Debt securities, including restricted securities, are valued based on evaluated prices received from third party pricing vendors or from brokers who make markets in such securities. Corporate bonds, bank loan obligations and preferred securities are valued by pricing vendors who utilize matrix pricing which considers yield or price of bonds of comparable quality, coupon, maturity and type or by broker-supplied prices. Asset backed securities, collateralized mortgage obligations and commercial mortgage securities are valued by pricing vendors who utilize matrix pricing which considers prepayment speed assumptions, attributes of the collateral, yield or price of bonds of comparable quality, coupon, maturity and type or by broker-supplied prices. When independent prices are unavailable or unreliable, debt securities may be valued utilizing pricing methodologies which consider similar factors that would be used by third party pricing vendors. Debt securities are generally categorized as Level 2 in the hierarchy but may be Level 3 depending on the circumstances.
Investments in open-end mutual funds, including the Fidelity Central Funds, are valued at their closing net asset value (NAV) each business day and are categorized as Level 1 in the hierarchy.
The following provides information on Level 3 securities held by the Fund that were valued at period end based on unobservable inputs. These amounts exclude valuations provided by a broker.
| Asset Type | Fair Value | Valuation Technique(s) | Unobservable Input | Amount or Range/Weighted Average | Impact to Valuation from an Increase in Input(a) |
| Corporate Bonds | $ 4 | Recovery value | Recovery value | $0.00 | Increase |
| Asset-Backed Securities | $270 | Indicative market price | Evaluated bid | $0.00 - $0.01 / $0.01 | Increase |
| Commercial Mortgage Securities | $43,384,637 | Indicative market price | Evaluated bid | $0.00 - $92.24 / $63.77 | Increase |
| Preferred Securities | $10,122 | Indicative market price | Evaluated bid | $0.00 - $2.00 / $1.98 | Increase |
| Bank Loan Obligations | $78,982,346 | Discounted cash flow | Yield | 8.3% - 18.5% / 12.2% | Decrease |
| Collateralized Mortgage Obligations | $34,728 | Indicative market price | Evaluated bid | $75.32 | Increase |
(a) Represents the directional change in the fair value of the Level 3 investments that could have resulted from an increase in the corresponding input as of period end. A decrease to the unobservable input would have had the opposite effect. Significant changes in these inputs may have resulted in a significantly higher or lower fair value measurement at period end.
Changes in valuation techniques may result in transfers in or out of an assigned level within the disclosure hierarchy. The aggregate value of investments by input level as of July 31, 2022, as well as a roll forward of Level 3 investments, is included at the end of the Fund's Schedule of Investments.
Foreign Currency. Certain Funds may use foreign currency contracts to facilitate transactions in foreign-denominated securities. Gains and losses from these transactions may arise from changes in the value of the foreign currency or if the counterparties do not perform under the contracts' terms.
Foreign-denominated assets, including investment securities, and liabilities are translated into U.S. dollars at the exchange rates at period end. Purchases and sales of investment securities, income and dividends received, and expenses denominated in foreign currencies are translated into U.S. dollars at the exchange rate in effect on the transaction date.
The effects of exchange rate fluctuations on investments are included with the net realized and unrealized gain (loss) on investment securities. Other foreign currency transactions resulting in realized and unrealized gain (loss) are disclosed separately.
Investment Transactions and Income. For financial reporting purposes, the Fund's investment holdings and NAV include trades executed through the end of the last business day of the period. The NAV per share for processing shareholder transactions is calculated as of the close of business of the New York Stock Exchange (NYSE), normally 4:00 p.m. Eastern time and includes trades executed through the end of the prior business day. Gains and losses on securities sold are determined on the basis of identified cost and include proceeds received from litigation. Commissions paid to certain brokers with whom the investment adviser, or its affiliates, places trades on behalf of a fund include an amount in addition to trade execution, which may be rebated back to a fund. Any such rebates are included in net realized gain (loss) on investments in the Statement of Operations. Dividend income is recorded on the ex-dividend date, except for certain dividends from foreign securities where the ex-dividend date may have passed, which are recorded as soon as the Fund is informed of the ex-dividend date. Non-cash dividends included in dividend income, if any, are recorded at the fair market value of the securities received. Income and capital gain distributions from Fidelity Central Funds, if any, are recorded on the ex-dividend date. Certain distributions received by the Fund represent a return of capital or capital gain. The Fund determines the components of these distributions subsequent to the ex-dividend date, based upon receipt of tax filings or other correspondence relating to the underlying investment. These distributions are recorded as a reduction of cost of investments and/or as a realized gain. Interest income is accrued as earned and includes coupon interest and amortization of premium and accretion of discount on debt securities as applicable. For certain lower credit quality securitized assets that have contractual cash flows (for example, asset backed securities, collateralized mortgage obligations and commercial mortgage-backed securities), changes in estimated cash flows are periodically evaluated and the estimated yield is adjusted on a prospective basis, resulting in increases or decreases to Interest Income in the accompanying Statement of Operations. Investment income is recorded net of foreign taxes withheld where recovery of such taxes is uncertain. Debt obligations may be placed on non-accrual status and related interest income may be reduced by ceasing current accruals and writing off interest receivables when the collection of all or a portion of interest has become doubtful based on consistently applied procedures. A debt obligation is removed from non-accrual status when the issuer resumes interest payments or when collectability of interest is reasonably assured.
Class Allocations and Expenses. Investment income, realized and unrealized capital gains and losses, common expenses of a fund, and certain fund-level expense reductions, if any, are allocated daily on a pro-rata basis to each class based on the relative net assets of each class to the total net assets of a fund. Each class differs with respect to transfer agent and distribution and service plan fees incurred, as applicable. Certain expense reductions may also differ by class, if applicable. For the reporting period, the allocated portion of income and expenses to each class as a percent of its average net assets may vary due to the timing of recording these transactions in relation to fluctuating net assets of the classes. Expenses directly attributable to a fund are charged to that fund. Expenses attributable to more than one fund are allocated among the respective funds on the basis of relative net assets or other appropriate methods. Expenses included in the accompanying financial statements reflect the expenses of that fund and do not include any expenses associated with any underlying mutual funds or exchange-traded funds. Although not included in a fund's expenses, a fund indirectly bears its proportionate share of these expenses through the net asset value of each underlying mutual fund or exchange-traded fund. Expense estimates are accrued in the period to which they relate and adjustments are made when actual amounts are known.
Income Tax Information and Distributions to Shareholders. Each year, the Fund intends to qualify as a regulated investment company under Subchapter M of the Internal Revenue Code, including distributing substantially all of its taxable income and realized gains. As a result, no provision for U.S. Federal income taxes is required. As of July 31, 2022, the Fund did not have any unrecognized tax benefits in the financial statements; nor is the Fund aware of any tax positions for which it is reasonably possible that the total amounts of unrecognized tax benefits will significantly change in the next twelve months. The Fund files a U.S. federal tax return, in addition to state and local tax returns as required. The Fund's federal income tax returns are subject to examination by the Internal Revenue Service (IRS) for a period of three fiscal years after they are filed. State and local tax returns may be subject to examination for an additional fiscal year depending on the jurisdiction. Foreign taxes are provided for based on the Fund's understanding of the tax rules and rates that exist in the foreign markets in which it invests.
Distributions are declared and recorded on the ex-dividend date. Income and capital gain distributions are declared separately for each class. Income and capital gain distributions are determined in accordance with income tax regulations, which may differ from GAAP. In addition, the Fund claimed a portion of the payment made to redeeming shareholders as a distribution for income tax purposes
Capital accounts within the financial statements are adjusted for permanent book-tax differences. These adjustments have no impact on net assets or the results of operations. Capital accounts are not adjusted for temporary book-tax differences which will reverse in a subsequent period.
Book-tax differences are primarily due to foreign currency transactions, passive foreign investment companies (PFIC), market discount, partnerships, certain conversion ratio adjustments, equity-debt classifications and losses deferred due to wash sales and excise tax regulations.
As of period end, the cost and unrealized appreciation (depreciation) in securities, and derivatives if applicable, for federal income tax purposes were as follows:
| Gross unrealized appreciation | $550,431,201 |
| Gross unrealized depreciation | (388,773,015) |
| Net unrealized appreciation (depreciation) | $161,658,186 |
| Tax Cost | $5,766,632,014 |
The tax-based components of distributable earnings as of period end were as follows:
| Undistributed ordinary income | $42,227,246 |
| Undistributed long-term capital gain | $98,273,274 |
| Net unrealized appreciation (depreciation) on securities and other investments | $161,658,186 |
The tax character of distributions paid was as follows:
| | July 31, 2022 | July 31, 2021 |
| Ordinary Income | $171,594,973 | $ 201,926,110 |
| Long-term Capital Gains | 10,706,799 | 12,907,012 |
| Total | $182,301,772 | $ 214,833,122 |
Restricted Securities (including Private Placements). Funds may invest in securities that are subject to legal or contractual restrictions on resale. These securities generally may be resold in transactions exempt from registration or to the public if the securities are registered. Disposal of these securities may involve time-consuming negotiations and expense, and prompt sale at an acceptable price may be difficult. Information regarding restricted securities held at period end is included at the end of the Schedule of Investments, if applicable.
Loans and Other Direct Debt Instruments. Direct debt instruments are interests in amounts owed to lenders by corporate or other borrowers. These instruments may be in the form of loans, trade claims or other receivables and may include standby financing commitments such as revolving credit facilities that obligate a fund to supply additional cash to the borrower on demand. Loans may be acquired through assignment, participation, or may be made directly to a borrower. Such instruments are presented in the Bank Loan Obligations section in the Schedule of Investments. Certain funds may also invest in unfunded loan commitments, which are contractual obligations for future funding. Information regarding unfunded commitments is included at the end of the Schedule of Investments, if applicable.
New Accounting Pronouncement. In March 2020, the Financial Accounting Standards Board (FASB) issued an Accounting Standards Update (ASU), ASU 2020-04, which provides optional, temporary relief with respect to the financial reporting of contracts subject to certain types of modifications due to the planned discontinuation of the London Interbank Offered Rate (LIBOR) and other IBOR-based reference rates. The temporary relief provided by ASU 2020-04 is effective for certain reference rate-related contract modifications that occur during the period March 12, 2020 through December 31, 2022. Management does not expect the adoption of ASU 2020-04 to have a material impact on the Fund's financial statements.
4. Purchases and Sales of Investments.
Purchases and sales of securities, other than short-term securities, U.S. government securities and in-kind transactions, as applicable, are noted in the table below.
| | Purchases ($) | Sales ($) |
| Fidelity Real Estate Income Fund | 2,717,712,451 | 3,177,922,954 |
5. Fees and Other Transactions with Affiliates.
Management Fee. Fidelity Management & Research Company LLC (the investment adviser) and its affiliates provide the Fund with investment management related services for which the Fund pays a monthly management fee. The management fee is the sum of an individual fund fee rate that is based on an annual rate of .30% of the Fund's average net assets and an annualized group fee rate that averaged .22% during the period. The group fee rate is based upon the monthly average net assets of a group of registered investment companies with which the investment adviser has management contracts. The group fee rate decreases as assets under management increase and increases as assets under management decrease. For the reporting period, the total annual management fee rate was .52% of the Fund's average net assets.
Distribution and Service Plan Fees. In accordance with Rule 12b-1 of the 1940 Act, the Fund has adopted separate Distribution and Service Plans for each class of shares. Certain classes pay Fidelity Distributors Company LLC (FDC), an affiliate of the investment adviser, separate Distribution and Service Fees, each of which is based on an annual percentage of each class' average net assets. In addition, FDC may pay financial intermediaries for selling shares of the Fund and providing shareholder support services. For the period, the Distribution and Service Fee rates, total fees and amounts retained by FDC were as follows:
| | Distribution Fee | Service Fee | Total Fees | Retained by FDC |
| Class A | -% | .25% | $954,810 | $36,029 |
| Class M | -% | .25% | 139,274 | 163 |
| Class C | .75% | .25% | 1,078,416 | 115,448 |
| | | | $2,172,500 | $151,640 |
Sales Load. FDC may receive a front-end sales charge of up to 4.00% for selling Class A shares and Class M shares, some of which is paid to financial intermediaries for selling shares of the Fund. Depending on the holding period, FDC may receive contingent deferred sales charges levied on Class A, Class M and Class C redemptions. The deferred sales charges are 1.00% for Class C shares, 1.00% for certain purchases of Class A shares and .25% for certain purchases of Class M shares.
For the period, sales charge amounts retained by FDC were as follows:
| | Retained by FDC |
| Class A | $22,047 |
| Class M | 3,822 |
| Class C(a) | 5,278 |
| | $31,147 |
(a) When Class C shares are initially sold, FDC pays commissions from its own resources to financial intermediaries through which the sales are made.
Transfer Agent Fees. Fidelity Investments Institutional Operations Company LLC (FIIOC), an affiliate of the investment adviser, is the transfer, dividend disbursing and shareholder servicing agent for each class of the Fund. FIIOC receives account fees and asset-based fees that vary according to the account size and type of account of the shareholders of the respective classes of the Fund, except for Class Z. FIIOC receives an asset-based fee of Class Z's average net assets. FIIOC pays for typesetting, printing and mailing of shareholder reports, except proxy statements.
For the period, transfer agent fees for each class were as follows:
| | Amount | % of Class-Level Average Net Assets |
| Class A | $694,729 | .18 |
| Class M | 105,234 | .19 |
| Class C | 188,825 | .17 |
| Real Estate Income | 4,217,857 | .16 |
| Class I | 3,496,862 | .16 |
| Class Z | 682,113 | .04 |
| | $9,385,620 | |
Accounting Fees. Fidelity Service Company, Inc. (FSC), an affiliate of the investment adviser, maintains the Fund's accounting records. The accounting fee is based on the level of average net assets for each month. For the period, the fees were equivalent to the following annual rates:
| | % of Average Net Assets |
| Fidelity Real Estate Income Fund | .02 |
Brokerage Commissions. A portion of portfolio transactions were placed with brokerage firms which are affiliates of the investment adviser. Brokerage commissions are included in net realized gain (loss) and change in net unrealized appreciation (depreciation) in the Statement of Operations. The commissions paid to these affiliated firms were as follows:
| | Amount |
| Fidelity Real Estate Income Fund | $21,837 |
Interfund Trades. Funds may purchase from or sell securities to other Fidelity Funds under procedures adopted by the Board. The procedures have been designed to ensure these interfund trades are executed in accordance with Rule 17a-7 of the 1940 Act. Any interfund trades are included within the respective purchases and sales amounts shown in the Purchases and Sales of Investments note. Interfund trades during the period are noted in the table below.
| | Purchases ($) | Sales ($) | Realized Gain (Loss) ($) |
| Fidelity Real Estate Income Fund | 29,880,886 | 43,258,897 | 3,391,958 |
6. Committed Line of Credit.
Certain Funds participate with other funds managed by the investment adviser or an affiliate in a $4.25 billion credit facility (the "line of credit") to be utilized for temporary or emergency purposes to fund shareholder redemptions or for other short-term liquidity purposes. The participating funds have agreed to pay commitment fees on their pro-rata portion of the line of credit, which are reflected in Miscellaneous expenses on the Statement of Operations, and are listed below. During the period, there were no borrowings on this line of credit.
| | Amount |
| Fidelity Real Estate Income Fund | $8,991 |
7. Security Lending.
Funds lend portfolio securities from time to time in order to earn additional income. Lending agents are used, including National Financial Services (NFS), an affiliate of the investment adviser. Pursuant to a securities lending agreement, NFS will receive a fee, which is capped at 9.9% of a fund's daily lending revenue, for its services as lending agent. A fund may lend securities to certain qualified borrowers, including NFS. On the settlement date of the loan, a fund receives collateral (in the form of U.S. Treasury obligations, letters of credit and/or cash) against the loaned securities and maintains collateral in an amount not less than 100% of the market value of the loaned securities during the period of the loan. The market value of the loaned securities is determined at the close of business of a fund and any additional required collateral is delivered to a fund on the next business day. A fund or borrower may terminate the loan at any time, and if the borrower defaults on its obligation to return the securities loaned because of insolvency or other reasons, a fund may apply collateral received from the borrower against the obligation. A fund may experience delays and costs in recovering the securities loaned. Any cash collateral received is invested in the Fidelity Securities Lending Cash Central Fund. Any loaned securities are identified as such in the Schedule of Investments, and the value of loaned securities and cash collateral at period end, as applicable, are presented in the Statement of Assets and Liabilities. Security lending income represents the income earned on investing cash collateral, less rebates paid to borrowers and any lending agent fees associated with the loan, plus any premium payments received for lending certain types of securities. Security lending income is presented in the Statement of Operations as a component of income from Fidelity Central Funds. Affiliated security lending activity, if any, was as follows:
| | Total Security Lending Fees Paid to NFS | Security Lending Income From Securities Loaned to NFS | Value of Securities Loaned to NFS at Period End |
| Fidelity Real Estate Income Fund | $16,034 | $7,964 | $– |
8. Expense Reductions.
Through arrangements with the Fund's custodian, credits realized as a result of certain uninvested cash balances were used to reduce the Fund's expenses. During the period, custodian credits reduced the Fund's expenses by $2,259.
In addition, during the period the investment adviser or an affiliate reimbursed and/or waived a portion of fund-level operating expenses in the amount of $222,400.
9. Distributions to Shareholders.
Distributions to shareholders of each class were as follows:
| | Year ended
July 31, 2022 | Year ended
July 31, 2021 |
| Fidelity Real Estate Income Fund | | |
| Distributions to shareholders | | |
| Class A | $8,818,580 | $12,331,880 |
| Class M | 1,275,531 | 1,887,965 |
| Class C | 1,818,918 | 4,798,344 |
| Real Estate Income | 67,601,059 | 81,764,089 |
| Class I | 55,434,062 | 86,521,059 |
| Class Z | 47,353,622 | 27,529,785 |
| Total | $182,301,772 | $214,833,122 |
10. Share Transactions.
Share transactions for each class were as follows and may contain in-kind transactions, automatic conversions between classes or exchanges between affiliated funds:
| | Shares | Shares | Dollars | Dollars |
| | Year ended July 31, 2022 | Year ended July 31, 2021 | Year ended July 31, 2022 | Year ended July 31, 2021 |
| Fidelity Real Estate Income Fund | | | | |
| Class A | | | | |
| Shares sold | 5,531,610 | 8,136,569 | $72,570,914 | $101,075,219 |
| Reinvestment of distributions | 513,437 | 801,826 | 6,723,485 | 9,213,403 |
| Shares redeemed | (5,497,840) | (9,710,895) | (71,617,823) | (115,179,123) |
| Net increase (decrease) | 547,207 | (772,500) | $7,676,576 | $(4,890,501) |
| Class M | | | | |
| Shares sold | 573,436 | 487,991 | $7,485,522 | $6,084,348 |
| Reinvestment of distributions | 95,811 | 162,222 | 1,255,521 | 1,864,757 |
| Shares redeemed | (703,618) | (860,551) | (9,213,383) | (10,214,340) |
| Net increase (decrease) | (34,371) | (210,338) | $(472,340) | $(2,265,235) |
| Class C | | | | |
| Shares sold | 795,990 | 989,182 | $10,421,747 | $12,002,432 |
| Reinvestment of distributions | 137,493 | 411,102 | 1,780,331 | 4,669,922 |
| Shares redeemed | (2,761,921) | (6,160,079) | (35,374,652) | (73,385,638) |
| Net increase (decrease) | (1,828,438) | (4,759,795) | $(23,172,574) | $(56,713,284) |
| Real Estate Income | | | | |
| Shares sold | 45,578,678 | 74,411,219 | $609,828,801 | $925,077,942 |
| Reinvestment of distributions | 4,627,906 | 6,329,008 | 61,214,036 | 73,049,209 |
| Shares redeemed | (104,743,578) | (74,275,882) | (1,345,838,761) | (890,231,669) |
| Net increase (decrease) | (54,536,994) | 6,464,345 | $(674,795,924) | $107,895,482 |
| Class I | | | | |
| Shares sold | 51,885,027 | 103,155,973 | $688,287,283 | $1,245,278,753 |
| Reinvestment of distributions | 3,827,145 | 6,802,374 | 50,268,241 | 78,374,070 |
| Shares redeemed | (109,053,815) | (62,658,053) | (1,441,761,631) | (740,583,076) |
| Net increase (decrease) | (53,341,643) | 47,300,294 | $(703,206,107) | $583,069,747 |
| Class Z | | | | |
| Shares sold | 110,101,188 | 33,570,549 | $1,472,830,240 | $409,694,150 |
| Reinvestment of distributions | 3,202,845 | 1,849,171 | 42,119,423 | 21,304,595 |
| Shares redeemed | (53,304,114) | (38,953,817) | (703,496,787) | (452,279,979) |
| Net increase (decrease) | 59,999,919 | (3,534,097) | $811,452,876 | $(21,281,234) |
11. Other.
A fund's organizational documents provide former and current trustees and officers with a limited indemnification against liabilities arising in connection with the performance of their duties to the fund. In the normal course of business, a fund may also enter into contracts that provide general indemnifications. A fund's maximum exposure under these arrangements is unknown as this would be dependent on future claims that may be made against a fund. The risk of material loss from such claims is considered remote.
At the end of the period, the following mutual funds managed by the investment adviser or its affiliates were the owners of record of 10% or more of the total outstanding shares.
| | Strategic Advisers Fidelity Core Income Fund |
| Fidelity Real Estate Income Fund | 15% |
12. Coronavirus (COVID-19) Pandemic.
An outbreak of COVID-19 first detected in China during December 2019 has since spread globally and was declared a pandemic by the World Health Organization during March 2020. Developments that disrupt global economies and financial markets, such as the COVID-19 pandemic, may magnify factors that affect the Fund's performance.
Report of Independent Registered Public Accounting Firm
To the Board of Trustees of Fidelity Securities Fund and the Shareholders of Fidelity Real Estate Income Fund
Opinion on the Financial Statements and Financial Highlights
We have audited the accompanying statement of assets and liabilities of Fidelity Real Estate Income Fund (the "Fund"), a fund of Fidelity Securities Fund, including the schedule of investments, as of July 31, 2022, the related statement of operations for the year then ended, the statement of changes in net assets for each of the two years in the period then ended, the financial highlights for each of the five years in the period then ended, and the related notes. In our opinion, the financial statements and financial highlights present fairly, in all material respects, the financial position of the Fund as of July 31, 2022, and the results of its operations for the year then ended, the changes in its net assets for each of the two years in the period then ended, and the financial highlights for each of the five years in the period then ended in conformity with accounting principles generally accepted in the United States of America.
Basis for Opinion
These financial statements and financial highlights are the responsibility of the Fund's management. Our responsibility is to express an opinion on the Fund's financial statements and financial highlights based on our audits. We are a public accounting firm registered with the Public Company Accounting Oversight Board (United States) (PCAOB) and are required to be independent with respect to the Fund in accordance with the U.S. federal securities laws and the applicable rules and regulations of the Securities and Exchange Commission and the PCAOB.
We conducted our audits in accordance with the standards of the PCAOB. Those standards require that we plan and perform the audit to obtain reasonable assurance about whether the financial statements and financial highlights are free of material misstatement, whether due to error or fraud. The Fund is not required to have, nor were we engaged to perform, an audit of its internal control over financial reporting. As part of our audits we are required to obtain an understanding of internal control over financial reporting but not for the purpose of expressing an opinion on the effectiveness of the Fund’s internal control over financial reporting. Accordingly, we express no such opinion.
Our audits included performing procedures to assess the risks of material misstatement of the financial statements and financial highlights, whether due to error or fraud, and performing procedures that respond to those risks. Such procedures included examining, on a test basis, evidence regarding the amounts and disclosures in the financial statements and financial highlights. Our audits also included evaluating the accounting principles used and significant estimates made by management, as well as evaluating the overall presentation of the financial statements and financial highlights. Our procedures included confirmation of securities owned as of July 31, 2022, by correspondence with the custodian, brokers and agent banks; when replies were not received from brokers or agent banks, we performed other auditing procedures. We believe that our audits provide a reasonable basis for our opinion.
/s/ Deloitte & Touche LLP
Boston, Massachusetts
September 14, 2022
We have served as the auditor of one or more of the Fidelity investment companies since 1999.
Trustees and Officers
The Trustees, Members of the Advisory Board (if any), and officers of the trust and fund, as applicable, are listed below. The Board of Trustees governs the fund and is responsible for protecting the interests of shareholders. The Trustees are experienced executives who meet periodically throughout the year to oversee the fund's activities, review contractual arrangements with companies that provide services to the fund, oversee management of the risks associated with such activities and contractual arrangements, and review the fund's performance. Except for Jonathan Chiel, each of the Trustees oversees 316 funds. Mr. Chiel oversees 184 funds.
The Trustees hold office without limit in time except that (a) any Trustee may resign; (b) any Trustee may be removed by written instrument, signed by at least two-thirds of the number of Trustees prior to such removal; (c) any Trustee who requests to be retired or who has become incapacitated by illness or injury may be retired by written instrument signed by a majority of the other Trustees; and (d) any Trustee may be removed at any special meeting of shareholders by a two-thirds vote of the outstanding voting securities of the trust. Each Trustee who is not an interested person (as defined in the 1940 Act) of the trust and the fund is referred to herein as an Independent Trustee. Each Independent Trustee shall retire not later than the last day of the calendar year in which his or her 75th birthday occurs. The Independent Trustees may waive this mandatory retirement age policy with respect to individual Trustees. Officers and Advisory Board Members hold office without limit in time, except that any officer or Advisory Board Member may resign or may be removed by a vote of a majority of the Trustees at any regular meeting or any special meeting of the Trustees. Except as indicated, each individual has held the office shown or other offices in the same company for the past five years.
The fund's Statement of Additional Information (SAI) includes more information about the Trustees. To request a free copy, call Fidelity at 1-800-544-8544 if you’re an individual investing directly with Fidelity, call 1-800-835-5092 if you’re a plan sponsor or participant with Fidelity as your recordkeeper or call 1-877-208-0098 on institutional accounts or if you’re an advisor or invest through one.
Experience, Skills, Attributes, and Qualifications of the Trustees. The Governance and Nominating Committee has adopted a statement of policy that describes the experience, qualifications, attributes, and skills that are necessary and desirable for potential Independent Trustee candidates (Statement of Policy). The Board believes that each Trustee satisfied at the time he or she was initially elected or appointed a Trustee, and continues to satisfy, the standards contemplated by the Statement of Policy. The Governance and Nominating Committee also engages professional search firms to help identify potential Independent Trustee candidates who have the experience, qualifications, attributes, and skills consistent with the Statement of Policy. From time to time, additional criteria based on the composition and skills of the current Independent Trustees, as well as experience or skills that may be appropriate in light of future changes to board composition, business conditions, and regulatory or other developments, have also been considered by the professional search firms and the Governance and Nominating Committee. In addition, the Board takes into account the Trustees' commitment and participation in Board and committee meetings, as well as their leadership of standing and ad hoc committees throughout their tenure.
In determining that a particular Trustee was and continues to be qualified to serve as a Trustee, the Board has considered a variety of criteria, none of which, in isolation, was controlling. The Board believes that, collectively, the Trustees have balanced and diverse experience, qualifications, attributes, and skills, which allow the Board to operate effectively in governing the fund and protecting the interests of shareholders. Information about the specific experience, skills, attributes, and qualifications of each Trustee, which in each case led to the Board's conclusion that the Trustee should serve (or continue to serve) as a trustee of the fund, is provided below.
Board Structure and Oversight Function. Robert A. Lawrence is an interested person and currently serves as Chair. The Trustees have determined that an interested Chair is appropriate and benefits shareholders because an interested Chair has a personal and professional stake in the quality and continuity of services provided to the fund. Independent Trustees exercise their informed business judgment to appoint an individual of their choosing to serve as Chair, regardless of whether the Trustee happens to be independent or a member of management. The Independent Trustees have determined that they can act independently and effectively without having an Independent Trustee serve as Chair and that a key structural component for assuring that they are in a position to do so is for the Independent Trustees to constitute a substantial majority for the Board. The Independent Trustees also regularly meet in executive session. David M. Thomas serves as Lead Independent Trustee and as such (i) acts as a liaison between the Independent Trustees and management with respect to matters important to the Independent Trustees and (ii) with management prepares agendas for Board meetings.
Fidelity® funds are overseen by different Boards of Trustees. The fund's Board oversees Fidelity's high income and certain equity funds, and other Boards oversee Fidelity's investment-grade bond, money market, asset allocation, and other equity funds. The asset allocation funds may invest in Fidelity® funds overseen by the fund's Board. The use of separate Boards, each with its own committee structure, allows the Trustees of each group of Fidelity® funds to focus on the unique issues of the funds they oversee, including common research, investment, and operational issues. On occasion, the separate Boards establish joint committees to address issues of overlapping consequences for the Fidelity® funds overseen by each Board.
The Trustees operate using a system of committees to facilitate the timely and efficient consideration of all matters of importance to the Trustees, the fund, and fund shareholders and to facilitate compliance with legal and regulatory requirements and oversight of the fund's activities and associated risks. The Board, acting through its committees, has charged FMR and its affiliates with (i) identifying events or circumstances the occurrence of which could have demonstrably adverse effects on the fund's business and/or reputation; (ii) implementing processes and controls to lessen the possibility that such events or circumstances occur or to mitigate the effects of such events or circumstances if they do occur; and (iii) creating and maintaining a system designed to evaluate continuously business and market conditions in order to facilitate the identification and implementation processes described in (i) and (ii) above. Because the day-to-day operations and activities of the fund are carried out by or through FMR, its affiliates, and other service providers, the fund's exposure to risks is mitigated but not eliminated by the processes overseen by the Trustees. While each of the Board's committees has responsibility for overseeing different aspects of the fund's activities, oversight is exercised primarily through the Operations, Audit, and Compliance Committees. Appropriate personnel, including but not limited to the fund's Chief Compliance Officer (CCO), FMR's internal auditor, the independent accountants, the fund's Treasurer and portfolio management personnel, make periodic reports to the Board's committees, as appropriate, including an annual review of Fidelity's risk management program for the Fidelity® funds. The responsibilities of each standing committee, including their oversight responsibilities, are described further under "Standing Committees of the Trustees."
Interested Trustees*:
Correspondence intended for a Trustee who is an interested person may be sent to Fidelity Investments, 245 Summer Street, Boston, Massachusetts 02210.
Name, Year of Birth; Principal Occupations and Other Relevant Experience+
Jonathan Chiel (1957)
Year of Election or Appointment: 2016
Trustee
Mr. Chiel also serves as Trustee of other Fidelity® funds. Mr. Chiel is Executive Vice President and General Counsel for FMR LLC (diversified financial services company, 2012-present). Previously, Mr. Chiel served as general counsel (2004-2012) and senior vice president and deputy general counsel (2000-2004) for John Hancock Financial Services; a partner with Choate, Hall & Stewart (1996-2000) (law firm); and an Assistant United States Attorney for the United States Attorney’s Office of the District of Massachusetts (1986-95), including Chief of the Criminal Division (1993-1995). Mr. Chiel is a director on the boards of the Boston Bar Foundation and the Maimonides School.
Bettina Doulton (1964)
Year of Election or Appointment: 2021
Trustee
Ms. Doulton also serves as Trustee of other Fidelity® funds. Prior to her retirement, Ms. Doulton served in a variety of positions at Fidelity Investments, including as a managing director of research (2006-2007), portfolio manager to certain Fidelity® funds (1993-2005), equity analyst and portfolio assistant (1990-1993), and research assistant (1987-1990). Ms. Doulton currently owns and operates Phi Builders + Architects and Cellardoor Winery. Previously, Ms. Doulton served as a member of the Board of Brown Capital Management, LLC (2014-2018).
Robert A. Lawrence (1952)
Year of Election or Appointment: 2020
Trustee
Chair of the Board of Trustees
Mr. Lawrence also serves as Trustee of other funds. Previously, Mr. Lawrence served as a Trustee and Member of the Advisory Board of certain funds. Prior to his retirement in 2008, Mr. Lawrence served as Vice President of certain Fidelity® funds (2006-2008), Senior Vice President, Head of High Income Division of Fidelity Management & Research Company (investment adviser firm, 2006-2008), and President of Fidelity Strategic Investments (investment adviser firm, 2002-2005).
* Determined to be an “Interested Trustee” by virtue of, among other things, his or her affiliation with the trust or various entities under common control with FMR.
+ The information includes the Trustee's principal occupation during the last five years and other information relating to the experience, attributes, and skills relevant to the Trustee's qualifications to serve as a Trustee, which led to the conclusion that the Trustee should serve as a Trustee for the fund.
Independent Trustees:
Correspondence intended for an Independent Trustee may be sent to Fidelity Investments, P.O. Box 55235, Boston, Massachusetts 02205-5235.
Name, Year of Birth; Principal Occupations and Other Relevant Experience+
Thomas P. Bostick (1956)
Year of Election or Appointment: 2021
Trustee
Lieutenant General Bostick also serves as Trustee of other Fidelity® funds. Prior to his retirement, General Bostick (United States Army, Retired) held a variety of positions within the U.S. Army, including Commanding General and Chief of Engineers, U.S. Army Corps of Engineers (2012-2016) and Deputy Chief of Staff and Director of Human Resources, U.S. Army (2009-2012). General Bostick currently serves as a member of the Board and Finance and Governance Committees of CSX Corporation (transportation, 2020-present) and a member of the Board and Corporate Governance and Nominating Committee of Perma-Fix Environmental Services, Inc. (nuclear waste management, 2020-present). General Bostick serves as Chief Executive Officer of Bostick Global Strategies, LLC (consulting, 2016-present) and as a member of the Board of HireVue, Inc. (video interview and assessment, 2020-present). Previously, General Bostick served as a Member of the Advisory Board of certain Fidelity® funds (2021), President, Intrexon Bioengineering (2018-2020) and Chief Operating Officer (2017-2020) and Senior Vice President of the Environment Sector (2016-2017) of Intrexon Corporation (biopharmaceutical company).
Dennis J. Dirks (1948)
Year of Election or Appointment: 2005
Trustee
Mr. Dirks also serves as Trustee of other Fidelity® funds. Prior to his retirement in May 2003, Mr. Dirks served as Chief Operating Officer and as a member of the Board of The Depository Trust & Clearing Corporation (financial markets infrastructure), President, Chief Operating Officer and a member of the Board of The Depository Trust Company (DTC), President and a member of the Board of the National Securities Clearing Corporation (NSCC), Chief Executive Officer and a member of the Board of the Government Securities Clearing Corporation and Chief Executive Officer and a member of the Board of the Mortgage-Backed Securities Clearing Corporation. Mr. Dirks currently serves as a member of the Finance Committee (2016-present) and Board (2017-present) and is Treasurer (2018-present) of the Asolo Repertory Theatre.
Donald F. Donahue (1950)
Year of Election or Appointment: 2018
Trustee
Mr. Donahue also serves as Trustee of other Fidelity® funds. Mr. Donahue serves as President and Chief Executive Officer of Miranda Partners, LLC (risk consulting for the financial services industry, 2012-present). Previously, Mr. Donahue served as Chief Executive Officer (2006-2012), Chief Operating Officer (2003-2006) and Managing Director, Customer Marketing and Development (1999-2003) of The Depository Trust & Clearing Corporation (financial markets infrastructure). Mr. Donahue currently serves as a member (2007-present) and Co-Chairman (2016-present) of the Board of United Way of New York and a member of the Board of The Leadership Academy (previously NYC Leadership Academy) (2012-present). Mr. Donahue previously served as a member of the Advisory Board of certain Fidelity® funds (2015-2018).
Vicki L. Fuller (1957)
Year of Election or Appointment: 2020
Trustee
Ms. Fuller also serves as Trustee of other Fidelity® funds. Previously, Ms. Fuller served as a member of the Advisory Board of certain Fidelity® funds (2018-2020), Chief Investment Officer of the New York State Common Retirement Fund (2012-2018) and held a variety of positions at AllianceBernstein L.P. (global asset management, 1985-2012), including Managing Director (2006-2012) and Senior Vice President and Senior Portfolio Manager (2001-2006). Ms. Fuller currently serves as a member of the Board, Audit Committee and Nominating and Governance Committee of two Blackstone business development companies (2020-present), as a member of the Board of Treliant, LLC (consulting, 2019-present), as a member of the Advisory Board of Ariel Alternatives, LLC (private equity, 2021-present) and as a member of the Board and Chair of the Audit Committee of Gusto, Inc. (software, 2021-present). In addition, Ms. Fuller currently serves as a member of the Board of Roosevelt University (2019-present) and as a member of the Executive Board of New York University’s Stern School of Business. Ms. Fuller previously served as a member of the Board, Audit Committee and Nominating and Governance Committee of The Williams Companies, Inc. (natural gas infrastructure, 2018-2021).
Patricia L. Kampling (1959)
Year of Election or Appointment: 2020
Trustee
Ms. Kampling also serves as Trustee of other Fidelity® funds. Prior to her retirement, Ms. Kampling served as Chairman of the Board and Chief Executive Officer (2012-2019), President and Chief Operating Officer (2011-2012) and Executive Vice President and Chief Financial Officer (2010-2011) of Alliant Energy Corporation. Ms. Kampling currently serves as a member of the Board, Finance Committee and Governance, Compensation and Nominating Committee of Xcel Energy Inc. (utilities company, 2020-present) and as a member of the Board, Audit, Finance and Risk Committee and Safety, Environmental, Technology and Operations Committee and Chair of the Executive Development and Compensation Committee of American Water Works Company, Inc. (utilities company, 2019-present). In addition, Ms. Kampling currently serves as a member of the Board of the Nature Conservancy, Wisconsin Chapter (2019-present). Previously, Ms. Kampling served as a Member of the Advisory Board of certain Fidelity® funds (2020), a member of the Board, Compensation Committee and Executive Committee and Chair of the Audit Committee of Briggs & Stratton Corporation (manufacturing, 2011-2021), a member of the Board of Interstate Power and Light Company (2012-2019) and Wisconsin Power and Light Company (2012-2019) (each a subsidiary of Alliant Energy Corporation) and as a member of the Board and Workforce Development Committee of the Business Roundtable (2018-2019).
Thomas A. Kennedy (1955)
Year of Election or Appointment: 2021
Trustee
Mr. Kennedy also serves as Trustee of other Fidelity® funds. Previously, Mr. Kennedy served as a Member of the Advisory Board of certain Fidelity® funds (2020) and held a variety of positions at Raytheon Company (aerospace and defense, 1983-2020), including Chairman and Chief Executive Officer (2014-2020) and Executive Vice President and Chief Operating Officer (2013-2014). Mr. Kennedy currently serves as Executive Chairman of the Board of Directors of Raytheon Technologies Corporation (aerospace and defense, 2020-present). He is also a member of the Rutgers School of Engineering Industry Advisory Board (2011-present) and a member of the UCLA Engineering Dean’s Executive Board (2016-present).
Oscar Munoz (1959)
Year of Election or Appointment: 2021
Trustee
Mr. Munoz also serves as Trustee of other Fidelity® funds. Prior to his retirement, Mr. Munoz served as Executive Chairman (2020-2021), Chief Executive Officer (2015-2020), President (2015-2016) and a member of the Board (2010-2021) of United Airlines Holdings, Inc. Mr. Munoz currently serves as a member of the Board of CBRE Group, Inc. (commercial real estate, 2020-present), a member of the Board of Univision Communications, Inc. (Hispanic media, 2020-present) and a member of the Advisory Board of Salesforce.com, Inc. (cloud-based software, 2020-present). Previously, Mr. Munoz served as a Member of the Advisory Board of certain Fidelity® funds (2021).
Garnett A. Smith (1947)
Year of Election or Appointment: 2018
Trustee
Mr. Smith also serves as Trustee of other Fidelity® funds. Prior to his retirement, Mr. Smith served as Chairman and Chief Executive Officer (1990-1997) and President (1986-1990) of Inbrand Corp. (manufacturer of personal absorbent products). Prior to his employment with Inbrand Corp., he was employed by a retail fabric chain and North Carolina National Bank (now Bank of America). Mr. Smith previously served as a member of the Advisory Board of certain Fidelity® funds (2012-2013).
David M. Thomas (1949)
Year of Election or Appointment: 2008
Trustee
Lead Independent Trustee
Mr. Thomas also serves as Trustee of other Fidelity® funds. Previously, Mr. Thomas served as Executive Chairman (2005-2006) and Chairman and Chief Executive Officer (2000-2005) of IMS Health, Inc. (pharmaceutical and healthcare information solutions). Mr. Thomas currently serves as a member of the Board of Fortune Brands Home and Security (home and security products, 2004-present) and as Director (2013-present) and Non-Executive Chairman of the Board (2022-present) of Interpublic Group of Companies, Inc. (marketing communication).
Susan Tomasky (1953)
Year of Election or Appointment: 2020
Trustee
Ms. Tomasky also serves as Trustee of other Fidelity® funds. Prior to her retirement, Ms. Tomasky served in various executive officer positions at American Electric Power Company, Inc. (1998-2011), including most recently as President of AEP Transmission (2007-2011). Ms. Tomasky currently serves as a member of the Board and Sustainability Committee and as Chair of the Audit Committee of Marathon Petroleum Corporation (2018-present) and as a member of the Board, Executive Committee, Corporate Governance Committee and Organization and Compensation Committee and as Chair of the Audit Committee of Public Service Enterprise Group, Inc. (utilities company, 2012-present) and as a member of the Board of its subsidiary company, Public Service Electric and Gas Co. (2021-present). In addition, Ms. Tomasky currently serves as a member (2009-present) and President (2020-present) of the Board of the Royal Shakespeare Company – America (2009-present), as a member of the Board of the Columbus Association for the Performing Arts (2011-present) and as a member of the Board and Kenyon in the World Committee of Kenyon College (2016-present). Previously, Ms. Tomasky served as a Member of the Advisory Board of certain Fidelity® funds (2020), as a member of the Board of the Columbus Regional Airport Authority (2007-2020), as a member of the Board (2011-2018) and Lead Independent Director (2015-2018) of Andeavor Corporation (previously Tesoro Corporation) (independent oil refiner and marketer) and as a member of the Board of Summit Midstream Partners LP (energy, 2012-2018).
Michael E. Wiley (1950)
Year of Election or Appointment: 2020
Trustee
Mr. Wiley also serves as Trustee of other Fidelity® funds. Previously, Mr. Wiley served as a member of the Advisory Board of certain Fidelity® funds (2018-2020), Chairman, President and CEO of Baker Hughes, Inc. (oilfield services, 2000-2004). Mr. Wiley also previously served as a member of the Board of Andeavor Corporation (independent oil refiner and marketer, 2005-2018), a member of the Board of Andeavor Logistics LP (natural resources logistics, 2015-2018) and a member of the Board of High Point Resources (exploration and production, 2005-2020).
+ The information includes the Trustee's principal occupation during the last five years and other information relating to the experience, attributes, and skills relevant to the Trustee's qualifications to serve as a Trustee, which led to the conclusion that the Trustee should serve as a Trustee for the fund.
Advisory Board Members and Officers:
Correspondence intended for a Member of the Advisory Board (if any) may be sent to Fidelity Investments, P.O. Box 55235, Boston, Massachusetts 02205-5235. Correspondence intended for an officer or Peter S. Lynch may be sent to Fidelity Investments, 245 Summer Street, Boston, Massachusetts 02210. Officers appear below in alphabetical order.
Name, Year of Birth; Principal Occupation
Peter S. Lynch (1944)
Year of Election or Appointment: 2003
Member of the Advisory Board
Mr. Lynch also serves as a Member of the Advisory Board of other Fidelity® funds. Mr. Lynch is Vice Chairman and a Director of Fidelity Management & Research Company LLC (investment adviser firm). In addition, Mr. Lynch serves as a Trustee of Boston College and as the Chairman of the Inner-City Scholarship Fund. Previously, Mr. Lynch served as Vice Chairman and a Director of FMR Co., Inc. (investment adviser firm) and on the Special Olympics International Board of Directors (1997-2006).
Craig S. Brown (1977)
Year of Election or Appointment: 2019
Assistant Treasurer
Mr. Brown also serves as an officer of other funds. Mr. Brown serves as Assistant Treasurer of FIMM, LLC (2021-present) and is an employee of Fidelity Investments (2013-present).
John J. Burke III (1964)
Year of Election or Appointment: 2018
Chief Financial Officer
Mr. Burke also serves as Chief Financial Officer of other funds. Mr. Burke serves as Head of Investment Operations for Fidelity Fund and Investment Operations (2018-present) and is an employee of Fidelity Investments (1998-present). Previously Mr. Burke served as head of Asset Management Investment Operations (2012-2018).
William C. Coffey (1969)
Year of Election or Appointment: 2019
Assistant Secretary
Mr. Coffey also serves as Assistant Secretary of other funds. He is Senior Vice President and Deputy General Counsel of FMR LLC (diversified financial services company, 2010-present), and is an employee of Fidelity Investments. Previously, Mr. Coffey served as Secretary and CLO of certain funds (2018-2019); CLO, Secretary, and Senior Vice President of Fidelity Management & Research Company and FMR Co., Inc. (investment adviser firms, 2018-2019); Secretary of Fidelity SelectCo, LLC and Fidelity Investments Money Management, Inc. (investment adviser firms, 2018-2019); CLO of Fidelity Management & Research (Hong Kong) Limited, FMR Investment Management (UK) Limited, and Fidelity Management & Research (Japan) Limited (investment adviser firms, 2018-2019); and Assistant Secretary of certain funds (2009-2018).
Timothy M. Cohen (1969)
Year of Election or Appointment: 2018
Vice President
Mr. Cohen also serves as Vice President of other funds. Mr. Cohen serves as Co-Head of Equity (2018-present), a Director of Fidelity Management & Research (Japan) Limited (investment adviser firm, 2016-present), and is an employee of Fidelity Investments. Previously, Mr. Cohen served as Executive Vice President of Fidelity SelectCo, LLC (2019), Head of Global Equity Research (2016-2018), Chief Investment Officer - Equity and a Director of Fidelity Management & Research (U.K.) Inc. (investment adviser firm, 2013-2015) and as a Director of Fidelity Management & Research (Hong Kong) Limited (investment adviser firm, 2017).
Jonathan Davis (1968)
Year of Election or Appointment: 2010
Assistant Treasurer
Mr. Davis also serves as an officer of other funds. Mr. Davis serves as Assistant Treasurer of FIMM, LLC (2021-present), FMR Capital, Inc. (2017-present), FD Funds GP LLC (2021-present), FD Funds Holding LLC (2021-present), and FD Funds Management LLC (2021-present); and is an employee of Fidelity Investments. Previously, Mr. Davis served as Vice President and Associate General Counsel of FMR LLC (diversified financial services company, 2003-2010).
Laura M. Del Prato (1964)
Year of Election or Appointment: 2018
Assistant Treasurer
Ms. Del Prato also serves as an officer of other funds. Ms. Del Prato serves as Assistant Treasurer of FIMM, LLC (2021-present) and is an employee of Fidelity Investments (2017-present). Previously, Ms. Del Prato served as President and Treasurer of The North Carolina Capital Management Trust: Cash Portfolio and Term Portfolio (2018-2020). Prior to joining Fidelity Investments, Ms. Del Prato served as a Managing Director and Treasurer of the JPMorgan Mutual Funds (2014-2017). Prior to JPMorgan, Ms. Del Prato served as a partner at Cohen Fund Audit Services (accounting firm, 2012-2013) and KPMG LLP (accounting firm, 2004-2012).
Colm A. Hogan (1973)
Year of Election or Appointment: 2020
Assistant Treasurer
Mr. Hogan also serves as an officer of other funds. Mr. Hogan serves as Assistant Treasurer of FIMM, LLC (2021-present) and FMR Capital, Inc. (2017-present) and is an employee of Fidelity Investments (2005-present). Previously, Mr. Hogan served as Deputy Treasurer of certain Fidelity® funds (2016-2020) and Assistant Treasurer of certain Fidelity® funds (2016-2018).
Pamela R. Holding (1964)
Year of Election or Appointment: 2018
Vice President
Ms. Holding also serves as Vice President of other funds. Ms. Holding serves as Co-Head of Equity (2018-present) and is an employee of Fidelity Investments (2013-present). Previously, Ms. Holding served as Executive Vice President of Fidelity SelectCo, LLC (2019) and as Chief Investment Officer of Fidelity Institutional Asset Management (2013-2018).
Cynthia Lo Bessette (1969)
Year of Election or Appointment: 2019
Secretary and Chief Legal Officer (CLO)
Ms. Lo Bessette also serves as an officer of other funds. Ms. Lo Bessette serves as CLO, Secretary, and Senior Vice President of Fidelity Management & Research Company LLC (investment adviser firm, 2019-present); CLO of Fidelity Management & Research (Hong Kong) Limited, FMR Investment Management (UK) Limited, and Fidelity Management & Research (Japan) Limited (investment adviser firms, 2019-present); Secretary of FD Funds GP LLC (2021-present), FD Funds Holding LLC (2021-present), and FD Funds Management LLC (2021-present); and Assistant Secretary of FIMM, LLC (2019-present). She is a Senior Vice President and Deputy General Counsel of FMR LLC (diversified financial services company, 2019-present), and is an employee of Fidelity Investments. Previously, Ms. Lo Bessette served as CLO, Secretary, and Senior Vice President of FMR Co., Inc. (investment adviser firm, 2019); Secretary of Fidelity SelectCo, LLC and Fidelity Investments Money Management, Inc. (investment adviser firms, 2019). Prior to joining Fidelity Investments, Ms. Lo Bessette was Executive Vice President, General Counsel (2016-2019) and Senior Vice President, Deputy General Counsel (2015-2016) of OppenheimerFunds (investment management company) and Deputy Chief Legal Officer (2013-2015) of Jennison Associates LLC (investment adviser firm).
Chris Maher (1972)
Year of Election or Appointment: 2020
Deputy Treasurer
Mr. Maher also serves as an officer of other funds. Mr. Maher serves as Assistant Treasurer of FIMM, LLC (2021-present) and FMR Capital, Inc. (2017-present), and is an employee of Fidelity Investments (2008-present). Previously, Mr. Maher served as Assistant Treasurer of certain funds (2013-2020); Vice President of Asset Management Compliance (2013), Vice President of the Program Management Group of FMR (investment adviser firm, 2010-2013), and Vice President of Valuation Oversight (2008-2010).
Jason P. Pogorelec (1975)
Year of Election or Appointment: 2020
Chief Compliance Officer
Mr. Pogorelec also serves as Chief Compliance Officer of other funds. Mr. Pogorelec is a senior Vice President of Asset Management Compliance for Fidelity Investments and is an employee of Fidelity Investments (2006-present). Previously, Mr. Pogorelec served as Vice President, Associate General Counsel for Fidelity Investments (2010-2020) and Assistant Secretary of certain Fidelity funds (2015-2020).
Brett Segaloff (1972)
Year of Election or Appointment: 2021
Anti-Money Laundering (AML) Officer
Mr. Segaloff also serves as an AML Officer of other funds and other related entities. He is Director, Anti-Money Laundering (2007-present) of FMR LLC (diversified financial services company) and is an employee of Fidelity Investments (1996-present).
Stacie M. Smith (1974)
Year of Election or Appointment: 2016
President and Treasurer
Ms. Smith also serves as an officer of other funds. Ms. Smith serves as Assistant Treasurer of FIMM, LLC (2021-present) and FMR Capital, Inc. (2017-present), is an employee of Fidelity Investments (2009-present), and has served in other fund officer roles. Prior to joining Fidelity Investments, Ms. Smith served as Senior Audit Manager of Ernst & Young LLP (accounting firm, 1996-2009). Previously, Ms. Smith served as Assistant Treasurer (2013-2019) and Deputy Treasurer (2013-2016) of certain Fidelity® funds.
Jim Wegmann (1979)
Year of Election or Appointment: 2019
Assistant Treasurer
Mr. Wegmann also serves as an officer of other funds. Mr. Wegmann serves as Assistant Treasurer of FIMM, LLC (2021-present) and is an employee of Fidelity Investments (2011-present). Previously, Mr. Wegmann served as Assistant Treasurer of certain Fidelity® funds (2019-2021).
Shareholder Expense Example
As a shareholder, you incur two types of costs: (1) transaction costs, which may include sales charges (loads) on purchase payments or redemption proceeds, as applicable and (2) ongoing costs, which generally include management fees, distribution and/or service (12b-1) fees and other Fund expenses. This Example is intended to help you understand your ongoing costs (in dollars) of investing in a fund and to compare these costs with the ongoing costs of investing in other mutual funds.
The Example is based on an investment of $1,000 invested at the beginning of the period and held for the entire period (February 1, 2022 to July 31, 2022).
Actual Expenses
The first line of the accompanying table provides information about actual account values and actual expenses. You may use the information in this line, together with the amount you invested, to estimate the expenses that you paid over the period. Simply divide your account value by $1,000.00 (for example, an $8,600 account value divided by $1,000.00 = 8.6), then multiply the result by the number in the first line for a class/Fund under the heading entitled "Expenses Paid During Period" to estimate the expenses you paid on your account during this period. If any fund is a shareholder of any underlying mutual funds or exchange-traded funds (ETFs) (the Underlying Funds), such fund indirectly bears its proportional share of the expenses of the Underlying Funds in addition to the direct expenses incurred presented in the table. These fees and expenses are not included in the annualized expense ratio used to calculate the expense estimate in the table below.
Hypothetical Example for Comparison Purposes
The second line of the accompanying table provides information about hypothetical account values and hypothetical expenses based on the actual expense ratio and an assumed rate of return of 5% per year before expenses, which is not the actual return. The hypothetical account values and expenses may not be used to estimate the actual ending account balance or expenses you paid for the period. You may use this information to compare the ongoing costs of investing in the Fund and other funds. To do so, compare this 5% hypothetical example with the 5% hypothetical examples that appear in the shareholder reports of the other funds. If any fund is a shareholder of any Underlying Funds, such fund indirectly bears its proportional share of the expenses of the Underlying Funds in addition to the direct expenses as presented in the table. These fees and expenses are not included in the annualized expense ratio used to calculate the expense estimate in the table below.
Please note that the expenses shown in the table are meant to highlight your ongoing costs only and do not reflect any transaction costs. Therefore, the second line of the table is useful in comparing ongoing costs only, and will not help you determine the relative total costs of owning different funds. In addition, if these transactional costs were included, your costs would have been higher.
| | Annualized Expense Ratio-A | Beginning
Account Value
February 1, 2022 | Ending
Account Value
July 31, 2022 | Expenses Paid
During Period-B
February 1, 2022
to July 31, 2022 |
| Fidelity Real Estate Income Fund | | | | |
| Class A | .98% | | | |
| Actual | | $1,000.00 | $947.60 | $4.73 |
| Hypothetical-C | | $1,000.00 | $1,019.93 | $4.91 |
| Class M | .99% | | | |
| Actual | | $1,000.00 | $946.90 | $4.78 |
| Hypothetical-C | | $1,000.00 | $1,019.89 | $4.96 |
| Class C | 1.73% | | | |
| Actual | | $1,000.00 | $943.50 | $8.34 |
| Hypothetical- C | | $1,000.00 | $1,016.22 | $8.65 |
| Real Estate Income | .71% | | | |
| Actual | | $1,000.00 | $948.20 | $3.43 |
| Hypothetical-C | | $1,000.00 | $1,021.27 | $3.56 |
| Class I | .72% | | | |
| Actual | | $1,000.00 | $948.80 | $3.48 |
| Hypothetical-C | | $1,000.00 | $1,021.22 | $3.61 |
| Class Z | .59% | | | |
| Actual | | $1,000.00 | $949.30 | $2.85 |
| Hypothetical-C | | $1,000.00 | $1,021.87 | $2.96 |
A Annualized expense ratio reflects expenses net of applicable fee waivers.
B Expenses are equal to the annualized expense ratio, multiplied by the average account value over the period, multiplied by 181/ 365 (to reflect the one-half year period). The fees and expenses of any Underlying Funds are not included in each annualized expense ratio.
C 5% return per year before expenses
Distributions (Unaudited)
The dividend and capital gains distributions for the fund(s) are available on Fidelity.com or Institutional.Fidelity.com.
The fund hereby designates as a capital gain dividend with respect to the taxable year ended July 31, 2022, $133,156,561, or, if subsequently determined to be different, the net capital gain of such year.
A total of 0.01% of the dividends distributed during the fiscal year was derived from interest on U.S. Government securities which is generally exempt from state income tax.
The fund designates $59,504,727 of distributions paid in the calendar year 2021 as qualifying to be taxed as interest-related dividends for nonresident alien shareholders.
The fund designates $44,349,229 of distributions paid in the calendar year 2021 as qualifying to be taxed as section 163(j) interest dividends.
A percentage of the dividends distributed during the fiscal year for the following funds qualify for the dividends–received deduction for corporate shareholders:
| | Class A | Class M | Class C | Real Estate Income | Class I | Class Z |
| Fidelity Real Estate Income Fund | | | | | | |
| September 2021 | 7% | 8% | – | 3% | 4% | 3% |
| December 2021 | 4% | 4% | 5% | 3% | 3% | 3% |
| June 2022 | 5% | 5% | 7% | 4% | 4% | 4% |
A percentage of the dividends distributed during the fiscal year for the following funds may be taken into account as a dividend for purposes of the maximum rate under section 1(h)(11) of the Internal Revenue Code.
| | Class A | Class M | Class C | Real Estate Income | Class I | Class Z |
| Fidelity Real Estate Income Fund | | | | | | |
| September 2021 | 8% | 9% | – | 4% | 4% | 3% |
| December 2021 | 4% | 4% | 5% | 4% | 4% | 4% |
| June 2022 | 7% | 7% | 11% | 7% | 6% | 6% |
A percentage of the dividends distributed during the fiscal year for the following funds qualify as a section 199A dividend:
| | Class A | Class M | Class C | Real Estate Income | Class I | Class Z |
| Fidelity Real Estate Income Fund | | | | | | |
| September 2021 | 93% | 92% | – | 44% | 47% | 35% |
| December 2021 | 47% | 48% | 62% | 44% | 44% | 42% |
| June 2022 | 92% | 92% | 90% | 83% | 82% | 78% |
The fund will notify shareholders in January 2023 of amounts for use in preparing 2022 income tax returns.
Board Approval of Investment Advisory Contracts and Management Fees
Fidelity Real Estate Income Fund
Each year, the Board of Trustees, including the Independent Trustees (together, the Board), votes on the renewal of the management contract with Fidelity Management & Research Company LLC (FMR) and the sub-advisory agreements (together, the Advisory Contracts) for the fund. FMR and the sub-advisers are referred to herein as the Investment Advisers. The Board, assisted by the advice of fund counsel and Independent Trustees' counsel, requests and considers a broad range of information relevant to the renewal of the Advisory Contracts throughout the year.
The Board meets regularly and, at each of its meetings, covers an extensive agenda of topics and materials and considers factors that are relevant to its annual consideration of the renewal of the fund's Advisory Contracts, including the services and support provided to the fund and its shareholders. The Board has established various standing committees (Committees), each composed of and chaired by Independent Trustees with varying backgrounds, to which the Board has assigned specific subject matter responsibilities in order to enhance effective decision-making by the Board. The Board, acting directly and through its Committees, requests and receives information concerning the annual consideration of the renewal of the fund's Advisory Contracts. The Board also meets as needed to review matters specifically related to the Board's annual consideration of the renewal of the Advisory Contracts. Members of the Board may also meet with trustees of other Fidelity funds through joint ad hoc committees to discuss certain matters relevant to all of the Fidelity funds.
At its May 2022 meeting, the Board unanimously determined to renew the fund's Advisory Contracts. In reaching its determination, the Board considered all factors it believed relevant, including (i) the nature, extent, and quality of the services provided to the fund and its shareholders (including the investment performance of the fund); (ii) the competitiveness relative to peer funds of the fund's management fee and the total expense ratio of a representative class (retail class); (iii) the total costs of the services provided by and the profits realized by Fidelity from its relationships with the fund; and (iv) the extent to which, if any, economies of scale exist and are realized as the fund grows, and whether any economies of scale are appropriately shared with fund shareholders.
In considering whether to renew the Advisory Contracts for the fund, the Board reached a determination, with the assistance of fund counsel and Independent Trustees' counsel and through the exercise of its business judgment, that the renewal of the Advisory Contracts was in the best interests of the fund and its shareholders and that the compensation payable under the Advisory Contracts was fair and reasonable. The Board's decision to renew the Advisory Contracts was not based on any single factor, but rather was based on a comprehensive consideration of all the information provided to the Board at its meetings throughout the year. The Board, in reaching its determination to renew the Advisory Contracts, was aware that shareholders of the fund have a broad range of investment choices available to them, including a wide choice among funds offered by Fidelity's competitors, and that the fund's shareholders, who have the opportunity to review and weigh the disclosure provided by the fund in its prospectus and other public disclosures, have chosen to invest in this fund, which is part of the Fidelity family of funds.
Nature, Extent, and Quality of Services Provided. The Board considered Fidelity's staffing as it relates to the fund, including the backgrounds of investment personnel of Fidelity, and also considered the fund's investment objective, strategies, and related investment philosophy. The Independent Trustees also had discussions with senior management of Fidelity's investment operations and investment groups. The Board considered the structure of the investment personnel compensation program and whether this structure provides appropriate incentives to act in the best interests of the fund. Additionally, the Board considered the portfolio managers' investments, if any, in the funds that they manage. The Board also considered the steps Fidelity had taken to ensure the continued provision of high quality services to the Fidelity funds during the COVID-19 pandemic, including the expansion of staff in client facing positions to maintain service levels in periods of high volumes and volatility.
Resources Dedicated to Investment Management and Support Services. The Board and the Fund Oversight and Research Committees reviewed the general qualifications and capabilities of Fidelity's investment staff, including its size, education, experience, and resources, as well as Fidelity's approach to recruiting, training, managing, and compensating investment personnel. The Board noted the resources devoted to expansion of Fidelity's global investment organization, and that Fidelity's analysts have extensive resources, tools, and capabilities that allow them to conduct sophisticated quantitative and fundamental analysis, as well as credit analysis of issuers, counterparties, and guarantors. Further, the Board considered that Fidelity's investment professionals have sufficient access to global information and data so as to provide competitive investment results over time, and that those professionals also have access to sophisticated tools that permit them to assess portfolio construction and risk and performance attribution characteristics continuously, as well as to transmit new information and research conclusions rapidly around the world. Additionally, in its deliberations, the Board considered Fidelity's trading, risk management, compliance, and technology and operations capabilities and resources, which are integral parts of the investment management process.
Shareholder and Administrative Services. The Board considered (i) the nature, extent, quality, and cost of advisory, administrative, and shareholder services performed by the Investment Advisers and their affiliates under the Advisory Contracts and under separate agreements covering transfer agency, pricing and bookkeeping, and securities lending services for the fund; (ii) the nature and extent of the supervision of third party service providers, principally custodians, subcustodians, and pricing vendors; and (iii) the resources devoted to, and the record of compliance with, the fund's compliance policies and procedures. The Board also reviewed the allocation of fund brokerage, including allocations to brokers affiliated with the Investment Advisers, the use of brokerage commissions to pay fund expenses, and the use of "soft" commission dollars to pay for research services.
The Board noted that the growth of fund assets over time across the complex allows Fidelity to reinvest in the development of services designed to enhance the value and convenience of the Fidelity funds as investment vehicles. These services include 24-hour access to account information and market information over the Internet and through telephone representatives, investor education materials, and asset allocation tools. The Board also considered that it reviews customer service metrics such as telephone response times, continuity of services on the website and metrics addressing services at Fidelity Investor Centers.
Investment in a Large Fund Family. The Board considered the benefits to shareholders of investing in a Fidelity fund, including the benefits of investing in a fund that is part of a large family of funds offering a variety of investment disciplines and providing a large variety of mutual fund investor services. The Board noted that Fidelity had taken, or had made recommendations that resulted in the Fidelity funds taking, a number of actions over the previous year that benefited particular funds, including: (i) continuing to dedicate additional resources to Fidelity's investment research process, which includes meetings with management of issuers of securities in which the funds invest; (ii) continuing efforts to enhance Fidelity's global research capabilities; (iii) launching new funds and ETFs with innovative structures, strategies and pricing and making other enhancements to meet client needs; (iv) launching new share classes of existing funds; (v) eliminating purchase minimums and broadening eligibility requirements for certain funds and share classes; (vi) reducing management fees and total expenses for certain target date funds and classes and index funds; (vii) lowering expenses for certain existing funds and classes by implementing or lowering expense caps; (viii) rationalizing product lines and gaining increased efficiencies from fund mergers and liquidations; (ix) continuing to develop, acquire and implement systems and technology to improve services to the funds and shareholders, strengthen information security, and increase efficiency; and (x) continuing to implement enhancements to further strengthen Fidelity's product line to increase investors' probability of success in achieving their investment goals, including retirement income goals.
Investment Performance. The Board considered whether the fund has operated in accordance with its investment objective, as well as its record of compliance with its investment restrictions and its performance history. The Board noted that the fund had a portfolio manager change in March 2019 and July 2021. The Board will continue to monitor closely the fund's performance, taking into account the portfolio management changes.
The Board took into account discussions that occur at Board meetings throughout the year with representatives of the Investment Advisers about fund investment performance. In this regard the Board noted that as part of regularly scheduled fund reviews and other reports to the Board on fund performance, the Board considers annualized return information for the fund for different time periods, measured against an appropriate securities market index (benchmark index) and an appropriate peer group of funds with similar objectives (peer group). The Board also reviews and considers information about performance attribution. In its evaluation of fund investment performance, the Board gave particular attention to information indicating changes in performance of certain Fidelity funds for specific time periods and discussed with the Investment Advisers the reasons for any overperformance or underperformance.
In addition to reviewing absolute and relative fund performance, the Independent Trustees periodically consider the appropriateness of fund performance metrics in evaluating the results achieved. In general, the Independent Trustees believe that fund performance should be evaluated based on net performance (after fees and expenses) of the representative class, compared to appropriate benchmark indices, over appropriate time periods that may include full market cycles, and compared to peer groups, as applicable, over the same periods, taking into account relevant factors including the following: general market conditions; issuer-specific information; and fund cash flows and other factors.
The Independent Trustees recognize that shareholders evaluate performance on a net basis over their own holding periods, for which one-, three-, and five-year periods are often used as a proxy. For this reason, the performance information reviewed by the Board also included net cumulative total return information for the fund and an appropriate benchmark index and peer group for the most recent one-, three-, and five-year periods ended September 30, 2021, as shown below. Returns are shown compared to the 25th percentile (top of box, 75% beaten) and 75th percentile (bottom of box, 25% beaten) of the peer universe.
Fidelity Real Estate Income Fund
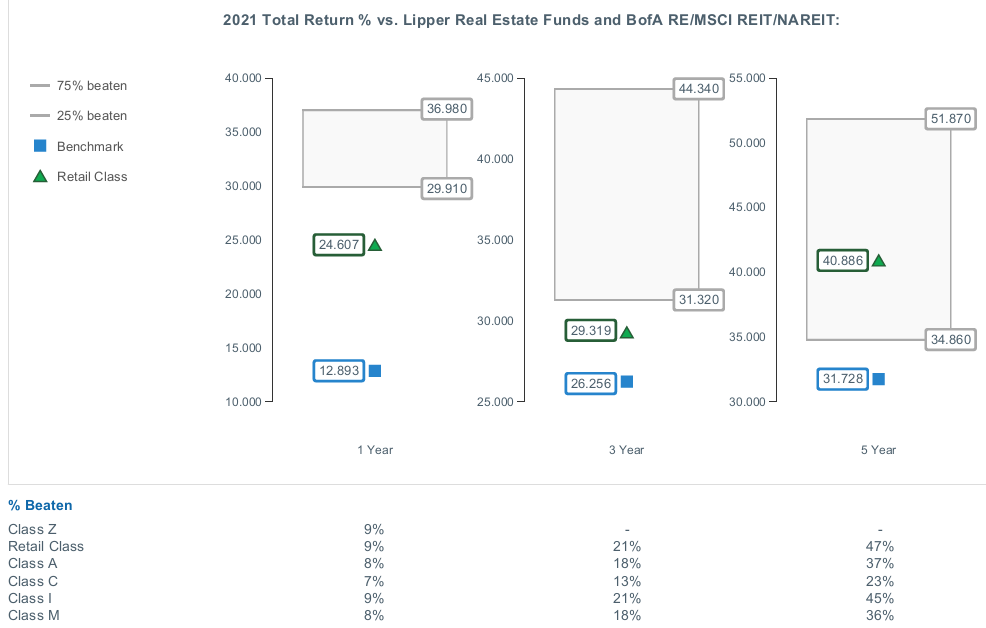
Based on its review, the Board concluded that the nature, extent, and quality of services provided to the fund under the Advisory Contracts should continue to benefit the shareholders of the fund.
Competitiveness of Management Fee and Total Expense Ratio. The Board considered the fund's management fee and total expense ratio compared to "mapped groups" of competitive funds and classes created for the purpose of facilitating the Trustees' competitive analysis of management fees and total expenses. Fidelity creates "mapped groups" by combining similar Lipper investment objective categories that have comparable investment mandates. For this purpose, all sector focused equity funds are grouped in the same mapped group. Combining Lipper investment objective categories aids the Board's management fee and total expense ratio comparisons by broadening the competitive group used for comparison.
Management Fee. The Board considered two proprietary management fee comparisons for the 12-month periods ended September 30 (June 30 for periods ended 2019 and 2018 and December 31 for periods prior to 2018) shown in basis points (BP) in the chart below. The group of Lipper funds used by the Board for management fee comparisons is referred to below as the "Total Mapped Group." The Total Mapped Group is broader than the Lipper peer group used by the Board for performance comparisons because the Total Mapped Group combines several Lipper investment objective categories while the Lipper peer group does not. The Total Mapped Group comparison focuses on a fund's standing in terms of gross management fees before expense reimbursements or caps relative to the total universe of funds with comparable investment mandates (i.e., sector equities), regardless of whether their management fee structures also are comparable. Funds with comparable management fee structures have similar management fee contractual arrangements (
e.g., flat rate charged for advisory services, all-inclusive fee rate,
etc.). "TMG %" represents the percentage of funds in the Total Mapped Group that had management fees that were lower than the fund's. For example, a hypothetical TMG % of 20% would mean that 80% of the funds in the Total Mapped Group had higher, and 20% had lower, management fees than the fund. The fund's actual TMG %s and the number of funds in the Total Mapped Group are in the chart below. The "Asset-Sized Peer Group" (ASPG) comparison focuses on a fund's standing relative to a subset of non-Fidelity funds within the Total Mapped Group that are similar in size and management fee structure. For example, if a fund is in the first quartile of the ASPG, the fund's management fee ranks in the least expensive or lowest 25% of funds in the ASPG. The ASPG represents at least 15% of the funds in the Total Mapped Group with comparable asset size and management fee structures, subject to a minimum of 50 funds (or all funds in the Total Mapped Group if fewer than 50). Additional information, such as the ASPG quartile in which the fund's management fee rate ranked, is also included in the chart and was considered by the Board.
Fidelity Real Estate Income Fund
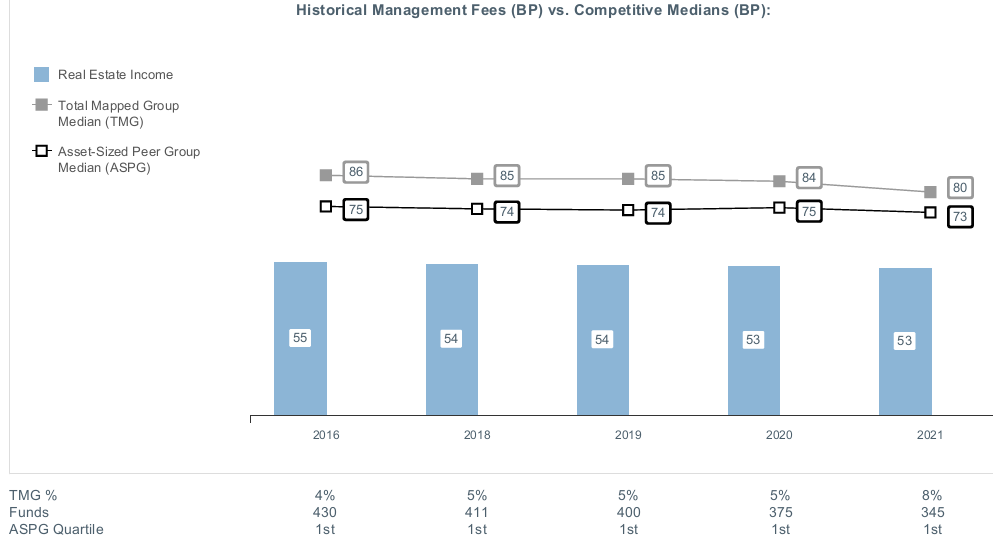
The Board noted that the fund's management fee rate ranked below the median of its Total Mapped Group and below the median of its ASPG for the 12-month period ended September 30, 2021.
The Board also considered that, for funds subject to the group fee, FMR agreed to voluntarily waive fees over a specified period of time in amounts designed to account for assets converted from certain funds to certain collective investment trusts.
Based on its review, the Board concluded that the fund's management fee is fair and reasonable in light of the services that the fund receives and the other factors considered.
Total Expense Ratio. In its review of the total expense ratio of the representative class (retail class), the Board considered the fund's management fee rate as well as other fund or class expenses, as applicable, such as transfer agent fees, pricing and bookkeeping fees, fund-paid 12b-1 fees, and custodial, legal, and audit fees. The Board also noted that Fidelity may agree to waive fees or reimburse expenses from time to time, and the extent to which, if any, it has done so for the fund. The fund's representative class is compared to those funds and classes in the Total Mapped Group (used by the Board for management fee comparisons) that have a similar sales load structure. The Board also considered a total expense ASPG comparison, which focuses on the total expenses of the representative class relative to a subset of non-Fidelity funds within the total expense similar sales load structure group. The total expense ASPG is limited to 15 larger and 15 smaller classes in fund average assets for a total of 30 classes, where possible. The total expense ASPG comparison excludes performance adjustments and fund-paid 12b-1 fees to eliminate variability in fee structures.
The Board noted that the total net expense ratio of the retail class ranked below the similar sales load structure group competitive median and below the ASPG competitive median for the 12-month period ended September 30, 2021.
Fees Charged to Other Fidelity Clients. The Board also considered Fidelity fee structures and other information with respect to clients of Fidelity, such as other funds advised or subadvised by Fidelity, pension plan clients, and other institutional clients with similar mandates. The Board noted that a joint ad hoc committee created by it and the boards of other Fidelity funds periodically reviews and compares Fidelity's institutional investment advisory business with its business of providing services to the Fidelity funds and also noted the most recent findings of the committee. The Board noted that the committee's review included a consideration of the differences in services provided, fees charged, and costs incurred, as well as competition in the markets serving the different categories of clients.
Based on its review of total expense ratios and fees charged to other Fidelity clients, the Board concluded that the total expense ratio of each class of the fund was reasonable in light of the services that the fund and its shareholders receive and the other factors considered.
Costs of the Services and Profitability. The Board considered the revenues earned and the expenses incurred by Fidelity in conducting the business of developing, marketing, distributing, managing, administering and servicing the fund and servicing the fund's shareholders. The Board also considered the level of Fidelity's profits in respect of all the Fidelity funds.
On an annual basis, Fidelity presents to the Board information about the profitability of its relationships with the fund. Fidelity calculates profitability information for each fund, as well as aggregate profitability information for groups of Fidelity funds and all Fidelity funds, using a series of detailed revenue and cost allocation methodologies which originate with the books and records of Fidelity on which Fidelity's audited financial statements are based. The Audit Committee of the Board reviews any significant changes from the prior year's methodologies and the full Board approves such changes.
A public accounting firm has been engaged annually by the Board as part of the Board's assessment of Fidelity's profitability analysis. The engagement includes the review and assessment of the methodologies used by Fidelity in determining the revenues and expenses attributable to Fidelity's mutual fund business, and completion of agreed-upon procedures in respect of the mathematical accuracy of certain fund profitability information and its conformity to established allocation methodologies. After considering the reports issued under the engagement and information provided by Fidelity, the Board concluded that while other allocation methods may also be reasonable, Fidelity's profitability methodologies are reasonable in all material respects.
The Board also reviewed Fidelity's non-fund businesses and potential indirect benefits such businesses may have received as a result of their association with Fidelity's mutual fund business (i.e., fall-out benefits) as well as cases where Fidelity's affiliates may benefit from the funds' business. The Board considered areas where potential indirect benefits to the Fidelity funds from their relationships with Fidelity may exist. The Board's consideration of these matters was informed by the findings of a joint ad hoc committee created by it and the boards of other Fidelity funds to evaluate potential fall-out benefits.
The Board considered the costs of the services provided by and the profits realized by Fidelity in connection with the operation of the fund and was satisfied that the profitability was not excessive.
Economies of Scale. The Board considered whether there have been economies of scale in respect of the management of the Fidelity funds, whether the Fidelity funds (including the fund) have appropriately benefited from any such economies of scale, and whether there is potential for realization of any further economies of scale. The Board considered the extent to which the fund will benefit from economies of scale as assets grow through increased services to the fund, through waivers or reimbursements, or through fee or expense ratio reductions. The Board also noted that a committee (the Economies of Scale Committee) created by it and the boards of other Fidelity funds periodically analyzes whether Fidelity attains economies of scale in respect of the management and servicing of the Fidelity funds, whether the Fidelity funds have appropriately benefited from such economies of scale, and whether there is potential for realization of any further economies of scale.
The Board recognized that the fund's management contract incorporates a "group fee" structure, which provides for lower group fee rates as total "group assets" increase, and for higher group fee rates as total "group assets" decrease ("group assets" as defined in the management contract). FMR calculates the group fee rates based on a tiered asset "breakpoint" schedule that varies based on asset class. The Board considered that the group fee is designed to deliver the benefits of economies of scale to fund shareholders when total Fidelity fund assets increase, even if assets of any particular fund are unchanged or have declined, because some portion of Fidelity's costs are attributable to services provided to all Fidelity funds, and all funds benefit if those costs can be allocated among more assets. The Board further considered that Fidelity agreed to impose a temporary fee waiver in the form of additional breakpoints to the current breakpoint schedule. The Board concluded that, given the group fee structure, fund shareholders will benefit from lower management fees as "group assets" increase at the fund complex level, regardless of whether Fidelity achieves any such economies of scale.
The Board concluded, taking into account the analysis of the Economies of Scale Committee, that economies of scale, if any, are being appropriately shared between fund shareholders and Fidelity.
Additional Information Requested by the Board. In order to develop fully the factual basis for consideration of the Fidelity funds' advisory contracts, the Board requested and received additional information on certain topics, including: (i) fund flow and performance trends, in particular the underperformance of certain funds and strategies, and Fidelity's long-term strategies for certain funds, including any consideration of fund liquidations or mergers; (ii) the operation of performance fees, competitor use of performance fees, and consideration of the expansion of performance fees to additional funds; (iii) Fidelity's pricing philosophy compared to competitors; (iv) fund profitability methodology and data; (v) evaluation of competitive fund data and peer group classifications and fee and expense comparisons; (vi) the management fee and expense structures for different funds and classes and information about the differences between various fee and expense structures; (vii) group fee breakpoints and related voluntary fee waivers; and (viii) information regarding other accounts managed by Fidelity and the funds' sub-advisory arrangements.
Based on its evaluation of all of the conclusions noted above, and after considering all factors it believed relevant, the Board concluded that the advisory fee arrangements are fair and reasonable and that the fund's Advisory Contracts should be renewed.
Liquidity Risk Management Program
The Securities and Exchange Commission adopted Rule 22e-4 under the Investment Company Act of 1940 (the Liquidity Rule) to promote effective liquidity risk management throughout the open-end investment company industry, thereby reducing the risk that funds will be unable to meet their redemption obligations and mitigating dilution of the interests of fund shareholders.
The Fund has adopted and implemented a liquidity risk management program pursuant to the Liquidity Rule (the Program) effective December 1, 2018. The Program is reasonably designed to assess and manage the Fund’s liquidity risk and to comply with the requirements of the Liquidity Rule. The Fund’s Board of Trustees (the Board) has designated the Fund’s investment adviser as administrator of the Program. The Fidelity advisers have established a Liquidity Risk Management Committee (the LRM Committee) to manage the Program for each of the Fidelity Funds. The LRM Committee monitors the adequacy and effectiveness of implementation of the Program and on a periodic basis assesses each Fund’s liquidity risk based on a variety of factors including (1) the Fund’s investment strategy, (2) portfolio liquidity and cash flow projections during normal and reasonably foreseeable stressed conditions, (3) shareholder redemptions, (4) borrowings and other funding sources and (5) in the case of exchange-traded funds, certain additional factors including the effect of the Fund’s prices and spreads, market participants, and basket compositions on the overall liquidity of the Fund’s portfolio, as applicable.
In accordance with the Program, each of the Fund’s portfolio investments is classified into one of four liquidity categories described below based on a determination of a reasonable expectation for how long it would take to convert the investment to cash (or sell or dispose of the investment) without significantly changing its market value.
- Highly liquid investments – cash or convertible to cash within three business days or less
- Moderately liquid investments – convertible to cash in three to seven calendar days
- Less liquid investments – can be sold or disposed of, but not settled, within seven calendar days
- Illiquid investments – cannot be sold or disposed of within seven calendar days
Liquidity classification determinations take into account a variety of factors including various market, trading and investment-specific considerations, as well as market depth, and generally utilize analysis from a third-party liquidity metrics service.
The Liquidity Rule places a 15% limit on a fund’s illiquid investments and requires funds that do not primarily hold assets that are highly liquid investments to determine and maintain a minimum percentage of the fund’s net assets to be invested in highly liquid investments (highly liquid investment minimum or HLIM). The Program includes provisions reasonably designed to comply with the 15% limit on illiquid investments and for determining, periodically reviewing and complying with the HLIM requirement as applicable.
At a recent meeting of the Fund’s Board of Trustees, the LRM Committee provided a written report to the Board pertaining to the operation, adequacy, and effectiveness of implementation of the Program for the annual period from December 1, 2020 through November 30, 2021. The report concluded that the Program has been implemented and is operating effectively and is reasonably designed to assess and manage the Fund’s liquidity risk.
REI-ANN-0922
1.788862.119
Fidelity® Small Cap Growth Fund
Annual Report
July 31, 2022
Includes Fidelity and Fidelity Advisor share classes
Contents
To view a fund's proxy voting guidelines and proxy voting record for the 12-month period ended June 30, visit http://www.fidelity.com/proxyvotingresults or visit the Securities and Exchange Commission's (SEC) web site at http://www.sec.gov.
You may also call 1-800-544-8544 if you’re an individual investing directly with Fidelity, call 1-800-835-5092 if you’re a plan sponsor or participant with Fidelity as your recordkeeper or call 1-877-208-0098 on institutional accounts or if you’re an advisor or invest through one to request a free copy of the proxy voting guidelines.
Standard & Poor's, S&P and S&P 500 are registered service marks of The McGraw-Hill Companies, Inc. and have been licensed for use by Fidelity Distributors Corporation.
Other third-party marks appearing herein are the property of their respective owners.
All other marks appearing herein are registered or unregistered trademarks or service marks of FMR LLC or an affiliated company. © 2022 FMR LLC. All rights reserved.
This report and the financial statements contained herein are submitted for the general information of the shareholders of the Fund. This report is not authorized for distribution to prospective investors in the Fund unless preceded or accompanied by an effective prospectus.
A fund files its complete schedule of portfolio holdings with the SEC for the first and third quarters of each fiscal year on Form N-PORT. Forms N-PORT are available on the SEC’s web site at http://www.sec.gov. A fund's Forms N-PORT may be reviewed and copied at the SEC’s Public Reference Room in Washington, DC. Information regarding the operation of the SEC's Public Reference Room may be obtained by calling 1-800-SEC-0330.
For a complete list of a fund's portfolio holdings, view the most recent holdings listing, semiannual report, or annual report on Fidelity's web site at http://www.fidelity.com, http://www.institutional.fidelity.com, or http://www.401k.com, as applicable.
NOT FDIC INSURED •MAY LOSE VALUE •NO BANK GUARANTEE
Neither the Fund nor Fidelity Distributors Corporation is a bank.
Note to Shareholders:
Early in 2020, the outbreak and spread of COVID-19 emerged as a public health emergency that had a major influence on financial markets, primarily based on its impact on the global economy and corporate earnings. On March 11, 2020, the World Health Organization declared the COVID-19 outbreak a pandemic, citing sustained risk of further global spread. The pandemic prompted a number of measures to limit the spread of COVID-19, including travel and border restrictions, quarantines, and restrictions on large gatherings. In turn, these resulted in lower consumer activity, diminished demand for a wide range of products and services, disruption in manufacturing and supply chains, and – given the wide variability in outcomes regarding the outbreak – significant market uncertainty and volatility. To help stem the turmoil, the U.S. government took unprecedented action – in concert with the U.S. Federal Reserve and central banks around the world – to help support consumers, businesses, and the broader economy, and to limit disruption to the financial system.
In general, the overall impact of the pandemic lessened in 2021, amid a resilient economy and widespread distribution of three COVID-19 vaccines granted emergency use authorization from the U.S. Food and Drug Administration (FDA) early in the year. Still, the situation remains dynamic, and the extent and duration of its influence on financial markets and the economy is highly uncertain, due in part to a recent spike in cases based on highly contagious variants of the coronavirus.
Extreme events such as the COVID-19 crisis are exogenous shocks that can have significant adverse effects on mutual funds and their investments. Although multiple asset classes may be affected by market disruption, the duration and impact may not be the same for all types of assets. Fidelity is committed to helping you stay informed amid news about COVID-19 and during increased market volatility, and we continue to take extra steps to be responsive to customer needs. We encourage you to visit us online, where we offer ongoing updates, commentary, and analysis on the markets and our funds.
Performance: The Bottom Line
Average annual total return reflects the change in the value of an investment, assuming reinvestment of distributions from dividend income and capital gains (the profits earned upon the sale of securities that have grown in value, if any) and assuming a constant rate of performance each year. The hypothetical investment and the average annual total returns do not reflect the deduction of taxes that a shareholder would pay on fund distributions or the redemption of fund shares. During periods of reimbursement by Fidelity, a fund’s total return will be greater than it would be had the reimbursement not occurred. How a fund did yesterday is no guarantee of how it will do tomorrow.
Average Annual Total Returns
| For the periods ended July 31, 2022 | Past 1 year | Past 5 years | Past 10 years |
| Class A (incl. 5.75% sales charge) | (25.19)% | 9.73% | 12.81% |
| Class M (incl. 3.50% sales charge) | (23.62)% | 9.96% | 12.77% |
| Class C (incl. contingent deferred sales charge) | (21.88)% | 10.19% | 12.79% |
| Fidelity® Small Cap Growth Fund | (20.42)% | 11.34% | 13.81% |
| Class I | (20.42)% | 11.32% | 13.80% |
| Class Z | (20.33)% | 11.48% | 13.88% |
Class C shares' contingent deferred sales charges included in the past one year, past five years and past ten years total return figures are 1%, 0% and 0%, respectively.
The initial offering of Class Z shares took place on February 1, 2017. Returns prior to February 1, 2017, are those of Class I.
$10,000 Over 10 Years
Let's say hypothetically that $10,000 was invested in Fidelity® Small Cap Growth Fund, a class of the fund, on July 31, 2012.
The chart shows how the value of your investment would have changed, and also shows how the Russell 2000® Growth Index performed over the same period.
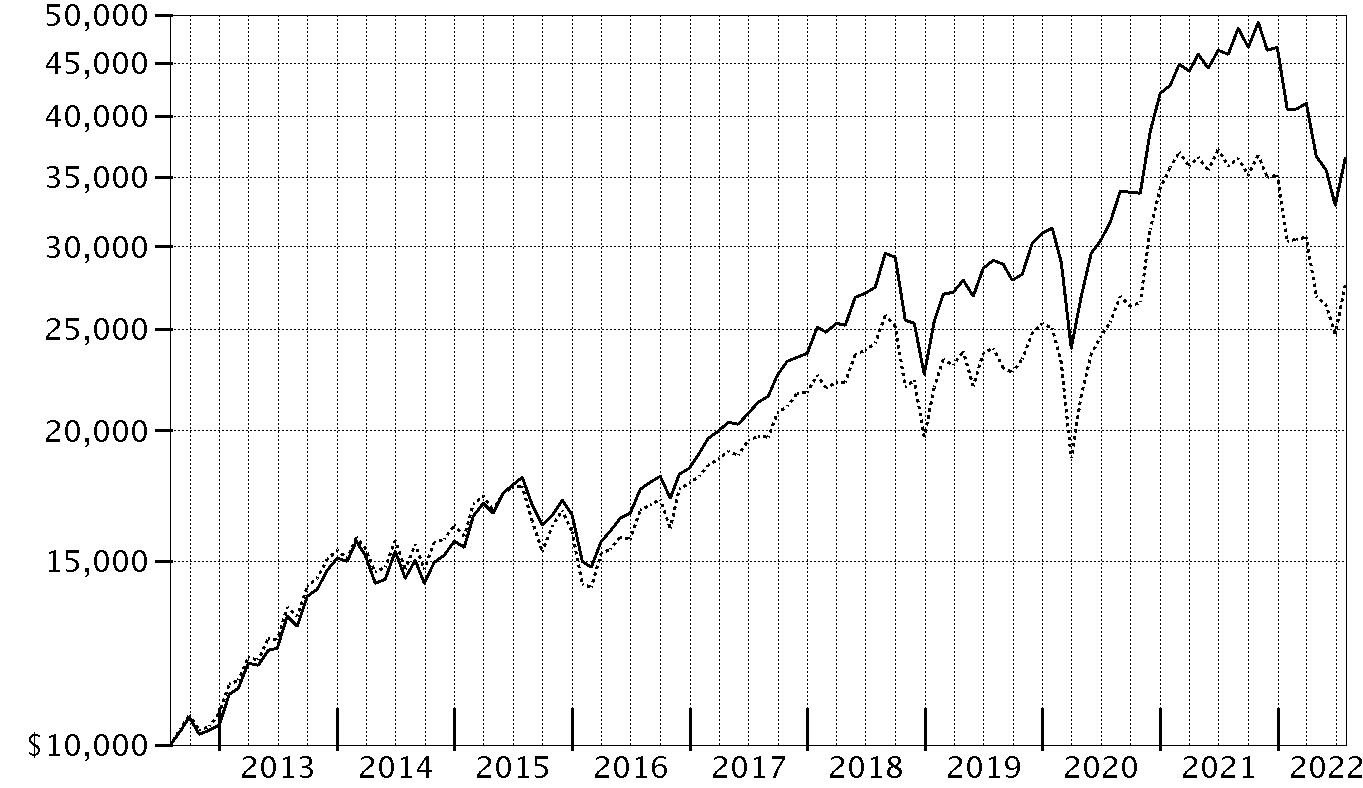
| Period Ending Values |
| $36,456 | Fidelity® Small Cap Growth Fund |
| $27,529 | Russell 2000® Growth Index |
Management's Discussion of Fund Performance
Market Recap: The S&P 500
® index returned -4.64% for the 12 months ending July 31, 2022, as a multitude of crosscurrents challenged the global economy and financial markets. Persistently high inflation, exacerbated by energy price shocks from the Russia–Ukraine conflict, spurred the U.S. Federal Reserve to hike interest rates more aggressively than anticipated, and concerns about the outlook for economic growth sent stocks into bear market territory. In early May, the Fed approved a rare half-percentage-point interest rate increase and announced plans to shrink its $9 trillion asset portfolio. June began with the Fed allowing up to billions in Treasuries and mortgage bonds to mature every month without investing the proceeds. Two weeks later, the central bank raised rates by 0.75 percentage points, its largest increase since 1994, and said it was becoming more difficult to achieve a soft landing, in which the economy slows enough to bring down inflation while avoiding a recession. Against this volatile backdrop, the S&P 500 posted its worst first-half result (-19.96%) to begin a year since 1970. Stocks sharply reversed course in July (+9.22%), as the Fed again raised its benchmark interest rate by 0.75% but signaled that, at some point, it will likely slow the pace of tightening to assess the impact on the economy. For the full 12 months, growth-oriented communication services (-29%) and consumer discretionary (-10%) stocks lagged most. In contrast, energy (+67%) rode a surge in commodity prices and led by a wide margin, followed by the defensive utilities (+16%) and consumer staples (+7%) sectors.
Comments from Portfolio Manager Patrick Venanzi: For the fiscal year ending July 31, 2022, the fund's share classes (excluding sales charges, if applicable) returned roughly -21% to -20%, outperforming the -23.18% result of the benchmark Russell 2000
® Growth Index. Versus the benchmark, security selection was the primary contributor. Specifically, security selection in industrials, communication services and health care bolstered the fund's relative result. The biggest individual relative contributor was an overweight position in Antero Resources (+193%). Also boosting value was our outsized stake in SiTime, which gained 37%. SiTime was among our largest holdings. The fund's non-benchmark stake in Builders FirstSource, another of the fund's biggest holdings this period, gained 53%. Conversely, the primary detractor from performance versus the benchmark was our stock picks in consumer discretionary. Weak picks in utilities also hindered the fund's relative result. Also hampering the fund's relative result was an underweighting in the consumer staples sector, especially within the food, beverage & tobacco segment. The biggest individual relative detractor was an overweight position in Figs (-74%), which was a position we established the past year. Other notable relative detractors were overweights in Porch (-89%) and American Eagle Outfitters (-62%), the latter a position that was sold the past 12 months. Notable changes in positioning include increased exposure to the industrials sector and a lower allocation to consumer discretionary.
The views expressed above reflect those of the portfolio manager(s) only through the end of the period as stated on the cover of this report and do not necessarily represent the views of Fidelity or any other person in the Fidelity organization. Any such views are subject to change at any time based upon market or other conditions and Fidelity disclaims any responsibility to update such views. These views may not be relied on as investment advice and, because investment decisions for a Fidelity fund are based on numerous factors, may not be relied on as an indication of trading intent on behalf of any Fidelity fund.
Investment Summary (Unaudited)
Top Ten Stocks as of July 31, 2022
| | % of fund's net assets |
| Crocs, Inc. | 1.3 |
| Bumble, Inc. | 1.3 |
| CACI International, Inc. Class A | 1.3 |
| TechTarget, Inc. | 1.3 |
| Avid Technology, Inc. | 1.3 |
| Insulet Corp. | 1.2 |
| SiTime Corp. | 1.2 |
| Performance Food Group Co. | 1.1 |
| Molina Healthcare, Inc. | 1.0 |
| Acadia Healthcare Co., Inc. | 1.0 |
| | 12.0 |
Market Sectors as of July 31, 2022
| | % of fund's net assets |
| Health Care | 24.3 |
| Industrials | 19.6 |
| Information Technology | 18.4 |
| Consumer Discretionary | 11.5 |
| Financials | 5.7 |
| Energy | 5.4 |
| Communication Services | 4.9 |
| Materials | 4.3 |
| Consumer Staples | 3.7 |
| Utilities | 1.1 |
| Real Estate | 0.5 |
Asset Allocation (% of fund's net assets)
| As of July 31, 2022* |
| | Stocks | 97.3% |
| | Convertible Securities | 2.5% |
| | Short-Term Investments and Net Other Assets (Liabilities) | 0.2% |

* Foreign investments - 8.7%
Schedule of Investments July 31, 2022
Showing Percentage of Net Assets
| Common Stocks - 96.9% | | | |
| | | Shares | Value |
| COMMUNICATION SERVICES - 4.7% | | | |
| Diversified Telecommunication Services - 0.2% | | | |
| IDT Corp. Class B (a) | | 332,547 | $8,656,198 |
| Interactive Media & Services - 2.2% | | | |
| Bumble, Inc. (a)(b) | | 1,841,305 | 69,822,286 |
| CarGurus, Inc. Class A (a) | | 1,114,796 | 27,078,395 |
| Cars.com, Inc. (a) | | 1,512,072 | 17,781,967 |
| | | | 114,682,648 |
| Media - 1.8% | | | |
| Nexstar Broadcasting Group, Inc. Class A | | 133,718 | 25,188,460 |
| TechTarget, Inc. (a)(b) | | 1,030,297 | 67,165,061 |
| | | | 92,353,521 |
| Wireless Telecommunication Services - 0.5% | | | |
| Gogo, Inc. (a) | | 1,691,232 | 29,359,788 |
|
| TOTAL COMMUNICATION SERVICES | | | 245,052,155 |
|
| CONSUMER DISCRETIONARY - 11.5% | | | |
| Auto Components - 1.1% | | | |
| Autoliv, Inc. | | 166,663 | 14,333,018 |
| Fox Factory Holding Corp. (a) | | 258,877 | 24,505,297 |
| Gentherm, Inc. (a) | | 309,418 | 19,976,026 |
| | | | 58,814,341 |
| Diversified Consumer Services - 1.4% | | | |
| Duolingo, Inc. (a)(b) | | 144,178 | 13,228,332 |
| Grand Canyon Education, Inc. (a) | | 288,744 | 27,739,636 |
| H&R Block, Inc. | | 488,528 | 19,521,579 |
| Rover Group, Inc. Class A (a)(b)(c) | | 2,437,923 | 10,653,724 |
| | | | 71,143,271 |
| Hotels, Restaurants & Leisure - 2.4% | | | |
| Churchill Downs, Inc. | | 180,670 | 37,904,566 |
| Dutch Bros, Inc. (b) | | 451,098 | 16,911,664 |
| Everi Holdings, Inc. (a) | | 881,497 | 16,933,557 |
| Kura Sushi U.S.A., Inc. Class A (a)(b) | | 185,923 | 15,699,338 |
| Lindblad Expeditions Holdings (a)(c) | | 3,166,339 | 25,014,078 |
| SeaWorld Entertainment, Inc. (a) | | 255,200 | 12,180,696 |
| | | | 124,643,899 |
| Household Durables - 0.7% | | | |
| GoPro, Inc. Class A (a) | | 1,799,915 | 11,447,459 |
| Helen of Troy Ltd. (a) | | 47,261 | 6,323,049 |
| Lovesac (a)(b) | | 687,857 | 21,433,624 |
| | | | 39,204,132 |
| Internet & Direct Marketing Retail - 0.3% | | | |
| BARK, Inc. (a)(b)(c) | | 2,112,748 | 3,021,230 |
| BARK, Inc. (a)(c)(d) | | 1,195,200 | 1,709,136 |
| BARK, Inc. warrants 8/29/25 (a)(c) | | 576,984 | 92,317 |
| Porch Group, Inc. Class A (a)(b) | | 3,189,020 | 6,154,809 |
| thredUP, Inc. (a) | | 1,201,224 | 2,702,754 |
| Xometry, Inc. | | 27,205 | 1,033,790 |
| | | | 14,714,036 |
| Specialty Retail - 3.7% | | | |
| Aritzia, Inc. (a) | | 1,008,200 | 31,807,645 |
| Boot Barn Holdings, Inc. (a) | | 136,200 | 8,485,260 |
| Dick's Sporting Goods, Inc. (b) | | 226,945 | 21,239,783 |
| Fanatics, Inc. Class A (d)(e) | | 726,062 | 46,918,126 |
| Five Below, Inc. (a) | | 105,889 | 13,455,315 |
| Floor & Decor Holdings, Inc. Class A (a)(b) | | 315,507 | 25,420,399 |
| Lithia Motors, Inc. Class A (sub. vtg.) (b) | | 63,793 | 16,923,007 |
| Williams-Sonoma, Inc. (b) | | 189,030 | 27,299,713 |
| | | | 191,549,248 |
| Textiles, Apparel & Luxury Goods - 1.9% | | | |
| Algolia, Inc. (d)(e) | | 234,640 | 4,310,337 |
| Crocs, Inc. (a) | | 1,010,060 | 72,360,694 |
| Kontoor Brands, Inc. | | 703,710 | 25,685,415 |
| | | | 102,356,446 |
|
| TOTAL CONSUMER DISCRETIONARY | | | 602,425,373 |
|
| CONSUMER STAPLES - 3.7% | | | |
| Beverages - 0.3% | | | |
| Boston Beer Co., Inc. Class A (a) | | 35,300 | 13,429,179 |
| Food & Staples Retailing - 3.1% | | | |
| BJ's Wholesale Club Holdings, Inc. (a) | | 651,684 | 44,119,007 |
| Grocery Outlet Holding Corp. (a)(b) | | 480,137 | 20,511,453 |
| Performance Food Group Co. (a) | | 1,183,386 | 58,826,118 |
| U.S. Foods Holding Corp. (a) | | 1,216,692 | 38,325,798 |
| | | | 161,782,376 |
| Food Products - 0.0% | | | |
| The Real Good Food Co. LLC: | | | |
| Class B (e) | | 248,958 | 2 |
| Class B unit (f) | | 248,958 | 1,618,227 |
| | | | 1,618,229 |
| Personal Products - 0.3% | | | |
| The Beauty Health Co. (a)(b) | | 1,138,082 | 15,159,252 |
|
| TOTAL CONSUMER STAPLES | | | 191,989,036 |
|
| ENERGY - 5.4% | | | |
| Energy Equipment & Services - 0.7% | | | |
| TechnipFMC PLC (a) | | 4,608,288 | 37,281,050 |
| Oil, Gas & Consumable Fuels - 4.7% | | | |
| Antero Resources Corp. (a) | | 1,203,248 | 47,696,751 |
| Civitas Resources, Inc. | | 224,454 | 13,233,808 |
| Denbury, Inc. (a) | | 497,105 | 35,746,821 |
| Enviva, Inc. | | 541,098 | 37,676,654 |
| Genesis Energy LP | | 3,223,658 | 32,204,343 |
| HF Sinclair Corp. | | 374,588 | 17,912,798 |
| Northern Oil & Gas, Inc. | | 489,453 | 14,110,930 |
| PDC Energy, Inc. | | 151,851 | 9,975,092 |
| Range Resources Corp. (a) | | 1,195,382 | 39,531,283 |
| | | | 248,088,480 |
|
| TOTAL ENERGY | | | 285,369,530 |
|
| FINANCIALS - 5.7% | | | |
| Banks - 1.8% | | | |
| East West Bancorp, Inc. | | 153,111 | 10,990,308 |
| First Interstate Bancsystem, Inc. | | 275,678 | 11,242,149 |
| Glacier Bancorp, Inc. | | 240,923 | 12,067,833 |
| Independent Bank Group, Inc. | | 124,962 | 8,837,313 |
| Metropolitan Bank Holding Corp. (a) | | 63,077 | 4,376,282 |
| PacWest Bancorp | | 389,072 | 10,905,688 |
| Pinnacle Financial Partners, Inc. | | 166,649 | 13,181,936 |
| Silvergate Capital Corp. (a) | | 170,646 | 15,919,565 |
| Starling Bank Ltd. Series D (a)(d)(e) | | 1,942,800 | 5,578,891 |
| | | | 93,099,965 |
| Capital Markets - 1.8% | | | |
| Impax Asset Management Group PLC | | 4,752 | 41,493 |
| Lazard Ltd. Class A | | 380,975 | 14,351,328 |
| LPL Financial | | 131,239 | 27,549,691 |
| Morningstar, Inc. | | 40,753 | 10,406,279 |
| Perella Weinberg Partners (a)(d) | | 2,039,500 | 14,378,475 |
| StepStone Group, Inc. Class A | | 743,449 | 19,805,481 |
| StoneX Group, Inc. (a) | | 98,443 | 8,577,339 |
| | | | 95,110,086 |
| Insurance - 1.7% | | | |
| American Financial Group, Inc. | | 204,618 | 27,353,334 |
| Assurant, Inc. | | 173,152 | 30,436,659 |
| BRP Group, Inc. (a)(b) | | 1,122,609 | 30,950,330 |
| | | | 88,740,323 |
| Thrifts & Mortgage Finance - 0.4% | | | |
| Walker & Dunlop, Inc. | | 197,591 | 22,256,650 |
|
| TOTAL FINANCIALS | | | 299,207,024 |
|
| HEALTH CARE - 23.9% | | | |
| Biotechnology - 7.8% | | | |
| 4D Molecular Therapeutics, Inc. (a)(b) | | 305,631 | 2,872,931 |
| ADC Therapeutics SA (a) | | 213,636 | 1,583,043 |
| ALX Oncology Holdings, Inc. (a)(b) | | 800,990 | 7,753,583 |
| Argenx SE ADR (a) | | 96,191 | 35,033,724 |
| Ascendis Pharma A/S sponsored ADR (a) | | 227,635 | 19,469,622 |
| Bicycle Therapeutics PLC ADR (a) | | 172,519 | 4,064,548 |
| Blueprint Medicines Corp. (a) | | 475,076 | 24,257,381 |
| Celldex Therapeutics, Inc. (a) | | 545,881 | 16,769,464 |
| Century Therapeutics, Inc. (a) | | 435,492 | 4,603,150 |
| Cyteir Therapeutics, Inc. (a) | | 642,162 | 1,868,691 |
| Cytokinetics, Inc. (a) | | 789,181 | 33,406,032 |
| Day One Biopharmaceuticals, Inc. (a) | | 506,574 | 8,677,613 |
| Erasca, Inc. | | 1,216,416 | 9,171,777 |
| Exelixis, Inc. (a) | | 705,503 | 14,759,123 |
| Global Blood Therapeutics, Inc. (a)(b) | | 640,134 | 20,945,184 |
| Graphite Bio, Inc. (a) | | 453,675 | 1,429,076 |
| Halozyme Therapeutics, Inc. (a) | | 302,034 | 14,769,463 |
| Imago BioSciences, Inc. | | 514,475 | 8,283,048 |
| Immunocore Holdings PLC ADR (a)(b) | | 321,548 | 14,836,225 |
| Instil Bio, Inc. (a) | | 1,587,336 | 8,952,575 |
| Janux Therapeutics, Inc. (a) | | 430,342 | 5,344,848 |
| Keros Therapeutics, Inc. (a) | | 267,627 | 8,585,474 |
| Monte Rosa Therapeutics, Inc. (a)(b) | | 642,654 | 5,828,872 |
| Morphic Holding, Inc. (a) | | 369,421 | 9,778,574 |
| Nuvalent, Inc. Class A (a) | | 545,683 | 8,108,849 |
| Prelude Therapeutics, Inc. (a) | | 694,139 | 3,470,695 |
| PTC Therapeutics, Inc. (a) | | 463,056 | 20,166,089 |
| Relay Therapeutics, Inc. (a)(b) | | 454,395 | 8,642,593 |
| Repare Therapeutics, Inc. (a)(b) | | 454,928 | 5,750,290 |
| Tango Therapeutics, Inc. (a) | | 499,400 | 2,042,546 |
| Tenaya Therapeutics, Inc. (a) | | 813,356 | 3,879,708 |
| Tyra Biosciences, Inc. | | 700,832 | 7,463,861 |
| United Therapeutics Corp. (a) | | 107,543 | 24,849,961 |
| Vaxcyte, Inc. (a) | | 256,586 | 5,922,005 |
| Vericel Corp. (a) | | 297,679 | 9,686,475 |
| Verve Therapeutics, Inc. (a)(b) | | 549,924 | 13,539,129 |
| Xenon Pharmaceuticals, Inc. (a) | | 348,595 | 11,555,924 |
| | | | 408,122,146 |
| Health Care Equipment & Supplies - 5.0% | | | |
| Angiodynamics, Inc. (a) | | 63,990 | 1,451,933 |
| Envista Holdings Corp. (a) | | 620,802 | 25,235,601 |
| Figs, Inc. Class A (a)(b) | | 4,176,950 | 44,150,362 |
| Globus Medical, Inc. (a)(b) | | 261,228 | 15,331,471 |
| Haemonetics Corp. (a) | | 406,944 | 28,278,539 |
| Insulet Corp. (a) | | 259,941 | 64,413,380 |
| Integer Holdings Corp. (a) | | 320,961 | 22,431,964 |
| LivaNova PLC (a) | | 266,242 | 16,951,628 |
| Minerva Surgical, Inc. | | 517,056 | 1,344,346 |
| NeuroPace, Inc. (a)(b) | | 1,164,662 | 6,824,919 |
| TransMedics Group, Inc. (a) | | 836,176 | 33,764,787 |
| | | | 260,178,930 |
| Health Care Providers & Services - 6.5% | | | |
| 1Life Healthcare, Inc. (a) | | 652,448 | 11,052,469 |
| Acadia Healthcare Co., Inc. (a) | | 639,373 | 53,010,415 |
| AdaptHealth Corp. (a) | | 647,198 | 14,309,548 |
| agilon health, Inc. (a)(b) | | 1,549,177 | 38,775,900 |
| Guardant Health, Inc. (a) | | 261,914 | 13,140,225 |
| Molina Healthcare, Inc. (a) | | 163,619 | 53,621,219 |
| Option Care Health, Inc. (a) | | 1,163,572 | 39,096,019 |
| Owens & Minor, Inc. | | 723,424 | 25,616,444 |
| R1 Rcm, Inc. (a) | | 1,738,361 | 43,459,025 |
| Surgery Partners, Inc. (a) | | 908,546 | 35,778,541 |
| Tenet Healthcare Corp. (a) | | 182,842 | 12,089,513 |
| | | | 339,949,318 |
| Health Care Technology - 2.6% | | | |
| Doximity, Inc. (a)(b) | | 279,872 | 11,844,183 |
| Evolent Health, Inc. (a) | | 1,095,412 | 37,233,054 |
| Inspire Medical Systems, Inc. (a) | | 207,060 | 43,273,469 |
| OptimizeRx Corp. (a)(b) | | 186,249 | 4,185,015 |
| Phreesia, Inc. (a) | | 1,316,282 | 30,919,464 |
| Schrodinger, Inc. (a) | | 222,140 | 6,952,982 |
| | | | 134,408,167 |
| Life Sciences Tools & Services - 1.0% | | | |
| Absci Corp. (b) | | 835,790 | 2,749,749 |
| Olink Holding AB ADR (a)(b) | | 876,589 | 11,790,122 |
| Syneos Health, Inc. (a) | | 372,286 | 29,462,714 |
| Veterinary Emergency Group LLC Class A (d)(e)(g) | | 190,561 | 9,980,404 |
| | | | 53,982,989 |
| Pharmaceuticals - 1.0% | | | |
| Arvinas Holding Co. LLC (a) | | 286,453 | 15,213,519 |
| DICE Therapeutics, Inc. (b) | | 511,092 | 8,811,226 |
| Edgewise Therapeutics, Inc. (a) | | 797,917 | 7,715,857 |
| Ikena Oncology, Inc. (a) | | 698,537 | 3,534,597 |
| NGM Biopharmaceuticals, Inc. (a) | | 369,315 | 5,347,681 |
| Pharvaris BV (a)(b) | | 698,859 | 14,745,925 |
| | | | 55,368,805 |
|
| TOTAL HEALTH CARE | | | 1,252,010,355 |
|
| INDUSTRIALS - 18.7% | | | |
| Aerospace & Defense - 1.7% | | | |
| AeroVironment, Inc. (a) | | 140,383 | 12,162,783 |
| BWX Technologies, Inc. | | 400,135 | 22,679,652 |
| Curtiss-Wright Corp. | | 291,612 | 41,828,825 |
| Dassault Aviation SA | | 77,100 | 10,992,608 |
| | | | 87,663,868 |
| Air Freight & Logistics - 0.6% | | | |
| Air Transport Services Group, Inc. (a) | | 584,325 | 18,312,746 |
| Hub Group, Inc. Class A (a) | | 178,906 | 13,668,418 |
| | | | 31,981,164 |
| Building Products - 1.8% | | | |
| Builders FirstSource, Inc. (a) | | 354,793 | 24,125,924 |
| Carlisle Companies, Inc. | | 70,116 | 20,761,348 |
| The AZEK Co., Inc. (a)(b) | | 1,089,630 | 22,533,548 |
| UFP Industries, Inc. | | 292,957 | 27,013,565 |
| | | | 94,434,385 |
| Commercial Services & Supplies - 0.7% | | | |
| Driven Brands Holdings, Inc. (a) | | 766,892 | 23,298,179 |
| HNI Corp. | | 395,083 | 13,954,332 |
| | | | 37,252,511 |
| Construction & Engineering - 2.0% | | | |
| EMCOR Group, Inc. | | 39,803 | 4,631,875 |
| NV5 Global, Inc. (a) | | 105,163 | 14,260,103 |
| Valmont Industries, Inc. | | 132,475 | 35,964,313 |
| Willscot Mobile Mini Holdings (a) | | 1,309,380 | 50,555,162 |
| | | | 105,411,453 |
| Electrical Equipment - 2.7% | | | |
| Acuity Brands, Inc. | | 114,305 | 20,849,232 |
| Array Technologies, Inc. (a)(b) | | 1,668,710 | 28,117,764 |
| Atkore, Inc. (a) | | 119,886 | 11,901,083 |
| nVent Electric PLC (b) | | 816,435 | 28,828,320 |
| Regal Rexnord Corp. | | 247,760 | 33,274,168 |
| Sunrun, Inc. (a) | | 492,900 | 16,112,901 |
| | | | 139,083,468 |
| Machinery - 2.9% | | | |
| Chart Industries, Inc. (a)(b) | | 69,644 | 13,586,848 |
| Crane Holdings Co. | | 441,531 | 43,680,662 |
| Federal Signal Corp. | | 663,192 | 27,535,732 |
| ITT, Inc. | | 228,620 | 17,153,359 |
| Mueller Industries, Inc. | | 373,404 | 25,141,291 |
| Terex Corp. (b) | | 689,100 | 23,091,741 |
| | | | 150,189,633 |
| Marine - 0.4% | | | |
| Kirby Corp. (a) | | 310,018 | 19,667,542 |
| Professional Services - 4.4% | | | |
| Alight, Inc. Class A (a) | | 2,129,037 | 16,052,939 |
| ASGN, Inc. (a) | | 343,890 | 35,682,026 |
| CACI International, Inc. Class A (a) | | 228,787 | 69,160,022 |
| CRA International, Inc. | | 10,066 | 996,635 |
| First Advantage Corp. (a) | | 353,852 | 4,964,544 |
| FTI Consulting, Inc. (a) | | 208,458 | 34,095,390 |
| Insperity, Inc. | | 29,630 | 3,251,596 |
| KBR, Inc. | | 962,914 | 51,255,912 |
| Korn Ferry | | 176,749 | 11,578,827 |
| TriNet Group, Inc. (a) | | 63,024 | 5,199,480 |
| | | | 232,237,371 |
| Trading Companies & Distributors - 1.5% | | | |
| Applied Industrial Technologies, Inc. | | 382,102 | 38,435,640 |
| Beacon Roofing Supply, Inc. (a) | | 534,091 | 32,056,142 |
| Custom Truck One Source, Inc. Class A (a)(b) | | 1,682,187 | 10,412,738 |
| | | | 80,904,520 |
|
| TOTAL INDUSTRIALS | | | 978,825,915 |
|
| INFORMATION TECHNOLOGY - 17.4% | | | |
| Communications Equipment - 0.7% | | | |
| Lumentum Holdings, Inc. (a)(b) | | 252,318 | 22,824,686 |
| NetScout Systems, Inc. (a) | | 363,788 | 12,943,577 |
| | | | 35,768,263 |
| Electronic Equipment & Components - 2.0% | | | |
| Fabrinet (a) | | 332,297 | 31,920,450 |
| Insight Enterprises, Inc. (a) | | 180,180 | 16,830,614 |
| TD SYNNEX Corp. | | 411,676 | 41,340,504 |
| Vontier Corp. | | 561,535 | 14,487,603 |
| | | | 104,579,171 |
| IT Services - 3.2% | | | |
| Concentrix Corp. | | 326,919 | 43,728,685 |
| ExlService Holdings, Inc. (a) | | 291,243 | 49,036,584 |
| Flywire Corp. (a) | | 207,324 | 4,863,821 |
| Genpact Ltd. | | 549,654 | 26,427,364 |
| Perficient, Inc. (a) | | 123,149 | 12,994,682 |
| Verra Mobility Corp. (a) | | 2,020,288 | 33,314,549 |
| | | | 170,365,685 |
| Semiconductors & Semiconductor Equipment - 3.3% | | | |
| AEHR Test Systems (a)(b) | | 604,759 | 6,900,300 |
| Cirrus Logic, Inc. (a) | | 346,585 | 29,619,154 |
| eMemory Technology, Inc. | | 278,000 | 11,015,527 |
| Lattice Semiconductor Corp. (a) | | 186,000 | 11,439,000 |
| MACOM Technology Solutions Holdings, Inc. (a) | | 503,133 | 29,151,526 |
| Nova Ltd. (a) | | 233,752 | 24,625,773 |
| SiTime Corp. (a) | | 338,388 | 62,933,400 |
| | | | 175,684,680 |
| Software - 6.9% | | | |
| Alkami Technology, Inc. (a)(b) | | 891,781 | 12,413,592 |
| Avalara, Inc. (a)(b) | | 222,632 | 19,462,489 |
| Braze, Inc. (b) | | 195,260 | 8,487,952 |
| CCC Intelligent Solutions Holdings, Inc. (a)(d) | | 48,511 | 484,625 |
| Confluent, Inc. (a)(b) | | 289,921 | 7,378,489 |
| CyberArk Software Ltd. (a)(b) | | 163,155 | 21,231,360 |
| DoubleVerify Holdings, Inc. (a)(b) | | 1,148,072 | 26,325,291 |
| Dynatrace, Inc. (a) | | 1,088,111 | 40,945,617 |
| Elastic NV (a) | | 384,820 | 30,743,270 |
| Five9, Inc. (a) | | 98,895 | 10,692,527 |
| GitLab, Inc. (b) | | 144,960 | 8,320,704 |
| KnowBe4, Inc. (a)(b) | | 2,099,071 | 29,995,725 |
| Rapid7, Inc. (a) | | 226,007 | 14,457,668 |
| Sprout Social, Inc. (a)(b) | | 943,800 | 49,171,980 |
| TECSYS, Inc. (b) | | 706,729 | 21,595,647 |
| Tenable Holdings, Inc. (a) | | 1,293,943 | 50,010,897 |
| WalkMe Ltd. (a)(b) | | 886,803 | 8,335,948 |
| | | | 360,053,781 |
| Technology Hardware, Storage & Peripherals - 1.3% | | | |
| Avid Technology, Inc. (a)(c) | | 2,341,997 | 65,716,436 |
|
| TOTAL INFORMATION TECHNOLOGY | | | 912,168,016 |
|
| MATERIALS - 4.3% | | | |
| Chemicals - 2.7% | | | |
| Cabot Corp. (b) | | 705,746 | 52,408,698 |
| Element Solutions, Inc. | | 1,007,607 | 19,910,314 |
| Huntsman Corp. | | 526,478 | 15,246,803 |
| The Chemours Co. LLC | | 718,592 | 25,574,689 |
| Valvoline, Inc. | | 865,611 | 27,889,986 |
| | | | 141,030,490 |
| Construction Materials - 0.2% | | | |
| Eagle Materials, Inc. | | 96,082 | 12,149,569 |
| Containers & Packaging - 0.6% | | | |
| Ardagh Metal Packaging SA (a)(d) | | 1,634,000 | 11,045,840 |
| O-I Glass, Inc. (a) | | 1,506,398 | 22,159,115 |
| | | | 33,204,955 |
| Metals & Mining - 0.8% | | | |
| Arconic Corp. (a) | | 446,631 | 13,492,723 |
| Iluka Resources Ltd. | | 3,589,528 | 24,362,208 |
| Sierra Rutile Holdings Ltd. (a) | | 3,589,528 | 806,574 |
| | | | 38,661,505 |
|
| TOTAL MATERIALS | | | 225,046,519 |
|
| REAL ESTATE - 0.5% | | | |
| Equity Real Estate Investment Trusts (REITs) - 0.2% | | | |
| Terreno Realty Corp. | | 150,786 | 9,446,743 |
| Real Estate Management & Development - 0.3% | | | |
| Compass, Inc. (a) | | 13 | 50 |
| Jones Lang LaSalle, Inc. (a) | | 101,342 | 19,322,879 |
| | | | 19,322,929 |
|
| TOTAL REAL ESTATE | | | 28,769,672 |
|
| UTILITIES - 1.1% | | | |
| Independent Power and Renewable Electricity Producers - 1.1% | | | |
| NextEra Energy Partners LP | | 149,886 | 12,401,568 |
| Sunnova Energy International, Inc. (a) | | 601,900 | 15,661,438 |
| Vistra Corp. | | 1,070,339 | 27,668,263 |
| | | | 55,731,269 |
| TOTAL COMMON STOCKS | | | |
| (Cost $4,878,557,152) | | | 5,076,594,864 |
|
| Convertible Preferred Stocks - 2.5% | | | |
| COMMUNICATION SERVICES - 0.2% | | | |
| Interactive Media & Services - 0.2% | | | |
| Reddit, Inc. Series F (d)(e) | | 253,500 | 9,972,690 |
| CONSUMER DISCRETIONARY - 0.0% | | | |
| Textiles, Apparel & Luxury Goods - 0.0% | | | |
| Algolia SAS Series D (d)(e) | | 53,800 | 988,306 |
| HEALTH CARE - 0.4% | | | |
| Biotechnology - 0.4% | | | |
| Bright Peak Therapeutics AG Series B (a)(d)(e) | | 1,079,522 | 2,482,901 |
| Caris Life Sciences, Inc. Series D (a)(d)(e) | | 780,603 | 4,324,541 |
| LifeMine Therapeutics, Inc. Series C (d)(e) | | 2,048,403 | 3,502,769 |
| Sonoma Biotherapeutics, Inc.: | | | |
| Series B (d)(e) | | 2,370,360 | 3,318,504 |
| Series B1 (d)(e) | | 1,264,171 | 1,769,839 |
| T-Knife Therapeutics, Inc. Series B (a)(d)(e) | | 1,097,257 | 3,489,277 |
| Treeline Biosciences Series A (d)(e) | | 115,000 | 545,100 |
| | | | 19,432,931 |
| Health Care Providers & Services - 0.0% | | | |
| Boundless Bio, Inc. Series B (a)(d)(e) | | 3,017,761 | 2,263,321 |
| Health Care Technology - 0.0% | | | |
| Wugen, Inc. Series B (a)(d)(e) | | 326,496 | 1,413,728 |
|
| TOTAL HEALTH CARE | | | 23,109,980 |
|
| INDUSTRIALS - 0.9% | | | |
| Construction & Engineering - 0.7% | | | |
| Beta Technologies, Inc.: | | | |
| Series A (a)(d)(e) | | 278,129 | 28,694,569 |
| Series B, 6.00% (d)(e) | | 85,106 | 8,780,386 |
| | | | 37,474,955 |
| Road & Rail - 0.2% | | | |
| Convoy, Inc. Series D (a)(d)(e) | | 913,444 | 9,901,733 |
|
| TOTAL INDUSTRIALS | | | 47,376,688 |
|
| INFORMATION TECHNOLOGY - 1.0% | | | |
| Communications Equipment - 0.4% | | | |
| Astranis Space Technologies Corp. Series C (a)(d)(e) | | 557,717 | 19,414,129 |
| IT Services - 0.4% | | | |
| Yanka Industries, Inc.: | | | |
| Series E (a)(d)(e) | | 869,641 | 17,366,731 |
| Series F (a)(d)(e) | | 127,716 | 2,550,489 |
| | | | 19,917,220 |
| Software - 0.2% | | | |
| Mountain Digital, Inc. Series D (d)(e) | | 729,676 | 10,653,270 |
| Skyryse, Inc. Series B (d)(e) | | 62,100 | 1,456,866 |
| | | | 12,110,136 |
|
| TOTAL INFORMATION TECHNOLOGY | | | 51,441,485 |
|
| TOTAL CONVERTIBLE PREFERRED STOCKS | | | |
| (Cost $140,835,839) | | | 132,889,149 |
|
| Investment Companies - 0.4% | | | |
| iShares Russell 2000 Growth Index ETF | | | |
| (Cost $19,013,360) | | 87,700 | 20,136,797 |
|
| Money Market Funds - 8.7% | | | |
| Fidelity Cash Central Fund 2.01% (h) | | 52,788,747 | 52,799,304 |
| Fidelity Securities Lending Cash Central Fund 2.01% (h)(i) | | 400,119,013 | 400,159,025 |
| TOTAL MONEY MARKET FUNDS | | | |
| (Cost $452,958,329) | | | 452,958,329 |
| TOTAL INVESTMENT IN SECURITIES - 108.5% | | | |
| (Cost $5,491,364,680) | | | 5,682,579,139 |
| NET OTHER ASSETS (LIABILITIES) - (8.5)% | | | (445,988,744) |
| NET ASSETS - 100% | | | $5,236,590,395 |
Security Type Abbreviations
ETF – Exchange-Traded Fund
Legend
(a) Non-income producing
(b) Security or a portion of the security is on loan at period end.
(c) Affiliated company
(d) Restricted securities (including private placements) - Investment in securities not registered under the Securities Act of 1933 (excluding 144A issues). At the end of the period, the value of restricted securities (excluding 144A issues) amounted to $227,294,983 or 4.3% of net assets.
(e) Level 3 security
(f) Security exempt from registration under Rule 144A of the Securities Act of 1933. These securities may be resold in transactions exempt from registration, normally to qualified institutional buyers. At the end of the period, the value of these securities amounted to $1,618,227 or 0.0% of net assets.
(g) Investment is owned by a wholly-owned subsidiary (Subsidiary) that is treated as a corporation for U.S. tax purposes.
(h) Affiliated fund that is generally available only to investment companies and other accounts managed by Fidelity Investments. The rate quoted is the annualized seven-day yield of the fund at period end. A complete unaudited listing of the fund's holdings as of its most recent quarter end is available upon request. In addition, each Fidelity Central Fund's financial statements, which are not covered by the Fund's Report of Independent Registered Public Accounting Firm, are available on the SEC's website or upon request.
(i) Investment made with cash collateral received from securities on loan.
Additional information on each restricted holding is as follows:
| Security | Acquisition Date | Acquisition Cost |
| Algolia SAS Series D | 7/23/21 | $1,573,384 |
| Algolia, Inc. | 10/27/21 | $6,862,059 |
| Ardagh Metal Packaging SA | 2/22/21 | $16,340,000 |
| Astranis Space Technologies Corp. Series C | 3/19/21 | $12,225,675 |
| BARK, Inc. | 12/17/20 | $11,952,000 |
| Beta Technologies, Inc. Series A | 4/9/21 | $20,378,512 |
| Beta Technologies, Inc. Series B, 6.00% | 4/4/22 | $8,780,386 |
| Boundless Bio, Inc. Series B | 4/23/21 | $4,073,977 |
| Bright Peak Therapeutics AG Series B | 5/14/21 | $4,216,613 |
| Caris Life Sciences, Inc. Series D | 5/11/21 | $6,322,884 |
| CCC Intelligent Solutions Holdings, Inc. | 2/2/21 | $485,110 |
| Convoy, Inc. Series D | 10/30/19 | $12,368,032 |
| Fanatics, Inc. Class A | 8/13/20 - 3/22/21 | $12,874,623 |
| LifeMine Therapeutics, Inc. Series C | 2/15/22 | $4,171,757 |
| Mountain Digital, Inc. Series D | 11/5/21 | $16,757,228 |
| Perella Weinberg Partners | 12/29/20 | $20,395,000 |
| Reddit, Inc. Series F | 8/11/21 | $15,664,880 |
| Skyryse, Inc. Series B | 10/21/21 | $1,532,626 |
| Sonoma Biotherapeutics, Inc. Series B | 7/26/21 | $4,684,542 |
| Sonoma Biotherapeutics, Inc. Series B1 | 7/26/21 | $3,747,635 |
| Starling Bank Ltd. Series D | 6/18/21 - 4/5/22 | $3,728,430 |
| T-Knife Therapeutics, Inc. Series B | 6/30/21 | $6,329,856 |
| Treeline Biosciences Series A | 7/30/21 | $900,163 |
| Veterinary Emergency Group LLC Class A | 9/16/21 - 3/17/22 | $9,331,366 |
| Wugen, Inc. Series B | 7/9/21 | $2,531,944 |
| Yanka Industries, Inc. Series E | 5/15/20 | $10,504,568 |
| Yanka Industries, Inc. Series F | 4/8/21 | $4,071,177 |
Affiliated Central Funds
Fiscal year to date information regarding the Fund's investments in Fidelity Central Funds, including the ownership percentage, is presented below.
| Fund | Value, beginning of period | Purchases | Sales Proceeds | Dividend Income | Realized Gain/Loss | Change in Unrealized appreciation (depreciation) | Value, end of period | % ownership, end of period |
| Fidelity Cash Central Fund 2.01% | $26,240,913 | $2,283,902,903 | $2,257,344,512 | $194,477 | $-- | $-- | $52,799,304 | 0.1% |
| Fidelity Securities Lending Cash Central Fund 2.01% | 318,547,474 | 2,105,985,780 | 2,024,374,229 | 4,358,888 | -- | -- | 400,159,025 | 1.1% |
| Total | $344,788,387 | $4,389,888,683 | $4,281,718,741 | $4,553,365 | $-- | $-- | $452,958,329 | |
Amounts in the income column in the above table include any capital gain distributions from underlying funds, which are presented in the corresponding line-item in the Statement of Operations, if applicable. Amount for Fidelity Securities Lending Cash Central Fund represents the income earned on investing cash collateral, less rebates paid to borrowers and any lending agent fees associated with the loan, plus any premium payments received for lending certain types of securities.
Other Affiliated Issuers
An affiliated company is a company in which the Fund has ownership of at least 5% of the voting securities. Fiscal year to date transactions with companies which are or were affiliates are presented in the table below. Certain corporate actions, such as mergers, are excluded from the amounts in this table if applicable.
| Affiliate | Value, beginning of period | Purchases | Sales Proceeds(a) | Dividend Income | Realized Gain (loss) | Change in Unrealized appreciation (depreciation) | Value, end of period |
| Avid Technology, Inc. | $18,283,710 | $56,355,126 | $350,821 | $-- | $6,068 | $(8,577,647) | $65,716,436 |
| BARK, Inc. | 14,024,018 | 12,546,364 | 4,750,936 | -- | (6,572,082) | (12,226,134) | 3,021,230 |
| BARK, Inc. | 9,621,360 | -- | -- | -- | -- | (7,912,224) | 1,709,136 |
| BARK, Inc. warrants 8/29/25 | 1,184,462 | -- | 2,070 | -- | (7,661) | (1,082,414) | 92,317 |
| Lindblad Expeditions Holdings | 57,591,585 | -- | 12,602,357 | -- | (6,195,305) | (13,779,845) | 25,014,078 |
| Lovesac | 56,334,031 | 4,084,596 | 14,033,951 | -- | (7,279,721) | (17,671,331) | -- |
| ProQR Therapeutics BV | 18,598,393 | 582,602 | 6,715,595 | -- | (17,992,361) | 5,526,961 | -- |
| Rover Group, Inc. Class A | -- | 15,829,173 | 39,050 | -- | (11,253) | (5,125,146) | 10,653,724 |
| Total | $175,637,559 | $89,397,861 | $38,494,780 | $-- | $(38,052,315) | $(60,847,780) | $106,206,921 |
(a) Includes the value of securities delivered through in-kind transactions, if applicable.
Investment Valuation
The following is a summary of the inputs used, as of July 31, 2022, involving the Fund's assets and liabilities carried at fair value. The inputs or methodology used for valuing securities may not be an indication of the risk associated with investing in those securities. For more information on valuation inputs, and their aggregation into the levels used below, please refer to the Investment Valuation section in the accompanying Notes to Financial Statements.
| | Valuation Inputs at Reporting Date: |
| Description | Total | Level 1 | Level 2 | Level 3 |
| Investments in Securities: | | | | |
| Equities: | | | | |
| Communication Services | $255,024,845 | $245,052,155 | $-- | $9,972,690 |
| Consumer Discretionary | 603,413,679 | 551,196,910 | -- | 52,216,769 |
| Consumer Staples | 191,989,036 | 191,989,034 | -- | 2 |
| Energy | 285,369,530 | 285,369,530 | -- | -- |
| Financials | 299,207,024 | 293,628,133 | -- | 5,578,891 |
| Health Care | 1,275,120,335 | 1,242,029,951 | -- | 33,090,384 |
| Industrials | 1,026,202,603 | 978,825,915 | -- | 47,376,688 |
| Information Technology | 963,609,501 | 901,152,489 | 11,015,527 | 51,441,485 |
| Materials | 225,046,519 | 199,877,737 | 25,168,782 | -- |
| Real Estate | 28,769,672 | 28,769,672 | -- | -- |
| Utilities | 55,731,269 | 55,731,269 | -- | -- |
| Investment Companies | 20,136,797 | 20,136,797 | -- | -- |
| Money Market Funds | 452,958,329 | 452,958,329 | -- | -- |
| Total Investments in Securities: | $5,682,579,139 | $5,446,717,921 | $36,184,309 | $199,676,909 |
The following is a reconciliation of Investments in Securities for which Level 3 inputs were used in determining value:
| Investments in Securities: | |
| Beginning Balance | $141,867,091 |
| Net Realized Gain (Loss) on Investment Securities | -- |
| Net Unrealized Gain (Loss) on Investment Securities | (3,507,090) |
| Cost of Purchases | 63,706,908 |
| Proceeds of Sales | (2,390,000) |
| Amortization/Accretion | -- |
| Transfers into Level 3 | -- |
| Transfers out of Level 3 | -- |
| Ending Balance | $199,676,909 |
| The change in unrealized gain (loss) for the period attributable to Level 3 securities held at July 31, 2022 | $(3,507,090) |
The information used in the above reconciliation represents fiscal year to date activity for any Investments in Securities identified as using Level 3 inputs at either the beginning or the end of the current fiscal period. Transfers into Level 3 were attributable to a lack of observable market data resulting from decreases in market activity, decreases in liquidity, security restructurings or corporate actions. Transfers out of Level 3 were attributable to observable market data becoming available for those securities. Cost of purchases and proceeds of sales may include securities received and/or delivered through in-kind transactions. Transfers in or out of Level 3 represent the beginning value of any Security or Instrument where a change in the pricing level occurred from the beginning to the end of the period. The cost of purchases and the proceeds of sales may include securities received or delivered through corporate actions or exchanges. Realized and unrealized gains (losses) disclosed in the reconciliation are included in Net Gain (Loss) on the Fund's Statement of Operations.
See accompanying notes which are an integral part of the financial statements.
Financial Statements
Statement of Assets and Liabilities
| | | July 31, 2022 |
| Assets | | |
Investment in securities, at value (including securities loaned of $394,655,985) — See accompanying schedule:
Unaffiliated issuers (cost $4,881,639,047) | $5,123,413,889 | |
| Fidelity Central Funds (cost $452,958,329) | 452,958,329 | |
| Other affiliated issuers (cost $156,767,304) | 106,206,921 | |
| Total Investment in Securities (cost $5,491,364,680) | | $5,682,579,139 |
| Cash | | 353,828 |
| Receivable for investments sold | | 38,728,065 |
| Receivable for fund shares sold | | 2,841,834 |
| Dividends receivable | | 1,297,177 |
| Distributions receivable from Fidelity Central Funds | | 854,081 |
| Other receivables | | 3 |
| Total assets | | 5,726,654,127 |
| Liabilities | | |
| Payable to custodian bank | $591 | |
| Payable for investments purchased | 82,669,118 | |
| Payable for fund shares redeemed | 2,746,255 | |
| Accrued management fee | 3,635,794 | |
| Distribution and service plan fees payable | 131,299 | |
| Other affiliated payables | 667,336 | |
| Other payables and accrued expenses | 65,263 | |
| Collateral on securities loaned | 400,148,076 | |
| Total liabilities | | 490,063,732 |
| Net Assets | | $5,236,590,395 |
| Net Assets consist of: | | |
| Paid in capital | | $5,317,721,484 |
| Total accumulated earnings (loss) | | (81,131,089) |
| Net Assets | | $5,236,590,395 |
| Net Asset Value and Maximum Offering Price | | |
| Class A: | | |
| Net Asset Value and redemption price per share ($287,904,678 ÷ 12,453,475 shares)(a) | | $23.12 |
| Maximum offering price per share (100/94.25 of $23.12) | | $24.53 |
| Class M: | | |
| Net Asset Value and redemption price per share ($70,182,020 ÷ 3,214,623 shares)(a) | | $21.83 |
| Maximum offering price per share (100/96.50 of $21.83) | | $22.62 |
| Class C: | | |
| Net Asset Value and offering price per share ($59,767,853 ÷ 3,161,711 shares)(a) | | $18.90 |
| Small Cap Growth: | | |
| Net Asset Value, offering price and redemption price per share ($2,747,001,879 ÷ 110,707,806 shares) | | $24.81 |
| Class I: | | |
| Net Asset Value, offering price and redemption price per share ($606,422,071 ÷ 24,359,014 shares) | | $24.90 |
| Class Z: | | |
| Net Asset Value, offering price and redemption price per share ($1,465,311,894 ÷ 58,511,705 shares) | | $25.04 |
(a) Redemption price per share is equal to net asset value less any applicable contingent deferred sales charge.
See accompanying notes which are an integral part of the financial statements.
Statement of Operations
| | | Year ended July 31, 2022 |
| Investment Income | | |
| Dividends | | $35,671,912 |
| Interest | | 5,755 |
| Income from Fidelity Central Funds (including $4,358,888 from security lending) | | 4,553,365 |
| Total income | | 40,231,032 |
| Expenses | | |
| Management fee | | |
| Basic fee | $39,887,116 | |
| Performance adjustment | 9,620,333 | |
| Transfer agent fees | 7,899,398 | |
| Distribution and service plan fees | 2,038,974 | |
| Accounting fees | 1,097,884 | |
| Custodian fees and expenses | 83,620 | |
| Independent trustees' fees and expenses | 19,832 | |
| Registration fees | 176,971 | |
| Audit | 60,066 | |
| Legal | 14,740 | |
| Interest | 6,630 | |
| Miscellaneous | 20,190 | |
| Total expenses before reductions | 60,925,754 | |
| Expense reductions | (186,524) | |
| Total expenses after reductions | | 60,739,230 |
| Net investment income (loss) | | (20,508,198) |
| Realized and Unrealized Gain (Loss) | | |
| Net realized gain (loss) on: | | |
| Investment securities: | | |
| Unaffiliated issuers | 26,591,993 | |
| Affiliated issuers | (38,052,315) | |
| Foreign currency transactions | (34,867) | |
| Total net realized gain (loss) | | (11,495,189) |
| Change in net unrealized appreciation (depreciation) on: | | |
| Investment securities: | | |
| Unaffiliated issuers | (1,260,950,927) | |
| Affiliated issuers | (60,847,780) | |
| Unfunded commitments | 2,227,006 | |
| Assets and liabilities in foreign currencies | (6,718) | |
| Total change in net unrealized appreciation (depreciation) | | (1,319,578,419) |
| Net gain (loss) | | (1,331,073,608) |
| Net increase (decrease) in net assets resulting from operations | | $(1,351,581,806) |
See accompanying notes which are an integral part of the financial statements.
Statement of Changes in Net Assets
| | Year ended July 31, 2022 | Year ended July 31, 2021 |
| Increase (Decrease) in Net Assets | | |
| Operations | | |
| Net investment income (loss) | $(20,508,198) | $(31,333,822) |
| Net realized gain (loss) | (11,495,189) | 1,190,258,956 |
| Change in net unrealized appreciation (depreciation) | (1,319,578,419) | 630,831,031 |
| Net increase (decrease) in net assets resulting from operations | (1,351,581,806) | 1,789,756,165 |
| Distributions to shareholders | (1,068,881,678) | (414,291,138) |
| Share transactions - net increase (decrease) | 1,399,956,604 | 886,906,306 |
| Total increase (decrease) in net assets | (1,020,506,880) | 2,262,371,333 |
| Net Assets | | |
| Beginning of period | 6,257,097,275 | 3,994,725,942 |
| End of period | $5,236,590,395 | $6,257,097,275 |
See accompanying notes which are an integral part of the financial statements.
Financial Highlights
Fidelity Small Cap Growth Fund Class A
| Years ended July 31, | 2022 | 2021 | 2020 | 2019 | 2018 |
| Selected Per–Share Data | | | | | |
| Net asset value, beginning of period | $34.89 | $26.64 | $26.03 | $27.45 | $22.99 |
| Income from Investment Operations | | | | | |
| Net investment income (loss)A,B | (.17) | (.26)C | (.20) | (.21) | (.18) |
| Net realized and unrealized gain (loss) | (5.58) | 11.27 | 2.26 | 1.79 | 6.32 |
| Total from investment operations | (5.75) | 11.01 | 2.06 | 1.58 | 6.14 |
| Distributions from net realized gain | (6.02) | (2.76) | (1.45) | (3.00) | (1.68) |
| Total distributions | (6.02) | (2.76) | (1.45) | (3.00) | (1.68) |
| Redemption fees added to paid in capitalA | – | – | – | – | –D |
| Net asset value, end of period | $23.12 | $34.89 | $26.64 | $26.03 | $27.45 |
| Total ReturnE,F | (20.62)% | 44.21% | 8.39% | 5.88% | 28.47% |
| Ratios to Average Net AssetsB,G,H | | | | | |
| Expenses before reductions | 1.29% | 1.29% | 1.37% | 1.33% | 1.31% |
| Expenses net of fee waivers, if any | 1.29% | 1.29% | 1.37% | 1.33% | 1.31% |
| Expenses net of all reductions | 1.29% | 1.28% | 1.36% | 1.32% | 1.30% |
| Net investment income (loss) | (.61)% | (.82)%C | (.80)% | (.85)% | (.74)% |
| Supplemental Data | | | | | |
| Net assets, end of period (000 omitted) | $287,905 | $387,793 | $268,448 | $285,554 | $315,894 |
| Portfolio turnover rateI | 79%J | 107% | 126%J | 91%J | 106%J |
A Calculated based on average shares outstanding during the period.
B Net investment income (loss) is affected by the timing of the declaration of dividends by any underlying mutual funds or exchange-traded funds (ETFs). Net investment income (loss) of any such underlying funds is not included in the Fund's net investment income (loss) ratio.
C Net investment income per share reflects one or more large, non-recurring dividend(s) which amounted to $.03 per share. Excluding such non-recurring dividend(s), the ratio of net investment income (loss) to average net assets would have been (.91) %.
D Amount represents less than $.005 per share.
E Total returns would have been lower if certain expenses had not been reduced during the applicable periods shown.
F Total returns do not include the effect of the sales charges.
G Fees and expenses of any underlying mutual funds or exchange-traded funds (ETFs) are not included in the Fund's expense ratio. The Fund indirectly bears its proportionate share of these expenses. For additional expense information related to investments in Fidelity Central Funds, please refer to the "Investments in Fidelity Central Funds" note found in the Notes to Financial Statements section of the most recent Annual or Semi-Annual report.
H Expense ratios reflect operating expenses of the class. Expenses before reductions do not reflect amounts reimbursed, waived, or reduced through arrangements with the investment adviser, brokerage services, or other offset arrangements, if applicable, and do not represent the amount paid by the class during periods when reimbursements, waivers or reductions occur.
I Amount does not include the portfolio activity of any underlying mutual funds or exchange-traded funds (ETFs).
J Portfolio turnover rate excludes securities received or delivered in-kind.
See accompanying notes which are an integral part of the financial statements.
Fidelity Small Cap Growth Fund Class M
| Years ended July 31, | 2022 | 2021 | 2020 | 2019 | 2018 |
| Selected Per–Share Data | | | | | |
| Net asset value, beginning of period | $33.27 | $25.56 | $25.09 | $26.59 | $22.35 |
| Income from Investment Operations | | | | | |
| Net investment income (loss)A,B | (.22) | (.33)C | (.25) | (.26) | (.24) |
| Net realized and unrealized gain (loss) | (5.28) | 10.77 | 2.17 | 1.72 | 6.13 |
| Total from investment operations | (5.50) | 10.44 | 1.92 | 1.46 | 5.89 |
| Distributions from net realized gain | (5.94) | (2.73) | (1.45) | (2.96) | (1.65) |
| Total distributions | (5.94) | (2.73) | (1.45) | (2.96) | (1.65) |
| Redemption fees added to paid in capitalA | – | – | – | – | –D |
| Net asset value, end of period | $21.83 | $33.27 | $25.56 | $25.09 | $26.59 |
| Total ReturnE,F | (20.85)% | 43.82% | 8.14% | 5.60% | 28.15% |
| Ratios to Average Net AssetsB,G,H | | | | | |
| Expenses before reductions | 1.54% | 1.55% | 1.63% | 1.60% | 1.58% |
| Expenses net of fee waivers, if any | 1.54% | 1.55% | 1.63% | 1.60% | 1.58% |
| Expenses net of all reductions | 1.54% | 1.53% | 1.62% | 1.59% | 1.57% |
| Net investment income (loss) | (.86)% | (1.08)%C | (1.06)% | (1.12)% | (1.01)% |
| Supplemental Data | | | | | |
| Net assets, end of period (000 omitted) | $70,182 | $98,005 | $70,605 | $75,030 | $82,567 |
| Portfolio turnover rateI | 79%J | 107% | 126%J | 91%J | 106%J |
A Calculated based on average shares outstanding during the period.
B Net investment income (loss) is affected by the timing of the declaration of dividends by any underlying mutual funds or exchange-traded funds (ETFs). Net investment income (loss) of any such underlying funds is not included in the Fund's net investment income (loss) ratio.
C Net investment income per share reflects one or more large, non-recurring dividend(s) which amounted to $.03 per share. Excluding such non-recurring dividend(s), the ratio of net investment income (loss) to average net assets would have been (1.17) %.
D Amount represents less than $.005 per share.
E Total returns would have been lower if certain expenses had not been reduced during the applicable periods shown.
F Total returns do not include the effect of the sales charges.
G Fees and expenses of any underlying mutual funds or exchange-traded funds (ETFs) are not included in the Fund's expense ratio. The Fund indirectly bears its proportionate share of these expenses. For additional expense information related to investments in Fidelity Central Funds, please refer to the "Investments in Fidelity Central Funds" note found in the Notes to Financial Statements section of the most recent Annual or Semi-Annual report.
H Expense ratios reflect operating expenses of the class. Expenses before reductions do not reflect amounts reimbursed, waived, or reduced through arrangements with the investment adviser, brokerage services, or other offset arrangements, if applicable, and do not represent the amount paid by the class during periods when reimbursements, waivers or reductions occur.
I Amount does not include the portfolio activity of any underlying mutual funds or exchange-traded funds (ETFs).
J Portfolio turnover rate excludes securities received or delivered in-kind.
See accompanying notes which are an integral part of the financial statements.
Fidelity Small Cap Growth Fund Class C
| Years ended July 31, | 2022 | 2021 | 2020 | 2019 | 2018 |
| Selected Per–Share Data | | | | | |
| Net asset value, beginning of period | $29.58 | $23.07 | $22.89 | $24.56 | $20.83 |
| Income from Investment Operations | | | | | |
| Net investment income (loss)A,B | (.31) | (.43)C | (.34) | (.35) | (.34) |
| Net realized and unrealized gain (loss) | (4.54) | 9.62 | 1.97 | 1.58 | 5.69 |
| Total from investment operations | (4.85) | 9.19 | 1.63 | 1.23 | 5.35 |
| Distributions from net realized gain | (5.83) | (2.68) | (1.45) | (2.90) | (1.62) |
| Total distributions | (5.83) | (2.68) | (1.45) | (2.90) | (1.62) |
| Redemption fees added to paid in capitalA | – | – | – | – | –D |
| Net asset value, end of period | $18.90 | $29.58 | $23.07 | $22.89 | $24.56 |
| Total ReturnE,F | (21.24)% | 43.07% | 7.62% | 5.06% | 27.51% |
| Ratios to Average Net AssetsB,G,H | | | | | |
| Expenses before reductions | 2.05% | 2.06% | 2.13% | 2.09% | 2.07% |
| Expenses net of fee waivers, if any | 2.05% | 2.06% | 2.13% | 2.09% | 2.07% |
| Expenses net of all reductions | 2.05% | 2.05% | 2.12% | 2.08% | 2.06% |
| Net investment income (loss) | (1.37)% | (1.59)%C | (1.56)% | (1.61)% | (1.50)% |
| Supplemental Data | | | | | |
| Net assets, end of period (000 omitted) | $59,768 | $88,239 | $77,850 | $96,449 | $139,375 |
| Portfolio turnover rateI | 79%J | 107% | 126%J | 91%J | 106%J |
A Calculated based on average shares outstanding during the period.
B Net investment income (loss) is affected by the timing of the declaration of dividends by any underlying mutual funds or exchange-traded funds (ETFs). Net investment income (loss) of any such underlying funds is not included in the Fund's net investment income (loss) ratio.
C Net investment income per share reflects one or more large, non-recurring dividend(s) which amounted to $.02 per share. Excluding such non-recurring dividend(s), the ratio of net investment income (loss) to average net assets would have been (1.68) %.
D Amount represents less than $.005 per share.
E Total returns would have been lower if certain expenses had not been reduced during the applicable periods shown.
F Total returns do not include the effect of the contingent deferred sales charge.
G Fees and expenses of any underlying mutual funds or exchange-traded funds (ETFs) are not included in the Fund's expense ratio. The Fund indirectly bears its proportionate share of these expenses. For additional expense information related to investments in Fidelity Central Funds, please refer to the "Investments in Fidelity Central Funds" note found in the Notes to Financial Statements section of the most recent Annual or Semi-Annual report.
H Expense ratios reflect operating expenses of the class. Expenses before reductions do not reflect amounts reimbursed, waived, or reduced through arrangements with the investment adviser, brokerage services, or other offset arrangements, if applicable, and do not represent the amount paid by the class during periods when reimbursements, waivers or reductions occur.
I Amount does not include the portfolio activity of any underlying mutual funds or exchange-traded funds (ETFs).
J Portfolio turnover rate excludes securities received or delivered in-kind.
See accompanying notes which are an integral part of the financial statements.
Fidelity Small Cap Growth Fund
| Years ended July 31, | 2022 | 2021 | 2020 | 2019 | 2018 |
| Selected Per–Share Data | | | | | |
| Net asset value, beginning of period | $37.02 | $28.07 | $27.27 | $28.59 | $23.84 |
| Income from Investment Operations | | | | | |
| Net investment income (loss)A,B | (.10) | (.18)C | (.13) | (.15) | (.12) |
| Net realized and unrealized gain (loss) | (6.00) | 11.92 | 2.38 | 1.87 | 6.57 |
| Total from investment operations | (6.10) | 11.74 | 2.25 | 1.72 | 6.45 |
| Distributions from net realized gain | (6.11) | (2.79) | (1.45) | (3.04) | (1.70) |
| Total distributions | (6.11) | (2.79) | (1.45) | (3.04) | (1.70) |
| Redemption fees added to paid in capitalA | – | – | – | – | –D |
| Net asset value, end of period | $24.81 | $37.02 | $28.07 | $27.27 | $28.59 |
| Total ReturnE | (20.42)% | 44.60% | 8.72% | 6.17% | 28.81% |
| Ratios to Average Net AssetsB,F,G | | | | | |
| Expenses before reductions | 1.02% | 1.00% | 1.08% | 1.05% | 1.02% |
| Expenses net of fee waivers, if any | 1.01% | 1.00% | 1.08% | 1.05% | 1.02% |
| Expenses net of all reductions | 1.01% | .99% | 1.07% | 1.04% | 1.01% |
| Net investment income (loss) | (.33)% | (.53)%C | (.52)% | (.57)% | (.45)% |
| Supplemental Data | | | | | |
| Net assets, end of period (000 omitted) | $2,747,002 | $4,540,695 | $2,839,506 | $2,888,038 | $3,269,548 |
| Portfolio turnover rateH | 79%I | 107% | 126%I | 91%I | 106%I |
A Calculated based on average shares outstanding during the period.
B Net investment income (loss) is affected by the timing of the declaration of dividends by any underlying mutual funds or exchange-traded funds (ETFs). Net investment income (loss) of any such underlying funds is not included in the Fund's net investment income (loss) ratio.
C Net investment income per share reflects one or more large, non-recurring dividend(s) which amounted to $.03 per share. Excluding such non-recurring dividend(s), the ratio of net investment income (loss) to average net assets would have been (.62) %.
D Amount represents less than $.005 per share.
E Total returns would have been lower if certain expenses had not been reduced during the applicable periods shown.
F Fees and expenses of any underlying mutual funds or exchange-traded funds (ETFs) are not included in the Fund's expense ratio. The Fund indirectly bears its proportionate share of these expenses. For additional expense information related to investments in Fidelity Central Funds, please refer to the "Investments in Fidelity Central Funds" note found in the Notes to Financial Statements section of the most recent Annual or Semi-Annual report.
G Expense ratios reflect operating expenses of the class. Expenses before reductions do not reflect amounts reimbursed, waived, or reduced through arrangements with the investment adviser, brokerage services, or other offset arrangements, if applicable, and do not represent the amount paid by the class during periods when reimbursements, waivers or reductions occur.
H Amount does not include the portfolio activity of any underlying mutual funds or exchange-traded funds (ETFs).
I Portfolio turnover rate excludes securities received or delivered in-kind.
See accompanying notes which are an integral part of the financial statements.
Fidelity Small Cap Growth Fund Class I
| Years ended July 31, | 2022 | 2021 | 2020 | 2019 | 2018 |
| Selected Per–Share Data | | | | | |
| Net asset value, beginning of period | $37.13 | $28.15 | $27.35 | $28.66 | $23.90 |
| Income from Investment Operations | | | | | |
| Net investment income (loss)A,B | (.10) | (.19)C | (.14) | (.15) | (.12) |
| Net realized and unrealized gain (loss) | (6.03) | 11.96 | 2.39 | 1.88 | 6.58 |
| Total from investment operations | (6.13) | 11.77 | 2.25 | 1.73 | 6.46 |
| Distributions from net realized gain | (6.10) | (2.79) | (1.45) | (3.04) | (1.70) |
| Total distributions | (6.10) | (2.79) | (1.45) | (3.04) | (1.70) |
| Redemption fees added to paid in capitalA | – | – | – | – | –D |
| Net asset value, end of period | $24.90 | $37.13 | $28.15 | $27.35 | $28.66 |
| Total ReturnE | (20.42)% | 44.57% | 8.70% | 6.18% | 28.78% |
| Ratios to Average Net AssetsB,F,G | | | | | |
| Expenses before reductions | 1.04% | 1.04% | 1.11% | 1.06% | 1.03% |
| Expenses net of fee waivers, if any | 1.03% | 1.04% | 1.11% | 1.06% | 1.03% |
| Expenses net of all reductions | 1.03% | 1.03% | 1.10% | 1.06% | 1.02% |
| Net investment income (loss) | (.35)% | (.57)%C | (.54)% | (.58)% | (.46)% |
| Supplemental Data | | | | | |
| Net assets, end of period (000 omitted) | $606,422 | $775,746 | $540,553 | $590,311 | $678,576 |
| Portfolio turnover rateH | 79%I | 107% | 126%I | 91%I | 106%I |
A Calculated based on average shares outstanding during the period.
B Net investment income (loss) is affected by the timing of the declaration of dividends by any underlying mutual funds or exchange-traded funds (ETFs). Net investment income (loss) of any such underlying funds is not included in the Fund's net investment income (loss) ratio.
C Net investment income per share reflects one or more large, non-recurring dividend(s) which amounted to $.03 per share. Excluding such non-recurring dividend(s), the ratio of net investment income (loss) to average net assets would have been (.66) %.
D Amount represents less than $.005 per share.
E Total returns would have been lower if certain expenses had not been reduced during the applicable periods shown.
F Fees and expenses of any underlying mutual funds or exchange-traded funds (ETFs) are not included in the Fund's expense ratio. The Fund indirectly bears its proportionate share of these expenses. For additional expense information related to investments in Fidelity Central Funds, please refer to the "Investments in Fidelity Central Funds" note found in the Notes to Financial Statements section of the most recent Annual or Semi-Annual report.
G Expense ratios reflect operating expenses of the class. Expenses before reductions do not reflect amounts reimbursed, waived, or reduced through arrangements with the investment adviser, brokerage services, or other offset arrangements, if applicable, and do not represent the amount paid by the class during periods when reimbursements, waivers or reductions occur.
H Amount does not include the portfolio activity of any underlying mutual funds or exchange-traded funds (ETFs).
I Portfolio turnover rate excludes securities received or delivered in-kind.
See accompanying notes which are an integral part of the financial statements.
Fidelity Small Cap Growth Fund Class Z
| Years ended July 31, | 2022 | 2021 | 2020 | 2019 | 2018 |
| Selected Per–Share Data | | | | | |
| Net asset value, beginning of period | $37.32 | $28.26 | $27.41 | $28.71 | $23.91 |
| Income from Investment Operations | | | | | |
| Net investment income (loss)A,B | (.06) | (.15)C | (.10) | (.11) | (.09) |
| Net realized and unrealized gain (loss) | (6.06) | 12.01 | 2.40 | 1.87 | 6.61 |
| Total from investment operations | (6.12) | 11.86 | 2.30 | 1.76 | 6.52 |
| Distributions from net realized gain | (6.16) | (2.80) | (1.45) | (3.06) | (1.72) |
| Total distributions | (6.16) | (2.80) | (1.45) | (3.06) | (1.72) |
| Redemption fees added to paid in capitalA | – | – | – | – | –D |
| Net asset value, end of period | $25.04 | $37.32 | $28.26 | $27.41 | $28.71 |
| Total ReturnE | (20.33)% | 44.75% | 8.87% | 6.29% | 29.02% |
| Ratios to Average Net AssetsB,F,G | | | | | |
| Expenses before reductions | .90% | .90% | .97% | .92% | .89% |
| Expenses net of fee waivers, if any | .90% | .90% | .96% | .92% | .89% |
| Expenses net of all reductions | .90% | .89% | .95% | .92% | .88% |
| Net investment income (loss) | (.22)% | (.43)%C | (.40)% | (.44)% | (.32)% |
| Supplemental Data | | | | | |
| Net assets, end of period (000 omitted) | $1,465,312 | $366,620 | $197,764 | $183,552 | $132,928 |
| Portfolio turnover rateH | 79%I | 107% | 126%I | 91%I | 106%I |
A Calculated based on average shares outstanding during the period.
B Net investment income (loss) is affected by the timing of the declaration of dividends by any underlying mutual funds or exchange-traded funds (ETFs). Net investment income (loss) of any such underlying funds is not included in the Fund's net investment income (loss) ratio.
C Net investment income per share reflects one or more large, non-recurring dividend(s) which amounted to $.03 per share. Excluding such non-recurring dividend(s), the ratio of net investment income (loss) to average net assets would have been (.52) %.
D Amount represents less than $.005 per share.
E Total returns would have been lower if certain expenses had not been reduced during the applicable periods shown.
F Fees and expenses of any underlying mutual funds or exchange-traded funds (ETFs) are not included in the Fund's expense ratio. The Fund indirectly bears its proportionate share of these expenses. For additional expense information related to investments in Fidelity Central Funds, please refer to the "Investments in Fidelity Central Funds" note found in the Notes to Financial Statements section of the most recent Annual or Semi-Annual report.
G Expense ratios reflect operating expenses of the class. Expenses before reductions do not reflect amounts reimbursed, waived, or reduced through arrangements with the investment adviser, brokerage services, or other offset arrangements, if applicable, and do not represent the amount paid by the class during periods when reimbursements, waivers or reductions occur.
H Amount does not include the portfolio activity of any underlying mutual funds or exchange-traded funds (ETFs).
I Portfolio turnover rate excludes securities received or delivered in-kind.
See accompanying notes which are an integral part of the financial statements.
Notes to Financial Statements
For the period ended July 31, 2022
1. Organization.
Fidelity Small Cap Growth Fund (the Fund) is a fund of Fidelity Securities Fund (the Trust) and is authorized to issue an unlimited number of shares. The Trust is registered under the Investment Company Act of 1940, as amended (the 1940 Act), as an open-end management investment company organized as a Massachusetts business trust. The Fund offers Class A, Class M, Class C, Fidelity Small Cap Growth, Class I and Class Z shares, each of which has equal rights as to assets and voting privileges. Each class has exclusive voting rights with respect to matters that affect that class. Class C shares will automatically convert to Class A shares after a holding period of eight years from the initial date of purchase, with certain exceptions.
2. Investments in Fidelity Central Funds.
Funds may invest in Fidelity Central Funds, which are open-end investment companies generally available only to other investment companies and accounts managed by the investment adviser and its affiliates. The Schedule of Investments lists any Fidelity Central Funds held as an investment as of period end, but does not include the underlying holdings of each Fidelity Central Fund. An investing fund indirectly bears its proportionate share of the expenses of the underlying Fidelity Central Funds.
Based on its investment objective, each Fidelity Central Fund may invest or participate in various investment vehicles or strategies that are similar to those of the investing fund. These strategies are consistent with the investment objectives of the investing fund and may involve certain economic risks which may cause a decline in value of each of the Fidelity Central Funds and thus a decline in the value of the investing fund.
| Fidelity Central Fund | Investment Manager | Investment Objective | Investment Practices | Expense Ratio(a) |
| Fidelity Money Market Central Funds | Fidelity Management & Research Company LLC (FMR) | Each fund seeks to obtain a high level of current income consistent with the preservation of capital and liquidity. | Short-term Investments | Less than .005% |
(a) Expenses expressed as a percentage of average net assets and are as of each underlying Central Fund's most recent annual or semi-annual shareholder report.
A complete unaudited list of holdings for each Fidelity Central Fund is available upon request or at the Securities and Exchange Commission website at www.sec.gov. In addition, the financial statements of the Fidelity Central Funds which contain the significant accounting policies (including investment valuation policies) of those funds, and are not covered by the Report of Independent Registered Public Accounting Firm, are available on the Securities and Exchange Commission website or upon request.
3. Significant Accounting Policies.
The Fund is an investment company and applies the accounting and reporting guidance of the Financial Accounting Standards Board (FASB) Accounting Standards Codification Topic 946 Financial Services - Investment Companies. The financial statements have been prepared in conformity with accounting principles generally accepted in the United States of America (GAAP), which require management to make certain estimates and assumptions at the date of the financial statements. Actual results could differ from those estimates. Subsequent events, if any, through the date that the financial statements were issued have been evaluated in the preparation of the financial statements. The Fund's Schedule of Investments lists any underlying mutual funds or exchange-traded funds (ETFs) but does not include the underlying holdings of these funds. The following summarizes the significant accounting policies of the Fund:
Investment Valuation. Investments are valued as of 4:00 p.m. Eastern time on the last calendar day of the period. The Board of Trustees (the Board) has delegated the day to day responsibility for the valuation of the Fund's investments to the Fair Value Committee (the Committee) established by the Fund's investment adviser. In accordance with valuation policies and procedures approved by the Board, the Fund attempts to obtain prices from one or more third party pricing vendors or brokers to value its investments. When current market prices, quotations or currency exchange rates are not readily available or reliable, investments will be fair valued in good faith by the Committee, in accordance with procedures adopted by the Board. Factors used in determining fair value vary by investment type and may include market or investment specific events. The frequency with which these procedures are used cannot be predicted and they may be utilized to a significant extent. The Committee oversees the Fund's valuation policies and procedures and reports to the Board on the Committee's activities and fair value determinations. The Board monitors the appropriateness of the procedures used in valuing the Fund's investments and ratifies the fair value determinations of the Committee.
The Fund categorizes the inputs to valuation techniques used to value its investments into a disclosure hierarchy consisting of three levels as shown below:
- Level 1 – unadjusted quoted prices in active markets for identical investments
- Level 2 – other significant observable inputs (including quoted prices for similar investments, interest rates, prepayment speeds, etc.)
- Level 3 – unobservable inputs (including the Fund's own assumptions based on the best information available)
Valuation techniques used to value the Fund's investments by major category are as follows:
Equity securities, including restricted securities, for which market quotations are readily available, are valued at the last reported sale price or official closing price as reported by a third party pricing vendor on the primary market or exchange on which they are traded and are categorized as Level 1 in the hierarchy. In the event there were no sales during the day or closing prices are not available, securities are valued at the last quoted bid price or may be valued using the last available price and are generally categorized as Level 2 in the hierarchy. For foreign equity securities, when market or security specific events arise, comparisons to the valuation of American Depositary Receipts (ADRs), futures contracts, ETFs and certain indexes as well as quoted prices for similar securities may be used and would be categorized as Level 2 in the hierarchy. For equity securities, including restricted securities, where observable inputs are limited, assumptions about market activity and risk are used and these securities may be categorized as Level 3 in the hierarchy. Securities, including private placements or other restricted securities, for which observable inputs are not available are valued using alternate valuation approaches, including the market approach, the income approach and cost approach, and are categorized as Level 3 in the hierarchy. The market approach considers factors including the price of recent investments in the same or a similar security or financial metrics of comparable securities. The income approach considers factors including expected future cash flows, security specific risks and corresponding discount rates. The cost approach considers factors including the value of the security's underlying assets and liabilities.
ETFs are valued at their last sale price or official closing price as reported by a third party pricing vendor on the primary market or exchange on which they are traded and are categorized as Level 1 in the hierarchy. In the event there were no sales during the day but the exchange reports a closing bid level, ETFs are valued at the closing bid and would be categorized as Level 1 in the hierarchy. In the event there was no closing bid, ETFs may be valued by another method that the Board believes reflects fair value in accordance with the Board's fair value pricing policies and may be categorized as Level 2 in the hierarchy.
Investments in open-end mutual funds, including the Fidelity Central Funds, are valued at their closing net asset value (NAV) each business day and are categorized as Level 1 in the hierarchy.
The following provides information on Level 3 securities held by the Fund that were valued at period end based on unobservable inputs. These amounts exclude valuations provided by a broker.
| Asset Type | Fair Value | Valuation Technique(s) | Unobservable Input | Amount or Range/Weighted Average | Impact to Valuation from an Increase in Input(a) |
| Equities | $199,676,909 | Market approach | Discount rate | 16.0% - 44.9% / 36.3% | Decrease |
| | | | Transaction price | $1.35 - $103.17 / $59.19 | Increase |
| | | Recovery value | Recovery value | $0.00 | Increase |
| | | Market comparable | Enterprise value/Revenue multiple (EV/R) | 1.5 - 10.0 / 4.9 | Increase |
| | | Discounted cash flow | Weighted average cost of capital (WACC) | 19.6% | Decrease |
| | | | Discount for lack of marketability | 10.0% | Decrease |
| | | | Growth rate | 2.0% | Increase |
(a) Represents the directional change in the fair value of the Level 3 investments that could have resulted from an increase in the corresponding input as of period end. A decrease to the unobservable input would have had the opposite effect. Significant changes in these inputs may have resulted in a significantly higher or lower fair value measurement at period end.
Changes in valuation techniques may result in transfers in or out of an assigned level within the disclosure hierarchy. The aggregate value of investments by input level as of July 31, 2022, as well as a roll forward of Level 3 investments, is included at the end of the Fund's Schedule of Investments.
Foreign Currency. Certain Funds may use foreign currency contracts to facilitate transactions in foreign-denominated securities. Gains and losses from these transactions may arise from changes in the value of the foreign currency or if the counterparties do not perform under the contracts' terms.
Foreign-denominated assets, including investment securities, and liabilities are translated into U.S. dollars at the exchange rates at period end. Purchases and sales of investment securities, income and dividends received, and expenses denominated in foreign currencies are translated into U.S. dollars at the exchange rate in effect on the transaction date.
The effects of exchange rate fluctuations on investments are included with the net realized and unrealized gain (loss) on investment securities. Other foreign currency transactions resulting in realized and unrealized gain (loss) are disclosed separately.
Investment Transactions and Income. For financial reporting purposes, the Fund's investment holdings and NAV include trades executed through the end of the last business day of the period. The NAV per share for processing shareholder transactions is calculated as of the close of business of the New York Stock Exchange (NYSE), normally 4:00 p.m. Eastern time and includes trades executed through the end of the prior business day. Gains and losses on securities sold are determined on the basis of identified cost and include proceeds received from litigation. Commissions paid to certain brokers with whom the investment adviser, or its affiliates, places trades on behalf of a fund include an amount in addition to trade execution, which may be rebated back to a fund. Any such rebates are included in net realized gain (loss) on investments in the Statement of Operations. Dividend income is recorded on the ex-dividend date, except for certain dividends from foreign securities where the ex-dividend date may have passed, which are recorded as soon as the Fund is informed of the ex-dividend date. Non-cash dividends included in dividend income, if any, are recorded at the fair market value of the securities received. Income and capital gain distributions from Fidelity Central Funds, if any, are recorded on the ex-dividend date. Certain distributions received by the Fund represent a return of capital or capital gain. The Fund determines the components of these distributions subsequent to the ex-dividend date, based upon receipt of tax filings or other correspondence relating to the underlying investment. These distributions are recorded as a reduction of cost of investments and/or as a realized gain. Interest income is accrued as earned and includes coupon interest and amortization of premium and accretion of discount on debt securities as applicable. Investment income is recorded net of foreign taxes withheld where recovery of such taxes is uncertain. Funds may file withholding tax reclaims in certain jurisdictions to recover a portion of amounts previously withheld. Any withholding tax reclaims income is included in the Statement of Operations in dividends. Any receivables for withholding tax reclaims are included in the Statement of Assets and Liabilities in dividends receivable.
Class Allocations and Expenses. Investment income, realized and unrealized capital gains and losses, common expenses of a fund, and certain fund-level expense reductions, if any, are allocated daily on a pro-rata basis to each class based on the relative net assets of each class to the total net assets of a fund. Each class differs with respect to transfer agent and distribution and service plan fees incurred, as applicable. Certain expense reductions may also differ by class, if applicable. For the reporting period, the allocated portion of income and expenses to each class as a percent of its average net assets may vary due to the timing of recording these transactions in relation to fluctuating net assets of the classes. Expenses directly attributable to a fund are charged to that fund. Expenses attributable to more than one fund are allocated among the respective funds on the basis of relative net assets or other appropriate methods. Expenses included in the accompanying financial statements reflect the expenses of that fund and do not include any expenses associated with any underlying mutual funds or exchange-traded funds. Although not included in a fund's expenses, a fund indirectly bears its proportionate share of these expenses through the net asset value of each underlying mutual fund or exchange-traded fund. Expense estimates are accrued in the period to which they relate and adjustments are made when actual amounts are known.
Income Tax Information and Distributions to Shareholders. Each year, the Fund intends to qualify as a regulated investment company under Subchapter M of the Internal Revenue Code, including distributing substantially all of its taxable income and realized gains. As a result, no provision for U.S. Federal income taxes is required. As of July 31, 2022, the Fund did not have any unrecognized tax benefits in the financial statements; nor is the Fund aware of any tax positions for which it is reasonably possible that the total amounts of unrecognized tax benefits will significantly change in the next twelve months. The Fund files a U.S. federal tax return, in addition to state and local tax returns as required. The Fund's federal income tax returns are subject to examination by the Internal Revenue Service (IRS) for a period of three fiscal years after they are filed. State and local tax returns may be subject to examination for an additional fiscal year depending on the jurisdiction. Foreign taxes are provided for based on the Fund's understanding of the tax rules and rates that exist in the foreign markets in which it invests.
Distributions are declared and recorded on the ex-dividend date. Income and capital gain distributions are declared separately for each class. Income and capital gain distributions are determined in accordance with income tax regulations, which may differ from GAAP.
Capital accounts within the financial statements are adjusted for permanent book-tax differences. These adjustments have no impact on net assets or the results of operations. Capital accounts are not adjusted for temporary book-tax differences which will reverse in a subsequent period.
Book-tax differences are primarily due to foreign currency transactions, passive foreign investment companies (PFIC), partnerships, redemptions in kind, net operating losses and losses deferred due to wash sales and excise tax regulations.
As of period end, the cost and unrealized appreciation (depreciation) in securities, and derivatives if applicable, for federal income tax purposes were as follows:
| Gross unrealized appreciation | $940,618,718 |
| Gross unrealized depreciation | (768,395,720) |
| Net unrealized appreciation (depreciation) | $172,222,998 |
| Tax Cost | $5,510,356,141 |
The tax-based components of distributable earnings as of period end were as follows:
| Net unrealized appreciation (depreciation) on securities and other investments | $167,925,484 |
The Fund intends to elect to defer to its next fiscal year $241,802,824 of capital losses recognized during the period November 1, 2021 to July 31, 2022, and $7,253,749 of ordinary losses recognized during the period January 1, 2022 to July 31, 2022.
The tax character of distributions paid was as follows:
| | July 31, 2022 | July 31, 2021 |
| Ordinary Income | $417,614,718 | $ 102,974,752 |
| Long-term Capital Gains | 651,266,960 | 311,316,386 |
| Total | $1,068,881,678 | $ 414,291,138 |
Restricted Securities (including Private Placements). Funds may invest in securities that are subject to legal or contractual restrictions on resale. These securities generally may be resold in transactions exempt from registration or to the public if the securities are registered. Disposal of these securities may involve time-consuming negotiations and expense, and prompt sale at an acceptable price may be difficult. Information regarding restricted securities held at period end is included at the end of the Schedule of Investments, if applicable.
Special Purpose Acquisition Companies. Funds may invest in stock, warrants, and other securities of special purpose acquisition companies (SPACs) or similar special purpose entities. A SPAC is a publicly traded company that raises investment capital via an initial public offering (IPO) for the purpose of acquiring the equity securities of one or more existing companies via merger, business combination, acquisition or other similar transactions within a designated time frame.
Private Investment in Public Equity. Funds may acquire equity securities of an issuer through a private investment in a public equity (PIPE) transaction, including through commitments to purchase securities on a when-issued basis. A PIPE typically involves the purchase of securities directly from a publicly traded company in a private placement transaction. Securities purchased through PIPE transactions will be restricted from trading and considered illiquid until a resale registration statement for the shares is filed and declared effective.
At the current and/or prior period end, the Fund had commitments to purchase when-issued securities through PIPE transactions with SPACs. The commitments are contingent upon the SPACs acquiring the securities of target companies. Unrealized appreciation (depreciation) on any commitments outstanding at period end is separately presented in the Statements of Assets and Liabilities as Unrealized appreciation (depreciation) on unfunded commitments, and any change in unrealized appreciation (depreciation) on unfunded commitments during the period is separately presented in the Statement of Operations, as applicable.
Consolidated Subsidiary. The Funds included in the table below hold certain investments through a wholly-owned subsidiary ("Subsidiary"), which may be subject to federal and state taxes upon disposition.
As of period end, investments in Subsidiaries were as follows:
| | $ Amount | % of Net Assets |
| Fidelity Small Cap Growth Fund | 9,980,404 | .19 |
The financial statements have been consolidated to include the Subsidiary accounts where applicable. Accordingly, all inter-company transactions and balances have been eliminated.
At period end, any estimated tax liability for these investments is presented as "Deferred taxes" in the Statement of Assets and Liabilities and included in "Change in net unrealized appreciation (depreciation) on investment securities" in the Statement of Operations. The tax liability incurred may differ materially depending on conditions when these investments are disposed. Any cash held by a Subsidiary is restricted as to its use and is presented as "Restricted cash" in the Statement of Assets and Liabilities, if applicable.
4. Purchases and Sales of Investments.
Purchases and sales of securities, other than short-term securities and in-kind transactions, as applicable, are noted in the table below.
| | Purchases ($) | Sales ($) |
| Fidelity Small Cap Growth Fund | 5,041,141,367 | 4,685,862,789 |
Unaffiliated Redemptions In-Kind. Shares that were redeemed in-kind for investments, including accrued interest and cash, if any, are shown in the table below. The net realized gain or loss on investments delivered through in-kind redemptions is included in the accompanying Statement of Operations. The amount of the in-kind redemptions is included in share transactions in the accompanying Statement of Changes in Net Assets. There was no gain or loss for federal income tax purposes.
| | Shares | Total net realized gain or loss
($) | Total Proceeds
($) | Participating classes |
| Fidelity Small Cap Growth Fund | 1,267,055 | 6,413,331 | 32,229,577 | Fidelity Small Cap Growth and Class I |
5. Fees and Other Transactions with Affiliates.
Management Fee. Fidelity Management & Research Company LLC (the investment adviser) and its affiliates provide the Fund with investment management related services for which the Fund pays a monthly management fee. The management fee is the sum of an individual fund fee rate that is based on an annual rate of .45% of the Fund's average net assets and an annualized group fee rate that averaged .22% during the period. The group fee rate is based upon the monthly average net assets of a group of registered investment companies with which the investment adviser has management contracts. The group fee rate decreases as assets under management increase and increases as assets under management decrease. In addition, the management fee is subject to a performance adjustment (up to a maximum of +/- .20% of the Fund's average net assets over a 36 month performance period). The upward or downward adjustment to the management fee is based on the relative investment performance of Small Cap Growth as compared to its benchmark index, the Russell 2000 Growth Index, over the same 36 month performance period. For the reporting period, the total annual management fee rate, including the performance adjustment, was .84% of the Fund's average net assets. The performance adjustment included in the management fee rate may be higher or lower than the maximum performance adjustment rate due to the difference between the average net assets for the reporting and performance periods.
Distribution and Service Plan Fees. In accordance with Rule 12b-1 of the 1940 Act, the Fund has adopted separate Distribution and Service Plans for each class of shares. Certain classes pay Fidelity Distributors Company LLC (FDC), an affiliate of the investment adviser, separate Distribution and Service Fees, each of which is based on an annual percentage of each class' average net assets. In addition, FDC may pay financial intermediaries for selling shares of the Fund and providing shareholder support services. For the period, the Distribution and Service Fee rates, total fees and amounts retained by FDC were as follows:
| | Distribution Fee | Service Fee | Total Fees | Retained by FDC |
| Class A | -% | .25% | $860,565 | $33,566 |
| Class M | .25% | .25% | 428,674 | 926 |
| Class C | .75% | .25% | 749,735 | 93,571 |
| | | | $2,038,974 | $128,063 |
Sales Load. FDC may receive a front-end sales charge of up to 5.75% for selling Class A shares and 3.50% for selling Class M shares, some of which is paid to financial intermediaries for selling shares of the Fund. Depending on the holding period, FDC may receive contingent deferred sales charges levied on Class A, Class M and Class C redemptions. The deferred sales charges are 1.00% for Class C shares, 1.00% for certain purchases of Class A shares and .25% for certain purchases of Class M shares.
For the period, sales charge amounts retained by FDC were as follows:
| | Retained by FDC |
| Class A | $106,834 |
| Class M | 7,323 |
| Class C(a) | 951 |
| | $115,108 |
(a) When Class C shares are initially sold, FDC pays commissions from its own resources to financial intermediaries through which the sales are made.
Transfer Agent Fees. Fidelity Investments Institutional Operations Company LLC (FIIOC), an affiliate of the investment adviser, is the transfer, dividend disbursing and shareholder servicing agent for each class of the Fund. FIIOC receives account fees and asset-based fees that vary according to the account size and type of account of the shareholders of the respective classes of the Fund, except for Class Z. FIIOC receives an asset-based fee of Class Z's average net assets. FIIOC pays for typesetting, printing and mailing of shareholder reports, except proxy statements.
For the period, transfer agent fees for each class were as follows:
| | Amount | % of Class-Level Average Net Assets |
| Class A | $618,781 | .18 |
| Class M | 155,726 | .18 |
| Class C | 142,919 | .19 |
| Fidelity Small Cap Growth | 5,210,409 | .15 |
| Class I | 1,224,353 | .18 |
| Class Z | 547,210 | .04 |
| | $7,899,398 | |
Accounting Fees. Fidelity Service Company, Inc. (FSC), an affiliate of the investment adviser, maintains the Fund's accounting records. The accounting fee is based on the level of average net assets for each month. For the period, the fees were equivalent to the following annual rates:
| | % of Average Net Assets |
| Fidelity Small Cap Growth Fund | .02 |
Brokerage Commissions. A portion of portfolio transactions were placed with brokerage firms which are affiliates of the investment adviser. Brokerage commissions are included in net realized gain (loss) and change in net unrealized appreciation (depreciation) in the Statement of Operations. The commissions paid to these affiliated firms were as follows:
| | Amount |
| Fidelity Small Cap Growth Fund | $153,221 |
Interfund Lending Program. Pursuant to an Exemptive Order issued by the Securities and Exchange Commission (the SEC), the Fund, along with other registered investment companies having management contracts with Fidelity Management & Research Company LLC (FMR), or other affiliated entities of FMR, may participate in an interfund lending program. This program provides an alternative credit facility allowing the Fund to borrow from, or lend money to, other participating affiliated funds. At period end, there were no interfund loans outstanding. Activity in this program during the period for which loans were outstanding was as follows:
| | Borrower or Lender | Average Loan Balance | Weighted Average Interest Rate | Interest Expense |
| Fidelity Small Cap Growth Fund | Borrower | $13,015,587 | .40% | $6,630 |
Interfund Trades. Funds may purchase from or sell securities to other Fidelity Funds under procedures adopted by the Board. The procedures have been designed to ensure these interfund trades are executed in accordance with Rule 17a-7 of the 1940 Act. Any interfund trades are included within the respective purchases and sales amounts shown in the Purchases and Sales of Investments note. Interfund trades during the period are noted in the table below.
| | Purchases ($) | Sales ($) | Realized Gain (Loss) ($) |
| Fidelity Small Cap Growth Fund | 242,654,069 | 367,609,305 | 15,534,286 |
Other. During the period, the investment adviser reimbursed the Fund for certain losses as follows:
| | Amount ($) |
| Fidelity Small Cap Growth Fund | 12,696 |
6. Committed Line of Credit.
Certain Funds participate with other funds managed by the investment adviser or an affiliate in a $4.25 billion credit facility (the "line of credit") to be utilized for temporary or emergency purposes to fund shareholder redemptions or for other short-term liquidity purposes. The participating funds have agreed to pay commitment fees on their pro-rata portion of the line of credit, which are reflected in Miscellaneous expenses on the Statement of Operations, and are listed below. During the period, there were no borrowings on this line of credit.
| | Amount |
| Fidelity Small Cap Growth Fund | $7,704 |
7. Security Lending.
Funds lend portfolio securities from time to time in order to earn additional income. Lending agents are used, including National Financial Services (NFS), an affiliate of the investment adviser. Pursuant to a securities lending agreement, NFS will receive a fee, which is capped at 9.9% of a fund's daily lending revenue, for its services as lending agent. A fund may lend securities to certain qualified borrowers, including NFS. On the settlement date of the loan, a fund receives collateral (in the form of U.S. Treasury obligations, letters of credit and/or cash) against the loaned securities and maintains collateral in an amount not less than 100% of the market value of the loaned securities during the period of the loan. The market value of the loaned securities is determined at the close of business of a fund and any additional required collateral is delivered to a fund on the next business day. A fund or borrower may terminate the loan at any time, and if the borrower defaults on its obligation to return the securities loaned because of insolvency or other reasons, a fund may apply collateral received from the borrower against the obligation. A fund may experience delays and costs in recovering the securities loaned. Any cash collateral received is invested in the Fidelity Securities Lending Cash Central Fund. Any loaned securities are identified as such in the Schedule of Investments, and the value of loaned securities and cash collateral at period end, as applicable, are presented in the Statement of Assets and Liabilities. Security lending income represents the income earned on investing cash collateral, less rebates paid to borrowers and any lending agent fees associated with the loan, plus any premium payments received for lending certain types of securities. Security lending income is presented in the Statement of Operations as a component of income from Fidelity Central Funds. Affiliated security lending activity, if any, was as follows:
| | Total Security Lending Fees Paid to NFS | Security Lending Income From Securities Loaned to NFS | Value of Securities Loaned to NFS at Period End |
| Fidelity Small Cap Growth Fund | $452,130 | $285,973 | $1,216,342 |
8. Expense Reductions.
Through arrangements with the Fund's custodian, credits realized as a result of certain uninvested cash balances were used to reduce the Fund's expenses. During the period, custodian credits reduced the Fund's expenses by $207.
In addition, during the period the investment adviser or an affiliate reimbursed and/or waived a portion of fund-level operating expenses in the amount of $186,317.
9. Distributions to Shareholders.
Distributions to shareholders of each class were as follows:
| | Year ended
July 31, 2022 | Year ended
July 31, 2021 |
| Fidelity Small Cap Growth Fund | | |
| Distributions to shareholders | | |
| Class A | $67,979,799 | $28,072,163 |
| Class M | 17,907,670 | 7,663,523 |
| Class C | 17,539,783 | 8,833,078 |
| Small Cap Growth | 638,250,356 | 295,452,508 |
| Class I | 130,451,281 | 54,275,270 |
| Class Z | 196,752,789 | 19,994,596 |
| Total | $1,068,881,678 | $414,291,138 |
10. Share Transactions.
Share transactions for each class were as follows and may contain in-kind transactions, automatic conversions between classes or exchanges between affiliated funds:
| | Shares | Shares | Dollars | Dollars |
| | Year ended July 31, 2022 | Year ended July 31, 2021 | Year ended July 31, 2022 | Year ended July 31, 2021 |
| Fidelity Small Cap Growth Fund | | | | |
| Class A | | | | |
| Shares sold | 2,718,612 | 2,866,158 | $74,995,450 | $94,142,976 |
| Reinvestment of distributions | 2,151,573 | 992,952 | 67,245,012 | 27,768,422 |
| Shares redeemed | (3,530,802) | (2,820,344) | (96,163,790) | (90,226,445) |
| Net increase (decrease) | 1,339,383 | 1,038,766 | $46,076,672 | $31,684,953 |
| Class M | | | | |
| Shares sold | 431,115 | 490,758 | $11,263,605 | $15,299,858 |
| Reinvestment of distributions | 597,527 | 283,607 | 17,701,076 | 7,574,791 |
| Shares redeemed | (760,045) | (590,978) | (19,559,813) | (18,376,525) |
| Net increase (decrease) | 268,597 | 183,387 | $9,404,868 | $4,498,124 |
| Class C | | | | |
| Shares sold | 571,841 | 545,845 | $13,494,292 | $15,197,876 |
| Reinvestment of distributions | 673,112 | 368,546 | 17,397,814 | 8,764,070 |
| Shares redeemed | (1,065,945) | (1,306,378) | (24,414,238) | (35,873,924) |
| Net increase (decrease) | 179,008 | (391,987) | $6,477,868 | $(11,911,978) |
| Small Cap Growth | | | | |
| Shares sold | 20,198,332 | 40,178,307 | $601,187,332 | $1,388,678,427 |
| Reinvestment of distributions | 18,119,358 | 9,508,156 | 605,852,496 | 282,245,288 |
| Shares redeemed | (50,251,214) | (28,193,491) | (1,631,982,649) | (959,494,567) |
| Net increase (decrease) | (11,933,524) | 21,492,972 | $(424,942,821) | $711,429,148 |
| Class I | | | | |
| Shares sold | 9,200,827 | 6,856,746 | $260,264,783 | $232,528,912 |
| Reinvestment of distributions | 3,793,722 | 1,777,184 | 127,231,880 | 52,852,239 |
| Shares redeemed | (9,529,628) | (6,942,425) | (270,197,792) | (235,475,367) |
| Net increase (decrease) | 3,464,921 | 1,691,505 | $117,298,871 | $49,905,784 |
| Class Z | | | | |
| Shares sold | 47,704,858 | 4,788,627 | $1,587,489,270 | $170,967,105 |
| Reinvestment of distributions | 5,572,104 | 549,462 | 186,739,643 | 16,414,402 |
| Shares redeemed | (4,588,101) | (2,512,801) | (128,587,767) | (86,081,232) |
| Net increase (decrease) | 48,688,861 | 2,825,288 | $1,645,641,146 | $101,300,275 |
11. Other.
A fund's organizational documents provide former and current trustees and officers with a limited indemnification against liabilities arising in connection with the performance of their duties to the fund. In the normal course of business, a fund may also enter into contracts that provide general indemnifications. A fund's maximum exposure under these arrangements is unknown as this would be dependent on future claims that may be made against a fund. The risk of material loss from such claims is considered remote.
At the end of the period, the following mutual funds managed by the investment adviser or its affiliates were the owners of record of 10% or more of the total outstanding shares.
| | Strategic Advisers Fidelity U.S. Total Stock Fund |
| Fidelity Small Cap Growth Fund | 12% |
12. Coronavirus (COVID-19) Pandemic.
An outbreak of COVID-19 first detected in China during December 2019 has since spread globally and was declared a pandemic by the World Health Organization during March 2020. Developments that disrupt global economies and financial markets, such as the COVID-19 pandemic, may magnify factors that affect the Fund's performance.
Report of Independent Registered Public Accounting Firm
To the Board of Trustees of Fidelity Securities Fund and Shareholders of Fidelity Small Cap Growth Fund
Opinion on the Financial Statements
We have audited the accompanying statement of assets and liabilities, including the schedule of investments, of Fidelity Small Cap Growth Fund (one of the funds constituting Fidelity Securities Fund, referred to hereafter as the “Fund”) as of July 31, 2022, the related statement of operations for the year ended July 31, 2022, the statement of changes in net assets for each of the two years in the period ended July 31, 2022, including the related notes, and the financial highlights for each of the five years in the period ended July 31, 2022 (collectively referred to as the “financial statements”). In our opinion, the financial statements present fairly, in all material respects, the financial position of the Fund as of July 31, 2022, the results of its operations for the year then ended, the changes in its net assets for each of the two years in the period ended July 31, 2022 and the financial highlights for each of the five years in the period ended July 31, 2022 in conformity with accounting principles generally accepted in the United States of America.
Basis for Opinion
These financial statements are the responsibility of the Fund’s management. Our responsibility is to express an opinion on the Fund’s financial statements based on our audits. We are a public accounting firm registered with the Public Company Accounting Oversight Board (United States) (PCAOB) and are required to be independent with respect to the Fund in accordance with the U.S. federal securities laws and the applicable rules and regulations of the Securities and Exchange Commission and the PCAOB.
We conducted our audits of these financial statements in accordance with the standards of the PCAOB. Those standards require that we plan and perform the audit to obtain reasonable assurance about whether the financial statements are free of material misstatement, whether due to error or fraud.
Our audits included performing procedures to assess the risks of material misstatement of the financial statements, whether due to error or fraud, and performing procedures that respond to those risks. Such procedures included examining, on a test basis, evidence regarding the amounts and disclosures in the financial statements. Our audits also included evaluating the accounting principles used and significant estimates made by management, as well as evaluating the overall presentation of the financial statements. Our procedures included confirmation of securities owned as of July 31, 2022 by correspondence with the custodian, issuers of privately offered securities and brokers; when replies were not received from brokers, we performed other auditing procedures. We believe that our audits provide a reasonable basis for our opinion.
/s/ PricewaterhouseCoopers LLP
Boston, Massachusetts
September 14, 2022
We have served as the auditor of one or more investment companies in the Fidelity group of funds since 1932.
Trustees and Officers
The Trustees, Members of the Advisory Board (if any), and officers of the trust and fund, as applicable, are listed below. The Board of Trustees governs the fund and is responsible for protecting the interests of shareholders. The Trustees are experienced executives who meet periodically throughout the year to oversee the fund's activities, review contractual arrangements with companies that provide services to the fund, oversee management of the risks associated with such activities and contractual arrangements, and review the fund's performance. Except for Jonathan Chiel, each of the Trustees oversees 316 funds. Mr. Chiel oversees 184 funds.
The Trustees hold office without limit in time except that (a) any Trustee may resign; (b) any Trustee may be removed by written instrument, signed by at least two-thirds of the number of Trustees prior to such removal; (c) any Trustee who requests to be retired or who has become incapacitated by illness or injury may be retired by written instrument signed by a majority of the other Trustees; and (d) any Trustee may be removed at any special meeting of shareholders by a two-thirds vote of the outstanding voting securities of the trust. Each Trustee who is not an interested person (as defined in the 1940 Act) of the trust and the fund is referred to herein as an Independent Trustee. Each Independent Trustee shall retire not later than the last day of the calendar year in which his or her 75th birthday occurs. The Independent Trustees may waive this mandatory retirement age policy with respect to individual Trustees. Officers and Advisory Board Members hold office without limit in time, except that any officer or Advisory Board Member may resign or may be removed by a vote of a majority of the Trustees at any regular meeting or any special meeting of the Trustees. Except as indicated, each individual has held the office shown or other offices in the same company for the past five years.
The fund's Statement of Additional Information (SAI) includes more information about the Trustees. To request a free copy, call Fidelity at 1-800-544-8544 if you’re an individual investing directly with Fidelity, call 1-800-835-5092 if you’re a plan sponsor or participant with Fidelity as your recordkeeper or call 1-877-208-0098 on institutional accounts or if you’re an advisor or invest through one.
Experience, Skills, Attributes, and Qualifications of the Trustees. The Governance and Nominating Committee has adopted a statement of policy that describes the experience, qualifications, attributes, and skills that are necessary and desirable for potential Independent Trustee candidates (Statement of Policy). The Board believes that each Trustee satisfied at the time he or she was initially elected or appointed a Trustee, and continues to satisfy, the standards contemplated by the Statement of Policy. The Governance and Nominating Committee also engages professional search firms to help identify potential Independent Trustee candidates who have the experience, qualifications, attributes, and skills consistent with the Statement of Policy. From time to time, additional criteria based on the composition and skills of the current Independent Trustees, as well as experience or skills that may be appropriate in light of future changes to board composition, business conditions, and regulatory or other developments, have also been considered by the professional search firms and the Governance and Nominating Committee. In addition, the Board takes into account the Trustees' commitment and participation in Board and committee meetings, as well as their leadership of standing and ad hoc committees throughout their tenure.
In determining that a particular Trustee was and continues to be qualified to serve as a Trustee, the Board has considered a variety of criteria, none of which, in isolation, was controlling. The Board believes that, collectively, the Trustees have balanced and diverse experience, qualifications, attributes, and skills, which allow the Board to operate effectively in governing the fund and protecting the interests of shareholders. Information about the specific experience, skills, attributes, and qualifications of each Trustee, which in each case led to the Board's conclusion that the Trustee should serve (or continue to serve) as a trustee of the fund, is provided below.
Board Structure and Oversight Function. Robert A. Lawrence is an interested person and currently serves as Chair. The Trustees have determined that an interested Chair is appropriate and benefits shareholders because an interested Chair has a personal and professional stake in the quality and continuity of services provided to the fund. Independent Trustees exercise their informed business judgment to appoint an individual of their choosing to serve as Chair, regardless of whether the Trustee happens to be independent or a member of management. The Independent Trustees have determined that they can act independently and effectively without having an Independent Trustee serve as Chair and that a key structural component for assuring that they are in a position to do so is for the Independent Trustees to constitute a substantial majority for the Board. The Independent Trustees also regularly meet in executive session. David M. Thomas serves as Lead Independent Trustee and as such (i) acts as a liaison between the Independent Trustees and management with respect to matters important to the Independent Trustees and (ii) with management prepares agendas for Board meetings.
Fidelity® funds are overseen by different Boards of Trustees. The fund's Board oversees Fidelity's high income and certain equity funds, and other Boards oversee Fidelity's investment-grade bond, money market, asset allocation, and other equity funds. The asset allocation funds may invest in Fidelity® funds overseen by the fund's Board. The use of separate Boards, each with its own committee structure, allows the Trustees of each group of Fidelity® funds to focus on the unique issues of the funds they oversee, including common research, investment, and operational issues. On occasion, the separate Boards establish joint committees to address issues of overlapping consequences for the Fidelity® funds overseen by each Board.
The Trustees operate using a system of committees to facilitate the timely and efficient consideration of all matters of importance to the Trustees, the fund, and fund shareholders and to facilitate compliance with legal and regulatory requirements and oversight of the fund's activities and associated risks. The Board, acting through its committees, has charged FMR and its affiliates with (i) identifying events or circumstances the occurrence of which could have demonstrably adverse effects on the fund's business and/or reputation; (ii) implementing processes and controls to lessen the possibility that such events or circumstances occur or to mitigate the effects of such events or circumstances if they do occur; and (iii) creating and maintaining a system designed to evaluate continuously business and market conditions in order to facilitate the identification and implementation processes described in (i) and (ii) above. Because the day-to-day operations and activities of the fund are carried out by or through FMR, its affiliates, and other service providers, the fund's exposure to risks is mitigated but not eliminated by the processes overseen by the Trustees. While each of the Board's committees has responsibility for overseeing different aspects of the fund's activities, oversight is exercised primarily through the Operations, Audit, and Compliance Committees. Appropriate personnel, including but not limited to the fund's Chief Compliance Officer (CCO), FMR's internal auditor, the independent accountants, the fund's Treasurer and portfolio management personnel, make periodic reports to the Board's committees, as appropriate, including an annual review of Fidelity's risk management program for the Fidelity® funds. The responsibilities of each standing committee, including their oversight responsibilities, are described further under "Standing Committees of the Trustees."
Interested Trustees*:
Correspondence intended for a Trustee who is an interested person may be sent to Fidelity Investments, 245 Summer Street, Boston, Massachusetts 02210.
Name, Year of Birth; Principal Occupations and Other Relevant Experience+
Jonathan Chiel (1957)
Year of Election or Appointment: 2016
Trustee
Mr. Chiel also serves as Trustee of other Fidelity® funds. Mr. Chiel is Executive Vice President and General Counsel for FMR LLC (diversified financial services company, 2012-present). Previously, Mr. Chiel served as general counsel (2004-2012) and senior vice president and deputy general counsel (2000-2004) for John Hancock Financial Services; a partner with Choate, Hall & Stewart (1996-2000) (law firm); and an Assistant United States Attorney for the United States Attorney’s Office of the District of Massachusetts (1986-95), including Chief of the Criminal Division (1993-1995). Mr. Chiel is a director on the boards of the Boston Bar Foundation and the Maimonides School.
Bettina Doulton (1964)
Year of Election or Appointment: 2021
Trustee
Ms. Doulton also serves as Trustee of other Fidelity® funds. Prior to her retirement, Ms. Doulton served in a variety of positions at Fidelity Investments, including as a managing director of research (2006-2007), portfolio manager to certain Fidelity® funds (1993-2005), equity analyst and portfolio assistant (1990-1993), and research assistant (1987-1990). Ms. Doulton currently owns and operates Phi Builders + Architects and Cellardoor Winery. Previously, Ms. Doulton served as a member of the Board of Brown Capital Management, LLC (2014-2018).
Robert A. Lawrence (1952)
Year of Election or Appointment: 2020
Trustee
Chair of the Board of Trustees
Mr. Lawrence also serves as Trustee of other funds. Previously, Mr. Lawrence served as a Trustee and Member of the Advisory Board of certain funds. Prior to his retirement in 2008, Mr. Lawrence served as Vice President of certain Fidelity® funds (2006-2008), Senior Vice President, Head of High Income Division of Fidelity Management & Research Company (investment adviser firm, 2006-2008), and President of Fidelity Strategic Investments (investment adviser firm, 2002-2005).
* Determined to be an “Interested Trustee” by virtue of, among other things, his or her affiliation with the trust or various entities under common control with FMR.
+ The information includes the Trustee's principal occupation during the last five years and other information relating to the experience, attributes, and skills relevant to the Trustee's qualifications to serve as a Trustee, which led to the conclusion that the Trustee should serve as a Trustee for the fund.
Independent Trustees:
Correspondence intended for an Independent Trustee may be sent to Fidelity Investments, P.O. Box 55235, Boston, Massachusetts 02205-5235.
Name, Year of Birth; Principal Occupations and Other Relevant Experience+
Thomas P. Bostick (1956)
Year of Election or Appointment: 2021
Trustee
Lieutenant General Bostick also serves as Trustee of other Fidelity® funds. Prior to his retirement, General Bostick (United States Army, Retired) held a variety of positions within the U.S. Army, including Commanding General and Chief of Engineers, U.S. Army Corps of Engineers (2012-2016) and Deputy Chief of Staff and Director of Human Resources, U.S. Army (2009-2012). General Bostick currently serves as a member of the Board and Finance and Governance Committees of CSX Corporation (transportation, 2020-present) and a member of the Board and Corporate Governance and Nominating Committee of Perma-Fix Environmental Services, Inc. (nuclear waste management, 2020-present). General Bostick serves as Chief Executive Officer of Bostick Global Strategies, LLC (consulting, 2016-present) and as a member of the Board of HireVue, Inc. (video interview and assessment, 2020-present). Previously, General Bostick served as a Member of the Advisory Board of certain Fidelity® funds (2021), President, Intrexon Bioengineering (2018-2020) and Chief Operating Officer (2017-2020) and Senior Vice President of the Environment Sector (2016-2017) of Intrexon Corporation (biopharmaceutical company).
Dennis J. Dirks (1948)
Year of Election or Appointment: 2005
Trustee
Mr. Dirks also serves as Trustee of other Fidelity® funds. Prior to his retirement in May 2003, Mr. Dirks served as Chief Operating Officer and as a member of the Board of The Depository Trust & Clearing Corporation (financial markets infrastructure), President, Chief Operating Officer and a member of the Board of The Depository Trust Company (DTC), President and a member of the Board of the National Securities Clearing Corporation (NSCC), Chief Executive Officer and a member of the Board of the Government Securities Clearing Corporation and Chief Executive Officer and a member of the Board of the Mortgage-Backed Securities Clearing Corporation. Mr. Dirks currently serves as a member of the Finance Committee (2016-present) and Board (2017-present) and is Treasurer (2018-present) of the Asolo Repertory Theatre.
Donald F. Donahue (1950)
Year of Election or Appointment: 2018
Trustee
Mr. Donahue also serves as Trustee of other Fidelity® funds. Mr. Donahue serves as President and Chief Executive Officer of Miranda Partners, LLC (risk consulting for the financial services industry, 2012-present). Previously, Mr. Donahue served as Chief Executive Officer (2006-2012), Chief Operating Officer (2003-2006) and Managing Director, Customer Marketing and Development (1999-2003) of The Depository Trust & Clearing Corporation (financial markets infrastructure). Mr. Donahue currently serves as a member (2007-present) and Co-Chairman (2016-present) of the Board of United Way of New York and a member of the Board of The Leadership Academy (previously NYC Leadership Academy) (2012-present). Mr. Donahue previously served as a member of the Advisory Board of certain Fidelity® funds (2015-2018).
Vicki L. Fuller (1957)
Year of Election or Appointment: 2020
Trustee
Ms. Fuller also serves as Trustee of other Fidelity® funds. Previously, Ms. Fuller served as a member of the Advisory Board of certain Fidelity® funds (2018-2020), Chief Investment Officer of the New York State Common Retirement Fund (2012-2018) and held a variety of positions at AllianceBernstein L.P. (global asset management, 1985-2012), including Managing Director (2006-2012) and Senior Vice President and Senior Portfolio Manager (2001-2006). Ms. Fuller currently serves as a member of the Board, Audit Committee and Nominating and Governance Committee of two Blackstone business development companies (2020-present), as a member of the Board of Treliant, LLC (consulting, 2019-present), as a member of the Advisory Board of Ariel Alternatives, LLC (private equity, 2021-present) and as a member of the Board and Chair of the Audit Committee of Gusto, Inc. (software, 2021-present). In addition, Ms. Fuller currently serves as a member of the Board of Roosevelt University (2019-present) and as a member of the Executive Board of New York University’s Stern School of Business. Ms. Fuller previously served as a member of the Board, Audit Committee and Nominating and Governance Committee of The Williams Companies, Inc. (natural gas infrastructure, 2018-2021).
Patricia L. Kampling (1959)
Year of Election or Appointment: 2020
Trustee
Ms. Kampling also serves as Trustee of other Fidelity® funds. Prior to her retirement, Ms. Kampling served as Chairman of the Board and Chief Executive Officer (2012-2019), President and Chief Operating Officer (2011-2012) and Executive Vice President and Chief Financial Officer (2010-2011) of Alliant Energy Corporation. Ms. Kampling currently serves as a member of the Board, Finance Committee and Governance, Compensation and Nominating Committee of Xcel Energy Inc. (utilities company, 2020-present) and as a member of the Board, Audit, Finance and Risk Committee and Safety, Environmental, Technology and Operations Committee and Chair of the Executive Development and Compensation Committee of American Water Works Company, Inc. (utilities company, 2019-present). In addition, Ms. Kampling currently serves as a member of the Board of the Nature Conservancy, Wisconsin Chapter (2019-present). Previously, Ms. Kampling served as a Member of the Advisory Board of certain Fidelity® funds (2020), a member of the Board, Compensation Committee and Executive Committee and Chair of the Audit Committee of Briggs & Stratton Corporation (manufacturing, 2011-2021), a member of the Board of Interstate Power and Light Company (2012-2019) and Wisconsin Power and Light Company (2012-2019) (each a subsidiary of Alliant Energy Corporation) and as a member of the Board and Workforce Development Committee of the Business Roundtable (2018-2019).
Thomas A. Kennedy (1955)
Year of Election or Appointment: 2021
Trustee
Mr. Kennedy also serves as Trustee of other Fidelity® funds. Previously, Mr. Kennedy served as a Member of the Advisory Board of certain Fidelity® funds (2020) and held a variety of positions at Raytheon Company (aerospace and defense, 1983-2020), including Chairman and Chief Executive Officer (2014-2020) and Executive Vice President and Chief Operating Officer (2013-2014). Mr. Kennedy currently serves as Executive Chairman of the Board of Directors of Raytheon Technologies Corporation (aerospace and defense, 2020-present). He is also a member of the Rutgers School of Engineering Industry Advisory Board (2011-present) and a member of the UCLA Engineering Dean’s Executive Board (2016-present).
Oscar Munoz (1959)
Year of Election or Appointment: 2021
Trustee
Mr. Munoz also serves as Trustee of other Fidelity® funds. Prior to his retirement, Mr. Munoz served as Executive Chairman (2020-2021), Chief Executive Officer (2015-2020), President (2015-2016) and a member of the Board (2010-2021) of United Airlines Holdings, Inc. Mr. Munoz currently serves as a member of the Board of CBRE Group, Inc. (commercial real estate, 2020-present), a member of the Board of Univision Communications, Inc. (Hispanic media, 2020-present) and a member of the Advisory Board of Salesforce.com, Inc. (cloud-based software, 2020-present). Previously, Mr. Munoz served as a Member of the Advisory Board of certain Fidelity® funds (2021).
Garnett A. Smith (1947)
Year of Election or Appointment: 2018
Trustee
Mr. Smith also serves as Trustee of other Fidelity® funds. Prior to his retirement, Mr. Smith served as Chairman and Chief Executive Officer (1990-1997) and President (1986-1990) of Inbrand Corp. (manufacturer of personal absorbent products). Prior to his employment with Inbrand Corp., he was employed by a retail fabric chain and North Carolina National Bank (now Bank of America). Mr. Smith previously served as a member of the Advisory Board of certain Fidelity® funds (2012-2013).
David M. Thomas (1949)
Year of Election or Appointment: 2008
Trustee
Lead Independent Trustee
Mr. Thomas also serves as Trustee of other Fidelity® funds. Previously, Mr. Thomas served as Executive Chairman (2005-2006) and Chairman and Chief Executive Officer (2000-2005) of IMS Health, Inc. (pharmaceutical and healthcare information solutions). Mr. Thomas currently serves as a member of the Board of Fortune Brands Home and Security (home and security products, 2004-present) and as Director (2013-present) and Non-Executive Chairman of the Board (2022-present) of Interpublic Group of Companies, Inc. (marketing communication).
Susan Tomasky (1953)
Year of Election or Appointment: 2020
Trustee
Ms. Tomasky also serves as Trustee of other Fidelity® funds. Prior to her retirement, Ms. Tomasky served in various executive officer positions at American Electric Power Company, Inc. (1998-2011), including most recently as President of AEP Transmission (2007-2011). Ms. Tomasky currently serves as a member of the Board and Sustainability Committee and as Chair of the Audit Committee of Marathon Petroleum Corporation (2018-present) and as a member of the Board, Executive Committee, Corporate Governance Committee and Organization and Compensation Committee and as Chair of the Audit Committee of Public Service Enterprise Group, Inc. (utilities company, 2012-present) and as a member of the Board of its subsidiary company, Public Service Electric and Gas Co. (2021-present). In addition, Ms. Tomasky currently serves as a member (2009-present) and President (2020-present) of the Board of the Royal Shakespeare Company – America (2009-present), as a member of the Board of the Columbus Association for the Performing Arts (2011-present) and as a member of the Board and Kenyon in the World Committee of Kenyon College (2016-present). Previously, Ms. Tomasky served as a Member of the Advisory Board of certain Fidelity® funds (2020), as a member of the Board of the Columbus Regional Airport Authority (2007-2020), as a member of the Board (2011-2018) and Lead Independent Director (2015-2018) of Andeavor Corporation (previously Tesoro Corporation) (independent oil refiner and marketer) and as a member of the Board of Summit Midstream Partners LP (energy, 2012-2018).
Michael E. Wiley (1950)
Year of Election or Appointment: 2020
Trustee
Mr. Wiley also serves as Trustee of other Fidelity® funds. Previously, Mr. Wiley served as a member of the Advisory Board of certain Fidelity® funds (2018-2020), Chairman, President and CEO of Baker Hughes, Inc. (oilfield services, 2000-2004). Mr. Wiley also previously served as a member of the Board of Andeavor Corporation (independent oil refiner and marketer, 2005-2018), a member of the Board of Andeavor Logistics LP (natural resources logistics, 2015-2018) and a member of the Board of High Point Resources (exploration and production, 2005-2020).
+ The information includes the Trustee's principal occupation during the last five years and other information relating to the experience, attributes, and skills relevant to the Trustee's qualifications to serve as a Trustee, which led to the conclusion that the Trustee should serve as a Trustee for the fund.
Advisory Board Members and Officers:
Correspondence intended for a Member of the Advisory Board (if any) may be sent to Fidelity Investments, P.O. Box 55235, Boston, Massachusetts 02205-5235. Correspondence intended for an officer or Peter S. Lynch may be sent to Fidelity Investments, 245 Summer Street, Boston, Massachusetts 02210. Officers appear below in alphabetical order.
Name, Year of Birth; Principal Occupation
Peter S. Lynch (1944)
Year of Election or Appointment: 2003
Member of the Advisory Board
Mr. Lynch also serves as a Member of the Advisory Board of other Fidelity® funds. Mr. Lynch is Vice Chairman and a Director of Fidelity Management & Research Company LLC (investment adviser firm). In addition, Mr. Lynch serves as a Trustee of Boston College and as the Chairman of the Inner-City Scholarship Fund. Previously, Mr. Lynch served as Vice Chairman and a Director of FMR Co., Inc. (investment adviser firm) and on the Special Olympics International Board of Directors (1997-2006).
Craig S. Brown (1977)
Year of Election or Appointment: 2019
Assistant Treasurer
Mr. Brown also serves as an officer of other funds. Mr. Brown serves as Assistant Treasurer of FIMM, LLC (2021-present) and is an employee of Fidelity Investments (2013-present).
John J. Burke III (1964)
Year of Election or Appointment: 2018
Chief Financial Officer
Mr. Burke also serves as Chief Financial Officer of other funds. Mr. Burke serves as Head of Investment Operations for Fidelity Fund and Investment Operations (2018-present) and is an employee of Fidelity Investments (1998-present). Previously Mr. Burke served as head of Asset Management Investment Operations (2012-2018).
William C. Coffey (1969)
Year of Election or Appointment: 2019
Assistant Secretary
Mr. Coffey also serves as Assistant Secretary of other funds. He is Senior Vice President and Deputy General Counsel of FMR LLC (diversified financial services company, 2010-present), and is an employee of Fidelity Investments. Previously, Mr. Coffey served as Secretary and CLO of certain funds (2018-2019); CLO, Secretary, and Senior Vice President of Fidelity Management & Research Company and FMR Co., Inc. (investment adviser firms, 2018-2019); Secretary of Fidelity SelectCo, LLC and Fidelity Investments Money Management, Inc. (investment adviser firms, 2018-2019); CLO of Fidelity Management & Research (Hong Kong) Limited, FMR Investment Management (UK) Limited, and Fidelity Management & Research (Japan) Limited (investment adviser firms, 2018-2019); and Assistant Secretary of certain funds (2009-2018).
Timothy M. Cohen (1969)
Year of Election or Appointment: 2018
Vice President
Mr. Cohen also serves as Vice President of other funds. Mr. Cohen serves as Co-Head of Equity (2018-present), a Director of Fidelity Management & Research (Japan) Limited (investment adviser firm, 2016-present), and is an employee of Fidelity Investments. Previously, Mr. Cohen served as Executive Vice President of Fidelity SelectCo, LLC (2019), Head of Global Equity Research (2016-2018), Chief Investment Officer - Equity and a Director of Fidelity Management & Research (U.K.) Inc. (investment adviser firm, 2013-2015) and as a Director of Fidelity Management & Research (Hong Kong) Limited (investment adviser firm, 2017).
Jonathan Davis (1968)
Year of Election or Appointment: 2010
Assistant Treasurer
Mr. Davis also serves as an officer of other funds. Mr. Davis serves as Assistant Treasurer of FIMM, LLC (2021-present), FMR Capital, Inc. (2017-present), FD Funds GP LLC (2021-present), FD Funds Holding LLC (2021-present), and FD Funds Management LLC (2021-present); and is an employee of Fidelity Investments. Previously, Mr. Davis served as Vice President and Associate General Counsel of FMR LLC (diversified financial services company, 2003-2010).
Laura M. Del Prato (1964)
Year of Election or Appointment: 2018
Assistant Treasurer
Ms. Del Prato also serves as an officer of other funds. Ms. Del Prato serves as Assistant Treasurer of FIMM, LLC (2021-present) and is an employee of Fidelity Investments (2017-present). Previously, Ms. Del Prato served as President and Treasurer of The North Carolina Capital Management Trust: Cash Portfolio and Term Portfolio (2018-2020). Prior to joining Fidelity Investments, Ms. Del Prato served as a Managing Director and Treasurer of the JPMorgan Mutual Funds (2014-2017). Prior to JPMorgan, Ms. Del Prato served as a partner at Cohen Fund Audit Services (accounting firm, 2012-2013) and KPMG LLP (accounting firm, 2004-2012).
Colm A. Hogan (1973)
Year of Election or Appointment: 2020
Assistant Treasurer
Mr. Hogan also serves as an officer of other funds. Mr. Hogan serves as Assistant Treasurer of FIMM, LLC (2021-present) and FMR Capital, Inc. (2017-present) and is an employee of Fidelity Investments (2005-present). Previously, Mr. Hogan served as Deputy Treasurer of certain Fidelity® funds (2016-2020) and Assistant Treasurer of certain Fidelity® funds (2016-2018).
Pamela R. Holding (1964)
Year of Election or Appointment: 2018
Vice President
Ms. Holding also serves as Vice President of other funds. Ms. Holding serves as Co-Head of Equity (2018-present) and is an employee of Fidelity Investments (2013-present). Previously, Ms. Holding served as Executive Vice President of Fidelity SelectCo, LLC (2019) and as Chief Investment Officer of Fidelity Institutional Asset Management (2013-2018).
Cynthia Lo Bessette (1969)
Year of Election or Appointment: 2019
Secretary and Chief Legal Officer (CLO)
Ms. Lo Bessette also serves as an officer of other funds. Ms. Lo Bessette serves as CLO, Secretary, and Senior Vice President of Fidelity Management & Research Company LLC (investment adviser firm, 2019-present); CLO of Fidelity Management & Research (Hong Kong) Limited, FMR Investment Management (UK) Limited, and Fidelity Management & Research (Japan) Limited (investment adviser firms, 2019-present); Secretary of FD Funds GP LLC (2021-present), FD Funds Holding LLC (2021-present), and FD Funds Management LLC (2021-present); and Assistant Secretary of FIMM, LLC (2019-present). She is a Senior Vice President and Deputy General Counsel of FMR LLC (diversified financial services company, 2019-present), and is an employee of Fidelity Investments. Previously, Ms. Lo Bessette served as CLO, Secretary, and Senior Vice President of FMR Co., Inc. (investment adviser firm, 2019); Secretary of Fidelity SelectCo, LLC and Fidelity Investments Money Management, Inc. (investment adviser firms, 2019). Prior to joining Fidelity Investments, Ms. Lo Bessette was Executive Vice President, General Counsel (2016-2019) and Senior Vice President, Deputy General Counsel (2015-2016) of OppenheimerFunds (investment management company) and Deputy Chief Legal Officer (2013-2015) of Jennison Associates LLC (investment adviser firm).
Chris Maher (1972)
Year of Election or Appointment: 2020
Deputy Treasurer
Mr. Maher also serves as an officer of other funds. Mr. Maher serves as Assistant Treasurer of FIMM, LLC (2021-present) and FMR Capital, Inc. (2017-present), and is an employee of Fidelity Investments (2008-present). Previously, Mr. Maher served as Assistant Treasurer of certain funds (2013-2020); Vice President of Asset Management Compliance (2013), Vice President of the Program Management Group of FMR (investment adviser firm, 2010-2013), and Vice President of Valuation Oversight (2008-2010).
Jason P. Pogorelec (1975)
Year of Election or Appointment: 2020
Chief Compliance Officer
Mr. Pogorelec also serves as Chief Compliance Officer of other funds. Mr. Pogorelec is a senior Vice President of Asset Management Compliance for Fidelity Investments and is an employee of Fidelity Investments (2006-present). Previously, Mr. Pogorelec served as Vice President, Associate General Counsel for Fidelity Investments (2010-2020) and Assistant Secretary of certain Fidelity funds (2015-2020).
Brett Segaloff (1972)
Year of Election or Appointment: 2021
Anti-Money Laundering (AML) Officer
Mr. Segaloff also serves as an AML Officer of other funds and other related entities. He is Director, Anti-Money Laundering (2007-present) of FMR LLC (diversified financial services company) and is an employee of Fidelity Investments (1996-present).
Stacie M. Smith (1974)
Year of Election or Appointment: 2016
President and Treasurer
Ms. Smith also serves as an officer of other funds. Ms. Smith serves as Assistant Treasurer of FIMM, LLC (2021-present) and FMR Capital, Inc. (2017-present), is an employee of Fidelity Investments (2009-present), and has served in other fund officer roles. Prior to joining Fidelity Investments, Ms. Smith served as Senior Audit Manager of Ernst & Young LLP (accounting firm, 1996-2009). Previously, Ms. Smith served as Assistant Treasurer (2013-2019) and Deputy Treasurer (2013-2016) of certain Fidelity® funds.
Jim Wegmann (1979)
Year of Election or Appointment: 2019
Assistant Treasurer
Mr. Wegmann also serves as an officer of other funds. Mr. Wegmann serves as Assistant Treasurer of FIMM, LLC (2021-present) and is an employee of Fidelity Investments (2011-present). Previously, Mr. Wegmann served as Assistant Treasurer of certain Fidelity® funds (2019-2021).
Shareholder Expense Example
As a shareholder, you incur two types of costs: (1) transaction costs, which may include sales charges (loads) on purchase payments or redemption proceeds, as applicable and (2) ongoing costs, which generally include management fees, distribution and/or service (12b-1) fees and other Fund expenses. This Example is intended to help you understand your ongoing costs (in dollars) of investing in a fund and to compare these costs with the ongoing costs of investing in other mutual funds.
The Example is based on an investment of $1,000 invested at the beginning of the period and held for the entire period (February 1, 2022 to July 31, 2022).
Actual Expenses
The first line of the accompanying table provides information about actual account values and actual expenses. You may use the information in this line, together with the amount you invested, to estimate the expenses that you paid over the period. Simply divide your account value by $1,000.00 (for example, an $8,600 account value divided by $1,000.00 = 8.6), then multiply the result by the number in the first line for a class/Fund under the heading entitled "Expenses Paid During Period" to estimate the expenses you paid on your account during this period. If any fund is a shareholder of any underlying mutual funds or exchange-traded funds (ETFs) (the Underlying Funds), such fund indirectly bears its proportional share of the expenses of the Underlying Funds in addition to the direct expenses incurred presented in the table. These fees and expenses are not included in the annualized expense ratio used to calculate the expense estimate in the table below.
Hypothetical Example for Comparison Purposes
The second line of the accompanying table provides information about hypothetical account values and hypothetical expenses based on the actual expense ratio and an assumed rate of return of 5% per year before expenses, which is not the actual return. The hypothetical account values and expenses may not be used to estimate the actual ending account balance or expenses you paid for the period. You may use this information to compare the ongoing costs of investing in the Fund and other funds. To do so, compare this 5% hypothetical example with the 5% hypothetical examples that appear in the shareholder reports of the other funds. If any fund is a shareholder of any Underlying Funds, such fund indirectly bears its proportional share of the expenses of the Underlying Funds in addition to the direct expenses as presented in the table. These fees and expenses are not included in the annualized expense ratio used to calculate the expense estimate in the table below.
Please note that the expenses shown in the table are meant to highlight your ongoing costs only and do not reflect any transaction costs. Therefore, the second line of the table is useful in comparing ongoing costs only, and will not help you determine the relative total costs of owning different funds. In addition, if these transactional costs were included, your costs would have been higher.
| | Annualized Expense Ratio-A | Beginning
Account Value
February 1, 2022 | Ending
Account Value
July 31, 2022 | Expenses Paid
During Period-B
February 1, 2022
to July 31, 2022 |
| Fidelity Small Cap Growth Fund | | | | |
| Class A | 1.32% | | | |
| Actual | | $1,000.00 | $896.10 | $6.21 |
| Hypothetical-C | | $1,000.00 | $1,018.25 | $6.61 |
| Class M | 1.58% | | | |
| Actual | | $1,000.00 | $894.70 | $7.42 |
| Hypothetical-C | | $1,000.00 | $1,016.96 | $7.90 |
| Class C | 2.08% | | | |
| Actual | | $1,000.00 | $892.40 | $9.76 |
| Hypothetical- C | | $1,000.00 | $1,014.48 | $10.39 |
| Small Cap Growth | 1.05% | | | |
| Actual | | $1,000.00 | $897.30 | $4.94 |
| Hypothetical-C | | $1,000.00 | $1,019.59 | $5.26 |
| Class I | 1.06% | | | |
| Actual | | $1,000.00 | $897.30 | $4.99 |
| Hypothetical-C | | $1,000.00 | $1,019.54 | $5.31 |
| Class Z | .91% | | | |
| Actual | | $1,000.00 | $897.80 | $4.28 |
| Hypothetical-C | | $1,000.00 | $1,020.28 | $4.56 |
A Annualized expense ratio reflects expenses net of applicable fee waivers.
B Expenses are equal to the annualized expense ratio, multiplied by the average account value over the period, multiplied by 181/ 365 (to reflect the one-half year period). The fees and expenses of any Underlying Funds are not included in each annualized expense ratio.
C 5% return per year before expenses
Distributions (Unaudited)
The dividend and capital gains distributions for the fund are available on Fidelity.com or Institutional.Fidelity.com.
The fund hereby designates as a capital gain dividend with respect to the taxable year ended July 31, 2022, $200,444,529, or, if subsequently determined to be different, the net capital gain of such year.
The fund designates 100% of the short-term capital gain dividends distributed in September and December, respectively during the fiscal year as qualifying to be taxed as short-term capital gain dividends for nonresident alien shareholders.
Class A designates 4% and 100%; Class M designates 4% and 100%; Class C designates 4% and 0%; Small Cap Growth designates 4% and 84%; Class I designates 4% and 87%; and Class Z designates 4% and 71%; of the dividends distributed in September and December, respectively during the fiscal year as qualifying for the dividends–received deduction for corporate shareholders.
Class A designates 5% and 100%; Class M designates 5% and 100%; Class C designates 5% and 0%; Small Cap Growth designates 4% and 89%; Class I designates 4% and 92%; and Class Z designates 4% and 75%; of the dividends distributed in September and December, respectively during the fiscal year as amounts which may be taken into account as a dividend for purposes of the maximum rate under section 1(h)(11) of the Internal Revenue Code.
Class A designates 1% and 0%; Class M designates 1% and 0%; Class C designates 1% and 0%; Small Cap Growth designates 1% and 2%; Class I designates 1% and 2%; Class Z designates 1% and 1%; of the dividends distributed in September and December, respectively during the fiscal year as a section 199A dividend.
The fund will notify shareholders in January 2023 of amounts for use in preparing 2022 income tax returns.
Board Approval of Investment Advisory Contracts and Management Fees
Fidelity Small Cap Growth Fund
Each year, the Board of Trustees, including the Independent Trustees (together, the Board), votes on the renewal of the management contract with Fidelity Management & Research Company LLC (FMR) and the sub-advisory agreements (together, the Advisory Contracts) for the fund. FMR and the sub-advisers are referred to herein as the Investment Advisers. The Board, assisted by the advice of fund counsel and Independent Trustees' counsel, requests and considers a broad range of information relevant to the renewal of the Advisory Contracts throughout the year.
The Board meets regularly and, at each of its meetings, covers an extensive agenda of topics and materials and considers factors that are relevant to its annual consideration of the renewal of the fund's Advisory Contracts, including the services and support provided to the fund and its shareholders. The Board has established various standing committees (Committees), each composed of and chaired by Independent Trustees with varying backgrounds, to which the Board has assigned specific subject matter responsibilities in order to enhance effective decision-making by the Board. The Board, acting directly and through its Committees, requests and receives information concerning the annual consideration of the renewal of the fund's Advisory Contracts. The Board also meets as needed to review matters specifically related to the Board's annual consideration of the renewal of the Advisory Contracts. Members of the Board may also meet with trustees of other Fidelity funds through joint ad hoc committees to discuss certain matters relevant to all of the Fidelity funds.
At its May 2022 meeting, the Board unanimously determined to renew the fund's Advisory Contracts. In reaching its determination, the Board considered all factors it believed relevant, including (i) the nature, extent, and quality of the services provided to the fund and its shareholders (including the investment performance of the fund); (ii) the competitiveness relative to peer funds of the fund's management fee and total expense ratio of a representative class (retail class); (iii) the total costs of the services provided by and the profits realized by Fidelity from its relationships with the fund; and (iv) the extent to which, if any, economies of scale exist and are realized as the fund grows, and whether any economies of scale are appropriately shared with fund shareholders.
In considering whether to renew the Advisory Contracts for the fund, the Board reached a determination, with the assistance of fund counsel and Independent Trustees' counsel and through the exercise of its business judgment, that the renewal of the Advisory Contracts was in the best interests of the fund and its shareholders and that the compensation payable under the Advisory Contracts was fair and reasonable. The Board's decision to renew the Advisory Contracts was not based on any single factor, but rather was based on a comprehensive consideration of all the information provided to the Board at its meetings throughout the year. The Board, in reaching its determination to renew the Advisory Contracts, was aware that shareholders of the fund have a broad range of investment choices available to them, including a wide choice among funds offered by Fidelity's competitors, and that the fund's shareholders, who have the opportunity to review and weigh the disclosure provided by the fund in its prospectus and other public disclosures, have chosen to invest in this fund, which is part of the Fidelity family of funds.
Nature, Extent, and Quality of Services Provided. The Board considered Fidelity's staffing as it relates to the fund, including the backgrounds of investment personnel of Fidelity, and also considered the fund's investment objective, strategies, and related investment philosophy. The Independent Trustees also had discussions with senior management of Fidelity's investment operations and investment groups. The Board considered the structure of the investment personnel compensation program and whether this structure provides appropriate incentives to act in the best interests of the fund. Additionally, the Board considered the portfolio managers' investments, if any, in the funds that they manage. The Board also considered the steps Fidelity had taken to ensure the continued provision of high quality services to the Fidelity funds during the COVID-19 pandemic, including the expansion of staff in client facing positions to maintain service levels in periods of high volumes and volatility.
Resources Dedicated to Investment Management and Support Services. The Board and the Fund Oversight and Research Committees reviewed the general qualifications and capabilities of Fidelity's investment staff, including its size, education, experience, and resources, as well as Fidelity's approach to recruiting, training, managing, and compensating investment personnel. The Board noted the resources devoted to expansion of Fidelity's global investment organization, and that Fidelity's analysts have extensive resources, tools, and capabilities that allow them to conduct sophisticated quantitative and fundamental analysis, as well as credit analysis of issuers, counterparties, and guarantors. Further, the Board considered that Fidelity's investment professionals have sufficient access to global information and data so as to provide competitive investment results over time, and that those professionals also have access to sophisticated tools that permit them to assess portfolio construction and risk and performance attribution characteristics continuously, as well as to transmit new information and research conclusions rapidly around the world. Additionally, in its deliberations, the Board considered Fidelity's trading, risk management, compliance, and technology and operations capabilities and resources, which are integral parts of the investment management process.
Shareholder and Administrative Services. The Board considered (i) the nature, extent, quality, and cost of advisory, administrative, and shareholder services performed by the Investment Advisers and their affiliates under the Advisory Contracts and under separate agreements covering transfer agency, pricing and bookkeeping, and securities lending services for the fund; (ii) the nature and extent of the supervision of third party service providers, principally custodians, subcustodians, and pricing vendors; and (iii) the resources devoted to, and the record of compliance with, the fund's compliance policies and procedures. The Board also reviewed the allocation of fund brokerage, including allocations to brokers affiliated with the Investment Advisers, the use of brokerage commissions to pay fund expenses, and the use of "soft" commission dollars to pay for research services.
The Board noted that the growth of fund assets over time across the complex allows Fidelity to reinvest in the development of services designed to enhance the value and convenience of the Fidelity funds as investment vehicles. These services include 24-hour access to account information and market information over the Internet and through telephone representatives, investor education materials, and asset allocation tools. The Board also considered that it reviews customer service metrics such as telephone response times, continuity of services on the website and metrics addressing services at Fidelity Investor Centers.
Investment in a Large Fund Family. The Board considered the benefits to shareholders of investing in a Fidelity fund, including the benefits of investing in a fund that is part of a large family of funds offering a variety of investment disciplines and providing a large variety of mutual fund investor services. The Board noted that Fidelity had taken, or had made recommendations that resulted in the Fidelity funds taking, a number of actions over the previous year that benefited particular funds, including: (i) continuing to dedicate additional resources to Fidelity's investment research process, which includes meetings with management of issuers of securities in which the funds invest; (ii) continuing efforts to enhance Fidelity's global research capabilities; (iii) launching new funds and ETFs with innovative structures, strategies and pricing and making other enhancements to meet client needs; (iv) launching new share classes of existing funds; (v) eliminating purchase minimums and broadening eligibility requirements for certain funds and share classes; (vi) reducing management fees and total expenses for certain target date funds and classes and index funds; (vii) lowering expenses for certain existing funds and classes by implementing or lowering expense caps; (viii) rationalizing product lines and gaining increased efficiencies from fund mergers and liquidations; (ix) continuing to develop, acquire and implement systems and technology to improve services to the funds and shareholders, strengthen information security, and increase efficiency; and (x) continuing to implement enhancements to further strengthen Fidelity's product line to increase investors' probability of success in achieving their investment goals, including retirement income goals.
Investment Performance. The Board considered whether the fund has operated in accordance with its investment objective, as well as its record of compliance with its investment restrictions and its performance history.
The Board took into account discussions that occur at Board meetings throughout the year with representatives of the Investment Advisers about fund investment performance. In this regard the Board noted that as part of regularly scheduled fund reviews and other reports to the Board on fund performance, the Board considers annualized return information for the fund for different time periods, measured against an appropriate securities market index (benchmark index) and an appropriate peer group of funds with similar objectives (peer group). The Board also reviews and considers information about performance attribution. In its evaluation of fund investment performance, the Board gave particular attention to information indicating changes in performance of certain Fidelity funds for specific time periods and discussed with the Investment Advisers the reasons for any overperformance or underperformance.
In addition to reviewing absolute and relative fund performance, the Independent Trustees periodically consider the appropriateness of fund performance metrics in evaluating the results achieved. In general, the Independent Trustees believe that fund performance should be evaluated based on net performance (after fees and expenses) of the representative class compared to appropriate benchmark indices, over appropriate time periods that may include full market cycles, and compared to peer groups, as applicable, over the same periods, taking into account relevant factors including the following: general market conditions; issuer-specific information; and fund cash flows and other factors.
The Independent Trustees recognize that shareholders evaluate performance on a net basis over their own holding periods, for which one-, three-, and five-year periods are often used as a proxy. For this reason, the performance information reviewed by the Board also included net cumulative total return information for the fund and an appropriate benchmark index and peer group for the most recent one-, three-, and five-year periods ended September 30, 2021, as shown below. Returns are shown compared to the 25th percentile (top of box, 75% beaten) and 75th percentile (bottom of box, 25% beaten) of the peer universe.
Fidelity Small Cap Growth Fund
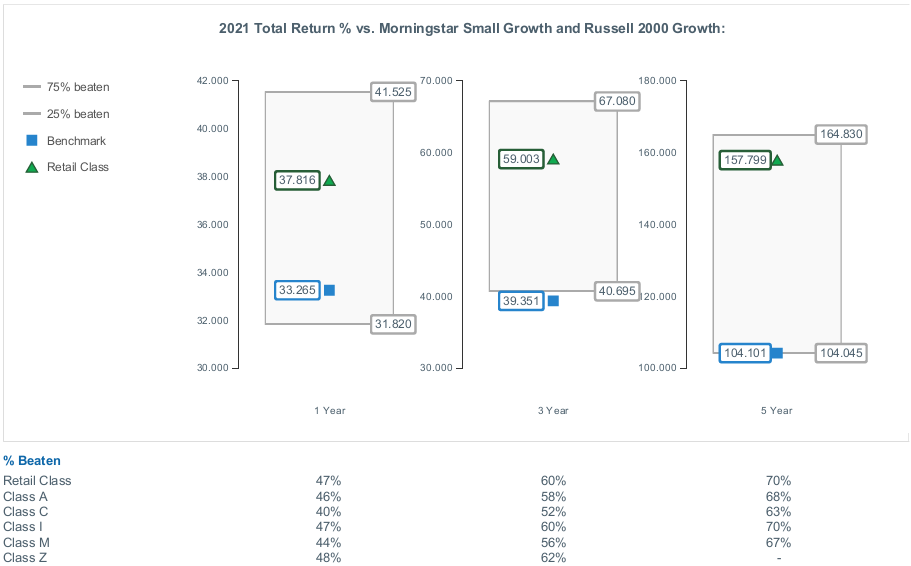
The Board also considered that the fund's management fee is subject to upward or downward adjustment depending upon whether, and to what extent, the fund's investment performance for the performance period (a rolling 36-month period) exceeds, or is exceeded by, a securities index, thus leading to a performance adjustment for the same period. The Board noted that the performance adjustment provides FMR with a strong economic incentive to seek to achieve superior long-term performance for the fund's shareholders and helps to more closely align the interests of FMR and the shareholders of the fund.
Based on its review, the Board concluded that the nature, extent, and quality of services provided to the fund under the Advisory Contracts should continue to benefit the shareholders of the fund.
Competitiveness of Management Fee and Total Expense Ratio. The Board considered the fund's management fee and total expense ratio compared to "mapped groups" of competitive funds and classes created for the purpose of facilitating the Trustees' competitive analysis of management fees and total expenses. Fidelity creates "mapped groups" by combining similar Lipper investment objective categories that have comparable investment mandates. Combining Lipper investment objective categories aids the Board's management fee and total expense ratio comparisons by broadening the competitive group used for comparison.
Management Fee. The Board considered two proprietary management fee comparisons for the 12-month periods ended September 30 (June 30 for periods ended 2019 and 2018 and December 31 for periods prior to 2018) shown in basis points (BP) in the chart below. The group of Lipper funds used by the Board for management fee comparisons is referred to below as the "Total Mapped Group." The Total Mapped Group comparison focuses on a fund's standing in terms of gross management fees before expense reimbursements or caps, and without giving effect to the fund's performance adjustment, relative to the total universe of funds with comparable investment mandates, regardless of whether their management fee structures also are comparable. Funds with comparable investment mandates offer exposure to similar types of securities. Funds with comparable management fee structures have similar management fee contractual arrangements (
e.g., flat rate charged for advisory services, all-inclusive fee rate,
etc.). "TMG %" represents the percentage of funds in the Total Mapped Group that had management fees that were lower than the fund's. For example, a hypothetical TMG % of 20% would mean that 80% of the funds in the Total Mapped Group had higher, and 20% had lower, management fees than the fund. The fund's actual TMG %s and the number of funds in the Total Mapped Group are in the chart below. The "Asset-Sized Peer Group" (ASPG) comparison focuses on a fund's standing relative to a subset of non-Fidelity funds within the Total Mapped Group that are similar in size and management fee structure without taking into account performance adjustments, if any. For example, if a fund is in the first quartile of the ASPG, the fund's management fee ranks in the least expensive or lowest 25% of funds in the ASPG. The ASPG represents at least 15% of the funds in the Total Mapped Group with comparable asset size and management fee structures, subject to a minimum of 50 funds (or all funds in the Total Mapped Group if fewer than 50). Additional information, such as the ASPG quartile in which the fund's management fee rate ranked and the impact of the fund's performance adjustment, is also included in the chart and was considered by the Board.
Fidelity Small Cap Growth Fund
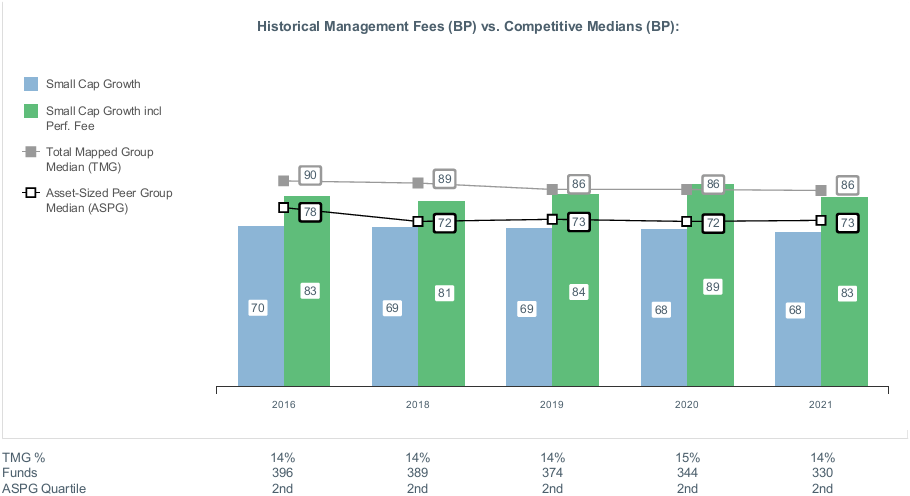
The Board noted that the fund's management fee rate ranked below the median of its Total Mapped Group and below the median of its ASPG for the 12-month period ended September 30, 2021. The Board also noted the effect of the fund's performance adjustment, if any, on the fund's management fee ranking.
The Board also considered that, for funds subject to the group fee, FMR agreed to voluntarily waive fees over a specified period of time in amounts designed to account for assets converted from certain funds to certain collective investment trusts.
Based on its review, the Board concluded that the fund's management fee is fair and reasonable in light of the services that the fund receives and the other factors considered.
Total Expense Ratio. In its review of the total expense ratio of the representative class (retail class), the Board considered the fund's management fee rate as well as other fund or class expenses, as applicable, such as transfer agent fees, pricing and bookkeeping fees, fund-paid 12b-1 fees, and custodial, legal, and audit fees. The Board noted the impact of the fund's performance adjustment. The Board also noted that Fidelity may agree to waive fees or reimburse expenses from time to time, and the extent to which, if any, it has done so for the fund. The fund's representative class is compared to those funds and classes in the Total Mapped Group (used by the Board for management fee comparisons) that have a similar sales load structure. The Board also considered a total expense ASPG comparison for the representative class, which focuses on the total expenses of the representative class relative to a subset of non-Fidelity funds within the total expense similar sales load structure group. The total expense ASPG is limited to 15 larger and 15 smaller classes in fund average assets for a total of 30 classes, where possible. The total expense ASPG comparison excludes performance adjustments and fund-paid 12b-1 fees to eliminate variability in fee structures.
The Board noted that the total net expense ratio of the retail class ranked below the similar sales load structure group competitive median and below the ASPG competitive median for the 12-month period ended September 30, 2021.
Fees Charged to Other Fidelity Clients. The Board also considered Fidelity fee structures and other information with respect to clients of Fidelity, such as other funds advised or subadvised by Fidelity, pension plan clients, and other institutional clients with similar mandates. The Board noted that a joint ad hoc committee created by it and the boards of other Fidelity funds periodically reviews and compares Fidelity's institutional investment advisory business with its business of providing services to the Fidelity funds and also noted the most recent findings of the committee. The Board noted that the committee's review included a consideration of the differences in services provided, fees charged, and costs incurred, as well as competition in the markets serving the different categories of clients.
Based on its review of total expense ratios and fees charged to other Fidelity clients, the Board concluded that the total expense ratio of each class of the fund was reasonable in light of the services that the fund and its shareholders receive and the other factors considered.
Costs of the Services and Profitability. The Board considered the revenues earned and the expenses incurred by Fidelity in conducting the business of developing, marketing, distributing, managing, administering and servicing the fund and servicing the fund's shareholders. The Board also considered the level of Fidelity's profits in respect of all the Fidelity funds.
On an annual basis, Fidelity presents to the Board information about the profitability of its relationships with the fund. Fidelity calculates profitability information for each fund, as well as aggregate profitability information for groups of Fidelity funds and all Fidelity funds, using a series of detailed revenue and cost allocation methodologies which originate with the books and records of Fidelity on which Fidelity's audited financial statements are based. The Audit Committee of the Board reviews any significant changes from the prior year's methodologies and the full Board approves such changes.
A public accounting firm has been engaged annually by the Board as part of the Board's assessment of Fidelity's profitability analysis. The engagement includes the review and assessment of the methodologies used by Fidelity in determining the revenues and expenses attributable to Fidelity's mutual fund business, and completion of agreed-upon procedures in respect of the mathematical accuracy of certain fund profitability information and its conformity to established allocation methodologies. After considering the reports issued under the engagement and information provided by Fidelity, the Board concluded that while other allocation methods may also be reasonable, Fidelity's profitability methodologies are reasonable in all material respects.
The Board also reviewed Fidelity's non-fund businesses and potential indirect benefits such businesses may have received as a result of their association with Fidelity's mutual fund business (i.e., fall-out benefits) as well as cases where Fidelity's affiliates may benefit from the funds' business. The Board considered areas where potential indirect benefits to the Fidelity funds from their relationships with Fidelity may exist. The Board's consideration of these matters was informed by the findings of a joint ad hoc committee created by it and the boards of other Fidelity funds to evaluate potential fall-out benefits.
The Board considered the costs of the services provided by and the profits realized by Fidelity in connection with the operation of the fund and was satisfied that the profitability was not excessive.
Economies of Scale. The Board considered whether there have been economies of scale in respect of the management of the Fidelity funds, whether the Fidelity funds (including the fund) have appropriately benefited from any such economies of scale, and whether there is potential for realization of any further economies of scale. The Board considered the extent to which the fund will benefit from economies of scale as assets grow through increased services to the fund, through waivers or reimbursements, or through fee or expense ratio reductions. The Board also noted that a committee (the Economies of Scale Committee) created by it and the boards of other Fidelity funds periodically analyzes whether Fidelity attains economies of scale in respect of the management and servicing of the Fidelity funds, whether the Fidelity funds have appropriately benefited from such economies of scale, and whether there is potential for realization of any further economies of scale.
The Board recognized that the fund's management contract incorporates a "group fee" structure, which provides for lower group fee rates as total "group assets" increase, and for higher group fee rates as total "group assets" decrease ("group assets" as defined in the management contract). FMR calculates the group fee rates based on a tiered asset "breakpoint" schedule that varies based on asset class. The Board considered that the group fee is designed to deliver the benefits of economies of scale to fund shareholders when total Fidelity fund assets increase, even if assets of any particular fund are unchanged or have declined, because some portion of Fidelity's costs are attributable to services provided to all Fidelity funds, and all funds benefit if those costs can be allocated among more assets. The Board further considered that Fidelity agreed to impose a temporary fee waiver in the form of additional breakpoints to the current breakpoint schedule. The Board concluded that, given the group fee structure, fund shareholders will benefit from lower management fees as "group assets" increase at the fund complex level, regardless of whether Fidelity achieves any such economies of scale.
The Board concluded, taking into account the analysis of the Economies of Scale Committee, that economies of scale, if any, are being appropriately shared between fund shareholders and Fidelity.
Additional Information Requested by the Board. In order to develop fully the factual basis for consideration of the Fidelity funds' advisory contracts, the Board requested and received additional information on certain topics, including: (i) fund flow and performance trends, in particular the underperformance of certain funds and strategies, and Fidelity's long-term strategies for certain funds, including any consideration of fund liquidations or mergers; (ii) the operation of performance fees, competitor use of performance fees, and consideration of the expansion of performance fees to additional funds; (iii) Fidelity's pricing philosophy compared to competitors; (iv) fund profitability methodology and data; (v) evaluation of competitive fund data and peer group classifications and fee and expense comparisons; (vi) the management fee and expense structures for different funds and classes and information about the differences between various fee and expense structures; (vii) group fee breakpoints and related voluntary fee waivers; and (viii) information regarding other accounts managed by Fidelity and the funds' sub-advisory arrangements.
Based on its evaluation of all of the conclusions noted above, and after considering all factors it believed relevant, the Board concluded that the advisory fee arrangements are fair and reasonable and that the fund's Advisory Contracts should be renewed.
Liquidity Risk Management Program
The Securities and Exchange Commission adopted Rule 22e-4 under the Investment Company Act of 1940 (the Liquidity Rule) to promote effective liquidity risk management throughout the open-end investment company industry, thereby reducing the risk that funds will be unable to meet their redemption obligations and mitigating dilution of the interests of fund shareholders.
The Fund has adopted and implemented a liquidity risk management program pursuant to the Liquidity Rule (the Program) effective December 1, 2018. The Program is reasonably designed to assess and manage the Fund’s liquidity risk and to comply with the requirements of the Liquidity Rule. The Fund’s Board of Trustees (the Board) has designated the Fund’s investment adviser as administrator of the Program. The Fidelity advisers have established a Liquidity Risk Management Committee (the LRM Committee) to manage the Program for each of the Fidelity Funds. The LRM Committee monitors the adequacy and effectiveness of implementation of the Program and on a periodic basis assesses each Fund’s liquidity risk based on a variety of factors including (1) the Fund’s investment strategy, (2) portfolio liquidity and cash flow projections during normal and reasonably foreseeable stressed conditions, (3) shareholder redemptions, (4) borrowings and other funding sources and (5) in the case of exchange-traded funds, certain additional factors including the effect of the Fund’s prices and spreads, market participants, and basket compositions on the overall liquidity of the Fund’s portfolio, as applicable.
In accordance with the Program, each of the Fund’s portfolio investments is classified into one of four liquidity categories described below based on a determination of a reasonable expectation for how long it would take to convert the investment to cash (or sell or dispose of the investment) without significantly changing its market value.
- Highly liquid investments – cash or convertible to cash within three business days or less
- Moderately liquid investments – convertible to cash in three to seven calendar days
- Less liquid investments – can be sold or disposed of, but not settled, within seven calendar days
- Illiquid investments – cannot be sold or disposed of within seven calendar days
Liquidity classification determinations take into account a variety of factors including various market, trading and investment-specific considerations, as well as market depth, and generally utilize analysis from a third-party liquidity metrics service.
The Liquidity Rule places a 15% limit on a fund’s illiquid investments and requires funds that do not primarily hold assets that are highly liquid investments to determine and maintain a minimum percentage of the fund’s net assets to be invested in highly liquid investments (highly liquid investment minimum or HLIM). The Program includes provisions reasonably designed to comply with the 15% limit on illiquid investments and for determining, periodically reviewing and complying with the HLIM requirement as applicable.
At a recent meeting of the Fund’s Board of Trustees, the LRM Committee provided a written report to the Board pertaining to the operation, adequacy, and effectiveness of implementation of the Program for the annual period from December 1, 2020 through November 30, 2021. The report concluded that the Program has been implemented and is operating effectively and is reasonably designed to assess and manage the Fund’s liquidity risk.
SCP-ANN-0922
1.803695.117
Fidelity® Small Cap Growth K6 Fund
Annual Report
July 31, 2022
Contents
To view a fund's proxy voting guidelines and proxy voting record for the 12-month period ended June 30, visit http://www.fidelity.com/proxyvotingresults or visit the Securities and Exchange Commission's (SEC) web site at http://www.sec.gov.
You may also call 1-800-835-5092 to request a free copy of the proxy voting guidelines.
Standard & Poor's, S&P and S&P 500 are registered service marks of The McGraw-Hill Companies, Inc. and have been licensed for use by Fidelity Distributors Corporation.
Other third-party marks appearing herein are the property of their respective owners.
All other marks appearing herein are registered or unregistered trademarks or service marks of FMR LLC or an affiliated company. © 2022 FMR LLC. All rights reserved.
This report and the financial statements contained herein are submitted for the general information of the shareholders of the Fund. This report is not authorized for distribution to prospective investors in the Fund unless preceded or accompanied by an effective prospectus.
A fund files its complete schedule of portfolio holdings with the SEC for the first and third quarters of each fiscal year on Form N-PORT. Forms N-PORT are available on the SEC’s web site at http://www.sec.gov. A fund's Forms N-PORT may be reviewed and copied at the SEC’s Public Reference Room in Washington, DC. Information regarding the operation of the SEC's Public Reference Room may be obtained by calling 1-800-SEC-0330.
For a complete list of a fund's portfolio holdings, view the most recent holdings listing, semiannual report, or annual report on Fidelity's web site at http://www.fidelity.com, http://www.institutional.fidelity.com, or http://www.401k.com, as applicable.
NOT FDIC INSURED •MAY LOSE VALUE •NO BANK GUARANTEE
Neither the Fund nor Fidelity Distributors Corporation is a bank.
Note to Shareholders:
Early in 2020, the outbreak and spread of COVID-19 emerged as a public health emergency that had a major influence on financial markets, primarily based on its impact on the global economy and corporate earnings. On March 11, 2020, the World Health Organization declared the COVID-19 outbreak a pandemic, citing sustained risk of further global spread. The pandemic prompted a number of measures to limit the spread of COVID-19, including travel and border restrictions, quarantines, and restrictions on large gatherings. In turn, these resulted in lower consumer activity, diminished demand for a wide range of products and services, disruption in manufacturing and supply chains, and – given the wide variability in outcomes regarding the outbreak – significant market uncertainty and volatility. To help stem the turmoil, the U.S. government took unprecedented action – in concert with the U.S. Federal Reserve and central banks around the world – to help support consumers, businesses, and the broader economy, and to limit disruption to the financial system.
In general, the overall impact of the pandemic lessened in 2021, amid a resilient economy and widespread distribution of three COVID-19 vaccines granted emergency use authorization from the U.S. Food and Drug Administration (FDA) early in the year. Still, the situation remains dynamic, and the extent and duration of its influence on financial markets and the economy is highly uncertain, due in part to a recent spike in cases based on highly contagious variants of the coronavirus.
Extreme events such as the COVID-19 crisis are exogenous shocks that can have significant adverse effects on mutual funds and their investments. Although multiple asset classes may be affected by market disruption, the duration and impact may not be the same for all types of assets. Fidelity is committed to helping you stay informed amid news about COVID-19 and during increased market volatility, and we continue to take extra steps to be responsive to customer needs. We encourage you to visit us online, where we offer ongoing updates, commentary, and analysis on the markets and our funds.
Performance: The Bottom Line
Average annual total return reflects the change in the value of an investment, assuming reinvestment of distributions from dividend income and capital gains (the profits earned upon the sale of securities that have grown in value, if any) and assuming a constant rate of performance each year. The hypothetical investment and the average annual total returns do not reflect the deduction of taxes that a shareholder would pay on fund distributions or the redemption of fund shares. During periods of reimbursement by Fidelity, a fund’s total return will be greater than it would be had the reimbursement not occurred. How a fund did yesterday is no guarantee of how it will do tomorrow.
Average Annual Total Returns
| For the periods ended July 31, 2022 | Past 1 year | Past 5 years | Life of fundA |
| Fidelity® Small Cap Growth K6 Fund | (20.31)% | 11.58% | 12.03% |
A From May 25, 2017
$10,000 Over Life of Fund
Let's say hypothetically that $10,000 was invested in Fidelity® Small Cap Growth K6 Fund on May 25, 2017, when the fund started.
The chart shows how the value of your investment would have changed, and also shows how the Russell 2000® Growth Index performed over the same period.
| Period Ending Values |
| $18,024 | Fidelity® Small Cap Growth K6 Fund |
| $14,435 | Russell 2000® Growth Index |
Management's Discussion of Fund Performance
Market Recap: The S&P 500
® index returned -4.64% for the 12 months ending July 31, 2022, as a multitude of crosscurrents challenged the global economy and financial markets. Persistently high inflation, exacerbated by energy price shocks from the Russia–Ukraine conflict, spurred the U.S. Federal Reserve to hike interest rates more aggressively than anticipated, and concerns about the outlook for economic growth sent stocks into bear market territory. In early May, the Fed approved a rare half-percentage-point interest rate increase and announced plans to shrink its $9 trillion asset portfolio. June began with the Fed allowing up to billions in Treasuries and mortgage bonds to mature every month without investing the proceeds. Two weeks later, the central bank raised rates by 0.75 percentage points, its largest increase since 1994, and said it was becoming more difficult to achieve a soft landing, in which the economy slows enough to bring down inflation while avoiding a recession. Against this volatile backdrop, the S&P 500 posted its worst first-half result (-19.96%) to begin a year since 1970. Stocks sharply reversed course in July (+9.22%), as the Fed again raised its benchmark interest rate by 0.75% but signaled that, at some point, it will likely slow the pace of tightening to assess the impact on the economy. For the full 12 months, growth-oriented communication services (-29%) and consumer discretionary (-10%) stocks lagged most. In contrast, energy (+67%) rode a surge in commodity prices and led by a wide margin, followed by the defensive utilities (+16%) and consumer staples (+7%) sectors.
Comments from Portfolio Manager Patrick Venanzi: For the fiscal year ending July 31, 2022, the fund returned -20.31%, outperforming the -23.18% result of the benchmark Russell 2000
® Growth Index. Versus the benchmark, security selection was the primary contributor. Specifically, security selection in industrials, communication services and health care boosted the fund's relative result. The biggest individual relative contributor was an overweight position in Antero Resources (+193%). Also boosting value was our outsized stake in SiTime, which gained 37%. SiTime was among our largest holdings. The fund's non-benchmark stake in Builders FirstSource gained 53%. We reduced our stake in the company the past year. Conversely, the largest detractor from performance versus the benchmark was our security selection in consumer discretionary. Weak picks in utilities also hampered relative performance. Also hurting the fund's relative performance was an underweighting in the consumer staples sector, especially within the food, beverage & tobacco industry. The biggest individual relative detractor was an overweight position in FIGS (-74%), which was a position we established the past 12 months. Another notable relative detractor was an overweighting in Porch (-89%). This period we increased our stake. Another detractor was our overweighting in American Eagle Outfitters (-62%), a position that was sold the past year. Notable changes in positioning include decreased exposure to the consumer discretionary sector and a higher allocation to industrials.
The views expressed above reflect those of the portfolio manager(s) only through the end of the period as stated on the cover of this report and do not necessarily represent the views of Fidelity or any other person in the Fidelity organization. Any such views are subject to change at any time based upon market or other conditions and Fidelity disclaims any responsibility to update such views. These views may not be relied on as investment advice and, because investment decisions for a Fidelity fund are based on numerous factors, may not be relied on as an indication of trading intent on behalf of any Fidelity fund.
Investment Summary (Unaudited)
Top Ten Stocks as of July 31, 2022
| | % of fund's net assets |
| Crocs, Inc. | 1.3 |
| TechTarget, Inc. | 1.3 |
| Bumble, Inc. | 1.3 |
| CACI International, Inc. Class A | 1.2 |
| Avid Technology, Inc. | 1.2 |
| SiTime Corp. | 1.1 |
| Performance Food Group Co. | 1.1 |
| Acadia Healthcare Co., Inc. | 1.0 |
| Insulet Corp. | 1.0 |
| Molina Healthcare, Inc. | 1.0 |
| | 11.5 |
Market Sectors as of July 31, 2022
| | % of fund's net assets |
| Health Care | 22.6 |
| Industrials | 18.5 |
| Information Technology | 17.4 |
| Consumer Discretionary | 10.9 |
| Financials | 5.3 |
| Energy | 5.2 |
| Communication Services | 4.6 |
| Materials | 4.1 |
| Consumer Staples | 3.5 |
| Utilities | 1.0 |
| Real Estate | 0.5 |
Asset Allocation (% of fund's net assets)
| As of July 31, 2022* |
| | Stocks | 93.3% |
| | Convertible Securities | 2.1% |
| | Short-Term Investments and Net Other Assets (Liabilities) | 4.6% |

* Foreign investments - 8.1%
Schedule of Investments July 31, 2022
Showing Percentage of Net Assets
| Common Stocks - 91.5% | | | |
| | | Shares | Value |
| COMMUNICATION SERVICES - 4.5% | | | |
| Diversified Telecommunication Services - 0.2% | | | |
| IDT Corp. Class B (a) | | 75,105 | $1,954,983 |
| Interactive Media & Services - 2.1% | | | |
| Bumble, Inc. (a)(b) | | 415,851 | 15,769,070 |
| CarGurus, Inc. Class A (a) | | 257,789 | 6,261,695 |
| Cars.com, Inc. (a) | | 353,288 | 4,154,667 |
| | | | 26,185,432 |
| Media - 1.7% | | | |
| Nexstar Broadcasting Group, Inc. Class A | | 30,199 | 5,688,586 |
| TechTarget, Inc. (a) | | 247,613 | 16,141,891 |
| | | | 21,830,477 |
| Wireless Telecommunication Services - 0.5% | | | |
| Gogo, Inc. (a) | | 386,482 | 6,709,328 |
|
| TOTAL COMMUNICATION SERVICES | | | 56,680,220 |
|
| CONSUMER DISCRETIONARY - 10.9% | | | |
| Auto Components - 1.1% | | | |
| Autoliv, Inc. | | 38,137 | 3,279,782 |
| Fox Factory Holding Corp. (a) | | 62,223 | 5,890,029 |
| Gentherm, Inc. (a) | | 72,596 | 4,686,798 |
| | | | 13,856,609 |
| Diversified Consumer Services - 1.3% | | | |
| Duolingo, Inc. (a)(b) | | 33,294 | 3,054,725 |
| Grand Canyon Education, Inc. (a) | | 65,756 | 6,317,179 |
| H&R Block, Inc. | | 112,672 | 4,502,373 |
| Rover Group, Inc. Class A (a) | | 562,527 | 2,458,243 |
| | | | 16,332,520 |
| Hotels, Restaurants & Leisure - 2.2% | | | |
| Churchill Downs, Inc. | | 41,778 | 8,765,024 |
| Dutch Bros, Inc. (b) | | 101,878 | 3,819,406 |
| Everi Holdings, Inc. (a) | | 170,597 | 3,277,168 |
| Kura Sushi U.S.A., Inc. Class A (a) | | 43,052 | 3,635,311 |
| Lindblad Expeditions Holdings (a) | | 723,183 | 5,713,146 |
| SeaWorld Entertainment, Inc. (a) | | 61,400 | 2,930,622 |
| | | | 28,140,677 |
| Household Durables - 0.7% | | | |
| GoPro, Inc. Class A (a) | | 406,502 | 2,585,353 |
| Helen of Troy Ltd. (a) | | 10,805 | 1,445,601 |
| Lovesac (a) | | 155,164 | 4,834,910 |
| | | | 8,865,864 |
| Internet & Direct Marketing Retail - 0.2% | | | |
| BARK, Inc. (a) | | 446,748 | 638,850 |
| BARK, Inc. (a)(c) | | 267,300 | 382,239 |
| BARK, Inc. warrants 8/29/25 (a) | | 133,865 | 21,418 |
| Porch Group, Inc. Class A (a)(b) | | 727,038 | 1,403,183 |
| thredUP, Inc. (a) | | 282,620 | 635,895 |
| Xometry, Inc. | | 6,460 | 245,480 |
| | | | 3,327,065 |
| Specialty Retail - 3.5% | | | |
| Aritzia, Inc. (a) | | 242,500 | 7,650,619 |
| Boot Barn Holdings, Inc. (a) | | 32,800 | 2,043,440 |
| Dick's Sporting Goods, Inc. (b) | | 51,254 | 4,796,862 |
| Fanatics, Inc. Class A (c)(d) | | 163,048 | 10,536,162 |
| Five Below, Inc. (a) | | 23,740 | 3,016,642 |
| Floor & Decor Holdings, Inc. Class A (a) | | 70,557 | 5,684,777 |
| Lithia Motors, Inc. Class A (sub. vtg.) | | 15,327 | 4,065,947 |
| Williams-Sonoma, Inc. (b) | | 42,691 | 6,165,434 |
| | | | 43,959,883 |
| Textiles, Apparel & Luxury Goods - 1.9% | | | |
| Algolia, Inc. (c)(d) | | 43,269 | 794,852 |
| Crocs, Inc. (a) | | 238,490 | 17,085,424 |
| Kontoor Brands, Inc. | | 159,141 | 5,808,647 |
| | | | 23,688,923 |
|
| TOTAL CONSUMER DISCRETIONARY | | | 138,171,541 |
|
| CONSUMER STAPLES - 3.5% | | | |
| Beverages - 0.3% | | | |
| Boston Beer Co., Inc. Class A (a) | | 8,500 | 3,233,655 |
| Food & Staples Retailing - 3.0% | | | |
| BJ's Wholesale Club Holdings, Inc. (a) | | 150,249 | 10,171,857 |
| Grocery Outlet Holding Corp. (a)(b) | | 115,665 | 4,941,209 |
| Performance Food Group Co. (a) | | 272,486 | 13,545,279 |
| U.S. Foods Holding Corp. (a) | | 274,784 | 8,655,696 |
| | | | 37,314,041 |
| Food Products - 0.0% | | | |
| The Real Good Food Co. LLC: | | | |
| Class B (d) | | 45,833 | 0 |
| Class B unit (e) | | 45,833 | 297,915 |
| | | | 297,915 |
| Personal Products - 0.2% | | | |
| The Beauty Health Co. (a)(b) | | 220,318 | 2,934,636 |
|
| TOTAL CONSUMER STAPLES | | | 43,780,247 |
|
| ENERGY - 5.2% | | | |
| Energy Equipment & Services - 0.7% | | | |
| TechnipFMC PLC (a) | | 1,040,761 | 8,419,756 |
| Oil, Gas & Consumable Fuels - 4.5% | | | |
| Antero Resources Corp. (a) | | 282,085 | 11,181,849 |
| Civitas Resources, Inc. | | 50,692 | 2,988,800 |
| Denbury, Inc. (a) | | 119,703 | 8,607,843 |
| Enviva, Inc. | | 130,178 | 9,064,294 |
| Genesis Energy LP | | 728,049 | 7,273,210 |
| HF Sinclair Corp. | | 84,599 | 4,045,524 |
| Northern Oil & Gas, Inc. | | 110,541 | 3,186,897 |
| PDC Energy, Inc. | | 34,424 | 2,261,313 |
| Range Resources Corp. (a) | | 269,971 | 8,927,941 |
| | | | 57,537,671 |
|
| TOTAL ENERGY | | | 65,957,427 |
|
| FINANCIALS - 5.3% | | | |
| Banks - 1.7% | | | |
| East West Bancorp, Inc. | | 34,963 | 2,509,644 |
| First Interstate Bancsystem, Inc. | | 62,922 | 2,565,959 |
| Glacier Bancorp, Inc. | | 54,411 | 2,725,447 |
| Independent Bank Group, Inc. | | 28,223 | 1,995,931 |
| Metropolitan Bank Holding Corp. (a) | | 14,942 | 1,036,676 |
| PacWest Bancorp | | 88,483 | 2,480,178 |
| Pinnacle Financial Partners, Inc. | | 37,637 | 2,977,087 |
| Silvergate Capital Corp. (a) | | 41,000 | 3,824,890 |
| Starling Bank Ltd. Series D (a)(c)(d) | | 431,700 | 1,239,658 |
| | | | 21,355,470 |
| Capital Markets - 1.6% | | | |
| Impax Asset Management Group PLC | | 1,024 | 8,941 |
| Lazard Ltd. Class A | | 76,366 | 2,876,707 |
| LPL Financial | | 29,640 | 6,222,029 |
| Morningstar, Inc. | | 9,204 | 2,350,241 |
| Perella Weinberg Partners (a)(c) | | 457,262 | 3,223,697 |
| StepStone Group, Inc. Class A | | 174,212 | 4,641,008 |
| StoneX Group, Inc. (a) | | 22,233 | 1,937,161 |
| | | | 21,259,784 |
| Insurance - 1.6% | | | |
| American Financial Group, Inc. | | 46,212 | 6,177,620 |
| Assurant, Inc. | | 39,106 | 6,874,053 |
| BRP Group, Inc. (a) | | 253,537 | 6,990,015 |
| | | | 20,041,688 |
| Thrifts & Mortgage Finance - 0.4% | | | |
| Walker & Dunlop, Inc. | | 44,626 | 5,026,673 |
|
| TOTAL FINANCIALS | | | 67,683,615 |
|
| HEALTH CARE - 22.3% | | | |
| Biotechnology - 7.3% | | | |
| 4D Molecular Therapeutics, Inc. (a)(b) | | 70,039 | 658,367 |
| ADC Therapeutics SA (a) | | 57,909 | 429,106 |
| ALX Oncology Holdings, Inc. (a)(b) | | 185,500 | 1,795,640 |
| Argenx SE ADR (a) | | 21,724 | 7,912,098 |
| Ascendis Pharma A/S sponsored ADR (a) | | 54,512 | 4,662,411 |
| Bicycle Therapeutics PLC ADR (a) | | 37,214 | 876,762 |
| Blueprint Medicines Corp. (a) | | 107,294 | 5,478,432 |
| Celldex Therapeutics, Inc. (a) | | 108,422 | 3,330,724 |
| Century Therapeutics, Inc. (a) | | 94,277 | 996,508 |
| Cyteir Therapeutics, Inc. (a) | | 123,738 | 360,078 |
| Cytokinetics, Inc. (a) | | 168,919 | 7,150,341 |
| Day One Biopharmaceuticals, Inc. (a) | | 115,926 | 1,985,812 |
| Erasca, Inc. | | 258,246 | 1,947,175 |
| Exelixis, Inc. (a) | | 159,335 | 3,333,288 |
| Global Blood Therapeutics, Inc. (a) | | 144,572 | 4,730,396 |
| Graphite Bio, Inc. (a) | | 101,141 | 318,594 |
| Halozyme Therapeutics, Inc. (a) | | 69,879 | 3,417,083 |
| Imago BioSciences, Inc. | | 116,455 | 1,874,926 |
| Immunocore Holdings PLC ADR (a) | | 72,693 | 3,354,055 |
| Instil Bio, Inc. (a) | | 346,222 | 1,952,692 |
| Janux Therapeutics, Inc. (a) | | 102,382 | 1,271,584 |
| Keros Therapeutics, Inc. (a) | | 61,396 | 1,969,584 |
| Monte Rosa Therapeutics, Inc. (a) | | 145,141 | 1,316,429 |
| Morphic Holding, Inc. (a) | | 86,489 | 2,289,364 |
| Nuvalent, Inc. Class A (a) | | 126,926 | 1,886,120 |
| Prelude Therapeutics, Inc. (a) | | 158,442 | 792,210 |
| PTC Therapeutics, Inc. (a) | | 102,732 | 4,473,979 |
| Relay Therapeutics, Inc. (a)(b) | | 105,391 | 2,004,537 |
| Repare Therapeutics, Inc. (a)(b) | | 101,057 | 1,277,360 |
| Tango Therapeutics, Inc. (a) | | 113,500 | 464,215 |
| Tenaya Therapeutics, Inc. (a) | | 183,693 | 876,216 |
| Tyra Biosciences, Inc. (b) | | 161,593 | 1,720,965 |
| United Therapeutics Corp. (a) | | 24,632 | 5,691,716 |
| Vaxcyte, Inc. (a) | | 59,145 | 1,365,067 |
| Vericel Corp. (a) | | 67,230 | 2,187,664 |
| Verve Therapeutics, Inc. (a)(b) | | 132,305 | 3,257,349 |
| Xenon Pharmaceuticals, Inc. (a) | | 79,292 | 2,628,530 |
| | | | 92,037,377 |
| Health Care Equipment & Supplies - 4.6% | | | |
| Angiodynamics, Inc. (a) | | 15,713 | 356,528 |
| Envista Holdings Corp. (a) | | 144,720 | 5,882,868 |
| Figs, Inc. Class A (a) | | 947,730 | 10,017,506 |
| Globus Medical, Inc. (a) | | 58,997 | 3,462,534 |
| Haemonetics Corp. (a) | | 95,008 | 6,602,106 |
| Insulet Corp. (a) | | 50,989 | 12,635,074 |
| Integer Holdings Corp. (a) | | 72,488 | 5,066,186 |
| LivaNova PLC (a) | | 60,129 | 3,828,413 |
| Minerva Surgical, Inc. (b) | | 103,220 | 268,372 |
| NeuroPace, Inc. (a)(b) | | 254,289 | 1,490,134 |
| TransMedics Group, Inc. (a)(b) | | 193,520 | 7,814,338 |
| | | | 57,424,059 |
| Health Care Providers & Services - 6.2% | | | |
| 1Life Healthcare, Inc. (a) | | 149,852 | 2,538,493 |
| Acadia Healthcare Co., Inc. (a) | | 154,106 | 12,776,928 |
| AdaptHealth Corp. (a) | | 155,793 | 3,444,583 |
| agilon health, Inc. (a) | | 373,398 | 9,346,152 |
| Guardant Health, Inc. (a) | | 59,886 | 3,004,481 |
| Molina Healthcare, Inc. (a) | | 36,953 | 12,110,237 |
| Option Care Health, Inc. (a) | | 266,550 | 8,956,080 |
| Owens & Minor, Inc. | | 163,382 | 5,785,357 |
| R1 Rcm, Inc. (a) | | 392,601 | 9,815,025 |
| Surgery Partners, Inc. (a) | | 205,191 | 8,080,422 |
| Tenet Healthcare Corp. (a) | | 42,168 | 2,788,148 |
| | | | 78,645,906 |
| Health Care Technology - 2.4% | | | |
| Doximity, Inc. (a)(b) | | 63,208 | 2,674,963 |
| Evolent Health, Inc. (a) | | 247,394 | 8,408,922 |
| Inspire Medical Systems, Inc. (a) | | 46,763 | 9,772,999 |
| OptimizeRx Corp. (a)(b) | | 43,460 | 976,546 |
| Phreesia, Inc. (a) | | 295,499 | 6,941,272 |
| Schrodinger, Inc. (a) | | 47,832 | 1,497,142 |
| | | | 30,271,844 |
| Life Sciences Tools & Services - 0.9% | | | |
| Absci Corp. | | 196,201 | 645,501 |
| Olink Holding AB ADR (a)(b) | | 175,340 | 2,358,323 |
| Syneos Health, Inc. (a) | | 84,079 | 6,654,012 |
| Veterinary Emergency Group LLC Class A (c)(d)(f) | | 38,574 | 2,020,267 |
| | | | 11,678,103 |
| Pharmaceuticals - 0.9% | | | |
| Arvinas Holding Co. LLC (a) | | 64,694 | 3,435,898 |
| DICE Therapeutics, Inc. (b) | | 116,006 | 1,999,943 |
| Edgewise Therapeutics, Inc. (a) | | 176,215 | 1,703,999 |
| Ikena Oncology, Inc. (a) | | 145,720 | 737,343 |
| NGM Biopharmaceuticals, Inc. (a) | | 86,801 | 1,256,878 |
| Pharvaris BV (a)(b) | | 127,019 | 2,680,101 |
| | | | 11,814,162 |
|
| TOTAL HEALTH CARE | | | 281,871,451 |
|
| INDUSTRIALS - 17.7% | | | |
| Aerospace & Defense - 1.6% | | | |
| AeroVironment, Inc. (a) | | 31,948 | 2,767,975 |
| BWX Technologies, Inc. | | 90,369 | 5,122,115 |
| Curtiss-Wright Corp. | | 65,860 | 9,446,958 |
| Dassault Aviation SA | | 17,400 | 2,480,822 |
| | | | 19,817,870 |
| Air Freight & Logistics - 0.6% | | | |
| Air Transport Services Group, Inc. (a) | | 131,967 | 4,135,846 |
| Hub Group, Inc. Class A (a) | | 40,406 | 3,087,018 |
| | | | 7,222,864 |
| Building Products - 1.7% | | | |
| Builders FirstSource, Inc. (a) | | 85,447 | 5,810,396 |
| Carlisle Companies, Inc. | | 15,884 | 4,703,252 |
| The AZEK Co., Inc. (a) | | 250,830 | 5,187,164 |
| UFP Industries, Inc. | | 68,659 | 6,331,046 |
| | | | 22,031,858 |
| Commercial Services & Supplies - 0.7% | | | |
| Driven Brands Holdings, Inc. (a) | | 173,200 | 5,261,816 |
| HNI Corp. | | 89,228 | 3,151,533 |
| | | | 8,413,349 |
| Construction & Engineering - 1.9% | | | |
| EMCOR Group, Inc. | | 9,548 | 1,111,101 |
| NV5 Global, Inc. (a) | | 23,751 | 3,220,636 |
| Valmont Industries, Inc. | | 31,063 | 8,432,983 |
| Willscot Mobile Mini Holdings (a) | | 302,175 | 11,666,977 |
| | | | 24,431,697 |
| Electrical Equipment - 2.5% | | | |
| Acuity Brands, Inc. | | 25,816 | 4,708,838 |
| Array Technologies, Inc. (a) | | 402,199 | 6,777,053 |
| Atkore, Inc. (a) | | 27,414 | 2,721,388 |
| nVent Electric PLC | | 184,388 | 6,510,740 |
| Regal Rexnord Corp. | | 55,956 | 7,514,891 |
| Sunrun, Inc. (a) | | 118,700 | 3,880,303 |
| | | | 32,113,213 |
| Machinery - 2.7% | | | |
| Chart Industries, Inc. (a)(b) | | 15,900 | 3,101,931 |
| Crane Holdings Co. | | 99,718 | 9,865,102 |
| Federal Signal Corp. | | 155,308 | 6,448,388 |
| ITT, Inc. | | 51,633 | 3,874,024 |
| Mueller Industries, Inc. | | 86,206 | 5,804,250 |
| Terex Corp. | | 161,300 | 5,405,163 |
| | | | 34,498,858 |
| Marine - 0.4% | | | |
| Kirby Corp. (a) | | 70,016 | 4,441,815 |
| Professional Services - 4.2% | | | |
| Alight, Inc. Class A (a) | | 480,834 | 3,625,488 |
| ASGN, Inc. (a) | | 80,492 | 8,351,850 |
| CACI International, Inc. Class A (a) | | 51,670 | 15,619,324 |
| CRA International, Inc. | | 2,431 | 240,693 |
| First Advantage Corp. (a) | | 82,878 | 1,162,778 |
| FTI Consulting, Inc. (a) | | 48,842 | 7,988,598 |
| Insperity, Inc. | | 7,033 | 771,801 |
| KBR, Inc. | | 222,219 | 11,828,717 |
| Korn Ferry | | 40,420 | 2,647,914 |
| TriNet Group, Inc. (a) | | 15,163 | 1,250,948 |
| | | | 53,488,111 |
| Trading Companies & Distributors - 1.4% | | | |
| Applied Industrial Technologies, Inc. | | 86,297 | 8,680,615 |
| Beacon Roofing Supply, Inc. (a) | | 114,829 | 6,892,037 |
| Custom Truck One Source, Inc. Class A (a)(b) | | 388,895 | 2,407,260 |
| | | | 17,979,912 |
|
| TOTAL INDUSTRIALS | | | 224,439,547 |
|
| INFORMATION TECHNOLOGY - 16.5% | | | |
| Communications Equipment - 0.6% | | | |
| Lumentum Holdings, Inc. (a) | | 56,541 | 5,114,699 |
| NetScout Systems, Inc. (a) | | 84,846 | 3,018,821 |
| | | | 8,133,520 |
| Electronic Equipment & Components - 1.9% | | | |
| Fabrinet (a) | | 75,048 | 7,209,111 |
| Insight Enterprises, Inc. (a) | | 40,693 | 3,801,133 |
| TD SYNNEX Corp. | | 92,975 | 9,336,550 |
| Vontier Corp. | | 126,820 | 3,271,956 |
| | | | 23,618,750 |
| IT Services - 3.1% | | | |
| Concentrix Corp. | | 73,798 | 9,871,220 |
| ExlService Holdings, Inc. (a) | | 67,357 | 11,340,898 |
| Flywire Corp. (a) | | 45,606 | 1,069,917 |
| Genpact Ltd. | | 132,238 | 6,358,003 |
| Perficient, Inc. (a) | | 27,813 | 2,934,828 |
| Verra Mobility Corp. (a) | | 456,273 | 7,523,942 |
| | | | 39,098,808 |
| Semiconductors & Semiconductor Equipment - 3.2% | | | |
| AEHR Test Systems (a) | | 135,290 | 1,543,659 |
| Cirrus Logic, Inc. (a) | | 80,661 | 6,893,289 |
| eMemory Technology, Inc. | | 61,000 | 2,417,076 |
| Lattice Semiconductor Corp. (a) | | 43,600 | 2,681,400 |
| MACOM Technology Solutions Holdings, Inc. (a) | | 113,630 | 6,583,722 |
| Nova Ltd. (a) | | 52,463 | 5,526,977 |
| SiTime Corp. (a) | | 76,423 | 14,213,150 |
| | | | 39,859,273 |
| Software - 6.5% | | | |
| Alkami Technology, Inc. (a) | | 201,404 | 2,803,544 |
| Avalara, Inc. (a) | | 53,500 | 4,676,970 |
| Braze, Inc. | | 45,595 | 1,982,015 |
| CCC Intelligent Solutions Holdings, Inc. (a)(c) | | 10,832 | 108,212 |
| Confluent, Inc. (a)(b) | | 67,441 | 1,716,373 |
| CyberArk Software Ltd. (a)(b) | | 36,795 | 4,788,133 |
| DoubleVerify Holdings, Inc. (a) | | 259,286 | 5,945,428 |
| Dynatrace, Inc. (a) | | 248,236 | 9,341,121 |
| Elastic NV (a) | | 90,090 | 7,197,290 |
| Five9, Inc. (a) | | 22,874 | 2,473,137 |
| GitLab, Inc. | | 31,982 | 1,835,767 |
| KnowBe4, Inc. (a) | | 471,179 | 6,733,148 |
| Rapid7, Inc. (a) | | 51,467 | 3,292,344 |
| Sprout Social, Inc. (a) | | 214,024 | 11,150,650 |
| TECSYS, Inc. | | 159,611 | 4,877,262 |
| Tenable Holdings, Inc. (a) | | 311,080 | 12,023,242 |
| WalkMe Ltd. (a)(b) | | 202,544 | 1,903,914 |
| | | | 82,848,550 |
| Technology Hardware, Storage & Peripherals - 1.2% | | | |
| Avid Technology, Inc. (a) | | 528,929 | 14,841,748 |
|
| TOTAL INFORMATION TECHNOLOGY | | | 208,400,649 |
|
| MATERIALS - 4.1% | | | |
| Chemicals - 2.6% | | | |
| Cabot Corp. | | 160,030 | 11,883,828 |
| Element Solutions, Inc. | | 232,312 | 4,590,485 |
| Huntsman Corp. | | 121,363 | 3,514,672 |
| The Chemours Co. LLC | | 162,289 | 5,775,866 |
| Valvoline, Inc. | | 195,494 | 6,298,817 |
| | | | 32,063,668 |
| Construction Materials - 0.2% | | | |
| Eagle Materials, Inc. | | 21,931 | 2,773,175 |
| Containers & Packaging - 0.6% | | | |
| Ardagh Metal Packaging SA (a)(c) | | 364,084 | 2,461,208 |
| O-I Glass, Inc. (a) | | 355,974 | 5,236,378 |
| | | | 7,697,586 |
| Metals & Mining - 0.7% | | | |
| Arconic Corp. (a) | | 101,869 | 3,077,462 |
| Iluka Resources Ltd. | | 810,678 | 5,502,090 |
| Sierra Rutile Holdings Ltd. (a) | | 810,678 | 182,161 |
| | | | 8,761,713 |
|
| TOTAL MATERIALS | | | 51,296,142 |
|
| REAL ESTATE - 0.5% | | | |
| Equity Real Estate Investment Trusts (REITs) - 0.2% | | | |
| Terreno Realty Corp. | | 33,101 | 2,073,778 |
| Real Estate Management & Development - 0.3% | | | |
| Compass, Inc. (a) | | 42 | 160 |
| Jones Lang LaSalle, Inc. (a) | | 23,131 | 4,410,388 |
| | | | 4,410,548 |
|
| TOTAL REAL ESTATE | | | 6,484,326 |
|
| UTILITIES - 1.0% | | | |
| Independent Power and Renewable Electricity Producers - 1.0% | | | |
| NextEra Energy Partners LP | | 34,275 | 2,835,914 |
| Sunnova Energy International, Inc. (a) | | 145,000 | 3,772,900 |
| Vistra Corp. | | 241,731 | 6,248,746 |
| | | | 12,857,560 |
| TOTAL COMMON STOCKS | | | |
| (Cost $1,110,481,730) | | | 1,157,622,725 |
|
| Convertible Preferred Stocks - 2.1% | | | |
| COMMUNICATION SERVICES - 0.1% | | | |
| Interactive Media & Services - 0.1% | | | |
| Reddit, Inc. Series F (c)(d) | | 46,800 | 1,841,112 |
| CONSUMER DISCRETIONARY - 0.0% | | | |
| Textiles, Apparel & Luxury Goods - 0.0% | | | |
| Algolia SAS Series D (c)(d) | | 9,900 | 181,863 |
| HEALTH CARE - 0.3% | | | |
| Biotechnology - 0.3% | | | |
| Bright Peak Therapeutics AG Series B (a)(c)(d) | | 199,331 | 458,461 |
| Caris Life Sciences, Inc. Series D (a)(c)(d) | | 144,435 | 800,170 |
| LifeMine Therapeutics, Inc. Series C (c)(d) | | 402,743 | 688,691 |
| Sonoma Biotherapeutics, Inc.: | | | |
| Series B (c)(d) | | 438,013 | 613,218 |
| Series B1 (c)(d) | | 233,603 | 327,044 |
| T-Knife Therapeutics, Inc. Series B (a)(c)(d) | | 201,583 | 641,034 |
| Treeline Biosciences Series A (c)(d) | | 21,246 | 100,706 |
| | | | 3,629,324 |
| Health Care Providers & Services - 0.0% | | | |
| Boundless Bio, Inc. Series B (a)(c)(d) | | 682,407 | 511,805 |
| Health Care Technology - 0.0% | | | |
| Wugen, Inc. Series B (a)(c)(d) | | 59,982 | 259,722 |
|
| TOTAL HEALTH CARE | | | 4,400,851 |
|
| INDUSTRIALS - 0.8% | | | |
| Construction & Engineering - 0.6% | | | |
| Beta Technologies, Inc.: | | | |
| Series A (a)(c)(d) | | 62,752 | 6,474,124 |
| Series B, 6.00% (c)(d) | | 11,821 | 1,219,573 |
| | | | 7,693,697 |
| Road & Rail - 0.2% | | | |
| Convoy, Inc. Series D (a)(c)(d) | | 192,936 | 2,091,426 |
|
| TOTAL INDUSTRIALS | | | 9,785,123 |
|
| INFORMATION TECHNOLOGY - 0.9% | | | |
| Communications Equipment - 0.3% | | | |
| Astranis Space Technologies Corp. Series C (a)(c)(d) | | 125,912 | 4,382,997 |
| IT Services - 0.4% | | | |
| Yanka Industries, Inc.: | | | |
| Series E (a)(c)(d) | | 191,029 | 3,814,849 |
| Series F (a)(c)(d) | | 28,989 | 578,910 |
| | | | 4,393,759 |
| Software - 0.2% | | | |
| Mountain Digital, Inc. Series D (c)(d) | | 140,383 | 2,049,592 |
| Skyryse, Inc. Series B (c)(d) | | 12,000 | 281,520 |
| | | | 2,331,112 |
|
| TOTAL INFORMATION TECHNOLOGY | | | 11,107,868 |
|
| TOTAL CONVERTIBLE PREFERRED STOCKS | | | |
| (Cost $28,165,522) | | | 27,316,817 |
|
| Investment Companies - 1.8% | | | |
| iShares Russell 2000 Growth Index ETF (b) | | | |
| (Cost $21,220,786) | | 97,400 | 22,364,011 |
|
| Money Market Funds - 11.0% | | | |
| Fidelity Cash Central Fund 2.01% (g) | | 71,243,790 | 71,258,038 |
| Fidelity Securities Lending Cash Central Fund 2.01% (g)(h) | | 67,959,373 | 67,966,169 |
| TOTAL MONEY MARKET FUNDS | | | |
| (Cost $139,224,207) | | | 139,224,207 |
| TOTAL INVESTMENT IN SECURITIES - 106.4% | | | |
| (Cost $1,299,092,245) | | | 1,346,527,760 |
| NET OTHER ASSETS (LIABILITIES) - (6.4)% | | | (81,301,384) |
| NET ASSETS - 100% | | | $1,265,226,376 |
Security Type Abbreviations
ETF – Exchange-Traded Fund
Legend
(a) Non-income producing
(b) Security or a portion of the security is on loan at period end.
(c) Restricted securities (including private placements) - Investment in securities not registered under the Securities Act of 1933 (excluding 144A issues). At the end of the period, the value of restricted securities (excluding 144A issues) amounted to $48,083,112 or 3.8% of net assets.
(d) Level 3 security
(e) Security exempt from registration under Rule 144A of the Securities Act of 1933. These securities may be resold in transactions exempt from registration, normally to qualified institutional buyers. At the end of the period, the value of these securities amounted to $297,915 or 0.0% of net assets.
(f) Investment is owned by a wholly-owned subsidiary (Subsidiary) that is treated as a corporation for U.S. tax purposes.
(g) Affiliated fund that is generally available only to investment companies and other accounts managed by Fidelity Investments. The rate quoted is the annualized seven-day yield of the fund at period end. A complete unaudited listing of the fund's holdings as of its most recent quarter end is available upon request. In addition, each Fidelity Central Fund's financial statements, which are not covered by the Fund's Report of Independent Registered Public Accounting Firm, are available on the SEC's website or upon request.
(h) Investment made with cash collateral received from securities on loan.
Additional information on each restricted holding is as follows:
| Security | Acquisition Date | Acquisition Cost |
| Algolia SAS Series D | 7/23/21 | $289,526 |
| Algolia, Inc. | 10/27/21 | $1,265,404 |
| Ardagh Metal Packaging SA | 2/22/21 | $3,640,840 |
| Astranis Space Technologies Corp. Series C | 3/19/21 | $2,760,108 |
| BARK, Inc. | 12/17/20 | $2,673,000 |
| Beta Technologies, Inc. Series A | 4/9/21 | $4,597,839 |
| Beta Technologies, Inc. Series B, 6.00% | 4/4/22 | $1,219,573 |
| Boundless Bio, Inc. Series B | 4/23/21 | $921,249 |
| Bright Peak Therapeutics AG Series B | 5/14/21 | $778,587 |
| Caris Life Sciences, Inc. Series D | 5/11/21 | $1,169,924 |
| CCC Intelligent Solutions Holdings, Inc. | 2/2/21 | $108,320 |
| Convoy, Inc. Series D | 10/30/19 | $2,612,353 |
| Fanatics, Inc. Class A | 8/13/20 - 3/22/21 | $2,891,600 |
| LifeMine Therapeutics, Inc. Series C | 2/15/22 | $820,222 |
| Mountain Digital, Inc. Series D | 11/5/21 | $3,223,938 |
| Perella Weinberg Partners | 12/29/20 | $4,572,620 |
| Reddit, Inc. Series F | 8/11/21 | $2,891,978 |
| Skyryse, Inc. Series B | 10/21/21 | $296,160 |
| Sonoma Biotherapeutics, Inc. Series B | 7/26/21 | $865,645 |
| Sonoma Biotherapeutics, Inc. Series B1 | 7/26/21 | $692,516 |
| Starling Bank Ltd. Series D | 6/18/21 - 4/5/22 | $824,189 |
| T-Knife Therapeutics, Inc. Series B | 6/30/21 | $1,162,892 |
| Treeline Biosciences Series A | 7/30/21 | $166,303 |
| Veterinary Emergency Group LLC Class A | 9/16/21 - 3/17/22 | $1,901,246 |
| Wugen, Inc. Series B | 7/9/21 | $465,154 |
| Yanka Industries, Inc. Series E | 5/15/20 | $2,307,478 |
| Yanka Industries, Inc. Series F | 4/8/21 | $924,077 |
Affiliated Central Funds
Fiscal year to date information regarding the Fund's investments in Fidelity Central Funds, including the ownership percentage, is presented below.
| Fund | Value, beginning of period | Purchases | Sales Proceeds | Dividend Income | Realized Gain/Loss | Change in Unrealized appreciation (depreciation) | Value, end of period | % ownership, end of period |
| Fidelity Cash Central Fund 2.01% | $4,152,847 | $613,850,569 | $546,745,378 | $140,299 | $-- | $-- | $71,258,038 | 0.1% |
| Fidelity Securities Lending Cash Central Fund 2.01% | 107,112,980 | 420,402,592 | 459,549,403 | 940,841 | -- | -- | 67,966,169 | 0.2% |
| Total | $111,265,827 | $1,034,253,161 | $1,006,294,781 | $1,081,140 | $-- | $-- | $139,224,207 | |
Amounts in the income column in the above table include any capital gain distributions from underlying funds, which are presented in the corresponding line-item in the Statement of Operations, if applicable. Amount for Fidelity Securities Lending Cash Central Fund represents the income earned on investing cash collateral, less rebates paid to borrowers and any lending agent fees associated with the loan, plus any premium payments received for lending certain types of securities.
Investment Valuation
The following is a summary of the inputs used, as of July 31, 2022, involving the Fund's assets and liabilities carried at fair value. The inputs or methodology used for valuing securities may not be an indication of the risk associated with investing in those securities. For more information on valuation inputs, and their aggregation into the levels used below, please refer to the Investment Valuation section in the accompanying Notes to Financial Statements.
| | Valuation Inputs at Reporting Date: |
| Description | Total | Level 1 | Level 2 | Level 3 |
| Investments in Securities: | | | | |
| Equities: | | | | |
| Communication Services | $58,521,332 | $56,680,220 | $-- | $1,841,112 |
| Consumer Discretionary | 138,353,404 | 126,840,527 | -- | 11,512,877 |
| Consumer Staples | 43,780,247 | 43,780,247 | -- | -- |
| Energy | 65,957,427 | 65,957,427 | -- | -- |
| Financials | 67,683,615 | 66,443,957 | -- | 1,239,658 |
| Health Care | 286,272,302 | 279,851,184 | -- | 6,421,118 |
| Industrials | 234,224,670 | 224,439,547 | -- | 9,785,123 |
| Information Technology | 219,508,517 | 205,983,573 | 2,417,076 | 11,107,868 |
| Materials | 51,296,142 | 45,611,891 | 5,684,251 | -- |
| Real Estate | 6,484,326 | 6,484,326 | -- | -- |
| Utilities | 12,857,560 | 12,857,560 | -- | -- |
| Investment Companies | 22,364,011 | 22,364,011 | -- | -- |
| Money Market Funds | 139,224,207 | 139,224,207 | -- | -- |
| Total Investments in Securities: | $1,346,527,760 | $1,296,518,677 | $8,101,327 | $41,907,756 |
The following is a reconciliation of Investments in Securities for which Level 3 inputs were used in determining value:
| Investments in Securities: | |
| Beginning Balance | $30,298,033 |
| Net Realized Gain (Loss) on Investment Securities | -- |
| Net Unrealized Gain (Loss) on Investment Securities | 306,614 |
| Cost of Purchases | 11,743,109 |
| Proceeds of Sales | (440,000) |
| Amortization/Accretion | -- |
| Transfers into Level 3 | -- |
| Transfers out of Level 3 | -- |
| Ending Balance | $41,907,756 |
| The change in unrealized gain (loss) for the period attributable to Level 3 securities held at July 31, 2022 | $306,614 |
The information used in the above reconciliation represents fiscal year to date activity for any Investments in Securities identified as using Level 3 inputs at either the beginning or the end of the current fiscal period. Transfers into Level 3 were attributable to a lack of observable market data resulting from decreases in market activity, decreases in liquidity, security restructurings or corporate actions. Transfers out of Level 3 were attributable to observable market data becoming available for those securities. Cost of purchases and proceeds of sales may include securities received and/or delivered through in-kind transactions. Transfers in or out of Level 3 represent the beginning value of any Security or Instrument where a change in the pricing level occurred from the beginning to the end of the period. The cost of purchases and the proceeds of sales may include securities received or delivered through corporate actions or exchanges. Realized and unrealized gains (losses) disclosed in the reconciliation are included in Net Gain (Loss) on the Fund's Statement of Operations.
See accompanying notes which are an integral part of the financial statements.
Financial Statements
Statement of Assets and Liabilities
| | | July 31, 2022 |
| Assets | | |
Investment in securities, at value (including securities loaned of $66,349,302) — See accompanying schedule:
Unaffiliated issuers (cost $1,159,868,038) | $1,207,303,553 | |
| Fidelity Central Funds (cost $139,224,207) | 139,224,207 | |
| Total Investment in Securities (cost $1,299,092,245) | | $1,346,527,760 |
| Receivable for investments sold | | 7,396,378 |
| Receivable for fund shares sold | | 1,256,420 |
| Dividends receivable | | 351,534 |
| Distributions receivable from Fidelity Central Funds | | 241,858 |
| Total assets | | 1,355,773,950 |
| Liabilities | | |
| Payable for investments purchased | $20,765,755 | |
| Payable for fund shares redeemed | 1,233,625 | |
| Accrued management fee | 583,435 | |
| Collateral on securities loaned | 67,964,759 | |
| Total liabilities | | 90,547,574 |
| Net Assets | | $1,265,226,376 |
| Net Assets consist of: | | |
| Paid in capital | | $1,275,613,978 |
| Total accumulated earnings (loss) | | (10,387,602) |
| Net Assets | | $1,265,226,376 |
| Net Asset Value, offering price and redemption price per share ($1,265,226,376 ÷ 95,730,804 shares) | | $13.22 |
See accompanying notes which are an integral part of the financial statements.
Statement of Operations
| | | Year ended July 31, 2022 |
| Investment Income | | |
| Dividends | | $7,065,024 |
| Interest | | 1,148 |
| Income from Fidelity Central Funds (including $940,841 from security lending) | | 1,081,140 |
| Total income | | 8,147,312 |
| Expenses | | |
| Management fee | $7,103,748 | |
| Independent trustees' fees and expenses | 3,900 | |
| Interest | 1,146 | |
| Total expenses before reductions | 7,108,794 | |
| Expense reductions | (80) | |
| Total expenses after reductions | | 7,108,714 |
| Net investment income (loss) | | 1,038,598 |
| Realized and Unrealized Gain (Loss) | | |
| Net realized gain (loss) on: | | |
| Investment securities: | | |
| Unaffiliated issuers | (9,270,661) | |
| Foreign currency transactions | (5,668) | |
| Total net realized gain (loss) | | (9,276,329) |
| Change in net unrealized appreciation (depreciation) on: | | |
| Investment securities: | | |
| Unaffiliated issuers | (249,743,953) | |
| Unfunded commitments | 498,561 | |
| Assets and liabilities in foreign currencies | (1,259) | |
| Total change in net unrealized appreciation (depreciation) | | (249,246,651) |
| Net gain (loss) | | (258,522,980) |
| Net increase (decrease) in net assets resulting from operations | | $(257,484,382) |
See accompanying notes which are an integral part of the financial statements.
Statement of Changes in Net Assets
| | Year ended July 31, 2022 | Year ended July 31, 2021 |
| Increase (Decrease) in Net Assets | | |
| Operations | | |
| Net investment income (loss) | $1,038,598 | $(1,648,598) |
| Net realized gain (loss) | (9,276,329) | 291,358,606 |
| Change in net unrealized appreciation (depreciation) | (249,246,651) | 111,070,616 |
| Net increase (decrease) in net assets resulting from operations | (257,484,382) | 400,780,624 |
| Distributions to shareholders | (287,761,100) | (32,449,496) |
| Share transactions | | |
| Proceeds from sales of shares | 651,115,115 | 442,975,177 |
| Reinvestment of distributions | 287,761,100 | 32,449,496 |
| Cost of shares redeemed | (282,783,905) | (589,302,011) |
| Net increase (decrease) in net assets resulting from share transactions | 656,092,310 | (113,877,338) |
| Total increase (decrease) in net assets | 110,846,828 | 254,453,790 |
| Net Assets | | |
| Beginning of period | 1,154,379,548 | 899,925,758 |
| End of period | $1,265,226,376 | $1,154,379,548 |
| Other Information | | |
| Shares | | |
| Sold | 44,616,415 | 22,367,069 |
| Issued in reinvestment of distributions | 15,979,576 | 1,720,546 |
| Redeemed | (18,439,508) | (29,251,232) |
| Net increase (decrease) | 42,156,483 | (5,163,617) |
See accompanying notes which are an integral part of the financial statements.
Financial Highlights
Fidelity Small Cap Growth K6 Fund
| | | | | | |
| Years ended July 31, | 2022 | 2021 | 2020 | 2019 | 2018 |
| Selected Per–Share Data | | | | | |
| Net asset value, beginning of period | $21.55 | $15.32 | $13.96 | $13.40 | $10.42 |
| Income from Investment Operations | | | | | |
| Net investment income (loss)A,B | .01 | (.03)C | –D | (.01) | (.01) |
| Net realized and unrealized gain (loss) | (3.11) | 6.81 | 1.36 | .84 | 3.00 |
| Total from investment operations | (3.10) | 6.78 | 1.36 | .83 | 2.99 |
| Distributions from net investment income | – | – | – | – | –D |
| Distributions from net realized gain | (5.23) | (.55) | – | (.27) | (.01) |
| Total distributions | (5.23) | (.55) | – | (.27) | (.01) |
| Net asset value, end of period | $13.22 | $21.55 | $15.32 | $13.96 | $13.40 |
| Total ReturnE | (20.31)% | 44.76% | 9.74% | 6.14% | 28.72% |
| Ratios to Average Net AssetsB,F,G | | | | | |
| Expenses before reductions | .60% | .60% | .60% | .60% | .60% |
| Expenses net of fee waivers, if any | .60% | .60% | .60% | .60% | .60% |
| Expenses net of all reductions | .60% | .59% | .59% | .59% | .59% |
| Net investment income (loss) | .09% | (.14)%C | (.02)% | (.09)% | (.06)% |
| Supplemental Data | | | | | |
| Net assets, end of period (000 omitted) | $1,265,226 | $1,154,380 | $899,926 | $833,744 | $562,817 |
| Portfolio turnover rateH | 81%I | 119% | 137%I | 108%I | 114%I |
A Calculated based on average shares outstanding during the period.
B Net investment income (loss) is affected by the timing of the declaration of dividends by any underlying mutual funds or exchange-traded funds (ETFs). Net investment income (loss) of any such underlying funds is not included in the Fund's net investment income (loss) ratio.
C Net investment income per share reflects one or more large, non-recurring dividend(s) which amounted to $.01 per share. Excluding such non-recurring dividend(s), the ratio of net investment income (loss) to average net assets would have been (.22) %.
D Amount represents less than $.005 per share.
E Total returns would have been lower if certain expenses had not been reduced during the applicable periods shown.
F Fees and expenses of any underlying mutual funds or exchange-traded funds (ETFs) are not included in the Fund's expense ratio. The Fund indirectly bears its proportionate share of these expenses. For additional expense information related to investments in Fidelity Central Funds, please refer to the "Investments in Fidelity Central Funds" note found in the Notes to Financial Statements section of the most recent Annual or Semi-Annual report.
G Expense ratios reflect operating expenses of the class. Expenses before reductions do not reflect amounts reimbursed, waived, or reduced through arrangements with the investment adviser, brokerage services, or other offset arrangements, if applicable, and do not represent the amount paid by the class during periods when reimbursements, waivers or reductions occur.
H Amount does not include the portfolio activity of any underlying mutual funds or exchange-traded funds (ETFs).
I Portfolio turnover rate excludes securities received or delivered in-kind.
See accompanying notes which are an integral part of the financial statements.
Notes to Financial Statements
For the period ended July 31, 2022
1. Organization.
Fidelity Small Cap Growth K6 Fund (the Fund) is a fund of Fidelity Securities Fund (the Trust) and is authorized to issue an unlimited number of shares. Share transactions on the Statement of Changes in Net Assets may contain exchanges between affiliated funds. The Trust is registered under the Investment Company Act of 1940, as amended (the 1940 Act), as an open-end management investment company organized as a Massachusetts business trust. Shares generally are available only to employer-sponsored retirement plans that are recordkept by Fidelity, or to certain employer-sponsored retirement plans that are not recordkept by Fidelity.
2. Investments in Fidelity Central Funds.
Funds may invest in Fidelity Central Funds, which are open-end investment companies generally available only to other investment companies and accounts managed by the investment adviser and its affiliates. The Schedule of Investments lists any Fidelity Central Funds held as an investment as of period end, but does not include the underlying holdings of each Fidelity Central Fund. An investing fund indirectly bears its proportionate share of the expenses of the underlying Fidelity Central Funds.
Based on its investment objective, each Fidelity Central Fund may invest or participate in various investment vehicles or strategies that are similar to those of the investing fund. These strategies are consistent with the investment objectives of the investing fund and may involve certain economic risks which may cause a decline in value of each of the Fidelity Central Funds and thus a decline in the value of the investing fund.
| Fidelity Central Fund | Investment Manager | Investment Objective | Investment Practices | Expense Ratio(a) |
| Fidelity Money Market Central Funds | Fidelity Management & Research Company LLC (FMR) | Each fund seeks to obtain a high level of current income consistent with the preservation of capital and liquidity. | Short-term Investments | Less than .005% |
(a) Expenses expressed as a percentage of average net assets and are as of each underlying Central Fund's most recent annual or semi-annual shareholder report.
A complete unaudited list of holdings for each Fidelity Central Fund is available upon request or at the Securities and Exchange Commission website at www.sec.gov. In addition, the financial statements of the Fidelity Central Funds which contain the significant accounting policies (including investment valuation policies) of those funds, and are not covered by the Report of Independent Registered Public Accounting Firm, are available on the Securities and Exchange Commission website or upon request.
3. Significant Accounting Policies.
The Fund is an investment company and applies the accounting and reporting guidance of the Financial Accounting Standards Board (FASB) Accounting Standards Codification Topic 946 Financial Services - Investment Companies. The financial statements have been prepared in conformity with accounting principles generally accepted in the United States of America (GAAP), which require management to make certain estimates and assumptions at the date of the financial statements. Actual results could differ from those estimates. Subsequent events, if any, through the date that the financial statements were issued have been evaluated in the preparation of the financial statements. The Fund's Schedule of Investments lists any underlying mutual funds or exchange-traded funds (ETFs) but does not include the underlying holdings of these funds. The following summarizes the significant accounting policies of the Fund:
Investment Valuation. Investments are valued as of 4:00 p.m. Eastern time on the last calendar day of the period. The Board of Trustees (the Board) has delegated the day to day responsibility for the valuation of the Fund's investments to the Fair Value Committee (the Committee) established by the Fund's investment adviser. In accordance with valuation policies and procedures approved by the Board, the Fund attempts to obtain prices from one or more third party pricing vendors or brokers to value its investments. When current market prices, quotations or currency exchange rates are not readily available or reliable, investments will be fair valued in good faith by the Committee, in accordance with procedures adopted by the Board. Factors used in determining fair value vary by investment type and may include market or investment specific events. The frequency with which these procedures are used cannot be predicted and they may be utilized to a significant extent. The Committee oversees the Fund's valuation policies and procedures and reports to the Board on the Committee's activities and fair value determinations. The Board monitors the appropriateness of the procedures used in valuing the Fund's investments and ratifies the fair value determinations of the Committee.
The Fund categorizes the inputs to valuation techniques used to value its investments into a disclosure hierarchy consisting of three levels as shown below:
- Level 1 – unadjusted quoted prices in active markets for identical investments
- Level 2 – other significant observable inputs (including quoted prices for similar investments, interest rates, prepayment speeds, etc.)
- Level 3 – unobservable inputs (including the Fund's own assumptions based on the best information available)
Valuation techniques used to value the Fund's investments by major category are as follows:
Equity securities, including restricted securities, for which market quotations are readily available, are valued at the last reported sale price or official closing price as reported by a third party pricing vendor on the primary market or exchange on which they are traded and are categorized as Level 1 in the hierarchy. In the event there were no sales during the day or closing prices are not available, securities are valued at the last quoted bid price or may be valued using the last available price and are generally categorized as Level 2 in the hierarchy. For foreign equity securities, when market or security specific events arise, comparisons to the valuation of American Depositary Receipts (ADRs), futures contracts, ETFs and certain indexes as well as quoted prices for similar securities may be used and would be categorized as Level 2 in the hierarchy. For equity securities, including restricted securities, where observable inputs are limited, assumptions about market activity and risk are used and these securities may be categorized as Level 3 in the hierarchy. Securities, including private placements or other restricted securities, for which observable inputs are not available are valued using alternate valuation approaches, including the market approach, the income approach and cost approach, and are categorized as Level 3 in the hierarchy. The market approach considers factors including the price of recent investments in the same or a similar security or financial metrics of comparable securities. The income approach considers factors including expected future cash flows, security specific risks and corresponding discount rates. The cost approach considers factors including the value of the security's underlying assets and liabilities.
ETFs are valued at their last sale price or official closing price as reported by a third party pricing vendor on the primary market or exchange on which they are traded and are categorized as Level 1 in the hierarchy. In the event there were no sales during the day but the exchange reports a closing bid level, ETFs are valued at the closing bid and would be categorized as Level 1 in the hierarchy. In the event there was no closing bid, ETFs may be valued by another method that the Board believes reflects fair value in accordance with the Board's fair value pricing policies and may be categorized as Level 2 in the hierarchy.
Investments in open-end mutual funds, including the Fidelity Central Funds, are valued at their closing net asset value (NAV) each business day and are categorized as Level 1 in the hierarchy.
The following provides information on Level 3 securities held by the Fund that were valued at period end based on unobservable inputs. These amounts exclude valuations provided by a broker.
| Asset Type | Fair Value | Valuation Technique(s) | Unobservable Input | Amount or Range/Weighted Average | Impact to Valuation from an Increase in Input(a) |
| Equities | $ 41,907,756 | Market approach | Discount rate | 16.0% - 44.9% / 36.2% | Decrease |
| | | | Transaction price | $1.35 - $103.17 / $60.06 | Increase |
| | | Recovery value | Recovery value | $0.00 | Increase |
| | | Market comparable | Enterprise value/Revenue multiple (EV/R) | 1.5 - 10.0 / 4.8 | Increase |
| | | Discounted cash flow | Weighted average cost of capital (WACC) | 19.6% | Decrease |
| | | | Discount for lack of marketability | 10.0% | Decrease |
| | | | Growth rate | 2.0% | Increase |
(a) Represents the directional change in the fair value of the Level 3 investments that could have resulted from an increase in the corresponding input as of period end. A decrease to the unobservable input would have had the opposite effect. Significant changes in these inputs may have resulted in a significantly higher or lower fair value measurement at period end.
Changes in valuation techniques may result in transfers in or out of an assigned level within the disclosure hierarchy. The aggregate value of investments by input level as of July 31, 2022, as well as a roll forward of Level 3 investments, is included at the end of the Fund's Schedule of Investments.
Foreign Currency. Certain Funds may use foreign currency contracts to facilitate transactions in foreign-denominated securities. Gains and losses from these transactions may arise from changes in the value of the foreign currency or if the counterparties do not perform under the contracts' terms.
Foreign-denominated assets, including investment securities, and liabilities are translated into U.S. dollars at the exchange rates at period end. Purchases and sales of investment securities, income and dividends received, and expenses denominated in foreign currencies are translated into U.S. dollars at the exchange rate in effect on the transaction date.
The effects of exchange rate fluctuations on investments are included with the net realized and unrealized gain (loss) on investment securities. Other foreign currency transactions resulting in realized and unrealized gain (loss) are disclosed separately.
Investment Transactions and Income. For financial reporting purposes, the Fund's investment holdings and NAV include trades executed through the end of the last business day of the period. The NAV per share for processing shareholder transactions is calculated as of the close of business of the New York Stock Exchange (NYSE), normally 4:00 p.m. Eastern time and includes trades executed through the end of the prior business day. Gains and losses on securities sold are determined on the basis of identified cost and include proceeds received from litigation. Commissions paid to certain brokers with whom the investment adviser, or its affiliates, places trades on behalf of a fund include an amount in addition to trade execution, which may be rebated back to a fund. Any such rebates are included in net realized gain (loss) on investments in the Statement of Operations. Dividend income is recorded on the ex-dividend date, except for certain dividends from foreign securities where the ex-dividend date may have passed, which are recorded as soon as the Fund is informed of the ex-dividend date. Non-cash dividends included in dividend income, if any, are recorded at the fair market value of the securities received. Income and capital gain distributions from Fidelity Central Funds, if any, are recorded on the ex-dividend date. Certain distributions received by the Fund represent a return of capital or capital gain. The Fund determines the components of these distributions subsequent to the ex-dividend date, based upon receipt of tax filings or other correspondence relating to the underlying investment. These distributions are recorded as a reduction of cost of investments and/or as a realized gain. Interest income is accrued as earned and includes coupon interest and amortization of premium and accretion of discount on debt securities as applicable. Investment income is recorded net of foreign taxes withheld where recovery of such taxes is uncertain. Funds may file withholding tax reclaims in certain jurisdictions to recover a portion of amounts previously withheld. Any withholding tax reclaims income is included in the Statement of Operations in dividends. Any receivables for withholding tax reclaims are included in the Statement of Assets and Liabilities in dividends receivable.
Expenses. Expenses directly attributable to a fund are charged to that fund. Expenses attributable to more than one fund are allocated among the respective funds on the basis of relative net assets or other appropriate methods. Expenses included in the accompanying financial statements reflect the expenses of that fund and do not include any expenses associated with any underlying mutual funds or exchange-traded funds. Although not included in a fund's expenses, a fund indirectly bears its proportionate share of these expenses through the net asset value of each underlying mutual fund or exchange-traded fund. Expense estimates are accrued in the period to which they relate and adjustments are made when actual amounts are known.
Income Tax Information and Distributions to Shareholders. Each year, the Fund intends to qualify as a regulated investment company under Subchapter M of the Internal Revenue Code, including distributing substantially all of its taxable income and realized gains. As a result, no provision for U.S. Federal income taxes is required. As of July 31, 2022, the Fund did not have any unrecognized tax benefits in the financial statements; nor is the Fund aware of any tax positions for which it is reasonably possible that the total amounts of unrecognized tax benefits will significantly change in the next twelve months. The Fund files a U.S. federal tax return, in addition to state and local tax returns as required. The Fund's federal income tax returns are subject to examination by the Internal Revenue Service (IRS) for a period of three fiscal years after they are filed. State and local tax returns may be subject to examination for an additional fiscal year depending on the jurisdiction. Foreign taxes are provided for based on the Fund's understanding of the tax rules and rates that exist in the foreign markets in which it invests.
Distributions are declared and recorded on the ex-dividend date. Income and capital gain distributions are determined in accordance with income tax regulations, which may differ from GAAP.
Capital accounts within the financial statements are adjusted for permanent book-tax differences. These adjustments have no impact on net assets or the results of operations. Capital accounts are not adjusted for temporary book-tax differences which will reverse in a subsequent period.
Book-tax differences are primarily due to foreign currency transactions, passive foreign investment companies (PFIC), partnerships and losses deferred due to wash sales and excise tax regulations.
As of period end, the cost and unrealized appreciation (depreciation) in securities, and derivatives if applicable, for federal income tax purposes were as follows:
| Gross unrealized appreciation | $199,847,204 |
| Gross unrealized depreciation | (160,529,736) |
| Net unrealized appreciation (depreciation) | $39,317,468 |
| Tax Cost | $1,307,210,292 |
The tax-based components of distributable earnings as of period end were as follows:
| Net unrealized appreciation (depreciation) on securities and other investments | $39,316,348 |
The Fund intends to elect to defer to its next fiscal year $49,703,950 of capital losses recognized during the period November 1, 2021 to July 31, 2022.
The tax character of distributions paid was as follows:
| | July 31, 2022 | July 31, 2021 |
| Ordinary Income | $134,762,480 | $ 17,259,113 |
| Long-term Capital Gains | 152,998,620 | 15,190,383 |
| Total | $287,761,100 | $ 32,449,496 |
Restricted Securities (including Private Placements). Funds may invest in securities that are subject to legal or contractual restrictions on resale. These securities generally may be resold in transactions exempt from registration or to the public if the securities are registered. Disposal of these securities may involve time-consuming negotiations and expense, and prompt sale at an acceptable price may be difficult. Information regarding restricted securities held at period end is included at the end of the Schedule of Investments, if applicable.
Special Purpose Acquisition Companies. Funds may invest in stock, warrants, and other securities of special purpose acquisition companies (SPACs) or similar special purpose entities. A SPAC is a publicly traded company that raises investment capital via an initial public offering (IPO) for the purpose of acquiring the equity securities of one or more existing companies via merger, business combination, acquisition or other similar transactions within a designated time frame.
Private Investment in Public Equity. Funds may acquire equity securities of an issuer through a private investment in a public equity (PIPE) transaction, including through commitments to purchase securities on a when-issued basis. A PIPE typically involves the purchase of securities directly from a publicly traded company in a private placement transaction. Securities purchased through PIPE transactions will be restricted from trading and considered illiquid until a resale registration statement for the shares is filed and declared effective.
At the current and/or prior period end, the Fund had commitments to purchase when-issued securities through PIPE transactions with SPACs. The commitments are contingent upon the SPACs acquiring the securities of target companies. Unrealized appreciation (depreciation) on any commitments outstanding at period end is separately presented in the Statements of Assets and Liabilities as Unrealized appreciation (depreciation) on unfunded commitments, and any change in unrealized appreciation (depreciation) on unfunded commitments during the period is separately presented in the Statement of Operations, as applicable.
Consolidated Subsidiary. The Funds included in the table below hold certain investments through a wholly-owned subsidiary ("Subsidiary"), which may be subject to federal and state taxes upon disposition.
As of period end, investments in Subsidiaries were as follows:
| | $ Amount | % of Net Assets |
| Fidelity Small Cap Growth K6 Fund | 2,020,267 | .16 |
The financial statements have been consolidated to include the Subsidiary accounts where applicable. Accordingly, all inter-company transactions and balances have been eliminated.
At period end, any estimated tax liability for these investments is presented as "Deferred taxes" in the Statement of Assets and Liabilities and included in "Change in net unrealized appreciation (depreciation) on investment securities" in the Statement of Operations. The tax liability incurred may differ materially depending on conditions when these investments are disposed. Any cash held by a Subsidiary is restricted as to its use and is presented as "Restricted cash" in the Statement of Assets and Liabilities, if applicable.
4. Purchases and Sales of Investments.
Purchases and sales of securities, other than short-term securities and in-kind transactions, as applicable, are noted in the table below.
| | Purchases ($) | Sales ($) |
| Fidelity Small Cap Growth K6 Fund | 1,230,632,373 | 947,451,522 |
Unaffiliated Exchanges In-Kind. Shares that were exchanged for investments, including accrued interest and cash, if any, are shown in the table below. The amount of in-kind exchanges is included in share transactions in the accompanying Statement of Changes in Net Assets.
| | Shares | Total Proceeds
($) |
| Fidelity Small Cap Growth K6 Fund | 2,375,229 | 32,229,577 |
5. Fees and Other Transactions with Affiliates.
Management Fee. Fidelity Management & Research Company LLC (the investment adviser) and its affiliates provide the Fund with investment management related services for which the Fund pays a monthly management fee that is based on an annual rate of .60% of average net assets. Under the management contract, the investment adviser or an affiliate pays all other expenses of the Fund, excluding fees and expenses of the independent Trustees, and certain miscellaneous expenses such as proxy and shareholder meeting expenses.
Brokerage Commissions. A portion of portfolio transactions were placed with brokerage firms which are affiliates of the investment adviser. Brokerage commissions are included in net realized gain (loss) and change in net unrealized appreciation (depreciation) in the Statement of Operations. The commissions paid to these affiliated firms were as follows:
| | Amount |
| Fidelity Small Cap Growth K6 Fund | $32,201 |
Interfund Lending Program. Pursuant to an Exemptive Order issued by the Securities and Exchange Commission (the SEC), the Fund, along with other registered investment companies having management contracts with Fidelity Management & Research Company LLC (FMR), or other affiliated entities of FMR, may participate in an interfund lending program. This program provides an alternative credit facility allowing the Fund to borrow from, or lend money to, other participating affiliated funds. At period end, there were no interfund loans outstanding. Activity in this program during the period for which loans were outstanding was as follows:
| | Borrower or Lender | Average Loan Balance | Weighted Average Interest Rate | Interest Expense |
| Fidelity Small Cap Growth K6 Fund | Borrower | $5,005,885 | .32% | $1,146 |
Interfund Trades. Funds may purchase from or sell securities to other Fidelity Funds under procedures adopted by the Board. The procedures have been designed to ensure these interfund trades are executed in accordance with Rule 17a-7 of the 1940 Act. Any interfund trades are included within the respective purchases and sales amounts shown in the Purchases and Sales of Investments note. Interfund trades during the period are noted in the table below.
| | Purchases ($) | Sales ($) | Realized Gain (Loss) ($) |
| Fidelity Small Cap Growth K6 Fund | 60,353,629 | 72,901,931 | 4,594,280 |
Other. During the period, the investment adviser reimbursed the Fund for certain losses as follows:
| | Amount ($) |
| Fidelity Small Cap Growth K6 Fund | 4,809 |
6. Committed Line of Credit.
Certain Funds participate with other funds managed by the investment adviser or an affiliate in a $4.25 billion credit facility (the "line of credit") to be utilized for temporary or emergency purposes to fund shareholder redemptions or for other short-term liquidity purposes. The commitment fees on the pro-rata portion of the line of credit are borne by the investment adviser. During the period, there were no borrowings on this line of credit.
7. Security Lending.
Funds lend portfolio securities from time to time in order to earn additional income. Lending agents are used, including National Financial Services (NFS), an affiliate of the investment adviser. Pursuant to a securities lending agreement, NFS will receive a fee, which is capped at 9.9% of a fund's daily lending revenue, for its services as lending agent. A fund may lend securities to certain qualified borrowers, including NFS. On the settlement date of the loan, a fund receives collateral (in the form of U.S. Treasury obligations, letters of credit and/or cash) against the loaned securities and maintains collateral in an amount not less than 100% of the market value of the loaned securities during the period of the loan. The market value of the loaned securities is determined at the close of business of a fund and any additional required collateral is delivered to a fund on the next business day. A fund or borrower may terminate the loan at any time, and if the borrower defaults on its obligation to return the securities loaned because of insolvency or other reasons, a fund may apply collateral received from the borrower against the obligation. A fund may experience delays and costs in recovering the securities loaned. Any cash collateral received is invested in the Fidelity Securities Lending Cash Central Fund. Any loaned securities are identified as such in the Schedule of Investments, and the value of loaned securities and cash collateral at period end, as applicable, are presented in the Statement of Assets and Liabilities. Security lending income represents the income earned on investing cash collateral, less rebates paid to borrowers and any lending agent fees associated with the loan, plus any premium payments received for lending certain types of securities. Security lending income is presented in the Statement of Operations as a component of income from Fidelity Central Funds. Affiliated security lending activity, if any, was as follows:
| | Total Security Lending Fees Paid to NFS | Security Lending Income From Securities Loaned to NFS | Value of Securities Loaned to NFS at Period End |
| Fidelity Small Cap Growth K6 Fund | $99,826 | $8,778 | $7,498 |
8. Expense Reductions.
Through arrangements with the Fund's custodian, credits realized as a result of certain uninvested cash balances were used to reduce the Fund's expenses by $80.
9. Other.
A fund's organizational documents provide former and current trustees and officers with a limited indemnification against liabilities arising in connection with the performance of their duties to the fund. In the normal course of business, a fund may also enter into contracts that provide general indemnifications. A fund's maximum exposure under these arrangements is unknown as this would be dependent on future claims that may be made against a fund. The risk of material loss from such claims is considered remote.
10. Coronavirus (COVID-19) Pandemic.
An outbreak of COVID-19 first detected in China during December 2019 has since spread globally and was declared a pandemic by the World Health Organization during March 2020. Developments that disrupt global economies and financial markets, such as the COVID-19 pandemic, may magnify factors that affect the Fund's performance.
Report of Independent Registered Public Accounting Firm
To the Board of Trustees of Fidelity Securities Fund and Shareholders of Fidelity Small Cap Growth K6 Fund
Opinion on the Financial Statements
We have audited the accompanying statement of assets and liabilities, including the schedule of investments, of Fidelity Small Cap Growth K6 Fund (one of the funds constituting Fidelity Securities Fund, referred to hereafter as the “Fund”) as of July 31, 2022, the related statement of operations for the year ended July 31, 2022, the statement of changes in net assets for each of the two years in the period ended July 31, 2022, including the related notes, and the financial highlights for each of the five years in the period ended July 31, 2022 (collectively referred to as the “financial statements”). In our opinion, the financial statements present fairly, in all material respects, the financial position of the Fund as of July 31, 2022, the results of its operations for the year then ended, the changes in its net assets for each of the two years in the period ended July 31, 2022 and the financial highlights for each of the five years in the period ended July 31, 2022 in conformity with accounting principles generally accepted in the United States of America.
Basis for Opinion
These financial statements are the responsibility of the Fund’s management. Our responsibility is to express an opinion on the Fund’s financial statements based on our audits. We are a public accounting firm registered with the Public Company Accounting Oversight Board (United States) (PCAOB) and are required to be independent with respect to the Fund in accordance with the U.S. federal securities laws and the applicable rules and regulations of the Securities and Exchange Commission and the PCAOB.
We conducted our audits of these financial statements in accordance with the standards of the PCAOB. Those standards require that we plan and perform the audit to obtain reasonable assurance about whether the financial statements are free of material misstatement, whether due to error or fraud.
Our audits included performing procedures to assess the risks of material misstatement of the financial statements, whether due to error or fraud, and performing procedures that respond to those risks. Such procedures included examining, on a test basis, evidence regarding the amounts and disclosures in the financial statements. Our audits also included evaluating the accounting principles used and significant estimates made by management, as well as evaluating the overall presentation of the financial statements. Our procedures included confirmation of securities owned as of July 31, 2022 by correspondence with the custodian, issuers of privately offered securities and brokers; when replies were not received from brokers, we performed other auditing procedures. We believe that our audits provide a reasonable basis for our opinion.
/s/ PricewaterhouseCoopers LLP
Boston, Massachusetts
September 14, 2022
We have served as the auditor of one or more investment companies in the Fidelity group of funds since 1932.
Trustees and Officers
The Trustees, Members of the Advisory Board (if any), and officers of the trust and fund, as applicable, are listed below. The Board of Trustees governs the fund and is responsible for protecting the interests of shareholders. The Trustees are experienced executives who meet periodically throughout the year to oversee the fund's activities, review contractual arrangements with companies that provide services to the fund, oversee management of the risks associated with such activities and contractual arrangements, and review the fund's performance. Except for Jonathan Chiel, each of the Trustees oversees 316 funds. Mr. Chiel oversees 184 funds.
The Trustees hold office without limit in time except that (a) any Trustee may resign; (b) any Trustee may be removed by written instrument, signed by at least two-thirds of the number of Trustees prior to such removal; (c) any Trustee who requests to be retired or who has become incapacitated by illness or injury may be retired by written instrument signed by a majority of the other Trustees; and (d) any Trustee may be removed at any special meeting of shareholders by a two-thirds vote of the outstanding voting securities of the trust. Each Trustee who is not an interested person (as defined in the 1940 Act) of the trust and the fund is referred to herein as an Independent Trustee. Each Independent Trustee shall retire not later than the last day of the calendar year in which his or her 75th birthday occurs. The Independent Trustees may waive this mandatory retirement age policy with respect to individual Trustees. Officers and Advisory Board Members hold office without limit in time, except that any officer or Advisory Board Member may resign or may be removed by a vote of a majority of the Trustees at any regular meeting or any special meeting of the Trustees. Except as indicated, each individual has held the office shown or other offices in the same company for the past five years.
The fund’s Statement of Additional Information (SAI) includes more information about the Trustees. To request a free copy, call Fidelity at 1-800-835-5092.
Experience, Skills, Attributes, and Qualifications of the Trustees. The Governance and Nominating Committee has adopted a statement of policy that describes the experience, qualifications, attributes, and skills that are necessary and desirable for potential Independent Trustee candidates (Statement of Policy). The Board believes that each Trustee satisfied at the time he or she was initially elected or appointed a Trustee, and continues to satisfy, the standards contemplated by the Statement of Policy. The Governance and Nominating Committee also engages professional search firms to help identify potential Independent Trustee candidates who have the experience, qualifications, attributes, and skills consistent with the Statement of Policy. From time to time, additional criteria based on the composition and skills of the current Independent Trustees, as well as experience or skills that may be appropriate in light of future changes to board composition, business conditions, and regulatory or other developments, have also been considered by the professional search firms and the Governance and Nominating Committee. In addition, the Board takes into account the Trustees' commitment and participation in Board and committee meetings, as well as their leadership of standing and ad hoc committees throughout their tenure.
In determining that a particular Trustee was and continues to be qualified to serve as a Trustee, the Board has considered a variety of criteria, none of which, in isolation, was controlling. The Board believes that, collectively, the Trustees have balanced and diverse experience, qualifications, attributes, and skills, which allow the Board to operate effectively in governing the fund and protecting the interests of shareholders. Information about the specific experience, skills, attributes, and qualifications of each Trustee, which in each case led to the Board's conclusion that the Trustee should serve (or continue to serve) as a trustee of the fund, is provided below.
Board Structure and Oversight Function. Robert A. Lawrence is an interested person and currently serves as Chair. The Trustees have determined that an interested Chair is appropriate and benefits shareholders because an interested Chair has a personal and professional stake in the quality and continuity of services provided to the fund. Independent Trustees exercise their informed business judgment to appoint an individual of their choosing to serve as Chair, regardless of whether the Trustee happens to be independent or a member of management. The Independent Trustees have determined that they can act independently and effectively without having an Independent Trustee serve as Chair and that a key structural component for assuring that they are in a position to do so is for the Independent Trustees to constitute a substantial majority for the Board. The Independent Trustees also regularly meet in executive session. David M. Thomas serves as Lead Independent Trustee and as such (i) acts as a liaison between the Independent Trustees and management with respect to matters important to the Independent Trustees and (ii) with management prepares agendas for Board meetings.
Fidelity® funds are overseen by different Boards of Trustees. The fund's Board oversees Fidelity's high income and certain equity funds, and other Boards oversee Fidelity's investment-grade bond, money market, asset allocation, and other equity funds. The asset allocation funds may invest in Fidelity® funds overseen by the fund's Board. The use of separate Boards, each with its own committee structure, allows the Trustees of each group of Fidelity® funds to focus on the unique issues of the funds they oversee, including common research, investment, and operational issues. On occasion, the separate Boards establish joint committees to address issues of overlapping consequences for the Fidelity® funds overseen by each Board.
The Trustees operate using a system of committees to facilitate the timely and efficient consideration of all matters of importance to the Trustees, the fund, and fund shareholders and to facilitate compliance with legal and regulatory requirements and oversight of the fund's activities and associated risks. The Board, acting through its committees, has charged FMR and its affiliates with (i) identifying events or circumstances the occurrence of which could have demonstrably adverse effects on the fund's business and/or reputation; (ii) implementing processes and controls to lessen the possibility that such events or circumstances occur or to mitigate the effects of such events or circumstances if they do occur; and (iii) creating and maintaining a system designed to evaluate continuously business and market conditions in order to facilitate the identification and implementation processes described in (i) and (ii) above. Because the day-to-day operations and activities of the fund are carried out by or through FMR, its affiliates, and other service providers, the fund's exposure to risks is mitigated but not eliminated by the processes overseen by the Trustees. While each of the Board's committees has responsibility for overseeing different aspects of the fund's activities, oversight is exercised primarily through the Operations, Audit, and Compliance Committees. Appropriate personnel, including but not limited to the fund's Chief Compliance Officer (CCO), FMR's internal auditor, the independent accountants, the fund's Treasurer and portfolio management personnel, make periodic reports to the Board's committees, as appropriate, including an annual review of Fidelity's risk management program for the Fidelity® funds. The responsibilities of each standing committee, including their oversight responsibilities, are described further under "Standing Committees of the Trustees."
Interested Trustees*:
Correspondence intended for a Trustee who is an interested person may be sent to Fidelity Investments, 245 Summer Street, Boston, Massachusetts 02210.
Name, Year of Birth; Principal Occupations and Other Relevant Experience+
Jonathan Chiel (1957)
Year of Election or Appointment: 2016
Trustee
Mr. Chiel also serves as Trustee of other Fidelity® funds. Mr. Chiel is Executive Vice President and General Counsel for FMR LLC (diversified financial services company, 2012-present). Previously, Mr. Chiel served as general counsel (2004-2012) and senior vice president and deputy general counsel (2000-2004) for John Hancock Financial Services; a partner with Choate, Hall & Stewart (1996-2000) (law firm); and an Assistant United States Attorney for the United States Attorney’s Office of the District of Massachusetts (1986-95), including Chief of the Criminal Division (1993-1995). Mr. Chiel is a director on the boards of the Boston Bar Foundation and the Maimonides School.
Bettina Doulton (1964)
Year of Election or Appointment: 2021
Trustee
Ms. Doulton also serves as Trustee of other Fidelity® funds. Prior to her retirement, Ms. Doulton served in a variety of positions at Fidelity Investments, including as a managing director of research (2006-2007), portfolio manager to certain Fidelity® funds (1993-2005), equity analyst and portfolio assistant (1990-1993), and research assistant (1987-1990). Ms. Doulton currently owns and operates Phi Builders + Architects and Cellardoor Winery. Previously, Ms. Doulton served as a member of the Board of Brown Capital Management, LLC (2014-2018).
Robert A. Lawrence (1952)
Year of Election or Appointment: 2020
Trustee
Chair of the Board of Trustees
Mr. Lawrence also serves as Trustee of other funds. Previously, Mr. Lawrence served as a Trustee and Member of the Advisory Board of certain funds. Prior to his retirement in 2008, Mr. Lawrence served as Vice President of certain Fidelity® funds (2006-2008), Senior Vice President, Head of High Income Division of Fidelity Management & Research Company (investment adviser firm, 2006-2008), and President of Fidelity Strategic Investments (investment adviser firm, 2002-2005).
* Determined to be an “Interested Trustee” by virtue of, among other things, his or her affiliation with the trust or various entities under common control with FMR.
+ The information includes the Trustee's principal occupation during the last five years and other information relating to the experience, attributes, and skills relevant to the Trustee's qualifications to serve as a Trustee, which led to the conclusion that the Trustee should serve as a Trustee for the fund.
Independent Trustees:
Correspondence intended for an Independent Trustee may be sent to Fidelity Investments, P.O. Box 55235, Boston, Massachusetts 02205-5235.
Name, Year of Birth; Principal Occupations and Other Relevant Experience+
Thomas P. Bostick (1956)
Year of Election or Appointment: 2021
Trustee
Lieutenant General Bostick also serves as Trustee of other Fidelity® funds. Prior to his retirement, General Bostick (United States Army, Retired) held a variety of positions within the U.S. Army, including Commanding General and Chief of Engineers, U.S. Army Corps of Engineers (2012-2016) and Deputy Chief of Staff and Director of Human Resources, U.S. Army (2009-2012). General Bostick currently serves as a member of the Board and Finance and Governance Committees of CSX Corporation (transportation, 2020-present) and a member of the Board and Corporate Governance and Nominating Committee of Perma-Fix Environmental Services, Inc. (nuclear waste management, 2020-present). General Bostick serves as Chief Executive Officer of Bostick Global Strategies, LLC (consulting, 2016-present) and as a member of the Board of HireVue, Inc. (video interview and assessment, 2020-present). Previously, General Bostick served as a Member of the Advisory Board of certain Fidelity® funds (2021), President, Intrexon Bioengineering (2018-2020) and Chief Operating Officer (2017-2020) and Senior Vice President of the Environment Sector (2016-2017) of Intrexon Corporation (biopharmaceutical company).
Dennis J. Dirks (1948)
Year of Election or Appointment: 2005
Trustee
Mr. Dirks also serves as Trustee of other Fidelity® funds. Prior to his retirement in May 2003, Mr. Dirks served as Chief Operating Officer and as a member of the Board of The Depository Trust & Clearing Corporation (financial markets infrastructure), President, Chief Operating Officer and a member of the Board of The Depository Trust Company (DTC), President and a member of the Board of the National Securities Clearing Corporation (NSCC), Chief Executive Officer and a member of the Board of the Government Securities Clearing Corporation and Chief Executive Officer and a member of the Board of the Mortgage-Backed Securities Clearing Corporation. Mr. Dirks currently serves as a member of the Finance Committee (2016-present) and Board (2017-present) and is Treasurer (2018-present) of the Asolo Repertory Theatre.
Donald F. Donahue (1950)
Year of Election or Appointment: 2018
Trustee
Mr. Donahue also serves as Trustee of other Fidelity® funds. Mr. Donahue serves as President and Chief Executive Officer of Miranda Partners, LLC (risk consulting for the financial services industry, 2012-present). Previously, Mr. Donahue served as Chief Executive Officer (2006-2012), Chief Operating Officer (2003-2006) and Managing Director, Customer Marketing and Development (1999-2003) of The Depository Trust & Clearing Corporation (financial markets infrastructure). Mr. Donahue currently serves as a member (2007-present) and Co-Chairman (2016-present) of the Board of United Way of New York and a member of the Board of The Leadership Academy (previously NYC Leadership Academy) (2012-present). Mr. Donahue previously served as a member of the Advisory Board of certain Fidelity® funds (2015-2018).
Vicki L. Fuller (1957)
Year of Election or Appointment: 2020
Trustee
Ms. Fuller also serves as Trustee of other Fidelity® funds. Previously, Ms. Fuller served as a member of the Advisory Board of certain Fidelity® funds (2018-2020), Chief Investment Officer of the New York State Common Retirement Fund (2012-2018) and held a variety of positions at AllianceBernstein L.P. (global asset management, 1985-2012), including Managing Director (2006-2012) and Senior Vice President and Senior Portfolio Manager (2001-2006). Ms. Fuller currently serves as a member of the Board, Audit Committee and Nominating and Governance Committee of two Blackstone business development companies (2020-present), as a member of the Board of Treliant, LLC (consulting, 2019-present), as a member of the Advisory Board of Ariel Alternatives, LLC (private equity, 2021-present) and as a member of the Board and Chair of the Audit Committee of Gusto, Inc. (software, 2021-present). In addition, Ms. Fuller currently serves as a member of the Board of Roosevelt University (2019-present) and as a member of the Executive Board of New York University’s Stern School of Business. Ms. Fuller previously served as a member of the Board, Audit Committee and Nominating and Governance Committee of The Williams Companies, Inc. (natural gas infrastructure, 2018-2021).
Patricia L. Kampling (1959)
Year of Election or Appointment: 2020
Trustee
Ms. Kampling also serves as Trustee of other Fidelity® funds. Prior to her retirement, Ms. Kampling served as Chairman of the Board and Chief Executive Officer (2012-2019), President and Chief Operating Officer (2011-2012) and Executive Vice President and Chief Financial Officer (2010-2011) of Alliant Energy Corporation. Ms. Kampling currently serves as a member of the Board, Finance Committee and Governance, Compensation and Nominating Committee of Xcel Energy Inc. (utilities company, 2020-present) and as a member of the Board, Audit, Finance and Risk Committee and Safety, Environmental, Technology and Operations Committee and Chair of the Executive Development and Compensation Committee of American Water Works Company, Inc. (utilities company, 2019-present). In addition, Ms. Kampling currently serves as a member of the Board of the Nature Conservancy, Wisconsin Chapter (2019-present). Previously, Ms. Kampling served as a Member of the Advisory Board of certain Fidelity® funds (2020), a member of the Board, Compensation Committee and Executive Committee and Chair of the Audit Committee of Briggs & Stratton Corporation (manufacturing, 2011-2021), a member of the Board of Interstate Power and Light Company (2012-2019) and Wisconsin Power and Light Company (2012-2019) (each a subsidiary of Alliant Energy Corporation) and as a member of the Board and Workforce Development Committee of the Business Roundtable (2018-2019).
Thomas A. Kennedy (1955)
Year of Election or Appointment: 2021
Trustee
Mr. Kennedy also serves as Trustee of other Fidelity® funds. Previously, Mr. Kennedy served as a Member of the Advisory Board of certain Fidelity® funds (2020) and held a variety of positions at Raytheon Company (aerospace and defense, 1983-2020), including Chairman and Chief Executive Officer (2014-2020) and Executive Vice President and Chief Operating Officer (2013-2014). Mr. Kennedy currently serves as Executive Chairman of the Board of Directors of Raytheon Technologies Corporation (aerospace and defense, 2020-present). He is also a member of the Rutgers School of Engineering Industry Advisory Board (2011-present) and a member of the UCLA Engineering Dean’s Executive Board (2016-present).
Oscar Munoz (1959)
Year of Election or Appointment: 2021
Trustee
Mr. Munoz also serves as Trustee of other Fidelity® funds. Prior to his retirement, Mr. Munoz served as Executive Chairman (2020-2021), Chief Executive Officer (2015-2020), President (2015-2016) and a member of the Board (2010-2021) of United Airlines Holdings, Inc. Mr. Munoz currently serves as a member of the Board of CBRE Group, Inc. (commercial real estate, 2020-present), a member of the Board of Univision Communications, Inc. (Hispanic media, 2020-present) and a member of the Advisory Board of Salesforce.com, Inc. (cloud-based software, 2020-present). Previously, Mr. Munoz served as a Member of the Advisory Board of certain Fidelity® funds (2021).
Garnett A. Smith (1947)
Year of Election or Appointment: 2018
Trustee
Mr. Smith also serves as Trustee of other Fidelity® funds. Prior to his retirement, Mr. Smith served as Chairman and Chief Executive Officer (1990-1997) and President (1986-1990) of Inbrand Corp. (manufacturer of personal absorbent products). Prior to his employment with Inbrand Corp., he was employed by a retail fabric chain and North Carolina National Bank (now Bank of America). Mr. Smith previously served as a member of the Advisory Board of certain Fidelity® funds (2012-2013).
David M. Thomas (1949)
Year of Election or Appointment: 2008
Trustee
Lead Independent Trustee
Mr. Thomas also serves as Trustee of other Fidelity® funds. Previously, Mr. Thomas served as Executive Chairman (2005-2006) and Chairman and Chief Executive Officer (2000-2005) of IMS Health, Inc. (pharmaceutical and healthcare information solutions). Mr. Thomas currently serves as a member of the Board of Fortune Brands Home and Security (home and security products, 2004-present) and as Director (2013-present) and Non-Executive Chairman of the Board (2022-present) of Interpublic Group of Companies, Inc. (marketing communication).
Susan Tomasky (1953)
Year of Election or Appointment: 2020
Trustee
Ms. Tomasky also serves as Trustee of other Fidelity® funds. Prior to her retirement, Ms. Tomasky served in various executive officer positions at American Electric Power Company, Inc. (1998-2011), including most recently as President of AEP Transmission (2007-2011). Ms. Tomasky currently serves as a member of the Board and Sustainability Committee and as Chair of the Audit Committee of Marathon Petroleum Corporation (2018-present) and as a member of the Board, Executive Committee, Corporate Governance Committee and Organization and Compensation Committee and as Chair of the Audit Committee of Public Service Enterprise Group, Inc. (utilities company, 2012-present) and as a member of the Board of its subsidiary company, Public Service Electric and Gas Co. (2021-present). In addition, Ms. Tomasky currently serves as a member (2009-present) and President (2020-present) of the Board of the Royal Shakespeare Company – America (2009-present), as a member of the Board of the Columbus Association for the Performing Arts (2011-present) and as a member of the Board and Kenyon in the World Committee of Kenyon College (2016-present). Previously, Ms. Tomasky served as a Member of the Advisory Board of certain Fidelity® funds (2020), as a member of the Board of the Columbus Regional Airport Authority (2007-2020), as a member of the Board (2011-2018) and Lead Independent Director (2015-2018) of Andeavor Corporation (previously Tesoro Corporation) (independent oil refiner and marketer) and as a member of the Board of Summit Midstream Partners LP (energy, 2012-2018).
Michael E. Wiley (1950)
Year of Election or Appointment: 2020
Trustee
Mr. Wiley also serves as Trustee of other Fidelity® funds. Previously, Mr. Wiley served as a member of the Advisory Board of certain Fidelity® funds (2018-2020), Chairman, President and CEO of Baker Hughes, Inc. (oilfield services, 2000-2004). Mr. Wiley also previously served as a member of the Board of Andeavor Corporation (independent oil refiner and marketer, 2005-2018), a member of the Board of Andeavor Logistics LP (natural resources logistics, 2015-2018) and a member of the Board of High Point Resources (exploration and production, 2005-2020).
+ The information includes the Trustee's principal occupation during the last five years and other information relating to the experience, attributes, and skills relevant to the Trustee's qualifications to serve as a Trustee, which led to the conclusion that the Trustee should serve as a Trustee for the fund.
Advisory Board Members and Officers:
Correspondence intended for a Member of the Advisory Board (if any) may be sent to Fidelity Investments, P.O. Box 55235, Boston, Massachusetts 02205-5235. Correspondence intended for an officer or Peter S. Lynch may be sent to Fidelity Investments, 245 Summer Street, Boston, Massachusetts 02210. Officers appear below in alphabetical order.
Name, Year of Birth; Principal Occupation
Peter S. Lynch (1944)
Year of Election or Appointment: 2003
Member of the Advisory Board
Mr. Lynch also serves as a Member of the Advisory Board of other Fidelity® funds. Mr. Lynch is Vice Chairman and a Director of Fidelity Management & Research Company LLC (investment adviser firm). In addition, Mr. Lynch serves as a Trustee of Boston College and as the Chairman of the Inner-City Scholarship Fund. Previously, Mr. Lynch served as Vice Chairman and a Director of FMR Co., Inc. (investment adviser firm) and on the Special Olympics International Board of Directors (1997-2006).
Craig S. Brown (1977)
Year of Election or Appointment: 2019
Assistant Treasurer
Mr. Brown also serves as an officer of other funds. Mr. Brown serves as Assistant Treasurer of FIMM, LLC (2021-present) and is an employee of Fidelity Investments (2013-present).
John J. Burke III (1964)
Year of Election or Appointment: 2018
Chief Financial Officer
Mr. Burke also serves as Chief Financial Officer of other funds. Mr. Burke serves as Head of Investment Operations for Fidelity Fund and Investment Operations (2018-present) and is an employee of Fidelity Investments (1998-present). Previously Mr. Burke served as head of Asset Management Investment Operations (2012-2018).
William C. Coffey (1969)
Year of Election or Appointment: 2019
Assistant Secretary
Mr. Coffey also serves as Assistant Secretary of other funds. He is Senior Vice President and Deputy General Counsel of FMR LLC (diversified financial services company, 2010-present), and is an employee of Fidelity Investments. Previously, Mr. Coffey served as Secretary and CLO of certain funds (2018-2019); CLO, Secretary, and Senior Vice President of Fidelity Management & Research Company and FMR Co., Inc. (investment adviser firms, 2018-2019); Secretary of Fidelity SelectCo, LLC and Fidelity Investments Money Management, Inc. (investment adviser firms, 2018-2019); CLO of Fidelity Management & Research (Hong Kong) Limited, FMR Investment Management (UK) Limited, and Fidelity Management & Research (Japan) Limited (investment adviser firms, 2018-2019); and Assistant Secretary of certain funds (2009-2018).
Timothy M. Cohen (1969)
Year of Election or Appointment: 2018
Vice President
Mr. Cohen also serves as Vice President of other funds. Mr. Cohen serves as Co-Head of Equity (2018-present), a Director of Fidelity Management & Research (Japan) Limited (investment adviser firm, 2016-present), and is an employee of Fidelity Investments. Previously, Mr. Cohen served as Executive Vice President of Fidelity SelectCo, LLC (2019), Head of Global Equity Research (2016-2018), Chief Investment Officer - Equity and a Director of Fidelity Management & Research (U.K.) Inc. (investment adviser firm, 2013-2015) and as a Director of Fidelity Management & Research (Hong Kong) Limited (investment adviser firm, 2017).
Jonathan Davis (1968)
Year of Election or Appointment: 2010
Assistant Treasurer
Mr. Davis also serves as an officer of other funds. Mr. Davis serves as Assistant Treasurer of FIMM, LLC (2021-present), FMR Capital, Inc. (2017-present), FD Funds GP LLC (2021-present), FD Funds Holding LLC (2021-present), and FD Funds Management LLC (2021-present); and is an employee of Fidelity Investments. Previously, Mr. Davis served as Vice President and Associate General Counsel of FMR LLC (diversified financial services company, 2003-2010).
Laura M. Del Prato (1964)
Year of Election or Appointment: 2018
Assistant Treasurer
Ms. Del Prato also serves as an officer of other funds. Ms. Del Prato serves as Assistant Treasurer of FIMM, LLC (2021-present) and is an employee of Fidelity Investments (2017-present). Previously, Ms. Del Prato served as President and Treasurer of The North Carolina Capital Management Trust: Cash Portfolio and Term Portfolio (2018-2020). Prior to joining Fidelity Investments, Ms. Del Prato served as a Managing Director and Treasurer of the JPMorgan Mutual Funds (2014-2017). Prior to JPMorgan, Ms. Del Prato served as a partner at Cohen Fund Audit Services (accounting firm, 2012-2013) and KPMG LLP (accounting firm, 2004-2012).
Colm A. Hogan (1973)
Year of Election or Appointment: 2020
Assistant Treasurer
Mr. Hogan also serves as an officer of other funds. Mr. Hogan serves as Assistant Treasurer of FIMM, LLC (2021-present) and FMR Capital, Inc. (2017-present) and is an employee of Fidelity Investments (2005-present). Previously, Mr. Hogan served as Deputy Treasurer of certain Fidelity® funds (2016-2020) and Assistant Treasurer of certain Fidelity® funds (2016-2018).
Pamela R. Holding (1964)
Year of Election or Appointment: 2018
Vice President
Ms. Holding also serves as Vice President of other funds. Ms. Holding serves as Co-Head of Equity (2018-present) and is an employee of Fidelity Investments (2013-present). Previously, Ms. Holding served as Executive Vice President of Fidelity SelectCo, LLC (2019) and as Chief Investment Officer of Fidelity Institutional Asset Management (2013-2018).
Cynthia Lo Bessette (1969)
Year of Election or Appointment: 2019
Secretary and Chief Legal Officer (CLO)
Ms. Lo Bessette also serves as an officer of other funds. Ms. Lo Bessette serves as CLO, Secretary, and Senior Vice President of Fidelity Management & Research Company LLC (investment adviser firm, 2019-present); CLO of Fidelity Management & Research (Hong Kong) Limited, FMR Investment Management (UK) Limited, and Fidelity Management & Research (Japan) Limited (investment adviser firms, 2019-present); Secretary of FD Funds GP LLC (2021-present), FD Funds Holding LLC (2021-present), and FD Funds Management LLC (2021-present); and Assistant Secretary of FIMM, LLC (2019-present). She is a Senior Vice President and Deputy General Counsel of FMR LLC (diversified financial services company, 2019-present), and is an employee of Fidelity Investments. Previously, Ms. Lo Bessette served as CLO, Secretary, and Senior Vice President of FMR Co., Inc. (investment adviser firm, 2019); Secretary of Fidelity SelectCo, LLC and Fidelity Investments Money Management, Inc. (investment adviser firms, 2019). Prior to joining Fidelity Investments, Ms. Lo Bessette was Executive Vice President, General Counsel (2016-2019) and Senior Vice President, Deputy General Counsel (2015-2016) of OppenheimerFunds (investment management company) and Deputy Chief Legal Officer (2013-2015) of Jennison Associates LLC (investment adviser firm).
Chris Maher (1972)
Year of Election or Appointment: 2020
Deputy Treasurer
Mr. Maher also serves as an officer of other funds. Mr. Maher serves as Assistant Treasurer of FIMM, LLC (2021-present) and FMR Capital, Inc. (2017-present), and is an employee of Fidelity Investments (2008-present). Previously, Mr. Maher served as Assistant Treasurer of certain funds (2013-2020); Vice President of Asset Management Compliance (2013), Vice President of the Program Management Group of FMR (investment adviser firm, 2010-2013), and Vice President of Valuation Oversight (2008-2010).
Jason P. Pogorelec (1975)
Year of Election or Appointment: 2020
Chief Compliance Officer
Mr. Pogorelec also serves as Chief Compliance Officer of other funds. Mr. Pogorelec is a senior Vice President of Asset Management Compliance for Fidelity Investments and is an employee of Fidelity Investments (2006-present). Previously, Mr. Pogorelec served as Vice President, Associate General Counsel for Fidelity Investments (2010-2020) and Assistant Secretary of certain Fidelity funds (2015-2020).
Brett Segaloff (1972)
Year of Election or Appointment: 2021
Anti-Money Laundering (AML) Officer
Mr. Segaloff also serves as an AML Officer of other funds and other related entities. He is Director, Anti-Money Laundering (2007-present) of FMR LLC (diversified financial services company) and is an employee of Fidelity Investments (1996-present).
Stacie M. Smith (1974)
Year of Election or Appointment: 2016
President and Treasurer
Ms. Smith also serves as an officer of other funds. Ms. Smith serves as Assistant Treasurer of FIMM, LLC (2021-present) and FMR Capital, Inc. (2017-present), is an employee of Fidelity Investments (2009-present), and has served in other fund officer roles. Prior to joining Fidelity Investments, Ms. Smith served as Senior Audit Manager of Ernst & Young LLP (accounting firm, 1996-2009). Previously, Ms. Smith served as Assistant Treasurer (2013-2019) and Deputy Treasurer (2013-2016) of certain Fidelity® funds.
Jim Wegmann (1979)
Year of Election or Appointment: 2019
Assistant Treasurer
Mr. Wegmann also serves as an officer of other funds. Mr. Wegmann serves as Assistant Treasurer of FIMM, LLC (2021-present) and is an employee of Fidelity Investments (2011-present). Previously, Mr. Wegmann served as Assistant Treasurer of certain Fidelity® funds (2019-2021).
Shareholder Expense Example
As a shareholder, you incur two types of costs: (1) transaction costs, which may include sales charges (loads) on purchase payments or redemption proceeds, as applicable and (2) ongoing costs, which generally include management fees, distribution and/or service (12b-1) fees and other Fund expenses. This Example is intended to help you understand your ongoing costs (in dollars) of investing in a fund and to compare these costs with the ongoing costs of investing in other mutual funds.
The Example is based on an investment of $1,000 invested at the beginning of the period and held for the entire period (February 1, 2022 to July 31, 2022).
Actual Expenses
The first line of the accompanying table provides information about actual account values and actual expenses. You may use the information in this line, together with the amount you invested, to estimate the expenses that you paid over the period. Simply divide your account value by $1,000.00 (for example, an $8,600 account value divided by $1,000.00 = 8.6), then multiply the result by the number in the first line for a class/Fund under the heading entitled "Expenses Paid During Period" to estimate the expenses you paid on your account during this period. If any fund is a shareholder of any underlying mutual funds or exchange-traded funds (ETFs) (the Underlying Funds), such fund indirectly bears its proportional share of the expenses of the Underlying Funds in addition to the direct expenses incurred presented in the table. These fees and expenses are not included in the annualized expense ratio used to calculate the expense estimate in the table below.
Hypothetical Example for Comparison Purposes
The second line of the accompanying table provides information about hypothetical account values and hypothetical expenses based on the actual expense ratio and an assumed rate of return of 5% per year before expenses, which is not the actual return. The hypothetical account values and expenses may not be used to estimate the actual ending account balance or expenses you paid for the period. You may use this information to compare the ongoing costs of investing in the Fund and other funds. To do so, compare this 5% hypothetical example with the 5% hypothetical examples that appear in the shareholder reports of the other funds. If any fund is a shareholder of any Underlying Funds, such fund indirectly bears its proportional share of the expenses of the Underlying Funds in addition to the direct expenses as presented in the table. These fees and expenses are not included in the annualized expense ratio used to calculate the expense estimate in the table below.
Please note that the expenses shown in the table are meant to highlight your ongoing costs only and do not reflect any transaction costs. Therefore, the second line of the table is useful in comparing ongoing costs only, and will not help you determine the relative total costs of owning different funds. In addition, if these transactional costs were included, your costs would have been higher.
| | Annualized Expense Ratio-A | Beginning
Account Value
February 1, 2022 | Ending
Account Value
July 31, 2022 | Expenses Paid
During Period-B
February 1, 2022
to July 31, 2022 |
| Fidelity Small Cap Growth K6 Fund | .60% | | | |
| Actual | | $1,000.00 | $898.10 | $2.82 |
| Hypothetical-C | | $1,000.00 | $1,021.82 | $3.01 |
A Annualized expense ratio reflects expenses net of applicable fee waivers.
B Expenses are equal to the annualized expense ratio, multiplied by the average account value over the period, multiplied by 181/ 365 (to reflect the one-half year period). The fees and expenses of any Underlying Funds are not included in each annualized expense ratio.
C 5% return per year before expenses
Distributions (Unaudited)
The dividend and capital gains distributions for the fund(s) are available on Fidelity.com or Institutional.Fidelity.com.
The fund hereby designates as a capital gain dividend with respect to the taxable year ended July 31, 2022, $40,743,101, or, if subsequently determined to be different, the net capital gain of such year.
The fund designates 99.99% and 99.50% of the short-term capital gain dividends distributed in September and December, respectively during the fiscal year as qualifying to be taxed as short-term capital gain dividends for nonresident alien shareholders.
The fund designates 2% and 63% of the dividends distributed in September and December, respectively during the fiscal year as qualifying for the dividends–received deduction for corporate shareholders.
The fund designates 3% and 71% of the dividends distributed in September and December, respectively during the fiscal year as amounts which may be taken into account as a dividend for the purposes of the maximum rate under section 1(h)(11) of the Internal Revenue Code.
The fund designates 1% and 2% of the dividends distributed in September and December, respectively during the fiscal year as a section 199A dividend.
The fund will notify shareholders in January 2023 of amounts for use in preparing 2022 income tax returns.
Board Approval of Investment Advisory Contracts and Management Fees
Fidelity Small Cap Growth K6 Fund
Each year, the Board of Trustees, including the Independent Trustees (together, the Board), votes on the renewal of the management contract with Fidelity Management & Research Company LLC (FMR) and the sub-advisory agreements (together, the Advisory Contracts) for the fund. FMR and the sub-advisers are referred to herein as the Investment Advisers. The Board, assisted by the advice of fund counsel and Independent Trustees' counsel, requests and considers a broad range of information relevant to the renewal of the Advisory Contracts throughout the year.
The Board meets regularly and, at each of its meetings, covers an extensive agenda of topics and materials and considers factors that are relevant to its annual consideration of the renewal of the fund's Advisory Contracts, including the services and support provided to the fund and its shareholders. The Board has established various standing committees (Committees), each composed of and chaired by Independent Trustees with varying backgrounds, to which the Board has assigned specific subject matter responsibilities in order to enhance effective decision-making by the Board. The Board, acting directly and through its Committees, requests and receives information concerning the annual consideration of the renewal of the fund's Advisory Contracts. The Board also meets as needed to review matters specifically related to the Board's annual consideration of the renewal of the Advisory Contracts. Members of the Board may also meet with trustees of other Fidelity funds through joint ad hoc committees to discuss certain matters relevant to all of the Fidelity funds.
At its May 2022 meeting, the Board unanimously determined to renew the fund's Advisory Contracts. In reaching its determination, the Board considered all factors it believed relevant, including (i) the nature, extent, and quality of the services provided to the fund and its shareholders (including the investment performance of the fund); (ii) the competitiveness relative to peer funds of the fund's management fee and total expense ratio; (iii) the total costs of the services provided by and the profits realized by Fidelity from its relationships with the fund; and (iv) the extent to which, if any, economies of scale exist and are realized as the fund grows, and whether any economies of scale are appropriately shared with fund shareholders.
In considering whether to renew the Advisory Contracts for the fund, the Board reached a determination, with the assistance of fund counsel and Independent Trustees' counsel and through the exercise of its business judgment, that the renewal of the Advisory Contracts was in the best interests of the fund and its shareholders and that the compensation payable under the Advisory Contracts was fair and reasonable. The Board's decision to renew the Advisory Contracts was not based on any single factor, but rather was based on a comprehensive consideration of all the information provided to the Board at its meetings throughout the year. The Board, in reaching its determination to renew the Advisory Contracts, was aware that shareholders of the fund have a broad range of investment choices available to them, including a wide choice among funds offered by Fidelity's competitors, and that the fund's shareholders, who have the opportunity to review and weigh the disclosure provided by the fund in its prospectus and other public disclosures, have chosen to invest in this fund, which is part of the Fidelity family of funds.
Nature, Extent, and Quality of Services Provided. The Board considered Fidelity's staffing as it relates to the fund, including the backgrounds of investment personnel of Fidelity, and also considered the fund's investment objective, strategies, and related investment philosophy. The Independent Trustees also had discussions with senior management of Fidelity's investment operations and investment groups. The Board considered the structure of the investment personnel compensation program and whether this structure provides appropriate incentives to act in the best interests of the fund. Additionally, the Board considered the portfolio managers' investments, if any, in the funds that they manage. The Board also considered the steps Fidelity had taken to ensure the continued provision of high quality services to the Fidelity funds during the COVID-19 pandemic, including the expansion of staff in client facing positions to maintain service levels in periods of high volumes and volatility.
Resources Dedicated to Investment Management and Support Services. The Board and the Fund Oversight and Research Committees reviewed the general qualifications and capabilities of Fidelity's investment staff, including its size, education, experience, and resources, as well as Fidelity's approach to recruiting, training, managing, and compensating investment personnel. The Board noted the resources devoted to expansion of Fidelity's global investment organization, and that Fidelity's analysts have extensive resources, tools, and capabilities that allow them to conduct sophisticated quantitative and fundamental analysis, as well as credit analysis of issuers, counterparties, and guarantors. Further, the Board considered that Fidelity's investment professionals have sufficient access to global information and data so as to provide competitive investment results over time, and that those professionals also have access to sophisticated tools that permit them to assess portfolio construction and risk and performance attribution characteristics continuously, as well as to transmit new information and research conclusions rapidly around the world. Additionally, in its deliberations, the Board considered Fidelity's trading, risk management, compliance, and technology and operations capabilities and resources, which are integral parts of the investment management process.
Shareholder and Administrative Services. The Board considered (i) the nature, extent, quality, and cost of advisory, administrative, and shareholder services performed by the Investment Advisers and their affiliates under the Advisory Contracts and under separate agreements covering transfer agency, pricing and bookkeeping, and securities lending services for the fund; (ii) the nature and extent of the supervision of third party service providers, principally custodians, subcustodians, and pricing vendors; and (iii) the resources devoted to, and the record of compliance with, the fund's compliance policies and procedures. The Board also reviewed the allocation of fund brokerage, including allocations to brokers affiliated with the Investment Advisers, the use of brokerage commissions to pay fund expenses, and the use of "soft" commission dollars to pay for research services.
The Board noted that the growth of fund assets over time across the complex allows Fidelity to reinvest in the development of services designed to enhance the value and convenience of the Fidelity funds as investment vehicles. These services include 24-hour access to account information and market information over the Internet and through telephone representatives, investor education materials, and asset allocation tools. The Board also considered that it reviews customer service metrics such as telephone response times, continuity of services on the website and metrics addressing services at Fidelity Investor Centers.
Investment in a Large Fund Family. The Board considered the benefits to shareholders of investing in a Fidelity fund, including the benefits of investing in a fund that is part of a large family of funds offering a variety of investment disciplines and providing a large variety of mutual fund investor services. The Board noted that Fidelity had taken, or had made recommendations that resulted in the Fidelity funds taking, a number of actions over the previous year that benefited particular funds, including: (i) continuing to dedicate additional resources to Fidelity's investment research process, which includes meetings with management of issuers of securities in which the funds invest; (ii) continuing efforts to enhance Fidelity's global research capabilities; (iii) launching new funds and ETFs with innovative structures, strategies and pricing and making other enhancements to meet client needs; (iv) launching new share classes of existing funds; (v) eliminating purchase minimums and broadening eligibility requirements for certain funds and share classes; (vi) reducing management fees and total expenses for certain target date funds and classes and index funds; (vii) lowering expenses for certain existing funds and classes by implementing or lowering expense caps; (viii) rationalizing product lines and gaining increased efficiencies from fund mergers and liquidations; (ix) continuing to develop, acquire and implement systems and technology to improve services to the funds and shareholders, strengthen information security, and increase efficiency; and (x) continuing to implement enhancements to further strengthen Fidelity's product line to increase investors' probability of success in achieving their investment goals, including retirement income goals.
Investment Performance. The Board considered whether the fund has operated in accordance with its investment objective, as well as its record of compliance with its investment restrictions and its performance history.
The Board took into account discussions that occur at Board meetings throughout the year with representatives of the Investment Advisers about fund investment performance. In this regard the Board noted that as part of regularly scheduled fund reviews and other reports to the Board on fund performance, the Board considers annualized return information for the fund for different time periods, measured against an appropriate securities market index (benchmark index) and an appropriate peer group of funds with similar objectives (peer group). The Board also reviews and considers information about performance attribution. In its evaluation of fund investment performance, the Board gave particular attention to information indicating changes in performance of certain Fidelity funds for specific time periods and discussed with the Investment Advisers the reasons for any overperformance or underperformance.
In addition to reviewing absolute and relative fund performance, the Independent Trustees periodically consider the appropriateness of fund performance metrics in evaluating the results achieved. In general, the Independent Trustees believe that fund performance should be evaluated based on net performance (after fees and expenses) of the fund compared to appropriate benchmark indices, over appropriate time periods that may include full market cycles, and compared to peer groups, as applicable, over the same periods, taking into account relevant factors including the following: general market conditions; issuer-specific information; and fund cash flows and other factors.
The Independent Trustees recognize that shareholders evaluate performance on a net basis over their own holding periods, for which one-, three-, and five-year periods are often used as a proxy. For this reason, the performance information reviewed by the Board also included net total return information for the fund and an appropriate benchmark index and peer group for the most recent one- and three-year periods ended September 30, 2021, as shown below. Returns are shown compared to the 25th percentile (top of box, 75% beaten) and 75th percentile (bottom of box, 25% beaten) of the peer universe.
Fidelity Small Cap Growth K6 Fund
Based on its review, the Board concluded that the nature, extent, and quality of services provided to the fund under the Advisory Contracts should continue to benefit the shareholders of the fund.
Competitiveness of Management Fee and Total Expense Ratio. The Board considered the fund's management fee and total expense ratio compared to "mapped groups" of competitive funds and classes created for the purpose of facilitating the Trustees' competitive analysis of management fees and total expenses. Fidelity creates "mapped groups" by combining similar Lipper investment objective categories that have comparable investment mandates. Combining Lipper investment objective categories aids the Board's management fee and total expense ratio comparisons by broadening the competitive group used for comparison.
Management Fee. The Board considered two proprietary management fee comparisons for the 12-month periods ended September 30 (June 30 for periods ended 2019 and 2018 and December 31 for periods prior to 2018) shown in basis points (BP) in the chart below. The group of Lipper funds used by the Board for management fee comparisons is referred to below as the "Total Mapped Group." The Total Mapped Group comparison focuses on a fund's standing in terms of gross management fees before expense reimbursements or caps, relative to the total universe of funds with comparable investment mandates, regardless of whether their management fee structures also are comparable. Funds with comparable investment mandates offer exposure to similar types of securities. Funds with comparable management fee structures have similar management fee contractual arrangements (e.g., flat rate charged for advisory services, all-inclusive fee rate, etc.). "TMG %" represents the percentage of funds in the Total Mapped Group that had management fees that were lower than the fund's. For example, a hypothetical TMG % of 20% would mean that 80% of the funds in the Total Mapped Group had higher, and 20% had lower, management fees than the fund. The fund's actual TMG %s and the number of funds in the Total Mapped Group are in the chart below. The "Asset-Sized Peer Group" (ASPG) comparison focuses on a fund's standing relative to a subset of non-Fidelity funds within the Total Mapped Group that are similar in size and management fee structure. For example, if a fund is in the first quartile of the ASPG, the fund's management fee ranks in the least expensive or lowest 25% of funds in the ASPG. The ASPG represents at least 15% of the funds in the Total Mapped Group with comparable asset size and management fee structures, subject to a minimum of 50 funds (or all funds in the Total Mapped Group if fewer than 50). Additional information, such as the ASPG quartile in which the fund's management fee rate ranked, is also included in the chart and was considered by the Board.
Fidelity Small Cap Growth K6 Fund
The Board noted that the fund's management fee rate ranked below the median of its Total Mapped Group and below the median of its ASPG for the 12-month period ended September 30, 2021.
Based on its review, the Board concluded that the fund's management fee is fair and reasonable in light of the services that the fund receives and the other factors considered.
Total Expense Ratio. In its review of the fund's total expense ratio, the Board considered the fund's unitary fee rate as well as other fund expenses paid by FMR under the fund's management contract, such as transfer agent fees, pricing and bookkeeping fees, and custodial, legal, and audit fees. The Board also noted that Fidelity may agree to waive fees or reimburse expenses from time to time, and the extent to which, if any, it has done so for the fund. The fund is compared to those funds and classes in the Total Mapped Group (used by the Board for management fee comparisons) that have a similar sales load structure. The Board also considered a total expense ASPG comparison for the fund, which focuses on the total expenses of the fund relative to a subset of non-Fidelity funds within the total expense similar sales load structure group. The total expense ASPG is limited to 15 larger and 15 smaller classes in fund average assets for a total of 30 classes, where possible. The total expense ASPG comparison excludes performance adjustments and fund-paid 12b-1 fees to eliminate variability in fee structures.
The Board noted that the fund's total net expense ratio ranked below the similar sales load structure group competitive median and below the ASPG competitive median for the 12-month period ended September 30, 2021.
Fees Charged to Other Fidelity Clients. The Board also considered Fidelity fee structures and other information with respect to clients of Fidelity, such as other funds advised or subadvised by Fidelity, pension plan clients, and other institutional clients with similar mandates. The Board noted that a joint ad hoc committee created by it and the boards of other Fidelity funds periodically reviews and compares Fidelity's institutional investment advisory business with its business of providing services to the Fidelity funds and also noted the most recent findings of the committee. The Board noted that the committee's review included a consideration of the differences in services provided, fees charged, and costs incurred, as well as competition in the markets serving the different categories of clients.
Based on its review of total expense ratios and fees charged to other Fidelity clients, the Board concluded that the fund's total expense ratio was reasonable in light of the services that the fund and its shareholders receive and the other factors considered.
Costs of the Services and Profitability. The Board considered the revenues earned and the expenses incurred by Fidelity in conducting the business of developing, marketing, distributing, managing, administering and servicing the fund and servicing the fund's shareholders. The Board also considered the level of Fidelity's profits in respect of all the Fidelity funds.
On an annual basis, Fidelity presents to the Board information about the profitability of its relationships with the fund. Fidelity calculates profitability information for each fund, as well as aggregate profitability information for groups of Fidelity funds and all Fidelity funds, using a series of detailed revenue and cost allocation methodologies which originate with the books and records of Fidelity on which Fidelity's audited financial statements are based. The Audit Committee of the Board reviews any significant changes from the prior year's methodologies and the full Board approves such changes.
A public accounting firm has been engaged annually by the Board as part of the Board's assessment of Fidelity's profitability analysis. The engagement includes the review and assessment of the methodologies used by Fidelity in determining the revenues and expenses attributable to Fidelity's mutual fund business, and completion of agreed-upon procedures in respect of the mathematical accuracy of certain fund profitability information and its conformity to established allocation methodologies. After considering the reports issued under the engagement and information provided by Fidelity, the Board concluded that while other allocation methods may also be reasonable, Fidelity's profitability methodologies are reasonable in all material respects.
The Board also reviewed Fidelity's non-fund businesses and potential indirect benefits such businesses may have received as a result of their association with Fidelity's mutual fund business (i.e., fall-out benefits) as well as cases where Fidelity's affiliates may benefit from the funds' business. The Board considered areas where potential indirect benefits to the Fidelity funds from their relationships with Fidelity may exist. The Board's consideration of these matters was informed by the findings of a joint ad hoc committee created by it and the boards of other Fidelity funds to evaluate potential fall-out benefits.
The Board considered the costs of the services provided by and the profits realized by Fidelity in connection with the operation of the fund and was satisfied that the profitability was not excessive.
Economies of Scale. The Board considered whether there have been economies of scale in respect of the management of the Fidelity funds, whether the Fidelity funds (including the fund) have appropriately benefited from any such economies of scale, and whether there is potential for realization of any further economies of scale. The Board considered the extent to which the fund will benefit from economies of scale as assets grow through increased services to the fund, through waivers or reimbursements, or through fee or expense ratio reductions. The Board recognized that, due to the fund's current contractual arrangements, its expense ratio will not decline if the fund's operating costs decrease as assets grow or rise as assets decrease. The Board also noted that a committee (the Economies of Scale Committee) created by it and the boards of other Fidelity funds periodically analyzes whether Fidelity attains economies of scale in respect of the management and servicing of the Fidelity funds, whether the Fidelity funds have appropriately benefited from such economies of scale, and whether there is potential for realization of any further economies of scale.
The Board concluded, taking into account the analysis of the Economies of Scale Committee, that economies of scale, if any, are being appropriately shared between fund shareholders and Fidelity.
Additional Information Requested by the Board. In order to develop fully the factual basis for consideration of the Fidelity funds' advisory contracts, the Board requested and received additional information on certain topics, including: (i) fund flow and performance trends, in particular the underperformance of certain funds and strategies, and Fidelity's long-term strategies for certain funds, including any consideration of fund liquidations or mergers; (ii) the operation of performance fees, competitor use of performance fees, and consideration of the expansion of performance fees to additional funds; (iii) Fidelity's pricing philosophy compared to competitors; (iv) fund profitability methodology and data; (v) evaluation of competitive fund data and peer group classifications and fee and expense comparisons; (vi) the management fee and expense structures for different funds and classes and information about the differences between various fee and expense structures; (vii) group fee breakpoints and related voluntary fee waivers; and (viii) information regarding other accounts managed by Fidelity and the funds' sub-advisory arrangements.
Based on its evaluation of all of the conclusions noted above, and after considering all factors it believed relevant, the Board concluded that the advisory fee arrangements are fair and reasonable and that the fund's Advisory Contracts should be renewed.
Liquidity Risk Management Program
The Securities and Exchange Commission adopted Rule 22e-4 under the Investment Company Act of 1940 (the Liquidity Rule) to promote effective liquidity risk management throughout the open-end investment company industry, thereby reducing the risk that funds will be unable to meet their redemption obligations and mitigating dilution of the interests of fund shareholders.
The Fund has adopted and implemented a liquidity risk management program pursuant to the Liquidity Rule (the Program) effective December 1, 2018. The Program is reasonably designed to assess and manage the Fund’s liquidity risk and to comply with the requirements of the Liquidity Rule. The Fund’s Board of Trustees (the Board) has designated the Fund’s investment adviser as administrator of the Program. The Fidelity advisers have established a Liquidity Risk Management Committee (the LRM Committee) to manage the Program for each of the Fidelity Funds. The LRM Committee monitors the adequacy and effectiveness of implementation of the Program and on a periodic basis assesses each Fund’s liquidity risk based on a variety of factors including (1) the Fund’s investment strategy, (2) portfolio liquidity and cash flow projections during normal and reasonably foreseeable stressed conditions, (3) shareholder redemptions, (4) borrowings and other funding sources and (5) in the case of exchange-traded funds, certain additional factors including the effect of the Fund’s prices and spreads, market participants, and basket compositions on the overall liquidity of the Fund’s portfolio, as applicable.
In accordance with the Program, each of the Fund’s portfolio investments is classified into one of four liquidity categories described below based on a determination of a reasonable expectation for how long it would take to convert the investment to cash (or sell or dispose of the investment) without significantly changing its market value.
- Highly liquid investments – cash or convertible to cash within three business days or less
- Moderately liquid investments – convertible to cash in three to seven calendar days
- Less liquid investments – can be sold or disposed of, but not settled, within seven calendar days
- Illiquid investments – cannot be sold or disposed of within seven calendar days
Liquidity classification determinations take into account a variety of factors including various market, trading and investment-specific considerations, as well as market depth, and generally utilize analysis from a third-party liquidity metrics service.
The Liquidity Rule places a 15% limit on a fund’s illiquid investments and requires funds that do not primarily hold assets that are highly liquid investments to determine and maintain a minimum percentage of the fund’s net assets to be invested in highly liquid investments (highly liquid investment minimum or HLIM). The Program includes provisions reasonably designed to comply with the 15% limit on illiquid investments and for determining, periodically reviewing and complying with the HLIM requirement as applicable.
At a recent meeting of the Fund’s Board of Trustees, the LRM Committee provided a written report to the Board pertaining to the operation, adequacy, and effectiveness of implementation of the Program for the annual period from December 1, 2020 through November 30, 2021. The report concluded that the Program has been implemented and is operating effectively and is reasonably designed to assess and manage the Fund’s liquidity risk.
SCPK6-ANN-0922
1.9884011.105
Fidelity® Small Cap Value Fund
Annual Report
July 31, 2022
Includes Fidelity and Fidelity Advisor share classes
Contents
To view a fund's proxy voting guidelines and proxy voting record for the 12-month period ended June 30, visit http://www.fidelity.com/proxyvotingresults or visit the Securities and Exchange Commission's (SEC) web site at http://www.sec.gov.
You may also call 1-800-544-8544 if you’re an individual investing directly with Fidelity, call 1-800-835-5092 if you’re a plan sponsor or participant with Fidelity as your recordkeeper or call 1-877-208-0098 on institutional accounts or if you’re an advisor or invest through one to request a free copy of the proxy voting guidelines.
Standard & Poor's, S&P and S&P 500 are registered service marks of The McGraw-Hill Companies, Inc. and have been licensed for use by Fidelity Distributors Corporation.
Other third-party marks appearing herein are the property of their respective owners.
All other marks appearing herein are registered or unregistered trademarks or service marks of FMR LLC or an affiliated company. © 2022 FMR LLC. All rights reserved.
This report and the financial statements contained herein are submitted for the general information of the shareholders of the Fund. This report is not authorized for distribution to prospective investors in the Fund unless preceded or accompanied by an effective prospectus.
A fund files its complete schedule of portfolio holdings with the SEC for the first and third quarters of each fiscal year on Form N-PORT. Forms N-PORT are available on the SEC’s web site at http://www.sec.gov. A fund's Forms N-PORT may be reviewed and copied at the SEC’s Public Reference Room in Washington, DC. Information regarding the operation of the SEC's Public Reference Room may be obtained by calling 1-800-SEC-0330.
For a complete list of a fund's portfolio holdings, view the most recent holdings listing, semiannual report, or annual report on Fidelity's web site at http://www.fidelity.com, http://www.institutional.fidelity.com, or http://www.401k.com, as applicable.
NOT FDIC INSURED •MAY LOSE VALUE •NO BANK GUARANTEE
Neither the Fund nor Fidelity Distributors Corporation is a bank.
Note to Shareholders:
Early in 2020, the outbreak and spread of COVID-19 emerged as a public health emergency that had a major influence on financial markets, primarily based on its impact on the global economy and corporate earnings. On March 11, 2020, the World Health Organization declared the COVID-19 outbreak a pandemic, citing sustained risk of further global spread. The pandemic prompted a number of measures to limit the spread of COVID-19, including travel and border restrictions, quarantines, and restrictions on large gatherings. In turn, these resulted in lower consumer activity, diminished demand for a wide range of products and services, disruption in manufacturing and supply chains, and – given the wide variability in outcomes regarding the outbreak – significant market uncertainty and volatility. To help stem the turmoil, the U.S. government took unprecedented action – in concert with the U.S. Federal Reserve and central banks around the world – to help support consumers, businesses, and the broader economy, and to limit disruption to the financial system.
In general, the overall impact of the pandemic lessened in 2021, amid a resilient economy and widespread distribution of three COVID-19 vaccines granted emergency use authorization from the U.S. Food and Drug Administration (FDA) early in the year. Still, the situation remains dynamic, and the extent and duration of its influence on financial markets and the economy is highly uncertain, due in part to a recent spike in cases based on highly contagious variants of the coronavirus.
Extreme events such as the COVID-19 crisis are exogenous shocks that can have significant adverse effects on mutual funds and their investments. Although multiple asset classes may be affected by market disruption, the duration and impact may not be the same for all types of assets. Fidelity is committed to helping you stay informed amid news about COVID-19 and during increased market volatility, and we continue to take extra steps to be responsive to customer needs. We encourage you to visit us online, where we offer ongoing updates, commentary, and analysis on the markets and our funds.
Performance: The Bottom Line
Average annual total return reflects the change in the value of an investment, assuming reinvestment of distributions from dividend income and capital gains (the profits earned upon the sale of securities that have grown in value, if any) and assuming a constant rate of performance each year. The hypothetical investment and the average annual total returns do not reflect the deduction of taxes that a shareholder would pay on fund distributions or the redemption of fund shares. During periods of reimbursement by Fidelity, a fund’s total return will be greater than it would be had the reimbursement not occurred. How a fund did yesterday is no guarantee of how it will do tomorrow.
Average Annual Total Returns
| For the periods ended July 31, 2022 | Past 1 year | Past 5 years | Past 10 years |
| Class A (incl. 5.75% sales charge) | (7.16)% | 7.76% | 11.16% |
| Class M (incl. 3.50% sales charge) | (5.18)% | 8.01% | 11.15% |
| Class C (incl. contingent deferred sales charge) | (3.16)% | 8.22% | 11.13% |
| Fidelity® Small Cap Value Fund | (1.23)% | 9.33% | 12.11% |
| Class I | (1.22)% | 9.34% | 12.13% |
| Class Z | (1.11)% | 9.45% | 12.18% |
Class C shares' contingent deferred sales charges included in the past one year, past five years and past ten years total return figures are 1%, 0% and 0%, respectively.
The initial offering of Class Z shares took place on October 2, 2018. Returns prior to October 2, 2018, are those of Class I.
$10,000 Over 10 Years
Let's say hypothetically that $10,000 was invested in Fidelity® Small Cap Value Fund, a class of the fund, on July 31, 2012.
The chart shows how the value of your investment would have changed, and also shows how the Russell 2000® Value Index performed over the same period.
| Period Ending Values |
| $31,377 | Fidelity® Small Cap Value Fund |
| $26,365 | Russell 2000® Value Index |
Management's Discussion of Fund Performance
Market Recap: The S&P 500
® index returned -4.64% for the 12 months ending July 31, 2022, as a multitude of crosscurrents challenged the global economy and financial markets. Persistently high inflation, exacerbated by energy price shocks from the Russia–Ukraine conflict, spurred the U.S. Federal Reserve to hike interest rates more aggressively than anticipated, and concerns about the outlook for economic growth sent stocks into bear market territory. In early May, the Fed approved a rare half-percentage-point interest rate increase and announced plans to shrink its $9 trillion asset portfolio. June began with the Fed allowing up to billions in Treasuries and mortgage bonds to mature every month without investing the proceeds. Two weeks later, the central bank raised rates by 0.75 percentage points, its largest increase since 1994, and said it was becoming more difficult to achieve a soft landing, in which the economy slows enough to bring down inflation while avoiding a recession. Against this volatile backdrop, the S&P 500 posted its worst first-half result (-19.96%) to begin a year since 1970. Stocks sharply reversed course in July (+9.22%), as the Fed again raised its benchmark interest rate by 0.75% but signaled that, at some point, it will likely slow the pace of tightening to assess the impact on the economy. For the full 12 months, growth-oriented communication services (-29%) and consumer discretionary (-10%) stocks lagged most. In contrast, energy (+67%) rode a surge in commodity prices and led by a wide margin, followed by the defensive utilities (+16%) and consumer staples (+7%) sectors.
Comments from Co-Managers Derek Janssen and Gabriela Kelleher: For the fiscal year ending July 31, 2022, the fund's share classes (excluding sales charges, if applicable) returned roughly -2% to -1%, outperforming the -4.77% result of the benchmark Russell 2000
® Value Index. Versus the benchmark, security selection was the primary contributor, led by the financials sector. An underweighting and stock picking in the health care sector, especially within the pharmaceuticals, biotechnology & life sciences industry, also boosted the fund's relative result. Also helping was an underweighting and security selection in the communication services sector, primarily driven by the media & entertainment industry. The biggest individual relative contributor was an overweight position in Antero Resources (+188%). We reduced our stake in this company. Our second-largest relative contributor this period was avoiding AMC Entertainment, a benchmark component that returned roughly -66%. The fund's non-benchmark stake in Lamb Weston Holdings, a position we established this period, gained approximately 40% and helped. In contrast, the biggest detractor from performance versus the benchmark was an underweighting in energy. Stock selection in real estate and an underweighting in utilities also hampered relative performance. The biggest individual relative detractor was an overweight position in Rent-A-Center (-57%). We increased our position in this company the past 12 months. A second notable relative detractor was our outsized stake in Jeld-Wen Holding (-49%), a position that was sold the past 12 months. Avoiding Ovintiv, a benchmark component that gained about 80%, also hurt relative performance. Notable changes in positioning include increased exposure to the consumer discretionary sector and a lower allocation to materials.
The views expressed above reflect those of the portfolio manager(s) only through the end of the period as stated on the cover of this report and do not necessarily represent the views of Fidelity or any other person in the Fidelity organization. Any such views are subject to change at any time based upon market or other conditions and Fidelity disclaims any responsibility to update such views. These views may not be relied on as investment advice and, because investment decisions for a Fidelity fund are based on numerous factors, may not be relied on as an indication of trading intent on behalf of any Fidelity fund.
Investment Summary (Unaudited)
Top Ten Stocks as of July 31, 2022
| | % of fund's net assets |
| Eastern Bankshares, Inc. | 2.4 |
| Tempur Sealy International, Inc. | 2.3 |
| Beacon Roofing Supply, Inc. | 2.1 |
| Brookfield Infrastructure Corp. A Shares | 2.0 |
| Assurant, Inc. | 1.9 |
| FirstCash Holdings, Inc. | 1.9 |
| Encore Capital Group, Inc. | 1.8 |
| U.S. Foods Holding Corp. | 1.8 |
| Owens & Minor, Inc. | 1.8 |
| Builders FirstSource, Inc. | 1.8 |
| | 19.8 |
Market Sectors as of July 31, 2022
| | % of fund's net assets |
| Financials | 28.9 |
| Industrials | 14.2 |
| Consumer Discretionary | 13.0 |
| Real Estate | 8.3 |
| Information Technology | 8.2 |
| Health Care | 7.6 |
| Materials | 5.0 |
| Energy | 4.3 |
| Consumer Staples | 4.0 |
| Utilities | 3.4 |
| Communication Services | 1.6 |
Asset Allocation (% of fund's net assets)
| As of July 31, 2022 * |
| | Stocks | 98.5% |
| | Short-Term Investments and Net Other Assets (Liabilities) | 1.5% |

* Foreign investments - 13.8%
Geographic Diversification (% of fund's net assets)
| As of July 31, 2022 |
| | United States of America* | 86.2% |
| | Bermuda | 4.3% |
| | United Kingdom | 3.8% |
| | Canada | 2.9% |
| | Ireland | 1.8% |
| | Germany | 0.7% |
| | Netherlands | 0.3% |

* Includes Short-Term investments and Net Other Assets (Liabilities).
Percentages are based on country or territory of incorporation and are adjusted for the effect of futures contracts, if applicable.
Schedule of Investments July 31, 2022
Showing Percentage of Net Assets
| Common Stocks - 98.5% | | | |
| | | Shares | Value |
| COMMUNICATION SERVICES - 1.6% | | | |
| Media - 1.6% | | | |
| Nexstar Broadcasting Group, Inc. Class A | | 426,800 | $80,396,316 |
| CONSUMER DISCRETIONARY - 13.0% | | | |
| Auto Components - 1.4% | | | |
| Adient PLC (a) | | 2,040,000 | 68,911,200 |
| Hotels, Restaurants & Leisure - 4.4% | | | |
| Brinker International, Inc. (a)(b) | | 1,860,036 | 51,615,999 |
| Churchill Downs, Inc. | | 397,700 | 83,437,460 |
| Hilton Grand Vacations, Inc. (a) | | 415,000 | 16,919,550 |
| Light & Wonder, Inc. Class A (a) | | 1,300,000 | 66,222,000 |
| | | | 218,195,009 |
| Household Durables - 4.3% | | | |
| KB Home (b) | | 2,625,000 | 85,680,000 |
| Tempur Sealy International, Inc. | | 4,095,000 | 112,530,600 |
| Traeger, Inc. (a)(b) | | 5,255,000 | 16,132,850 |
| | | | 214,343,450 |
| Specialty Retail - 2.9% | | | |
| Rent-A-Center, Inc. (c) | | 3,355,000 | 78,943,150 |
| Williams-Sonoma, Inc. (b) | | 430,100 | 62,115,042 |
| | | | 141,058,192 |
|
| TOTAL CONSUMER DISCRETIONARY | | | 642,507,851 |
|
| CONSUMER STAPLES - 4.0% | | | |
| Food & Staples Retailing - 2.8% | | | |
| BJ's Wholesale Club Holdings, Inc. (a) | | 735,000 | 49,759,500 |
| U.S. Foods Holding Corp. (a) | | 2,830,000 | 89,145,000 |
| | | | 138,904,500 |
| Food Products - 1.2% | | | |
| Lamb Weston Holdings, Inc. | | 710,584 | 56,605,121 |
|
| TOTAL CONSUMER STAPLES | | | 195,509,621 |
|
| ENERGY - 4.3% | | | |
| Energy Equipment & Services - 1.7% | | | |
| TechnipFMC PLC (a)(b) | | 10,400,000 | 84,136,000 |
| Oil, Gas & Consumable Fuels - 2.6% | | | |
| Antero Resources Corp. (a) | | 1,152,000 | 45,665,280 |
| Brigham Minerals, Inc. Class A (c) | | 3,130,100 | 83,104,155 |
| | | | 128,769,435 |
|
| TOTAL ENERGY | | | 212,905,435 |
|
| FINANCIALS - 28.9% | | | |
| Banks - 13.1% | | | |
| BOK Financial Corp. | | 440,000 | 38,733,200 |
| Comerica, Inc. | | 608,300 | 47,307,491 |
| Cullen/Frost Bankers, Inc. | | 250,000 | 32,600,000 |
| Eastern Bankshares, Inc. | | 5,870,100 | 119,750,040 |
| First Foundation, Inc. (b) | | 2,192,275 | 45,643,166 |
| First Interstate Bancsystem, Inc. | | 1,300,000 | 53,014,000 |
| Independent Bank Group, Inc. (b) | | 1,041,196 | 73,633,381 |
| Synovus Financial Corp. | | 976,700 | 39,439,146 |
| The Bank of NT Butterfield & Son Ltd. | | 1,760,000 | 59,646,400 |
| Trico Bancshares | | 1,309,400 | 62,589,320 |
| Webster Financial Corp. (b) | | 998,829 | 46,395,607 |
| Western Alliance Bancorp. | | 379,700 | 29,001,486 |
| | | | 647,753,237 |
| Capital Markets - 1.9% | | | |
| AllianceBernstein Holding LP | | 1,238,200 | 54,555,092 |
| Lazard Ltd. Class A | | 1,029,300 | 38,773,731 |
| | | | 93,328,823 |
| Consumer Finance - 3.7% | | | |
| Encore Capital Group, Inc. (a)(b)(c) | | 1,250,200 | 90,551,986 |
| FirstCash Holdings, Inc. | | 1,251,765 | 91,704,304 |
| | | | 182,256,290 |
| Diversified Financial Services - 0.9% | | | |
| ECN Capital Corp. | | 9,302,051 | 43,439,354 |
| Insurance - 9.3% | | | |
| Assurant, Inc. | | 541,800 | 95,237,604 |
| Enstar Group Ltd. (a) | | 278,949 | 55,209,586 |
| First American Financial Corp. | | 1,133,000 | 65,714,000 |
| Old Republic International Corp. | | 3,758,700 | 87,464,949 |
| Primerica, Inc. | | 505,624 | 65,068,753 |
| Reinsurance Group of America, Inc. | | 348,200 | 40,314,596 |
| Selective Insurance Group, Inc. | | 650,000 | 50,609,000 |
| | | | 459,618,488 |
|
| TOTAL FINANCIALS | | | 1,426,396,192 |
|
| HEALTH CARE - 7.6% | | | |
| Biotechnology - 1.9% | | | |
| ALX Oncology Holdings, Inc. (a) | | 555,000 | 5,372,400 |
| Blueprint Medicines Corp. (a) | | 200,000 | 10,212,000 |
| Celldex Therapeutics, Inc. (a) | | 200,000 | 6,144,000 |
| Cyteir Therapeutics, Inc. (a) | | 725,000 | 2,109,750 |
| Cytokinetics, Inc. (a) | | 130,000 | 5,502,900 |
| Day One Biopharmaceuticals, Inc. (a) | | 450,000 | 7,708,500 |
| Erasca, Inc. | | 705,000 | 5,315,700 |
| Exelixis, Inc. (a) | | 375,000 | 7,845,000 |
| Imago BioSciences, Inc. | | 556,000 | 8,951,600 |
| Instil Bio, Inc. (a) | | 1,170,411 | 6,601,118 |
| Janux Therapeutics, Inc. (a) | | 375,000 | 4,657,500 |
| Keros Therapeutics, Inc. (a) | | 265,000 | 8,501,200 |
| Relay Therapeutics, Inc. (a) | | 495,000 | 9,414,900 |
| Vaxcyte, Inc. (a) | | 220,000 | 5,077,600 |
| | | | 93,414,168 |
| Health Care Equipment & Supplies - 1.5% | | | |
| Envista Holdings Corp. (a) | | 1,820,000 | 73,983,000 |
| Health Care Providers & Services - 2.6% | | | |
| Owens & Minor, Inc. | | 2,507,700 | 88,797,657 |
| Premier, Inc. | | 1,000,000 | 38,460,000 |
| | | | 127,257,657 |
| Pharmaceuticals - 1.6% | | | |
| Arvinas Holding Co. LLC (a) | | 179,000 | 9,506,690 |
| Jazz Pharmaceuticals PLC (a) | | 133,600 | 20,849,616 |
| NGM Biopharmaceuticals, Inc. (a) | | 490,000 | 7,095,200 |
| Prestige Brands Holdings, Inc. (a) | | 710,000 | 42,820,100 |
| | | | 80,271,606 |
|
| TOTAL HEALTH CARE | | | 374,926,431 |
|
| INDUSTRIALS - 14.2% | | | |
| Aerospace & Defense - 1.3% | | | |
| Curtiss-Wright Corp. | | 465,000 | 66,699,600 |
| Building Products - 2.4% | | | |
| Builders FirstSource, Inc. (a) | | 1,300,000 | 88,400,000 |
| Hayward Holdings, Inc. (a)(b) | | 2,728,442 | 31,840,918 |
| | | | 120,240,918 |
| Commercial Services & Supplies - 0.6% | | | |
| KAR Auction Services, Inc. (a)(b) | | 1,700,600 | 29,080,260 |
| Construction & Engineering - 0.0% | | | |
| Arcosa, Inc. | | 46,774 | 2,411,667 |
| Machinery - 2.2% | | | |
| EnPro Industries, Inc. | | 497,000 | 46,459,560 |
| ITT, Inc. | | 800,000 | 60,024,000 |
| | | | 106,483,560 |
| Professional Services - 4.0% | | | |
| ASGN, Inc. (a) | | 550,000 | 57,068,000 |
| CACI International, Inc. Class A (a) | | 145,000 | 43,832,050 |
| First Advantage Corp. (a) | | 2,430,000 | 34,092,900 |
| KBR, Inc. | | 1,160,000 | 61,746,800 |
| | | | 196,739,750 |
| Trading Companies & Distributors - 3.7% | | | |
| Beacon Roofing Supply, Inc. (a) | | 1,742,700 | 104,596,854 |
| Univar Solutions, Inc. (a) | | 2,820,000 | 76,252,800 |
| | | | 180,849,654 |
|
| TOTAL INDUSTRIALS | | | 702,505,409 |
|
| INFORMATION TECHNOLOGY - 8.2% | | | |
| Communications Equipment - 0.3% | | | |
| Lumentum Holdings, Inc. (a)(b) | | 180,000 | 16,282,800 |
| Electronic Equipment & Components - 3.5% | | | |
| Insight Enterprises, Inc. (a) | | 898,000 | 83,882,180 |
| TD SYNNEX Corp. | | 865,000 | 86,863,300 |
| | | | 170,745,480 |
| IT Services - 4.4% | | | |
| Concentrix Corp. | | 654,900 | 87,599,424 |
| Cyxtera Technologies, Inc. Class A (a)(b) | | 5,871,645 | 71,575,353 |
| Genpact Ltd. | | 1,250,000 | 60,100,000 |
| | | | 219,274,777 |
|
| TOTAL INFORMATION TECHNOLOGY | | | 406,303,057 |
|
| MATERIALS - 5.0% | | | |
| Chemicals - 2.1% | | | |
| Tronox Holdings PLC | | 2,125,000 | 33,171,250 |
| Valvoline, Inc. | | 2,170,800 | 69,943,176 |
| | | | 103,114,426 |
| Construction Materials - 1.7% | | | |
| Eagle Materials, Inc. | | 125,200 | 15,831,540 |
| RHI Magnesita NV | | 613,941 | 16,837,243 |
| Summit Materials, Inc. (a) | | 1,900,000 | 52,269,000 |
| | | | 84,937,783 |
| Containers & Packaging - 1.2% | | | |
| O-I Glass, Inc. (a) | | 3,800,000 | 55,898,000 |
|
| TOTAL MATERIALS | | | 243,950,209 |
|
| REAL ESTATE - 8.3% | | | |
| Equity Real Estate Investment Trusts (REITs) - 3.8% | | | |
| Corporate Office Properties Trust (SBI) | | 1,320,000 | 37,158,000 |
| Douglas Emmett, Inc. | | 2,503,000 | 59,170,920 |
| LXP Industrial Trust (REIT) (b) | | 5,850,000 | 64,174,500 |
| National Storage Affiliates Trust | | 460,000 | 25,226,400 |
| | | | 185,729,820 |
| Real Estate Management & Development - 4.5% | | | |
| Anywhere Real Estate, Inc. (a) | | 4,133,900 | 41,049,627 |
| Cushman & Wakefield PLC (a) | | 4,163,779 | 69,951,487 |
| DIC Asset AG | | 3,000,000 | 34,034,265 |
| Jones Lang LaSalle, Inc. (a) | | 415,400 | 79,204,318 |
| | | | 224,239,697 |
|
| TOTAL REAL ESTATE | | | 409,969,517 |
|
| UTILITIES - 3.4% | | | |
| Gas Utilities - 2.0% | | | |
| Brookfield Infrastructure Corp. A Shares (b) | | 2,167,850 | 99,309,209 |
| Independent Power and Renewable Electricity Producers - 1.4% | | | |
| NextEra Energy Partners LP (b) | | 841,600 | 69,633,984 |
|
| TOTAL UTILITIES | | | 168,943,193 |
|
| TOTAL COMMON STOCKS | | | |
| (Cost $4,500,215,498) | | | 4,864,313,231 |
|
| Money Market Funds - 6.4% | | | |
| Fidelity Cash Central Fund 2.01% (d) | | 55,612,525 | 55,623,648 |
| Fidelity Securities Lending Cash Central Fund 2.01% (d)(e) | | 261,324,724 | 261,350,857 |
| TOTAL MONEY MARKET FUNDS | | | |
| (Cost $316,974,505) | | | 316,974,505 |
| TOTAL INVESTMENT IN SECURITIES - 104.9% | | | |
| (Cost $4,817,190,003) | | | 5,181,287,736 |
| NET OTHER ASSETS (LIABILITIES) - (4.9)% | | | (241,740,183) |
| NET ASSETS - 100% | | | $4,939,547,553 |
Legend
(a) Non-income producing
(b) Security or a portion of the security is on loan at period end.
(c) Affiliated company
(d) Affiliated fund that is generally available only to investment companies and other accounts managed by Fidelity Investments. The rate quoted is the annualized seven-day yield of the fund at period end. A complete unaudited listing of the fund's holdings as of its most recent quarter end is available upon request. In addition, each Fidelity Central Fund's financial statements, which are not covered by the Fund's Report of Independent Registered Public Accounting Firm, are available on the SEC's website or upon request.
(e) Investment made with cash collateral received from securities on loan.
Affiliated Central Funds
Fiscal year to date information regarding the Fund's investments in Fidelity Central Funds, including the ownership percentage, is presented below.
| Fund | Value, beginning of period | Purchases | Sales Proceeds | Dividend Income | Realized Gain/Loss | Change in Unrealized appreciation (depreciation) | Value, end of period | % ownership, end of period |
| Fidelity Cash Central Fund 2.01% | $24,411,882 | $2,164,318,383 | $2,133,106,617 | $182,943 | $-- | $-- | $55,623,648 | 0.1% |
| Fidelity Securities Lending Cash Central Fund 2.01% | 63,724,657 | 1,338,519,744 | 1,140,893,544 | 1,372,877 | -- | -- | 261,350,857 | 0.7% |
| Total | $88,136,539 | $3,502,838,127 | $3,274,000,161 | $1,555,820 | $-- | $-- | $316,974,505 | |
Amounts in the income column in the above table include any capital gain distributions from underlying funds, which are presented in the corresponding line-item in the Statement of Operations, if applicable. Amount for Fidelity Securities Lending Cash Central Fund represents the income earned on investing cash collateral, less rebates paid to borrowers and any lending agent fees associated with the loan, plus any premium payments received for lending certain types of securities.
Other Affiliated Issuers
An affiliated company is a company in which the Fund has ownership of at least 5% of the voting securities. Fiscal year to date transactions with companies which are or were affiliates are presented in the table below. Certain corporate actions, such as mergers, are excluded from the amounts in this table if applicable.
| Affiliate | Value, beginning of period | Purchases | Sales Proceeds | Dividend Income | Realized Gain (loss) | Change in Unrealized appreciation (depreciation) | Value, end of period |
| Brigham Minerals, Inc. Class A | $43,208,000 | $22,753,335 | $-- | $4,936,605 | $-- | $17,142,820 | $83,104,155 |
| Encore Capital Group, Inc. | 59,184,468 | -- | -- | -- | -- | 31,367,518 | 90,551,986 |
| Rent-A-Center, Inc. | 57,220,000 | 69,088,071 | -- | 2,355,100 | -- | (47,364,921) | 78,943,150 |
| Total | $159,612,468 | $91,841,406 | $-- | $7,291,705 | $-- | $1,145,417 | $252,599,291 |
Investment Valuation
The following is a summary of the inputs used, as of July 31, 2022, involving the Fund's assets and liabilities carried at fair value. The inputs or methodology used for valuing securities may not be an indication of the risk associated with investing in those securities. For more information on valuation inputs, and their aggregation into the levels used below, please refer to the Investment Valuation section in the accompanying Notes to Financial Statements.
| | Valuation Inputs at Reporting Date: |
| Description | Total | Level 1 | Level 2 | Level 3 |
| Investments in Securities: | | | | |
| Equities: | | | | |
| Communication Services | $80,396,316 | $80,396,316 | $-- | $-- |
| Consumer Discretionary | 642,507,851 | 642,507,851 | -- | -- |
| Consumer Staples | 195,509,621 | 195,509,621 | -- | -- |
| Energy | 212,905,435 | 212,905,435 | -- | -- |
| Financials | 1,426,396,192 | 1,426,396,192 | -- | -- |
| Health Care | 374,926,431 | 374,926,431 | -- | -- |
| Industrials | 702,505,409 | 702,505,409 | -- | -- |
| Information Technology | 406,303,057 | 406,303,057 | -- | -- |
| Materials | 243,950,209 | 243,950,209 | -- | -- |
| Real Estate | 409,969,517 | 409,969,517 | -- | -- |
| Utilities | 168,943,193 | 168,943,193 | -- | -- |
| Money Market Funds | 316,974,505 | 316,974,505 | -- | -- |
| Total Investments in Securities: | $5,181,287,736 | $5,181,287,736 | $-- | $-- |
See accompanying notes which are an integral part of the financial statements.
Financial Statements
Statement of Assets and Liabilities
| | | July 31, 2022 |
| Assets | | |
Investment in securities, at value (including securities loaned of $262,035,471) — See accompanying schedule:
Unaffiliated issuers (cost $4,296,808,731) | $4,611,713,940 | |
| Fidelity Central Funds (cost $316,974,505) | 316,974,505 | |
| Other affiliated issuers (cost $203,406,767) | 252,599,291 | |
| Total Investment in Securities (cost $4,817,190,003) | | $5,181,287,736 |
| Foreign currency held at value (cost $371,776) | | 360,836 |
| Receivable for investments sold | | 25,713,233 |
| Receivable for fund shares sold | | 6,607,292 |
| Dividends receivable | | 1,124,107 |
| Distributions receivable from Fidelity Central Funds | | 114,728 |
| Total assets | | 5,215,207,932 |
| Liabilities | | |
| Payable for investments purchased | $852,657 | |
| Payable for fund shares redeemed | 9,427,083 | |
| Accrued management fee | 3,152,260 | |
| Distribution and service plan fees payable | 114,957 | |
| Other affiliated payables | 708,840 | |
| Other payables and accrued expenses | 59,307 | |
| Collateral on securities loaned | 261,345,275 | |
| Total liabilities | | 275,660,379 |
| Net Assets | | $4,939,547,553 |
| Net Assets consist of: | | |
| Paid in capital | | $4,359,206,942 |
| Total accumulated earnings (loss) | | 580,340,611 |
| Net Assets | | $4,939,547,553 |
| Net Asset Value and Maximum Offering Price | | |
| Class A: | | |
| Net Asset Value and redemption price per share ($267,853,944 ÷ 14,001,480 shares)(a) | | $19.13 |
| Maximum offering price per share (100/94.25 of $19.13) | | $20.30 |
| Class M: | | |
| Net Asset Value and redemption price per share ($81,789,966 ÷ 4,439,335 shares)(a) | | $18.42 |
| Maximum offering price per share (100/96.50 of $18.42) | | $19.09 |
| Class C: | | |
| Net Asset Value and offering price per share ($38,832,389 ÷ 2,370,330 shares)(a) | | $16.38 |
| Small Cap Value: | | |
| Net Asset Value, offering price and redemption price per share ($2,691,063,293 ÷ 136,683,449 shares) | | $19.69 |
| Class I: | | |
| Net Asset Value, offering price and redemption price per share ($1,319,153,545 ÷ 67,005,711 shares) | | $19.69 |
| Class Z: | | |
| Net Asset Value, offering price and redemption price per share ($540,854,416 ÷ 27,467,041 shares) | | $19.69 |
(a) Redemption price per share is equal to net asset value less any applicable contingent deferred sales charge.
See accompanying notes which are an integral part of the financial statements.
Statement of Operations
| | | Year ended July 31, 2022 |
| Investment Income | | |
| Dividends (including $7,291,705 earned from other affiliated issuers) | | $65,372,881 |
| Special dividends | | 36,917,428 |
| Income from Fidelity Central Funds (including $1,372,877 from security lending) | | 1,555,820 |
| Total income | | 103,846,129 |
| Expenses | | |
| Management fee | | |
| Basic fee | $32,512,051 | |
| Performance adjustment | 5,551,393 | |
| Transfer agent fees | 7,375,194 | |
| Distribution and service plan fees | 1,445,497 | |
| Accounting fees | 1,053,045 | |
| Custodian fees and expenses | 84,842 | |
| Independent trustees' fees and expenses | 15,643 | |
| Registration fees | 329,880 | |
| Audit | 59,924 | |
| Legal | 5,176 | |
| Interest | 3,881 | |
| Miscellaneous | 15,135 | |
| Total expenses before reductions | 48,451,661 | |
| Expense reductions | (150,307) | |
| Total expenses after reductions | | 48,301,354 |
| Net investment income (loss) | | 55,544,775 |
| Realized and Unrealized Gain (Loss) | | |
| Net realized gain (loss) on: | | |
| Investment securities: | | |
| Unaffiliated issuers | 374,508,672 | |
| Foreign currency transactions | (50,707) | |
| Total net realized gain (loss) | | 374,457,965 |
| Change in net unrealized appreciation (depreciation) on: | | |
| Investment securities: | | |
| Unaffiliated issuers | (541,189,958) | |
| Affiliated issuers | 1,145,417 | |
| Assets and liabilities in foreign currencies | (72,566) | |
| Total change in net unrealized appreciation (depreciation) | | (540,117,107) |
| Net gain (loss) | | (165,659,142) |
| Net increase (decrease) in net assets resulting from operations | | $(110,114,367) |
See accompanying notes which are an integral part of the financial statements.
Statement of Changes in Net Assets
| | Year ended July 31, 2022 | Year ended July 31, 2021 |
| Increase (Decrease) in Net Assets | | |
| Operations | | |
| Net investment income (loss) | $55,544,775 | $21,998,088 |
| Net realized gain (loss) | 374,457,965 | 431,506,266 |
| Change in net unrealized appreciation (depreciation) | (540,117,107) | 808,798,720 |
| Net increase (decrease) in net assets resulting from operations | (110,114,367) | 1,262,303,074 |
| Distributions to shareholders | (359,250,603) | (10,614,922) |
| Share transactions - net increase (decrease) | 1,138,061,901 | 1,325,877,253 |
| Total increase (decrease) in net assets | 668,696,931 | 2,577,565,405 |
| Net Assets | | |
| Beginning of period | 4,270,850,622 | 1,693,285,217 |
| End of period | $4,939,547,553 | $4,270,850,622 |
See accompanying notes which are an integral part of the financial statements.
Financial Highlights
Fidelity Small Cap Value Fund Class A
| Years ended July 31, | 2022 | 2021 | 2020 | 2019 | 2018 |
| Selected Per–Share Data | | | | | |
| Net asset value, beginning of period | $21.03 | $12.33 | $14.68 | $20.33 | $19.05 |
| Income from Investment Operations | | | | | |
| Net investment income (loss)A,B | .18C | .09D | .11 | .14E | .10F |
| Net realized and unrealized gain (loss) | (.41) | 8.66 | (1.96) | (.98) | 1.87 |
| Total from investment operations | (.23) | 8.75 | (1.85) | (.84) | 1.97 |
| Distributions from net investment income | (.39) | (.05) | (.09) | (.10) | (.17) |
| Distributions from net realized gain | (1.28) | – | (.41) | (4.71) | (.52) |
| Total distributions | (1.67) | (.05) | (.50) | (4.81) | (.69) |
| Redemption fees added to paid in capitalA | – | – | – | – | –G |
| Net asset value, end of period | $19.13 | $21.03 | $12.33 | $14.68 | $20.33 |
| Total ReturnH,I | (1.50)% | 71.07% | (13.09)% | (4.85)% | 10.65% |
| Ratios to Average Net AssetsB,J,K | | | | | |
| Expenses before reductions | 1.26% | 1.24% | 1.22% | .92% | 1.18% |
| Expenses net of fee waivers, if any | 1.25% | 1.24% | 1.22% | .92% | 1.17% |
| Expenses net of all reductions | 1.25% | 1.23% | 1.20% | .91% | 1.17% |
| Net investment income (loss) | .90%C | .50%D | .84% | .91%E | .49%F |
| Supplemental Data | | | | | |
| Net assets, end of period (000 omitted) | $267,854 | $232,920 | $101,675 | $129,115 | $162,572 |
| Portfolio turnover rateL | 40% | 54% | 109% | 79% | 55% |
A Calculated based on average shares outstanding during the period.
B Net investment income (loss) is affected by the timing of the declaration of dividends by any underlying mutual funds or exchange-traded funds (ETFs). Net investment income (loss) of any such underlying funds is not included in the Fund's net investment income (loss) ratio.
C Net investment income per share reflects one or more large, non-recurring dividend(s) which amounted to $.16 per share. Excluding such non-recurring dividend(s), the ratio of net investment income (loss) to average net assets would have been .14%.
D Net investment income per share reflects one or more large, non-recurring dividend(s) which amounted to $.07 per share. Excluding such non-recurring dividend(s), the ratio of net investment income (loss) to average net assets would have been .13%.
E Net investment income per share reflects one or more large, non-recurring dividend(s) which amounted to $.03 per share. Excluding such non-recurring dividend(s), the ratio of net investment income (loss) to average net assets would have been .71%.
F Net investment income per share reflects one or more large, non-recurring dividend(s) which amounted to $.04 per share. Excluding such non-recurring dividend(s), the ratio of net investment income (loss) to average net assets would have been .29%.
G Amount represents less than $.005 per share.
H Total returns would have been lower if certain expenses had not been reduced during the applicable periods shown.
I Total returns do not include the effect of the sales charges.
J Fees and expenses of any underlying mutual funds or exchange-traded funds (ETFs) are not included in the Fund's expense ratio. The Fund indirectly bears its proportionate share of these expenses. For additional expense information related to investments in Fidelity Central Funds, please refer to the "Investments in Fidelity Central Funds" note found in the Notes to Financial Statements section of the most recent Annual or Semi-Annual report.
K Expense ratios reflect operating expenses of the class. Expenses before reductions do not reflect amounts reimbursed, waived, or reduced through arrangements with the investment adviser, brokerage services, or other offset arrangements, if applicable, and do not represent the amount paid by the class during periods when reimbursements, waivers or reductions occur.
L Amount does not include the portfolio activity of any underlying mutual funds or exchange-traded funds (ETFs).
See accompanying notes which are an integral part of the financial statements.
Fidelity Small Cap Value Fund Class M
| Years ended July 31, | 2022 | 2021 | 2020 | 2019 | 2018 |
| Selected Per–Share Data | | | | | |
| Net asset value, beginning of period | $20.31 | $11.93 | $14.22 | $19.84 | $18.61 |
| Income from Investment Operations | | | | | |
| Net investment income (loss)A,B | .13C | .05D | .08 | .10E | .05F |
| Net realized and unrealized gain (loss) | (.40) | 8.37 | (1.91) | (.96) | 1.82 |
| Total from investment operations | (.27) | 8.42 | (1.83) | (.86) | 1.87 |
| Distributions from net investment income | (.35) | (.04) | (.05) | (.05) | (.13) |
| Distributions from net realized gain | (1.28) | – | (.41) | (4.71) | (.52) |
| Total distributions | (1.62)G | (.04) | (.46) | (4.76) | (.64)G |
| Redemption fees added to paid in capitalA | – | – | – | – | –H |
| Net asset value, end of period | $18.42 | $20.31 | $11.93 | $14.22 | $19.84 |
| Total ReturnI,J | (1.74)% | 70.63% | (13.29)% | (5.08)% | 10.39% |
| Ratios to Average Net AssetsB,K,L | | | | | |
| Expenses before reductions | 1.50% | 1.48% | 1.46% | 1.17% | 1.42% |
| Expenses net of fee waivers, if any | 1.49% | 1.48% | 1.46% | 1.17% | 1.42% |
| Expenses net of all reductions | 1.49% | 1.47% | 1.44% | 1.16% | 1.41% |
| Net investment income (loss) | .66%C | .26%D | .59% | .66%E | .25%F |
| Supplemental Data | | | | | |
| Net assets, end of period (000 omitted) | $81,790 | $80,182 | $38,049 | $53,612 | $69,380 |
| Portfolio turnover rateM | 40% | 54% | 109% | 79% | 55% |
A Calculated based on average shares outstanding during the period.
B Net investment income (loss) is affected by the timing of the declaration of dividends by any underlying mutual funds or exchange-traded funds (ETFs). Net investment income (loss) of any such underlying funds is not included in the Fund's net investment income (loss) ratio.
C Net investment income per share reflects one or more large, non-recurring dividend(s) which amounted to $.15 per share. Excluding such non-recurring dividend(s), the ratio of net investment income (loss) to average net assets would have been (.10) %.
D Net investment income per share reflects one or more large, non-recurring dividend(s) which amounted to $.06 per share. Excluding such non-recurring dividend(s), the ratio of net investment income (loss) to average net assets would have been (.11) %.
E Net investment income per share reflects one or more large, non-recurring dividend(s) which amounted to $.03 per share. Excluding such non-recurring dividend(s), the ratio of net investment income (loss) to average net assets would have been .46%.
F Net investment income per share reflects one or more large, non-recurring dividend(s) which amounted to $.04 per share. Excluding such non-recurring dividend(s), the ratio of net investment income (loss) to average net assets would have been .04%.
G Total distributions per share do not sum due to rounding.
H Amount represents less than $.005 per share.
I Total returns would have been lower if certain expenses had not been reduced during the applicable periods shown.
J Total returns do not include the effect of the sales charges.
K Fees and expenses of any underlying mutual funds or exchange-traded funds (ETFs) are not included in the Fund's expense ratio. The Fund indirectly bears its proportionate share of these expenses. For additional expense information related to investments in Fidelity Central Funds, please refer to the "Investments in Fidelity Central Funds" note found in the Notes to Financial Statements section of the most recent Annual or Semi-Annual report.
L Expense ratios reflect operating expenses of the class. Expenses before reductions do not reflect amounts reimbursed, waived, or reduced through arrangements with the investment adviser, brokerage services, or other offset arrangements, if applicable, and do not represent the amount paid by the class during periods when reimbursements, waivers or reductions occur.
M Amount does not include the portfolio activity of any underlying mutual funds or exchange-traded funds (ETFs).
See accompanying notes which are an integral part of the financial statements.
Fidelity Small Cap Value Fund Class C
| Years ended July 31, | 2022 | 2021 | 2020 | 2019 | 2018 |
| Selected Per–Share Data | | | | | |
| Net asset value, beginning of period | $18.25 | $10.76 | $12.91 | $18.50 | $17.39 |
| Income from Investment Operations | | | | | |
| Net investment income (loss)A,B | .03C | (.04)D | .01 | .02E | (.05)F |
| Net realized and unrealized gain (loss) | (.36) | 7.55 | (1.72) | (.89) | 1.71 |
| Total from investment operations | (.33) | 7.51 | (1.71) | (.87) | 1.66 |
| Distributions from net investment income | (.31) | (.02) | (.03) | (.02) | (.03) |
| Distributions from net realized gain | (1.24) | – | (.41) | (4.71) | (.52) |
| Total distributions | (1.54)G | (.02) | (.44) | (4.72)G | (.55) |
| Redemption fees added to paid in capitalA | – | – | – | – | –H |
| Net asset value, end of period | $16.38 | $18.25 | $10.76 | $12.91 | $18.50 |
| Total ReturnI,J | (2.27)% | 69.84% | (13.74)% | (5.63)% | 9.84% |
| Ratios to Average Net AssetsB,K,L | | | | | |
| Expenses before reductions | 2.02% | 2.01% | 2.00% | 1.68% | 1.93% |
| Expenses net of fee waivers, if any | 2.01% | 2.01% | 1.99% | 1.68% | 1.93% |
| Expenses net of all reductions | 2.01% | 2.00% | 1.97% | 1.67% | 1.92% |
| Net investment income (loss) | .14%C | (.26)%D | .06% | .15%E | (.26)%F |
| Supplemental Data | | | | | |
| Net assets, end of period (000 omitted) | $38,832 | $32,469 | $13,748 | $22,187 | $44,396 |
| Portfolio turnover rateM | 40% | 54% | 109% | 79% | 55% |
A Calculated based on average shares outstanding during the period.
B Net investment income (loss) is affected by the timing of the declaration of dividends by any underlying mutual funds or exchange-traded funds (ETFs). Net investment income (loss) of any such underlying funds is not included in the Fund's net investment income (loss) ratio.
C Net investment income per share reflects one or more large, non-recurring dividend(s) which amounted to $.13 per share. Excluding such non-recurring dividend(s), the ratio of net investment income (loss) to average net assets would have been (.62) %.
D Net investment income per share reflects one or more large, non-recurring dividend(s) which amounted to $.06 per share. Excluding such non-recurring dividend(s), the ratio of net investment income (loss) to average net assets would have been (.64) %.
E Net investment income per share reflects one or more large, non-recurring dividend(s) which amounted to $.03 per share. Excluding such non-recurring dividend(s), the ratio of net investment income (loss) to average net assets would have been (.05) %.
F Net investment income per share reflects one or more large, non-recurring dividend(s) which amounted to $.04 per share. Excluding such non-recurring dividend(s), the ratio of net investment income (loss) to average net assets would have been (.47) %.
G Total distributions per share do not sum due to rounding.
H Amount represents less than $.005 per share.
I Total returns would have been lower if certain expenses had not been reduced during the applicable periods shown.
J Total returns do not include the effect of the contingent deferred sales charge.
K Fees and expenses of any underlying mutual funds or exchange-traded funds (ETFs) are not included in the Fund's expense ratio. The Fund indirectly bears its proportionate share of these expenses. For additional expense information related to investments in Fidelity Central Funds, please refer to the "Investments in Fidelity Central Funds" note found in the Notes to Financial Statements section of the most recent Annual or Semi-Annual report.
L Expense ratios reflect operating expenses of the class. Expenses before reductions do not reflect amounts reimbursed, waived, or reduced through arrangements with the investment adviser, brokerage services, or other offset arrangements, if applicable, and do not represent the amount paid by the class during periods when reimbursements, waivers or reductions occur.
M Amount does not include the portfolio activity of any underlying mutual funds or exchange-traded funds (ETFs).
See accompanying notes which are an integral part of the financial statements.
Fidelity Small Cap Value Fund
| Years ended July 31, | 2022 | 2021 | 2020 | 2019 | 2018 |
| Selected Per–Share Data | | | | | |
| Net asset value, beginning of period | $21.59 | $12.64 | $15.04 | $20.71 | $19.41 |
| Income from Investment Operations | | | | | |
| Net investment income (loss)A,B | .24C | .14D | .15 | .18E | .15F |
| Net realized and unrealized gain (loss) | (.42) | 8.89 | (2.01) | (1.00) | 1.89 |
| Total from investment operations | (.18) | 9.03 | (1.86) | (.82) | 2.04 |
| Distributions from net investment income | (.44) | (.08) | (.12) | (.15) | (.22) |
| Distributions from net realized gain | (1.28) | – | (.41) | (4.71) | (.52) |
| Total distributions | (1.72) | (.08) | (.54)G | (4.85)G | (.74) |
| Redemption fees added to paid in capitalA | – | – | – | – | –H |
| Net asset value, end of period | $19.69 | $21.59 | $12.64 | $15.04 | $20.71 |
| Total ReturnI | (1.23)% | 71.64% | (12.88)% | (4.58)% | 10.88% |
| Ratios to Average Net AssetsB,J,K | | | | | |
| Expenses before reductions | .99% | .97% | .96% | .66% | .91% |
| Expenses net of fee waivers, if any | .98% | .97% | .96% | .66% | .91% |
| Expenses net of all reductions | .98% | .96% | .94% | .64% | .91% |
| Net investment income (loss) | 1.17%C | .77%D | 1.10% | 1.17%E | .76%F |
| Supplemental Data | | | | | |
| Net assets, end of period (000 omitted) | $2,691,063 | $2,715,703 | $1,231,427 | $1,611,032 | $2,052,664 |
| Portfolio turnover rateL | 40% | 54% | 109% | 79% | 55% |
A Calculated based on average shares outstanding during the period.
B Net investment income (loss) is affected by the timing of the declaration of dividends by any underlying mutual funds or exchange-traded funds (ETFs). Net investment income (loss) of any such underlying funds is not included in the Fund's net investment income (loss) ratio.
C Net investment income per share reflects one or more large, non-recurring dividend(s) which amounted to $.16 per share. Excluding such non-recurring dividend(s), the ratio of net investment income (loss) to average net assets would have been .41%.
D Net investment income per share reflects one or more large, non-recurring dividend(s) which amounted to $.07 per share. Excluding such non-recurring dividend(s), the ratio of net investment income (loss) to average net assets would have been .40%.
E Net investment income per share reflects one or more large, non-recurring dividend(s) which amounted to $.03 per share. Excluding such non-recurring dividend(s), the ratio of net investment income (loss) to average net assets would have been .98%.
F Net investment income per share reflects one or more large, non-recurring dividend(s) which amounted to $.04 per share. Excluding such non-recurring dividend(s), the ratio of net investment income (loss) to average net assets would have been .55%.
G Total distributions per share do not sum due to rounding.
H Amount represents less than $.005 per share.
I Total returns would have been lower if certain expenses had not been reduced during the applicable periods shown.
J Fees and expenses of any underlying mutual funds or exchange-traded funds (ETFs) are not included in the Fund's expense ratio. The Fund indirectly bears its proportionate share of these expenses. For additional expense information related to investments in Fidelity Central Funds, please refer to the "Investments in Fidelity Central Funds" note found in the Notes to Financial Statements section of the most recent Annual or Semi-Annual report.
K Expense ratios reflect operating expenses of the class. Expenses before reductions do not reflect amounts reimbursed, waived, or reduced through arrangements with the investment adviser, brokerage services, or other offset arrangements, if applicable, and do not represent the amount paid by the class during periods when reimbursements, waivers or reductions occur.
L Amount does not include the portfolio activity of any underlying mutual funds or exchange-traded funds (ETFs).
See accompanying notes which are an integral part of the financial statements.
Fidelity Small Cap Value Fund Class I
| Years ended July 31, | 2022 | 2021 | 2020 | 2019 | 2018 |
| Selected Per–Share Data | | | | | |
| Net asset value, beginning of period | $21.59 | $12.65 | $15.04 | $20.72 | $19.41 |
| Income from Investment Operations | | | | | |
| Net investment income (loss)A,B | .24C | .15D | .15 | .18E | .15F |
| Net realized and unrealized gain (loss) | (.42) | 8.87 | (2.01) | (1.01) | 1.90 |
| Total from investment operations | (.18) | 9.02 | (1.86) | (.83) | 2.05 |
| Distributions from net investment income | (.44) | (.08) | (.12) | (.15) | (.22) |
| Distributions from net realized gain | (1.28) | – | (.41) | (4.71) | (.52) |
| Total distributions | (1.72) | (.08) | (.53) | (4.85)G | (.74) |
| Redemption fees added to paid in capitalA | – | – | – | – | –H |
| Net asset value, end of period | $19.69 | $21.59 | $12.65 | $15.04 | $20.72 |
| Total ReturnI | (1.22)% | 71.55% | (12.82)% | (4.63)% | 10.93% |
| Ratios to Average Net AssetsB,J,K | | | | | |
| Expenses before reductions | .99% | .97% | .95% | .66% | .91% |
| Expenses net of fee waivers, if any | .99% | .97% | .95% | .66% | .91% |
| Expenses net of all reductions | .99% | .96% | .93% | .65% | .90% |
| Net investment income (loss) | 1.17%C | .77%D | 1.10% | 1.17%E | .76%F |
| Supplemental Data | | | | | |
| Net assets, end of period (000 omitted) | $1,319,154 | $845,012 | $214,538 | $243,571 | $459,332 |
| Portfolio turnover rateL | 40% | 54% | 109% | 79% | 55% |
A Calculated based on average shares outstanding during the period.
B Net investment income (loss) is affected by the timing of the declaration of dividends by any underlying mutual funds or exchange-traded funds (ETFs). Net investment income (loss) of any such underlying funds is not included in the Fund's net investment income (loss) ratio.
C Net investment income per share reflects one or more large, non-recurring dividend(s) which amounted to $.16 per share. Excluding such non-recurring dividend(s), the ratio of net investment income (loss) to average net assets would have been .40%.
D Net investment income per share reflects one or more large, non-recurring dividend(s) which amounted to $.07 per share. Excluding such non-recurring dividend(s), the ratio of net investment income (loss) to average net assets would have been .40%.
E Net investment income per share reflects one or more large, non-recurring dividend(s) which amounted to $.03 per share. Excluding such non-recurring dividend(s), the ratio of net investment income (loss) to average net assets would have been .97%.
F Net investment income per share reflects one or more large, non-recurring dividend(s) which amounted to $.04 per share. Excluding such non-recurring dividend(s), the ratio of net investment income (loss) to average net assets would have been .55%.
G Total distributions per share do not sum due to rounding.
H Amount represents less than $.005 per share.
I Total returns would have been lower if certain expenses had not been reduced during the applicable periods shown.
J Fees and expenses of any underlying mutual funds or exchange-traded funds (ETFs) are not included in the Fund's expense ratio. The Fund indirectly bears its proportionate share of these expenses. For additional expense information related to investments in Fidelity Central Funds, please refer to the "Investments in Fidelity Central Funds" note found in the Notes to Financial Statements section of the most recent Annual or Semi-Annual report.
K Expense ratios reflect operating expenses of the class. Expenses before reductions do not reflect amounts reimbursed, waived, or reduced through arrangements with the investment adviser, brokerage services, or other offset arrangements, if applicable, and do not represent the amount paid by the class during periods when reimbursements, waivers or reductions occur.
L Amount does not include the portfolio activity of any underlying mutual funds or exchange-traded funds (ETFs).
See accompanying notes which are an integral part of the financial statements.
Fidelity Small Cap Value Fund Class Z
| Years ended July 31, | 2022 | 2021 | 2020 | 2019 A |
| Selected Per–Share Data | | | | |
| Net asset value, beginning of period | $21.59 | $12.65 | $15.05 | $16.90 |
| Income from Investment Operations | | | | |
| Net investment income (loss)B,C | .27D | .17E | .17 | (.08)F |
| Net realized and unrealized gain (loss) | (.43) | 8.87 | (2.01) | (.66) |
| Total from investment operations | (.16) | 9.04 | (1.84) | (.74) |
| Distributions from net investment income | (.47) | (.10) | (.15) | (.09) |
| Distributions from net realized gain | (1.28) | – | (.41) | (1.02) |
| Total distributions | (1.74)G | (.10) | (.56) | (1.11) |
| Redemption fees added to paid in capitalB | – | – | – | – |
| Net asset value, end of period | $19.69 | $21.59 | $12.65 | $15.05 |
| Total ReturnH,I | (1.11)% | 71.75% | (12.73)% | (3.75)% |
| Ratios to Average Net AssetsC,J,K | | | | |
| Expenses before reductions | .86% | .84% | .81% | .52%L |
| Expenses net of fee waivers, if any | .86% | .84% | .81% | .52%L |
| Expenses net of all reductions | .86% | .83% | .79% | .51%L |
| Net investment income (loss) | 1.30%D | .90%E | 1.25% | (.63)%F,L |
| Supplemental Data | | | | |
| Net assets, end of period (000 omitted) | $540,854 | $364,564 | $93,849 | $26,006 |
| Portfolio turnover rateM | 40% | 54% | 109% | 79% |
A For the period October 2, 2018 (commencement of sale of shares) through July 31, 2019.
B Calculated based on average shares outstanding during the period.
C Net investment income (loss) is affected by the timing of the declaration of dividends by any underlying mutual funds or exchange-traded funds (ETFs). Net investment income (loss) of any such underlying funds is not included in the Fund's net investment income (loss) ratio.
D Net investment income per share reflects one or more large, non-recurring dividend(s) which amounted to $.16 per share. Excluding such non-recurring dividend(s), the ratio of net investment income (loss) to average net assets would have been .53%.
E Net investment income per share reflects one or more large, non-recurring dividend(s) which amounted to $.07 per share. Excluding such non-recurring dividend(s), the ratio of net investment income (loss) to average net assets would have been .53%.
F Net investment income per share reflects one or more large, non-recurring dividend(s) which amounted to $.02 per share. Excluding such non-recurring dividend(s), the ratio of net investment income (loss) to average net assets would have been (.82) %.
G Total distributions per share do not sum due to rounding.
H Total returns for periods of less than one year are not annualized.
I Total returns would have been lower if certain expenses had not been reduced during the applicable periods shown.
J Fees and expenses of any underlying mutual funds or exchange-traded funds (ETFs) are not included in the Fund's expense ratio. The Fund indirectly bears its proportionate share of these expenses. For additional expense information related to investments in Fidelity Central Funds, please refer to the "Investments in Fidelity Central Funds" note found in the Notes to Financial Statements section of the most recent Annual or Semi-Annual report.
K Expense ratios reflect operating expenses of the class. Expenses before reductions do not reflect amounts reimbursed, waived, or reduced through arrangements with the investment adviser, brokerage services, or other offset arrangements, if applicable, and do not represent the amount paid by the class during periods when reimbursements, waivers or reductions occur.
L Annualized
M Amount does not include the portfolio activity of any underlying mutual funds or exchange-traded funds (ETFs).
See accompanying notes which are an integral part of the financial statements.
Notes to Financial Statements
For the period ended July 31, 2022
1. Organization.
Fidelity Small Cap Value Fund (the Fund) is a fund of Fidelity Securities Fund (the Trust) and is authorized to issue an unlimited number of shares. The Trust is registered under the Investment Company Act of 1940, as amended (the 1940 Act), as an open-end management investment company organized as a Massachusetts business trust. The Fund offers Class A, Class M, Class C, Small Cap Value, Class I and Class Z shares, each of which has equal rights as to assets and voting privileges. Each class has exclusive voting rights with respect to matters that affect that class. Class C shares will automatically convert to Class A shares after a holding period of eight years from the initial date of purchase, with certain exceptions.
2. Investments in Fidelity Central Funds.
Funds may invest in Fidelity Central Funds, which are open-end investment companies generally available only to other investment companies and accounts managed by the investment adviser and its affiliates. The Schedule of Investments lists any Fidelity Central Funds held as an investment as of period end, but does not include the underlying holdings of each Fidelity Central Fund. An investing fund indirectly bears its proportionate share of the expenses of the underlying Fidelity Central Funds.
Based on its investment objective, each Fidelity Central Fund may invest or participate in various investment vehicles or strategies that are similar to those of the investing fund. These strategies are consistent with the investment objectives of the investing fund and may involve certain economic risks which may cause a decline in value of each of the Fidelity Central Funds and thus a decline in the value of the investing fund.
| Fidelity Central Fund | Investment Manager | Investment Objective | Investment Practices | Expense Ratio(a) |
| Fidelity Money Market Central Funds | Fidelity Management & Research Company LLC (FMR) | Each fund seeks to obtain a high level of current income consistent with the preservation of capital and liquidity. | Short-term Investments | Less than .005% |
(a) Expenses expressed as a percentage of average net assets and are as of each underlying Central Fund's most recent annual or semi-annual shareholder report.
A complete unaudited list of holdings for each Fidelity Central Fund is available upon request or at the Securities and Exchange Commission website at www.sec.gov. In addition, the financial statements of the Fidelity Central Funds which contain the significant accounting policies (including investment valuation policies) of those funds, and are not covered by the Report of Independent Registered Public Accounting Firm, are available on the Securities and Exchange Commission website or upon request.
3. Significant Accounting Policies.
The Fund is an investment company and applies the accounting and reporting guidance of the Financial Accounting Standards Board (FASB) Accounting Standards Codification Topic 946 Financial Services - Investment Companies. The financial statements have been prepared in conformity with accounting principles generally accepted in the United States of America (GAAP), which require management to make certain estimates and assumptions at the date of the financial statements. Actual results could differ from those estimates. Subsequent events, if any, through the date that the financial statements were issued have been evaluated in the preparation of the financial statements. The Fund's Schedule of Investments lists any underlying mutual funds or exchange-traded funds (ETFs) but does not include the underlying holdings of these funds. The following summarizes the significant accounting policies of the Fund:
Investment Valuation. Investments are valued as of 4:00 p.m. Eastern time on the last calendar day of the period. The Board of Trustees (the Board) has delegated the day to day responsibility for the valuation of the Fund's investments to the Fair Value Committee (the Committee) established by the Fund's investment adviser. In accordance with valuation policies and procedures approved by the Board, the Fund attempts to obtain prices from one or more third party pricing vendors or brokers to value its investments. When current market prices, quotations or currency exchange rates are not readily available or reliable, investments will be fair valued in good faith by the Committee, in accordance with procedures adopted by the Board. Factors used in determining fair value vary by investment type and may include market or investment specific events. The frequency with which these procedures are used cannot be predicted and they may be utilized to a significant extent. The Committee oversees the Fund's valuation policies and procedures and reports to the Board on the Committee's activities and fair value determinations. The Board monitors the appropriateness of the procedures used in valuing the Fund's investments and ratifies the fair value determinations of the Committee.
The Fund categorizes the inputs to valuation techniques used to value its investments into a disclosure hierarchy consisting of three levels as shown below:
- Level 1 – unadjusted quoted prices in active markets for identical investments
- Level 2 – other significant observable inputs (including quoted prices for similar investments, interest rates, prepayment speeds, etc.)
- Level 3 – unobservable inputs (including the Fund's own assumptions based on the best information available)
Valuation techniques used to value the Fund's investments by major category are as follows:
Equity securities, including restricted securities, for which market quotations are readily available, are valued at the last reported sale price or official closing price as reported by a third party pricing vendor on the primary market or exchange on which they are traded and are categorized as Level 1 in the hierarchy. In the event there were no sales during the day or closing prices are not available, securities are valued at the last quoted bid price or may be valued using the last available price and are generally categorized as Level 2 in the hierarchy. For foreign equity securities, when market or security specific events arise, comparisons to the valuation of American Depositary Receipts (ADRs), futures contracts, ETFs and certain indexes as well as quoted prices for similar securities may be used and would be categorized as Level 2 in the hierarchy. For equity securities, including restricted securities, where observable inputs are limited, assumptions about market activity and risk are used and these securities may be categorized as Level 3 in the hierarchy.
Investments in open-end mutual funds, including the Fidelity Central Funds, are valued at their closing net asset value (NAV) each business day and are categorized as Level 1 in the hierarchy.
Changes in valuation techniques may result in transfers in or out of an assigned level within the disclosure hierarchy. The aggregate value of investments by input level as of July 31, 2022 is included at the end of the Fund's Schedule of Investments.
Foreign Currency. Certain Funds may use foreign currency contracts to facilitate transactions in foreign-denominated securities. Gains and losses from these transactions may arise from changes in the value of the foreign currency or if the counterparties do not perform under the contracts' terms.
Foreign-denominated assets, including investment securities, and liabilities are translated into U.S. dollars at the exchange rates at period end. Purchases and sales of investment securities, income and dividends received, and expenses denominated in foreign currencies are translated into U.S. dollars at the exchange rate in effect on the transaction date.
The effects of exchange rate fluctuations on investments are included with the net realized and unrealized gain (loss) on investment securities. Other foreign currency transactions resulting in realized and unrealized gain (loss) are disclosed separately.
Investment Transactions and Income. For financial reporting purposes, the Fund's investment holdings and NAV include trades executed through the end of the last business day of the period. The NAV per share for processing shareholder transactions is calculated as of the close of business of the New York Stock Exchange (NYSE), normally 4:00 p.m. Eastern time and includes trades executed through the end of the prior business day. Gains and losses on securities sold are determined on the basis of identified cost and include proceeds received from litigation. Commissions paid to certain brokers with whom the investment adviser, or its affiliates, places trades on behalf of a fund include an amount in addition to trade execution, which may be rebated back to a fund. Any such rebates are included in net realized gain (loss) on investments in the Statement of Operations. Dividend income is recorded on the ex-dividend date, except for certain dividends from foreign securities where the ex-dividend date may have passed, which are recorded as soon as the Fund is informed of the ex-dividend date. Non-cash dividends included in dividend income, if any, are recorded at the fair market value of the securities received. Income and capital gain distributions from Fidelity Central Funds, if any, are recorded on the ex-dividend date. Certain distributions received by the Fund represent a return of capital or capital gain. The Fund determines the components of these distributions subsequent to the ex-dividend date, based upon receipt of tax filings or other correspondence relating to the underlying investment. These distributions are recorded as a reduction of cost of investments and/or as a realized gain. Large, non-recurring dividends recognized by the Fund are presented separately on the Statement of Operations as "Special Dividends" and the impact of these dividends is presented in the Financial Highlights. Investment income is recorded net of foreign taxes withheld where recovery of such taxes is uncertain. Funds may file withholding tax reclaims in certain jurisdictions to recover a portion of amounts previously withheld. Any withholding tax reclaims income is included in the Statement of Operations in dividends. Any receivables for withholding tax reclaims are included in the Statement of Assets and Liabilities in dividends receivable.
Class Allocations and Expenses. Investment income, realized and unrealized capital gains and losses, common expenses of a fund, and certain fund-level expense reductions, if any, are allocated daily on a pro-rata basis to each class based on the relative net assets of each class to the total net assets of a fund. Each class differs with respect to transfer agent and distribution and service plan fees incurred, as applicable. Certain expense reductions may also differ by class, if applicable. For the reporting period, the allocated portion of income and expenses to each class as a percent of its average net assets may vary due to the timing of recording these transactions in relation to fluctuating net assets of the classes. Expenses directly attributable to a fund are charged to that fund. Expenses attributable to more than one fund are allocated among the respective funds on the basis of relative net assets or other appropriate methods. Expenses included in the accompanying financial statements reflect the expenses of that fund and do not include any expenses associated with any underlying mutual funds or exchange-traded funds. Although not included in a fund's expenses, a fund indirectly bears its proportionate share of these expenses through the net asset value of each underlying mutual fund or exchange-traded fund. Expense estimates are accrued in the period to which they relate and adjustments are made when actual amounts are known.
Income Tax Information and Distributions to Shareholders. Each year, the Fund intends to qualify as a regulated investment company under Subchapter M of the Internal Revenue Code, including distributing substantially all of its taxable income and realized gains. As a result, no provision for U.S. Federal income taxes is required. As of July 31, 2022, the Fund did not have any unrecognized tax benefits in the financial statements; nor is the Fund aware of any tax positions for which it is reasonably possible that the total amounts of unrecognized tax benefits will significantly change in the next twelve months. The Fund files a U.S. federal tax return, in addition to state and local tax returns as required. The Fund's federal income tax returns are subject to examination by the Internal Revenue Service (IRS) for a period of three fiscal years after they are filed. State and local tax returns may be subject to examination for an additional fiscal year depending on the jurisdiction. Foreign taxes are provided for based on the Fund's understanding of the tax rules and rates that exist in the foreign markets in which it invests.
Distributions are declared and recorded on the ex-dividend date. Income and capital gain distributions are declared separately for each class. Income and capital gain distributions are determined in accordance with income tax regulations, which may differ from GAAP. In addition, the Fund claimed a portion of the payment made to redeeming shareholders as a distribution for income tax purposes.
Capital accounts within the financial statements are adjusted for permanent book-tax differences. These adjustments have no impact on net assets or the results of operations. Capital accounts are not adjusted for temporary book-tax differences which will reverse in a subsequent period.
Book-tax differences are primarily due to foreign currency transactions, partnership, passive foreign investment companies (PFIC) and losses deferred due to wash sales and excise tax regulations.
As of period end, the cost and unrealized appreciation (depreciation) in securities, and derivatives if applicable, for federal income tax purposes were as follows:
| Gross unrealized appreciation | $697,040,748 |
| Gross unrealized depreciation | (344,036,608) |
| Net unrealized appreciation (depreciation) | $353,004,140 |
| Tax Cost | $4,828,283,596 |
The tax-based components of distributable earnings as of period end were as follows:
| Undistributed long-term capital gain | $259,502,564 |
| Net unrealized appreciation (depreciation) on securities and other investments | $352,933,605 |
The Fund intends to elect to defer to its next fiscal year $11,047,968 of capital losses recognized during the period November 1, 2021 to July 31, 2022, and $21,047,590 of ordinary losses recognized during the period January 1, 2022 to July 31, 2022.
The tax character of distributions paid was as follows:
| | July 31, 2022 | July 31, 2021 |
| Ordinary Income | $237,962,097 | $ 10,614,922 |
| Long-term Capital Gains | 121,288,506 | – |
| Total | $359,250,603 | $ 10,614,922 |
4. Purchases and Sales of Investments.
Purchases and sales of securities, other than short-term securities and in-kind transactions, as applicable, are noted in the table below.
| | Purchases ($) | Sales ($) |
| Fidelity Small Cap Value Fund | 2,700,519,419 | 1,889,425,723 |
5. Fees and Other Transactions with Affiliates.
Management Fee. Fidelity Management & Research Company LLC (the investment adviser) and its affiliates provide the Fund with investment management related services for which the Fund pays a monthly management fee. The management fee is the sum of an individual fund fee rate that is based on an annual rate of .45% of the Fund's average net assets and an annualized group fee rate that averaged .22% during the period. The group fee rate is based upon the monthly average net assets of a group of registered investment companies with which the investment adviser has management contracts. The group fee rate decreases as assets under management increase and increases as assets under management decrease. In addition, the management fee is subject to a performance adjustment (up to a maximum of +/- .20 % of the Fund's average net assets over a 36 month performance period). The upward or downward adjustment to the management fee is based on the relative investment performance of Small Cap Value Fund as compared to its benchmark index, the Russell 2000 Value Index, over the same 36 month performance period. For the reporting period, the total annual management fee rate, including the performance adjustment, was .79% of the Fund's average net assets. The performance adjustment included in the management fee rate may be higher or lower than the maximum performance adjustment rate due to the difference between the average net assets for the reporting and performance periods.
Distribution and Service Plan Fees. In accordance with Rule 12b-1 of the 1940 Act, the Fund has adopted separate Distribution and Service Plans for each class of shares. Certain classes pay Fidelity Distributors Company LLC (FDC), an affiliate of the investment adviser, separate Distribution and Service Fees, each of which is based on an annual percentage of each class' average net assets. In addition, FDC may pay financial intermediaries for selling shares of the Fund and providing shareholder support services. For the period, the Distribution and Service Fee rates, total fees and amounts retained by FDC were as follows:
| | Distribution Fee | Service Fee | Total Fees | Retained by FDC |
| Class A | -% | .25% | $660,693 | $45,212 |
| Class M | .25% | .25% | 410,904 | 360 |
| Class C | .75% | .25%% | 373,900 | 158,112 |
| | | | $1,445,497 | $203,684 |
Sales Load. FDC may receive a front-end sales charge of up to 5.75% for selling Class A shares and 3.50% for selling Class M shares, some of which is paid to financial intermediaries for selling shares of the Fund. Depending on the holding period, FDC may receive contingent deferred sales charges levied on Class A, Class M and Class C redemptions. The deferred sales charges are 1.00% for Class C shares, 1.00% for certain purchases of Class A shares and .25% for certain purchases of Class M shares.
For the period, sales charge amounts retained by FDC were as follows:
| | Retained by FDC |
| Class A | $140,397 |
| Class M | 7,427 |
| Class C(a) | 900 |
| | $148,724 |
(a) When Class C shares are initially sold, FDC pays commissions from its own resources to financial intermediaries through which the sales are made.
Transfer Agent Fees. Fidelity Investments Institutional Operations Company LLC (FIIOC), an affiliate of the investment adviser, is the transfer, dividend disbursing and shareholder servicing agent for each class of the Fund. FIIOC receives account fees and asset-based fees that vary according to the account size and type of account of the shareholders of the respective classes of the Fund, except for Class Z. FIIOC receives an asset-based fee of Class Z's average net assets. FIIOC pays for typesetting, printing and mailing of shareholder reports, except proxy statements.
For the period, transfer agent fees for each class were as follows:
| | Amount | % of Class-Level Average Net Assets |
| Class A | $481,265 | .18 |
| Class M | 142,903 | .17 |
| Class C | 71,549 | .19 |
| Small Cap Value | 4,542,043 | .16 |
| Class I | 1,948,840 | .17 |
| Class Z | 188,594 | .04 |
| | $7,375,194 | |
Accounting Fees. Fidelity Service Company, Inc. (FSC), an affiliate of the investment adviser, maintains the Fund's accounting records. The accounting fee is based on the level of average net assets for each month. For the period, the fees were equivalent to the following annual rates:
| | % of Average Net Assets |
| Fidelity Small Cap Value Fund | .02 |
Brokerage Commissions. A portion of portfolio transactions were placed with brokerage firms which are affiliates of the investment adviser. Brokerage commissions are included in net realized gain (loss) and change in net unrealized appreciation (depreciation) in the Statement of Operations. The commissions paid to these affiliated firms were as follows:
| | Amount |
| Fidelity Small Cap Value Fund | $55,252 |
Interfund Lending Program. Pursuant to an Exemptive Order issued by the Securities and Exchange Commission (the SEC), the Fund, along with other registered investment companies having management contracts with Fidelity Management & Research Company LLC (FMR), or other affiliated entities of FMR, may participate in an interfund lending program. This program provides an alternative credit facility allowing the Fund to borrow from, or lend money to, other participating affiliated funds. At period end, there were no interfund loans outstanding. Activity in this program during the period for which loans were outstanding was as follows:
| | Borrower or Lender | Average Loan Balance | Weighted Average Interest Rate | Interest Expense |
| Fidelity Small Cap Value Fund | Borrower | $17,498,800 | 1.60% | $3,881 |
Interfund Trades. Funds may purchase from or sell securities to other Fidelity Funds under procedures adopted by the Board. The procedures have been designed to ensure these interfund trades are executed in accordance with Rule 17a-7 of the 1940 Act. Any interfund trades are included within the respective purchases and sales amounts shown in the Purchases and Sales of Investments note. Interfund trades during the period are noted in the table below.
| | Purchases ($) | Sales ($) | Realized Gain (Loss) ($) |
| Fidelity Small Cap Value Fund | 244,040,399 | 142,483,203 | 48,513,881 |
6. Committed Line of Credit.
Certain Funds participate with other funds managed by the investment adviser or an affiliate in a $4.25 billion credit facility (the "line of credit") to be utilized for temporary or emergency purposes to fund shareholder redemptions or for other short-term liquidity purposes. The participating funds have agreed to pay commitment fees on their pro-rata portion of the line of credit, which are reflected in Miscellaneous expenses on the Statement of Operations, and are listed below. During the period, there were no borrowings on this line of credit.
| | Amount |
| Fidelity Small Cap Value Fund | $5,814 |
7. Security Lending.
Funds lend portfolio securities from time to time in order to earn additional income. Lending agents are used, including National Financial Services (NFS), an affiliate of the investment adviser. Pursuant to a securities lending agreement, NFS will receive a fee, which is capped at 9.9% of a fund's daily lending revenue, for its services as lending agent. A fund may lend securities to certain qualified borrowers, including NFS. On the settlement date of the loan, a fund receives collateral (in the form of U.S. Treasury obligations, letters of credit and/or cash) against the loaned securities and maintains collateral in an amount not less than 100% of the market value of the loaned securities during the period of the loan. The market value of the loaned securities is determined at the close of business of a fund and any additional required collateral is delivered to a fund on the next business day. A fund or borrower may terminate the loan at any time, and if the borrower defaults on its obligation to return the securities loaned because of insolvency or other reasons, a fund may apply collateral received from the borrower against the obligation. A fund may experience delays and costs in recovering the securities loaned. Any cash collateral received is invested in the Fidelity Securities Lending Cash Central Fund. Any loaned securities are identified as such in the Schedule of Investments, and the value of loaned securities and cash collateral at period end, as applicable, are presented in the Statement of Assets and Liabilities. Security lending income represents the income earned on investing cash collateral, less rebates paid to borrowers and any lending agent fees associated with the loan, plus any premium payments received for lending certain types of securities. Security lending income is presented in the Statement of Operations as a component of income from Fidelity Central Funds. Affiliated security lending activity, if any, was as follows:
| | Total Security Lending Fees Paid to NFS | Security Lending Income From Securities Loaned to NFS | Value of Securities Loaned to NFS at Period End |
| Fidelity Small Cap Value Fund | $137,211 | $20,676 | $– |
8. Expense Reductions.
Through arrangements with the Fund's custodian, credits realized as a result of certain uninvested cash balances were used to reduce the Fund's expenses. During the period, custodian credits reduced the Fund's expenses by $95
In addition, during the period the investment adviser or an affiliate reimbursed and/or waived a portion of fund-level operating expenses in the amount of $150,212.
9. Distributions to Shareholders.
Distributions to shareholders of each class were as follows:
| | Year ended
July 31, 2022 | Year ended
July 31, 2021 |
| Fidelity Small Cap Value Fund | | |
| Distributions to shareholders | | |
| Class A | $19,708,729 | $407,443 |
| Class M | 6,431,794 | 113,565 |
| Class C | 2,894,329 | 26,709 |
| Small Cap Value | 219,284,330 | 7,606,520 |
| Class I | 78,004,957 | 1,593,887 |
| Class Z | 32,926,464 | 866,798 |
| Total | $359,250,603 | $10,614,922 |
10. Share Transactions.
Share transactions for each class were as follows and may contain in-kind transactions, automatic conversions between classes or exchanges between affiliated funds:
| | Shares | Shares | Dollars | Dollars |
| | Year ended July 31, 2022 | Year ended July 31, 2021 | Year ended July 31, 2022 | Year ended July 31, 2021 |
| Fidelity Small Cap Value Fund | | | | |
| Class A | | | | |
| Shares sold | 5,298,721 | 5,515,402 | $108,496,696 | $105,357,330 |
| Reinvestment of distributions | 931,850 | 24,428 | 19,175,840 | 399,404 |
| Shares redeemed | (3,305,265) | (2,711,145) | (66,717,629) | (47,316,784) |
| Net increase (decrease) | 2,925,306 | 2,828,685 | $60,954,907 | $58,439,950 |
| Class M | | | | |
| Shares sold | 1,378,126 | 1,737,851 | $27,066,436 | $33,058,379 |
| Reinvestment of distributions | 320,905 | 7,107 | 6,377,160 | 112,433 |
| Shares redeemed | (1,207,147) | (987,198) | (23,647,044) | (17,372,101) |
| Net increase (decrease) | 491,884 | 757,760 | $9,796,552 | $15,798,711 |
| Class C | | | | |
| Shares sold | 1,199,095 | 1,480,989 | $21,139,005 | $24,653,857 |
| Reinvestment of distributions | 159,909 | 1,866 | 2,839,061 | 26,596 |
| Shares redeemed | (768,069) | (980,897) | (13,253,131) | (16,135,958) |
| Net increase (decrease) | 590,935 | 501,958 | $10,724,935 | $8,544,495 |
| Small Cap Value | | | | |
| Shares sold | 47,561,130 | 70,129,869 | $1,004,315,420 | $1,400,537,590 |
| Reinvestment of distributions | 9,867,950 | 450,885 | 208,631,722 | 7,216,719 |
| Shares redeemed | (46,550,420) | (42,160,543) | (975,621,735) | (796,634,527) |
| Net increase (decrease) | 10,878,660 | 28,420,211 | $237,325,407 | $611,119,782 |
| Class I | | | | |
| Shares sold | 50,555,646 | 33,704,033 | $1,058,311,814 | $671,155,072 |
| Reinvestment of distributions | 3,478,382 | 94,656 | 73,471,142 | 1,516,743 |
| Shares redeemed | (26,168,822) | (11,618,016) | (534,982,261) | (228,753,739) |
| Net increase (decrease) | 27,865,206 | 22,180,673 | $596,800,695 | $443,918,076 |
| Class Z | | | | |
| Shares sold | 17,011,053 | 13,699,777 | $355,253,994 | $269,713,242 |
| Reinvestment of distributions | 1,279,957 | 47,848 | 27,023,961 | 752,829 |
| Shares redeemed | (7,709,768) | (4,281,250) | (159,818,550) | (82,409,832) |
| Net increase (decrease) | 10,581,242 | 9,466,375 | $222,459,405 | $188,056,239 |
11. Other.
A fund's organizational documents provide former and current trustees and officers with a limited indemnification against liabilities arising in connection with the performance of their duties to the fund. In the normal course of business, a fund may also enter into contracts that provide general indemnifications. A fund's maximum exposure under these arrangements is unknown as this would be dependent on future claims that may be made against a fund. The risk of material loss from such claims is considered remote.
12. Coronavirus (COVID-19) Pandemic.
An outbreak of COVID-19 first detected in China during December 2019 has since spread globally and was declared a pandemic by the World Health Organization during March 2020. Developments that disrupt global economies and financial markets, such as the COVID-19 pandemic, may magnify factors that affect the Fund's performance.
Report of Independent Registered Public Accounting Firm
To the Board of Trustees of Fidelity Securities Fund and Shareholders of Fidelity Small Cap Value Fund
Opinion on the Financial Statements
We have audited the accompanying statement of assets and liabilities, including the schedule of investments, of Fidelity Small Cap Value Fund (one of the funds constituting Fidelity Securities Fund, referred to hereafter as the “Fund”) as of July 31, 2022, the related statement of operations for the year ended July 31, 2022, the statement of changes in net assets for each of the two years in the period ended July 31, 2022, including the related notes, and the financial highlights for each of the periods indicated therein (collectively referred to as the “financial statements”). In our opinion, the financial statements present fairly, in all material respects, the financial position of the Fund as of July 31, 2022, the results of its operations for the year then ended, the changes in its net assets for each of the two years in the period ended July 31, 2022 and the financial highlights for each of the periods indicated therein in conformity with accounting principles generally accepted in the United States of America.
Basis for Opinion
These financial statements are the responsibility of the Fund’s management. Our responsibility is to express an opinion on the Fund’s financial statements based on our audits. We are a public accounting firm registered with the Public Company Accounting Oversight Board (United States) (PCAOB) and are required to be independent with respect to the Fund in accordance with the U.S. federal securities laws and the applicable rules and regulations of the Securities and Exchange Commission and the PCAOB.
We conducted our audits of these financial statements in accordance with the standards of the PCAOB. Those standards require that we plan and perform the audit to obtain reasonable assurance about whether the financial statements are free of material misstatement, whether due to error or fraud.
Our audits included performing procedures to assess the risks of material misstatement of the financial statements, whether due to error or fraud, and performing procedures that respond to those risks. Such procedures included examining, on a test basis, evidence regarding the amounts and disclosures in the financial statements. Our audits also included evaluating the accounting principles used and significant estimates made by management, as well as evaluating the overall presentation of the financial statements. Our procedures included confirmation of securities owned as of July 31, 2022 by correspondence with the custodian and brokers; when replies were not received from brokers, we performed other auditing procedures. We believe that our audits provide a reasonable basis for our opinion.
/s/ PricewaterhouseCoopers LLP
Boston, Massachusetts
September 14, 2022
We have served as the auditor of one or more investment companies in the Fidelity group of funds since 1932.
Trustees and Officers
The Trustees, Members of the Advisory Board (if any), and officers of the trust and fund, as applicable, are listed below. The Board of Trustees governs the fund and is responsible for protecting the interests of shareholders. The Trustees are experienced executives who meet periodically throughout the year to oversee the fund's activities, review contractual arrangements with companies that provide services to the fund, oversee management of the risks associated with such activities and contractual arrangements, and review the fund's performance. Except for Jonathan Chiel, each of the Trustees oversees 316 funds. Mr. Chiel oversees 184 funds.
The Trustees hold office without limit in time except that (a) any Trustee may resign; (b) any Trustee may be removed by written instrument, signed by at least two-thirds of the number of Trustees prior to such removal; (c) any Trustee who requests to be retired or who has become incapacitated by illness or injury may be retired by written instrument signed by a majority of the other Trustees; and (d) any Trustee may be removed at any special meeting of shareholders by a two-thirds vote of the outstanding voting securities of the trust. Each Trustee who is not an interested person (as defined in the 1940 Act) of the trust and the fund is referred to herein as an Independent Trustee. Each Independent Trustee shall retire not later than the last day of the calendar year in which his or her 75th birthday occurs. The Independent Trustees may waive this mandatory retirement age policy with respect to individual Trustees. Officers and Advisory Board Members hold office without limit in time, except that any officer or Advisory Board Member may resign or may be removed by a vote of a majority of the Trustees at any regular meeting or any special meeting of the Trustees. Except as indicated, each individual has held the office shown or other offices in the same company for the past five years.
The fund's Statement of Additional Information (SAI) includes more information about the Trustees. To request a free copy, call Fidelity at 1-800-544-8544 if you’re an individual investing directly with Fidelity, call 1-800-835-5092 if you’re a plan sponsor or participant with Fidelity as your recordkeeper or call 1-877-208-0098 on institutional accounts or if you’re an advisor or invest through one.
Experience, Skills, Attributes, and Qualifications of the Trustees. The Governance and Nominating Committee has adopted a statement of policy that describes the experience, qualifications, attributes, and skills that are necessary and desirable for potential Independent Trustee candidates (Statement of Policy). The Board believes that each Trustee satisfied at the time he or she was initially elected or appointed a Trustee, and continues to satisfy, the standards contemplated by the Statement of Policy. The Governance and Nominating Committee also engages professional search firms to help identify potential Independent Trustee candidates who have the experience, qualifications, attributes, and skills consistent with the Statement of Policy. From time to time, additional criteria based on the composition and skills of the current Independent Trustees, as well as experience or skills that may be appropriate in light of future changes to board composition, business conditions, and regulatory or other developments, have also been considered by the professional search firms and the Governance and Nominating Committee. In addition, the Board takes into account the Trustees' commitment and participation in Board and committee meetings, as well as their leadership of standing and ad hoc committees throughout their tenure.
In determining that a particular Trustee was and continues to be qualified to serve as a Trustee, the Board has considered a variety of criteria, none of which, in isolation, was controlling. The Board believes that, collectively, the Trustees have balanced and diverse experience, qualifications, attributes, and skills, which allow the Board to operate effectively in governing the fund and protecting the interests of shareholders. Information about the specific experience, skills, attributes, and qualifications of each Trustee, which in each case led to the Board's conclusion that the Trustee should serve (or continue to serve) as a trustee of the fund, is provided below.
Board Structure and Oversight Function. Robert A. Lawrence is an interested person and currently serves as Chair. The Trustees have determined that an interested Chair is appropriate and benefits shareholders because an interested Chair has a personal and professional stake in the quality and continuity of services provided to the fund. Independent Trustees exercise their informed business judgment to appoint an individual of their choosing to serve as Chair, regardless of whether the Trustee happens to be independent or a member of management. The Independent Trustees have determined that they can act independently and effectively without having an Independent Trustee serve as Chair and that a key structural component for assuring that they are in a position to do so is for the Independent Trustees to constitute a substantial majority for the Board. The Independent Trustees also regularly meet in executive session. David M. Thomas serves as Lead Independent Trustee and as such (i) acts as a liaison between the Independent Trustees and management with respect to matters important to the Independent Trustees and (ii) with management prepares agendas for Board meetings.
Fidelity® funds are overseen by different Boards of Trustees. The fund's Board oversees Fidelity's high income and certain equity funds, and other Boards oversee Fidelity's investment-grade bond, money market, asset allocation, and other equity funds. The asset allocation funds may invest in Fidelity® funds overseen by the fund's Board. The use of separate Boards, each with its own committee structure, allows the Trustees of each group of Fidelity® funds to focus on the unique issues of the funds they oversee, including common research, investment, and operational issues. On occasion, the separate Boards establish joint committees to address issues of overlapping consequences for the Fidelity® funds overseen by each Board.
The Trustees operate using a system of committees to facilitate the timely and efficient consideration of all matters of importance to the Trustees, the fund, and fund shareholders and to facilitate compliance with legal and regulatory requirements and oversight of the fund's activities and associated risks. The Board, acting through its committees, has charged FMR and its affiliates with (i) identifying events or circumstances the occurrence of which could have demonstrably adverse effects on the fund's business and/or reputation; (ii) implementing processes and controls to lessen the possibility that such events or circumstances occur or to mitigate the effects of such events or circumstances if they do occur; and (iii) creating and maintaining a system designed to evaluate continuously business and market conditions in order to facilitate the identification and implementation processes described in (i) and (ii) above. Because the day-to-day operations and activities of the fund are carried out by or through FMR, its affiliates, and other service providers, the fund's exposure to risks is mitigated but not eliminated by the processes overseen by the Trustees. While each of the Board's committees has responsibility for overseeing different aspects of the fund's activities, oversight is exercised primarily through the Operations, Audit, and Compliance Committees. Appropriate personnel, including but not limited to the fund's Chief Compliance Officer (CCO), FMR's internal auditor, the independent accountants, the fund's Treasurer and portfolio management personnel, make periodic reports to the Board's committees, as appropriate, including an annual review of Fidelity's risk management program for the Fidelity® funds. The responsibilities of each standing committee, including their oversight responsibilities, are described further under "Standing Committees of the Trustees."
Interested Trustees*:
Correspondence intended for a Trustee who is an interested person may be sent to Fidelity Investments, 245 Summer Street, Boston, Massachusetts 02210.
Name, Year of Birth; Principal Occupations and Other Relevant Experience+
Jonathan Chiel (1957)
Year of Election or Appointment: 2016
Trustee
Mr. Chiel also serves as Trustee of other Fidelity® funds. Mr. Chiel is Executive Vice President and General Counsel for FMR LLC (diversified financial services company, 2012-present). Previously, Mr. Chiel served as general counsel (2004-2012) and senior vice president and deputy general counsel (2000-2004) for John Hancock Financial Services; a partner with Choate, Hall & Stewart (1996-2000) (law firm); and an Assistant United States Attorney for the United States Attorney’s Office of the District of Massachusetts (1986-95), including Chief of the Criminal Division (1993-1995). Mr. Chiel is a director on the boards of the Boston Bar Foundation and the Maimonides School.
Bettina Doulton (1964)
Year of Election or Appointment: 2021
Trustee
Ms. Doulton also serves as Trustee of other Fidelity® funds. Prior to her retirement, Ms. Doulton served in a variety of positions at Fidelity Investments, including as a managing director of research (2006-2007), portfolio manager to certain Fidelity® funds (1993-2005), equity analyst and portfolio assistant (1990-1993), and research assistant (1987-1990). Ms. Doulton currently owns and operates Phi Builders + Architects and Cellardoor Winery. Previously, Ms. Doulton served as a member of the Board of Brown Capital Management, LLC (2014-2018).
Robert A. Lawrence (1952)
Year of Election or Appointment: 2020
Trustee
Chair of the Board of Trustees
Mr. Lawrence also serves as Trustee of other funds. Previously, Mr. Lawrence served as a Trustee and Member of the Advisory Board of certain funds. Prior to his retirement in 2008, Mr. Lawrence served as Vice President of certain Fidelity® funds (2006-2008), Senior Vice President, Head of High Income Division of Fidelity Management & Research Company (investment adviser firm, 2006-2008), and President of Fidelity Strategic Investments (investment adviser firm, 2002-2005).
* Determined to be an “Interested Trustee” by virtue of, among other things, his or her affiliation with the trust or various entities under common control with FMR.
+ The information includes the Trustee's principal occupation during the last five years and other information relating to the experience, attributes, and skills relevant to the Trustee's qualifications to serve as a Trustee, which led to the conclusion that the Trustee should serve as a Trustee for the fund.
Independent Trustees:
Correspondence intended for an Independent Trustee may be sent to Fidelity Investments, P.O. Box 55235, Boston, Massachusetts 02205-5235.
Name, Year of Birth; Principal Occupations and Other Relevant Experience+
Thomas P. Bostick (1956)
Year of Election or Appointment: 2021
Trustee
Lieutenant General Bostick also serves as Trustee of other Fidelity® funds. Prior to his retirement, General Bostick (United States Army, Retired) held a variety of positions within the U.S. Army, including Commanding General and Chief of Engineers, U.S. Army Corps of Engineers (2012-2016) and Deputy Chief of Staff and Director of Human Resources, U.S. Army (2009-2012). General Bostick currently serves as a member of the Board and Finance and Governance Committees of CSX Corporation (transportation, 2020-present) and a member of the Board and Corporate Governance and Nominating Committee of Perma-Fix Environmental Services, Inc. (nuclear waste management, 2020-present). General Bostick serves as Chief Executive Officer of Bostick Global Strategies, LLC (consulting, 2016-present) and as a member of the Board of HireVue, Inc. (video interview and assessment, 2020-present). Previously, General Bostick served as a Member of the Advisory Board of certain Fidelity® funds (2021), President, Intrexon Bioengineering (2018-2020) and Chief Operating Officer (2017-2020) and Senior Vice President of the Environment Sector (2016-2017) of Intrexon Corporation (biopharmaceutical company).
Dennis J. Dirks (1948)
Year of Election or Appointment: 2005
Trustee
Mr. Dirks also serves as Trustee of other Fidelity® funds. Prior to his retirement in May 2003, Mr. Dirks served as Chief Operating Officer and as a member of the Board of The Depository Trust & Clearing Corporation (financial markets infrastructure), President, Chief Operating Officer and a member of the Board of The Depository Trust Company (DTC), President and a member of the Board of the National Securities Clearing Corporation (NSCC), Chief Executive Officer and a member of the Board of the Government Securities Clearing Corporation and Chief Executive Officer and a member of the Board of the Mortgage-Backed Securities Clearing Corporation. Mr. Dirks currently serves as a member of the Finance Committee (2016-present) and Board (2017-present) and is Treasurer (2018-present) of the Asolo Repertory Theatre.
Donald F. Donahue (1950)
Year of Election or Appointment: 2018
Trustee
Mr. Donahue also serves as Trustee of other Fidelity® funds. Mr. Donahue serves as President and Chief Executive Officer of Miranda Partners, LLC (risk consulting for the financial services industry, 2012-present). Previously, Mr. Donahue served as Chief Executive Officer (2006-2012), Chief Operating Officer (2003-2006) and Managing Director, Customer Marketing and Development (1999-2003) of The Depository Trust & Clearing Corporation (financial markets infrastructure). Mr. Donahue currently serves as a member (2007-present) and Co-Chairman (2016-present) of the Board of United Way of New York and a member of the Board of The Leadership Academy (previously NYC Leadership Academy) (2012-present). Mr. Donahue previously served as a member of the Advisory Board of certain Fidelity® funds (2015-2018).
Vicki L. Fuller (1957)
Year of Election or Appointment: 2020
Trustee
Ms. Fuller also serves as Trustee of other Fidelity® funds. Previously, Ms. Fuller served as a member of the Advisory Board of certain Fidelity® funds (2018-2020), Chief Investment Officer of the New York State Common Retirement Fund (2012-2018) and held a variety of positions at AllianceBernstein L.P. (global asset management, 1985-2012), including Managing Director (2006-2012) and Senior Vice President and Senior Portfolio Manager (2001-2006). Ms. Fuller currently serves as a member of the Board, Audit Committee and Nominating and Governance Committee of two Blackstone business development companies (2020-present), as a member of the Board of Treliant, LLC (consulting, 2019-present), as a member of the Advisory Board of Ariel Alternatives, LLC (private equity, 2021-present) and as a member of the Board and Chair of the Audit Committee of Gusto, Inc. (software, 2021-present). In addition, Ms. Fuller currently serves as a member of the Board of Roosevelt University (2019-present) and as a member of the Executive Board of New York University’s Stern School of Business. Ms. Fuller previously served as a member of the Board, Audit Committee and Nominating and Governance Committee of The Williams Companies, Inc. (natural gas infrastructure, 2018-2021).
Patricia L. Kampling (1959)
Year of Election or Appointment: 2020
Trustee
Ms. Kampling also serves as Trustee of other Fidelity® funds. Prior to her retirement, Ms. Kampling served as Chairman of the Board and Chief Executive Officer (2012-2019), President and Chief Operating Officer (2011-2012) and Executive Vice President and Chief Financial Officer (2010-2011) of Alliant Energy Corporation. Ms. Kampling currently serves as a member of the Board, Finance Committee and Governance, Compensation and Nominating Committee of Xcel Energy Inc. (utilities company, 2020-present) and as a member of the Board, Audit, Finance and Risk Committee and Safety, Environmental, Technology and Operations Committee and Chair of the Executive Development and Compensation Committee of American Water Works Company, Inc. (utilities company, 2019-present). In addition, Ms. Kampling currently serves as a member of the Board of the Nature Conservancy, Wisconsin Chapter (2019-present). Previously, Ms. Kampling served as a Member of the Advisory Board of certain Fidelity® funds (2020), a member of the Board, Compensation Committee and Executive Committee and Chair of the Audit Committee of Briggs & Stratton Corporation (manufacturing, 2011-2021), a member of the Board of Interstate Power and Light Company (2012-2019) and Wisconsin Power and Light Company (2012-2019) (each a subsidiary of Alliant Energy Corporation) and as a member of the Board and Workforce Development Committee of the Business Roundtable (2018-2019).
Thomas A. Kennedy (1955)
Year of Election or Appointment: 2021
Trustee
Mr. Kennedy also serves as Trustee of other Fidelity® funds. Previously, Mr. Kennedy served as a Member of the Advisory Board of certain Fidelity® funds (2020) and held a variety of positions at Raytheon Company (aerospace and defense, 1983-2020), including Chairman and Chief Executive Officer (2014-2020) and Executive Vice President and Chief Operating Officer (2013-2014). Mr. Kennedy currently serves as Executive Chairman of the Board of Directors of Raytheon Technologies Corporation (aerospace and defense, 2020-present). He is also a member of the Rutgers School of Engineering Industry Advisory Board (2011-present) and a member of the UCLA Engineering Dean’s Executive Board (2016-present).
Oscar Munoz (1959)
Year of Election or Appointment: 2021
Trustee
Mr. Munoz also serves as Trustee of other Fidelity® funds. Prior to his retirement, Mr. Munoz served as Executive Chairman (2020-2021), Chief Executive Officer (2015-2020), President (2015-2016) and a member of the Board (2010-2021) of United Airlines Holdings, Inc. Mr. Munoz currently serves as a member of the Board of CBRE Group, Inc. (commercial real estate, 2020-present), a member of the Board of Univision Communications, Inc. (Hispanic media, 2020-present) and a member of the Advisory Board of Salesforce.com, Inc. (cloud-based software, 2020-present). Previously, Mr. Munoz served as a Member of the Advisory Board of certain Fidelity® funds (2021).
Garnett A. Smith (1947)
Year of Election or Appointment: 2018
Trustee
Mr. Smith also serves as Trustee of other Fidelity® funds. Prior to his retirement, Mr. Smith served as Chairman and Chief Executive Officer (1990-1997) and President (1986-1990) of Inbrand Corp. (manufacturer of personal absorbent products). Prior to his employment with Inbrand Corp., he was employed by a retail fabric chain and North Carolina National Bank (now Bank of America). Mr. Smith previously served as a member of the Advisory Board of certain Fidelity® funds (2012-2013).
David M. Thomas (1949)
Year of Election or Appointment: 2008
Trustee
Lead Independent Trustee
Mr. Thomas also serves as Trustee of other Fidelity® funds. Previously, Mr. Thomas served as Executive Chairman (2005-2006) and Chairman and Chief Executive Officer (2000-2005) of IMS Health, Inc. (pharmaceutical and healthcare information solutions). Mr. Thomas currently serves as a member of the Board of Fortune Brands Home and Security (home and security products, 2004-present) and as Director (2013-present) and Non-Executive Chairman of the Board (2022-present) of Interpublic Group of Companies, Inc. (marketing communication).
Susan Tomasky (1953)
Year of Election or Appointment: 2020
Trustee
Ms. Tomasky also serves as Trustee of other Fidelity® funds. Prior to her retirement, Ms. Tomasky served in various executive officer positions at American Electric Power Company, Inc. (1998-2011), including most recently as President of AEP Transmission (2007-2011). Ms. Tomasky currently serves as a member of the Board and Sustainability Committee and as Chair of the Audit Committee of Marathon Petroleum Corporation (2018-present) and as a member of the Board, Executive Committee, Corporate Governance Committee and Organization and Compensation Committee and as Chair of the Audit Committee of Public Service Enterprise Group, Inc. (utilities company, 2012-present) and as a member of the Board of its subsidiary company, Public Service Electric and Gas Co. (2021-present). In addition, Ms. Tomasky currently serves as a member (2009-present) and President (2020-present) of the Board of the Royal Shakespeare Company – America (2009-present), as a member of the Board of the Columbus Association for the Performing Arts (2011-present) and as a member of the Board and Kenyon in the World Committee of Kenyon College (2016-present). Previously, Ms. Tomasky served as a Member of the Advisory Board of certain Fidelity® funds (2020), as a member of the Board of the Columbus Regional Airport Authority (2007-2020), as a member of the Board (2011-2018) and Lead Independent Director (2015-2018) of Andeavor Corporation (previously Tesoro Corporation) (independent oil refiner and marketer) and as a member of the Board of Summit Midstream Partners LP (energy, 2012-2018).
Michael E. Wiley (1950)
Year of Election or Appointment: 2020
Trustee
Mr. Wiley also serves as Trustee of other Fidelity® funds. Previously, Mr. Wiley served as a member of the Advisory Board of certain Fidelity® funds (2018-2020), Chairman, President and CEO of Baker Hughes, Inc. (oilfield services, 2000-2004). Mr. Wiley also previously served as a member of the Board of Andeavor Corporation (independent oil refiner and marketer, 2005-2018), a member of the Board of Andeavor Logistics LP (natural resources logistics, 2015-2018) and a member of the Board of High Point Resources (exploration and production, 2005-2020).
+ The information includes the Trustee's principal occupation during the last five years and other information relating to the experience, attributes, and skills relevant to the Trustee's qualifications to serve as a Trustee, which led to the conclusion that the Trustee should serve as a Trustee for the fund.
Advisory Board Members and Officers:
Correspondence intended for a Member of the Advisory Board (if any) may be sent to Fidelity Investments, P.O. Box 55235, Boston, Massachusetts 02205-5235. Correspondence intended for an officer or Peter S. Lynch may be sent to Fidelity Investments, 245 Summer Street, Boston, Massachusetts 02210. Officers appear below in alphabetical order.
Name, Year of Birth; Principal Occupation
Peter S. Lynch (1944)
Year of Election or Appointment: 2003
Member of the Advisory Board
Mr. Lynch also serves as a Member of the Advisory Board of other Fidelity® funds. Mr. Lynch is Vice Chairman and a Director of Fidelity Management & Research Company LLC (investment adviser firm). In addition, Mr. Lynch serves as a Trustee of Boston College and as the Chairman of the Inner-City Scholarship Fund. Previously, Mr. Lynch served as Vice Chairman and a Director of FMR Co., Inc. (investment adviser firm) and on the Special Olympics International Board of Directors (1997-2006).
Craig S. Brown (1977)
Year of Election or Appointment: 2019
Assistant Treasurer
Mr. Brown also serves as an officer of other funds. Mr. Brown serves as Assistant Treasurer of FIMM, LLC (2021-present) and is an employee of Fidelity Investments (2013-present).
John J. Burke III (1964)
Year of Election or Appointment: 2018
Chief Financial Officer
Mr. Burke also serves as Chief Financial Officer of other funds. Mr. Burke serves as Head of Investment Operations for Fidelity Fund and Investment Operations (2018-present) and is an employee of Fidelity Investments (1998-present). Previously Mr. Burke served as head of Asset Management Investment Operations (2012-2018).
William C. Coffey (1969)
Year of Election or Appointment: 2019
Assistant Secretary
Mr. Coffey also serves as Assistant Secretary of other funds. He is Senior Vice President and Deputy General Counsel of FMR LLC (diversified financial services company, 2010-present), and is an employee of Fidelity Investments. Previously, Mr. Coffey served as Secretary and CLO of certain funds (2018-2019); CLO, Secretary, and Senior Vice President of Fidelity Management & Research Company and FMR Co., Inc. (investment adviser firms, 2018-2019); Secretary of Fidelity SelectCo, LLC and Fidelity Investments Money Management, Inc. (investment adviser firms, 2018-2019); CLO of Fidelity Management & Research (Hong Kong) Limited, FMR Investment Management (UK) Limited, and Fidelity Management & Research (Japan) Limited (investment adviser firms, 2018-2019); and Assistant Secretary of certain funds (2009-2018).
Timothy M. Cohen (1969)
Year of Election or Appointment: 2018
Vice President
Mr. Cohen also serves as Vice President of other funds. Mr. Cohen serves as Co-Head of Equity (2018-present), a Director of Fidelity Management & Research (Japan) Limited (investment adviser firm, 2016-present), and is an employee of Fidelity Investments. Previously, Mr. Cohen served as Executive Vice President of Fidelity SelectCo, LLC (2019), Head of Global Equity Research (2016-2018), Chief Investment Officer - Equity and a Director of Fidelity Management & Research (U.K.) Inc. (investment adviser firm, 2013-2015) and as a Director of Fidelity Management & Research (Hong Kong) Limited (investment adviser firm, 2017).
Jonathan Davis (1968)
Year of Election or Appointment: 2010
Assistant Treasurer
Mr. Davis also serves as an officer of other funds. Mr. Davis serves as Assistant Treasurer of FIMM, LLC (2021-present), FMR Capital, Inc. (2017-present), FD Funds GP LLC (2021-present), FD Funds Holding LLC (2021-present), and FD Funds Management LLC (2021-present); and is an employee of Fidelity Investments. Previously, Mr. Davis served as Vice President and Associate General Counsel of FMR LLC (diversified financial services company, 2003-2010).
Laura M. Del Prato (1964)
Year of Election or Appointment: 2018
Assistant Treasurer
Ms. Del Prato also serves as an officer of other funds. Ms. Del Prato serves as Assistant Treasurer of FIMM, LLC (2021-present) and is an employee of Fidelity Investments (2017-present). Previously, Ms. Del Prato served as President and Treasurer of The North Carolina Capital Management Trust: Cash Portfolio and Term Portfolio (2018-2020). Prior to joining Fidelity Investments, Ms. Del Prato served as a Managing Director and Treasurer of the JPMorgan Mutual Funds (2014-2017). Prior to JPMorgan, Ms. Del Prato served as a partner at Cohen Fund Audit Services (accounting firm, 2012-2013) and KPMG LLP (accounting firm, 2004-2012).
Colm A. Hogan (1973)
Year of Election or Appointment: 2020
Assistant Treasurer
Mr. Hogan also serves as an officer of other funds. Mr. Hogan serves as Assistant Treasurer of FIMM, LLC (2021-present) and FMR Capital, Inc. (2017-present) and is an employee of Fidelity Investments (2005-present). Previously, Mr. Hogan served as Deputy Treasurer of certain Fidelity® funds (2016-2020) and Assistant Treasurer of certain Fidelity® funds (2016-2018).
Pamela R. Holding (1964)
Year of Election or Appointment: 2018
Vice President
Ms. Holding also serves as Vice President of other funds. Ms. Holding serves as Co-Head of Equity (2018-present) and is an employee of Fidelity Investments (2013-present). Previously, Ms. Holding served as Executive Vice President of Fidelity SelectCo, LLC (2019) and as Chief Investment Officer of Fidelity Institutional Asset Management (2013-2018).
Cynthia Lo Bessette (1969)
Year of Election or Appointment: 2019
Secretary and Chief Legal Officer (CLO)
Ms. Lo Bessette also serves as an officer of other funds. Ms. Lo Bessette serves as CLO, Secretary, and Senior Vice President of Fidelity Management & Research Company LLC (investment adviser firm, 2019-present); CLO of Fidelity Management & Research (Hong Kong) Limited, FMR Investment Management (UK) Limited, and Fidelity Management & Research (Japan) Limited (investment adviser firms, 2019-present); Secretary of FD Funds GP LLC (2021-present), FD Funds Holding LLC (2021-present), and FD Funds Management LLC (2021-present); and Assistant Secretary of FIMM, LLC (2019-present). She is a Senior Vice President and Deputy General Counsel of FMR LLC (diversified financial services company, 2019-present), and is an employee of Fidelity Investments. Previously, Ms. Lo Bessette served as CLO, Secretary, and Senior Vice President of FMR Co., Inc. (investment adviser firm, 2019); Secretary of Fidelity SelectCo, LLC and Fidelity Investments Money Management, Inc. (investment adviser firms, 2019). Prior to joining Fidelity Investments, Ms. Lo Bessette was Executive Vice President, General Counsel (2016-2019) and Senior Vice President, Deputy General Counsel (2015-2016) of OppenheimerFunds (investment management company) and Deputy Chief Legal Officer (2013-2015) of Jennison Associates LLC (investment adviser firm).
Chris Maher (1972)
Year of Election or Appointment: 2020
Deputy Treasurer
Mr. Maher also serves as an officer of other funds. Mr. Maher serves as Assistant Treasurer of FIMM, LLC (2021-present) and FMR Capital, Inc. (2017-present), and is an employee of Fidelity Investments (2008-present). Previously, Mr. Maher served as Assistant Treasurer of certain funds (2013-2020); Vice President of Asset Management Compliance (2013), Vice President of the Program Management Group of FMR (investment adviser firm, 2010-2013), and Vice President of Valuation Oversight (2008-2010).
Jason P. Pogorelec (1975)
Year of Election or Appointment: 2020
Chief Compliance Officer
Mr. Pogorelec also serves as Chief Compliance Officer of other funds. Mr. Pogorelec is a senior Vice President of Asset Management Compliance for Fidelity Investments and is an employee of Fidelity Investments (2006-present). Previously, Mr. Pogorelec served as Vice President, Associate General Counsel for Fidelity Investments (2010-2020) and Assistant Secretary of certain Fidelity funds (2015-2020).
Brett Segaloff (1972)
Year of Election or Appointment: 2021
Anti-Money Laundering (AML) Officer
Mr. Segaloff also serves as an AML Officer of other funds and other related entities. He is Director, Anti-Money Laundering (2007-present) of FMR LLC (diversified financial services company) and is an employee of Fidelity Investments (1996-present).
Stacie M. Smith (1974)
Year of Election or Appointment: 2016
President and Treasurer
Ms. Smith also serves as an officer of other funds. Ms. Smith serves as Assistant Treasurer of FIMM, LLC (2021-present) and FMR Capital, Inc. (2017-present), is an employee of Fidelity Investments (2009-present), and has served in other fund officer roles. Prior to joining Fidelity Investments, Ms. Smith served as Senior Audit Manager of Ernst & Young LLP (accounting firm, 1996-2009). Previously, Ms. Smith served as Assistant Treasurer (2013-2019) and Deputy Treasurer (2013-2016) of certain Fidelity® funds.
Jim Wegmann (1979)
Year of Election or Appointment: 2019
Assistant Treasurer
Mr. Wegmann also serves as an officer of other funds. Mr. Wegmann serves as Assistant Treasurer of FIMM, LLC (2021-present) and is an employee of Fidelity Investments (2011-present). Previously, Mr. Wegmann served as Assistant Treasurer of certain Fidelity® funds (2019-2021).
Shareholder Expense Example
As a shareholder, you incur two types of costs: (1) transaction costs, which may include sales charges (loads) on purchase payments or redemption proceeds, as applicable and (2) ongoing costs, which generally include management fees, distribution and/or service (12b-1) fees and other Fund expenses. This Example is intended to help you understand your ongoing costs (in dollars) of investing in a fund and to compare these costs with the ongoing costs of investing in other mutual funds.
The Example is based on an investment of $1,000 invested at the beginning of the period and held for the entire period (February 1, 2022 to July 31, 2022).
Actual Expenses
The first line of the accompanying table provides information about actual account values and actual expenses. You may use the information in this line, together with the amount you invested, to estimate the expenses that you paid over the period. Simply divide your account value by $1,000.00 (for example, an $8,600 account value divided by $1,000.00 = 8.6), then multiply the result by the number in the first line for a class/Fund under the heading entitled "Expenses Paid During Period" to estimate the expenses you paid on your account during this period. If any fund is a shareholder of any underlying mutual funds or exchange-traded funds (ETFs) (the Underlying Funds), such fund indirectly bears its proportional share of the expenses of the Underlying Funds in addition to the direct expenses incurred presented in the table. These fees and expenses are not included in the annualized expense ratio used to calculate the expense estimate in the table below.
Hypothetical Example for Comparison Purposes
The second line of the accompanying table provides information about hypothetical account values and hypothetical expenses based on the actual expense ratio and an assumed rate of return of 5% per year before expenses, which is not the actual return. The hypothetical account values and expenses may not be used to estimate the actual ending account balance or expenses you paid for the period. You may use this information to compare the ongoing costs of investing in the Fund and other funds. To do so, compare this 5% hypothetical example with the 5% hypothetical examples that appear in the shareholder reports of the other funds. If any fund is a shareholder of any Underlying Funds, such fund indirectly bears its proportional share of the expenses of the Underlying Funds in addition to the direct expenses as presented in the table. These fees and expenses are not included in the annualized expense ratio used to calculate the expense estimate in the table below.
Please note that the expenses shown in the table are meant to highlight your ongoing costs only and do not reflect any transaction costs. Therefore, the second line of the table is useful in comparing ongoing costs only, and will not help you determine the relative total costs of owning different funds. In addition, if these transactional costs were included, your costs would have been higher.
| | Annualized Expense Ratio-A | Beginning
Account Value
February 1, 2022 | Ending
Account Value
July 31, 2022 | Expenses Paid
During Period-B
February 1, 2022
to July 31, 2022 |
| Fidelity Small Cap Value Fund | | | | |
| Class A | 1.26% | | | |
| Actual | | $1,000.00 | $942.40 | $6.07 |
| Hypothetical-C | | $1,000.00 | $1,018.55 | $6.31 |
| Class M | 1.50% | | | |
| Actual | | $1,000.00 | $941.20 | $7.22 |
| Hypothetical-C | | $1,000.00 | $1,017.36 | $7.50 |
| Class C | 2.02% | | | |
| Actual | | $1,000.00 | $938.70 | $9.71 |
| Hypothetical-C | | $1,000.00 | $1,014.78 | $10.09 |
| Small Cap Value | .99% | | | |
| Actual | | $1,000.00 | $943.90 | $4.77 |
| Hypothetical-C | | $1,000.00 | $1,019.89 | $4.96 |
| Class I | .99% | | | |
| Actual | | $1,000.00 | $943.90 | $4.77 |
| Hypothetical-C | | $1,000.00 | $1,019.89 | $4.96 |
| Class Z | .86% | | | |
| Actual | | $1,000.00 | $944.40 | $4.15 |
| Hypothetical-C | | $1,000.00 | $1,020.53 | $4.31 |
A Annualized expense ratio reflects expenses net of applicable fee waivers.
B Expenses are equal to the annualized expense ratio, multiplied by the average account value over the period, multiplied by 181/ 365 (to reflect the one-half year period). The fees and expenses of any Underlying Funds are not included in each annualized expense ratio.
C 5% return per year before expenses
Distributions (Unaudited)
The dividend and capital gains distributions for the fund are available on Fidelity.com or Institutional.Fidelity.com.
The fund hereby designates as a capital gain dividend with respect to the taxable year ended July 31, 2022, $367,864,242, or, if subsequently determined to be different, the net capital gain of such year.
The fund designates 100% of the short-term capital gain dividends distributed on September 3, 2021, and December 17, 2021, as qualifying to be taxed as short-term capital gain dividends for nonresident alien shareholders.
A percentage of the dividends distributed during the fiscal year qualify for the dividends–received deduction for corporate shareholders:
| | Class A | Class M | Class C | Small Cap Value | Class I | Class Z |
| September 3, 2021 | 13% | 14% | 15% | 13% | 13% | 12% |
| December 17, 2021 | 21% | 23% | 25% | 20% | 20% | 20% |
| December 28, 2021 | 20% | 20% | 20% | 20% | 20% | 20% |
|
A percentage of the dividends distributed during the fiscal year as amounts which may be taken into account as a dividend for purposes of the maximum rate under section 1(h)(11) of the Internal Revenue Code:
| | Class A | Class M | Class C | Small Cap Value | Class I | Class Z |
| September 3, 2021 | 28% | 30% | 32% | 27% | 27% | 27% |
| December 17, 2021 | 31% | 33% | 35% | 29% | 29% | 28% |
| December 28, 2021 | 29% | 29% | 29% | 29% | 29% | 29% |
| | | | | | | |
A percentage of the dividends distributed during the fiscal year qualify as a section 199A dividend:
| | Class A | Class M | Class C | Small Cap Value | Class I | Class Z |
| September 3, 2021 | 1% | 1% | 1% | 1% | 1% | 1% |
| December 17, 2021 | 3% | 3% | 3% | 3% | 3% | 3% |
| December 28, 2021 | 3% | 3% | 3% | 3% | 3% | 3% |
| | | | | | | |
The fund will notify shareholders in January 2023 of amounts for use in preparing 2022 income tax returns.
Board Approval of Investment Advisory Contracts and Management Fees
Fidelity Small Cap Value Fund
Each year, the Board of Trustees, including the Independent Trustees (together, the Board), votes on the renewal of the management contract with Fidelity Management & Research Company LLC (FMR) and the sub-advisory agreements (together, the Advisory Contracts) for the fund. FMR and the sub-advisers are referred to herein as the Investment Advisers. The Board, assisted by the advice of fund counsel and Independent Trustees' counsel, requests and considers a broad range of information relevant to the renewal of the Advisory Contracts throughout the year.
The Board meets regularly and, at each of its meetings, covers an extensive agenda of topics and materials and considers factors that are relevant to its annual consideration of the renewal of the fund's Advisory Contracts, including the services and support provided to the fund and its shareholders. The Board has established various standing committees (Committees), each composed of and chaired by Independent Trustees with varying backgrounds, to which the Board has assigned specific subject matter responsibilities in order to enhance effective decision-making by the Board. The Board, acting directly and through its Committees, requests and receives information concerning the annual consideration of the renewal of the fund's Advisory Contracts. The Board also meets as needed to review matters specifically related to the Board's annual consideration of the renewal of the Advisory Contracts. Members of the Board may also meet with trustees of other Fidelity funds through joint ad hoc committees to discuss certain matters relevant to all of the Fidelity funds.
At its May 2022 meeting, the Board unanimously determined to renew the fund's Advisory Contracts. In reaching its determination, the Board considered all factors it believed relevant, including (i) the nature, extent, and quality of the services provided to the fund and its shareholders (including the investment performance of the fund); (ii) the competitiveness relative to peer funds of the fund's management fee and total expense ratio of a representative class (retail class); (iii) the total costs of the services provided by and the profits realized by Fidelity from its relationships with the fund; and (iv) the extent to which, if any, economies of scale exist and are realized as the fund grows, and whether any economies of scale are appropriately shared with fund shareholders.
In considering whether to renew the Advisory Contracts for the fund, the Board reached a determination, with the assistance of fund counsel and Independent Trustees' counsel and through the exercise of its business judgment, that the renewal of the Advisory Contracts was in the best interests of the fund and its shareholders and that the compensation payable under the Advisory Contracts was fair and reasonable. The Board's decision to renew the Advisory Contracts was not based on any single factor, but rather was based on a comprehensive consideration of all the information provided to the Board at its meetings throughout the year. The Board, in reaching its determination to renew the Advisory Contracts, was aware that shareholders of the fund have a broad range of investment choices available to them, including a wide choice among funds offered by Fidelity's competitors, and that the fund's shareholders, who have the opportunity to review and weigh the disclosure provided by the fund in its prospectus and other public disclosures, have chosen to invest in this fund, which is part of the Fidelity family of funds.
Nature, Extent, and Quality of Services Provided. The Board considered Fidelity's staffing as it relates to the fund, including the backgrounds of investment personnel of Fidelity, and also considered the fund's investment objective, strategies, and related investment philosophy. The Independent Trustees also had discussions with senior management of Fidelity's investment operations and investment groups. The Board considered the structure of the investment personnel compensation program and whether this structure provides appropriate incentives to act in the best interests of the fund. Additionally, the Board considered the portfolio managers' investments, if any, in the funds that they manage. The Board also considered the steps Fidelity had taken to ensure the continued provision of high quality services to the Fidelity funds during the COVID-19 pandemic, including the expansion of staff in client facing positions to maintain service levels in periods of high volumes and volatility.
Resources Dedicated to Investment Management and Support Services. The Board and the Fund Oversight and Research Committees reviewed the general qualifications and capabilities of Fidelity's investment staff, including its size, education, experience, and resources, as well as Fidelity's approach to recruiting, training, managing, and compensating investment personnel. The Board noted the resources devoted to expansion of Fidelity's global investment organization, and that Fidelity's analysts have extensive resources, tools, and capabilities that allow them to conduct sophisticated quantitative and fundamental analysis, as well as credit analysis of issuers, counterparties, and guarantors. Further, the Board considered that Fidelity's investment professionals have sufficient access to global information and data so as to provide competitive investment results over time, and that those professionals also have access to sophisticated tools that permit them to assess portfolio construction and risk and performance attribution characteristics continuously, as well as to transmit new information and research conclusions rapidly around the world. Additionally, in its deliberations, the Board considered Fidelity's trading, risk management, compliance, and technology and operations capabilities and resources, which are integral parts of the investment management process.
Shareholder and Administrative Services. The Board considered (i) the nature, extent, quality, and cost of advisory, administrative, and shareholder services performed by the Investment Advisers and their affiliates under the Advisory Contracts and under separate agreements covering transfer agency, pricing and bookkeeping, and securities lending services for the fund; (ii) the nature and extent of the supervision of third party service providers, principally custodians, subcustodians, and pricing vendors; and (iii) the resources devoted to, and the record of compliance with, the fund's compliance policies and procedures. The Board also reviewed the allocation of fund brokerage, including allocations to brokers affiliated with the Investment Advisers, the use of brokerage commissions to pay fund expenses, and the use of "soft" commission dollars to pay for research services.
The Board noted that the growth of fund assets over time across the complex allows Fidelity to reinvest in the development of services designed to enhance the value and convenience of the Fidelity funds as investment vehicles. These services include 24-hour access to account information and market information over the Internet and through telephone representatives, investor education materials, and asset allocation tools. The Board also considered that it reviews customer service metrics such as telephone response times, continuity of services on the website and metrics addressing services at Fidelity Investor Centers.
Investment in a Large Fund Family. The Board considered the benefits to shareholders of investing in a Fidelity fund, including the benefits of investing in a fund that is part of a large family of funds offering a variety of investment disciplines and providing a large variety of mutual fund investor services. The Board noted that Fidelity had taken, or had made recommendations that resulted in the Fidelity funds taking, a number of actions over the previous year that benefited particular funds, including: (i) continuing to dedicate additional resources to Fidelity's investment research process, which includes meetings with management of issuers of securities in which the funds invest; (ii) continuing efforts to enhance Fidelity's global research capabilities; (iii) launching new funds and ETFs with innovative structures, strategies and pricing and making other enhancements to meet client needs; (iv) launching new share classes of existing funds; (v) eliminating purchase minimums and broadening eligibility requirements for certain funds and share classes; (vi) reducing management fees and total expenses for certain target date funds and classes and index funds; (vii) lowering expenses for certain existing funds and classes by implementing or lowering expense caps; (viii) rationalizing product lines and gaining increased efficiencies from fund mergers and liquidations; (ix) continuing to develop, acquire and implement systems and technology to improve services to the funds and shareholders, strengthen information security, and increase efficiency; and (x) continuing to implement enhancements to further strengthen Fidelity's product line to increase investors' probability of success in achieving their investment goals, including retirement income goals.
Investment Performance. The Board considered whether the fund has operated in accordance with its investment objective, as well as its record of compliance with its investment restrictions and its performance history. The Board noted that the fund had a portfolio manager change in January 2021 and May 2021. The Board will continue to monitor closely the fund's performance, taking into account the portfolio manager changes.
The Board took into account discussions that occur at Board meetings throughout the year with representatives of the Investment Advisers about fund investment performance. In this regard the Board noted that as part of regularly scheduled fund reviews and other reports to the Board on fund performance, the Board considers annualized return information for the fund for different time periods, measured against an appropriate securities market index (benchmark index) and an appropriate peer group of funds with similar objectives (peer group). The Board also reviews and considers information about performance attribution. In its evaluation of fund investment performance, the Board gave particular attention to information indicating changes in performance of certain Fidelity funds for specific time periods and discussed with the Investment Advisers the reasons for any overperformance or underperformance.
In addition to reviewing absolute and relative fund performance, the Independent Trustees periodically consider the appropriateness of fund performance metrics in evaluating the results achieved. In general, the Independent Trustees believe that fund performance should be evaluated based on net performance (after fees and expenses) of the representative class, compared to appropriate benchmark indices, over appropriate time periods that may include full market cycles, and compared to peer groups, as applicable, over the same periods, taking into account relevant factors including the following: general market conditions; issuer-specific information; and fund cash flows and other factors.
The Independent Trustees recognize that shareholders evaluate performance on a net basis over their own holding periods, for which one-, three-, and five-year periods are often used as a proxy. For this reason, the performance information reviewed by the Board also included net cumulative total return information for the fund and an appropriate benchmark index and peer group for the most recent one-, three-, and five-year periods ended September 30, 2021, as shown below. Returns are shown compared to the 25th percentile (top of box, 75% beaten) and 75th percentile (bottom of box, 25% beaten) of the peer universe.
Fidelity Small Cap Value Fund
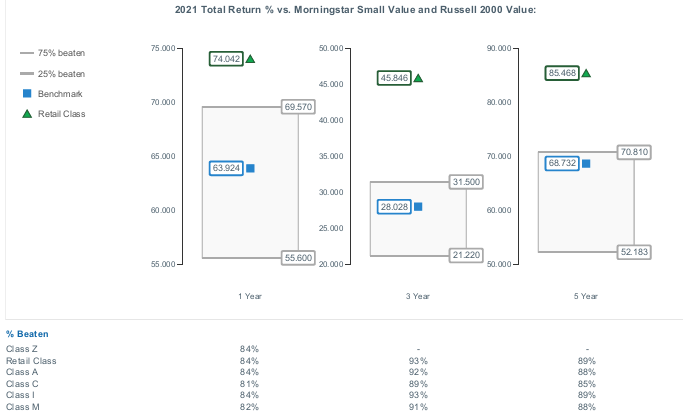
The Board also considered that the fund's management fee is subject to upward or downward adjustment depending upon whether, and to what extent, the fund's investment performance for the performance period (a rolling 36-month period) exceeds, or is exceeded by, a securities index, thus leading to a performance adjustment for the same period. The Board noted that the performance adjustment provides FMR with a strong economic incentive to seek to achieve superior long-term performance for the fund's shareholders and helps to more closely align the interests of FMR and the shareholders of the fund.
Based on its review, the Board concluded that the nature, extent, and quality of services provided to the fund under the Advisory Contracts should continue to benefit the shareholders of the fund.
Competitiveness of Management Fee and Total Expense Ratio. The Board considered the fund's management fee and total expense ratio compared to "mapped groups" of competitive funds and classes created for the purpose of facilitating the Trustees' competitive analysis of management fees and total expenses. Fidelity creates "mapped groups" by combining similar Lipper investment objective categories that have comparable investment mandates. Combining Lipper investment objective categories aids the Board's management fee and total expense ratio comparisons by broadening the competitive group used for comparison.
Management Fee. The Board considered two proprietary management fee comparisons for the 12-month periods ended September 30 (June 30 for periods ended 2019 and 2018 and December 31 for periods prior to 2018) shown in basis points (BP) in the chart below. The group of Lipper funds used by the Board for management fee comparisons is referred to below as the "Total Mapped Group." The Total Mapped Group comparison focuses on a fund's standing in terms of gross management fees before expense reimbursements or caps, and without giving effect to the fund's performance adjustment, relative to the total universe of funds with comparable investment mandates, regardless of whether their management fee structures also are comparable. Funds with comparable investment mandates offer exposure to similar types of securities. Funds with comparable management fee structures have similar management fee contractual arrangements (
e.g., flat rate charged for advisory services, all-inclusive fee rate,
etc.). "TMG %" represents the percentage of funds in the Total Mapped Group that had management fees that were lower than the fund's. For example, a hypothetical TMG % of 20% would mean that 80% of the funds in the Total Mapped Group had higher, and 20% had lower, management fees than the fund. The fund's actual TMG %s and the number of funds in the Total Mapped Group are in the chart below. The "Asset-Sized Peer Group" (ASPG) comparison focuses on a fund's standing relative to a subset of non-Fidelity funds within the Total Mapped Group that are similar in size and management fee structure without taking into account performance adjustments, if any. For example, if a fund is in the first quartile of the ASPG, the fund's management fee ranks in the least expensive or lowest 25% of funds in the ASPG. The ASPG represents at least 15% of the funds in the Total Mapped Group with comparable asset size and management fee structures, subject to a minimum of 50 funds (or all funds in the Total Mapped Group if fewer than 50). Additional information, such as the ASPG quartile in which the fund's management fee rate ranked and the impact of the fund's performance adjustment, is also included in the chart and was considered by the Board.
Fidelity Small Cap Value Fund
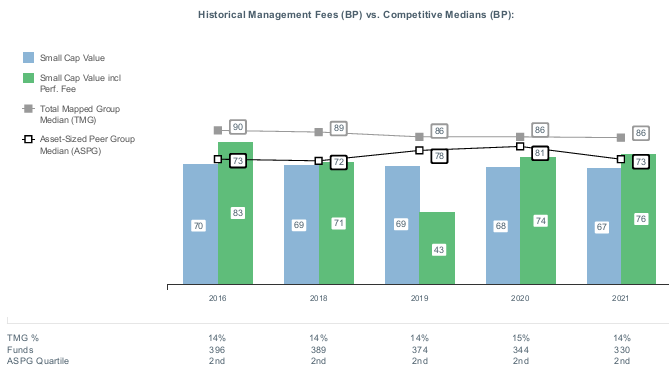
The Board noted that the fund's management fee rate ranked below the median of its Total Mapped Group and below the median of its ASPG for the 12-month period ended September 30, 2021. The Board also noted the effect of the fund's performance adjustment, if any, on the fund's management fee ranking.
The Board also considered that, for funds subject to the group fee, FMR agreed to voluntarily waive fees over a specified period of time in amounts designed to account for assets converted from certain funds to certain collective investment trusts.
Based on its review, the Board concluded that the fund's management fee is fair and reasonable in light of the services that the fund receives and the other factors considered.
Total Expense Ratio. In its review of the total expense ratio of the representative class (retail class), the Board considered the fund's management fee rate as well as other fund or class expenses, as applicable, such as transfer agent fees, pricing and bookkeeping fees, fund-paid 12b-1 fees, and custodial, legal, and audit fees. The Board noted the impact of the fund's performance adjustment. The Board also noted that Fidelity may agree to waive fees or reimburse expenses from time to time, and the extent to which, if any, it has done so for the fund. The fund's representative class is compared to those funds and classes in the Total Mapped Group (used by the Board for management fee comparisons) that have a similar sales load structure. The Board also considered a total expense ASPG comparison for the representative class, which focuses on the total expenses of the representative class relative to a subset of non-Fidelity funds within the total expense similar sales load structure group. The total expense ASPG is limited to 15 larger and 15 smaller classes in fund average assets for a total of 30 classes, where possible. The total expense ASPG comparison excludes performance adjustments and fund-paid 12b-1 fees to eliminate variability in fee structures.
The Board noted that the total net expense ratio of the retail class ranked below the similar sales load structure group competitive median and below the ASPG competitive median for the 12-month period ended September 30, 2021.
Fees Charged to Other Fidelity Clients. The Board also considered Fidelity fee structures and other information with respect to clients of Fidelity, such as other funds advised or subadvised by Fidelity, pension plan clients, and other institutional clients with similar mandates. The Board noted that a joint ad hoc committee created by it and the boards of other Fidelity funds periodically reviews and compares Fidelity's institutional investment advisory business with its business of providing services to the Fidelity funds and also noted the most recent findings of the committee. The Board noted that the committee's review included a consideration of the differences in services provided, fees charged, and costs incurred, as well as competition in the markets serving the different categories of clients.
Based on its review of total expense ratios and fees charged to other Fidelity clients, the Board concluded that the total expense ratio of each class of the fund was reasonable in light of the services that the fund and its shareholders receive and the other factors considered.
Costs of the Services and Profitability. The Board considered the revenues earned and the expenses incurred by Fidelity in conducting the business of developing, marketing, distributing, managing, administering and servicing the fund and servicing the fund's shareholders. The Board also considered the level of Fidelity's profits in respect of all the Fidelity funds.
On an annual basis, Fidelity presents to the Board information about the profitability of its relationships with the fund. Fidelity calculates profitability information for each fund, as well as aggregate profitability information for groups of Fidelity funds and all Fidelity funds, using a series of detailed revenue and cost allocation methodologies which originate with the books and records of Fidelity on which Fidelity's audited financial statements are based. The Audit Committee of the Board reviews any significant changes from the prior year's methodologies and the full Board approves such changes.
A public accounting firm has been engaged annually by the Board as part of the Board's assessment of Fidelity's profitability analysis. The engagement includes the review and assessment of the methodologies used by Fidelity in determining the revenues and expenses attributable to Fidelity's mutual fund business, and completion of agreed-upon procedures in respect of the mathematical accuracy of certain fund profitability information and its conformity to established allocation methodologies. After considering the reports issued under the engagement and information provided by Fidelity, the Board concluded that while other allocation methods may also be reasonable, Fidelity's profitability methodologies are reasonable in all material respects.
The Board also reviewed Fidelity's non-fund businesses and potential indirect benefits such businesses may have received as a result of their association with Fidelity's mutual fund business (i.e., fall-out benefits) as well as cases where Fidelity's affiliates may benefit from the funds' business. The Board considered areas where potential indirect benefits to the Fidelity funds from their relationships with Fidelity may exist. The Board's consideration of these matters was informed by the findings of a joint ad hoc committee created by it and the boards of other Fidelity funds to evaluate potential fall-out benefits.
The Board considered the costs of the services provided by and the profits realized by Fidelity in connection with the operation of the fund and was satisfied that the profitability was not excessive.
Economies of Scale. The Board considered whether there have been economies of scale in respect of the management of the Fidelity funds, whether the Fidelity funds (including the fund) have appropriately benefited from any such economies of scale, and whether there is potential for realization of any further economies of scale. The Board considered the extent to which the fund will benefit from economies of scale as assets grow through increased services to the fund, through waivers or reimbursements, or through fee or expense ratio reductions. The Board also noted that a committee (the Economies of Scale Committee) created by it and the boards of other Fidelity funds periodically analyzes whether Fidelity attains economies of scale in respect of the management and servicing of the Fidelity funds, whether the Fidelity funds have appropriately benefited from such economies of scale, and whether there is potential for realization of any further economies of scale.
The Board recognized that the fund's management contract incorporates a "group fee" structure, which provides for lower group fee rates as total "group assets" increase, and for higher group fee rates as total "group assets" decrease ("group assets" as defined in the management contract). FMR calculates the group fee rates based on a tiered asset "breakpoint" schedule that varies based on asset class. The Board considered that the group fee is designed to deliver the benefits of economies of scale to fund shareholders when total Fidelity fund assets increase, even if assets of any particular fund are unchanged or have declined, because some portion of Fidelity's costs are attributable to services provided to all Fidelity funds, and all funds benefit if those costs can be allocated among more assets. The Board further considered that Fidelity agreed to impose a temporary fee waiver in the form of additional breakpoints to the current breakpoint schedule. The Board concluded that, given the group fee structure, fund shareholders will benefit from lower management fees as "group assets" increase at the fund complex level, regardless of whether Fidelity achieves any such economies of scale.
The Board concluded, taking into account the analysis of the Economies of Scale Committee, that economies of scale, if any, are being appropriately shared between fund shareholders and Fidelity.
Additional Information Requested by the Board. In order to develop fully the factual basis for consideration of the Fidelity funds' advisory contracts, the Board requested and received additional information on certain topics, including: (i) fund flow and performance trends, in particular the underperformance of certain funds and strategies, and Fidelity's long-term strategies for certain funds, including any consideration of fund liquidations or mergers; (ii) the operation of performance fees, competitor use of performance fees, and consideration of the expansion of performance fees to additional funds; (iii) Fidelity's pricing philosophy compared to competitors; (iv) fund profitability methodology and data; (v) evaluation of competitive fund data and peer group classifications and fee and expense comparisons; (vi) the management fee and expense structures for different funds and classes and information about the differences between various fee and expense structures; (vii) group fee breakpoints and related voluntary fee waivers; and (viii) information regarding other accounts managed by Fidelity and the funds' sub-advisory arrangements.
Based on its evaluation of all of the conclusions noted above, and after considering all factors it believed relevant, the Board concluded that the advisory fee arrangements are fair and reasonable and that the fund's Advisory Contracts should be renewed.
Liquidity Risk Management Program
The Securities and Exchange Commission adopted Rule 22e-4 under the Investment Company Act of 1940 (the Liquidity Rule) to promote effective liquidity risk management throughout the open-end investment company industry, thereby reducing the risk that funds will be unable to meet their redemption obligations and mitigating dilution of the interests of fund shareholders.
The Fund has adopted and implemented a liquidity risk management program pursuant to the Liquidity Rule (the Program) effective December 1, 2018. The Program is reasonably designed to assess and manage the Fund’s liquidity risk and to comply with the requirements of the Liquidity Rule. The Fund’s Board of Trustees (the Board) has designated the Fund’s investment adviser as administrator of the Program. The Fidelity advisers have established a Liquidity Risk Management Committee (the LRM Committee) to manage the Program for each of the Fidelity Funds. The LRM Committee monitors the adequacy and effectiveness of implementation of the Program and on a periodic basis assesses each Fund’s liquidity risk based on a variety of factors including (1) the Fund’s investment strategy, (2) portfolio liquidity and cash flow projections during normal and reasonably foreseeable stressed conditions, (3) shareholder redemptions, (4) borrowings and other funding sources and (5) in the case of exchange-traded funds, certain additional factors including the effect of the Fund’s prices and spreads, market participants, and basket compositions on the overall liquidity of the Fund’s portfolio, as applicable.
In accordance with the Program, each of the Fund’s portfolio investments is classified into one of four liquidity categories described below based on a determination of a reasonable expectation for how long it would take to convert the investment to cash (or sell or dispose of the investment) without significantly changing its market value.
- Highly liquid investments – cash or convertible to cash within three business days or less
- Moderately liquid investments – convertible to cash in three to seven calendar days
- Less liquid investments – can be sold or disposed of, but not settled, within seven calendar days
- Illiquid investments – cannot be sold or disposed of within seven calendar days
Liquidity classification determinations take into account a variety of factors including various market, trading and investment-specific considerations, as well as market depth, and generally utilize analysis from a third-party liquidity metrics service.
The Liquidity Rule places a 15% limit on a fund’s illiquid investments and requires funds that do not primarily hold assets that are highly liquid investments to determine and maintain a minimum percentage of the fund’s net assets to be invested in highly liquid investments (highly liquid investment minimum or HLIM). The Program includes provisions reasonably designed to comply with the 15% limit on illiquid investments and for determining, periodically reviewing and complying with the HLIM requirement as applicable.
At a recent meeting of the Fund’s Board of Trustees, the LRM Committee provided a written report to the Board pertaining to the operation, adequacy, and effectiveness of implementation of the Program for the annual period from December 1, 2020 through November 30, 2021. The report concluded that the Program has been implemented and is operating effectively and is reasonably designed to assess and manage the Fund’s liquidity risk.
SCV-ANN-0922
1.803706.117
Fidelity® Series Blue Chip Growth Fund
Annual Report
July 31, 2022
Contents
To view a fund's proxy voting guidelines and proxy voting record for the 12-month period ended June 30, visit http://www.fidelity.com/proxyvotingresults or visit the Securities and Exchange Commission's (SEC) web site at http://www.sec.gov.
You may also call 1-800-544-8544 to request a free copy of the proxy voting guidelines.
Standard & Poor's, S&P and S&P 500 are registered service marks of The McGraw-Hill Companies, Inc. and have been licensed for use by Fidelity Distributors Corporation.
Other third-party marks appearing herein are the property of their respective owners.
All other marks appearing herein are registered or unregistered trademarks or service marks of FMR LLC or an affiliated company. © 2022 FMR LLC. All rights reserved.
This report and the financial statements contained herein are submitted for the general information of the shareholders of the Fund. This report is not authorized for distribution to prospective investors in the Fund unless preceded or accompanied by an effective prospectus.
A fund files its complete schedule of portfolio holdings with the SEC for the first and third quarters of each fiscal year on Form N-PORT. Forms N-PORT are available on the SEC’s web site at http://www.sec.gov. A fund's Forms N-PORT may be reviewed and copied at the SEC’s Public Reference Room in Washington, DC. Information regarding the operation of the SEC's Public Reference Room may be obtained by calling 1-800-SEC-0330.
For a complete list of a fund's portfolio holdings, view the most recent holdings listing, semiannual report, or annual report on Fidelity's web site at http://www.fidelity.com, http://www.institutional.fidelity.com, or http://www.401k.com, as applicable.
NOT FDIC INSURED •MAY LOSE VALUE •NO BANK GUARANTEE
Neither the Fund nor Fidelity Distributors Corporation is a bank.
Note to Shareholders:
Early in 2020, the outbreak and spread of COVID-19 emerged as a public health emergency that had a major influence on financial markets, primarily based on its impact on the global economy and corporate earnings. On March 11, 2020, the World Health Organization declared the COVID-19 outbreak a pandemic, citing sustained risk of further global spread. The pandemic prompted a number of measures to limit the spread of COVID-19, including travel and border restrictions, quarantines, and restrictions on large gatherings. In turn, these resulted in lower consumer activity, diminished demand for a wide range of products and services, disruption in manufacturing and supply chains, and – given the wide variability in outcomes regarding the outbreak – significant market uncertainty and volatility. To help stem the turmoil, the U.S. government took unprecedented action – in concert with the U.S. Federal Reserve and central banks around the world – to help support consumers, businesses, and the broader economy, and to limit disruption to the financial system.
In general, the overall impact of the pandemic lessened in 2021, amid a resilient economy and widespread distribution of three COVID-19 vaccines granted emergency use authorization from the U.S. Food and Drug Administration (FDA) early in the year. Still, the situation remains dynamic, and the extent and duration of its influence on financial markets and the economy is highly uncertain, due in part to a recent spike in cases based on highly contagious variants of the coronavirus.
Extreme events such as the COVID-19 crisis are exogenous shocks that can have significant adverse effects on mutual funds and their investments. Although multiple asset classes may be affected by market disruption, the duration and impact may not be the same for all types of assets. Fidelity is committed to helping you stay informed amid news about COVID-19 and during increased market volatility, and we continue to take extra steps to be responsive to customer needs. We encourage you to visit us online, where we offer ongoing updates, commentary, and analysis on the markets and our funds.
Performance: The Bottom Line
Average annual total return reflects the change in the value of an investment, assuming reinvestment of distributions from dividend income and capital gains (the profits earned upon the sale of securities that have grown in value, if any) and assuming a constant rate of performance each year. The hypothetical investment and the average annual total returns do not reflect the deduction of taxes that a shareholder would pay on fund distributions or the redemption of fund shares. During periods of reimbursement by Fidelity, a fund’s total return will be greater than it would be had the reimbursement not occurred. How a fund did yesterday is no guarantee of how it will do tomorrow.
Average Annual Total Returns
| For the periods ended July 31, 2022 | Past 1 year | Past 5 years | Life of fundA |
| Fidelity® Series Blue Chip Growth Fund | (22.51)% | 17.51% | 16.05% |
A From November 7, 2013
$10,000 Over Life of Fund
Let's say hypothetically that $10,000 was invested in Fidelity® Series Blue Chip Growth Fund on November 7, 2013, when the fund started.
The chart shows how the value of your investment would have changed, and also shows how the Russell 1000® Growth Index performed over the same period.

| Period Ending Values |
| $36,697 | Fidelity® Series Blue Chip Growth Fund |
| $33,984 | Russell 1000® Growth Index |
Management's Discussion of Fund Performance
Market Recap: The S&P 500
® index returned -4.64% for the 12 months ending July 31, 2022, as a multitude of crosscurrents challenged the global economy and financial markets. Persistently high inflation, exacerbated by energy price shocks from the Russia–Ukraine conflict, spurred the U.S. Federal Reserve to hike interest rates more aggressively than anticipated, and concerns about the outlook for economic growth sent stocks into bear market territory. In early May, the Fed approved a rare half-percentage-point interest rate increase and announced plans to shrink its $9 trillion asset portfolio. June began with the Fed allowing up to billions in Treasuries and mortgage bonds to mature every month without investing the proceeds. Two weeks later, the central bank raised rates by 0.75 percentage points, its largest increase since 1994, and said it was becoming more difficult to achieve a soft landing, in which the economy slows enough to bring down inflation while avoiding a recession. Against this volatile backdrop, the S&P 500 posted its worst first-half result (-19.96%) to begin a year since 1970. Stocks sharply reversed course in July (+9.22%), as the Fed again raised its benchmark interest rate by 0.75% but signaled that, at some point, it will likely slow the pace of tightening to assess the impact on the economy. For the full 12 months, growth-oriented communication services (-29%) and consumer discretionary (-10%) stocks lagged most. In contrast, energy (+67%) rode a surge in commodity prices and led by a wide margin, followed by the defensive utilities (+16%) and consumer staples (+7%) sectors.
Comments from Portfolio Manager Sonu Kalra: For the fiscal year ending July 31, 2022, the fund returned -22.51%, underperforming the -11.93% result of the benchmark Russell 1000
® Growth Index. Versus the benchmark, security selection was the primary detractor from relative performance. Weak picks in the industrials sector, especially within the transportation industry, hurt. Also detracting from performance was stock selection and an underweighting in information technology. The biggest individual relative detractor was an overweight position in Lyft (-75%). Lyft was among the fund's largest holdings this period. The fund's stake in Snap returned roughly -87%. We added to our non-benchmark stake in the company the past 12 months. Another notable relative detractor was an overweighting in RH (-58%). In contrast, the top contributor to performance versus the benchmark was an overweighting in energy. Stock picks and an overweighting in materials also bolstered the fund's relative result. An out-of-index position in Celsius Holdings, which gained approximately 29% the past year, was a notable relative contributor. We increased our position in the company the past 12 months. A non-benchmark stake in SpaceX (+67%) also contributed, as did an outsized stake in Dollar Tree (+73%), a position we established this period. Notable changes in positioning include a lower allocation to the industrials and communication services sectors.
The views expressed above reflect those of the portfolio manager(s) only through the end of the period as stated on the cover of this report and do not necessarily represent the views of Fidelity or any other person in the Fidelity organization. Any such views are subject to change at any time based upon market or other conditions and Fidelity disclaims any responsibility to update such views. These views may not be relied on as investment advice and, because investment decisions for a Fidelity fund are based on numerous factors, may not be relied on as an indication of trading intent on behalf of any Fidelity fund.
Investment Summary (Unaudited)
Top Ten Stocks as of July 31, 2022
| | % of fund's net assets |
| Apple, Inc. | 10.8 |
| Microsoft Corp. | 8.3 |
| Amazon.com, Inc. | 7.4 |
| NVIDIA Corp. | 5.5 |
| Tesla, Inc. | 4.9 |
| Alphabet, Inc. Class A | 4.6 |
| Marvell Technology, Inc. | 3.6 |
| lululemon athletica, Inc. | 2.4 |
| iShares Russell 1000 Growth Index ETF | 2.3 |
| Meta Platforms, Inc. Class A | 2.2 |
| | 52.0 |
Market Sectors as of July 31, 2022
| | % of fund's net assets |
| Information Technology | 39.0 |
| Consumer Discretionary | 30.0 |
| Communication Services | 9.2 |
| Health Care | 7.8 |
| Energy | 4.4 |
| Investment Companies | 2.3 |
| Industrials | 2.3 |
| Materials | 1.3 |
| Consumer Staples | 1.2 |
| Financials | 0.9 |
| Real Estate | 0.1 |
| Utilities | 0.0 |
Asset Allocation (% of fund's net assets)
| As of July 31, 2022 |
| | Stocks and Equity Futures | 95.5% |
| | Convertible Securities | 1.4% |
| | Other Investments | 2.3% |
| | Short-Term Investments and Net Other Assets (Liabilities) | 0.8% |

Foreign investments - 6.2%
Schedule of Investments July 31, 2022
Showing Percentage of Net Assets
| Common Stocks - 94.7% | | | |
| | | Shares | Value |
| COMMUNICATION SERVICES - 9.1% | | | |
| Diversified Telecommunication Services - 0.0% | | | |
| Starry, Inc. | | 346,148 | $1,052,290 |
| Entertainment - 1.6% | | | |
| Bilibili, Inc. ADR (a)(b) | | 362,700 | 8,864,388 |
| Endeavor Group Holdings, Inc. (a) | | 386,488 | 8,808,062 |
| Netflix, Inc. (a) | | 345,924 | 77,798,308 |
| Sea Ltd. ADR (a) | | 156,831 | 11,969,342 |
| Universal Music Group NV | | 114,456 | 2,590,886 |
| | | | 110,030,986 |
| Interactive Media & Services - 7.4% | | | |
| Alphabet, Inc. Class A (a) | | 2,804,260 | 326,191,523 |
| Meta Platforms, Inc. Class A (a) | | 1,017,310 | 161,854,021 |
| Snap, Inc. Class A (a) | | 4,135,300 | 40,856,764 |
| | | | 528,902,308 |
| Wireless Telecommunication Services - 0.1% | | | |
| T-Mobile U.S., Inc. (a) | | 34,700 | 4,964,182 |
|
| TOTAL COMMUNICATION SERVICES | | | 644,949,766 |
|
| CONSUMER DISCRETIONARY - 29.8% | | | |
| Automobiles - 5.3% | | | |
| Neutron Holdings, Inc. (a)(c)(d) | | 691,699 | 19,022 |
| Rad Power Bikes, Inc.(a)(c)(d) | | 110,210 | 574,194 |
| Rivian Automotive, Inc. (b) | | 581,795 | 19,955,569 |
| Tesla, Inc. (a) | | 389,035 | 346,805,251 |
| XPeng, Inc. ADR (a) | | 464,000 | 11,335,520 |
| | | | 378,689,556 |
| Hotels, Restaurants & Leisure - 3.9% | | | |
| Airbnb, Inc. Class A (a) | | 640,200 | 71,049,396 |
| Booking Holdings, Inc. (a) | | 5,500 | 10,646,295 |
| Caesars Entertainment, Inc. (a) | | 660,847 | 30,194,099 |
| Chipotle Mexican Grill, Inc. (a) | | 26,342 | 41,204,683 |
| Hilton Worldwide Holdings, Inc. | | 188,300 | 24,115,581 |
| Marriott International, Inc. Class A | | 238,200 | 37,830,924 |
| Penn National Gaming, Inc. (a) | | 1,287,643 | 44,488,066 |
| Sweetgreen, Inc. Class A (b) | | 1,116,759 | 17,544,284 |
| | | | 277,073,328 |
| Internet & Direct Marketing Retail - 9.8% | | | |
| Alibaba Group Holding Ltd. sponsored ADR (a) | | 151,900 | 13,575,303 |
| Amazon.com, Inc. (a) | | 3,901,000 | 526,439,950 |
| Deliveroo PLC Class A (a)(e) | | 400,600 | 442,188 |
| FSN E-Commerce Ventures Private Ltd. (a)(c) | | 818,460 | 12,969,256 |
| JD.com, Inc.: | | | |
| Class A | | 5,328 | 158,948 |
| sponsored ADR | | 193,500 | 11,513,250 |
| Lyft, Inc. (a)(b) | | 2,883,607 | 39,966,793 |
| Pinduoduo, Inc. ADR (a) | | 357,000 | 17,496,570 |
| Uber Technologies, Inc. (a) | | 2,883,875 | 67,626,869 |
| Wayfair LLC Class A (a) | | 211,114 | 11,381,156 |
| | | | 701,570,283 |
| Multiline Retail - 1.1% | | | |
| Dollar Tree, Inc. (a) | | 410,200 | 67,830,672 |
| Ollie's Bargain Outlet Holdings, Inc. (a) | | 65,800 | 3,878,910 |
| Target Corp. | | 33,100 | 5,407,878 |
| | | | 77,117,460 |
| Specialty Retail - 4.6% | | | |
| American Eagle Outfitters, Inc. (b) | | 1,437,986 | 17,313,351 |
| Burlington Stores, Inc. (a) | | 79,003 | 11,149,693 |
| Carvana Co. Class A (a)(b) | | 829,813 | 24,189,049 |
| Fanatics, Inc. Class A (c)(d) | | 159,285 | 10,292,997 |
| Five Below, Inc. (a) | | 231,384 | 29,401,965 |
| Floor & Decor Holdings, Inc. Class A (a) | | 211,740 | 17,059,892 |
| Lowe's Companies, Inc. | | 622,706 | 119,266,880 |
| RH (a) | | 147,304 | 41,161,157 |
| TJX Companies, Inc. | | 612,400 | 37,454,384 |
| Victoria's Secret & Co. (a) | | 327,927 | 12,120,182 |
| Warby Parker, Inc. (a)(b) | | 531,579 | 6,586,264 |
| | | | 325,995,814 |
| Textiles, Apparel & Luxury Goods - 5.1% | | | |
| Capri Holdings Ltd. (a) | | 754,900 | 36,748,532 |
| Crocs, Inc. (a) | | 462,684 | 33,146,682 |
| Deckers Outdoor Corp. (a) | | 90,516 | 28,350,516 |
| Hermes International SCA | | 1,401 | 1,910,144 |
| lululemon athletica, Inc. (a) | | 562,774 | 174,746,955 |
| LVMH Moet Hennessy Louis Vuitton SE | | 22,161 | 15,387,597 |
| NIKE, Inc. Class B | | 549,513 | 63,150,034 |
| On Holding AG | | 319,500 | 6,955,515 |
| Tory Burch LLC (a)(c)(d)(f) | | 106,817 | 5,171,011 |
| | | | 365,566,986 |
|
| TOTAL CONSUMER DISCRETIONARY | | | 2,126,013,427 |
|
| CONSUMER STAPLES - 1.1% | | | |
| Beverages - 0.9% | | | |
| Boston Beer Co., Inc. Class A (a) | | 20,600 | 7,836,858 |
| Celsius Holdings, Inc. (a)(b) | | 552,200 | 49,123,712 |
| Constellation Brands, Inc. Class A (sub. vtg.) | | 17,800 | 4,384,318 |
| | | | 61,344,888 |
| Food & Staples Retailing - 0.1% | | | |
| Albertsons Companies, Inc. | | 92,900 | 2,494,365 |
| BJ's Wholesale Club Holdings, Inc. (a) | | 59,500 | 4,028,150 |
| Blink Health LLC Series A1 (a)(c)(d) | | 6,283 | 238,377 |
| Sysco Corp. | | 46,000 | 3,905,400 |
| Walmart, Inc. | | 4,800 | 633,840 |
| | | | 11,300,132 |
| Food Products - 0.0% | | | |
| The Real Good Food Co., Inc. | | 5,400 | 35,100 |
| Household Products - 0.1% | | | |
| Procter & Gamble Co. | | 36,800 | 5,111,888 |
| Tobacco - 0.0% | | | |
| JUUL Labs, Inc. Class B (a)(c)(d) | | 2,450 | 18,865 |
|
| TOTAL CONSUMER STAPLES | | | 77,810,873 |
|
| ENERGY - 4.4% | | | |
| Energy Equipment & Services - 0.1% | | | |
| Halliburton Co. | | 142,300 | 4,169,390 |
| Schlumberger Ltd. | | 21,400 | 792,442 |
| Tenaris SA sponsored ADR | | 37,500 | 1,052,250 |
| U.S. Silica Holdings, Inc. (a) | | 68,600 | 948,738 |
| | | | 6,962,820 |
| Oil, Gas & Consumable Fuels - 4.3% | | | |
| Antero Resources Corp. (a) | | 285,100 | 11,301,364 |
| Cenovus Energy, Inc. (Canada) | | 223,200 | 4,252,923 |
| Cheniere Energy, Inc. | | 35,700 | 5,340,006 |
| Denbury, Inc. (a) | | 78,600 | 5,652,126 |
| Devon Energy Corp. | | 331,800 | 20,853,630 |
| Diamondback Energy, Inc. | | 217,000 | 27,780,340 |
| EOG Resources, Inc. | | 279,600 | 31,097,112 |
| EQT Corp. | | 53,700 | 2,364,411 |
| Equinor ASA | | 47,900 | 1,844,337 |
| Exxon Mobil Corp. | | 212,800 | 20,626,704 |
| Hess Corp. | | 336,400 | 37,834,908 |
| Imperial Oil Ltd. | | 50,500 | 2,420,198 |
| Marathon Oil Corp. | | 341,100 | 8,459,280 |
| Northern Oil & Gas, Inc. | | 78,800 | 2,271,804 |
| Occidental Petroleum Corp. | | 313,400 | 20,606,050 |
| Ovintiv, Inc. | | 26,600 | 1,358,994 |
| Phillips 66 Co. | | 201,900 | 17,969,100 |
| Pioneer Natural Resources Co. | | 118,200 | 28,007,490 |
| Range Resources Corp. (a) | | 35,500 | 1,173,985 |
| Reliance Industries Ltd. | | 911,649 | 28,961,597 |
| Reliance Industries Ltd. sponsored GDR (e) | | 36,100 | 2,277,910 |
| Valero Energy Corp. | | 216,600 | 23,992,782 |
| | | | 306,447,051 |
|
| TOTAL ENERGY | | | 313,409,871 |
|
| FINANCIALS - 0.9% | | | |
| Banks - 0.3% | | | |
| Kotak Mahindra Bank Ltd. | | 118,376 | 2,715,537 |
| Wells Fargo & Co. | | 418,200 | 18,346,434 |
| | | | 21,061,971 |
| Consumer Finance - 0.5% | | | |
| American Express Co. | | 228,100 | 35,131,962 |
| Diversified Financial Services - 0.1% | | | |
| Ant International Co. Ltd. Class C (a)(c)(d) | | 1,568,556 | 2,964,571 |
| Berkshire Hathaway, Inc. Class B (a) | | 5,300 | 1,593,180 |
| | | | 4,557,751 |
|
| TOTAL FINANCIALS | | | 60,751,684 |
|
| HEALTH CARE - 7.7% | | | |
| Biotechnology - 1.3% | | | |
| Alnylam Pharmaceuticals, Inc. (a) | | 98,081 | 13,931,425 |
| Arcutis Biotherapeutics, Inc. (a) | | 88,800 | 2,154,288 |
| Argenx SE ADR (a) | | 11,437 | 4,165,470 |
| Ascendis Pharma A/S sponsored ADR (a) | | 145,496 | 12,444,273 |
| Avidity Biosciences, Inc. (a) | | 36,700 | 597,843 |
| Cibus Corp.: | | | |
| Series C (a)(c)(d)(f) | | 726,554 | 1,794,588 |
| Series D (a)(c)(d)(f) | | 398,640 | 984,641 |
| Series E (a)(c)(d)(f) | | 251,468 | 621,126 |
| CytomX Therapeutics, Inc. (a)(e) | | 137,854 | 197,131 |
| Generation Bio Co. (a) | | 163,122 | 1,040,718 |
| Horizon Therapeutics PLC (a) | | 284,699 | 23,621,476 |
| Instil Bio, Inc. (a) | | 68,800 | 388,032 |
| Karuna Therapeutics, Inc. (a) | | 40,000 | 5,210,000 |
| Regeneron Pharmaceuticals, Inc. (a) | | 18,900 | 10,993,941 |
| Vertex Pharmaceuticals, Inc. (a) | | 46,700 | 13,095,147 |
| Verve Therapeutics, Inc. (a) | | 59,000 | 1,452,580 |
| | | | 92,692,679 |
| Health Care Equipment & Supplies - 1.2% | | | |
| Axonics Modulation Technologies, Inc. (a) | | 53,420 | 3,465,355 |
| DexCom, Inc. (a) | | 390,560 | 32,057,165 |
| Insulet Corp. (a) | | 89,898 | 22,276,724 |
| Shockwave Medical, Inc. (a) | | 127,633 | 26,921,629 |
| | | | 84,720,873 |
| Health Care Providers & Services - 2.3% | | | |
| agilon health, Inc. (a) | | 47,000 | 1,176,410 |
| Alignment Healthcare, Inc. (a) | | 145,747 | 2,139,566 |
| Centene Corp. (a) | | 40,700 | 3,783,879 |
| Cigna Corp. | | 4,700 | 1,294,192 |
| Elevance Health, Inc. | | 3,500 | 1,669,850 |
| Guardant Health, Inc. (a) | | 308,109 | 15,457,829 |
| LifeStance Health Group, Inc. (a) | | 111,400 | 663,944 |
| Surgery Partners, Inc. (a) | | 54,700 | 2,154,086 |
| UnitedHealth Group, Inc. | | 246,300 | 133,578,342 |
| | | | 161,918,098 |
| Health Care Technology - 0.0% | | | |
| Certara, Inc. (a) | | 50,700 | 1,165,593 |
| MultiPlan Corp. warrants (a)(c) | | 24,206 | 15,259 |
| | | | 1,180,852 |
| Life Sciences Tools & Services - 0.7% | | | |
| 10X Genomics, Inc. (a) | | 20,300 | 815,045 |
| Danaher Corp. | | 105,700 | 30,808,379 |
| ICON PLC (a) | | 11,100 | 2,677,875 |
| Olink Holding AB ADR (a) | | 77,300 | 1,039,685 |
| Seer, Inc. (a) | | 39,619 | 356,571 |
| Thermo Fisher Scientific, Inc. | | 28,900 | 17,294,049 |
| | | | 52,991,604 |
| Pharmaceuticals - 2.2% | | | |
| AstraZeneca PLC sponsored ADR | | 9,900 | 655,677 |
| Chiasma, Inc. warrants 12/16/24 (a)(d) | | 23,784 | 0 |
| Eli Lilly & Co. | | 274,179 | 90,394,075 |
| Roche Holding AG (participation certificate) | | 5,830 | 1,935,586 |
| Sanofi SA sponsored ADR | | 10,500 | 521,850 |
| Zoetis, Inc. Class A | | 343,379 | 62,683,836 |
| | | | 156,191,024 |
|
| TOTAL HEALTH CARE | | | 549,695,130 |
|
| INDUSTRIALS - 1.7% | | | |
| Aerospace & Defense - 0.8% | | | |
| Airbus Group NV | | 24,100 | 2,598,503 |
| General Dynamics Corp. | | 4,600 | 1,042,682 |
| Howmet Aerospace, Inc. | | 91,800 | 3,408,534 |
| L3Harris Technologies, Inc. | | 19,700 | 4,727,409 |
| Lockheed Martin Corp. | | 7,600 | 3,144,956 |
| Northrop Grumman Corp. | | 7,200 | 3,448,080 |
| Space Exploration Technologies Corp.: | | | |
| Class A (a)(c)(d) | | 227,030 | 15,892,100 |
| Class C (a)(c)(d) | | 6,860 | 480,200 |
| The Boeing Co. (a) | | 116,400 | 18,543,684 |
| | | | 53,286,148 |
| Air Freight & Logistics - 0.0% | | | |
| Delhivery Private Ltd. (c) | | 294,700 | 2,122,482 |
| Electrical Equipment - 0.4% | | | |
| Acuity Brands, Inc. | | 96,300 | 17,565,120 |
| Generac Holdings, Inc. (a) | | 40,291 | 10,810,075 |
| | | | 28,375,195 |
| Industrial Conglomerates - 0.2% | | | |
| General Electric Co. | | 141,750 | 10,476,743 |
| Machinery - 0.1% | | | |
| Deere & Co. | | 29,400 | 10,089,492 |
| Road & Rail - 0.2% | | | |
| Avis Budget Group, Inc. (a) | | 30,900 | 5,624,727 |
| Bird Global, Inc.: | | | |
| Class A (a)(b) | | 828,933 | 445,966 |
| rights (a)(d) | | 13,740 | 275 |
| rights (a)(d) | | 13,740 | 137 |
| rights (a)(d) | | 13,740 | 0 |
| Hertz Global Holdings, Inc. (b) | | 339,600 | 7,274,232 |
| | | | 13,345,337 |
|
| TOTAL INDUSTRIALS | | | 117,695,397 |
|
| INFORMATION TECHNOLOGY - 38.7% | | | |
| IT Services - 3.0% | | | |
| MasterCard, Inc. Class A | | 357,700 | 126,550,683 |
| MongoDB, Inc. Class A (a) | | 23,680 | 7,399,290 |
| Okta, Inc. (a) | | 257,200 | 25,321,340 |
| Shift4 Payments, Inc. (a)(b) | | 110,800 | 4,036,444 |
| Snowflake, Inc. (a) | | 34,300 | 5,141,913 |
| Toast, Inc. (b) | | 3,900 | 62,322 |
| Twilio, Inc. Class A (a) | | 278,756 | 23,638,509 |
| Visa, Inc. Class A | | 102,300 | 21,698,853 |
| | | | 213,849,354 |
| Semiconductors & Semiconductor Equipment - 13.5% | | | |
| Advanced Micro Devices, Inc. (a) | | 582,719 | 55,049,464 |
| ASML Holding NV | | 10,100 | 5,801,844 |
| Cirrus Logic, Inc. (a) | | 97,400 | 8,323,804 |
| Enphase Energy, Inc. (a) | | 3,600 | 1,023,048 |
| GlobalFoundries, Inc. | | 555,960 | 28,620,821 |
| Lam Research Corp. | | 25,100 | 12,562,801 |
| Marvell Technology, Inc. | | 4,591,479 | 255,653,551 |
| Monolithic Power Systems, Inc. | | 20,400 | 9,480,288 |
| NVIDIA Corp. | | 2,148,596 | 390,249,491 |
| NXP Semiconductors NV | | 649,735 | 119,473,272 |
| onsemi (a) | | 427,900 | 28,575,162 |
| SolarEdge Technologies, Inc. (a) | | 5,200 | 1,872,676 |
| Synaptics, Inc. (a) | | 33,400 | 4,841,330 |
| Taiwan Semiconductor Manufacturing Co. Ltd. sponsored ADR | | 140,400 | 12,422,592 |
| Teradyne, Inc. | | 290,100 | 29,268,189 |
| | | | 963,218,333 |
| Software - 11.4% | | | |
| Atlassian Corp. PLC (a) | | 8,700 | 1,821,084 |
| Atom Tickets LLC (a)(c)(d)(f) | | 344,068 | 3 |
| Bill.Com Holdings, Inc. (a)(b) | | 50,600 | 6,835,048 |
| Coupa Software, Inc. (a) | | 94,814 | 6,202,732 |
| Crowdstrike Holdings, Inc. (a) | | 86,500 | 15,881,400 |
| Datadog, Inc. Class A (a) | | 58,000 | 5,916,580 |
| EngageSmart, Inc. | | 7,546 | 142,393 |
| Epic Games, Inc. (a)(c)(d) | | 1,076 | 1,000,680 |
| HubSpot, Inc. (a) | | 73,192 | 22,543,136 |
| Intuit, Inc. | | 72,900 | 33,254,793 |
| Microsoft Corp. | | 2,097,700 | 588,908,298 |
| Paycom Software, Inc. (a) | | 15,600 | 5,155,644 |
| Riskified Ltd. Class A (e) | | 17,300 | 75,947 |
| Salesforce.com, Inc. (a) | | 437,870 | 80,576,837 |
| ServiceNow, Inc. (a) | | 38,123 | 17,028,019 |
| Stripe, Inc. Class B (a)(c)(d) | | 19,900 | 575,508 |
| Tanium, Inc. Class B (a)(c)(d) | | 151,000 | 1,484,330 |
| Zoom Video Communications, Inc. Class A (a) | | 186,800 | 19,401,048 |
| | | | 806,803,480 |
| Technology Hardware, Storage & Peripherals - 10.8% | | | |
| Apple, Inc. | | 4,740,636 | 770,400,753 |
|
| TOTAL INFORMATION TECHNOLOGY | | | 2,754,271,920 |
|
| MATERIALS - 1.2% | | | |
| Chemicals - 0.8% | | | |
| Cabot Corp. | | 43,900 | 3,260,014 |
| CF Industries Holdings, Inc. | | 135,700 | 12,957,993 |
| Nutrien Ltd. | | 264,500 | 22,642,216 |
| The Mosaic Co. | | 372,300 | 19,605,318 |
| | | | 58,465,541 |
| Metals & Mining - 0.4% | | | |
| Freeport-McMoRan, Inc. | | 961,000 | 30,319,550 |
|
| TOTAL MATERIALS | | | 88,785,091 |
|
| REAL ESTATE - 0.1% | | | |
| Equity Real Estate Investment Trusts (REITs) - 0.0% | | | |
| Welltower, Inc. | | 6,400 | 552,576 |
| Real Estate Management & Development - 0.1% | | | |
| WeWork, Inc. (a)(b) | | 1,936,485 | 9,237,033 |
|
| TOTAL REAL ESTATE | | | 9,789,609 |
|
| UTILITIES - 0.0% | | | |
| Electric Utilities - 0.0% | | | |
| ORSTED A/S (e) | | 11,000 | 1,280,583 |
| Multi-Utilities - 0.0% | | | |
| Sempra Energy | | 12,000 | 1,989,600 |
|
| TOTAL UTILITIES | | | 3,270,183 |
|
| TOTAL COMMON STOCKS | | | |
| (Cost $4,549,783,973) | | | 6,746,442,951 |
|
| Preferred Stocks - 1.5% | | | |
| Convertible Preferred Stocks - 1.4% | | | |
| COMMUNICATION SERVICES - 0.1% | | | |
| Interactive Media & Services - 0.1% | | | |
| Reddit, Inc.: | | | |
| Series B (a)(c)(d) | | 129,280 | 5,085,875 |
| Series E (a)(c)(d) | | 5,005 | 196,897 |
| | | | 5,282,772 |
| CONSUMER DISCRETIONARY - 0.2% | | | |
| Automobiles - 0.0% | | | |
| Rad Power Bikes, Inc.: | | | |
| Series A (a)(c)(d) | | 14,368 | 74,857 |
| Series C (a)(c)(d) | | 56,537 | 294,558 |
| | | | 369,415 |
| Hotels, Restaurants & Leisure - 0.1% | | | |
| MOD Super Fast Pizza Holdings LLC: | | | |
| Series 3 (a)(c)(d)(f) | | 22,518 | 5,542,344 |
| Series 4 (a)(c)(d)(f) | | 2,055 | 481,651 |
| Series 5 (a)(c)(d)(f) | | 8,253 | 1,800,805 |
| | | | 7,824,800 |
| Internet & Direct Marketing Retail - 0.1% | | | |
| GoBrands, Inc. Series G (a)(c)(d) | | 19,600 | 4,471,348 |
| Instacart, Inc.: | | | |
| Series H (a)(c)(d) | | 31,105 | 1,633,946 |
| Series I (a)(c)(d) | | 13,960 | 733,319 |
| | | | 6,838,613 |
| TOTAL CONSUMER DISCRETIONARY | | | 15,032,828 |
| CONSUMER STAPLES - 0.1% | | | |
| Food & Staples Retailing - 0.0% | | | |
| Blink Health LLC Series C (a)(c)(d) | | 27,197 | 1,031,854 |
| Food Products - 0.0% | | | |
| AgBiome LLC Series C (a)(c)(d) | | 266,499 | 1,689,604 |
| Tobacco - 0.1% | | | |
| JUUL Labs, Inc.: | | | |
| Series C (a)(c)(d) | | 660,029 | 5,082,223 |
| Series D (a)(c)(d) | | 5,110 | 39,347 |
| | | | 5,121,570 |
| TOTAL CONSUMER STAPLES | | | 7,843,028 |
| HEALTH CARE - 0.0% | | | |
| Biotechnology - 0.0% | | | |
| Castle Creek Biosciences, Inc. Series D2 (c)(d) | | 642 | 130,801 |
| Pharmaceuticals - 0.0% | | | |
| Castle Creek Pharmaceutical Holdings, Inc. Series B (a)(c)(d) | | 1,069 | 236,805 |
| TOTAL HEALTH CARE | | | 367,606 |
| INDUSTRIALS - 0.6% | | | |
| Aerospace & Defense - 0.6% | | | |
| Space Exploration Technologies Corp.: | | | |
| Series G (a)(c)(d) | | 42,650 | 29,855,000 |
| Series H (a)(c)(d) | | 6,348 | 4,443,600 |
| Series N (a)(c)(d) | | 12,799 | 8,959,300 |
| | | | 43,257,900 |
| Construction & Engineering - 0.0% | | | |
| Beta Technologies, Inc. Series A (a)(c)(d) | | 12,033 | 1,241,445 |
| TOTAL INDUSTRIALS | | | 44,499,345 |
| INFORMATION TECHNOLOGY - 0.3% | | | |
| Communications Equipment - 0.0% | | | |
| Xsight Labs Ltd. Series D (a)(c)(d) | | 140,500 | 1,050,940 |
| Electronic Equipment & Components - 0.0% | | | |
| Enevate Corp. Series E (a)(c)(d) | | 1,441,706 | 1,598,396 |
| IT Services - 0.1% | | | |
| AppNexus, Inc. Series E (Escrow) (a)(c)(d) | | 307,049 | 9,617 |
| ByteDance Ltd. Series E1 (a)(c)(d) | | 37,119 | 5,328,061 |
| | | | 5,337,678 |
| Software - 0.2% | | | |
| Bolt Technology OU Series E (c)(d) | | 18,160 | 2,868,143 |
| Databricks, Inc. Series G (a)(c)(d) | | 17,300 | 2,737,206 |
| Dataminr, Inc. Series D (a)(c)(d) | | 115,901 | 2,519,688 |
| Delphix Corp. Series D (a)(c)(d) | | 242,876 | 1,770,566 |
| Jet.Com, Inc. Series B1 (Escrow) (a)(c)(d) | | 922,232 | 9 |
| Malwarebytes Corp. Series B (a)(c)(d) | | 329,349 | 6,316,914 |
| Nuvia, Inc. Series B (a)(c) | | 181,697 | 148,486 |
| Stripe, Inc. Series H (a)(c)(d) | | 8,700 | 251,604 |
| | | | 16,612,616 |
| TOTAL INFORMATION TECHNOLOGY | | | 24,599,630 |
| MATERIALS - 0.1% | | | |
| Metals & Mining - 0.1% | | | |
| Diamond Foundry, Inc. Series C (a)(c)(d) | | 125,000 | 3,892,500 |
|
| TOTAL CONVERTIBLE PREFERRED STOCKS | | | 101,517,709 |
|
| Nonconvertible Preferred Stocks - 0.1% | | | |
| CONSUMER DISCRETIONARY - 0.0% | | | |
| Automobiles - 0.0% | | | |
| Neutron Holdings, Inc. Series 1C (a)(c)(d) | | 12,405,800 | 341,160 |
| Waymo LLC Series A2 (a)(c)(d) | | 15,200 | 944,376 |
| | | | 1,285,536 |
| HEALTH CARE - 0.1% | | | |
| Pharmaceuticals - 0.1% | | | |
| Castle Creek Pharmaceutical Holdings, Inc. Series A4 (a)(c)(d) | | 9,636 | 2,085,327 |
|
| TOTAL NONCONVERTIBLE PREFERRED STOCKS | | | 3,370,863 |
|
| TOTAL PREFERRED STOCKS | | | |
| (Cost $59,270,805) | | | 104,888,572 |
| | | Principal Amount | Value |
|
| Convertible Bonds - 0.0% | | | |
| CONSUMER DISCRETIONARY - 0.0% | | | |
| Automobiles - 0.0% | | | |
| Neutron Holdings, Inc.: | | | |
| 4% 5/22/27 (c)(d) | | $433,800 | 479,566 |
| 4% 6/12/27 (c)(d) | | 115,200 | 127,354 |
| (Cost $549,000) | | | 606,920 |
|
| U.S. Treasury Obligations - 0.4% | | | |
| U.S. Treasury Bills, yield at date of purchase 1.11% 9/1/22 (g) | | | |
| (Cost $25,235,964) | | 25,260,000 | 25,213,669 |
|
| Preferred Securities - 0.0% | | | |
| INFORMATION TECHNOLOGY - 0.0% | | | |
| Electronic Equipment & Components - 0.0% | | | |
Enevate Corp. 0% 1/29/23
(c)(d) | | | |
| (Cost $613,815) | | $613,815 | $613,815 |
| | | Shares | Value |
|
| Money Market Funds - 6.3% | | | |
| Fidelity Cash Central Fund 2.01% (h) | | 371,634,811 | 371,709,138 |
| Fidelity Securities Lending Cash Central Fund 2.01% (h)(i) | | 80,546,486 | 80,554,541 |
| TOTAL MONEY MARKET FUNDS | | | |
| (Cost $452,263,679) | | | 452,263,679 |
|
| Equity Funds - 2.3% | | | |
| Domestic Equity Funds - 2.3% | | | |
| iShares Russell 1000 Growth Index ETF (b) | | | |
| (Cost $160,672,072) | | 674,000 | 165,244,580 |
| TOTAL INVESTMENT IN SECURITIES - 105.2% | | | |
| (Cost $5,248,389,308) | | | 7,495,274,186 |
| NET OTHER ASSETS (LIABILITIES) - (5.2)% | | | (370,338,641) |
| NET ASSETS - 100% | | | $7,124,935,545 |
| Futures Contracts | | | | | |
| | Number of contracts | Expiration Date | Notional Amount | Value | Unrealized Appreciation/(Depreciation) |
| Purchased | | | | | |
| Equity Index Contracts | | | | | |
| CME E-mini S&P 500 Index Contracts (United States) | 255 | Sept. 2022 | $52,702,125 | $4,839,166 | $4,839,166 |
The notional amount of futures purchased as a percentage of Net Assets is 0.7%
Security Type Abbreviations
ETF – Exchange-Traded Fund
Legend
(a) Non-income producing
(b) Security or a portion of the security is on loan at period end.
(c) Restricted securities (including private placements) - Investment in securities not registered under the Securities Act of 1933 (excluding 144A issues). At the end of the period, the value of restricted securities (excluding 144A issues) amounted to $163,328,517 or 2.3% of net assets.
(d) Level 3 security
(e) Security exempt from registration under Rule 144A of the Securities Act of 1933. These securities may be resold in transactions exempt from registration, normally to qualified institutional buyers. At the end of the period, the value of these securities amounted to $4,273,759 or 0.1% of net assets.
(f) Investment is owned by a wholly-owned subsidiary (Subsidiary) that is treated as a corporation for U.S. tax purposes.
(g) Security or a portion of the security was pledged to cover margin requirements for futures contracts. At period end, the value of securities pledged amounted to $13,671,877.
(h) Affiliated fund that is generally available only to investment companies and other accounts managed by Fidelity Investments. The rate quoted is the annualized seven-day yield of the fund at period end. A complete unaudited listing of the fund's holdings as of its most recent quarter end is available upon request. In addition, each Fidelity Central Fund's financial statements, which are not covered by the Fund's Report of Independent Registered Public Accounting Firm, are available on the SEC's website or upon request.
(i) Investment made with cash collateral received from securities on loan.
Additional information on each restricted holding is as follows:
| Security | Acquisition Date | Acquisition Cost |
| AgBiome LLC Series C | 6/29/18 | $1,687,925 |
| Ant International Co. Ltd. Class C | 5/16/18 | $5,978,358 |
| AppNexus, Inc. Series E (Escrow) | 8/1/14 | $0 |
| Atom Tickets LLC | 8/15/17 | $1,999,998 |
| Beta Technologies, Inc. Series A | 4/9/21 | $881,658 |
| Blink Health LLC Series A1 | 12/30/20 | $170,206 |
| Blink Health LLC Series C | 11/7/19 - 1/21/21 | $1,038,273 |
| Bolt Technology OU Series E | 1/3/22 | $4,717,904 |
| ByteDance Ltd. Series E1 | 11/18/20 | $4,067,284 |
| Castle Creek Biosciences, Inc. Series D2 | 6/28/21 | $110,200 |
| Castle Creek Pharmaceutical Holdings, Inc. Series A4 | 9/29/16 | $3,185,523 |
| Castle Creek Pharmaceutical Holdings, Inc. Series B | 10/9/18 | $440,268 |
| Cibus Corp. Series C | 2/16/18 | $1,525,763 |
| Cibus Corp. Series D | 5/10/19 | $498,300 |
| Cibus Corp. Series E | 6/23/21 | $442,584 |
| Databricks, Inc. Series G | 2/1/21 | $3,068,465 |
| Dataminr, Inc. Series D | 3/6/15 | $1,477,738 |
| Delhivery Private Ltd. | 5/20/21 | $1,438,501 |
| Delphix Corp. Series D | 7/10/15 | $2,185,884 |
| Diamond Foundry, Inc. Series C | 3/15/21 | $3,000,000 |
| Enevate Corp. Series E | 1/29/21 | $1,598,398 |
| Enevate Corp. 0% 1/29/23 | 1/29/21 | $613,815 |
| Epic Games, Inc. | 7/30/20 | $618,700 |
| Fanatics, Inc. Class A | 8/13/20 | $2,754,038 |
| FSN E-Commerce Ventures Private Ltd. | 10/7/20 - 10/26/20 | $2,246,418 |
| GoBrands, Inc. Series G | 3/2/21 | $4,894,459 |
| Instacart, Inc. Series H | 11/13/20 | $1,866,300 |
| Instacart, Inc. Series I | 2/26/21 | $1,745,000 |
| Jet.Com, Inc. Series B1 (Escrow) | 3/19/18 | $0 |
| JUUL Labs, Inc. Class B | 11/21/17 | $0 |
| JUUL Labs, Inc. Series C | 5/22/15 - 7/6/18 | $0 |
| JUUL Labs, Inc. Series D | 6/25/18 - 7/6/18 | $0 |
| Malwarebytes Corp. Series B | 12/21/15 | $3,416,996 |
| MOD Super Fast Pizza Holdings LLC Series 3 | 11/3/16 | $3,084,966 |
| MOD Super Fast PizzaHoldings LLC Series 4 | 12/14/17 | $287,556 |
| MOD Super Fast PizzaHoldings LLC Series 5 | 5/15/19 | $1,176,218 |
| MultiPlan Corp. warrants | 10/8/20 | $0 |
| Neutron Holdings, Inc. | 2/4/21 | $6,918 |
| Neutron Holdings, Inc. Series 1C | 7/3/18 | $2,268,276 |
| Neutron Holdings, Inc. 4% 5/22/27 | 6/4/20 | $433,800 |
| Neutron Holdings, Inc. 4% 6/12/27 | 6/12/20 | $115,200 |
| Nuvia, Inc. Series B | 3/16/21 | $148,486 |
| Rad Power Bikes, Inc. | 1/21/21 | $531,635 |
| Rad Power Bikes, Inc. Series A | 1/21/21 | $69,309 |
| Rad Power Bikes, Inc. Series C | 1/21/21 | $272,725 |
| Reddit, Inc. Series B | 7/26/17 | $1,835,324 |
| Reddit, Inc. Series E | 5/18/21 | $212,583 |
| Space Exploration Technologies Corp. Class A | 4/6/17 - 9/11/17 | $2,534,625 |
| Space Exploration Technologies Corp. Class C | 9/11/17 | $92,610 |
| Space Exploration Technologies Corp. Series G | 1/20/15 | $3,303,669 |
| Space Exploration Technologies Corp. Series H | 8/4/17 | $856,980 |
| Space Exploration Technologies Corp. Series N | 8/4/20 | $3,455,730 |
| Stripe, Inc. Class B | 5/18/21 | $798,555 |
| Stripe, Inc. Series H | 3/15/21 | $349,088 |
| Tanium, Inc. Class B | 4/21/17 | $749,609 |
| Tory Burch LLC | 5/14/15 | $7,600,030 |
| Waymo LLC Series A2 | 5/8/20 | $1,305,181 |
| Xsight Labs Ltd. Series D | 2/16/21 | $1,123,438 |
Affiliated Central Funds
Fiscal year to date information regarding the Fund's investments in Fidelity Central Funds, including the ownership percentage, is presented below.
| Fund | Value, beginning of period | Purchases | Sales Proceeds | Dividend Income | Realized Gain/Loss | Change in Unrealized appreciation (depreciation) | Value, end of period | % ownership, end of period |
| Fidelity Cash Central Fund 2.01% | $52,071,809 | $3,634,012,571 | $3,314,375,242 | $1,044,986 | $-- | $-- | $371,709,138 | 0.7% |
| Fidelity Securities Lending Cash Central Fund 2.01% | 80,352,964 | 1,399,067,787 | 1,398,866,210 | 1,355,087 | -- | -- | 80,554,541 | 0.2% |
| Total | $132,424,773 | $5,033,080,358 | $4,713,241,452 | $2,400,073 | $-- | $-- | $452,263,679 | |
Amounts in the income column in the above table include any capital gain distributions from underlying funds, which are presented in the corresponding line-item in the Statement of Operations, if applicable. Amount for Fidelity Securities Lending Cash Central Fund represents the income earned on investing cash collateral, less rebates paid to borrowers and any lending agent fees associated with the loan, plus any premium payments received for lending certain types of securities.
Investment Valuation
The following is a summary of the inputs used, as of July 31, 2022, involving the Fund's assets and liabilities carried at fair value. The inputs or methodology used for valuing securities may not be an indication of the risk associated with investing in those securities. For more information on valuation inputs, and their aggregation into the levels used below, please refer to the Investment Valuation section in the accompanying Notes to Financial Statements.
| | Valuation Inputs at Reporting Date: |
| Description | Total | Level 1 | Level 2 | Level 3 |
| Investments in Securities: | | | | |
| Equities: | | | | |
| Communication Services | $650,232,538 | $641,306,590 | $3,643,176 | $5,282,772 |
| Consumer Discretionary | 2,142,331,791 | 2,081,440,402 | 28,515,801 | 32,375,588 |
| Consumer Staples | 85,653,901 | 77,553,631 | -- | 8,100,270 |
| Energy | 313,409,871 | 282,603,937 | 30,805,934 | -- |
| Financials | 60,751,684 | 55,071,576 | 2,715,537 | 2,964,571 |
| Health Care | 552,148,063 | 544,343,930 | 1,950,845 | 5,853,288 |
| Industrials | 162,194,742 | 96,601,700 | 4,720,985 | 60,872,057 |
| Information Technology | 2,778,871,550 | 2,751,359,885 | -- | 27,511,665 |
| Materials | 92,677,591 | 88,785,091 | -- | 3,892,500 |
| Real Estate | 9,789,609 | 9,789,609 | -- | -- |
| Utilities | 3,270,183 | 1,989,600 | 1,280,583 | -- |
| Corporate Bonds | 606,920 | -- | -- | 606,920 |
| U.S. Government and Government Agency Obligations | 25,213,669 | -- | 25,213,669 | -- |
| Preferred Securities | 613,815 | -- | -- | 613,815 |
| Money Market Funds | 452,263,679 | 452,263,679 | -- | -- |
| Equity Funds | 165,244,580 | 165,244,580 | -- | -- |
| Total Investments in Securities: | $7,495,274,186 | $7,248,354,210 | $98,846,530 | $148,073,446 |
| Derivative Instruments: | | | | |
| Assets | | | | |
| Futures Contracts | $4,839,166 | $4,839,166 | $-- | $-- |
| Total Assets | $4,839,166 | $4,839,166 | $-- | $-- |
| Total Derivative Instruments: | $4,839,166 | $4,839,166 | $-- | $-- |
| Net unrealized depreciation on unfunded commitments | $( 315,970) | $-- | $-- | $( 315,970) |
The following is a reconciliation of Investments in Securities for which Level 3 inputs were used in determining value:
| Investments in Securities: | |
| Beginning Balance | $201,417,798 |
| Net Realized Gain (Loss) on Investment Securities | (3,772,682) |
| Net Unrealized Gain (Loss) on Investment Securities | (15,579,426) |
| Cost of Purchases | 4,979,311 |
| Proceeds of Sales | (10,523) |
| Amortization/Accretion | -- |
| Transfers into Level 3 | 123,060 |
| Transfers out of Level 3 | (39,084,092) |
| Ending Balance | $148,073,446 |
| The change in unrealized gain (loss) for the period attributable to Level 3 securities held at July 31, 2022 | $(19,356,390) |
The information used in the above reconciliation represents fiscal year to date activity for any Investments in Securities identified as using Level 3 inputs at either the beginning or the end of the current fiscal period. Transfers into Level 3 were attributable to a lack of observable market data resulting from decreases in market activity, decreases in liquidity, security restructurings or corporate actions. Transfers out of Level 3 were attributable to observable market data becoming available for those securities. Cost of purchases and proceeds of sales may include securities received and/or delivered through in-kind transactions. Transfers in or out of Level 3 represent the beginning value of any Security or Instrument where a change in the pricing level occurred from the beginning to the end of the period. The cost of purchases and the proceeds of sales may include securities received or delivered through corporate actions or exchanges. Realized and unrealized gains (losses) disclosed in the reconciliation are included in Net Gain (Loss) on the Fund's Statement of Operations.
Value of Derivative Instruments
The following table is a summary of the Fund's value of derivative instruments by primary risk exposure as of July 31, 2022. For additional information on derivative instruments, please refer to the Derivative Instruments section in the accompanying Notes to Financial Statements.
| Primary Risk Exposure / Derivative Type | Value |
| | Asset | Liability |
| Equity Risk | | |
| Futures Contracts(a) | $4,839,166 | $0 |
| Total Equity Risk | 4,839,166 | 0 |
| Total Value of Derivatives | $4,839,166 | $0 |
(a) Reflects gross cumulative appreciation (depreciation) on futures contracts as presented in the Schedule of Investments. In the Statement of Assets and Liabilities, the period end daily variation margin is included in receivable or payable for daily variation margin on futures contracts, and the net cumulative appreciation (depreciation) is included in Total accumulated earnings (loss).
See accompanying notes which are an integral part of the financial statements.
Financial Statements
Statement of Assets and Liabilities
| | | July 31, 2022 |
| Assets | | |
Investment in securities, at value (including securities loaned of $80,710,116) — See accompanying schedule:
Unaffiliated issuers (cost $4,796,125,629) | $7,043,010,507 | |
| Fidelity Central Funds (cost $452,263,679) | 452,263,679 | |
| Total Investment in Securities (cost $5,248,389,308) | | $7,495,274,186 |
| Foreign currency held at value (cost $2,013) | | 2,039 |
| Receivable for investments sold | | 10,829,769 |
| Receivable for fund shares sold | | 2,452,013 |
| Dividends receivable | | 1,454,777 |
| Interest receivable | | 47,348 |
| Distributions receivable from Fidelity Central Funds | | 691,430 |
| Receivable for daily variation margin on futures contracts | | 4,016,915 |
| Other receivables | | 485,071 |
| Total assets | | 7,515,253,548 |
| Liabilities | | |
| Payable to custodian bank | $221,365 | |
| Payable for investments purchased | 1,200,904 | |
| Unrealized depreciation on unfunded commitments | 315,970 | |
| Payable for fund shares redeemed | 304,515,052 | |
| Other payables and accrued expenses | 3,521,610 | |
| Collateral on securities loaned | 80,543,102 | |
| Total liabilities | | 390,318,003 |
| Net Assets | | $7,124,935,545 |
| Net Assets consist of: | | |
| Paid in capital | | $4,896,950,805 |
| Total accumulated earnings (loss) | | 2,227,984,740 |
| Net Assets | | $7,124,935,545 |
| Net Asset Value, offering price and redemption price per share ($7,124,935,545 ÷ 594,558,338 shares) | | $11.98 |
See accompanying notes which are an integral part of the financial statements.
Statement of Operations
| | | Year ended July 31, 2022 |
| Investment Income | | |
| Dividends | | $25,721,286 |
| Interest | | 68,633 |
| Income from Fidelity Central Funds (including $1,355,087 from security lending) | | 2,400,073 |
| Total income | | 28,189,992 |
| Expenses | | |
| Custodian fees and expenses | $170,548 | |
| Independent trustees' fees and expenses | 20,332 | |
| Legal | 14 | |
| Interest | 14,776 | |
| Total expenses | | 205,670 |
| Net investment income (loss) | | 27,984,322 |
| Realized and Unrealized Gain (Loss) | | |
| Net realized gain (loss) on: | | |
| Investment securities: | | |
| Unaffiliated issuers (net of foreign taxes of $439,687) | 250,144,638 | |
| Foreign currency transactions | (301,617) | |
| Futures contracts | (20,689,070) | |
| Total net realized gain (loss) | | 229,153,951 |
| Change in net unrealized appreciation (depreciation) on: | | |
| Investment securities: | | |
| Unaffiliated issuers (net of increase in deferred foreign taxes of $872,519) | (1,578,764,166) | |
| Unfunded commitments | 1,432,367 | |
| Assets and liabilities in foreign currencies | 316,623 | |
| Futures contracts | 4,839,166 | |
| Total change in net unrealized appreciation (depreciation) | | (1,572,176,010) |
| Net gain (loss) | | (1,343,022,059) |
| Net increase (decrease) in net assets resulting from operations | | $(1,315,037,737) |
See accompanying notes which are an integral part of the financial statements.
Statement of Changes in Net Assets
| | Year ended July 31, 2022 | Year ended July 31, 2021 |
| Increase (Decrease) in Net Assets | | |
| Operations | | |
| Net investment income (loss) | $27,984,322 | $18,831,626 |
| Net realized gain (loss) | 229,153,951 | 1,843,296,270 |
| Change in net unrealized appreciation (depreciation) | (1,572,176,010) | 445,634,791 |
| Net increase (decrease) in net assets resulting from operations | (1,315,037,737) | 2,307,762,687 |
| Distributions to shareholders | (1,312,935,433) | (1,909,413,522) |
| Share transactions | | |
| Proceeds from sales of shares | 3,773,203,170 | 1,010,876,682 |
| Reinvestment of distributions | 1,312,935,433 | 1,909,413,522 |
| Cost of shares redeemed | (1,613,105,018) | (2,828,198,616) |
| Net increase (decrease) in net assets resulting from share transactions | 3,473,033,585 | 92,091,588 |
| Total increase (decrease) in net assets | 845,060,415 | 490,440,753 |
| Net Assets | | |
| Beginning of period | 6,279,875,130 | 5,789,434,377 |
| End of period | $7,124,935,545 | $6,279,875,130 |
| Other Information | | |
| Shares | | |
| Sold | 297,595,283 | 56,402,633 |
| Issued in reinvestment of distributions | 78,714,050 | 119,502,616 |
| Redeemed | (106,486,525) | (151,964,287) |
| Net increase (decrease) | 269,822,808 | 23,940,962 |
See accompanying notes which are an integral part of the financial statements.
Financial Highlights
Fidelity Series Blue Chip Growth Fund
| | | | | | |
| Years ended July 31, | 2022 | 2021 | 2020 | 2019 | 2018 |
| Selected Per–Share Data | | | | | |
| Net asset value, beginning of period | $19.34 | $19.25 | $15.57 | $15.90 | $14.07 |
| Income from Investment Operations | | | | | |
| Net investment income (loss)A,B | .07 | .06 | .09 | .10 | .12C |
| Net realized and unrealized gain (loss) | (3.37) | 6.76 | 5.30 | 1.58 | 3.28 |
| Total from investment operations | (3.30) | 6.82 | 5.39 | 1.68 | 3.40 |
| Distributions from net investment income | (.05) | (.10) | (.11) | (.12) | (.07) |
| Distributions from net realized gain | (4.00) | (6.63) | (1.60) | (1.89) | (1.50) |
| Total distributions | (4.06)D | (6.73) | (1.71) | (2.01) | (1.57) |
| Net asset value, end of period | $11.98 | $19.34 | $19.25 | $15.57 | $15.90 |
| Total ReturnE | (22.51)% | 46.98% | 39.00% | 11.85% | 26.54% |
| Ratios to Average Net AssetsB,F,G | | | | | |
| Expenses before reductions | - %H | - %H | - %H | - %H | - %H |
| Expenses net of fee waivers, if any | - %H | - %H | - %H | - %H | - %H |
| Expenses net of all reductions | - %H | - %H | - %H | - %H | - %H |
| Net investment income (loss) | .45% | .31% | .59% | .71% | .81%C |
| Supplemental Data | | | | | |
| Net assets, end of period (000 omitted) | $7,124,936 | $6,279,875 | $5,789,434 | $5,846,965 | $6,005,980 |
| Portfolio turnover rateI | 48% | 53% | 52%J | 53% | 41% |
A Calculated based on average shares outstanding during the period.
B Net investment income (loss) is affected by the timing of the declaration of dividends by any underlying mutual funds or exchange-traded funds (ETFs). Net investment income (loss) of any such underlying funds is not included in the Fund's net investment income (loss) ratio.
C Net investment income per share reflects one or more large, non-recurring dividend(s) which amounted to $.01 per share. Excluding such non-recurring dividend(s), the ratio of net investment income (loss) to average net assets would have been .71%.
D Total distributions per share do not sum due to rounding.
E Total returns would have been lower if certain expenses had not been reduced during the applicable periods shown.
F Fees and expenses of any underlying mutual funds or exchange-traded funds (ETFs) are not included in the Fund's expense ratio. The Fund indirectly bears its proportionate share of these expenses. For additional expense information related to investments in Fidelity Central Funds, please refer to the "Investments in Fidelity Central Funds" note found in the Notes to Financial Statements section of the most recent Annual or Semi-Annual report.
G Expense ratios reflect operating expenses of the class. Expenses before reductions do not reflect amounts reimbursed, waived, or reduced through arrangements with the investment adviser, brokerage services, or other offset arrangements, if applicable, and do not represent the amount paid by the class during periods when reimbursements, waivers or reductions occur.
H Amount represents less than .005%.
I Amount does not include the portfolio activity of any underlying mutual funds or exchange-traded funds (ETFs).
J Portfolio turnover rate excludes securities received or delivered in-kind.
See accompanying notes which are an integral part of the financial statements.
Notes to Financial Statements
For the period ended July 31, 2022
1. Organization.
Fidelity Series Blue Chip Growth Fund (the Fund) is a fund of Fidelity Securities Fund (the Trust) and is authorized to issue an unlimited number of shares. Shares are offered only to certain other Fidelity funds, Fidelity managed 529 plans, and Fidelity managed collective investment trusts. The Trust is registered under the Investment Company Act of 1940, as amended (the 1940 Act), as an open-end management investment company organized as a Massachusetts business trust.
2. Investments in Fidelity Central Funds.
Funds may invest in Fidelity Central Funds, which are open-end investment companies generally available only to other investment companies and accounts managed by the investment adviser and its affiliates. The Schedule of Investments lists any Fidelity Central Funds held as an investment as of period end, but does not include the underlying holdings of each Fidelity Central Fund. An investing fund indirectly bears its proportionate share of the expenses of the underlying Fidelity Central Funds.
Based on its investment objective, each Fidelity Central Fund may invest or participate in various investment vehicles or strategies that are similar to those of the investing fund. These strategies are consistent with the investment objectives of the investing fund and may involve certain economic risks which may cause a decline in value of each of the Fidelity Central Funds and thus a decline in the value of the investing fund.
| Fidelity Central Fund | Investment Manager | Investment Objective | Investment Practices | Expense Ratio(a) |
| Fidelity Money Market Central Funds | Fidelity Management & Research Company LLC (FMR) | Each fund seeks to obtain a high level of current income consistent with the preservation of capital and liquidity. | Short-term Investments | Less than .005% |
(a) Expenses expressed as a percentage of average net assets and are as of each underlying Central Fund's most recent annual or semi-annual shareholder report.
A complete unaudited list of holdings for each Fidelity Central Fund is available upon request or at the Securities and Exchange Commission website at www.sec.gov. In addition, the financial statements of the Fidelity Central Funds which contain the significant accounting policies (including investment valuation policies) of those funds, and are not covered by the Report of Independent Registered Public Accounting Firm, are available on the Securities and Exchange Commission website or upon request.
3. Significant Accounting Policies.
The Fund is an investment company and applies the accounting and reporting guidance of the Financial Accounting Standards Board (FASB) Accounting Standards Codification Topic 946 Financial Services - Investment Companies. The financial statements have been prepared in conformity with accounting principles generally accepted in the United States of America (GAAP), which require management to make certain estimates and assumptions at the date of the financial statements. Actual results could differ from those estimates. Subsequent events, if any, through the date that the financial statements were issued have been evaluated in the preparation of the financial statements. The Fund's Schedule of Investments lists any underlying mutual funds or exchange-traded funds (ETFs) but does not include the underlying holdings of these funds. The following summarizes the significant accounting policies of the Fund:
Investment Valuation. Investments are valued as of 4:00 p.m. Eastern time on the last calendar day of the period. The Board of Trustees (the Board) has delegated the day to day responsibility for the valuation of the Fund's investments to the Fair Value Committee (the Committee) established by the Fund's investment adviser. In accordance with valuation policies and procedures approved by the Board, the Fund attempts to obtain prices from one or more third party pricing vendors or brokers to value its investments. When current market prices, quotations or currency exchange rates are not readily available or reliable, investments will be fair valued in good faith by the Committee, in accordance with procedures adopted by the Board. Factors used in determining fair value vary by investment type and may include market or investment specific events, changes in interest rates and credit quality. The frequency with which these procedures are used cannot be predicted and they may be utilized to a significant extent. The Committee oversees the Fund's valuation policies and procedures and reports to the Board on the Committee's activities and fair value determinations. The Board monitors the appropriateness of the procedures used in valuing the Fund's investments and ratifies the fair value determinations of the Committee.
The Fund categorizes the inputs to valuation techniques used to value its investments into a disclosure hierarchy consisting of three levels as shown below:
- Level 1 – unadjusted quoted prices in active markets for identical investments
- Level 2 – other significant observable inputs (including quoted prices for similar investments, interest rates, prepayment speeds, etc.)
- Level 3 – unobservable inputs (including the Fund's own assumptions based on the best information available)
Valuation techniques used to value the Fund's investments by major category are as follows:
Equity securities, including restricted securities, for which market quotations are readily available, are valued at the last reported sale price or official closing price as reported by a third party pricing vendor on the primary market or exchange on which they are traded and are categorized as Level 1 in the hierarchy. In the event there were no sales during the day or closing prices are not available, securities are valued at the last quoted bid price or may be valued using the last available price and are generally categorized as Level 2 in the hierarchy. For foreign equity securities, when market or security specific events arise, comparisons to the valuation of American Depositary Receipts (ADRs), futures contracts, ETFs and certain indexes as well as quoted prices for similar securities may be used and would be categorized as Level 2 in the hierarchy. For equity securities, including restricted securities, where observable inputs are limited, assumptions about market activity and risk are used and these securities may be categorized as Level 3 in the hierarchy. Securities, including private placements or other restricted securities, for which observable inputs are not available are valued using alternate valuation approaches, including the market approach, the income approach and cost approach, and are categorized as Level 3 in the hierarchy. The market approach considers factors including the price of recent investments in the same or a similar security or financial metrics of comparable securities. The income approach considers factors including expected future cash flows, security specific risks and corresponding discount rates. The cost approach considers factors including the value of the security's underlying assets and liabilities.
Debt securities, including restricted securities, are valued based on evaluated prices received from third party pricing vendors or from brokers who make markets in such securities. Corporate bonds, preferred securities and U.S. government and government agency obligations are valued by pricing vendors who utilize matrix pricing which considers yield or price of bonds of comparable quality, coupon, maturity and type or by broker-supplied prices When independent prices are unavailable or unreliable, debt securities may be valued utilizing pricing methodologies which consider similar factors that would be used by third party pricing vendors. Debt securities are generally categorized as Level 2 in the hierarchy but may be Level 3 depending on the circumstances. ETFs are valued at their last sale price or official closing price as reported by a third party pricing vendor on the primary market or exchange on which they are traded and are categorized as Level 1 in the hierarchy. In the event there were no sales during the day but the exchange reports a closing bid level, ETFs are valued at the closing bid and would be categorized as Level 1 in the hierarchy. In the event there was no closing bid, ETFs may be valued by another method that the Board believes reflects fair value in accordance with the Board's fair value pricing policies and may be categorized as Level 2 in the hierarchy.
Futures contracts are valued at the settlement price established each day by the board of trade or exchange on which they are traded and are categorized as Level 1 in the hierarchy. Investments in open-end mutual funds, including the Fidelity Central Funds, are valued at their closing net asset value (NAV) each business day and are categorized as Level 1 in the hierarchy.
The following provides information on Level 3 securities held by the Fund that were valued at period end based on unobservable inputs. These amounts exclude valuations provided by a broker.
| Asset Type | Fair Value | Valuation Technique(s) | Unobservable Input | Amount or Range/Weighted Average | Impact to Valuation from an Increase in Input(a) |
| Equities | $ 146,852,711 | Market approach | Discount rate | 5.3% - 6.5% / 5.6% | Decrease |
| | | | Transaction price | $1.11 - $700.00 / $486.44 | Increase |
| | | Recovery value | Recovery value | $0.00 - $0.03 / $0.00 | Increase |
| | | | Discount for lack of marketability | 5.0% | Decrease |
| | | Book value | Book value multiple | 1.7 | Increase |
| | | Market comparable | Discount rate | 30.0% | Decrease |
| | | | Enterprise value/Revenue multiple (EV/R) | 2.0 - 26.0 / 6.7 | Increase |
| | | | Enterprise value/Gross profit multiple (EV/GP) | 8.8 | Increase |
| | | | Enterprise value/EBITDA multiple (EV/EBITDA) | 9.3 | Increase |
| | | | Probability rate | 25.0% - 75.0% / 50.0% | Increase |
| | | | Liquidity preference | $218.20 - $246.13 / $232.90 | Increase |
| | | Discounted cash flow | Weighted average cost of capital (WACC) | 33.5% - 42.0% / 39.2% | Decrease |
| | | | Exit multiple | 2.3 - 5.0 / 4.1 | Increase |
| | | Black scholes | Term | 5.0 | Increase |
| | | | Volatility | 75.0% | Increase |
| Corporate Bonds | $606,920 | Market comparable | Enterprise value/Revenue multiple (EV/R) | 2.8 | Increase |
| Preferred Securities | $613,815 | Market approach | Transaction price | $100.00 | Increase |
(a) Represents the directional change in the fair value of the Level 3 investments that could have resulted from an increase in the corresponding input as of period end. A decrease to the unobservable input would have had the opposite effect. Significant changes in these inputs may have resulted in a significantly higher or lower fair value measurement at period end.
Changes in valuation techniques may result in transfers in or out of an assigned level within the disclosure hierarchy. The aggregate value of investments by input level as of July 31, 2022, as well as a roll forward of Level 3 investments, is included at the end of the Fund's Schedule of Investments.
Foreign Currency. Certain Funds may use foreign currency contracts to facilitate transactions in foreign-denominated securities. Gains and losses from these transactions may arise from changes in the value of the foreign currency or if the counterparties do not perform under the contracts' terms.
Foreign-denominated assets, including investment securities, and liabilities are translated into U.S. dollars at the exchange rates at period end. Purchases and sales of investment securities, income and dividends received, and expenses denominated in foreign currencies are translated into U.S. dollars at the exchange rate in effect on the transaction date.
The effects of exchange rate fluctuations on investments are included with the net realized and unrealized gain (loss) on investment securities. Other foreign currency transactions resulting in realized and unrealized gain (loss) are disclosed separately.
Investment Transactions and Income. For financial reporting purposes, the Fund's investment holdings and NAV include trades executed through the end of the last business day of the period. The NAV per share for processing shareholder transactions is calculated as of the close of business of the New York Stock Exchange (NYSE), normally 4:00 p.m. Eastern time and includes trades executed through the end of the prior business day. Gains and losses on securities sold are determined on the basis of identified cost and include proceeds received from litigation. Commissions paid to certain brokers with whom the investment adviser, or its affiliates, places trades on behalf of a fund include an amount in addition to trade execution, which may be rebated back to a fund. Any such rebates are included in net realized gain (loss) on investments in the Statement of Operations. Dividend income is recorded on the ex-dividend date, except for certain dividends from foreign securities where the ex-dividend date may have passed, which are recorded as soon as the Fund is informed of the ex-dividend date. Non-cash dividends included in dividend income, if any, are recorded at the fair market value of the securities received. Income and capital gain distributions from Fidelity Central Funds, if any, are recorded on the ex-dividend date. Certain distributions received by the Fund represent a return of capital or capital gain. The Fund determines the components of these distributions subsequent to the ex-dividend date, based upon receipt of tax filings or other correspondence relating to the underlying investment. These distributions are recorded as a reduction of cost of investments and/or as a realized gain. Interest income is accrued as earned and includes coupon interest and amortization of premium and accretion of discount on debt securities as applicable. Investment income is recorded net of foreign taxes withheld where recovery of such taxes is uncertain. Funds may file withholding tax reclaims in certain jurisdictions to recover a portion of amounts previously withheld. Any withholding tax reclaims income is included in the Statement of Operations in dividends. Any receivables for withholding tax reclaims are included in the Statement of Assets and Liabilities in dividends receivable.
Expenses. Expenses directly attributable to a fund are charged to that fund. Expenses attributable to more than one fund are allocated among the respective funds on the basis of relative net assets or other appropriate methods. Expenses included in the accompanying financial statements reflect the expenses of that fund and do not include any expenses associated with any underlying mutual funds or exchange-traded funds. Although not included in a fund's expenses, a fund indirectly bears its proportionate share of these expenses through the net asset value of each underlying mutual fund or exchange-traded fund. Expense estimates are accrued in the period to which they relate and adjustments are made when actual amounts are known.
Income Tax Information and Distributions to Shareholders. Each year, the Fund intends to qualify as a regulated investment company under Subchapter M of the Internal Revenue Code, including distributing substantially all of its taxable income and realized gains. As a result, no provision for U.S. Federal income taxes is required. As of July 31, 2022, the Fund did not have any unrecognized tax benefits in the financial statements; nor is the Fund aware of any tax positions for which it is reasonably possible that the total amounts of unrecognized tax benefits will significantly change in the next twelve months. The Fund files a U.S. federal tax return, in addition to state and local tax returns as required. The Fund's federal income tax returns are subject to examination by the Internal Revenue Service (IRS) for a period of three fiscal years after they are filed. State and local tax returns may be subject to examination for an additional fiscal year depending on the jurisdiction. Foreign taxes are provided for based on the Fund's understanding of the tax rules and rates that exist in the foreign markets in which it invests. The Fund is subject to a tax imposed on capital gains by certain countries in which it invests. An estimated deferred tax liability for net unrealized appreciation on the applicable securities is included in Other payables and accrued expenses on the Statement of Assets & Liabilities.
Distributions are declared and recorded on the ex-dividend date. Income and capital gain distributions are determined in accordance with income tax regulations, which may differ from GAAP. In addition, the Fund claimed a portion of the payment made to redeeming shareholders as a distribution for income tax purposes.
Capital accounts within the financial statements are adjusted for permanent book-tax differences. These adjustments have no impact on net assets or the results of operations. Capital accounts are not adjusted for temporary book-tax differences which will reverse in a subsequent period.
Book-tax differences are primarily due to futures contracts, foreign currency transactions, certain foreign taxes, passive foreign investment companies (PFIC), partnerships, losses deferred due to wash sales and excise tax regulations.
As of period end, the cost and unrealized appreciation (depreciation) in securities, and derivatives if applicable, for federal income tax purposes were as follows:
| Gross unrealized appreciation | $2,726,979,692 |
| Gross unrealized depreciation | (556,607,253) |
| Net unrealized appreciation (depreciation) | $2,170,372,439 |
| Tax Cost | $5,324,585,696 |
The tax-based components of distributable earnings as of period end were as follows:
| Undistributed ordinary income | $17,468,935 |
| Undistributed long-term capital gain | $202,490,591 |
| Net unrealized appreciation (depreciation) on securities and other investments | $2,170,695,626 |
The Fund intends to elect to defer to its next fiscal year $159,620,947 of capital losses recognized during the period November 1,2021 to July 31, 2022.
The tax character of distributions paid was as follows:
| | July 31, 2022 | July 31, 2021 |
| Ordinary Income | $226,283,391 | $ 151,548,380 |
| Long-term Capital Gains | 1,086,652,042 | 1,757,865,142 |
| Total | $1,312,935,433 | $1,909,413,522 |
Restricted Securities (including Private Placements). Funds may invest in securities that are subject to legal or contractual restrictions on resale. These securities generally may be resold in transactions exempt from registration or to the public if the securities are registered. Disposal of these securities may involve time-consuming negotiations and expense, and prompt sale at an acceptable price may be difficult. Information regarding restricted securities held at period end is included at the end of the Schedule of Investments, if applicable.
Commitments. A commitment is an agreement to acquire an investment at a future date (subject to conditions) in connection with a potential public or non-public offering. Commitments outstanding at period end are presented in the table below. Unrealized appreciation (depreciation) on any commitments outstanding at period end is separately presented in the Statements of Assets and Liabilities as Unrealized appreciation (depreciation) on unfunded commitments, and any change in unrealized appreciation (depreciation) on unfunded commitments during the period is separately presented in the Statement of Operations, as applicable based on contractual conditions of each commitment.
| | Investment to be Acquired | Commitment Amount | Unrealized Appreciation (Depreciation) |
| Fidelity Series Blue Chip Growth Fund | Stripe, Inc.
| $315,970 | $(315,970) |
Special Purpose Acquisition Companies. Funds may invest in stock, warrants, and other securities of special purpose acquisition companies (SPACs) or similar special purpose entities. A SPAC is a publicly traded company that raises investment capital via an initial public offering (IPO) for the purpose of acquiring the equity securities of one or more existing companies via merger, business combination, acquisition or other similar transactions within a designated time frame.
Private Investment in Public Equity. Funds may acquire equity securities of an issuer through a private investment in a public equity (PIPE) transaction, including through commitments to purchase securities on a when-issued basis. A PIPE typically involves the purchase of securities directly from a publicly traded company in a private placement transaction. Securities purchased through PIPE transactions will be restricted from trading and considered illiquid until a resale registration statement for the shares is filed and declared effective.
At the current and/or prior period end, the Fund had commitments to purchase when-issued securities through PIPE transactions with SPACs. The commitments are contingent upon the SPACs acquiring the securities of target companies. Unrealized appreciation (depreciation) on any commitments outstanding at period end is separately presented in the Statements of Assets and Liabilities as Unrealized appreciation (depreciation) on unfunded commitments, and any change in unrealized appreciation (depreciation) on unfunded commitments during the period is separately presented in the Statement of Operations, as applicable.
Consolidated Subsidiary. The Funds included in the table below hold certain investments through a wholly-owned subsidiary ("Subsidiary"), which may be subject to federal and state taxes upon disposition.
As of period end, investments in Subsidiaries were as follows:
| | $ Amount | % of Net Assets |
| Fidelity Series Blue Chip Growth Fund | 16,396,169 | .23 |
The financial statements have been consolidated to include the Subsidiary accounts where applicable. Accordingly, all inter-company transactions and balances have been eliminated.
At period end, any estimated tax liability for these investments is presented as "Deferred taxes" in the Statement of Assets and Liabilities and included in "Change in net unrealized appreciation (depreciation) on investment securities" in the Statement of Operations. The tax liability incurred may differ materially depending on conditions when these investments are disposed. Any cash held by a Subsidiary is restricted as to its use and is presented as "Restricted cash" in the Statement of Assets and Liabilities, if applicable.
4. Derivative Instruments.
Risk Exposures and the Use of Derivative Instruments. Investment objectives allow a fund to enter into various types of derivative contracts, including futures contracts. Derivatives are investments whose value is primarily derived from underlying assets, indices or reference rates and may be transacted on an exchange or over-the-counter (OTC). Derivatives may involve a future commitment to buy or sell a specified asset based on specified terms, to exchange future cash flows at periodic intervals based on a notional principal amount, or for one party to make one or more payments upon the occurrence of specified events in exchange for periodic payments from the other party.
Derivatives were used to increase returns and to manage exposure to certain risks as defined below. The success of any strategy involving derivatives depends on analysis of numerous economic factors, and if the strategies for investment do not work as intended, the objectives may not be achieved.
Derivatives were used to increase or decrease exposure to the following risk(s):
| Equity Risk | Equity risk relates to the fluctuations in the value of financial instruments as a result of changes in market prices (other than those arising from interest rate risk or foreign exchange risk), whether caused by factors specific to an individual investment, its issuer, or all factors affecting all instruments traded in a market or market segment.
|
Funds are also exposed to additional risks from investing in derivatives, such as liquidity risk and counterparty credit risk. Liquidity risk is the risk that a fund will be unable to close out the derivative in the open market in a timely manner. Counterparty credit risk is the risk that the counterparty will not be able to fulfill its obligation to a fund. Exchange-traded contracts are not covered by the ISDA Master Agreement; however counterparty credit risk related to these contracts may be mitigated by the protection provided by the exchange on which they trade.
Investing in derivatives may involve greater risks than investing in the underlying assets directly and, to varying degrees, may involve risk of loss in excess of any initial investment and collateral received and amounts recognized in the Statement of Assets and Liabilities. In addition, there may be the risk that the change in value of the derivative contract does not correspond to the change in value of the underlying instrument.
Futures Contracts. A futures contract is an agreement between two parties to buy or sell a specified underlying instrument for a fixed price at a specified future date. Futures contracts were used to manage exposure to the stock market.
Upon entering into a futures contract, a fund is required to deposit either cash or securities (initial margin) with a clearing broker in an amount equal to a certain percentage of the face value of the contract. Futures contracts are marked-to-market daily and subsequent daily payments are made or received by a fund depending on the daily fluctuations in the value of the futures contracts and are recorded as unrealized appreciation or (depreciation). This receivable and/or payable, if any, is included in daily variation margin on futures contracts in the Statement of Assets and Liabilities. Realized gain or (loss) is recorded upon the expiration or closing of a futures contract. The net realized gain (loss) and change in net unrealized appreciation (depreciation) on futures contracts during the period is presented in the Statement of Operations.
Any open futures contracts at period end are presented in the Schedule of Investments under the caption "Futures Contracts". The notional amount at value reflects each contract's exposure to the underlying instrument or index at period end, and is representative of volume of activity during the period unless an average notional amount is presented. Any securities deposited to meet initial margin requirements are identified in the Schedule of Investments. Any cash deposited to meet initial margin requirements is presented as segregated cash with brokers for derivative instruments in the Statement of Assets and Liabilities.
5. Purchases and Sales of Investments.
Purchases and sales of securities, other than short-term securities, U.S. government securities and in-kind transactions, as applicable, are noted in the table below.
| | Purchases ($) | Sales ($) |
| Fidelity Series Blue Chip Growth Fund | 5,041,323,428 | 2,961,298,745 |
6. Fees and Other Transactions with Affiliates.
Management Fee. Fidelity Management & Research Company LLC (the investment adviser) and its affiliates provide the Fund with investment management related services for which the Fund does not pay a management fee. Under the management contract, the investment adviser or an affiliate pays all ordinary operating expenses of the Fund, except custody fees, fees and expenses of the independent Trustees, and certain miscellaneous expenses such as proxy and shareholder meeting expenses.
Brokerage Commissions. A portion of portfolio transactions were placed with brokerage firms which are affiliates of the investment adviser. Brokerage commissions are included in net realized gain (loss) and change in net unrealized appreciation (depreciation) in the Statement of Operations. The commissions paid to these affiliated firms were as follows:
| | Amount |
| Fidelity Series Blue Chip Growth Fund | $71,667 |
Interfund Lending Program. Pursuant to an Exemptive Order issued by the Securities and Exchange Commission (the SEC), the Fund, along with other registered investment companies having management contracts with Fidelity Management & Research Company LLC (FMR), or other affiliated entities of FMR, may participate in an interfund lending program. This program provides an alternative credit facility allowing the Fund to borrow from, or lend money to, other participating affiliated funds. At period end, there were no interfund loans outstanding. Activity in this program during the period for which loans were outstanding was as follows:
| | Borrower or Lender | Average Loan Balance | Weighted Average Interest Rate | Interest Expense |
| Fidelity Series Blue Chip Growth Fund | Borrower | $59,057,571 | .43% | $14,776 |
Interfund Trades. Funds may purchase from or sell securities to other Fidelity Funds under procedures adopted by the Board. The procedures have been designed to ensure these interfund trades are executed in accordance with Rule 17a-7 of the 1940 Act. Any interfund trades are included within the respective purchases and sales amounts shown in the Purchases and Sales of Investments note. Interfund trades during the period are noted in the table below.
| | Purchases ($) | Sales ($) | Realized Gain (Loss) ($) |
| Fidelity Series Blue Chip Growth Fund | 427,862,166 | 160,975,030 | 12,958,075 |
Other. During the period, the investment adviser reimbursed the Fund for certain losses as follows:
| | Amount ($) |
| Fidelity Series Blue Chip Growth Fund | 13,554 |
7. Committed Line of Credit.
Certain Funds participate with other funds managed by the investment adviser or an affiliate in a $4.25 billion credit facility (the "line of credit") to be utilized for temporary or emergency purposes to fund shareholder redemptions or for other short-term liquidity purposes. The commitment fees on the pro-rata portion of the line of credit are borne by the investment adviser. During the period, there were no borrowings on this line of credit.
8. Security Lending.
Funds lend portfolio securities from time to time in order to earn additional income. Lending agents are used, including National Financial Services (NFS), an affiliate of the investment adviser. Pursuant to a securities lending agreement, NFS will receive a fee, which is capped at 9.9% of a fund's daily lending revenue, for its services as lending agent. A fund may lend securities to certain qualified borrowers, including NFS. On the settlement date of the loan, a fund receives collateral (in the form of U.S. Treasury obligations, letters of credit and/or cash) against the loaned securities and maintains collateral in an amount not less than 100% of the market value of the loaned securities during the period of the loan. The market value of the loaned securities is determined at the close of business of a fund and any additional required collateral is delivered to a fund on the next business day. A fund or borrower may terminate the loan at any time, and if the borrower defaults on its obligation to return the securities loaned because of insolvency or other reasons, a fund may apply collateral received from the borrower against the obligation. A fund may experience delays and costs in recovering the securities loaned. Any cash collateral received is invested in the Fidelity Securities Lending Cash Central Fund. Any loaned securities are identified as such in the Schedule of Investments, and the value of loaned securities and cash collateral at period end, as applicable, are presented in the Statement of Assets and Liabilities. Security lending income represents the income earned on investing cash collateral, less rebates paid to borrowers and any lending agent fees associated with the loan, plus any premium payments received for lending certain types of securities. Security lending income is presented in the Statement of Operations as a component of income from Fidelity Central Funds. Affiliated security lending activity, if any, was as follows:
| | Total Security Lending Fees Paid to NFS | Security Lending Income From Securities Loaned to NFS | Value of Securities Loaned to NFS at Period End |
| Fidelity Series Blue Chip Growth Fund | $145,152 | $16,872 | $251,515 |
9. Other.
A fund's organizational documents provide former and current trustees and officers with a limited indemnification against liabilities arising in connection with the performance of their duties to the fund. In the normal course of business, a fund may also enter into contracts that provide general indemnifications. A fund's maximum exposure under these arrangements is unknown as this would be dependent on future claims that may be made against a fund. The risk of material loss from such claims is considered remote.
At the end of the period, mutual funds and accounts managed by the investment adviser or its affiliates were the owners of record of all of the outstanding shares of the Fund.
10. Coronavirus (COVID-19) Pandemic.
An outbreak of COVID-19 first detected in China during December 2019 has since spread globally and was declared a pandemic by the World Health Organization during March 2020. Developments that disrupt global economies and financial markets, such as the COVID-19 pandemic, may magnify factors that affect the Fund's performance.
Report of Independent Registered Public Accounting Firm
To the Board of Trustees of Fidelity Securities Fund and Shareholders of Fidelity Series Blue Chip Growth Fund
Opinion on the Financial Statements and Financial Highlights
We have audited the accompanying statement of assets and liabilities of Fidelity Series Blue Chip Growth Fund (the "Fund"), a fund of Fidelity Securities Fund, including the schedule of investments, as of July 31, 2022, the related statement of operations for the year then ended, the statement of changes in net assets for each of the two years in the period then ended, the financial highlights for each of the five years in the period then ended, and the related notes. In our opinion, the financial statements and financial highlights present fairly, in all material respects, the financial position of the Fund as of July 31, 2022, and the results of its operations for the year then ended, the changes in its net assets for each of the two years in the period then ended, and the financial highlights for each of the five years in the period then ended in conformity with accounting principles generally accepted in the United States of America.
Basis for Opinion
These financial statements and financial highlights are the responsibility of the Fund's management. Our responsibility is to express an opinion on the Fund's financial statements and financial highlights based on our audits. We are a public accounting firm registered with the Public Company Accounting Oversight Board (United States) (PCAOB) and are required to be independent with respect to the Fund in accordance with the U.S. federal securities laws and the applicable rules and regulations of the Securities and Exchange Commission and the PCAOB.
We conducted our audits in accordance with the standards of the PCAOB. Those standards require that we plan and perform the audit to obtain reasonable assurance about whether the financial statements and financial highlights are free of material misstatement, whether due to error or fraud. The Fund is not required to have, nor were we engaged to perform, an audit of its internal control over financial reporting. As part of our audits we are required to obtain an understanding of internal control over financial reporting but not for the purpose of expressing an opinion on the effectiveness of the Fund’s internal control over financial reporting. Accordingly, we express no such opinion.
Our audits included performing procedures to assess the risks of material misstatement of the financial statements and financial highlights, whether due to error or fraud, and performing procedures that respond to those risks. Such procedures included examining, on a test basis, evidence regarding the amounts and disclosures in the financial statements and financial highlights. Our audits also included evaluating the accounting principles used and significant estimates made by management, as well as evaluating the overall presentation of the financial statements and financial highlights. Our procedures included confirmation of securities owned as of July 31, 2022, by correspondence with the custodian and brokers; when replies were not received from brokers, we performed other auditing procedures. We believe that our audits provide a reasonable basis for our opinion.
/s/ Deloitte & Touche LLP
Boston, Massachusetts
September 12, 2022
We have served as the auditor of one or more of the Fidelity investment companies since 1999.
Trustees and Officers
The Trustees, Members of the Advisory Board (if any), and officers of the trust and fund, as applicable, are listed below. The Board of Trustees governs the fund and is responsible for protecting the interests of shareholders. The Trustees are experienced executives who meet periodically throughout the year to oversee the fund's activities, review contractual arrangements with companies that provide services to the fund, oversee management of the risks associated with such activities and contractual arrangements, and review the fund's performance. Except for Jonathan Chiel,each of the Trustees oversees 316 funds. Mr. Chiel oversees 184 funds.
The Trustees hold office without limit in time except that (a) any Trustee may resign; (b) any Trustee may be removed by written instrument, signed by at least two-thirds of the number of Trustees prior to such removal; (c) any Trustee who requests to be retired or who has become incapacitated by illness or injury may be retired by written instrument signed by a majority of the other Trustees; and (d) any Trustee may be removed at any special meeting of shareholders by a two-thirds vote of the outstanding voting securities of the trust. Each Trustee who is not an interested person (as defined in the 1940 Act) of the trust and the fund is referred to herein as an Independent Trustee. Each Independent Trustee shall retire not later than the last day of the calendar year in which his or her 75th birthday occurs. The Independent Trustees may waive this mandatory retirement age policy with respect to individual Trustees. Officers and Advisory Board Members hold office without limit in time, except that any officer or Advisory Board Member may resign or may be removed by a vote of a majority of the Trustees at any regular meeting or any special meeting of the Trustees. Except as indicated, each individual has held the office shown or other offices in the same company for the past five years.
The fund’s Statement of Additional Information (SAI) includes more information about the Trustees. To request a free copy, call Fidelity at 1-800-544-8544.
Experience, Skills, Attributes, and Qualifications of the Trustees. The Governance and Nominating Committee has adopted a statement of policy that describes the experience, qualifications, attributes, and skills that are necessary and desirable for potential Independent Trustee candidates (Statement of Policy). The Board believes that each Trustee satisfied at the time he or she was initially elected or appointed a Trustee, and continues to satisfy, the standards contemplated by the Statement of Policy. The Governance and Nominating Committee also engages professional search firms to help identify potential Independent Trustee candidates who have the experience, qualifications, attributes, and skills consistent with the Statement of Policy. From time to time, additional criteria based on the composition and skills of the current Independent Trustees, as well as experience or skills that may be appropriate in light of future changes to board composition, business conditions, and regulatory or other developments, have also been considered by the professional search firms and the Governance and Nominating Committee. In addition, the Board takes into account the Trustees' commitment and participation in Board and committee meetings, as well as their leadership of standing and ad hoc committees throughout their tenure.
In determining that a particular Trustee was and continues to be qualified to serve as a Trustee, the Board has considered a variety of criteria, none of which, in isolation, was controlling. The Board believes that, collectively, the Trustees have balanced and diverse experience, qualifications, attributes, and skills, which allow the Board to operate effectively in governing the fund and protecting the interests of shareholders. Information about the specific experience, skills, attributes, and qualifications of each Trustee, which in each case led to the Board's conclusion that the Trustee should serve (or continue to serve) as a trustee of the fund, is provided below.
Board Structure and Oversight Function. Robert A. Lawrence is an interested person and currently serves as Chair. The Trustees have determined that an interested Chair is appropriate and benefits shareholders because an interested Chair has a personal and professional stake in the quality and continuity of services provided to the fund. Independent Trustees exercise their informed business judgment to appoint an individual of their choosing to serve as Chair, regardless of whether the Trustee happens to be independent or a member of management. The Independent Trustees have determined that they can act independently and effectively without having an Independent Trustee serve as Chair and that a key structural component for assuring that they are in a position to do so is for the Independent Trustees to constitute a substantial majority for the Board. The Independent Trustees also regularly meet in executive session. David M. Thomas serves as Lead Independent Trustee and as such (i) acts as a liaison between the Independent Trustees and management with respect to matters important to the Independent Trustees and (ii) with management prepares agendas for Board meetings.
Fidelity® funds are overseen by different Boards of Trustees. The fund's Board oversees Fidelity's high income and certain equity funds, and other Boards oversee Fidelity's investment-grade bond, money market, asset allocation, and other equity funds. The asset allocation funds may invest in Fidelity® funds overseen by the fund's Board. The use of separate Boards, each with its own committee structure, allows the Trustees of each group of Fidelity® funds to focus on the unique issues of the funds they oversee, including common research, investment, and operational issues. On occasion, the separate Boards establish joint committees to address issues of overlapping consequences for the Fidelity® funds overseen by each Board.
The Trustees operate using a system of committees to facilitate the timely and efficient consideration of all matters of importance to the Trustees, the fund, and fund shareholders and to facilitate compliance with legal and regulatory requirements and oversight of the fund's activities and associated risks. The Board, acting through its committees, has charged FMR and its affiliates with (i) identifying events or circumstances the occurrence of which could have demonstrably adverse effects on the fund's business and/or reputation; (ii) implementing processes and controls to lessen the possibility that such events or circumstances occur or to mitigate the effects of such events or circumstances if they do occur; and (iii) creating and maintaining a system designed to evaluate continuously business and market conditions in order to facilitate the identification and implementation processes described in (i) and (ii) above. Because the day-to-day operations and activities of the fund are carried out by or through FMR, its affiliates, and other service providers, the fund's exposure to risks is mitigated but not eliminated by the processes overseen by the Trustees. While each of the Board's committees has responsibility for overseeing different aspects of the fund's activities, oversight is exercised primarily through the Operations, Audit, and Compliance Committees. Appropriate personnel, including but not limited to the fund's Chief Compliance Officer (CCO), FMR's internal auditor, the independent accountants, the fund's Treasurer and portfolio management personnel, make periodic reports to the Board's committees, as appropriate, including an annual review of Fidelity's risk management program for the Fidelity® funds. The responsibilities of each standing committee, including their oversight responsibilities, are described further under "Standing Committees of the Trustees."
Interested Trustees*:
Correspondence intended for a Trustee who is an interested person may be sent to Fidelity Investments, 245 Summer Street, Boston, Massachusetts 02210.
Name, Year of Birth; Principal Occupations and Other Relevant Experience+
Jonathan Chiel (1957)
Year of Election or Appointment: 2016
Trustee
Mr. Chiel also serves as Trustee of other Fidelity® funds. Mr. Chiel is Executive Vice President and General Counsel for FMR LLC (diversified financial services company, 2012-present). Previously, Mr. Chiel served as general counsel (2004-2012) and senior vice president and deputy general counsel (2000-2004) for John Hancock Financial Services; a partner with Choate, Hall & Stewart (1996-2000) (law firm); and an Assistant United States Attorney for the United States Attorney’s Office of the District of Massachusetts (1986-95), including Chief of the Criminal Division (1993-1995). Mr. Chiel is a director on the boards of the Boston Bar Foundation and the Maimonides School.
Bettina Doulton (1964)
Year of Election or Appointment: 2021
Trustee
Ms. Doulton also serves as Trustee of other Fidelity® funds. Prior to her retirement, Ms. Doulton served in a variety of positions at Fidelity Investments, including as a managing director of research (2006-2007), portfolio manager to certain Fidelity® funds (1993-2005), equity analyst and portfolio assistant (1990-1993), and research assistant (1987-1990). Ms. Doulton currently owns and operates Phi Builders + Architects and Cellardoor Winery. Previously, Ms. Doulton served as a member of the Board of Brown Capital Management, LLC (2014-2018).
Robert A. Lawrence (1952)
Year of Election or Appointment: 2020
Trustee
Chair of the Board of Trustees
Mr. Lawrence also serves as Trustee of other funds. Previously, Mr. Lawrence served as a Trustee and Member of the Advisory Board of certain funds. Prior to his retirement in 2008, Mr. Lawrence served as Vice President of certain Fidelity® funds (2006-2008), Senior Vice President, Head of High Income Division of Fidelity Management & Research Company (investment adviser firm, 2006-2008), and President of Fidelity Strategic Investments (investment adviser firm, 2002-2005).
* Determined to be an “Interested Trustee” by virtue of, among other things, his or her affiliation with the trust or various entities under common control with FMR.
+ The information includes the Trustee's principal occupation during the last five years and other information relating to the experience, attributes, and skills relevant to the Trustee's qualifications to serve as a Trustee, which led to the conclusion that the Trustee should serve as a Trustee for the fund.
Independent Trustees:
Correspondence intended for an Independent Trustee may be sent to Fidelity Investments, P.O. Box 55235, Boston, Massachusetts 02205-5235.
Name, Year of Birth; Principal Occupations and Other Relevant Experience+
Thomas P. Bostick (1956)
Year of Election or Appointment: 2021
Trustee
Lieutenant General Bostick also serves as Trustee of other Fidelity® funds. Prior to his retirement, General Bostick (United States Army, Retired) held a variety of positions within the U.S. Army, including Commanding General and Chief of Engineers, U.S. Army Corps of Engineers (2012-2016) and Deputy Chief of Staff and Director of Human Resources, U.S. Army (2009-2012). General Bostick currently serves as a member of the Board and Finance and Governance Committees of CSX Corporation (transportation, 2020-present) and a member of the Board and Corporate Governance and Nominating Committee of Perma-Fix Environmental Services, Inc. (nuclear waste management, 2020-present). General Bostick serves as Chief Executive Officer of Bostick Global Strategies, LLC (consulting, 2016-present) and as a member of the Board of HireVue, Inc. (video interview and assessment, 2020-present). Previously, General Bostick served as a Member of the Advisory Board of certain Fidelity® funds (2021), President, Intrexon Bioengineering (2018-2020) and Chief Operating Officer (2017-2020) and Senior Vice President of the Environment Sector (2016-2017) of Intrexon Corporation (biopharmaceutical company).
Dennis J. Dirks (1948)
Year of Election or Appointment: 2005
Trustee
Mr. Dirks also serves as Trustee of other Fidelity® funds. Prior to his retirement in May 2003, Mr. Dirks served as Chief Operating Officer and as a member of the Board of The Depository Trust & Clearing Corporation (financial markets infrastructure), President, Chief Operating Officer and a member of the Board of The Depository Trust Company (DTC), President and a member of the Board of the National Securities Clearing Corporation (NSCC), Chief Executive Officer and a member of the Board of the Government Securities Clearing Corporation and Chief Executive Officer and a member of the Board of the Mortgage-Backed Securities Clearing Corporation. Mr. Dirks currently serves as a member of the Finance Committee (2016-present) and Board (2017-present) and is Treasurer (2018-present) of the Asolo Repertory Theatre.
Donald F. Donahue (1950)
Year of Election or Appointment: 2018
Trustee
Mr. Donahue also serves as Trustee of other Fidelity® funds. Mr. Donahue serves as President and Chief Executive Officer of Miranda Partners, LLC (risk consulting for the financial services industry, 2012-present). Previously, Mr. Donahue served as Chief Executive Officer (2006-2012), Chief Operating Officer (2003-2006) and Managing Director, Customer Marketing and Development (1999-2003) of The Depository Trust & Clearing Corporation (financial markets infrastructure). Mr. Donahue currently serves as a member (2007-present) and Co-Chairman (2016-present) of the Board of United Way of New York and a member of the Board of The Leadership Academy (previously NYC Leadership Academy) (2012-present). Mr. Donahue previously served as a member of the Advisory Board of certain Fidelity® funds (2015-2018).
Vicki L. Fuller (1957)
Year of Election or Appointment: 2020
Trustee
Ms. Fuller also serves as Trustee of other Fidelity® funds. Previously, Ms. Fuller served as a member of the Advisory Board of certain Fidelity® funds (2018-2020), Chief Investment Officer of the New York State Common Retirement Fund (2012-2018) and held a variety of positions at AllianceBernstein L.P. (global asset management, 1985-2012), including Managing Director (2006-2012) and Senior Vice President and Senior Portfolio Manager (2001-2006). Ms. Fuller currently serves as a member of the Board, Audit Committee and Nominating and Governance Committee of two Blackstone business development companies (2020-present), as a member of the Board of Treliant, LLC (consulting, 2019-present), as a member of the Advisory Board of Ariel Alternatives, LLC (private equity, 2021-present) and as a member of the Board and Chair of the Audit Committee of Gusto, Inc. (software, 2021-present). In addition, Ms. Fuller currently serves as a member of the Board of Roosevelt University (2019-present) and as a member of the Executive Board of New York University’s Stern School of Business. Ms. Fuller previously served as a member of the Board, Audit Committee and Nominating and Governance Committee of The Williams Companies, Inc. (natural gas infrastructure, 2018-2021).
Patricia L. Kampling (1959)
Year of Election or Appointment: 2020
Trustee
Ms. Kampling also serves as Trustee of other Fidelity® funds. Prior to her retirement, Ms. Kampling served as Chairman of the Board and Chief Executive Officer (2012-2019), President and Chief Operating Officer (2011-2012) and Executive Vice President and Chief Financial Officer (2010-2011) of Alliant Energy Corporation. Ms. Kampling currently serves as a member of the Board, Finance Committee and Governance, Compensation and Nominating Committee of Xcel Energy Inc. (utilities company, 2020-present) and as a member of the Board, Audit, Finance and Risk Committee and Safety, Environmental, Technology and Operations Committee and Chair of the Executive Development and Compensation Committee of American Water Works Company, Inc. (utilities company, 2019-present). In addition, Ms. Kampling currently serves as a member of the Board of the Nature Conservancy, Wisconsin Chapter (2019-present). Previously, Ms. Kampling served as a Member of the Advisory Board of certain Fidelity® funds (2020), a member of the Board, Compensation Committee and Executive Committee and Chair of the Audit Committee of Briggs & Stratton Corporation (manufacturing, 2011-2021), a member of the Board of Interstate Power and Light Company (2012-2019) and Wisconsin Power and Light Company (2012-2019) (each a subsidiary of Alliant Energy Corporation) and as a member of the Board and Workforce Development Committee of the Business Roundtable (2018-2019).
Thomas A. Kennedy (1955)
Year of Election or Appointment: 2021
Trustee
Mr. Kennedy also serves as Trustee of other Fidelity® funds. Previously, Mr. Kennedy served as a Member of the Advisory Board of certain Fidelity® funds (2020) and held a variety of positions at Raytheon Company (aerospace and defense, 1983-2020), including Chairman and Chief Executive Officer (2014-2020) and Executive Vice President and Chief Operating Officer (2013-2014). Mr. Kennedy currently serves as Executive Chairman of the Board of Directors of Raytheon Technologies Corporation (aerospace and defense, 2020-present). He is also a member of the Rutgers School of Engineering Industry Advisory Board (2011-present) and a member of the UCLA Engineering Dean’s Executive Board (2016-present).
Oscar Munoz (1959)
Year of Election or Appointment: 2021
Trustee
Mr. Munoz also serves as Trustee of other Fidelity® funds. Prior to his retirement, Mr. Munoz served as Executive Chairman (2020-2021), Chief Executive Officer (2015-2020), President (2015-2016) and a member of the Board (2010-2021) of United Airlines Holdings, Inc. Mr. Munoz currently serves as a member of the Board of CBRE Group, Inc. (commercial real estate, 2020-present), a member of the Board of Univision Communications, Inc. (Hispanic media, 2020-present) and a member of the Advisory Board of Salesforce.com, Inc. (cloud-based software, 2020-present). Previously, Mr. Munoz served as a Member of the Advisory Board of certain Fidelity® funds (2021).
Garnett A. Smith (1947)
Year of Election or Appointment: 2018
Trustee
Mr. Smith also serves as Trustee of other Fidelity® funds. Prior to his retirement, Mr. Smith served as Chairman and Chief Executive Officer (1990-1997) and President (1986-1990) of Inbrand Corp. (manufacturer of personal absorbent products). Prior to his employment with Inbrand Corp., he was employed by a retail fabric chain and North Carolina National Bank (now Bank of America). Mr. Smith previously served as a member of the Advisory Board of certain Fidelity® funds (2012-2013).
David M. Thomas (1949)
Year of Election or Appointment: 2008
Trustee
Lead Independent Trustee
Mr. Thomas also serves as Trustee of other Fidelity® funds. Previously, Mr. Thomas served as Executive Chairman (2005-2006) and Chairman and Chief Executive Officer (2000-2005) of IMS Health, Inc. (pharmaceutical and healthcare information solutions). Mr. Thomas currently serves as a member of the Board of Fortune Brands Home and Security (home and security products, 2004-present) and as Director (2013-present) and Non-Executive Chairman of the Board (2022-present) of Interpublic Group of Companies, Inc. (marketing communication).
Susan Tomasky (1953)
Year of Election or Appointment: 2020
Trustee
Ms. Tomasky also serves as Trustee of other Fidelity® funds. Prior to her retirement, Ms. Tomasky served in various executive officer positions at American Electric Power Company, Inc. (1998-2011), including most recently as President of AEP Transmission (2007-2011). Ms. Tomasky currently serves as a member of the Board and Sustainability Committee and as Chair of the Audit Committee of Marathon Petroleum Corporation (2018-present) and as a member of the Board, Executive Committee, Corporate Governance Committee and Organization and Compensation Committee and as Chair of the Audit Committee of Public Service Enterprise Group, Inc. (utilities company, 2012-present) and as a member of the Board of its subsidiary company, Public Service Electric and Gas Co. (2021-present). In addition, Ms. Tomasky currently serves as a member (2009-present) and President (2020-present) of the Board of the Royal Shakespeare Company – America (2009-present), as a member of the Board of the Columbus Association for the Performing Arts (2011-present) and as a member of the Board and Kenyon in the World Committee of Kenyon College (2016-present). Previously, Ms. Tomasky served as a Member of the Advisory Board of certain Fidelity® funds (2020), as a member of the Board of the Columbus Regional Airport Authority (2007-2020), as a member of the Board (2011-2018) and Lead Independent Director (2015-2018) of Andeavor Corporation (previously Tesoro Corporation) (independent oil refiner and marketer) and as a member of the Board of Summit Midstream Partners LP (energy, 2012-2018).
Michael E. Wiley (1950)
Year of Election or Appointment: 2020
Trustee
Mr. Wiley also serves as Trustee of other Fidelity® funds. Previously, Mr. Wiley served as a member of the Advisory Board of certain Fidelity® funds (2018-2020), Chairman, President and CEO of Baker Hughes, Inc. (oilfield services, 2000-2004). Mr. Wiley also previously served as a member of the Board of Andeavor Corporation (independent oil refiner and marketer, 2005-2018), a member of the Board of Andeavor Logistics LP (natural resources logistics, 2015-2018) and a member of the Board of High Point Resources (exploration and production, 2005-2020).
+ The information includes the Trustee's principal occupation during the last five years and other information relating to the experience, attributes, and skills relevant to the Trustee's qualifications to serve as a Trustee, which led to the conclusion that the Trustee should serve as a Trustee for the fund.
Advisory Board Members and Officers:
Correspondence intended for a Member of the Advisory Board (if any) may be sent to Fidelity Investments, P.O. Box 55235, Boston, Massachusetts 02205-5235. Correspondence intended for an officer or Peter S. Lynch may be sent to Fidelity Investments, 245 Summer Street, Boston, Massachusetts 02210. Officers appear below in alphabetical order.
Name, Year of Birth; Principal Occupation
Peter S. Lynch (1944)
Year of Election or Appointment: 2003
Member of the Advisory Board
Mr. Lynch also serves as a Member of the Advisory Board of other Fidelity® funds. Mr. Lynch is Vice Chairman and a Director of Fidelity Management & Research Company LLC (investment adviser firm). In addition, Mr. Lynch serves as a Trustee of Boston College and as the Chairman of the Inner-City Scholarship Fund. Previously, Mr. Lynch served as Vice Chairman and a Director of FMR Co., Inc. (investment adviser firm) and on the Special Olympics International Board of Directors (1997-2006).
Craig S. Brown (1977)
Year of Election or Appointment: 2019
Assistant Treasurer
Mr. Brown also serves as an officer of other funds. Mr. Brown serves as Assistant Treasurer of FIMM, LLC (2021-present) and is an employee of Fidelity Investments (2013-present).
John J. Burke III (1964)
Year of Election or Appointment: 2018
Chief Financial Officer
Mr. Burke also serves as Chief Financial Officer of other funds. Mr. Burke serves as Head of Investment Operations for Fidelity Fund and Investment Operations (2018-present) and is an employee of Fidelity Investments (1998-present). Previously Mr. Burke served as head of Asset Management Investment Operations (2012-2018).
William C. Coffey (1969)
Year of Election or Appointment: 2019
Assistant Secretary
Mr. Coffey also serves as Assistant Secretary of other funds. He is Senior Vice President and Deputy General Counsel of FMR LLC (diversified financial services company, 2010-present), and is an employee of Fidelity Investments. Previously, Mr. Coffey served as Secretary and CLO of certain funds (2018-2019); CLO, Secretary, and Senior Vice President of Fidelity Management & Research Company and FMR Co., Inc. (investment adviser firms, 2018-2019); Secretary of Fidelity SelectCo, LLC and Fidelity Investments Money Management, Inc. (investment adviser firms, 2018-2019); CLO of Fidelity Management & Research (Hong Kong) Limited, FMR Investment Management (UK) Limited, and Fidelity Management & Research (Japan) Limited (investment adviser firms, 2018-2019); and Assistant Secretary of certain funds (2009-2018).
Timothy M. Cohen (1969)
Year of Election or Appointment: 2018
Vice President
Mr. Cohen also serves as Vice President of other funds. Mr. Cohen serves as Co-Head of Equity (2018-present), a Director of Fidelity Management & Research (Japan) Limited (investment adviser firm, 2016-present), and is an employee of Fidelity Investments. Previously, Mr. Cohen served as Executive Vice President of Fidelity SelectCo, LLC (2019), Head of Global Equity Research (2016-2018), Chief Investment Officer - Equity and a Director of Fidelity Management & Research (U.K.) Inc. (investment adviser firm, 2013-2015) and as a Director of Fidelity Management & Research (Hong Kong) Limited (investment adviser firm, 2017).
Jonathan Davis (1968)
Year of Election or Appointment: 2010
Assistant Treasurer
Mr. Davis also serves as an officer of other funds. Mr. Davis serves as Assistant Treasurer of FIMM, LLC (2021-present), FMR Capital, Inc. (2017-present), FD Funds GP LLC (2021-present), FD Funds Holding LLC (2021-present), and FD Funds Management LLC (2021-present); and is an employee of Fidelity Investments. Previously, Mr. Davis served as Vice President and Associate General Counsel of FMR LLC (diversified financial services company, 2003-2010).
Laura M. Del Prato (1964)
Year of Election or Appointment: 2018
Assistant Treasurer
Ms. Del Prato also serves as an officer of other funds. Ms. Del Prato serves as Assistant Treasurer of FIMM, LLC (2021-present) and is an employee of Fidelity Investments (2017-present). Previously, Ms. Del Prato served as President and Treasurer of The North Carolina Capital Management Trust: Cash Portfolio and Term Portfolio (2018-2020). Prior to joining Fidelity Investments, Ms. Del Prato served as a Managing Director and Treasurer of the JPMorgan Mutual Funds (2014-2017). Prior to JPMorgan, Ms. Del Prato served as a partner at Cohen Fund Audit Services (accounting firm, 2012-2013) and KPMG LLP (accounting firm, 2004-2012).
Colm A. Hogan (1973)
Year of Election or Appointment: 2020
Assistant Treasurer
Mr. Hogan also serves as an officer of other funds. Mr. Hogan serves as Assistant Treasurer of FIMM, LLC (2021-present) and FMR Capital, Inc. (2017-present) and is an employee of Fidelity Investments (2005-present). Previously, Mr. Hogan served as Deputy Treasurer of certain Fidelity® funds (2016-2020) and Assistant Treasurer of certain Fidelity® funds (2016-2018).
Pamela R. Holding (1964)
Year of Election or Appointment: 2018
Vice President
Ms. Holding also serves as Vice President of other funds. Ms. Holding serves as Co-Head of Equity (2018-present) and is an employee of Fidelity Investments (2013-present). Previously, Ms. Holding served as Executive Vice President of Fidelity SelectCo, LLC (2019) and as Chief Investment Officer of Fidelity Institutional Asset Management (2013-2018).
Cynthia Lo Bessette (1969)
Year of Election or Appointment: 2019
Secretary and Chief Legal Officer (CLO)
Ms. Lo Bessette also serves as an officer of other funds. Ms. Lo Bessette serves as CLO, Secretary, and Senior Vice President of Fidelity Management & Research Company LLC (investment adviser firm, 2019-present); CLO of Fidelity Management & Research (Hong Kong) Limited, FMR Investment Management (UK) Limited, and Fidelity Management & Research (Japan) Limited (investment adviser firms, 2019-present); Secretary of FD Funds GP LLC (2021-present), FD Funds Holding LLC (2021-present), and FD Funds Management LLC (2021-present); and Assistant Secretary of FIMM, LLC (2019-present). She is a Senior Vice President and Deputy General Counsel of FMR LLC (diversified financial services company, 2019-present), and is an employee of Fidelity Investments. Previously, Ms. Lo Bessette served as CLO, Secretary, and Senior Vice President of FMR Co., Inc. (investment adviser firm, 2019); Secretary of Fidelity SelectCo, LLC and Fidelity Investments Money Management, Inc. (investment adviser firms, 2019). Prior to joining Fidelity Investments, Ms. Lo Bessette was Executive Vice President, General Counsel (2016-2019) and Senior Vice President, Deputy General Counsel (2015-2016) of OppenheimerFunds (investment management company) and Deputy Chief Legal Officer (2013-2015) of Jennison Associates LLC (investment adviser firm).
Chris Maher (1972)
Year of Election or Appointment: 2020
Deputy Treasurer
Mr. Maher also serves as an officer of other funds. Mr. Maher serves as Assistant Treasurer of FIMM, LLC (2021-present) and FMR Capital, Inc. (2017-present), and is an employee of Fidelity Investments (2008-present). Previously, Mr. Maher served as Assistant Treasurer of certain funds (2013-2020); Vice President of Asset Management Compliance (2013), Vice President of the Program Management Group of FMR (investment adviser firm, 2010-2013), and Vice President of Valuation Oversight (2008-2010).
Jason P. Pogorelec (1975)
Year of Election or Appointment: 2020
Chief Compliance Officer
Mr. Pogorelec also serves as Chief Compliance Officer of other funds. Mr. Pogorelec is a senior Vice President of Asset Management Compliance for Fidelity Investments and is an employee of Fidelity Investments (2006-present). Previously, Mr. Pogorelec served as Vice President, Associate General Counsel for Fidelity Investments (2010-2020) and Assistant Secretary of certain Fidelity funds (2015-2020).
Brett Segaloff (1972)
Year of Election or Appointment: 2021
Anti-Money Laundering (AML) Officer
Mr. Segaloff also serves as an AML Officer of other funds and other related entities. He is Director, Anti-Money Laundering (2007-present) of FMR LLC (diversified financial services company) and is an employee of Fidelity Investments (1996-present).
Stacie M. Smith (1974)
Year of Election or Appointment: 2016
President and Treasurer
Ms. Smith also serves as an officer of other funds. Ms. Smith serves as Assistant Treasurer of FIMM, LLC (2021-present) and FMR Capital, Inc. (2017-present), is an employee of Fidelity Investments (2009-present), and has served in other fund officer roles. Prior to joining Fidelity Investments, Ms. Smith served as Senior Audit Manager of Ernst & Young LLP (accounting firm, 1996-2009). Previously, Ms. Smith served as Assistant Treasurer (2013-2019) and Deputy Treasurer (2013-2016) of certain Fidelity® funds.
Jim Wegmann (1979)
Year of Election or Appointment: 2019
Assistant Treasurer
Mr. Wegmann also serves as an officer of other funds. Mr. Wegmann serves as Assistant Treasurer of FIMM, LLC (2021-present) and is an employee of Fidelity Investments (2011-present). Previously, Mr. Wegmann served as Assistant Treasurer of certain Fidelity® funds (2019-2021).
Shareholder Expense Example
As a shareholder, you incur two types of costs: (1) transaction costs, which may include sales charges (loads) on purchase payments or redemption proceeds, as applicable and (2) ongoing costs, which generally include management fees, distribution and/or service (12b-1) fees and other Fund expenses. This Example is intended to help you understand your ongoing costs (in dollars) of investing in a fund and to compare these costs with the ongoing costs of investing in other mutual funds.
The Example is based on an investment of $1,000 invested at the beginning of the period and held for the entire period (February 1, 2022 to July 31, 2022).
Actual Expenses
The first line of the accompanying table provides information about actual account values and actual expenses. You may use the information in this line, together with the amount you invested, to estimate the expenses that you paid over the period. Simply divide your account value by $1,000.00 (for example, an $8,600 account value divided by $1,000.00 = 8.6), then multiply the result by the number in the first line for a class/Fund under the heading entitled "Expenses Paid During Period" to estimate the expenses you paid on your account during this period. If any fund is a shareholder of any underlying mutual funds or exchange-traded funds (ETFs) (the Underlying Funds), such fund indirectly bears its proportional share of the expenses of the Underlying Funds in addition to the direct expenses incurred presented in the table. These fees and expenses are not included in the annualized expense ratio used to calculate the expense estimate in the table below.
Hypothetical Example for Comparison Purposes
The second line of the accompanying table provides information about hypothetical account values and hypothetical expenses based on the actual expense ratio and an assumed rate of return of 5% per year before expenses, which is not the actual return. The hypothetical account values and expenses may not be used to estimate the actual ending account balance or expenses you paid for the period. You may use this information to compare the ongoing costs of investing in the Fund and other funds. To do so, compare this 5% hypothetical example with the 5% hypothetical examples that appear in the shareholder reports of the other funds. If any fund is a shareholder of any Underlying Funds, such fund indirectly bears its proportional share of the expenses of the Underlying Funds in addition to the direct expenses as presented in the table. These fees and expenses are not included in the annualized expense ratio used to calculate the expense estimate in the table below.
Please note that the expenses shown in the table are meant to highlight your ongoing costs only and do not reflect any transaction costs. Therefore, the second line of the table is useful in comparing ongoing costs only, and will not help you determine the relative total costs of owning different funds. In addition, if these transactional costs were included, your costs would have been higher.
| | Annualized Expense Ratio-A | Beginning
Account Value
February 1, 2022 | Ending
Account Value
July 31, 2022 | Expenses Paid
During Period-B
February 1, 2022
to July 31, 2022 |
| Fidelity Series Blue Chip Growth Fund | - %-C�� | | | |
| Actual | | $1,000.00 | $820.50 | $--D |
| Hypothetical-E | | $1,000.00 | $1,024.79 | $--D |
A Annualized expense ratio reflects expenses net of applicable fee waivers.
B Expenses are equal to the annualized expense ratio, multiplied by the average account value over the period, multiplied by 181/ 365 (to reflect the one-half year period). The fees and expenses of any Underlying Funds are not included in each annualized expense ratio.
C Amount represents less than .005%.
D Amount represents less than $.005.
E 5% return per year before expenses
Distributions (Unaudited)
The dividend and capital gains distributions for the fund are available on Fidelity.com or Institutional.Fidelity.com.
The fund hereby designates as a capital gain dividend with respect to the taxable year ended July 31, 2022, $435,454,403, or, if subsequently determined to be different, the net capital gain of such year.
The fund designates 4% and 24% of the dividends distributed in September and December, respectively during the fiscal year as qualifying for the dividends–received deduction for corporate shareholders.
The fund designates 6% and 28% of the dividends distributed in September and December, respectively during the fiscal year as amounts which may be taken into account as a dividend for the purposes of the maximum rate under section 1(h)(11) of the Internal Revenue Code.
The fund designates 1% of the dividends distributed during the fiscal year as a section 199A dividend.
The fund will notify shareholders in January 2023 of amounts for use in preparing 2022 income tax returns.
Board Approval of Investment Advisory Contracts and Management Fees
Fidelity Series Blue Chip Growth Fund
Each year, the Board of Trustees, including the Independent Trustees (together, the Board), votes on the renewal of the management contract with Fidelity Management & Research Company LLC (FMR) and the sub-advisory agreements (together, the Advisory Contracts) for the fund. FMR and the sub-advisers are referred to herein as the Investment Advisers. The Board, assisted by the advice of fund counsel and Independent Trustees' counsel, requests and considers a broad range of information relevant to the renewal of the Advisory Contracts throughout the year.
The Board meets regularly and, at each of its meetings, covers an extensive agenda of topics and materials and considers factors that are relevant to its annual consideration of the renewal of the fund's Advisory Contracts, including the services and support provided to the fund and its shareholders. The Board has established various standing committees (Committees), each composed of and chaired by Independent Trustees with varying backgrounds, to which the Board has assigned specific subject matter responsibilities in order to enhance effective decision-making by the Board. The Board, acting directly and through its Committees, requests and receives information concerning the annual consideration of the renewal of the fund's Advisory Contracts. The Board also meets as needed to review matters specifically related to the Board's annual consideration of the renewal of the Advisory Contracts. Members of the Board may also meet with trustees of other Fidelity funds through joint ad hoc committees to discuss certain matters relevant to all of the Fidelity funds.
At its May 2022 meeting, the Board unanimously determined to renew the fund's Advisory Contracts. In considering whether to renew the Advisory Contracts for the fund, the Board considered all factors it believed relevant and reached a determination, with the assistance of fund counsel and Independent Trustees' counsel and through the exercise of its business judgment, that the renewal of the Advisory Contracts was in the best interests of the fund and its shareholders and the fact that no fee is payable under the management contract was fair and reasonable.
Nature, Extent, and Quality of Services Provided. The Board considered Fidelity's staffing as it relates to the fund, including the backgrounds of investment personnel of Fidelity, and also considered the fund's investment objective, strategies, and related investment philosophy. The Independent Trustees also had discussions with senior management of Fidelity's investment operations and investment groups. The Board considered the structure of the investment personnel compensation program and whether this structure provides appropriate incentives to act in the best interests of the fund. The Board also considered the steps Fidelity had taken to ensure the continued provision of high quality services to the Fidelity funds during the COVID-19 pandemic, including the expansion of staff in client facing positions to maintain service levels in periods of high volumes and volatility.
Resources Dedicated to Investment Management and Support Services. The Board and the Fund Oversight and Research Committees reviewed the general qualifications and capabilities of Fidelity's investment staff, including its size, education, experience, and resources, as well as Fidelity's approach to recruiting, training, managing, and compensating investment personnel. The Board noted the resources devoted to expansion of Fidelity's global investment organization, and that Fidelity's analysts have extensive resources, tools, and capabilities that allow them to conduct sophisticated quantitative and fundamental analysis, as well as credit analysis of issuers, counterparties, and guarantors. Further, the Board considered that Fidelity's investment professionals have sufficient access to global information and data so as to provide competitive investment results over time, and that those professionals also have access to sophisticated tools that permit them to assess portfolio construction and risk and performance attribution characteristics continuously, as well as to transmit new information and research conclusions rapidly around the world. Additionally, in its deliberations, the Board considered Fidelity's trading, risk management, compliance, and technology and operations capabilities and resources, which are integral parts of the investment management process.
Administrative Services. The Board considered (i) the nature, extent, quality, and cost of advisory and administrative services performed by the Investment Advisers and their affiliates under the Advisory Contracts and under separate agreements covering transfer agency, pricing and bookkeeping, and securities lending services for the fund; (ii) the nature and extent of the supervision of third party service providers, principally custodians, subcustodians, and pricing vendors; and (iii) the resources devoted to, and the record of compliance with, the fund's compliance policies and procedures. The Board also reviewed the allocation of fund brokerage, including allocations to brokers affiliated with the Investment Advisers, the use of brokerage commissions to pay fund expenses, and the use of "soft" commission dollars to pay for research services.
Investment Performance. The Board considered whether the fund has operated in accordance with its investment objective, as well as its record of compliance with its investment restrictions. The Board reviewed the fund's absolute investment performance, as well as the fund's relative investment performance, but did not consider performance to be a material factor in its decision to renew the fund's Advisory Contracts, as the fund is not publicly offered as a stand-alone investment product. In this regard, the Board noted that the fund is designed to offer an investment option for other investment companies, 529 plans, and collective investment trusts managed by Fidelity and ultimately to enhance the performance of those investment companies, 529 plans, and collective investment trusts.
Based on its review, the Board concluded that the nature, extent, and quality of services provided to the fund under the Advisory Contracts should continue to benefit the shareholders of the fund.
Competitiveness of Management Fee and Total Expense Ratio. The Board considered that the fund does not pay FMR a management fee for investment advisory services, but that FMR receives fees for providing services to funds that invest in the fund. The Board noted that FMR or an affiliate undertakes to pay all operating expenses of the fund, except transfer agent fees, 12b-1 fees, Independent Trustee fees and expenses, custodian fees and expenses, proxy and shareholder meeting expenses, interest, taxes, and extraordinary expenses (such as litigation expenses). The Board further noted that the fund pays its non-operating expenses, including brokerage commissions and fees and expenses associated with the fund's securities lending program, if applicable.
The Board further considered that FMR has contractually agreed to reimburse the fund to the extent that total operating expenses, with certain exceptions, as a percentage of its average net assets, exceed 0.003% through November 30, 2024.
Based on its review, the Board considered that the fund does not pay a management fee and concluded that the total expense ratio of the fund was reasonable in light of the services that the fund and its shareholders receive and the other factors considered.
Costs of the Services and Profitability. The Board considered the level of Fidelity's profits in respect of all the Fidelity funds.
A public accounting firm has been engaged annually by the Board as part of the Board's assessment of Fidelity's profitability analysis. The engagement includes the review and assessment of the methodologies used by Fidelity in determining the revenues and expenses attributable to Fidelity's mutual fund business, and completion of agreed-upon procedures in respect of the mathematical accuracy of certain fund profitability information and its conformity to established allocation methodologies. After considering the reports issued under the engagement and information provided by Fidelity, the Board concluded that while other allocation methods may also be reasonable, Fidelity's profitability methodologies are reasonable in all material respects.
The Board also reviewed Fidelity's non-fund businesses and potential indirect benefits such businesses may have received as a result of their association with Fidelity's mutual fund business (i.e., fall-out benefits) as well as cases where Fidelity's affiliates may benefit from the funds' business. The Board considered areas where potential indirect benefits to the Fidelity funds from their relationships with Fidelity may exist. The Board's consideration of these matters was informed by the findings of a joint ad hoc committee created by it and the boards of other Fidelity funds to evaluate potential fall-out benefits.
The Board concluded that the costs of the services provided by and the profits realized by Fidelity in connection with the operation of the fund were not relevant to the renewal of the Advisory Contracts because the fund pays no advisory fees and FMR bears all expenses of the fund with certain exceptions.
Economies of Scale. The Board concluded that because the fund pays no advisory fees and FMR bears all expenses of the fund with certain exceptions, the realization of economies of scale was not a material factor in the Board's decision to renew the fund's Advisory Contracts.
Additional Information Requested by the Board. In order to develop fully the factual basis for consideration of the Fidelity funds' advisory contracts, the Board requested and received additional information on certain topics, including: (i) fund flow and performance trends, in particular the underperformance of certain funds and strategies, and Fidelity's long-term strategies for certain funds, including any consideration of fund liquidations or mergers; (ii) the operation of performance fees, competitor use of performance fees, and consideration of the expansion of performance fees to additional funds; (iii) Fidelity's pricing philosophy compared to competitors; (iv) fund profitability methodology and data; (v) evaluation of competitive fund data and peer group classifications and fee and expense comparisons; (vi) the management fee and expense structures for different funds and classes and information about the differences between various fee and expense structures; (vii) group fee breakpoints and related voluntary fee waivers; and (viii) information regarding other accounts managed by Fidelity and the funds' sub-advisory arrangements.
Based on its evaluation of all of the conclusions noted above, and after considering all factors it believed relevant, the Board concluded that the advisory fee arrangements are fair and reasonable and that the fund's Advisory Contracts should be renewed.
Liquidity Risk Management Program
The Securities and Exchange Commission adopted Rule 22e-4 under the Investment Company Act of 1940 (the Liquidity Rule) to promote effective liquidity risk management throughout the open-end investment company industry, thereby reducing the risk that funds will be unable to meet their redemption obligations and mitigating dilution of the interests of fund shareholders.
The Fund has adopted and implemented a liquidity risk management program pursuant to the Liquidity Rule (the Program) effective December 1, 2018. The Program is reasonably designed to assess and manage the Fund’s liquidity risk and to comply with the requirements of the Liquidity Rule. The Fund’s Board of Trustees (the Board) has designated the Fund’s investment adviser as administrator of the Program. The Fidelity advisers have established a Liquidity Risk Management Committee (the LRM Committee) to manage the Program for each of the Fidelity Funds. The LRM Committee monitors the adequacy and effectiveness of implementation of the Program and on a periodic basis assesses each Fund’s liquidity risk based on a variety of factors including (1) the Fund’s investment strategy, (2) portfolio liquidity and cash flow projections during normal and reasonably foreseeable stressed conditions, (3) shareholder redemptions, (4) borrowings and other funding sources and (5) in the case of exchange-traded funds, certain additional factors including the effect of the Fund’s prices and spreads, market participants, and basket compositions on the overall liquidity of the Fund’s portfolio, as applicable.
In accordance with the Program, each of the Fund’s portfolio investments is classified into one of four liquidity categories described below based on a determination of a reasonable expectation for how long it would take to convert the investment to cash (or sell or dispose of the investment) without significantly changing its market value.
- Highly liquid investments – cash or convertible to cash within three business days or less
- Moderately liquid investments – convertible to cash in three to seven calendar days
- Less liquid investments – can be sold or disposed of, but not settled, within seven calendar days
- Illiquid investments – cannot be sold or disposed of within seven calendar days
Liquidity classification determinations take into account a variety of factors including various market, trading and investment-specific considerations, as well as market depth, and generally utilize analysis from a third-party liquidity metrics service.
The Liquidity Rule places a 15% limit on a fund’s illiquid investments and requires funds that do not primarily hold assets that are highly liquid investments to determine and maintain a minimum percentage of the fund’s net assets to be invested in highly liquid investments (highly liquid investment minimum or HLIM). The Program includes provisions reasonably designed to comply with the 15% limit on illiquid investments and for determining, periodically reviewing and complying with the HLIM requirement as applicable.
At a recent meeting of the Fund’s Board of Trustees, the LRM Committee provided a written report to the Board pertaining to the operation, adequacy, and effectiveness of implementation of the Program for the annual period from December 1, 2020 through November 30, 2021. The report concluded that the Program has been implemented and is operating effectively and is reasonably designed to assess and manage the Fund’s liquidity risk.
XS1-ANN-0922
1.967985.108
Fidelity® Series Real Estate Income Fund
Annual Report
July 31, 2022
Contents
To view a fund's proxy voting guidelines and proxy voting record for the 12-month period ended June 30, visit http://www.fidelity.com/proxyvotingresults or visit the Securities and Exchange Commission's (SEC) web site at http://www.sec.gov.
You may also call 1-800-544-8544 to request a free copy of the proxy voting guidelines.
Standard & Poor's, S&P and S&P 500 are registered service marks of The McGraw-Hill Companies, Inc. and have been licensed for use by Fidelity Distributors Corporation.
Other third-party marks appearing herein are the property of their respective owners.
All other marks appearing herein are registered or unregistered trademarks or service marks of FMR LLC or an affiliated company. © 2022 FMR LLC. All rights reserved.
This report and the financial statements contained herein are submitted for the general information of the shareholders of the Fund. This report is not authorized for distribution to prospective investors in the Fund unless preceded or accompanied by an effective prospectus.
A fund files its complete schedule of portfolio holdings with the SEC for the first and third quarters of each fiscal year on Form N-PORT. Forms N-PORT are available on the SEC’s web site at http://www.sec.gov. A fund's Forms N-PORT may be reviewed and copied at the SEC’s Public Reference Room in Washington, DC. Information regarding the operation of the SEC's Public Reference Room may be obtained by calling 1-800-SEC-0330.
For a complete list of a fund's portfolio holdings, view the most recent holdings listing, semiannual report, or annual report on Fidelity's web site at http://www.fidelity.com, http://www.institutional.fidelity.com, or http://www.401k.com, as applicable.
NOT FDIC INSURED •MAY LOSE VALUE •NO BANK GUARANTEE
Neither the Fund nor Fidelity Distributors Corporation is a bank.
Note to Shareholders:
Early in 2020, the outbreak and spread of COVID-19 emerged as a public health emergency that had a major influence on financial markets, primarily based on its impact on the global economy and corporate earnings. On March 11, 2020, the World Health Organization declared the COVID-19 outbreak a pandemic, citing sustained risk of further global spread. The pandemic prompted a number of measures to limit the spread of COVID-19, including travel and border restrictions, quarantines, and restrictions on large gatherings. In turn, these resulted in lower consumer activity, diminished demand for a wide range of products and services, disruption in manufacturing and supply chains, and – given the wide variability in outcomes regarding the outbreak – significant market uncertainty and volatility. To help stem the turmoil, the U.S. government took unprecedented action – in concert with the U.S. Federal Reserve and central banks around the world – to help support consumers, businesses, and the broader economy, and to limit disruption to the financial system.
In general, the overall impact of the pandemic lessened in 2021, amid a resilient economy and widespread distribution of three COVID-19 vaccines granted emergency use authorization from the U.S. Food and Drug Administration (FDA) early in the year. Still, the situation remains dynamic, and the extent and duration of its influence on financial markets and the economy is highly uncertain, due in part to a recent spike in cases based on highly contagious variants of the coronavirus.
Extreme events such as the COVID-19 crisis are exogenous shocks that can have significant adverse effects on mutual funds and their investments. Although multiple asset classes may be affected by market disruption, the duration and impact may not be the same for all types of assets. Fidelity is committed to helping you stay informed amid news about COVID-19 and during increased market volatility, and we continue to take extra steps to be responsive to customer needs. We encourage you to visit us online, where we offer ongoing updates, commentary, and analysis on the markets and our funds.
Performance: The Bottom Line
Average annual total return reflects the change in the value of an investment, assuming reinvestment of distributions from dividend income and capital gains (the profits earned upon the sale of securities that have grown in value, if any) and assuming a constant rate of performance each year. The hypothetical investment and the average annual total returns do not reflect the deduction of taxes that a shareholder would pay on fund distributions or the redemption of fund shares. During periods of reimbursement by Fidelity, a fund’s total return will be greater than it would be had the reimbursement not occurred. How a fund did yesterday is no guarantee of how it will do tomorrow.
Average Annual Total Returns
| For the periods ended July 31, 2022 | Past 1 year | Past 5 years | Past 10 years |
| Fidelity® Series Real Estate Income Fund | (3.78)% | 5.17% | 6.41% |
$10,000 Over 10 Years
Let's say hypothetically that $10,000 was invested in Fidelity® Series Real Estate Income Fund on July 31, 2012.
The chart shows how the value of your investment would have changed, and also shows how the S&P 500® Index performed over the same period.
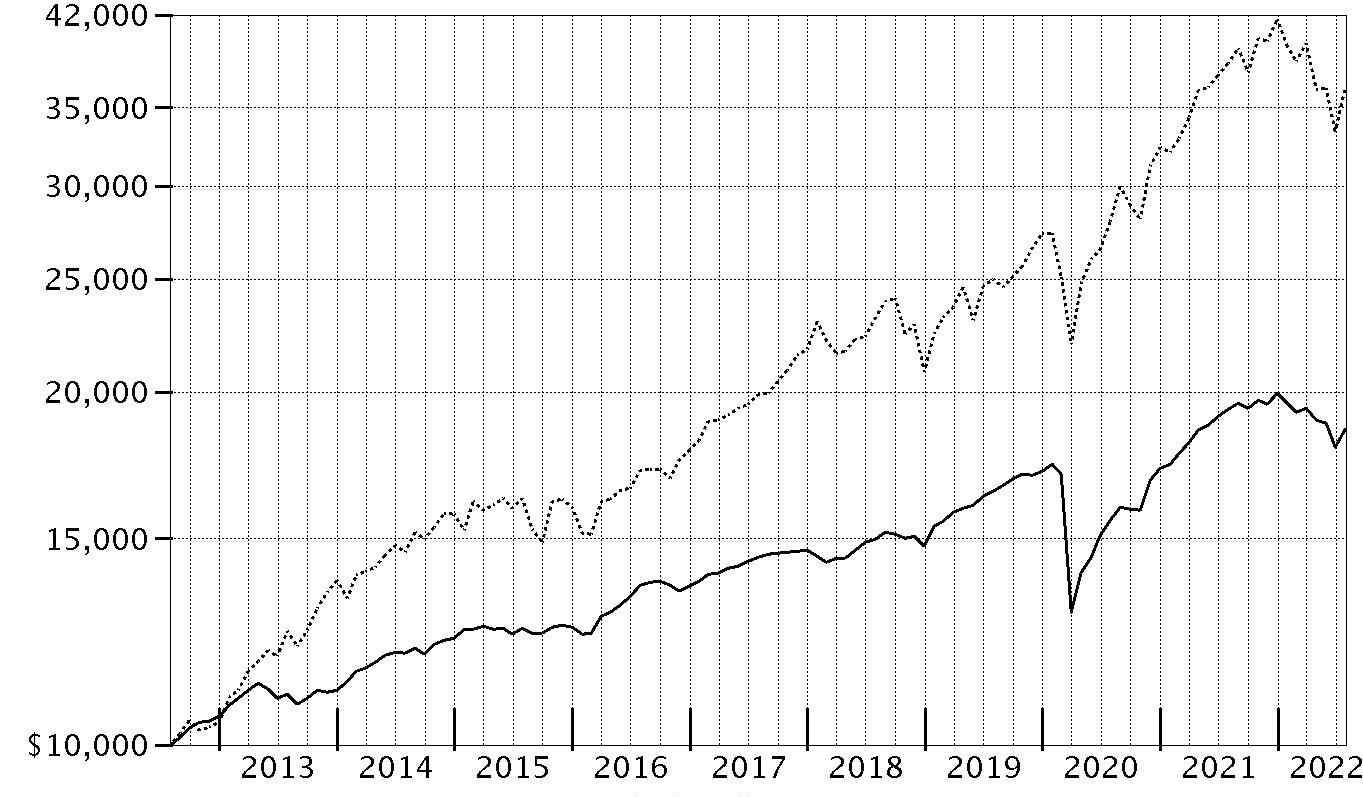
| Period Ending Values |
| $18,619 | Fidelity® Series Real Estate Income Fund |
| $36,428 | S&P 500® Index |
Management's Discussion of Fund Performance
Market Recap: For the 12 months ending July 31, 2022, a multitude of crosscurrents challenged the global economy and financial markets. Persistently high inflation, exacerbated by energy price shocks from the Russia–Ukraine conflict, spurred the U.S. Federal Reserve to hike interest rates more aggressively than anticipated, and concerns about the outlook for economic growth sent broader equities into bear market territory. For the 12-month period, real estate investment trust (REIT) common stocks, as measured by the FTSE
® NAREIT
® All REITs Index, returned -2.63%. The REIT market, alongside most other asset types, fell sharply in the first half of 2022, after gaining 43% in 2021. In a challenging market environment, most segments of the index lost ground for the 12 months, even as REITs seen as stable growers, such as industrial and cell-tower property owners, fared better. Meanwhile, real estate preferred stocks returned -7.48%, according to the MSCI REIT Preferred Index. Real estate bonds, captured by the ICE BofA
® US Real Estate Index – a market-capitalization-weighted measure of investment-grade corporate debt in the domestic real estate sector – returned -11.82%, hampered by rising interest rates. Bond issues with lower credit ratings modestly outperformed higher-quality credits, reflecting their higher coupons and reduced sensitivity to interest rates.
Comments from Portfolio Manager William Maclay: For the fiscal year, the fund returned -3.78%, outperforming the -9.02% result of the Fidelity Series Real Estate Income Composite Index℠. The Composite index is a 40/50/10 blend of the MSCI REIT Preferred Index, the ICE BofA
® U.S. Real Estate Index and the FTSE
® NAREIT
® All REITs Index. Compared with the Composite index, security selection, especially in the fund's bond portfolio, was the main contributor. We pay close attention to limiting interest rate risk in this fund, so our general avoidance of the securities that were most highly sensitive to rising rates significantly helped our relative result. Focusing on the bonds of fundamentally well-positioned property types, such as industrial REITs, while limiting exposure to bonds of companies in less-well-positioned areas, such as office REITs, boosted relative performance. Security selection among preferred stocks also contributed, again largely due to our focus on limiting the fund's interest rate exposure, in part by owning floating-rate preferreds, whose higher coupons gave them a degree of protection from rising rates. Also contributing was the fund's overweighting in the outperforming real estate common stock area, as well as a cash allocation of 5%, on average, which boosted relative performance. In a strong investing environment for the fund, positive performance factors far outweighed the negative factors. The fund did, however, see a modest detrimental impact from our security selection among real estate common stocks, while a large underweighting in preferred securities detracted a bit, given that preferreds underperformed the Composite index by 1.54 percentage points.
The views expressed above reflect those of the portfolio manager(s) only through the end of the period as stated on the cover of this report and do not necessarily represent the views of Fidelity or any other person in the Fidelity organization. Any such views are subject to change at any time based upon market or other conditions and Fidelity disclaims any responsibility to update such views. These views may not be relied on as investment advice and, because investment decisions for a Fidelity fund are based on numerous factors, may not be relied on as an indication of trading intent on behalf of any Fidelity fund.
Investment Summary (Unaudited)
Top Ten Stocks as of July 31, 2022
| | % of fund's net assets |
| Two Harbors Investment Corp. Series B, 7.625% | 1.4 |
| American Tower Corp. | 1.4 |
| Equity Lifestyle Properties, Inc. | 1.3 |
| Rithm Capital Corp. 7.125% | 1.2 |
| Rithm Capital Corp. Series A, 7.50% | 1.2 |
| Digitalbridge Group, Inc. Series J, 7.15% | 1.2 |
| Annaly Capital Management, Inc. Series F, 6.95% | 1.2 |
| Chimera Investment Corp. Series B, 8.00% | 1.1 |
| Great Ajax Corp. 7.25% | 1.1 |
| iStar Financial, Inc. Series I, 7.50% | 1.1 |
| | 12.2 |
Top Bonds as of July 31, 2022
| | % of fund's net assets |
| Redwood Trust, Inc. 5.625% 7/15/24 | 1.2 |
| Mhp 2022-Mhil Mezz U.S. Secured Overnight Fin. Rate (SOFR) Indx + 5.000% 6.9586% 1/9/24 | 1.1 |
| Sabra Health Care LP 5.125% 8/15/26 | 1.0 |
| iStar Financial, Inc. 4.75% 10/1/24 | 0.8 |
| Senior Housing Properties Trust 4.75% 5/1/24 | 0.8 |
| Veritas Multifamily Portfolio 1 month U.S. LIBOR + 8.500% 10.4992% 11/15/22 | 0.7 |
| RWT Holdings, Inc. 5.75% 10/1/25 | 0.7 |
| PennyMac Corp. 5.5% 11/1/24 | 0.7 |
| Sunbelt Mezz U.S. Secured Overnight Fin. Rate (SOFR) Indx + 4.450% 6.163% 1/21/27 | 0.7 |
| MPT Operating Partnership LP/MPT Finance Corp. 5% 10/15/27 | 0.6 |
| | 8.3 |
Top Five REIT Sectors as of July 31, 2022
| | % of fund's net assets |
| REITs - Mortgage | 20.5 |
| REITs - Diversified | 15.3 |
| REITs - Health Care | 5.4 |
| REITs - Management/Investment | 4.3 |
| REITs - Hotels | 3.5 |
Asset Allocation (% of fund's net assets)
| As of July 31, 2022 * |
| | Stocks | 44.1% |
| | Bonds | 42.5% |
| | Convertible Securities | 5.3% |
| | Other Investments | 3.0% |
| | Short-Term Investments and Net Other Assets (Liabilities) | 5.1% |

* Foreign investments - 0.5%
Schedule of Investments July 31, 2022
Showing Percentage of Net Assets
| Common Stocks - 11.8% | | | |
| | | Shares | Value |
| FINANCIALS - 0.6% | | | |
| Mortgage Real Estate Investment Trusts - 0.6% | | | |
| Great Ajax Corp. | | 281,246 | $3,099,331 |
| MFA Financial, Inc. | | 98,575 | 1,277,532 |
| | | | 4,376,863 |
| INFORMATION TECHNOLOGY - 0.1% | | | |
| IT Services - 0.1% | | | |
| Cyxtera Technologies, Inc. Class A (a) | | 45,200 | 550,988 |
| REAL ESTATE - 11.1% | | | |
| Equity Real Estate Investment Trusts (REITs) - 11.0% | | | |
| Acadia Realty Trust (SBI) | | 300 | 5,139 |
| American Homes 4 Rent Class A | | 52,500 | 1,988,700 |
| American Tower Corp. | | 34,500 | 9,343,635 |
| AvalonBay Communities, Inc. | | 9,900 | 2,118,006 |
| Crown Castle International Corp. | | 30,700 | 5,546,262 |
| CubeSmart | | 22,500 | 1,032,075 |
| Digital Realty Trust, Inc. | | 2,200 | 291,390 |
| Douglas Emmett, Inc. | | 18,500 | 437,340 |
| Duke Realty Corp. | | 3,200 | 200,192 |
| Easterly Government Properties, Inc. | | 79,300 | 1,607,411 |
| EastGroup Properties, Inc. | | 500 | 85,270 |
| Equinix, Inc. | | 5,800 | 4,081,692 |
| Equity Lifestyle Properties, Inc. | | 123,700 | 9,094,424 |
| Essex Property Trust, Inc. | | 9,300 | 2,664,729 |
| Extra Space Storage, Inc. | | 6,400 | 1,212,928 |
| Farmland Partners, Inc. | | 32,015 | 475,103 |
| Gaming & Leisure Properties | | 51,004 | 2,651,698 |
| Healthcare Trust of America, Inc. | | 3,250 | 85,313 |
| Invitation Homes, Inc. | | 28,800 | 1,124,064 |
| iStar Financial, Inc. | | 6,787 | 113,411 |
| Lamar Advertising Co. Class A | | 11,000 | 1,111,660 |
| Life Storage, Inc. | | 3,200 | 402,848 |
| LXP Industrial Trust (REIT) | | 463,022 | 5,079,351 |
| Mid-America Apartment Communities, Inc. | | 14,314 | 2,658,539 |
| National Retail Properties, Inc. | | 4,700 | 223,767 |
| NexPoint Residential Trust, Inc. | | 1,000 | 66,540 |
| Postal Realty Trust, Inc. | | 51,200 | 864,256 |
| Prologis (REIT), Inc. | | 13,400 | 1,776,304 |
| Public Storage | | 6,300 | 2,056,383 |
| Retail Value, Inc. | | 24,066 | 3,357 |
| RLJ Lodging Trust | | 14,700 | 183,603 |
| Sabra Health Care REIT, Inc. | | 38,000 | 584,820 |
| SITE Centers Corp. | | 118,800 | 1,735,668 |
| Spirit Realty Capital, Inc. | | 42,000 | 1,862,280 |
| Sunstone Hotel Investors, Inc. | | 17,100 | 193,743 |
| Terreno Realty Corp. | | 28,480 | 1,784,272 |
| UMH Properties, Inc. | | 29,000 | 617,990 |
| Ventas, Inc. | | 62,555 | 3,364,208 |
| VICI Properties, Inc. | | 42,000 | 1,435,980 |
| Washington REIT (SBI) | | 48,600 | 1,077,462 |
| Welltower, Inc. | | 40,900 | 3,531,306 |
| Weyerhaeuser Co. | | 13,700 | 497,584 |
| | | | 75,270,703 |
| Real Estate Management& Development - 0.1% | | | |
| Cushman & Wakefield PLC (a) | | 11,300 | 189,840 |
| Digitalbridge Group, Inc. (a) | | 34,699 | 190,151 |
| | | | 379,991 |
|
| TOTAL REAL ESTATE | | | 75,650,694 |
|
| TOTAL COMMON STOCKS | | | |
| (Cost $37,870,421) | | | 80,578,545 |
|
| Preferred Stocks - 34.2% | | | |
| Convertible Preferred Stocks - 1.9% | | | |
| FINANCIALS - 1.1% | | | |
| Mortgage Real Estate Investment Trusts - 1.1% | | | |
| Great Ajax Corp. 7.25% | | 310,550 | 7,689,218 |
| REAL ESTATE - 0.8% | | | |
| Equity Real Estate Investment Trusts (REITs) - 0.8% | | | |
| Braemar Hotels & Resorts, Inc. 5.50% | | 14,117 | 242,107 |
| LXP Industrial Trust (REIT) Series C, 6.50% | | 71,519 | 3,944,828 |
| RLJ Lodging Trust Series A, 1.95% | | 38,950 | 1,019,711 |
| | | | 5,206,646 |
|
| TOTAL CONVERTIBLE PREFERRED STOCKS | | | 12,895,864 |
|
| Nonconvertible Preferred Stocks - 32.3% | | | |
| ENERGY - 1.1% | | | |
| Oil, Gas & Consumable Fuels - 1.1% | | | |
| DCP Midstream Partners LP: | | | |
| 7.95% (b) | | 36,975 | 929,552 |
| Series B, 7.875% (b) | | 34,150 | 829,162 |
| Enbridge, Inc.: | | | |
| Series 1, 5 year U.S. Treasury Index + 3.140% 5.949% (b)(c) | | 97,425 | 2,248,569 |
| Series L, 5 year U.S. Treasury Index + 3.150% 4.959% (b)(c) | | 19,600 | 467,460 |
| Energy Transfer LP 7.60% (b) | | 98,525 | 2,329,131 |
| Global Partners LP: | | | |
| 9.75% (b) | | 1,825 | 47,852 |
| Series B, 9.50% | | 12,200 | 311,039 |
| | | | 7,162,765 |
| FINANCIALS - 17.7% | | | |
| Mortgage Real Estate Investment Trusts - 17.7% | | | |
| Acres Commercial Realty Corp. 8.625% (b) | | 2,363 | 47,331 |
| AG Mortgage Investment Trust, Inc.: | | | |
| 8.00% | | 107,209 | 2,112,478 |
| Series C, 8.00% (b) | | 86,993 | 1,731,169 |
| AGNC Investment Corp.: | | | |
| 6.125% (b) | | 104,900 | 2,338,221 |
| 6.875% (b) | | 85,750 | 1,873,638 |
| Series C, 7.00% (b) | | 201,199 | 4,871,028 |
| Series E, 6.50% (b) | | 277,732 | 6,279,521 |
| Annaly Capital Management, Inc.: | | | |
| 6.75% (b) | | 40,700 | 960,520 |
| Series F, 6.95% (b) | | 329,100 | 7,947,765 |
| Series G, 6.50% (b) | | 158,690 | 3,554,656 |
| Arbor Realty Trust, Inc.: | | | |
| Series D, 6.375% | | 12,400 | 264,740 |
| Series F, 6.25% (b) | | 16,300 | 333,661 |
| Arlington Asset Investment Corp. 8.25% (b) | | 12,857 | 263,569 |
| Armour Residential REIT, Inc. Series C 7.00% | | 8,484 | 189,363 |
| Cherry Hill Mortgage Investment Corp.: | | | |
| 8.25% (b) | | 43,766 | 973,356 |
| Series A, 8.20% | | 43,594 | 983,045 |
| Chimera Investment Corp.: | | | |
| 8.00% (b) | | 165,100 | 3,589,274 |
| Series A, 8.00% | | 200 | 4,440 |
| Series B, 8.00% (b) | | 350,558 | 7,712,276 |
| Series C, 7.75% (b) | | 256,366 | 5,588,779 |
| Dynex Capital, Inc. Series C 6.90% (b) | | 89,500 | 2,041,495 |
| Ellington Financial LLC 6.75% (b) | | 79,744 | 1,704,129 |
| Franklin BSP Realty Trust, Inc. 7.50% | | 100,816 | 2,120,160 |
| MFA Financial, Inc.: | | | |
| 6.50% (b) | | 342,843 | 6,757,436 |
| Series B, 7.50% | | 166,349 | 3,526,599 |
| New York Mortgage Trust, Inc. Series D, 8.00% (b) | | 11,741 | 238,107 |
| PennyMac Mortgage Investment Trust: | | | |
| 6.75% | | 28,700 | 610,736 |
| 8.125% (b) | | 86,075 | 2,135,521 |
| Series B, 8.00% (b) | | 250,005 | 6,360,127 |
| Ready Capital Corp.: | | | |
| 5.75% | | 52,255 | 1,243,669 |
| Series C, 6.20% | | 79,050 | 1,920,915 |
| Rithm Capital Corp.: | | | |
| 7.125% (b) | | 377,990 | 8,470,756 |
| Series A, 7.50% (b) | | 370,096 | 8,445,591 |
| Series C, 6.375% (b) | | 107,446 | 2,159,665 |
| Series D, 7.00% (b) | | 17,100 | 380,475 |
| Two Harbors Investment Corp.: | | | |
| Series A, 8.125% (b) | | 244,491 | 5,862,894 |
| Series B, 7.625% (b) | | 436,368 | 9,761,539 |
| Series C, 7.25% (b) | | 242,924 | 5,201,003 |
| | | | 120,559,647 |
| Real Estate Management & Development - 0.0% | | | |
| Brookfield Properties Corp. Series EE, 5.10% (b) | | 7,675 | 117,893 |
| TOTAL FINANCIALS | | | 120,677,540 |
| REAL ESTATE - 13.5% | | | |
| Equity Real Estate Investment Trusts (REITs) - 10.4% | | | |
| Agree Realty Corp. 4.375% | | 38,700 | 760,842 |
| American Homes 4 Rent: | | | |
| 6.25% | | 18,925 | 490,158 |
| Series G, 5.875% | | 37,050 | 940,329 |
| Armada Hoffler Properties, Inc. 6.75% | | 33,250 | 857,850 |
| Ashford Hospitality Trust, Inc.: | | | |
| Series D, 8.45% | | 50,274 | 1,101,001 |
| Series F, 7.375% | | 66,735 | 1,157,185 |
| Series G, 7.375% | | 32,129 | 555,832 |
| Series H, 7.50% | | 35,575 | 605,131 |
| Series I, 7.50% | | 54,911 | 987,849 |
| Bluerock Residential Growth (REIT), Inc.: | | | |
| Series C, 7.625% | | 44,175 | 1,108,351 |
| Series D, 7.125% | | 31,900 | 798,138 |
| Braemar Hotels & Resorts, Inc. Series D, 8.25% | | 35,150 | 880,508 |
| Cedar Realty Trust, Inc.: | | | |
| 7.25% | | 34,165 | 327,642 |
| Series C, 6.50% | | 53,500 | 366,475 |
| Centerspace Series C, 6.625% | | 57,700 | 1,520,395 |
| City Office REIT, Inc. Series A, 6.625% | | 27,525 | 648,489 |
| CTO Realty Growth, Inc. 6.375% | | 20,000 | 479,800 |
| DiamondRock Hospitality Co. 8.25% | | 34,900 | 938,112 |
| Gladstone Commercial Corp.: | | | |
| 6.625% | | 41,125 | 1,028,536 |
| Series G, 6.00% | | 81,700 | 1,838,250 |
| Gladstone Land Corp. Series D, 5.00% | | 60,000 | 1,482,000 |
| Global Medical REIT, Inc. Series A, 7.50% | | 27,461 | 705,473 |
| Global Net Lease, Inc.: | | | |
| Series A, 7.25% | | 129,625 | 3,336,548 |
| Series B 6.875% | | 47,200 | 1,176,696 |
| Healthcare Trust, Inc.: | | | |
| 7.125% | | 48,000 | 1,080,000 |
| Series A 7.375% | | 33,000 | 823,350 |
| Hersha Hospitality Trust: | | | |
| Series C, 6.875% | | 550 | 11,597 |
| Series D, 6.50% | | 42,250 | 890,630 |
| Hudson Pacific Properties, Inc. Series C, 4.75% | | 40,000 | 843,600 |
| iStar Financial, Inc.: | | | |
| Series D, 8.00% | | 75,056 | 1,934,193 |
| Series G, 7.65% | | 141,700 | 3,499,990 |
| Series I, 7.50% | | 303,323 | 7,616,441 |
| National Storage Affiliates Trust Series A, 6.00% | | 12,325 | 309,851 |
| Necessity Retail (REIT), Inc./The: | | | |
| 7.50% | | 193,698 | 4,726,231 |
| Series C 7.375% | | 205,000 | 5,020,450 |
| Pebblebrook Hotel Trust: | | | |
| 6.30% | | 53,702 | 1,219,035 |
| 6.375% | | 55,192 | 1,345,581 |
| 6.375% | | 20,200 | 468,034 |
| Series H, 5.70% | | 104,200 | 2,169,444 |
| Pennsylvania (REIT): | | | |
| Series B, 7.375% (a) | | 56,533 | 197,300 |
| Series C, 7.20% (a) | | 9,575 | 32,842 |
| Series D, 6.875% (a) | | 27,400 | 89,324 |
| Plymouth Industrial REIT, Inc. Series A, 7.50% | | 30,350 | 776,960 |
| Prologis (REIT), Inc. Series Q, 8.54% | | 16,850 | 1,019,425 |
| Rexford Industrial Realty, Inc.: | | | |
| Series B, 5.875% | | 50,000 | 1,274,000 |
| Series C, 5.625% | | 11,775 | 294,375 |
| Saul Centers, Inc.: | | | |
| Series D, 6.125% | | 15,958 | 385,545 |
| Series E, 6.00% | | 13,475 | 335,258 |
| SITE Centers Corp. 6.375% | | 15,100 | 391,921 |
| Sotherly Hotels, Inc.: | | | |
| Series B, 8.00% (a) | | 12,750 | 266,475 |
| Series C, 7.875% (a) | | 19,300 | 401,440 |
| Spirit Realty Capital, Inc. Series A, 6.00% | | 16,575 | 430,619 |
| Summit Hotel Properties, Inc.: | | | |
| Series E, 6.25% | | 60,784 | 1,255,816 |
| Series F, 5.875% | | 61,000 | 1,239,520 |
| Sunstone Hotel Investors, Inc.: | | | |
| Series H, 6.125% | | 20,000 | 464,000 |
| Series I, 5.70% | | 38,700 | 859,914 |
| UMH Properties, Inc. Series D, 6.375% | | 63,875 | 1,627,535 |
| Urstadt Biddle Properties, Inc.: | | | |
| Series H, 6.25% | | 51,175 | 1,245,318 |
| Series K 5.875% | | 28,775 | 656,648 |
| Vornado Realty Trust: | | | |
| Series N, 5.25% | | 19,600 | 448,252 |
| Series O, 4.45% | | 55,300 | 1,049,594 |
| | | | 70,792,098 |
| Real Estate Management & Development - 3.1% | | | |
| Brookfield Property Partners LP: | | | |
| 5.75% | | 7,000 | 139,020 |
| 6.50% | | 5,875 | 131,953 |
| Digitalbridge Group, Inc.: | | | |
| Series H, 7.125% | | 247,310 | 5,928,021 |
| Series I, 7.15% | | 285,785 | 6,881,703 |
| Series J, 7.15% | | 345,049 | 8,263,924 |
| Seritage Growth Properties Series A, 7.00% | | 1,050 | 23,846 |
| | | | 21,368,467 |
| TOTAL REAL ESTATE | | | 92,160,565 |
|
| TOTAL NONCONVERTIBLE PREFERRED STOCKS | | | 220,000,870 |
|
| TOTAL PREFERRED STOCKS | | | |
| (Cost $238,901,799) | | | 232,896,734 |
| | | Principal Amount | Value |
|
| Corporate Bonds - 19.5% | | | |
| Convertible Bonds - 3.4% | | | |
| FINANCIALS - 3.0% | | | |
| Mortgage Real Estate Investment Trusts - 3.0% | | | |
| MFA Financial, Inc. 6.25% 6/15/24 | | 2,015,000 | 1,814,177 |
| PennyMac Corp.: | | | |
| 5.5% 11/1/24 | | 4,840,000 | 4,679,675 |
| 5.5% 3/15/26 | | 250,000 | 223,750 |
| Redwood Trust, Inc. 5.625% 7/15/24 | | 8,898,000 | 7,918,709 |
| RWT Holdings, Inc. 5.75% 10/1/25 | | 5,596,000 | 4,792,455 |
| Two Harbors Investment Corp. 6.25% 1/15/26 | | 904,000 | 812,696 |
| | | | 20,241,462 |
| REAL ESTATE - 0.4% | | | |
| Real Estate Management & Development - 0.4% | | | |
| Digitalbridge Group, Inc. 5% 4/15/23 | | 3,062,000 | 2,992,473 |
|
| TOTAL CONVERTIBLE BONDS | | | 23,233,935 |
|
| Nonconvertible Bonds - 16.1% | | | |
| COMMUNICATION SERVICES - 0.6% | | | |
| Media - 0.6% | | | |
| Clear Channel Outdoor Holdings, Inc.: | | | |
| 7.5% 6/1/29 (d) | | 1,140,000 | 917,700 |
| 7.75% 4/15/28 (d) | | 3,555,000 | 2,859,358 |
| | | | 3,777,058 |
| CONSUMER DISCRETIONARY - 2.4% | | | |
| Hotels, Restaurants & Leisure - 0.6% | | | |
| Hilton Grand Vacations Borrower Escrow LLC 4.875% 7/1/31 (d) | | 925,000 | 777,000 |
| Marriott Ownership Resorts, Inc. 4.5% 6/15/29 (d) | | 2,000,000 | 1,736,220 |
| Times Square Hotel Trust 8.528% 8/1/26 (d) | | 1,232,411 | 1,263,945 |
| | | | 3,777,165 |
| Household Durables - 1.8% | | | |
| Adams Homes, Inc. 7.5% 2/15/25 (d) | | 1,550,000 | 1,356,250 |
| Ashton Woods U.S.A. LLC/Ashton Woods Finance Co.: | | | |
| 4.625% 8/1/29 (d) | | 605,000 | 468,962 |
| 4.625% 4/1/30 (d) | | 930,000 | 706,118 |
| Century Communities, Inc.: | | | |
| 3.875% 8/15/29 (d) | | 1,930,000 | 1,643,249 |
| 6.75% 6/1/27 | | 1,330,000 | 1,351,626 |
| LGI Homes, Inc. 4% 7/15/29 (d) | | 2,110,000 | 1,737,838 |
| M/I Homes, Inc. 3.95% 2/15/30 | | 1,430,000 | 1,186,701 |
| New Home Co., Inc. 7.25% 10/15/25 (d) | | 1,495,000 | 1,211,127 |
| Picasso Finance Sub, Inc. 6.125% 6/15/25 (d) | | 648,000 | 656,408 |
| TRI Pointe Homes, Inc. 5.25% 6/1/27 | | 2,042,000 | 1,960,683 |
| | | | 12,278,962 |
| TOTAL CONSUMER DISCRETIONARY | | | 16,056,127 |
| ENERGY - 0.4% | | | |
| Oil, Gas & Consumable Fuels - 0.4% | | | |
| EG Global Finance PLC: | | | |
| 6.75% 2/7/25 (d) | | 970,000 | 923,925 |
| 8.5% 10/30/25 (d) | | 305,000 | 298,674 |
| Global Partners LP/GLP Finance Corp. 7% 8/1/27 | | 2,045,000 | 1,869,968 |
| | | | 3,092,567 |
| FINANCIALS - 0.2% | | | |
| Diversified Financial Services - 0.2% | | | |
| Brixmor Operating Partnership LP 3.85% 2/1/25 | | 1,753,000 | 1,729,642 |
| HEALTH CARE - 1.0% | | | |
| Health Care Providers & Services - 1.0% | | | |
| Sabra Health Care LP 5.125% 8/15/26 | | 6,615,000 | 6,501,900 |
| INDUSTRIALS - 0.1% | | | |
| Trading Companies & Distributors - 0.1% | | | |
| Williams Scotsman International, Inc. 4.625% 8/15/28 (d) | | 750,000 | 703,241 |
| REAL ESTATE - 11.4% | | | |
| Equity Real Estate Investment Trusts (REITs) - 8.6% | | | |
| American Finance Trust, Inc./American Finance Operating Partnership LP 4.5% 9/30/28 (d) | | 2,450,000 | 1,971,197 |
| American Homes 4 Rent LP 4.25% 2/15/28 | | 2,000,000 | 1,958,796 |
| CBL & Associates LP: | | | |
| 4.6% 10/15/24 (e)(f) | | 3,930,000 | 0 |
| 5.25% 12/1/23 (e)(f) | | 3,629,000 | 0 |
| 5.95% 12/15/26 (e)(f) | | 2,551,000 | 0 |
| CTR Partnership LP/CareTrust Capital Corp. 3.875% 6/30/28 (d) | | 2,135,000 | 1,886,401 |
| Global Net Lease, Inc. / Global Net Lease Operating Partnership LP 3.75% 12/15/27 (d) | | 925,000 | 810,997 |
| GLP Capital LP/GLP Financing II, Inc. 5.25% 6/1/25 | | 2,375,000 | 2,354,225 |
| iStar Financial, Inc.: | | | |
| 4.25% 8/1/25 | | 2,405,000 | 2,293,769 |
| 4.75% 10/1/24 | | 5,615,000 | 5,537,794 |
| 5.5% 2/15/26 | | 3,015,000 | 2,960,128 |
| MPT Operating Partnership LP/MPT Finance Corp.: | | | |
| 4.625% 8/1/29 | | 1,506,000 | 1,411,875 |
| 5% 10/15/27 | | 4,237,000 | 4,076,418 |
| Office Properties Income Trust: | | | |
| 4.25% 5/15/24 | | 946,000 | 911,893 |
| 4.5% 2/1/25 | | 3,695,000 | 3,475,110 |
| Omega Healthcare Investors, Inc.: | | | |
| 4.5% 4/1/27 | | 483,000 | 465,780 |
| 4.75% 1/15/28 | | 1,616,000 | 1,562,045 |
| 4.95% 4/1/24 | | 659,000 | 661,212 |
| 5.25% 1/15/26 | | 22,000 | 22,042 |
| Realty Income Corp.: | | | |
| 3.1% 12/15/29 | | 1,000,000 | 935,269 |
| 4.6% 2/6/24 | | 1,757,000 | 1,782,130 |
| 4.875% 6/1/26 | | 1,593,000 | 1,646,520 |
| RLJ Lodging Trust LP 4% 9/15/29 (d) | | 2,245,000 | 1,989,631 |
| Senior Housing Properties Trust: | | | |
| 4.75% 5/1/24 | | 5,970,000 | 5,447,070 |
| 4.75% 2/15/28 | | 5,067,000 | 3,809,868 |
| Service Properties Trust: | | | |
| 4.65% 3/15/24 | | 1,556,000 | 1,415,011 |
| 7.5% 9/15/25 | | 1,480,000 | 1,434,949 |
| Uniti Group LP / Uniti Group Finance, Inc. 6.5% 2/15/29 (d) | | 4,000,000 | 3,079,240 |
| Uniti Group, Inc.: | | | |
| 6% 1/15/30 (d) | | 1,040,000 | 742,638 |
| 7.875% 2/15/25 (d) | | 1,000,000 | 1,006,250 |
| VICI Properties LP / VICI Note Co. 4.625% 12/1/29 (d) | | 1,095,000 | 1,043,031 |
| WP Carey, Inc.: | | | |
| 4% 2/1/25 | | 422,000 | 421,695 |
| 4.25% 10/1/26 | | 459,000 | 458,181 |
| XHR LP 6.375% 8/15/25 (d) | | 750,000 | 755,333 |
| | | | 58,326,498 |
| Real Estate Management & Development - 2.8% | | | |
| DTZ U.S. Borrower LLC 6.75% 5/15/28 (d) | | 875,000 | 865,909 |
| Five Point Operation Co. LP 7.875% 11/15/25 (d) | | 3,399,000 | 2,889,150 |
| Forestar Group, Inc. 3.85% 5/15/26 (d) | | 1,000,000 | 883,910 |
| Greystar Real Estate Partners 5.75% 12/1/25 (d) | | 2,025,000 | 2,023,157 |
| Howard Hughes Corp.: | | | |
| 4.125% 2/1/29 (d) | | 3,000,000 | 2,580,558 |
| 4.375% 2/1/31 (d) | | 1,090,000 | 923,028 |
| 5.375% 8/1/28 (d) | | 970,000 | 908,250 |
| Kennedy-Wilson, Inc.: | | | |
| 4.75% 3/1/29 | | 3,800,000 | 3,353,500 |
| 4.75% 2/1/30 | | 3,170,000 | 2,724,361 |
| Realogy Group LLC/Realogy Co-Issuer Corp. 5.75% 1/15/29 (d) | | 2,500,000 | 2,031,250 |
| Taylor Morrison Communities, Inc./Monarch Communities, Inc. 5.875% 6/15/27 (d) | | 202,000 | 206,293 |
| | | | 19,389,366 |
| TOTAL REAL ESTATE | | | 77,715,864 |
|
| TOTAL NONCONVERTIBLE BONDS | | | 109,576,399 |
|
| TOTAL CORPORATE BONDS | | | |
| (Cost $145,503,038) | | | 132,810,334 |
|
| Asset-Backed Securities - 3.3% | | | |
| American Homes 4 Rent: | | | |
| Series 2014-SFR3 Class E, 6.418% 12/17/36 (d) | | 1,841,000 | 1,886,829 |
| Series 2015-SFR2: | | | |
| Class E, 6.07% 10/17/52 (d) | | 1,624,000 | 1,670,748 |
| Class XS, 0% 10/17/52 (b)(d)(f)(g) | | 897,661 | 9 |
| Conseco Finance Securitizations Corp.: | | | |
| Series 2002-1 Class M2, 9.546% 12/1/33 | | 1,216,000 | 1,194,906 |
| Series 2002-2 Class M2, 9.163% 3/1/33 | | 1,541,123 | 1,403,201 |
| Diamond Infrastructure Funding LLC Series 2021-1A Class C, 3.475% 4/15/49 (d) | | 1,005,000 | 875,383 |
| DigitalBridge Issuer, LLC / DigitalBridge Co.-Issuer, LLC Series 2021-1A Class A2, 3.933% 9/25/51 (d) | | 1,000,000 | 912,954 |
| FirstKey Homes Trust: | | | |
| Series 2021-SFR1 Class F1, 3.238% 8/17/38 (d) | | 1,250,000 | 1,085,811 |
| Series 2021-SFR2 Class F1, 2.908% 9/17/38 (d) | | 500,000 | 435,023 |
| GPMT Ltd. Series 2019-FL2 Class D, 1 month U.S. LIBOR + 2.950% 5.1116% 2/22/36 (b)(c)(d) | | 358,000 | 350,202 |
| Green Tree Financial Corp.: | | | |
| Series 1996-4 Class M1, 7.75% 6/15/27 (b) | | 3,083 | 3,060 |
| Series 1997-3 Class M1, 7.53% 3/15/28 | | 28,691 | 27,638 |
| Home Partners of America Trust: | | | |
| Series 2021-1 Class F, 3.325% 9/17/41 (d) | | 450,265 | 381,092 |
| Series 2021-2 Class G, 4.505% 12/17/26 (d) | | 978,476 | 862,191 |
| Series 2021-3 Class F, 4.242% 1/17/41 (d) | | 1,370,613 | 1,215,371 |
| Lehman ABS Manufactured Housing Contract Trust Series 2001-B Class M2, 7.17% 4/15/40 | | 1,719,612 | 1,187,407 |
| Progress Residential Trust: | | | |
| Series 2019-SFR3 Class F, 3.867% 9/17/36 (d) | | 1,000,000 | 978,498 |
| Series 2019-SFR4 Class F, 3.684% 10/17/36 (d) | | 1,000,000 | 975,159 |
| Series 2020-SFR1 Class H, 5.268% 4/17/37 (d) | | 588,000 | 566,144 |
| Series 2021-SFR2 Class H, 4.998% 4/19/38 (d) | | 1,533,000 | 1,385,043 |
| Series 2021-SFR6: | | | |
| Class F, 3.422% 7/17/38 (d) | | 1,449,000 | 1,273,171 |
| Class G, 4.003% 7/17/38 (d) | | 749,000 | 659,113 |
| Series 2021-SFR8: | | | |
| Class F, 3.181% 10/17/38 (d) | | 934,000 | 810,034 |
| Class G, 4.005% 10/17/38 (d) | | 2,351,000 | 2,056,882 |
| Tricon American Homes Series 2017-SFR2 Class F, 5.104% 1/17/36 (d) | | 628,000 | 619,191 |
| TOTAL ASSET-BACKED SECURITIES | | | |
| (Cost $24,959,198) | | | 22,815,060 |
|
| Commercial Mortgage Securities - 23.1% | | | |
| ALEN Mortgage Trust floater Series 2021-ACEN Class F, 1 month U.S. LIBOR + 5.000% 6.999% 4/15/34 (b)(c)(d) | | 616,000 | 498,077 |
| BANK: | | | |
| Series 2017-BNK4 Class D, 3.357% 5/15/50 (d) | | 625,000 | 512,304 |
| Series 2017-BNK8 Class E, 2.8% 11/15/50 (d) | | 1,848,000 | 1,133,007 |
| Series 2018-BN12 Class D, 3% 5/15/61 (d) | | 318,000 | 228,940 |
| BCP Trust floater Series 2021-330N Class F, 1 month U.S. LIBOR + 4.630% 6.633% 6/15/38 (b)(c)(d) | | 1,000,000 | 886,728 |
| Benchmark Mortgage Trust: | | | |
| sequential payer Series 2019-B14: | | | |
| Class 225D, 3.2943% 12/15/62 (b)(d) | | 573,000 | 490,038 |
| Class 225E, 3.2943% 12/15/62 (b)(d) | | 859,000 | 727,904 |
| Series 2020-B18 Class AGNG, 4.3885% 7/15/53 (b)(d) | | 2,058,000 | 1,695,032 |
| Series 2022-B35 Class D, 2.5% 5/15/55 (d)(f) | | 1,000,000 | 635,889 |
| BHP Trust floater Series 2019-BXHP Class F, 1 month U.S. LIBOR + 2.930% 4.937% 8/15/36 (b)(c)(d) | | 1,050,000 | 974,344 |
| BSREP Commercial Mortgage Trust floater Series 2021-DC: | | | |
| Class F, 1 month U.S. LIBOR + 2.850% 4.85% 8/15/38 (b)(c)(d) | | 107,000 | 96,359 |
| Class G, 1 month U.S. LIBOR + 3.850% 5.85% 8/15/38 (b)(c)(d) | | 250,000 | 222,616 |
| BX Commercial Mortgage Trust: | | | |
| floater: | | | |
| Series 2021-CIP Class G, 1 month U.S. LIBOR + 3.960% 5.968% 12/15/38 (b)(c)(d) | | 3,549,000 | 3,276,342 |
| Series 2021-VINO Class G, 1 month U.S. LIBOR + 3.950% 5.9513% 5/15/38 (b)(c)(d) | | 2,499,000 | 2,361,262 |
| Series 2020-VIVA: | | | |
| Class D, 3.5488% 3/11/44 (b)(d) | | 1,505,000 | 1,244,557 |
| Class E, 3.5488% 3/11/44 (b)(d) | | 2,018,000 | 1,609,681 |
| BX Trust: | | | |
| floater: | | | |
| Series 2019-IMC Class G, 1 month U.S. LIBOR + 3.600% 5.599% 4/15/34 (b)(c)(d) | | 819,000 | 755,419 |
| Series 2019-XL Class J, 1 month U.S. LIBOR + 2.650% 4.649% 10/15/36 (b)(c)(d) | | 1,592,900 | 1,513,898 |
| Series 2021-21M Class H, 1 month U.S. LIBOR + 4.010% 6.009% 10/15/36 (b)(c)(d) | | 1,000,000 | 907,050 |
| Series 2021-ACNT Class G, 1 month U.S. LIBOR + 3.290% 5.295% 11/15/38 (b)(c)(d) | | 250,000 | 235,377 |
| Series 2021-ARIA Class G, 1 month U.S. LIBOR + 3.140% 5.1411% 10/15/36 (b)(c)(d) | | 1,392,000 | 1,280,415 |
| Series 2021-SDMF Class F, 1 month U.S. LIBOR + 1.930% 3.936% 9/15/34 (b)(c)(d) | | 73,000 | 67,863 |
| Series 2021-SOAR Class G, 4.8% 6/15/38 (b)(d) | | 992,482 | 912,764 |
| Series 2021-VOLT Class G, 1 month U.S. LIBOR + 2.850% 4.8492% 9/15/36 (b)(c)(d) | | 2,793,000 | 2,582,995 |
| Series 2021-XL2 Class J, 1 month U.S. LIBOR + 3.890% 5.889% 10/15/38 (b)(c)(d) | | 4,081,096 | 3,816,511 |
| Series 2022-LBA6: | | | |
| Class F, CME Term SOFR 1 Month Index + 3.350% 5.3086% 1/15/39 (b)(c)(d) | | 700,000 | 656,315 |
| Class G, CME Term SOFR 1 Month Index + 4.200% 6.1586% 1/15/39 (b)(c)(d) | | 1,491,000 | 1,398,011 |
| floater sequential payer Series 2021-LGCY Class J, 1 month U.S. LIBOR + 3.190% 5.192% 10/15/23 (b)(c)(d) | | 1,558,000 | 1,409,194 |
| Series 2019-OC11 Class E, 4.0755% 12/9/41 (b)(d) | | 4,666,000 | 3,997,263 |
| BXSC Commercial Mortgage Trust floater Series 2022-WSS Class F, 7.288% 3/15/35 (b)(d) | | 2,384,000 | 2,270,536 |
| CALI Mortgage Trust Series 2019-101C Class F, 4.3244% 3/10/39 (b)(d) | | 651,000 | 522,504 |
| CAMB Commercial Mortgage Trust floater Series 2019-LIFE Class G, 1 month U.S. LIBOR + 3.250% 5.249% 12/15/37 (b)(c)(d) | | 1,021,000 | 971,779 |
| CD Mortgage Trust Series 2017-CD3 Class D, 3.25% 2/10/50 (d) | | 2,226,000 | 1,587,697 |
| CHC Commercial Mortgage Trust floater Series 2019-CHC Class F, 1 month U.S. LIBOR + 2.600% 4.6072% 6/15/34 (b)(c)(d) | | 992,505 | 944,317 |
| Citigroup Commercial Mortgage Trust: | | | |
| Series 2013-GC15 Class D, 5.1734% 9/10/46 (b)(d) | | 2,496,000 | 2,380,168 |
| Series 2016-C3 Class D, 3% 11/15/49 (d) | | 2,990,000 | 2,135,460 |
| Cologix Data Centers U.S. Issuer, LLC / Cologix Data Centers U.S. Co.-Issuer, LLC Series 2021-1A Class C, 5.99% 12/26/51 (d) | | 1,500,000 | 1,362,989 |
| COMM Mortgage Trust: | | | |
| floater Series 2018-HCLV: | | | |
| Class F, 1 month U.S. LIBOR + 3.050% 5.049% 9/15/33 (b)(c)(d) | | 735,000 | 649,005 |
| Class G, 1 month U.S. LIBOR + 5.050% 7.0553% 9/15/33 (b)(c)(d) | | 735,000 | 621,578 |
| sequential payer Series 2013-LC6 Class E, 3.5% 1/10/46 (d)(f) | | 1,299,000 | 1,130,130 |
| Series 2012-CR1: | | | |
| Class C, 5.2815% 5/15/45 (b) | | 3,011,000 | 2,773,131 |
| Class D, 5.2815% 5/15/45 (b)(d) | | 1,917,000 | 1,677,375 |
| Class G, 2.462% 5/15/45 (d) | | 1,133,000 | 274,450 |
| Series 2012-LC4 Class C, 5.2794% 12/10/44 (b) | | 802,000 | 724,234 |
| Series 2013-CR10 Class D, 4.8693% 8/10/46 (b)(d) | | 1,756,000 | 1,685,104 |
| Series 2013-LC6 Class D, 4.2897% 1/10/46 (b)(d) | | 1,732,000 | 1,671,107 |
| Series 2014-UBS2 Class D, 4.9798% 3/10/47 (b)(d) | | 537,000 | 502,005 |
| Series 2017-CD4 Class D, 3.3% 5/10/50 (d) | | 1,192,000 | 948,816 |
| COMM Trust Series 2017-COR2 Class D, 3% 9/10/50 (d) | | 31,000 | 24,347 |
| Commercial Mortgage Trust pass-thru certificates Series 2012-CR2: | | | |
| Class D, 4.917% 8/15/45 (b)(d) | | 836,000 | 822,109 |
| Class F, 4.25% 8/15/45 (d) | | 783,000 | 624,599 |
| Credit Suisse Commercial Mortgage Trust floater Series 2021-SOP2 Class F, 1 month U.S. LIBOR + 4.210% 6.216% 6/15/34 (c)(d) | | 800,000 | 741,450 |
| Credit Suisse Mortgage Trust: | | | |
| floater Series 2021-4SZN Class A, CME Term SOFR 1 Month Index + 3.960% 5.9255% 11/15/23 (b)(c)(d) | | 2,000,000 | 1,936,475 |
| Series 2020-NET: | | | |
| Class E, 3.7042% 8/15/37 (b)(d) | | 500,000 | 450,372 |
| Class F, 3.7042% 8/15/37 (b)(d) | | 1,057,000 | 944,798 |
| CSAIL Commercial Mortgage Trust: | | | |
| Series 2017-C8 Class D, 4.4407% 6/15/50 (b)(d) | | 1,766,000 | 1,360,220 |
| Series 2017-CX9 Class D, 4.0704% 9/15/50 (b)(d) | | 461,000 | 354,679 |
| DBCCRE Mortgage Trust Series 2014-ARCP Class E, 4.9345% 1/10/34 (b)(d) | | 2,168,000 | 2,007,080 |
| DBGS Mortgage Trust Series 2018-C1 Class C, 4.6328% 10/15/51 (b) | | 1,000,000 | 914,508 |
| DBUBS Mortgage Trust Series 2011-LC3A Class D, 5.3628% 8/10/44 (b)(d) | | 548,097 | 514,554 |
| Extended Stay America Trust floater Series 2021-ESH Class F, 1 month U.S. LIBOR + 3.700% 5.7% 7/15/38 (b)(c)(d) | | 3,262,918 | 3,205,570 |
| GS Mortgage Securities Trust: | | | |
| floater Series 2018-RIVR Class G, 1 month U.S. LIBOR + 2.600% 4.599% 7/15/35 (b)(c)(d) | | 669,000 | 523,328 |
| Series 2011-GC5: | | | |
| Class C, 5.1588% 8/10/44 (b)(d) | | 101,000 | 83,830 |
| Class D, 5.1588% 8/10/44 (b)(d) | | 759,236 | 323,435 |
| Class E, 5.1588% 8/10/44 (b)(d)(f) | | 848,000 | 74,624 |
| Class F, 4.5% 8/10/44 (d)(f) | | 677,000 | 2,375 |
| Series 2012-GCJ9: | | | |
| Class D, 4.6624% 11/10/45 (b)(d) | | 1,569,000 | 1,517,110 |
| Class E, 4.6624% 11/10/45 (b)(d) | | 355,000 | 291,678 |
| Series 2013-GC16 Class F, 3.5% 11/10/46 (d)(f) | | 1,510,000 | 1,155,852 |
| Series 2016-GS2 Class D, 2.753% 5/10/49 (d) | | 1,964,000 | 1,580,742 |
| Hilton U.S.A. Trust Series 2016-HHV Class F, 4.1935% 11/5/38 (b)(d) | | 2,515,000 | 2,161,688 |
| IMT Trust Series 2017-APTS Class EFX, 3.4966% 6/15/34 (b)(d) | | 1,693,000 | 1,582,173 |
| Independence Plaza Trust Series 2018-INDP Class E, 4.996% 7/10/35 (d) | | 504,000 | 462,582 |
| JPMBB Commercial Mortgage Securities Trust: | | | |
| Series 2014-C23 Class UH5, 4.7094% 9/15/47 (d) | | 1,624,000 | 1,258,173 |
| Series 2014-C26 Class D, 3.8792% 1/15/48 (b)(d) | | 602,000 | 532,305 |
| JPMCC Commercial Mortgage Securities Trust Series 2016-JP4 Class D, 3.3866% 12/15/49 (b)(d) | | 1,924,000 | 1,502,665 |
| JPMDB Commercial Mortgage Securities Trust: | | | |
| Series 2016-C4 Class D, 3.0692% 12/15/49 (b)(d) | | 1,308,000 | 992,377 |
| Series 2018-C8 Class D, 3.2171% 6/15/51 (b)(d) | | 302,000 | 217,771 |
| JPMorgan Chase Commercial Mortgage Securities Trust: | | | |
| sequential payer Series 2021-1MEM Class E, 2.6535% 10/9/42 (b)(d) | | 500,000 | 382,149 |
| Series 2011-C3: | | | |
| Class E, 5.5244% 2/15/46 (b)(d) | | 3,467,000 | 1,199,089 |
| Class G, 4.409% 2/15/46 (b)(d) | | 1,680,000 | 116,437 |
| Class H, 4.409% 2/15/46 (b)(d)(f) | | 1,320,000 | 60,887 |
| Series 2011-C4 Class E, 5.5565% 7/15/46 (b)(d) | | 1,390,000 | 1,334,773 |
| Series 2012-CBX: | | | |
| Class E, 4.7843% 6/15/45 (b)(d) | | 1,078,000 | 970,200 |
| Class G 4% 6/15/45 (d)(f) | | 805,000 | 78,123 |
| Series 2013-LC11: | | | |
| Class D, 4.1593% 4/15/46 (b) | | 1,316,000 | 1,006,686 |
| Class F, 3.25% 4/15/46 (b)(d) | | 482,000 | 161,518 |
| Series 2014-DSTY Class E, 3.8046% 6/10/27 (b)(d)(f) | | 924,000 | 46,227 |
| Series 2018-AON Class F, 4.6132% 7/5/31 (b)(d) | | 961,000 | 780,635 |
| Series 2020-NNN Class FFX, 4.6254% 1/16/37 (d) | | 1,406,000 | 1,272,143 |
| LIFE Mortgage Trust floater Series 2021-BMR Class G, 1 month U.S. LIBOR + 2.950% 4.949% 3/15/38 (b)(c)(d) | | 1,816,529 | 1,673,684 |
| MED Trust floater Series 2021-MDLN Class G, 1 month U.S. LIBOR + 5.250% 7.25% 11/15/38 (b)(c)(d) | | 3,870,000 | 3,618,579 |
| Merit floater Series 2021-STOR Class G, 1 month U.S. LIBOR + 2.750% 4.749% 7/15/38 (b)(c)(d) | | 250,000 | 230,523 |
| MHC Commercial Mortgage Trust floater Series 2021-MHC: | | | |
| Class F, 1 month U.S. LIBOR + 2.600% 4.6% 4/15/38 (b)(c)(d) | | 694,000 | 655,001 |
| Class G, 1 month U.S. LIBOR + 3.200% 5.2% 4/15/38 (b)(c)(d) | | 846,000 | 799,470 |
| MHP Commercial Mortgage Trust floater Series 2022-MHIL Class G, CME Term SOFR 1 Month Index + 3.950% 5.9161% 1/15/27 (b)(c)(d) | | 2,562,000 | 2,364,849 |
| Morgan Stanley BAML Trust: | | | |
| Series 2012-C6 Class D, 4.5738% 11/15/45 (b)(d) | | 2,000,000 | 1,980,623 |
| Series 2012-C6, Class F, 4.5738% 11/15/45 (b)(d)(f) | | 1,000,000 | 933,518 |
| Series 2013-C12 Class D, 4.7622% 10/15/46 (b)(d) | | 1,500,000 | 1,361,585 |
| Series 2013-C13: | | | |
| Class D, 4.896% 11/15/46 (b)(d) | | 2,994,000 | 2,737,170 |
| Class E, 4.896% 11/15/46 (b)(d) | | 659,000 | 559,523 |
| Series 2013-C9 Class C, 4.018% 5/15/46 (b) | | 625,000 | 604,337 |
| Series 2016-C30 Class D, 3% 9/15/49 (d) | | 522,000 | 357,569 |
| Morgan Stanley Capital I Trust: | | | |
| Series 1998-CF1 Class G, 7.35% 7/15/32 (b)(d) | | 27,226 | 26,967 |
| Series 2011-C2: | | | |
| Class D, 5.2113% 6/15/44 (b)(d) | | 1,629,766 | 1,540,125 |
| Class F, 5.2113% 6/15/44 (b)(d)(f) | | 1,467,000 | 953,550 |
| Class XB, 0.4386% 6/15/44 (b)(d)(g) | | 23,731,269 | 93,779 |
| Series 2011-C3: | | | |
| Class C, 5.0842% 7/15/49 (b)(d) | | 464,249 | 458,248 |
| Class D, 5.0842% 7/15/49 (b)(d) | | 83,000 | 79,561 |
| Class E, 5.0842% 7/15/49 (b)(d)(f) | | 652,000 | 573,412 |
| Class F, 5.0842% 7/15/49 (b)(d)(f) | | 636,000 | 440,478 |
| Class G, 5.0842% 7/15/49 (b)(d)(f) | | 979,600 | 515,245 |
| Series 2012-C4 Class D, 5.1638% 3/15/45 (b)(d) | | 961,583 | 919,514 |
| Series 2015-MS1 Class D, 4.024% 5/15/48 (b)(d) | | 2,045,000 | 1,726,134 |
| Series 2015-UBS8 Class D, 3.18% 12/15/48 (d) | | 642,000 | 473,483 |
| Series 2016-BNK2 Class C, 3% 11/15/49 (d) | | 2,346,000 | 1,824,512 |
| Motel 6 Trust floater Series 2021-MTL6: | | | |
| Class G, 1 month U.S. LIBOR + 4.700% 6.6991% 9/15/38 (b)(c)(d) | | 740,090 | 733,025 |
| Class H, 1 month U.S. LIBOR + 6.000% 7.9991% 9/15/38 (b)(c)(d) | | 499,800 | 490,129 |
| MSJP Commercial Securities Mortgage Trust Series 2015-HAUL Class E, 4.851% 9/5/47 (b)(d) | | 1,000,000 | 760,584 |
| MTN Commercial Mortgage Trust floater Series 2022-LPFL Class F, CME Term SOFR 1 Month Index + 5.280% 7.2437% 3/15/39 (b)(c)(d) | | 1,000,000 | 944,108 |
| Natixis Commercial Mortgage Securities Trust floater Series 2018-FL1 Class WAN2, 1 month U.S. LIBOR + 3.750% 5.7491% 6/15/35 (b)(c)(d) | | 113,725 | 88,024 |
| OPG Trust floater Series 2021-PORT Class J, 1 month U.S. LIBOR + 3.340% 5.345% 10/15/36 (b)(c)(d) | | 500,000 | 462,500 |
| PKHL Commercial Mortgage Trust floater Series 2021-MF Class G, 1 month U.S. LIBOR + 4.350% 6.35% 7/15/38 (b)(c)(d) | | 500,000 | 472,208 |
| Prima Capital CRE Securitization Ltd. Series 2020-8A Class C, 3% 12/1/70 (d) | | 250,000 | 194,860 |
| Providence Place Group Ltd. Partnership Series 2000-C1 Class A2, 7.75% 7/20/28 (d) | | 855,594 | 931,918 |
| ReadyCap Commercial Mortgage Trust floater Series 2019-FL3 Class D, 1 month U.S. LIBOR + 2.900% 5.159% 3/25/34 (b)(c)(d) | | 599,000 | 576,163 |
| SG Commercial Mortgage Securities Trust Series 2019-PREZ Class F, 3.4771% 9/15/39 (b)(d) | | 2,000,000 | 1,551,521 |
| SMRT Commercial Mortgage Trust floater Series 2022-MINI Class F, CME Term SOFR 1 Month Index + 3.350% 5.309% 1/15/39 (b)(c)(d) | | 3,633,000 | 3,354,063 |
| SREIT Trust floater: | | | |
| Series 2021-IND Class G, 1 month U.S. LIBOR + 3.260% 5.2648% 10/15/38 (b)(c)(d) | | 2,573,000 | 2,320,104 |
| Series 2021-MFP2 Class J, 1 month U.S. LIBOR + 3.910% 5.9145% 11/15/36 (b)(c)(d) | | 2,000,000 | 1,888,110 |
| STWD Trust floater sequential payer Series 2021-LIH Class G, 1 month U.S. LIBOR + 4.200% 6.199% 11/15/36 (b)(c)(d) | | 1,280,000 | 1,177,562 |
| TPGI Trust floater Series 2021-DGWD Class G, 1 month U.S. LIBOR + 3.850% 5.85% 6/15/26 (b)(c)(d) | | 1,176,000 | 1,076,021 |
| UBS Commercial Mortgage Trust Series 2012-C1: | | | |
| Class D, 6.4444% 5/10/45 (b)(d) | | 68,841 | 62,645 |
| Class E, 5% 5/10/45 (b)(d)(f) | | 1,236,000 | 482,040 |
| Class F, 5% 5/10/45 (b)(d) | | 399,000 | 20,393 |
| UBS-BAMLL Trust Series 12-WRM Class D, 4.238% 6/10/30 (b)(d)(f) | | 1,817,000 | 1,379,119 |
| VMC Finance Ltd. floater Series 2021-HT1 Class B, 1 month U.S. LIBOR + 4.500% 6.656% 1/18/37 (b)(c)(d) | | 3,528,000 | 3,293,760 |
| Wells Fargo Commercial Mortgage Trust: | | | |
| Series 2012-LC5: | | | |
| Class E, 4.7272% 10/15/45 (b)(d) | | 1,539,000 | 1,509,508 |
| Class F, 4.7272% 10/15/45 (b)(d) | | 774,000 | 696,087 |
| Series 2016-BNK1 Class D, 3% 8/15/49 (d) | | 1,260,000 | 792,988 |
| Series 2016-NXS6 Class D, 3.059% 11/15/49 (d) | | 963,000 | 772,366 |
| WF-RBS Commercial Mortgage Trust: | | | |
| sequential payer Series 2011-C4I Class G, 5% 6/15/44 (b)(f) | | 45,000 | 1,654 |
| Series 2011-C3: | | | |
| Class D, 22.8133% 3/15/44 (b)(d) | | 2,587,186 | 1,102,141 |
| Class E, 5% 3/15/44 (d)(f) | | 34,000 | 170 |
| Series 2011-C5: | | | |
| Class E, 5.5193% 11/15/44 (b)(d) | | 382,733 | 381,717 |
| Class F, 5.25% 11/15/44 (b)(d) | | 2,000,000 | 1,834,851 |
| Class G, 5.25% 11/15/44 (b)(d) | | 1,000,000 | 887,164 |
| Series 2012-C7 Class D, 4.6935% 6/15/45 (b)(d)(f) | | 620,000 | 288,300 |
| Series 2012-C8 Class E, 4.8877% 8/15/45 (b)(d) | | 234,835 | 234,335 |
| Series 2013-C11: | | | |
| Class D, 4.2295% 3/15/45 (b)(d) | | 65,000 | 62,756 |
| Class E, 4.2295% 3/15/45 (b)(d)(f) | | 53,000 | 49,885 |
| Series 2013-C13 Class D, 4.1453% 5/15/45 (b)(d) | | 45,000 | 42,878 |
| Series 2013-C16 Class D, 4.9824% 9/15/46 (b)(d) | | 715,000 | 669,753 |
| Series 2013-UBS1 Class D, 5.0243% 3/15/46 (b)(d) | | 910,000 | 878,135 |
| WP Glimcher Mall Trust Series 2015-WPG: | | | |
| Class PR1, 3.516% 6/5/35 (b)(d) | | 1,168,000 | 959,613 |
| Class PR2, 3.516% 6/5/35 (b)(d) | | 459,000 | 350,564 |
| TOTAL COMMERCIAL MORTGAGE SECURITIES | | | |
| (Cost $175,816,448) | | | 157,806,037 |
|
| Bank Loan Obligations - 3.0% | | | |
| CONSUMER DISCRETIONARY - 0.3% | | | |
| Hotels, Restaurants & Leisure - 0.3% | | | |
| BRE/Everbright M6 Borrower LLC Tranche B 1LN, term loan 1 month U.S. LIBOR + 5.000% 7.346% 9/9/26 (b)(c)(h) | | 1,364,688 | 1,322,614 |
| Hilton Grand Vacations Borrower LLC Tranche B 1LN, term loan 1 month U.S. LIBOR + 3.000% 5.3723% 8/2/28 (b)(c)(h) | | 356,529 | 348,953 |
| | | | 1,671,567 |
| FINANCIALS - 2.7% | | | |
| Diversified Financial Services - 2.7% | | | |
| Agellan Portfolio 9% 8/7/25 (b)(f)(h) | | 1,217,000 | 1,217,000 |
| Mhp 2022-Mhil Mezz U.S. Secured Overnight Fin. Rate (SOFR) Indx + 5.000% 6.9586% 1/9/24 (b)(c)(f)(h) | | 7,800,000 | 7,566,000 |
| Sunbelt Mezz U.S. Secured Overnight Fin. Rate (SOFR) Indx + 4.450% 6.163% 1/21/27 (b)(c)(f)(h) | | 4,575,631 | 4,575,631 |
| Veritas Multifamily Portfolio 1 month U.S. LIBOR + 8.500% 10.4992% 11/15/22 (b)(c)(f)(h) | | 5,305,035 | 5,225,459 |
| | | | 18,584,090 |
| TOTAL BANK LOAN OBLIGATIONS | | | |
| (Cost $20,609,908) | | | 20,255,657 |
| | | Shares | Value |
|
| Money Market Funds - 10.9% | | | |
| Fidelity Cash Central Fund 2.01% (i) | | | |
| (Cost $74,307,966) | | 74,293,107 | 74,307,966 |
| TOTAL INVESTMENT IN SECURITIES - 105.8% | | | |
| (Cost $717,968,778) | | | 721,470,333 |
| NET OTHER ASSETS (LIABILITIES) - (5.8)% | | | (39,828,567) |
| NET ASSETS - 100% | | | $681,641,766 |
Legend
(a) Non-income producing
(b) Coupon rates for floating and adjustable rate securities reflect the rates in effect at period end.
(c) Coupon is indexed to a floating interest rate which may be multiplied by a specified factor and/or subject to caps or floors.
(d) Security exempt from registration under Rule 144A of the Securities Act of 1933. These securities may be resold in transactions exempt from registration, normally to qualified institutional buyers. At the end of the period, the value of these securities amounted to $214,636,573 or 31.5% of net assets.
(e) Non-income producing - Security is in default.
(f) Level 3 security
(g) Interest Only (IO) security represents the right to receive only monthly interest payments on an underlying pool of mortgages or assets. Principal shown is the outstanding par amount of the pool as of the end of the period.
(h) Remaining maturities of bank loan obligations may be less than the stated maturities shown as a result of contractual or optional prepayments by the borrower. Such prepayments cannot be predicted with certainty.
(i) Affiliated fund that is generally available only to investment companies and other accounts managed by Fidelity Investments. The rate quoted is the annualized seven-day yield of the fund at period end. A complete unaudited listing of the fund's holdings as of its most recent quarter end is available upon request. In addition, each Fidelity Central Fund's financial statements, which are not covered by the Fund's Report of Independent Registered Public Accounting Firm, are available on the SEC's website or upon request.
Affiliated Central Funds
Fiscal year to date information regarding the Fund's investments in Fidelity Central Funds, including the ownership percentage, is presented below.
| Fund | Value, beginning of period | Purchases | Sales Proceeds | Dividend Income | Realized Gain/Loss | Change in Unrealized appreciation (depreciation) | Value, end of period | % ownership, end of period |
| Fidelity Cash Central Fund 2.01% | $44,412,278 | $367,738,390 | $337,842,701 | $141,770 | $2,702 | $(2,703) | $74,307,966 | 0.1% |
| Fidelity Securities Lending Cash Central Fund 2.01% | -- | 9,754,807 | 9,754,807 | 15,406 | -- | -- | -- | 0.0% |
| Total | $44,412,278 | $377,493,197 | $347,597,508 | $157,176 | $2,702 | $(2,703) | $74,307,966 | |
Amounts in the income column in the above table include any capital gain distributions from underlying funds, which are presented in the corresponding line-item in the Statement of Operations, if applicable. Amount for Fidelity Securities Lending Cash Central Fund represents the income earned on investing cash collateral, less rebates paid to borrowers and any lending agent fees associated with the loan, plus any premium payments received for lending certain types of securities.
Investment Valuation
The following is a summary of the inputs used, as of July 31, 2022, involving the Fund's assets and liabilities carried at fair value. The inputs or methodology used for valuing securities may not be an indication of the risk associated with investing in those securities. For more information on valuation inputs, and their aggregation into the levels used below, please refer to the Investment Valuation section in the accompanying Notes to Financial Statements.
| | Valuation Inputs at Reporting Date: |
| Description | Total | Level 1 | Level 2 | Level 3 |
| Investments in Securities: | | | | |
| Equities: | | | | |
| Energy | $7,162,765 | $7,162,765 | $-- | $-- |
| Financials | 132,743,621 | 125,054,403 | 7,689,218 | -- |
| Information Technology | 550,988 | 550,988 | -- | -- |
| Real Estate | 173,017,905 | 167,811,259 | 5,206,646 | -- |
| Corporate Bonds | 132,810,334 | -- | 132,810,334 | -- |
| Asset-Backed Securities | 22,815,060 | -- | 22,815,051 | 9 |
| Commercial Mortgage Securities | 157,806,037 | -- | 149,004,559 | 8,801,478 |
| Bank Loan Obligations | 20,255,657 | -- | 1,671,567 | 18,584,090 |
| Money Market Funds | 74,307,966 | 74,307,966 | -- | -- |
| Total Investments in Securities: | $721,470,333 | $374,887,381 | $319,197,375 | $27,385,577 |
The following is a reconciliation of Investments in Securities for which Level 3 inputs were used in determining value:
| Investments in Securities: | |
| Commercial Mortgage Securities | |
| Beginning Balance | $4,910,979 |
| Net Realized Gain (Loss) on Investment Securities | -- |
| Net Unrealized Gain (Loss) on Investment Securities | 547,814 |
| Cost of Purchases | 666,568 |
| Proceeds of Sales | -- |
| Amortization/Accretion | (103,327) |
| Transfers into Level 3 | 3,676,018 |
| Transfers out of Level 3 | (896,574) |
| Ending Balance | $8,801,478 |
| The change in unrealized gain (loss) for the period attributable to Level 3 securities held at July 31, 2022 | $(547,814) |
| Bank Loan Obligations | |
| Beginning Balance | $7,615,181 |
| Net Realized Gain (Loss) on Investment Securities | 4,470 |
| Net Unrealized Gain (Loss) on Investment Securities | (335,393) |
| Cost of Purchases | 15,488,450 |
| Proceeds of Sales | (4,189,401) |
| Amortization/Accretion | 783 |
| Transfers into Level 3 | -- |
| Transfers out of Level 3 | -- |
| Ending Balance | $18,584,090 |
| The change in unrealized gain (loss) for the period attributable to Level 3 securities held at July 31, 2022 | $(332,867) |
| Other Investments in Securities | |
| Beginning Balance | $9 |
| Net Realized Gain (Loss) on Investment Securities | (2,528,303) |
| Net Unrealized Gain (Loss) on Investment Securities | 3,988,649 |
| Cost of Purchases | -- |
| Proceeds of Sales | (6,868,841) |
| Amortization/Accretion | (306,844) |
| Transfers into Level 3 | 5,715,339 |
| Transfers out of Level 3 | -- |
| Ending Balance | $9 |
| The change in unrealized gain (loss) for the period attributable to Level 3 securities held at July 31, 2022 | $3,988,649 |
The information used in the above reconciliations represents fiscal year to date activity for any Investments in Securities identified as using Level 3 inputs at either the beginning or the end of the current fiscal period. Transfers into Level 3 were attributable to a lack of observable market data resulting from decreases in market activity, decreases in liquidity, security restructurings or corporate actions. Transfers out of Level 3 were attributable to observable market data becoming available for those securities. Cost of purchases and proceeds of sales may include securities received and/or delivered through in-kind transactions. Transfers in or out of Level 3 represent the beginning value of any Security or Instrument where a change in the pricing level occurred from the beginning to the end of the period. The cost of purchases and the proceeds of sales may include securities received or delivered through corporate actions or exchanges. Realized and unrealized gains (losses) disclosed in the reconciliations are included in Net Gain (Loss) on the Fund's Statement of Operations.
Other Information
The composition of credit quality ratings as a percentage of Total Net Assets is as follows (Unaudited):
| AAA,AA,A | 1.1% |
| BBB | 3.8% |
| BB | 10.3% |
| B | 9.2% |
| CCC,CC,C | 3.2% |
| Not Rated | 21.3% |
| Equities | 46.0% |
| Short-Term Investments and Net Other Assets | 5.1% |
| | 100.0% |
We have used ratings from Moody's Investors Service, Inc. Where Moody's® ratings are not available, we have used S&P® ratings. All ratings are as of the date indicated and do not reflect subsequent changes.
See accompanying notes which are an integral part of the financial statements.
Financial Statements
Statement of Assets and Liabilities
| | | July 31, 2022 |
| Assets | | |
Investment in securities, at value — See accompanying schedule:
Unaffiliated issuers (cost $643,660,812) | $647,162,367 | |
| Fidelity Central Funds (cost $74,307,966) | 74,307,966 | |
| Total Investment in Securities (cost $717,968,778) | | $721,470,333 |
| Receivable for investments sold | | 16,934,417 |
| Receivable for fund shares sold | | 5,826,907 |
| Dividends receivable | | 729,323 |
| Interest receivable | | 3,311,664 |
| Distributions receivable from Fidelity Central Funds | | 72,333 |
| Total assets | | 748,344,977 |
| Liabilities | | |
| Payable to custodian bank | $698,899 | |
| Payable for fund shares redeemed | 65,999,490 | |
| Other payables and accrued expenses | 4,822 | |
| Total liabilities | | 66,703,211 |
| Net Assets | | $681,641,766 |
| Net Assets consist of: | | |
| Paid in capital | | $652,880,353 |
| Total accumulated earnings (loss) | | 28,761,413 |
| Net Assets | | $681,641,766 |
| Net Asset Value, offering price and redemption price per share ($681,641,766 ÷ 63,461,736 shares) | | $10.74 |
See accompanying notes which are an integral part of the financial statements.
Statement of Operations
| | | Year ended July 31, 2022 |
| Investment Income | | |
| Dividends | | $20,608,122 |
| Interest | | 25,110,557 |
| Income from Fidelity Central Funds (including $15,406 from security lending) | | 157,176 |
| Total income | | 45,875,855 |
| Expenses | | |
| Custodian fees and expenses | $14,287 | |
| Independent trustees' fees and expenses | 3,222 | |
| Total expenses before reductions | 17,509 | |
| Expense reductions | (380) | |
| Total expenses after reductions | | 17,129 |
| Net investment income (loss) | | 45,858,726 |
| Realized and Unrealized Gain (Loss) | | |
| Net realized gain (loss) on: | | |
| Investment securities: | | |
| Unaffiliated issuers | 23,702,779 | |
| Fidelity Central Funds | 2,702 | |
| Foreign currency transactions | 11,373 | |
| Total net realized gain (loss) | | 23,716,854 |
| Change in net unrealized appreciation (depreciation) on: | | |
| Investment securities: | | |
| Unaffiliated issuers | (106,109,223) | |
| Fidelity Central Funds | (2,703) | |
| Assets and liabilities in foreign currencies | 1 | |
| Total change in net unrealized appreciation (depreciation) | | (106,111,925) |
| Net gain (loss) | | (82,395,071) |
| Net increase (decrease) in net assets resulting from operations | | $(36,536,345) |
See accompanying notes which are an integral part of the financial statements.
Statement of Changes in Net Assets
| | Year ended July 31, 2022 | Year ended July 31, 2021 |
| Increase (Decrease) in Net Assets | | |
| Operations | | |
| Net investment income (loss) | $45,858,726 | $42,370,443 |
| Net realized gain (loss) | 23,716,854 | 11,329,717 |
| Change in net unrealized appreciation (depreciation) | (106,111,925) | 166,451,074 |
| Net increase (decrease) in net assets resulting from operations | (36,536,345) | 220,151,234 |
| Distributions to shareholders | (50,959,619) | (48,286,218) |
| Share transactions | | |
| Proceeds from sales of shares | 53,121,264 | 98,771,090 |
| Reinvestment of distributions | 50,959,619 | 48,286,218 |
| Cost of shares redeemed | (382,144,760) | (206,774,956) |
| Net increase (decrease) in net assets resulting from share transactions | (278,063,877) | (59,717,648) |
| Total increase (decrease) in net assets | (365,559,841) | 112,147,368 |
| Net Assets | | |
| Beginning of period | 1,047,201,607 | 935,054,239 |
| End of period | $681,641,766 | $1,047,201,607 |
| Other Information | | |
| Shares | | |
| Sold | 4,694,984 | 9,213,332 |
| Issued in reinvestment of distributions | 4,460,414 | 4,712,141 |
| Redeemed | (34,667,147) | (19,063,555) |
| Net increase (decrease) | (25,511,749) | (5,138,082) |
See accompanying notes which are an integral part of the financial statements.
Financial Highlights
Fidelity Series Real Estate Income Fund
| | | | | | |
| Years ended July 31, | 2022 | 2021 | 2020 | 2019 | 2018 |
| Selected Per–Share Data | | | | | |
| Net asset value, beginning of period | $11.77 | $9.94 | $11.21 | $10.97 | $11.34 |
| Income from Investment Operations | | | | | |
| Net investment income (loss)A,B | .55 | .45 | .56 | .61 | .59 |
| Net realized and unrealized gain (loss) | (.97) | 1.90 | (1.16) | .42 | (.20) |
| Total from investment operations | (.42) | 2.35 | (.60) | 1.03 | .39 |
| Distributions from net investment income | (.52) | (.45) | (.55) | (.62) | (.60) |
| Distributions from net realized gain | (.09) | (.07) | (.12) | (.17) | (.16) |
| Total distributions | (.61) | (.52) | (.67) | (.79) | (.76) |
| Net asset value, end of period | $10.74 | $11.77 | $9.94 | $11.21 | $10.97 |
| Total ReturnC | (3.78)% | 24.48% | (5.68)% | 9.91% | 3.61% |
| Ratios to Average Net AssetsB,D,E | | | | | |
| Expenses before reductionsF | -% | -% | -% | -% | -% |
| Expenses net of fee waivers, if anyF | -% | -% | -% | -% | -% |
| Expenses net of all reductionsF | -% | -% | -% | -% | -% |
| Net investment income (loss) | 4.83% | 4.21% | 5.36% | 5.67% | 5.36% |
| Supplemental Data | | | | | |
| Net assets, end of period (000 omitted) | $681,642 | $1,047,202 | $935,054 | $971,641 | $907,388 |
| Portfolio turnover rateG | 19% | 23% | 25%H | 16% | 27% |
A Calculated based on average shares outstanding during the period.
B Net investment income (loss) is affected by the timing of the declaration of dividends by any underlying mutual funds or exchange-traded funds (ETFs). Net investment income (loss) of any such underlying funds is not included in the Fund's net investment income (loss) ratio.
C Total returns would have been lower if certain expenses had not been reduced during the applicable periods shown.
D Fees and expenses of any underlying mutual funds or exchange-traded funds (ETFs) are not included in the Fund's expense ratio. The Fund indirectly bears its proportionate share of these expenses. For additional expense information related to investments in Fidelity Central Funds, please refer to the "Investments in Fidelity Central Funds" note found in the Notes to Financial Statements section of the most recent Annual or Semi-Annual report.
E Expense ratios reflect operating expenses of the class. Expenses before reductions do not reflect amounts reimbursed, waived, or reduced through arrangements with the investment adviser, brokerage services, or other offset arrangements, if applicable, and do not represent the amount paid by the class during periods when reimbursements, waivers or reductions occur.
F Amount represents less than .005%.
G Amount does not include the portfolio activity of any underlying mutual funds or exchange-traded funds (ETFs).
H Portfolio turnover rate excludes securities received or delivered in-kind.
See accompanying notes which are an integral part of the financial statements.
Notes to Financial Statements
For the period ended July 31, 2022
1. Organization.
Fidelity Series Real Estate Income Fund (the Fund) is a fund of Fidelity Securities Fund (the Trust) and is authorized to issue an unlimited number of shares. Shares are offered only to certain other Fidelity funds, Fidelity managed 529 plans, and Fidelity managed collective investment trusts. The Trust is registered under the Investment Company Act of 1940, as amended (the 1940 Act), as an open-end management investment company organized as a Massachusetts business trust.
2. Investments in Fidelity Central Funds.
Funds may invest in Fidelity Central Funds, which are open-end investment companies generally available only to other investment companies and accounts managed by the investment adviser and its affiliates. The Schedule of Investments lists any Fidelity Central Funds held as an investment as of period end, but does not include the underlying holdings of each Fidelity Central Fund. An investing fund indirectly bears its proportionate share of the expenses of the underlying Fidelity Central Funds.
Based on its investment objective, each Fidelity Central Fund may invest or participate in various investment vehicles or strategies that are similar to those of the investing fund. These strategies are consistent with the investment objectives of the investing fund and may involve certain economic risks which may cause a decline in value of each of the Fidelity Central Funds and thus a decline in the value of the investing fund.
| Fidelity Central Fund | Investment Manager | Investment Objective | Investment Practices | Expense Ratio(a) |
| Fidelity Money Market Central Funds | Fidelity Management & Research Company LLC (FMR) | Each fund seeks to obtain a high level of current income consistent with the preservation of capital and liquidity. | Short-term Investments | Less than .005% |
(a) Expenses expressed as a percentage of average net assets and are as of each underlying Central Fund's most recent annual or semi-annual shareholder report.
A complete unaudited list of holdings for each Fidelity Central Fund is available upon request or at the Securities and Exchange Commission website at www.sec.gov. In addition, the financial statements of the Fidelity Central Funds which contain the significant accounting policies (including investment valuation policies) of those funds, and are not covered by the Report of Independent Registered Public Accounting Firm, are available on the Securities and Exchange Commission website or upon request.
3. Significant Accounting Policies.
The Fund is an investment company and applies the accounting and reporting guidance of the Financial Accounting Standards Board (FASB) Accounting Standards Codification Topic 946 Financial Services - Investment Companies. The financial statements have been prepared in conformity with accounting principles generally accepted in the United States of America (GAAP), which require management to make certain estimates and assumptions at the date of the financial statements. Actual results could differ from those estimates. Subsequent events, if any, through the date that the financial statements were issued have been evaluated in the preparation of the financial statements. The Fund's Schedule of Investments lists any underlying mutual funds or exchange-traded funds (ETFs) but does not include the underlying holdings of these funds. The following summarizes the significant accounting policies of the Fund:
Investment Valuation. Investments are valued as of 4:00 p.m. Eastern time on the last calendar day of the period. The Board of Trustees (the Board) has delegated the day to day responsibility for the valuation of the Fund's investments to the Fair Value Committee (the Committee) established by the Fund's investment adviser. In accordance with valuation policies and procedures approved by the Board, the Fund attempts to obtain prices from one or more third party pricing vendors or brokers to value its investments. When current market prices, quotations or currency exchange rates are not readily available or reliable, investments will be fair valued in good faith by the Committee, in accordance with procedures adopted by the Board. Factors used in determining fair value vary by investment type and may include market or investment specific events, changes in interest rates and credit quality. The frequency with which these procedures are used cannot be predicted and they may be utilized to a significant extent. The Committee oversees the Fund's valuation policies and procedures and reports to the Board on the Committee's activities and fair value determinations. The Board monitors the appropriateness of the procedures used in valuing the Fund's investments and ratifies the fair value determinations of the Committee.
The Fund categorizes the inputs to valuation techniques used to value its investments into a disclosure hierarchy consisting of three levels as shown below:
- Level 1 – unadjusted quoted prices in active markets for identical investments
- Level 2 – other significant observable inputs (including quoted prices for similar investments, interest rates, prepayment speeds, etc.)
- Level 3 – unobservable inputs (including the Fund's own assumptions based on the best information available)
Valuation techniques used to value the Fund's investments by major category are as follows:
Equity securities, including restricted securities, for which market quotations are readily available, are valued at the last reported sale price or official closing price as reported by a third party pricing vendor on the primary market or exchange on which they are traded and are categorized as Level 1 in the hierarchy. In the event there were no sales during the day or closing prices are not available, securities are valued at the last quoted bid price or may be valued using the last available price and are generally categorized as Level 2 in the hierarchy. For foreign equity securities, when market or security specific events arise, comparisons to the valuation of American Depositary Receipts (ADRs), futures contracts, ETFs and certain indexes as well as quoted prices for similar securities may be used and would be categorized as Level 2 in the hierarchy. For equity securities, including restricted securities, where observable inputs are limited, assumptions about market activity and risk are used and these securities may be categorized as Level 3 in the hierarchy. Securities, including private placements or other restricted securities, for which observable inputs are not available are valued using alternate valuation approaches, including the market approach, the income approach and cost approach, and are categorized as Level 3 in the hierarchy. The market approach considers factors including the price of recent investments in the same or a similar security or financial metrics of comparable securities. The income approach considers factors including expected future cash flows, security specific risks and corresponding discount rates. The cost approach considers factors including the value of the security's underlying assets and liabilities.
Debt securities, including restricted securities, are valued based on evaluated prices received from third party pricing vendors or from brokers who make markets in such securities. Corporate bonds and bank loan obligations are valued by pricing vendors who utilize matrix pricing which considers yield or price of bonds of comparable quality, coupon, maturity and type or by broker-supplied prices. Asset backed securities and commercial mortgage securities are valued by pricing vendors who utilize matrix pricing which considers prepayment speed assumptions, attributes of the collateral, yield or price of bonds of comparable quality, coupon, maturity and type or by broker-supplied prices. When independent prices are unavailable or unreliable, debt securities may be valued utilizing pricing methodologies which consider similar factors that would be used by third party pricing vendors. Debt securities are generally categorized as Level 2 in the hierarchy but may be Level 3 depending on the circumstances. The Fund invests a significant portion of its assets in below investment grade securities. The value of these securities can be more volatile due to changes in the credit quality of the issuer and is sensitive to changes in economic, market and regulatory conditions.
Investments in open-end mutual funds, including the Fidelity Central Funds, are valued at their closing net asset value (NAV) each business day and are categorized as Level 1 in the hierarchy.
The following provides information on Level 3 securities held by the Fund that were valued at period end based on unobservable inputs. These amounts exclude valuations provided by a broker.
| Asset Type | Fair Value | Valuation Technique(s) | Unobservable Input | Amount or Range/Weighted Average | Impact to Valuation from an Increase in Input(a) |
| Corporate Bonds | $- | Recovery value | Recovery value | $0.00 | Increase |
| Asset-Backed Securities | $9 | Indicative market price | Evaluated bid | $0.00 | Increase |
| Commercial Mortgage Securities | $8,801,478 | Indicative market price | Evaluated bid | $0.00 - $90.51 / $66.04 | Increase |
| Bank Loan Obligations | $18,584,090 | Discounted cash flow | Yield | 8.3% - 18.5% / 11.3% | Decrease |
(a) Represents the directional change in the fair value of the Level 3 investments that could have resulted from an increase in the corresponding input as of period end. A decrease to the unobservable input would have had the opposite effect. Significant changes in these inputs may have resulted in a significantly higher or lower fair value measurement at period end.
Changes in valuation techniques may result in transfers in or out of an assigned level within the disclosure hierarchy. The aggregate value of investments by input level as of July 31, 2022, as well as a roll forward of Level 3 investments, is included at the end of the Fund's Schedule of Investments.
Foreign Currency. Certain Funds may use foreign currency contracts to facilitate transactions in foreign-denominated securities. Gains and losses from these transactions may arise from changes in the value of the foreign currency or if the counterparties do not perform under the contracts' terms.
Foreign-denominated assets, including investment securities, and liabilities are translated into U.S. dollars at the exchange rates at period end. Purchases and sales of investment securities, income and dividends received, and expenses denominated in foreign currencies are translated into U.S. dollars at the exchange rate in effect on the transaction date.
The effects of exchange rate fluctuations on investments are included with the net realized and unrealized gain (loss) on investment securities. Other foreign currency transactions resulting in realized and unrealized gain (loss) are disclosed separately.
Investment Transactions and Income. For financial reporting purposes, the Fund's investment holdings and NAV include trades executed through the end of the last business day of the period. The NAV per share for processing shareholder transactions is calculated as of the close of business of the New York Stock Exchange (NYSE), normally 4:00 p.m. Eastern time and includes trades executed through the end of the prior business day. Gains and losses on securities sold are determined on the basis of identified cost. Commissions paid to certain brokers with whom the investment adviser, or its affiliates, places trades on behalf of a fund include an amount in addition to trade execution, which may be rebated back to a fund. Any such rebates are included in net realized gain (loss) on investments in the Statement of Operations. Dividend income is recorded on the ex-dividend date, except for certain dividends from foreign securities where the ex-dividend date may have passed, which are recorded as soon as the Fund is informed of the ex-dividend date. Non-cash dividends included in dividend income, if any, are recorded at the fair market value of the securities received. Income and capital gain distributions from Fidelity Central Funds, if any, are recorded on the ex-dividend date. Certain distributions received by the Fund represent a return of capital or capital gain. The Fund determines the components of these distributions subsequent to the ex-dividend date, based upon receipt of tax filings or other correspondence relating to the underlying investment. These distributions are recorded as a reduction of cost of investments and/or as a realized gain. Interest income is accrued as earned and includes coupon interest and amortization of premium and accretion of discount on debt securities as applicable. Investment income is recorded net of foreign taxes withheld where recovery of such taxes is uncertain. Debt obligations may be placed on non-accrual status and related interest income may be reduced by ceasing current accruals and writing off interest receivables when the collection of all or a portion of interest has become doubtful based on consistently applied procedures. A debt obligation is removed from non-accrual status when the issuer resumes interest payments or when collectability of interest is reasonably assured.
Expenses. Expenses directly attributable to a fund are charged to that fund. Expenses attributable to more than one fund are allocated among the respective funds on the basis of relative net assets or other appropriate methods. Expenses included in the accompanying financial statements reflect the expenses of that fund and do not include any expenses associated with any underlying mutual funds or exchange-traded funds. Although not included in a fund's expenses, a fund indirectly bears its proportionate share of these expenses through the net asset value of each underlying mutual fund or exchange-traded fund. Expense estimates are accrued in the period to which they relate and adjustments are made when actual amounts are known.
Income Tax Information and Distributions to Shareholders. Each year, the Fund intends to qualify as a regulated investment company under Subchapter M of the Internal Revenue Code, including distributing substantially all of its taxable income and realized gains. As a result, no provision for U.S. Federal income taxes is required. As of July 31, 2022, the Fund did not have any unrecognized tax benefits in the financial statements; nor is the Fund aware of any tax positions for which it is reasonably possible that the total amounts of unrecognized tax benefits will significantly change in the next twelve months. The Fund files a U.S. federal tax return, in addition to state and local tax returns as required. The Fund's federal income tax returns are subject to examination by the Internal Revenue Service (IRS) for a period of three fiscal years after they are filed. State and local tax returns may be subject to examination for an additional fiscal year depending on the jurisdiction. Foreign taxes are provided for based on the Fund's understanding of the tax rules and rates that exist in the foreign markets in which it invests.
Distributions are declared and recorded on the ex-dividend date. Income and capital gain distributions are determined in accordance with income tax regulations, which may differ from GAAP. In addition, the Fund claimed a portion of the payment made to redeeming shareholders as a distribution for income tax purposes.
Capital accounts within the financial statements are adjusted for permanent book-tax differences. These adjustments have no impact on net assets or the results of operations. Capital accounts are not adjusted for temporary book-tax differences which will reverse in a subsequent period.
Book-tax differences are primarily due to equity-debt classifications, certain conversion ratio adjustments, foreign currency transactions, partnerships, and losses deferred due to wash sales.
As of period end, the cost and unrealized appreciation (depreciation) in securities, and derivatives if applicable, for federal income tax purposes were as follows:
| Gross unrealized appreciation | $46,769,398 |
| Gross unrealized depreciation | (45,800,989) |
| Net unrealized appreciation (depreciation) | $968,409 |
| Tax Cost | $720,501,924 |
The tax-based components of distributable earnings as of period end were as follows:
| Undistributed ordinary income | $9,091,006 |
| Undistributed long-term capital gain | $18,759,010 |
| Net unrealized appreciation (depreciation) on securities and other investments | $968,409 |
The tax character of distributions paid was as follows:
| | July 31, 2022 | July 31, 2021 |
| Ordinary Income | $47,615,155 | $ 42,421,612 |
| Long-term Capital Gains | 3,344,464 | 5,864,606 |
| Total | $50,959,619 | $ 48,286,218 |
Restricted Securities (including Private Placements). Funds may invest in securities that are subject to legal or contractual restrictions on resale. These securities generally may be resold in transactions exempt from registration or to the public if the securities are registered. Disposal of these securities may involve time-consuming negotiations and expense, and prompt sale at an acceptable price may be difficult. Information regarding restricted securities held at period end is included at the end of the Schedule of Investments, if applicable.
Loans and Other Direct Debt Instruments. Direct debt instruments are interests in amounts owed to lenders by corporate or other borrowers. These instruments may be in the form of loans, trade claims or other receivables and may include standby financing commitments such as revolving credit facilities that obligate a fund to supply additional cash to the borrower on demand. Loans may be acquired through assignment, participation, or may be made directly to a borrower. Such instruments are presented in the Bank Loan Obligations section in the Schedule of Investments. Certain funds may also invest in unfunded loan commitments, which are contractual obligations for future funding. Information regarding unfunded commitments is included at the end of the Schedule of Investments, if applicable.
New Accounting Pronouncement. In March 2020, the Financial Accounting Standards Board (FASB) issued an Accounting Standards Update (ASU), ASU 2020-04, which provides optional, temporary relief with respect to the financial reporting of contracts subject to certain types of modifications due to the planned discontinuation of the London Interbank Offered Rate (LIBOR) and other IBOR-based reference rates. The temporary relief provided by ASU 2020-04 is effective for certain reference rate-related contract modifications that occur during the period March 12, 2020 through December 31, 2022. Management does not expect the adoption of ASU 2020-04 to have a material impact on the Fund's financial statements.
4. Purchases and Sales of Investments.
Purchases and sales of securities, other than short-term securities and in-kind transactions, as applicable, are noted in the table below.
| | Purchases ($) | Sales ($) |
| Fidelity Series Real Estate Income Fund | 172,428,556 | 435,064,613 |
5. Fees and Other Transactions with Affiliates.
Management Fee. Fidelity Management & Research Company LLC (the investment adviser) and its affiliates provide the Fund with investment management related services for which the Fund does not pay a management fee. Under the management contract, the investment adviser or an affiliate pays all ordinary operating expenses of the Fund, except custody fees, fees and expenses of the independent Trustees, and certain miscellaneous expenses such as proxy and shareholder meeting expenses.
Brokerage Commissions. A portion of portfolio transactions were placed with brokerage firms which are affiliates of the investment adviser. Brokerage commissions are included in net realized gain (loss) and change in net unrealized appreciation (depreciation) in the Statement of Operations. The commissions paid to these affiliated firms were as follows:
| | Amount |
| Fidelity Series Real Estate Income Fund | $1,887 |
Interfund Trades. Funds may purchase from or sell securities to other Fidelity Funds under procedures adopted by the Board. The procedures have been designed to ensure these interfund trades are executed in accordance with Rule 17a-7 of the 1940 Act. Any interfund trades are included within the respective purchases and sales amounts shown in the Purchases and Sales of Investments note. Interfund trades during the period are noted in the table below.
| | Purchases ($) | Sales ($) | Realized Gain (Loss) ($) |
| Fidelity Series Real Estate Income Fund | 812,583 | 5,085,883 | 1,144,560 |
6. Committed Line of Credit.
Certain Funds participate with other funds managed by the investment adviser or an affiliate in a $4.25 billion credit facility (the "line of credit") to be utilized for temporary or emergency purposes to fund shareholder redemptions or for other short-term liquidity purposes. The commitment fees on the pro-rata portion of the line of credit are borne by the investment adviser. During the period, there were no borrowings on this line of credit.
7. Security Lending.
Funds lend portfolio securities from time to time in order to earn additional income. Lending agents are used, including National Financial Services (NFS), an affiliate of the investment adviser. Pursuant to a securities lending agreement, NFS will receive a fee, which is capped at 9.9% of a fund's daily lending revenue, for its services as lending agent. A fund may lend securities to certain qualified borrowers, including NFS. On the settlement date of the loan, a fund receives collateral (in the form of U.S. Treasury obligations, letters of credit and/or cash) against the loaned securities and maintains collateral in an amount not less than 100% of the market value of the loaned securities during the period of the loan. The market value of the loaned securities is determined at the close of business of a fund and any additional required collateral is delivered to a fund on the next business day. A fund or borrower may terminate the loan at any time, and if the borrower defaults on its obligation to return the securities loaned because of insolvency or other reasons, a fund may apply collateral received from the borrower against the obligation. A fund may experience delays and costs in recovering the securities loaned. Any cash collateral received is invested in the Fidelity Securities Lending Cash Central Fund. Any loaned securities are identified as such in the Schedule of Investments, and the value of loaned securities and cash collateral at period end, as applicable, are presented in the Statement of Assets and Liabilities. Security lending income represents the income earned on investing cash collateral, less rebates paid to borrowers and any lending agent fees associated with the loan, plus any premium payments received for lending certain types of securities. Security lending income is presented in the Statement of Operations as a component of income from Fidelity Central Funds. Affiliated security lending activity, if any, was as follows:
| | Total Security Lending Fees Paid to NFS | Security Lending Income From Securities Loaned to NFS | Value of Securities Loaned to NFS at Period End |
| Fidelity Series Real Estate Income Fund | $1,638 | $7,477 | $– |
8. Expense Reductions.
Through arrangements with the Fund's custodian, credits realized as a result of certain uninvested cash balances were used to reduce the Fund's expenses by $380.
9. Other.
A fund's organizational documents provide former and current trustees and officers with a limited indemnification against liabilities arising in connection with the performance of their duties to the fund. In the normal course of business, a fund may also enter into contracts that provide general indemnifications. A fund's maximum exposure under these arrangements is unknown as this would be dependent on future claims that may be made against a fund. The risk of material loss from such claims is considered remote.
At the end of the period, mutual funds and accounts managed by the investment adviser or its affiliates were the owners of record of all of the outstanding shares of the Fund.
10. Coronavirus (COVID-19) Pandemic.
An outbreak of COVID-19 first detected in China during December 2019 has since spread globally and was declared a pandemic by the World Health Organization during March 2020. Developments that disrupt global economies and financial markets, such as the COVID-19 pandemic, may magnify factors that affect the Fund's performance.
Report of Independent Registered Public Accounting Firm
To the Board of Trustees of Fidelity Securities Fund and Shareholders of Fidelity Series Real Estate Income Fund
Opinion on the Financial Statements and Financial Highlights
We have audited the accompanying statement of assets and liabilities of Fidelity Series Real Estate Income Fund (the "Fund"), a fund of Fidelity Securities Fund, including the schedule of investments, as of July 31, 2022, the related statement of operations for the year then ended, the statement of changes in net assets for each of the two years in the period then ended, the financial highlights for each of the five years in the period then ended, and the related notes. In our opinion, the financial statements and financial highlights present fairly, in all material respects, the financial position of the Fund as of July 31, 2022, and the results of its operations for the year then ended, the changes in its net assets for each of the two years in the period then ended, and the financial highlights for each of the five years in the period then ended in conformity with accounting principles generally accepted in the United States of America.
Basis for Opinion
These financial statements and financial highlights are the responsibility of the Fund's management. Our responsibility is to express an opinion on the Fund's financial statements and financial highlights based on our audits. We are a public accounting firm registered with the Public Company Accounting Oversight Board (United States) (PCAOB) and are required to be independent with respect to the Fund in accordance with the U.S. federal securities laws and the applicable rules and regulations of the Securities and Exchange Commission and the PCAOB.
We conducted our audits in accordance with the standards of the PCAOB. Those standards require that we plan and perform the audit to obtain reasonable assurance about whether the financial statements and financial highlights are free of material misstatement, whether due to error or fraud. The Fund is not required to have, nor were we engaged to perform, an audit of its internal control over financial reporting. As part of our audits we are required to obtain an understanding of internal control over financial reporting but not for the purpose of expressing an opinion on the effectiveness of the Fund’s internal control over financial reporting. Accordingly, we express no such opinion.
Our audits included performing procedures to assess the risks of material misstatement of the financial statements and financial highlights, whether due to error or fraud, and performing procedures that respond to those risks. Such procedures included examining, on a test basis, evidence regarding the amounts and disclosures in the financial statements and financial highlights. Our audits also included evaluating the accounting principles used and significant estimates made by management, as well as evaluating the overall presentation of the financial statements and financial highlights. Our procedures included confirmation of securities owned as of July 31, 2022, by correspondence with the custodian, brokers and agent banks; when replies were not received from brokers or agent banks, we performed other auditing procedures. We believe that our audits provide a reasonable basis for our opinion.
/s/ Deloitte & Touche LLP
Boston, Massachusetts
September 15, 2022
We have served as the auditor of one or more of the Fidelity investment companies since 1999.
Trustees and Officers
The Trustees, Members of the Advisory Board (if any), and officers of the trust and fund, as applicable, are listed below. The Board of Trustees governs the fund and is responsible for protecting the interests of shareholders. The Trustees are experienced executives who meet periodically throughout the year to oversee the fund's activities, review contractual arrangements with companies that provide services to the fund, oversee management of the risks associated with such activities and contractual arrangements, and review the fund's performance. Except for Jonathan Chiel, each of the Trustees oversees 316 funds. Mr. Chiel oversees 184 funds.
The Trustees hold office without limit in time except that (a) any Trustee may resign; (b) any Trustee may be removed by written instrument, signed by at least two-thirds of the number of Trustees prior to such removal; (c) any Trustee who requests to be retired or who has become incapacitated by illness or injury may be retired by written instrument signed by a majority of the other Trustees; and (d) any Trustee may be removed at any special meeting of shareholders by a two-thirds vote of the outstanding voting securities of the trust. Each Trustee who is not an interested person (as defined in the 1940 Act) of the trust and the fund is referred to herein as an Independent Trustee. Each Independent Trustee shall retire not later than the last day of the calendar year in which his or her 75th birthday occurs. The Independent Trustees may waive this mandatory retirement age policy with respect to individual Trustees. Officers and Advisory Board Members hold office without limit in time, except that any officer or Advisory Board Member may resign or may be removed by a vote of a majority of the Trustees at any regular meeting or any special meeting of the Trustees. Except as indicated, each individual has held the office shown or other offices in the same company for the past five years.
The fund’s Statement of Additional Information (SAI) includes more information about the Trustees. To request a free copy, call Fidelity at 1-800-544-8544.
Experience, Skills, Attributes, and Qualifications of the Trustees. The Governance and Nominating Committee has adopted a statement of policy that describes the experience, qualifications, attributes, and skills that are necessary and desirable for potential Independent Trustee candidates (Statement of Policy). The Board believes that each Trustee satisfied at the time he or she was initially elected or appointed a Trustee, and continues to satisfy, the standards contemplated by the Statement of Policy. The Governance and Nominating Committee also engages professional search firms to help identify potential Independent Trustee candidates who have the experience, qualifications, attributes, and skills consistent with the Statement of Policy. From time to time, additional criteria based on the composition and skills of the current Independent Trustees, as well as experience or skills that may be appropriate in light of future changes to board composition, business conditions, and regulatory or other developments, have also been considered by the professional search firms and the Governance and Nominating Committee. In addition, the Board takes into account the Trustees' commitment and participation in Board and committee meetings, as well as their leadership of standing and ad hoc committees throughout their tenure.
In determining that a particular Trustee was and continues to be qualified to serve as a Trustee, the Board has considered a variety of criteria, none of which, in isolation, was controlling. The Board believes that, collectively, the Trustees have balanced and diverse experience, qualifications, attributes, and skills, which allow the Board to operate effectively in governing the fund and protecting the interests of shareholders. Information about the specific experience, skills, attributes, and qualifications of each Trustee, which in each case led to the Board's conclusion that the Trustee should serve (or continue to serve) as a trustee of the fund, is provided below.
Board Structure and Oversight Function. Robert A. Lawrence is an interested person and currently serves as Chair. The Trustees have determined that an interested Chair is appropriate and benefits shareholders because an interested Chair has a personal and professional stake in the quality and continuity of services provided to the fund. Independent Trustees exercise their informed business judgment to appoint an individual of their choosing to serve as Chair, regardless of whether the Trustee happens to be independent or a member of management. The Independent Trustees have determined that they can act independently and effectively without having an Independent Trustee serve as Chair and that a key structural component for assuring that they are in a position to do so is for the Independent Trustees to constitute a substantial majority for the Board. The Independent Trustees also regularly meet in executive session. David M. Thomas serves as Lead Independent Trustee and as such (i) acts as a liaison between the Independent Trustees and management with respect to matters important to the Independent Trustees and (ii) with management prepares agendas for Board meetings.
Fidelity® funds are overseen by different Boards of Trustees. The fund's Board oversees Fidelity's high income and certain equity funds, and other Boards oversee Fidelity's investment-grade bond, money market, asset allocation, and other equity funds. The asset allocation funds may invest in Fidelity® funds overseen by the fund's Board. The use of separate Boards, each with its own committee structure, allows the Trustees of each group of Fidelity® funds to focus on the unique issues of the funds they oversee, including common research, investment, and operational issues. On occasion, the separate Boards establish joint committees to address issues of overlapping consequences for the Fidelity® funds overseen by each Board.
The Trustees operate using a system of committees to facilitate the timely and efficient consideration of all matters of importance to the Trustees, the fund, and fund shareholders and to facilitate compliance with legal and regulatory requirements and oversight of the fund's activities and associated risks. The Board, acting through its committees, has charged FMR and its affiliates with (i) identifying events or circumstances the occurrence of which could have demonstrably adverse effects on the fund's business and/or reputation; (ii) implementing processes and controls to lessen the possibility that such events or circumstances occur or to mitigate the effects of such events or circumstances if they do occur; and (iii) creating and maintaining a system designed to evaluate continuously business and market conditions in order to facilitate the identification and implementation processes described in (i) and (ii) above. Because the day-to-day operations and activities of the fund are carried out by or through FMR, its affiliates, and other service providers, the fund's exposure to risks is mitigated but not eliminated by the processes overseen by the Trustees. While each of the Board's committees has responsibility for overseeing different aspects of the fund's activities, oversight is exercised primarily through the Operations, Audit, and Compliance Committees. Appropriate personnel, including but not limited to the fund's Chief Compliance Officer (CCO), FMR's internal auditor, the independent accountants, the fund's Treasurer and portfolio management personnel, make periodic reports to the Board's committees, as appropriate, including an annual review of Fidelity's risk management program for the Fidelity® funds. The responsibilities of each standing committee, including their oversight responsibilities, are described further under "Standing Committees of the Trustees."
Interested Trustees*:
Correspondence intended for a Trustee who is an interested person may be sent to Fidelity Investments, 245 Summer Street, Boston, Massachusetts 02210.
Name, Year of Birth; Principal Occupations and Other Relevant Experience+
Jonathan Chiel (1957)
Year of Election or Appointment: 2016
Trustee
Mr. Chiel also serves as Trustee of other Fidelity® funds. Mr. Chiel is Executive Vice President and General Counsel for FMR LLC (diversified financial services company, 2012-present). Previously, Mr. Chiel served as general counsel (2004-2012) and senior vice president and deputy general counsel (2000-2004) for John Hancock Financial Services; a partner with Choate, Hall & Stewart (1996-2000) (law firm); and an Assistant United States Attorney for the United States Attorney’s Office of the District of Massachusetts (1986-95), including Chief of the Criminal Division (1993-1995). Mr. Chiel is a director on the boards of the Boston Bar Foundation and the Maimonides School.
Bettina Doulton (1964)
Year of Election or Appointment: 2021
Trustee
Ms. Doulton also serves as Trustee of other Fidelity® funds. Prior to her retirement, Ms. Doulton served in a variety of positions at Fidelity Investments, including as a managing director of research (2006-2007), portfolio manager to certain Fidelity® funds (1993-2005), equity analyst and portfolio assistant (1990-1993), and research assistant (1987-1990). Ms. Doulton currently owns and operates Phi Builders + Architects and Cellardoor Winery. Previously, Ms. Doulton served as a member of the Board of Brown Capital Management, LLC (2014-2018).
Robert A. Lawrence (1952)
Year of Election or Appointment: 2020
Trustee
Chair of the Board of Trustees
Mr. Lawrence also serves as Trustee of other funds. Previously, Mr. Lawrence served as a Trustee and Member of the Advisory Board of certain funds. Prior to his retirement in 2008, Mr. Lawrence served as Vice President of certain Fidelity® funds (2006-2008), Senior Vice President, Head of High Income Division of Fidelity Management & Research Company (investment adviser firm, 2006-2008), and President of Fidelity Strategic Investments (investment adviser firm, 2002-2005).
* Determined to be an “Interested Trustee” by virtue of, among other things, his or her affiliation with the trust or various entities under common control with FMR.
+ The information includes the Trustee's principal occupation during the last five years and other information relating to the experience, attributes, and skills relevant to the Trustee's qualifications to serve as a Trustee, which led to the conclusion that the Trustee should serve as a Trustee for the fund.
Independent Trustees:
Correspondence intended for an Independent Trustee may be sent to Fidelity Investments, P.O. Box 55235, Boston, Massachusetts 02205-5235.
Name, Year of Birth; Principal Occupations and Other Relevant Experience+
Thomas P. Bostick (1956)
Year of Election or Appointment: 2021
Trustee
Lieutenant General Bostick also serves as Trustee of other Fidelity® funds. Prior to his retirement, General Bostick (United States Army, Retired) held a variety of positions within the U.S. Army, including Commanding General and Chief of Engineers, U.S. Army Corps of Engineers (2012-2016) and Deputy Chief of Staff and Director of Human Resources, U.S. Army (2009-2012). General Bostick currently serves as a member of the Board and Finance and Governance Committees of CSX Corporation (transportation, 2020-present) and a member of the Board and Corporate Governance and Nominating Committee of Perma-Fix Environmental Services, Inc. (nuclear waste management, 2020-present). General Bostick serves as Chief Executive Officer of Bostick Global Strategies, LLC (consulting, 2016-present) and as a member of the Board of HireVue, Inc. (video interview and assessment, 2020-present). Previously, General Bostick served as a Member of the Advisory Board of certain Fidelity® funds (2021), President, Intrexon Bioengineering (2018-2020) and Chief Operating Officer (2017-2020) and Senior Vice President of the Environment Sector (2016-2017) of Intrexon Corporation (biopharmaceutical company).
Dennis J. Dirks (1948)
Year of Election or Appointment: 2005
Trustee
Mr. Dirks also serves as Trustee of other Fidelity® funds. Prior to his retirement in May 2003, Mr. Dirks served as Chief Operating Officer and as a member of the Board of The Depository Trust & Clearing Corporation (financial markets infrastructure), President, Chief Operating Officer and a member of the Board of The Depository Trust Company (DTC), President and a member of the Board of the National Securities Clearing Corporation (NSCC), Chief Executive Officer and a member of the Board of the Government Securities Clearing Corporation and Chief Executive Officer and a member of the Board of the Mortgage-Backed Securities Clearing Corporation. Mr. Dirks currently serves as a member of the Finance Committee (2016-present) and Board (2017-present) and is Treasurer (2018-present) of the Asolo Repertory Theatre.
Donald F. Donahue (1950)
Year of Election or Appointment: 2018
Trustee
Mr. Donahue also serves as Trustee of other Fidelity® funds. Mr. Donahue serves as President and Chief Executive Officer of Miranda Partners, LLC (risk consulting for the financial services industry, 2012-present). Previously, Mr. Donahue served as Chief Executive Officer (2006-2012), Chief Operating Officer (2003-2006) and Managing Director, Customer Marketing and Development (1999-2003) of The Depository Trust & Clearing Corporation (financial markets infrastructure). Mr. Donahue currently serves as a member (2007-present) and Co-Chairman (2016-present) of the Board of United Way of New York and a member of the Board of The Leadership Academy (previously NYC Leadership Academy) (2012-present). Mr. Donahue previously served as a member of the Advisory Board of certain Fidelity® funds (2015-2018).
Vicki L. Fuller (1957)
Year of Election or Appointment: 2020
Trustee
Ms. Fuller also serves as Trustee of other Fidelity® funds. Previously, Ms. Fuller served as a member of the Advisory Board of certain Fidelity® funds (2018-2020), Chief Investment Officer of the New York State Common Retirement Fund (2012-2018) and held a variety of positions at AllianceBernstein L.P. (global asset management, 1985-2012), including Managing Director (2006-2012) and Senior Vice President and Senior Portfolio Manager (2001-2006). Ms. Fuller currently serves as a member of the Board, Audit Committee and Nominating and Governance Committee of two Blackstone business development companies (2020-present), as a member of the Board of Treliant, LLC (consulting, 2019-present), as a member of the Advisory Board of Ariel Alternatives, LLC (private equity, 2021-present) and as a member of the Board and Chair of the Audit Committee of Gusto, Inc. (software, 2021-present). In addition, Ms. Fuller currently serves as a member of the Board of Roosevelt University (2019-present) and as a member of the Executive Board of New York University’s Stern School of Business. Ms. Fuller previously served as a member of the Board, Audit Committee and Nominating and Governance Committee of The Williams Companies, Inc. (natural gas infrastructure, 2018-2021).
Patricia L. Kampling (1959)
Year of Election or Appointment: 2020
Trustee
Ms. Kampling also serves as Trustee of other Fidelity® funds. Prior to her retirement, Ms. Kampling served as Chairman of the Board and Chief Executive Officer (2012-2019), President and Chief Operating Officer (2011-2012) and Executive Vice President and Chief Financial Officer (2010-2011) of Alliant Energy Corporation. Ms. Kampling currently serves as a member of the Board, Finance Committee and Governance, Compensation and Nominating Committee of Xcel Energy Inc. (utilities company, 2020-present) and as a member of the Board, Audit, Finance and Risk Committee and Safety, Environmental, Technology and Operations Committee and Chair of the Executive Development and Compensation Committee of American Water Works Company, Inc. (utilities company, 2019-present). In addition, Ms. Kampling currently serves as a member of the Board of the Nature Conservancy, Wisconsin Chapter (2019-present). Previously, Ms. Kampling served as a Member of the Advisory Board of certain Fidelity® funds (2020), a member of the Board, Compensation Committee and Executive Committee and Chair of the Audit Committee of Briggs & Stratton Corporation (manufacturing, 2011-2021), a member of the Board of Interstate Power and Light Company (2012-2019) and Wisconsin Power and Light Company (2012-2019) (each a subsidiary of Alliant Energy Corporation) and as a member of the Board and Workforce Development Committee of the Business Roundtable (2018-2019).
Thomas A. Kennedy (1955)
Year of Election or Appointment: 2021
Trustee
Mr. Kennedy also serves as Trustee of other Fidelity® funds. Previously, Mr. Kennedy served as a Member of the Advisory Board of certain Fidelity® funds (2020) and held a variety of positions at Raytheon Company (aerospace and defense, 1983-2020), including Chairman and Chief Executive Officer (2014-2020) and Executive Vice President and Chief Operating Officer (2013-2014). Mr. Kennedy currently serves as Executive Chairman of the Board of Directors of Raytheon Technologies Corporation (aerospace and defense, 2020-present). He is also a member of the Rutgers School of Engineering Industry Advisory Board (2011-present) and a member of the UCLA Engineering Dean’s Executive Board (2016-present).
Oscar Munoz (1959)
Year of Election or Appointment: 2021
Trustee
Mr. Munoz also serves as Trustee of other Fidelity® funds. Prior to his retirement, Mr. Munoz served as Executive Chairman (2020-2021), Chief Executive Officer (2015-2020), President (2015-2016) and a member of the Board (2010-2021) of United Airlines Holdings, Inc. Mr. Munoz currently serves as a member of the Board of CBRE Group, Inc. (commercial real estate, 2020-present), a member of the Board of Univision Communications, Inc. (Hispanic media, 2020-present) and a member of the Advisory Board of Salesforce.com, Inc. (cloud-based software, 2020-present). Previously, Mr. Munoz served as a Member of the Advisory Board of certain Fidelity® funds (2021).
Garnett A. Smith (1947)
Year of Election or Appointment: 2018
Trustee
Mr. Smith also serves as Trustee of other Fidelity® funds. Prior to his retirement, Mr. Smith served as Chairman and Chief Executive Officer (1990-1997) and President (1986-1990) of Inbrand Corp. (manufacturer of personal absorbent products). Prior to his employment with Inbrand Corp., he was employed by a retail fabric chain and North Carolina National Bank (now Bank of America). Mr. Smith previously served as a member of the Advisory Board of certain Fidelity® funds (2012-2013).
David M. Thomas (1949)
Year of Election or Appointment: 2008
Trustee
Lead Independent Trustee
Mr. Thomas also serves as Trustee of other Fidelity® funds. Previously, Mr. Thomas served as Executive Chairman (2005-2006) and Chairman and Chief Executive Officer (2000-2005) of IMS Health, Inc. (pharmaceutical and healthcare information solutions). Mr. Thomas currently serves as a member of the Board of Fortune Brands Home and Security (home and security products, 2004-present) and as Director (2013-present) and Non-Executive Chairman of the Board (2022-present) of Interpublic Group of Companies, Inc. (marketing communication).
Susan Tomasky (1953)
Year of Election or Appointment: 2020
Trustee
Ms. Tomasky also serves as Trustee of other Fidelity® funds. Prior to her retirement, Ms. Tomasky served in various executive officer positions at American Electric Power Company, Inc. (1998-2011), including most recently as President of AEP Transmission (2007-2011). Ms. Tomasky currently serves as a member of the Board and Sustainability Committee and as Chair of the Audit Committee of Marathon Petroleum Corporation (2018-present) and as a member of the Board, Executive Committee, Corporate Governance Committee and Organization and Compensation Committee and as Chair of the Audit Committee of Public Service Enterprise Group, Inc. (utilities company, 2012-present) and as a member of the Board of its subsidiary company, Public Service Electric and Gas Co. (2021-present). In addition, Ms. Tomasky currently serves as a member (2009-present) and President (2020-present) of the Board of the Royal Shakespeare Company – America (2009-present), as a member of the Board of the Columbus Association for the Performing Arts (2011-present) and as a member of the Board and Kenyon in the World Committee of Kenyon College (2016-present). Previously, Ms. Tomasky served as a Member of the Advisory Board of certain Fidelity® funds (2020), as a member of the Board of the Columbus Regional Airport Authority (2007-2020), as a member of the Board (2011-2018) and Lead Independent Director (2015-2018) of Andeavor Corporation (previously Tesoro Corporation) (independent oil refiner and marketer) and as a member of the Board of Summit Midstream Partners LP (energy, 2012-2018).
Michael E. Wiley (1950)
Year of Election or Appointment: 2020
Trustee
Mr. Wiley also serves as Trustee of other Fidelity® funds. Previously, Mr. Wiley served as a member of the Advisory Board of certain Fidelity® funds (2018-2020), Chairman, President and CEO of Baker Hughes, Inc. (oilfield services, 2000-2004). Mr. Wiley also previously served as a member of the Board of Andeavor Corporation (independent oil refiner and marketer, 2005-2018), a member of the Board of Andeavor Logistics LP (natural resources logistics, 2015-2018) and a member of the Board of High Point Resources (exploration and production, 2005-2020).
+ The information includes the Trustee's principal occupation during the last five years and other information relating to the experience, attributes, and skills relevant to the Trustee's qualifications to serve as a Trustee, which led to the conclusion that the Trustee should serve as a Trustee for the fund.
Advisory Board Members and Officers:
Correspondence intended for a Member of the Advisory Board (if any) may be sent to Fidelity Investments, P.O. Box 55235, Boston, Massachusetts 02205-5235. Correspondence intended for an officer or Peter S. Lynch may be sent to Fidelity Investments, 245 Summer Street, Boston, Massachusetts 02210. Officers appear below in alphabetical order.
Name, Year of Birth; Principal Occupation
Peter S. Lynch (1944)
Year of Election or Appointment: 2003
Member of the Advisory Board
Mr. Lynch also serves as a Member of the Advisory Board of other Fidelity® funds. Mr. Lynch is Vice Chairman and a Director of Fidelity Management & Research Company LLC (investment adviser firm). In addition, Mr. Lynch serves as a Trustee of Boston College and as the Chairman of the Inner-City Scholarship Fund. Previously, Mr. Lynch served as Vice Chairman and a Director of FMR Co., Inc. (investment adviser firm) and on the Special Olympics International Board of Directors (1997-2006).
Craig S. Brown (1977)
Year of Election or Appointment: 2019
Assistant Treasurer
Mr. Brown also serves as an officer of other funds. Mr. Brown serves as Assistant Treasurer of FIMM, LLC (2021-present) and is an employee of Fidelity Investments (2013-present).
John J. Burke III (1964)
Year of Election or Appointment: 2018
Chief Financial Officer
Mr. Burke also serves as Chief Financial Officer of other funds. Mr. Burke serves as Head of Investment Operations for Fidelity Fund and Investment Operations (2018-present) and is an employee of Fidelity Investments (1998-present). Previously Mr. Burke served as head of Asset Management Investment Operations (2012-2018).
William C. Coffey (1969)
Year of Election or Appointment: 2019
Assistant Secretary
Mr. Coffey also serves as Assistant Secretary of other funds. He is Senior Vice President and Deputy General Counsel of FMR LLC (diversified financial services company, 2010-present), and is an employee of Fidelity Investments. Previously, Mr. Coffey served as Secretary and CLO of certain funds (2018-2019); CLO, Secretary, and Senior Vice President of Fidelity Management & Research Company and FMR Co., Inc. (investment adviser firms, 2018-2019); Secretary of Fidelity SelectCo, LLC and Fidelity Investments Money Management, Inc. (investment adviser firms, 2018-2019); CLO of Fidelity Management & Research (Hong Kong) Limited, FMR Investment Management (UK) Limited, and Fidelity Management & Research (Japan) Limited (investment adviser firms, 2018-2019); and Assistant Secretary of certain funds (2009-2018).
Timothy M. Cohen (1969)
Year of Election or Appointment: 2018
Vice President
Mr. Cohen also serves as Vice President of other funds. Mr. Cohen serves as Co-Head of Equity (2018-present), a Director of Fidelity Management & Research (Japan) Limited (investment adviser firm, 2016-present), and is an employee of Fidelity Investments. Previously, Mr. Cohen served as Executive Vice President of Fidelity SelectCo, LLC (2019), Head of Global Equity Research (2016-2018), Chief Investment Officer - Equity and a Director of Fidelity Management & Research (U.K.) Inc. (investment adviser firm, 2013-2015) and as a Director of Fidelity Management & Research (Hong Kong) Limited (investment adviser firm, 2017).
Jonathan Davis (1968)
Year of Election or Appointment: 2010
Assistant Treasurer
Mr. Davis also serves as an officer of other funds. Mr. Davis serves as Assistant Treasurer of FIMM, LLC (2021-present), FMR Capital, Inc. (2017-present), FD Funds GP LLC (2021-present), FD Funds Holding LLC (2021-present), and FD Funds Management LLC (2021-present); and is an employee of Fidelity Investments. Previously, Mr. Davis served as Vice President and Associate General Counsel of FMR LLC (diversified financial services company, 2003-2010).
Laura M. Del Prato (1964)
Year of Election or Appointment: 2018
Assistant Treasurer
Ms. Del Prato also serves as an officer of other funds. Ms. Del Prato serves as Assistant Treasurer of FIMM, LLC (2021-present) and is an employee of Fidelity Investments (2017-present). Previously, Ms. Del Prato served as President and Treasurer of The North Carolina Capital Management Trust: Cash Portfolio and Term Portfolio (2018-2020). Prior to joining Fidelity Investments, Ms. Del Prato served as a Managing Director and Treasurer of the JPMorgan Mutual Funds (2014-2017). Prior to JPMorgan, Ms. Del Prato served as a partner at Cohen Fund Audit Services (accounting firm, 2012-2013) and KPMG LLP (accounting firm, 2004-2012).
Colm A. Hogan (1973)
Year of Election or Appointment: 2020
Assistant Treasurer
Mr. Hogan also serves as an officer of other funds. Mr. Hogan serves as Assistant Treasurer of FIMM, LLC (2021-present) and FMR Capital, Inc. (2017-present) and is an employee of Fidelity Investments (2005-present). Previously, Mr. Hogan served as Deputy Treasurer of certain Fidelity® funds (2016-2020) and Assistant Treasurer of certain Fidelity® funds (2016-2018).
Pamela R. Holding (1964)
Year of Election or Appointment: 2018
Vice President
Ms. Holding also serves as Vice President of other funds. Ms. Holding serves as Co-Head of Equity (2018-present) and is an employee of Fidelity Investments (2013-present). Previously, Ms. Holding served as Executive Vice President of Fidelity SelectCo, LLC (2019) and as Chief Investment Officer of Fidelity Institutional Asset Management (2013-2018).
Cynthia Lo Bessette (1969)
Year of Election or Appointment: 2019
Secretary and Chief Legal Officer (CLO)
Ms. Lo Bessette also serves as an officer of other funds. Ms. Lo Bessette serves as CLO, Secretary, and Senior Vice President of Fidelity Management & Research Company LLC (investment adviser firm, 2019-present); CLO of Fidelity Management & Research (Hong Kong) Limited, FMR Investment Management (UK) Limited, and Fidelity Management & Research (Japan) Limited (investment adviser firms, 2019-present); Secretary of FD Funds GP LLC (2021-present), FD Funds Holding LLC (2021-present), and FD Funds Management LLC (2021-present); and Assistant Secretary of FIMM, LLC (2019-present). She is a Senior Vice President and Deputy General Counsel of FMR LLC (diversified financial services company, 2019-present), and is an employee of Fidelity Investments. Previously, Ms. Lo Bessette served as CLO, Secretary, and Senior Vice President of FMR Co., Inc. (investment adviser firm, 2019); Secretary of Fidelity SelectCo, LLC and Fidelity Investments Money Management, Inc. (investment adviser firms, 2019). Prior to joining Fidelity Investments, Ms. Lo Bessette was Executive Vice President, General Counsel (2016-2019) and Senior Vice President, Deputy General Counsel (2015-2016) of OppenheimerFunds (investment management company) and Deputy Chief Legal Officer (2013-2015) of Jennison Associates LLC (investment adviser firm).
Chris Maher (1972)
Year of Election or Appointment: 2020
Deputy Treasurer
Mr. Maher also serves as an officer of other funds. Mr. Maher serves as Assistant Treasurer of FIMM, LLC (2021-present) and FMR Capital, Inc. (2017-present), and is an employee of Fidelity Investments (2008-present). Previously, Mr. Maher served as Assistant Treasurer of certain funds (2013-2020); Vice President of Asset Management Compliance (2013), Vice President of the Program Management Group of FMR (investment adviser firm, 2010-2013), and Vice President of Valuation Oversight (2008-2010).
Jason P. Pogorelec (1975)
Year of Election or Appointment: 2020
Chief Compliance Officer
Mr. Pogorelec also serves as Chief Compliance Officer of other funds. Mr. Pogorelec is a senior Vice President of Asset Management Compliance for Fidelity Investments and is an employee of Fidelity Investments (2006-present). Previously, Mr. Pogorelec served as Vice President, Associate General Counsel for Fidelity Investments (2010-2020) and Assistant Secretary of certain Fidelity funds (2015-2020).
Brett Segaloff (1972)
Year of Election or Appointment: 2021
Anti-Money Laundering (AML) Officer
Mr. Segaloff also serves as an AML Officer of other funds and other related entities. He is Director, Anti-Money Laundering (2007-present) of FMR LLC (diversified financial services company) and is an employee of Fidelity Investments (1996-present).
Stacie M. Smith (1974)
Year of Election or Appointment: 2016
President and Treasurer
Ms. Smith also serves as an officer of other funds. Ms. Smith serves as Assistant Treasurer of FIMM, LLC (2021-present) and FMR Capital, Inc. (2017-present), is an employee of Fidelity Investments (2009-present), and has served in other fund officer roles. Prior to joining Fidelity Investments, Ms. Smith served as Senior Audit Manager of Ernst & Young LLP (accounting firm, 1996-2009). Previously, Ms. Smith served as Assistant Treasurer (2013-2019) and Deputy Treasurer (2013-2016) of certain Fidelity® funds.
Jim Wegmann (1979)
Year of Election or Appointment: 2019
Assistant Treasurer
Mr. Wegmann also serves as an officer of other funds. Mr. Wegmann serves as Assistant Treasurer of FIMM, LLC (2021-present) and is an employee of Fidelity Investments (2011-present). Previously, Mr. Wegmann served as Assistant Treasurer of certain Fidelity® funds (2019-2021).
Shareholder Expense Example
As a shareholder, you incur two types of costs: (1) transaction costs, which may include sales charges (loads) on purchase payments or redemption proceeds, as applicable and (2) ongoing costs, which generally include management fees, distribution and/or service (12b-1) fees and other Fund expenses. This Example is intended to help you understand your ongoing costs (in dollars) of investing in a fund and to compare these costs with the ongoing costs of investing in other mutual funds.
The Example is based on an investment of $1,000 invested at the beginning of the period and held for the entire period (February 1, 2022 to July 31, 2022).
Actual Expenses
The first line of the accompanying table provides information about actual account values and actual expenses. You may use the information in this line, together with the amount you invested, to estimate the expenses that you paid over the period. Simply divide your account value by $1,000.00 (for example, an $8,600 account value divided by $1,000.00 = 8.6), then multiply the result by the number in the first line for a class/Fund under the heading entitled "Expenses Paid During Period" to estimate the expenses you paid on your account during this period. If any fund is a shareholder of any underlying mutual funds or exchange-traded funds (ETFs) (the Underlying Funds), such fund indirectly bears its proportional share of the expenses of the Underlying Funds in addition to the direct expenses incurred presented in the table. These fees and expenses are not included in the annualized expense ratio used to calculate the expense estimate in the table below.
Hypothetical Example for Comparison Purposes
The second line of the accompanying table provides information about hypothetical account values and hypothetical expenses based on the actual expense ratio and an assumed rate of return of 5% per year before expenses, which is not the actual return. The hypothetical account values and expenses may not be used to estimate the actual ending account balance or expenses you paid for the period. You may use this information to compare the ongoing costs of investing in the Fund and other funds. To do so, compare this 5% hypothetical example with the 5% hypothetical examples that appear in the shareholder reports of the other funds. If any fund is a shareholder of any Underlying Funds, such fund indirectly bears its proportional share of the expenses of the Underlying Funds in addition to the direct expenses as presented in the table. These fees and expenses are not included in the annualized expense ratio used to calculate the expense estimate in the table below.
Please note that the expenses shown in the table are meant to highlight your ongoing costs only and do not reflect any transaction costs. Therefore, the second line of the table is useful in comparing ongoing costs only, and will not help you determine the relative total costs of owning different funds. In addition, if these transactional costs were included, your costs would have been higher.
| | Annualized Expense Ratio-A | Beginning
Account Value
February 1, 2022 | Ending
Account Value
July 31, 2022 | Expenses Paid
During Period-B
February 1, 2022
to July 31, 2022 |
| Fidelity Series Real Estate Income Fund | - %-C | | | |
| Actual | | $1,000.00 | $951.60 | $--D |
| Hypothetical-E | | $1,000.00 | $1,024.79 | $--D |
A Annualized expense ratio reflects expenses net of applicable fee waivers.
B Expenses are equal to the annualized expense ratio, multiplied by the average account value over the period, multiplied by 181/ 365 (to reflect the one-half year period). The fees and expenses of any Underlying Funds are not included in each annualized expense ratio.
C Amount represents less than .005%.
D Amount represents less than $.005.
E 5% return per year before expenses
Distributions (Unaudited)
The dividend and capital gains distributions for the fund(s) are available on Fidelity.com or Institutional.Fidelity.com.
The fund hereby designates as a capital gain dividend with respect to the taxable year ended July 31, 2022, $ 21,997,650, or, if subsequently determined to be different, the net capital gain of such year.
The fund designates $25,050,082 of distributions paid in the calendar year 2021 as qualifying to be taxed as section 163(j) interest dividends.
The fund designates 1%, 4%, 5%, and 5% of the dividends distributed in September, December, March, and June, respectively during the fiscal year as qualifying for the dividends–received deduction for corporate shareholders.
The fund designates 1%, 5%, 6%, and 6% of the dividends distributed in September, December, March, and June during the fiscal year as amounts which may be taken into account as a dividend for the purposes of the maximum rate under section 1(h)(11) of the Internal Revenue Code.
The fund designates 27%, 36%, 77%, and 77% of the dividends distributed in September, December, March, and June, respectively during the fiscal year as a section 199A dividend.
The fund will notify shareholders in January 2023 of amounts for use in preparing 2022 income tax returns.
Board Approval of Investment Advisory Contracts and Management Fees
Fidelity Series Real Estate Income Fund
Each year, the Board of Trustees, including the Independent Trustees (together, the Board), votes on the renewal of the management contract with Fidelity Management & Research Company LLC (FMR) and the sub-advisory agreements (together, the Advisory Contracts) for the fund. FMR and the sub-advisers are referred to herein as the Investment Advisers. The Board, assisted by the advice of fund counsel and Independent Trustees' counsel, requests and considers a broad range of information relevant to the renewal of the Advisory Contracts throughout the year.
The Board meets regularly and, at each of its meetings, covers an extensive agenda of topics and materials and considers factors that are relevant to its annual consideration of the renewal of the fund's Advisory Contracts, including the services and support provided to the fund and its shareholders. The Board has established various standing committees (Committees), each composed of and chaired by Independent Trustees with varying backgrounds, to which the Board has assigned specific subject matter responsibilities in order to enhance effective decision-making by the Board. The Board, acting directly and through its Committees, requests and receives information concerning the annual consideration of the renewal of the fund's Advisory Contracts. The Board also meets as needed to review matters specifically related to the Board's annual consideration of the renewal of the Advisory Contracts. Members of the Board may also meet with trustees of other Fidelity funds through joint ad hoc committees to discuss certain matters relevant to all of the Fidelity funds.
At its May 2022 meeting, the Board unanimously determined to renew the fund's Advisory Contracts. In considering whether to renew the Advisory Contracts for the fund, the Board considered all factors it believed relevant and reached a determination, with the assistance of fund counsel and Independent Trustees' counsel and through the exercise of its business judgment, that the renewal of the Advisory Contracts was in the best interests of the fund and its shareholders and the fact that no fee is payable under the management contract was fair and reasonable.
Nature, Extent, and Quality of Services Provided. The Board considered Fidelity's staffing as it relates to the fund, including the backgrounds of investment personnel of Fidelity, and also considered the fund's investment objective, strategies, and related investment philosophy. The Independent Trustees also had discussions with senior management of Fidelity's investment operations and investment groups. The Board considered the structure of the investment personnel compensation program and whether this structure provides appropriate incentives to act in the best interests of the fund. The Board also considered the steps Fidelity had taken to ensure the continued provision of high quality services to the Fidelity funds during the COVID-19 pandemic, including the expansion of staff in client facing positions to maintain service levels in periods of high volumes and volatility.
Resources Dedicated to Investment Management and Support Services. The Board and the Fund Oversight and Research Committees reviewed the general qualifications and capabilities of Fidelity's investment staff, including its size, education, experience, and resources, as well as Fidelity's approach to recruiting, training, managing, and compensating investment personnel. The Board noted the resources devoted to expansion of Fidelity's global investment organization, and that Fidelity's analysts have extensive resources, tools, and capabilities that allow them to conduct sophisticated quantitative and fundamental analysis, as well as credit analysis of issuers, counterparties, and guarantors. Further, the Board considered that Fidelity's investment professionals have sufficient access to global information and data so as to provide competitive investment results over time, and that those professionals also have access to sophisticated tools that permit them to assess portfolio construction and risk and performance attribution characteristics continuously, as well as to transmit new information and research conclusions rapidly around the world. Additionally, in its deliberations, the Board considered Fidelity's trading, risk management, compliance, and technology and operations capabilities and resources, which are integral parts of the investment management process.
Administrative Services. The Board considered (i) the nature, extent, quality, and cost of advisory and administrative services performed by the Investment Advisers and their affiliates under the Advisory Contracts and under separate agreements covering transfer agency, pricing and bookkeeping, and securities lending services for the fund; (ii) the nature and extent of the supervision of third party service providers, principally custodians, subcustodians, and pricing vendors; and (iii) the resources devoted to, and the record of compliance with, the fund's compliance policies and procedures. The Board also reviewed the allocation of fund brokerage, including allocations to brokers affiliated with the Investment Advisers, the use of brokerage commissions to pay fund expenses, and the use of "soft" commission dollars to pay for research services.
Investment Performance. The Board considered whether the fund has operated in accordance with its investment objective, as well as its record of compliance with its investment restrictions. The Board reviewed the fund's absolute investment performance, as well as the fund's relative investment performance, but did not consider performance to be a material factor in its decision to renew the fund's Advisory Contracts, as the fund is not publicly offered as a stand-alone investment product. In this regard, the Board noted that the fund is designed to offer an investment option for other investment companies, 529 plans, and collective investment trusts managed by Fidelity and ultimately to enhance the performance of those investment companies, 529 plans, and collective investment trusts. The Board noted that there was a portfolio management change for the fund in March 2019 and July 2021. The Board will continue to monitor closely the fund's performance, taking into account the portfolio management changes.
Based on its review, the Board concluded that the nature, extent, and quality of services provided to the fund under the Advisory Contracts should continue to benefit the shareholders of the fund.
Competitiveness of Management Fee and Total Expense Ratio. The Board considered that the fund does not pay FMR a management fee for investment advisory services, but that FMR receives fees for providing services to funds that invest in the fund. The Board noted that FMR or an affiliate undertakes to pay all operating expenses of the fund, except transfer agent fees, 12b-1 fees, Independent Trustee fees and expenses, custodian fees and expenses, proxy and shareholder meeting expenses, interest, taxes, and extraordinary expenses (such as litigation expenses). The Board further noted that the fund pays its non-operating expenses, including brokerage commissions and fees and expenses associated with the fund's securities lending program, if applicable.
The Board further considered that FMR has contractually agreed to reimburse the fund to the extent that total operating expenses, with certain exceptions, as a percentage of its average net assets, exceed 0.003% through November 30, 2024.
Based on its review, the Board considered that the fund does not pay a management fee and concluded that the total expense ratio of the fund was reasonable in light of the services that the fund and its shareholders receive and the other factors considered.
Costs of the Services and Profitability. The Board considered the level of Fidelity's profits in respect of all the Fidelity funds.
A public accounting firm has been engaged annually by the Board as part of the Board's assessment of Fidelity's profitability analysis. The engagement includes the review and assessment of the methodologies used by Fidelity in determining the revenues and expenses attributable to Fidelity's mutual fund business, and completion of agreed-upon procedures in respect of the mathematical accuracy of certain fund profitability information and its conformity to established allocation methodologies. After considering the reports issued under the engagement and information provided by Fidelity, the Board concluded that while other allocation methods may also be reasonable, Fidelity's profitability methodologies are reasonable in all material respects.
The Board also reviewed Fidelity's non-fund businesses and potential indirect benefits such businesses may have received as a result of their association with Fidelity's mutual fund business (i.e., fall-out benefits) as well as cases where Fidelity's affiliates may benefit from the funds' business. The Board considered areas where potential indirect benefits to the Fidelity funds from their relationships with Fidelity may exist. The Board's consideration of these matters was informed by the findings of a joint ad hoc committee created by it and the boards of other Fidelity funds to evaluate potential fall-out benefits.
The Board concluded that the costs of the services provided by and the profits realized by Fidelity in connection with the operation of the fund were not relevant to the renewal of the Advisory Contracts because the fund pays no advisory fees and FMR bears all expenses of the fund with certain exceptions.
Economies of Scale. The Board concluded that because the fund pays no advisory fees and FMR bears all expenses of the fund with certain exceptions, the realization of economies of scale was not a material factor in the Board's decision to renew the fund's Advisory Contracts.
Additional Information Requested by the Board. In order to develop fully the factual basis for consideration of the Fidelity funds' advisory contracts, the Board requested and received additional information on certain topics, including: (i) fund flow and performance trends, in particular the underperformance of certain funds and strategies, and Fidelity's long-term strategies for certain funds, including any consideration of fund liquidations or mergers; (ii) the operation of performance fees, competitor use of performance fees, and consideration of the expansion of performance fees to additional funds; (iii) Fidelity's pricing philosophy compared to competitors; (iv) fund profitability methodology and data; (v) evaluation of competitive fund data and peer group classifications and fee and expense comparisons; (vi) the management fee and expense structures for different funds and classes and information about the differences between various fee and expense structures; (vii) group fee breakpoints and related voluntary fee waivers; and (viii) information regarding other accounts managed by Fidelity and the funds' sub-advisory arrangements.
Based on its evaluation of all of the conclusions noted above, and after considering all factors it believed relevant, the Board concluded that the advisory fee arrangements are fair and reasonable and that the fund's Advisory Contracts should be renewed.
Liquidity Risk Management Program
The Securities and Exchange Commission adopted Rule 22e-4 under the Investment Company Act of 1940 (the Liquidity Rule) to promote effective liquidity risk management throughout the open-end investment company industry, thereby reducing the risk that funds will be unable to meet their redemption obligations and mitigating dilution of the interests of fund shareholders.
The Fund has adopted and implemented a liquidity risk management program pursuant to the Liquidity Rule (the Program) effective December 1, 2018. The Program is reasonably designed to assess and manage the Fund’s liquidity risk and to comply with the requirements of the Liquidity Rule. The Fund’s Board of Trustees (the Board) has designated the Fund’s investment adviser as administrator of the Program. The Fidelity advisers have established a Liquidity Risk Management Committee (the LRM Committee) to manage the Program for each of the Fidelity Funds. The LRM Committee monitors the adequacy and effectiveness of implementation of the Program and on a periodic basis assesses each Fund’s liquidity risk based on a variety of factors including (1) the Fund’s investment strategy, (2) portfolio liquidity and cash flow projections during normal and reasonably foreseeable stressed conditions, (3) shareholder redemptions, (4) borrowings and other funding sources and (5) in the case of exchange-traded funds, certain additional factors including the effect of the Fund’s prices and spreads, market participants, and basket compositions on the overall liquidity of the Fund’s portfolio, as applicable.
In accordance with the Program, each of the Fund’s portfolio investments is classified into one of four liquidity categories described below based on a determination of a reasonable expectation for how long it would take to convert the investment to cash (or sell or dispose of the investment) without significantly changing its market value.
- Highly liquid investments – cash or convertible to cash within three business days or less
- Moderately liquid investments – convertible to cash in three to seven calendar days
- Less liquid investments – can be sold or disposed of, but not settled, within seven calendar days
- Illiquid investments – cannot be sold or disposed of within seven calendar days
Liquidity classification determinations take into account a variety of factors including various market, trading and investment-specific considerations, as well as market depth, and generally utilize analysis from a third-party liquidity metrics service.
The Liquidity Rule places a 15% limit on a fund’s illiquid investments and requires funds that do not primarily hold assets that are highly liquid investments to determine and maintain a minimum percentage of the fund’s net assets to be invested in highly liquid investments (highly liquid investment minimum or HLIM). The Program includes provisions reasonably designed to comply with the 15% limit on illiquid investments and for determining, periodically reviewing and complying with the HLIM requirement as applicable.
At a recent meeting of the Fund’s Board of Trustees, the LRM Committee provided a written report to the Board pertaining to the operation, adequacy, and effectiveness of implementation of the Program for the annual period from December 1, 2020 through November 30, 2021. The report concluded that the Program has been implemented and is operating effectively and is reasonably designed to assess and manage the Fund’s liquidity risk.
SRE-ANN-0922
1.924310.110
Fidelity® Series Small Cap Opportunities Fund
Annual Report
July 31, 2022
Contents
To view a fund's proxy voting guidelines and proxy voting record for the 12-month period ended June 30, visit http://www.fidelity.com/proxyvotingresults or visit the Securities and Exchange Commission's (SEC) web site at http://www.sec.gov.
You may also call 1-800-544-8544 to request a free copy of the proxy voting guidelines.
Standard & Poor's, S&P and S&P 500 are registered service marks of The McGraw-Hill Companies, Inc. and have been licensed for use by Fidelity Distributors Corporation.
Other third-party marks appearing herein are the property of their respective owners.
All other marks appearing herein are registered or unregistered trademarks or service marks of FMR LLC or an affiliated company. © 2022 FMR LLC. All rights reserved.
This report and the financial statements contained herein are submitted for the general information of the shareholders of the Fund. This report is not authorized for distribution to prospective investors in the Fund unless preceded or accompanied by an effective prospectus.
A fund files its complete schedule of portfolio holdings with the SEC for the first and third quarters of each fiscal year on Form N-PORT. Forms N-PORT are available on the SEC’s web site at http://www.sec.gov. A fund's Forms N-PORT may be reviewed and copied at the SEC’s Public Reference Room in Washington, DC. Information regarding the operation of the SEC's Public Reference Room may be obtained by calling 1-800-SEC-0330.
For a complete list of a fund's portfolio holdings, view the most recent holdings listing, semiannual report, or annual report on Fidelity's web site at http://www.fidelity.com, http://www.institutional.fidelity.com, or http://www.401k.com, as applicable.
NOT FDIC INSURED •MAY LOSE VALUE •NO BANK GUARANTEE
Neither the Fund nor Fidelity Distributors Corporation is a bank.
Note to Shareholders:
Early in 2020, the outbreak and spread of COVID-19 emerged as a public health emergency that had a major influence on financial markets, primarily based on its impact on the global economy and corporate earnings. On March 11, 2020, the World Health Organization declared the COVID-19 outbreak a pandemic, citing sustained risk of further global spread. The pandemic prompted a number of measures to limit the spread of COVID-19, including travel and border restrictions, quarantines, and restrictions on large gatherings. In turn, these resulted in lower consumer activity, diminished demand for a wide range of products and services, disruption in manufacturing and supply chains, and – given the wide variability in outcomes regarding the outbreak – significant market uncertainty and volatility. To help stem the turmoil, the U.S. government took unprecedented action – in concert with the U.S. Federal Reserve and central banks around the world – to help support consumers, businesses, and the broader economy, and to limit disruption to the financial system.
In general, the overall impact of the pandemic lessened in 2021, amid a resilient economy and widespread distribution of three COVID-19 vaccines granted emergency use authorization from the U.S. Food and Drug Administration (FDA) early in the year. Still, the situation remains dynamic, and the extent and duration of its influence on financial markets and the economy is highly uncertain, due in part to a recent spike in cases based on highly contagious variants of the coronavirus.
Extreme events such as the COVID-19 crisis are exogenous shocks that can have significant adverse effects on mutual funds and their investments. Although multiple asset classes may be affected by market disruption, the duration and impact may not be the same for all types of assets. Fidelity is committed to helping you stay informed amid news about COVID-19 and during increased market volatility, and we continue to take extra steps to be responsive to customer needs. We encourage you to visit us online, where we offer ongoing updates, commentary, and analysis on the markets and our funds.
Performance: The Bottom Line
Average annual total return reflects the change in the value of an investment, assuming reinvestment of distributions from dividend income and capital gains (the profits earned upon the sale of securities that have grown in value, if any) and assuming a constant rate of performance each year. The hypothetical investment and the average annual total returns do not reflect the deduction of taxes that a shareholder would pay on fund distributions or the redemption of fund shares. During periods of reimbursement by Fidelity, a fund’s total return will be greater than it would be had the reimbursement not occurred. How a fund did yesterday is no guarantee of how it will do tomorrow.
Average Annual Total Returns
| For the periods ended July 31, 2022 | Past 1 year | Past 5 years | Past 10 years |
| Fidelity® Series Small Cap Opportunities Fund | (7.62)% | 9.74% | 10.74% |
$10,000 Over 10 Years
Let's say hypothetically that $10,000 was invested in Fidelity® Series Small Cap Opportunities Fund on July 31, 2012.
The chart shows how the value of your investment would have changed, and also shows how the Russell 2000® Index performed over the same period.
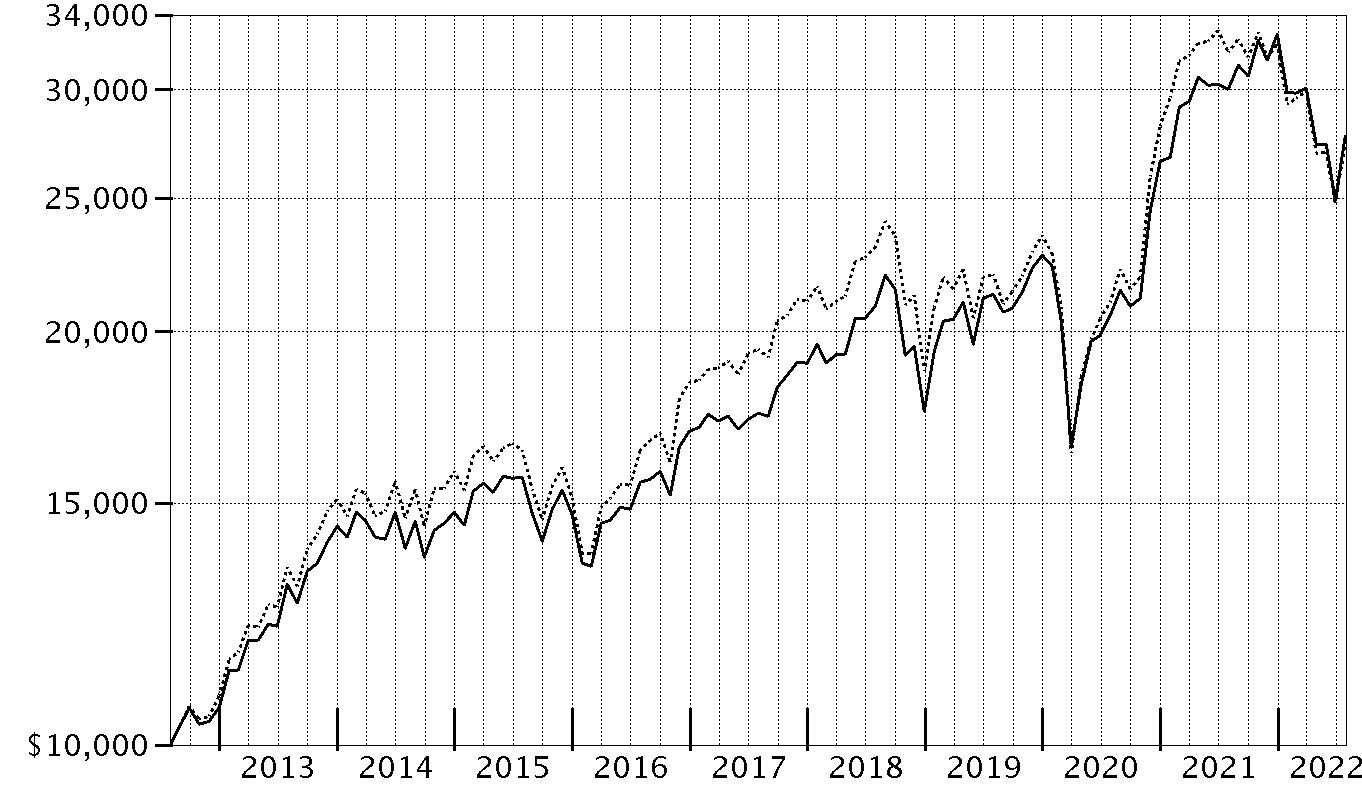
| Period Ending Values |
| $27,730 | Fidelity® Series Small Cap Opportunities Fund |
| $27,379 | Russell 2000® Index |
Management's Discussion of Fund Performance
Market Recap: The S&P 500
® index returned -4.64% for the 12 months ending July 31, 2022, as a multitude of crosscurrents challenged the global economy and financial markets. Persistently high inflation, exacerbated by energy price shocks from the Russia–Ukraine conflict, spurred the U.S. Federal Reserve to hike interest rates more aggressively than anticipated, and concerns about the outlook for economic growth sent stocks into bear market territory. In early May, the Fed approved a rare half-percentage-point interest rate increase and announced plans to shrink its $9 trillion asset portfolio. June began with the Fed allowing up to billions in Treasuries and mortgage bonds to mature every month without investing the proceeds. Two weeks later, the central bank raised rates by 0.75 percentage points, its largest increase since 1994, and said it was becoming more difficult to achieve a soft landing, in which the economy slows enough to bring down inflation while avoiding a recession. Against this volatile backdrop, the S&P 500 posted its worst first-half result (-19.96%) to begin a year since 1970. Stocks sharply reversed course in July (+9.22%), as the Fed again raised its benchmark interest rate by 0.75% but signaled that, at some point, it will likely slow the pace of tightening to assess the impact on the economy. For the full 12 months, growth-oriented communication services (-29%) and consumer discretionary (-10%) stocks lagged most. In contrast, energy (+67%) rode a surge in commodity prices and led by a wide margin, followed by the defensive utilities (+16%) and consumer staples (+7%) sectors.
Comments from Co-Lead Managers Morgen Peck and Shadman Riaz: For the fiscal year ending July 31, 2022, the fund returned -7.62%, outperforming the -14.29% result of the benchmark Russell 2000
® Index. Versus the benchmark, security selection was the primary contributor, especially in information technology, industrials and health care. Strong picks in the consumer discretionary sector, especially within the retailing industry, also helped. The biggest individual relative contributor was an overweight position in Antero Resources (+187%), which was among our biggest holdings. Also helping performance was our overweighting in EXL Service, which gained approximately 48%. EXL Service was also among the fund's largest holdings. Another notable relative contributor was an outsized stake in Northern Oil and Gas (+70%). Conversely, the primary detractor from performance versus the benchmark was our security selection in the financials sector, especially within the banks industry. Stock picks and an underweighting in consumer staples and an underweighting in utilities also hindered the fund's relative performance. The biggest individual relative detractor was an overweight position in TG Therapeutics (-81%), which was a stake that was not held at the end of this period. A second notable relative detractor was our overweighting in Protagonist Therapeutics (-85%), a position that was sold the past 12 months. Another notable relative detractor was an overweighting in Crocs (-47%). Notable changes in positioning include increased exposure to the energy sector and a lower allocation to health care.
The views expressed above reflect those of the portfolio manager(s) only through the end of the period as stated on the cover of this report and do not necessarily represent the views of Fidelity or any other person in the Fidelity organization. Any such views are subject to change at any time based upon market or other conditions and Fidelity disclaims any responsibility to update such views. These views may not be relied on as investment advice and, because investment decisions for a Fidelity fund are based on numerous factors, may not be relied on as an indication of trading intent on behalf of any Fidelity fund.
Investment Summary (Unaudited)
Top Ten Stocks as of July 31, 2022
| | % of fund's net assets |
| Antero Resources Corp. | 1.9 |
| ExlService Holdings, Inc. | 1.6 |
| Commercial Metals Co. | 1.4 |
| Denbury, Inc. | 1.3 |
| Murphy U.S.A., Inc. | 1.3 |
| Terreno Realty Corp. | 1.3 |
| Academy Sports & Outdoors, Inc. | 1.2 |
| Atkore, Inc. | 1.2 |
| HF Sinclair Corp. | 1.2 |
| Brookfield Infrastructure Corp. A Shares | 1.2 |
| | 13.6 |
Market Sectors as of July 31, 2022
| | % of fund's net assets |
| Industrials | 16.7 |
| Health Care | 15.3 |
| Financials | 14.9 |
| Information Technology | 13.1 |
| Consumer Discretionary | 11.6 |
| Energy | 7.9 |
| Real Estate | 6.2 |
| Materials | 5.7 |
| Consumer Staples | 3.4 |
| Utilities | 2.4 |
| Communication Services | 2.2 |
Asset Allocation (% of fund's net assets)
| As of July 31, 2022 * |
| | Stocks and Equity Futures | 101.4% |
| | Convertible Securities | 0.3% |
| | Short-Term Investments and Net Other Assets (Liabilities) | (1.7)% |

* Foreign investments - 12.5%
Geographic Diversification (% of fund's net assets)
| As of July 31, 2022 |
| | United States of America* | 87.5% |
| | Canada | 3.6% |
| | United Kingdom | 1.7% |
| | Bermuda | 1.6% |
| | Bailiwick of Jersey | 1.1% |
| | British Virgin Islands | 1.0% |
| | Ireland | 0.9% |
| | Cayman Islands | 0.7% |
| | Puerto Rico | 0.6% |
| | Other | 1.3% |

* Includes Short-Term investments and Net Other Assets (Liabilities).
Percentages are based on country or territory of incorporation and are adjusted for the effect of futures contracts, if applicable.
Schedule of Investments July 31, 2022
Showing Percentage of Net Assets
| Common Stocks - 99.1% | | | |
| | | Shares | Value |
| COMMUNICATION SERVICES - 2.2% | | | |
| Diversified Telecommunication Services - 0.2% | | | |
| Frontier Communications Parent, Inc. (a) | | 336,600 | $8,721,306 |
| Interactive Media & Services - 0.4% | | | |
| Ziff Davis, Inc. (a) | | 232,700 | 19,055,803 |
| Media - 1.6% | | | |
| Nexstar Broadcasting Group, Inc. Class A | | 217,600 | 40,989,312 |
| TechTarget, Inc. (a) | | 403,129 | 26,279,980 |
| Thryv Holdings, Inc. (a)(b) | | 697,500 | 16,977,150 |
| | | | 84,246,442 |
|
| TOTAL COMMUNICATION SERVICES | | | 112,023,551 |
|
| CONSUMER DISCRETIONARY - 11.6% | | | |
| Auto Components - 2.1% | | | |
| Adient PLC (a) | | 880,500 | 29,743,290 |
| Fox Factory Holding Corp. (a) | | 282,279 | 26,720,530 |
| Gentherm, Inc. (a) | | 187,900 | 12,130,824 |
| LCI Industries (b) | | 157,800 | 21,317,202 |
| Patrick Industries, Inc. | | 306,000 | 18,580,320 |
| | | | 108,492,166 |
| Diversified Consumer Services - 0.2% | | | |
| Laureate Education, Inc. Class A | | 690,420 | 8,174,573 |
| Hotels, Restaurants & Leisure - 2.2% | | | |
| Brinker International, Inc. (a) | | 711,825 | 19,753,144 |
| Churchill Downs, Inc. | | 206,500 | 43,323,700 |
| Everi Holdings, Inc. (a) | | 745,300 | 14,317,213 |
| Hilton Grand Vacations, Inc. (a) | | 449,600 | 18,330,192 |
| Jack in the Box, Inc. (b) | | 130,200 | 9,002,028 |
| Lindblad Expeditions Holdings (a) | | 377,950 | 2,985,805 |
| Ruth's Hospitality Group, Inc. | | 66,559 | 1,168,110 |
| | | | 108,880,192 |
| Household Durables - 1.4% | | | |
| M.D.C. Holdings, Inc. | | 410,550 | 14,882,438 |
| Skyline Champion Corp. (a) | | 615,998 | 38,992,673 |
| Tempur Sealy International, Inc. | | 532,700 | 14,638,596 |
| | | | 68,513,707 |
| Internet & Direct Marketing Retail - 0.2% | | | |
| Vivid Seats, Inc. Class A (b) | | 1,495,616 | 12,503,350 |
| Leisure Products - 0.6% | | | |
| Acushnet Holdings Corp. (b) | | 331,500 | 16,153,995 |
| Clarus Corp. (b) | | 728,914 | 15,030,207 |
| | | | 31,184,202 |
| Specialty Retail - 3.1% | | | |
| Academy Sports & Outdoors, Inc. (b) | | 1,485,372 | 63,915,557 |
| Dick's Sporting Goods, Inc. (b) | | 199,250 | 18,647,808 |
| Murphy U.S.A., Inc. | | 227,691 | 64,746,213 |
| Rent-A-Center, Inc. | | 416,952 | 9,810,881 |
| | | | 157,120,459 |
| Textiles, Apparel & Luxury Goods - 1.8% | | | |
| Capri Holdings Ltd. (a) | | 371,300 | 18,074,884 |
| Crocs, Inc. (a) | | 493,600 | 35,361,504 |
| Deckers Outdoor Corp. (a) | | 44,100 | 13,812,561 |
| Kontoor Brands, Inc. | | 689,500 | 25,166,750 |
| | | | 92,415,699 |
|
| TOTAL CONSUMER DISCRETIONARY | | | 587,284,348 |
|
| CONSUMER STAPLES - 3.4% | | | |
| Beverages - 0.4% | | | |
| Primo Water Corp. | | 1,614,900 | 21,348,978 |
| Food & Staples Retailing - 1.4% | | | |
| BJ's Wholesale Club Holdings, Inc. (a) | | 652,517 | 44,175,401 |
| Performance Food Group Co. (a) | | 559,000 | 27,787,890 |
| | | | 71,963,291 |
| Food Products - 1.3% | | | |
| Darling Ingredients, Inc. (a) | | 214,250 | 14,843,240 |
| Nomad Foods Ltd. (a) | | 2,095,123 | 38,634,068 |
| The Simply Good Foods Co. (a) | | 439,900 | 14,349,538 |
| | | | 67,826,846 |
| Personal Products - 0.3% | | | |
| BellRing Brands, Inc. (a) | | 538,733 | 13,005,015 |
|
| TOTAL CONSUMER STAPLES | | | 174,144,130 |
|
| ENERGY - 7.9% | | | |
| Energy Equipment & Services - 1.3% | | | |
| Liberty Oilfield Services, Inc. Class A (a) | | 3,208,954 | 45,567,147 |
| TechnipFMC PLC (a) | | 2,339,600 | 18,927,364 |
| | | | 64,494,511 |
| Oil, Gas & Consumable Fuels - 6.6% | | | |
| Antero Resources Corp. (a) | | 2,368,926 | 93,904,223 |
| Denbury, Inc. (a)(b) | | 910,200 | 65,452,482 |
| Enviva, Inc. | | 341,660 | 23,789,786 |
| HF Sinclair Corp. | | 1,289,990 | 61,687,322 |
| Magnolia Oil & Gas Corp. Class A | | 1,285,700 | 31,023,941 |
| Northern Oil & Gas, Inc. | | 1,931,645 | 55,689,325 |
| | | | 331,547,079 |
|
| TOTAL ENERGY | | | 396,041,590 |
|
| FINANCIALS - 14.9% | | | |
| Banks - 8.5% | | | |
| Ameris Bancorp | | 50 | 2,365 |
| East West Bancorp, Inc. | | 301,300 | 21,627,314 |
| First Bancorp, Puerto Rico (b) | | 2,025,038 | 30,557,823 |
| Glacier Bancorp, Inc. (b) | | 486,350 | 24,361,272 |
| Independent Bank Group, Inc. | | 348,800 | 24,667,136 |
| Metropolitan Bank Holding Corp. (a) | | 209,000 | 14,500,420 |
| PacWest Bancorp | | 1,352,200 | 37,902,166 |
| Pathward Financial, Inc. | | 815,802 | 27,508,843 |
| Pinnacle Financial Partners, Inc. | | 253,000 | 20,012,300 |
| Preferred Bank, Los Angeles | | 326,450 | 23,732,915 |
| ServisFirst Bancshares, Inc. | | 270,342 | 23,100,724 |
| Synovus Financial Corp. (b) | | 1,204,695 | 48,645,584 |
| Trico Bancshares | | 775,208 | 37,054,942 |
| United Community Bank, Inc. | | 1,488,700 | 50,660,461 |
| Webster Financial Corp. | | 505,971 | 23,502,353 |
| Western Alliance Bancorp. | | 259,850 | 19,847,343 |
| | | | 427,683,961 |
| Capital Markets - 2.5% | | | |
| Focus Financial Partners, Inc. Class A (a) | | 516,452 | 20,880,154 |
| Houlihan Lokey | | 191,750 | 16,214,380 |
| Lazard Ltd. Class A | | 932,840 | 35,140,083 |
| LPL Financial | | 88,550 | 18,588,416 |
| TMX Group Ltd. | | 351,764 | 36,092,516 |
| | | | 126,915,549 |
| Consumer Finance - 0.5% | | | |
| FirstCash Holdings, Inc. | | 322,524 | 23,628,108 |
| Insurance - 1.6% | | | |
| Assurant, Inc. | | 128,880 | 22,654,526 |
| Primerica, Inc. | | 277,700 | 35,737,213 |
| Selective Insurance Group, Inc. | | 267,657 | 20,839,774 |
| | | | 79,231,513 |
| Thrifts & Mortgage Finance - 1.8% | | | |
| Essent Group Ltd. | | 1,122,800 | 46,888,128 |
| Walker & Dunlop, Inc. | | 395,216 | 44,517,130 |
| | | | 91,405,258 |
|
| TOTAL FINANCIALS | | | 748,864,389 |
|
| HEALTH CARE - 15.0% | | | |
| Biotechnology - 6.7% | | | |
| ADC Therapeutics SA (a) | | 341,410 | 2,529,848 |
| ALX Oncology Holdings, Inc. (a) | | 337,600 | 3,267,968 |
| Arcutis Biotherapeutics, Inc. (a) | | 483,300 | 11,724,858 |
| Argenx SE ADR (a) | | 62,100 | 22,617,441 |
| Ascendis Pharma A/S sponsored ADR (a) | | 105,248 | 9,001,861 |
| Blueprint Medicines Corp. (a) | | 427,000 | 21,802,620 |
| Celldex Therapeutics, Inc. (a) | | 337,200 | 10,358,784 |
| Cerevel Therapeutics Holdings (a) | | 563,300 | 14,809,157 |
| ChemoCentryx, Inc. (a) | | 260,300 | 6,148,286 |
| Cyteir Therapeutics, Inc. (a) | | 68,809 | 200,234 |
| Cytokinetics, Inc. (a) | | 634,300 | 26,849,919 |
| Day One Biopharmaceuticals, Inc. (a)(b) | | 564,500 | 9,669,885 |
| Erasca, Inc. | | 1,165,000 | 8,784,100 |
| Exelixis, Inc. (a) | | 789,600 | 16,518,432 |
| Global Blood Therapeutics, Inc. (a) | | 476,456 | 15,589,640 |
| Imago BioSciences, Inc. | | 603,023 | 9,708,670 |
| Instil Bio, Inc. (a)(b) | | 1,159,864 | 6,541,633 |
| Janux Therapeutics, Inc. (a) | | 659,500 | 8,190,990 |
| Keros Therapeutics, Inc. (a) | | 363,914 | 11,674,361 |
| Mirati Therapeutics, Inc. (a)(b) | | 156,900 | 10,104,360 |
| Morphic Holding, Inc. (a) | | 308,662 | 8,170,283 |
| PTC Therapeutics, Inc. (a) | | 355,300 | 15,473,315 |
| Relay Therapeutics, Inc. (a) | | 480,300 | 9,135,306 |
| Scholar Rock Holding Corp. warrants 12/31/25 (a)(c) | | 18,825 | 47,184 |
| Tango Therapeutics, Inc. (a) | | 1,398,900 | 5,721,501 |
| Tenaya Therapeutics, Inc. (a) | | 350,680 | 1,672,744 |
| Tyra Biosciences, Inc. (b) | | 1,030,200 | 10,971,630 |
| Vaxcyte, Inc. (a) | | 581,872 | 13,429,606 |
| Vera Therapeutics, Inc. (a) | | 551,700 | 9,516,825 |
| Verve Therapeutics, Inc. (a)(b) | | 415,300 | 10,224,686 |
| Xenon Pharmaceuticals, Inc. (a) | | 480,030 | 15,912,995 |
| Zentalis Pharmaceuticals, Inc. (a) | | 442,982 | 12,935,074 |
| | | | 339,304,196 |
| Health Care Equipment & Supplies - 1.9% | | | |
| Envista Holdings Corp. (a) | | 673,400 | 27,373,710 |
| Figs, Inc. Class A (a) | | 2,628,600 | 27,784,302 |
| Globus Medical, Inc. (a) | | 123,400 | 7,242,346 |
| Integer Holdings Corp. (a) | | 300,372 | 20,992,999 |
| Omnicell, Inc. (a) | | 105,400 | 11,606,648 |
| | | | 95,000,005 |
| Health Care Providers & Services - 3.8% | | | |
| Acadia Healthcare Co., Inc. (a) | | 433,400 | 35,933,194 |
| agilon health, Inc. (a) | | 849,500 | 21,262,985 |
| Molina Healthcare, Inc. (a) | | 112,800 | 36,966,816 |
| Owens & Minor, Inc. | | 907,440 | 32,132,450 |
| R1 Rcm, Inc. (a) | | 940,800 | 23,520,000 |
| Surgery Partners, Inc. (a) | | 496,700 | 19,560,046 |
| Tenet Healthcare Corp. (a) | | 205,900 | 13,614,108 |
| The Oncology Institute, Inc. (a)(c) | | 1,126,158 | 7,274,981 |
| | | | 190,264,580 |
| Health Care Technology - 1.1% | | | |
| Evolent Health, Inc. (a) | | 869,160 | 29,542,748 |
| Inspire Medical Systems, Inc. (a) | | 124,343 | 25,986,444 |
| | | | 55,529,192 |
| Life Sciences Tools & Services - 0.6% | | | |
| Olink Holding AB ADR (a) | | 590,195 | 7,938,123 |
| Syneos Health, Inc. (a) | | 268,300 | 21,233,262 |
| | | | 29,171,385 |
| Pharmaceuticals - 0.9% | | | |
| Arvinas Holding Co. LLC (a) | | 331,800 | 17,621,898 |
| DICE Therapeutics, Inc. (b) | | 408,600 | 7,044,264 |
| Edgewise Therapeutics, Inc. (a) | | 684,800 | 6,622,016 |
| Fulcrum Therapeutics, Inc. (a) | | 737,000 | 4,333,560 |
| Ikena Oncology, Inc. (a) | | 665,049 | 3,365,148 |
| Theseus Pharmaceuticals, Inc. | | 566,600 | 4,085,186 |
| Ventyx Biosciences, Inc. (b) | | 354,100 | 5,350,451 |
| | | | 48,422,523 |
|
| TOTAL HEALTH CARE | | | 757,691,881 |
|
| INDUSTRIALS - 16.7% | | | |
| Building Products - 1.8% | | | |
| Builders FirstSource, Inc. (a) | | 481,249 | 32,724,932 |
| Masonite International Corp. (a) | | 273,334 | 24,881,594 |
| Simpson Manufacturing Co. Ltd. | | 323,999 | 33,462,617 |
| | | | 91,069,143 |
| Commercial Services & Supplies - 0.7% | | | |
| Casella Waste Systems, Inc. Class A (a) | | 279,832 | 22,652,400 |
| The Brink's Co. | | 215,500 | 12,270,570 |
| | | | 34,922,970 |
| Construction & Engineering - 3.5% | | | |
| Comfort Systems U.S.A., Inc. | | 279,322 | 29,513,163 |
| Construction Partners, Inc. Class A (a) | | 700,783 | 16,664,620 |
| Dycom Industries, Inc. (a) | | 246,210 | 25,399,024 |
| EMCOR Group, Inc. | | 324,360 | 37,745,773 |
| Granite Construction, Inc. | | 553,600 | 16,552,640 |
| IES Holdings, Inc. (a) | | 641,718 | 21,176,694 |
| NV5 Global, Inc. (a) | | 202,282 | 27,429,439 |
| | | | 174,481,353 |
| Electrical Equipment - 1.5% | | | |
| Atkore, Inc. (a) | | 633,961 | 62,933,308 |
| Regal Rexnord Corp. | | 72,400 | 9,723,320 |
| Thermon Group Holdings, Inc. (a) | | 303,446 | 4,724,654 |
| | | | 77,381,282 |
| Machinery - 2.9% | | | |
| Federal Signal Corp. | | 937,628 | 38,930,315 |
| ITT, Inc. | | 213,800 | 16,041,414 |
| Kadant, Inc. (b) | | 111,356 | 22,699,921 |
| Oshkosh Corp. | | 194,400 | 16,737,840 |
| SPX Corp. (a) | | 820,286 | 48,503,511 |
| | | | 142,913,001 |
| Professional Services - 3.5% | | | |
| Alight, Inc. Class A (a)(b) | | 2,383,407 | 17,970,889 |
| ASGN, Inc. (a) | | 505,792 | 52,480,978 |
| CACI International, Inc. Class A (a) | | 75,700 | 22,883,353 |
| CRA International, Inc. | | 167,174 | 16,551,898 |
| KBR, Inc. | | 512,400 | 27,275,052 |
| TriNet Group, Inc. (a) | | 491,316 | 40,533,570 |
| | | | 177,695,740 |
| Trading Companies & Distributors - 2.8% | | | |
| Beacon Roofing Supply, Inc. (a) | | 581,857 | 34,923,057 |
| Finning International, Inc. | | 582,350 | 12,733,435 |
| GMS, Inc. (a) | | 402,700 | 21,371,289 |
| Rush Enterprises, Inc. Class A | | 992,414 | 47,824,431 |
| Univar Solutions, Inc. (a) | | 948,954 | 25,659,716 |
| | | | 142,511,928 |
|
| TOTAL INDUSTRIALS | | | 840,975,417 |
|
| INFORMATION TECHNOLOGY - 13.1% | | | |
| Communications Equipment - 0.3% | | | |
| Extreme Networks, Inc. (a) | | 1,244,400 | 16,276,752 |
| Electronic Equipment & Components - 3.2% | | | |
| Advanced Energy Industries, Inc. | | 539,899 | 48,315,562 |
| Fabrinet (a) | | 350,956 | 33,712,833 |
| FARO Technologies, Inc. (a) | | 66,424 | 2,160,108 |
| Insight Enterprises, Inc. (a) | | 378,800 | 35,383,708 |
| Napco Security Technologies, Inc. | | 642,632 | 16,489,937 |
| TD SYNNEX Corp. | | 219,700 | 22,062,274 |
| | | | 158,124,422 |
| IT Services - 4.6% | | | |
| Cyxtera Technologies, Inc. Class A (a) | | 1,020,594 | 12,441,041 |
| Endava PLC ADR (a) | | 237,003 | 24,174,306 |
| ExlService Holdings, Inc. (a) | | 474,376 | 79,870,687 |
| Perficient, Inc. (a) | | 543,252 | 57,323,951 |
| WNS Holdings Ltd. sponsored ADR (a) | | 632,790 | 54,869,221 |
| | | | 228,679,206 |
| Semiconductors & Semiconductor Equipment - 2.4% | | | |
| FormFactor, Inc. (a) | | 425,700 | 15,137,892 |
| MACOM Technology Solutions Holdings, Inc. (a) | | 238,500 | 13,818,690 |
| Onto Innovation, Inc. (a) | | 311,592 | 25,940,034 |
| Semtech Corp. (a) | | 241,600 | 15,058,928 |
| SiTime Corp. (a) | | 169,375 | 31,500,363 |
| Synaptics, Inc. (a) | | 147,500 | 21,380,125 |
| | | | 122,836,032 |
| Software - 2.4% | | | |
| Five9, Inc. (a) | | 104,000 | 11,244,480 |
| Intapp, Inc. | | 523,953 | 7,948,367 |
| Manhattan Associates, Inc. (a) | | 83,400 | 11,731,878 |
| NCR Corp. (a) | | 352,000 | 11,422,400 |
| Rapid7, Inc. (a) | | 471,910 | 30,188,083 |
| SPS Commerce, Inc. (a) | | 135,858 | 16,270,354 |
| Tenable Holdings, Inc. (a) | | 843,600 | 32,605,140 |
| | | | 121,410,702 |
| Technology Hardware, Storage & Peripherals - 0.2% | | | |
| Avid Technology, Inc. (a) | | 394,048 | 11,056,987 |
|
| TOTAL INFORMATION TECHNOLOGY | | | 658,384,101 |
|
| MATERIALS - 5.7% | | | |
| Chemicals - 2.0% | | | |
| Element Solutions, Inc. | | 1,222,817 | 24,162,864 |
| Huntsman Corp. (b) | | 1,159,756 | 33,586,534 |
| Trinseo PLC | | 445,400 | 15,931,958 |
| Tronox Holdings PLC | | 1,676,247 | 26,166,216 |
| | | | 99,847,572 |
| Construction Materials - 0.7% | | | |
| Eagle Materials, Inc. | | 302,100 | 38,200,545 |
| Containers & Packaging - 0.3% | | | |
| O-I Glass, Inc. (a) | | 1,039,000 | 15,283,690 |
| Metals & Mining - 2.3% | | | |
| Arconic Corp. (a) | | 541,900 | 16,370,799 |
| Commercial Metals Co. | | 1,698,230 | 67,283,873 |
| Constellium NV (a) | | 1,311,700 | 19,190,171 |
| Yamana Gold, Inc. | | 2,297,900 | 10,983,962 |
| | | | 113,828,805 |
| Paper & Forest Products - 0.4% | | | |
| Louisiana-Pacific Corp. | | 318,400 | 20,259,792 |
|
| TOTAL MATERIALS | | | 287,420,404 |
|
| REAL ESTATE - 6.2% | | | |
| Equity Real Estate Investment Trusts (REITs) - 5.3% | | | |
| EastGroup Properties, Inc. | | 190,600 | 32,504,924 |
| Equity Commonwealth (a) | | 994,000 | 27,881,700 |
| Essential Properties Realty Trust, Inc. | | 968,100 | 23,350,572 |
| Lamar Advertising Co. Class A | | 192,200 | 19,423,732 |
| LXP Industrial Trust (REIT) | | 3,606,899 | 39,567,682 |
| Sunstone Hotel Investors, Inc. | | 2,166,900 | 24,550,977 |
| Terreno Realty Corp. | | 1,026,300 | 64,297,695 |
| Washington REIT (SBI) | | 1,595,500 | 35,372,235 |
| | | | 266,949,517 |
| Real Estate Management & Development - 0.9% | | | |
| Cushman & Wakefield PLC (a) | | 1,028,200 | 17,273,760 |
| Jones Lang LaSalle, Inc. (a) | | 147,300 | 28,085,691 |
| | | | 45,359,451 |
|
| TOTAL REAL ESTATE | | | 312,308,968 |
|
| UTILITIES - 2.4% | | | |
| Electric Utilities - 0.4% | | | |
| IDACORP, Inc. | | 173,500 | 19,383,420 |
| Gas Utilities - 1.6% | | | |
| Brookfield Infrastructure Corp. A Shares | | 1,277,700 | 58,531,437 |
| ONE Gas, Inc. | | 253,000 | 21,489,820 |
| | | | 80,021,257 |
| Independent Power and Renewable Electricity Producers - 0.4% | | | |
| Clearway Energy, Inc. Class C | | 547,475 | 20,552,212 |
|
| TOTAL UTILITIES | | | 119,956,889 |
|
| TOTAL COMMON STOCKS | | | |
| (Cost $4,265,022,860) | | | 4,995,095,668 |
|
| Convertible Preferred Stocks - 0.3% | | | |
| HEALTH CARE - 0.3% | | | |
| Biotechnology - 0.1% | | | |
| Dianthus Therapeutics, Inc. Series A (c)(d) | | 1,102,127 | 4,114,130 |
| ValenzaBio, Inc. Series A (a)(c)(d) | | 383,419 | 1,886,421 |
| | | | 6,000,551 |
| Pharmaceuticals - 0.2% | | | |
| Aristea Therapeutics, Inc. Series B (a)(c)(d) | | 733,075 | 6,898,236 |
| TOTAL CONVERTIBLE PREFERRED STOCKS | | | |
| (Cost $12,244,945) | | | 12,898,787 |
| | | Principal Amount | Value |
|
| U.S. Treasury Obligations - 0.0% | | | |
| U.S. Treasury Bills, yield at date of purchase 0.85% to 1.37% 8/4/22 to 9/8/22 (e) | | |
| (Cost $1,519,369) | | $1,520,000 | 1,518,822 |
| | | Shares | Value |
|
| Money Market Funds - 2.8% | | | |
| Fidelity Cash Central Fund 2.01% (f) | | 56,152,448 | $56,163,679 |
| Fidelity Securities Lending Cash Central Fund 2.01% (f)(g) | | 83,299,882 | 83,308,212 |
| TOTAL MONEY MARKET FUNDS | | | |
| (Cost $139,471,890) | | | 139,471,891 |
| TOTAL INVESTMENT IN SECURITIES - 102.2% | | | |
| (Cost $4,418,259,064) | | | 5,148,985,168 |
| NET OTHER ASSETS (LIABILITIES) - (2.2)% | | | (109,027,771) |
| NET ASSETS - 100% | | | $5,039,957,397 |
| Futures Contracts | | | | | |
| | Number of contracts | Expiration Date | Notional Amount | Value | Unrealized Appreciation/(Depreciation) |
| Purchased | | | | | |
| Equity Index Contracts | | | | | |
| CME E-mini Russell 2000 Index Contracts (United States) | 1,222 | Sept. 2022 | $115,191,830 | $1,164,569 | $1,164,569 |
The notional amount of futures purchased as a percentage of Net Assets is 2.3%
Legend
(a) Non-income producing
(b) Security or a portion of the security is on loan at period end.
(c) Restricted securities (including private placements) - Investment in securities not registered under the Securities Act of 1933 (excluding 144A issues). At the end of the period, the value of restricted securities (excluding 144A issues) amounted to $20,220,952 or 0.4% of net assets.
(d) Level 3 security
(e) Security or a portion of the security was pledged to cover margin requirements for futures contracts. At period end, the value of securities pledged amounted to $773,940.
(f) Affiliated fund that is generally available only to investment companies and other accounts managed by Fidelity Investments. The rate quoted is the annualized seven-day yield of the fund at period end. A complete unaudited listing of the fund's holdings as of its most recent quarter end is available upon request. In addition, each Fidelity Central Fund's financial statements, which are not covered by the Fund's Report of Independent Registered Public Accounting Firm, are available on the SEC's website or upon request.
(g) Investment made with cash collateral received from securities on loan.
Additional information on each restricted holding is as follows:
| Security | Acquisition Date | Acquisition Cost |
| Aristea Therapeutics, Inc. Series B | 10/6/20 - 7/27/21 | $4,041,955 |
| Dianthus Therapeutics, Inc. Series A | 4/6/22 | $4,790,395 |
| Scholar Rock Holding Corp. warrants 12/31/25 | 6/17/22 | $0 |
| The Oncology Institute, Inc. | 6/28/21 | $11,261,580 |
| ValenzaBio, Inc. Series A | 3/25/21 | $3,412,594 |
Affiliated Central Funds
Fiscal year to date information regarding the Fund's investments in Fidelity Central Funds, including the ownership percentage, is presented below.
| Fund | Value, beginning of period | Purchases | Sales Proceeds | Dividend Income | Realized Gain/Loss | Change in Unrealized appreciation (depreciation) | Value, end of period | % ownership, end of period |
| Fidelity Cash Central Fund 2.01% | $102,671,891 | $1,868,028,313 | $1,914,536,525 | $271,735 | $352 | $(352) | $56,163,679 | 0.1% |
| Fidelity Securities Lending Cash Central Fund 2.01% | 72,073,537 | 1,422,853,421 | 1,411,618,746 | 497,613 | -- | -- | 83,308,212 | 0.2% |
| Total | $174,745,428 | $3,290,881,734 | $3,326,155,271 | $769,348 | $352 | $(352) | $139,471,891 | |
Amounts in the income column in the above table include any capital gain distributions from underlying funds, which are presented in the corresponding line-item in the Statement of Operations, if applicable. Amount for Fidelity Securities Lending Cash Central Fund represents the income earned on investing cash collateral, less rebates paid to borrowers and any lending agent fees associated with the loan, plus any premium payments received for lending certain types of securities.
Investment Valuation
The following is a summary of the inputs used, as of July 31, 2022, involving the Fund's assets and liabilities carried at fair value. The inputs or methodology used for valuing securities may not be an indication of the risk associated with investing in those securities. For more information on valuation inputs, and their aggregation into the levels used below, please refer to the Investment Valuation section in the accompanying Notes to Financial Statements.
| | Valuation Inputs at Reporting Date: |
| Description | Total | Level 1 | Level 2 | Level 3 |
| Investments in Securities: | | | | |
| Equities: | | | | |
| Communication Services | $112,023,551 | $112,023,551 | $-- | $-- |
| Consumer Discretionary | 587,284,348 | 587,284,348 | -- | -- |
| Consumer Staples | 174,144,130 | 174,144,130 | -- | -- |
| Energy | 396,041,590 | 396,041,590 | -- | -- |
| Financials | 748,864,389 | 748,864,389 | -- | -- |
| Health Care | 770,590,668 | 757,644,697 | 47,184 | 12,898,787 |
| Industrials | 840,975,417 | 840,975,417 | -- | -- |
| Information Technology | 658,384,101 | 658,384,101 | -- | -- |
| Materials | 287,420,404 | 287,420,404 | -- | -- |
| Real Estate | 312,308,968 | 312,308,968 | -- | -- |
| Utilities | 119,956,889 | 119,956,889 | -- | -- |
| U.S. Government and Government Agency Obligations | 1,518,822 | -- | 1,518,822 | -- |
| Money Market Funds | 139,471,891 | 139,471,891 | -- | -- |
| Total Investments in Securities: | $5,148,985,168 | $5,134,520,375 | $1,566,006 | $12,898,787 |
| Derivative Instruments: | | | | |
| Assets | | | | |
| Futures Contracts | $1,164,569 | $1,164,569 | $-- | $-- |
| Total Assets | $1,164,569 | $1,164,569 | $-- | $-- |
| Total Derivative Instruments: | $1,164,569 | $1,164,569 | $-- | $-- |
Value of Derivative Instruments
The following table is a summary of the Fund's value of derivative instruments by primary risk exposure as of July 31, 2022. For additional information on derivative instruments, please refer to the Derivative Instruments section in the accompanying Notes to Financial Statements.
| Primary Risk Exposure / Derivative Type | Value |
| | Asset | Liability |
| Equity Risk | | |
| Futures Contracts(a) | $1,164,569 | $0 |
| Total Equity Risk | 1,164,569 | 0 |
| Total Value of Derivatives | $1,164,569 | $0 |
(a) Reflects gross cumulative appreciation (depreciation) on futures contracts as presented in the Schedule of Investments. In the Statement of Assets and Liabilities, the period end daily variation margin is included in receivable or payable for daily variation margin on futures contracts, and the net cumulative appreciation (depreciation) is included in Total accumulated earnings (loss).
See accompanying notes which are an integral part of the financial statements.
Financial Statements
Statement of Assets and Liabilities
| | | July 31, 2022 |
| Assets | | |
Investment in securities, at value (including securities loaned of $80,902,779) — See accompanying schedule:
Unaffiliated issuers (cost $4,278,787,174) | $5,009,513,277 | |
| Fidelity Central Funds (cost $139,471,890) | 139,471,891 | |
| Total Investment in Securities (cost $4,418,259,064) | | $5,148,985,168 |
| Receivable for investments sold | | 83,779,620 |
| Receivable for fund shares sold | | 1,492,904 |
| Dividends receivable | | 152,120 |
| Distributions receivable from Fidelity Central Funds | | 116,263 |
| Receivable for daily variation margin on futures contracts | | 126,759 |
| Other receivables | | 52,100 |
| Total assets | | 5,234,704,934 |
| Liabilities | | |
| Payable to custodian bank | $14 | |
| Payable for fund shares redeemed | 111,409,483 | |
| Other payables and accrued expenses | 40,265 | |
| Collateral on securities loaned | 83,297,775 | |
| Total liabilities | | 194,747,537 |
| Net Assets | | $5,039,957,397 |
| Net Assets consist of: | | |
| Paid in capital | | $4,292,062,844 |
| Total accumulated earnings (loss) | | 747,894,553 |
| Net Assets | | $5,039,957,397 |
| Net Asset Value, offering price and redemption price per share ($5,039,957,397 ÷ 401,003,284 shares) | | $12.57 |
See accompanying notes which are an integral part of the financial statements.
Statement of Operations
| | | Year ended July 31, 2022 |
| Investment Income | | |
| Dividends | | $47,847,566 |
| Interest | | 5,011 |
| Income from Fidelity Central Funds (including $497,613 from security lending) | | 769,348 |
| Total income | | 48,621,925 |
| Expenses | | |
| Custodian fees and expenses | $86,241 | |
| Independent trustees' fees and expenses | 18,877 | |
| Interest | 2,394 | |
| Total expenses before reductions | 107,512 | |
| Expense reductions | (247) | |
| Total expenses after reductions | | 107,265 |
| Net investment income (loss) | | 48,514,660 |
| Realized and Unrealized Gain (Loss) | | |
| Net realized gain (loss) on: | | |
| Investment securities: | | |
| Unaffiliated issuers | 127,857,362 | |
| Fidelity Central Funds | 352 | |
| Foreign currency transactions | (34,357) | |
| Futures contracts | (4,068,864) | |
| Total net realized gain (loss) | | 123,754,493 |
| Change in net unrealized appreciation (depreciation) on: | | |
| Investment securities: | | |
| Unaffiliated issuers | (572,775,252) | |
| Fidelity Central Funds | (352) | |
| Unfunded commitments | 1,197,106 | |
| Assets and liabilities in foreign currencies | (29,292) | |
| Futures contracts | 655,058 | |
| Total change in net unrealized appreciation (depreciation) | | (570,952,732) |
| Net gain (loss) | | (447,198,239) |
| Net increase (decrease) in net assets resulting from operations | | $(398,683,579) |
See accompanying notes which are an integral part of the financial statements.
Statement of Changes in Net Assets
| | Year ended July 31, 2022 | Year ended July 31, 2021 |
| Increase (Decrease) in Net Assets | | |
| Operations | | |
| Net investment income (loss) | $48,514,660 | $43,799,726 |
| Net realized gain (loss) | 123,754,493 | 1,514,536,306 |
| Change in net unrealized appreciation (depreciation) | (570,952,732) | 546,729,663 |
| Net increase (decrease) in net assets resulting from operations | (398,683,579) | 2,105,065,695 |
| Distributions to shareholders | (1,511,145,723) | (118,324,848) |
| Share transactions | | |
| Proceeds from sales of shares | 772,983,933 | 636,699,749 |
| Reinvestment of distributions | 1,511,145,723 | 118,324,848 |
| Cost of shares redeemed | (1,346,757,031) | (1,660,543,500) |
| Net increase (decrease) in net assets resulting from share transactions | 937,372,625 | (905,518,903) |
| Total increase (decrease) in net assets | (972,456,677) | 1,081,221,944 |
| Net Assets | | |
| Beginning of period | 6,012,414,074 | 4,931,192,130 |
| End of period | $5,039,957,397 | $6,012,414,074 |
| Other Information | | |
| Shares | | |
| Sold | 57,044,933 | 37,014,662 |
| Issued in reinvestment of distributions | 106,014,574 | 8,102,705 |
| Redeemed | (94,592,767) | (102,071,306) |
| Net increase (decrease) | 68,466,740 | (56,953,939) |
See accompanying notes which are an integral part of the financial statements.
Financial Highlights
Fidelity Series Small Cap Opportunities Fund
| | | | | | |
| Years ended July 31, | 2022 | 2021 | 2020 | 2019 | 2018 |
| Selected Per–Share Data | | | | | |
| Net asset value, beginning of period | $18.08 | $12.66 | $14.04 | $15.46 | $14.42 |
| Income from Investment Operations | | | | | |
| Net investment income (loss)A,B | .12 | .12 | .15 | .15 | .16 |
| Net realized and unrealized gain (loss) | (1.03) | 5.62 | (.60) | .12 | 2.44 |
| Total from investment operations | (.91) | 5.74 | (.45) | .27 | 2.60 |
| Distributions from net investment income | (.12) | (.14) | (.16) | (.14) | (.12) |
| Distributions from net realized gain | (4.48) | (.19) | (.77) | (1.55) | (1.45) |
| Total distributions | (4.60) | (.32)C | (.93) | (1.69) | (1.56)C |
| Net asset value, end of period | $12.57 | $18.08 | $12.66 | $14.04 | $15.46 |
| Total ReturnD | (7.62)% | 45.98% | (3.44)% | 1.98% | 19.84% |
| Ratios to Average Net AssetsB,E,F | | | | | |
| Expenses before reductionsG | -% | -% | -% | -% | -% |
| Expenses net of fee waivers, if anyG | -% | -% | -% | -% | -% |
| Expenses net of all reductionsG | -% | -% | -% | -% | -% |
| Net investment income (loss) | .86% | .77% | 1.17% | 1.13% | 1.10% |
| Supplemental Data | | | | | |
| Net assets, end of period (000 omitted) | $5,039,957 | $6,012,414 | $4,931,192 | $5,667,458 | $5,997,330 |
| Portfolio turnover rateH | 39% | 96% | 61%I | 59% | 68% |
A Calculated based on average shares outstanding during the period.
B Net investment income (loss) is affected by the timing of the declaration of dividends by any underlying mutual funds or exchange-traded funds (ETFs). Net investment income (loss) of any such underlying funds is not included in the Fund's net investment income (loss) ratio.
C Total distributions per share do not sum due to rounding.
D Total returns would have been lower if certain expenses had not been reduced during the applicable periods shown.
E Fees and expenses of any underlying mutual funds or exchange-traded funds (ETFs) are not included in the Fund's expense ratio. The Fund indirectly bears its proportionate share of these expenses. For additional expense information related to investments in Fidelity Central Funds, please refer to the "Investments in Fidelity Central Funds" note found in the Notes to Financial Statements section of the most recent Annual or Semi-Annual report.
F Expense ratios reflect operating expenses of the class. Expenses before reductions do not reflect amounts reimbursed, waived, or reduced through arrangements with the investment adviser, brokerage services, or other offset arrangements, if applicable, and do not represent the amount paid by the class during periods when reimbursements, waivers or reductions occur.
G Amount represents less than .005%.
H Amount does not include the portfolio activity of any underlying mutual funds or exchange-traded funds (ETFs).
I Portfolio turnover rate excludes securities received or delivered in-kind.
See accompanying notes which are an integral part of the financial statements.
Notes to Financial Statements
For the period ended July 31, 2022
1. Organization.
Fidelity Series Small Cap Opportunities Fund (the Fund) is a fund of Fidelity Securities Fund (the Trust) and is authorized to issue an unlimited number of shares. Shares are offered only to certain other Fidelity funds, Fidelity managed 529 plans, and Fidelity managed collective investment trusts. The Trust is registered under the Investment Company Act of 1940, as amended (the 1940 Act), as an open-end management investment company organized as a Massachusetts business trust.
2. Investments in Fidelity Central Funds.
Funds may invest in Fidelity Central Funds, which are open-end investment companies generally available only to other investment companies and accounts managed by the investment adviser and its affiliates. The Schedule of Investments lists any Fidelity Central Funds held as an investment as of period end, but does not include the underlying holdings of each Fidelity Central Fund. An investing fund indirectly bears its proportionate share of the expenses of the underlying Fidelity Central Funds.
Based on its investment objective, each Fidelity Central Fund may invest or participate in various investment vehicles or strategies that are similar to those of the investing fund. These strategies are consistent with the investment objectives of the investing fund and may involve certain economic risks which may cause a decline in value of each of the Fidelity Central Funds and thus a decline in the value of the investing fund.
| Fidelity Central Fund | Investment Manager | Investment Objective | Investment Practices | Expense Ratio(a) |
| Fidelity Money Market Central Funds | Fidelity Management & Research Company LLC (FMR) | Each fund seeks to obtain a high level of current income consistent with the preservation of capital and liquidity. | Short-term Investments | Less than .005% |
(a) Expenses expressed as a percentage of average net assets and are as of each underlying Central Fund's most recent annual or semi-annual shareholder report.
A complete unaudited list of holdings for each Fidelity Central Fund is available upon request or at the Securities and Exchange Commission website at www.sec.gov. In addition, the financial statements of the Fidelity Central Funds which contain the significant accounting policies (including investment valuation policies) of those funds, and are not covered by the Report of Independent Registered Public Accounting Firm, are available on the Securities and Exchange Commission website or upon request.
3. Significant Accounting Policies.
The Fund is an investment company and applies the accounting and reporting guidance of the Financial Accounting Standards Board (FASB) Accounting Standards Codification Topic 946 Financial Services - Investment Companies. The financial statements have been prepared in conformity with accounting principles generally accepted in the United States of America (GAAP), which require management to make certain estimates and assumptions at the date of the financial statements. Actual results could differ from those estimates. Subsequent events, if any, through the date that the financial statements were issued have been evaluated in the preparation of the financial statements. The Fund's Schedule of Investments lists any underlying mutual funds or exchange-traded funds (ETFs) but does not include the underlying holdings of these funds. The following summarizes the significant accounting policies of the Fund:
Investment Valuation. Investments are valued as of 4:00 p.m. Eastern time on the last calendar day of the period. The Board of Trustees (the Board) has delegated the day to day responsibility for the valuation of the Fund's investments to the Fair Value Committee (the Committee) established by the Fund's investment adviser. In accordance with valuation policies and procedures approved by the Board, the Fund attempts to obtain prices from one or more third party pricing vendors or brokers to value its investments. When current market prices, quotations or currency exchange rates are not readily available or reliable, investments will be fair valued in good faith by the Committee, in accordance with procedures adopted by the Board. Factors used in determining fair value vary by investment type and may include market or investment specific events, changes in interest rates and credit quality. The frequency with which these procedures are used cannot be predicted and they may be utilized to a significant extent. The Committee oversees the Fund's valuation policies and procedures and reports to the Board on the Committee's activities and fair value determinations. The Board monitors the appropriateness of the procedures used in valuing the Fund's investments and ratifies the fair value determinations of the Committee.
The Fund categorizes the inputs to valuation techniques used to value its investments into a disclosure hierarchy consisting of three levels as shown below:
- Level 1 – unadjusted quoted prices in active markets for identical investments
- Level 2 – other significant observable inputs (including quoted prices for similar investments, interest rates, prepayment speeds, etc.)
- Level 3 – unobservable inputs (including the Fund's own assumptions based on the best information available)
Valuation techniques used to value the Fund's investments by major category are as follows:
Equity securities, including restricted securities, for which market quotations are readily available, are valued at the last reported sale price or official closing price as reported by a third party pricing vendor on the primary market or exchange on which they are traded and are categorized as Level 1 in the hierarchy. In the event there were no sales during the day or closing prices are not available, securities are valued at the last quoted bid price or may be valued using the last available price and are generally categorized as Level 2 in the hierarchy. For foreign equity securities, when market or security specific events arise, comparisons to the valuation of American Depositary Receipts (ADRs), futures contracts, ETFs and certain indexes as well as quoted prices for similar securities may be used and would be categorized as Level 2 in the hierarchy. For equity securities, including restricted securities, where observable inputs are limited, assumptions about market activity and risk are used and these securities may be categorized as Level 3 in the hierarchy.
Debt securities, including restricted securities, are valued based on evaluated prices received from third party pricing vendors or from brokers who make markets in such securities. U.S. government and government agency obligations are valued by pricing vendors who utilize matrix pricing which considers yield or price of bonds of comparable quality, coupon, maturity and type or by broker-supplied prices. When independent prices are unavailable or unreliable, debt securities may be valued utilizing pricing methodologies which consider similar factors that would be used by third party pricing vendors. Debt securities are generally categorized as Level 2 in the hierarchy but may be Level 3 depending on the circumstances.
Futures contracts are valued at the settlement price established each day by the board of trade or exchange on which they are traded and are categorized as Level 1 in the hierarchy. Investments in open-end mutual funds, including the Fidelity Central Funds, are valued at their closing net asset value (NAV) each business day and are categorized as Level 1 in the hierarchy.
Changes in valuation techniques may result in transfers in or out of an assigned level within the disclosure hierarchy. The aggregate value of investments by input level as of July 31, 2022 is included at the end of the Fund's Schedule of Investments.
Foreign Currency. Certain Funds may use foreign currency contracts to facilitate transactions in foreign-denominated securities. Gains and losses from these transactions may arise from changes in the value of the foreign currency or if the counterparties do not perform under the contracts' terms.
Foreign-denominated assets, including investment securities, and liabilities are translated into U.S. dollars at the exchange rates at period end. Purchases and sales of investment securities, income and dividends received, and expenses denominated in foreign currencies are translated into U.S. dollars at the exchange rate in effect on the transaction date.
The effects of exchange rate fluctuations on investments are included with the net realized and unrealized gain (loss) on investment securities. Other foreign currency transactions resulting in realized and unrealized gain (loss) are disclosed separately.
Investment Transactions and Income. For financial reporting purposes, the Fund's investment holdings and NAV include trades executed through the end of the last business day of the period. The NAV per share for processing shareholder transactions is calculated as of the close of business of the New York Stock Exchange (NYSE), normally 4:00 p.m. Eastern time and includes trades executed through the end of the prior business day. Gains and losses on securities sold are determined on the basis of identified cost and include proceeds received from litigation. Commissions paid to certain brokers with whom the investment adviser, or its affiliates, places trades on behalf of a fund include an amount in addition to trade execution, which may be rebated back to a fund. Any such rebates are included in net realized gain (loss) on investments in the Statement of Operations. Dividend income is recorded on the ex-dividend date, except for certain dividends from foreign securities where the ex-dividend date may have passed, which are recorded as soon as the Fund is informed of the ex-dividend date. Non-cash dividends included in dividend income, if any, are recorded at the fair market value of the securities received. Income and capital gain distributions from Fidelity Central Funds, if any, are recorded on the ex-dividend date. Certain distributions received by the Fund represent a return of capital or capital gain. The Fund determines the components of these distributions subsequent to the ex-dividend date, based upon receipt of tax filings or other correspondence relating to the underlying investment. These distributions are recorded as a reduction of cost of investments and/or as a realized gain. Interest income is accrued as earned and includes coupon interest and amortization of premium and accretion of discount on debt securities as applicable. Investment income is recorded net of foreign taxes withheld where recovery of such taxes is uncertain.
Expenses. Expenses directly attributable to a fund are charged to that fund. Expenses attributable to more than one fund are allocated among the respective funds on the basis of relative net assets or other appropriate methods. Expenses included in the accompanying financial statements reflect the expenses of that fund and do not include any expenses associated with any underlying mutual funds or exchange-traded funds. Although not included in a fund's expenses, a fund indirectly bears its proportionate share of these expenses through the net asset value of each underlying mutual fund or exchange-traded fund. Expense estimates are accrued in the period to which they relate and adjustments are made when actual amounts are known.
Income Tax Information and Distributions to Shareholders. Each year, the Fund intends to qualify as a regulated investment company under Subchapter M of the Internal Revenue Code, including distributing substantially all of its taxable income and realized gains. As a result, no provision for U.S. Federal income taxes is required. As of July 31, 2022, the Fund did not have any unrecognized tax benefits in the financial statements; nor is the Fund aware of any tax positions for which it is reasonably possible that the total amounts of unrecognized tax benefits will significantly change in the next twelve months. The Fund files a U.S. federal tax return, in addition to state and local tax returns as required. The Fund's federal income tax returns are subject to examination by the Internal Revenue Service (IRS) for a period of three fiscal years after they are filed. State and local tax returns may be subject to examination for an additional fiscal year depending on the jurisdiction. Foreign taxes are provided for based on the Fund's understanding of the tax rules and rates that exist in the foreign markets in which it invests.
Distributions are declared and recorded on the ex-dividend date. Income and capital gain distributions are determined in accordance with income tax regulations, which may differ from GAAP. In addition, the Fund claimed a portion of the payment made to redeeming shareholders as a distribution for income tax purposes.
Capital accounts within the financial statements are adjusted for permanent book-tax differences. These adjustments have no impact on net assets or the results of operations. Capital accounts are not adjusted for temporary book-tax differences which will reverse in a subsequent period.
Book-tax differences are primarily due to futures contracts, foreign currency transactions, partnerships, passive foreign investment companies (PFIC), capital loss carryforwards and losses deferred due to wash sales and excise tax regulations.
As of period end, the cost and unrealized appreciation (depreciation) in securities, and derivatives if applicable, for federal income tax purposes were as follows:
| Gross unrealized appreciation | $1,163,599,380 |
| Gross unrealized depreciation | (448,024,978) |
| Net unrealized appreciation (depreciation) | $715,574,402 |
| Tax Cost | $4,433,410,766 |
The tax-based components of distributable earnings as of period end were as follows:
| Undistributed ordinary income | $22,390,150 |
| Undistributed long-term capital gain | $178,052,621 |
| Net unrealized appreciation (depreciation) on securities and other investments | $715,557,932 |
The Fund intends to elect to defer to its next fiscal year $168,106,150 of capital losses recognized during the period November 1, 2021 to July 31, 2022.
The tax character of distributions paid was as follows:
| | July 31, 2022 | July 31, 2021 |
| Ordinary Income | $605,253,396 | $ 50,956,528 |
| Long-term Capital Gains | 905,892,327 | 67,368,320 |
| Total | $1,511,145,723 | $ 118,324,848 |
Restricted Securities (including Private Placements). Funds may invest in securities that are subject to legal or contractual restrictions on resale. These securities generally may be resold in transactions exempt from registration or to the public if the securities are registered. Disposal of these securities may involve time-consuming negotiations and expense, and prompt sale at an acceptable price may be difficult. Information regarding restricted securities held at period end is included at the end of the Schedule of Investments, if applicable.
Special Purpose Acquisition Companies. Funds may invest in stock, warrants, and other securities of special purpose acquisition companies (SPACs) or similar special purpose entities. A SPAC is a publicly traded company that raises investment capital via an initial public offering (IPO) for the purpose of acquiring the equity securities of one or more existing companies via merger, business combination, acquisition or other similar transactions within a designated time frame.
Private Investment in Public Equity. Funds may acquire equity securities of an issuer through a private investment in a public equity (PIPE) transaction, including through commitments to purchase securities on a when-issued basis. A PIPE typically involves the purchase of securities directly from a publicly traded company in a private placement transaction. Securities purchased through PIPE transactions will be restricted from trading and considered illiquid until a resale registration statement for the shares is filed and declared effective.
At the current and/or prior period end, the Fund had commitments to purchase when-issued securities through PIPE transactions with SPACs. The commitments are contingent upon the SPACs acquiring the securities of target companies. Unrealized appreciation (depreciation) on any commitments outstanding at period end is separately presented in the Statements of Assets and Liabilities as Unrealized appreciation (depreciation) on unfunded commitments, and any change in unrealized appreciation (depreciation) on unfunded commitments during the period is separately presented in the Statement of Operations, as applicable.
4. Derivative Instruments.
Risk Exposures and the Use of Derivative Instruments. Investment objectives allow a fund to enter into various types of derivative contracts, including futures contracts. Derivatives are investments whose value is primarily derived from underlying assets, indices or reference rates and may be transacted on an exchange or over-the-counter (OTC). Derivatives may involve a future commitment to buy or sell a specified asset based on specified terms, to exchange future cash flows at periodic intervals based on a notional principal amount, or for one party to make one or more payments upon the occurrence of specified events in exchange for periodic payments from the other party.
Derivatives were used to increase returns and to manage exposure to certain risks as defined below. The success of any strategy involving derivatives depends on analysis of numerous economic factors, and if the strategies for investment do not work as intended, the objectives may not be achieved.
Derivatives were used to increase or decrease exposure to the following risk(s):
| Equity Risk | Equity risk relates to the fluctuations in the value of financial instruments as a result of changes in market prices (other than those arising from interest rate risk or foreign exchange risk), whether caused by factors specific to an individual investment, its issuer, or all factors affecting all instruments traded in a market or market segment.
|
Funds are also exposed to additional risks from investing in derivatives, such as liquidity risk and counterparty credit risk. Liquidity risk is the risk that a fund will be unable to close out the derivative in the open market in a timely manner. Counterparty credit risk is the risk that the counterparty will not be able to fulfill its obligation to a fund. Exchange-traded contracts are not covered by the ISDA Master Agreement; however counterparty credit risk related to these contracts may be mitigated by the protection provided by the exchange on which they trade.
Investing in derivatives may involve greater risks than investing in the underlying assets directly and, to varying degrees, may involve risk of loss in excess of any initial investment and collateral received and amounts recognized in the Statement of Assets and Liabilities. In addition, there may be the risk that the change in value of the derivative contract does not correspond to the change in value of the underlying instrument.
Futures Contracts. A futures contract is an agreement between two parties to buy or sell a specified underlying instrument for a fixed price at a specified future date. Futures contracts were used to manage exposure to the stock market.
Upon entering into a futures contract, a fund is required to deposit either cash or securities (initial margin) with a clearing broker in an amount equal to a certain percentage of the face value of the contract. Futures contracts are marked-to-market daily and subsequent daily payments are made or received by a fund depending on the daily fluctuations in the value of the futures contracts and are recorded as unrealized appreciation or (depreciation). This receivable and/or payable, if any, is included in daily variation margin on futures contracts in the Statement of Assets and Liabilities. Realized gain or (loss) is recorded upon the expiration or closing of a futures contract. The net realized gain (loss) and change in net unrealized appreciation (depreciation) on futures contracts during the period is presented in the Statement of Operations.
Any open futures contracts at period end are presented in the Schedule of Investments under the caption "Futures Contracts". The notional amount at value reflects each contract's exposure to the underlying instrument or index at period end, and is representative of volume of activity during the period unless an average notional amount is presented. Any securities deposited to meet initial margin requirements are identified in the Schedule of Investments. Any cash deposited to meet initial margin requirements is presented as segregated cash with brokers for derivative instruments in the Statement of Assets and Liabilities.
5. Purchases and Sales of Investments.
Purchases and sales of securities, other than short-term securities, U.S. government securities and in-kind transactions, as applicable, are noted in the table below.
| | Purchases ($) | Sales ($) |
| Fidelity Series Small Cap Opportunities Fund | 2,187,419,880 | 2,643,134,737 |
6. Fees and Other Transactions with Affiliates.
Management Fee. Fidelity Management & Research Company LLC (the investment adviser) and its affiliates provide the Fund with investment management related services for which the Fund does not pay a management fee. Under the management contract, the investment adviser or an affiliate pays all ordinary operating expenses of the Fund, except custody fees, fees and expenses of the independent Trustees, and certain miscellaneous expenses such as proxy and shareholder meeting expenses.
Brokerage Commissions. A portion of portfolio transactions were placed with brokerage firms which are affiliates of the investment adviser. Brokerage commissions are included in net realized gain (loss) and change in net unrealized appreciation (depreciation) in the Statement of Operations. The commissions paid to these affiliated firms were as follows:
| | Amount |
| Fidelity Series Small Cap Opportunities Fund | $93,014 |
Interfund Lending Program. Pursuant to an Exemptive Order issued by the Securities and Exchange Commission (the SEC), the Fund, along with other registered investment companies having management contracts with Fidelity Management & Research Company LLC (FMR), or other affiliated entities of FMR, may participate in an interfund lending program. This program provides an alternative credit facility allowing the Fund to borrow from, or lend money to, other participating affiliated funds. At period end, there were no interfund loans outstanding. Activity in this program during the period for which loans were outstanding was as follows:
| | Borrower or Lender | Average Loan Balance | Weighted Average Interest Rate | Interest Expense |
| Fidelity Series Small Cap Opportunities Fund | Borrower | $32,615,857 | .38% | $2,394 |
Interfund Trades. Funds may purchase from or sell securities to other Fidelity Funds under procedures adopted by the Board. The procedures have been designed to ensure these interfund trades are executed in accordance with Rule 17a-7 of the 1940 Act. Any interfund trades are included within the respective purchases and sales amounts shown in the Purchases and Sales of Investments note. Interfund trades during the period are noted in the table below.
| | Purchases ($) | Sales ($) | Realized Gain (Loss) ($) |
| Fidelity Series Small Cap Opportunities Fund | 160,908,497 | 194,687,876 | (2,066,780) |
7. Committed Line of Credit.
Certain Funds participate with other funds managed by the investment adviser or an affiliate in a $4.25 billion credit facility (the "line of credit") to be utilized for temporary or emergency purposes to fund shareholder redemptions or for other short-term liquidity purposes. The commitment fees on the pro-rata portion of the line of credit are borne by the investment adviser. During the period, there were no borrowings on this line of credit.
8. Security Lending.
Funds lend portfolio securities from time to time in order to earn additional income. Lending agents are used, including National Financial Services (NFS), an affiliate of the investment adviser. Pursuant to a securities lending agreement, NFS will receive a fee, which is capped at 9.9% of a fund's daily lending revenue, for its services as lending agent. A fund may lend securities to certain qualified borrowers, including NFS. On the settlement date of the loan, a fund receives collateral (in the form of U.S. Treasury obligations, letters of credit and/or cash) against the loaned securities and maintains collateral in an amount not less than 100% of the market value of the loaned securities during the period of the loan. The market value of the loaned securities is determined at the close of business of a fund and any additional required collateral is delivered to a fund on the next business day. A fund or borrower may terminate the loan at any time, and if the borrower defaults on its obligation to return the securities loaned because of insolvency or other reasons, a fund may apply collateral received from the borrower against the obligation. A fund may experience delays and costs in recovering the securities loaned. Any cash collateral received is invested in the Fidelity Securities Lending Cash Central Fund. Any loaned securities are identified as such in the Schedule of Investments, and the value of loaned securities and cash collateral at period end, as applicable, are presented in the Statement of Assets and Liabilities. Security lending income represents the income earned on investing cash collateral, less rebates paid to borrowers and any lending agent fees associated with the loan, plus any premium payments received for lending certain types of securities. Security lending income is presented in the Statement of Operations as a component of income from Fidelity Central Funds. Affiliated security lending activity, if any, was as follows:
| | Total Security Lending Fees Paid to NFS | Security Lending Income From Securities Loaned to NFS | Value of Securities Loaned to NFS at Period End |
| Fidelity Series Small Cap Opportunities Fund | $51,249 | $9,048 | $– |
9. Expense Reductions.
Through arrangements with the Fund's custodian, credits realized as a result of certain uninvested cash balances were used to reduce the Fund's expenses by $247.
10. Other.
A fund's organizational documents provide former and current trustees and officers with a limited indemnification against liabilities arising in connection with the performance of their duties to the fund. In the normal course of business, a fund may also enter into contracts that provide general indemnifications. A fund's maximum exposure under these arrangements is unknown as this would be dependent on future claims that may be made against a fund. The risk of material loss from such claims is considered remote.
At the end of the period, mutual funds and accounts managed by the investment adviser or its affiliates were the owners of record of all of the outstanding shares of the Fund.
11. Coronavirus (COVID-19) Pandemic.
An outbreak of COVID-19 first detected in China during December 2019 has since spread globally and was declared a pandemic by the World Health Organization during March 2020. Developments that disrupt global economies and financial markets, such as the COVID-19 pandemic, may magnify factors that affect the Fund's performance.
Report of Independent Registered Public Accounting Firm
To the Board of Trustees of Fidelity Securities Fund and Shareholders of Fidelity Series Small Cap Opportunities Fund
Opinion on the Financial Statements and Financial Highlights
We have audited the accompanying statement of assets and liabilities of Fidelity Series Small Cap Opportunities Fund (the "Fund"), a fund of Fidelity Securities Fund, including the schedule of investments, as of July 31, 2022, the related statement of operations for the year then ended, the statement of changes in net assets for each of the two years in the period then ended, the financial highlights for each of the five years in the period then ended, and the related notes. In our opinion, the financial statements and financial highlights present fairly, in all material respects, the financial position of the Fund as of July 31, 2022, and the results of its operations for the year then ended, the changes in its net assets for each of the two years in the period then ended, and the financial highlights for each of the five years in the period then ended in conformity with accounting principles generally accepted in the United States of America.
Basis for Opinion
These financial statements and financial highlights are the responsibility of the Fund's management. Our responsibility is to express an opinion on the Fund's financial statements and financial highlights based on our audits. We are a public accounting firm registered with the Public Company Accounting Oversight Board (United States) (PCAOB) and are required to be independent with respect to the Fund in accordance with the U.S. federal securities laws and the applicable rules and regulations of the Securities and Exchange Commission and the PCAOB.
We conducted our audits in accordance with the standards of the PCAOB. Those standards require that we plan and perform the audit to obtain reasonable assurance about whether the financial statements and financial highlights are free of material misstatement, whether due to error or fraud. The Fund is not required to have, nor were we engaged to perform, an audit of its internal control over financial reporting. As part of our audits we are required to obtain an understanding of internal control over financial reporting but not for the purpose of expressing an opinion on the effectiveness of the Fund’s internal control over financial reporting. Accordingly, we express no such opinion.
Our audits included performing procedures to assess the risks of material misstatement of the financial statements and financial highlights, whether due to error or fraud, and performing procedures that respond to those risks. Such procedures included examining, on a test basis, evidence regarding the amounts and disclosures in the financial statements and financial highlights. Our audits also included evaluating the accounting principles used and significant estimates made by management, as well as evaluating the overall presentation of the financial statements and financial highlights. Our procedures included confirmation of securities owned as of July 31, 2022, by correspondence with the custodian and brokers; when replies were not received from brokers, we performed other auditing procedures. We believe that our audits provide a reasonable basis for our opinion.
/s/ Deloitte & Touche LLP
Boston, Massachusetts
September 15, 2022
We have served as the auditor of one or more of the Fidelity investment companies since 1999.
Trustees and Officers
The Trustees, Members of the Advisory Board (if any), and officers of the trust and fund, as applicable, are listed below. The Board of Trustees governs the fund and is responsible for protecting the interests of shareholders. The Trustees are experienced executives who meet periodically throughout the year to oversee the fund's activities, review contractual arrangements with companies that provide services to the fund, oversee management of the risks associated with such activities and contractual arrangements, and review the fund's performance. Except for Jonathan Chiel, each of the Trustees oversees 316 funds. Mr. Chiel oversees 184 funds.
The Trustees hold office without limit in time except that (a) any Trustee may resign; (b) any Trustee may be removed by written instrument, signed by at least two-thirds of the number of Trustees prior to such removal; (c) any Trustee who requests to be retired or who has become incapacitated by illness or injury may be retired by written instrument signed by a majority of the other Trustees; and (d) any Trustee may be removed at any special meeting of shareholders by a two-thirds vote of the outstanding voting securities of the trust. Each Trustee who is not an interested person (as defined in the 1940 Act) of the trust and the fund is referred to herein as an Independent Trustee. Each Independent Trustee shall retire not later than the last day of the calendar year in which his or her 75th birthday occurs. The Independent Trustees may waive this mandatory retirement age policy with respect to individual Trustees. Officers and Advisory Board Members hold office without limit in time, except that any officer or Advisory Board Member may resign or may be removed by a vote of a majority of the Trustees at any regular meeting or any special meeting of the Trustees. Except as indicated, each individual has held the office shown or other offices in the same company for the past five years.
The fund’s Statement of Additional Information (SAI) includes more information about the Trustees. To request a free copy, call Fidelity at 1-800-544-8544.
Experience, Skills, Attributes, and Qualifications of the Trustees. The Governance and Nominating Committee has adopted a statement of policy that describes the experience, qualifications, attributes, and skills that are necessary and desirable for potential Independent Trustee candidates (Statement of Policy). The Board believes that each Trustee satisfied at the time he or she was initially elected or appointed a Trustee, and continues to satisfy, the standards contemplated by the Statement of Policy. The Governance and Nominating Committee also engages professional search firms to help identify potential Independent Trustee candidates who have the experience, qualifications, attributes, and skills consistent with the Statement of Policy. From time to time, additional criteria based on the composition and skills of the current Independent Trustees, as well as experience or skills that may be appropriate in light of future changes to board composition, business conditions, and regulatory or other developments, have also been considered by the professional search firms and the Governance and Nominating Committee. In addition, the Board takes into account the Trustees' commitment and participation in Board and committee meetings, as well as their leadership of standing and ad hoc committees throughout their tenure.
In determining that a particular Trustee was and continues to be qualified to serve as a Trustee, the Board has considered a variety of criteria, none of which, in isolation, was controlling. The Board believes that, collectively, the Trustees have balanced and diverse experience, qualifications, attributes, and skills, which allow the Board to operate effectively in governing the fund and protecting the interests of shareholders. Information about the specific experience, skills, attributes, and qualifications of each Trustee, which in each case led to the Board's conclusion that the Trustee should serve (or continue to serve) as a trustee of the fund, is provided below.
Board Structure and Oversight Function. Robert A. Lawrence is an interested person and currently serves as Chair. The Trustees have determined that an interested Chair is appropriate and benefits shareholders because an interested Chair has a personal and professional stake in the quality and continuity of services provided to the fund. Independent Trustees exercise their informed business judgment to appoint an individual of their choosing to serve as Chair, regardless of whether the Trustee happens to be independent or a member of management. The Independent Trustees have determined that they can act independently and effectively without having an Independent Trustee serve as Chair and that a key structural component for assuring that they are in a position to do so is for the Independent Trustees to constitute a substantial majority for the Board. The Independent Trustees also regularly meet in executive session. David M. Thomas serves as Lead Independent Trustee and as such (i) acts as a liaison between the Independent Trustees and management with respect to matters important to the Independent Trustees and (ii) with management prepares agendas for Board meetings.
Fidelity® funds are overseen by different Boards of Trustees. The fund's Board oversees Fidelity's high income and certain equity funds, and other Boards oversee Fidelity's investment-grade bond, money market, asset allocation, and other equity funds. The asset allocation funds may invest in Fidelity® funds overseen by the fund's Board. The use of separate Boards, each with its own committee structure, allows the Trustees of each group of Fidelity® funds to focus on the unique issues of the funds they oversee, including common research, investment, and operational issues. On occasion, the separate Boards establish joint committees to address issues of overlapping consequences for the Fidelity® funds overseen by each Board.
The Trustees operate using a system of committees to facilitate the timely and efficient consideration of all matters of importance to the Trustees, the fund, and fund shareholders and to facilitate compliance with legal and regulatory requirements and oversight of the fund's activities and associated risks. The Board, acting through its committees, has charged FMR and its affiliates with (i) identifying events or circumstances the occurrence of which could have demonstrably adverse effects on the fund's business and/or reputation; (ii) implementing processes and controls to lessen the possibility that such events or circumstances occur or to mitigate the effects of such events or circumstances if they do occur; and (iii) creating and maintaining a system designed to evaluate continuously business and market conditions in order to facilitate the identification and implementation processes described in (i) and (ii) above. Because the day-to-day operations and activities of the fund are carried out by or through FMR, its affiliates, and other service providers, the fund's exposure to risks is mitigated but not eliminated by the processes overseen by the Trustees. While each of the Board's committees has responsibility for overseeing different aspects of the fund's activities, oversight is exercised primarily through the Operations, Audit, and Compliance Committees. Appropriate personnel, including but not limited to the fund's Chief Compliance Officer (CCO), FMR's internal auditor, the independent accountants, the fund's Treasurer and portfolio management personnel, make periodic reports to the Board's committees, as appropriate, including an annual review of Fidelity's risk management program for the Fidelity® funds. The responsibilities of each standing committee, including their oversight responsibilities, are described further under "Standing Committees of the Trustees."
Interested Trustees*:
Correspondence intended for a Trustee who is an interested person may be sent to Fidelity Investments, 245 Summer Street, Boston, Massachusetts 02210.
Name, Year of Birth; Principal Occupations and Other Relevant Experience+
Jonathan Chiel (1957)
Year of Election or Appointment: 2016
Trustee
Mr. Chiel also serves as Trustee of other Fidelity® funds. Mr. Chiel is Executive Vice President and General Counsel for FMR LLC (diversified financial services company, 2012-present). Previously, Mr. Chiel served as general counsel (2004-2012) and senior vice president and deputy general counsel (2000-2004) for John Hancock Financial Services; a partner with Choate, Hall & Stewart (1996-2000) (law firm); and an Assistant United States Attorney for the United States Attorney’s Office of the District of Massachusetts (1986-95), including Chief of the Criminal Division (1993-1995). Mr. Chiel is a director on the boards of the Boston Bar Foundation and the Maimonides School.
Bettina Doulton (1964)
Year of Election or Appointment: 2021
Trustee
Ms. Doulton also serves as Trustee of other Fidelity® funds. Prior to her retirement, Ms. Doulton served in a variety of positions at Fidelity Investments, including as a managing director of research (2006-2007), portfolio manager to certain Fidelity® funds (1993-2005), equity analyst and portfolio assistant (1990-1993), and research assistant (1987-1990). Ms. Doulton currently owns and operates Phi Builders + Architects and Cellardoor Winery. Previously, Ms. Doulton served as a member of the Board of Brown Capital Management, LLC (2014-2018).
Robert A. Lawrence (1952)
Year of Election or Appointment: 2020
Trustee
Chair of the Board of Trustees
Mr. Lawrence also serves as Trustee of other funds. Previously, Mr. Lawrence served as a Trustee and Member of the Advisory Board of certain funds. Prior to his retirement in 2008, Mr. Lawrence served as Vice President of certain Fidelity® funds (2006-2008), Senior Vice President, Head of High Income Division of Fidelity Management & Research Company (investment adviser firm, 2006-2008), and President of Fidelity Strategic Investments (investment adviser firm, 2002-2005).
* Determined to be an “Interested Trustee” by virtue of, among other things, his or her affiliation with the trust or various entities under common control with FMR.
+ The information includes the Trustee's principal occupation during the last five years and other information relating to the experience, attributes, and skills relevant to the Trustee's qualifications to serve as a Trustee, which led to the conclusion that the Trustee should serve as a Trustee for the fund.
Independent Trustees:
Correspondence intended for an Independent Trustee may be sent to Fidelity Investments, P.O. Box 55235, Boston, Massachusetts 02205-5235.
Name, Year of Birth; Principal Occupations and Other Relevant Experience+
Thomas P. Bostick (1956)
Year of Election or Appointment: 2021
Trustee
Lieutenant General Bostick also serves as Trustee of other Fidelity® funds. Prior to his retirement, General Bostick (United States Army, Retired) held a variety of positions within the U.S. Army, including Commanding General and Chief of Engineers, U.S. Army Corps of Engineers (2012-2016) and Deputy Chief of Staff and Director of Human Resources, U.S. Army (2009-2012). General Bostick currently serves as a member of the Board and Finance and Governance Committees of CSX Corporation (transportation, 2020-present) and a member of the Board and Corporate Governance and Nominating Committee of Perma-Fix Environmental Services, Inc. (nuclear waste management, 2020-present). General Bostick serves as Chief Executive Officer of Bostick Global Strategies, LLC (consulting, 2016-present) and as a member of the Board of HireVue, Inc. (video interview and assessment, 2020-present). Previously, General Bostick served as a Member of the Advisory Board of certain Fidelity® funds (2021), President, Intrexon Bioengineering (2018-2020) and Chief Operating Officer (2017-2020) and Senior Vice President of the Environment Sector (2016-2017) of Intrexon Corporation (biopharmaceutical company).
Dennis J. Dirks (1948)
Year of Election or Appointment: 2005
Trustee
Mr. Dirks also serves as Trustee of other Fidelity® funds. Prior to his retirement in May 2003, Mr. Dirks served as Chief Operating Officer and as a member of the Board of The Depository Trust & Clearing Corporation (financial markets infrastructure), President, Chief Operating Officer and a member of the Board of The Depository Trust Company (DTC), President and a member of the Board of the National Securities Clearing Corporation (NSCC), Chief Executive Officer and a member of the Board of the Government Securities Clearing Corporation and Chief Executive Officer and a member of the Board of the Mortgage-Backed Securities Clearing Corporation. Mr. Dirks currently serves as a member of the Finance Committee (2016-present) and Board (2017-present) and is Treasurer (2018-present) of the Asolo Repertory Theatre.
Donald F. Donahue (1950)
Year of Election or Appointment: 2018
Trustee
Mr. Donahue also serves as Trustee of other Fidelity® funds. Mr. Donahue serves as President and Chief Executive Officer of Miranda Partners, LLC (risk consulting for the financial services industry, 2012-present). Previously, Mr. Donahue served as Chief Executive Officer (2006-2012), Chief Operating Officer (2003-2006) and Managing Director, Customer Marketing and Development (1999-2003) of The Depository Trust & Clearing Corporation (financial markets infrastructure). Mr. Donahue currently serves as a member (2007-present) and Co-Chairman (2016-present) of the Board of United Way of New York and a member of the Board of The Leadership Academy (previously NYC Leadership Academy) (2012-present). Mr. Donahue previously served as a member of the Advisory Board of certain Fidelity® funds (2015-2018).
Vicki L. Fuller (1957)
Year of Election or Appointment: 2020
Trustee
Ms. Fuller also serves as Trustee of other Fidelity® funds. Previously, Ms. Fuller served as a member of the Advisory Board of certain Fidelity® funds (2018-2020), Chief Investment Officer of the New York State Common Retirement Fund (2012-2018) and held a variety of positions at AllianceBernstein L.P. (global asset management, 1985-2012), including Managing Director (2006-2012) and Senior Vice President and Senior Portfolio Manager (2001-2006). Ms. Fuller currently serves as a member of the Board, Audit Committee and Nominating and Governance Committee of two Blackstone business development companies (2020-present), as a member of the Board of Treliant, LLC (consulting, 2019-present), as a member of the Advisory Board of Ariel Alternatives, LLC (private equity, 2021-present) and as a member of the Board and Chair of the Audit Committee of Gusto, Inc. (software, 2021-present). In addition, Ms. Fuller currently serves as a member of the Board of Roosevelt University (2019-present) and as a member of the Executive Board of New York University’s Stern School of Business. Ms. Fuller previously served as a member of the Board, Audit Committee and Nominating and Governance Committee of The Williams Companies, Inc. (natural gas infrastructure, 2018-2021).
Patricia L. Kampling (1959)
Year of Election or Appointment: 2020
Trustee
Ms. Kampling also serves as Trustee of other Fidelity® funds. Prior to her retirement, Ms. Kampling served as Chairman of the Board and Chief Executive Officer (2012-2019), President and Chief Operating Officer (2011-2012) and Executive Vice President and Chief Financial Officer (2010-2011) of Alliant Energy Corporation. Ms. Kampling currently serves as a member of the Board, Finance Committee and Governance, Compensation and Nominating Committee of Xcel Energy Inc. (utilities company, 2020-present) and as a member of the Board, Audit, Finance and Risk Committee and Safety, Environmental, Technology and Operations Committee and Chair of the Executive Development and Compensation Committee of American Water Works Company, Inc. (utilities company, 2019-present). In addition, Ms. Kampling currently serves as a member of the Board of the Nature Conservancy, Wisconsin Chapter (2019-present). Previously, Ms. Kampling served as a Member of the Advisory Board of certain Fidelity® funds (2020), a member of the Board, Compensation Committee and Executive Committee and Chair of the Audit Committee of Briggs & Stratton Corporation (manufacturing, 2011-2021), a member of the Board of Interstate Power and Light Company (2012-2019) and Wisconsin Power and Light Company (2012-2019) (each a subsidiary of Alliant Energy Corporation) and as a member of the Board and Workforce Development Committee of the Business Roundtable (2018-2019).
Thomas A. Kennedy (1955)
Year of Election or Appointment: 2021
Trustee
Mr. Kennedy also serves as Trustee of other Fidelity® funds. Previously, Mr. Kennedy served as a Member of the Advisory Board of certain Fidelity® funds (2020) and held a variety of positions at Raytheon Company (aerospace and defense, 1983-2020), including Chairman and Chief Executive Officer (2014-2020) and Executive Vice President and Chief Operating Officer (2013-2014). Mr. Kennedy currently serves as Executive Chairman of the Board of Directors of Raytheon Technologies Corporation (aerospace and defense, 2020-present). He is also a member of the Rutgers School of Engineering Industry Advisory Board (2011-present) and a member of the UCLA Engineering Dean’s Executive Board (2016-present).
Oscar Munoz (1959)
Year of Election or Appointment: 2021
Trustee
Mr. Munoz also serves as Trustee of other Fidelity® funds. Prior to his retirement, Mr. Munoz served as Executive Chairman (2020-2021), Chief Executive Officer (2015-2020), President (2015-2016) and a member of the Board (2010-2021) of United Airlines Holdings, Inc. Mr. Munoz currently serves as a member of the Board of CBRE Group, Inc. (commercial real estate, 2020-present), a member of the Board of Univision Communications, Inc. (Hispanic media, 2020-present) and a member of the Advisory Board of Salesforce.com, Inc. (cloud-based software, 2020-present). Previously, Mr. Munoz served as a Member of the Advisory Board of certain Fidelity® funds (2021).
Garnett A. Smith (1947)
Year of Election or Appointment: 2018
Trustee
Mr. Smith also serves as Trustee of other Fidelity® funds. Prior to his retirement, Mr. Smith served as Chairman and Chief Executive Officer (1990-1997) and President (1986-1990) of Inbrand Corp. (manufacturer of personal absorbent products). Prior to his employment with Inbrand Corp., he was employed by a retail fabric chain and North Carolina National Bank (now Bank of America). Mr. Smith previously served as a member of the Advisory Board of certain Fidelity® funds (2012-2013).
David M. Thomas (1949)
Year of Election or Appointment: 2008
Trustee
Lead Independent Trustee
Mr. Thomas also serves as Trustee of other Fidelity® funds. Previously, Mr. Thomas served as Executive Chairman (2005-2006) and Chairman and Chief Executive Officer (2000-2005) of IMS Health, Inc. (pharmaceutical and healthcare information solutions). Mr. Thomas currently serves as a member of the Board of Fortune Brands Home and Security (home and security products, 2004-present) and as Director (2013-present) and Non-Executive Chairman of the Board (2022-present) of Interpublic Group of Companies, Inc. (marketing communication).
Susan Tomasky (1953)
Year of Election or Appointment: 2020
Trustee
Ms. Tomasky also serves as Trustee of other Fidelity® funds. Prior to her retirement, Ms. Tomasky served in various executive officer positions at American Electric Power Company, Inc. (1998-2011), including most recently as President of AEP Transmission (2007-2011). Ms. Tomasky currently serves as a member of the Board and Sustainability Committee and as Chair of the Audit Committee of Marathon Petroleum Corporation (2018-present) and as a member of the Board, Executive Committee, Corporate Governance Committee and Organization and Compensation Committee and as Chair of the Audit Committee of Public Service Enterprise Group, Inc. (utilities company, 2012-present) and as a member of the Board of its subsidiary company, Public Service Electric and Gas Co. (2021-present). In addition, Ms. Tomasky currently serves as a member (2009-present) and President (2020-present) of the Board of the Royal Shakespeare Company – America (2009-present), as a member of the Board of the Columbus Association for the Performing Arts (2011-present) and as a member of the Board and Kenyon in the World Committee of Kenyon College (2016-present). Previously, Ms. Tomasky served as a Member of the Advisory Board of certain Fidelity® funds (2020), as a member of the Board of the Columbus Regional Airport Authority (2007-2020), as a member of the Board (2011-2018) and Lead Independent Director (2015-2018) of Andeavor Corporation (previously Tesoro Corporation) (independent oil refiner and marketer) and as a member of the Board of Summit Midstream Partners LP (energy, 2012-2018).
Michael E. Wiley (1950)
Year of Election or Appointment: 2020
Trustee
Mr. Wiley also serves as Trustee of other Fidelity® funds. Previously, Mr. Wiley served as a member of the Advisory Board of certain Fidelity® funds (2018-2020), Chairman, President and CEO of Baker Hughes, Inc. (oilfield services, 2000-2004). Mr. Wiley also previously served as a member of the Board of Andeavor Corporation (independent oil refiner and marketer, 2005-2018), a member of the Board of Andeavor Logistics LP (natural resources logistics, 2015-2018) and a member of the Board of High Point Resources (exploration and production, 2005-2020).
+ The information includes the Trustee's principal occupation during the last five years and other information relating to the experience, attributes, and skills relevant to the Trustee's qualifications to serve as a Trustee, which led to the conclusion that the Trustee should serve as a Trustee for the fund.
Advisory Board Members and Officers:
Correspondence intended for a Member of the Advisory Board (if any) may be sent to Fidelity Investments, P.O. Box 55235, Boston, Massachusetts 02205-5235. Correspondence intended for an officer or Peter S. Lynch may be sent to Fidelity Investments, 245 Summer Street, Boston, Massachusetts 02210. Officers appear below in alphabetical order.
Name, Year of Birth; Principal Occupation
Peter S. Lynch (1944)
Year of Election or Appointment: 2003
Member of the Advisory Board
Mr. Lynch also serves as a Member of the Advisory Board of other Fidelity® funds. Mr. Lynch is Vice Chairman and a Director of Fidelity Management & Research Company LLC (investment adviser firm). In addition, Mr. Lynch serves as a Trustee of Boston College and as the Chairman of the Inner-City Scholarship Fund. Previously, Mr. Lynch served as Vice Chairman and a Director of FMR Co., Inc. (investment adviser firm) and on the Special Olympics International Board of Directors (1997-2006).
Craig S. Brown (1977)
Year of Election or Appointment: 2019
Assistant Treasurer
Mr. Brown also serves as an officer of other funds. Mr. Brown serves as Assistant Treasurer of FIMM, LLC (2021-present) and is an employee of Fidelity Investments (2013-present).
John J. Burke III (1964)
Year of Election or Appointment: 2018
Chief Financial Officer
Mr. Burke also serves as Chief Financial Officer of other funds. Mr. Burke serves as Head of Investment Operations for Fidelity Fund and Investment Operations (2018-present) and is an employee of Fidelity Investments (1998-present). Previously Mr. Burke served as head of Asset Management Investment Operations (2012-2018).
William C. Coffey (1969)
Year of Election or Appointment: 2019
Assistant Secretary
Mr. Coffey also serves as Assistant Secretary of other funds. He is Senior Vice President and Deputy General Counsel of FMR LLC (diversified financial services company, 2010-present), and is an employee of Fidelity Investments. Previously, Mr. Coffey served as Secretary and CLO of certain funds (2018-2019); CLO, Secretary, and Senior Vice President of Fidelity Management & Research Company and FMR Co., Inc. (investment adviser firms, 2018-2019); Secretary of Fidelity SelectCo, LLC and Fidelity Investments Money Management, Inc. (investment adviser firms, 2018-2019); CLO of Fidelity Management & Research (Hong Kong) Limited, FMR Investment Management (UK) Limited, and Fidelity Management & Research (Japan) Limited (investment adviser firms, 2018-2019); and Assistant Secretary of certain funds (2009-2018).
Timothy M. Cohen (1969)
Year of Election or Appointment: 2018
Vice President
Mr. Cohen also serves as Vice President of other funds. Mr. Cohen serves as Co-Head of Equity (2018-present), a Director of Fidelity Management & Research (Japan) Limited (investment adviser firm, 2016-present), and is an employee of Fidelity Investments. Previously, Mr. Cohen served as Executive Vice President of Fidelity SelectCo, LLC (2019), Head of Global Equity Research (2016-2018), Chief Investment Officer - Equity and a Director of Fidelity Management & Research (U.K.) Inc. (investment adviser firm, 2013-2015) and as a Director of Fidelity Management & Research (Hong Kong) Limited (investment adviser firm, 2017).
Jonathan Davis (1968)
Year of Election or Appointment: 2010
Assistant Treasurer
Mr. Davis also serves as an officer of other funds. Mr. Davis serves as Assistant Treasurer of FIMM, LLC (2021-present), FMR Capital, Inc. (2017-present), FD Funds GP LLC (2021-present), FD Funds Holding LLC (2021-present), and FD Funds Management LLC (2021-present); and is an employee of Fidelity Investments. Previously, Mr. Davis served as Vice President and Associate General Counsel of FMR LLC (diversified financial services company, 2003-2010).
Laura M. Del Prato (1964)
Year of Election or Appointment: 2018
Assistant Treasurer
Ms. Del Prato also serves as an officer of other funds. Ms. Del Prato serves as Assistant Treasurer of FIMM, LLC (2021-present) and is an employee of Fidelity Investments (2017-present). Previously, Ms. Del Prato served as President and Treasurer of The North Carolina Capital Management Trust: Cash Portfolio and Term Portfolio (2018-2020). Prior to joining Fidelity Investments, Ms. Del Prato served as a Managing Director and Treasurer of the JPMorgan Mutual Funds (2014-2017). Prior to JPMorgan, Ms. Del Prato served as a partner at Cohen Fund Audit Services (accounting firm, 2012-2013) and KPMG LLP (accounting firm, 2004-2012).
Colm A. Hogan (1973)
Year of Election or Appointment: 2020
Assistant Treasurer
Mr. Hogan also serves as an officer of other funds. Mr. Hogan serves as Assistant Treasurer of FIMM, LLC (2021-present) and FMR Capital, Inc. (2017-present) and is an employee of Fidelity Investments (2005-present). Previously, Mr. Hogan served as Deputy Treasurer of certain Fidelity® funds (2016-2020) and Assistant Treasurer of certain Fidelity® funds (2016-2018).
Pamela R. Holding (1964)
Year of Election or Appointment: 2018
Vice President
Ms. Holding also serves as Vice President of other funds. Ms. Holding serves as Co-Head of Equity (2018-present) and is an employee of Fidelity Investments (2013-present). Previously, Ms. Holding served as Executive Vice President of Fidelity SelectCo, LLC (2019) and as Chief Investment Officer of Fidelity Institutional Asset Management (2013-2018).
Cynthia Lo Bessette (1969)
Year of Election or Appointment: 2019
Secretary and Chief Legal Officer (CLO)
Ms. Lo Bessette also serves as an officer of other funds. Ms. Lo Bessette serves as CLO, Secretary, and Senior Vice President of Fidelity Management & Research Company LLC (investment adviser firm, 2019-present); CLO of Fidelity Management & Research (Hong Kong) Limited, FMR Investment Management (UK) Limited, and Fidelity Management & Research (Japan) Limited (investment adviser firms, 2019-present); Secretary of FD Funds GP LLC (2021-present), FD Funds Holding LLC (2021-present), and FD Funds Management LLC (2021-present); and Assistant Secretary of FIMM, LLC (2019-present). She is a Senior Vice President and Deputy General Counsel of FMR LLC (diversified financial services company, 2019-present), and is an employee of Fidelity Investments. Previously, Ms. Lo Bessette served as CLO, Secretary, and Senior Vice President of FMR Co., Inc. (investment adviser firm, 2019); Secretary of Fidelity SelectCo, LLC and Fidelity Investments Money Management, Inc. (investment adviser firms, 2019). Prior to joining Fidelity Investments, Ms. Lo Bessette was Executive Vice President, General Counsel (2016-2019) and Senior Vice President, Deputy General Counsel (2015-2016) of OppenheimerFunds (investment management company) and Deputy Chief Legal Officer (2013-2015) of Jennison Associates LLC (investment adviser firm).
Chris Maher (1972)
Year of Election or Appointment: 2020
Deputy Treasurer
Mr. Maher also serves as an officer of other funds. Mr. Maher serves as Assistant Treasurer of FIMM, LLC (2021-present) and FMR Capital, Inc. (2017-present), and is an employee of Fidelity Investments (2008-present). Previously, Mr. Maher served as Assistant Treasurer of certain funds (2013-2020); Vice President of Asset Management Compliance (2013), Vice President of the Program Management Group of FMR (investment adviser firm, 2010-2013), and Vice President of Valuation Oversight (2008-2010).
Jason P. Pogorelec (1975)
Year of Election or Appointment: 2020
Chief Compliance Officer
Mr. Pogorelec also serves as Chief Compliance Officer of other funds. Mr. Pogorelec is a senior Vice President of Asset Management Compliance for Fidelity Investments and is an employee of Fidelity Investments (2006-present). Previously, Mr. Pogorelec served as Vice President, Associate General Counsel for Fidelity Investments (2010-2020) and Assistant Secretary of certain Fidelity funds (2015-2020).
Brett Segaloff (1972)
Year of Election or Appointment: 2021
Anti-Money Laundering (AML) Officer
Mr. Segaloff also serves as an AML Officer of other funds and other related entities. He is Director, Anti-Money Laundering (2007-present) of FMR LLC (diversified financial services company) and is an employee of Fidelity Investments (1996-present).
Stacie M. Smith (1974)
Year of Election or Appointment: 2016
President and Treasurer
Ms. Smith also serves as an officer of other funds. Ms. Smith serves as Assistant Treasurer of FIMM, LLC (2021-present) and FMR Capital, Inc. (2017-present), is an employee of Fidelity Investments (2009-present), and has served in other fund officer roles. Prior to joining Fidelity Investments, Ms. Smith served as Senior Audit Manager of Ernst & Young LLP (accounting firm, 1996-2009). Previously, Ms. Smith served as Assistant Treasurer (2013-2019) and Deputy Treasurer (2013-2016) of certain Fidelity® funds.
Jim Wegmann (1979)
Year of Election or Appointment: 2019
Assistant Treasurer
Mr. Wegmann also serves as an officer of other funds. Mr. Wegmann serves as Assistant Treasurer of FIMM, LLC (2021-present) and is an employee of Fidelity Investments (2011-present). Previously, Mr. Wegmann served as Assistant Treasurer of certain Fidelity® funds (2019-2021).
Shareholder Expense Example
As a shareholder, you incur two types of costs: (1) transaction costs, which may include sales charges (loads) on purchase payments or redemption proceeds, as applicable and (2) ongoing costs, which generally include management fees, distribution and/or service (12b-1) fees and other Fund expenses. This Example is intended to help you understand your ongoing costs (in dollars) of investing in a fund and to compare these costs with the ongoing costs of investing in other mutual funds.
The Example is based on an investment of $1,000 invested at the beginning of the period and held for the entire period (February 1, 2022 to July 31, 2022).
Actual Expenses
The first line of the accompanying table provides information about actual account values and actual expenses. You may use the information in this line, together with the amount you invested, to estimate the expenses that you paid over the period. Simply divide your account value by $1,000.00 (for example, an $8,600 account value divided by $1,000.00 = 8.6), then multiply the result by the number in the first line for a class/Fund under the heading entitled "Expenses Paid During Period" to estimate the expenses you paid on your account during this period. If any fund is a shareholder of any underlying mutual funds or exchange-traded funds (ETFs) (the Underlying Funds), such fund indirectly bears its proportional share of the expenses of the Underlying Funds in addition to the direct expenses incurred presented in the table. These fees and expenses are not included in the annualized expense ratio used to calculate the expense estimate in the table below.
Hypothetical Example for Comparison Purposes
The second line of the accompanying table provides information about hypothetical account values and hypothetical expenses based on the actual expense ratio and an assumed rate of return of 5% per year before expenses, which is not the actual return. The hypothetical account values and expenses may not be used to estimate the actual ending account balance or expenses you paid for the period. You may use this information to compare the ongoing costs of investing in the Fund and other funds. To do so, compare this 5% hypothetical example with the 5% hypothetical examples that appear in the shareholder reports of the other funds. If any fund is a shareholder of any Underlying Funds, such fund indirectly bears its proportional share of the expenses of the Underlying Funds in addition to the direct expenses as presented in the table. These fees and expenses are not included in the annualized expense ratio used to calculate the expense estimate in the table below.
Please note that the expenses shown in the table are meant to highlight your ongoing costs only and do not reflect any transaction costs. Therefore, the second line of the table is useful in comparing ongoing costs only, and will not help you determine the relative total costs of owning different funds. In addition, if these transactional costs were included, your costs would have been higher.
| | Annualized Expense Ratio-A | Beginning
Account Value
February 1, 2022 | Ending
Account Value
July 31, 2022 | Expenses Paid
During Period-B
February 1, 2022
to July 31, 2022 |
| Fidelity Series Small Cap Opportunities Fund | - %-C | | | |
| Actual | | $1,000.00 | $928.40 | $--D |
| Hypothetical-E | | $1,000.00 | $1,024.79 | $--D |
A Annualized expense ratio reflects expenses net of applicable fee waivers.
B Expenses are equal to the annualized expense ratio, multiplied by the average account value over the period, multiplied by 181/ 365 (to reflect the one-half year period). The fees and expenses of any Underlying Funds are not included in each annualized expense ratio.
C Amount represents less than .005%
D Amount represents less than $.005
E 5% return per year before expenses
Distributions (Unaudited)
The dividend and capital gains distributions for the fund(s) are available on Fidelity.com or Institutional.Fidelity.com.
The fund hereby designates as a capital gain dividend with respect to the taxable year ended July 31, 2022, $276,833,780, or, if subsequently determined to be different, the net capital gain of such year.
The fund designates 3% and 52% of the dividends distributed in September and December, respectively during the fiscal year as qualifying for the dividends–received deduction for corporate shareholders.
The fund designates 3% and 57% of the dividends distributed in September and December, respectively during the fiscal year as amounts which may be taken into account as a dividend for the purposes of the maximum rate under section 1(h)(11) of the Internal Revenue Code.
The fund designates 1% and 9% of the dividends distributed in September and December, respectively during the fiscal year as a section 199A dividend.
The fund will notify shareholders in January 2023 of amounts for use in preparing 2022 income tax returns.
Board Approval of Investment Advisory Contracts and Management Fees
Fidelity Series Small Cap Opportunities Fund
Each year, the Board of Trustees, including the Independent Trustees (together, the Board), votes on the renewal of the management contract with Fidelity Management & Research Company LLC (FMR) and the sub-advisory agreements (together, the Advisory Contracts) for the fund. FMR and the sub-advisers are referred to herein as the Investment Advisers. The Board, assisted by the advice of fund counsel and Independent Trustees' counsel, requests and considers a broad range of information relevant to the renewal of the Advisory Contracts throughout the year.
The Board meets regularly and, at each of its meetings, covers an extensive agenda of topics and materials and considers factors that are relevant to its annual consideration of the renewal of the fund's Advisory Contracts, including the services and support provided to the fund and its shareholders. The Board has established various standing committees (Committees), each composed of and chaired by Independent Trustees with varying backgrounds, to which the Board has assigned specific subject matter responsibilities in order to enhance effective decision-making by the Board. The Board, acting directly and through its Committees, requests and receives information concerning the annual consideration of the renewal of the fund's Advisory Contracts. The Board also meets as needed to review matters specifically related to the Board's annual consideration of the renewal of the Advisory Contracts. Members of the Board may also meet with trustees of other Fidelity funds through joint ad hoc committees to discuss certain matters relevant to all of the Fidelity funds.
At its May 2022 meeting, the Board unanimously determined to renew the fund's Advisory Contracts. In considering whether to renew the Advisory Contracts for the fund, the Board considered all factors it believed relevant and reached a determination, with the assistance of fund counsel and Independent Trustees' counsel and through the exercise of its business judgment, that the renewal of the Advisory Contracts was in the best interests of the fund and its shareholders and the fact that no fee is payable under the management contract was fair and reasonable.
Nature, Extent, and Quality of Services Provided. The Board considered Fidelity's staffing as it relates to the fund, including the backgrounds of investment personnel of Fidelity, and also considered the fund's investment objective, strategies, and related investment philosophy. The Independent Trustees also had discussions with senior management of Fidelity's investment operations and investment groups. The Board considered the structure of the investment personnel compensation program and whether this structure provides appropriate incentives to act in the best interests of the fund. The Board also considered the steps Fidelity had taken to ensure the continued provision of high quality services to the Fidelity funds during the COVID-19 pandemic, including the expansion of staff in client facing positions to maintain service levels in periods of high volumes and volatility.
Resources Dedicated to Investment Management and Support Services. The Board and the Fund Oversight and Research Committees reviewed the general qualifications and capabilities of Fidelity's investment staff, including its size, education, experience, and resources, as well as Fidelity's approach to recruiting, training, managing, and compensating investment personnel. The Board noted the resources devoted to expansion of Fidelity's global investment organization, and that Fidelity's analysts have extensive resources, tools, and capabilities that allow them to conduct sophisticated quantitative and fundamental analysis, as well as credit analysis of issuers, counterparties, and guarantors. Further, the Board considered that Fidelity's investment professionals have sufficient access to global information and data so as to provide competitive investment results over time, and that those professionals also have access to sophisticated tools that permit them to assess portfolio construction and risk and performance attribution characteristics continuously, as well as to transmit new information and research conclusions rapidly around the world. Additionally, in its deliberations, the Board considered Fidelity's trading, risk management, compliance, and technology and operations capabilities and resources, which are integral parts of the investment management process.
Administrative Services. The Board considered (i) the nature, extent, quality, and cost of advisory and administrative services performed by the Investment Advisers and their affiliates under the Advisory Contracts and under separate agreements covering transfer agency, pricing and bookkeeping, and securities lending services for the fund; (ii) the nature and extent of the supervision of third party service providers, principally custodians, subcustodians, and pricing vendors; and (iii) the resources devoted to, and the record of compliance with, the fund's compliance policies and procedures. The Board also reviewed the allocation of fund brokerage, including allocations to brokers affiliated with the Investment Advisers, the use of brokerage commissions to pay fund expenses, and the use of "soft" commission dollars to pay for research services.
Investment Performance. The Board considered whether the fund has operated in accordance with its investment objective, as well as its record of compliance with its investment restrictions. The Board reviewed the fund's absolute investment performance, as well as the fund's relative investment performance, but did not consider performance to be a material factor in its decision to renew the fund's Advisory Contracts, as the fund is not publicly offered as a stand-alone investment product. In this regard, the Board noted that the fund is designed to offer an investment option for other investment companies, 529 plans, and collective investment trusts managed by Fidelity and ultimately to enhance the performance of those investment companies, 529 plans, and collective investment trusts. The Board noted that there was a portfolio management change for the fund in November 2021. The Board will continue to monitor closely the fund's performance, taking into account the portfolio management change.
Based on its review, the Board concluded that the nature, extent, and quality of services provided to the fund under the Advisory Contracts should continue to benefit the shareholders of the fund.
Competitiveness of Management Fee and Total Expense Ratio. The Board considered that the fund does not pay FMR a management fee for investment advisory services, but that FMR receives fees for providing services to funds that invest in the fund. The Board noted that FMR or an affiliate undertakes to pay all operating expenses of the fund, except transfer agent fees, 12b-1 fees, Independent Trustee fees and expenses, custodian fees and expenses, proxy and shareholder meeting expenses, interest, taxes, and extraordinary expenses (such as litigation expenses). The Board further noted that the fund pays its non-operating expenses, including brokerage commissions and fees and expenses associated with the fund's securities lending program, if applicable.
The Board further considered that FMR has contractually agreed to reimburse the fund to the extent that total operating expenses, with certain exceptions, as a percentage of its average net assets, exceed 0.003% through November 30, 2024.
Based on its review, the Board considered that the fund does not pay a management fee and concluded that the total expense ratio of the fund was reasonable in light of the services that the fund and its shareholders receive and the other factors considered.
Costs of the Services and Profitability. The Board considered the level of Fidelity's profits in respect of all the Fidelity funds.
A public accounting firm has been engaged annually by the Board as part of the Board's assessment of Fidelity's profitability analysis. The engagement includes the review and assessment of the methodologies used by Fidelity in determining the revenues and expenses attributable to Fidelity's mutual fund business, and completion of agreed-upon procedures in respect of the mathematical accuracy of certain fund profitability information and its conformity to established allocation methodologies. After considering the reports issued under the engagement and information provided by Fidelity, the Board concluded that while other allocation methods may also be reasonable, Fidelity's profitability methodologies are reasonable in all material respects.
The Board also reviewed Fidelity's non-fund businesses and potential indirect benefits such businesses may have received as a result of their association with Fidelity's mutual fund business (i.e., fall-out benefits) as well as cases where Fidelity's affiliates may benefit from the funds' business. The Board considered areas where potential indirect benefits to the Fidelity funds from their relationships with Fidelity may exist. The Board's consideration of these matters was informed by the findings of a joint ad hoc committee created by it and the boards of other Fidelity funds to evaluate potential fall-out benefits.
The Board concluded that the costs of the services provided by and the profits realized by Fidelity in connection with the operation of the fund were not relevant to the renewal of the Advisory Contracts because the fund pays no advisory fees and FMR bears all expenses of the fund with certain exceptions.
Economies of Scale. The Board concluded that because the fund pays no advisory fees and FMR bears all expenses of the fund with certain exceptions, the realization of economies of scale was not a material factor in the Board's decision to renew the fund's Advisory Contracts.
Additional Information Requested by the Board. In order to develop fully the factual basis for consideration of the Fidelity funds' advisory contracts, the Board requested and received additional information on certain topics, including: (i) fund flow and performance trends, in particular the underperformance of certain funds and strategies, and Fidelity's long-term strategies for certain funds, including any consideration of fund liquidations or mergers; (ii) the operation of performance fees, competitor use of performance fees, and consideration of the expansion of performance fees to additional funds; (iii) Fidelity's pricing philosophy compared to competitors; (iv) fund profitability methodology and data; (v) evaluation of competitive fund data and peer group classifications and fee and expense comparisons; (vi) the management fee and expense structures for different funds and classes and information about the differences between various fee and expense structures; (vii) group fee breakpoints and related voluntary fee waivers; and (viii) information regarding other accounts managed by Fidelity and the funds' sub-advisory arrangements.
Based on its evaluation of all of the conclusions noted above, and after considering all factors it believed relevant, the Board concluded that the advisory fee arrangements are fair and reasonable and that the fund's Advisory Contracts should be renewed.
Liquidity Risk Management Program
The Securities and Exchange Commission adopted Rule 22e-4 under the Investment Company Act of 1940 (the Liquidity Rule) to promote effective liquidity risk management throughout the open-end investment company industry, thereby reducing the risk that funds will be unable to meet their redemption obligations and mitigating dilution of the interests of fund shareholders.
The Fund has adopted and implemented a liquidity risk management program pursuant to the Liquidity Rule (the Program) effective December 1, 2018. The Program is reasonably designed to assess and manage the Fund’s liquidity risk and to comply with the requirements of the Liquidity Rule. The Fund’s Board of Trustees (the Board) has designated the Fund’s investment adviser as administrator of the Program. The Fidelity advisers have established a Liquidity Risk Management Committee (the LRM Committee) to manage the Program for each of the Fidelity Funds. The LRM Committee monitors the adequacy and effectiveness of implementation of the Program and on a periodic basis assesses each Fund’s liquidity risk based on a variety of factors including (1) the Fund’s investment strategy, (2) portfolio liquidity and cash flow projections during normal and reasonably foreseeable stressed conditions, (3) shareholder redemptions, (4) borrowings and other funding sources and (5) in the case of exchange-traded funds, certain additional factors including the effect of the Fund’s prices and spreads, market participants, and basket compositions on the overall liquidity of the Fund’s portfolio, as applicable.
In accordance with the Program, each of the Fund’s portfolio investments is classified into one of four liquidity categories described below based on a determination of a reasonable expectation for how long it would take to convert the investment to cash (or sell or dispose of the investment) without significantly changing its market value.
- Highly liquid investments – cash or convertible to cash within three business days or less
- Moderately liquid investments – convertible to cash in three to seven calendar days
- Less liquid investments – can be sold or disposed of, but not settled, within seven calendar days
- Illiquid investments – cannot be sold or disposed of within seven calendar days
Liquidity classification determinations take into account a variety of factors including various market, trading and investment-specific considerations, as well as market depth, and generally utilize analysis from a third-party liquidity metrics service.
The Liquidity Rule places a 15% limit on a fund’s illiquid investments and requires funds that do not primarily hold assets that are highly liquid investments to determine and maintain a minimum percentage of the fund’s net assets to be invested in highly liquid investments (highly liquid investment minimum or HLIM). The Program includes provisions reasonably designed to comply with the 15% limit on illiquid investments and for determining, periodically reviewing and complying with the HLIM requirement as applicable.
At a recent meeting of the Fund’s Board of Trustees, the LRM Committee provided a written report to the Board pertaining to the operation, adequacy, and effectiveness of implementation of the Program for the annual period from December 1, 2020 through November 30, 2021. The report concluded that the Program has been implemented and is operating effectively and is reasonably designed to assess and manage the Fund’s liquidity risk.
SMO-ANN-0922
1.839807.115
Item 2.
Code of Ethics
As of the end of the period, July 31, 2022, Fidelity Securities Fund (the trust) has adopted a code of ethics, as defined in Item 2 of Form N-CSR, that applies to its President and Treasurer and its Chief Financial Officer. A copy of the code of ethics is filed as an exhibit to this Form N-CSR.
Item 3.
Audit Committee Financial Expert
The Board of Trustees of the trust has determined that Donald F. Donahue is an audit committee financial expert, as defined in Item 3 of Form N-CSR. Mr. Donahue is independent for purposes of Item 3 of Form N-CSR.
Item 4.
Principal Accountant Fees and Services
Fees and Services
The following table presents fees billed by Deloitte & Touche LLP, the member firms of Deloitte Touche Tohmatsu, and their respective affiliates (collectively, “Deloitte Entities”) in each of the last two fiscal years for services rendered to Fidelity Blue Chip Growth Fund, Fidelity Blue Chip Growth K6 Fund, Fidelity OTC K6 Portfolio, Fidelity OTC Portfolio, Fidelity Real Estate Income Fund, Fidelity Series Blue Chip Growth Fund, Fidelity Series Real Estate Income Fund and Fidelity Series Small Cap Opportunities Fund (the “Funds”):
Services Billed by Deloitte Entities
July 31, 2022 FeesA
| | | | |
| Audit Fees | Audit-Related Fees | Tax Fees | All Other Fees |
Fidelity Blue Chip Growth Fund | $81,900 | $- | $9,400 | $1,500 |
Fidelity Blue Chip Growth K6 Fund | $55,900 | $- | $5,900 | $1,000 |
Fidelity OTC K6 Portfolio | $75,300 | $- | $8,700 | $1,400 |
Fidelity OTC Portfolio | $82,100 | $- | $10,500 | $1,500 |
Fidelity Real Estate Income Fund | $81,500 | $- | $9,300 | $1,800 |
Fidelity Series Blue Chip Growth Fund | $64,900 | $- | $7,600 | $1,400 |
Fidelity Series Real Estate Income Fund | $71,600 | $- | $8,600 | $1,600 |
Fidelity Series Small Cap Opportunities Fund | $39,100 | $- | $7,600 | $900 |
| | | | |
| Audit Fees | Audit-Related Fees | Tax Fees | All Other Fees |
Fidelity Blue Chip Growth Fund | $65,900 | $- | $20,900 | $1,500 |
Fidelity Blue Chip Growth K6 Fund | $44,000 | $- | $14,600 | $1,000 |
Fidelity OTC K6 Portfolio | $61,400 | $- | $37,500 | $1,500 |
Fidelity OTC Portfolio | $62,600 | $- | $41,100 | $1,500 |
Fidelity Real Estate Income Fund | $80,200 | $- | $10,400 | $1,900 |
Fidelity Series Blue Chip Growth Fund | $63,700 | $- | $9,200 | $1,500 |
Fidelity Series Real Estate Income Fund | $70,100 | $- | $10,400 | $1,700 |
Fidelity Series Small Cap Opportunities Fund | $38,800 | $- | $9,000 | $1,000 |
A Amounts may reflect rounding.
The following table presents fees billed by PricewaterhouseCoopers LLP (“PwC”) in each of the last two fiscal years for services rendered to Fidelity Blue Chip Value Fund, Fidelity Dividend Growth Fund, Fidelity Growth & Income Portfolio, Fidelity Leveraged Company Stock Fund, Fidelity Small Cap Growth Fund, Fidelity Small Cap Growth K6 Fund and Fidelity Small Cap Value Fund (the “Funds”):
Services Billed by PwC
July 31, 2022 FeesA
| | | | |
| Audit Fees | Audit-Related Fees | Tax Fees | All Other Fees |
Fidelity Blue Chip Value Fund | $42,400 | $3,900 | $8,300 | $1,300 |
Fidelity Dividend Growth Fund | $50,700 | $4,500 | $9,100 | $1,500 |
Fidelity Growth & Income Portfolio | $57,400 | $5,200 | $10,700 | $1,700 |
Fidelity Leveraged Company Stock Fund | $42,400 | $4,100 | $10,600 | $1,400 |
Fidelity Small Cap Growth Fund | $43,100 | $3,900 | $10,800 | $1,300 |
Fidelity Small Cap Growth K6 Fund | $38,600 | $3,600 | $8,100 | $1,200 |
Fidelity Small Cap Value Fund | $43,800 | $4,000 | $9,100 | $1,300 |
| | | | |
| Audit Fees | Audit-Related Fees | Tax Fees | All Other Fees |
Fidelity Blue Chip Value Fund | $41,300 | $4,000 | $8,100 | $1,400 |
Fidelity Dividend Growth Fund | $49,300 | $4,600 | $8,100 | $1,700 |
Fidelity Growth & Income Portfolio | $55,800 | $5,300 | $10,200 | $1,900 |
Fidelity Leveraged Company Stock Fund | $41,200 | $4,200 | $10,300 | $1,500 |
Fidelity Small Cap Growth Fund | $49,300 | $4,000 | $8,100 | $1,400 |
Fidelity Small Cap Growth K6 Fund | $41,100 | $3,700 | $7,900 | $1,300 |
Fidelity Small Cap Value Fund | $42,600 | $4,100 | $8,300 | $1,500 |
A Amounts may reflect rounding.
The following table(s) present(s) fees billed by Deloitte Entities and PwC that were required to be approved by the Audit Committee for services that relate directly to the operations and financial reporting of the Fund(s) and that are rendered on behalf of Fidelity Management & Research Company LLC ("FMR") and entities controlling, controlled by, or under common control with FMR (not including any sub-adviser whose role is primarily portfolio management and is subcontracted with or overseen by another investment adviser) that provide ongoing services to the Fund(s) (“Fund Service Providers”):
Services Billed by Deloitte Entities
| | |
| July 31, 2022A | July 31, 2021A |
Audit-Related Fees | $- | $- |
Tax Fees | $- | $- |
All Other Fees | $- | $- |
A Amounts may reflect rounding.
Services Billed by PwC
| | |
| July 31, 2022A | July 31, 2021A |
Audit-Related Fees | $7,914,600 | $8,959,700 |
Tax Fees | $353,200 | $11,200 |
All Other Fees | $- | $- |
A Amounts may reflect rounding.
“Audit-Related Fees” represent fees billed for assurance and related services that are reasonably related to the performance of the fund audit or the review of the fund's financial statements and that are not reported under Audit Fees.
“Tax Fees” represent fees billed for tax compliance, tax advice or tax planning that relate directly to the operations and financial reporting of the fund.
“All Other Fees” represent fees billed for services provided to the fund or Fund Service Provider, a significant portion of which are assurance related, that relate directly to the operations and financial reporting of the fund, excluding those services that are reported under Audit Fees, Audit-Related Fees or Tax Fees.
Assurance services must be performed by an independent public accountant.
* * *
The aggregate non-audit fees billed by Deloitte Entities and PwC for services rendered to the Fund(s), FMR (not including any sub-adviser whose role is primarily portfolio management and is subcontracted with or overseen by another investment adviser), and any Fund Service Provider for each of the last two fiscal years of the Fund(s) are as follows:
| | |
Billed By | July 31, 2022A | July 31, 2021A |
Deloitte Entities | $542,900 | 692,600 |
PwC | $13,340,800 | $14,375,200 |
A Amounts may reflect rounding.
The trust's Audit Committee has considered non-audit services that were not pre-approved that were provided by Deloitte Entities and PwC to Fund Service Providers to be compatible with maintaining the independence of Deloitte Entities and PwC in its(their) audit of the Fund(s), taking into account representations from Deloitte Entities and PwC, in accordance with Public Company Accounting Oversight Board rules, regarding its independence from the Fund(s) and its(their) related entities and FMR’s review of the appropriateness and permissibility under applicable law of such non-audit services prior to their provision to the Fund(s) Service Providers.
Audit Committee Pre-Approval Policies and Procedures
The trust’s Audit Committee must pre-approve all audit and non-audit services provided by a fund’s independent registered public accounting firm relating to the operations or financial reporting of the fund. Prior to the commencement of any audit or non-audit services to a fund, the Audit Committee reviews the services to determine whether they are appropriate and permissible under applicable law.
The Audit Committee has adopted policies and procedures to, among other purposes, provide a framework for the Committee’s consideration of non-audit services by the audit firms that audit the Fidelity funds. The policies and procedures require that any non-audit service provided by a fund audit firm to a Fidelity fund and any non-audit service provided by a fund auditor to a Fund Service Provider that relates directly to the operations and financial reporting of a Fidelity fund (“Covered Service”) are subject to approval by the Audit Committee before such service is provided.
All Covered Services must be approved in advance of provision of the service either: (i) by formal resolution of the Audit Committee, or (ii) by oral or written approval of the service by the Chair of the Audit Committee (or if the Chair is unavailable, such other member of the Audit Committee as may be designated by the Chair to act in the Chair’s absence). The approval contemplated by (ii) above is permitted where the Treasurer determines that action on such an engagement is necessary before the next meeting of the Audit Committee.
Non-audit services provided by a fund audit firm to a Fund Service Provider that do not relate directly to the operations and financial reporting of a Fidelity fund are reported to the Audit Committee periodically.
Non-Audit Services Approved Pursuant to Rule 2-01(c)(7)(i)(C) and (ii) of Regulation S-X (“De Minimis Exception”)
There were no non-audit services approved or required to be approved by the Audit Committee pursuant to the De Minimis Exception during the Fund’s(s’) last two fiscal years relating to services provided to (i) the Fund(s) or (ii) any Fund Service Provider that relate directly to the operations and financial reporting of the Fund(s).
Item 5.
Audit Committee of Listed Registrants
Not applicable.
Item 6.
Investments
(a)
Not applicable.
(b)
Not applicable.
Item 7.
Disclosure of Proxy Voting Policies and Procedures for Closed-End Management Investment Companies
Not applicable.
Item 8.
Portfolio Managers of Closed-End Management Investment Companies
Not applicable.
Item 9.
Purchase of Equity Securities by Closed-End Management Investment Company and Affiliated Purchasers
Not applicable.
Item 10.
Submission of Matters to a Vote of Security Holders
There were no material changes to the procedures by which shareholders may recommend nominees to the trust’s Board of Trustees.
Item 11.
Controls and Procedures
(a)(i) The President and Treasurer and the Chief Financial Officer have concluded that the trust’s disclosure controls and procedures (as defined in Rule 30a-3(c) under the Investment Company Act) provide reasonable assurances that material information relating to the trust is made known to them by the appropriate persons, based on their evaluation of these controls and procedures as of a date within 90 days of the filing date of this report.
(a)(ii) There was no change in the trust’s internal control over financial reporting (as defined in Rule 30a-3(d) under the Investment Company Act) that occurred during the period covered by this report that has materially affected, or is reasonably likely to materially affect, the trust’s internal control over financial reporting.
Item 12.
Disclosure of Securities Lending Activities for Closed-End Management
Investment Companies
Not applicable.
Item 13.
Exhibits
SIGNATURES
Pursuant to the requirements of the Securities Exchange Act of 1934 and the Investment Company Act of 1940, the registrant has duly caused this report to be signed on its behalf by the undersigned, thereunto duly authorized.
Fidelity Securities Fund
| |
By: | /s/Stacie M. Smith |
| Stacie M. Smith |
| President and Treasurer |
|
|
Date: | September 21, 2022 |
Pursuant to the requirements of the Securities Exchange Act of 1934 and the Investment Company Act of 1940, this report has been signed below by the following persons on behalf of the registrant and in the capacities and on the dates indicated.
| |
By: | /s/Stacie M. Smith |
| Stacie M. Smith |
| President and Treasurer |
|
|
Date: | September 21, 2022 |
| |
By: | /s/John J. Burke III |
| John J. Burke III |
| Chief Financial Officer |
|
|
Date: | September 21, 2022 |