UNITED STATES
SECURITIES AND EXCHANGE COMMISSION
Washington, D.C. 20549
FORM N-CSR
CERTIFIED SHAREHOLDER REPORT OF REGISTERED
MANAGEMENT INVESTMENT COMPANIES
Investment Company Act file number 811-04118
Fidelity Securities Fund
(Exact name of registrant as specified in charter)
245 Summer St., Boston, Massachusetts 02210
(Address of principal executive offices) (Zip code)
Cynthia Lo Bessette, Secretary
245 Summer St.
Boston, Massachusetts 02210
(Name and address of agent for service)
Registrant's telephone number, including area code:
617-563-7000
| |
Date of fiscal year end: | July 31 |
|
|
Date of reporting period: | July 31, 2020 |
Item 1.
Reports to Stockholders
Fidelity® OTC Portfolio
Annual Report
July 31, 2020

See the inside front cover for important information about access to your fund’s shareholder reports.

Beginning on January 1, 2021, as permitted by regulations adopted by the Securities and Exchange Commission, paper copies of a fund’s shareholder reports will no longer be sent by mail, unless you specifically request paper copies of the reports from the fund or from your financial intermediary, such as a financial advisor, broker-dealer or bank. Instead, the reports will be made available on a website, and you will be notified by mail each time a report is posted and provided with a website link to access the report.
If you already elected to receive shareholder reports electronically, you will not be affected by this change and you need not take any action. You may elect to receive shareholder reports and other communications from a fund electronically, by contacting your financial intermediary. For Fidelity customers, visit Fidelity's web site or call Fidelity using the contact information listed below.
You may elect to receive all future reports in paper free of charge. If you wish to continue receiving paper copies of your shareholder reports, you may contact your financial intermediary or, if you are a Fidelity customer, visit Fidelity’s website, or call Fidelity at the applicable toll-free number listed below. Your election to receive reports in paper will apply to all funds held with the fund complex/your financial intermediary.
| Account Type | Website | Phone Number |
| Brokerage, Mutual Fund, or Annuity Contracts: | fidelity.com/mailpreferences | 1-800-343-3548 |
| Employer Provided Retirement Accounts: | netbenefits.fidelity.com/preferences (choose 'no' under Required Disclosures to continue to print) | 1-800-343-0860 |
| Advisor Sold Accounts Serviced Through Your Financial Intermediary: | Contact Your Financial Intermediary | Your Financial Intermediary's phone number |
| Advisor Sold Accounts Serviced by Fidelity: | institutional.fidelity.com | 1-877-208-0098 |
Contents
To view a fund's proxy voting guidelines and proxy voting record for the 12-month period ended June 30, visit http://www.fidelity.com/proxyvotingresults or visit the Securities and Exchange Commission's (SEC) web site at http://www.sec.gov.
You may also call 1-800-544-8544 if you’re an individual investing directly with Fidelity, call 1-800-835-5092 if you’re a plan sponsor or participant with Fidelity as your recordkeeper or call 1-877-208-0098 on institutional accounts or if you’re an advisor or invest through one to request a free copy of the proxy voting guidelines.
Standard & Poor's, S&P and S&P 500 are registered service marks of The McGraw-Hill Companies, Inc. and have been licensed for use by Fidelity Distributors Corporation.
Other third-party marks appearing herein are the property of their respective owners.
All other marks appearing herein are registered or unregistered trademarks or service marks of FMR LLC or an affiliated company. © 2020 FMR LLC. All rights reserved.
This report and the financial statements contained herein are submitted for the general information of the shareholders of the Fund. This report is not authorized for distribution to prospective investors in the Fund unless preceded or accompanied by an effective prospectus.
A fund files its complete schedule of portfolio holdings with the SEC for the first and third quarters of each fiscal year on Form N-PORT. Forms N-PORT are available on the SEC’s web site at http://www.sec.gov. A fund's Forms N-PORT may be reviewed and copied at the SEC’s Public Reference Room in Washington, DC. Information regarding the operation of the SEC's Public Reference Room may be obtained by calling 1-800-SEC-0330.
For a complete list of a fund's portfolio holdings, view the most recent holdings listing, semiannual report, or annual report on Fidelity's web site at http://www.fidelity.com, http://www.institutional.fidelity.com, or http://www.401k.com, as applicable.
NOT FDIC INSURED •MAY LOSE VALUE •NO BANK GUARANTEE
Neither the Fund nor Fidelity Distributors Corporation is a bank.
Note to Shareholders:
Early in 2020, the outbreak and spread of a new coronavirus emerged as a public health emergency that had a major influence on financial markets, primarily based on its impact on the global economy and the outlook for corporate earnings. The virus causes a respiratory disease known as COVID-19. On March 11, the World Health Organization declared the COVID-19 outbreak a pandemic, citing sustained risk of further global spread.
In the weeks following, as the crisis worsened, we witnessed an escalating human tragedy with wide-scale social and economic consequences from coronavirus-containment measures. The outbreak of COVID-19 prompted a number of measures to limit the spread, including travel and border restrictions, quarantines, and restrictions on large gatherings. In turn, these resulted in lower consumer activity, diminished demand for a wide range of products and services, disruption in manufacturing and supply chains, and – given the wide variability in outcomes regarding the outbreak – significant market uncertainty and volatility. Amid the turmoil, the U.S. government took unprecedented action – in concert with the U.S. Federal Reserve and central banks around the world – to help support consumers, businesses, and the broader economy, and to limit disruption to the financial system.
The situation continues to unfold, and the extent and duration of its impact on financial markets and the economy remain highly uncertain. Extreme events such as the coronavirus crisis are “exogenous shocks” that can have significant adverse effects on mutual funds and their investments. Although multiple asset classes may be affected by market disruption, the duration and impact may not be the same for all types of assets.
Fidelity is committed to helping you stay informed amid news about COVID-19 and during increased market volatility, and we’re taking extra steps to be responsive to customer needs. We encourage you to visit our websites, where we offer ongoing updates, commentary, and analysis on the markets and our funds.
Performance: The Bottom Line
Average annual total return reflects the change in the value of an investment, assuming reinvestment of distributions from dividend income and capital gains (the profits earned upon the sale of securities that have grown in value, if any) and assuming a constant rate of performance each year. The hypothetical investment and the average annual total returns do not reflect the deduction of taxes that a shareholder would pay on fund distributions or the redemption of fund shares. During periods of reimbursement by Fidelity, a fund’s total return will be greater than it would be had the reimbursement not occurred. How a fund did yesterday is no guarantee of how it will do tomorrow.
Average Annual Total Returns
| For the periods ended July 31, 2020 | Past 1 year | Past 5 years | Past 10 years |
| Fidelity® OTC Portfolio | 35.79% | 18.98% | 19.66% |
| Class K | 35.94% | 19.10% | 19.80% |
$10,000 Over 10 Years
Let's say hypothetically that $10,000 was invested in Fidelity® OTC Portfolio, a class of the fund, on July 31, 2010.
The chart shows how the value of your investment would have changed, and also shows how the Nasdaq Composite Index® performed over the same period.
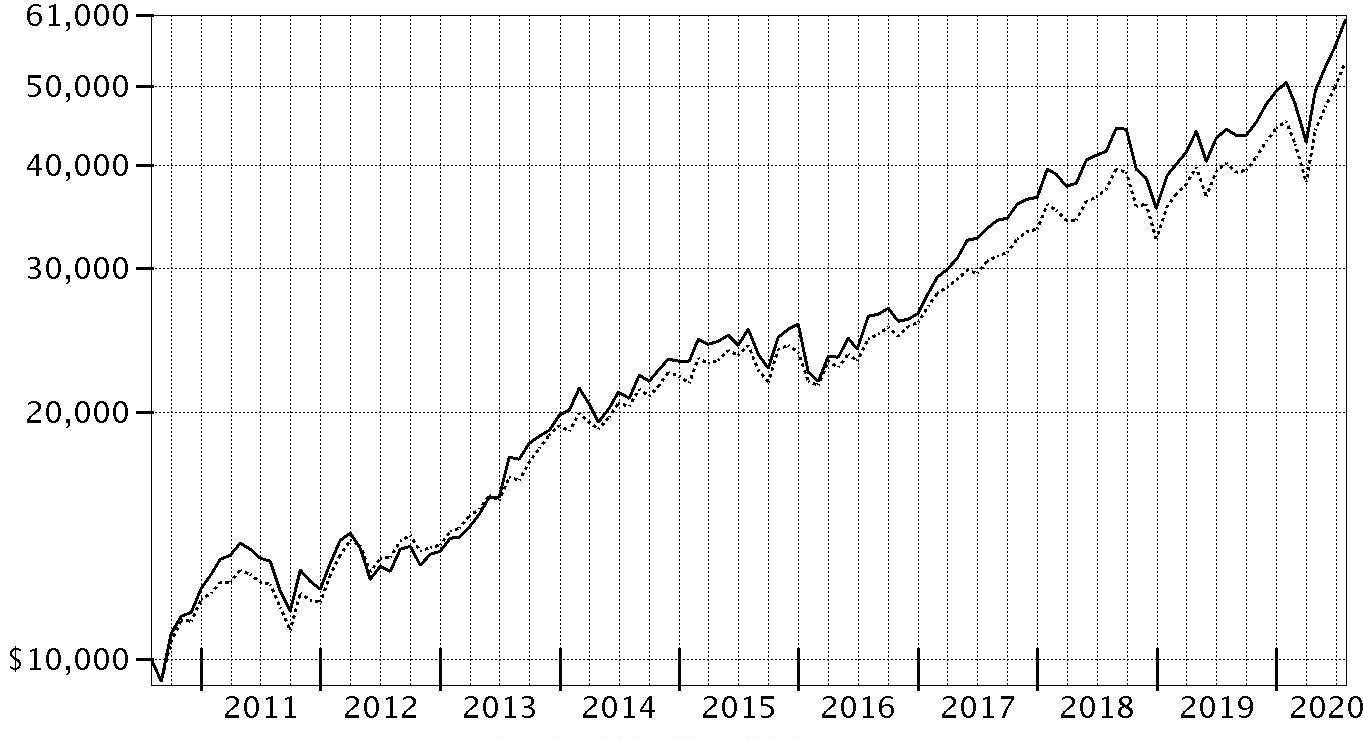
| Period Ending Values |
| $60,179 | Fidelity® OTC Portfolio |
| $53,433 | Nasdaq Composite Index® |
Management's Discussion of Fund Performance
Market Recap: The S&P 500
® index gained 11.96% for the 12 months ending July 31, 2020, in what was a bumpy ride for U.S. equity investors, marked by a steep but brief decline due to the early-2020 outbreak and spread of the coronavirus, followed by a historic rebound. Declared a pandemic on March 11, the COVID-19 crisis and containment efforts caused broad contraction in economic activity, along with extreme uncertainty, volatility and dislocation in financial markets. By mid-March, U.S. stocks entered bear-market territory less than a month after hitting an all-time high and extending the longest-running bull market in American history. Stocks slid in late February, after a surge in COVID-19 cases outside China. The sudden downtrend continued in March (-12%), capping the index’s worst quarter since 2008. A historically rapid and expansive U.S. monetary/fiscal-policy response provided a partial offset to the economic disruption and fueled a sharp uptrend. Aggressive support for financial markets by the U.S. Federal Reserve, plans for reopening the economy and improving infection data boosted stocks in April (+13%) and May (+5%). In June and July, the index gained amid progress on potential treatments and signs of an early recovery in economic activity. For the full 12 months, growth stocks widely topped value, while large-caps handily bested smaller-caps. The information technology sector (+39%) led the way, followed by consumer discretionary (+22%). In contrast, energy (-38%) fell hard along with the price of crude oil.
Comments from Portfolio Manager Christopher Lin: For the fiscal year ending July 31, 2020, the fund's Retail Class shares gained 35.79%, outperforming the 32.78% advance of the benchmark NASDAQ Composite Index. The primary contributor to performance versus the benchmark was security selection in information technology. An underweighting and stock picking in financials also boosted the fund's relative result. Adding further value was security selection in the communication services sector, especially within the media & entertainment industry. The fund's top individual relative contributor was an out-of-benchmark stake in Shopify (+225%). We reduced this position the past year. Also lifting performance was our lighter-than-benchmark stake in Intel, which returned -4%. We also decreased this holding the past 12 months. The fund's non-benchmark position in Meituan Dianping, a position not held at period end, gained roughly 205%. Conversely, the primary detractor from performance versus the benchmark was stock selection in consumer discretionary. Weak picks in the health care sector, especially within the pharmaceuticals, biotechnology & life sciences industry, also hindered performance. Also detracting from the fund's relative result was stock picking in the industrials sector, primarily within the transportation industry. The biggest individual relative detractor was an underweight position in PayPal (+73%). This period we reduced our PayPal stake. Also weighing on performance versus the benchmark was an outsized stake in Lyft (-45%), as well as an underweighting in Amazon.com (+69%). Nevertheless, the latter was among our largest holdings at period end.
The views expressed above reflect those of the portfolio manager(s) only through the end of the period as stated on the cover of this report and do not necessarily represent the views of Fidelity or any other person in the Fidelity organization. Any such views are subject to change at any time based upon market or other conditions and Fidelity disclaims any responsibility to update such views. These views may not be relied on as investment advice and, because investment decisions for a Fidelity fund are based on numerous factors, may not be relied on as an indication of trading intent on behalf of any Fidelity fund.
Investment Summary (Unaudited)
Top Ten Stocks as of July 31, 2020
| | % of fund's net assets |
| Apple, Inc. | 11.0 |
| Microsoft Corp. | 10.4 |
| Amazon.com, Inc. | 10.1 |
| Alphabet, Inc. Class A | 5.4 |
| Facebook, Inc. Class A | 5.1 |
| Alphabet, Inc. Class C | 2.3 |
| Tesla, Inc. | 2.1 |
| NVIDIA Corp. | 1.7 |
| Reliance Industries Ltd. | 1.7 |
| Starbucks Corp. | 1.5 |
| | 51.3 |
Top Five Market Sectors as of July 31, 2020
| | % of fund's net assets |
| Information Technology | 39.2 |
| Consumer Discretionary | 22.4 |
| Communication Services | 19.4 |
| Health Care | 8.1 |
| Industrials | 2.7 |
Asset Allocation (% of fund's net assets)
| As of July 31, 2020* |
| | Stocks | 98.5% |
| | Convertible Securities | 1.3% |
| | Short-Term Investments and Net Other Assets (Liabilities) | 0.2% |

* Foreign investments - 12.5%
Schedule of Investments July 31, 2020
Showing Percentage of Net Assets
| Common Stocks - 98.4% | | | |
| | | Shares | Value (000s) |
| COMMUNICATION SERVICES - 19.4% | | | |
| Entertainment - 2.2% | | | |
| Activision Blizzard, Inc. | | 2,877,771 | $237,790 |
| Electronic Arts, Inc. (a) | | 2,464 | 349 |
| NetEase, Inc. ADR | | 58,256 | 26,706 |
| Netflix, Inc. (a) | | 115,085 | 56,263 |
| Take-Two Interactive Software, Inc. (a) | | 462,161 | 75,804 |
| The Walt Disney Co. | | 914,605 | 106,954 |
| Zynga, Inc. (a) | | 2,211,115 | 21,735 |
| | | | 525,601 |
| Interactive Media & Services - 16.3% | | | |
| 58.com, Inc. ADR (a) | | 10,710 | 593 |
| Alphabet, Inc.: | | | |
| Class A (a) | | 858,394 | 1,277,247 |
| Class C (a) | | 363,518 | 539,083 |
| Eventbrite, Inc. (a) | | 23,904 | 204 |
| Facebook, Inc. Class A (a) | | 4,844,534 | 1,228,913 |
| InterActiveCorp (a) | | 183,727 | 24,329 |
| Match Group, Inc. (a)(b) | | 1,392,591 | 143,019 |
| Tencent Holdings Ltd. sponsored ADR | | 4,260,465 | 291,799 |
| Twitter, Inc. (a) | | 6,444,186 | 234,568 |
| Yandex NV Series A (a) | | 2,480,354 | 142,720 |
| | | | 3,882,475 |
| Media - 0.6% | | | |
| Charter Communications, Inc. Class A (a)(b) | | 263,908 | 153,067 |
| Wireless Telecommunication Services - 0.3% | | | |
| T-Mobile U.S., Inc. | | 774,677 | 83,185 |
|
| TOTAL COMMUNICATION SERVICES | | | 4,644,328 |
|
| CONSUMER DISCRETIONARY - 21.8% | | | |
| Automobiles - 2.1% | | | |
| Tesla, Inc. (a) | | 351,063 | 502,287 |
| Hotels, Restaurants & Leisure - 3.0% | | | |
| Caesars Entertainment, Inc. (a) | | 606,566 | 18,834 |
| Extended Stay America, Inc. unit | | 5,385,682 | 61,451 |
| Hilton Worldwide Holdings, Inc. | | 1,285,279 | 96,460 |
| Marriott International, Inc. Class A | | 2,192,670 | 183,801 |
| Starbucks Corp. | | 4,712,314 | 360,633 |
| | | | 721,179 |
| Household Durables - 0.9% | | | |
| Lennar Corp. Class A | | 2,821,292 | 204,120 |
| Internet & Direct Marketing Retail - 11.9% | | | |
| Alibaba Group Holding Ltd. sponsored ADR (a) | | 668,300 | 167,757 |
| Amazon.com, Inc. (a) | | 764,142 | 2,418,265 |
| Expedia, Inc. | | 802,244 | 64,990 |
| MercadoLibre, Inc. (a) | | 28,601 | 32,165 |
| The Booking Holdings, Inc. (a) | | 88,033 | 146,322 |
| | | | 2,829,499 |
| Multiline Retail - 0.7% | | | |
| Dollar Tree, Inc. (a) | | 1,900,267 | 177,390 |
| Specialty Retail - 1.5% | | | |
| Burlington Stores, Inc. (a) | | 74,623 | 14,029 |
| Five Below, Inc. (a) | | 1,239,666 | 135,012 |
| Lowe's Companies, Inc. | | 1,241,759 | 184,910 |
| The Home Depot, Inc. | | 90,300 | 23,974 |
| | | | 357,925 |
| Textiles, Apparel & Luxury Goods - 1.7% | | | |
| Kontoor Brands, Inc. | | 6,173 | 118 |
| lululemon athletica, Inc. (a) | | 1,059,329 | 344,907 |
| LVMH Moet Hennessy Louis Vuitton SE | | 139,358 | 60,599 |
| | | | 405,624 |
|
| TOTAL CONSUMER DISCRETIONARY | | | 5,198,024 |
|
| CONSUMER STAPLES - 2.1% | | | |
| Beverages - 1.6% | | | |
| Diageo PLC | | 3,403,546 | 124,538 |
| Kweichow Moutai Co. Ltd. (A Shares) | | 113,175 | 27,229 |
| Monster Beverage Corp. (a) | | 2,081,382 | 163,347 |
| PepsiCo, Inc. | | 410,304 | 56,482 |
| | | | 371,596 |
| Food & Staples Retailing - 0.4% | | | |
| Costco Wholesale Corp. | | 330,411 | 107,559 |
| Food Products - 0.1% | | | |
| Lamb Weston Holdings, Inc. | | 169,100 | 10,160 |
| Mondelez International, Inc. | | 331,970 | 18,421 |
| | | | 28,581 |
|
| TOTAL CONSUMER STAPLES | | | 507,736 |
|
| ENERGY - 2.2% | | | |
| Oil, Gas & Consumable Fuels - 2.2% | | | |
| Cenovus Energy, Inc. (Canada) | | 175,291 | 780 |
| Centennial Resource Development, Inc. Class A (a) | | 942,824 | 742 |
| EOG Resources, Inc. | | 14,535 | 681 |
| Reliance Industries Ltd. | | 14,972,173 | 413,094 |
| Reliance Industries Ltd. (a) | | 998,144 | 15,685 |
| Reliance Industries Ltd. sponsored GDR (c) | | 1,460,700 | 80,485 |
| | | | 511,467 |
| FINANCIALS - 2.6% | | | |
| Banks - 1.2% | | | |
| Huntington Bancshares, Inc. | | 17,095,389 | 158,474 |
| PacWest Bancorp | | 2,156,416 | 39,409 |
| Signature Bank | | 841,811 | 86,311 |
| | | | 284,194 |
| Capital Markets - 1.0% | | | |
| CME Group, Inc. | | 200,834 | 33,375 |
| London Stock Exchange Group PLC | | 745,836 | 82,384 |
| S&P Global, Inc. | | 360,111 | 126,129 |
| | | | 241,888 |
| Consumer Finance - 0.4% | | | |
| Capital One Financial Corp. | | 1,641,141 | 104,705 |
|
| TOTAL FINANCIALS | | | 630,787 |
|
| HEALTH CARE - 7.9% | | | |
| Biotechnology - 4.1% | | | |
| Agios Pharmaceuticals, Inc. (a) | | 289,443 | 13,118 |
| Alexion Pharmaceuticals, Inc. (a) | | 1,080,638 | 110,755 |
| Alnylam Pharmaceuticals, Inc. (a) | | 255,977 | 37,311 |
| Amgen, Inc. | | 873,874 | 213,811 |
| Arcutis Biotherapeutics, Inc. (a) | | 419,988 | 11,214 |
| Ascendis Pharma A/S sponsored ADR (a) | | 139,452 | 19,190 |
| ChemoCentryx, Inc. (a) | | 249,006 | 13,125 |
| Chimerix, Inc. (a) | | 48,575 | 151 |
| FibroGen, Inc. (a) | | 180,150 | 7,291 |
| G1 Therapeutics, Inc. (a) | | 297,833 | 4,369 |
| GenSight Biologics SA (a)(b)(c) | | 225,059 | 793 |
| Global Blood Therapeutics, Inc. (a) | | 1,275,364 | 86,062 |
| Intercept Pharmaceuticals, Inc. (a) | | 267,256 | 12,198 |
| Ionis Pharmaceuticals, Inc. (a) | | 33,595 | 1,934 |
| Neurocrine Biosciences, Inc. (a) | | 704,250 | 84,764 |
| Regeneron Pharmaceuticals, Inc. (a) | | 306,541 | 193,755 |
| Sarepta Therapeutics, Inc. (a) | | 193,470 | 29,702 |
| Trevena, Inc. (a)(b) | | 473,057 | 1,097 |
| Vertex Pharmaceuticals, Inc. (a) | | 359,753 | 97,853 |
| Xencor, Inc. (a) | | 1,205,992 | 36,288 |
| | | | 974,781 |
| Health Care Equipment & Supplies - 1.8% | | | |
| DexCom, Inc. (a) | | 353,209 | 153,837 |
| Insulet Corp. (a) | | 670,237 | 136,299 |
| Intuitive Surgical, Inc. (a) | | 133,495 | 91,503 |
| Masimo Corp. (a) | | 67,891 | 14,944 |
| Neuronetics, Inc. (a) | | 40,923 | 109 |
| Tandem Diabetes Care, Inc. (a) | | 203,215 | 21,228 |
| | | | 417,920 |
| Health Care Providers & Services - 0.5% | | | |
| Cigna Corp. | | 148,571 | 25,657 |
| Humana, Inc. | | 239,667 | 94,057 |
| | | | 119,714 |
| Health Care Technology - 0.0% | | | |
| Castlight Health, Inc. Class B (a) | | 48,863 | 54 |
| Life Sciences Tools & Services - 0.9% | | | |
| 10X Genomics, Inc. (a) | | 457,398 | 44,994 |
| Bruker Corp. | | 2,432,402 | 108,534 |
| Nanostring Technologies, Inc. (a)(d) | | 1,924,269 | 69,485 |
| | | | 223,013 |
| Pharmaceuticals - 0.6% | | | |
| AstraZeneca PLC: | | | |
| (United Kingdom) | | 113,281 | 12,515 |
| sponsored ADR | | 1,371,531 | 76,504 |
| Elanco Animal Health, Inc. (a) | | 94,092 | 2,223 |
| Roche Holding AG (participation certificate) | | 134,800 | 46,689 |
| TherapeuticsMD, Inc. (a)(b) | | 362,690 | 671 |
| | | | 138,602 |
|
| TOTAL HEALTH CARE | | | 1,874,084 |
|
| INDUSTRIALS - 2.6% | | | |
| Aerospace & Defense - 0.2% | | | |
| Space Exploration Technologies Corp.: | | | |
| Class A (a)(e)(f) | | 203,488 | 54,942 |
| Class C (e)(f) | | 7,092 | 1,915 |
| | | | 56,857 |
| Airlines - 0.1% | | | |
| Copa Holdings SA Class A | | 397,749 | 16,483 |
| Wheels Up Partners Holdings LLC Series B(a)(e)(f)(g) | | 1,760,377 | 4,999 |
| | | | 21,482 |
| Commercial Services & Supplies - 0.3% | | | |
| Copart, Inc. (a) | | 438,111 | 40,854 |
| Waste Connection, Inc. (United States) | | 362,100 | 37,068 |
| | | | 77,922 |
| Industrial Conglomerates - 0.1% | | | |
| Roper Technologies, Inc. | | 28,700 | 12,411 |
| Professional Services - 0.4% | | | |
| Verisk Analytics, Inc. | | 558,077 | 105,315 |
| Road & Rail - 1.5% | | | |
| CSX Corp. | | 1,199,623 | 85,581 |
| Lyft, Inc. (a) | | 2,504,913 | 73,219 |
| Rumo SA (a) | | 10,313,900 | 43,932 |
| Uber Technologies, Inc. (a) | | 4,766,049 | 144,221 |
| | | | 346,953 |
|
| TOTAL INDUSTRIALS | | | 620,940 |
|
| INFORMATION TECHNOLOGY - 38.8% | | | |
| IT Services - 3.0% | | | |
| Black Knight, Inc. (a) | | 391,509 | 29,332 |
| Fidelity National Information Services, Inc. | | 412,165 | 60,304 |
| Gartner, Inc. (a) | | 1,320,811 | 164,626 |
| Genpact Ltd. | | 578,565 | 23,038 |
| MasterCard, Inc. Class A | | 656,509 | 202,553 |
| PayPal Holdings, Inc. (a) | | 831,324 | 162,998 |
| Reply SpA | | 258,800 | 23,626 |
| Shopify, Inc. Class A (a) | | 46,292 | 47,340 |
| Visa, Inc. Class A | | 48,667 | 9,266 |
| | | | 723,083 |
| Semiconductors & Semiconductor Equipment - 8.2% | | | |
| Advanced Micro Devices, Inc. (a) | | 868,200 | 67,225 |
| Analog Devices, Inc. | | 469,819 | 53,959 |
| Applied Materials, Inc. | | 688,464 | 44,289 |
| ASML Holding NV | | 344,813 | 121,967 |
| Intel Corp. | | 73,828 | 3,524 |
| Lam Research Corp. | | 213,797 | 80,636 |
| Marvell Technology Group Ltd. | | 7,360,351 | 268,432 |
| Micron Technology, Inc. (a) | | 2,945,371 | 147,431 |
| NVIDIA Corp. | | 974,510 | 413,767 |
| NXP Semiconductors NV | | 2,543,836 | 298,977 |
| Qualcomm, Inc. | | 3,040,660 | 321,124 |
| Skyworks Solutions, Inc. | | 98,830 | 14,388 |
| Taiwan Semiconductor Manufacturing Co. Ltd. sponsored ADR | | 1,405,891 | 110,911 |
| | | | 1,946,630 |
| Software - 15.7% | | | |
| Adobe, Inc. (a) | | 755,676 | 335,762 |
| ANSYS, Inc. (a) | | 117,500 | 36,496 |
| Aspen Technology, Inc. (a) | | 1,367,052 | 132,959 |
| Atom Tickets LLC (a)(e)(f)(g) | | 516,103 | 692 |
| Autodesk, Inc. (a) | | 404,218 | 95,569 |
| Dropbox, Inc. Class A (a) | | 203,975 | 4,640 |
| Elastic NV (a) | | 664,102 | 63,880 |
| Epic Games, Inc. (e)(f)(h) | | 23,000 | 13,225 |
| Five9, Inc. (a) | | 216,300 | 26,133 |
| Globant SA (a) | | 196,433 | 33,971 |
| HIVE Blockchain Technologies Ltd. (a)(b) | | 2,661,600 | 964 |
| Intuit, Inc. | | 378,806 | 116,055 |
| Manhattan Associates, Inc. (a) | | 936,557 | 89,713 |
| Microsoft Corp. | | 12,142,321 | 2,489,297 |
| Netcompany Group A/S (a)(c) | | 68,694 | 4,933 |
| NICE Systems Ltd. sponsored ADR (a) | | 293,600 | 60,258 |
| Salesforce.com, Inc. (a) | | 1,150,363 | 224,148 |
| Workday, Inc. Class A (a) | | 129,662 | 23,458 |
| | | | 3,752,153 |
| Technology Hardware, Storage & Peripherals - 11.9% | | | |
| Apple, Inc. | | 6,196,280 | 2,633,664 |
| Samsung Electronics Co. Ltd. | | 1,438,770 | 69,661 |
| Western Digital Corp. | | 3,444,181 | 148,444 |
| | | | 2,851,769 |
|
| TOTAL INFORMATION TECHNOLOGY | | | 9,273,635 |
|
| MATERIALS - 0.5% | | | |
| Chemicals - 0.2% | | | |
| LG Chemical Ltd. | | 43,715 | 20,763 |
| Livent Corp. (a)(b) | | 3,991,423 | 25,026 |
| | | | 45,789 |
| Paper & Forest Products - 0.3% | | | |
| Suzano Papel e Celulose SA (a) | | 10,190,000 | 82,043 |
|
| TOTAL MATERIALS | | | 127,832 |
|
| REAL ESTATE - 0.5% | | | |
| Equity Real Estate Investment Trusts (REITs) - 0.5% | | | |
| Ant International Co. Ltd. Class C(a)(e)(f) | | 6,818,398 | 71,320 |
| Equinix, Inc. | | 47,331 | 37,178 |
| | | | 108,498 |
| TOTAL COMMON STOCKS | | | |
| (Cost $12,553,906) | | | 23,497,331 |
|
| Preferred Stocks - 1.4% | | | |
| Convertible Preferred Stocks - 1.3% | | | |
| CONSUMER DISCRETIONARY - 0.6% | | | |
| Internet & Direct Marketing Retail - 0.6% | | | |
| One Kings Lane, Inc. Series E (Escrow)(a)(e)(f) | | 648,635 | 259 |
| Reddit, Inc.: | | | |
| Series B (a)(e)(f) | | 1,337,584 | 66,518 |
| Series C (a)(e)(f) | | 300,673 | 14,952 |
| Series D (a)(e)(f) | | 929,200 | 46,209 |
| The Honest Co., Inc. Series D (a)(e)(f) | | 75,268 | 3,444 |
| | | | 131,382 |
| CONSUMER STAPLES - 0.1% | | | |
| Food & Staples Retailing - 0.1% | | | |
| Roofoods Ltd. Series F(a)(e)(f) | | 93,930 | 32,643 |
| HEALTH CARE - 0.1% | | | |
| Health Care Providers & Services - 0.1% | | | |
| Mulberry Health, Inc. Series A-8 (a)(e)(f) | | 4,342,250 | 19,751 |
| INDUSTRIALS - 0.1% | | | |
| Aerospace & Defense - 0.1% | | | |
| Space Exploration Technologies Corp.: | | | |
| Series G (a)(e)(f) | | 62,037 | 16,750 |
| Series H (a)(e)(f) | | 65,670 | 17,731 |
| | | | 34,481 |
| Professional Services - 0.0% | | | |
| YourPeople, Inc. Series C (a)(e)(f) | | 335,546 | 641 |
| TOTAL INDUSTRIALS | | | 35,122 |
| INFORMATION TECHNOLOGY - 0.4% | | | |
| Internet Software & Services - 0.0% | | | |
| Starry, Inc. Series B (a)(e)(f) | | 1,811,120 | 2,590 |
| IT Services - 0.0% | | | |
| AppNexus, Inc.: | | | |
| Series E (Escrow) (a)(e)(f) | | 1,416,796 | 44 |
| Series F (Escrow) (a)(e)(f) | | 90,913 | 25 |
| | | | 69 |
| Software - 0.4% | | | |
| Dataminr, Inc. Series D(a)(e)(f) | | 1,520,446 | 16,725 |
| Jet.Com, Inc. Series B1 (Escrow) (a)(e)(f) | | 4,896,249 | 0 |
| Taboola.Com Ltd. Series E (a)(e)(f) | | 1,918,392 | 65,283 |
| | | | 82,008 |
| TOTAL INFORMATION TECHNOLOGY | | | 84,667 |
| REAL ESTATE - 0.0% | | | |
| Real Estate Management & Development - 0.0% | | | |
| WeWork Companies, Inc.: | | | |
| Series E (a)(e)(f) | | 269,091 | 1,897 |
| Series F(a)(e)(f) | | 14,513 | 102 |
| | | | 1,999 |
|
| TOTAL CONVERTIBLE PREFERRED STOCKS | | | 305,564 |
|
| Nonconvertible Preferred Stocks - 0.1% | | | |
| CONSUMER DISCRETIONARY - 0.0% | | | |
| Automobiles - 0.0% | | | |
| Waymo LLC Series A2 (e)(f) | | 103,940 | 8,925 |
| HEALTH CARE - 0.1% | | | |
| Pharmaceuticals - 0.1% | | | |
| Castle Creek Pharmaceutical Holdings, Inc. Series A4 (a)(e)(f) | | 30,303 | 14,615 |
|
| TOTAL NONCONVERTIBLE PREFERRED STOCKS | | | 23,540 |
|
| TOTAL PREFERRED STOCKS | | | |
| (Cost $197,860) | | | 329,104 |
|
| Money Market Funds - 0.4% | | | |
| Fidelity Cash Central Fund 0.14% (i) | | 790 | 1 |
| Fidelity Securities Lending Cash Central Fund 0.13% (i)(j) | | 101,051,103 | 101,061 |
| TOTAL MONEY MARKET FUNDS | | | |
| (Cost $101,062) | | | 101,062 |
| TOTAL INVESTMENT IN SECURITIES - 100.2% | | | |
| (Cost $12,852,828) | | | 23,927,497 |
| NET OTHER ASSETS (LIABILITIES) - (0.2)% | | | (36,509) |
| NET ASSETS - 100% | | | $23,890,988 |
Values shown as $0 in the Schedule of Investments may reflect amounts less than $500.
Legend
(a) Non-income producing
(b) Security or a portion of the security is on loan at period end.
(c) Security exempt from registration under Rule 144A of the Securities Act of 1933. These securities may be resold in transactions exempt from registration, normally to qualified institutional buyers. At the end of the period, the value of these securities amounted to $86,211,000 or 0.4% of net assets.
(d) Affiliated company
(e) Restricted securities (including private placements) - Investment in securities not registered under the Securities Act of 1933 (excluding 144A issues). At the end of the period, the value of restricted securities (excluding 144A issues) amounted to $476,197,000 or 2.0% of net assets.
(f) Level 3 security
(g) Investment is owned by a wholly-owned subsidiary (Subsidiary) that is treated as a corporation for U.S. tax purposes.
(h) Security or a portion of the security purchased on a delayed delivery or when-issued basis.
(i) Affiliated fund that is generally available only to investment companies and other accounts managed by Fidelity Investments. The rate quoted is the annualized seven-day yield of the fund at period end. A complete unaudited listing of the fund's holdings as of its most recent quarter end is available upon request. In addition, each Fidelity Central Fund's financial statements, which are not covered by the Fund's Report of Independent Registered Public Accounting Firm, are available on the SEC's website or upon request.
(j) Investment made with cash collateral received from securities on loan.
Additional information on each restricted holding is as follows:
| Security | Acquisition Date | Acquisition Cost (000s) |
| Ant International Co. Ltd. Class C | 5/16/18 | $38,251 |
| AppNexus, Inc. Series E (Escrow) | 8/1/14 - 9/17/14 | $0 |
| AppNexus, Inc. Series F (Escrow) | 8/23/16 | $40 |
| Atom Tickets LLC | 8/15/17 | $3,000 |
| Castle Creek Pharmaceutical Holdings, Inc. Series A4 | 9/29/16 | $10,011 |
| Dataminr, Inc. Series D | 2/18/15 - 3/6/15 | $19,386 |
| Epic Games, Inc. | 7/13/20 - 7/30/20 | $13,225 |
| Jet.Com, Inc. Series B1 (Escrow) | 3/19/18 | $0 |
| Mulberry Health, Inc. Series A-8 | 1/20/16 | $29,331 |
| One Kings Lane, Inc. Series E (Escrow) | 1/29/14 | $401 |
| Reddit, Inc. Series B | 7/26/17 | $18,989 |
| Reddit, Inc. Series C | 7/24/17 | $4,743 |
| Reddit, Inc. Series D | 2/4/19 | $20,151 |
| Roofoods Ltd. Series F | 9/12/17 | $33,211 |
| Space Exploration Technologies Corp. Class A | 10/16/15 - 9/11/17 | $21,156 |
| Space Exploration Technologies Corp. Class C | 9/11/17 | $957 |
| Space Exploration Technologies Corp. Series G | 1/20/15 | $4,805 |
| Space Exploration Technologies Corp. Series H | 8/4/17 | $8,865 |
| Starry, Inc. Series B | 12/1/16 | $980 |
| Taboola.Com Ltd. Series E | 12/22/14 | $20,000 |
| The Honest Co., Inc. Series D | 8/3/15 | $3,444 |
| Waymo LLC Series A2 | 5/8/20 | $8,925 |
| WeWork Companies, Inc. Series E | 6/23/15 | $8,850 |
| WeWork Companies, Inc. Series F | 12/1/16 | $728 |
| Wheels Up Partners Holdings LLC Series B | 9/18/15 | $5,000 |
| YourPeople, Inc. Series C | 5/1/15 | $5,000 |
Affiliated Central Funds
Information regarding fiscal year to date income earned by the Fund from investments in Fidelity Central Funds is as follows:
| Fund | Income earned |
| | (Amounts in thousands) |
| Fidelity Cash Central Fund | $755 |
| Fidelity Securities Lending Cash Central Fund | 5,046 |
| Total | $5,801 |
Amounts in the income column in the above table include any capital gain distributions from underlying funds, which are presented in the corresponding line-item in the Statement of Operations, if applicable. Amount for Fidelity Securities Lending Cash Central Fund represents the income earned on investing cash collateral, less rebates paid to borrowers and any lending agent fees associated with the loan, plus any premium payments received for lending certain types of securities.
Other Affiliated Issuers
An affiliated company is a company in which the Fund has ownership of at least 5% of the voting securities. Fiscal year to date transactions with companies which are or were affiliates are as follows:
| Affiliate (Amounts in thousands) | Value, beginning of period | Purchases | Sales Proceeds(a) | Dividend Income | Realized Gain (loss) | Change in Unrealized appreciation (depreciation) | Value, end of period |
| Cardlytics, Inc. | $7,743 | $59,916 | $86,783 | $-- | $19,709 | $(585) | $-- |
| Nanostring Technologies, Inc. | -- | 63,681 | 1,238 | -- | 20 | 7,022 | 69,485 |
| Total | $7,743 | $123,597 | $88,021 | $-- | $19,729 | $6,437 | $69,485 |
(a) Includes the value of securities delivered through in-kind transactions, if applicable.
Investment Valuation
The following is a summary of the inputs used, as of July 31, 2020, involving the Fund's assets and liabilities carried at fair value. The inputs or methodology used for valuing securities may not be an indication of the risk associated with investing in those securities. For more information on valuation inputs, and their aggregation into the levels used below, please refer to the Investment Valuation section in the accompanying Notes to Financial Statements.
| | Valuation Inputs at Reporting Date: |
| Description | Total | Level 1 | Level 2 | Level 3 |
| (Amounts in thousands) | | | | |
| Investments in Securities: | | | | |
| Equities: | | | | |
| Communication Services | $4,644,328 | $4,644,328 | $-- | $-- |
| Consumer Discretionary | 5,338,331 | 5,137,425 | 60,599 | 140,307 |
| Consumer Staples | 540,379 | 383,198 | 124,538 | 32,643 |
| Energy | 511,467 | 511,467 | -- | -- |
| Financials | 630,787 | 548,403 | 82,384 | -- |
| Health Care | 1,908,450 | 1,814,880 | 59,204 | 34,366 |
| Industrials | 656,062 | 559,084 | -- | 96,978 |
| Information Technology | 9,358,302 | 9,259,718 | -- | 98,584 |
| Materials | 127,832 | 127,832 | -- | -- |
| Real Estate | 110,497 | 37,178 | -- | 73,319 |
| Money Market Funds | 101,062 | 101,062 | -- | -- |
| Total Investments in Securities: | $23,927,497 | $23,124,575 | $326,725 | $476,197 |
The following is a reconciliation of Investments in Securities for which Level 3 inputs were used in determining value:
| (Amounts in thousands) | |
| Investments in Securities: | |
| Beginning Balance | $470,041 |
| Net Realized Gain (Loss) on Investment Securities | (18,797) |
| Net Unrealized Gain (Loss) on Investment Securities | 73,913 |
| Cost of Purchases | 22,244 |
| Proceeds of Sales | (63,371) |
| Amortization/Accretion | -- |
| Transfers into Level 3 | -- |
| Transfers out of Level 3 | (7,833) |
| Ending Balance | $476,197 |
| The change in unrealized gain (loss) for the period attributable to Level 3 securities held at July 31, 2020 | $75,456 |
The information used in the above reconciliation represents fiscal year to date activity for any Investments in Securities identified as using Level 3 inputs at either the beginning or the end of the current fiscal period. Transfers in or out of Level 3 represent the beginning value of any Security or Instrument where a change in the pricing level occurred from the beginning to the end of the period. The cost of purchases and the proceeds of sales may include securities received or delivered through corporate actions or exchanges. Realized and unrealized gains (losses) disclosed in the reconciliation are included in Net Gain (Loss) on the Fund's Statement of Operations.
Other Information
Distribution of investments by country or territory of incorporation, as a percentage of Total Net Assets, is as follows (Unaudited):
| United States of America | 87.5% |
| Netherlands | 2.7% |
| Cayman Islands | 2.3% |
| India | 2.2% |
| United Kingdom | 1.4% |
| Bermuda | 1.2% |
| Others (Individually Less Than 1%) | 2.7% |
| | 100.0% |
See accompanying notes which are an integral part of the financial statements.
Financial Statements
Statement of Assets and Liabilities
| Amounts in thousands (except per-share amounts) | | July 31, 2020 |
| Assets | | |
Investment in securities, at value (including securities loaned of $99,535) — See accompanying schedule:
Unaffiliated issuers (cost $12,689,303) | $23,756,950 | |
| Fidelity Central Funds (cost $101,062) | 101,062 | |
| Other affiliated issuers (cost $62,463) | 69,485 | |
| Total Investment in Securities (cost $12,852,828) | | $23,927,497 |
| Receivable for investments sold | | 190,175 |
| Receivable for fund shares sold | | 15,578 |
| Dividends receivable | | 1,706 |
| Distributions receivable from Fidelity Central Funds | | 369 |
| Prepaid expenses | | 6 |
| Other receivables | | 2,799 |
| Total assets | | 24,138,130 |
| Liabilities | | |
| Payable for investments purchased | | |
| Regular delivery | $49,884 | |
| Delayed delivery | 9,315 | |
| Payable for fund shares redeemed | 21,508 | |
| Accrued management fee | 13,008 | |
| Notes payable to affiliates | 19,928 | |
| Other affiliated payables | 2,159 | |
| Other payables and accrued expenses | 30,303 | |
| Collateral on securities loaned | 101,037 | |
| Total liabilities | | 247,142 |
| Net Assets | | $23,890,988 |
| Net Assets consist of: | | |
| Paid in capital | | $11,427,546 |
| Total accumulated earnings (loss) | | 12,463,442 |
| Net Assets | | $23,890,988 |
| Net Asset Value and Maximum Offering Price | | |
| OTC: | | |
| Net Asset Value, offering price and redemption price per share ($16,817,413 ÷ 1,077,661 shares) | | $15.61 |
| Class K: | | |
| Net Asset Value, offering price and redemption price per share ($7,073,575 ÷ 445,553 shares) | | $15.88 |
See accompanying notes which are an integral part of the financial statements.
Statement of Operations
| Amounts in thousands | | Year ended July 31, 2020 |
| Investment Income | | |
| Dividends | | $158,692 |
| Income from Fidelity Central Funds (including $5,046 from security lending) | | 5,801 |
| Total income | | 164,493 |
| Expenses | | |
| Management fee | | |
| Basic fee | $119,644 | |
| Performance adjustment | 28,076 | |
| Transfer agent fees | 22,042 | |
| Accounting fees | 1,717 | |
| Custodian fees and expenses | 502 | |
| Independent trustees' fees and expenses | 127 | |
| Registration fees | 349 | |
| Audit | 95 | |
| Legal | 41 | |
| Interest | 62 | |
| Miscellaneous | 254 | |
| Total expenses before reductions | 172,909 | |
| Expense reductions | (942) | |
| Total expenses after reductions | | 171,967 |
| Net investment income (loss) | | (7,474) |
| Realized and Unrealized Gain (Loss) | | |
| Net realized gain (loss) on: | | |
| Investment securities: | | |
| Unaffiliated issuers | 2,377,242 | |
| Redemptions in-kind with affiliated entities | 91,387 | |
| Fidelity Central Funds | 39 | |
| Other affiliated issuers | 19,729 | |
| Foreign currency transactions | (1,235) | |
| Total net realized gain (loss) | | 2,487,162 |
| Change in net unrealized appreciation (depreciation) on: | | |
| Investment securities: | | |
| Unaffiliated issuers (net of increase in deferred foreign taxes of $29,288) | 3,939,251 | |
| Affiliated issuers | 6,437 | |
| Assets and liabilities in foreign currencies | 11 | |
| Total change in net unrealized appreciation (depreciation) | | 3,945,699 |
| Net gain (loss) | | 6,432,861 |
| Net increase (decrease) in net assets resulting from operations | | $6,425,387 |
See accompanying notes which are an integral part of the financial statements.
Statement of Changes in Net Assets
| Amounts in thousands | Year ended July 31, 2020 | Year ended July 31, 2019 |
| Increase (Decrease) in Net Assets | | |
| Operations | | |
| Net investment income (loss) | $(7,474) | $(13,547) |
| Net realized gain (loss) | 2,487,162 | 2,129,510 |
| Change in net unrealized appreciation (depreciation) | 3,945,699 | (1,100,213) |
| Net increase (decrease) in net assets resulting from operations | 6,425,387 | 1,015,750 |
| Distributions to shareholders | (1,522,641) | (1,313,763) |
| Share transactions - net increase (decrease) | (929,542) | (412,601) |
| Total increase (decrease) in net assets | 3,973,204 | (710,614) |
| Net Assets | | |
| Beginning of period | 19,917,784 | 20,628,398 |
| End of period | $23,890,988 | $19,917,784 |
See accompanying notes which are an integral part of the financial statements.
Financial Highlights
Fidelity OTC Portfolio
| Years ended July 31, | 2020 | 2019 | 2018 A | 2017 A | 2016 A |
| Selected Per–Share Data | | | | | |
| Net asset value, beginning of period | $12.45 | $12.50 | $10.57 | $8.53 | $8.70 |
| Income from Investment Operations | | | | | |
| Net investment income (loss)B | (.01) | (.01) | (.02) | (.02) | (.01) |
| Net realized and unrealized gain (loss) | 4.14 | .75 | 2.48 | 2.33 | .29 |
| Total from investment operations | 4.13 | .74 | 2.46 | 2.31 | .28 |
| Distributions from net realized gain | (.97) | (.79) | (.53) | (.27) | (.45) |
| Total distributions | (.97) | (.79) | (.53) | (.27) | (.45) |
| Net asset value, end of period | $15.61 | $12.45 | $12.50 | $10.57 | $8.53 |
| Total ReturnC | 35.79% | 6.43% | 24.34% | 27.97% | 3.68% |
| Ratios to Average Net AssetsD,E | | | | | |
| Expenses before reductions | .87% | .88% | .88% | .81% | .91% |
| Expenses net of fee waivers, if any | .87% | .88% | .88% | .81% | .91% |
| Expenses net of all reductions | .87% | .88% | .88% | .81% | .90% |
| Net investment income (loss) | (.07)% | (.10)% | (.17)% | (.16)% | (.07)% |
| Supplemental Data | | | | | |
| Net assets, end of period (in millions) | $16,817 | $13,166 | $13,340 | $12,136 | $9,845 |
| Portfolio turnover rateF,G | 48% | 34% | 38% | 71% | 56% |
A Per share amounts have been adjusted to reflect the impact of the 10 for 1 share split that occurred on May 11, 2018.
B Calculated based on average shares outstanding during the period.
C Total returns would have been lower if certain expenses had not been reduced during the applicable periods shown.
D Fees and expenses of any underlying mutual funds or exchange-traded funds (ETFs) are not included in the Fund's expense ratio. The Fund indirectly bears its proportionate share of these expenses. For additional expense information related to investments in Fidelity Central Funds, please refer to the "Investments in Fidelity Central Funds" note found in the Notes to Financial Statements section of the most recent Annual or Semi-Annual report.
E Expense ratios reflect operating expenses of the class. Expenses before reductions do not reflect amounts reimbursed by the investment adviser or reductions from brokerage service arrangements or reductions from other expense offset arrangements and do not represent the amount paid by the class during periods when reimbursements or reductions occur. Expenses net of fee waivers reflect expenses after reimbursement by the investment adviser but prior to reductions from brokerage service arrangements or other expense offset arrangements. Expenses net of all reductions represent the net expenses paid by the class.
F Amount does not include the portfolio activity of any underlying Fidelity Central Funds.
G Portfolio turnover rate excludes securities received or delivered in-kind.
See accompanying notes which are an integral part of the financial statements.
Fidelity OTC Portfolio Class K
| Years ended July 31, | 2020 | 2019 | 2018 A | 2017 A | 2016 A |
| Selected Per–Share Data | | | | | |
| Net asset value, beginning of period | $12.64 | $12.67 | $10.70 | $8.62 | $8.79 |
| Income from Investment Operations | | | | | |
| Net investment income (loss)B | –C | –C | (.01) | (.01) | –C |
| Net realized and unrealized gain (loss) | 4.21 | .76 | 2.52 | 2.36 | .29 |
| Total from investment operations | 4.21 | .76 | 2.51 | 2.35 | .29 |
| Distributions from net investment income | –C | – | – | – | – |
| Distributions from net realized gain | (.97) | (.79) | (.54) | (.27) | (.46) |
| Total distributions | (.97) | (.79) | (.54) | (.27) | (.46) |
| Net asset value, end of period | $15.88 | $12.64 | $12.67 | $10.70 | $8.62 |
| Total ReturnD | 35.94% | 6.50% | 24.48% | 28.12% | 3.80% |
| Ratios to Average Net AssetsE,F | | | | | |
| Expenses before reductions | .78% | .79% | .78% | .70% | .79% |
| Expenses net of fee waivers, if any | .78% | .79% | .78% | .70% | .79% |
| Expenses net of all reductions | .78% | .78% | .77% | .70% | .79% |
| Net investment income (loss) | .03% | (.01)% | (.07)% | (.05)% | .05% |
| Supplemental Data | | | | | |
| Net assets, end of period (in millions) | $7,074 | $6,752 | $7,288 | $3,662 | $3,508 |
| Portfolio turnover rateG,H | 48% | 34% | 38% | 71% | 56% |
A Per share amounts have been adjusted to reflect the impact of the 10 for 1 share split that occurred on May 11, 2018.
B Calculated based on average shares outstanding during the period.
C Amount represents less than $.005 per share.
D Total returns would have been lower if certain expenses had not been reduced during the applicable periods shown.
E Fees and expenses of any underlying mutual funds or exchange-traded funds (ETFs) are not included in the Fund's expense ratio. The Fund indirectly bears its proportionate share of these expenses. For additional expense information related to investments in Fidelity Central Funds, please refer to the "Investments in Fidelity Central Funds" note found in the Notes to Financial Statements section of the most recent Annual or Semi-Annual report.
F Expense ratios reflect operating expenses of the class. Expenses before reductions do not reflect amounts reimbursed by the investment adviser or reductions from brokerage service arrangements or reductions from other expense offset arrangements and do not represent the amount paid by the class during periods when reimbursements or reductions occur. Expenses net of fee waivers reflect expenses after reimbursement by the investment adviser but prior to reductions from brokerage service arrangements or other expense offset arrangements. Expenses net of all reductions represent the net expenses paid by the class.
G Amount does not include the portfolio activity of any underlying Fidelity Central Funds.
H Portfolio turnover rate excludes securities received or delivered in-kind.
See accompanying notes which are an integral part of the financial statements.
Notes to Financial Statements
For the period ended July 31, 2020
(Amounts in thousands except percentages)
1. Organization.
Fidelity OTC Portfolio (the Fund) is a non-diversified fund of Fidelity Securities Fund (the Trust) and is authorized to issue an unlimited number of shares. The Trust is registered under the Investment Company Act of 1940, as amended (the 1940 Act), as an open-end management investment company organized as a Massachusetts business trust. The Fund offers OTC and Class K shares, each of which has equal rights as to assets and voting privileges. Each class has exclusive voting rights with respect to matters that affect that class.
Effective January 1, 2020:
Investment advisers Fidelity Investments Money Management, Inc., FMR Co., Inc., and Fidelity SelectCo, LLC, merged with and into Fidelity Management & Research Company. In connection with the merger transactions, the resulting, merged investment adviser was then redomiciled from Massachusetts to Delaware, changed its corporate structure from a corporation to a limited liability company, and changed its name to "Fidelity Management & Research Company LLC".
Fidelity Investments Institutional Operations Company, Inc. converted from a Massachusetts corporation to a Massachusetts LLC, and changed its name to "Fidelity Investments Institutional Operations Company LLC".
2. Investments in Fidelity Central Funds.
The Fund invests in Fidelity Central Funds, which are open-end investment companies generally available only to other investment companies and accounts managed by the investment adviser and its affiliates. The Fund's Schedule of Investments lists each of the Fidelity Central Funds held as of period end, if any, as an investment of the Fund, but does not include the underlying holdings of each Fidelity Central Fund. As an Investing Fund, the Fund indirectly bears its proportionate share of the expenses of the underlying Fidelity Central Funds.
The Money Market Central Funds seek preservation of capital and current income and are managed by the investment adviser. Annualized expenses of the Money Market Central Funds as of their most recent shareholder report date ranged from less than .005% to .01%.
A complete unaudited list of holdings for each Fidelity Central Fund is available upon request or at the Securities and Exchange Commission (the SEC) website at www.sec.gov. In addition, the financial statements of the Fidelity Central Funds, which are not covered by the Fund's Report of Independent Registered Public Accounting Firm, are available on the SEC website or upon request.
3. Significant Accounting Policies.
The Fund is an investment company and applies the accounting and reporting guidance of the Financial Accounting Standards Board (FASB) Accounting Standards Codification Topic 946 Financial Services – Investment Companies. The financial statements have been prepared in conformity with accounting principles generally accepted in the United States of America (GAAP), which require management to make certain estimates and assumptions at the date of the financial statements. Actual results could differ from those estimates. Subsequent events, if any, through the date that the financial statements were issued have been evaluated in the preparation of the financial statements. The following summarizes the significant accounting policies of the Fund:
Investment Valuation. Investments are valued as of 4:00 p.m. Eastern time on the last calendar day of the period. The Board of Trustees (the Board) has delegated the day to day responsibility for the valuation of the Fund's investments to the Fair Value Committee (the Committee) established by the Fund's investment adviser. In accordance with valuation policies and procedures approved by the Board, the Fund attempts to obtain prices from one or more third party pricing vendors or brokers to value its investments. When current market prices, quotations or currency exchange rates are not readily available or reliable, investments will be fair valued in good faith by the Committee, in accordance with procedures adopted by the Board. Factors used in determining fair value vary by investment type and may include market or investment specific events. The frequency with which these procedures are used cannot be predicted and they may be utilized to a significant extent. The Committee oversees the Fund's valuation policies and procedures and reports to the Board on the Committee's activities and fair value determinations. The Board monitors the appropriateness of the procedures used in valuing the Fund's investments and ratifies the fair value determinations of the Committee.
The Fund categorizes the inputs to valuation techniques used to value its investments into a disclosure hierarchy consisting of three levels as shown below:
- Level 1 – quoted prices in active markets for identical investments
- Level 2 – other significant observable inputs (including quoted prices for similar investments, interest rates, prepayment speeds, etc.)
- Level 3 – unobservable inputs (including the Fund's own assumptions based on the best information available)
Valuation techniques used to value the Fund's investments by major category are as follows:
Equity securities, including restricted securities, for which market quotations are readily available, are valued at the last reported sale price or official closing price as reported by a third party pricing vendor on the primary market or exchange on which they are traded and are categorized as Level 1 in the hierarchy. In the event there were no sales during the day or closing prices are not available, securities are valued at the last quoted bid price or may be valued using the last available price and are generally categorized as Level 2 in the hierarchy. For foreign equity securities, when market or security specific events arise, comparisons to the valuation of American Depositary Receipts (ADRs), futures contracts, Exchange-Traded Funds (ETFs) and certain indexes as well as quoted prices for similar securities may be used and would be categorized as Level 2 in the hierarchy. For equity securities, including restricted securities, where observable inputs are limited, assumptions about market activity and risk are used and these securities may be categorized as Level 3 in the hierarchy. Securities, including private placements or other restricted securities, for which observable inputs are not available are valued using alternate valuation approaches, including the market approach, the income approach and cost approach, and are categorized as Level 3 in the hierarchy. The market approach considers factors including the price of recent investments in the same or a similar security or financial metrics of comparable securities. The income approach considers factors including expected future cash flows, security specific risks and corresponding discount rates. The cost approach considers factors including the value of the security's underlying assets and liabilities.
Investments in open-end mutual funds, including the Fidelity Central Funds, are valued at their closing net asset value (NAV) each business day and are categorized as Level 1 in the hierarchy.
The following provides information on Level 3 securities held by the Fund that were valued at period end based on unobservable inputs. These amounts exclude valuations provided by a broker.
| Asset Type | Fair Value | Valuation Technique(s) | Unobservable Input | Amount or Range/Weighted Average | Impact to Valuation from an Increase in Input(a) |
| Equities | $ 476,197 | Market approach | Transaction price | $4.55 - $575.00 / $222.09 | Increase |
| | | Recovery value | Recovery value | 0.0% - 0.4% / 0.1% | Increase |
| | | Market comparable | Transaction price | $1.43 - $411.85 / $350.07 | Increase |
| | | | Discount rate | 0.8% - 75.0% / 39.6% | Decrease |
| | | | Enterprise value/Sales multiple (EV/S) | 1.5 - 20.1 / 11.1 | Increase |
| | | | Discount for lack of marketability | 10.0% | Decrease |
| | | | Premium rate | 5.7% - 172.9% / 156.2% | Increase |
| | | | Liquidity preference | $2.84 - $45.76 / $20.35 | Increase |
(a) Represents the directional change in the fair value of the Level 3 investments that could have resulted from an increase in the corresponding input as of period end. A decrease to the unobservable input would have had the opposite effect. Significant changes in these inputs may have resulted in a significantly higher or lower fair value measurement at period end.
Changes in valuation techniques may result in transfers in or out of an assigned level within the disclosure hierarchy. The aggregate value of investments by input level as of July 31, 2020, as well as a roll forward of Level 3 investments, is included at the end of the Fund's Schedule of Investments.
Foreign Currency. The Fund may use foreign currency contracts to facilitate transactions in foreign-denominated securities. Gains and losses from these transactions may arise from changes in the value of the foreign currency or if the counterparties do not perform under the contracts' terms.
Foreign-denominated assets, including investment securities, and liabilities are translated into U.S. dollars at the exchange rates at period end. Purchases and sales of investment securities, income and dividends received and expenses denominated in foreign currencies are translated into U.S. dollars at the exchange rate in effect on the transaction date.
The effects of exchange rate fluctuations on investments are included with the net realized and unrealized gain (loss) on investment securities. Other foreign currency transactions resulting in realized and unrealized gain (loss) are disclosed separately.
Investment Transactions and Income. For financial reporting purposes, the Fund's investment holdings and NAV include trades executed through the end of the last business day of the period. The NAV per share for processing shareholder transactions is calculated as of the close of business of the New York Stock Exchange (NYSE), normally 4:00 p.m. Eastern time and includes trades executed through the end of the prior business day. Gains and losses on securities sold are determined on the basis of identified cost and include proceeds received from litigation. Dividend income is recorded on the ex-dividend date, except for certain dividends from foreign securities where the ex-dividend date may have passed, which are recorded as soon as the Fund is informed of the ex-dividend date. Non-cash dividends included in dividend income, if any, are recorded at the fair market value of the securities received. Income and capital gain distributions from Fidelity Central Funds, if any, are recorded on the ex-dividend date. Certain distributions received by the Fund represent a return of capital or capital gain. The Fund determines the components of these distributions subsequent to the ex-dividend date, based upon receipt of tax filings or other correspondence relating to the underlying investment. These distributions are recorded as a reduction of cost of investments and/or as a realized gain. Investment income is recorded net of foreign taxes withheld where recovery of such taxes is uncertain.
Class Allocations and Expenses. Investment income, realized and unrealized capital gains and losses, common expenses of the Fund, and certain fund-level expense reductions, if any, are allocated daily on a pro-rata basis to each class based on the relative net assets of each class to the total net assets of the Fund. Each class differs with respect to transfer agent fees incurred. Certain expense reductions may also differ by class. For the reporting period, the allocated portion of income and expenses to each class as a percent of its average net assets may vary due to the timing of recording these transactions in relation to fluctuating net assets of the classes. Expenses directly attributable to a fund are charged to that fund. Expenses attributable to more than one fund are allocated among the respective funds on the basis of relative net assets or other appropriate methods. Expense estimates are accrued in the period to which they relate and adjustments are made when actual amounts are known.
Deferred Trustee Compensation. Under a Deferred Compensation Plan (the Plan) for the Fund, certain independent Trustees have elected to defer receipt of a portion of their annual compensation. Deferred amounts are invested in a cross-section of Fidelity funds, are marked-to-market and remain in the Fund until distributed in accordance with the Plan. The investment of deferred amounts and the offsetting payable to the Trustees of $609 are included in the accompanying Statement of Assets and Liabilities in other receivables and other payables and accrued expenses, respectively.
Income Tax Information and Distributions to Shareholders. Each year, the Fund intends to qualify as a regulated investment company under Subchapter M of the Internal Revenue Code, including distributing substantially all of its taxable income and realized gains. As a result, no provision for U.S. Federal income taxes is required. As of July 31, 2020, the Fund did not have any unrecognized tax benefits in the financial statements; nor is the Fund aware of any tax positions for which it is reasonably possible that the total amounts of unrecognized tax benefits will significantly change in the next twelve months. The Fund files a U.S. federal tax return, in addition to state and local tax returns as required. The Fund's federal income tax returns are subject to examination by the Internal Revenue Service (IRS) for a period of three fiscal years after they are filed. State and local tax returns may be subject to examination for an additional fiscal year depending on the jurisdiction. Foreign taxes are provided for based on the Fund's understanding of the tax rules and rates that exist in the foreign markets in which it invests. The Fund is subject to a tax imposed on capital gains by certain countries in which it invests. An estimated deferred tax liability for net unrealized appreciation on the applicable securities is included in Other payables and accrued expenses on the Statement of Assets & Liabilities.
Distributions are declared and recorded on the ex-dividend date. Income and capital gain distributions are declared separately for each class. Income and capital gain distributions are determined in accordance with income tax regulations, which may differ from GAAP. In addition, the Fund claimed a portion of the payment made to redeeming shareholders as a distribution for income tax purposes.
Capital accounts within the financial statements are adjusted for permanent book-tax differences. These adjustments have no impact on net assets or the results of operations. Capital accounts are not adjusted for temporary book-tax differences which will reverse in a subsequent period.
Book-tax differences are primarily due to in-kind transactions, foreign currency transactions, passive foreign investment companies (PFIC), deferred trustees compensation, losses deferred due to wash sales, and excise tax regulations.
As of period end, the cost and unrealized appreciation (depreciation) in securities, and derivatives if applicable, for federal income tax purposes were as follows:
| Gross unrealized appreciation | $11,329,189 |
| Gross unrealized depreciation | (343,107) |
| Net unrealized appreciation (depreciation) | $10,986,082 |
| Tax Cost | $12,941,415 |
The tax-based components of distributable earnings as of period end were as follows:
| Undistributed ordinary income | $73,972 |
| Undistributed long-term capital gain | $1,433,492 |
| Net unrealized appreciation (depreciation) on securities and other investments | $10,986,048 |
The tax character of distributions paid was as follows:
| | July 31, 2020 | July 31, 2019 |
| Ordinary Income | $2,175 | $ - |
| Long-term Capital Gains | 1,520,466 | 1,313,763 |
| Total | $1,522,641 | $ 1,313,763 |
Delayed Delivery Transactions and When-Issued Securities. During the period, the Fund transacted in securities on a delayed delivery or when-issued basis. Payment and delivery may take place after the customary settlement period for that security. The price of the underlying securities and the date when the securities will be delivered and paid for are fixed at the time the transaction is negotiated. The securities purchased on a delayed delivery or when-issued basis are identified as such in the Fund's Schedule of Investments. Losses may arise due to changes in the value of the underlying securities or if the counterparty does not perform under the contract's terms, or if the issuer does not issue the securities due to political, economic, or other factors.
Restricted Securities (including Private Placements). The Fund may invest in securities that are subject to legal or contractual restrictions on resale. These securities generally may be resold in transactions exempt from registration or to the public if the securities are registered. Disposal of these securities may involve time-consuming negotiations and expense, and prompt sale at an acceptable price may be difficult. Information regarding restricted securities is included at the end of the Fund's Schedule of Investments.
Consolidated Subsidiary. The Fund invests in certain investments through a wholly-owned subsidiary ("Subsidiary"), which may be subject to federal and state taxes upon disposition.
As of period end, the Fund held an investment of $5,691 in these Subsidiaries, representing .02% of the Fund's net assets. The financial statements have been consolidated and include accounts of the Fund and each Subsidiary. Accordingly, all inter-company transactions and balances have been eliminated.
4. Purchases and Sales of Investments.
Purchases and sales of securities, other than short-term securities and in-kind transactions, are noted in the table below.
| | Purchases ($) | Sales ($) |
| Fidelity OTC Portfolio | 9,791,265 | 11,229,157 |
Unaffiliated Redemptions In-Kind. During the period, 67,944 shares of the Fund were redeemed in-kind for investments and cash with a value of $904,757. The net realized gain of $518,791 on investments delivered through in-kind redemptions is included in the accompanying Statement of Operations. The amount of the in-kind redemptions is included in share transactions in the accompanying Statement of Changes in Net Assets as well as the Notes to Financial Statements. The Fund recognized no gain or loss for federal income tax purposes.
Prior Fiscal Year Unaffiliated Redemptions In-Kind. During the prior period, shares of the Fidelity OTC Portfolio were redeemed in-kind for investments. The amount of the in-kind redemptions is included in share transactions in the accompanying Statement of Changes in Net Assets. For additional information of the Fidelity OTC Portfolio in-kind transactions, please refer to the Fidelity OTC Portfolio prior annual shareholder report.
5. Fees and Other Transactions with Affiliates.
Management Fee. Fidelity Management & Research Company LLC (the investment adviser) and its affiliates provide the Fund with investment management related services for which the Fund pays a monthly management fee. The management fee is the sum of an individual fund fee rate that is based on an annual rate of .35% of the Fund's average net assets and an annualized group fee rate that averaged .23% during the period. The group fee rate is based upon the monthly average net assets of a group of registered investment companies with which the investment adviser has management contracts. The group fee rate decreases as assets under management increase and increases as assets under management decrease. In addition, the management fee is subject to a performance adjustment (up to a maximum of +/- .20% of the Fund's average net assets over a 36 month performance period). The upward or downward adjustment to the management fee is based on the relative investment performance of OTC as compared to its benchmark index, the Nasdaq Composite Index, over the same 36 month performance period. For the reporting period, the total annual management fee rate, including the performance adjustment, was .72% of the Fund's average net assets. The performance adjustment included in the management fee rate may be higher or lower than the maximum performance adjustment rate due to the difference between the average net assets for the reporting and performance periods.
Transfer Agent Fees. Fidelity Investments Institutional Operations Company LLC (FIIOC), an affiliate of the investment adviser, is the transfer, dividend disbursing and shareholder servicing agent for each class of the Fund. FIIOC receives account fees and asset-based fees that vary according to the account size and type of account of the shareholders of OTC, except for Class K. FIIOC receives an asset-based fee of Class K's average net assets. FIIOC pays for typesetting, printing and mailing of shareholder reports, except proxy statements. Effective February 1, 2020, the Board approved to change the fee for Class K from .046% to .044%.
For the period, transfer agent fees for each class were as follows:
| | Amount | % of Class-Level Average Net Assets |
| OTC | $19,126 | .14 |
| Class K | 2,916 | .04 |
| | $22,042 | |
Accounting Fees. Fidelity Service Company, Inc. (FSC), an affiliate of the investment adviser, maintains the Fund's accounting records. The accounting fee is based on the level of average net assets for each month. For the period, the fees were equivalent to the following annual rates:
| | % of Average Net Assets |
| Fidelity OTC Portfolio | .01 |
Brokerage Commissions. A portion of portfolio transactions were placed with brokerage firms which are affiliates of the investment adviser. Brokerage commissions are included in net realized gain (loss) and change in net unrealized appreciation (depreciation) in the Statement of Operations. The commissions paid to these affiliated firms were as follows:
| | Amount |
| Fidelity OTC Portfolio | $215 |
Interfund Lending Program. Pursuant to an Exemptive Order issued by the SEC, the fund, along with other registered investment companies having management contracts with Fidelity Management & Research Company LLC (FMR), or other affiliated entities of FMR, may participate in an interfund lending program. This program provides an alternative credit facility allowing the fund to borrow from, or lend money to, other participating affiliated funds. Any open loans, including accrued interest, at period end are presented under the caption "Notes payable to affiliates" in the Statement of Assets and Liabilities. Activity in this program during the period for which loans were outstanding was as follows:
| | Borrower or Lender | Average Loan Balance | Weighted Average Interest Rate | Interest Expense |
| Fidelity OTC Portfolio | Borrower | $22,816 | 1.48% | $58 |
Interfund Trades. Funds may purchase from or sell securities to other Fidelity Funds under procedures adopted by the Board. The procedures have been designed to ensure these interfund trades are executed in accordance with Rule 17a-7 of the 1940 Act. Interfund trades are included within the respective purchases and sales amounts shown in the Purchases and Sales of Investments note.
Affiliated Redemptions In-Kind. During the period, 13,875 shares of the Fund were redeemed in-kind for investments and cash with a value of $170,108. The net realized gain of $91,387 on investments delivered through in-kind redemptions is included in the accompanying Statement of Operations. The amount of the in-kind redemptions is included in share transactions in the accompanying Statement of Changes in Net Assets as well as the Notes to Financial Statements. The Fund recognized no gain or loss for federal income tax purposes.
Other. During the period, the investment adviser reimbursed the Fund for certain losses in the amount of $130.
6. Committed Line of Credit.
Certain Funds participate with other funds managed by the investment adviser or an affiliate in a $4.25 billion credit facility (the "line of credit") to be utilized for temporary or emergency purposes to fund shareholder redemptions or for other short-term liquidity purposes. The participating funds have agreed to pay commitment fees on their pro-rata portion of the line of credit, which are reflected in Miscellaneous expenses on the Statement of Operations, and are as follows:
| | Amount |
| Fidelity OTC Portfolio | $49 |
During the period, there were no borrowings on this line of credit.
7. Security Lending.
The Fund lends portfolio securities from time to time in order to earn additional income. Lending agents are used, including National Financial Services (NFS), an affiliate of the Fund. Pursuant to a securities lending agreement, NFS will receive a fee, which is capped at 9.9% of daily lending revenue, for its services as lending agent. The Fund may lend securities to certain qualified borrowers, including NFS. On the settlement date of the loan, the Fund receives collateral (in the form of U.S. Treasury obligations, letters of credit and/or cash) against the loaned securities and maintains collateral in an amount not less than 100% of the market value of the loaned securities during the period of the loan. The market value of the loaned securities is determined at the close of business of the Fund and any additional required collateral is delivered to the Fund on the next business day. The Fund or borrower may terminate the loan at any time, and if the borrower defaults on its obligation to return the securities loaned because of insolvency or other reasons, the Fund may apply collateral received from the borrower against the obligation. The Fund may experience delays and costs in recovering the securities loaned. Any cash collateral received is invested in the Fidelity Securities Lending Cash Central Fund. The value of loaned securities and cash collateral at period end are disclosed on the Fund's Statement of Assets and Liabilities. The value of securities loaned to NFS, as affiliated borrower, at period end was $429. Total fees paid by the Fund to NFS, as lending agent, amounted to $430. Security lending income represents the income earned on investing cash collateral, less rebates paid to borrowers and any lending agent fees associated with the loan, plus any premium payments received for lending certain types of securities. Net income from the Fidelity Securities Lending Cash Central Fund during the period is presented in the Statement of Operations as a component of income from Fidelity Central Funds (and includes $60 from securities loaned to NFS, as affiliated borrower).
8. Bank Borrowings.
The Fund is permitted to have bank borrowings for temporary or emergency purposes to fund shareholder redemptions or for other short-term liquidity requirements. The Fund has established borrowing arrangements with certain banks. The interest rate on the borrowings is the bank's base rate, as revised from time to time. Any open loans, including accrued interest, at period end are presented under the caption "Notes payable" in the Statement of Assets and Liabilities, if applicable. Activity in this program during the period for which loans were outstanding was as follows:
| | Average Loan Balance | Weighted Average Interest Rate | Interest Expense |
| Fidelity OTC Portfolio | $12,512 | 2.62% | $4 |
9. Expense Reductions.
Commissions paid to certain brokers with whom the investment adviser, or its affiliates, places trades on behalf of the Fund include an amount in addition to trade execution, which may be rebated back to the Fund to offset certain expenses. This amount totaled $852 for the period. In addition, through arrangements with the Fund's custodian and each class' transfer agent, credits realized as a result of certain uninvested cash balances were used to reduce the Fund's expenses. During the period, custodian credits reduced the Fund's expenses by $6. During the period, transfer agent credits reduced each class' expenses as noted in the table below.
In addition, during the period the investment adviser or an affiliate reimbursed and/or waived a portion of fund-level operating expenses in the amount of $83.
10. Distributions to Shareholders.
Distributions to shareholders of each class were as follows:
| | Year ended
July 31, 2020 | Year ended
July 31, 2019 |
| Distributions to shareholders | | |
| OTC | $1,018,787 | $854,603 |
| Class K | 503,854 | 459,160 |
| Total | $1,522,641 | $1,313,763 |
11. Share Transactions.
Share transactions for each class were as follows and may contain automatic conversions between classes or exchanges between affiliated funds:
| | Shares | Shares | Dollars | Dollars |
| | Year ended July 31, 2020 | Year ended July 31, 2019 | Year ended July 31, 2020 | Year ended July 31, 2019 |
| OTC | | | | |
| Shares sold | 238,435 | 182,454 | $3,042,001 | $2,166,729 |
| Reinvestment of distributions | 81,896 | 69,503 | 965,898 | 812,954 |
| Shares redeemed | (300,179)(a) | (261,680) | (3,722,853)(a) | (2,992,015) |
| Net increase (decrease) | 20,152 | (9,723) | $285,046 | $(12,332) |
| Class K | | | | |
| Shares sold | 87,490 | 66,477 | $1,115,420 | $791,678 |
| Reinvestment of distributions | 42,016 | 38,747 | 503,854 | 459,160 |
| Shares redeemed | (218,079)(a),(b) | (146,402)(c) | (2,833,862)(a),(b) | (1,651,108)(c) |
| Net increase (decrease) | (88,573) | (41,178) | $(1,214,588) | $(400,270) |
(a) Amount includes in-kind redemptions (see the Unaffiliated Redemption In-Kind note for additional details).
(b) Amount includes in-kind redemptions (see the Affiliated Redemption In-Kind note for additional details).
(c) Amount includes in-kind redemptions (see the Prior Fiscal Year Unaffiliated Redemption In-Kind note for additional details).
12. Other.
The Fund's organizational documents provide former and current trustees and officers with a limited indemnification against liabilities arising in connection with the performance of their duties to the Fund. In the normal course of business, the Fund may also enter into contracts that provide general indemnifications. The Fund's maximum exposure under these arrangements is unknown as this would be dependent on future claims that may be made against the Fund. The risk of material loss from such claims is considered remote.
13. Coronavirus (COVID-19) Pandemic.
An outbreak of COVID-19 first detected in China during December 2019 has since spread globally and was declared a pandemic by the World Health Organization during March 2020. Developments that disrupt global economies and financial markets, such as the COVID-19 pandemic, may magnify factors that affect the Fund's performance.
Report of Independent Registered Public Accounting Firm
To the Board of Trustees of Fidelity Securities Fund and Shareholders of Fidelity OTC Portfolio
Opinion on the Financial Statements and Financial Highlights
We have audited the accompanying statement of assets and liabilities of Fidelity OTC Portfolio (the "Fund"), a fund of Fidelity Securities Fund, including the schedule of investments, as of July 31, 2020, the related statement of operations for the year then ended, the statement of changes in net assets for each of the two years in the period then ended, the financial highlights for each of the five years in the period then ended, and the related notes. In our opinion, the financial statements and financial highlights present fairly, in all material respects, the financial position of the Fund as of July 31, 2020, and the results of its operations for the year then ended, the changes in its net assets for each of the two years in the period then ended, and the financial highlights for each of the five years in the period then ended in conformity with accounting principles generally accepted in the United States of America.
Basis for Opinion
These financial statements and financial highlights are the responsibility of the Fund's management. Our responsibility is to express an opinion on the Fund's financial statements and financial highlights based on our audits. We are a public accounting firm registered with the Public Company Accounting Oversight Board (United States) (PCAOB) and are required to be independent with respect to the Fund in accordance with the U.S. federal securities laws and the applicable rules and regulations of the Securities and Exchange Commission and the PCAOB.
We conducted our audits in accordance with the standards of the PCAOB. Those standards require that we plan and perform the audit to obtain reasonable assurance about whether the financial statements and financial highlights are free of material misstatement, whether due to error or fraud. The Fund is not required to have, nor were we engaged to perform, an audit of its internal control over financial reporting. As part of our audits we are required to obtain an understanding of internal control over financial reporting but not for the purpose of expressing an opinion on the effectiveness of the Fund’s internal control over financial reporting. Accordingly, we express no such opinion.
Our audits included performing procedures to assess the risks of material misstatement of the financial statements and financial highlights, whether due to error or fraud, and performing procedures that respond to those risks. Such procedures included examining, on a test basis, evidence regarding the amounts and disclosures in the financial statements and financial highlights. Our audits also included evaluating the accounting principles used and significant estimates made by management, as well as evaluating the overall presentation of the financial statements and financial highlights. Our procedures included confirmation of securities owned as of July 31, 2020, by correspondence with the custodian and brokers; when replies were not received from brokers, we performed other auditing procedures. We believe that our audits provide a reasonable basis for our opinion.
/s/ Deloitte & Touche LLP
Boston, Massachusetts
September 14, 2020
We have served as the auditor of one or more of the Fidelity investment companies since 1999.
Trustees and Officers
The Trustees, Members of the Advisory Board (if any), and officers of the trust and fund, as applicable, are listed below. The Board of Trustees governs the fund and is responsible for protecting the interests of shareholders. The Trustees are experienced executives who meet periodically throughout the year to oversee the fund's activities, review contractual arrangements with companies that provide services to the fund, oversee management of the risks associated with such activities and contractual arrangements, and review the fund's performance. Except for Jonathan Chiel, each of the Trustees oversees 311 funds. Mr. Chiel oversees 174 funds.
The Trustees hold office without limit in time except that (a) any Trustee may resign; (b) any Trustee may be removed by written instrument, signed by at least two-thirds of the number of Trustees prior to such removal; (c) any Trustee who requests to be retired or who has become incapacitated by illness or injury may be retired by written instrument signed by a majority of the other Trustees; and (d) any Trustee may be removed at any special meeting of shareholders by a two-thirds vote of the outstanding voting securities of the trust. Each Trustee who is not an interested person (as defined in the 1940 Act) of the trust and the fund is referred to herein as an Independent Trustee. Each Independent Trustee shall retire not later than the last day of the calendar year in which his or her 75th birthday occurs. The Independent Trustees may waive this mandatory retirement age policy with respect to individual Trustees. Officers and Advisory Board Members hold office without limit in time, except that any officer or Advisory Board Member may resign or may be removed by a vote of a majority of the Trustees at any regular meeting or any special meeting of the Trustees. Except as indicated, each individual has held the office shown or other offices in the same company for the past five years.
The fund's Statement of Additional Information (SAI) includes more information about the Trustees. To request a free copy, call Fidelity at 1-800-544-8544 if you’re an individual investing directly with Fidelity, call 1-800-835-5092 if you’re a plan sponsor or participant with Fidelity as your recordkeeper or call 1-877-208-0098 on institutional accounts or if you’re an advisor or invest through one.
Experience, Skills, Attributes, and Qualifications of the Trustees. The Governance and Nominating Committee has adopted a statement of policy that describes the experience, qualifications, attributes, and skills that are necessary and desirable for potential Independent Trustee candidates (Statement of Policy). The Board believes that each Trustee satisfied at the time he or she was initially elected or appointed a Trustee, and continues to satisfy, the standards contemplated by the Statement of Policy. The Governance and Nominating Committee also engages professional search firms to help identify potential Independent Trustee candidates who have the experience, qualifications, attributes, and skills consistent with the Statement of Policy. From time to time, additional criteria based on the composition and skills of the current Independent Trustees, as well as experience or skills that may be appropriate in light of future changes to board composition, business conditions, and regulatory or other developments, have also been considered by the professional search firms and the Governance and Nominating Committee. In addition, the Board takes into account the Trustees' commitment and participation in Board and committee meetings, as well as their leadership of standing and ad hoc committees throughout their tenure.
In determining that a particular Trustee was and continues to be qualified to serve as a Trustee, the Board has considered a variety of criteria, none of which, in isolation, was controlling. The Board believes that, collectively, the Trustees have balanced and diverse experience, qualifications, attributes, and skills, which allow the Board to operate effectively in governing the fund and protecting the interests of shareholders. Information about the specific experience, skills, attributes, and qualifications of each Trustee, which in each case led to the Board's conclusion that the Trustee should serve (or continue to serve) as a trustee of the fund, is provided below.
Board Structure and Oversight Function. Robert A. Lawrence is an interested person and currently serves as Acting Chairman. The Trustees have determined that an interested Chairman is appropriate and benefits shareholders because an interested Chairman has a personal and professional stake in the quality and continuity of services provided to the fund. Independent Trustees exercise their informed business judgment to appoint an individual of their choosing to serve as Chairman, regardless of whether the Trustee happens to be independent or a member of management. The Independent Trustees have determined that they can act independently and effectively without having an Independent Trustee serve as Chairman and that a key structural component for assuring that they are in a position to do so is for the Independent Trustees to constitute a substantial majority for the Board. The Independent Trustees also regularly meet in executive session. Ned C. Lautenbach and David M. Thomas serve as Co-Lead Independent Trustees and as such each (i) acts as a liaison between the Independent Trustees and management with respect to matters important to the Independent Trustees and (ii) with management prepares agendas for Board meetings.
Fidelity® funds are overseen by different Boards of Trustees. The fund's Board oversees Fidelity's high income and certain equity funds, and other Boards oversee Fidelity's investment-grade bond, money market, asset allocation, and other equity funds. The asset allocation funds may invest in Fidelity® funds overseen by the fund's Board. The use of separate Boards, each with its own committee structure, allows the Trustees of each group of Fidelity® funds to focus on the unique issues of the funds they oversee, including common research, investment, and operational issues. On occasion, the separate Boards establish joint committees to address issues of overlapping consequences for the Fidelity® funds overseen by each Board.
The Trustees operate using a system of committees to facilitate the timely and efficient consideration of all matters of importance to the Trustees, the fund, and fund shareholders and to facilitate compliance with legal and regulatory requirements and oversight of the fund's activities and associated risks. The Board, acting through its committees, has charged FMR and its affiliates with (i) identifying events or circumstances the occurrence of which could have demonstrably adverse effects on the fund's business and/or reputation; (ii) implementing processes and controls to lessen the possibility that such events or circumstances occur or to mitigate the effects of such events or circumstances if they do occur; and (iii) creating and maintaining a system designed to evaluate continuously business and market conditions in order to facilitate the identification and implementation processes described in (i) and (ii) above. Because the day-to-day operations and activities of the fund are carried out by or through FMR, its affiliates, and other service providers, the fund's exposure to risks is mitigated but not eliminated by the processes overseen by the Trustees. While each of the Board's committees has responsibility for overseeing different aspects of the fund's activities, oversight is exercised primarily through the Operations, Audit, and Compliance Committees. Appropriate personnel, including but not limited to the fund's Chief Compliance Officer (CCO), FMR's internal auditor, the independent accountants, the fund's Treasurer and portfolio management personnel, make periodic reports to the Board's committees, as appropriate, including an annual review of Fidelity's risk management program for the Fidelity® funds. The responsibilities of each standing committee, including their oversight responsibilities, are described further under "Standing Committees of the Trustees."
Interested Trustees*:
Correspondence intended for a Trustee who is an interested person may be sent to Fidelity Investments, 245 Summer Street, Boston, Massachusetts 02210.
Name, Year of Birth; Principal Occupations and Other Relevant Experience+
Jonathan Chiel (1957)
Year of Election or Appointment: 2016
Trustee
Mr. Chiel also serves as Trustee of other Fidelity® funds. Mr. Chiel is Executive Vice President and General Counsel for FMR LLC (diversified financial services company, 2012-present). Previously, Mr. Chiel served as general counsel (2004-2012) and senior vice president and deputy general counsel (2000-2004) for John Hancock Financial Services; a partner with Choate, Hall & Stewart (1996-2000) (law firm); and an Assistant United States Attorney for the United States Attorney’s Office of the District of Massachusetts (1986-95), including Chief of the Criminal Division (1993-1995). Mr. Chiel is a director on the boards of the Boston Bar Foundation and the Maimonides School.
Robert A. Lawrence (1952)
Year of Election or Appointment: 2020
Trustee
Acting Chairman of the Board of Trustees
Mr. Lawrence also serves as Trustee of other funds. Previously, Mr. Lawrence served as a Member of the Advisory Board of certain funds. Prior to his retirement in 2008, Mr. Lawrence served as Vice President of certain Fidelity® funds (2006-2008), Senior Vice President, Head of High Income Division of Fidelity Management & Research Company (investment adviser firm, 2006-2008), and President of Fidelity Strategic Investments (investment adviser firm, 2002-2005).
* Determined to be an “Interested Trustee” by virtue of, among other things, his or her affiliation with the trust or various entities under common control with FMR.
+ The information includes the Trustee's principal occupation during the last five years and other information relating to the experience, attributes, and skills relevant to the Trustee's qualifications to serve as a Trustee, which led to the conclusion that the Trustee should serve as a Trustee for the fund.
Independent Trustees:
Correspondence intended for an Independent Trustee may be sent to Fidelity Investments, P.O. Box 55235, Boston, Massachusetts 02205-5235.
Name, Year of Birth; Principal Occupations and Other Relevant Experience+
Dennis J. Dirks (1948)
Year of Election or Appointment: 2005
Trustee
Mr. Dirks also serves as Trustee of other Fidelity® funds. Prior to his retirement in May 2003, Mr. Dirks served as Chief Operating Officer and as a member of the Board of The Depository Trust & Clearing Corporation (financial markets infrastructure), President, Chief Operating Officer and a member of the Board of The Depository Trust Company (DTC), President and a member of the Board of the National Securities Clearing Corporation (NSCC), Chief Executive Officer and a member of the Board of the Government Securities Clearing Corporation and Chief Executive Officer and a member of the Board of the Mortgage-Backed Securities Clearing Corporation. Mr. Dirks currently serves as a member of the Finance Committee (2016-present) and Board (2017-present) and is Treasurer (2018-present) of the Asolo Repertory Theatre.
Donald F. Donahue (1950)
Year of Election or Appointment: 2018
Trustee
Mr. Donahue also serves as Trustee of other Fidelity® funds. Mr. Donahue serves as President and Chief Executive Officer of Miranda Partners, LLC (risk consulting for the financial services industry, 2012-present). Previously, Mr. Donahue served as Chief Executive Officer (2006-2012), Chief Operating Officer (2003-2006) and Managing Director, Customer Marketing and Development (1999-2003) of The Depository Trust & Clearing Corporation (financial markets infrastructure). Mr. Donahue currently serves as a member (2007-present) and Co-Chairman (2016-present) of the Board of United Way of New York, a member of the Board of NYC Leadership Academy (2012-present) and a member of the Board of Advisors of Ripple Labs, Inc. (financial services, 2015-present). Mr. Donahue previously served as a member of the Advisory Board of certain Fidelity® funds (2015-2018).
Vicki L. Fuller (1957)
Year of Election or Appointment: 2020
Trustee
Ms. Fuller also serves as Trustee of other Fidelity® funds. Previously, Ms. Fuller served as a member of the Advisory Board of certain Fidelity® funds (2018-2020), Chief Investment Officer of the New York State Common Retirement Fund (2012-2018) and held a variety of positions at AllianceBernstein L.P. (global asset management, 1985-2012), including Managing Director (2006-2012) and Senior Vice President and Senior Portfolio Manager (2001-2006). Ms. Fuller currently serves as a member of the Board, Audit Committee and Nominating and Governance Committee of The Williams Companies, Inc. (natural gas infrastructure, 2018-present) and as a member of the Board of Treliant, LLC (consulting, 2019-present).
Patricia L. Kampling (1959)
Year of Election or Appointment: 2020
Trustee
Ms. Kampling also serves as Trustee of other Fidelity® funds. Prior to her retirement, Ms. Kampling served as Chairman of the Board and Chief Executive Officer (2012-2019), President and Chief Operating Officer (2011-2012) and Executive Vice President and Chief Financial Officer (2010-2011) of Alliant Energy Corporation. Ms. Kampling currently serves as a member of the Board, Compensation Committee and Executive Committee and as Chair of the Audit Committee of Briggs & Stratton Corporation (manufacturing, 2011-present) and as a member of the Board, Audit, Finance and Risk Committee and Safety, Environmental, Technology and Operations Committee of American Water Works Company, Inc. (utilities company, 2019-present). In addition, Ms. Kampling currently serves as a member of the Board of the Nature Conservancy, Wisconsin Chapter (2019-present). Previously, Ms. Kampling served as a Member of the Advisory Board of certain Fidelity® funds (2020), a member of the Board of Interstate Power and Light Company (2012-2019) and Wisconsin Power and Light Company (2012-2019) (each a subsidiary of Alliant Energy Corporation) and as a member of the Board and Workforce Development Committee of the Business Roundtable (2018-2019).
Alan J. Lacy (1953)
Year of Election or Appointment: 2008
Trustee
Mr. Lacy also serves as Trustee of other Fidelity® funds. Previously, Mr. Lacy served as Senior Adviser (2007-2014) of Oak Hill Capital Partners, L.P. (private equity), Chief Executive Officer (2005) and Vice Chairman (2005-2006) of Sears Holdings Corporation (retail), Chief Executive Officer and Chairman of the Board of Sears, Roebuck and Co. (retail, 2000-2005), Chairman (2014-2017) and a member of the Board (2010-2017) of Dave & Buster’s Entertainment, Inc. (restaurant and entertainment complexes) and a member of the Board of Bristol-Myers Squibb Company (global pharmaceuticals, 2008-2020). Mr. Lacy currently serves as a Trustee of the California Chapter of The Nature Conservancy (2015-present) and a member of the Board of the Center for Advanced Study in the Behavioral Sciences at Stanford University (2015-present).
Ned C. Lautenbach (1944)
Year of Election or Appointment: 2000
Trustee
Co-Lead Independent Trustee
Mr. Lautenbach also serves as Trustee of other Fidelity® funds. Mr. Lautenbach currently serves as Chair of the Board of Governors, State University System of Florida (2013-present) and is a member of the Council on Foreign Relations (1994-present). He is also a member and has in the past served as Chairman of the Board of Directors of Artis-Naples (2012-present). Previously, Mr. Lautenbach served as a member and then Lead Director of the Board of Directors of Eaton Corporation (diversified industrial, 1997-2016). He was also a Partner at Clayton, Dubilier & Rice, LLC (private equity investment, 1998-2010); as well as Director of Sony Corporation (2006-2007). In addition, Mr. Lautenbach had a 30-year career with IBM (technology company), during which time he served as Senior Vice President and as a member of the Corporate Executive Committee (1968-1998).
Joseph Mauriello (1944)
Year of Election or Appointment: 2008
Trustee
Mr. Mauriello also serves as Trustee of other Fidelity® funds. Prior to his retirement in January 2006, Mr. Mauriello served in numerous senior management positions including Deputy Chairman and Chief Operating Officer (2004-2005), and Vice Chairman of Financial Services (2002-2004) of KPMG LLP US (professional services, 1965-2005). Mr. Mauriello currently serves as a member of the Independent Directors Council Governing Council (2015-present). Previously, Mr. Mauriello served as a member of the Board of XL Group plc. (global insurance and re-insurance, 2006-2018).
Cornelia M. Small (1944)
Year of Election or Appointment: 2005
Trustee
Ms. Small also serves as Trustee of other Fidelity® funds. Previously, Ms. Small served as Chief Investment Officer, Director of Global Equity Investments and a member of Scudder, Stevens & Clark and Scudder Kemper Investments. Ms. Small previously served as a member of the Board (2009-2019) and Chair of the Investment Committee (2010-2019) of the Teagle Foundation and a member of the Investment Committee of the Berkshire Taconic Community Foundation (2008-2019).
Garnett A. Smith (1947)
Year of Election or Appointment: 2018
Trustee
Mr. Smith also serves as Trustee of other Fidelity® funds. Prior to his retirement, Mr. Smith served as Chairman and Chief Executive Officer (1990-1997) and President (1986-1990) of Inbrand Corp. (manufacturer of personal absorbent products). Prior to his employment with Inbrand Corp., he was employed by a retail fabric chain and North Carolina National Bank (now Bank of America). Mr. Smith previously served as a member of the Advisory Board of certain Fidelity® funds (2012-2013).
David M. Thomas (1949)
Year of Election or Appointment: 2008
Trustee
Co-Lead Independent Trustee
Mr. Thomas also serves as Trustee of other Fidelity® funds. Previously, Mr. Thomas served as Executive Chairman (2005-2006) and Chairman and Chief Executive Officer (2000-2005) of IMS Health, Inc. (pharmaceutical and healthcare information solutions). Mr. Thomas currently serves as Non-Executive Chairman of the Board of Fortune Brands Home and Security (home and security products, 2011-present), and a member of the Board (2004-present) and Presiding Director (2013-present) of Interpublic Group of Companies, Inc. (marketing communication).
Susan Tomasky (1953)
Year of Election or Appointment: 2020
Trustee
Ms. Tomasky also serves as Trustee of other Fidelity® funds. Prior to her retirement, Ms. Tomasky served in various executive officer positions at American Electric Power Company, Inc. (1998-2011), including most recently as President of AEP Transmission (2007-2011). Ms. Tomasky currently serves as a member of the Board and Sustainability Committee and as Chair of the Audit Committee of Marathon Petroleum Corporation (2018-present) and as a member of the Board, Corporate Governance Committee and Organization and Compensation Committee and as Chair of the Audit Committee of Public Service Enterprise Group, Inc. (utilities company, 2012-present). In addition, Ms. Tomasky currently serves as a member of the Board of the Columbus Regional Airport Authority (2007-present), as a member of the Board of the Royal Shakespeare Company – America (2009-present), as a member of the Board of the Columbus Association for the Performing Arts (2011-present) and as a member of the Board of Kenyon College (2016-present). Previously, Ms. Tomasky served as a Member of the Advisory Board of certain Fidelity® funds (2020), a member of the Board (2011-2019) and as Lead Independent Director (2015-2018) of Andeavor Corporation (previously Tesoro Corporation) (independent oil refiner and marketer) and as a member of the Board of Summit Midstream Partners LP (energy, 2012-2018).
Michael E. Wiley (1950)
Year of Election or Appointment: 2020
Trustee
Mr. Wiley also serves as Trustee of other Fidelity® funds. Previously, Mr. Wiley served as a member of the Advisory Board of certain Fidelity® funds (2018-2020), Chairman, President and CEO of Baker Hughes, Inc. (oilfield services, 2000-2004). Mr. Wiley also previously served as a member of the Board of Andeavor Corporation (independent oil refiner and marketer, 2005-2018), a member of the Board of Andeavor Logistics LP (natural resources logistics, 2015-2018) and a member of the Board of High Point Resources (exploration and production, 2005-2020).
+ The information includes the Trustee's principal occupation during the last five years and other information relating to the experience, attributes, and skills relevant to the Trustee's qualifications to serve as a Trustee, which led to the conclusion that the Trustee should serve as a Trustee for the fund.
Advisory Board Members and Officers:
Correspondence intended for a Member of the Advisory Board (if any) may be sent to Fidelity Investments, P.O. Box 55235, Boston, Massachusetts 02205-5235. Correspondence intended for an officer or Peter S. Lynch may be sent to Fidelity Investments, 245 Summer Street, Boston, Massachusetts 02210. Officers appear below in alphabetical order.
Name, Year of Birth; Principal Occupation
Peter S. Lynch (1944)
Year of Election or Appointment: 2003
Member of the Advisory Board
Mr. Lynch also serves as a Member of the Advisory Board of other Fidelity® funds. Mr. Lynch is Vice Chairman and a Director of Fidelity Management & Research Company LLC (investment adviser firm). In addition, Mr. Lynch serves as a Trustee of Boston College and as the Chairman of the Inner-City Scholarship Fund. Previously, Mr. Lynch served as Vice Chairman and a Director of FMR Co., Inc. (investment adviser firm) and on the Special Olympics International Board of Directors (1997-2006).
Elizabeth Paige Baumann (1968)
Year of Election or Appointment: 2017
Anti-Money Laundering (AML) Officer
Ms. Baumann also serves as AML Officer of other funds. She is Chief AML Officer (2012-present) and Senior Vice President (2014-present) of FMR LLC (diversified financial services company) and is an employee of Fidelity Investments. Previously, Ms. Baumann served as AML Officer of certain funds (2017-2019), as AML Officer of the funds (2012-2016), and Vice President (2007-2014) and Deputy Anti-Money Laundering Officer (2007-2012) of FMR LLC.
Craig S. Brown (1977)
Year of Election or Appointment: 2019
Assistant Treasurer
Mr. Brown also serves as Assistant Treasurer of other funds. Mr. Brown is an employee of Fidelity Investments (2013-present).
John J. Burke III (1964)
Year of Election or Appointment: 2018
Chief Financial Officer
Mr. Burke also serves as Chief Financial Officer of other funds. Mr. Burke serves as Head of Investment Operations for Fidelity Fund and Investment Operations (2018-present) and is an employee of Fidelity Investments (1998-present). Previously Mr. Burke served as head of Asset Management Investment Operations (2012-2018).
William C. Coffey (1969)
Year of Election or Appointment: 2019
Assistant Secretary
Mr. Coffey also serves as Assistant Secretary of other funds. He is Senior Vice President and Deputy General Counsel of FMR LLC (diversified financial services company, 2010-present), and is an employee of Fidelity Investments. Previously, Mr. Coffey served as Secretary and CLO of certain funds (2018-2019); CLO, Secretary, and Senior Vice President of Fidelity Management & Research Company and FMR Co., Inc. (investment adviser firms, 2018-2019); Secretary of Fidelity SelectCo, LLC and Fidelity Investments Money Management, Inc. (investment adviser firms, 2018-2019); CLO of Fidelity Management & Research (Hong Kong) Limited, FMR Investment Management (UK) Limited, and Fidelity Management & Research (Japan) Limited (investment adviser firms, 2018-2019); and Assistant Secretary of certain funds (2009-2018).
Timothy M. Cohen (1969)
Year of Election or Appointment: 2018
Vice President
Mr. Cohen also serves as Vice President of other funds. Mr. Cohen serves as Co-Head of Equity (2018-present), a Director of Fidelity Management & Research (Japan) Limited (investment adviser firm, 2016-present), and is an employee of Fidelity Investments. Previously, Mr. Cohen served as Executive Vice President of Fidelity SelectCo, LLC (2019), Head of Global Equity Research (2016-2018), Chief Investment Officer - Equity and a Director of Fidelity Management & Research (U.K.) Inc. (investment adviser firm, 2013-2015) and as a Director of Fidelity Management & Research (Hong Kong) Limited (investment adviser firm, 2017).
Jonathan Davis (1968)
Year of Election or Appointment: 2010
Assistant Treasurer
Mr. Davis also serves as Assistant Treasurer of other funds. Mr. Davis serves as Assistant Treasurer of FMR Capital, Inc. (2017-present) and is an employee of Fidelity Investments. Previously, Mr. Davis served as Vice President and Associate General Counsel of FMR LLC (diversified financial services company, 2003-2010).
Laura M. Del Prato (1964)
Year of Election or Appointment: 2018
Assistant Treasurer
Ms. Del Prato also serves as an officer of other funds. Ms. Del Prato is an employee of Fidelity Investments (2017-present). Previously, Ms. Del Prato served as President and Treasurer of The North Carolina Capital Management Trust: Cash Portfolio and Term Portfolio (2018-2020). Prior to joining Fidelity Investments, Ms. Del Prato served as a Managing Director and Treasurer of the JPMorgan Mutual Funds (2014-2017). Prior to JPMorgan, Ms. Del Prato served as a partner at Cohen Fund Audit Services (accounting firm, 2012-2013) and KPMG LLP (accounting firm, 2004-2012).
Colm A. Hogan (1973)
Year of Election or Appointment: 2020
Assistant Treasurer
Mr. Hogan also serves as an officer of other funds. Mr. Hogan serves as Assistant Treasurer of FMR Capital, Inc. (2017-present) and is an employee of Fidelity Investments (2005-present). Previously, Mr. Hogan served as Deputy Treasurer of certain Fidelity® funds (2016-2020) and Assistant Treasurer of certain Fidelity® funds (2016-2018).
Pamela R. Holding (1964)
Year of Election or Appointment: 2018
Vice President
Ms. Holding also serves as Vice President of other funds. Ms. Holding serves as Co-Head of Equity (2018-present) and is an employee of Fidelity Investments (2013-present). Previously, Ms. Holding served as Executive Vice President of Fidelity SelectCo, LLC (2019) and as Chief Investment Officer of Fidelity Institutional Asset Management (2013-2018).
Cynthia Lo Bessette (1969)
Year of Election or Appointment: 2019
Secretary and Chief Legal Officer (CLO)
Ms. Lo Bessette also serves as an officer of other funds. Ms. Lo Bessette serves as CLO, Secretary, and Senior Vice President of Fidelity Management & Research Company LLC (investment adviser firm, 2019-present); and CLO of Fidelity Management & Research (Hong Kong) Limited, FMR Investment Management (UK) Limited, and Fidelity Management & Research (Japan) Limited (investment adviser firms, 2019-present). She is a Senior Vice President and Deputy General Counsel of FMR LLC (diversified financial services company, 2019-present), and is an employee of Fidelity Investments. Previously, Ms. Lo Bessette served as CLO, Secretary, and Senior Vice President of FMR Co., Inc. (investment adviser firm, 2019); Secretary of Fidelity SelectCo, LLC and Fidelity Investments Money Management, Inc. (investment adviser firms, 2019). Prior to joining Fidelity Investments, Ms. Lo Bessette was Executive Vice President, General Counsel (2016-2019) and Senior Vice President, Deputy General Counsel (2015-2016) of OppenheimerFunds (investment management company) and Deputy Chief Legal Officer (2013-2015) of Jennison Associates LLC (investment adviser firm).
Chris Maher (1972)
Year of Election or Appointment: 2020
Deputy Treasurer
Mr. Maher also serves as an officer of other funds. Mr. Maher serves as Assistant Treasurer of FMR Capital, Inc. (2017-present), and is an employee of Fidelity Investments (2008-present). Previously, Mr. Maher served as Assistant Treasurer of certain funds (2013-2020); Vice President of Asset Management Compliance (2013), Vice President of the Program Management Group of FMR (investment adviser firm, 2010-2013), and Vice President of Valuation Oversight (2008-2010).
Jason P. Pogorelec (1975)
Year of Election or Appointment: 2020
Chief Compliance Officer
Mr. Pogorelec also serves as Chief Compliance Officer of other funds. Mr. Pogorelec is a senior Vice President of Asset Management Compliance for Fidelity Investments and is an employee of Fidelity Investments (2006-present). Previously, Mr. Pogorelec served as Vice President, Associate General Counsel for Fidelity Investments (2010-2020) and Assistant Secretary of certain Fidelity funds (2015-2020).
Stacie M. Smith (1974)
Year of Election or Appointment: 2016
President and Treasurer
Ms. Smith also serves as an officer of other funds. Ms. Smith serves as Assistant Treasurer of FMR Capital, Inc. (2017-present), is an employee of Fidelity Investments (2009-present), and has served in other fund officer roles. Prior to joining Fidelity Investments, Ms. Smith served as Senior Audit Manager of Ernst & Young LLP (accounting firm, 1996-2009). Previously, Ms. Smith served as Assistant Treasurer (2013-2019) and Deputy Treasurer (2013-2016) of certain Fidelity® funds.
Marc L. Spector (1972)
Year of Election or Appointment: 2016
Assistant Treasurer
Mr. Spector also serves as an officer of other funds. Mr. Spector serves as Assistant Treasurer of FMR Capital, Inc. (2017-present) and is an employee of Fidelity Investments (2016-present). Prior to joining Fidelity Investments, Mr. Spector served as Director at the Siegfried Group (accounting firm, 2013-2016), and prior to Siegfried Group as audit senior manager at Deloitte & Touche LLP (accounting firm, 2005-2013).
Jim Wegmann (1979)
Year of Election or Appointment: 2019
Assistant Treasurer
Mr. Wegmann also serves as Assistant Treasurer of other funds. Mr. Wegmann is an employee of Fidelity Investments (2011-present).
Shareholder Expense Example
As a shareholder, you incur two types of costs: (1) transaction costs, which may include sales charges (loads) on purchase payments or redemption proceeds, as applicable and (2) ongoing costs, which generally include management fees, distribution and/or service (12b-1) fees and other Fund expenses. This Example is intended to help you understand your ongoing costs (in dollars) of investing in a fund and to compare these costs with the ongoing costs of investing in other mutual funds.
The Example is based on an investment of $1,000 invested at the beginning of the period and held for the entire period (February 1, 2020 to July 31, 2020).
Actual Expenses
The first line of the accompanying table provides information about actual account values and actual expenses. You may use the information in this line, together with the amount you invested, to estimate the expenses that you paid over the period. Simply divide your account value by $1,000.00 (for example, an $8,600 account value divided by $1,000.00 = 8.6), then multiply the result by the number in the first line for a class/Fund under the heading entitled "Expenses Paid During Period" to estimate the expenses you paid on your account during this period. If any fund is a shareholder of any underlying mutual funds or exchange-traded funds (ETFs) (the Underlying Funds), such fund indirectly bears its proportional share of the expenses of the Underlying Funds in addition to the direct expenses incurred presented in the table. These fees and expenses are not included in the annualized expense ratio used to calculate the expense estimate in the table below.
Hypothetical Example for Comparison Purposes
The second line of the accompanying table provides information about hypothetical account values and hypothetical expenses based on the actual expense ratio and an assumed rate of return of 5% per year before expenses, which is not the actual return. The hypothetical account values and expenses may not be used to estimate the actual ending account balance or expenses you paid for the period. You may use this information to compare the ongoing costs of investing in the Fund and other funds. To do so, compare this 5% hypothetical example with the 5% hypothetical examples that appear in the shareholder reports of the other funds. If any fund is a shareholder of any Underlying Funds, such fund indirectly bears its proportional share of the expenses of the Underlying Funds in addition to the direct expenses as presented in the table. These fees and expenses are not included in the annualized expense ratio used to calculate the expense estimate in the table below.
Please note that the expenses shown in the table are meant to highlight your ongoing costs only and do not reflect any transaction costs. Therefore, the second line of the table is useful in comparing ongoing costs only, and will not help you determine the relative total costs of owning different funds.
| | Annualized Expense Ratio-A | Beginning
Account Value
February 1, 2020 | Ending
Account Value
July 31, 2020 | Expenses Paid
During Period-B
February 1, 2020
to July 31, 2020 |
| Fidelity OTC Portfolio | | | | |
| OTC | .85% | | | |
| Actual | | $1,000.00 | $1,190.70 | $4.63 |
| Hypothetical-C | | $1,000.00 | $1,020.64 | $4.27 |
| Class K | .75% | | | |
| Actual | | $1,000.00 | $1,191.30 | $4.09 |
| Hypothetical-C | | $1,000.00 | $1,021.13 | $3.77 |
A Annualized expense ratio reflects expenses net of applicable fee waivers.
B Expenses are equal to the annualized expense ratio, multiplied by the average account value over the period, multiplied by 182/ 366 (to reflect the one-half year period). The fees and expenses of any Underlying Funds are not included in each annualized expense ratio.
C 5% return per year before expenses
Distributions (Unaudited)
The Board of Trustees of Fidelity OTC Portfolio voted to pay to shareholders of record at the opening of business on record date, the following distributions per share derived from capital gains realized from sales of portfolio securities, and dividends derived from net investment income:
| | Pay Date | Record Date | Dividends | Capital Gains |
| Fidelity OTC Portfolio | | | | |
| OTC | 09/14/2020 | 09/11/2020 | $0.007 | $0.993 |
| Class K | 09/14/2020 | 09/11/2020 | $0.014 | $0.993 |
|
The fund hereby designates as a capital gain dividend with respect to the taxable year ended July 31, 2020, $1,654,969,402, or, if subsequently determined to be different, the net capital gain of such year.
Class K designates 100% of the dividend distributed in December 2019, during the fiscal year as qualifying for the dividends–received deduction for corporate shareholders
Class K designates 100% of the dividend distributed during the fiscal year as amounts which may be taken into account as a dividend for purposes of the maximum rate under section 1(h)(11) of the Internal Revenue Code.
The fund will notify shareholders in January 2021 of amounts for use in preparing 2020 income tax returns.
Liquidity Risk Management Program
The Securities and Exchange Commission adopted Rule 22e-4 under the Investment Company Act of 1940 (the Liquidity Rule) to promote effective liquidity risk management throughout the open-end investment company industry, thereby reducing the risk that funds will be unable to meet their redemption obligations and mitigating dilution of the interests of fund shareholders.
The Fund has adopted and implemented a liquidity risk management program pursuant to the Liquidity Rule (the Program) effective December 1, 2018. The Program is reasonably designed to assess and manage the Fund’s liquidity risk and to comply with the requirements of the Liquidity Rule. The Fund’s Board of Trustees (the Board) has designated the Fund’s investment adviser as administrator of the Program. The Fidelity advisers have established a Liquidity Risk Management Committee (the LRM Committee) to manage the Program for each of the Fidelity Funds. The LRM Committee monitors the adequacy and effectiveness of implementation of the Program and on a periodic basis assesses each Fund’s liquidity risk based on a variety of factors including (1) the Fund’s investment strategy, (2) portfolio liquidity and cash flow projections during normal and reasonably foreseeable stressed conditions, (3) shareholder redemptions, (4) borrowings and other funding sources and (5) in the case of exchange-traded funds, certain additional factors including the effect of the Fund’s prices and spreads, market participants, and basket compositions on the overall liquidity of the Fund’s portfolio, as applicable.
In accordance with the Program, each of the Fund’s portfolio investments is classified into one of four liquidity categories described below based on a determination of a reasonable expectation for how long it would take to convert the investment to cash (or sell or dispose of the investment) without significantly changing its market value.
- Highly liquid investments – cash or convertible to cash within three business days or less
- Moderately liquid investments – convertible to cash in three to seven calendar days
- Less liquid investments – can be sold or disposed of, but not settled, within seven calendar days
- Illiquid investments – cannot be sold or disposed of within seven calendar days
Liquidity classification determinations take into account a variety of factors including various market, trading and investment-specific considerations, as well as market depth, and generally utilize analysis from a third-party liquidity metrics service.
The Liquidity Rule places a 15% limit on a fund’s illiquid investments and requires funds that do not primarily hold assets that are highly liquid investments to determine and maintain a minimum percentage of the fund’s net assets to be invested in highly liquid investments (highly liquid investment minimum or HLIM). The Program includes provisions reasonably designed to comply with the 15% limit on illiquid investments and for determining, periodically reviewing and complying with the HLIM requirement as applicable.
At a recent meeting of the Fund’s Board of Trustees, the LRM Committee provided a written report to the Board pertaining to the operation, adequacy, and effectiveness of implementation of the Program for the annual period from December 1, 2018 through November 30, 2019. The report concluded that the Program has been implemented and is operating effectively and is reasonably designed to assess and manage the Fund’s liquidity risk.
Proxy Voting Results
A special meeting of shareholders was held on June 9, 2020. The results of votes taken among shareholders on the proposal before them are reported below. Each vote reported represents one dollar of net asset value held on the record date for the meeting.
PROPOSAL 1
To elect a Board of Trustees.
| | # of
Votes | % of
Votes |
| Dennis J. Dirks |
| Affirmative | 43,167,428,219.785 | 94.885 |
| Withheld | 2,327,070,930.034 | 5.115 |
| TOTAL | 45,494,499,149.820 | 100.000 |
| Donald F. Donahue |
| Affirmative | 43,161,668,935.467 | 94.872 |
| Withheld | 2,333,065,287.611 | 5.128 |
| TOTAL | 45,494,734,223.077 | 100.000 |
| Bettina Doulton |
| Affirmative | 43,304,465,213.969 | 95.186 |
| Withheld | 2,190,010,062.903 | 4.814 |
| TOTAL | 45,494,475,276.872 | 100.000 |
| Vicki L. Fuller |
| Affirmative | 43,380,442,631.493 | 95.353 |
| Withheld | 2,114,180,614.639 | 4.647 |
| TOTAL | 45,494,623,246.132 | 100.000 |
| Patricia L. Kampling |
| Affirmative | 43,128,008,796.761 | 94.798 |
| Withheld | 2,366,685,422.999 | 5.202 |
| TOTAL | 45,494,694,219.760 | 100.000 |
| Alan J. Lacy |
| Affirmative | 42,904,065,046.958 | 94.305 |
| Withheld | 2,590,717,567.229 | 5.695 |
| TOTAL | 45,494,782,614.187 | 100.000 |
| Ned C. Lautenbach |
| Affirmative | 42,802,778,827.017 | 94.083 |
| Withheld | 2,692,003,787.170 | 5.917 |
| TOTAL | 45,494,782,614.187 | 100.000 |
| Robert A. Lawrence |
| Affirmative | 42,971,258,294.203 | 94.453 |
| Withheld | 2,523,524,319.984 | 5.547 |
| TOTAL | 45,494,782,614.187 | 100.000 |
| Joseph Mauriello |
| Affirmative | 42,874,562,778.490 | 94.241 |
| Withheld | 2,620,171,874.731 | 5.759 |
| TOTAL | 45,494,734,653.220 | 100.000 |
| Cornelia M. Small |
| Affirmative | 43,029,040,988.063 | 94.580 |
| Withheld | 2,465,741,626.124 | 5.420 |
| TOTAL | 45,494,782,614.187 | 100.000 |
| Garnett A. Smith |
| Affirmative | 42,892,814,945.159 | 94.281 |
| Withheld | 2,601,967,669.028 | 5.719 |
| TOTAL | 45,494,782,614.187 | 100.000 |
| David M. Thomas |
| Affirmative | 42,936,080,036.111 | 94.376 |
| Withheld | 2,558,702,578.076 | 5.624 |
| TOTAL | 45,494,782,614.187 | 100.000 |
| Susan Tomasky |
| Affirmative | 43,147,934,105.796 | 94.842 |
| Withheld | 2,346,571,066.028 | 5.158 |
| TOTAL | 45,494,782,614.187 | 100.000 |
| Michael E. Wiley |
| Affirmative | 42,885,333,102.972 | 94.264 |
| Withheld | 2,609,449,511.215 | 5.736 |
| TOTAL | 45,494,782,614.187 | 100.000 |
|
| Proposal 1 reflects trust wide proposal and voting results. |

OTC-ANN-0920
1.536191.123
Fidelity® Growth & Income Portfolio
Annual Report
July 31, 2020
See the inside front cover for important information about access to your fund’s shareholder reports.
Beginning on January 1, 2021, as permitted by regulations adopted by the Securities and Exchange Commission, paper copies of a fund’s shareholder reports will no longer be sent by mail, unless you specifically request paper copies of the reports from the fund or from your financial intermediary, such as a financial advisor, broker-dealer or bank. Instead, the reports will be made available on a website, and you will be notified by mail each time a report is posted and provided with a website link to access the report.
If you already elected to receive shareholder reports electronically, you will not be affected by this change and you need not take any action. You may elect to receive shareholder reports and other communications from a fund electronically, by contacting your financial intermediary. For Fidelity customers, visit Fidelity's web site or call Fidelity using the contact information listed below.
You may elect to receive all future reports in paper free of charge. If you wish to continue receiving paper copies of your shareholder reports, you may contact your financial intermediary or, if you are a Fidelity customer, visit Fidelity’s website, or call Fidelity at the applicable toll-free number listed below. Your election to receive reports in paper will apply to all funds held with the fund complex/your financial intermediary.
| Account Type | Website | Phone Number |
| Brokerage, Mutual Fund, or Annuity Contracts: | fidelity.com/mailpreferences | 1-800-343-3548 |
| Employer Provided Retirement Accounts: | netbenefits.fidelity.com/preferences (choose 'no' under Required Disclosures to continue to print) | 1-800-343-0860 |
| Advisor Sold Accounts Serviced Through Your Financial Intermediary: | Contact Your Financial Intermediary | Your Financial Intermediary's phone number |
| Advisor Sold Accounts Serviced by Fidelity: | institutional.fidelity.com | 1-877-208-0098 |
Contents
To view a fund's proxy voting guidelines and proxy voting record for the 12-month period ended June 30, visit http://www.fidelity.com/proxyvotingresults or visit the Securities and Exchange Commission's (SEC) web site at http://www.sec.gov.
You may also call 1-800-544-8544 if you’re an individual investing directly with Fidelity, call 1-800-835-5092 if you’re a plan sponsor or participant with Fidelity as your recordkeeper or call 1-877-208-0098 on institutional accounts or if you’re an advisor or invest through one to request a free copy of the proxy voting guidelines.
Standard & Poor's, S&P and S&P 500 are registered service marks of The McGraw-Hill Companies, Inc. and have been licensed for use by Fidelity Distributors Corporation.
Other third-party marks appearing herein are the property of their respective owners.
All other marks appearing herein are registered or unregistered trademarks or service marks of FMR LLC or an affiliated company. © 2020 FMR LLC. All rights reserved.
This report and the financial statements contained herein are submitted for the general information of the shareholders of the Fund. This report is not authorized for distribution to prospective investors in the Fund unless preceded or accompanied by an effective prospectus.
A fund files its complete schedule of portfolio holdings with the SEC for the first and third quarters of each fiscal year on Form N-PORT. Forms N-PORT are available on the SEC’s web site at http://www.sec.gov. A fund's Forms N-PORT may be reviewed and copied at the SEC’s Public Reference Room in Washington, DC. Information regarding the operation of the SEC's Public Reference Room may be obtained by calling 1-800-SEC-0330.
For a complete list of a fund's portfolio holdings, view the most recent holdings listing, semiannual report, or annual report on Fidelity's web site at http://www.fidelity.com, http://www.institutional.fidelity.com, or http://www.401k.com, as applicable.
NOT FDIC INSURED •MAY LOSE VALUE •NO BANK GUARANTEE
Neither the Fund nor Fidelity Distributors Corporation is a bank.
Note to Shareholders:
Early in 2020, the outbreak and spread of a new coronavirus emerged as a public health emergency that had a major influence on financial markets, primarily based on its impact on the global economy and the outlook for corporate earnings. The virus causes a respiratory disease known as COVID-19. On March 11, the World Health Organization declared the COVID-19 outbreak a pandemic, citing sustained risk of further global spread.
In the weeks following, as the crisis worsened, we witnessed an escalating human tragedy with wide-scale social and economic consequences from coronavirus-containment measures. The outbreak of COVID-19 prompted a number of measures to limit the spread, including travel and border restrictions, quarantines, and restrictions on large gatherings. In turn, these resulted in lower consumer activity, diminished demand for a wide range of products and services, disruption in manufacturing and supply chains, and – given the wide variability in outcomes regarding the outbreak – significant market uncertainty and volatility. Amid the turmoil, the U.S. government took unprecedented action – in concert with the U.S. Federal Reserve and central banks around the world – to help support consumers, businesses, and the broader economy, and to limit disruption to the financial system.
The situation continues to unfold, and the extent and duration of its impact on financial markets and the economy remain highly uncertain. Extreme events such as the coronavirus crisis are “exogenous shocks” that can have significant adverse effects on mutual funds and their investments. Although multiple asset classes may be affected by market disruption, the duration and impact may not be the same for all types of assets.
Fidelity is committed to helping you stay informed amid news about COVID-19 and during increased market volatility, and we’re taking extra steps to be responsive to customer needs. We encourage you to visit our websites, where we offer ongoing updates, commentary, and analysis on the markets and our funds.
Performance: The Bottom Line
Average annual total return reflects the change in the value of an investment, assuming reinvestment of distributions from dividend income and capital gains (the profits earned upon the sale of securities that have grown in value, if any) and assuming a constant rate of performance each year. The hypothetical investment and the average annual total returns do not reflect the deduction of taxes that a shareholder would pay on fund distributions or the redemption of fund shares. During periods of reimbursement by Fidelity, a fund’s total return will be greater than it would be had the reimbursement not occurred. How a fund did yesterday is no guarantee of how it will do tomorrow.
Average Annual Total Returns
| For the periods ended July 31, 2020 | Past 1 year | Past 5 years | Past 10 years |
| Fidelity® Growth & Income Portfolio | 1.27% | 6.88% | 11.53% |
| Class K | 1.39% | 7.01% | 11.68% |
$10,000 Over 10 Years
Let's say hypothetically that $10,000 was invested in Fidelity® Growth & Income Portfolio, a class of the fund, on July 31, 2010.
The chart shows how the value of your investment would have changed, and also shows how the S&P 500® Index performed over the same period.
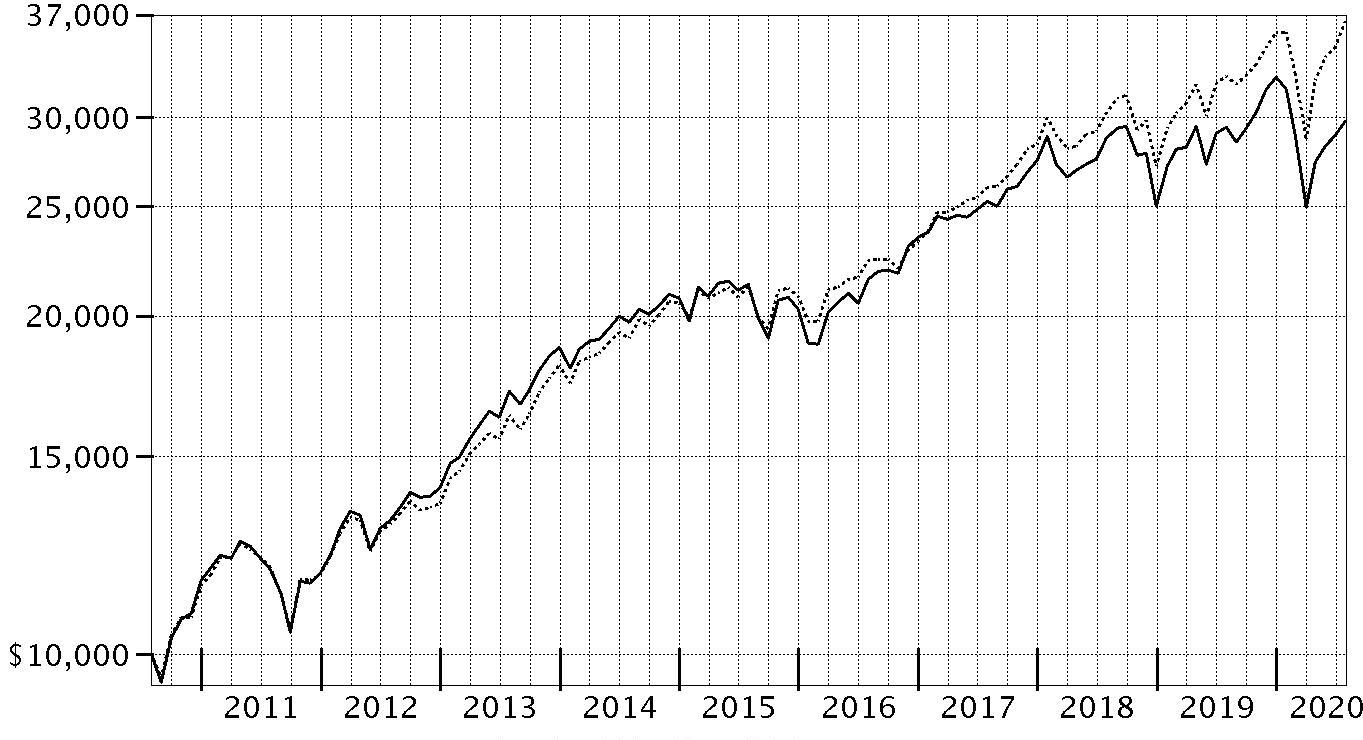
| Period Ending Values |
| $29,782 | Fidelity® Growth & Income Portfolio |
| $36,558 | S&P 500® Index |
Management's Discussion of Fund Performance
Market Recap: The S&P 500
® index gained 11.96% for the 12 months ending July 31, 2020, in what was a bumpy ride for U.S. equity investors, marked by a steep but brief decline due to the early-2020 outbreak and spread of the coronavirus, followed by a historic rebound. Declared a pandemic on March 11, the COVID-19 crisis and containment efforts caused broad contraction in economic activity, along with extreme uncertainty, volatility and dislocation in financial markets. By mid-March, U.S. stocks entered bear-market territory less than a month after hitting an all-time high and extending the longest-running bull market in American history. Stocks slid in late February, after a surge in COVID-19 cases outside China. The sudden downtrend continued in March (-12%), capping the index’s worst quarter since 2008. A historically rapid and expansive U.S. monetary/fiscal-policy response provided a partial offset to the economic disruption and fueled a sharp uptrend. Aggressive support for financial markets by the U.S. Federal Reserve, plans for reopening the economy and improving infection data boosted stocks in April (+13%) and May (+5%). In June and July, the index gained amid progress on potential treatments and signs of an early recovery in economic activity. For the full 12 months, growth stocks widely topped value, while large-caps handily bested smaller-caps. The information technology sector (+39%) led the way, followed by consumer discretionary (+22%). In contrast, energy (-38%) fell hard along with the price of crude oil.
Comments from Portfolio Manager Matt Fruhan: For the fiscal year ending July 31, 2020, the fund's share classes gained about 1%, underperforming the 11.96% result of the benchmark S&P 500
® Index. The primary detractor from performance versus the benchmark was overweighting in the lagging energy sector. An underweighting in the outperforming information technology also hurt. Also detracting from performance was stock selection and an overweighting in the financials sector, especially within the banks industry. The biggest individual relative detractor was an overweight position in General Electric (-42%). General Electric was among the largest holdings in the fund. Another notable relative detractor was an outsized stake in Exxon Mobil (-40%), which also was among our biggest holdings. Another notable relative detractor was an overweighting in Wells Fargo (-47%), another large position in the fund. Conversely, the largest contributor to performance versus the benchmark was positioning in the real estate sector. An overweighting in the health care sector, especially within the pharmaceuticals, biotechnology & life sciences industry, also helped. Also bolstering the fund's relative performance was stock picks in information technology. The biggest individual relative contributor was an overweight position in Qualcomm (+49%). Qualcomm was among the biggest holdings at period end. Also bolstering performance was our outsized stake in Bristol-Myers Squibb, which gained 35% and was among the largest holdings in the fund the past 12 months. Avoiding Chevron, a benchmark component that returned -29%, aided performance. Notable changes in positioning include increased exposure to the information technology sector and a lower allocation to energy.
The views expressed above reflect those of the portfolio manager(s) only through the end of the period as stated on the cover of this report and do not necessarily represent the views of Fidelity or any other person in the Fidelity organization. Any such views are subject to change at any time based upon market or other conditions and Fidelity disclaims any responsibility to update such views. These views may not be relied on as investment advice and, because investment decisions for a Fidelity fund are based on numerous factors, may not be relied on as an indication of trading intent on behalf of any Fidelity fund.
Investment Summary (Unaudited)
Top Ten Stocks as of July 31, 2020
| | % of fund's net assets |
| Microsoft Corp. | 6.7 |
| Comcast Corp. Class A | 3.9 |
| Apple, Inc. | 3.7 |
| Altria Group, Inc. | 3.6 |
| General Electric Co. | 3.6 |
| Exxon Mobil Corp. | 3.5 |
| Bank of America Corp. | 2.9 |
| Qualcomm, Inc. | 2.5 |
| Wells Fargo & Co. | 2.5 |
| Bristol-Myers Squibb Co. | 2.3 |
| | 35.2 |
Top Five Market Sectors as of July 31, 2020
| | % of fund's net assets |
| Information Technology | 20.4 |
| Health Care | 18.4 |
| Financials | 14.9 |
| Industrials | 13.2 |
| Consumer Staples | 8.9 |
Asset Allocation (% of fund's net assets)
| As of July 31, 2020*,** |
| | Stocks | 97.1% |
| | Convertible Securities | 0.5% |
| | Other Investments | 0.1% |
| | Short-Term Investments and Net Other Assets (Liabilities) | 2.3% |

* Foreign investments - 13.6%
** Written options - (0.0)%
Percentages shown as 0.0% may reflect amounts less than 0.05%.
Schedule of Investments July 31, 2020
Showing Percentage of Net Assets
| Common Stocks - 97.1% | | | |
| | | Shares | Value (000s) |
| COMMUNICATION SERVICES - 7.8% | | | |
| Diversified Telecommunication Services - 1.2% | | | |
| Verizon Communications, Inc. | | 1,316,274 | $75,659 |
| Entertainment - 2.2% | | | |
| Activision Blizzard, Inc. | | 477,800 | 39,481 |
| The Walt Disney Co. | | 353,900 | 41,385 |
| Vivendi SA | | 2,018,100 | 53,553 |
| Warner Music Group Corp. Class A | | 269,600 | 8,128 |
| | | | 142,547 |
| Media - 4.4% | | | |
| Comcast Corp. Class A | | 5,936,900 | 254,099 |
| Interpublic Group of Companies, Inc. | | 1,608,000 | 29,024 |
| Omnicom Group, Inc. | | 87,700 | 4,712 |
| | | | 287,835 |
|
| TOTAL COMMUNICATION SERVICES | | | 506,041 |
|
| CONSUMER DISCRETIONARY - 3.3% | | | |
| Auto Components - 0.7% | | | |
| BorgWarner, Inc. | | 1,219,297 | 44,626 |
| Automobiles - 0.1% | | | |
| Harley-Davidson, Inc. | | 295,600 | 7,694 |
| Hotels, Restaurants & Leisure - 0.2% | | | |
| Starbucks Corp. | | 195,000 | 14,923 |
| Household Durables - 0.7% | | | |
| Mohawk Industries, Inc. (a) | | 2,600 | 208 |
| Whirlpool Corp. | | 262,600 | 42,835 |
| | | | 43,043 |
| Specialty Retail - 1.4% | | | |
| Lowe's Companies, Inc. | | 565,379 | 84,191 |
| TJX Companies, Inc. | | 50,000 | 2,600 |
| | | | 86,791 |
| Textiles, Apparel & Luxury Goods - 0.2% | | | |
| NIKE, Inc. Class B | | 130,600 | 12,748 |
| Puma AG | | 9,693 | 752 |
| Tapestry, Inc. | | 130,800 | 1,747 |
| | | | 15,247 |
|
| TOTAL CONSUMER DISCRETIONARY | | | 212,324 |
|
| CONSUMER STAPLES - 8.9% | | | |
| Beverages - 1.7% | | | |
| Anheuser-Busch InBev SA NV ADR (b) | | 184,300 | 10,031 |
| Diageo PLC sponsored ADR | | 97,900 | 14,415 |
| Pernod Ricard SA | | 45,100 | 7,756 |
| Remy Cointreau SA (b) | | 42,300 | 6,772 |
| Remy Cointreau SA rights 9/18/20 (a)(c) | | 42,300 | 50 |
| The Coca-Cola Co. | | 1,439,103 | 67,983 |
| | | | 107,007 |
| Food & Staples Retailing - 1.3% | | | |
| Sysco Corp. | | 664,446 | 35,116 |
| Walmart, Inc. (d) | | 361,500 | 46,778 |
| | | | 81,894 |
| Food Products - 0.3% | | | |
| JDE Peet's BV | | 449,400 | 19,984 |
| Household Products - 1.0% | | | |
| Colgate-Palmolive Co. | | 75,300 | 5,813 |
| Energizer Holdings, Inc. | | 260,500 | 13,059 |
| Procter & Gamble Co. | | 248,215 | 32,546 |
| Spectrum Brands Holdings, Inc. | | 285,900 | 15,484 |
| | | | 66,902 |
| Personal Products - 0.2% | | | |
| Unilever NV | | 191,600 | 11,322 |
| Tobacco - 4.4% | | | |
| Altria Group, Inc. | | 5,744,000 | 236,366 |
| British American Tobacco PLC sponsored ADR (b) | | 1,513,200 | 50,768 |
| | | | 287,134 |
|
| TOTAL CONSUMER STAPLES | | | 574,243 |
|
| ENERGY - 6.7% | | | |
| Oil, Gas & Consumable Fuels - 6.7% | | | |
| Cabot Oil & Gas Corp. | | 325,100 | 6,079 |
| Cenovus Energy, Inc. | | 37,200 | 166 |
| Cenovus Energy, Inc. (Canada) (b) | | 10,471,400 | 46,593 |
| Equinor ASA sponsored ADR | | 4,493,700 | 67,001 |
| Exxon Mobil Corp. | | 5,434,000 | 228,663 |
| Hess Corp. | | 1,454,700 | 71,586 |
| Kosmos Energy Ltd. | | 4,189,285 | 6,745 |
| Total SA sponsored ADR | | 298,450 | 11,240 |
| | | | 438,073 |
| FINANCIALS - 14.9% | | | |
| Banks - 9.6% | | | |
| Bank of America Corp. | | 7,416,156 | 184,514 |
| First Hawaiian, Inc. | | 143,600 | 2,496 |
| JPMorgan Chase & Co. | | 767,392 | 74,161 |
| M&T Bank Corp. | | 134,000 | 14,197 |
| PNC Financial Services Group, Inc. | | 609,554 | 65,021 |
| Truist Financial Corp. | | 1,804,830 | 67,609 |
| U.S. Bancorp | | 1,291,973 | 47,596 |
| Wells Fargo & Co. | | 6,697,441 | 162,480 |
| | | | 618,074 |
| Capital Markets - 3.7% | | | |
| Brookfield Asset Management, Inc. Class A | | 390,935 | 12,639 |
| FS KKR Capital Corp. | | 6,527 | 104 |
| KKR & Co. LP | | 714,543 | 25,273 |
| Morgan Stanley | | 460,397 | 22,504 |
| Northern Trust Corp. | | 1,076,464 | 84,341 |
| Raymond James Financial, Inc. | | 284,700 | 19,781 |
| S&P Global, Inc. | | 2,600 | 911 |
| State Street Corp. | | 1,119,027 | 71,383 |
| TPG Specialty Lending, Inc. | | 79,656 | 1,357 |
| | | | 238,293 |
| Consumer Finance - 0.3% | | | |
| Discover Financial Services | | 378,200 | 18,694 |
| Shriram Transport Finance Co. Ltd. | | 170,100 | 1,570 |
| Shriram Transport Finance Co. Ltd. | | 19,626 | 181 |
| | | | 20,445 |
| Insurance - 0.9% | | | |
| Chubb Ltd. | | 172,500 | 21,949 |
| Marsh & McLennan Companies, Inc. | | 198,607 | 23,158 |
| Old Republic International Corp. | | 89,200 | 1,433 |
| The Travelers Companies, Inc. | | 124,000 | 14,188 |
| | | | 60,728 |
| Mortgage Real Estate Investment Trusts - 0.1% | | | |
| AGNC Investment Corp. | | 279,100 | 3,796 |
| Thrifts & Mortgage Finance - 0.3% | | | |
| Essent Group Ltd. | | 285,500 | 10,229 |
| Radian Group, Inc. | | 715,368 | 10,673 |
| | | | 20,902 |
|
| TOTAL FINANCIALS | | | 962,238 |
|
| HEALTH CARE - 17.9% | | | |
| Biotechnology - 1.2% | | | |
| AbbVie, Inc. | | 211,800 | 20,102 |
| Alexion Pharmaceuticals, Inc. (a) | | 295,400 | 30,276 |
| Amgen, Inc. | | 58,300 | 14,264 |
| Intercept Pharmaceuticals, Inc. (a) | | 230,704 | 10,529 |
| | | | 75,171 |
| Health Care Equipment & Supplies - 0.9% | | | |
| Becton, Dickinson & Co. | | 128,216 | 36,072 |
| Boston Scientific Corp. (a) | | 374,200 | 14,433 |
| GN Store Nord A/S | | 54,000 | 3,293 |
| Sonova Holding AG Class B | | 26,112 | 5,870 |
| | | | 59,668 |
| Health Care Providers & Services - 7.5% | | | |
| AmerisourceBergen Corp. | | 304,900 | 30,548 |
| Cardinal Health, Inc. | | 927,600 | 50,666 |
| Cigna Corp. | | 508,700 | 87,847 |
| CVS Health Corp. | | 1,720,004 | 108,257 |
| McKesson Corp. | | 521,387 | 78,291 |
| Patterson Companies, Inc. (b) | | 735,070 | 19,523 |
| United Drug PLC (United Kingdom) | | 202,900 | 1,891 |
| UnitedHealth Group, Inc. | | 368,800 | 111,665 |
| | | | 488,688 |
| Pharmaceuticals - 8.3% | | | |
| Bayer AG | | 1,588,635 | 105,539 |
| Bristol-Myers Squibb Co. | | 2,564,410 | 150,428 |
| GlaxoSmithKline PLC sponsored ADR | | 2,711,012 | 109,308 |
| Johnson & Johnson | | 981,069 | 143,001 |
| Novartis AG sponsored ADR | | 7,344 | 603 |
| Royalty Pharma PLC | | 35,900 | 1,545 |
| Sanofi SA sponsored ADR | | 517,400 | 27,138 |
| | | | 537,562 |
|
| TOTAL HEALTH CARE | | | 1,161,089 |
|
| INDUSTRIALS - 13.2% | | | |
| Aerospace & Defense - 1.0% | | | |
| General Dynamics Corp. | | 160,000 | 23,478 |
| Huntington Ingalls Industries, Inc. | | 97,200 | 16,885 |
| Raytheon Technologies Corp. | | 167,882 | 9,516 |
| Safran SA (a) | | 104,400 | 11,103 |
| The Boeing Co. | | 35,100 | 5,546 |
| | | | 66,528 |
| Air Freight & Logistics - 2.8% | | | |
| DSV A/S | | 31,400 | 4,306 |
| Expeditors International of Washington, Inc. | | 9,700 | 820 |
| FedEx Corp. | | 178,300 | 30,026 |
| United Parcel Service, Inc. Class B (d) | | 1,031,904 | 147,315 |
| | | | 182,467 |
| Building Products - 0.3% | | | |
| Johnson Controls International PLC | | 449,500 | 17,297 |
| Commercial Services & Supplies - 0.5% | | | |
| Healthcare Services Group, Inc. (b) | | 792,289 | 20,750 |
| HNI Corp. | | 129,500 | 3,846 |
| Interface, Inc. | | 541,000 | 4,317 |
| KAR Auction Services, Inc. | | 101,600 | 1,537 |
| Ritchie Bros. Auctioneers, Inc. | | 19,100 | 883 |
| | | | 31,333 |
| Electrical Equipment - 1.1% | | | |
| Acuity Brands, Inc. | | 137,600 | 13,636 |
| Hubbell, Inc. Class B | | 168,939 | 22,802 |
| Rockwell Automation, Inc. | | 22,800 | 4,974 |
| Vertiv Holdings Co. (a) | | 56,600 | 821 |
| Vertiv Holdings LLC (e) | | 2,000,000 | 29,000 |
| | | | 71,233 |
| Industrial Conglomerates - 3.9% | | | |
| 3M Co. | | 125,700 | 18,914 |
| General Electric Co. | | 37,879,927 | 229,931 |
| | | | 248,845 |
| Machinery - 1.5% | | | |
| Caterpillar, Inc. | | 26,900 | 3,574 |
| Cummins, Inc. | | 60,700 | 11,731 |
| Donaldson Co., Inc. | | 469,800 | 22,710 |
| Flowserve Corp. | | 296,400 | 8,261 |
| Fortive Corp. | | 243,500 | 17,091 |
| Kardex AG | | 7,390 | 1,273 |
| Nordson Corp. | | 28,100 | 5,441 |
| Otis Worldwide Corp. | | 89,041 | 5,586 |
| Stanley Black & Decker, Inc. | | 63,800 | 9,782 |
| Westinghouse Air Brake Co. | | 227,690 | 14,160 |
| | | | 99,609 |
| Professional Services - 0.0% | | | |
| Equifax, Inc. | | 9,700 | 1,577 |
| Robert Half International, Inc. | | 22,100 | 1,124 |
| | | | 2,701 |
| Road & Rail - 1.0% | | | |
| J.B. Hunt Transport Services, Inc. | | 141,040 | 18,251 |
| Knight-Swift Transportation Holdings, Inc. Class A | | 1,042,500 | 45,338 |
| | | | 63,589 |
| Trading Companies & Distributors - 1.1% | | | |
| Fastenal Co. | | 183,400 | 8,627 |
| MSC Industrial Direct Co., Inc. Class A | | 8,600 | 568 |
| Watsco, Inc. | | 258,492 | 61,022 |
| | | | 70,217 |
|
| TOTAL INDUSTRIALS | | | 853,819 |
|
| INFORMATION TECHNOLOGY - 20.4% | | | |
| Communications Equipment - 0.6% | | | |
| Cisco Systems, Inc. | | 825,752 | 38,893 |
| IT Services - 3.8% | | | |
| Amadeus IT Holding SA Class A | | 381,000 | 19,025 |
| DXC Technology Co. | | 137,700 | 2,466 |
| Fidelity National Information Services, Inc. | | 350,300 | 51,252 |
| Genpact Ltd. | | 540,700 | 21,531 |
| IBM Corp. | | 221,600 | 27,244 |
| MasterCard, Inc. Class A | | 29,200 | 9,009 |
| Unisys Corp. (a) | | 927,018 | 11,022 |
| Visa, Inc. Class A | | 559,379 | 106,506 |
| | | | 248,055 |
| Semiconductors & Semiconductor Equipment - 3.7% | | | |
| Analog Devices, Inc. | | 94,600 | 10,865 |
| Applied Materials, Inc. | | 220,900 | 14,210 |
| Intel Corp. | | 64,100 | 3,059 |
| Lam Research Corp. | | 24,000 | 9,052 |
| Marvell Technology Group Ltd. | | 238,500 | 8,698 |
| NXP Semiconductors NV | | 231,900 | 27,255 |
| Qualcomm, Inc. | | 1,546,046 | 163,278 |
| | | | 236,417 |
| Software - 8.6% | | | |
| Microsoft Corp. | | 2,122,099 | 435,056 |
| Open Text Corp. | | 183,100 | 8,242 |
| SAP SE sponsored ADR (b) | | 663,000 | 105,563 |
| Temenos Group AG | | 58,050 | 8,569 |
| | | | 557,430 |
| Technology Hardware, Storage & Peripherals - 3.7% | | | |
| Apple, Inc. | | 559,694 | 237,892 |
|
| TOTAL INFORMATION TECHNOLOGY | | | 1,318,687 |
|
| MATERIALS - 1.9% | | | |
| Chemicals - 1.3% | | | |
| DuPont de Nemours, Inc. | | 900,800 | 48,175 |
| LyondellBasell Industries NV Class A | | 115,139 | 7,198 |
| Nutrien Ltd. | | 466,280 | 15,185 |
| PPG Industries, Inc. | | 118,300 | 12,735 |
| | | | 83,293 |
| Metals & Mining - 0.6% | | | |
| BHP Billiton Ltd. sponsored ADR (b) | | 755,300 | 39,910 |
|
| TOTAL MATERIALS | | | 123,203 |
|
| REAL ESTATE - 1.0% | | | |
| Equity Real Estate Investment Trusts (REITs) - 1.0% | | | |
| American Tower Corp. | | 87,700 | 22,924 |
| CoreSite Realty Corp. | | 103,300 | 13,331 |
| Equinix, Inc. | | 17,500 | 13,746 |
| Public Storage | | 45,900 | 9,174 |
| Simon Property Group, Inc. | | 83,500 | 5,206 |
| | | | 64,381 |
| UTILITIES - 1.1% | | | |
| Electric Utilities - 0.9% | | | |
| Duke Energy Corp. | | 127,800 | 10,830 |
| Entergy Corp. | | 154,900 | 16,285 |
| Exelon Corp. | | 165,200 | 6,378 |
| PPL Corp. | | 50,200 | 1,336 |
| Southern Co. | | 373,100 | 20,375 |
| | | | 55,204 |
| Multi-Utilities - 0.2% | | | |
| CenterPoint Energy, Inc. | | 270,400 | 5,140 |
| Sempra Energy | | 79,700 | 9,919 |
| | | | 15,059 |
|
| TOTAL UTILITIES | | | 70,263 |
|
| TOTAL COMMON STOCKS | | | |
| (Cost $5,684,684) | | | 6,284,361 |
|
| Convertible Preferred Stocks - 0.4% | | | |
| HEALTH CARE - 0.4% | | | |
| Health Care Equipment & Supplies - 0.4% | | | |
| Becton, Dickinson & Co. 6.50% | | 184,100 | 11,099 |
| Boston Scientific Corp. Series A 5.50% | | 108,900 | 12,208 |
| TOTAL CONVERTIBLE PREFERRED STOCKS | | | |
| (Cost $20,122) | | | 23,307 |
| | | Principal Amount (000s) | Value (000s) |
|
| Convertible Bonds - 0.1% | | | |
| HEALTH CARE - 0.1% | | | |
| Biotechnology - 0.1% | | | |
Intercept Pharmaceuticals, Inc. 2% 5/15/26
(Cost $8,001) | | 9,657 | 7,078 |
| | | Shares | Value (000s) |
|
| Other - 0.1% | | | |
| ENERGY - 0.1% | | | |
| Oil, Gas & Consumable Fuels - 0.1% | | | |
| Utica Shale Drilling Program (non-operating revenue interest) (e)(f)(g) | | | |
| (Cost $18,052) | | 18,052,449 | 8,268 |
|
| Money Market Funds - 4.3% | | | |
| Fidelity Cash Central Fund 0.14% (h) | | 152,676,099 | 152,722 |
| Fidelity Securities Lending Cash Central Fund 0.13% (h)(i) | | 123,345,233 | 123,358 |
| TOTAL MONEY MARKET FUNDS | | | |
| (Cost $276,060) | | | 276,080 |
| TOTAL INVESTMENT IN SECURITIES - 102.0% | | | |
| (Cost $6,006,919) | | | 6,599,094 |
| NET OTHER ASSETS (LIABILITIES) - (2.0)% | | | (128,076) |
| NET ASSETS - 100% | | | $6,471,018 |
| Written Options | | | | | | |
| | Counterparty | Number of Contracts | Notional Amount (000s) | Exercise Price | Expiration Date | Value (000s) |
| Call Options | | | | | | |
| United Parcel Service, Inc. Class B | Chicago Board Options Exchange | 999 | $14,262 | $130.00 | 10/16/20 | $(1,479) |
| Walmart, Inc. | Chicago Board Options Exchange | 308 | 3,986 | 135.00 | 9/18/20 | (75) |
| Walmart, Inc. | Chicago Board Options Exchange | 692 | 8,954 | 140.00 | 9/18/20 | (91) |
| TOTAL WRITTEN OPTIONS | | | | | | $(1,645) |
For the period, the average monthly notional amount at value for written options in the aggregate was $18,620.
Legend
(a) Non-income producing
(b) Security or a portion of the security is on loan at period end.
(c) Security or a portion of the security purchased on a delayed delivery or when-issued basis.
(d) Security or a portion of the security is pledged as collateral for call options written. At period end, the value of securities pledged amounted to $27,202,000.
(e) Restricted securities (including private placements) - Investment in securities not registered under the Securities Act of 1933 (excluding 144A issues). At the end of the period, the value of restricted securities (excluding 144A issues) amounted to $37,268,000 or 0.6% of net assets.
(f) Investment is owned by a wholly-owned subsidiary (Subsidiary) that is treated as a corporation for U.S. tax purposes.
(g) Level 3 security
(h) Affiliated fund that is generally available only to investment companies and other accounts managed by Fidelity Investments. The rate quoted is the annualized seven-day yield of the fund at period end. A complete unaudited listing of the fund's holdings as of its most recent quarter end is available upon request. In addition, each Fidelity Central Fund's financial statements, which are not covered by the Fund's Report of Independent Registered Public Accounting Firm, are available on the SEC's website or upon request.
(i) Investment made with cash collateral received from securities on loan.
Additional information on each restricted holding is as follows:
| Security | Acquisition Date | Acquisition Cost (000s) |
| Utica Shale Drilling Program (non-operating revenue interest) | 10/5/16 - 9/1/17 | $18,052 |
| Vertiv Holdings LLC | 2/6/20 | $20,000 |
Affiliated Central Funds
Information regarding fiscal year to date income earned by the Fund from investments in Fidelity Central Funds is as follows:
| Fund | Income earned |
| | (Amounts in thousands) |
| Fidelity Cash Central Fund | $3,235 |
| Fidelity Securities Lending Cash Central Fund | 819 |
| Total | $4,054 |
Amounts in the income column in the above table include any capital gain distributions from underlying funds, which are presented in the corresponding line-item in the Statement of Operations, if applicable. Amount for Fidelity Securities Lending Cash Central Fund represents the income earned on investing cash collateral, less rebates paid to borrowers and any lending agent fees associated with the loan, plus any premium payments received for lending certain types of securities.
Investment Valuation
The following is a summary of the inputs used, as of July 31, 2020, involving the Fund's assets and liabilities carried at fair value. The inputs or methodology used for valuing securities may not be an indication of the risk associated with investing in those securities. For more information on valuation inputs, and their aggregation into the levels used below, please refer to the Investment Valuation section in the accompanying Notes to Financial Statements.
| | Valuation Inputs at Reporting Date: |
| Description | Total | Level 1 | Level 2 | Level 3 |
| (Amounts in thousands) | | | | |
| Investments in Securities: | | | | |
| Equities: | | | | |
| Communication Services | $506,041 | $452,488 | $53,553 | $-- |
| Consumer Discretionary | 212,324 | 212,324 | -- | -- |
| Consumer Staples | 574,243 | 562,921 | 11,322 | -- |
| Energy | 438,073 | 438,073 | -- | -- |
| Financials | 962,238 | 962,238 | -- | -- |
| Health Care | 1,184,396 | 1,055,550 | 128,846 | -- |
| Industrials | 853,819 | 842,716 | 11,103 | -- |
| Information Technology | 1,318,687 | 1,299,662 | 19,025 | -- |
| Materials | 123,203 | 123,203 | -- | -- |
| Real Estate | 64,381 | 64,381 | -- | -- |
| Utilities | 70,263 | 70,263 | -- | -- |
| Corporate Bonds | 7,078 | -- | 7,078 | -- |
| Other | 8,268 | -- | -- | 8,268 |
| Money Market Funds | 276,080 | 276,080 | -- | -- |
| Total Investments in Securities: | $6,599,094 | $6,359,899 | $230,927 | $8,268 |
| Derivative Instruments: | | | | |
| Liabilities | | | | |
| Written Options | $(1,645) | $(1,645) | $-- | $-- |
| Total Liabilities | $(1,645) | $(1,645) | $-- | $-- |
| Total Derivative Instruments: | $(1,645) | $(1,645) | $-- | $-- |
Value of Derivative Instruments
The following table is a summary of the Fund's value of derivative instruments by primary risk exposure as of July 31, 2020. For additional information on derivative instruments, please refer to the Derivative Instruments section in the accompanying Notes to Financial Statements.
| Primary Risk Exposure / Derivative Type | Value |
| | Asset | Liability |
| (Amounts in thousands) | | |
| Equity Risk | | |
| Written Options(a) | $0 | $(1,645) |
| Total Equity Risk | 0 | (1,645) |
| Total Value of Derivatives | $0 | $(1,645) |
(a) Gross value is presented in the Statement of Assets and Liabilities in the written options, at value line-item.
Other Information
Distribution of investments by country or territory of incorporation, as a percentage of Total Net Assets, is as follows (Unaudited):
| United States of America | 86.4% |
| Germany | 3.3% |
| United Kingdom | 2.7% |
| France | 1.8% |
| Canada | 1.2% |
| Norway | 1.0% |
| Netherlands | 1.0% |
| Others (Individually Less Than 1%) | 2.6% |
| | 100.0% |
See accompanying notes which are an integral part of the financial statements.
Financial Statements
Statement of Assets and Liabilities
| Amounts in thousands (except per-share amounts) | | July 31, 2020 |
| Assets | | |
Investment in securities, at value (including securities loaned of $119,489) — See accompanying schedule:
Unaffiliated issuers (cost $5,730,859) | $6,323,014 | |
| Fidelity Central Funds (cost $276,060) | 276,080 | |
| Total Investment in Securities (cost $6,006,919) | | $6,599,094 |
| Restricted cash | | 603 |
| Foreign currency held at value (cost $4) | | 4 |
| Receivable for investments sold | | 10,843 |
| Receivable for fund shares sold | | 885 |
| Dividends receivable | | 7,400 |
| Interest receivable | | 34 |
| Distributions receivable from Fidelity Central Funds | | 95 |
| Prepaid expenses | | 2 |
| Other receivables | | 801 |
| Total assets | | 6,619,761 |
| Liabilities | | |
| Payable for investments purchased | | |
| Regular delivery | $15,715 | |
| Delayed delivery | 50 | |
| Payable for fund shares redeemed | 4,038 | |
| Accrued management fee | 2,309 | |
| Written options, at value (premium received $609) | 1,645 | |
| Other affiliated payables | 799 | |
| Other payables and accrued expenses | 831 | |
| Collateral on securities loaned | 123,356 | |
| Total liabilities | | 148,743 |
| Net Assets | | $6,471,018 |
| Net Assets consist of: | | |
| Paid in capital | | $5,808,278 |
| Total accumulated earnings (loss) | | 662,740 |
| Net Assets | | $6,471,018 |
| Net Asset Value and Maximum Offering Price | | |
| Growth and Income: | | |
| Net Asset Value, offering price and redemption price per share ($5,451,158 ÷ 142,874.8 shares) | | $38.15 |
| Class K: | | |
| Net Asset Value, offering price and redemption price per share ($1,019,860 ÷ 26,757.5 shares) | | $38.11 |
See accompanying notes which are an integral part of the financial statements.
Statement of Operations
| Amounts in thousands | | Year ended July 31, 2020 |
| Investment Income | | |
| Dividends | | $170,109 |
| Interest | | 200 |
| Income from Fidelity Central Funds (including $819 from security lending) | | 4,054 |
| Total income | | 174,363 |
| Expenses | | |
| Management fee | $27,188 | |
| Transfer agent fees | 8,529 | |
| Accounting fees | 1,133 | |
| Custodian fees and expenses | 112 | |
| Independent trustees' fees and expenses | 40 | |
| Registration fees | 101 | |
| Audit | 86 | |
| Legal | 14 | |
| Miscellaneous | 97 | |
| Total expenses before reductions | 37,300 | |
| Expense reductions | (240) | |
| Total expenses after reductions | | 37,060 |
| Net investment income (loss) | | 137,303 |
| Realized and Unrealized Gain (Loss) | | |
| Net realized gain (loss) on: | | |
| Investment securities: | | |
| Unaffiliated issuers | 103,256 | |
| Fidelity Central Funds | 12 | |
| Foreign currency transactions | (59) | |
| Written options | 11,007 | |
| Total net realized gain (loss) | | 114,216 |
| Change in net unrealized appreciation (depreciation) on: | | |
| Investment securities: | | |
| Unaffiliated issuers (net of increase in deferred foreign taxes of $6) | (164,577) | |
| Fidelity Central Funds | 14 | |
| Assets and liabilities in foreign currencies | 62 | |
| Written options | (663) | |
| Total change in net unrealized appreciation (depreciation) | | (165,164) |
| Net gain (loss) | | (50,948) |
| Net increase (decrease) in net assets resulting from operations | | $86,355 |
See accompanying notes which are an integral part of the financial statements.
Statement of Changes in Net Assets
| Amounts in thousands | Year ended July 31, 2020 | Year ended July 31, 2019 |
| Increase (Decrease) in Net Assets | | |
| Operations | | |
| Net investment income (loss) | $137,303 | $150,639 |
| Net realized gain (loss) | 114,216 | 85,851 |
| Change in net unrealized appreciation (depreciation) | (165,164) | (98,315) |
| Net increase (decrease) in net assets resulting from operations | 86,355 | 138,175 |
| Distributions to shareholders | (213,226) | (205,560) |
| Share transactions - net increase (decrease) | 173,918 | (380,141) |
| Total increase (decrease) in net assets | 47,047 | (447,526) |
| Net Assets | | |
| Beginning of period | 6,423,971 | 6,871,497 |
| End of period | $6,471,018 | $6,423,971 |
See accompanying notes which are an integral part of the financial statements.
Financial Highlights
Fidelity Growth & Income Portfolio
| Years ended July 31, | 2020 | 2019 | 2018 | 2017 | 2016 |
| Selected Per–Share Data | | | | | |
| Net asset value, beginning of period | $38.98 | $39.34 | $35.31 | $30.48 | $30.85 |
| Income from Investment Operations | | | | | |
| Net investment income (loss)A | .83 | .87 | .65 | .61 | .59 |
| Net realized and unrealized gain (loss) | (.37) | (.05)B | 4.12 | 4.68 | (.37) |
| Total from investment operations | .46 | .82 | 4.77 | 5.29 | .22 |
| Distributions from net investment income | (.84) | (.77) | (.74) | (.46) | (.58) |
| Distributions from net realized gain | (.46) | (.42) | – | – | (.01) |
| Total distributions | (1.29)C | (1.18)D | (.74) | (.46) | (.59) |
| Net asset value, end of period | $38.15 | $38.98 | $39.34 | $35.31 | $30.48 |
| Total ReturnE | 1.27% | 2.26%B | 13.66% | 17.48% | .88% |
| Ratios to Average Net AssetsF,G | | | | | |
| Expenses before reductions | .60% | .61% | .61% | .63% | .64% |
| Expenses net of fee waivers, if any | .60% | .61% | .61% | .63% | .64% |
| Expenses net of all reductions | .60% | .61% | .61% | .63% | .64% |
| Net investment income (loss) | 2.18% | 2.31% | 1.76% | 1.84% | 2.05% |
| Supplemental Data | | | | | |
| Net assets, end of period (in millions) | $5,451 | $5,927 | $6,280 | $6,356 | $5,529 |
| Portfolio turnover rateH | 32% | 36% | 38% | 37% | 29% |
A Calculated based on average shares outstanding during the period.
B Net realized and unrealized gain (loss) per share reflects proceeds received from litigation which amounted to $.05 per share. Excluding these litigation proceeds, the total return would have been 2.14%
C Total distributions of $1.29 per share is comprised of distributions from net investment income of $.838 and distributions from net realized gain of $.455 per share.
D Total distributions of $1.18 per share is comprised of distributions from net investment income of $.765 and distributions from net realized gain of $.419 per share.
E Total returns would have been lower if certain expenses had not been reduced during the applicable periods shown.
F Fees and expenses of any underlying mutual funds or exchange-traded funds (ETFs) are not included in the Fund's expense ratio. The Fund indirectly bears its proportionate share of these expenses. For additional expense information related to investments in Fidelity Central Funds, please refer to the "Investments in Fidelity Central Funds" note found in the Notes to Financial Statements section of the most recent Annual or Semi-Annual report.
G Expense ratios reflect operating expenses of the class. Expenses before reductions do not reflect amounts reimbursed by the investment adviser or reductions from brokerage service arrangements or reductions from other expense offset arrangements and do not represent the amount paid by the class during periods when reimbursements or reductions occur. Expenses net of fee waivers reflect expenses after reimbursement by the investment adviser but prior to reductions from brokerage service arrangements or other expense offset arrangements. Expenses net of all reductions represent the net expenses paid by the class.
H Amount does not include the portfolio activity of any underlying Fidelity Central Funds.
See accompanying notes which are an integral part of the financial statements.
Fidelity Growth & Income Portfolio Class K
| Years ended July 31, | 2020 | 2019 | 2018 | 2017 | 2016 |
| Selected Per–Share Data | | | | | |
| Net asset value, beginning of period | $38.94 | $39.31 | $35.28 | $30.46 | $30.82 |
| Income from Investment Operations | | | | | |
| Net investment income (loss)A | .86 | .91 | .69 | .65 | .62 |
| Net realized and unrealized gain (loss) | (.35) | (.06)B | 4.12 | 4.67 | (.35) |
| Total from investment operations | .51 | .85 | 4.81 | 5.32 | .27 |
| Distributions from net investment income | (.88) | (.81) | (.78) | (.50) | (.62) |
| Distributions from net realized gain | (.46) | (.42) | – | – | (.01) |
| Total distributions | (1.34) | (1.22)C | (.78) | (.50) | (.63) |
| Net asset value, end of period | $38.11 | $38.94 | $39.31 | $35.28 | $30.46 |
| Total ReturnD | 1.39% | 2.35%B | 13.79% | 17.60% | 1.04% |
| Ratios to Average Net AssetsE,F | | | | | |
| Expenses before reductions | .50% | .51% | .51% | .52% | .52% |
| Expenses net of fee waivers, if any | .50% | .51% | .51% | .52% | .52% |
| Expenses net of all reductions | .50% | .50% | .50% | .52% | .52% |
| Net investment income (loss) | 2.28% | 2.41% | 1.86% | 1.95% | 2.17% |
| Supplemental Data | | | | | |
| Net assets, end of period (in millions) | $1,020 | $497 | $591 | $890 | $765 |
| Portfolio turnover rateG | 32% | 36% | 38% | 37% | 29% |
A Calculated based on average shares outstanding during the period.
B Net realized and unrealized gain (loss) per share reflects proceeds received from litigation which amounted to $.05 per share. Excluding these litigation proceeds, the total return would have been 2.23%
C Total distributions of $1.22 per share is comprised of distributions from net investment income of $.805 and distributions from net realized gain of $.419 per share.
D Total returns would have been lower if certain expenses had not been reduced during the applicable periods shown.
E Fees and expenses of any underlying mutual funds or exchange-traded funds (ETFs) are not included in the Fund's expense ratio. The Fund indirectly bears its proportionate share of these expenses. For additional expense information related to investments in Fidelity Central Funds, please refer to the "Investments in Fidelity Central Funds" note found in the Notes to Financial Statements section of the most recent Annual or Semi-Annual report.
F Expense ratios reflect operating expenses of the class. Expenses before reductions do not reflect amounts reimbursed by the investment adviser or reductions from brokerage service arrangements or reductions from other expense offset arrangements and do not represent the amount paid by the class during periods when reimbursements or reductions occur. Expenses net of fee waivers reflect expenses after reimbursement by the investment adviser but prior to reductions from brokerage service arrangements or other expense offset arrangements. Expenses net of all reductions represent the net expenses paid by the class.
G Amount does not include the portfolio activity of any underlying Fidelity Central Funds.
See accompanying notes which are an integral part of the financial statements.
Notes to Financial Statements
For the period ended July 31, 2020
(Amounts in thousands except percentages)
1. Organization.
Fidelity Growth & Income Portfolio (the Fund) is a fund of Fidelity Securities Fund (the Trust) and is authorized to issue an unlimited number of shares. The Trust is registered under the Investment Company Act of 1940, as amended (the 1940 Act), as an open-end management investment company organized as a Massachusetts business trust. The Fund offers Growth & Income and Class K shares, each of which has equal rights as to assets and voting privileges. Each class has exclusive voting rights with respect to matters that affect that class.
Effective January 1, 2020:
Investment advisers Fidelity Investments Money Management, Inc., FMR Co., Inc., and Fidelity SelectCo, LLC, merged with and into Fidelity Management & Research Company. In connection with the merger transactions, the resulting, merged investment adviser was then redomiciled from Massachusetts to Delaware, changed its corporate structure from a corporation to a limited liability company, and changed its name to "Fidelity Management & Research Company LLC".
Fidelity Investments Institutional Operations Company, Inc. converted from a Massachusetts corporation to a Massachusetts LLC, and changed its name to "Fidelity Investments Institutional Operations Company LLC".
2. Investments in Fidelity Central Funds.
The Fund invests in Fidelity Central Funds, which are open-end investment companies generally available only to other investment companies and accounts managed by the investment adviser and its affiliates. The Fund's Schedule of Investments lists each of the Fidelity Central Funds held as of period end, if any, as an investment of the Fund, but does not include the underlying holdings of each Fidelity Central Fund. As an Investing Fund, the Fund indirectly bears its proportionate share of the expenses of the underlying Fidelity Central Funds.
The Money Market Central Funds seek preservation of capital and current income and are managed by the investment adviser. Annualized expenses of the Money Market Central Funds as of their most recent shareholder report date ranged from less than .005% to .01%.
A complete unaudited list of holdings for each Fidelity Central Fund is available upon request or at the Securities and Exchange Commission (the SEC) website at www.sec.gov. In addition, the financial statements of the Fidelity Central Funds, which are not covered by the Fund's Report of Independent Registered Public Accounting Firm, are available on the SEC website or upon request.
3. Significant Accounting Policies.
The Fund is an investment company and applies the accounting and reporting guidance of the Financial Accounting Standards Board (FASB) Accounting Standards Codification Topic 946 Financial Services – Investment Companies. The financial statements have been prepared in conformity with accounting principles generally accepted in the United States of America (GAAP), which require management to make certain estimates and assumptions at the date of the financial statements. Actual results could differ from those estimates. Subsequent events, if any, through the date that the financial statements were issued have been evaluated in the preparation of the financial statements. The following summarizes the significant accounting policies of the Fund:
Investment Valuation. Investments are valued as of 4:00 p.m. Eastern time on the last calendar day of the period. The Board of Trustees (the Board) has delegated the day to day responsibility for the valuation of the Fund's investments to the Fair Value Committee (the Committee) established by the Fund's investment adviser. In accordance with valuation policies and procedures approved by the Board, the Fund attempts to obtain prices from one or more third party pricing vendors or brokers to value its investments. When current market prices, quotations or currency exchange rates are not readily available or reliable, investments will be fair valued in good faith by the Committee, in accordance with procedures adopted by the Board. Factors used in determining fair value vary by investment type and may include market or investment specific events, changes in interest rates and credit quality. The frequency with which these procedures are used cannot be predicted and they may be utilized to a significant extent. The Committee oversees the Fund's valuation policies and procedures and reports to the Board on the Committee's activities and fair value determinations. The Board monitors the appropriateness of the procedures used in valuing the Fund's investments and ratifies the fair value determinations of the Committee.
The Fund categorizes the inputs to valuation techniques used to value its investments into a disclosure hierarchy consisting of three levels as shown below:
- Level 1 – quoted prices in active markets for identical investments
- Level 2 – other significant observable inputs (including quoted prices for similar investments, interest rates, prepayment speeds, etc.)
- Level 3 – unobservable inputs (including the Fund's own assumptions based on the best information available)
Valuation techniques used to value the Fund's investments by major category are as follows:
Equity securities, including restricted securities, for which market quotations are readily available, are valued at the last reported sale price or official closing price as reported by a third party pricing vendor on the primary market or exchange on which they are traded and are categorized as Level 1 in the hierarchy. In the event there were no sales during the day or closing prices are not available, securities are valued at the last quoted bid price or may be valued using the last available price and are generally categorized as Level 2 in the hierarchy. For foreign equity securities, when market or security specific events arise, comparisons to the valuation of American Depositary Receipts (ADRs), futures contracts, Exchange-Traded Funds (ETFs) and certain indexes as well as quoted prices for similar securities may be used and would be categorized as Level 2 in the hierarchy. For equity securities, including restricted securities, where observable inputs are limited, assumptions about market activity and risk are used and these securities may be categorized as Level 3 in the hierarchy.
Debt securities, including restricted securities, are valued based on evaluated prices received from third party pricing vendors or from brokers who make markets in such securities. Corporate bonds are valued by pricing vendors who utilize matrix pricing which considers yield or price of bonds of comparable quality, coupon, maturity and type or by broker-supplied prices. When independent prices are unavailable or unreliable, debt securities may be valued utilizing pricing methodologies which consider similar factors that would be used by third party pricing vendors. Debt securities are generally categorized as Level 2 in the hierarchy but may be Level 3 depending on the circumstances.
Exchange-traded options are valued using the last sale price or, in the absence of a sale, the last offering price and are categorized as Level 1 in the hierarchy. Investments in open-end mutual funds, including the Fidelity Central Funds, are valued at their closing net asset value (NAV) each business day and are categorized as Level 1 in the hierarchy.
Changes in valuation techniques may result in transfers in or out of an assigned level within the disclosure hierarchy. The aggregate value of investments by input level as of July 31, 2020 is included at the end of the Fund's Schedule of Investments.
Foreign Currency. The Fund may use foreign currency contracts to facilitate transactions in foreign-denominated securities. Gains and losses from these transactions may arise from changes in the value of the foreign currency or if the counterparties do not perform under the contracts' terms.
Foreign-denominated assets, including investment securities, and liabilities are translated into U.S. dollars at the exchange rates at period end. Purchases and sales of investment securities, income and dividends received and expenses denominated in foreign currencies are translated into U.S. dollars at the exchange rate in effect on the transaction date.
The effects of exchange rate fluctuations on investments are included with the net realized and unrealized gain (loss) on investment securities. Other foreign currency transactions resulting in realized and unrealized gain (loss) are disclosed separately.
Investment Transactions and Income. For financial reporting purposes, the Fund's investment holdings and NAV include trades executed through the end of the last business day of the period. The NAV per share for processing shareholder transactions is calculated as of the close of business of the New York Stock Exchange (NYSE), normally 4:00 p.m. Eastern time and includes trades executed through the end of the prior business day. Gains and losses on securities sold are determined on the basis of identified cost and include proceeds received from litigation. Dividend income is recorded on the ex-dividend date, except for certain dividends from foreign securities where the ex-dividend date may have passed, which are recorded as soon as the Fund is informed of the ex-dividend date. Non-cash dividends included in dividend income, if any, are recorded at the fair market value of the securities received. Income and capital gain distributions from Fidelity Central Funds, if any, are recorded on the ex-dividend date. Certain distributions received by the Fund represent a return of capital or capital gain. The Fund determines the components of these distributions subsequent to the ex-dividend date, based upon receipt of tax filings or other correspondence relating to the underlying investment. These distributions are recorded as a reduction of cost of investments and/or as a realized gain. Interest income is accrued as earned and includes coupon interest and amortization of premium and accretion of discount on debt securities as applicable. Investment income is recorded net of foreign taxes withheld where recovery of such taxes is uncertain. Debt obligations may be placed on non-accrual status and related interest income may be reduced by ceasing current accruals and writing off interest receivables when the collection of all or a portion of interest has become doubtful based on consistently applied procedures. A debt obligation is removed from non-accrual status when the issuer resumes interest payments or when collectability of interest is reasonably assured.
Class Allocations and Expenses. Investment income, realized and unrealized capital gains and losses, common expenses of the Fund, and certain fund-level expense reductions, if any, are allocated daily on a pro-rata basis to each class based on the relative net assets of each class to the total net assets of the Fund. Each class differs with respect to transfer agent fees incurred. Certain expense reductions may also differ by class. For the reporting period, the allocated portion of income and expenses to each class as a percent of its average net assets may vary due to the timing of recording these transactions in relation to fluctuating net assets of the classes. Expenses directly attributable to a fund are charged to that fund. Expenses attributable to more than one fund are allocated among the respective funds on the basis of relative net assets or other appropriate methods. Expense estimates are accrued in the period to which they relate and adjustments are made when actual amounts are known.
Deferred Trustee Compensation. Under a Deferred Compensation Plan (the Plan) for the Fund, certain independent Trustees have elected to defer receipt of a portion of their annual compensation. Deferred amounts are invested in a cross-section of Fidelity funds, are marked-to-market and remain in the Fund until distributed in accordance with the Plan. The investment of deferred amounts and the offsetting payable to the Trustees of $700 are included in the accompanying Statement of Assets and Liabilities in other receivables and other payables and accrued expenses, respectively.
Income Tax Information and Distributions to Shareholders. Each year, the Fund intends to qualify as a regulated investment company under Subchapter M of the Internal Revenue Code, including distributing substantially all of its taxable income and realized gains. As a result, no provision for U.S. Federal income taxes is required. As of July 31, 2020, the Fund did not have any unrecognized tax benefits in the financial statements; nor is the Fund aware of any tax positions for which it is reasonably possible that the total amounts of unrecognized tax benefits will significantly change in the next twelve months. The Fund files a U.S. federal tax return, in addition to state and local tax returns as required. The Fund's federal income tax returns are subject to examination by the Internal Revenue Service (IRS) for a period of three fiscal years after they are filed. State and local tax returns may be subject to examination for an additional fiscal year depending on the jurisdiction. Foreign taxes are provided for based on the Fund's understanding of the tax rules and rates that exist in the foreign markets in which it invests. The Fund is subject to a tax imposed on capital gains by certain countries in which it invests. An estimated deferred tax liability for net unrealized appreciation on the applicable securities is included in Other payables and accrued expenses on the Statement of Assets & Liabilities.
Distributions are declared and recorded on the ex-dividend date. Income and capital gain distributions are declared separately for each class. Income and capital gain distributions are determined in accordance with income tax regulations, which may differ from GAAP. In addition, the Fund claimed a portion of the payment made to redeeming shareholders as a distribution for income tax purposes.
Capital accounts within the financial statements are adjusted for permanent book-tax differences. These adjustments have no impact on net assets or the results of operations. Capital accounts are not adjusted for temporary book-tax differences which will reverse in a subsequent period.
Book-tax differences are primarily due to foreign currency transactions, partnerships, passive foreign investment companies (PFIC), deferred trustees compensation, and losses deferred due to wash sales and excise tax regulations.
As of period end, the cost and unrealized appreciation (depreciation) in securities, and derivatives if applicable, for federal income tax purposes were as follows:
| Gross unrealized appreciation | $1,489,554 |
| Gross unrealized depreciation | (946,315) |
| Net unrealized appreciation (depreciation) | $543,239 |
| Tax Cost | $6,054,210 |
The tax-based components of distributable earnings as of period end were as follows:
| Undistributed ordinary income | $9,860 |
| Undistributed long-term capital gain | $110,299 |
| Net unrealized appreciation (depreciation) on securities and other investments | $543,286 |
The tax character of distributions paid was as follows:
| | July 31, 2020 | July 31, 2019 |
| Ordinary Income | $139,095 | $ 141,490 |
| Long-term Capital Gains | 74,131 | 64,070 |
| Total | $213,226 | $ 205,560 |
Delayed Delivery Transactions and When-Issued Securities. During the period, the Fund transacted in securities on a delayed delivery or when-issued basis. Payment and delivery may take place after the customary settlement period for that security. The price of the underlying securities and the date when the securities will be delivered and paid for are fixed at the time the transaction is negotiated. The securities purchased on a delayed delivery or when-issued basis are identified as such in the Fund's Schedule of Investments. Losses may arise due to changes in the value of the underlying securities or if the counterparty does not perform under the contract's terms, or if the issuer does not issue the securities due to political, economic, or other factors.
Restricted Securities (including Private Placements). The Fund may invest in securities that are subject to legal or contractual restrictions on resale. These securities generally may be resold in transactions exempt from registration or to the public if the securities are registered. Disposal of these securities may involve time-consuming negotiations and expense, and prompt sale at an acceptable price may be difficult. Information regarding restricted securities is included at the end of the Fund's Schedule of Investments.
Consolidated Subsidiary. The Fund invests in certain investments through a wholly-owned subsidiary ("Subsidiary"), which may be subject to federal and state taxes upon disposition.
As of period end, the Fund held an investment of $8,871 in this Subsidiary, representing .14% of the Fund's net assets. The financial statements have been consolidated and include accounts of the Fund and the Subsidiary. Accordingly, all inter-company transactions and balances have been eliminated.
Any cash held by the Subsidiary is restricted as to its use and is presented as Restricted cash in the Statement of Assets and Liabilities.
4. Derivative Instruments.
Risk Exposures and the Use of Derivative Instruments. The Fund's investment objective allows the Fund to enter into various types of derivative contracts, including options. Derivatives are investments whose value is primarily derived from underlying assets, indices or reference rates and may be transacted on an exchange or over-the-counter (OTC). Derivatives may involve a future commitment to buy or sell a specified asset based on specified terms, to exchange future cash flows at periodic intervals based on a notional principal amount, or for one party to make one or more payments upon the occurrence of specified events in exchange for periodic payments from the other party.
The Fund used derivatives to increase returns and to manage exposure to certain risks as defined below. The success of any strategy involving derivatives depends on analysis of numerous economic factors, and if the strategies for investment do not work as intended, the Fund may not achieve its objectives.
The Fund's use of derivatives increased or decreased its exposure to the following risk:
| Equity Risk | Equity risk relates to the fluctuations in the value of financial instruments as a result of changes in market prices (other than those arising from interest rate risk or foreign exchange risk), whether caused by factors specific to an individual investment, its issuer, or all factors affecting all instruments traded in a market or market segment.
|
The Fund is also exposed to additional risks from investing in derivatives, such as liquidity risk and counterparty credit risk. Liquidity risk is the risk that the Fund will be unable to close out the derivative in the open market in a timely manner. Counterparty credit risk is the risk that the counterparty will not be able to fulfill its obligation to the Fund. Derivative counterparty credit risk is managed through formal evaluation of the creditworthiness of all potential counterparties. On certain OTC derivatives such as options, the Fund attempts to reduce its exposure to counterparty credit risk by entering into an International Swaps and Derivatives Association, Inc. (ISDA) Master Agreement with each of its counterparties. The ISDA Master Agreement gives the Fund the right to terminate all transactions traded under such agreement upon the deterioration in the credit quality of the counterparty beyond specified levels. The ISDA Master Agreement gives each party the right, upon an event of default by the other party or a termination of the agreement, to close out all transactions traded under such agreement and to net amounts owed under each transaction to one net payable by one party to the other. To mitigate counterparty credit risk on bi-lateral OTC derivatives, the Fund receives collateral in the form of cash or securities once the Fund's net unrealized appreciation on outstanding derivative contracts under an ISDA Master Agreement exceeds certain applicable thresholds, subject to certain minimum transfer provisions. The collateral received is held in segregated accounts with the Fund's custodian bank in accordance with the collateral agreements entered into between the Fund, the counterparty and the Fund's custodian bank. The Fund could experience delays and costs in gaining access to the collateral even though it is held by the Fund's custodian bank. The Fund's maximum risk of loss from counterparty credit risk related to bi-lateral OTC derivatives is generally the aggregate unrealized appreciation and unpaid counterparty payments in excess of any collateral pledged by the counterparty to the Fund. The Fund may be required to pledge collateral for the benefit of the counterparties on bi-lateral OTC derivatives in an amount not less than each counterparty's unrealized appreciation on outstanding derivative contracts, subject to certain minimum transfer provisions, and any such pledged collateral is identified in the Schedule of Investments. Counterparty credit risk related to exchange-traded options may be mitigated by the protection provided by the exchange on which they trade.
Investing in derivatives may involve greater risks than investing in the underlying assets directly and, to varying degrees, may involve risk of loss in excess of any initial investment and collateral received and amounts recognized in the Statement of Assets and Liabilities. In addition, there may be the risk that the change in value of the derivative contract does not correspond to the change in value of the underlying instrument.
Options. Options give the purchaser the right, but not the obligation, to buy (call) or sell (put) an underlying security or financial instrument at an agreed exercise or strike price between or on certain dates. Options obligate the seller (writer) to buy (put) or sell (call) an underlying instrument at the exercise or strike price or cash settle an underlying derivative instrument if the holder exercises the option on or before the expiration date.
The Fund used exchange-traded written covered call options to manage its exposure to the market. When the Fund writes a covered call option, the Fund holds the underlying instrument which must be delivered to the holder upon the exercise of the option.
Upon entering into a written options contract, the Fund will receive a premium. Premiums received are reflected as a liability on the Statement of Assets and Liabilities. Options are valued daily and any unrealized appreciation (depreciation) is reflected on the Statement of Assets and Liabilities. When a written option is exercised, the premium is added to the proceeds from the sale of the underlying instrument in determining the gain or loss realized on that investment. When an option is closed the Fund will realize a gain or loss depending on whether the proceeds or amount paid for the closing sale transaction are greater or less than the premium received. When an option expires, gains and losses are realized to the extent of premiums received. The net realized gain (loss) on closed and expired written options and the change in net unrealized appreciation (depreciation) on written options are presented in the Statement of Operations.
Writing call options tends to decrease exposure to the underlying instrument and risk of loss is the change in value in excess of the premium received.
Any open options at period end are presented in the Schedule of Investments under the caption "Written Options".
5. Purchases and Sales of Investments.
Purchases and sales of securities, other than short-term securities, are noted in the table below.
| | Purchases ($) | Sales ($) |
| Fidelity Growth & Income Portfolio | 2,184,962 | 1,934,078 |
6. Fees and Other Transactions with Affiliates.
Management Fee. Fidelity Management & Research Company LLC (the investment adviser) and its affiliates provide the Fund with investment management related services for which the Fund pays a monthly management fee. The management fee is the sum of an individual fund fee rate that is based on an annual rate of .20% of the Fund's average net assets and an annualized group fee rate that averaged .23% during the period. The group fee rate is based upon the monthly average net assets of a group of registered investment companies with which the investment adviser has management contracts. The group fee rate decreases as assets under management increase and increases as assets under management decrease. For the reporting period, the total annual management fee rate was .43% of the Fund's average net assets.
Transfer Agent Fees. Fidelity Investments Institutional Operations Company LLC (FIIOC), an affiliate of the investment adviser, is the transfer, dividend disbursing and shareholder servicing agent for each class of the Fund. FIIOC receives account fees and asset-based fees that vary according to the account size and type of account of the shareholders of Growth & Income, except for Class K. FIIOC receives an asset-based fee of Class K's average net assets. FIIOC pays for typesetting, printing and mailing of shareholder reports, except proxy statements. Effective February 1, 2020, the Board approved to change the fee for Class K from .046% to .044%.
For the period, transfer agent fees for each class were as follows:
| | Amount | % of Class-Level Average Net Assets |
| Growth and Income | $8,263 | .15 |
| Class K | 266 | .04 |
| | $8,529 | |
Accounting Fees. Fidelity Service Company, Inc. (FSC), an affiliate of the investment adviser, maintains the Fund's accounting records. The accounting fee is based on the level of average net assets for each month. For the period, the fees were equivalent to the following annual rates:
| | % of Average Net Assets |
| Fidelity Growth & Income Portfolio | .02 |
Brokerage Commissions. A portion of portfolio transactions were placed with brokerage firms which are affiliates of the investment adviser. Brokerage commissions are included in net realized gain (loss) and change in net unrealized appreciation (depreciation) in the Statement of Operations. The commissions paid to these affiliated firms were as follows:
| | Amount |
| Fidelity Growth & Income Portfolio | $53 |
Interfund Trades. Funds may purchase from or sell securities to other Fidelity Funds under procedures adopted by the Board. The procedures have been designed to ensure these interfund trades are executed in accordance with Rule 17a-7 of the 1940 Act. Interfund trades are included within the respective purchases and sales amounts shown in the Purchases and Sales of Investments note.
Other. During the period, the investment adviser reimbursed the Fund for certain losses in the amount of $70.
7. Committed Line of Credit.
Certain Funds participate with other funds managed by the investment adviser or an affiliate in a $4.25 billion credit facility (the "line of credit") to be utilized for temporary or emergency purposes to fund shareholder redemptions or for other short-term liquidity purposes. The participating funds have agreed to pay commitment fees on their pro-rata portion of the line of credit, which are reflected in Miscellaneous expenses on the Statement of Operations, and are as follows:
| | Amount |
| Fidelity Growth & Income Portfolio | $15 |
During the period, there were no borrowings on this line of credit.
8. Security Lending.
The Fund lends portfolio securities from time to time in order to earn additional income. Lending agents are used, including National Financial Services (NFS), an affiliate of the Fund. Pursuant to a securities lending agreement, NFS will receive a fee, which is capped at 9.9% of daily lending revenue, for its services as lending agent. The Fund may lend securities to certain qualified borrowers, including NFS. On the settlement date of the loan, the Fund receives collateral (in the form of U.S. Treasury obligations, letters of credit and/or cash) against the loaned securities and maintains collateral in an amount not less than 100% of the market value of the loaned securities during the period of the loan. The market value of the loaned securities is determined at the close of business of the Fund and any additional required collateral is delivered to the Fund on the next business day. The Fund or borrower may terminate the loan at any time, and if the borrower defaults on its obligation to return the securities loaned because of insolvency or other reasons, the Fund may apply collateral received from the borrower against the obligation. The Fund may experience delays and costs in recovering the securities loaned. Any cash collateral received is invested in the Fidelity Securities Lending Cash Central Fund. The value of loaned securities and cash collateral at period end are disclosed on the Fund's Statement of Assets and Liabilities. At period end, there were no security loans outstanding with NFS, as affiliated borrower. Total fees paid by the Fund to NFS, as lending agent, amounted to $64. Security lending income represents the income earned on investing cash collateral, less rebates paid to borrowers and any lending agent fees associated with the loan, plus any premium payments received for lending certain types of securities. Net income from the Fidelity Securities Lending Cash Central Fund during the period is presented in the Statement of Operations as a component of income from Fidelity Central Funds (and includes $11 from securities loaned to NFS, as affiliated borrower).
9. Expense Reductions.
Commissions paid to certain brokers with whom the investment adviser, or its affiliates, places trades on behalf of the Fund include an amount in addition to trade execution, which may be rebated back to the Fund to offset certain expenses. This amount totaled $207 for the period. In addition, through arrangements with the Fund's custodian and each class' transfer agent, credits realized as a result of certain uninvested cash balances were used to reduce the Fund's expenses. During the period, custodian credits reduced the Fund's expenses by $4. During the period, transfer agent credits reduced each class' expenses as noted in the table below.
| | Expense reduction |
| Growth and Income | $2 |
In addition, during the period the investment adviser or an affiliate reimbursed and/or waived a portion of fund-level operating expenses in the amount of $27.
10. Distributions to Shareholders.
Distributions to shareholders of each class were as follows:
| | Year ended
July 31, 2020 | Year ended
July 31, 2019 |
| Distributions to shareholders | | |
| Growth and Income | $191,327 | $184,494 |
| Class K | 21,899 | 21,066 |
| Total | $213,226 | $205,560 |
11. Share Transactions.
Share transactions for each class were as follows and may contain automatic conversions between classes or exchanges between affiliated funds:
| | Shares | Shares | Dollars | Dollars |
| | Year ended July 31, 2020 | Year ended July 31, 2019 | Year ended July 31, 2020 | Year ended July 31, 2019 |
| Growth and Income | | | | |
| Shares sold | 4,929 | 4,033 | $187,774 | $152,368 |
| Reinvestment of distributions | 4,774 | 4,678 | 180,310 | 174,463 |
| Shares redeemed | (18,889) | (16,278) | (708,521) | (613,720) |
| Net increase (decrease) | (9,186) | (7,567) | $(340,437) | $(286,889) |
| Class K | | | | |
| Shares sold | 17,497 | 7,816 | $646,482 | $289,822 |
| Reinvestment of distributions | 590 | 570 | 21,899 | 21,066 |
| Shares redeemed | (4,100) | (10,656) | (154,026) | (404,140) |
| Net increase (decrease) | 13,987 | (2,270) | $514,355 | $(93,252) |
12. Other.
The Fund's organizational documents provide former and current trustees and officers with a limited indemnification against liabilities arising in connection with the performance of their duties to the Fund. In the normal course of business, the Fund may also enter into contracts that provide general indemnifications. The Fund's maximum exposure under these arrangements is unknown as this would be dependent on future claims that may be made against the Fund. The risk of material loss from such claims is considered remote.
13. Coronavirus (COVID-19) Pandemic.
An outbreak of COVID-19 first detected in China during December 2019 has since spread globally and was declared a pandemic by the World Health Organization during March 2020. Developments that disrupt global economies and financial markets, such as the COVID-19 pandemic, may magnify factors that affect the Fund's performance.
Report of Independent Registered Public Accounting Firm
To the Board of Trustees of Fidelity Securities Fund and Shareholders of Fidelity Growth & Income Portfolio
Opinion on the Financial Statements
We have audited the accompanying statement of assets and liabilities, including the schedule of investments, of Fidelity Growth & Income Portfolio (one of the funds constituting Fidelity Securities Fund, referred to hereafter as the “Fund”) as of July 31, 2020, the related statement of operations for the year ended July 31, 2020, the statement of changes in net assets for each of the two years in the period ended July 31, 2020, including the related notes, and the financial highlights for each of the five years in the period ended July 31, 2020 (collectively referred to as the “financial statements”). In our opinion, the financial statements present fairly, in all material respects, the financial position of the Fund as of July 31, 2020, the results of its operations for the year then ended, the changes in its net assets for each of the two years in the period ended July 31, 2020 and the financial highlights for each of the five years in the period ended July 31, 2020 in conformity with accounting principles generally accepted in the United States of America.
Basis for Opinion
These financial statements are the responsibility of the Fund’s management. Our responsibility is to express an opinion on the Fund’s financial statements based on our audits. We are a public accounting firm registered with the Public Company Accounting Oversight Board (United States) (PCAOB) and are required to be independent with respect to the Fund in accordance with the U.S. federal securities laws and the applicable rules and regulations of the Securities and Exchange Commission and the PCAOB.
We conducted our audits of these financial statements in accordance with the standards of the PCAOB. Those standards require that we plan and perform the audit to obtain reasonable assurance about whether the financial statements are free of material misstatement, whether due to error or fraud.
Our audits included performing procedures to assess the risks of material misstatement of the financial statements, whether due to error or fraud, and performing procedures that respond to those risks. Such procedures included examining, on a test basis, evidence regarding the amounts and disclosures in the financial statements. Our audits also included evaluating the accounting principles used and significant estimates made by management, as well as evaluating the overall presentation of the financial statements. Our procedures included confirmation of securities owned as of July 31, 2020 by correspondence with the custodian, issuers of privately offered securities and brokers; when replies were not received from brokers, we performed other auditing procedures. We believe that our audits provide a reasonable basis for our opinion.
/s/ PricewaterhouseCoopers LLP
Boston, Massachusetts
September 09, 2020
We have served as the auditor of one or more investment companies in the Fidelity group of funds since 1932.
Trustees and Officers
The Trustees, Members of the Advisory Board (if any), and officers of the trust and fund, as applicable, are listed below. The Board of Trustees governs the fund and is responsible for protecting the interests of shareholders. The Trustees are experienced executives who meet periodically throughout the year to oversee the fund's activities, review contractual arrangements with companies that provide services to the fund, oversee management of the risks associated with such activities and contractual arrangements, and review the fund's performance. Except for Jonathan Chiel, each of the Trustees oversees 311 funds. Mr. Chiel oversees 174 funds.
The Trustees hold office without limit in time except that (a) any Trustee may resign; (b) any Trustee may be removed by written instrument, signed by at least two-thirds of the number of Trustees prior to such removal; (c) any Trustee who requests to be retired or who has become incapacitated by illness or injury may be retired by written instrument signed by a majority of the other Trustees; and (d) any Trustee may be removed at any special meeting of shareholders by a two-thirds vote of the outstanding voting securities of the trust. Each Trustee who is not an interested person (as defined in the 1940 Act) of the trust and the fund is referred to herein as an Independent Trustee. Each Independent Trustee shall retire not later than the last day of the calendar year in which his or her 75th birthday occurs. The Independent Trustees may waive this mandatory retirement age policy with respect to individual Trustees. Officers and Advisory Board Members hold office without limit in time, except that any officer or Advisory Board Member may resign or may be removed by a vote of a majority of the Trustees at any regular meeting or any special meeting of the Trustees. Except as indicated, each individual has held the office shown or other offices in the same company for the past five years.
The fund's Statement of Additional Information (SAI) includes more information about the Trustees. To request a free copy, call Fidelity at 1-800-544-8544 if you’re an individual investing directly with Fidelity, call 1-800-835-5092 if you’re a plan sponsor or participant with Fidelity as your recordkeeper or call 1-877-208-0098 on institutional accounts or if you’re an advisor or invest through one.
Experience, Skills, Attributes, and Qualifications of the Trustees. The Governance and Nominating Committee has adopted a statement of policy that describes the experience, qualifications, attributes, and skills that are necessary and desirable for potential Independent Trustee candidates (Statement of Policy). The Board believes that each Trustee satisfied at the time he or she was initially elected or appointed a Trustee, and continues to satisfy, the standards contemplated by the Statement of Policy. The Governance and Nominating Committee also engages professional search firms to help identify potential Independent Trustee candidates who have the experience, qualifications, attributes, and skills consistent with the Statement of Policy. From time to time, additional criteria based on the composition and skills of the current Independent Trustees, as well as experience or skills that may be appropriate in light of future changes to board composition, business conditions, and regulatory or other developments, have also been considered by the professional search firms and the Governance and Nominating Committee. In addition, the Board takes into account the Trustees' commitment and participation in Board and committee meetings, as well as their leadership of standing and ad hoc committees throughout their tenure.
In determining that a particular Trustee was and continues to be qualified to serve as a Trustee, the Board has considered a variety of criteria, none of which, in isolation, was controlling. The Board believes that, collectively, the Trustees have balanced and diverse experience, qualifications, attributes, and skills, which allow the Board to operate effectively in governing the fund and protecting the interests of shareholders. Information about the specific experience, skills, attributes, and qualifications of each Trustee, which in each case led to the Board's conclusion that the Trustee should serve (or continue to serve) as a trustee of the fund, is provided below.
Board Structure and Oversight Function. Robert A. Lawrence is an interested person and currently serves as Acting Chairman. The Trustees have determined that an interested Chairman is appropriate and benefits shareholders because an interested Chairman has a personal and professional stake in the quality and continuity of services provided to the fund. Independent Trustees exercise their informed business judgment to appoint an individual of their choosing to serve as Chairman, regardless of whether the Trustee happens to be independent or a member of management. The Independent Trustees have determined that they can act independently and effectively without having an Independent Trustee serve as Chairman and that a key structural component for assuring that they are in a position to do so is for the Independent Trustees to constitute a substantial majority for the Board. The Independent Trustees also regularly meet in executive session. Ned C. Lautenbach and David M. Thomas serve as Co-Lead Independent Trustees and as such each (i) acts as a liaison between the Independent Trustees and management with respect to matters important to the Independent Trustees and (ii) with management prepares agendas for Board meetings.
Fidelity® funds are overseen by different Boards of Trustees. The fund's Board oversees Fidelity's high income and certain equity funds, and other Boards oversee Fidelity's investment-grade bond, money market, asset allocation, and other equity funds. The asset allocation funds may invest in Fidelity® funds overseen by the fund's Board. The use of separate Boards, each with its own committee structure, allows the Trustees of each group of Fidelity® funds to focus on the unique issues of the funds they oversee, including common research, investment, and operational issues. On occasion, the separate Boards establish joint committees to address issues of overlapping consequences for the Fidelity® funds overseen by each Board.
The Trustees operate using a system of committees to facilitate the timely and efficient consideration of all matters of importance to the Trustees, the fund, and fund shareholders and to facilitate compliance with legal and regulatory requirements and oversight of the fund's activities and associated risks. The Board, acting through its committees, has charged FMR and its affiliates with (i) identifying events or circumstances the occurrence of which could have demonstrably adverse effects on the fund's business and/or reputation; (ii) implementing processes and controls to lessen the possibility that such events or circumstances occur or to mitigate the effects of such events or circumstances if they do occur; and (iii) creating and maintaining a system designed to evaluate continuously business and market conditions in order to facilitate the identification and implementation processes described in (i) and (ii) above. Because the day-to-day operations and activities of the fund are carried out by or through FMR, its affiliates, and other service providers, the fund's exposure to risks is mitigated but not eliminated by the processes overseen by the Trustees. While each of the Board's committees has responsibility for overseeing different aspects of the fund's activities, oversight is exercised primarily through the Operations, Audit, and Compliance Committees. Appropriate personnel, including but not limited to the fund's Chief Compliance Officer (CCO), FMR's internal auditor, the independent accountants, the fund's Treasurer and portfolio management personnel, make periodic reports to the Board's committees, as appropriate, including an annual review of Fidelity's risk management program for the Fidelity® funds. The responsibilities of each standing committee, including their oversight responsibilities, are described further under "Standing Committees of the Trustees."
Interested Trustees*:
Correspondence intended for a Trustee who is an interested person may be sent to Fidelity Investments, 245 Summer Street, Boston, Massachusetts 02210.
Name, Year of Birth; Principal Occupations and Other Relevant Experience+
Jonathan Chiel (1957)
Year of Election or Appointment: 2016
Trustee
Mr. Chiel also serves as Trustee of other Fidelity® funds. Mr. Chiel is Executive Vice President and General Counsel for FMR LLC (diversified financial services company, 2012-present). Previously, Mr. Chiel served as general counsel (2004-2012) and senior vice president and deputy general counsel (2000-2004) for John Hancock Financial Services; a partner with Choate, Hall & Stewart (1996-2000) (law firm); and an Assistant United States Attorney for the United States Attorney’s Office of the District of Massachusetts (1986-95), including Chief of the Criminal Division (1993-1995). Mr. Chiel is a director on the boards of the Boston Bar Foundation and the Maimonides School.
Robert A. Lawrence (1952)
Year of Election or Appointment: 2020
Trustee
Acting Chairman of the Board of Trustees
Mr. Lawrence also serves as Trustee of other funds. Previously, Mr. Lawrence served as a Member of the Advisory Board of certain funds. Prior to his retirement in 2008, Mr. Lawrence served as Vice President of certain Fidelity® funds (2006-2008), Senior Vice President, Head of High Income Division of Fidelity Management & Research Company (investment adviser firm, 2006-2008), and President of Fidelity Strategic Investments (investment adviser firm, 2002-2005).
* Determined to be an “Interested Trustee” by virtue of, among other things, his or her affiliation with the trust or various entities under common control with FMR.
+ The information includes the Trustee's principal occupation during the last five years and other information relating to the experience, attributes, and skills relevant to the Trustee's qualifications to serve as a Trustee, which led to the conclusion that the Trustee should serve as a Trustee for the fund.
Independent Trustees:
Correspondence intended for an Independent Trustee may be sent to Fidelity Investments, P.O. Box 55235, Boston, Massachusetts 02205-5235.
Name, Year of Birth; Principal Occupations and Other Relevant Experience+
Dennis J. Dirks (1948)
Year of Election or Appointment: 2005
Trustee
Mr. Dirks also serves as Trustee of other Fidelity® funds. Prior to his retirement in May 2003, Mr. Dirks served as Chief Operating Officer and as a member of the Board of The Depository Trust & Clearing Corporation (financial markets infrastructure), President, Chief Operating Officer and a member of the Board of The Depository Trust Company (DTC), President and a member of the Board of the National Securities Clearing Corporation (NSCC), Chief Executive Officer and a member of the Board of the Government Securities Clearing Corporation and Chief Executive Officer and a member of the Board of the Mortgage-Backed Securities Clearing Corporation. Mr. Dirks currently serves as a member of the Finance Committee (2016-present) and Board (2017-present) and is Treasurer (2018-present) of the Asolo Repertory Theatre.
Donald F. Donahue (1950)
Year of Election or Appointment: 2018
Trustee
Mr. Donahue also serves as Trustee of other Fidelity® funds. Mr. Donahue serves as President and Chief Executive Officer of Miranda Partners, LLC (risk consulting for the financial services industry, 2012-present). Previously, Mr. Donahue served as Chief Executive Officer (2006-2012), Chief Operating Officer (2003-2006) and Managing Director, Customer Marketing and Development (1999-2003) of The Depository Trust & Clearing Corporation (financial markets infrastructure). Mr. Donahue currently serves as a member (2007-present) and Co-Chairman (2016-present) of the Board of United Way of New York, a member of the Board of NYC Leadership Academy (2012-present) and a member of the Board of Advisors of Ripple Labs, Inc. (financial services, 2015-present). Mr. Donahue previously served as a member of the Advisory Board of certain Fidelity® funds (2015-2018).
Vicki L. Fuller (1957)
Year of Election or Appointment: 2020
Trustee
Ms. Fuller also serves as Trustee of other Fidelity® funds. Previously, Ms. Fuller served as a member of the Advisory Board of certain Fidelity® funds (2018-2020), Chief Investment Officer of the New York State Common Retirement Fund (2012-2018) and held a variety of positions at AllianceBernstein L.P. (global asset management, 1985-2012), including Managing Director (2006-2012) and Senior Vice President and Senior Portfolio Manager (2001-2006). Ms. Fuller currently serves as a member of the Board, Audit Committee and Nominating and Governance Committee of The Williams Companies, Inc. (natural gas infrastructure, 2018-present) and as a member of the Board of Treliant, LLC (consulting, 2019-present).
Patricia L. Kampling (1959)
Year of Election or Appointment: 2020
Trustee
Ms. Kampling also serves as Trustee of other Fidelity® funds. Prior to her retirement, Ms. Kampling served as Chairman of the Board and Chief Executive Officer (2012-2019), President and Chief Operating Officer (2011-2012) and Executive Vice President and Chief Financial Officer (2010-2011) of Alliant Energy Corporation. Ms. Kampling currently serves as a member of the Board, Compensation Committee and Executive Committee and as Chair of the Audit Committee of Briggs & Stratton Corporation (manufacturing, 2011-present) and as a member of the Board, Audit, Finance and Risk Committee and Safety, Environmental, Technology and Operations Committee of American Water Works Company, Inc. (utilities company, 2019-present). In addition, Ms. Kampling currently serves as a member of the Board of the Nature Conservancy, Wisconsin Chapter (2019-present). Previously, Ms. Kampling served as a Member of the Advisory Board of certain Fidelity® funds (2020), a member of the Board of Interstate Power and Light Company (2012-2019) and Wisconsin Power and Light Company (2012-2019) (each a subsidiary of Alliant Energy Corporation) and as a member of the Board and Workforce Development Committee of the Business Roundtable (2018-2019).
Alan J. Lacy (1953)
Year of Election or Appointment: 2008
Trustee
Mr. Lacy also serves as Trustee of other Fidelity® funds. Previously, Mr. Lacy served as Senior Adviser (2007-2014) of Oak Hill Capital Partners, L.P. (private equity), Chief Executive Officer (2005) and Vice Chairman (2005-2006) of Sears Holdings Corporation (retail), Chief Executive Officer and Chairman of the Board of Sears, Roebuck and Co. (retail, 2000-2005), Chairman (2014-2017) and a member of the Board (2010-2017) of Dave & Buster’s Entertainment, Inc. (restaurant and entertainment complexes) and a member of the Board of Bristol-Myers Squibb Company (global pharmaceuticals, 2008-2020). Mr. Lacy currently serves as a Trustee of the California Chapter of The Nature Conservancy (2015-present) and a member of the Board of the Center for Advanced Study in the Behavioral Sciences at Stanford University (2015-present).
Ned C. Lautenbach (1944)
Year of Election or Appointment: 2000
Trustee
Co-Lead Independent Trustee
Mr. Lautenbach also serves as Trustee of other Fidelity® funds. Mr. Lautenbach currently serves as Chair of the Board of Governors, State University System of Florida (2013-present) and is a member of the Council on Foreign Relations (1994-present). He is also a member and has in the past served as Chairman of the Board of Directors of Artis-Naples (2012-present). Previously, Mr. Lautenbach served as a member and then Lead Director of the Board of Directors of Eaton Corporation (diversified industrial, 1997-2016). He was also a Partner at Clayton, Dubilier & Rice, LLC (private equity investment, 1998-2010); as well as Director of Sony Corporation (2006-2007). In addition, Mr. Lautenbach had a 30-year career with IBM (technology company), during which time he served as Senior Vice President and as a member of the Corporate Executive Committee (1968-1998).
Joseph Mauriello (1944)
Year of Election or Appointment: 2008
Trustee
Mr. Mauriello also serves as Trustee of other Fidelity® funds. Prior to his retirement in January 2006, Mr. Mauriello served in numerous senior management positions including Deputy Chairman and Chief Operating Officer (2004-2005), and Vice Chairman of Financial Services (2002-2004) of KPMG LLP US (professional services, 1965-2005). Mr. Mauriello currently serves as a member of the Independent Directors Council Governing Council (2015-present). Previously, Mr. Mauriello served as a member of the Board of XL Group plc. (global insurance and re-insurance, 2006-2018).
Cornelia M. Small (1944)
Year of Election or Appointment: 2005
Trustee
Ms. Small also serves as Trustee of other Fidelity® funds. Previously, Ms. Small served as Chief Investment Officer, Director of Global Equity Investments and a member of Scudder, Stevens & Clark and Scudder Kemper Investments. Ms. Small previously served as a member of the Board (2009-2019) and Chair of the Investment Committee (2010-2019) of the Teagle Foundation and a member of the Investment Committee of the Berkshire Taconic Community Foundation (2008-2019).
Garnett A. Smith (1947)
Year of Election or Appointment: 2018
Trustee
Mr. Smith also serves as Trustee of other Fidelity® funds. Prior to his retirement, Mr. Smith served as Chairman and Chief Executive Officer (1990-1997) and President (1986-1990) of Inbrand Corp. (manufacturer of personal absorbent products). Prior to his employment with Inbrand Corp., he was employed by a retail fabric chain and North Carolina National Bank (now Bank of America). Mr. Smith previously served as a member of the Advisory Board of certain Fidelity® funds (2012-2013).
David M. Thomas (1949)
Year of Election or Appointment: 2008
Trustee
Co-Lead Independent Trustee
Mr. Thomas also serves as Trustee of other Fidelity® funds. Previously, Mr. Thomas served as Executive Chairman (2005-2006) and Chairman and Chief Executive Officer (2000-2005) of IMS Health, Inc. (pharmaceutical and healthcare information solutions). Mr. Thomas currently serves as Non-Executive Chairman of the Board of Fortune Brands Home and Security (home and security products, 2011-present), and a member of the Board (2004-present) and Presiding Director (2013-present) of Interpublic Group of Companies, Inc. (marketing communication).
Susan Tomasky (1953)
Year of Election or Appointment: 2020
Trustee
Ms. Tomasky also serves as Trustee of other Fidelity® funds. Prior to her retirement, Ms. Tomasky served in various executive officer positions at American Electric Power Company, Inc. (1998-2011), including most recently as President of AEP Transmission (2007-2011). Ms. Tomasky currently serves as a member of the Board and Sustainability Committee and as Chair of the Audit Committee of Marathon Petroleum Corporation (2018-present) and as a member of the Board, Corporate Governance Committee and Organization and Compensation Committee and as Chair of the Audit Committee of Public Service Enterprise Group, Inc. (utilities company, 2012-present). In addition, Ms. Tomasky currently serves as a member of the Board of the Columbus Regional Airport Authority (2007-present), as a member of the Board of the Royal Shakespeare Company – America (2009-present), as a member of the Board of the Columbus Association for the Performing Arts (2011-present) and as a member of the Board of Kenyon College (2016-present). Previously, Ms. Tomasky served as a Member of the Advisory Board of certain Fidelity® funds (2020), a member of the Board (2011-2019) and as Lead Independent Director (2015-2018) of Andeavor Corporation (previously Tesoro Corporation) (independent oil refiner and marketer) and as a member of the Board of Summit Midstream Partners LP (energy, 2012-2018).
Michael E. Wiley (1950)
Year of Election or Appointment: 2020
Trustee
Mr. Wiley also serves as Trustee of other Fidelity® funds. Previously, Mr. Wiley served as a member of the Advisory Board of certain Fidelity® funds (2018-2020), Chairman, President and CEO of Baker Hughes, Inc. (oilfield services, 2000-2004). Mr. Wiley also previously served as a member of the Board of Andeavor Corporation (independent oil refiner and marketer, 2005-2018), a member of the Board of Andeavor Logistics LP (natural resources logistics, 2015-2018) and a member of the Board of High Point Resources (exploration and production, 2005-2020).
+ The information includes the Trustee's principal occupation during the last five years and other information relating to the experience, attributes, and skills relevant to the Trustee's qualifications to serve as a Trustee, which led to the conclusion that the Trustee should serve as a Trustee for the fund.
Advisory Board Members and Officers:
Correspondence intended for a Member of the Advisory Board (if any) may be sent to Fidelity Investments, P.O. Box 55235, Boston, Massachusetts 02205-5235. Correspondence intended for an officer or Peter S. Lynch may be sent to Fidelity Investments, 245 Summer Street, Boston, Massachusetts 02210. Officers appear below in alphabetical order.
Name, Year of Birth; Principal Occupation
Peter S. Lynch (1944)
Year of Election or Appointment: 2003
Member of the Advisory Board
Mr. Lynch also serves as a Member of the Advisory Board of other Fidelity® funds. Mr. Lynch is Vice Chairman and a Director of Fidelity Management & Research Company LLC (investment adviser firm). In addition, Mr. Lynch serves as a Trustee of Boston College and as the Chairman of the Inner-City Scholarship Fund. Previously, Mr. Lynch served as Vice Chairman and a Director of FMR Co., Inc. (investment adviser firm) and on the Special Olympics International Board of Directors (1997-2006).
Elizabeth Paige Baumann (1968)
Year of Election or Appointment: 2017
Anti-Money Laundering (AML) Officer
Ms. Baumann also serves as AML Officer of other funds. She is Chief AML Officer (2012-present) and Senior Vice President (2014-present) of FMR LLC (diversified financial services company) and is an employee of Fidelity Investments. Previously, Ms. Baumann served as AML Officer of certain funds (2017-2019), as AML Officer of the funds (2012-2016), and Vice President (2007-2014) and Deputy Anti-Money Laundering Officer (2007-2012) of FMR LLC.
Craig S. Brown (1977)
Year of Election or Appointment: 2019
Assistant Treasurer
Mr. Brown also serves as Assistant Treasurer of other funds. Mr. Brown is an employee of Fidelity Investments (2013-present).
John J. Burke III (1964)
Year of Election or Appointment: 2018
Chief Financial Officer
Mr. Burke also serves as Chief Financial Officer of other funds. Mr. Burke serves as Head of Investment Operations for Fidelity Fund and Investment Operations (2018-present) and is an employee of Fidelity Investments (1998-present). Previously Mr. Burke served as head of Asset Management Investment Operations (2012-2018).
William C. Coffey (1969)
Year of Election or Appointment: 2019
Assistant Secretary
Mr. Coffey also serves as Assistant Secretary of other funds. He is Senior Vice President and Deputy General Counsel of FMR LLC (diversified financial services company, 2010-present), and is an employee of Fidelity Investments. Previously, Mr. Coffey served as Secretary and CLO of certain funds (2018-2019); CLO, Secretary, and Senior Vice President of Fidelity Management & Research Company and FMR Co., Inc. (investment adviser firms, 2018-2019); Secretary of Fidelity SelectCo, LLC and Fidelity Investments Money Management, Inc. (investment adviser firms, 2018-2019); CLO of Fidelity Management & Research (Hong Kong) Limited, FMR Investment Management (UK) Limited, and Fidelity Management & Research (Japan) Limited (investment adviser firms, 2018-2019); and Assistant Secretary of certain funds (2009-2018).
Timothy M. Cohen (1969)
Year of Election or Appointment: 2018
Vice President
Mr. Cohen also serves as Vice President of other funds. Mr. Cohen serves as Co-Head of Equity (2018-present), a Director of Fidelity Management & Research (Japan) Limited (investment adviser firm, 2016-present), and is an employee of Fidelity Investments. Previously, Mr. Cohen served as Executive Vice President of Fidelity SelectCo, LLC (2019), Head of Global Equity Research (2016-2018), Chief Investment Officer - Equity and a Director of Fidelity Management & Research (U.K.) Inc. (investment adviser firm, 2013-2015) and as a Director of Fidelity Management & Research (Hong Kong) Limited (investment adviser firm, 2017).
Jonathan Davis (1968)
Year of Election or Appointment: 2010
Assistant Treasurer
Mr. Davis also serves as Assistant Treasurer of other funds. Mr. Davis serves as Assistant Treasurer of FMR Capital, Inc. (2017-present) and is an employee of Fidelity Investments. Previously, Mr. Davis served as Vice President and Associate General Counsel of FMR LLC (diversified financial services company, 2003-2010).
Laura M. Del Prato (1964)
Year of Election or Appointment: 2018
Assistant Treasurer
Ms. Del Prato also serves as an officer of other funds. Ms. Del Prato is an employee of Fidelity Investments (2017-present). Previously, Ms. Del Prato served as President and Treasurer of The North Carolina Capital Management Trust: Cash Portfolio and Term Portfolio (2018-2020). Prior to joining Fidelity Investments, Ms. Del Prato served as a Managing Director and Treasurer of the JPMorgan Mutual Funds (2014-2017). Prior to JPMorgan, Ms. Del Prato served as a partner at Cohen Fund Audit Services (accounting firm, 2012-2013) and KPMG LLP (accounting firm, 2004-2012).
Colm A. Hogan (1973)
Year of Election or Appointment: 2020
Assistant Treasurer
Mr. Hogan also serves as an officer of other funds. Mr. Hogan serves as Assistant Treasurer of FMR Capital, Inc. (2017-present) and is an employee of Fidelity Investments (2005-present). Previously, Mr. Hogan served as Deputy Treasurer of certain Fidelity® funds (2016-2020) and Assistant Treasurer of certain Fidelity® funds (2016-2018).
Pamela R. Holding (1964)
Year of Election or Appointment: 2018
Vice President
Ms. Holding also serves as Vice President of other funds. Ms. Holding serves as Co-Head of Equity (2018-present) and is an employee of Fidelity Investments (2013-present). Previously, Ms. Holding served as Executive Vice President of Fidelity SelectCo, LLC (2019) and as Chief Investment Officer of Fidelity Institutional Asset Management (2013-2018).
Cynthia Lo Bessette (1969)
Year of Election or Appointment: 2019
Secretary and Chief Legal Officer (CLO)
Ms. Lo Bessette also serves as an officer of other funds. Ms. Lo Bessette serves as CLO, Secretary, and Senior Vice President of Fidelity Management & Research Company LLC (investment adviser firm, 2019-present); and CLO of Fidelity Management & Research (Hong Kong) Limited, FMR Investment Management (UK) Limited, and Fidelity Management & Research (Japan) Limited (investment adviser firms, 2019-present). She is a Senior Vice President and Deputy General Counsel of FMR LLC (diversified financial services company, 2019-present), and is an employee of Fidelity Investments. Previously, Ms. Lo Bessette served as CLO, Secretary, and Senior Vice President of FMR Co., Inc. (investment adviser firm, 2019); Secretary of Fidelity SelectCo, LLC and Fidelity Investments Money Management, Inc. (investment adviser firms, 2019). Prior to joining Fidelity Investments, Ms. Lo Bessette was Executive Vice President, General Counsel (2016-2019) and Senior Vice President, Deputy General Counsel (2015-2016) of OppenheimerFunds (investment management company) and Deputy Chief Legal Officer (2013-2015) of Jennison Associates LLC (investment adviser firm).
Chris Maher (1972)
Year of Election or Appointment: 2020
Deputy Treasurer
Mr. Maher also serves as an officer of other funds. Mr. Maher serves as Assistant Treasurer of FMR Capital, Inc. (2017-present), and is an employee of Fidelity Investments (2008-present). Previously, Mr. Maher served as Assistant Treasurer of certain funds (2013-2020); Vice President of Asset Management Compliance (2013), Vice President of the Program Management Group of FMR (investment adviser firm, 2010-2013), and Vice President of Valuation Oversight (2008-2010).
Jason P. Pogorelec (1975)
Year of Election or Appointment: 2020
Chief Compliance Officer
Mr. Pogorelec also serves as Chief Compliance Officer of other funds. Mr. Pogorelec is a senior Vice President of Asset Management Compliance for Fidelity Investments and is an employee of Fidelity Investments (2006-present). Previously, Mr. Pogorelec served as Vice President, Associate General Counsel for Fidelity Investments (2010-2020) and Assistant Secretary of certain Fidelity funds (2015-2020).
Stacie M. Smith (1974)
Year of Election or Appointment: 2016
President and Treasurer
Ms. Smith also serves as an officer of other funds. Ms. Smith serves as Assistant Treasurer of FMR Capital, Inc. (2017-present), is an employee of Fidelity Investments (2009-present), and has served in other fund officer roles. Prior to joining Fidelity Investments, Ms. Smith served as Senior Audit Manager of Ernst & Young LLP (accounting firm, 1996-2009). Previously, Ms. Smith served as Assistant Treasurer (2013-2019) and Deputy Treasurer (2013-2016) of certain Fidelity® funds.
Marc L. Spector (1972)
Year of Election or Appointment: 2016
Assistant Treasurer
Mr. Spector also serves as an officer of other funds. Mr. Spector serves as Assistant Treasurer of FMR Capital, Inc. (2017-present) and is an employee of Fidelity Investments (2016-present). Prior to joining Fidelity Investments, Mr. Spector served as Director at the Siegfried Group (accounting firm, 2013-2016), and prior to Siegfried Group as audit senior manager at Deloitte & Touche LLP (accounting firm, 2005-2013).
Jim Wegmann (1979)
Year of Election or Appointment: 2019
Assistant Treasurer
Mr. Wegmann also serves as Assistant Treasurer of other funds. Mr. Wegmann is an employee of Fidelity Investments (2011-present).
Shareholder Expense Example
As a shareholder, you incur two types of costs: (1) transaction costs, which may include sales charges (loads) on purchase payments or redemption proceeds, as applicable and (2) ongoing costs, which generally include management fees, distribution and/or service (12b-1) fees and other Fund expenses. This Example is intended to help you understand your ongoing costs (in dollars) of investing in a fund and to compare these costs with the ongoing costs of investing in other mutual funds.
The Example is based on an investment of $1,000 invested at the beginning of the period and held for the entire period (February 1, 2020 to July 31, 2020).
Actual Expenses
The first line of the accompanying table provides information about actual account values and actual expenses. You may use the information in this line, together with the amount you invested, to estimate the expenses that you paid over the period. Simply divide your account value by $1,000.00 (for example, an $8,600 account value divided by $1,000.00 = 8.6), then multiply the result by the number in the first line for a class/Fund under the heading entitled "Expenses Paid During Period" to estimate the expenses you paid on your account during this period. If any fund is a shareholder of any underlying mutual funds or exchange-traded funds (ETFs) (the Underlying Funds), such fund indirectly bears its proportional share of the expenses of the Underlying Funds in addition to the direct expenses incurred presented in the table. These fees and expenses are not included in the annualized expense ratio used to calculate the expense estimate in the table below.
Hypothetical Example for Comparison Purposes
The second line of the accompanying table provides information about hypothetical account values and hypothetical expenses based on the actual expense ratio and an assumed rate of return of 5% per year before expenses, which is not the actual return. The hypothetical account values and expenses may not be used to estimate the actual ending account balance or expenses you paid for the period. You may use this information to compare the ongoing costs of investing in the Fund and other funds. To do so, compare this 5% hypothetical example with the 5% hypothetical examples that appear in the shareholder reports of the other funds. If any fund is a shareholder of any Underlying Funds, such fund indirectly bears its proportional share of the expenses of the Underlying Funds in addition to the direct expenses as presented in the table. These fees and expenses are not included in the annualized expense ratio used to calculate the expense estimate in the table below.
Please note that the expenses shown in the table are meant to highlight your ongoing costs only and do not reflect any transaction costs. Therefore, the second line of the table is useful in comparing ongoing costs only, and will not help you determine the relative total costs of owning different funds.
| | Annualized Expense Ratio-A | Beginning
Account Value
February 1, 2020 | Ending
Account Value
July 31, 2020 | Expenses Paid
During Period-B
February 1, 2020
to July 31, 2020 |
| Fidelity Growth & Income Portfolio | | | | |
| Growth and Income | .61% | | | |
| Actual | | $1,000.00 | $936.90 | $2.94 |
| Hypothetical-C | | $1,000.00 | $1,021.83 | $3.07 |
| Class K | .50% | | | |
| Actual | | $1,000.00 | $937.40 | $2.41 |
| Hypothetical-C | | $1,000.00 | $1,022.38 | $2.51 |
A Annualized expense ratio reflects expenses net of applicable fee waivers.
B Expenses are equal to the annualized expense ratio, multiplied by the average account value over the period, multiplied by 182/ 366 (to reflect the one-half year period). The fees and expenses of any Underlying Funds are not included in each annualized expense ratio.
C 5% return per year before expenses
Distributions (Unaudited)
The Board of Trustees of Fidelity Growth & Income Portfolio voted to pay to shareholders of record at the opening of business on record date, the following distributions per share derived from capital gains realized from sales of portfolio securities:
| | Pay Date | Record Date | Capital Gains |
| Fidelity Growth & Income Portfolio | | | |
| Growth & Income | 09/08/2020 | 09/04/2020 | $0.658 |
| Class K | 09/08/2020 | 09/04/2020 | $0.658 |
|
The fund hereby designates as a capital gain dividend with respect to the taxable year ended July 31, 2020, $147,213,634, or, if subsequently determined to be different, the net capital gain of such year.
A total of 0.44% of the dividends distributed during the fiscal year was derived from interest on U.S. Government securities which is generally exempt from state income tax.
Growth & Income and Class K designate 100% of the dividends distributed during the fiscal year as qualifying for the dividends–received deduction for corporate shareholders.
Growth & Income and Class K designate 100% of dividends distributed during the fiscal year as amounts which may be taken into account as a dividend for purposes of the maximum rate under section 1(h)(11) of the Internal Revenue Code.
The fund will notify shareholders in January 2021 of amounts for use in preparing 2020 income tax returns.
Liquidity Risk Management Program
The Securities and Exchange Commission adopted Rule 22e-4 under the Investment Company Act of 1940 (the Liquidity Rule) to promote effective liquidity risk management throughout the open-end investment company industry, thereby reducing the risk that funds will be unable to meet their redemption obligations and mitigating dilution of the interests of fund shareholders.
The Fund has adopted and implemented a liquidity risk management program pursuant to the Liquidity Rule (the Program) effective December 1, 2018. The Program is reasonably designed to assess and manage the Fund’s liquidity risk and to comply with the requirements of the Liquidity Rule. The Fund’s Board of Trustees (the Board) has designated the Fund’s investment adviser as administrator of the Program. The Fidelity advisers have established a Liquidity Risk Management Committee (the LRM Committee) to manage the Program for each of the Fidelity Funds. The LRM Committee monitors the adequacy and effectiveness of implementation of the Program and on a periodic basis assesses each Fund’s liquidity risk based on a variety of factors including (1) the Fund’s investment strategy, (2) portfolio liquidity and cash flow projections during normal and reasonably foreseeable stressed conditions, (3) shareholder redemptions, (4) borrowings and other funding sources and (5) in the case of exchange-traded funds, certain additional factors including the effect of the Fund’s prices and spreads, market participants, and basket compositions on the overall liquidity of the Fund’s portfolio, as applicable.
In accordance with the Program, each of the Fund’s portfolio investments is classified into one of four liquidity categories described below based on a determination of a reasonable expectation for how long it would take to convert the investment to cash (or sell or dispose of the investment) without significantly changing its market value.
- Highly liquid investments – cash or convertible to cash within three business days or less
- Moderately liquid investments – convertible to cash in three to seven calendar days
- Less liquid investments – can be sold or disposed of, but not settled, within seven calendar days
- Illiquid investments – cannot be sold or disposed of within seven calendar days
Liquidity classification determinations take into account a variety of factors including various market, trading and investment-specific considerations, as well as market depth, and generally utilize analysis from a third-party liquidity metrics service.
The Liquidity Rule places a 15% limit on a fund’s illiquid investments and requires funds that do not primarily hold assets that are highly liquid investments to determine and maintain a minimum percentage of the fund’s net assets to be invested in highly liquid investments (highly liquid investment minimum or HLIM). The Program includes provisions reasonably designed to comply with the 15% limit on illiquid investments and for determining, periodically reviewing and complying with the HLIM requirement as applicable.
At a recent meeting of the Fund’s Board of Trustees, the LRM Committee provided a written report to the Board pertaining to the operation, adequacy, and effectiveness of implementation of the Program for the annual period from December 1, 2018 through November 30, 2019. The report concluded that the Program has been implemented and is operating effectively and is reasonably designed to assess and manage the Fund’s liquidity risk.
Proxy Voting Results
A special meeting of shareholders was held on June 9, 2020. The results of votes taken among shareholders on the proposals before them are reported below. Each vote reported represents one dollar of net asset value held on the record date for the meeting.
PROPOSAL 1
To elect a Board of Trustees.
| | # of
Votes | % of
Votes |
| Dennis J. Dirks |
| Affirmative | 43,167,428,219.785 | 94.885 |
| Withheld | 2,327,070,930.034 | 5.115 |
| TOTAL | 45,494,499,149.820 | 100.000 |
| Donald F. Donahue |
| Affirmative | 43,161,668,935.467 | 94.872 |
| Withheld | 2,333,065,287.611 | 5.128 |
| TOTAL | 45,494,734,223.077 | 100.000 |
| Bettina Doulton |
| Affirmative | 43,304,465,213.969 | 95.186 |
| Withheld | 2,190,010,062.903 | 4.814 |
| TOTAL | 45,494,475,276.872 | 100.000 |
| Vicki L. Fuller |
| Affirmative | 43,380,442,631.493 | 95.353 |
| Withheld | 2,114,180,614.639 | 4.647 |
| TOTAL | 45,494,623,246.132 | 100.000 |
| Patricia L. Kampling |
| Affirmative | 43,128,008,796.761 | 94.798 |
| Withheld | 2,366,685,422.999 | 5.202 |
| TOTAL | 45,494,694,219.760 | 100.000 |
| Alan J. Lacy |
| Affirmative | 42,904,065,046.958 | 94.305 |
| Withheld | 2,590,717,567.229 | 5.695 |
| TOTAL | 45,494,782,614.187 | 100.000 |
| Ned C. Lautenbach |
| Affirmative | 42,802,778,827.017 | 94.083 |
| Withheld | 2,692,003,787.170 | 5.917 |
| TOTAL | 45,494,782,614.187 | 100.000 |
| Robert A. Lawrence |
| Affirmative | 42,971,258,294.203 | 94.453 |
| Withheld | 2,523,524,319.984 | 5.547 |
| TOTAL | 45,494,782,614.187 | 100.000 |
| Joseph Mauriello |
| Affirmative | 42,874,562,778.490 | 94.241 |
| Withheld | 2,620,171,874.731 | 5.759 |
| TOTAL | 45,494,734,653.220 | 100.000 |
| Cornelia M. Small |
| Affirmative | 43,029,040,988.063 | 94.580 |
| Withheld | 2,465,741,626.124 | 5.420 |
| TOTAL | 45,494,782,614.187 | 100.000 |
| Garnett A. Smith |
| Affirmative | 42,892,814,945.159 | 94.281 |
| Withheld | 2,601,967,669.028 | 5.719 |
| TOTAL | 45,494,782,614.187 | 100.000 |
| David M. Thomas |
| Affirmative | 42,936,080,036.111 | 94.376 |
| Withheld | 2,558,702,578.076 | 5.624 |
| TOTAL | 45,494,782,614.187 | 100.000 |
| Susan Tomasky |
| Affirmative | 43,147,934,105.796 | 94.842 |
| Withheld | 2,346,571,066.028 | 5.158 |
| TOTAL | 45,494,782,614.187 | 100.000 |
| Michael E. Wiley |
| Affirmative | 42,885,333,102.972 | 94.264 |
| Withheld | 2,609,449,511.215 | 5.736 |
| TOTAL | 45,494,782,614.187 | 100.000 |
PROPOSAL 2
To convert a fundamental investment policy to a non-fundamental investment policy.
| | # of
Votes | % of
Votes |
| Affirmative | 2,466,527,369.349 | 71.350 |
| Against | 484,585,516.664 | 14.018 |
| Abstain | 397,135,866.581 | 11.488 |
| Broker Non-Vote | 108,703,252.660 | 3.144 |
| TOTAL | 3,456,952,005.254 | 100.000 |
PROPOSAL 5
A shareholder proposal to institute procedures to avoid holding investments in companies that contribute to genocide or crimes against humanity.
| | # of
Votes | % of
Votes |
| Affirmative | 1,116,761,068.425 | 32.305 |
| Against | 1,972,346,116.597 | 57.054 |
| Abstain | 258,630,177.078 | 7.481 |
| Broker Non-Vote | 109,214,643.155 | 3.159 |
| TOTAL | 3,456,952,005.254 | 100.000 |
| Proposal 1 reflects trust wide proposal and voting results. |
| Proposal 5 was not approved by shareholders. |
GAI-ANN-0920
1.536189.123
Fidelity® Leveraged Company Stock Fund
Annual Report
July 31, 2020
See the inside front cover for important information about access to your fund’s shareholder reports.
Beginning on January 1, 2021, as permitted by regulations adopted by the Securities and Exchange Commission, paper copies of a fund’s shareholder reports will no longer be sent by mail, unless you specifically request paper copies of the reports from the fund or from your financial intermediary, such as a financial advisor, broker-dealer or bank. Instead, the reports will be made available on a website, and you will be notified by mail each time a report is posted and provided with a website link to access the report.
If you already elected to receive shareholder reports electronically, you will not be affected by this change and you need not take any action. You may elect to receive shareholder reports and other communications from a fund electronically, by contacting your financial intermediary. For Fidelity customers, visit Fidelity's web site or call Fidelity using the contact information listed below.
You may elect to receive all future reports in paper free of charge. If you wish to continue receiving paper copies of your shareholder reports, you may contact your financial intermediary or, if you are a Fidelity customer, visit Fidelity’s website, or call Fidelity at the applicable toll-free number listed below. Your election to receive reports in paper will apply to all funds held with the fund complex/your financial intermediary.
| Account Type | Website | Phone Number |
| Brokerage, Mutual Fund, or Annuity Contracts: | fidelity.com/mailpreferences | 1-800-343-3548 |
| Employer Provided Retirement Accounts: | netbenefits.fidelity.com/preferences (choose 'no' under Required Disclosures to continue to print) | 1-800-343-0860 |
| Advisor Sold Accounts Serviced Through Your Financial Intermediary: | Contact Your Financial Intermediary | Your Financial Intermediary's phone number |
| Advisor Sold Accounts Serviced by Fidelity: | institutional.fidelity.com | 1-877-208-0098 |
Contents
To view a fund's proxy voting guidelines and proxy voting record for the 12-month period ended June 30, visit http://www.fidelity.com/proxyvotingresults or visit the Securities and Exchange Commission's (SEC) web site at http://www.sec.gov.
You may also call 1-800-544-8544 if you’re an individual investing directly with Fidelity, call 1-800-835-5092 if you’re a plan sponsor or participant with Fidelity as your recordkeeper or call 1-877-208-0098 on institutional accounts or if you’re an advisor or invest through one to request a free copy of the proxy voting guidelines.
Standard & Poor's, S&P and S&P 500 are registered service marks of The McGraw-Hill Companies, Inc. and have been licensed for use by Fidelity Distributors Corporation.
Other third-party marks appearing herein are the property of their respective owners.
All other marks appearing herein are registered or unregistered trademarks or service marks of FMR LLC or an affiliated company. © 2020 FMR LLC. All rights reserved.
This report and the financial statements contained herein are submitted for the general information of the shareholders of the Fund. This report is not authorized for distribution to prospective investors in the Fund unless preceded or accompanied by an effective prospectus.
A fund files its complete schedule of portfolio holdings with the SEC for the first and third quarters of each fiscal year on Form N-PORT. Forms N-PORT are available on the SEC’s web site at http://www.sec.gov. A fund's Forms N-PORT may be reviewed and copied at the SEC’s Public Reference Room in Washington, DC. Information regarding the operation of the SEC's Public Reference Room may be obtained by calling 1-800-SEC-0330.
For a complete list of a fund's portfolio holdings, view the most recent holdings listing, semiannual report, or annual report on Fidelity's web site at http://www.fidelity.com, http://www.institutional.fidelity.com, or http://www.401k.com, as applicable.
NOT FDIC INSURED •MAY LOSE VALUE •NO BANK GUARANTEE
Neither the Fund nor Fidelity Distributors Corporation is a bank.
Note to Shareholders:
Early in 2020, the outbreak and spread of a new coronavirus emerged as a public health emergency that had a major influence on financial markets, primarily based on its impact on the global economy and the outlook for corporate earnings. The virus causes a respiratory disease known as COVID-19. On March 11, the World Health Organization declared the COVID-19 outbreak a pandemic, citing sustained risk of further global spread.
In the weeks following, as the crisis worsened, we witnessed an escalating human tragedy with wide-scale social and economic consequences from coronavirus-containment measures. The outbreak of COVID-19 prompted a number of measures to limit the spread, including travel and border restrictions, quarantines, and restrictions on large gatherings. In turn, these resulted in lower consumer activity, diminished demand for a wide range of products and services, disruption in manufacturing and supply chains, and – given the wide variability in outcomes regarding the outbreak – significant market uncertainty and volatility. Amid the turmoil, the U.S. government took unprecedented action – in concert with the U.S. Federal Reserve and central banks around the world – to help support consumers, businesses, and the broader economy, and to limit disruption to the financial system.
The situation continues to unfold, and the extent and duration of its impact on financial markets and the economy remain highly uncertain. Extreme events such as the coronavirus crisis are “exogenous shocks” that can have significant adverse effects on mutual funds and their investments. Although multiple asset classes may be affected by market disruption, the duration and impact may not be the same for all types of assets.
Fidelity is committed to helping you stay informed amid news about COVID-19 and during increased market volatility, and we’re taking extra steps to be responsive to customer needs. We encourage you to visit our websites, where we offer ongoing updates, commentary, and analysis on the markets and our funds.
Performance: The Bottom Line
Average annual total return reflects the change in the value of an investment, assuming reinvestment of distributions from dividend income and capital gains (the profits earned upon the sale of securities that have grown in value, if any) and assuming a constant rate of performance each year. The hypothetical investment and the average annual total returns do not reflect the deduction of taxes that a shareholder would pay on fund distributions or the redemption of fund shares. During periods of reimbursement by Fidelity, a fund’s total return will be greater than it would be had the reimbursement not occurred. How a fund did yesterday is no guarantee of how it will do tomorrow.
Average Annual Total Returns
| For the periods ended July 31, 2020 | Past 1 year | Past 5 years | Past 10 years |
| Fidelity® Leveraged Company Stock Fund | 3.24% | 4.93% | 10.13% |
| Class K | 3.38% | 5.04% | 10.27% |
$10,000 Over 10 Years
Let's say hypothetically that $10,000 was invested in Fidelity® Leveraged Company Stock Fund, a class of the fund, on July 31, 2010.
The chart shows how the value of your investment would have changed, and also shows how the Russell Midcap® Index performed over the same period.
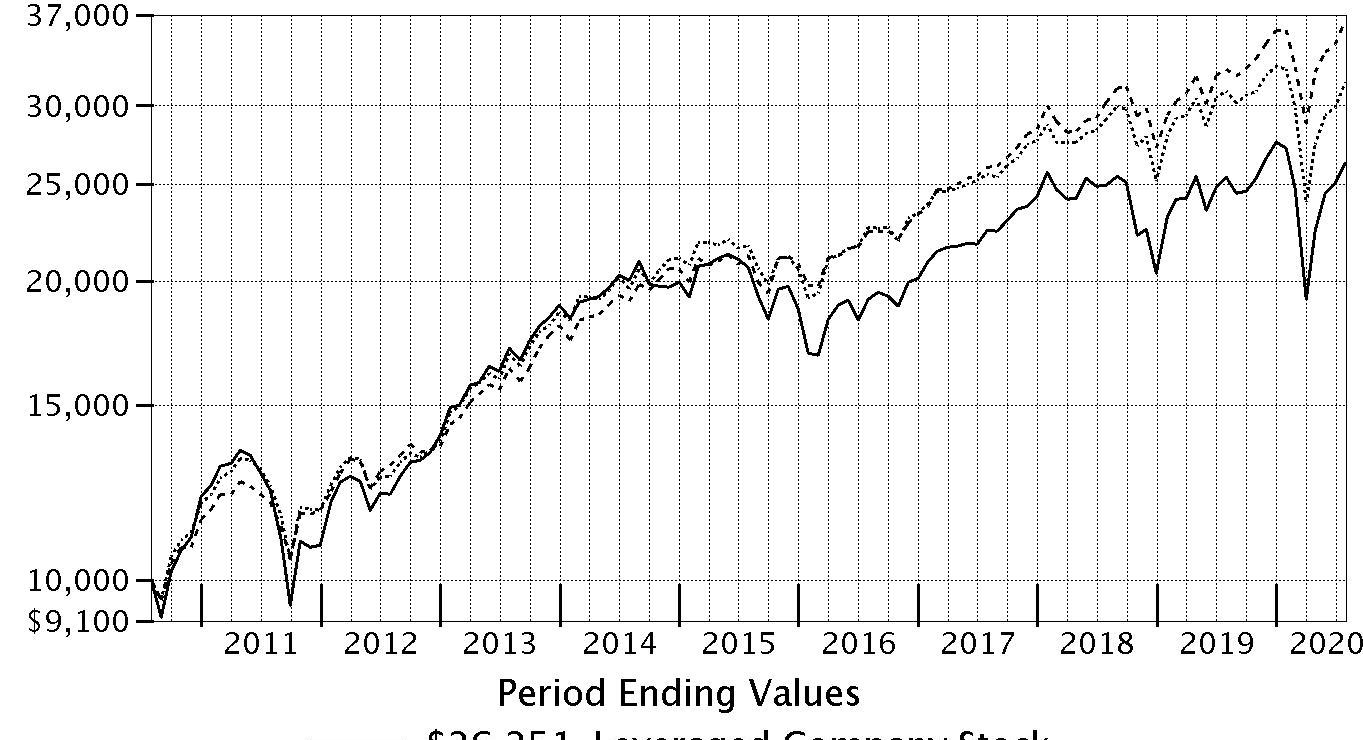
| Period Ending Values |
| $26,251 | Fidelity® Leveraged Company Stock Fund |
| $31,647 | Russell Midcap® Index |
| $36,558 | S&P 500 Index |
Effective October 1, 2019, the fund’s benchmark changed from the S&P 500® Index to the Russell Mid Cap Index.
Management's Discussion of Fund Performance
Market Recap: The S&P 500
® index gained 11.96% for the 12 months ending July 31, 2020, in what was a bumpy ride for U.S. equity investors, marked by a steep but brief decline due to the early-2020 outbreak and spread of the coronavirus, followed by a historic rebound. Declared a pandemic on March 11, the COVID-19 crisis and containment efforts caused broad contraction in economic activity, along with extreme uncertainty, volatility and dislocation in financial markets. By mid-March, U.S. stocks entered bear-market territory less than a month after hitting an all-time high and extending the longest-running bull market in American history. Stocks slid in late February, after a surge in COVID-19 cases outside China. The sudden downtrend continued in March (-12%), capping the index’s worst quarter since 2008. A historically rapid and expansive U.S. monetary/fiscal-policy response provided a partial offset to the economic disruption and fueled a sharp uptrend. Aggressive support for financial markets by the U.S. Federal Reserve, plans for reopening the economy and improving infection data boosted stocks in April (+13%) and May (+5%). In June and July, the index gained amid progress on potential treatments and signs of an early recovery in economic activity. For the full 12 months, growth stocks widely topped value, while large-caps handily bested smaller-caps. The information technology sector (+39%) led the way, followed by consumer discretionary (+22%). In contrast, energy (-38%) fell hard along with the price of crude oil.
Comments from Co-Portfolio Manager Mark Notkin: For the fiscal year ending July 31, 2020, the fund's share classes gained about 3%, topping the 2.04% advance of the Russell Midcap
® Index, the primary benchmark since October 1, 2019. The fund's outperformance of the benchmark the past 12 months was driven by industry positioning, especially overweightings in software & services and semiconductors & semiconductor equipment. To a lesser extent, relative performance benefited from our decision to largely avoid the weak real estate and energy sectors and underweight financials stocks. Security selection was helpful within communication services and information technology. The top individual contributors were a trio of software & services stocks: Adobe (+48%), Microsoft (+52%) and PayPal Holdings (+77%). Conversely, the largest relative detractor by a wide margin was security selection within the transportation industry, followed by our picks in the consumer staples, health care and utilities sectors. A sizable stake in Air Canada returned roughly -67% and was the biggest individual detractor. It also hurt to hold a large position in gaming company Caesars Entertainment (-30%). I'll also note that the fund's foreign holdings detracted, in part due to currency fluctuation. All of the stocks mentioned were non-benchmark holdings.
The views expressed above reflect those of the portfolio manager(s) only through the end of the period as stated on the cover of this report and do not necessarily represent the views of Fidelity or any other person in the Fidelity organization. Any such views are subject to change at any time based upon market or other conditions and Fidelity disclaims any responsibility to update such views. These views may not be relied on as investment advice and, because investment decisions for a Fidelity fund are based on numerous factors, may not be relied on as an indication of trading intent on behalf of any Fidelity fund.
Note to shareholders: On October 1, 2019, the fund's primary benchmark changed from the S&P 500
® index to the Russell Midcap
® Index. Additionally, the fund's supplemental benchmark changed from the Credit Suisse Leveraged Equity Index to the Fidelity U.S. Leveraged Stock Index. On October 1, 2019, Brian Chang assumed co-management responsibilities for the fund, joining Mark Notkin.
Investment Summary (Unaudited)
Top Ten Stocks as of July 31, 2020
| | % of fund's net assets |
| Adobe, Inc. | 4.3 |
| Microsoft Corp. | 4.0 |
| T-Mobile U.S., Inc. | 3.7 |
| PayPal Holdings, Inc. | 3.2 |
| IQVIA Holdings, Inc. | 3.1 |
| Caesars Entertainment, Inc. | 3.0 |
| Global Payments, Inc. | 2.8 |
| Alphabet, Inc. Class A | 2.8 |
| Lam Research Corp. | 2.6 |
| EPAM Systems, Inc. | 2.6 |
| | 32.1 |
Top Five Market Sectors as of July 31, 2020
| | % of fund's net assets |
| Information Technology | 36.8 |
| Consumer Discretionary | 13.5 |
| Health Care | 12.9 |
| Communication Services | 12.3 |
| Industrials | 8.5 |
Asset Allocation (% of fund's net assets)
| As of July 31, 2020 * |
| | Stocks | 98.7% |
| | Short-Term Investments and Net Other Assets (Liabilities) | 1.3% |

* Foreign investments - 7.2%
Schedule of Investments July 31, 2020
Showing Percentage of Net Assets
| Common Stocks - 98.7% | | | |
| | | Shares | Value (000s) |
| COMMUNICATION SERVICES - 12.3% | | | |
| Interactive Media & Services - 4.9% | | | |
| Alphabet, Inc. Class A (a) | | 35,700 | $53,120 |
| Facebook, Inc. Class A (a) | | 162,400 | 41,196 |
| | | | 94,316 |
| Media - 3.7% | | | |
| Altice U.S.A., Inc. Class A (a) | | 1,493,800 | 40,318 |
| Nexstar Broadcasting Group, Inc. Class A | | 347,798 | 30,484 |
| | | | 70,802 |
| Wireless Telecommunication Services - 3.7% | | | |
| T-Mobile U.S., Inc. (a) | | 653,000 | 70,119 |
|
| TOTAL COMMUNICATION SERVICES | | | 235,237 |
|
| CONSUMER DISCRETIONARY - 13.5% | | | |
| Automobiles - 2.2% | | | |
| Tesla, Inc. (a) | | 29,800 | 42,637 |
| Hotels, Restaurants & Leisure - 8.0% | | | |
| Boyd Gaming Corp. (b) | | 1,482,700 | 35,096 |
| Caesars Entertainment, Inc. (a) | | 1,853,080 | 57,538 |
| MGM Mirage, Inc. | | 369,500 | 5,945 |
| Penn National Gaming, Inc. (a) | | 1,317,970 | 44,613 |
| Studio City International Holdings Ltd. ADR (a) | | 695,700 | 10,331 |
| | | | 153,523 |
| Household Durables - 1.2% | | | |
| Tempur Sealy International, Inc. (a) | | 279,500 | 22,626 |
| Internet & Direct Marketing Retail - 2.1% | | | |
| Alibaba Group Holding Ltd. sponsored ADR (a) | | 77,400 | 19,429 |
| Amazon.com, Inc. (a) | | 6,400 | 20,254 |
| | | | 39,683 |
|
| TOTAL CONSUMER DISCRETIONARY | | | 258,469 |
|
| CONSUMER STAPLES - 3.2% | | | |
| Food Products - 3.2% | | | |
| Darling Ingredients, Inc. (a) | | 526,083 | 14,693 |
| JBS SA | | 11,023,700 | 45,519 |
| | | | 60,212 |
| ENERGY - 0.3% | | | |
| Oil, Gas & Consumable Fuels - 0.3% | | | |
| MEG Energy Corp.(a) | | 2,098,400 | 5,546 |
| FINANCIALS - 3.0% | | | |
| Banks - 1.8% | | | |
| Bank of America Corp. | | 652,399 | 16,232 |
| JPMorgan Chase & Co. | | 199,700 | 19,299 |
| | | | 35,531 |
| Consumer Finance - 1.2% | | | |
| OneMain Holdings, Inc. | | 788,900 | 22,641 |
|
| TOTAL FINANCIALS | | | 58,172 |
|
| HEALTH CARE - 12.9% | | | |
| Biotechnology - 1.5% | | | |
| Alexion Pharmaceuticals, Inc. (a) | | 134,100 | 13,744 |
| Regeneron Pharmaceuticals, Inc. (a) | | 25,000 | 15,802 |
| | | | 29,546 |
| Health Care Providers & Services - 4.1% | | | |
| HCA Holdings, Inc. | | 42,800 | 5,420 |
| Humana, Inc. | | 80,800 | 31,710 |
| UnitedHealth Group, Inc. | | 133,500 | 40,421 |
| | | | 77,551 |
| Life Sciences Tools & Services - 6.2% | | | |
| Charles River Laboratories International, Inc. (a) | | 80,900 | 16,098 |
| IQVIA Holdings, Inc. (a) | | 370,100 | 58,620 |
| Thermo Fisher Scientific, Inc. | | 107,500 | 44,500 |
| | | | 119,218 |
| Pharmaceuticals - 1.1% | | | |
| Bausch Health Cos., Inc. (Canada) (a) | | 408,100 | 7,462 |
| Bristol-Myers Squibb Co. | | 228,100 | 13,380 |
| | | | 20,842 |
|
| TOTAL HEALTH CARE | | | 247,157 |
|
| INDUSTRIALS - 8.5% | | | |
| Air Freight & Logistics - 0.4% | | | |
| XPO Logistics, Inc. (a) | | 111,600 | 8,372 |
| Airlines - 1.8% | | | |
| Air Canada (a) | | 3,111,100 | 35,096 |
| Building Products - 0.9% | | | |
| Carrier Global Corp. | | 603,300 | 16,434 |
| Commercial Services & Supplies - 0.0% | | | |
| Novus Holdings Ltd. | | 46,866 | 2 |
| Machinery - 1.9% | | | |
| Allison Transmission Holdings, Inc. | | 510,200 | 19,061 |
| Fortive Corp. | | 242,600 | 17,028 |
| | | | 36,089 |
| Marine - 0.0% | | | |
| Genco Shipping & Trading Ltd. | | 831 | 6 |
| Professional Services - 0.6% | | | |
| ASGN, Inc. (a) | | 162,500 | 11,125 |
| Trading Companies & Distributors - 2.9% | | | |
| HD Supply Holdings, Inc. (a) | | 713,100 | 25,030 |
| United Rentals, Inc. (a) | | 198,200 | 30,794 |
| | | | 55,824 |
|
| TOTAL INDUSTRIALS | | | 162,948 |
|
| INFORMATION TECHNOLOGY - 36.8% | | | |
| Electronic Equipment & Components - 3.8% | | | |
| CDW Corp. | | 205,900 | 23,936 |
| Zebra Technologies Corp. Class A (a) | | 175,300 | 49,215 |
| | | | 73,151 |
| IT Services - 14.7% | | | |
| EPAM Systems, Inc. (a) | | 170,200 | 49,372 |
| Fiserv, Inc. (a) | | 226,209 | 22,573 |
| Global Payments, Inc. | | 305,700 | 54,421 |
| GoDaddy, Inc. (a) | | 261,600 | 18,385 |
| MasterCard, Inc. Class A | | 125,000 | 38,566 |
| PayPal Holdings, Inc. (a) | | 309,400 | 60,664 |
| Visa, Inc. Class A | | 194,000 | 36,938 |
| | | | 280,919 |
| Semiconductors & Semiconductor Equipment - 6.6% | | | |
| Broadcom, Inc. | | 36,300 | 11,498 |
| Lam Research Corp. | | 132,600 | 50,011 |
| Microchip Technology, Inc. | | 408,600 | 41,567 |
| ON Semiconductor Corp. (a) | | 1,177,900 | 24,265 |
| | | | 127,341 |
| Software - 11.7% | | | |
| Adobe, Inc. (a) | | 185,600 | 82,465 |
| Microsoft Corp. | | 369,600 | 75,772 |
| Palo Alto Networks, Inc. (a) | | 108,300 | 27,716 |
| SS&C Technologies Holdings, Inc. | | 489,797 | 28,163 |
| VMware, Inc. Class A (a)(b) | | 73,000 | 10,235 |
| | | | 224,351 |
|
| TOTAL INFORMATION TECHNOLOGY | | | 705,762 |
|
| MATERIALS - 4.0% | | | |
| Chemicals - 1.8% | | | |
| CF Industries Holdings, Inc. | | 433,900 | 13,594 |
| The Chemours Co. LLC | | 1,129,328 | 20,926 |
| | | | 34,520 |
| Containers & Packaging - 1.5% | | | |
| Berry Global Group, Inc. (a) | | 204,500 | 10,223 |
| WestRock Co. | | 659,700 | 17,720 |
| | | | 27,943 |
| Metals & Mining - 0.7% | | | |
| First Quantum Minerals Ltd. | | 1,634,200 | 13,811 |
|
| TOTAL MATERIALS | | | 76,274 |
|
| UTILITIES - 4.2% | | | |
| Electric Utilities - 2.3% | | | |
| NRG Energy, Inc. | | 872,700 | 29,506 |
| Pacific Gas & Electric Co. (c) | | 31,752 | 282 |
| PG&E Corp. (a) | | 1,413,650 | 13,218 |
| | | | 43,006 |
| Independent Power and Renewable Electricity Producers - 1.9% | | | |
| Vistra Corp. | | 1,992,765 | 37,185 |
|
| TOTAL UTILITIES | | | 80,191 |
|
| TOTAL COMMON STOCKS | | | |
| (Cost $1,326,819) | | | 1,889,968 |
|
| Money Market Funds - 1.8% | | | |
| Fidelity Cash Central Fund 0.14% (d) | | 28,230,868 | 28,239 |
| Fidelity Securities Lending Cash Central Fund 0.13% (d)(e) | | 6,549,854 | 6,551 |
| TOTAL MONEY MARKET FUNDS | | | |
| (Cost $34,784) | | | 34,790 |
| TOTAL INVESTMENT IN SECURITIES - 100.5% | | | |
| (Cost $1,361,603) | | | 1,924,758 |
| NET OTHER ASSETS (LIABILITIES) - (0.5)% | | | (9,173) |
| NET ASSETS - 100% | | | $1,915,585 |
Legend
(a) Non-income producing
(b) Security or a portion of the security is on loan at period end.
(c) Restricted securities (including private placements) - Investment in securities not registered under the Securities Act of 1933 (excluding 144A issues). At the end of the period, the value of restricted securities (excluding 144A issues) amounted to $282,000 or 0.0% of net assets.
(d) Affiliated fund that is generally available only to investment companies and other accounts managed by Fidelity Investments. The rate quoted is the annualized seven-day yield of the fund at period end. A complete unaudited listing of the fund's holdings as of its most recent quarter end is available upon request. In addition, each Fidelity Central Fund's financial statements, which are not covered by the Fund's Report of Independent Registered Public Accounting Firm, are available on the SEC's website or upon request.
(e) Investment made with cash collateral received from securities on loan.
Additional information on each restricted holding is as follows:
| Security | Acquisition Date | Acquisition Cost (000s) |
| Pacific Gas & Electric Co. | 7/27/20 | $36 |
Affiliated Central Funds
Information regarding fiscal year to date income earned by the Fund from investments in Fidelity Central Funds is as follows:
| Fund | Income earned |
| | (Amounts in thousands) |
| Fidelity Cash Central Fund | $775 |
| Fidelity Securities Lending Cash Central Fund | 414 |
| Total | $1,189 |
Amounts in the income column in the above table include any capital gain distributions from underlying funds, which are presented in the corresponding line-item in the Statement of Operations, if applicable. Amount for Fidelity Securities Lending Cash Central Fund represents the income earned on investing cash collateral, less rebates paid to borrowers and any lending agent fees associated with the loan, plus any premium payments received for lending certain types of securities.
Investment Valuation
The following is a summary of the inputs used, as of July 31, 2020, involving the Fund's assets and liabilities carried at fair value. The inputs or methodology used for valuing securities may not be an indication of the risk associated with investing in those securities. For more information on valuation inputs, and their aggregation into the levels used below, please refer to the Investment Valuation section in the accompanying Notes to Financial Statements.
| | Valuation Inputs at Reporting Date: |
| Description | Total | Level 1 | Level 2 | Level 3 |
| (Amounts in thousands) | | | | |
| Investments in Securities: | | | | |
| Equities: | | | | |
| Communication Services | $235,237 | $235,237 | $-- | $-- |
| Consumer Discretionary | 258,469 | 258,469 | -- | -- |
| Consumer Staples | 60,212 | 60,212 | -- | -- |
| Energy | 5,546 | 5,546 | -- | -- |
| Financials | 58,172 | 58,172 | -- | -- |
| Health Care | 247,157 | 247,157 | -- | -- |
| Industrials | 162,948 | 162,948 | -- | -- |
| Information Technology | 705,762 | 705,762 | -- | -- |
| Materials | 76,274 | 76,274 | -- | -- |
| Utilities | 80,191 | 79,909 | 282 | -- |
| Money Market Funds | 34,790 | 34,790 | -- | -- |
| Total Investments in Securities: | $1,924,758 | $1,924,476 | $282 | $-- |
See accompanying notes which are an integral part of the financial statements.
Financial Statements
Statement of Assets and Liabilities
| Amounts in thousands (except per-share amounts) | | July 31, 2020 |
| Assets | | |
Investment in securities, at value (including securities loaned of $6,469) — See accompanying schedule:
Unaffiliated issuers (cost $1,326,819) | $1,889,968 | |
| Fidelity Central Funds (cost $34,784) | 34,790 | |
| Total Investment in Securities (cost $1,361,603) | | $1,924,758 |
| Receivable for investments sold | | 11,451 |
| Receivable for fund shares sold | | 188 |
| Dividends receivable | | 545 |
| Distributions receivable from Fidelity Central Funds | | 132 |
| Other receivables | | 21 |
| Total assets | | 1,937,095 |
| Liabilities | | |
| Payable for investments purchased | $12,038 | |
| Payable for fund shares redeemed | 1,668 | |
| Accrued management fee | 922 | |
| Other affiliated payables | 266 | |
| Other payables and accrued expenses | 69 | |
| Collateral on securities loaned | 6,547 | |
| Total liabilities | | 21,510 |
| Net Assets | | $1,915,585 |
| Net Assets consist of: | | |
| Paid in capital | | $1,413,867 |
| Total accumulated earnings (loss) | | 501,718 |
| Net Assets | | $1,915,585 |
| Net Asset Value and Maximum Offering Price | | |
| Leveraged Company Stock: | | |
| Net Asset Value, offering price and redemption price per share ($1,631,034 ÷ 52,818 shares) | | $30.88 |
| Class K: | | |
| Net Asset Value, offering price and redemption price per share ($284,551 ÷ 9,176 shares) | | $31.01 |
See accompanying notes which are an integral part of the financial statements.
Statement of Operations
| Amounts in thousands | | Year ended July 31, 2020 |
| Investment Income | | |
| Dividends | | $17,854 |
| Special dividends | | 2,188 |
| Interest | | 20 |
| Income from Fidelity Central Funds (including $414 from security lending) | | 1,189 |
| Total income | | 21,251 |
| Expenses | | |
| Management fee | $11,906 | |
| Transfer agent fees | 2,803 | |
| Accounting fees | 619 | |
| Custodian fees and expenses | 42 | |
| Independent trustees' fees and expenses | 13 | |
| Registration fees | 47 | |
| Audit | 59 | |
| Legal | 22 | |
| Miscellaneous | 33 | |
| Total expenses before reductions | 15,544 | |
| Expense reductions | (93) | |
| Total expenses after reductions | | 15,451 |
| Net investment income (loss) | | 5,800 |
| Realized and Unrealized Gain (Loss) | | |
| Net realized gain (loss) on: | | |
| Investment securities: | | |
| Unaffiliated issuers | (17,442) | |
| Fidelity Central Funds | 7 | |
| Foreign currency transactions | (142) | |
| Total net realized gain (loss) | | (17,577) |
| Change in net unrealized appreciation (depreciation) on: | | |
| Investment securities: | | |
| Unaffiliated issuers | 48,336 | |
| Fidelity Central Funds | 3 | |
| Assets and liabilities in foreign currencies | 2 | |
| Total change in net unrealized appreciation (depreciation) | | 48,341 |
| Net gain (loss) | | 30,764 |
| Net increase (decrease) in net assets resulting from operations | | $36,564 |
See accompanying notes which are an integral part of the financial statements.
Statement of Changes in Net Assets
| Amounts in thousands | Year ended July 31, 2020 | Year ended July 31, 2019 |
| Increase (Decrease) in Net Assets | | |
| Operations | | |
| Net investment income (loss) | $5,800 | $(1,093) |
| Net realized gain (loss) | (17,577) | 44,029 |
| Change in net unrealized appreciation (depreciation) | 48,341 | (35,293) |
| Net increase (decrease) in net assets resulting from operations | 36,564 | 7,643 |
| Distributions to shareholders | (2,522) | (382,089) |
| Share transactions - net increase (decrease) | (410,304) | (136,527) |
| Total increase (decrease) in net assets | (376,262) | (510,973) |
| Net Assets | | |
| Beginning of period | 2,291,847 | 2,802,820 |
| End of period | $1,915,585 | $2,291,847 |
See accompanying notes which are an integral part of the financial statements.
Financial Highlights
Fidelity Leveraged Company Stock Fund
| Years ended July 31, | 2020 | 2019 | 2018 | 2017 | 2016 |
| Selected Per–Share Data | | | | | |
| Net asset value, beginning of period | $29.94 | $34.31 | $37.25 | $40.68 | $46.90 |
| Income from Investment Operations | | | | | |
| Net investment income (loss)A | .08B | (.02) | .02 | .19 | .41 |
| Net realized and unrealized gain (loss) | .89 | .42 | 3.42C | 5.53 | (3.77) |
| Total from investment operations | .97 | .40 | 3.44 | 5.72 | (3.36) |
| Distributions from net investment income | (.03) | – | (.07) | (.37) | (.40) |
| Distributions from net realized gain | – | (4.77) | (6.32) | (8.78) | (2.46) |
| Total distributions | (.03) | (4.77) | (6.38)D | (9.15) | (2.86) |
| Redemption fees added to paid in capitalA | – | – | – | –E | –E |
| Net asset value, end of period | $30.88 | $29.94 | $34.31 | $37.25 | $40.68 |
| Total ReturnF | 3.24% | 1.93% | 10.91%C | 17.45% | (7.23)% |
| Ratios to Average Net AssetsG,H | | | | | |
| Expenses before reductions | .78% | .78% | .78% | .80% | .80% |
| Expenses net of fee waivers, if any | .78% | .78% | .78% | .79% | .80% |
| Expenses net of all reductions | .77% | .78% | .77% | .78% | .80% |
| Net investment income (loss) | .27%B | (.06)% | .07% | .51% | 1.03% |
| Supplemental Data | | | | | |
| Net assets, end of period (in millions) | $1,631 | $1,945 | $2,372 | $2,644 | $2,861 |
| Portfolio turnover rateI | 31% | 53% | 67% | 100% | 9% |
A Calculated based on average shares outstanding during the period.
B Net investment income per share reflects a large, non-recurring dividend which amounted to $.08 per share. Excluding this non-recurring dividend, the ratio of net investment income (loss) to average net assets would have been 1.03%.
C Amount includes a reimbursement from the investment adviser for an operational error which amounted to less than $.06 per share. Excluding this reimbursement, the total return would have been 10.73%.
D Total distributions of $6.38 per share is comprised of distributions from net investment income of $.066 and distributions from net realized gain of $6.318 per share.
E Amount represents less than $.005 per share.
F Total returns would have been lower if certain expenses had not been reduced during the applicable periods shown.
G Fees and expenses of any underlying mutual funds or exchange-traded funds (ETFs) are not included in the Fund's expense ratio. The Fund indirectly bears its proportionate share of these expenses. For additional expense information related to investments in Fidelity Central Funds, please refer to the "Investments in Fidelity Central Funds" note found in the Notes to Financial Statements section of the most recent Annual or Semi-Annual report.
H Expense ratios reflect operating expenses of the class. Expenses before reductions do not reflect amounts reimbursed by the investment adviser or reductions from brokerage service arrangements or reductions from other expense offset arrangements and do not represent the amount paid by the class during periods when reimbursements or reductions occur. Expenses net of fee waivers reflect expenses after reimbursement by the investment adviser but prior to reductions from brokerage service arrangements or other expense offset arrangements. Expenses net of all reductions represent the net expenses paid by the class.
I Amount does not include the portfolio activity of any underlying Fidelity Central Funds.
See accompanying notes which are an integral part of the financial statements.
Fidelity Leveraged Company Stock Fund Class K
| Years ended July 31, | 2020 | 2019 | 2018 | 2017 | 2016 |
| Selected Per–Share Data | | | | | |
| Net asset value, beginning of period | $30.04 | $34.40 | $37.34 | $40.76 | $47.00 |
| Income from Investment Operations | | | | | |
| Net investment income (loss)A�� | .11B | .01 | .06 | .23 | .46 |
| Net realized and unrealized gain (loss) | .91 | .42 | 3.42C | 5.55 | (3.79) |
| Total from investment operations | 1.02 | .43 | 3.48 | 5.78 | (3.33) |
| Distributions from net investment income | (.05) | – | (.11) | (.42) | (.45) |
| Distributions from net realized gain | – | (4.79) | (6.32) | (8.78) | (2.46) |
| Total distributions | (.05) | (4.79) | (6.42)D | (9.20) | (2.91) |
| Redemption fees added to paid in capitalA | – | – | – | –E | –E |
| Net asset value, end of period | $31.01 | $30.04 | $34.40 | $37.34 | $40.76 |
| Total ReturnF | 3.38% | 2.03% | 11.01%C | 17.60% | (7.14)% |
| Ratios to Average Net AssetsG,H | | | | | |
| Expenses before reductions | .67% | .67% | .67% | .68% | .68% |
| Expenses net of fee waivers, if any | .67% | .67% | .67% | .68% | .68% |
| Expenses net of all reductions | .66% | .67% | .66% | .67% | .68% |
| Net investment income (loss) | .38%B | .05% | .18% | .63% | 1.15% |
| Supplemental Data | | | | | |
| Net assets, end of period (in millions) | $285 | $347 | $431 | $489 | $573 |
| Portfolio turnover rateI | 31% | 53% | 67% | 100% | 9% |
A Calculated based on average shares outstanding during the period.
B Net investment income per share reflects a large, non-recurring dividend which amounted to $.08 per share. Excluding this non-recurring dividend, the ratio of net investment income (loss) to average net assets would have been 1.17%.
C Amount includes a reimbursement from the investment adviser for an operational error which amounted to less than $.06 per share. Excluding this reimbursement, the total return would have been 10.83%.
D Total distributions of $6.42 per share is comprised of distributions from net investment income of $.106 and distributions from net realized gain of $6.318 per share.
E Amount represents less than $.005 per share.
F Total returns would have been lower if certain expenses had not been reduced during the applicable periods shown.
G Fees and expenses of any underlying mutual funds or exchange-traded funds (ETFs) are not included in the Fund's expense ratio. The Fund indirectly bears its proportionate share of these expenses. For additional expense information related to investments in Fidelity Central Funds, please refer to the "Investments in Fidelity Central Funds" note found in the Notes to Financial Statements section of the most recent Annual or Semi-Annual report.
H Expense ratios reflect operating expenses of the class. Expenses before reductions do not reflect amounts reimbursed by the investment adviser or reductions from brokerage service arrangements or reductions from other expense offset arrangements and do not represent the amount paid by the class during periods when reimbursements or reductions occur. Expenses net of fee waivers reflect expenses after reimbursement by the investment adviser but prior to reductions from brokerage service arrangements or other expense offset arrangements. Expenses net of all reductions represent the net expenses paid by the class.
I Amount does not include the portfolio activity of any underlying Fidelity Central Funds.
See accompanying notes which are an integral part of the financial statements.
Notes to Financial Statements
For the period ended July 31, 2020
(Amounts in thousands except percentages)
1. Organization.
Fidelity Leveraged Company Stock Fund (the Fund) is a fund of Fidelity Securities Fund (the Trust) and is authorized to issue an unlimited number of shares. The Trust is registered under the Investment Company Act of 1940, as amended (the 1940 Act), as an open-end management investment company organized as a Massachusetts business trust. The Fund offers Leverage Company Stock and Class K Shares, each of which has equal rights as to assets and voting privileges. Each class has exclusive voting rights with respect to matters that affect that class.
Effective January 1, 2020:
Investment advisers Fidelity Investments Money Management, Inc., FMR Co., Inc., and Fidelity SelectCo, LLC, merged with and into Fidelity Management & Research Company. In connection with the merger transactions, the resulting, merged investment adviser was then redomiciled from Massachusetts to Delaware, changed its corporate structure from a corporation to a limited liability company, and changed its name to "Fidelity Management & Research Company LLC".
Fidelity Investments Institutional Operations Company, Inc. converted from a Massachusetts corporation to a Massachusetts LLC, and changed its name to "Fidelity Investments Institutional Operations Company LLC".
2. Investments in Fidelity Central Funds.
The Fund invests in Fidelity Central Funds, which are open-end investment companies generally available only to other investment companies and accounts managed by the investment adviser and its affiliates. The Fund's Schedule of Investments lists each of the Fidelity Central Funds held as of period end, if any, as an investment of the Fund, but does not include the underlying holdings of each Fidelity Central Fund. As an Investing Fund, the Fund indirectly bears its proportionate share of the expenses of the underlying Fidelity Central Funds.
The Money Market Central Funds seek preservation of capital and current income and are managed by the investment adviser. Annualized expenses of the Money Market Central Funds as of their most recent shareholder report date ranged from less than .005% to .01%.
A complete unaudited list of holdings for each Fidelity Central Fund is available upon request or at the Securities and Exchange Commission (the SEC) website at www.sec.gov. In addition, the financial statements of the Fidelity Central Funds, which are not covered by the Fund's Report of Independent Registered Public Accounting Firm, are available on the SEC website or upon request.
3. Significant Accounting Policies.
The Fund is an investment company and applies the accounting and reporting guidance of the Financial Accounting Standards Board (FASB) Accounting Standards Codification Topic 946 Financial Services – Investment Companies. The financial statements have been prepared in conformity with accounting principles generally accepted in the United States of America (GAAP), which require management to make certain estimates and assumptions at the date of the financial statements. Actual results could differ from those estimates. Subsequent events, if any, through the date that the financial statements were issued have been evaluated in the preparation of the financial statements. The following summarizes the significant accounting policies of the Fund:
Investment Valuation. Investments are valued as of 4:00 p.m. Eastern time on the last calendar day of the period. The Board of Trustees (the Board) has delegated the day to day responsibility for the valuation of the Fund's investments to the Fair Value Committee (the Committee) established by the Fund's investment adviser. In accordance with valuation policies and procedures approved by the Board, the Fund attempts to obtain prices from one or more third party pricing vendors or brokers to value its investments. When current market prices, quotations or currency exchange rates are not readily available or reliable, investments will be fair valued in good faith by the Committee, in accordance with procedures adopted by the Board. Factors used in determining fair value vary by investment type and may include market or investment specific events. The frequency with which these procedures are used cannot be predicted and they may be utilized to a significant extent. The Committee oversees the Fund's valuation policies and procedures and reports to the Board on the Committee's activities and fair value determinations. The Board monitors the appropriateness of the procedures used in valuing the Fund's investments and ratifies the fair value determinations of the Committee.
The Fund categorizes the inputs to valuation techniques used to value its investments into a disclosure hierarchy consisting of three levels as shown below:
- Level 1 – quoted prices in active markets for identical investments
- Level 2 – other significant observable inputs (including quoted prices for similar investments, interest rates, prepayment speeds, etc.)
- Level 3 – unobservable inputs (including the Fund's own assumptions based on the best information available)
Valuation techniques used to value the Fund's investments by major category are as follows:
Equity securities, including restricted securities, for which market quotations are readily available, are valued at the last reported sale price or official closing price as reported by a third party pricing vendor on the primary market or exchange on which they are traded and are categorized as Level 1 in the hierarchy. In the event there were no sales during the day or closing prices are not available, securities are valued at the last quoted bid price or may be valued using the last available price and are generally categorized as Level 2 in the hierarchy. For foreign equity securities, when market or security specific events arise, comparisons to the valuation of American Depositary Receipts (ADRs), futures contracts, and certain indexes as well as quoted prices for similar securities may be used and would be categorized as Level 2 in the hierarchy. For equity securities, including restricted securities, where observable inputs are limited, assumptions about market activity and risk are used and these securities may be categorized as Level 3 in the hierarchy.
Investments in open-end mutual funds, including the Fidelity Central Funds, are valued at their closing net asset value (NAV) each business day and are categorized as Level 1 in the hierarchy.
Changes in valuation techniques may result in transfers in or out of an assigned level within the disclosure hierarchy. The aggregate value of investments by input level as of July 31, 2020 is included at the end of the Fund's Schedule of Investments.
Foreign Currency. The Fund may use foreign currency contracts to facilitate transactions in foreign-denominated securities. Gains and losses from these transactions may arise from changes in the value of the foreign currency or if the counterparties do not perform under the contracts' terms.
Foreign-denominated assets, including investment securities, and liabilities are translated into U.S. dollars at the exchange rates at period end. Purchases and sales of investment securities, income and dividends received and expenses denominated in foreign currencies are translated into U.S. dollars at the exchange rate in effect on the transaction date.
The effects of exchange rate fluctuations on investments are included with the net realized and unrealized gain (loss) on investment securities. Other foreign currency transactions resulting in realized and unrealized gain (loss) are disclosed separately.
Investment Transactions and Income. For financial reporting purposes, the Fund's investment holdings and NAV include trades executed through the end of the last business day of the period. The NAV per share for processing shareholder transactions is calculated as of the close of business of the New York Stock Exchange (NYSE), normally 4:00 p.m. Eastern time and includes trades executed through the end of the prior business day. Gains and losses on securities sold are determined on the basis of identified cost and include proceeds received from litigation. Dividend income is recorded on the ex-dividend date, except for certain dividends from foreign securities where the ex-dividend date may have passed, which are recorded as soon as the Fund is informed of the ex-dividend date. Non-cash dividends included in dividend income, if any, are recorded at the fair market value of the securities received. Income and capital gain distributions from Fidelity Central Funds, if any, are recorded on the ex-dividend date. Certain distributions received by the Fund represent a return of capital or capital gain. The Fund determines the components of these distributions subsequent to the ex-dividend date, based upon receipt of tax filings or other correspondence relating to the underlying investment. These distributions are recorded as a reduction of cost of investments and/or as a realized gain. Large, non-recurring dividends recognized by the Fund are presented separately on the Statement of Operations as "Special Dividends" and the impact of these dividends is presented in the Financial Highlights. Interest income is accrued as earned and includes coupon interest and amortization of premium and accretion of discount on debt securities as applicable. Investment income is recorded net of foreign taxes withheld where recovery of such taxes is uncertain.
Class Allocations and Expenses. Investment income, realized and unrealized capital gains and losses, common expenses of the Fund, and certain fund-level expense reductions, if any, are allocated daily on a pro-rata basis to each class based on the relative net assets of each class to the total net assets of the Fund. Each class differs with respect to transfer agent fees incurred. Certain expense reductions may also differ by class. For the reporting period, the allocated portion of income and expenses to each class as a percent of its average net assets may vary due to the timing of recording these transactions in relation to fluctuating net assets of the classes. Expenses directly attributable to a fund are charged to that fund. Expenses attributable to more than one fund are allocated among the respective funds on the basis of relative net assets or other appropriate methods. Expense estimates are accrued in the period to which they relate and adjustments are made when actual amounts are known.
Income Tax Information and Distributions to Shareholders. Each year, the Fund intends to qualify as a regulated investment company under Subchapter M of the Internal Revenue Code, including distributing substantially all of its taxable income and realized gains. As a result, no provision for U.S. Federal income taxes is required. As of July 31, 2020, the Fund did not have any unrecognized tax benefits in the financial statements; nor is the Fund aware of any tax positions for which it is reasonably possible that the total amounts of unrecognized tax benefits will significantly change in the next twelve months. The Fund files a U.S. federal tax return, in addition to state and local tax returns as required. The Fund's federal income tax returns are subject to examination by the Internal Revenue Service (IRS) for a period of three fiscal years after they are filed. State and local tax returns may be subject to examination for an additional fiscal year depending on the jurisdiction. Foreign taxes are provided for based on the Fund's understanding of the tax rules and rates that exist in the foreign markets in which it invests.
Distributions are declared and recorded on the ex-dividend date. Income and capital gain distributions are declared separately for each class. Income and capital gain distributions are determined in accordance with income tax regulations, which may differ from GAAP. In addition, the Fund claimed a portion of the payment made to redeeming shareholders as a distribution for income tax purposes.
Capital accounts within the financial statements are adjusted for permanent book-tax differences. These adjustments have no impact on net assets or the results of operations. Capital accounts are not adjusted for temporary book-tax differences which will reverse in a subsequent period.
Book-tax differences are primarily due to foreign currency transactions, capital loss carryforwards and losses deferred due to wash sales and excise tax regulations.
As of period end, the cost and unrealized appreciation (depreciation) in securities, and derivatives if applicable, for federal income tax purposes were as follows:
| Gross unrealized appreciation | $625,978 |
| Gross unrealized depreciation | (63,361) |
| Net unrealized appreciation (depreciation) | $562,617 |
| Tax Cost | $1,362,141 |
The tax-based components of distributable earnings as of period end were as follows:
| Undistributed ordinary income | $2,220 |
| Capital loss carryforward | $(63,119) |
| Net unrealized appreciation (depreciation) on securities and other investments | $562,617 |
Capital loss carryforwards are only available to offset future capital gains of the Fund to the extent provided by regulations and may be limited. The capital loss carryforward information presented below, including any applicable limitation, is estimated as of fiscal period end and is subject to adjustment.
| No expiration | |
| Short-term | $(63,119) |
| Total capital loss carryforward | $(63,119) |
The tax character of distributions paid was as follows:
| | July 31, 2020 | July 31 ,2019 |
| Ordinary Income | $2,522 | $ 4,504 |
| Long-term Capital Gains | – | 377,586 |
| Total | $2,522 | $ 382,090 |
Restricted Securities (including Private Placements). The Fund may invest in securities that are subject to legal or contractual restrictions on resale. These securities generally may be resold in transactions exempt from registration or to the public if the securities are registered. Disposal of these securities may involve time-consuming negotiations and expense, and prompt sale at an acceptable price may be difficult. Information regarding restricted securities is included at the end of the Fund's Schedule of Investments.
4. Purchases and Sales of Investments.
Purchases and sales of securities, other than short-term securities are noted in the table below.
| | Purchases ($) | Sales ($) |
| Fidelity Leveraged Company Stock Fund | 624,899 | 976,950 |
5. Fees and Other Transactions with Affiliates.
Management Fee. Fidelity Management & Research Company LLC (the investment adviser) and its affiliates provide the Fund with investment management related services for which the Fund pays a monthly management fee. The management fee is the sum of an individual fund fee rate that is based on an annual rate of .35% of the Fund's average net assets and an annualized group fee rate that averaged .23% during the period. The group fee rate is based upon the monthly average net assets of a group of registered investment companies with which the investment adviser has management contracts. The group fee rate decreases as assets under management increase and increases as assets under management decrease. For the reporting period, the total annual management fee rate was .58% of the Fund's average net assets.
Transfer Agent Fees. Fidelity Investments Institutional Operations Company LLC (FIIOC), an affiliate of the investment adviser, is the transfer, dividend disbursing and shareholder servicing agent for each class of the Fund. FIIOC receives account fees and asset-based fees that vary according to the account size and type of account of the shareholders of Leveraged Company Stock, except for Class K. FIIOC receives an asset-based fee of Class K's average net assets. FIIOC pays for typesetting, printing and mailing of shareholder reports, except proxy statements. Effective February 1, 2020, the Board approved to change the fee for Class K from .046% to .044%.
For the period, transfer agent fees for each class were as follows:
| | Amount | % of Class-Level Average Net Assets |
| Leveraged Company Stock | $2,668 | .15 |
| Class K | 135 | .04 |
| | $2,803 | |
Accounting Fees. Fidelity Service Company, Inc. (FSC), an affiliate of the investment adviser, maintains the Fund's accounting records. The accounting fee is based on the level of average net assets for each month. For the period, the fees were equivalent to the following annual rates:
| | % of Average Net Assets |
| Fidelity Leveraged Company Stock Fund | .03 |
Brokerage Commissions. A portion of portfolio transactions were placed with brokerage firms which are affiliates of the investment adviser. Brokerage commissions are included in net realized gain (loss) and change in net unrealized appreciation (depreciation) in the Statement of Operations. The commissions paid to these affiliated firms were as follows:
| | Amount |
| Fidelity Leveraged Company Stock Fund | $26 |
Interfund Trades. Funds may purchase from or sell securities to other Fidelity Funds under procedures adopted by the Board. The procedures have been designed to ensure these interfund trades are executed in accordance with Rule 17a-7 of the 1940 Act. Interfund trades are included within the respective purchases and sales amounts shown in the Purchases and Sales of Investments note.
6. Committed Line of Credit.
Certain Funds participate with other funds managed by the investment adviser or an affiliate in a $4.25 billion credit facility (the "line of credit") to be utilized for temporary or emergency purposes to fund shareholder redemptions or for other short-term liquidity purposes. The participating funds have agreed to pay commitment fees on their pro-rata portion of the line of credit, which are reflected in Miscellaneous expenses on the Statement of Operations, and are as follows:
| | Amount |
| Fidelity Leveraged Company Stock Fund | $5 |
During the period, there were no borrowings on this line of credit.
7. Security Lending.
The Fund lends portfolio securities from time to time in order to earn additional income. Lending agents are used, including National Financial Services (NFS), an affiliate of the Fund. Pursuant to a securities lending agreement, NFS will receive a fee, which is capped at 9.9% of daily lending revenue, for its services as lending agent. The Fund may lend securities to certain qualified borrowers, including NFS. On the settlement date of the loan, the Fund receives collateral (in the form of U.S. Treasury obligations, letters of credit and/or cash) against the loaned securities and maintains collateral in an amount not less than 100% of the market value of the loaned securities during the period of the loan. The market value of the loaned securities is determined at the close of business of the Fund and any additional required collateral is delivered to the Fund on the next business day. The Fund or borrower may terminate the loan at any time, and if the borrower defaults on its obligation to return the securities loaned because of insolvency or other reasons, the Fund may apply collateral received from the borrower against the obligation. The Fund may experience delays and costs in recovering the securities loaned. Any cash collateral received is invested in the Fidelity Securities Lending Cash Central Fund. The value of loaned securities and cash collateral at period end are disclosed on the Fund's Statement of Assets and Liabilities. Total fees paid by the Fund to NFS, as lending agent, amounted to $36. Security lending income represents the income earned on investing cash collateral, less rebates paid to borrowers and any lending agent fees associated with the loan, plus any premium payments received for lending certain types of securities. Net income from the Fidelity Securities Lending Cash Central Fund during the period is presented in the Statement of Operations as a component of income from Fidelity Central Funds. During the period, there were no securities loaned to NFS.
8. Expense Reductions.
Commissions paid to certain brokers with whom the investment adviser, or its affiliates, places trades on behalf of the Fund include an amount in addition to trade execution, which may be rebated back to the Fund to offset certain expenses. This amount totaled $83 for the period. In addition, through arrangements with the Fund's custodian, credits realized as a result of certain uninvested cash balances were used to reduce the Fund's expenses. During the period, custodian credits reduced the Fund's expenses by $1.
In addition, during the period the investment adviser or an affiliate reimbursed and/or waived a portion of fund-level operating expenses in the amount of $9.
9. Distributions to Shareholders.
Distributions to shareholders of each class were as follows:
| | Year ended
July 31, 2020 | Year ended
July 31, 2019 |
| Distributions to shareholders | | |
| Leveraged Company Stock | $2,012 | $323,491 |
| Class K | 510 | 58,598 |
| Total | $2,522 | $382,089 |
10. Share Transactions.
Share transactions for each class were as follows and may contain automatic conversions between classes or exchanges between affiliated funds:
| | Shares | Shares | Dollars | Dollars |
| | Year ended July 31, 2020 | Year ended July 31, 2019 | Year ended July 31, 2020 | Year ended July 31, 2019 |
| Leveraged Company Stock | | | | |
| Shares sold | 2,131 | 2,630 | $60,081 | $74,697 |
| Reinvestment of distributions | 59 | 10,500 | 1,907 | 306,391 |
| Shares redeemed | (14,344) | (17,289) | (405,183) | (490,093) |
| Net increase (decrease) | (12,154) | (4,159) | $(343,195) | $(109,005) |
| Class K | | | | |
| Shares sold | 871 | 1,048 | $25,731 | $29,782 |
| Reinvestment of distributions | 16 | 2,004 | 510 | 58,598 |
| Shares redeemed | (3,258) | (4,033) | (93,350) | (115,902) |
| Net increase (decrease) | (2,371) | (981) | $(67,109) | $(27,522) |
11. Other.
The Fund's organizational documents provide former and current trustees and officers with a limited indemnification against liabilities arising in connection with the performance of their duties to the Fund. In the normal course of business, the Fund may also enter into contracts that provide general indemnifications. The Fund's maximum exposure under these arrangements is unknown as this would be dependent on future claims that may be made against the Fund. The risk of material loss from such claims is considered remote.
12. Coronavirus (COVID-19) Pandemic.
An outbreak of COVID-19 first detected in China during December 2019 has since spread globally and was declared a pandemic by the World Health Organization during March 2020. Developments that disrupt global economies and financial markets, such as the COVID-19 pandemic, may magnify factors that affect the Fund's performance.
Report of Independent Registered Public Accounting Firm
To the Board of Trustees of Fidelity Securities Fund and Shareholders of Fidelity Leveraged Company Stock Fund
Opinion on the Financial Statements
We have audited the accompanying statement of assets and liabilities, including the schedule of investments, of Fidelity Leveraged Company Stock Fund (one of the funds constituting Fidelity Securities Fund, referred to hereafter as the “Fund”) as of July 31, 2020, the related statement of operations for the year ended July 31, 2020, the statement of changes in net assets for each of the two years in the period ended July 31, 2020, including the related notes, and the financial highlights for each of the five years in the period ended July 31, 2020 (collectively referred to as the “financial statements”). In our opinion, the financial statements present fairly, in all material respects, the financial position of the Fund as of July 31, 2020, the results of its operations for the year then ended, the changes in its net assets for each of the two years in the period ended July 31, 2020 and the financial highlights for each of the five years in the period ended July 31, 2020 in conformity with accounting principles generally accepted in the United States of America.
Basis for Opinion
These financial statements are the responsibility of the Fund’s management. Our responsibility is to express an opinion on the Fund’s financial statements based on our audits. We are a public accounting firm registered with the Public Company Accounting Oversight Board (United States) (PCAOB) and are required to be independent with respect to the Fund in accordance with the U.S. federal securities laws and the applicable rules and regulations of the Securities and Exchange Commission and the PCAOB.
We conducted our audits of these financial statements in accordance with the standards of the PCAOB. Those standards require that we plan and perform the audit to obtain reasonable assurance about whether the financial statements are free of material misstatement, whether due to error or fraud.
Our audits included performing procedures to assess the risks of material misstatement of the financial statements, whether due to error or fraud, and performing procedures that respond to those risks. Such procedures included examining, on a test basis, evidence regarding the amounts and disclosures in the financial statements. Our audits also included evaluating the accounting principles used and significant estimates made by management, as well as evaluating the overall presentation of the financial statements. Our procedures included confirmation of securities owned as of July 31, 2020 by correspondence with the custodian and brokers; when replies were not received from brokers, we performed other auditing procedures. We believe that our audits provide a reasonable basis for our opinion.
/s/ PricewaterhouseCoopers LLP
Boston, Massachusetts
September 14, 2020
We have served as the auditor of one or more investment companies in the Fidelity group of funds since 1932.
Trustees and Officers
The Trustees, Members of the Advisory Board (if any), and officers of the trust and fund, as applicable, are listed below. The Board of Trustees governs the fund and is responsible for protecting the interests of shareholders. The Trustees are experienced executives who meet periodically throughout the year to oversee the fund's activities, review contractual arrangements with companies that provide services to the fund, oversee management of the risks associated with such activities and contractual arrangements, and review the fund's performance. Except for Jonathan Chiel and Bettina Doulton, each of the Trustees oversees 311 funds. Mr. Chiel oversees 174 funds. Ms. Doulton oversees 210 funds.
The Trustees hold office without limit in time except that (a) any Trustee may resign; (b) any Trustee may be removed by written instrument, signed by at least two-thirds of the number of Trustees prior to such removal; (c) any Trustee who requests to be retired or who has become incapacitated by illness or injury may be retired by written instrument signed by a majority of the other Trustees; and (d) any Trustee may be removed at any special meeting of shareholders by a two-thirds vote of the outstanding voting securities of the trust. Each Trustee who is not an interested person (as defined in the 1940 Act) of the trust and the fund is referred to herein as an Independent Trustee. Each Independent Trustee shall retire not later than the last day of the calendar year in which his or her 75th birthday occurs. The Independent Trustees may waive this mandatory retirement age policy with respect to individual Trustees. Officers and Advisory Board Members hold office without limit in time, except that any officer or Advisory Board Member may resign or may be removed by a vote of a majority of the Trustees at any regular meeting or any special meeting of the Trustees. Except as indicated, each individual has held the office shown or other offices in the same company for the past five years.
The fund's Statement of Additional Information (SAI) includes more information about the Trustees. To request a free copy, call Fidelity at 1-800-544-8544 if you’re an individual investing directly with Fidelity, call 1-800-835-5092 if you’re a plan sponsor or participant with Fidelity as your recordkeeper or call 1-877-208-0098 on institutional accounts or if you’re an advisor or invest through one.
Experience, Skills, Attributes, and Qualifications of the Trustees. The Governance and Nominating Committee has adopted a statement of policy that describes the experience, qualifications, attributes, and skills that are necessary and desirable for potential Independent Trustee candidates (Statement of Policy). The Board believes that each Trustee satisfied at the time he or she was initially elected or appointed a Trustee, and continues to satisfy, the standards contemplated by the Statement of Policy. The Governance and Nominating Committee also engages professional search firms to help identify potential Independent Trustee candidates who have the experience, qualifications, attributes, and skills consistent with the Statement of Policy. From time to time, additional criteria based on the composition and skills of the current Independent Trustees, as well as experience or skills that may be appropriate in light of future changes to board composition, business conditions, and regulatory or other developments, have also been considered by the professional search firms and the Governance and Nominating Committee. In addition, the Board takes into account the Trustees' commitment and participation in Board and committee meetings, as well as their leadership of standing and ad hoc committees throughout their tenure.
In determining that a particular Trustee was and continues to be qualified to serve as a Trustee, the Board has considered a variety of criteria, none of which, in isolation, was controlling. The Board believes that, collectively, the Trustees have balanced and diverse experience, qualifications, attributes, and skills, which allow the Board to operate effectively in governing the fund and protecting the interests of shareholders. Information about the specific experience, skills, attributes, and qualifications of each Trustee, which in each case led to the Board's conclusion that the Trustee should serve (or continue to serve) as a trustee of the fund, is provided below.
Board Structure and Oversight Function. Robert A. Lawrence is an interested person and currently serves as Acting Chairman. The Trustees have determined that an interested Chairman is appropriate and benefits shareholders because an interested Chairman has a personal and professional stake in the quality and continuity of services provided to the fund. Independent Trustees exercise their informed business judgment to appoint an individual of their choosing to serve as Chairman, regardless of whether the Trustee happens to be independent or a member of management. The Independent Trustees have determined that they can act independently and effectively without having an Independent Trustee serve as Chairman and that a key structural component for assuring that they are in a position to do so is for the Independent Trustees to constitute a substantial majority for the Board. The Independent Trustees also regularly meet in executive session. Ned C. Lautenbach and David M. Thomas serve as Co-Lead Independent Trustees and as such each (i) acts as a liaison between the Independent Trustees and management with respect to matters important to the Independent Trustees and (ii) with management prepares agendas for Board meetings.
Fidelity® funds are overseen by different Boards of Trustees. The fund's Board oversees Fidelity's high income and certain equity funds, and other Boards oversee Fidelity's investment-grade bond, money market, asset allocation, and other equity funds. The asset allocation funds may invest in Fidelity® funds overseen by the fund's Board. The use of separate Boards, each with its own committee structure, allows the Trustees of each group of Fidelity® funds to focus on the unique issues of the funds they oversee, including common research, investment, and operational issues. On occasion, the separate Boards establish joint committees to address issues of overlapping consequences for the Fidelity® funds overseen by each Board.
The Trustees operate using a system of committees to facilitate the timely and efficient consideration of all matters of importance to the Trustees, the fund, and fund shareholders and to facilitate compliance with legal and regulatory requirements and oversight of the fund's activities and associated risks. The Board, acting through its committees, has charged FMR and its affiliates with (i) identifying events or circumstances the occurrence of which could have demonstrably adverse effects on the fund's business and/or reputation; (ii) implementing processes and controls to lessen the possibility that such events or circumstances occur or to mitigate the effects of such events or circumstances if they do occur; and (iii) creating and maintaining a system designed to evaluate continuously business and market conditions in order to facilitate the identification and implementation processes described in (i) and (ii) above. Because the day-to-day operations and activities of the fund are carried out by or through FMR, its affiliates, and other service providers, the fund's exposure to risks is mitigated but not eliminated by the processes overseen by the Trustees. While each of the Board's committees has responsibility for overseeing different aspects of the fund's activities, oversight is exercised primarily through the Operations, Audit, and Compliance Committees. Appropriate personnel, including but not limited to the fund's Chief Compliance Officer (CCO), FMR's internal auditor, the independent accountants, the fund's Treasurer and portfolio management personnel, make periodic reports to the Board's committees, as appropriate, including an annual review of Fidelity's risk management program for the Fidelity® funds. The responsibilities of each standing committee, including their oversight responsibilities, are described further under "Standing Committees of the Trustees."
Interested Trustees*:
Correspondence intended for a Trustee who is an interested person may be sent to Fidelity Investments, 245 Summer Street, Boston, Massachusetts 02210.
Name, Year of Birth; Principal Occupations and Other Relevant Experience+
Jonathan Chiel (1957)
Year of Election or Appointment: 2016
Trustee
Mr. Chiel also serves as Trustee of other Fidelity® funds. Mr. Chiel is Executive Vice President and General Counsel for FMR LLC (diversified financial services company, 2012-present). Previously, Mr. Chiel served as general counsel (2004-2012) and senior vice president and deputy general counsel (2000-2004) for John Hancock Financial Services; a partner with Choate, Hall & Stewart (1996-2000) (law firm); and an Assistant United States Attorney for the United States Attorney’s Office of the District of Massachusetts (1986-95), including Chief of the Criminal Division (1993-1995). Mr. Chiel is a director on the boards of the Boston Bar Foundation and the Maimonides School.
Robert A. Lawrence (1952)
Year of Election or Appointment: 2020
Trustee
Acting Chairman of the Board of Trustees
Mr. Lawrence also serves as Trustee of other funds. Previously, Mr. Lawrence served as a Member of the Advisory Board of certain funds. Prior to his retirement in 2008, Mr. Lawrence served as Vice President of certain Fidelity® funds (2006-2008), Senior Vice President, Head of High Income Division of Fidelity Management & Research Company (investment adviser firm, 2006-2008), and President of Fidelity Strategic Investments (investment adviser firm, 2002-2005).
* Determined to be an “Interested Trustee” by virtue of, among other things, his or her affiliation with the trust[s] or various entities under common control with FMR.
+ The information includes the Trustee's principal occupation during the last five years and other information relating to the experience, attributes, and skills relevant to the Trustee's qualifications to serve as a Trustee, which led to the conclusion that the Trustee should serve as a Trustee for the fund.
Independent Trustees:
Correspondence intended for an Independent Trustee may be sent to Fidelity Investments, P.O. Box 55235, Boston, Massachusetts 02205-5235.
Name, Year of Birth; Principal Occupations and Other Relevant Experience+
Dennis J. Dirks (1948)
Year of Election or Appointment: 2005
Trustee
Mr. Dirks also serves as Trustee of other Fidelity® funds. Prior to his retirement in May 2003, Mr. Dirks served as Chief Operating Officer and as a member of the Board of The Depository Trust & Clearing Corporation (financial markets infrastructure), President, Chief Operating Officer and a member of the Board of The Depository Trust Company (DTC), President and a member of the Board of the National Securities Clearing Corporation (NSCC), Chief Executive Officer and a member of the Board of the Government Securities Clearing Corporation and Chief Executive Officer and a member of the Board of the Mortgage-Backed Securities Clearing Corporation. Mr. Dirks currently serves as a member of the Finance Committee (2016-present) and Board (2017-present) and is Treasurer (2018-present) of the Asolo Repertory Theatre.
Donald F. Donahue (1950)
Year of Election or Appointment: 2018
Trustee
Mr. Donahue also serves as Trustee of other Fidelity® funds. Mr. Donahue serves as President and Chief Executive Officer of Miranda Partners, LLC (risk consulting for the financial services industry, 2012-present). Previously, Mr. Donahue served as Chief Executive Officer (2006-2012), Chief Operating Officer (2003-2006) and Managing Director, Customer Marketing and Development (1999-2003) of The Depository Trust & Clearing Corporation (financial markets infrastructure). Mr. Donahue currently serves as a member (2007-present) and Co-Chairman (2016-present) of the Board of United Way of New York, a member of the Board of NYC Leadership Academy (2012-present) and a member of the Board of Advisors of Ripple Labs, Inc. (financial services, 2015-present). Mr. Donahue previously served as a member of the Advisory Board of certain Fidelity® funds (2015-2018).
Vicki L. Fuller (1957)
Year of Election or Appointment: 2020
Trustee
Ms. Fuller also serves as Trustee of other Fidelity® funds. Previously, Ms. Fuller served as a member of the Advisory Board of certain Fidelity® funds (2018-2020), Chief Investment Officer of the New York State Common Retirement Fund (2012-2018) and held a variety of positions at AllianceBernstein L.P. (global asset management, 1985-2012), including Managing Director (2006-2012) and Senior Vice President and Senior Portfolio Manager (2001-2006). Ms. Fuller currently serves as a member of the Board, Audit Committee and Nominating and Governance Committee of The Williams Companies, Inc. (natural gas infrastructure, 2018-present) and as a member of the Board of Treliant, LLC (consulting, 2019-present).
Patricia L. Kampling (1959)
Year of Election or Appointment: 2020
Trustee
Ms. Kampling also serves as Trustee of other Fidelity® funds. Prior to her retirement, Ms. Kampling served as Chairman of the Board and Chief Executive Officer (2012-2019), President and Chief Operating Officer (2011-2012) and Executive Vice President and Chief Financial Officer (2010-2011) of Alliant Energy Corporation. Ms. Kampling currently serves as a member of the Board, Compensation Committee and Executive Committee and as Chair of the Audit Committee of Briggs & Stratton Corporation (manufacturing, 2011-present) and as a member of the Board, Audit, Finance and Risk Committee and Safety, Environmental, Technology and Operations Committee of American Water Works Company, Inc. (utilities company, 2019-present). In addition, Ms. Kampling currently serves as a member of the Board of the Nature Conservancy, Wisconsin Chapter (2019-present). Previously, Ms. Kampling served as a Member of the Advisory Board of certain Fidelity® funds (2020), a member of the Board of Interstate Power and Light Company (2012-2019) and Wisconsin Power and Light Company (2012-2019) (each a subsidiary of Alliant Energy Corporation) and as a member of the Board and Workforce Development Committee of the Business Roundtable (2018-2019).
Alan J. Lacy (1953)
Year of Election or Appointment: 2008
Trustee
Mr. Lacy also serves as Trustee of other Fidelity® funds. Previously, Mr. Lacy served as Senior Adviser (2007-2014) of Oak Hill Capital Partners, L.P. (private equity), Chief Executive Officer (2005) and Vice Chairman (2005-2006) of Sears Holdings Corporation (retail), Chief Executive Officer and Chairman of the Board of Sears, Roebuck and Co. (retail, 2000-2005), Chairman (2014-2017) and a member of the Board (2010-2017) of Dave & Buster’s Entertainment, Inc. (restaurant and entertainment complexes) and a member of the Board of Bristol-Myers Squibb Company (global pharmaceuticals, 2008-2020). Mr. Lacy currently serves as a Trustee of the California Chapter of The Nature Conservancy (2015-present) and a member of the Board of the Center for Advanced Study in the Behavioral Sciences at Stanford University (2015-present).
Ned C. Lautenbach (1944)
Year of Election or Appointment: 2000
Trustee
Co-Lead Independent Trustee
Mr. Lautenbach also serves as Trustee of other Fidelity® funds. Mr. Lautenbach currently serves as Chair of the Board of Governors, State University System of Florida (2013-present) and is a member of the Council on Foreign Relations (1994-present). He is also a member and has in the past served as Chairman of the Board of Directors of Artis-Naples (2012-present). Previously, Mr. Lautenbach served as a member and then Lead Director of the Board of Directors of Eaton Corporation (diversified industrial, 1997-2016). He was also a Partner at Clayton, Dubilier & Rice, LLC (private equity investment, 1998-2010); as well as Director of Sony Corporation (2006-2007). In addition, Mr. Lautenbach had a 30-year career with IBM (technology company), during which time he served as Senior Vice President and as a member of the Corporate Executive Committee (1968-1998).
Joseph Mauriello (1944)
Year of Election or Appointment: 2008
Trustee
Mr. Mauriello also serves as Trustee of other Fidelity® funds. Prior to his retirement in January 2006, Mr. Mauriello served in numerous senior management positions including Deputy Chairman and Chief Operating Officer (2004-2005), and Vice Chairman of Financial Services (2002-2004) of KPMG LLP US (professional services, 1965-2005). Mr. Mauriello currently serves as a member of the Independent Directors Council Governing Council (2015-present). Previously, Mr. Mauriello served as a member of the Board of XL Group plc. (global insurance and re-insurance, 2006-2018).
Cornelia M. Small (1944)
Year of Election or Appointment: 2005
Trustee
Ms. Small also serves as Trustee of other Fidelity® funds. Previously, Ms. Small served as Chief Investment Officer, Director of Global Equity Investments and a member of Scudder, Stevens & Clark and Scudder Kemper Investments. Ms. Small previously served as a member of the Board (2009-2019) and Chair of the Investment Committee (2010-2019) of the Teagle Foundation and a member of the Investment Committee of the Berkshire Taconic Community Foundation (2008-2019).
Garnett A. Smith (1947)
Year of Election or Appointment: 2018
Trustee
Mr. Smith also serves as Trustee of other Fidelity® funds. Prior to his retirement, Mr. Smith served as Chairman and Chief Executive Officer (1990-1997) and President (1986-1990) of Inbrand Corp. (manufacturer of personal absorbent products). Prior to his employment with Inbrand Corp., he was employed by a retail fabric chain and North Carolina National Bank (now Bank of America). Mr. Smith previously served as a member of the Advisory Board of certain Fidelity® funds (2012-2013).
David M. Thomas (1949)
Year of Election or Appointment: 2008
Trustee
Co-Lead Independent Trustee
Mr. Thomas also serves as Trustee of other Fidelity® funds. Previously, Mr. Thomas served as Executive Chairman (2005-2006) and Chairman and Chief Executive Officer (2000-2005) of IMS Health, Inc. (pharmaceutical and healthcare information solutions). Mr. Thomas currently serves as Non-Executive Chairman of the Board of Fortune Brands Home and Security (home and security products, 2011-present), and a member of the Board (2004-present) and Presiding Director (2013-present) of Interpublic Group of Companies, Inc. (marketing communication).
Susan Tomasky (1953)
Year of Election or Appointment: 2020
Trustee
Ms. Tomasky also serves as Trustee of other Fidelity® funds. Prior to her retirement, Ms. Tomasky served in various executive officer positions at American Electric Power Company, Inc. (1998-2011), including most recently as President of AEP Transmission (2007-2011). Ms. Tomasky currently serves as a member of the Board and Sustainability Committee and as Chair of the Audit Committee of Marathon Petroleum Corporation (2018-present) and as a member of the Board, Corporate Governance Committee and Organization and Compensation Committee and as Chair of the Audit Committee of Public Service Enterprise Group, Inc. (utilities company, 2012-present). In addition, Ms. Tomasky currently serves as a member of the Board of the Columbus Regional Airport Authority (2007-present), as a member of the Board of the Royal Shakespeare Company – America (2009-present), as a member of the Board of the Columbus Association for the Performing Arts (2011-present) and as a member of the Board of Kenyon College (2016-present). Previously, Ms. Tomasky served as a Member of the Advisory Board of certain Fidelity® funds (2020), a member of the Board (2011-2019) and as Lead Independent Director (2015-2018) of Andeavor Corporation (previously Tesoro Corporation) (independent oil refiner and marketer) and as a member of the Board of Summit Midstream Partners LP (energy, 2012-2018).
Michael E. Wiley (1950)
Year of Election or Appointment: 2020
Trustee
Mr. Wiley also serves as Trustee of other Fidelity® funds. Previously, Mr. Wiley served as a member of the Advisory Board of certain Fidelity® funds (2018-2020), Chairman, President and CEO of Baker Hughes, Inc. (oilfield services, 2000-2004). Mr. Wiley also previously served as a member of the Board of Andeavor Corporation (independent oil refiner and marketer, 2005-2018), a member of the Board of Andeavor Logistics LP (natural resources logistics, 2015-2018) and a member of the Board of High Point Resources (exploration and production, 2005-2020).
+ The information includes the Trustee's principal occupation during the last five years and other information relating to the experience, attributes, and skills relevant to the Trustee's qualifications to serve as a Trustee, which led to the conclusion that the Trustee should serve as a Trustee for the fund.
Advisory Board Members and Officers:
Correspondence intended for a Member of the Advisory Board (if any) may be sent to Fidelity Investments, P.O. Box 55235, Boston, Massachusetts 02205-5235. Correspondence intended for an officer or Peter S. Lynch may be sent to Fidelity Investments, 245 Summer Street, Boston, Massachusetts 02210. Officers appear below in alphabetical order.
Name, Year of Birth; Principal Occupation
Peter S. Lynch (1944)
Year of Election or Appointment: 2003
Member of the Advisory Board
Mr. Lynch also serves as a Member of the Advisory Board of other Fidelity® funds. Mr. Lynch is Vice Chairman and a Director of Fidelity Management & Research Company LLC (investment adviser firm). In addition, Mr. Lynch serves as a Trustee of Boston College and as the Chairman of the Inner-City Scholarship Fund. Previously, Mr. Lynch served as Vice Chairman and a Director of FMR Co., Inc. (investment adviser firm) and on the Special Olympics International Board of Directors (1997-2006).
Elizabeth Paige Baumann (1968)
Year of Election or Appointment: 2017
Anti-Money Laundering (AML) Officer
Ms. Baumann also serves as AML Officer of other funds. She is Chief AML Officer (2012-present) and Senior Vice President (2014-present) of FMR LLC (diversified financial services company) and is an employee of Fidelity Investments. Previously, Ms. Baumann served as AML Officer of certain funds (2017-2019), as AML Officer of the funds (2012-2016), and Vice President (2007-2014) and Deputy Anti-Money Laundering Officer (2007-2012) of FMR LLC.
Craig S. Brown (1977)
Year of Election or Appointment: 2019
Assistant Treasurer
Mr. Brown also serves as Assistant Treasurer of other funds. Mr. Brown is an employee of Fidelity Investments (2013-present).
John J. Burke III (1964)
Year of Election or Appointment: 2018
Chief Financial Officer
Mr. Burke also serves as Chief Financial Officer of other funds. Mr. Burke serves as Head of Investment Operations for Fidelity Fund and Investment Operations (2018-present) and is an employee of Fidelity Investments (1998-present). Previously Mr. Burke served as head of Asset Management Investment Operations (2012-2018).
William C. Coffey (1969)
Year of Election or Appointment: 2019
Assistant Secretary
Mr. Coffey also serves as Assistant Secretary of other funds. He is Senior Vice President and Deputy General Counsel of FMR LLC (diversified financial services company, 2010-present), and is an employee of Fidelity Investments. Previously, Mr. Coffey served as Secretary and CLO of certain funds (2018-2019); CLO, Secretary, and Senior Vice President of Fidelity Management & Research Company and FMR Co., Inc. (investment adviser firms, 2018-2019); Secretary of Fidelity SelectCo, LLC and Fidelity Investments Money Management, Inc. (investment adviser firms, 2018-2019); CLO of Fidelity Management & Research (Hong Kong) Limited, FMR Investment Management (UK) Limited, and Fidelity Management & Research (Japan) Limited (investment adviser firms, 2018-2019); and Assistant Secretary of certain funds (2009-2018).
Timothy M. Cohen (1969)
Year of Election or Appointment: 2018
Vice President
Mr. Cohen also serves as Vice President of other funds. Mr. Cohen serves as Co-Head of Equity (2018-present), a Director of Fidelity Management & Research (Japan) Limited (investment adviser firm, 2016-present), and is an employee of Fidelity Investments. Previously, Mr. Cohen served as Executive Vice President of Fidelity SelectCo, LLC (2019), Head of Global Equity Research (2016-2018), Chief Investment Officer - Equity and a Director of Fidelity Management & Research (U.K.) Inc. (investment adviser firm, 2013-2015) and as a Director of Fidelity Management & Research (Hong Kong) Limited (investment adviser firm, 2017).
Jonathan Davis (1968)
Year of Election or Appointment: 2010
Assistant Treasurer
Mr. Davis also serves as Assistant Treasurer of other funds. Mr. Davis serves as Assistant Treasurer of FMR Capital, Inc. (2017-present) and is an employee of Fidelity Investments. Previously, Mr. Davis served as Vice President and Associate General Counsel of FMR LLC (diversified financial services company, 2003-2010).
Laura M. Del Prato (1964)
Year of Election or Appointment: 2018
Assistant Treasurer
Ms. Del Prato also serves as an officer of other funds. Ms. Del Prato is an employee of Fidelity Investments (2017-present). Previously, Ms. Del Prato served as President and Treasurer of The North Carolina Capital Management Trust: Cash Portfolio and Term Portfolio (2018-2020). Prior to joining Fidelity Investments, Ms. Del Prato served as a Managing Director and Treasurer of the JPMorgan Mutual Funds (2014-2017). Prior to JPMorgan, Ms. Del Prato served as a partner at Cohen Fund Audit Services (accounting firm, 2012-2013) and KPMG LLP (accounting firm, 2004-2012).
Colm A. Hogan (1973)
Year of Election or Appointment: 2020
Assistant Treasurer
Mr. Hogan also serves as an officer of other funds. Mr. Hogan serves as Assistant Treasurer of FMR Capital, Inc. (2017-present) and is an employee of Fidelity Investments (2005-present). Previously, Mr. Hogan served as Deputy Treasurer of certain Fidelity® funds (2016-2020) and Assistant Treasurer of certain Fidelity® funds (2016-2018).
Pamela R. Holding (1964)
Year of Election or Appointment: 2018
Vice President
Ms. Holding also serves as Vice President of other funds. Ms. Holding serves as Co-Head of Equity (2018-present) and is an employee of Fidelity Investments (2013-present). Previously, Ms. Holding served as Executive Vice President of Fidelity SelectCo, LLC (2019) and as Chief Investment Officer of Fidelity Institutional Asset Management (2013-2018).
Cynthia Lo Bessette (1969)
Year of Election or Appointment: 2019
Secretary and Chief Legal Officer (CLO)
Ms. Lo Bessette also serves as an officer of other funds. Ms. Lo Bessette serves as CLO, Secretary, and Senior Vice President of Fidelity Management & Research Company LLC (investment adviser firm, 2019-present); and CLO of Fidelity Management & Research (Hong Kong) Limited, FMR Investment Management (UK) Limited, and Fidelity Management & Research (Japan) Limited (investment adviser firms, 2019-present). She is a Senior Vice President and Deputy General Counsel of FMR LLC (diversified financial services company, 2019-present), and is an employee of Fidelity Investments. Previously, Ms. Lo Bessette served as CLO, Secretary, and Senior Vice President of FMR Co., Inc. (investment adviser firm, 2019); Secretary of Fidelity SelectCo, LLC and Fidelity Investments Money Management, Inc. (investment adviser firms, 2019). Prior to joining Fidelity Investments, Ms. Lo Bessette was Executive Vice President, General Counsel (2016-2019) and Senior Vice President, Deputy General Counsel (2015-2016) of OppenheimerFunds (investment management company) and Deputy Chief Legal Officer (2013-2015) of Jennison Associates LLC (investment adviser firm).
Chris Maher (1972)
Year of Election or Appointment: 2020
Deputy Treasurer
Mr. Maher also serves as an officer of other funds. Mr. Maher serves as Assistant Treasurer of FMR Capital, Inc. (2017-present), and is an employee of Fidelity Investments (2008-present). Previously, Mr. Maher served as Assistant Treasurer of certain funds (2013-2020); Vice President of Asset Management Compliance (2013), Vice President of the Program Management Group of FMR (investment adviser firm, 2010-2013), and Vice President of Valuation Oversight (2008-2010).
Jason P. Pogorelec (1975)
Year of Election or Appointment: 2020
Chief Compliance Officer
Mr. Pogorelec also serves as Chief Compliance Officer of other funds. Mr. Pogorelec is a senior Vice President of Asset Management Compliance for Fidelity Investments and is an employee of Fidelity Investments (2006-present). Previously, Mr. Pogorelec served as Vice President, Associate General Counsel for Fidelity Investments (2010-2020) and Assistant Secretary of certain Fidelity funds (2015-2020).
Stacie M. Smith (1974)
Year of Election or Appointment: 2016
President and Treasurer
Ms. Smith also serves as an officer of other funds. Ms. Smith serves as Assistant Treasurer of FMR Capital, Inc. (2017-present), is an employee of Fidelity Investments (2009-present), and has served in other fund officer roles. Prior to joining Fidelity Investments, Ms. Smith served as Senior Audit Manager of Ernst & Young LLP (accounting firm, 1996-2009). Previously, Ms. Smith served as Assistant Treasurer (2013-2019) and Deputy Treasurer (2013-2016) of certain Fidelity® funds.
Marc L. Spector (1972)
Year of Election or Appointment: 2016
Assistant Treasurer
Mr. Spector also serves as an officer of other funds. Mr. Spector serves as Assistant Treasurer of FMR Capital, Inc. (2017-present) and is an employee of Fidelity Investments (2016-present). Prior to joining Fidelity Investments, Mr. Spector served as Director at the Siegfried Group (accounting firm, 2013-2016), and prior to Siegfried Group as audit senior manager at Deloitte & Touche LLP (accounting firm, 2005-2013).
Jim Wegmann (1979)
Year of Election or Appointment: 2019
Assistant Treasurer
Mr. Wegmann also serves as Assistant Treasurer of other funds. Mr. Wegmann is an employee of Fidelity Investments (2011-present).
Shareholder Expense Example
As a shareholder, you incur two types of costs: (1) transaction costs, which may include sales charges (loads) on purchase payments or redemption proceeds, as applicable and (2) ongoing costs, which generally include management fees, distribution and/or service (12b-1) fees and other Fund expenses. This Example is intended to help you understand your ongoing costs (in dollars) of investing in a fund and to compare these costs with the ongoing costs of investing in other mutual funds.
The Example is based on an investment of $1,000 invested at the beginning of the period and held for the entire period (February 1, 2020 to July 31, 2020).
Actual Expenses
The first line of the accompanying table provides information about actual account values and actual expenses. You may use the information in this line, together with the amount you invested, to estimate the expenses that you paid over the period. Simply divide your account value by $1,000.00 (for example, an $8,600 account value divided by $1,000.00 = 8.6), then multiply the result by the number in the first line for a class/Fund under the heading entitled "Expenses Paid During Period" to estimate the expenses you paid on your account during this period. If any fund is a shareholder of any underlying mutual funds or exchange-traded funds (ETFs) (the Underlying Funds), such fund indirectly bears its proportional share of the expenses of the Underlying Funds in addition to the direct expenses incurred presented in the table. These fees and expenses are not included in the annualized expense ratio used to calculate the expense estimate in the table below.
Hypothetical Example for Comparison Purposes
The second line of the accompanying table provides information about hypothetical account values and hypothetical expenses based on the actual expense ratio and an assumed rate of return of 5% per year before expenses, which is not the actual return. The hypothetical account values and expenses may not be used to estimate the actual ending account balance or expenses you paid for the period. You may use this information to compare the ongoing costs of investing in the Fund and other funds. To do so, compare this 5% hypothetical example with the 5% hypothetical examples that appear in the shareholder reports of the other funds. If any fund is a shareholder of any Underlying Funds, such fund indirectly bears its proportional share of the expenses of the Underlying Funds in addition to the direct expenses as presented in the table. These fees and expenses are not included in the annualized expense ratio used to calculate the expense estimate in the table below.
Please note that the expenses shown in the table are meant to highlight your ongoing costs only and do not reflect any transaction costs. Therefore, the second line of the table is useful in comparing ongoing costs only, and will not help you determine the relative total costs of owning different funds.
| | Annualized Expense Ratio-A | Beginning
Account Value
February 1, 2020 | Ending
Account Value
July 31, 2020 | Expenses Paid
During Period-B
February 1, 2020
to July 31, 2020 |
| Fidelity Leveraged Company Stock Fund | | | | |
| Leveraged Company Stock | .78% | | | |
| Actual | | $1,000.00 | $965.60 | $3.81 |
| Hypothetical-C | | $1,000.00 | $1,020.98 | $3.92 |
| Class K | .67% | | | |
| Actual | | $1,000.00 | $966.00 | $3.28 |
| Hypothetical-C | | $1,000.00 | $1,021.53 | $3.37 |
A Annualized expense ratio reflects expenses net of applicable fee waivers.
B Expenses are equal to the annualized expense ratio, multiplied by the average account value over the period, multiplied by 182/ 366 (to reflect the one-half year period). The fees and expenses of any Underlying Funds are not included in each annualized expense ratio.
C 5% return per year before expenses
Distributions (Unaudited)
Leveraged Company Stock and Class K designate 100% of the dividends distributed in December during the fiscal year as qualifying for the dividends–received deduction for corporate shareholders.
Leveraged Company Stock and Class K designate 100% of the dividends distributed during the fiscal year as amounts which may be taken into account as a dividend for purposes of the maximum rate under section 1(h)(11) of the Internal Revenue Code.
The fund will notify shareholders in January 2021 of amounts for use in preparing 2020 income tax returns.
Liquidity Risk Management Program
The Securities and Exchange Commission adopted Rule 22e-4 under the Investment Company Act of 1940 (the Liquidity Rule) to promote effective liquidity risk management throughout the open-end investment company industry, thereby reducing the risk that funds will be unable to meet their redemption obligations and mitigating dilution of the interests of fund shareholders.
The Fund has adopted and implemented a liquidity risk management program pursuant to the Liquidity Rule (the Program) effective December 1, 2018. The Program is reasonably designed to assess and manage the Fund’s liquidity risk and to comply with the requirements of the Liquidity Rule. The Fund’s Board of Trustees (the Board) has designated the Fund’s investment adviser as administrator of the Program. The Fidelity advisers have established a Liquidity Risk Management Committee (the LRM Committee) to manage the Program for each of the Fidelity Funds. The LRM Committee monitors the adequacy and effectiveness of implementation of the Program and on a periodic basis assesses each Fund’s liquidity risk based on a variety of factors including (1) the Fund’s investment strategy, (2) portfolio liquidity and cash flow projections during normal and reasonably foreseeable stressed conditions, (3) shareholder redemptions, (4) borrowings and other funding sources and (5) in the case of exchange-traded funds, certain additional factors including the effect of the Fund’s prices and spreads, market participants, and basket compositions on the overall liquidity of the Fund’s portfolio, as applicable.
In accordance with the Program, each of the Fund’s portfolio investments is classified into one of four liquidity categories described below based on a determination of a reasonable expectation for how long it would take to convert the investment to cash (or sell or dispose of the investment) without significantly changing its market value.
- Highly liquid investments – cash or convertible to cash within three business days or less
- Moderately liquid investments – convertible to cash in three to seven calendar days
- Less liquid investments – can be sold or disposed of, but not settled, within seven calendar days
- Illiquid investments – cannot be sold or disposed of within seven calendar days
Liquidity classification determinations take into account a variety of factors including various market, trading and investment-specific considerations, as well as market depth, and generally utilize analysis from a third-party liquidity metrics service.
The Liquidity Rule places a 15% limit on a fund’s illiquid investments and requires funds that do not primarily hold assets that are highly liquid investments to determine and maintain a minimum percentage of the fund’s net assets to be invested in highly liquid investments (highly liquid investment minimum or HLIM). The Program includes provisions reasonably designed to comply with the 15% limit on illiquid investments and for determining, periodically reviewing and complying with the HLIM requirement as applicable.
At a recent meeting of the Fund’s Board of Trustees, the LRM Committee provided a written report to the Board pertaining to the operation, adequacy, and effectiveness of implementation of the Program for the annual period from December 1, 2018 through November 30, 2019. The report concluded that the Program has been implemented and is operating effectively and is reasonably designed to assess and manage the Fund’s liquidity risk.
Proxy Voting Results
A special meeting of shareholders was held on June 9, 2020. The results of votes taken among shareholders on the proposals before them are reported below. Each vote reported represents one dollar of net asset value held on the record date for the meeting.
PROPOSAL 1
To elect a Board of Trustees.
| | # of
Votes | % of
Votes |
| Dennis J. Dirks |
| Affirmative | 43,167,428,219.785 | 94.885 |
| Withheld | 2,327,070,930.034 | 5.115 |
| TOTAL | 45,494,499,149.820 | 100.000 |
| Donald F. Donahue |
| Affirmative | 43,161,668,935.467 | 94.872 |
| Withheld | 2,333,065,287.611 | 5.128 |
| TOTAL | 45,494,734,223.077 | 100.000 |
| Bettina Doulton |
| Affirmative | 43,304,465,213.969 | 95.186 |
| Withheld | 2,190,010,062.903 | 4.814 |
| TOTAL | 45,494,475,276.872 | 100.000 |
| Vicki L. Fuller |
| Affirmative | 43,380,442,631.493 | 95.353 |
| Withheld | 2,114,180,614.639 | 4.647 |
| TOTAL | 45,494,623,246.132 | 100.000 |
| Patricia L. Kampling |
| Affirmative | 43,128,008,796.761 | 94.798 |
| Withheld | 2,366,685,422.999 | 5.202 |
| TOTAL | 45,494,694,219.760 | 100.000 |
| Alan J. Lacy |
| Affirmative | 42,904,065,046.958 | 94.305 |
| Withheld | 2,590,717,567.229 | 5.695 |
| TOTAL | 45,494,782,614.187 | 100.000 |
| Ned C. Lautenbach |
| Affirmative | 42,802,778,827.017 | 94.083 |
| Withheld | 2,692,003,787.170 | 5.917 |
| TOTAL | 45,494,782,614.187 | 100.000 |
| Robert A. Lawrence |
| Affirmative | 42,971,258,294.203 | 94.453 |
| Withheld | 2,523,524,319.984 | 5.547 |
| TOTAL | 45,494,782,614.187 | 100.000 |
| Joseph Mauriello |
| Affirmative | 42,874,562,778.490 | 94.241 |
| Withheld | 2,620,171,874.731 | 5.759 |
| TOTAL | 45,494,734,653.220 | 100.000 |
| Cornelia M. Small |
| Affirmative | 43,029,040,988.063 | 94.580 |
| Withheld | 2,465,741,626.124 | 5.420 |
| TOTAL | 45,494,782,614.187 | 100.000 |
| Garnett A. Smith |
| Affirmative | 42,892,814,945.159 | 94.281 |
| Withheld | 2,601,967,669.028 | 5.719 |
| TOTAL | 45,494,782,614.187 | 100.000 |
| David M. Thomas |
| Affirmative | 42,936,080,036.111 | 94.376 |
| Withheld | 2,558,702,578.076 | 5.624 |
| TOTAL | 45,494,782,614.187 | 100.000 |
| Susan Tomasky |
| Affirmative | 43,147,934,105.796 | 94.842 |
| Withheld | 2,346,571,066.028 | 5.158 |
| TOTAL | 45,494,782,614.187 | 100.000 |
| Michael E. Wiley |
| Affirmative | 42,885,333,102.972 | 94.264 |
| Withheld | 2,609,449,511.215 | 5.736 |
| TOTAL | 45,494,782,614.187 | 100.000 |
PROPOSAL 2
To convert a fundamental investment policy to a non-fundamental investment policy.
| | # of
Votes | % of
Votes |
| Affirmative | 731,270,873.049 | 74.499 |
| Against | 119,877,953.903 | 12.213 |
| Abstain | 95,115,265.593 | 9.690 |
| Broker Non-Vote | 35,317,083.150 | 3.598 |
| TOTAL | 981,581,175.695 | 100.000 |
PROPOSAL 5
A shareholder proposal to institute procedures to avoid holding investments in companies that contribute to genocide or crimes against humanity.
| | # of
Votes | % of
Votes |
| Affirmative | 319,311,125.238 | 32.530 |
| Against | 548,550,184.858 | 55.884 |
| Abstain | 78,374,111.512 | 7.984 |
| Broker Non-Vote | 35,345,754.087 | 3.601 |
| TOTAL | 981,581,175.695 | 100.000 |
| Proposal 1 reflects trust wide proposal and voting results. |
| Proposal 5 was not approved by shareholders. |
LSF-ANN-0920
1.762413.119
Fidelity® Blue Chip Growth Fund
Annual Report
July 31, 2020
See the inside front cover for important information about access to your fund’s shareholder reports.
Beginning on January 1, 2021, as permitted by regulations adopted by the Securities and Exchange Commission, paper copies of a fund’s shareholder reports will no longer be sent by mail, unless you specifically request paper copies of the reports from the fund or from your financial intermediary, such as a financial advisor, broker-dealer or bank. Instead, the reports will be made available on a website, and you will be notified by mail each time a report is posted and provided with a website link to access the report.
If you already elected to receive shareholder reports electronically, you will not be affected by this change and you need not take any action. You may elect to receive shareholder reports and other communications from a fund electronically, by contacting your financial intermediary. For Fidelity customers, visit Fidelity's web site or call Fidelity using the contact information listed below.
You may elect to receive all future reports in paper free of charge. If you wish to continue receiving paper copies of your shareholder reports, you may contact your financial intermediary or, if you are a Fidelity customer, visit Fidelity’s website, or call Fidelity at the applicable toll-free number listed below. Your election to receive reports in paper will apply to all funds held with the fund complex/your financial intermediary.
| Account Type | Website | Phone Number |
| Brokerage, Mutual Fund, or Annuity Contracts: | fidelity.com/mailpreferences | 1-800-343-3548 |
| Employer Provided Retirement Accounts: | netbenefits.fidelity.com/preferences (choose 'no' under Required Disclosures to continue to print) | 1-800-343-0860 |
| Advisor Sold Accounts Serviced Through Your Financial Intermediary: | Contact Your Financial Intermediary | Your Financial Intermediary's phone number |
| Advisor Sold Accounts Serviced by Fidelity: | institutional.fidelity.com | 1-877-208-0098 |
Contents
To view a fund's proxy voting guidelines and proxy voting record for the 12-month period ended June 30, visit http://www.fidelity.com/proxyvotingresults or visit the Securities and Exchange Commission's (SEC) web site at http://www.sec.gov.
You may also call 1-800-544-8544 if you’re an individual investing directly with Fidelity, call 1-800-835-5092 if you’re a plan sponsor or participant with Fidelity as your recordkeeper or call 1-877-208-0098 on institutional accounts or if you’re an advisor or invest through one to request a free copy of the proxy voting guidelines.
Standard & Poor's, S&P and S&P 500 are registered service marks of The McGraw-Hill Companies, Inc. and have been licensed for use by Fidelity Distributors Corporation.
Other third-party marks appearing herein are the property of their respective owners.
All other marks appearing herein are registered or unregistered trademarks or service marks of FMR LLC or an affiliated company. © 2020 FMR LLC. All rights reserved.
This report and the financial statements contained herein are submitted for the general information of the shareholders of the Fund. This report is not authorized for distribution to prospective investors in the Fund unless preceded or accompanied by an effective prospectus.
A fund files its complete schedule of portfolio holdings with the SEC for the first and third quarters of each fiscal year on Form N-PORT. Forms N-PORT are available on the SEC’s web site at http://www.sec.gov. A fund's Forms N-PORT may be reviewed and copied at the SEC’s Public Reference Room in Washington, DC. Information regarding the operation of the SEC's Public Reference Room may be obtained by calling 1-800-SEC-0330.
For a complete list of a fund's portfolio holdings, view the most recent holdings listing, semiannual report, or annual report on Fidelity's web site at http://www.fidelity.com, http://www.institutional.fidelity.com, or http://www.401k.com, as applicable.
NOT FDIC INSURED •MAY LOSE VALUE •NO BANK GUARANTEE
Neither the Fund nor Fidelity Distributors Corporation is a bank.
Note to Shareholders:
Early in 2020, the outbreak and spread of a new coronavirus emerged as a public health emergency that had a major influence on financial markets, primarily based on its impact on the global economy and the outlook for corporate earnings. The virus causes a respiratory disease known as COVID-19. On March 11, the World Health Organization declared the COVID-19 outbreak a pandemic, citing sustained risk of further global spread.
In the weeks following, as the crisis worsened, we witnessed an escalating human tragedy with wide-scale social and economic consequences from coronavirus-containment measures. The outbreak of COVID-19 prompted a number of measures to limit the spread, including travel and border restrictions, quarantines, and restrictions on large gatherings. In turn, these resulted in lower consumer activity, diminished demand for a wide range of products and services, disruption in manufacturing and supply chains, and – given the wide variability in outcomes regarding the outbreak – significant market uncertainty and volatility. Amid the turmoil, the U.S. government took unprecedented action – in concert with the U.S. Federal Reserve and central banks around the world – to help support consumers, businesses, and the broader economy, and to limit disruption to the financial system.
The situation continues to unfold, and the extent and duration of its impact on financial markets and the economy remain highly uncertain. Extreme events such as the coronavirus crisis are “exogenous shocks” that can have significant adverse effects on mutual funds and their investments. Although multiple asset classes may be affected by market disruption, the duration and impact may not be the same for all types of assets.
Fidelity is committed to helping you stay informed amid news about COVID-19 and during increased market volatility, and we’re taking extra steps to be responsive to customer needs. We encourage you to visit our websites, where we offer ongoing updates, commentary, and analysis on the markets and our funds.
Performance: The Bottom Line
Average annual total return reflects the change in the value of an investment, assuming reinvestment of distributions from dividend income and capital gains (the profits earned upon the sale of securities that have grown in value, if any) and assuming a constant rate of performance each year. The hypothetical investment and the average annual total returns do not reflect the deduction of taxes that a shareholder would pay on fund distributions or the redemption of fund shares. During periods of reimbursement by Fidelity, a fund’s total return will be greater than it would be had the reimbursement not occurred. How a fund did yesterday is no guarantee of how it will do tomorrow.
Average Annual Total Returns
| For the periods ended July 31, 2020 | Past 1 year | Past 5 years | Past 10 years |
| Fidelity® Blue Chip Growth Fund | 39.45% | 18.22% | 18.86% |
| Class K | 39.57% | 18.35% | 19.00% |
$10,000 Over 10 Years
Let's say hypothetically that $10,000 was invested in Fidelity® Blue Chip Growth Fund, a class of the fund, on July 31, 2010.
The chart shows how the value of your investment would have changed, and also shows how the Russell 1000® Growth Index performed over the same period.
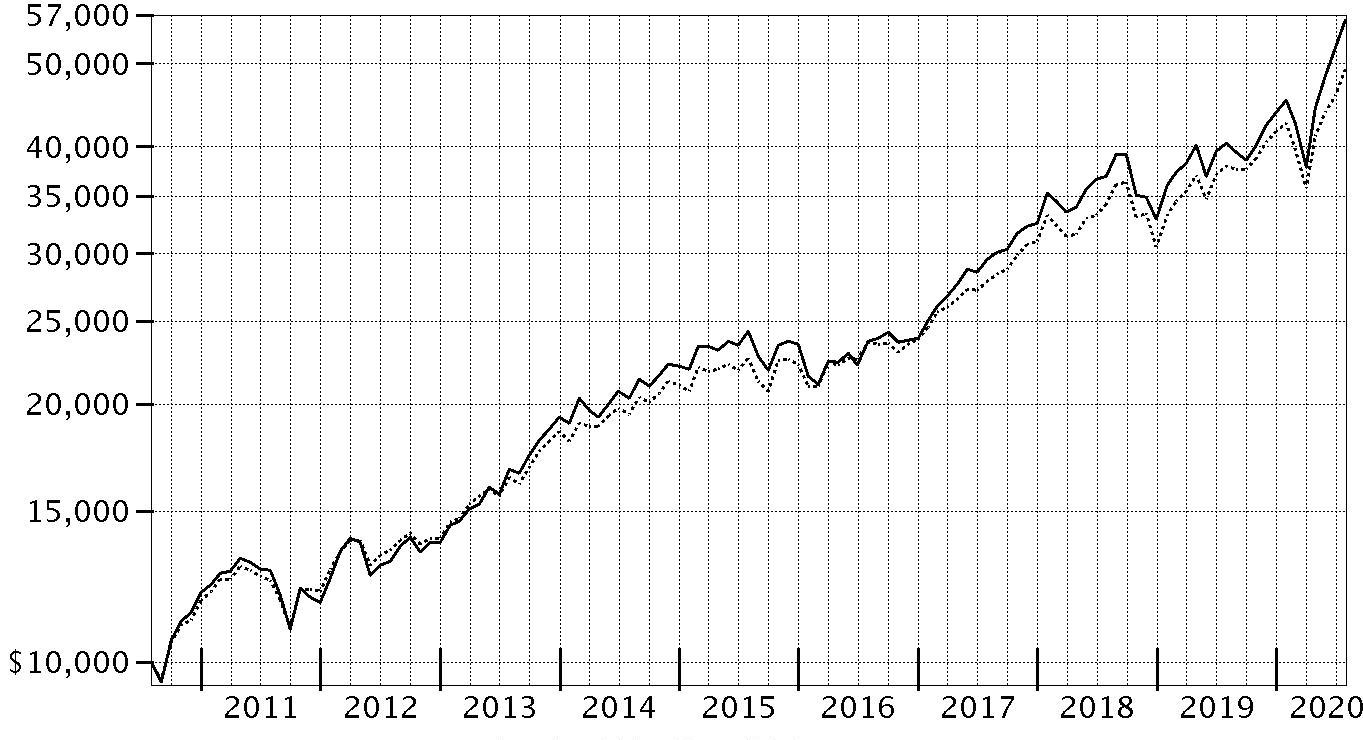
| Period Ending Values |
| $56,258 | Fidelity® Blue Chip Growth Fund |
| $49,285 | Russell 1000® Growth Index |
Management's Discussion of Fund Performance
Market Recap: The S&P 500
® index gained 11.96% for the 12 months ending July 31, 2020, in what was a bumpy ride for U.S. equity investors, marked by a steep but brief decline due to the early-2020 outbreak and spread of the coronavirus, followed by a historic rebound. Declared a pandemic on March 11, the COVID-19 crisis and containment efforts caused broad contraction in economic activity, along with extreme uncertainty, volatility and dislocation in financial markets. By mid-March, U.S. stocks entered bear-market territory less than a month after hitting an all-time high and extending the longest-running bull market in American history. Stocks slid in late February, after a surge in COVID-19 cases outside China. The sudden downtrend continued in March (-12%), capping the index’s worst quarter since 2008. A historically rapid and expansive U.S. monetary/fiscal-policy response provided a partial offset to the economic disruption and fueled a sharp uptrend. Aggressive support for financial markets by the U.S. Federal Reserve, plans for reopening the economy and improving infection data boosted stocks in April (+13%) and May (+5%). In June and July, the index gained amid progress on potential treatments and signs of an early recovery in economic activity. For the full 12 months, growth stocks widely topped value, while large-caps handily bested smaller-caps. The information technology sector (+39%) led the way, followed by consumer discretionary (+22%). In contrast, energy (-38%) fell hard along with the price of crude oil.
Comments from Portfolio Manager Sonu Kalra: For the fiscal year ending July 31, 2020, the fund's share classes gained about 39% to 40%, outperforming the 29.84% result of the benchmark Russell 1000 Growth Index. The primary contributor to performance versus the benchmark was security selection and overweighting in consumer discretionary. Strong picks in information technology also helped, as did stock selection in the communication services sector – especially within the media & entertainment industry. The biggest individual relative contributor was an overweight position in Tesla (+491%). Also adding value was our overweighting in Nvidia, which gained about 153%. Nvidia and Tesla were among the largest fund holdings, on average. Another key contributor was our out-of-benchmark position in SEA (+248%). Conversely, stock picks in consumer staples and the transportation industry, as well as an underweighting in information technology, hindered relative performance. Our non-benchmark stake in JUUL Labs (-65%) was the fund's largest individual relative detractor. Out-of-benchmark positions in Lyft (-50%) and General Electric (-37%) also detracted notably. We no longer held General Electric by period end but increased the fund’s stake in Lyft. Notable changes in positioning included increased exposure to the consumer discretionary sector and a lower allocation to industrials.
The views expressed above reflect those of the portfolio manager(s) only through the end of the period as stated on the cover of this report and do not necessarily represent the views of Fidelity or any other person in the Fidelity organization. Any such views are subject to change at any time based upon market or other conditions and Fidelity disclaims any responsibility to update such views. These views may not be relied on as investment advice and, because investment decisions for a Fidelity fund are based on numerous factors, may not be relied on as an indication of trading intent on behalf of any Fidelity fund.
Investment Summary (Unaudited)
Top Ten Stocks as of July 31, 2020
| | % of fund's net assets |
| Amazon.com, Inc. | 9.5 |
| Apple, Inc. | 9.4 |
| Microsoft Corp. | 6.8 |
| Alphabet, Inc. Class A | 4.6 |
| Facebook, Inc. Class A | 4.2 |
| NVIDIA Corp. | 3.4 |
| Tesla, Inc. | 2.9 |
| Marvell Technology Group Ltd. | 2.6 |
| Salesforce.com, Inc. | 2.2 |
| Visa, Inc. Class A | 1.9 |
| | 47.5 |
Top Five Market Sectors as of July 31, 2020
| | % of fund's net assets |
| Information Technology | 39.1 |
| Consumer Discretionary | 27.8 |
| Communication Services | 14.2 |
| Health Care | 9.8 |
| Industrials | 3.9 |
Asset Allocation (% of fund's net assets)
| As of July 31, 2020* |
| | Stocks | 98.2% |
| | Convertible Securities | 1.8% |

* Foreign investments - 12.4%
Schedule of Investments July 31, 2020
Showing Percentage of Net Assets
| Common Stocks - 98.1% | | | |
| | | Shares | Value (000s) |
| COMMUNICATION SERVICES - 14.2% | | | |
| Entertainment - 3.7% | | | |
| Activision Blizzard, Inc. | | 2,791,769 | $230,684 |
| CD Projekt RED SA (a) | | 31,712 | 3,404 |
| CD Projekt RED SA ADR (a) | | 706,297 | 19,568 |
| Electronic Arts, Inc. (a) | | 186,800 | 26,455 |
| Netflix, Inc. (a) | | 1,123,433 | 549,224 |
| Nintendo Co. Ltd. | | 63,812 | 28,065 |
| Nintendo Co. Ltd. ADR | | 171,800 | 9,451 |
| Roku, Inc. Class A (a) | | 491,219 | 76,085 |
| Sea Ltd. ADR (a)(b) | | 3,184,289 | 389,120 |
| Spotify Technology SA (a) | | 164,234 | 42,343 |
| Take-Two Interactive Software, Inc. (a) | | 43,870 | 7,196 |
| WME Entertainment Parent, LLC Class A (a)(c)(d)(e) | | 10,172,512 | 15,157 |
| | | | 1,396,752 |
| Interactive Media & Services - 10.2% | | | |
| Alphabet, Inc. Class A (a) | | 1,174,676 | 1,747,859 |
| CarGurus, Inc. Class A (a) | | 1,705,591 | 49,275 |
| Facebook, Inc. Class A (a) | | 6,171,288 | 1,565,471 |
| Match Group, Inc. (a)(b) | | 834,959 | 85,750 |
| Pinterest, Inc. Class A (a) | | 147,400 | 5,054 |
| Snap, Inc. Class A (a)(b) | | 2,579,552 | 57,834 |
| Tencent Holdings Ltd. | | 3,180,947 | 218,207 |
| Twitter, Inc. (a) | | 598,300 | 21,778 |
| Yandex NV Series A (a) | | 414,029 | 23,823 |
| Zoominfo Technologies, Inc. | | 1,638,530 | 66,967 |
| | | | 3,842,018 |
| Media - 0.0% | | | |
| The New York Times Co. Class A | | 245,900 | 11,346 |
| Wireless Telecommunication Services - 0.3% | | | |
| T-Mobile U.S., Inc. | | 1,029,228 | 110,519 |
|
| TOTAL COMMUNICATION SERVICES | | | 5,360,635 |
|
| CONSUMER DISCRETIONARY - 27.5% | | | |
| Auto Components - 0.1% | | | |
| BorgWarner, Inc. | | 511,824 | 18,733 |
| Lear Corp. | | 45,077 | 4,976 |
| | | | 23,709 |
| Automobiles - 3.0% | | | |
| Harley-Davidson, Inc. (b) | | 813,100 | 21,165 |
| Li Auto, Inc. ADR (a) | | 582,100 | 9,314 |
| Tesla, Inc. (a)(b) | | 764,411 | 1,093,689 |
| | | | 1,124,168 |
| Distributors - 0.0% | | | |
| Pool Corp. | | 38,752 | 12,273 |
| Diversified Consumer Services - 0.0% | | | |
| Bright Horizons Family Solutions, Inc. (a) | | 31,213 | 3,347 |
| Youdao, Inc. ADR (a) | | 121,300 | 5,132 |
| | | | 8,479 |
| Hotels, Restaurants & Leisure - 2.4% | | | |
| Boyd Gaming Corp. | | 1,758,681 | 41,628 |
| Caesars Entertainment, Inc. (a) | | 2,780,101 | 86,322 |
| Chipotle Mexican Grill, Inc. (a) | | 163,053 | 188,352 |
| Churchill Downs, Inc. | | 449,031 | 62,200 |
| Darden Restaurants, Inc. | | 488,557 | 37,081 |
| Domino's Pizza, Inc. | | 27,800 | 10,748 |
| DraftKings, Inc. Class A (a)(b) | | 202,300 | 6,752 |
| Evolution Gaming Group AB (f) | | 356,041 | 24,265 |
| Hilton Worldwide Holdings, Inc. | | 495,726 | 37,204 |
| Kambi Group PLC (a) | | 354,782 | 8,526 |
| Las Vegas Sands Corp. | | 518,503 | 22,627 |
| Marriott International, Inc. Class A | | 575,798 | 48,266 |
| Penn National Gaming, Inc. (a) | | 3,940,068 | 133,371 |
| Planet Fitness, Inc. (a) | | 23,244 | 1,213 |
| Starbucks Corp. | | 1,076,565 | 82,390 |
| Texas Roadhouse, Inc. Class A | | 769,269 | 43,225 |
| Vail Resorts, Inc. | | 227,206 | 43,630 |
| Wingstop, Inc. | | 150,113 | 23,455 |
| Wynn Resorts Ltd. | | 273,571 | 19,815 |
| | | | 921,070 |
| Household Durables - 0.9% | | | |
| D.R. Horton, Inc. | | 296,315 | 19,604 |
| iRobot Corp. (a)(b) | | 506,418 | 36,812 |
| KB Home | | 532,539 | 17,915 |
| Leggett & Platt, Inc. | | 178,005 | 7,136 |
| Lennar Corp. Class A | | 476,181 | 34,452 |
| NVR, Inc. (a) | | 3,985 | 15,662 |
| PulteGroup, Inc. | | 197,500 | 8,611 |
| Sony Corp. sponsored ADR | | 452,052 | 35,242 |
| Taylor Morrison Home Corp. (a) | | 1,688,071 | 39,585 |
| Tempur Sealy International, Inc. (a) | | 408,889 | 33,100 |
| Toll Brothers, Inc. | | 860,627 | 32,876 |
| TRI Pointe Homes, Inc. (a) | | 2,380,190 | 39,797 |
| Whirlpool Corp. | | 48,500 | 7,911 |
| | | | 328,703 |
| Internet & Direct Marketing Retail - 12.9% | | | |
| Alibaba Group Holding Ltd. sponsored ADR (a) | | 997,356 | 250,356 |
| Amazon.com, Inc. (a) | | 1,132,834 | 3,585,055 |
| Chewy, Inc. (a)(b) | | 72,322 | 3,796 |
| Delivery Hero AG (a)(f) | | 176,042 | 20,272 |
| eBay, Inc. | | 491,351 | 27,162 |
| Expedia, Inc. | | 629,546 | 51,000 |
| Farfetch Ltd. Class A (a)(b) | | 1,348,699 | 34,567 |
| Fiverr International Ltd. (a) | | 265,574 | 24,813 |
| JD.com, Inc.: | | | |
| Class A | | 333,073 | 10,348 |
| sponsored ADR (a) | | 676,711 | 43,167 |
| Kogan.Com Ltd. | | 916,093 | 10,904 |
| MercadoLibre, Inc. (a) | | 116,726 | 131,272 |
| Ocado Group PLC (a) | | 816,569 | 21,944 |
| Pinduoduo, Inc. ADR (a) | | 2,615,691 | 240,120 |
| The Booking Holdings, Inc. (a) | | 111,869 | 185,941 |
| The Honest Co., Inc. (a)(d)(e) | | 150,143 | 2,485 |
| The RealReal, Inc. (a)(b) | | 3,546,914 | 48,380 |
| Wayfair LLC Class A (a) | | 640,912 | 170,540 |
| | | | 4,862,122 |
| Leisure Products - 0.5% | | | |
| Bafang Electric Suzhou Co. Ltd. (A Shares) | | 167,500 | 3,832 |
| BRP, Inc. | | 247,836 | 11,102 |
| Callaway Golf Co. | | 687,511 | 13,097 |
| Peloton Interactive, Inc. Class A (a) | | 1,593,415 | 108,703 |
| Polaris, Inc. | | 72,199 | 7,482 |
| Vista Outdoor, Inc. (a) | | 1,888,293 | 32,384 |
| | | | 176,600 |
| Multiline Retail - 0.5% | | | |
| Dollar General Corp. | | 184,173 | 35,067 |
| Dollar Tree, Inc. (a) | | 959,808 | 89,598 |
| Nordstrom, Inc. (b) | | 226,392 | 3,099 |
| Ollie's Bargain Outlet Holdings, Inc. (a) | | 246,635 | 25,921 |
| Target Corp. | | 179,187 | 22,556 |
| | | | 176,241 |
| Specialty Retail - 4.3% | | | |
| Advance Auto Parts, Inc. | | 24,233 | 3,638 |
| Bed Bath & Beyond, Inc. (b) | | 281,248 | 3,043 |
| Burlington Stores, Inc. (a) | | 416,383 | 78,280 |
| Carvana Co. Class A (a)(b) | | 1,686,655 | 261,347 |
| Dick's Sporting Goods, Inc. | | 533,997 | 24,361 |
| Five Below, Inc. (a) | | 641,849 | 69,904 |
| Floor & Decor Holdings, Inc. Class A (a) | | 1,790,694 | 118,007 |
| Gap, Inc. (b) | | 1,356,260 | 18,133 |
| Lowe's Companies, Inc. | | 3,495,413 | 520,502 |
| Michaels Companies, Inc. (a) | | 2,343,100 | 16,823 |
| RH (a)(b) | | 672,977 | 193,434 |
| The Home Depot, Inc. | | 1,028,366 | 273,021 |
| Vroom, Inc. | | 162,548 | 9,621 |
| Williams-Sonoma, Inc. | | 249,905 | 21,772 |
| | | | 1,611,886 |
| Textiles, Apparel & Luxury Goods - 2.9% | | | |
| adidas AG | | 281,435 | 77,542 |
| Allbirds, Inc. (a)(d)(e) | | 181,080 | 1,865 |
| Anta Sports Products Ltd. | | 305,151 | 2,894 |
| Aritzia LP (a) | | 809,510 | 10,715 |
| Crocs, Inc. (a) | | 2,397,881 | 86,180 |
| Deckers Outdoor Corp. (a) | | 295,735 | 61,883 |
| lululemon athletica, Inc. (a) | | 1,516,124 | 493,635 |
| LVMH Moet Hennessy Louis Vuitton SE | | 102,609 | 44,619 |
| Moncler SpA | | 857,670 | 32,936 |
| NIKE, Inc. Class B | | 2,293,061 | 223,826 |
| PVH Corp. | | 694,527 | 33,796 |
| Tory Burch LLC (a)(c)(d)(e) | | 293,611 | 16,486 |
| VF Corp. | | 253,629 | 15,309 |
| | | | 1,101,686 |
|
| TOTAL CONSUMER DISCRETIONARY | | | 10,346,937 |
|
| CONSUMER STAPLES - 2.1% | | | |
| Beverages - 0.5% | | | |
| Boston Beer Co., Inc. Class A (a)(b) | | 87,571 | 70,971 |
| Keurig Dr. Pepper, Inc. | | 1,293,170 | 39,558 |
| Monster Beverage Corp. (a) | | 829,920 | 65,132 |
| | | | 175,661 |
| Food & Staples Retailing - 0.6% | | | |
| BJ's Wholesale Club Holdings, Inc. (a) | | 1,577,970 | 63,198 |
| Costco Wholesale Corp. | | 283,670 | 92,343 |
| Kroger Co. | | 1,394,740 | 48,523 |
| Performance Food Group Co. (a) | | 962,776 | 26,977 |
| Zur Rose Group AG (a) | | 24,250 | 6,695 |
| | | | 237,736 |
| Food Products - 0.1% | | | |
| Act II Global Acquisition Corp. Class A (a)(b) | | 1,883,215 | 13,070 |
| Freshpet, Inc. (a) | | 99,121 | 9,521 |
| JDE Peet's BV | | 451,244 | 20,066 |
| | | | 42,657 |
| Household Products - 0.7% | | | |
| Clorox Co. (b) | | 369,165 | 87,311 |
| Procter & Gamble Co. | | 1,018,998 | 133,611 |
| Reckitt Benckiser Group PLC | | 258,071 | 25,877 |
| | | | 246,799 |
| Personal Products - 0.1% | | | |
| Herbalife Nutrition Ltd. (a) | | 935,198 | 47,920 |
| Tobacco - 0.1% | | | |
| JUUL Labs, Inc.: | | | |
| Class A (a)(d)(e) | | 21,148 | 2,127 |
| Class B (a)(d)(e) | | 6,625 | 666 |
| Swedish Match Co. AB | | 434,366 | 33,294 |
| | | | 36,087 |
|
| TOTAL CONSUMER STAPLES | | | 786,860 |
|
| ENERGY - 0.6% | | | |
| Oil, Gas & Consumable Fuels - 0.6% | | | |
| Occidental Petroleum Corp. warrants 8/3/27 (a) | | 23,387 | 131 |
| Reliance Industries Ltd. | | 7,638,838 | 210,761 |
| Reliance Industries Ltd. (a) | | 509,255 | 8,002 |
| Reliance Industries Ltd. sponsored GDR (f) | | 384,448 | 21,183 |
| | | | 240,077 |
| FINANCIALS - 0.9% | | | |
| Banks - 0.0% | | | |
| Kotak Mahindra Bank Ltd. | | 779,186 | 14,204 |
| Capital Markets - 0.5% | | | |
| BlackRock, Inc. Class A | | 78,365 | 45,061 |
| Goldman Sachs Group, Inc. | | 85,662 | 16,958 |
| Insurance Acquisition Corp. Class A (a)(g) | | 1,235,586 | 13,233 |
| London Stock Exchange Group PLC | | 162,889 | 17,993 |
| Moody's Corp. | | 22,184 | 6,240 |
| Morgan Stanley | | 365,483 | 17,865 |
| MSCI, Inc. | | 133,861 | 50,329 |
| Open Lending Corp. (a)(b) | | 214,600 | 3,640 |
| | | | 171,319 |
| Consumer Finance - 0.2% | | | |
| Ally Financial, Inc. | | 1,848,175 | 37,148 |
| Capital One Financial Corp. | | 435,313 | 27,773 |
| Discover Financial Services | | 200,550 | 9,913 |
| Synchrony Financial | | 126,182 | 2,792 |
| | | | 77,626 |
| Diversified Financial Services - 0.0% | | | |
| dMY Technology Group, Inc. (a) | | 824,869 | 8,731 |
| Insurance - 0.1% | | | |
| eHealth, Inc. (a)(b) | | 762,658 | 52,730 |
| Thrifts & Mortgage Finance - 0.1% | | | |
| Housing Development Finance Corp. Ltd. | | 697,722 | 16,595 |
|
| TOTAL FINANCIALS | | | 341,205 |
|
| HEALTH CARE - 9.6% | | | |
| Biotechnology - 3.3% | | | |
| ACADIA Pharmaceuticals, Inc. (a) | | 364,078 | 15,135 |
| Acceleron Pharma, Inc. (a) | | 430,964 | 42,739 |
| ADC Therapeutics SA (a) | | 292,082 | 13,582 |
| Agios Pharmaceuticals, Inc. (a) | | 368,505 | 16,701 |
| Aimmune Therapeutics, Inc. (a)(b) | | 637,298 | 8,419 |
| Akouos, Inc. (a) | | 244,520 | 4,780 |
| Allakos, Inc. (a)(b) | | 78,418 | 5,887 |
| Alnylam Pharmaceuticals, Inc. (a) | | 791,603 | 115,384 |
| Annexon, Inc. (a)(b) | | 465,700 | 8,490 |
| Arcutis Biotherapeutics, Inc. (a) | | 372,349 | 9,942 |
| Argenx SE ADR (a) | | 81,111 | 18,666 |
| Ascendis Pharma A/S sponsored ADR (a) | | 438,046 | 60,280 |
| Avidity Biosciences, Inc. | | 206,525 | 5,822 |
| BeiGene Ltd. (a) | | 575,000 | 9,459 |
| BeiGene Ltd. ADR (a) | | 133,725 | 27,949 |
| BioNTech SE: | | | |
| ADR (a) | | 78,663 | 6,459 |
| rights 8/14/20 (a) | | 41,863 | 0 |
| BioXcel Therapeutics, Inc. (a) | | 70,300 | 3,189 |
| Bridgebio Pharma, Inc. (a)(b) | | 145,096 | 4,083 |
| Cibus Corp.: | | | |
| Series C (a)(c)(d)(e) | | 3,045,600 | 5,093 |
| Series D (a)(c)(d)(e) | | 1,716,640 | 2,146 |
| Coherus BioSciences, Inc. (a)(b) | | 559,224 | 9,837 |
| Crinetics Pharmaceuticals, Inc. (a) | | 319,122 | 4,429 |
| CytomX Therapeutics, Inc. (a)(f) | | 378,621 | 2,654 |
| FibroGen, Inc. (a) | | 427,074 | 17,284 |
| Forma Therapeutics Holdings, Inc. | | 163,146 | 5,704 |
| Fusion Pharmaceuticals, Inc. (a) | | 273,738 | 3,767 |
| Generation Bio Co. | | 85,861 | 1,686 |
| Generation Bio Co. | | 565,648 | 9,998 |
| Global Blood Therapeutics, Inc. (a) | | 899,959 | 60,729 |
| Immunomedics, Inc. (a) | | 196,249 | 8,288 |
| Insmed, Inc. (a) | | 226,434 | 5,914 |
| Intercept Pharmaceuticals, Inc. (a) | | 172,658 | 7,880 |
| Ionis Pharmaceuticals, Inc. (a) | | 150,764 | 8,678 |
| Karuna Therapeutics, Inc. (a) | | 184,335 | 15,079 |
| Mirati Therapeutics, Inc. (a) | | 57,300 | 6,951 |
| Moderna, Inc. (a) | | 358,827 | 26,589 |
| Morphic Holding, Inc. (a) | | 182,004 | 4,097 |
| Myovant Sciences Ltd. (a) | | 766,966 | 11,658 |
| Neurocrine Biosciences, Inc. (a) | | 461,838 | 55,587 |
| Nkarta, Inc. (a)(b) | | 134,474 | 3,463 |
| Principia Biopharma, Inc. (a) | | 187,280 | 15,657 |
| Protagonist Therapeutics, Inc. (a) | | 206,665 | 3,251 |
| Regeneron Pharmaceuticals, Inc. (a) | | 532,911 | 336,837 |
| Relay Therapeutics, Inc. (a) | | 157,300 | 5,578 |
| Revolution Medicines, Inc. | | 343,637 | 8,289 |
| Sage Therapeutics, Inc. (a) | | 555,679 | 25,322 |
| Sarepta Therapeutics, Inc. (a) | | 522,071 | 80,148 |
| Seattle Genetics, Inc. (a) | | 109,626 | 18,228 |
| Turning Point Therapeutics, Inc. (a) | | 536,704 | 31,789 |
| Vaxcyte, Inc. | | 386,624 | 12,144 |
| Viela Bio, Inc. | | 57,486 | 2,105 |
| Xencor, Inc. (a) | | 401,202 | 12,072 |
| Zai Lab Ltd. ADR (a) | | 499,083 | 37,985 |
| | | | 1,243,882 |
| Health Care Equipment & Supplies - 3.2% | | | |
| Atricure, Inc. (a) | | 65,649 | 2,679 |
| Axonics Modulation Technologies, Inc. (a) | | 770,439 | 32,636 |
| Becton, Dickinson & Co. | | 651,728 | 183,357 |
| Danaher Corp. | | 125,659 | 25,609 |
| DexCom, Inc. (a) | | 413,958 | 180,295 |
| Hologic, Inc. (a) | | 632,942 | 44,167 |
| InMode Ltd. (a)(b) | | 459,442 | 14,868 |
| Insulet Corp. (a) | | 336,069 | 68,343 |
| Intuitive Surgical, Inc. (a) | | 402,478 | 275,875 |
| Masimo Corp. (a) | | 194,896 | 42,901 |
| Novocure Ltd. (a) | | 256,650 | 19,452 |
| Quidel Corp. (a)(b) | | 570,546 | 161,162 |
| Shockwave Medical, Inc. (a) | | 847,644 | 41,806 |
| Tandem Diabetes Care, Inc. (a) | | 710,774 | 74,247 |
| West Pharmaceutical Services, Inc. | | 151,561 | 40,750 |
| | | | 1,208,147 |
| Health Care Providers & Services - 1.0% | | | |
| 1Life Healthcare, Inc. (a)(b) | | 650,677 | 19,267 |
| Alignment Healthcare Partners unit (d)(e) | | 289,571 | 4,621 |
| Cigna Corp. | | 125,895 | 21,741 |
| Guardant Health, Inc. (a) | | 403,913 | 34,405 |
| Humana, Inc. | | 262,360 | 102,963 |
| UnitedHealth Group, Inc. | | 682,823 | 206,745 |
| | | | 389,742 |
| Life Sciences Tools & Services - 0.5% | | | |
| 10X Genomics, Inc. (a) | | 268,550 | 26,417 |
| Berkeley Lights, Inc. (a) | | 47,500 | 2,849 |
| Eurofins Scientific SA | | 9,563 | 6,216 |
| Nanostring Technologies, Inc. (a) | | 313,915 | 11,335 |
| Thermo Fisher Scientific, Inc. | | 348,166 | 144,123 |
| | | | 190,940 |
| Pharmaceuticals - 1.6% | | | |
| AstraZeneca PLC sponsored ADR | | 2,661,101 | 148,436 |
| Chiasma, Inc. warrants 12/16/24 (a) | | 55,391 | 49 |
| Eli Lilly & Co. | | 1,060,273 | 159,348 |
| Hansoh Pharmaceutical Group Co. Ltd. (a)(f) | | 2,453,173 | 10,604 |
| Horizon Pharma PLC (a) | | 507,896 | 31,078 |
| Intra-Cellular Therapies, Inc. (a) | | 450,141 | 8,924 |
| MyoKardia, Inc. (a) | | 121,912 | 10,988 |
| Nektar Therapeutics (a) | | 859,654 | 19,050 |
| OptiNose, Inc. (a) | | 892,511 | 4,547 |
| Roche Holding AG (participation certificate) | | 91,607 | 31,729 |
| Royalty Pharma PLC | | 261,033 | 11,237 |
| Zoetis, Inc. Class A | | 979,748 | 148,608 |
| | | | 584,598 |
|
| TOTAL HEALTH CARE | | | 3,617,309 |
|
| INDUSTRIALS - 3.8% | | | |
| Aerospace & Defense - 0.2% | | | |
| Avon Rubber PLC | | 164,272 | 7,139 |
| Axon Enterprise, Inc. (a) | | 238,518 | 19,828 |
| Space Exploration Technologies Corp.: | | | |
| Class A (a)(d)(e) | | 242,545 | 65,487 |
| Class C (a)(d)(e) | | 2,783 | 751 |
| | | | 93,205 |
| Air Freight & Logistics - 0.1% | | | |
| XPO Logistics, Inc. (a) | | 303,673 | 22,782 |
| Airlines - 0.1% | | | |
| Spirit Airlines, Inc. (a)(b) | | 1,320,652 | 20,880 |
| Building Products - 0.0% | | | |
| Fortune Brands Home & Security, Inc. | | 174,983 | 13,386 |
| The AZEK Co., Inc. | | 177,506 | 6,124 |
| | | | 19,510 |
| Commercial Services & Supplies - 0.2% | | | |
| Copart, Inc. (a) | | 384,389 | 35,844 |
| HNI Corp. | | 182,590 | 5,423 |
| HomeServe PLC | | 1,459,432 | 25,370 |
| Knoll, Inc. | | 508,253 | 5,952 |
| Steelcase, Inc. Class A | | 638,274 | 6,849 |
| | | | 79,438 |
| Construction & Engineering - 0.1% | | | |
| Dycom Industries, Inc. (a) | | 896,690 | 38,405 |
| Electrical Equipment - 0.1% | | | |
| Sensata Technologies, Inc. PLC (a) | | 559,414 | 21,247 |
| Machinery - 0.1% | | | |
| Nikola Corp. (a)(b) | | 1,921,612 | 57,648 |
| Professional Services - 0.3% | | | |
| Equifax, Inc. | | 446,838 | 72,638 |
| Manpower, Inc. | | 373,469 | 25,691 |
| | | | 98,329 |
| Road & Rail - 2.6% | | | |
| Knight-Swift Transportation Holdings, Inc. Class A | | 1,218,818 | 53,006 |
| Lyft, Inc. (a)(b) | | 15,210,014 | 444,589 |
| Uber Technologies, Inc. (a) | | 16,054,551 | 485,811 |
| | | | 983,406 |
|
| TOTAL INDUSTRIALS | | | 1,434,850 |
|
| INFORMATION TECHNOLOGY - 38.7% | | | |
| Electronic Equipment & Components - 0.7% | | | |
| Flextronics International Ltd. (a) | | 1,749,215 | 20,098 |
| FLIR Systems, Inc. | | 934,155 | 38,917 |
| II-VI, Inc. (a)(b) | | 3,156,334 | 160,089 |
| Jabil, Inc. | | 1,715,408 | 59,799 |
| | | | 278,903 |
| IT Services - 6.5% | | | |
| Alliance Data Systems Corp. | | 325,002 | 14,417 |
| Endava PLC ADR (a) | | 282,365 | 14,584 |
| MasterCard, Inc. Class A | | 1,727,357 | 532,941 |
| MongoDB, Inc. Class A (a) | | 231,932 | 53,131 |
| PayPal Holdings, Inc. (a) | | 2,211,335 | 433,576 |
| Repay Holdings Corp. (a) | | 627,101 | 13,878 |
| Riskified Ltd. (d)(e) | | 367,600 | 3,497 |
| Riskified Ltd. warrants (a)(d)(e) | | 3,105 | 0 |
| Shopify, Inc. Class A (a) | | 274,613 | 280,831 |
| Square, Inc. (a) | | 627,500 | 81,481 |
| Twilio, Inc. Class A (a) | | 868,717 | 240,999 |
| Visa, Inc. Class A | | 3,716,503 | 707,622 |
| Wix.com Ltd. (a) | | 253,765 | 73,714 |
| | | | 2,450,671 |
| Semiconductors & Semiconductor Equipment - 9.2% | | | |
| Advanced Micro Devices, Inc. (a) | | 3,375,752 | 261,384 |
| Cirrus Logic, Inc. (a) | | 301,775 | 20,681 |
| Enphase Energy, Inc. (a) | | 612,518 | 36,972 |
| Inphi Corp. (a) | | 59,886 | 7,825 |
| Lam Research Corp. | | 63,640 | 24,002 |
| Lattice Semiconductor Corp. (a)(b) | | 675,158 | 20,991 |
| Marvell Technology Group Ltd. | | 26,560,805 | 968,673 |
| MediaTek, Inc. | | 735,000 | 17,548 |
| Micron Technology, Inc. (a) | | 3,464,435 | 173,412 |
| Monolithic Power Systems, Inc. | | 15,000 | 3,975 |
| NVIDIA Corp. | | 3,032,099 | 1,287,399 |
| NXP Semiconductors NV | | 4,091,606 | 480,886 |
| ON Semiconductor Corp. (a) | | 531,100 | 10,941 |
| SolarEdge Technologies, Inc. (a) | | 187,009 | 32,745 |
| STMicroelectronics NV (NY Shares) unit | | 750,367 | 20,965 |
| Synaptics, Inc. (a) | | 176,476 | 14,122 |
| Taiwan Semiconductor Manufacturing Co. Ltd. sponsored ADR | | 271,100 | 21,387 |
| Universal Display Corp. | | 223,210 | 38,939 |
| Xilinx, Inc. | | 326,896 | 35,092 |
| | | | 3,477,939 |
| Software - 12.9% | | | |
| Adobe, Inc. (a) | | 1,169,578 | 519,667 |
| Atom Tickets LLC (a)(c)(d)(e) | | 1,204,239 | 1,614 |
| Avalara, Inc. (a) | | 168,318 | 22,630 |
| Bill.Com Holdings, Inc. (a)(b) | | 361,550 | 33,664 |
| Cloudflare, Inc. (a) | | 1,154,477 | 48,049 |
| Coupa Software, Inc. (a) | | 175,934 | 53,915 |
| Crowdstrike Holdings, Inc. (a) | | 658,594 | 74,553 |
| DocuSign, Inc. (a) | | 255,544 | 55,410 |
| Dynatrace, Inc. | | 352,252 | 14,735 |
| Elastic NV (a) | | 656,870 | 63,184 |
| Epic Games, Inc. (d)(e) | | 6,131 | 3,525 |
| Five9, Inc. (a) | | 165,440 | 19,988 |
| HubSpot, Inc. (a) | | 216,644 | 50,827 |
| Lightspeed POS, Inc. (a) | | 1,275,305 | 36,028 |
| Microsoft Corp. | | 12,463,745 | 2,555,192 |
| Paycom Software, Inc. (a) | | 113,721 | 32,339 |
| Ping Identity Holding Corp. (a) | | 331,478 | 11,390 |
| RingCentral, Inc. (a)(b) | | 265,697 | 77,124 |
| Salesforce.com, Inc. (a) | | 4,224,250 | 823,095 |
| ServiceNow, Inc. (a) | | 298,736 | 131,205 |
| Slack Technologies, Inc. Class A (a)(b) | | 802,900 | 23,726 |
| Smartsheet, Inc. (a) | | 134,526 | 6,422 |
| Snowflake Computing, Inc. Class B (d)(e) | | 22,447 | 870 |
| Tanium, Inc. Class B (a)(d)(e) | | 554,900 | 6,323 |
| The Trade Desk, Inc. (a)(b) | | 251,149 | 113,349 |
| Workday, Inc. Class A (a) | | 135,844 | 24,577 |
| Zoom Video Communications, Inc. Class A (a)(b) | | 166,638 | 42,311 |
| | | | 4,845,712 |
| Technology Hardware, Storage & Peripherals - 9.4% | | | |
| Apple, Inc. | | 8,284,096 | 3,521,072 |
|
| TOTAL INFORMATION TECHNOLOGY | | | 14,574,297 |
|
| MATERIALS - 0.3% | | | |
| Chemicals - 0.2% | | | |
| The Chemours Co. LLC | | 3,850,398 | 71,348 |
| Metals & Mining - 0.1% | | | |
| ArcelorMittal SA Class A unit (a) | | 1,109,147 | 12,167 |
| Barrick Gold Corp. | | 132,500 | 3,831 |
| Lundin Mining Corp. | | 78,667 | 440 |
| MMC Norilsk Nickel PJSC sponsored ADR | | 142,400 | 3,741 |
| | | | 20,179 |
|
| TOTAL MATERIALS | | | 91,527 |
|
| REAL ESTATE - 0.4% | | | |
| Equity Real Estate Investment Trusts (REITs) - 0.2% | | | |
| Ant International Co. Ltd. Class C (a)(d)(e) | | 4,367,660 | 45,686 |
| Douglas Emmett, Inc. | | 287,726 | 8,384 |
| Equinix, Inc. | | 28,568 | 22,440 |
| | | | 76,510 |
| Real Estate Management & Development - 0.2% | | | |
| Redfin Corp. (a)(b) | | 1,795,998 | 74,678 |
|
| TOTAL REAL ESTATE | | | 151,188 |
|
| TOTAL COMMON STOCKS | | | |
| (Cost $15,925,175) | | | 36,944,885 |
|
| Preferred Stocks - 1.9% | | | |
| Convertible Preferred Stocks - 1.8% | | | |
| CONSUMER DISCRETIONARY - 0.3% | | | |
| Automobiles - 0.1% | | | |
| Rivian Automotive, Inc. Series E (d)(e) | | 2,276,313 | 35,260 |
| Hotels, Restaurants & Leisure - 0.1% | | | |
| MOD Super Fast Pizza Holdings LLC: | | | |
| Series 3 (a)(c)(d)(e) | | 68,723 | 9,415 |
| Series 4 (a)(c)(d)(e) | | 6,272 | 878 |
| Series 5 (a)(c)(d)(e) | | 25,187 | 3,590 |
| Topgolf International, Inc. Series F (a)(d)(e) | | 415,730 | 5,271 |
| | | | 19,154 |
| Internet & Direct Marketing Retail - 0.1% | | | |
| Reddit, Inc. Series B (a)(d)(e) | | 524,232 | 26,070 |
| The Honest Co., Inc.: | | | |
| Series C (a)(d)(e) | | 350,333 | 13,540 |
| Series D (a)(d)(e) | | 77,448 | 3,544 |
| Series E (a)(d)(e) | | 551,397 | 10,807 |
| | | | 53,961 |
| Textiles, Apparel & Luxury Goods - 0.0% | | | |
| Allbirds, Inc.: | | | |
| Series A (a)(d)(e) | | 71,465 | 736 |
| Series B (a)(d)(e) | | 12,560 | 129 |
| Series C (a)(d)(e) | | 119,995 | 1,236 |
| Series Seed (a)(d)(e) | | 38,400 | 396 |
| | | | 2,497 |
| TOTAL CONSUMER DISCRETIONARY | | | 110,872 |
| CONSUMER STAPLES - 0.9% | | | |
| Food & Staples Retailing - 0.2% | | | |
| Blink Health LLC Series C (d)(e) | | 89,676 | 3,424 |
| Roofoods Ltd. Series F (a)(d)(e) | | 41,941 | 14,575 |
| Sweetgreen, Inc.: | | | |
| Series C (d)(e) | | 15,004 | 223 |
| Series D (d)(e) | | 241,354 | 3,591 |
| Series H (a)(d)(e) | | 3,242,523 | 48,249 |
| Series I (d)(e) | | 568,842 | 8,464 |
| | | | 78,526 |
| Food Products - 0.0% | | | |
| Agbiome LLC Series C (a)(d)(e) | | 1,091,300 | 6,912 |
| Tobacco - 0.7% | | | |
| JUUL Labs, Inc.: | | | |
| Series C (a)(d)(e) | | 2,570,575 | 258,523 |
| Series D (a)(d)(e) | | 13,822 | 1,390 |
| Series E (a)(d)(e) | | 14,959 | 1,504 |
| | | | 261,417 |
| TOTAL CONSUMER STAPLES | | | 346,855 |
| FINANCIALS - 0.0% | | | |
| Diversified Financial Services - 0.0% | | | |
| Sonder Holdings, Inc. Series D (d)(e) | | 606,719 | 6,532 |
| HEALTH CARE - 0.1% | | | |
| Biotechnology - 0.1% | | | |
| 23andMe, Inc. Series F (a)(d)(e) | | 800,982 | 8,370 |
| Immunocore Ltd. Series A (a)(d)(e) | | 11,275 | 1,758 |
| Nuvation Bio, Inc. Series A (a)(d)(e)(h) | | 8,221,300 | 7,728 |
| | | | 17,856 |
| Health Care Providers & Services - 0.0% | | | |
| Mulberry Health, Inc. Series A-8 (a)(d)(e) | | 2,728,716 | 12,411 |
| Pharmaceuticals - 0.0% | | | |
| Castle Creek Pharmaceutical Holdings, Inc. Series B (a)(d)(e) | | 3,301 | 1,592 |
| TOTAL HEALTH CARE | | | 31,859 |
| INDUSTRIALS - 0.1% | | | |
| Aerospace & Defense - 0.1% | | | |
| Space Exploration Technologies Corp.: | | | |
| Series G (a)(d)(e) | | 97,277 | 26,265 |
| Series H (a)(d)(e) | | 25,767 | 6,957 |
| | | | 33,222 |
| Professional Services - 0.0% | | | |
| YourPeople, Inc. Series C (a)(d)(e) | | 692,196 | 1,322 |
| TOTAL INDUSTRIALS | | | 34,544 |
| INFORMATION TECHNOLOGY - 0.4% | | | |
| Internet Software & Services - 0.1% | | | |
| ContextLogic, Inc. Series G (a)(d)(e) | | 133,922 | 23,416 |
| Starry, Inc.: | | | |
| Series C (a)(d)(e) | | 5,833,836 | 8,342 |
| Series D (a)(d)(e) | | 6,810,656 | 9,739 |
| | | | 41,497 |
| IT Services - 0.0% | | | |
| AppNexus, Inc. Series E (Escrow) (a)(d)(e) | | 646,522 | 20 |
| Riskified Ltd. Series E (d)(e) | | 370,000 | 3,520 |
| | | | 3,540 |
| Software - 0.3% | | | |
| ACV Auctions, Inc. Series E (d)(e) | | 866,184 | 5,128 |
| Bird Rides, Inc.: | | | |
| Series C (a)(d)(e) | | 2,114,013 | 22,028 |
| Series D (d)(e) | | 265,200 | 2,763 |
| Compass, Inc. Series E (a)(d)(e) | | 53,263 | 6,731 |
| Dataminr, Inc. Series D (a)(d)(e) | | 277,250 | 3,050 |
| Delphix Corp. Series D (a)(d)(e) | | 675,445 | 3,431 |
| Jet.Com, Inc. Series B1 (Escrow) (a)(d)(e) | | 2,928,086 | 0 |
| Malwarebytes Corp. Series B (a)(d)(e) | | 1,056,193 | 21,515 |
| Taboola.Com Ltd. Series E (a)(d)(e) | | 634,902 | 21,606 |
| UiPath, Inc.: | | | |
| Series A1 (a)(d)(e) | | 384,849 | 7,156 |
| Series B1 (a)(d)(e) | | 19,170 | 356 |
| Series B2 (a)(d)(e) | | 95,481 | 1,775 |
| | | | 95,539 |
| TOTAL INFORMATION TECHNOLOGY | | | 140,576 |
|
| TOTAL CONVERTIBLE PREFERRED STOCKS | | | 671,238 |
|
| Nonconvertible Preferred Stocks - 0.1% | | | |
| CONSUMER DISCRETIONARY - 0.0% | | | |
| Automobiles - 0.0% | | | |
| Neutron Holdings, Inc.: | | | |
| Series 1C (d)(e) | | 50,654,200 | 1,013 |
| Series 1D (d)(e) | | 85,315,542 | 1,706 |
| Waymo LLC Series A2 (d)(e) | | 81,316 | 6,982 |
| | | | 9,701 |
| HEALTH CARE - 0.1% | | | |
| Health Care Providers & Services - 0.0% | | | |
| Oak Street Health LLC Series III-E (c)(d) | | 31,992 | 8,988 |
| Pharmaceuticals - 0.1% | | | |
| Castle Creek Pharmaceutical Holdings, Inc. Series A4 (a)(d)(e) | | 29,758 | 14,352 |
| TOTAL HEALTH CARE | | | 23,340 |
|
| TOTAL NONCONVERTIBLE PREFERRED STOCKS | | | 33,041 |
|
| TOTAL PREFERRED STOCKS | | | |
| (Cost $396,661) | | | 704,279 |
| | | Principal Amount (000s) | Value (000s) |
|
| Convertible Bonds - 0.0% | | | |
| CONSUMER DISCRETIONARY - 0.0% | | | |
| Automobiles - 0.0% | | | |
| Neutron Holdings, Inc.: | | | |
| 4% 5/22/27 (d)(e) | | 2,433 | 2,433 |
| 4% 6/12/27 (d)(e) | | 647 | 647 |
| TOTAL CONVERTIBLE BONDS | | | |
| (Cost $3,080) | | | 3,080 |
| | | Shares | Value (000s) |
|
| Money Market Funds - 2.2% | | | |
| Fidelity Cash Central Fund 0.14% (i) | | 6,394,040 | 6,396 |
| Fidelity Securities Lending Cash Central Fund 0.13% (i)(j) | | 833,624,055 | 833,707 |
| TOTAL MONEY MARKET FUNDS | | | |
| (Cost $840,103) | | | 840,103 |
| TOTAL INVESTMENT IN SECURITIES - 102.2% | | | |
| (Cost $17,165,019) | | | 38,492,347 |
| NET OTHER ASSETS (LIABILITIES) - (2.2)% | | | (845,062) |
| NET ASSETS - 100% | | | $37,647,285 |
Values shown as $0 in the Schedule of Investments may reflect amounts less than $500.
Legend
(a) Non-income producing
(b) Security or a portion of the security is on loan at period end.
(c) Investment is owned by a wholly-owned subsidiary (Subsidiary) that is treated as a corporation for U.S. tax purposes.
(d) Restricted securities (including private placements) - Investment in securities not registered under the Securities Act of 1933 (excluding 144A issues). At the end of the period, the value of restricted securities (excluding 144A issues) amounted to $885,758,000 or 2.4% of net assets.
(e) Level 3 security
(f) Security exempt from registration under Rule 144A of the Securities Act of 1933. These securities may be resold in transactions exempt from registration, normally to qualified institutional buyers. At the end of the period, the value of these securities amounted to $78,978,000 or 0.2% of net assets.
(g) Affiliated company
(h) Security or a portion of the security purchased on a delayed delivery or when-issued basis.
(i) Affiliated fund that is generally available only to investment companies and other accounts managed by Fidelity Investments. The rate quoted is the annualized seven-day yield of the fund at period end. A complete unaudited listing of the fund's holdings as of its most recent quarter end is available upon request. In addition, each Fidelity Central Fund's financial statements, which are not covered by the Fund's Report of Independent Registered Public Accounting Firm, are available on the SEC's website or upon request.
(j) Investment made with cash collateral received from securities on loan.
Additional information on each restricted holding is as follows:
| Security | Acquisition Date | Acquisition Cost (000s) |
| 23andMe, Inc. Series F | 8/31/17 | $11,121 |
| ACV Auctions, Inc. Series E | 11/6/19 | $4,790 |
| Agbiome LLC Series C | 6/29/18 | $6,912 |
| Alignment Healthcare Partners unit | 2/28/20 | $3,509 |
| Allbirds, Inc. | 10/9/18 | $1,986 |
| Allbirds, Inc. Series A | 10/9/18 | $784 |
| Allbirds, Inc. Series B | 10/9/18 | $138 |
| Allbirds, Inc. Series C | 10/9/18 | $1,316 |
| Allbirds, Inc. Series Seed | 10/9/18 | $421 |
| Ant International Co. Ltd. Class C | 5/16/18 | $24,503 |
| AppNexus, Inc. Series E (Escrow) | 8/1/14 | $0 |
| Atom Tickets LLC | 8/15/17 | $7,000 |
| Bird Rides, Inc. Series C | 12/21/18 | $24,830 |
| Bird Rides, Inc. Series D | 9/30/19 | $3,426 |
| Blink Health LLC Series C | 11/7/19 | $3,423 |
| Castle Creek Pharmaceutical Holdings, Inc. Series A4 | 9/29/16 | $9,831 |
| Castle Creek Pharmaceutical Holdings, Inc. Series B | 10/9/18 | $1,360 |
| Cibus Corp. Series C | 2/16/18 | $6,396 |
| Cibus Corp. Series D | 5/10/19 | $2,146 |
| Compass, Inc. Series E | 11/3/17 | $3,594 |
| ContextLogic, Inc. Series G | 10/24/17 | $18,017 |
| Dataminr, Inc. Series D | 3/6/15 | $3,535 |
| Delphix Corp. Series D | 7/10/15 | $6,079 |
| Epic Games, Inc. | 7/30/20 | $3,525 |
| Immunocore Ltd. Series A | 7/27/15 | $2,122 |
| Jet.Com, Inc. Series B1 (Escrow) | 3/19/18 | $0 |
| JUUL Labs, Inc. | 11/21/17 | $0 |
| JUUL Labs, Inc. Class A | 12/20/17 - 7/16/18 | $453 |
| JUUL Labs, Inc. Series C | 5/22/15 - 7/6/18 | $0 |
| JUUL Labs, Inc. Series D | 6/25/18 - 7/6/18 | $0 |
| JUUL Labs, Inc. Series E | 12/20/17 - 7/6/18 | $321 |
| Malwarebytes Corp. Series B | 12/21/15 | $10,958 |
| MOD Super Fast Pizza Holdings LLC Series 3 | 11/3/16 | $9,415 |
| MOD Super Fast Pizza Holdings LLC Series 4 | 12/14/17 | $878 |
| MOD Super Fast Pizza Holdings LLC Series 5 | 5/15/19 | $ 3,590 |
| Mulberry Health, Inc. Series A-8 | 1/20/16 | $18,432 |
| Neutron Holdings, Inc. Series 1C | 7/3/18 | $9,262 |
| Neutron Holdings, Inc. Series 1D | 1/25/19 | $20,689 |
| Neutron Holdings, Inc. 4% 5/22/27 | 6/4/20 | $2,433 |
| Neutron Holdings, Inc. 4% 6/12/27 | 6/12/20 | $647 |
| Nuvation Bio, Inc. Series A | 6/17/19 | $6,342 |
| Oak Street Health LLC Series III-E | 2/21/20 | $5,000 |
| Reddit, Inc. Series B | 7/26/17 | $7,442 |
| Riskified Ltd. | 12/20/19 - 4/15/20 | $3,324 |
| Riskified Ltd. Series E | 10/28/19 | $3,520 |
| Riskified Ltd. warrants | 10/28/19 | $0 |
| Rivian Automotive, Inc. Series E | 7/10/20 | $35,260 |
| Roofoods Ltd. Series F | 9/12/17 | $14,829 |
| Snowflake Computing, Inc. Class B | 3/19/20 | $871 |
| Sonder Holdings, Inc. Series D | 12/20/19 | $6,368 |
| Space Exploration Technologies Corp. Class A | 10/16/15 - 9/11/17 | $23,515 |
| Space Exploration Technologies Corp. Class C | 9/11/17 | $376 |
| Space Exploration Technologies Corp. Series G | 1/20/15 | $7,535 |
| Space Exploration Technologies Corp. Series H | 8/4/17 | $3,479 |
| Starry, Inc. Series C | 12/8/17 | $5,379 |
| Starry, Inc. Series D | 3/6/19 - 7/30/20 | $9,739 |
| Sweetgreen, Inc. Series C | 9/13/19 | $257 |
| Sweetgreen, Inc. Series D | 9/13/19 | $4,127 |
| Sweetgreen, Inc. Series H | 11/9/18 | $42,282 |
| Sweetgreen, Inc. Series I | 9/13/19 | $9,727 |
| Taboola.Com Ltd. Series E | 12/22/14 | $6,619 |
| Tanium, Inc. Class B | 4/21/17 | $2,755 |
| The Honest Co., Inc. | 8/21/14 | $4,062 |
| The Honest Co., Inc. Series C | 8/21/14 | $9,479 |
| The Honest Co., Inc. Series D | 8/3/15 | $3,544 |
| The Honest Co., Inc. Series E | 9/28/17 | $10,810 |
| Topgolf International, Inc. Series F | 11/10/17 | $5,751 |
| Tory Burch LLC | 5/14/15 | $20,890 |
| UiPath, Inc. Series A1 | 6/14/19 | $5,048 |
| UiPath, Inc. Series B1 | 6/14/19 | $251 |
| UiPath, Inc. Series B2 | 6/14/19 | $1,252 |
| Waymo LLC Series A2 | 5/8/20 | $6,982 |
| WME Entertainment Parent, LLC Class A | 4/13/16 - 8/16/16 | $19,025 |
| YourPeople, Inc. Series C | 5/1/15 | $10,314 |
Affiliated Central Funds
Information regarding fiscal year to date income earned by the Fund from investments in Fidelity Central Funds is as follows:
| Fund | Income earned |
| | (Amounts in thousands) |
| Fidelity Cash Central Fund | $107 |
| Fidelity Securities Lending Cash Central Fund | 12,694 |
| Total | $12,801 |
Amounts in the income column in the above table include any capital gain distributions from underlying funds, which are presented in the corresponding line-item in the Statement of Operations, if applicable. Amount for Fidelity Securities Lending Cash Central Fund represents the income earned on investing cash collateral, less rebates paid to borrowers and any lending agent fees associated with the loan, plus any premium payments received for lending certain types of securities.
Other Affiliated Issuers
An affiliated company is a company in which the Fund has ownership of at least 5% of the voting securities. Fiscal year to date transactions with companies which are or were affiliates are as follows:
| Affiliate (Amounts in thousands) | Value, beginning of period | Purchases | Sales Proceeds(a) | Dividend Income | Realized Gain (loss) | Change in Unrealized appreciation (depreciation) | Value, end of period |
| Insurance Acquisition Corp. Class A | $-- | $15,191 | $19 | $-- | $-- | $(1,939) | $13,233 |
| Total | $-- | $15,191 | $19 | $-- | $-- | $(1,939) | $13,233 |
(a) Includes the value of securities delivered through in-kind transactions, if applicable.
Investment Valuation
The following is a summary of the inputs used, as of July 31, 2020, involving the Fund's assets and liabilities carried at fair value. The inputs or methodology used for valuing securities may not be an indication of the risk associated with investing in those securities. For more information on valuation inputs, and their aggregation into the levels used below, please refer to the Investment Valuation section in the accompanying Notes to Financial Statements.
| | Valuation Inputs at Reporting Date: |
| Description | Total | Level 1 | Level 2 | Level 3 |
| (Amounts in thousands) | | | | |
| Investments in Securities: | | | | |
| Equities: | | | | |
| Communication Services | $5,360,635 | $5,099,206 | $246,272 | $15,157 |
| Consumer Discretionary | 10,467,510 | 10,281,482 | 44,619 | 141,409 |
| Consumer Staples | 1,133,715 | 758,190 | 25,877 | 349,648 |
| Energy | 240,077 | 240,077 | -- | -- |
| Financials | 347,737 | 323,212 | 17,993 | 6,532 |
| Health Care | 3,672,508 | 3,563,673 | 50,764 | 58,071 |
| Industrials | 1,469,394 | 1,368,612 | -- | 100,782 |
| Information Technology | 14,714,873 | 14,558,468 | -- | 156,405 |
| Materials | 91,527 | 91,527 | -- | -- |
| Real Estate | 151,188 | 105,502 | -- | 45,686 |
| Corporate Bonds | 3,080 | -- | -- | 3,080 |
| Money Market Funds | 840,103 | 840,103 | -- | -- |
| Total Investments in Securities: | $38,492,347 | $37,230,052 | $385,525 | $876,770 |
The following is a reconciliation of Investments in Securities for which Level 3 inputs were used in determining value:
| (Amounts in thousands) | |
| Investments in Securities: | |
| Equities - Consumer Staples | |
| Beginning Balance | $833,380 |
| Net Realized Gain (Loss) on Investment Securities | 11,992 |
| Net Unrealized Gain (Loss) on Investment Securities | (501,266) |
| Cost of Purchases | 17,534 |
| Proceeds of Sales | (11,992) |
| Amortization/Accretion | -- |
| Transfers into Level 3 | -- |
| Transfers out of Level 3 | -- |
| Ending Balance | $349,648 |
| The change in unrealized gain (loss) for the period attributable to Level 3 securities held at July 31, 2020 | $(501,266) |
| Other Investments in Securities | |
| Beginning Balance | $534,410 |
| Net Realized Gain (Loss) on Investment Securities | (12) |
| Net Unrealized Gain (Loss) on Investment Securities | (10,405) |
| Cost of Purchases | 72,046 |
| Proceeds of Sales | (1,207) |
| Amortization/Accretion | -- |
| Transfers into Level 3 | 39,341 |
| Transfers out of Level 3 | (107,051) |
| Ending Balance | $527,122 |
| The change in unrealized gain (loss) for the period attributable to Level 3 securities held at July 31, 2020 | $(10,405) |
The information used in the above reconciliations represents fiscal year to date activity for any Investments in Securities identified as using Level 3 inputs at either the beginning or the end of the current fiscal period. Cost of purchases and proceeds of sales may include securities received and/or delivered through in-kind transactions. Transfers in or out of Level 3 represent the beginning value of any Security or Instrument where a change in the pricing level occurred from the beginning to the end of the period. The cost of purchases and the proceeds of sales may include securities received or delivered through corporate actions or exchanges. Realized and unrealized gains (losses) disclosed in the reconciliations are included in Net Gain (Loss) on the Fund's Statement of Operations.
Other Information
Distribution of investments by country or territory of incorporation, as a percentage of Total Net Assets, is as follows (Unaudited):
| United States of America | 87.6% |
| Cayman Islands | 3.4% |
| Bermuda | 2.6% |
| Netherlands | 1.8% |
| United Kingdom | 1.0% |
| Others (Individually Less Than 1%) | 3.6% |
| | 100.0% |
See accompanying notes which are an integral part of the financial statements.
Financial Statements
Statement of Assets and Liabilities
| Amounts in thousands (except per-share amounts) | | July 31, 2020 |
| Assets | | |
Investment in securities, at value (including securities loaned of $810,721) — See accompanying schedule:
Unaffiliated issuers (cost $16,309,744) | $37,639,011 | |
| Fidelity Central Funds (cost $840,103) | 840,103 | |
| Other affiliated issuers (cost $15,172) | 13,233 | |
| Total Investment in Securities (cost $17,165,019) | | $38,492,347 |
| Cash | | 586 |
| Restricted cash | | 529 |
| Receivable for investments sold | | 452,294 |
| Receivable for fund shares sold | | 44,629 |
| Dividends receivable | | 7,900 |
| Interest receivable | | 19 |
| Distributions receivable from Fidelity Central Funds | | 1,109 |
| Prepaid expenses | | 10 |
| Other receivables | | 1,429 |
| Total assets | | 39,000,852 |
| Liabilities | | |
| Payable for investments purchased | | |
| Regular delivery | $448,718 | |
| Delayed delivery | 3,171 | |
| Payable for fund shares redeemed | 36,185 | |
| Accrued management fee | 20,643 | |
| Other affiliated payables | 3,442 | |
| Other payables and accrued expenses | 7,738 | |
| Collateral on securities loaned | 833,670 | |
| Total liabilities | | 1,353,567 |
| Net Assets | | $37,647,285 |
| Net Assets consist of: | | |
| Paid in capital | | $14,828,896 |
| Total accumulated earnings (loss) | | 22,818,389 |
| Net Assets | | $37,647,285 |
| Net Asset Value and Maximum Offering Price | | |
| Blue Chip Growth: | | |
| Net Asset Value, offering price and redemption price per share ($31,022,638 ÷ 224,607 shares) | | $138.12 |
| Class K: | | |
| Net Asset Value, offering price and redemption price per share ($6,624,647 ÷ 47,830 shares) | | $138.50 |
See accompanying notes which are an integral part of the financial statements.
Statement of Operations
| Amounts in thousands | | Year ended July 31, 2020 |
| Investment Income | | |
| Dividends | | $170,365 |
| Interest | | 19 |
| Income from Fidelity Central Funds (including $12,694 from security lending) | | 12,801 |
| Total income | | 183,185 |
| Expenses | | |
| Management fee | | |
| Basic fee | $157,200 | |
| Performance adjustment | 31,176 | |
| Transfer agent fees | 34,670 | |
| Accounting fees | 1,986 | |
| Custodian fees and expenses | 386 | |
| Independent trustees' fees and expenses | 180 | |
| Registration fees | 501 | |
| Audit | 127 | |
| Legal | 68 | |
| Interest | 127 | |
| Miscellaneous | 384 | |
| Total expenses before reductions | 226,805 | |
| Expense reductions | (1,243) | |
| Total expenses after reductions | | 225,562 |
| Net investment income (loss) | | (42,377) |
| Realized and Unrealized Gain (Loss) | | |
| Net realized gain (loss) on: | | |
| Investment securities: | | |
| Unaffiliated issuers | 2,023,384 | |
| Redemptions in-kind with affiliated entities | 135,027 | |
| Fidelity Central Funds | 20 | |
| Foreign currency transactions | (148) | |
| Total net realized gain (loss) | | 2,158,283 |
| Change in net unrealized appreciation (depreciation) on: | | |
| Investment securities: | | |
| Unaffiliated issuers (net of increase in deferred foreign taxes of $5,821) | 8,362,413 | |
| Other affiliated issuers | (1,939) | |
| Assets and liabilities in foreign currencies | 133 | |
| Total change in net unrealized appreciation (depreciation) | | 8,360,607 |
| Net gain (loss) | | 10,518,890 |
| Net increase (decrease) in net assets resulting from operations | | $10,476,513 |
See accompanying notes which are an integral part of the financial statements.
Statement of Changes in Net Assets
| Amounts in thousands | Year ended July 31, 2020 | Year ended July 31, 2019 |
| Increase (Decrease) in Net Assets | | |
| Operations | | |
| Net investment income (loss) | $(42,377) | $(5,839) |
| Net realized gain (loss) | 2,158,283 | 1,736,350 |
| Change in net unrealized appreciation (depreciation) | 8,360,607 | 509,431 |
| Net increase (decrease) in net assets resulting from operations | 10,476,513 | 2,239,942 |
| Distributions to shareholders | (1,088,560) | (1,427,021) |
| Share transactions - net increase (decrease) | (79,561) | 1,142,357 |
| Total increase (decrease) in net assets | 9,308,392 | 1,955,278 |
| Net Assets | | |
| Beginning of period | 28,338,893 | 26,383,615 |
| End of period | $37,647,285 | $28,338,893 |
See accompanying notes which are an integral part of the financial statements.
Financial Highlights
Fidelity Blue Chip Growth Fund
| Years ended July 31, | 2020 | 2019 | 2018 | 2017 | 2016 |
| Selected Per–Share Data | | | | | |
| Net asset value, beginning of period | $103.05 | $99.75 | $83.20 | $69.52 | $75.25 |
| Income from Investment Operations | | | | | |
| Net investment income (loss)A | (.17) | (.04) | .11B | .11 | .09 |
| Net realized and unrealized gain (loss) | 39.23 | 8.65 | 20.20 | 16.30 | (2.16) |
| Total from investment operations | 39.06 | 8.61 | 20.31 | 16.41 | (2.07) |
| Distributions from net investment income | – | (.11) | (.08) | (.15) | (.03) |
| Distributions from net realized gain | (3.99) | (5.20) | (3.68) | (2.58) | (3.63) |
| Total distributions | (3.99) | (5.31) | (3.76) | (2.73) | (3.66) |
| Net asset value, end of period | $138.12 | $103.05 | $99.75 | $83.20 | $69.52 |
| Total ReturnC | 39.45% | 9.09% | 25.21% | 24.48% | (2.59)% |
| Ratios to Average Net AssetsD,E | | | | | |
| Expenses before reductions | .79% | .80% | .72% | .70% | .82% |
| Expenses net of fee waivers, if any | .79% | .80% | .72% | .70% | .82% |
| Expenses net of all reductions | .78% | .80% | .72% | .69% | .82% |
| Net investment income (loss) | (.16)% | (.04)% | .12%B | .15% | .13% |
| Supplemental Data | | | | | |
| Net assets, end of period (in millions) | $31,023 | $23,023 | $20,714 | $16,993 | $14,230 |
| Portfolio turnover rateF | 49%G | 45%G | 41%G | 43%G | 50%G |
A Calculated based on average shares outstanding during the period.
B Net investment income per share reflects a large, non-recurring dividend which amounted to $.09 per share. Excluding this non-recurring dividend, the ratio of net investment income (loss) to average net assets would have been .02%.
C Total returns would have been lower if certain expenses had not been reduced during the applicable periods shown.
D Fees and expenses of any underlying mutual funds or exchange-traded funds (ETFs) are not included in the Fund's expense ratio. The Fund indirectly bears its proportionate share of these expenses. For additional expense information related to investments in Fidelity Central Funds, please refer to the "Investments in Fidelity Central Funds" note found in the Notes to Financial Statements section of the most recent Annual or Semi-Annual report.
E Expense ratios reflect operating expenses of the class. Expenses before reductions do not reflect amounts reimbursed by the investment adviser or reductions from brokerage service arrangements or reductions from other expense offset arrangements and do not represent the amount paid by the class during periods when reimbursements or reductions occur. Expenses net of fee waivers reflect expenses after reimbursement by the investment adviser but prior to reductions from brokerage service arrangements or other expense offset arrangements. Expenses net of all reductions represent the net expenses paid by the class.
F Amount does not include the portfolio activity of any underlying Fidelity Central Funds.
G Portfolio turnover rate excludes securities received or delivered in-kind.
See accompanying notes which are an integral part of the financial statements.
Fidelity Blue Chip Growth Fund Class K
| Years ended July 31, | 2020 | 2019 | 2018 | 2017 | 2016 |
| Selected Per–Share Data | | | | | |
| Net asset value, beginning of period | $103.24 | $99.92 | $83.34 | $69.67 | $75.36 |
| Income from Investment Operations | | | | | |
| Net investment income (loss)A | (.08) | .05 | .20B | .19 | .16 |
| Net realized and unrealized gain (loss) | 39.33 | 8.66 | 20.22 | 16.32 | (2.15) |
| Total from investment operations | 39.25 | 8.71 | 20.42 | 16.51 | (1.99) |
| Distributions from net investment income | – | (.19) | (.16) | (.27) | (.07) |
| Distributions from net realized gain | (3.99) | (5.20) | (3.68) | (2.58) | (3.63) |
| Total distributions | (3.99) | (5.39) | (3.84) | (2.84)C | (3.70) |
| Net asset value, end of period | $138.50 | $103.24 | $99.92 | $83.34 | $69.67 |
| Total ReturnD | 39.57% | 9.20% | 25.33% | 24.63% | (2.47)% |
| Ratios to Average Net AssetsE,F | | | | | |
| Expenses before reductions | .70% | .70% | .62% | .59% | .70% |
| Expenses net of fee waivers, if any | .69% | .70% | .62% | .59% | .70% |
| Expenses net of all reductions | .69% | .70% | .62% | .58% | .70% |
| Net investment income (loss) | (.07)% | .05% | .22%B | .26% | .25% |
| Supplemental Data | | | | | |
| Net assets, end of period (in millions) | $6,625 | $5,316 | $5,669 | $5,665 | $5,158 |
| Portfolio turnover rateG | 49%H | 45%H | 41%H | 43%H | 50%H |
A Calculated based on average shares outstanding during the period.
B Net investment income per share reflects a large, non-recurring dividend which amounted to $.09 per share. Excluding this non-recurring dividend, the ratio of net investment income (loss) to average net assets would have been .12%.
C Total distributions of $2.84 per share is comprised of distributions from net investment income of $.267 and distributions from net realized gain of $2.576 per share.
D Total returns would have been lower if certain expenses had not been reduced during the applicable periods shown.
E Fees and expenses of any underlying mutual funds or exchange-traded funds (ETFs) are not included in the Fund's expense ratio. The Fund indirectly bears its proportionate share of these expenses. For additional expense information related to investments in Fidelity Central Funds, please refer to the "Investments in Fidelity Central Funds" note found in the Notes to Financial Statements section of the most recent Annual or Semi-Annual report.
F Expense ratios reflect operating expenses of the class. Expenses before reductions do not reflect amounts reimbursed by the investment adviser or reductions from brokerage service arrangements or reductions from other expense offset arrangements and do not represent the amount paid by the class during periods when reimbursements or reductions occur. Expenses net of fee waivers reflect expenses after reimbursement by the investment adviser but prior to reductions from brokerage service arrangements or other expense offset arrangements. Expenses net of all reductions represent the net expenses paid by the class.
G Amount does not include the portfolio activity of any underlying Fidelity Central Funds.
H Portfolio turnover rate excludes securities received or delivered in-kind.
See accompanying notes which are an integral part of the financial statements.
Notes to Financial Statements
For the period ended July 31, 2020
(Amounts in thousands except percentages)
1. Organization.
Fidelity Blue Chip Growth Fund (the Fund) is a fund of Fidelity Securities Fund (the Trust) and is authorized to issue an unlimited number of shares. The Trust is registered under the Investment Company Act of 1940, as amended (the 1940 Act), as an open-end management investment company organized as a Massachusetts business trust. The Fund offers Blue Chip Growth and Class K shares, each of which has equal rights as to assets and voting privileges. Each class has exclusive voting rights with respect to matters that affect that class.
Effective January 1, 2020:
Investment advisers Fidelity Investments Money Management, Inc., FMR Co., Inc., and Fidelity SelectCo, LLC, merged with and into Fidelity Management & Research Company. In connection with the merger transactions, the resulting, merged investment adviser was then redomiciled from Massachusetts to Delaware, changed its corporate structure from a corporation to a limited liability company, and changed its name to "Fidelity Management & Research Company LLC".
Fidelity Investments Institutional Operations Company, Inc. converted from a Massachusetts corporation to a Massachusetts LLC, and changed its name to "Fidelity Investments Institutional Operations Company LLC".
2. Investments in Fidelity Central Funds.
The Fund invests in Fidelity Central Funds, which are open-end investment companies generally available only to other investment companies and accounts managed by the investment adviser and its affiliates. The Fund's Schedule of Investments lists each of the Fidelity Central Funds held as of period end, if any, as an investment of the Fund, but does not include the underlying holdings of each Fidelity Central Fund. As an Investing Fund, the Fund indirectly bears its proportionate share of the expenses of the underlying Fidelity Central Funds.
The Money Market Central Funds seek preservation of capital and current income and are managed by the investment adviser. Annualized expenses of the Money Market Central Funds as of their most recent shareholder report date ranged from less than .005% to .01%.
A complete unaudited list of holdings for each Fidelity Central Fund is available upon request or at the Securities and Exchange Commission (the SEC) website at www.sec.gov. In addition, the financial statements of the Fidelity Central Funds, which are not covered by the Fund's Report of Independent Registered Public Accounting Firm, are available on the SEC website or upon request.
3. Significant Accounting Policies.
The Fund is an investment company and applies the accounting and reporting guidance of the Financial Accounting Standards Board (FASB) Accounting Standards Codification Topic 946 Financial Services – Investment Companies. The financial statements have been prepared in conformity with accounting principles generally accepted in the United States of America (GAAP), which require management to make certain estimates and assumptions at the date of the financial statements. Actual results could differ from those estimates. Subsequent events, if any, through the date that the financial statements were issued have been evaluated in the preparation of the financial statements. The following summarizes the significant accounting policies of the Fund:
Investment Valuation. Investments are valued as of 4:00 p.m. Eastern time on the last calendar day of the period. The Board of Trustees (the Board) has delegated the day to day responsibility for the valuation of the Fund's investments to the Fair Value Committee (the Committee) established by the Fund's investment adviser. In accordance with valuation policies and procedures approved by the Board, the Fund attempts to obtain prices from one or more third party pricing vendors or brokers to value its investments. When current market prices, quotations or currency exchange rates are not readily available or reliable, investments will be fair valued in good faith by the Committee, in accordance with procedures adopted by the Board. Factors used in determining fair value vary by investment type and may include market or investment specific events, changes in interest rates and credit quality. The frequency with which these procedures are used cannot be predicted and they may be utilized to a significant extent. The Committee oversees the Fund's valuation policies and procedures and reports to the Board on the Committee's activities and fair value determinations. The Board monitors the appropriateness of the procedures used in valuing the Fund's investments and ratifies the fair value determinations of the Committee.
The Fund categorizes the inputs to valuation techniques used to value its investments into a disclosure hierarchy consisting of three levels as shown below:
- Level 1 – quoted prices in active markets for identical investments
- Level 2 – other significant observable inputs (including quoted prices for similar investments, interest rates, prepayment speeds, etc.)
- Level 3 – unobservable inputs (including the Fund's own assumptions based on the best information available)
Valuation techniques used to value the Fund's investments by major category are as follows:
Equity securities, including restricted securities, for which market quotations are readily available, are valued at the last reported sale price or official closing price as reported by a third party pricing vendor on the primary market or exchange on which they are traded and are categorized as Level 1 in the hierarchy. In the event there were no sales during the day or closing prices are not available, securities are valued at the last quoted bid price or may be valued using the last available price and are generally categorized as Level 2 in the hierarchy. For foreign equity securities, when market or security specific events arise, comparisons to the valuation of American Depositary Receipts (ADRs), futures contracts, Exchange-Traded Funds (ETFs) and certain indexes as well as quoted prices for similar securities may be used and would be categorized as Level 2 in the hierarchy. For equity securities, including restricted securities, where observable inputs are limited, assumptions about market activity and risk are used and these securities may be categorized as Level 3 in the hierarchy. Securities, including private placements or other restricted securities, for which observable inputs are not available are valued using alternate valuation approaches, including the market approach, the income approach and cost approach, and are categorized as Level 3 in the hierarchy. The market approach considers factors including the price of recent investments in the same or a similar security or financial metrics of comparable securities. The income approach considers factors including expected future cash flows, security specific risks and corresponding discount rates. The cost approach considers factors including the value of the security's underlying assets and liabilities.
Debt securities, including restricted securities, are valued based on evaluated prices received from third party pricing vendors or from brokers who make markets in such securities. Corporate bonds are valued by pricing vendors who utilize matrix pricing which considers yield or price of bonds of comparable quality, coupon, maturity and type or by broker-supplied prices. When independent prices are unavailable or unreliable, debt securities may be valued utilizing pricing methodologies which consider similar factors that would be used by third party pricing vendors. Debt securities are generally categorized as Level 2 in the hierarchy but may be Level 3 depending on the circumstances.
Investments in open-end mutual funds, including the Fidelity Central Funds, are valued at their closing net asset value (NAV) each business day and are categorized as Level 1 in the hierarchy.
The following provides information on Level 3 securities held by the Fund that were valued at period end based on unobservable inputs. These amounts exclude valuations provided by a broker.
| Asset Type | Fair Value | Valuation Technique(s) | Unobservable Input | Amount or Range/Weighted Average | Impact to Valuation from an Increase in Input(a) |
| Equities | $873,690 | Market approach | Transaction price | $0.02 - $575.00 / $123.38 | Increase |
| | | Recovery value | Recovery value | 0.0% | Increase |
| | | Market comparable | Transaction price | $0.77 - $411.85 / $155.53 | Increase |
| | | | Enterprise value/EBITDA multiple (EV/EBITDA) | 11.8 | Increase |
| | | | Discount rate | 0.8% - 75.0% / 18.3% | Decrease |
| | | | Enterprise value/Sales multiple (EV/S) | 1.2 - 20.1 / 6.3 | Increase |
| | | | Discount for lack of marketability | 10.0% - 20.0% / 10.9% | Decrease |
| | | | Premium rate | 5.7% - 172.9% / 67.5% | Increase |
| | | | Liquidity preference | $19.60 - $142.52 / $96.64 | Increase |
| | | | Conversion ratio | 1.0 | Increase |
| Corporate Bonds | $3,080 | Market approach | Transaction price | $100.00 | Increase |
(a) Represents the directional change in the fair value of the Level 3 investments that could have resulted from an increase in the corresponding input as of period end. A decrease to the unobservable input would have had the opposite effect. Significant changes in these inputs may have resulted in a significantly higher or lower fair value measurement at period end.
Changes in valuation techniques may result in transfers in or out of an assigned level within the disclosure hierarchy. The aggregate value of investments by input level as of July 31, 2020, as well as a roll forward of Level 3 investments, is included at the end of the Fund's Schedule of Investments.
Foreign Currency. The Fund may use foreign currency contracts to facilitate transactions in foreign-denominated securities. Gains and losses from these transactions may arise from changes in the value of the foreign currency or if the counterparties do not perform under the contracts' terms.
Foreign-denominated assets, including investment securities, and liabilities are translated into U.S. dollars at the exchange rates at period end. Purchases and sales of investment securities, income and dividends received and expenses denominated in foreign currencies are translated into U.S. dollars at the exchange rate in effect on the transaction date.
The effects of exchange rate fluctuations on investments are included with the net realized and unrealized gain (loss) on investment securities. Other foreign currency transactions resulting in realized and unrealized gain (loss) are disclosed separately.
Investment Transactions and Income. For financial reporting purposes, the Fund's investment holdings and NAV include trades executed through the end of the last business day of the period. The NAV per share for processing shareholder transactions is calculated as of the close of business of the New York Stock Exchange (NYSE), normally 4:00 p.m. Eastern time and includes trades executed through the end of the prior business day. Gains and losses on securities sold are determined on the basis of identified cost and include proceeds received from litigation. Dividend income is recorded on the ex-dividend date, except for certain dividends from foreign securities where the ex-dividend date may have passed, which are recorded as soon as the Fund is informed of the ex-dividend date. Non-cash dividends included in dividend income, if any, are recorded at the fair market value of the securities received. Income and capital gain distributions from Fidelity Central Funds, if any, are recorded on the ex-dividend date. Certain distributions received by the Fund represent a return of capital or capital gain. The Fund determines the components of these distributions subsequent to the ex-dividend date, based upon receipt of tax filings or other correspondence relating to the underlying investment. These distributions are recorded as a reduction of cost of investments and/or as a realized gain. Interest income is accrued as earned and includes coupon interest and amortization of premium and accretion of discount on debt securities as applicable. Investment income is recorded net of foreign taxes withheld where recovery of such taxes is uncertain.
Class Allocations and Expenses. Investment income, realized and unrealized capital gains and losses, common expenses of the Fund, and certain fund-level expense reductions, if any, are allocated daily on a pro-rata basis to each class based on the relative net assets of each class to the total net assets of the Fund. Each class differs with respect to transfer agent fees incurred. Certain expense reductions may also differ by class. For the reporting period, the allocated portion of income and expenses to each class as a percent of its average net assets may vary due to the timing of recording these transactions in relation to fluctuating net assets of the classes. Expenses directly attributable to a fund are charged to that fund. Expenses attributable to more than one fund are allocated among the respective funds on the basis of relative net assets or other appropriate methods. Expense estimates are accrued in the period to which they relate and adjustments are made when actual amounts are known.
Deferred Trustee Compensation. Under a Deferred Compensation Plan (the Plan) for the Fund, certain independent Trustees have elected to defer receipt of a portion of their annual compensation. Deferred amounts are invested in a cross-section of Fidelity funds, are marked-to-market and remain in the Fund until distributed in accordance with the Plan. The investment of deferred amounts and the offsetting payable to the Trustees of $1,093 are included in the accompanying Statement of Assets and Liabilities in other receivables and other payables and accrued expenses, respectively.
Income Tax Information and Distributions to Shareholders. Each year, the Fund intends to qualify as a regulated investment company under Subchapter M of the Internal Revenue Code, including distributing substantially all of its taxable income and realized gains. As a result, no provision for U.S. Federal income taxes is required. As of July 31, 2020, the Fund did not have any unrecognized tax benefits in the financial statements; nor is the Fund aware of any tax positions for which it is reasonably possible that the total amounts of unrecognized tax benefits will significantly change in the next twelve months. The Fund files a U.S. federal tax return, in addition to state and local tax returns as required. The Fund's federal income tax returns are subject to examination by the Internal Revenue Service (IRS) for a period of three fiscal years after they are filed. State and local tax returns may be subject to examination for an additional fiscal year depending on the jurisdiction. Foreign taxes are provided for based on the Fund's understanding of the tax rules and rates that exist in the foreign markets in which it invests. The Fund is subject to a tax imposed on capital gains by certain countries in which it invests. An estimated deferred tax liability for net unrealized appreciation on the applicable securities is included in Other payables and accrued expenses on the Statement of Assets & Liabilities.
Distributions are declared and recorded on the ex-dividend date. Income and capital gain distributions are declared separately for each class. Income and capital gain distributions are determined in accordance with income tax regulations, which may differ from GAAP. In addition, the Fund claimed a portion of the payment made to redeeming shareholders as a distribution for income tax purposes.
Capital accounts within the financial statements are adjusted for permanent book-tax differences. These adjustments have no impact on net assets or the results of operations. Capital accounts are not adjusted for temporary book-tax differences which will reverse in a subsequent period.
Book-tax differences are primarily due to foreign currency transactions, passive foreign investment companies (PFIC), redemptions in kind, partnerships, deferred trustees compensation and losses deferred due to wash sales and excise tax regulations.
As of period end, the cost and unrealized appreciation (depreciation) in securities, and derivatives if applicable, for federal income tax purposes were as follows:
| Gross unrealized appreciation | $21,782,807 |
| Gross unrealized depreciation | (548,679) |
| Net unrealized appreciation (depreciation) | $21,234,128 |
| Tax Cost | $17,258,219 |
The tax-based components of distributable earnings as of period end were as follows:
| Undistributed long-term capital gain | $1,618,571 |
| Net unrealized appreciation (depreciation) on securities and other investments | $21,234,201 |
The Fund intends to elect to defer to its next fiscal year $27,469 of ordinary losses recognized during the period January 1, 2020 to July 31, 2020.
The tax character of distributions paid was as follows:
| | July 31, 2020 | July 31, 2019 |
| Ordinary Income | $– | $ 33,263 |
| Long-term Capital Gains | 1,088,560 | 1,393,758 |
| Total | $1,088,560 | $ 1,427,021 |
Delayed Delivery Transactions and When-Issued Securities. During the period, the Fund transacted in securities on a delayed delivery or when-issued basis. Payment and delivery may take place after the customary settlement period for that security. The price of the underlying securities and the date when the securities will be delivered and paid for are fixed at the time the transaction is negotiated. The securities purchased on a delayed delivery or when-issued basis are identified as such in the Fund's Schedule of Investments. Losses may arise due to changes in the value of the underlying securities or if the counterparty does not perform under the contract's terms, or if the issuer does not issue the securities due to political, economic, or other factors.
Restricted Securities (including Private Placements). The Fund may invest in securities that are subject to legal or contractual restrictions on resale. These securities generally may be resold in transactions exempt from registration or to the public if the securities are registered. Disposal of these securities may involve time-consuming negotiations and expense, and prompt sale at an acceptable price may be difficult. Information regarding restricted securities is included at the end of the Fund's Schedule of Investments.
Consolidated Subsidiary. The Fund invests in certain investments through a wholly-owned subsidiary ("Subsidiary"), which may be subject to federal and state taxes upon disposition.
As of period end, the Fund held an investment of $63,896 in these Subsidiaries, representing .17% of the Fund's net assets. The financial statements have been consolidated and include accounts of the Fund and each Subsidiary. Accordingly, all inter-company transactions and balances have been eliminated.
Any cash held by the Subsidiaries is restricted as to its use and is presented as Restricted cash in the Statement of Assets and Liabilities.
4. Purchases and Sales of Investments.
Purchases and sales of securities, other than short-term securities and in-kind transactions, are noted in the table below.
| | Purchases ($) | Sales ($) |
| Fidelity Blue Chip Growth Fund | 14,643,430 | 15,382,835 |
Unaffiliated Redemptions In-Kind. During the period, 1,998 shares of the Fund were redeemed in-kind for investments and cash with a value of $233,639. The net realized gain of $153,466 on investments delivered through in-kind redemptions is included in the accompanying Statement of Operations. The amount of the in-kind redemptions is included in share transactions in the accompanying Statement of Changes in Net Assets as well as the Notes to Financial Statements. The Fund recognized no gain or loss for federal income tax purposes.
Prior Fiscal Year Unaffiliated Redemptions In-Kind. During the period, shares of the Fidelity Blue Chip Growth Fund were redeemed in-kind for investments. The amount of the in-kind redemptions is included in share transactions in the accompanying Statement of Changes in Net Assets. For additional information of the Fidelity Blue Chip Growth Fund in-kind transactions, please refer to the Fidelity Blue Chip Growth Fund prior annual shareholder report.
5. Fees and Other Transactions with Affiliates.
Management Fee. Fidelity Management & Research Company LLC (the investment adviser) and its affiliates provide the Fund with investment management related services for which the Fund pays a monthly management fee. The management fee is the sum of an individual fund fee rate that is based on an annual rate of .30% of the Fund's average net assets and an annualized group fee rate that averaged .23% during the period. The group fee rate is based upon the monthly average net assets of a group of registered investment companies with which the investment adviser has management contracts. The group fee rate decreases as assets under management increase and increases as assets under management decrease. In addition, the management fee is subject to a performance adjustment (up to a maximum of +/- .20% of the Fund's average net assets over a 36 month performance period). The upward or downward adjustment to the management fee is based on the relative investment performance of Blue Chip Growth as compared to its benchmark index, the Russell 1000 Growth Index, over the same 36 month performance period. For the reporting period, the total annual management fee rate, including the performance adjustment, was .64% of the Fund's average net assets. The performance adjustment included in the management fee rate may be higher or lower than the maximum performance adjustment rate due to the difference between the average net assets for the reporting and performance periods.
Transfer Agent Fees. Fidelity Investments Institutional Operations Company LLC (FIIOC), an affiliate of the investment adviser, is the transfer, dividend disbursing and shareholder servicing agent for each class of the Fund. FIIOC receives account fees and asset-based fees that vary according to the account size and type of account of the shareholders of Blue Chip Growth, except for Class K. FIIOC receives an asset-based fee of Class K's average net assets. FIIOC pays for typesetting, printing and mailing of shareholder reports, except proxy statements. Effective February 1, 2020, the Board approved to change the fee for Class K from .046% to .044%.
For the period, transfer agent fees for each class were as follows:
| | Amount | % of Class-Level Average Net Assets |
| Blue Chip Growth | $32,310 | .13 |
| Class K | 2,360 | .04 |
| | $34,670 | |
Accounting Fees. Fidelity Service Company, Inc. (FSC), an affiliate of the investment adviser, maintains the Fund's accounting records. The accounting fee is based on the level of average net assets for each month. For the period, the fees were equivalent to the following annual rates:
| | % of Average Net Assets |
| Fidelity Blue Chip Growth Fund | .01 |
Brokerage Commissions. A portion of portfolio transactions were placed with brokerage firms which are affiliates of the investment adviser. Brokerage commissions are included in net realized gain (loss) and change in net unrealized appreciation (depreciation) in the Statement of Operations. The commissions paid to these affiliated firms were as follows:
| | Amount |
| Fidelity Blue Chip Growth Fund | $385 |
Interfund Lending Program. Pursuant to an Exemptive Order issued by the SEC, the fund, along with other registered investment companies having management contracts with Fidelity Management & Research Company LLC (FMR), or other affiliated entities of FMR, may participate in an interfund lending program. This program provides an alternative credit facility allowing the fund to borrow from, or lend money to, other participating affiliated funds. At period end, there were no interfund loans outstanding. Activity in this program during the period for which loans were outstanding was as follows:
| | Borrower or Lender | Average Loan Balance | Weighted Average Interest Rate | Interest Expense |
| Fidelity Blue Chip Growth Fund | Borrower | $18,725 | 1.47% | $117 |
Interfund Trades. Funds may purchase from or sell securities to other Fidelity Funds under procedures adopted by the Board. The procedures have been designed to ensure these interfund trades are executed in accordance with Rule 17a-7 of the 1940 Act. Interfund trades are included within the respective purchases and sales amounts shown in the Purchases and Sales of Investments note.
Affiliated Redemptions In-Kind. During the period, 2,673 shares of the Fund were redeemed in-kind for investments and cash with a value of $256,703. The net realized gain of $135,027 on investments delivered through in-kind redemptions is included in the accompanying Statement of Operations. The amount of the in-kind redemptions is included in share transactions in the accompanying Statement of Changes in Net Assets as well as the Notes to Financial Statements. The Fund recognized no gain or loss for federal income tax purposes.
Other. During the period, the investment adviser reimbursed the Fund for certain losses in the amount of $198.
6. Committed Line of Credit.
Certain Funds participate with other funds managed by the investment adviser or an affiliate in a $4.25 billion credit facility (the "line of credit") to be utilized for temporary or emergency purposes to fund shareholder redemptions or for other short-term liquidity purposes. The participating funds have agreed to pay commitment fees on their pro-rata portion of the line of credit, which are reflected in Miscellaneous expenses on the Statement of Operations, and are as follows:
| | Amount |
| Fidelity Blue Chip Growth Fund | $70 |
During the period, there were no borrowings on this line of credit.
7. Security Lending.
The Fund lends portfolio securities from time to time in order to earn additional income. Lending agents are used, including National Financial Services (NFS), an affiliate of the Fund. Pursuant to a securities lending agreement, NFS will receive a fee, which is capped at 9.9% of daily lending revenue, for its services as lending agent. The Fund may lend securities to certain qualified borrowers, including NFS. On the settlement date of the loan, the Fund receives collateral (in the form of U.S. Treasury obligations, letters of credit and/or cash) against the loaned securities and maintains collateral in an amount not less than 100% of the market value of the loaned securities during the period of the loan. The market value of the loaned securities is determined at the close of business of the Fund and any additional required collateral is delivered to the Fund on the next business day. The Fund or borrower may terminate the loan at any time, and if the borrower defaults on its obligation to return the securities loaned because of insolvency or other reasons, the Fund may apply collateral received from the borrower against the obligation. The Fund may experience delays and costs in recovering the securities loaned. Any cash collateral received is invested in the Fidelity Securities Lending Cash Central Fund. The value of loaned securities and cash collateral at period end are disclosed on the Fund's Statement of Assets and Liabilities. The value of securities loaned to NFS, as affiliated borrower, at period end was $2,702. Total fees paid by the Fund to NFS, as lending agent, amounted to $1,244. Security lending income represents the income earned on investing cash collateral, less rebates paid to borrowers and any lending agent fees associated with the loan, plus any premium payments received for lending certain types of securities. Net income from the Fidelity Securities Lending Cash Central Fund during the period is presented in the Statement of Operations as a component of income from Fidelity Central Funds (and includes $1,043 from securities loaned to NFS, as affiliated borrower).
8. Bank Borrowings.
The Fund is permitted to have bank borrowings for temporary or emergency purposes to fund shareholder redemptions or for other short-term liquidity requirements. The Fund has established borrowing arrangements with certain banks. The interest rate on the borrowings is the bank's base rate, as revised from time to time. Any open loans, including accrued interest, at period end are presented under the caption "Notes payable" in the Statement of Assets and Liabilities, if applicable. Activity in this program during the period for which loans were outstanding was as follows:
| | Average Loan Balance | Weighted Average Interest Rate | Interest Expense |
| Fidelity Blue Chip Growth Fund | $9,698 | 2.38% | $10 |
9. Expense Reductions.
Commissions paid to certain brokers with whom the investment adviser, or its affiliates, places trades on behalf of the Fund include an amount in addition to trade execution, which may be rebated back to the Fund to offset certain expenses. This amount totaled $1,111 for the period. In addition, through arrangements with the Fund's custodian and each class' transfer agent, credits realized as a result of certain uninvested cash balances were used to reduce the Fund's expenses. During the period, custodian credits reduced the Fund's expenses by $16.
In addition, during the period the investment adviser or an affiliate reimbursed and/or waived a portion of fund-level operating expenses in the amount of $116.
10. Distributions to Shareholders.
Distributions to shareholders of each class were as follows:
| | Year ended
July 31, 2020 | Year ended
July 31, 2019 |
| Distributions to shareholders | | |
| Blue Chip Growth | $886,288 | $1,117,762 |
| Class K | 202,272 | 309,259 |
| Total | $1,088,560 | $1,427,021 |
11. Share Transactions.
Share transactions for each class were as follows and may contain automatic conversions between classes or
exchanges between affiliated funds:
| | Shares | Shares | Dollars | Dollars |
| | Year ended July 31, 2020 | Year ended July 31, 2019 | Year ended July 31, 2020 | Year ended July 31, 2019 |
| Blue Chip Growth | | | | |
| Shares sold | 50,328 | 46,648 | $5,529,773 | $4,497,772 |
| Reinvestment of distributions | 8,416 | 11,015 | 833,120 | 1,055,435 |
| Shares redeemed | (57,543)(a),(b) | (41,910)(c) | (6,053,757)(a),(b) | (3,958,336)(c) |
| Net increase (decrease) | 1,201 | 15,753 | $309,136 | $1,594,871 |
| Class K | | | | |
| Shares sold | 11,580 | 12,360 | $1,250,650 | $1,191,601 |
| Reinvestment of distributions | 2,039 | 3,225 | 202,272 | 309,259 |
| Shares redeemed | (17,282)(a),(b) | (20,830)(c) | (1,841,619)(a),(b) | (1,953,374)(c) |
| Net increase (decrease) | (3,663) | (5,245) | $(388,697) | $(452,514) |
(a) Amount includes in-kind redemptions (see the Unaffiliated Redemptions In-Kind note for additional details).
(b) Amount includes in-kind redemptions (see the Affiliated Redemptions In-Kind note for additional details).
(c) Amount includes in-kind redemptions (see the Prior fiscal Year Unaffiliated Redemptions In-Kind note for additional details).
12. Other.
The Fund's organizational documents provide former and current trustees and officers with a limited indemnification against liabilities arising in connection with the performance of their duties to the Fund. In the normal course of business, the Fund may also enter into contracts that provide general indemnifications. The Fund's maximum exposure under these arrangements is unknown as this would be dependent on future claims that may be made against the Fund. The risk of material loss from such claims is considered remote.
13. Coronavirus (COVID-19) Pandemic.
An outbreak of COVID-19 first detected in China during December 2019 has since spread globally and was declared a pandemic by the World Health Organization during March 2020. Developments that disrupt global economies and financial markets, such as the COVID-19 pandemic, may magnify factors that affect the Fund's performance.
Report of Independent Registered Public Accounting Firm
To the Board of Trustees of Fidelity Securities Fund and Shareholders of Fidelity Blue Chip Growth Fund :
Opinion on the Financial Statements and Financial Highlights
We have audited the accompanying statement of assets and liabilities of Fidelity Blue Chip Growth Fund (the "Fund"), a fund of Fidelity Securities Fund, including the schedule of investments, as of July 31, 2020, the related statement of operations for the year then ended, the statement of changes in net assets for each of the two years in the period then ended, the financial highlights for each of the five years in the period then ended, and the related notes. In our opinion, the financial statements and financial highlights present fairly, in all material respects, the financial position of the Fund as of July 31, 2020, and the results of its operations for the year then ended, the changes in its net assets for each of the two years in the period then ended, and the financial highlights for each of the five years in the period then ended in conformity with accounting principles generally accepted in the United States of America.
Basis for Opinion
These financial statements and financial highlights are the responsibility of the Fund's management. Our responsibility is to express an opinion on the Fund's financial statements and financial highlights based on our audits. We are a public accounting firm registered with the Public Company Accounting Oversight Board (United States) (PCAOB) and are required to be independent with respect to the Fund in accordance with the U.S. federal securities laws and the applicable rules and regulations of the Securities and Exchange Commission and the PCAOB.
We conducted our audits in accordance with the standards of the PCAOB. Those standards require that we plan and perform the audit to obtain reasonable assurance about whether the financial statements and financial highlights are free of material misstatement, whether due to error or fraud. The Fund is not required to have, nor were we engaged to perform, an audit of its internal control over financial reporting. As part of our audits we are required to obtain an understanding of internal control over financial reporting but not for the purpose of expressing an opinion on the effectiveness of the Fund’s internal control over financial reporting. Accordingly, we express no such opinion.
Our audits included performing procedures to assess the risks of material misstatement of the financial statements and financial highlights, whether due to error or fraud, and performing procedures that respond to those risks. Such procedures included examining, on a test basis, evidence regarding the amounts and disclosures in the financial statements and financial highlights. Our audits also included evaluating the accounting principles used and significant estimates made by management, as well as evaluating the overall presentation of the financial statements and financial highlights. Our procedures included confirmation of securities owned as of July 31, 2020, by correspondence with the custodian and brokers; when replies were not received from brokers, we performed other auditing procedures. We believe that our audits provide a reasonable basis for our opinion.
/s/ Deloitte & Touche LLP
Boston, Massachusetts
September 15, 2020
We have served as the auditor of one or more of the Fidelity investment companies since 1999.
Trustees and Officers
The Trustees, Members of the Advisory Board (if any), and officers of the trust and fund, as applicable, are listed below. The Board of Trustees governs the fund and is responsible for protecting the interests of shareholders. The Trustees are experienced executives who meet periodically throughout the year to oversee the fund's activities, review contractual arrangements with companies that provide services to the fund, oversee management of the risks associated with such activities and contractual arrangements, and review the fund's performance. Except for Jonathan Chiel, each of the Trustees oversees 311 funds. Mr. Chiel oversees 174 funds.
The Trustees hold office without limit in time except that (a) any Trustee may resign; (b) any Trustee may be removed by written instrument, signed by at least two-thirds of the number of Trustees prior to such removal; (c) any Trustee who requests to be retired or who has become incapacitated by illness or injury may be retired by written instrument signed by a majority of the other Trustees; and (d) any Trustee may be removed at any special meeting of shareholders by a two-thirds vote of the outstanding voting securities of the trust. Each Trustee who is not an interested person (as defined in the 1940 Act) of the trust and the fund is referred to herein as an Independent Trustee. Each Independent Trustee shall retire not later than the last day of the calendar year in which his or her 75th birthday occurs. The Independent Trustees may waive this mandatory retirement age policy with respect to individual Trustees. Officers and Advisory Board Members hold office without limit in time, except that any officer or Advisory Board Member may resign or may be removed by a vote of a majority of the Trustees at any regular meeting or any special meeting of the Trustees. Except as indicated, each individual has held the office shown or other offices in the same company for the past five years.
The fund's Statement of Additional Information (SAI) includes more information about the Trustees. To request a free copy, call Fidelity at 1-800-544-8544 if you’re an individual investing directly with Fidelity, call 1-800-835-5092 if you’re a plan sponsor or participant with Fidelity as your recordkeeper or call 1-877-208-0098 on institutional accounts or if you’re an advisor or invest through one.
Experience, Skills, Attributes, and Qualifications of the Trustees. The Governance and Nominating Committee has adopted a statement of policy that describes the experience, qualifications, attributes, and skills that are necessary and desirable for potential Independent Trustee candidates (Statement of Policy). The Board believes that each Trustee satisfied at the time he or she was initially elected or appointed a Trustee, and continues to satisfy, the standards contemplated by the Statement of Policy. The Governance and Nominating Committee also engages professional search firms to help identify potential Independent Trustee candidates who have the experience, qualifications, attributes, and skills consistent with the Statement of Policy. From time to time, additional criteria based on the composition and skills of the current Independent Trustees, as well as experience or skills that may be appropriate in light of future changes to board composition, business conditions, and regulatory or other developments, have also been considered by the professional search firms and the Governance and Nominating Committee. In addition, the Board takes into account the Trustees' commitment and participation in Board and committee meetings, as well as their leadership of standing and ad hoc committees throughout their tenure.
In determining that a particular Trustee was and continues to be qualified to serve as a Trustee, the Board has considered a variety of criteria, none of which, in isolation, was controlling. The Board believes that, collectively, the Trustees have balanced and diverse experience, qualifications, attributes, and skills, which allow the Board to operate effectively in governing the fund and protecting the interests of shareholders. Information about the specific experience, skills, attributes, and qualifications of each Trustee, which in each case led to the Board's conclusion that the Trustee should serve (or continue to serve) as a trustee of the fund, is provided below.
Board Structure and Oversight Function. Robert A. Lawrence is an interested person and currently serves as Acting Chairman. The Trustees have determined that an interested Chairman is appropriate and benefits shareholders because an interested Chairman has a personal and professional stake in the quality and continuity of services provided to the fund. Independent Trustees exercise their informed business judgment to appoint an individual of their choosing to serve as Chairman, regardless of whether the Trustee happens to be independent or a member of management. The Independent Trustees have determined that they can act independently and effectively without having an Independent Trustee serve as Chairman and that a key structural component for assuring that they are in a position to do so is for the Independent Trustees to constitute a substantial majority for the Board. The Independent Trustees also regularly meet in executive session. Ned C. Lautenbach and David M. Thomas serve as Co-Lead Independent Trustees and as such each (i) acts as a liaison between the Independent Trustees and management with respect to matters important to the Independent Trustees and (ii) with management prepares agendas for Board meetings.
Fidelity® funds are overseen by different Boards of Trustees. The fund's Board oversees Fidelity's high income and certain equity funds, and other Boards oversee Fidelity's investment-grade bond, money market, asset allocation, and other equity funds. The asset allocation funds may invest in Fidelity® funds overseen by the fund's Board. The use of separate Boards, each with its own committee structure, allows the Trustees of each group of Fidelity® funds to focus on the unique issues of the funds they oversee, including common research, investment, and operational issues. On occasion, the separate Boards establish joint committees to address issues of overlapping consequences for the Fidelity® funds overseen by each Board.
The Trustees operate using a system of committees to facilitate the timely and efficient consideration of all matters of importance to the Trustees, the fund, and fund shareholders and to facilitate compliance with legal and regulatory requirements and oversight of the fund's activities and associated risks. The Board, acting through its committees, has charged FMR and its affiliates with (i) identifying events or circumstances the occurrence of which could have demonstrably adverse effects on the fund's business and/or reputation; (ii) implementing processes and controls to lessen the possibility that such events or circumstances occur or to mitigate the effects of such events or circumstances if they do occur; and (iii) creating and maintaining a system designed to evaluate continuously business and market conditions in order to facilitate the identification and implementation processes described in (i) and (ii) above. Because the day-to-day operations and activities of the fund are carried out by or through FMR, its affiliates, and other service providers, the fund's exposure to risks is mitigated but not eliminated by the processes overseen by the Trustees. While each of the Board's committees has responsibility for overseeing different aspects of the fund's activities, oversight is exercised primarily through the Operations, Audit, and Compliance Committees. Appropriate personnel, including but not limited to the fund's Chief Compliance Officer (CCO), FMR's internal auditor, the independent accountants, the fund's Treasurer and portfolio management personnel, make periodic reports to the Board's committees, as appropriate, including an annual review of Fidelity's risk management program for the Fidelity® funds. The responsibilities of each standing committee, including their oversight responsibilities, are described further under "Standing Committees of the Trustees."
Interested Trustees*:
Correspondence intended for a Trustee who is an interested person may be sent to Fidelity Investments, 245 Summer Street, Boston, Massachusetts 02210.
Name, Year of Birth; Principal Occupations and Other Relevant Experience+
Jonathan Chiel (1957)
Year of Election or Appointment: 2016
Trustee
Mr. Chiel also serves as Trustee of other Fidelity® funds. Mr. Chiel is Executive Vice President and General Counsel for FMR LLC (diversified financial services company, 2012-present). Previously, Mr. Chiel served as general counsel (2004-2012) and senior vice president and deputy general counsel (2000-2004) for John Hancock Financial Services; a partner with Choate, Hall & Stewart (1996-2000) (law firm); and an Assistant United States Attorney for the United States Attorney’s Office of the District of Massachusetts (1986-95), including Chief of the Criminal Division (1993-1995). Mr. Chiel is a director on the boards of the Boston Bar Foundation and the Maimonides School.
Robert A. Lawrence (1952)
Year of Election or Appointment: 2020
Trustee
Acting Chairman of the Board of Trustees
Mr. Lawrence also serves as Trustee of other funds. Previously, Mr. Lawrence served as a Member of the Advisory Board of certain funds. Prior to his retirement in 2008, Mr. Lawrence served as Vice President of certain Fidelity® funds (2006-2008), Senior Vice President, Head of High Income Division of Fidelity Management & Research Company (investment adviser firm, 2006-2008), and President of Fidelity Strategic Investments (investment adviser firm, 2002-2005).
* Determined to be an “Interested Trustee” by virtue of, among other things, his or her affiliation with the trust or various entities under common control with FMR.
+ The information includes the Trustee's principal occupation during the last five years and other information relating to the experience, attributes, and skills relevant to the Trustee's qualifications to serve as a Trustee, which led to the conclusion that the Trustee should serve as a Trustee for the fund.
Independent Trustees:
Correspondence intended for an Independent Trustee may be sent to Fidelity Investments, P.O. Box 55235, Boston, Massachusetts 02205-5235.
Name, Year of Birth; Principal Occupations and Other Relevant Experience+
Dennis J. Dirks (1948)
Year of Election or Appointment: 2005
Trustee
Mr. Dirks also serves as Trustee of other Fidelity® funds. Prior to his retirement in May 2003, Mr. Dirks served as Chief Operating Officer and as a member of the Board of The Depository Trust & Clearing Corporation (financial markets infrastructure), President, Chief Operating Officer and a member of the Board of The Depository Trust Company (DTC), President and a member of the Board of the National Securities Clearing Corporation (NSCC), Chief Executive Officer and a member of the Board of the Government Securities Clearing Corporation and Chief Executive Officer and a member of the Board of the Mortgage-Backed Securities Clearing Corporation. Mr. Dirks currently serves as a member of the Finance Committee (2016-present) and Board (2017-present) and is Treasurer (2018-present) of the Asolo Repertory Theatre.
Donald F. Donahue (1950)
Year of Election or Appointment: 2018
Trustee
Mr. Donahue also serves as Trustee of other Fidelity® funds. Mr. Donahue serves as President and Chief Executive Officer of Miranda Partners, LLC (risk consulting for the financial services industry, 2012-present). Previously, Mr. Donahue served as Chief Executive Officer (2006-2012), Chief Operating Officer (2003-2006) and Managing Director, Customer Marketing and Development (1999-2003) of The Depository Trust & Clearing Corporation (financial markets infrastructure). Mr. Donahue currently serves as a member (2007-present) and Co-Chairman (2016-present) of the Board of United Way of New York, a member of the Board of NYC Leadership Academy (2012-present) and a member of the Board of Advisors of Ripple Labs, Inc. (financial services, 2015-present). Mr. Donahue previously served as a member of the Advisory Board of certain Fidelity® funds (2015-2018).
Vicki L. Fuller (1957)
Year of Election or Appointment: 2020
Trustee
Ms. Fuller also serves as Trustee of other Fidelity® funds. Previously, Ms. Fuller served as a member of the Advisory Board of certain Fidelity® funds (2018-2020), Chief Investment Officer of the New York State Common Retirement Fund (2012-2018) and held a variety of positions at AllianceBernstein L.P. (global asset management, 1985-2012), including Managing Director (2006-2012) and Senior Vice President and Senior Portfolio Manager (2001-2006). Ms. Fuller currently serves as a member of the Board, Audit Committee and Nominating and Governance Committee of The Williams Companies, Inc. (natural gas infrastructure, 2018-present) and as a member of the Board of Treliant, LLC (consulting, 2019-present).
Patricia L. Kampling (1959)
Year of Election or Appointment: 2020
Trustee
Ms. Kampling also serves as Trustee of other Fidelity® funds. Prior to her retirement, Ms. Kampling served as Chairman of the Board and Chief Executive Officer (2012-2019), President and Chief Operating Officer (2011-2012) and Executive Vice President and Chief Financial Officer (2010-2011) of Alliant Energy Corporation. Ms. Kampling currently serves as a member of the Board, Compensation Committee and Executive Committee and as Chair of the Audit Committee of Briggs & Stratton Corporation (manufacturing, 2011-present) and as a member of the Board, Audit, Finance and Risk Committee and Safety, Environmental, Technology and Operations Committee of American Water Works Company, Inc. (utilities company, 2019-present). In addition, Ms. Kampling currently serves as a member of the Board of the Nature Conservancy, Wisconsin Chapter (2019-present). Previously, Ms. Kampling served as a Member of the Advisory Board of certain Fidelity® funds (2020), a member of the Board of Interstate Power and Light Company (2012-2019) and Wisconsin Power and Light Company (2012-2019) (each a subsidiary of Alliant Energy Corporation) and as a member of the Board and Workforce Development Committee of the Business Roundtable (2018-2019).
Alan J. Lacy (1953)
Year of Election or Appointment: 2008
Trustee
Mr. Lacy also serves as Trustee of other Fidelity® funds. Previously, Mr. Lacy served as Senior Adviser (2007-2014) of Oak Hill Capital Partners, L.P. (private equity), Chief Executive Officer (2005) and Vice Chairman (2005-2006) of Sears Holdings Corporation (retail), Chief Executive Officer and Chairman of the Board of Sears, Roebuck and Co. (retail, 2000-2005), Chairman (2014-2017) and a member of the Board (2010-2017) of Dave & Buster’s Entertainment, Inc. (restaurant and entertainment complexes) and a member of the Board of Bristol-Myers Squibb Company (global pharmaceuticals, 2008-2020). Mr. Lacy currently serves as a Trustee of the California Chapter of The Nature Conservancy (2015-present) and a member of the Board of the Center for Advanced Study in the Behavioral Sciences at Stanford University (2015-present).
Ned C. Lautenbach (1944)
Year of Election or Appointment: 2000
Trustee
Co-Lead Independent Trustee
Mr. Lautenbach also serves as Trustee of other Fidelity® funds. Mr. Lautenbach currently serves as Chair of the Board of Governors, State University System of Florida (2013-present) and is a member of the Council on Foreign Relations (1994-present). He is also a member and has in the past served as Chairman of the Board of Directors of Artis-Naples (2012-present). Previously, Mr. Lautenbach served as a member and then Lead Director of the Board of Directors of Eaton Corporation (diversified industrial, 1997-2016). He was also a Partner at Clayton, Dubilier & Rice, LLC (private equity investment, 1998-2010); as well as Director of Sony Corporation (2006-2007). In addition, Mr. Lautenbach had a 30-year career with IBM (technology company), during which time he served as Senior Vice President and as a member of the Corporate Executive Committee (1968-1998).
Joseph Mauriello (1944)
Year of Election or Appointment: 2008
Trustee
Mr. Mauriello also serves as Trustee of other Fidelity® funds. Prior to his retirement in January 2006, Mr. Mauriello served in numerous senior management positions including Deputy Chairman and Chief Operating Officer (2004-2005), and Vice Chairman of Financial Services (2002-2004) of KPMG LLP US (professional services, 1965-2005). Mr. Mauriello currently serves as a member of the Independent Directors Council Governing Council (2015-present). Previously, Mr. Mauriello served as a member of the Board of XL Group plc. (global insurance and re-insurance, 2006-2018).
Cornelia M. Small (1944)
Year of Election or Appointment: 2005
Trustee
Ms. Small also serves as Trustee of other Fidelity® funds. Previously, Ms. Small served as Chief Investment Officer, Director of Global Equity Investments and a member of Scudder, Stevens & Clark and Scudder Kemper Investments. Ms. Small previously served as a member of the Board (2009-2019) and Chair of the Investment Committee (2010-2019) of the Teagle Foundation and a member of the Investment Committee of the Berkshire Taconic Community Foundation (2008-2019).
Garnett A. Smith (1947)
Year of Election or Appointment: 2018
Trustee
Mr. Smith also serves as Trustee of other Fidelity® funds. Prior to his retirement, Mr. Smith served as Chairman and Chief Executive Officer (1990-1997) and President (1986-1990) of Inbrand Corp. (manufacturer of personal absorbent products). Prior to his employment with Inbrand Corp., he was employed by a retail fabric chain and North Carolina National Bank (now Bank of America). Mr. Smith previously served as a member of the Advisory Board of certain Fidelity® funds (2012-2013).
David M. Thomas (1949)
Year of Election or Appointment: 2008
Trustee
Co-Lead Independent Trustee
Mr. Thomas also serves as Trustee of other Fidelity® funds. Previously, Mr. Thomas served as Executive Chairman (2005-2006) and Chairman and Chief Executive Officer (2000-2005) of IMS Health, Inc. (pharmaceutical and healthcare information solutions). Mr. Thomas currently serves as Non-Executive Chairman of the Board of Fortune Brands Home and Security (home and security products, 2011-present), and a member of the Board (2004-present) and Presiding Director (2013-present) of Interpublic Group of Companies, Inc. (marketing communication).
Susan Tomasky (1953)
Year of Election or Appointment: 2020
Trustee
Ms. Tomasky also serves as Trustee of other Fidelity® funds. Prior to her retirement, Ms. Tomasky served in various executive officer positions at American Electric Power Company, Inc. (1998-2011), including most recently as President of AEP Transmission (2007-2011). Ms. Tomasky currently serves as a member of the Board and Sustainability Committee and as Chair of the Audit Committee of Marathon Petroleum Corporation (2018-present) and as a member of the Board, Corporate Governance Committee and Organization and Compensation Committee and as Chair of the Audit Committee of Public Service Enterprise Group, Inc. (utilities company, 2012-present). In addition, Ms. Tomasky currently serves as a member of the Board of the Columbus Regional Airport Authority (2007-present), as a member of the Board of the Royal Shakespeare Company – America (2009-present), as a member of the Board of the Columbus Association for the Performing Arts (2011-present) and as a member of the Board of Kenyon College (2016-present). Previously, Ms. Tomasky served as a Member of the Advisory Board of certain Fidelity® funds (2020), a member of the Board (2011-2019) and as Lead Independent Director (2015-2018) of Andeavor Corporation (previously Tesoro Corporation) (independent oil refiner and marketer) and as a member of the Board of Summit Midstream Partners LP (energy, 2012-2018).
Michael E. Wiley (1950)
Year of Election or Appointment: 2020
Trustee
Mr. Wiley also serves as Trustee of other Fidelity® funds. Previously, Mr. Wiley served as a member of the Advisory Board of certain Fidelity® funds (2018-2020), Chairman, President and CEO of Baker Hughes, Inc. (oilfield services, 2000-2004). Mr. Wiley also previously served as a member of the Board of Andeavor Corporation (independent oil refiner and marketer, 2005-2018), a member of the Board of Andeavor Logistics LP (natural resources logistics, 2015-2018) and a member of the Board of High Point Resources (exploration and production, 2005-2020).
+ The information includes the Trustee's principal occupation during the last five years and other information relating to the experience, attributes, and skills relevant to the Trustee's qualifications to serve as a Trustee, which led to the conclusion that the Trustee should serve as a Trustee for the fund.
Advisory Board Members and Officers:
Correspondence intended for a Member of the Advisory Board (if any) may be sent to Fidelity Investments, P.O. Box 55235, Boston, Massachusetts 02205-5235. Correspondence intended for an officer or Peter S. Lynch may be sent to Fidelity Investments, 245 Summer Street, Boston, Massachusetts 02210. Officers appear below in alphabetical order.
Name, Year of Birth; Principal Occupation
Peter S. Lynch (1944)
Year of Election or Appointment: 2003
Member of the Advisory Board
Mr. Lynch also serves as a Member of the Advisory Board of other Fidelity® funds. Mr. Lynch is Vice Chairman and a Director of Fidelity Management & Research Company LLC (investment adviser firm). In addition, Mr. Lynch serves as a Trustee of Boston College and as the Chairman of the Inner-City Scholarship Fund. Previously, Mr. Lynch served as Vice Chairman and a Director of FMR Co., Inc. (investment adviser firm) and on the Special Olympics International Board of Directors (1997-2006).
Elizabeth Paige Baumann (1968)
Year of Election or Appointment: 2017
Anti-Money Laundering (AML) Officer
Ms. Baumann also serves as AML Officer of other funds. She is Chief AML Officer (2012-present) and Senior Vice President (2014-present) of FMR LLC (diversified financial services company) and is an employee of Fidelity Investments. Previously, Ms. Baumann served as AML Officer of certain funds (2017-2019), as AML Officer of the funds (2012-2016), and Vice President (2007-2014) and Deputy Anti-Money Laundering Officer (2007-2012) of FMR LLC.
Craig S. Brown (1977)
Year of Election or Appointment: 2019
Assistant Treasurer
Mr. Brown also serves as Assistant Treasurer of other funds. Mr. Brown is an employee of Fidelity Investments (2013-present).
John J. Burke III (1964)
Year of Election or Appointment: 2018
Chief Financial Officer
Mr. Burke also serves as Chief Financial Officer of other funds. Mr. Burke serves as Head of Investment Operations for Fidelity Fund and Investment Operations (2018-present) and is an employee of Fidelity Investments (1998-present). Previously Mr. Burke served as head of Asset Management Investment Operations (2012-2018).
William C. Coffey (1969)
Year of Election or Appointment: 2019
Assistant Secretary
Mr. Coffey also serves as Assistant Secretary of other funds. He is Senior Vice President and Deputy General Counsel of FMR LLC (diversified financial services company, 2010-present), and is an employee of Fidelity Investments. Previously, Mr. Coffey served as Secretary and CLO of certain funds (2018-2019); CLO, Secretary, and Senior Vice President of Fidelity Management & Research Company and FMR Co., Inc. (investment adviser firms, 2018-2019); Secretary of Fidelity SelectCo, LLC and Fidelity Investments Money Management, Inc. (investment adviser firms, 2018-2019); CLO of Fidelity Management & Research (Hong Kong) Limited, FMR Investment Management (UK) Limited, and Fidelity Management & Research (Japan) Limited (investment adviser firms, 2018-2019); and Assistant Secretary of certain funds (2009-2018).
Timothy M. Cohen (1969)
Year of Election or Appointment: 2018
Vice President
Mr. Cohen also serves as Vice President of other funds. Mr. Cohen serves as Co-Head of Equity (2018-present), a Director of Fidelity Management & Research (Japan) Limited (investment adviser firm, 2016-present), and is an employee of Fidelity Investments. Previously, Mr. Cohen served as Executive Vice President of Fidelity SelectCo, LLC (2019), Head of Global Equity Research (2016-2018), Chief Investment Officer - Equity and a Director of Fidelity Management & Research (U.K.) Inc. (investment adviser firm, 2013-2015) and as a Director of Fidelity Management & Research (Hong Kong) Limited (investment adviser firm, 2017).
Jonathan Davis (1968)
Year of Election or Appointment: 2010
Assistant Treasurer
Mr. Davis also serves as Assistant Treasurer of other funds. Mr. Davis serves as Assistant Treasurer of FMR Capital, Inc. (2017-present) and is an employee of Fidelity Investments. Previously, Mr. Davis served as Vice President and Associate General Counsel of FMR LLC (diversified financial services company, 2003-2010).
Laura M. Del Prato (1964)
Year of Election or Appointment: 2018
Assistant Treasurer
Ms. Del Prato also serves as an officer of other funds. Ms. Del Prato is an employee of Fidelity Investments (2017-present). Previously, Ms. Del Prato served as President and Treasurer of The North Carolina Capital Management Trust: Cash Portfolio and Term Portfolio (2018-2020). Prior to joining Fidelity Investments, Ms. Del Prato served as a Managing Director and Treasurer of the JPMorgan Mutual Funds (2014-2017). Prior to JPMorgan, Ms. Del Prato served as a partner at Cohen Fund Audit Services (accounting firm, 2012-2013) and KPMG LLP (accounting firm, 2004-2012).
Colm A. Hogan (1973)
Year of Election or Appointment: 2020
Assistant Treasurer
Mr. Hogan also serves as an officer of other funds. Mr. Hogan serves as Assistant Treasurer of FMR Capital, Inc. (2017-present) and is an employee of Fidelity Investments (2005-present). Previously, Mr. Hogan served as Deputy Treasurer of certain Fidelity® funds (2016-2020) and Assistant Treasurer of certain Fidelity® funds (2016-2018).
Pamela R. Holding (1964)
Year of Election or Appointment: 2018
Vice President
Ms. Holding also serves as Vice President of other funds. Ms. Holding serves as Co-Head of Equity (2018-present) and is an employee of Fidelity Investments (2013-present). Previously, Ms. Holding served as Executive Vice President of Fidelity SelectCo, LLC (2019) and as Chief Investment Officer of Fidelity Institutional Asset Management (2013-2018).
Cynthia Lo Bessette (1969)
Year of Election or Appointment: 2019
Secretary and Chief Legal Officer (CLO)
Ms. Lo Bessette also serves as an officer of other funds. Ms. Lo Bessette serves as CLO, Secretary, and Senior Vice President of Fidelity Management & Research Company LLC (investment adviser firm, 2019-present); and CLO of Fidelity Management & Research (Hong Kong) Limited, FMR Investment Management (UK) Limited, and Fidelity Management & Research (Japan) Limited (investment adviser firms, 2019-present). She is a Senior Vice President and Deputy General Counsel of FMR LLC (diversified financial services company, 2019-present), and is an employee of Fidelity Investments. Previously, Ms. Lo Bessette served as CLO, Secretary, and Senior Vice President of FMR Co., Inc. (investment adviser firm, 2019); Secretary of Fidelity SelectCo, LLC and Fidelity Investments Money Management, Inc. (investment adviser firms, 2019). Prior to joining Fidelity Investments, Ms. Lo Bessette was Executive Vice President, General Counsel (2016-2019) and Senior Vice President, Deputy General Counsel (2015-2016) of OppenheimerFunds (investment management company) and Deputy Chief Legal Officer (2013-2015) of Jennison Associates LLC (investment adviser firm).
Chris Maher (1972)
Year of Election or Appointment: 2020
Deputy Treasurer
Mr. Maher also serves as an officer of other funds. Mr. Maher serves as Assistant Treasurer of FMR Capital, Inc. (2017-present), and is an employee of Fidelity Investments (2008-present). Previously, Mr. Maher served as Assistant Treasurer of certain funds (2013-2020); Vice President of Asset Management Compliance (2013), Vice President of the Program Management Group of FMR (investment adviser firm, 2010-2013), and Vice President of Valuation Oversight (2008-2010).
Jason P. Pogorelec (1975)
Year of Election or Appointment: 2020
Chief Compliance Officer
Mr. Pogorelec also serves as Chief Compliance Officer of other funds. Mr. Pogorelec is a senior Vice President of Asset Management Compliance for Fidelity Investments and is an employee of Fidelity Investments (2006-present). Previously, Mr. Pogorelec served as Vice President, Associate General Counsel for Fidelity Investments (2010-2020) and Assistant Secretary of certain Fidelity funds (2015-2020).
Stacie M. Smith (1974)
Year of Election or Appointment: 2016
President and Treasurer
Ms. Smith also serves as an officer of other funds. Ms. Smith serves as Assistant Treasurer of FMR Capital, Inc. (2017-present), is an employee of Fidelity Investments (2009-present), and has served in other fund officer roles. Prior to joining Fidelity Investments, Ms. Smith served as Senior Audit Manager of Ernst & Young LLP (accounting firm, 1996-2009). Previously, Ms. Smith served as Assistant Treasurer (2013-2019) and Deputy Treasurer (2013-2016) of certain Fidelity® funds.
Marc L. Spector (1972)
Year of Election or Appointment: 2016
Assistant Treasurer
Mr. Spector also serves as an officer of other funds. Mr. Spector serves as Assistant Treasurer of FMR Capital, Inc. (2017-present) and is an employee of Fidelity Investments (2016-present). Prior to joining Fidelity Investments, Mr. Spector served as Director at the Siegfried Group (accounting firm, 2013-2016), and prior to Siegfried Group as audit senior manager at Deloitte & Touche LLP (accounting firm, 2005-2013).
Jim Wegmann (1979)
Year of Election or Appointment: 2019
Assistant Treasurer
Mr. Wegmann also serves as Assistant Treasurer of other funds. Mr. Wegmann is an employee of Fidelity Investments (2011-present).
Shareholder Expense Example
As a shareholder, you incur two types of costs: (1) transaction costs, which may include sales charges (loads) on purchase payments or redemption proceeds, as applicable and (2) ongoing costs, which generally include management fees, distribution and/or service (12b-1) fees and other Fund expenses. This Example is intended to help you understand your ongoing costs (in dollars) of investing in a fund and to compare these costs with the ongoing costs of investing in other mutual funds.
The Example is based on an investment of $1,000 invested at the beginning of the period and held for the entire period (February 1, 2020 to July 31, 2020).
Actual Expenses
The first line of the accompanying table provides information about actual account values and actual expenses. You may use the information in this line, together with the amount you invested, to estimate the expenses that you paid over the period. Simply divide your account value by $1,000.00 (for example, an $8,600 account value divided by $1,000.00 = 8.6), then multiply the result by the number in the first line for a class/Fund under the heading entitled "Expenses Paid During Period" to estimate the expenses you paid on your account during this period. If any fund is a shareholder of any underlying mutual funds or exchange-traded funds (ETFs) (the Underlying Funds), such fund indirectly bears its proportional share of the expenses of the Underlying Funds in addition to the direct expenses incurred presented in the table. These fees and expenses are not included in the annualized expense ratio used to calculate the expense estimate in the table below.
Hypothetical Example for Comparison Purposes
The second line of the accompanying table provides information about hypothetical account values and hypothetical expenses based on the actual expense ratio and an assumed rate of return of 5% per year before expenses, which is not the actual return. The hypothetical account values and expenses may not be used to estimate the actual ending account balance or expenses you paid for the period. You may use this information to compare the ongoing costs of investing in the Fund and other funds. To do so, compare this 5% hypothetical example with the 5% hypothetical examples that appear in the shareholder reports of the other funds. If any fund is a shareholder of any Underlying Funds, such fund indirectly bears its proportional share of the expenses of the Underlying Funds in addition to the direct expenses as presented in the table. These fees and expenses are not included in the annualized expense ratio used to calculate the expense estimate in the table below.
Please note that the expenses shown in the table are meant to highlight your ongoing costs only and do not reflect any transaction costs. Therefore, the second line of the table is useful in comparing ongoing costs only, and will not help you determine the relative total costs of owning different funds.
| | Annualized Expense Ratio-A | Beginning
Account Value
February 1, 2020 | Ending
Account Value
July 31, 2020 | Expenses Paid
During Period-B
February 1, 2020
to July 31, 2020 |
| Fidelity Blue Chip Growth Fund | | | | |
| Blue Chip Growth | .80% | | | |
| Actual | | $1,000.00 | $1,242.60 | $4.46 |
| Hypothetical-C | | $1,000.00 | $1,020.89 | $4.02 |
| Class K | .72% | | | |
| Actual | | $1,000.00 | $1,243.20 | $4.02 |
| Hypothetical-C | | $1,000.00 | $1,021.28 | $3.62 |
A Annualized expense ratio reflects expenses net of applicable fee waivers.
B Expenses are equal to the annualized expense ratio, multiplied by the average account value over the period, multiplied by 182/ 366 (to reflect the one-half year period). The fees and expenses of any Underlying Funds are not included in each annualized expense ratio.
C 5% return per year before expenses
Distributions (Unaudited)
The Board of Trustees of Fidelity Blue Chip Growth Fund voted to pay to shareholders of record at the opening of business on record date, the following distributions per share derived from capital gains realized from sales of portfolio securities:
| | Pay Date | Record Date | Capital Gains |
| Fidelity Blue Chip Growth Fund | | | |
| Blue Chip Growth | 09/14/20 | 09/11/20 | $5.913 |
| Class K | 09/14/20 | 09/11/20 | $5.913 |
|
The fund hereby designates as a capital gain dividend with respect to the taxable year ended July 31, 2020, $1,842,261,506, or, if subsequently determined to be different, the net capital gain of such year.
The fund will notify shareholders in January 2021 of amounts for use in preparing 2020 income tax returns.
Liquidity Risk Management Program
The Securities and Exchange Commission adopted Rule 22e-4 under the Investment Company Act of 1940 (the Liquidity Rule) to promote effective liquidity risk management throughout the open-end investment company industry, thereby reducing the risk that funds will be unable to meet their redemption obligations and mitigating dilution of the interests of fund shareholders.
The Fund has adopted and implemented a liquidity risk management program pursuant to the Liquidity Rule (the Program) effective December 1, 2018. The Program is reasonably designed to assess and manage the Fund’s liquidity risk and to comply with the requirements of the Liquidity Rule. The Fund’s Board of Trustees (the Board) has designated the Fund’s investment adviser as administrator of the Program. The Fidelity advisers have established a Liquidity Risk Management Committee (the LRM Committee) to manage the Program for each of the Fidelity Funds. The LRM Committee monitors the adequacy and effectiveness of implementation of the Program and on a periodic basis assesses each Fund’s liquidity risk based on a variety of factors including (1) the Fund’s investment strategy, (2) portfolio liquidity and cash flow projections during normal and reasonably foreseeable stressed conditions, (3) shareholder redemptions, (4) borrowings and other funding sources and (5) in the case of exchange-traded funds, certain additional factors including the effect of the Fund’s prices and spreads, market participants, and basket compositions on the overall liquidity of the Fund’s portfolio, as applicable.
In accordance with the Program, each of the Fund’s portfolio investments is classified into one of four liquidity categories described below based on a determination of a reasonable expectation for how long it would take to convert the investment to cash (or sell or dispose of the investment) without significantly changing its market value.
- Highly liquid investments – cash or convertible to cash within three business days or less
- Moderately liquid investments – convertible to cash in three to seven calendar days
- Less liquid investments – can be sold or disposed of, but not settled, within seven calendar days
- Illiquid investments – cannot be sold or disposed of within seven calendar days
Liquidity classification determinations take into account a variety of factors including various market, trading and investment-specific considerations, as well as market depth, and generally utilize analysis from a third-party liquidity metrics service.
The Liquidity Rule places a 15% limit on a fund’s illiquid investments and requires funds that do not primarily hold assets that are highly liquid investments to determine and maintain a minimum percentage of the fund’s net assets to be invested in highly liquid investments (highly liquid investment minimum or HLIM). The Program includes provisions reasonably designed to comply with the 15% limit on illiquid investments and for determining, periodically reviewing and complying with the HLIM requirement as applicable.
At a recent meeting of the Fund’s Board of Trustees, the LRM Committee provided a written report to the Board pertaining to the operation, adequacy, and effectiveness of implementation of the Program for the annual period from December 1, 2018 through November 30, 2019. The report concluded that the Program has been implemented and is operating effectively and is reasonably designed to assess and manage the Fund’s liquidity risk.
Proxy Voting Results
A special meeting of shareholders was held on June 9, 2020. The results of votes taken among shareholders on the proposals before them are reported below. Each vote reported represents one dollar of net asset value held on the record date for the meeting.
PROPOSAL 1
To elect a Board of Trustees.
| | # of
Votes | % of
Votes |
| Dennis J. Dirks |
| Affirmative | 43,167,428,219.785 | 94.885 |
| Withheld | 2,327,070,930.034 | 5.115 |
| TOTAL | 45,494,499,149.820 | 100.000 |
| Donald F. Donahue |
| Affirmative | 43,161,668,935.467 | 94.872 |
| Withheld | 2,333,065,287.611 | 5.128 |
| TOTAL | 45,494,734,223.077 | 100.000 |
| Bettina Doulton |
| Affirmative | 43,304,465,213.969 | 95.186 |
| Withheld | 2,190,010,062.903 | 4.814 |
| TOTAL | 45,494,475,276.872 | 100.000 |
| Vicki L. Fuller |
| Affirmative | 43,380,442,631.493 | 95.353 |
| Withheld | 2,114,180,614.639 | 4.647 |
| TOTAL | 45,494,623,246.132 | 100.000 |
| Patricia L. Kampling |
| Affirmative | 43,128,008,796.761 | 94.798 |
| Withheld | 2,366,685,422.999 | 5.202 |
| TOTAL | 45,494,694,219.760 | 100.000 |
| Alan J. Lacy |
| Affirmative | 42,904,065,046.958 | 94.305 |
| Withheld | 2,590,717,567.229 | 5.695 |
| TOTAL | 45,494,782,614.187 | 100.000 |
| Ned C. Lautenbach |
| Affirmative | 42,802,778,827.017 | 94.083 |
| Withheld | 2,692,003,787.170 | 5.917 |
| TOTAL | 45,494,782,614.187 | 100.000 |
| Robert A. Lawrence |
| Affirmative | 42,971,258,294.203 | 94.453 |
| Withheld | 2,523,524,319.984 | 5.547 |
| TOTAL | 45,494,782,614.187 | 100.000 |
| Joseph Mauriello |
| Affirmative | 42,874,562,778.490 | 94.241 |
| Withheld | 2,620,171,874.731 | 5.759 |
| TOTAL | 45,494,734,653.220 | 100.000 |
| Cornelia M. Small |
| Affirmative | 43,029,040,988.063 | 94.580 |
| Withheld | 2,465,741,626.124 | 5.420 |
| TOTAL | 45,494,782,614.187 | 100.000 |
| Garnett A. Smith |
| Affirmative | 42,892,814,945.159 | 94.281 |
| Withheld | 2,601,967,669.028 | 5.719 |
| TOTAL | 45,494,782,614.187 | 100.000 |
| David M. Thomas |
| Affirmative | 42,936,080,036.111 | 94.376 |
| Withheld | 2,558,702,578.076 | 5.624 |
| TOTAL | 45,494,782,614.187 | 100.000 |
| Susan Tomasky |
| Affirmative | 43,147,934,105.796 | 94.842 |
| Withheld | 2,346,571,066.028 | 5.158 |
| TOTAL | 45,494,782,614.187 | 100.000 |
| Michael E. Wiley |
| Affirmative | 42,885,333,102.972 | 94.264 |
| Withheld | 2,609,449,511.215 | 5.736 |
| TOTAL | 45,494,782,614.187 | 100.000 |
PROPOSAL 5
A shareholder proposal to institute procedures to avoid holding investments in companies that contribute to genocide or crimes against humanity.
| | # of
Votes | % of
Votes |
| Affirmative | 4,263,791,419.094 | 32.709 |
| Against | 7,221,433,423.694 | 55.398 |
| Abstain | 941,809,496.571 | 7.225 |
| Broker Non-Vote | 608,547,395.803 | 4.668 |
| TOTAL | 13,035,581,735.162 | 100.000 |
| Proposal 1 reflects trust wide proposal and voting results. |
| Proposal 5 was not approved by shareholders. |
BCF-ANN-0920
1.536058.123
Fidelity® Dividend Growth Fund
Annual Report
July 31, 2020
See the inside front cover for important information about access to your fund’s shareholder reports.
Beginning on January 1, 2021, as permitted by regulations adopted by the Securities and Exchange Commission, paper copies of a fund’s shareholder reports will no longer be sent by mail, unless you specifically request paper copies of the reports from the fund or from your financial intermediary, such as a financial advisor, broker-dealer or bank. Instead, the reports will be made available on a website, and you will be notified by mail each time a report is posted and provided with a website link to access the report.
If you already elected to receive shareholder reports electronically, you will not be affected by this change and you need not take any action. You may elect to receive shareholder reports and other communications from a fund electronically, by contacting your financial intermediary. For Fidelity customers, visit Fidelity's web site or call Fidelity using the contact information listed below.
You may elect to receive all future reports in paper free of charge. If you wish to continue receiving paper copies of your shareholder reports, you may contact your financial intermediary or, if you are a Fidelity customer, visit Fidelity’s website, or call Fidelity at the applicable toll-free number listed below. Your election to receive reports in paper will apply to all funds held with the fund complex/your financial intermediary.
| Account Type | Website | Phone Number |
| Brokerage, Mutual Fund, or Annuity Contracts: | fidelity.com/mailpreferences | 1-800-343-3548 |
| Employer Provided Retirement Accounts: | netbenefits.fidelity.com/preferences (choose 'no' under Required Disclosures to continue to print) | 1-800-343-0860 |
| Advisor Sold Accounts Serviced Through Your Financial Intermediary: | Contact Your Financial Intermediary | Your Financial Intermediary's phone number |
| Advisor Sold Accounts Serviced by Fidelity: | institutional.fidelity.com | 1-877-208-0098 |
Contents
To view a fund's proxy voting guidelines and proxy voting record for the 12-month period ended June 30, visit http://www.fidelity.com/proxyvotingresults or visit the Securities and Exchange Commission's (SEC) web site at http://www.sec.gov.
You may also call 1-800-544-8544 if you’re an individual investing directly with Fidelity, call 1-800-835-5092 if you’re a plan sponsor or participant with Fidelity as your recordkeeper or call 1-877-208-0098 on institutional accounts or if you’re an advisor or invest through one to request a free copy of the proxy voting guidelines.
Standard & Poor's, S&P and S&P 500 are registered service marks of The McGraw-Hill Companies, Inc. and have been licensed for use by Fidelity Distributors Corporation.
Other third-party marks appearing herein are the property of their respective owners.
All other marks appearing herein are registered or unregistered trademarks or service marks of FMR LLC or an affiliated company. © 2020 FMR LLC. All rights reserved.
This report and the financial statements contained herein are submitted for the general information of the shareholders of the Fund. This report is not authorized for distribution to prospective investors in the Fund unless preceded or accompanied by an effective prospectus.
A fund files its complete schedule of portfolio holdings with the SEC for the first and third quarters of each fiscal year on Form N-PORT. Forms N-PORT are available on the SEC’s web site at http://www.sec.gov. A fund's Forms N-PORT may be reviewed and copied at the SEC’s Public Reference Room in Washington, DC. Information regarding the operation of the SEC's Public Reference Room may be obtained by calling 1-800-SEC-0330.
For a complete list of a fund's portfolio holdings, view the most recent holdings listing, semiannual report, or annual report on Fidelity's web site at http://www.fidelity.com, http://www.institutional.fidelity.com, or http://www.401k.com, as applicable.
NOT FDIC INSURED •MAY LOSE VALUE •NO BANK GUARANTEE
Neither the Fund nor Fidelity Distributors Corporation is a bank.
Note to Shareholders:
Early in 2020, the outbreak and spread of a new coronavirus emerged as a public health emergency that had a major influence on financial markets, primarily based on its impact on the global economy and the outlook for corporate earnings. The virus causes a respiratory disease known as COVID-19. On March 11, the World Health Organization declared the COVID-19 outbreak a pandemic, citing sustained risk of further global spread.
In the weeks following, as the crisis worsened, we witnessed an escalating human tragedy with wide-scale social and economic consequences from coronavirus-containment measures. The outbreak of COVID-19 prompted a number of measures to limit the spread, including travel and border restrictions, quarantines, and restrictions on large gatherings. In turn, these resulted in lower consumer activity, diminished demand for a wide range of products and services, disruption in manufacturing and supply chains, and – given the wide variability in outcomes regarding the outbreak – significant market uncertainty and volatility. Amid the turmoil, the U.S. government took unprecedented action – in concert with the U.S. Federal Reserve and central banks around the world – to help support consumers, businesses, and the broader economy, and to limit disruption to the financial system.
The situation continues to unfold, and the extent and duration of its impact on financial markets and the economy remain highly uncertain. Extreme events such as the coronavirus crisis are “exogenous shocks” that can have significant adverse effects on mutual funds and their investments. Although multiple asset classes may be affected by market disruption, the duration and impact may not be the same for all types of assets.
Fidelity is committed to helping you stay informed amid news about COVID-19 and during increased market volatility, and we’re taking extra steps to be responsive to customer needs. We encourage you to visit our websites, where we offer ongoing updates, commentary, and analysis on the markets and our funds.
Performance: The Bottom Line
Average annual total return reflects the change in the value of an investment, assuming reinvestment of distributions from dividend income and capital gains (the profits earned upon the sale of securities that have grown in value, if any) and assuming a constant rate of performance each year. The hypothetical investment and the average annual total returns do not reflect the deduction of taxes that a shareholder would pay on fund distributions or the redemption of fund shares. During periods of reimbursement by Fidelity, a fund’s total return will be greater than it would be had the reimbursement not occurred. How a fund did yesterday is no guarantee of how it will do tomorrow.
Average Annual Total Returns
| For the periods ended July 31, 2020 | Past 1 year | Past 5 years | Past 10 years |
| Fidelity® Dividend Growth Fund | (6.24)% | 4.93% | 9.70% |
| Class K | (6.11)% | 5.05% | 9.84% |
$10,000 Over 10 Years
Let's say hypothetically that $10,000 was invested in Fidelity® Dividend Growth Fund, a class of the fund, on July 31, 2010.
The chart shows how the value of your investment would have changed, and also shows how the S&P 500® Index performed over the same period.

| Period Ending Values |
| $25,238 | Fidelity® Dividend Growth Fund |
| $36,558 | S&P 500® Index |
Management's Discussion of Fund Performance
Market Recap: The S&P 500
® index gained 11.96% for the 12 months ending July 31, 2020, in what was a bumpy ride for U.S. equity investors, marked by a steep but brief decline due to the early-2020 outbreak and spread of the coronavirus, followed by a historic rebound. Declared a pandemic on March 11, the COVID-19 crisis and containment efforts caused broad contraction in economic activity, along with extreme uncertainty, volatility and dislocation in financial markets. By mid-March, U.S. stocks entered bear-market territory less than a month after hitting an all-time high and extending the longest-running bull market in American history. Stocks slid in late February, after a surge in COVID-19 cases outside China. The sudden downtrend continued in March (-12%), capping the index’s worst quarter since 2008. A historically rapid and expansive U.S. monetary/fiscal-policy response provided a partial offset to the economic disruption and fueled a sharp uptrend. Aggressive support for financial markets by the U.S. Federal Reserve, plans for reopening the economy and improving infection data boosted stocks in April (+13%) and May (+5%). In June and July, the index gained amid progress on potential treatments and signs of an early recovery in economic activity. For the full 12 months, growth stocks widely topped value, while large-caps handily bested smaller-caps. The information technology sector (+39%) led the way, followed by consumer discretionary (+22%). In contrast, energy (-38%) fell hard along with the price of crude oil.
Comments from Co-Managers Gordon Scott and Zach Turner: For the fiscal year ending July 31, 2020, the fund's Retail Class shares returned -6.24%, trailing the gain of the benchmark S&P 500
® Index. The largest detractor from performance versus the benchmark was an overweighting and stock selection in the financials sector, primarily within the banks industry. Weak picks in the communication services sector, especially within the media & entertainment industry, also hurt. Further detracting from performance was an underweighting and stock picks in information technology. The fund's biggest individual relative detractor was an overweighting in General Electric, which returned about -42% the past 12 months. We reduced our stake in this company. Also hampering performance was our outsized stake in Wells Fargo, which returned about -47%. The stock was one of the fund’s largest holdings. Also hurting performance was our overweighting in Exxon Mobil, which returned roughly -40% and was also one of our biggest holdings. Conversely, the largest contributor to performance versus the benchmark was an underweighting in real estate. Also helping the fund's relative performance was an underweighting in materials and utilities. The fund's biggest individual relative contributor was an outsized stake in Bristol-Myers Squibb, which gained about 36% the past year. We decreased our position in this stock. Also boosting value was an underweighting in Boeing, which returned -53%. This was a position we established the past 12 months. Another notable relative contributor was an overweighting in Whirlpool (+16%). This period we added to our stake. Notable changes in positioning included a higher allocation to the information technology and energy sectors.
The views expressed above reflect those of the portfolio manager(s) only through the end of the period as stated on the cover of this report and do not necessarily represent the views of Fidelity or any other person in the Fidelity organization. Any such views are subject to change at any time based upon market or other conditions and Fidelity disclaims any responsibility to update such views. These views may not be relied on as investment advice and, because investment decisions for a Fidelity fund are based on numerous factors, may not be relied on as an indication of trading intent on behalf of any Fidelity fund.
Note to shareholders: On July 1, 2020, Zach Turner assumed co-management responsibilities for the fund, joining Gordon Scott.
Investment Summary (Unaudited)
Top Ten Stocks as of July 31, 2020
| | % of fund's net assets |
| Exxon Mobil Corp. | 4.6 |
| Altria Group, Inc. | 4.2 |
| Bank of America Corp. | 4.1 |
| Cisco Systems, Inc. | 3.8 |
| Comcast Corp. Class A | 3.4 |
| JPMorgan Chase & Co. | 3.3 |
| Wells Fargo & Co. | 3.0 |
| UnitedHealth Group, Inc. | 2.9 |
| Apple, Inc. | 2.7 |
| General Electric Co. | 2.5 |
| | 34.5 |
Top Five Market Sectors as of July 31, 2020
| | % of fund's net assets |
| Financials | 22.0 |
| Information Technology | 15.4 |
| Industrials | 13.5 |
| Consumer Discretionary | 11.9 |
| Health Care | 9.8 |
Asset Allocation (% of fund's net assets)
| As of July 31, 2020 * |
| | Stocks | 99.6% |
| | Short-Term Investments and Net Other Assets (Liabilities) | 0.4% |

* Foreign investments - 5.1%
Schedule of Investments July 31, 2020
Showing Percentage of Net Assets
| Common Stocks - 99.6% | | | |
| | | Shares | Value (000s) |
| COMMUNICATION SERVICES - 8.0% | | | |
| Media - 8.0% | | | |
| Comcast Corp. Class A | | 4,746,492 | $203,150 |
| Discovery Communications, Inc. Class A (a)(b) | | 1,174,100 | 24,774 |
| Interpublic Group of Companies, Inc. | | 4,959,700 | 89,523 |
| Liberty Media Corp.: | | | |
| Liberty SiriusXM Series A (a) | | 321,900 | 11,199 |
| Liberty SiriusXM Series C (a) | | 1 | 0 |
| Nexstar Broadcasting Group, Inc. Class A | | 74,600 | 6,539 |
| Omnicom Group, Inc. | | 1,513,500 | 81,320 |
| ViacomCBS, Inc. Class B (b) | | 2,254,700 | 58,780 |
| | | | 475,285 |
| CONSUMER DISCRETIONARY - 11.9% | | | |
| Auto Components - 2.4% | | | |
| BorgWarner, Inc. (b) | | 2,206,000 | 80,740 |
| Lear Corp. | | 565,000 | 62,365 |
| | | | 143,105 |
| Automobiles - 1.9% | | | |
| General Motors Co. | | 3,570,100 | 88,860 |
| Harley-Davidson, Inc. (b) | | 993,000 | 25,848 |
| | | | 114,708 |
| Distributors - 0.9% | | | |
| LKQ Corp. (a) | | 1,854,300 | 52,273 |
| Diversified Consumer Services - 0.9% | | | |
| H&R Block, Inc. | | 3,653,300 | 52,973 |
| Household Durables - 3.4% | | | |
| Lennar Corp. Class A | | 853,600 | 61,758 |
| Whirlpool Corp. (b) | | 834,600 | 136,140 |
| | | | 197,898 |
| Textiles, Apparel & Luxury Goods - 2.4% | | | |
| Hanesbrands, Inc. (b) | | 1,470,500 | 20,778 |
| PVH Corp. | | 1,264,201 | 61,516 |
| Tapestry, Inc. | | 4,449,500 | 59,445 |
| | | | 141,739 |
|
| TOTAL CONSUMER DISCRETIONARY | | | 702,696 |
|
| CONSUMER STAPLES - 5.9% | | | |
| Household Products - 1.7% | | | |
| Energizer Holdings, Inc. | | 857,800 | 43,002 |
| Spectrum Brands Holdings, Inc. | | 1,033,075 | 55,951 |
| | | | 98,953 |
| Tobacco - 4.2% | | | |
| Altria Group, Inc. | | 6,033,914 | 248,296 |
|
| TOTAL CONSUMER STAPLES | | | 347,249 |
|
| ENERGY - 9.2% | | | |
| Energy Equipment & Services - 0.6% | | | |
| Halliburton Co. | | 2,396,700 | 34,345 |
| Oil, Gas & Consumable Fuels - 8.6% | | | |
| Chevron Corp. | | 627,800 | 52,698 |
| Equinor ASA sponsored ADR | | 4,800,600 | 71,577 |
| Exxon Mobil Corp. | | 6,457,297 | 271,717 |
| Phillips 66 Co. | | 1,182,600 | 73,345 |
| Valero Energy Corp. | | 682,400 | 38,371 |
| | | | 507,708 |
|
| TOTAL ENERGY | | | 542,053 |
|
| FINANCIALS - 22.0% | | | |
| Banks - 16.8% | | | |
| Bank of America Corp. | | 9,653,617 | 240,182 |
| Citigroup, Inc. | | 961,800 | 48,100 |
| Comerica, Inc. | | 517,700 | 19,942 |
| Fifth Third Bancorp | | 2,786,000 | 55,330 |
| JPMorgan Chase & Co. | | 2,001,135 | 193,390 |
| M&T Bank Corp. | | 678,400 | 71,876 |
| PNC Financial Services Group, Inc. | | 868,800 | 92,675 |
| U.S. Bancorp | | 2,599,100 | 95,751 |
| Wells Fargo & Co. | | 7,281,393 | 176,647 |
| | | | 993,893 |
| Capital Markets - 0.7% | | | |
| Raymond James Financial, Inc. | | 623,300 | 43,307 |
| Consumer Finance - 2.9% | | | |
| American Express Co. | | 125,200 | 11,684 |
| Discover Financial Services | | 2,286,200 | 113,007 |
| Synchrony Financial | | 2,198,800 | 48,659 |
| | | | 173,350 |
| Insurance - 1.6% | | | |
| American International Group, Inc. | | 1,194,000 | 38,375 |
| The Travelers Companies, Inc. | | 475,000 | 54,350 |
| | | | 92,725 |
|
| TOTAL FINANCIALS | | | 1,303,275 |
|
| HEALTH CARE - 9.8% | | | |
| Biotechnology - 0.1% | | | |
| AbbVie, Inc. | | 67,700 | 6,425 |
| Health Care Equipment & Supplies - 0.4% | | | |
| Envista Holdings Corp. (a) | | 1,008,500 | 22,056 |
| Health Care Providers & Services - 7.6% | | | |
| Anthem, Inc. | | 374,300 | 102,483 |
| Cigna Corp. | | 550,500 | 95,066 |
| CVS Health Corp. | | 1,278,700 | 80,481 |
| UnitedHealth Group, Inc. | | 570,906 | 172,859 |
| | | | 450,889 |
| Pharmaceuticals - 1.7% | | | |
| Bayer AG | | 1,111,200 | 73,821 |
| Bristol-Myers Squibb Co. | | 495,900 | 29,089 |
| | | | 102,910 |
|
| TOTAL HEALTH CARE | | | 582,280 |
|
| INDUSTRIALS - 13.5% | | | |
| Aerospace & Defense - 0.4% | | | |
| The Boeing Co. | | 152,300 | 24,063 |
| Air Freight & Logistics - 2.3% | | | |
| FedEx Corp. | | 287,000 | 48,331 |
| United Parcel Service, Inc. Class B | | 604,900 | 86,356 |
| | | | 134,687 |
| Electrical Equipment - 0.3% | | | |
| AMETEK, Inc. | | 166,300 | 15,507 |
| Industrial Conglomerates - 2.5% | | | |
| General Electric Co. | | 24,656,300 | 149,664 |
| Machinery - 5.6% | | | |
| Allison Transmission Holdings, Inc. | | 896,002 | 33,475 |
| Caterpillar, Inc. | | 197,800 | 26,284 |
| Cummins, Inc. | | 461,100 | 89,112 |
| Fortive Corp. | | 335,100 | 23,521 |
| PACCAR, Inc. | | 1,087,600 | 92,533 |
| Snap-On, Inc. | | 458,800 | 66,925 |
| | | | 331,850 |
| Professional Services - 1.0% | | | |
| Nielsen Holdings PLC | | 2,798,400 | 40,381 |
| Robert Half International, Inc. | | 377,100 | 19,183 |
| | | | 59,564 |
| Road & Rail - 0.9% | | | |
| Knight-Swift Transportation Holdings, Inc. Class A (b) | | 825,684 | 35,909 |
| Ryder System, Inc. | | 489,000 | 17,912 |
| | | | 53,821 |
| Trading Companies & Distributors - 0.5% | | | |
| HD Supply Holdings, Inc. (a) | | 891,510 | 31,292 |
|
| TOTAL INDUSTRIALS | | | 800,448 |
|
| INFORMATION TECHNOLOGY - 15.4% | | | |
| Communications Equipment - 3.8% | | | |
| Cisco Systems, Inc. | | 4,711,800 | 221,926 |
| IT Services - 2.1% | | | |
| Amdocs Ltd. | | 728,200 | 45,221 |
| Cognizant Technology Solutions Corp. Class A | | 1,189,100 | 81,239 |
| | | | 126,460 |
| Software - 5.0% | | | |
| Microsoft Corp. | | 703,700 | 144,266 |
| Oracle Corp. | | 1,552,100 | 86,064 |
| SS&C Technologies Holdings, Inc. | | 1,151,300 | 66,200 |
| | | | 296,530 |
| Technology Hardware, Storage & Peripherals - 4.5% | | | |
| Apple, Inc. | | 378,318 | 160,800 |
| HP, Inc. | | 5,944,700 | 104,508 |
| | | | 265,308 |
|
| TOTAL INFORMATION TECHNOLOGY | | | 910,224 |
|
| MATERIALS - 3.2% | | | |
| Chemicals - 3.2% | | | |
| DuPont de Nemours, Inc. | | 1,184,000 | 63,320 |
| LyondellBasell Industries NV Class A | | 1,240,300 | 77,544 |
| Valvoline, Inc. | | 1,441,800 | 29,586 |
| W.R. Grace & Co. | | 374,000 | 17,253 |
| | | | 187,703 |
| REAL ESTATE - 0.7% | | | |
| Equity Real Estate Investment Trusts (REITs) - 0.7% | | | |
| National Retail Properties, Inc. | | 442,000 | 15,669 |
| Realty Income Corp. | | 218,000 | 13,091 |
| Simon Property Group, Inc. | | 193,100 | 12,040 |
| | | | 40,800 |
| TOTAL COMMON STOCKS | | | |
| (Cost $5,898,909) | | | 5,892,013 |
|
| Money Market Funds - 3.8% | | | |
| Fidelity Cash Central Fund 0.14% (c) | | 18,957,945 | 18,964 |
| Fidelity Securities Lending Cash Central Fund 0.13% (c)(d) | | 203,386,683 | 203,407 |
| TOTAL MONEY MARKET FUNDS | | | |
| (Cost $222,370) | | | 222,371 |
| TOTAL INVESTMENT IN SECURITIES - 103.4% | | | |
| (Cost $6,121,279) | | | 6,114,384 |
| NET OTHER ASSETS (LIABILITIES) - (3.4)% | | | (201,888) |
| NET ASSETS - 100% | | | $5,912,496 |
Values shown as $0 in the Schedule of Investments may reflect amounts less than $500.
Legend
(a) Non-income producing
(b) Security or a portion of the security is on loan at period end.
(c) Affiliated fund that is generally available only to investment companies and other accounts managed by Fidelity Investments. The rate quoted is the annualized seven-day yield of the fund at period end. A complete unaudited listing of the fund's holdings as of its most recent quarter end is available upon request. In addition, each Fidelity Central Fund's financial statements, which are not covered by the Fund's Report of Independent Registered Public Accounting Firm, are available on the SEC's website or upon request.
(d) Investment made with cash collateral received from securities on loan.
Affiliated Central Funds
Information regarding fiscal year to date income earned by the Fund from investments in Fidelity Central Funds is as follows:
| Fund | Income earned |
| | (Amounts in thousands) |
| Fidelity Cash Central Fund | $162 |
| Fidelity Securities Lending Cash Central Fund | 763 |
| Total | $925 |
Amounts in the income column in the above table include any capital gain distributions from underlying funds, which are presented in the corresponding line-item in the Statement of Operations, if applicable. Amount for Fidelity Securities Lending Cash Central Fund represents the income earned on investing cash collateral, less rebates paid to borrowers and any lending agent fees associated with the loan, plus any premium payments received for lending certain types of securities.
Investment Valuation
The following is a summary of the inputs used, as of July 31, 2020, involving the Fund's assets and liabilities carried at fair value. The inputs or methodology used for valuing securities may not be an indication of the risk associated with investing in those securities. For more information on valuation inputs, and their aggregation into the levels used below, please refer to the Investment Valuation section in the accompanying Notes to Financial Statements.
| | Valuation Inputs at Reporting Date: |
| Description | Total | Level 1 | Level 2 | Level 3 |
| (Amounts in thousands) | | | | |
| Investments in Securities: | | | | |
| Equities: | | | | |
| Communication Services | $475,285 | $475,285 | $-- | $-- |
| Consumer Discretionary | 702,696 | 702,696 | -- | -- |
| Consumer Staples | 347,249 | 347,249 | -- | -- |
| Energy | 542,053 | 542,053 | -- | -- |
| Financials | 1,303,275 | 1,303,275 | -- | -- |
| Health Care | 582,280 | 508,459 | 73,821 | -- |
| Industrials | 800,448 | 800,448 | -- | -- |
| Information Technology | 910,224 | 910,224 | -- | -- |
| Materials | 187,703 | 187,703 | -- | -- |
| Real Estate | 40,800 | 40,800 | -- | -- |
| Money Market Funds | 222,371 | 222,371 | -- | -- |
| Total Investments in Securities: | $6,114,384 | $6,040,563 | $73,821 | $-- |
See accompanying notes which are an integral part of the financial statements.
Financial Statements
Statement of Assets and Liabilities
| Amounts in thousands (except per-share amounts) | | July 31, 2020 |
| Assets | | |
Investment in securities, at value (including securities loaned of $198,693) — See accompanying schedule:
Unaffiliated issuers (cost $5,898,909) | $5,892,013 | |
| Fidelity Central Funds (cost $222,370) | 222,371 | |
| Total Investment in Securities (cost $6,121,279) | | $6,114,384 |
| Receivable for investments sold | | 26,941 |
| Receivable for fund shares sold | | 1,115 |
| Dividends receivable | | 4,847 |
| Distributions receivable from Fidelity Central Funds | | 48 |
| Prepaid expenses | | 1 |
| Other receivables | | 953 |
| Total assets | | 6,148,289 |
| Liabilities | | |
| Payable for investments purchased | $23,893 | |
| Payable for fund shares redeemed | 5,635 | |
| Accrued management fee | 1,453 | |
| Other affiliated payables | 740 | |
| Other payables and accrued expenses | 670 | |
| Collateral on securities loaned | 203,402 | |
| Total liabilities | | 235,793 |
| Net Assets | | $5,912,496 |
| Net Assets consist of: | | |
| Paid in capital | | $5,890,812 |
| Total accumulated earnings (loss) | | 21,684 |
| Net Assets | | $5,912,496 |
| Net Asset Value and Maximum Offering Price | | |
| Dividend Growth: | | |
| Net Asset Value, offering price and redemption price per share ($4,684,814 ÷ 177,580 shares) | | $26.38 |
| Class K: | | |
| Net Asset Value, offering price and redemption price per share ($1,227,682 ÷ 46,575 shares) | | $26.36 |
See accompanying notes which are an integral part of the financial statements.
Statement of Operations
| Amounts in thousands | | Year ended July 31, 2020 |
| Investment Income | | |
| Dividends | | $168,768 |
| Income from Fidelity Central Funds (including $763 from security lending) | | 925 |
| Total income | | 169,693 |
| Expenses | | |
| Management fee | | |
| Basic fee | $34,912 | |
| Performance adjustment | (14,029) | |
| Transfer agent fees | 8,232 | |
| Accounting fees | 1,145 | |
| Custodian fees and expenses | 49 | |
| Independent trustees' fees and expenses | 42 | |
| Registration fees | 76 | |
| Audit | 69 | |
| Legal | 21 | |
| Interest | 14 | |
| Miscellaneous | 104 | |
| Total expenses before reductions | 30,635 | |
| Expense reductions | (607) | |
| Total expenses after reductions | | 30,028 |
| Net investment income (loss) | | 139,665 |
| Realized and Unrealized Gain (Loss) | | |
| Net realized gain (loss) on: | | |
| Investment securities: | | |
| Unaffiliated issuers | 49,469 | |
| Fidelity Central Funds | 14 | |
| Total net realized gain (loss) | | 49,483 |
| Change in net unrealized appreciation (depreciation) on: | | |
| Investment securities: | | |
| Unaffiliated issuers | (640,278) | |
| Fidelity Central Funds | (2) | |
| Assets and liabilities in foreign currencies | 70 | |
| Total change in net unrealized appreciation (depreciation) | | (640,210) |
| Net gain (loss) | | (590,727) |
| Net increase (decrease) in net assets resulting from operations | | $(451,062) |
See accompanying notes which are an integral part of the financial statements.
Statement of Changes in Net Assets
| Amounts in thousands | Year ended July 31, 2020 | Year ended July 31, 2019 |
| Increase (Decrease) in Net Assets | | |
| Operations | | |
| Net investment income (loss) | $139,665 | $141,419 |
| Net realized gain (loss) | 49,483 | 275,109 |
| Change in net unrealized appreciation (depreciation) | (640,210) | (78,122) |
| Net increase (decrease) in net assets resulting from operations | (451,062) | 338,406 |
| Distributions to shareholders | (360,272) | (1,248,508) |
| Share transactions - net increase (decrease) | (484,245) | 851,366 |
| Total increase (decrease) in net assets | (1,295,579) | (58,736) |
| Net Assets | | |
| Beginning of period | 7,208,075 | 7,266,811 |
| End of period | $5,912,496 | $7,208,075 |
See accompanying notes which are an integral part of the financial statements.
Financial Highlights
Fidelity Dividend Growth Fund
| Years ended July 31, | 2020 | 2019 | 2018 | 2017 | 2016 |
| Selected Per–Share Data | | | | | |
| Net asset value, beginning of period | $29.59 | $33.79 | $35.06 | $31.51 | $34.46 |
| Income from Investment Operations | | | | | |
| Net investment income (loss)A | .58 | .59 | .65 | .53 | .48 |
| Net realized and unrealized gain (loss) | (2.29) | 1.01B | 3.72 | 3.53 | (.61)C |
| Total from investment operations | (1.71) | 1.60 | 4.37 | 4.06 | (.13) |
| Distributions from net investment income | (.49) | (.60) | (.60) | (.51) | (.47) |
| Distributions from net realized gain | (1.01) | (5.20) | (5.04) | – | (2.36) |
| Total distributions | (1.50) | (5.80) | (5.64) | (.51) | (2.82)D |
| Net asset value, end of period | $26.38 | $29.59 | $33.79 | $35.06 | $31.51 |
| Total ReturnE | (6.24)% | 5.38%B | 13.60% | 13.06% | .26%C |
| Ratios to Average Net AssetsF,G | | | | | |
| Expenses before reductions | .49% | .50% | .50% | .52% | .62% |
| Expenses net of fee waivers, if any | .49% | .50% | .50% | .52% | .61% |
| Expenses net of all reductions | .48% | .49% | .49% | .52% | .61% |
| Net investment income (loss) | 2.11% | 2.05% | 1.94% | 1.60% | 1.59% |
| Supplemental Data | | | | | |
| Net assets, end of period (in millions) | $4,685 | $5,728 | $6,055 | $5,952 | $5,849 |
| Portfolio turnover rateH | 69% | 101% | 115% | 43% | 30% |
A Calculated based on average shares outstanding during the period.
B Net realized and unrealized gain (loss) per share reflects proceeds received from litigation which amounted to $.05 per share. Excluding these litigation proceeds, the total return would have been 5.19%.
C Net realized and unrealized gain (loss) per share reflects proceeds received from litigation which amounted to $.01 per share. Excluding these litigation proceeds, the total return would have been .22%.
D Total distributions of $2.82 per share is comprised of distributions from net investment income of $.465 and distributions from net realized gain of $2.358 per share.
E Total returns would have been lower if certain expenses had not been reduced during the applicable periods shown.
F Fees and expenses of any underlying mutual funds or exchange-traded funds (ETFs) are not included in the Fund's expense ratio. The Fund indirectly bears its proportionate share of these expenses. For additional expense information related to investments in Fidelity Central Funds, please refer to the "Investments in Fidelity Central Funds" note found in the Notes to Financial Statements section of the most recent Annual or Semi-Annual report.
G Expense ratios reflect operating expenses of the class. Expenses before reductions do not reflect amounts reimbursed by the investment adviser or reductions from brokerage service arrangements or reductions from other expense offset arrangements and do not represent the amount paid by the class during periods when reimbursements or reductions occur. Expenses net of fee waivers reflect expenses after reimbursement by the investment adviser but prior to reductions from brokerage service arrangements or other expense offset arrangements. Expenses net of all reductions represent the net expenses paid by the class.
H Amount does not include the portfolio activity of any underlying Fidelity Central Funds.
See accompanying notes which are an integral part of the financial statements.
Fidelity Dividend Growth Fund Class K
| Years ended July 31, | 2020 | 2019 | 2018 | 2017 | 2016 |
| Selected Per–Share Data | | | | | |
| Net asset value, beginning of period | $29.56 | $33.76 | $35.04 | $31.50 | $34.45 |
| Income from Investment Operations | | | | | |
| Net investment income (loss)A | .61 | .63 | .69 | .56 | .52 |
| Net realized and unrealized gain (loss) | (2.28) | 1.01B | 3.71 | 3.53 | (.61)C |
| Total from investment operations | (1.67) | 1.64 | 4.40 | 4.09 | (.09) |
| Distributions from net investment income | (.52) | (.63) | (.64) | (.55) | (.50) |
| Distributions from net realized gain | (1.01) | (5.20) | (5.04) | – | (2.36) |
| Total distributions | (1.53) | (5.84)D | (5.68) | (.55) | (2.86) |
| Net asset value, end of period | $26.36 | $29.56 | $33.76 | $35.04 | $31.50 |
| Total ReturnE | (6.11)% | 5.50%B | 13.70% | 13.16% | .39%C |
| Ratios to Average Net AssetsF,G | | | | | |
| Expenses before reductions | .39% | .40% | .40% | .41% | .50% |
| Expenses net of fee waivers, if any | .39% | .39% | .40% | .41% | .50% |
| Expenses net of all reductions | .38% | .38% | .39% | .41% | .49% |
| Net investment income (loss) | 2.22% | 2.16% | 2.05% | 1.71% | 1.71% |
| Supplemental Data | | | | | |
| Net assets, end of period (in millions) | $1,228 | $1,480 | $1,212 | $1,477 | $1,691 |
| Portfolio turnover rateH | 69% | 101% | 115% | 43% | 30% |
A Calculated based on average shares outstanding during the period.
B Net realized and unrealized gain (loss) per share reflects proceeds received from litigation which amounted to $.05 per share. Excluding these litigation proceeds, the total return would have been 5.31%.
C Net realized and unrealized gain (loss) per share reflects proceeds received from litigation which amounted to $.01 per share. Excluding these litigation proceeds, the total return would have been .35%.
D Total distributions of $5.84 per share is comprised of distributions from net investment income of $.632 and distributions from net realized gain of $5.203 per share.
E Total returns would have been lower if certain expenses had not been reduced during the applicable periods shown.
F Fees and expenses of any underlying mutual funds or exchange-traded funds (ETFs) are not included in the Fund's expense ratio. The Fund indirectly bears its proportionate share of these expenses. For additional expense information related to investments in Fidelity Central Funds, please refer to the "Investments in Fidelity Central Funds" note found in the Notes to Financial Statements section of the most recent Annual or Semi-Annual report.
G Expense ratios reflect operating expenses of the class. Expenses before reductions do not reflect amounts reimbursed by the investment adviser or reductions from brokerage service arrangements or reductions from other expense offset arrangements and do not represent the amount paid by the class during periods when reimbursements or reductions occur. Expenses net of fee waivers reflect expenses after reimbursement by the investment adviser but prior to reductions from brokerage service arrangements or other expense offset arrangements. Expenses net of all reductions represent the net expenses paid by the class.
H Amount does not include the portfolio activity of any underlying Fidelity Central Funds.
See accompanying notes which are an integral part of the financial statements.
Notes to Financial Statements
For the period ended July 31, 2020
(Amounts in thousands except percentages)
1. Organization.
Fidelity Dividend Growth Fund (the Fund) is a fund of Fidelity Securities Fund (the Trust) and is authorized to issue an unlimited number of shares. The Trust is registered under the Investment Company Act of 1940, as amended (the 1940 Act), as an open-end management investment company organized as a Massachusetts business trust. The Fund offers Dividend Growth and Class K shares, each of which has equal rights as to assets and voting privileges. Each class has exclusive voting rights with respect to matters that affect that class.
Effective January 1, 2020:
Investment advisers Fidelity Investments Money Management, Inc., FMR Co., Inc., and Fidelity SelectCo, LLC, merged with and into Fidelity Management & Research Company. In connection with the merger transactions, the resulting, merged investment adviser was then redomiciled from Massachusetts to Delaware, changed its corporate structure from a corporation to a limited liability company, and changed its name to "Fidelity Management & Research Company LLC".
Fidelity Investments Institutional Operations Company, Inc. converted from a Massachusetts corporation to a Massachusetts LLC, and changed its name to "Fidelity Investments Institutional Operations Company LLC".
2. Investments in Fidelity Central Funds.
The Fund invests in Fidelity Central Funds, which are open-end investment companies generally available only to other investment companies and accounts managed by the investment adviser and its affiliates. The Fund's Schedule of Investments lists each of the Fidelity Central Funds held as of period end, if any, as an investment of the Fund, but does not include the underlying holdings of each Fidelity Central Fund. As an Investing Fund, the Fund indirectly bears its proportionate share of the expenses of the underlying Fidelity Central Funds.
The Money Market Central Funds seek preservation of capital and current income and are managed by the investment adviser. Annualized expenses of the Money Market Central Funds as of their most recent shareholder report date ranged from less than .005% to .01%.
A complete unaudited list of holdings for each Fidelity Central Fund is available upon request or at the Securities and Exchange Commission (the SEC) website at www.sec.gov. In addition, the financial statements of the Fidelity Central Funds, which are not covered by the Fund's Report of Independent Registered Public Accounting Firm, are available on the SEC website or upon request.
3. Significant Accounting Policies.
The Fund is an investment company and applies the accounting and reporting guidance of the Financial Accounting Standards Board (FASB) Accounting Standards Codification Topic 946 Financial Services – Investment Companies. The financial statements have been prepared in conformity with accounting principles generally accepted in the United States of America (GAAP), which require management to make certain estimates and assumptions at the date of the financial statements. Actual results could differ from those estimates. Subsequent events, if any, through the date that the financial statements were issued have been evaluated in the preparation of the financial statements. The following summarizes the significant accounting policies of the Fund:
Investment Valuation. Investments are valued as of 4:00 p.m. Eastern time on the last calendar day of the period. The Board of Trustees (the Board) has delegated the day to day responsibility for the valuation of the Fund's investments to the Fair Value Committee (the Committee) established by the Fund's investment adviser. In accordance with valuation policies and procedures approved by the Board, the Fund attempts to obtain prices from one or more third party pricing vendors or brokers to value its investments. When current market prices, quotations or currency exchange rates are not readily available or reliable, investments will be fair valued in good faith by the Committee, in accordance with procedures adopted by the Board. Factors used in determining fair value vary by investment type and may include market or investment specific events. The frequency with which these procedures are used cannot be predicted and they may be utilized to a significant extent. The Committee oversees the Fund's valuation policies and procedures and reports to the Board on the Committee's activities and fair value determinations. The Board monitors the appropriateness of the procedures used in valuing the Fund's investments and ratifies the fair value determinations of the Committee.
The Fund categorizes the inputs to valuation techniques used to value its investments into a disclosure hierarchy consisting of three levels as shown below:
- Level 1 – quoted prices in active markets for identical investments
- Level 2 – other significant observable inputs (including quoted prices for similar investments, interest rates, prepayment speeds, etc.)
- Level 3 – unobservable inputs (including the Fund's own assumptions based on the best information available)
Valuation techniques used to value the Fund's investments by major category are as follows:
Equity securities, including restricted securities, for which market quotations are readily available, are valued at the last reported sale price or official closing price as reported by a third party pricing vendor on the primary market or exchange on which they are traded and are categorized as Level 1 in the hierarchy. In the event there were no sales during the day or closing prices are not available, securities are valued at the last quoted bid price or may be valued using the last available price and are generally categorized as Level 2 in the hierarchy. For foreign equity securities, when market or security specific events arise, comparisons to the valuation of American Depositary Receipts (ADRs), futures contracts, Exchange-Traded Funds (ETFs) and certain indexes as well as quoted prices for similar securities may be used and would be categorized as Level 2 in the hierarchy. For equity securities, including restricted securities, where observable inputs are limited, assumptions about market activity and risk are used and these securities may be categorized as Level 3 in the hierarchy.
Investments in open-end mutual funds, including the Fidelity Central Funds, are valued at their closing net asset value (NAV) each business day and are categorized as Level 1 in the hierarchy.
Changes in valuation techniques may result in transfers in or out of an assigned level within the disclosure hierarchy. The aggregate value of investments by input level as of July 31, 2020 is included at the end of the Fund's Schedule of Investments.
Foreign Currency. The Fund may use foreign currency contracts to facilitate transactions in foreign-denominated securities. Gains and losses from these transactions may arise from changes in the value of the foreign currency or if the counterparties do not perform under the contracts' terms.
Foreign-denominated assets, including investment securities, and liabilities are translated into U.S. dollars at the exchange rates at period end. Purchases and sales of investment securities, income and dividends received and expenses denominated in foreign currencies are translated into U.S. dollars at the exchange rate in effect on the transaction date.
The effects of exchange rate fluctuations on investments are included with the net realized and unrealized gain (loss) on investment securities. Other foreign currency transactions resulting in realized and unrealized gain (loss) are disclosed separately.
Investment Transactions and Income. For financial reporting purposes, the Fund's investment holdings and NAV include trades executed through the end of the last business day of the period. The NAV per share for processing shareholder transactions is calculated as of the close of business of the New York Stock Exchange (NYSE), normally 4:00 p.m. Eastern time and includes trades executed through the end of the prior business day. Gains and losses on securities sold are determined on the basis of identified cost and include proceeds received from litigation. Dividend income is recorded on the ex-dividend date, except for certain dividends from foreign securities where the ex-dividend date may have passed, which are recorded as soon as the Fund is informed of the ex-dividend date. Non-cash dividends included in dividend income, if any, are recorded at the fair market value of the securities received. Income and capital gain distributions from Fidelity Central Funds, if any, are recorded on the ex-dividend date. Certain distributions received by the Fund represent a return of capital or capital gain. The Fund determines the components of these distributions subsequent to the ex-dividend date, based upon receipt of tax filings or other correspondence relating to the underlying investment. These distributions are recorded as a reduction of cost of investments and/or as a realized gain. Investment income is recorded net of foreign taxes withheld where recovery of such taxes is uncertain.
Class Allocations and Expenses. Investment income, realized and unrealized capital gains and losses, common expenses of the Fund, and certain fund-level expense reductions, if any, are allocated daily on a pro-rata basis to each class based on the relative net assets of each class to the total net assets of the Fund. Each class differs with respect to transfer agent fees incurred. Certain expense reductions may also differ by class. For the reporting period, the allocated portion of income and expenses to each class as a percent of its average net assets may vary due to the timing of recording these transactions in relation to fluctuating net assets of the classes. Expenses directly attributable to a fund are charged to that fund. Expenses attributable to more than one fund are allocated among the respective funds on the basis of relative net assets or other appropriate methods. Expense estimates are accrued in the period to which they relate and adjustments are made when actual amounts are known.
Deferred Trustee Compensation. Under a Deferred Compensation Plan (the Plan) for the Fund, certain independent Trustees have elected to defer receipt of a portion of their annual compensation. Deferred amounts are invested in a cross-section of Fidelity funds, are marked-to-market and remain in the Fund until distributed in accordance with the Plan. The investment of deferred amounts and the offsetting payable to the Trustees of $571 are included in the accompanying Statement of Assets and Liabilities in other receivables and other payables and accrued expenses, respectively.
Income Tax Information and Distributions to Shareholders. Each year, the Fund intends to qualify as a regulated investment company under Subchapter M of the Internal Revenue Code, including distributing substantially all of its taxable income and realized gains. As a result, no provision for U.S. Federal income taxes is required. As of July 31, 2020, the Fund did not have any unrecognized tax benefits in the financial statements; nor is the Fund aware of any tax positions for which it is reasonably possible that the total amounts of unrecognized tax benefits will significantly change in the next twelve months. The Fund files a U.S. federal tax return, in addition to state and local tax returns as required. The Fund's federal income tax returns are subject to examination by the Internal Revenue Service (IRS) for a period of three fiscal years after they are filed. State and local tax returns may be subject to examination for an additional fiscal year depending on the jurisdiction. Foreign taxes are provided for based on the Fund's understanding of the tax rules and rates that exist in the foreign markets in which it invests.
Distributions are declared and recorded on the ex-dividend date. Income and capital gain distributions are declared separately for each class. Income and capital gain distributions are determined in accordance with income tax regulations, which may differ from GAAP. In addition, the Fund claimed a portion of the payment made to redeeming shareholders as a distribution for income tax purposes.
Capital accounts within the financial statements are adjusted for permanent book-tax differences. These adjustments have no impact on net assets or the results of operations. Capital accounts are not adjusted for temporary book-tax differences which will reverse in a subsequent period.
Book-tax differences are primarily due to foreign currency transactions, deferred trustees compensation, partnerships and losses deferred due to wash sales and excise tax regulations.
As of period end, the cost and unrealized appreciation (depreciation) in securities, and derivatives if applicable, for federal income tax purposes were as follows:
| Gross unrealized appreciation | $847,098 |
| Gross unrealized depreciation | (884,564) |
| Net unrealized appreciation (depreciation) | $(37,466) |
| Tax Cost | $6,151,850 |
The tax-based components of distributable earnings as of period end were as follows:
| Undistributed ordinary income | $80,876 |
| Net unrealized appreciation (depreciation) on securities and other investments | $(37,405) |
The Fund intends to elect to defer to its next fiscal year $21,216 of capital losses recognized during the period November 1, 2019 to July 31, 2020.
The tax character of distributions paid was as follows:
| | July 31, 2020 | July 31, 2019 |
| Ordinary Income | $118,787 | $ 337,616 |
| Long-term Capital Gains | 241,485 | 910,892 |
| Total | $360,272 | $ 1,248,508 |
4. Purchases and Sales of Investments.
Purchases and sales of securities, other than short-term securities, are noted in the table below.
| | Purchases ($) | Sales ($) |
| Fidelity Dividend Growth Fund | 4,474,332 | 5,173,288 |
5. Fees and Other Transactions with Affiliates.
Management Fee. Fidelity Management & Research Company LLC (the investment adviser) and its affiliates provide the Fund with investment management related services for which the Fund pays a monthly management fee. The management fee is the sum of an individual fund fee rate that is based on an annual rate of .30% of the Fund's average net assets and an annualized group fee rate that averaged .23% during the period. The group fee rate is based upon the monthly average net assets of a group of registered investment companies with which the investment adviser has management contracts. The group fee rate decreases as assets under management increase and increases as assets under management decrease. In addition, the management fee is subject to a performance adjustment (up to a maximum of +/- .20% of the Fund's average net assets over a 36 month performance period). The upward or downward adjustment to the management fee is based on the relative investment performance of Dividend Growth as compared to its benchmark index, the S&P 500 Index, over the same 36 month performance period. For the reporting period, the total annual management fee rate, including the performance adjustment, was .32% of the Fund's average net assets. The performance adjustment included in the management fee rate may be higher or lower than the maximum performance adjustment rate due to the difference between the average net assets for the reporting and performance periods.
Transfer Agent Fees. Fidelity Investments Institutional Operations Company LLC (FIIOC), an affiliate of the investment adviser, is the transfer, dividend disbursing and shareholder servicing agent for each class of the Fund. FIIOC receives account fees and asset-based fees that vary according to the account size and type of account of the shareholders of Dividend Growth, except for Class K. FIIOC receives an asset-based fee of Class K's average net assets. FIIOC pays for typesetting, printing and mailing of shareholder reports, except proxy statements. Effective February 1, 2020, the Board approved to change the fee for Class K from .046% to .044%.
For the period, transfer agent fees for each class were as follows:
| | Amount | % of Class-Level Average Net Assets |
| Dividend Growth | $7,626 | .15 |
| Class K | 606 | .04 |
| | $8,232 | |
Accounting Fees. Fidelity Service Company, Inc. (FSC), an affiliate of the investment adviser, maintains the Fund's accounting records. The accounting fee is based on the level of average net assets for each month. For the period, the fees were equivalent to the following annual rates:
| | % of Average Net Assets |
| Fidelity Dividend Growth Fund | .02 |
Brokerage Commissions. A portion of portfolio transactions were placed with brokerage firms which are affiliates of the investment adviser. Brokerage commissions are included in net realized gain (loss) and change in net unrealized appreciation (depreciation) in the Statement of Operations. The commissions paid to these affiliated firms were as follows:
| | Amount |
| Fidelity Dividend Growth Fund | $179 |
Interfund Lending Program. Pursuant to an Exemptive Order issued by the SEC, the fund, along with other registered investment companies having management contracts with Fidelity Management & Research Company LLC (FMR), or other affiliated entities of FMR, may participate in an interfund lending program. This program provides an alternative credit facility allowing the fund to borrow from, or lend money to, other participating affiliated funds. At period end, there were no interfund loans outstanding. Activity in this program during the period for which loans were outstanding was as follows:
| | Borrower or Lender | Average Loan Balance | Weighted Average Interest Rate | Interest Expense |
| Fidelity Dividend Growth Fund | Borrower | $10,564 | 1.19% | $12 |
Interfund Trades. Funds may purchase from or sell securities to other Fidelity Funds under procedures adopted by the Board. The procedures have been designed to ensure these interfund trades are executed in accordance with Rule 17a-7 of the 1940 Act. Interfund trades are included within the respective purchases and sales amounts shown in the Purchases and Sales of Investments note.
6. Committed Line of Credit.
Certain Funds participate with other funds managed by the investment adviser or an affiliate in a $4.25 billion credit facility (the "line of credit") to be utilized for temporary or emergency purposes to fund shareholder redemptions or for other short-term liquidity purposes. The participating funds have agreed to pay commitment fees on their pro-rata portion of the line of credit, which are reflected in Miscellaneous expenses on the Statement of Operations, and are as follows:
| | Amount |
| Fidelity Dividend Growth Fund | $16 |
During the period, there were no borrowings on this line of credit.
7. Security Lending.
The Fund lends portfolio securities from time to time in order to earn additional income. Lending agents are used, including National Financial Services (NFS), an affiliate of the Fund. Pursuant to a securities lending agreement, NFS will receive a fee, which is capped at 9.9% of daily lending revenue, for its services as lending agent. The Fund may lend securities to certain qualified borrowers, including NFS. On the settlement date of the loan, the Fund receives collateral (in the form of U.S. Treasury obligations, letters of credit and/or cash) against the loaned securities and maintains collateral in an amount not less than 100% of the market value of the loaned securities during the period of the loan. The market value of the loaned securities is determined at the close of business of the Fund and any additional required collateral is delivered to the Fund on the next business day. The Fund or borrower may terminate the loan at any time, and if the borrower defaults on its obligation to return the securities loaned because of insolvency or other reasons, the Fund may apply collateral received from the borrower against the obligation. The Fund may experience delays and costs in recovering the securities loaned. Any cash collateral received is invested in the Fidelity Securities Lending Cash Central Fund. The value of loaned securities and cash collateral at period end are disclosed on the Fund's Statement of Assets and Liabilities. At period end, there were no security loans outstanding with NFS, as affiliated borrower. Total fees paid by the Fund to NFS, as lending agent, amounted to $59. Security lending income represents the income earned on investing cash collateral, less rebates paid to borrowers and any lending agent fees associated with the loan, plus any premium payments received for lending certain types of securities. Net income from the Fidelity Securities Lending Cash Central Fund during the period is presented in the Statement of Operations as a component of income from Fidelity Central Funds (and includes $2 from securities loaned to NFS, as affiliated borrower).
8. Bank Borrowings.
The Fund is permitted to have bank borrowings for temporary or emergency purposes to fund shareholder redemptions or for other short-term liquidity requirements. The Fund has established borrowing arrangements with certain banks. The interest rate on the borrowings is the bank's base rate, as revised from time to time. Any open loans, including accrued interest, at period end are presented under the caption "Notes payable" in the Statement of Assets and Liabilities, if applicable. Activity in this program during the period for which loans were outstanding was as follows:
| | Average Loan Balance | Weighted Average Interest Rate | Interest Expense |
| Fidelity Dividend Growth Fund | $9,196 | .79% | $2 |
9. Expense Reductions.
Commissions paid to certain brokers with whom the investment adviser, or its affiliates, places trades on behalf of the Fund include an amount in addition to trade execution, which may be rebated back to the Fund to offset certain expenses. This amount totaled $577 for the period.
In addition, during the period the investment adviser or an affiliate reimbursed and/or waived a portion of fund-level operating expenses in the amount of $30.
10. Distributions to Shareholders.
Distributions to shareholders of each class were as follows:
| | Year ended
July 31, 2020 | Year ended
July 31, 2019 |
| Distributions to shareholders | | |
| Dividend Growth | $283,522 | $1,046,442 |
| Class K | 76,750 | 202,066 |
| Total | $360,272 | $1,248,508 |
11. Share Transactions.
Share transactions for each class were as follows and may contain automatic conversions between classes or exchanges between affiliated funds:
| | Shares | Shares | Dollars | Dollars |
| | Year ended July 31, 2020 | Year ended July 31, 2019 | Year ended July 31, 2020 | Year ended July 31, 2019 |
| Dividend Growth | | | | |
| Shares sold | 10,791 | 10,720 | $295,876 | $305,981 |
| Reinvestment of distributions | 9,212 | 34,200 | 270,346 | 997,153 |
| Shares redeemed | (36,024) | (30,538) | (968,773) | (872,370) |
| Net increase (decrease) | (16,021) | 14,382 | $(402,551) | $430,764 |
| Class K | | | | |
| Shares sold | 13,439 | 25,736 | $362,888 | $751,445 |
| Reinvestment of distributions | 2,620 | 6,925 | 76,750 | 202,066 |
| Shares redeemed | (19,551) | (18,490) | (521,332) | (532,909) |
| Net increase (decrease) | (3,492) | 14,171 | $(81,694) | $420,602 |
12. Other.
The Fund's organizational documents provide former and current trustees and officers with a limited indemnification against liabilities arising in connection with the performance of their duties to the Fund. In the normal course of business, the Fund may also enter into contracts that provide general indemnifications. The Fund's maximum exposure under these arrangements is unknown as this would be dependent on future claims that may be made against the Fund. The risk of material loss from such claims is considered remote.
13. Coronavirus (COVID-19) Pandemic.
An outbreak of COVID-19 first detected in China during December 2019 has since spread globally and was declared a pandemic by the World Health Organization during March 2020. Developments that disrupt global economies and financial markets, such as the COVID-19 pandemic, may magnify factors that affect the Fund's performance.
Report of Independent Registered Public Accounting Firm
To the Board of Trustees of Fidelity Securities Fund and Shareholders of Fidelity Dividend Growth Fund
Opinion on the Financial Statements
We have audited the accompanying statement of assets and liabilities, including the schedule of investments, of Fidelity Dividend Growth Fund (one of the funds constituting Fidelity Securities Fund, referred to hereafter as the “Fund”) as of July 31, 2020, the related statement of operations for the year ended July 31, 2020, the statement of changes in net assets for each of the two years in the period ended July 31, 2020, including the related notes, and the financial highlights for each of the five years in the period ended July 31, 2020 (collectively referred to as the “financial statements”). In our opinion, the financial statements present fairly, in all material respects, the financial position of the Fund as of July 31, 2020, the results of its operations for the year then ended, the changes in its net assets for each of the two years in the period ended July 31, 2020 and the financial highlights for each of the five years in the period ended July 31, 2020 in conformity with accounting principles generally accepted in the United States of America.
Basis for Opinion
These financial statements are the responsibility of the Fund’s management. Our responsibility is to express an opinion on the Fund’s financial statements based on our audits. We are a public accounting firm registered with the Public Company Accounting Oversight Board (United States) (PCAOB) and are required to be independent with respect to the Fund in accordance with the U.S. federal securities laws and the applicable rules and regulations of the Securities and Exchange Commission and the PCAOB.
We conducted our audits of these financial statements in accordance with the standards of the PCAOB. Those standards require that we plan and perform the audit to obtain reasonable assurance about whether the financial statements are free of material misstatement, whether due to error or fraud.
Our audits included performing procedures to assess the risks of material misstatement of the financial statements, whether due to error or fraud, and performing procedures that respond to those risks. Such procedures included examining, on a test basis, evidence regarding the amounts and disclosures in the financial statements. Our audits also included evaluating the accounting principles used and significant estimates made by management, as well as evaluating the overall presentation of the financial statements. Our procedures included confirmation of securities owned as of July 31, 2020 by correspondence with the custodian and brokers; when replies were not received from brokers, we performed other auditing procedures. We believe that our audits provide a reasonable basis for our opinion.
/s/ PricewaterhouseCoopers LLP
Boston, Massachusetts
September 14, 2020
We have served as the auditor of one or more investment companies in the Fidelity group of funds since 1932.
Trustees and Officers
The Trustees, Members of the Advisory Board (if any), and officers of the trust and fund, as applicable, are listed below. The Board of Trustees governs the fund and is responsible for protecting the interests of shareholders. The Trustees are experienced executives who meet periodically throughout the year to oversee the fund's activities, review contractual arrangements with companies that provide services to the fund, oversee management of the risks associated with such activities and contractual arrangements, and review the fund's performance. Except for Jonathan Chiel, each of the Trustees oversees 311 funds. Mr. Chiel oversees 174 funds.
The Trustees hold office without limit in time except that (a) any Trustee may resign; (b) any Trustee may be removed by written instrument, signed by at least two-thirds of the number of Trustees prior to such removal; (c) any Trustee who requests to be retired or who has become incapacitated by illness or injury may be retired by written instrument signed by a majority of the other Trustees; and (d) any Trustee may be removed at any special meeting of shareholders by a two-thirds vote of the outstanding voting securities of the trust. Each Trustee who is not an interested person (as defined in the 1940 Act) of the trust and the fund is referred to herein as an Independent Trustee. Each Independent Trustee shall retire not later than the last day of the calendar year in which his or her 75th birthday occurs. The Independent Trustees may waive this mandatory retirement age policy with respect to individual Trustees. Officers and Advisory Board Members hold office without limit in time, except that any officer or Advisory Board Member may resign or may be removed by a vote of a majority of the Trustees at any regular meeting or any special meeting of the Trustees. Except as indicated, each individual has held the office shown or other offices in the same company for the past five years.
The fund's Statement of Additional Information (SAI) includes more information about the Trustees. To request a free copy, call Fidelity at 1-800-544-8544 if you’re an individual investing directly with Fidelity, call 1-800-835-5092 if you’re a plan sponsor or participant with Fidelity as your recordkeeper or call 1-877-208-0098 on institutional accounts or if you’re an advisor or invest through one.
Experience, Skills, Attributes, and Qualifications of the Trustees. The Governance and Nominating Committee has adopted a statement of policy that describes the experience, qualifications, attributes, and skills that are necessary and desirable for potential Independent Trustee candidates (Statement of Policy). The Board believes that each Trustee satisfied at the time he or she was initially elected or appointed a Trustee, and continues to satisfy, the standards contemplated by the Statement of Policy. The Governance and Nominating Committee also engages professional search firms to help identify potential Independent Trustee candidates who have the experience, qualifications, attributes, and skills consistent with the Statement of Policy. From time to time, additional criteria based on the composition and skills of the current Independent Trustees, as well as experience or skills that may be appropriate in light of future changes to board composition, business conditions, and regulatory or other developments, have also been considered by the professional search firms and the Governance and Nominating Committee. In addition, the Board takes into account the Trustees' commitment and participation in Board and committee meetings, as well as their leadership of standing and ad hoc committees throughout their tenure.
In determining that a particular Trustee was and continues to be qualified to serve as a Trustee, the Board has considered a variety of criteria, none of which, in isolation, was controlling. The Board believes that, collectively, the Trustees have balanced and diverse experience, qualifications, attributes, and skills, which allow the Board to operate effectively in governing the fund and protecting the interests of shareholders. Information about the specific experience, skills, attributes, and qualifications of each Trustee, which in each case led to the Board's conclusion that the Trustee should serve (or continue to serve) as a trustee of the fund, is provided below.
Board Structure and Oversight Function. Robert A. Lawrence is an interested person and currently serves as Acting Chairman. The Trustees have determined that an interested Chairman is appropriate and benefits shareholders because an interested Chairman has a personal and professional stake in the quality and continuity of services provided to the fund. Independent Trustees exercise their informed business judgment to appoint an individual of their choosing to serve as Chairman, regardless of whether the Trustee happens to be independent or a member of management. The Independent Trustees have determined that they can act independently and effectively without having an Independent Trustee serve as Chairman and that a key structural component for assuring that they are in a position to do so is for the Independent Trustees to constitute a substantial majority for the Board. The Independent Trustees also regularly meet in executive session. Ned C. Lautenbach and David M. Thomas serve as Co-Lead Independent Trustees and as such each (i) acts as a liaison between the Independent Trustees and management with respect to matters important to the Independent Trustees and (ii) with management prepares agendas for Board meetings.
Fidelity® funds are overseen by different Boards of Trustees. The fund's Board oversees Fidelity's high income and certain equity funds, and other Boards oversee Fidelity's investment-grade bond, money market, asset allocation, and other equity funds. The asset allocation funds may invest in Fidelity® funds overseen by the fund's Board. The use of separate Boards, each with its own committee structure, allows the Trustees of each group of Fidelity® funds to focus on the unique issues of the funds they oversee, including common research, investment, and operational issues. On occasion, the separate Boards establish joint committees to address issues of overlapping consequences for the Fidelity® funds overseen by each Board.
The Trustees operate using a system of committees to facilitate the timely and efficient consideration of all matters of importance to the Trustees, the fund, and fund shareholders and to facilitate compliance with legal and regulatory requirements and oversight of the fund's activities and associated risks. The Board, acting through its committees, has charged FMR and its affiliates with (i) identifying events or circumstances the occurrence of which could have demonstrably adverse effects on the fund's business and/or reputation; (ii) implementing processes and controls to lessen the possibility that such events or circumstances occur or to mitigate the effects of such events or circumstances if they do occur; and (iii) creating and maintaining a system designed to evaluate continuously business and market conditions in order to facilitate the identification and implementation processes described in (i) and (ii) above. Because the day-to-day operations and activities of the fund are carried out by or through FMR, its affiliates, and other service providers, the fund's exposure to risks is mitigated but not eliminated by the processes overseen by the Trustees. While each of the Board's committees has responsibility for overseeing different aspects of the fund's activities, oversight is exercised primarily through the Operations, Audit, and Compliance Committees. Appropriate personnel, including but not limited to the fund's Chief Compliance Officer (CCO), FMR's internal auditor, the independent accountants, the fund's Treasurer and portfolio management personnel, make periodic reports to the Board's committees, as appropriate, including an annual review of Fidelity's risk management program for the Fidelity® funds. The responsibilities of each standing committee, including their oversight responsibilities, are described further under "Standing Committees of the Trustees."
Interested Trustees*:
Correspondence intended for a Trustee who is an interested person may be sent to Fidelity Investments, 245 Summer Street, Boston, Massachusetts 02210.
Name, Year of Birth; Principal Occupations and Other Relevant Experience+
Jonathan Chiel (1957)
Year of Election or Appointment: 2016
Trustee
Mr. Chiel also serves as Trustee of other Fidelity® funds. Mr. Chiel is Executive Vice President and General Counsel for FMR LLC (diversified financial services company, 2012-present). Previously, Mr. Chiel served as general counsel (2004-2012) and senior vice president and deputy general counsel (2000-2004) for John Hancock Financial Services; a partner with Choate, Hall & Stewart (1996-2000) (law firm); and an Assistant United States Attorney for the United States Attorney’s Office of the District of Massachusetts (1986-95), including Chief of the Criminal Division (1993-1995). Mr. Chiel is a director on the boards of the Boston Bar Foundation and the Maimonides School.
Robert A. Lawrence (1952)
Year of Election or Appointment: 2020
Trustee
Acting Chairman of the Board of Trustees
Mr. Lawrence also serves as Trustee of other funds. Previously, Mr. Lawrence served as a Member of the Advisory Board of certain funds. Prior to his retirement in 2008, Mr. Lawrence served as Vice President of certain Fidelity® funds (2006-2008), Senior Vice President, Head of High Income Division of Fidelity Management & Research Company (investment adviser firm, 2006-2008), and President of Fidelity Strategic Investments (investment adviser firm, 2002-2005).
* Determined to be an “Interested Trustee” by virtue of, among other things, his or her affiliation with the trust or various entities under common control with FMR.
+ The information includes the Trustee's principal occupation during the last five years and other information relating to the experience, attributes, and skills relevant to the Trustee's qualifications to serve as a Trustee, which led to the conclusion that the Trustee should serve as a Trustee for the fund.
Independent Trustees:
Correspondence intended for an Independent Trustee may be sent to Fidelity Investments, P.O. Box 55235, Boston, Massachusetts 02205-5235.
Name, Year of Birth; Principal Occupations and Other Relevant Experience+
Dennis J. Dirks (1948)
Year of Election or Appointment: 2005
Trustee
Mr. Dirks also serves as Trustee of other Fidelity® funds. Prior to his retirement in May 2003, Mr. Dirks served as Chief Operating Officer and as a member of the Board of The Depository Trust & Clearing Corporation (financial markets infrastructure), President, Chief Operating Officer and a member of the Board of The Depository Trust Company (DTC), President and a member of the Board of the National Securities Clearing Corporation (NSCC), Chief Executive Officer and a member of the Board of the Government Securities Clearing Corporation and Chief Executive Officer and a member of the Board of the Mortgage-Backed Securities Clearing Corporation. Mr. Dirks currently serves as a member of the Finance Committee (2016-present) and Board (2017-present) and is Treasurer (2018-present) of the Asolo Repertory Theatre.
Donald F. Donahue (1950)
Year of Election or Appointment: 2018
Trustee
Mr. Donahue also serves as Trustee of other Fidelity® funds. Mr. Donahue serves as President and Chief Executive Officer of Miranda Partners, LLC (risk consulting for the financial services industry, 2012-present). Previously, Mr. Donahue served as Chief Executive Officer (2006-2012), Chief Operating Officer (2003-2006) and Managing Director, Customer Marketing and Development (1999-2003) of The Depository Trust & Clearing Corporation (financial markets infrastructure). Mr. Donahue currently serves as a member (2007-present) and Co-Chairman (2016-present) of the Board of United Way of New York, a member of the Board of NYC Leadership Academy (2012-present) and a member of the Board of Advisors of Ripple Labs, Inc. (financial services, 2015-present). Mr. Donahue previously served as a member of the Advisory Board of certain Fidelity® funds (2015-2018).
Vicki L. Fuller (1957)
Year of Election or Appointment: 2020
Trustee
Ms. Fuller also serves as Trustee of other Fidelity® funds. Previously, Ms. Fuller served as a member of the Advisory Board of certain Fidelity® funds (2018-2020), Chief Investment Officer of the New York State Common Retirement Fund (2012-2018) and held a variety of positions at AllianceBernstein L.P. (global asset management, 1985-2012), including Managing Director (2006-2012) and Senior Vice President and Senior Portfolio Manager (2001-2006). Ms. Fuller currently serves as a member of the Board, Audit Committee and Nominating and Governance Committee of The Williams Companies, Inc. (natural gas infrastructure, 2018-present) and as a member of the Board of Treliant, LLC (consulting, 2019-present).
Patricia L. Kampling (1959)
Year of Election or Appointment: 2020
Trustee
Ms. Kampling also serves as Trustee of other Fidelity® funds. Prior to her retirement, Ms. Kampling served as Chairman of the Board and Chief Executive Officer (2012-2019), President and Chief Operating Officer (2011-2012) and Executive Vice President and Chief Financial Officer (2010-2011) of Alliant Energy Corporation. Ms. Kampling currently serves as a member of the Board, Compensation Committee and Executive Committee and as Chair of the Audit Committee of Briggs & Stratton Corporation (manufacturing, 2011-present) and as a member of the Board, Audit, Finance and Risk Committee and Safety, Environmental, Technology and Operations Committee of American Water Works Company, Inc. (utilities company, 2019-present). In addition, Ms. Kampling currently serves as a member of the Board of the Nature Conservancy, Wisconsin Chapter (2019-present). Previously, Ms. Kampling served as a Member of the Advisory Board of certain Fidelity® funds (2020), a member of the Board of Interstate Power and Light Company (2012-2019) and Wisconsin Power and Light Company (2012-2019) (each a subsidiary of Alliant Energy Corporation) and as a member of the Board and Workforce Development Committee of the Business Roundtable (2018-2019).
Alan J. Lacy (1953)
Year of Election or Appointment: 2008
Trustee
Mr. Lacy also serves as Trustee of other Fidelity® funds. Previously, Mr. Lacy served as Senior Adviser (2007-2014) of Oak Hill Capital Partners, L.P. (private equity), Chief Executive Officer (2005) and Vice Chairman (2005-2006) of Sears Holdings Corporation (retail), Chief Executive Officer and Chairman of the Board of Sears, Roebuck and Co. (retail, 2000-2005), Chairman (2014-2017) and a member of the Board (2010-2017) of Dave & Buster’s Entertainment, Inc. (restaurant and entertainment complexes) and a member of the Board of Bristol-Myers Squibb Company (global pharmaceuticals, 2008-2020). Mr. Lacy currently serves as a Trustee of the California Chapter of The Nature Conservancy (2015-present) and a member of the Board of the Center for Advanced Study in the Behavioral Sciences at Stanford University (2015-present).
Ned C. Lautenbach (1944)
Year of Election or Appointment: 2000
Trustee
Co-Lead Independent Trustee
Mr. Lautenbach also serves as Trustee of other Fidelity® funds. Mr. Lautenbach currently serves as Chair of the Board of Governors, State University System of Florida (2013-present) and is a member of the Council on Foreign Relations (1994-present). He is also a member and has in the past served as Chairman of the Board of Directors of Artis-Naples (2012-present). Previously, Mr. Lautenbach served as a member and then Lead Director of the Board of Directors of Eaton Corporation (diversified industrial, 1997-2016). He was also a Partner at Clayton, Dubilier & Rice, LLC (private equity investment, 1998-2010); as well as Director of Sony Corporation (2006-2007). In addition, Mr. Lautenbach had a 30-year career with IBM (technology company), during which time he served as Senior Vice President and as a member of the Corporate Executive Committee (1968-1998).
Joseph Mauriello (1944)
Year of Election or Appointment: 2008
Trustee
Mr. Mauriello also serves as Trustee of other Fidelity® funds. Prior to his retirement in January 2006, Mr. Mauriello served in numerous senior management positions including Deputy Chairman and Chief Operating Officer (2004-2005), and Vice Chairman of Financial Services (2002-2004) of KPMG LLP US (professional services, 1965-2005). Mr. Mauriello currently serves as a member of the Independent Directors Council Governing Council (2015-present). Previously, Mr. Mauriello served as a member of the Board of XL Group plc. (global insurance and re-insurance, 2006-2018).
Cornelia M. Small (1944)
Year of Election or Appointment: 2005
Trustee
Ms. Small also serves as Trustee of other Fidelity® funds. Previously, Ms. Small served as Chief Investment Officer, Director of Global Equity Investments and a member of Scudder, Stevens & Clark and Scudder Kemper Investments. Ms. Small previously served as a member of the Board (2009-2019) and Chair of the Investment Committee (2010-2019) of the Teagle Foundation and a member of the Investment Committee of the Berkshire Taconic Community Foundation (2008-2019).
Garnett A. Smith (1947)
Year of Election or Appointment: 2018
Trustee
Mr. Smith also serves as Trustee of other Fidelity® funds. Prior to his retirement, Mr. Smith served as Chairman and Chief Executive Officer (1990-1997) and President (1986-1990) of Inbrand Corp. (manufacturer of personal absorbent products). Prior to his employment with Inbrand Corp., he was employed by a retail fabric chain and North Carolina National Bank (now Bank of America). Mr. Smith previously served as a member of the Advisory Board of certain Fidelity® funds (2012-2013).
David M. Thomas (1949)
Year of Election or Appointment: 2008
Trustee
Co-Lead Independent Trustee
Mr. Thomas also serves as Trustee of other Fidelity® funds. Previously, Mr. Thomas served as Executive Chairman (2005-2006) and Chairman and Chief Executive Officer (2000-2005) of IMS Health, Inc. (pharmaceutical and healthcare information solutions). Mr. Thomas currently serves as Non-Executive Chairman of the Board of Fortune Brands Home and Security (home and security products, 2011-present), and a member of the Board (2004-present) and Presiding Director (2013-present) of Interpublic Group of Companies, Inc. (marketing communication).
Susan Tomasky (1953)
Year of Election or Appointment: 2020
Trustee
Ms. Tomasky also serves as Trustee of other Fidelity® funds. Prior to her retirement, Ms. Tomasky served in various executive officer positions at American Electric Power Company, Inc. (1998-2011), including most recently as President of AEP Transmission (2007-2011). Ms. Tomasky currently serves as a member of the Board and Sustainability Committee and as Chair of the Audit Committee of Marathon Petroleum Corporation (2018-present) and as a member of the Board, Corporate Governance Committee and Organization and Compensation Committee and as Chair of the Audit Committee of Public Service Enterprise Group, Inc. (utilities company, 2012-present). In addition, Ms. Tomasky currently serves as a member of the Board of the Columbus Regional Airport Authority (2007-present), as a member of the Board of the Royal Shakespeare Company – America (2009-present), as a member of the Board of the Columbus Association for the Performing Arts (2011-present) and as a member of the Board of Kenyon College (2016-present). Previously, Ms. Tomasky served as a Member of the Advisory Board of certain Fidelity® funds (2020), a member of the Board (2011-2019) and as Lead Independent Director (2015-2018) of Andeavor Corporation (previously Tesoro Corporation) (independent oil refiner and marketer) and as a member of the Board of Summit Midstream Partners LP (energy, 2012-2018).
Michael E. Wiley (1950)
Year of Election or Appointment: 2020
Trustee
Mr. Wiley also serves as Trustee of other Fidelity® funds. Previously, Mr. Wiley served as a member of the Advisory Board of certain Fidelity® funds (2018-2020), Chairman, President and CEO of Baker Hughes, Inc. (oilfield services, 2000-2004). Mr. Wiley also previously served as a member of the Board of Andeavor Corporation (independent oil refiner and marketer, 2005-2018), a member of the Board of Andeavor Logistics LP (natural resources logistics, 2015-2018) and a member of the Board of High Point Resources (exploration and production, 2005-2020).
+ The information includes the Trustee's principal occupation during the last five years and other information relating to the experience, attributes, and skills relevant to the Trustee's qualifications to serve as a Trustee, which led to the conclusion that the Trustee should serve as a Trustee for the fund.
Advisory Board Members and Officers:
Correspondence intended for a Member of the Advisory Board (if any) may be sent to Fidelity Investments, P.O. Box 55235, Boston, Massachusetts 02205-5235. Correspondence intended for an officer or Peter S. Lynch may be sent to Fidelity Investments, 245 Summer Street, Boston, Massachusetts 02210. Officers appear below in alphabetical order.
Name, Year of Birth; Principal Occupation
Peter S. Lynch (1944)
Year of Election or Appointment: 2003
Member of the Advisory Board
Mr. Lynch also serves as a Member of the Advisory Board of other Fidelity® funds. Mr. Lynch is Vice Chairman and a Director of Fidelity Management & Research Company LLC (investment adviser firm). In addition, Mr. Lynch serves as a Trustee of Boston College and as the Chairman of the Inner-City Scholarship Fund. Previously, Mr. Lynch served as Vice Chairman and a Director of FMR Co., Inc. (investment adviser firm) and on the Special Olympics International Board of Directors (1997-2006).
Elizabeth Paige Baumann (1968)
Year of Election or Appointment: 2017
Anti-Money Laundering (AML) Officer
Ms. Baumann also serves as AML Officer of other funds. She is Chief AML Officer (2012-present) and Senior Vice President (2014-present) of FMR LLC (diversified financial services company) and is an employee of Fidelity Investments. Previously, Ms. Baumann served as AML Officer of certain funds (2017-2019), as AML Officer of the funds (2012-2016), and Vice President (2007-2014) and Deputy Anti-Money Laundering Officer (2007-2012) of FMR LLC.
Craig S. Brown (1977)
Year of Election or Appointment: 2019
Assistant Treasurer
Mr. Brown also serves as Assistant Treasurer of other funds. Mr. Brown is an employee of Fidelity Investments (2013-present).
John J. Burke III (1964)
Year of Election or Appointment: 2018
Chief Financial Officer
Mr. Burke also serves as Chief Financial Officer of other funds. Mr. Burke serves as Head of Investment Operations for Fidelity Fund and Investment Operations (2018-present) and is an employee of Fidelity Investments (1998-present). Previously Mr. Burke served as head of Asset Management Investment Operations (2012-2018).
William C. Coffey (1969)
Year of Election or Appointment: 2019
Assistant Secretary
Mr. Coffey also serves as Assistant Secretary of other funds. He is Senior Vice President and Deputy General Counsel of FMR LLC (diversified financial services company, 2010-present), and is an employee of Fidelity Investments. Previously, Mr. Coffey served as Secretary and CLO of certain funds (2018-2019); CLO, Secretary, and Senior Vice President of Fidelity Management & Research Company and FMR Co., Inc. (investment adviser firms, 2018-2019); Secretary of Fidelity SelectCo, LLC and Fidelity Investments Money Management, Inc. (investment adviser firms, 2018-2019); CLO of Fidelity Management & Research (Hong Kong) Limited, FMR Investment Management (UK) Limited, and Fidelity Management & Research (Japan) Limited (investment adviser firms, 2018-2019); and Assistant Secretary of certain funds (2009-2018).
Timothy M. Cohen (1969)
Year of Election or Appointment: 2018
Vice President
Mr. Cohen also serves as Vice President of other funds. Mr. Cohen serves as Co-Head of Equity (2018-present), a Director of Fidelity Management & Research (Japan) Limited (investment adviser firm, 2016-present), and is an employee of Fidelity Investments. Previously, Mr. Cohen served as Executive Vice President of Fidelity SelectCo, LLC (2019), Head of Global Equity Research (2016-2018), Chief Investment Officer - Equity and a Director of Fidelity Management & Research (U.K.) Inc. (investment adviser firm, 2013-2015) and as a Director of Fidelity Management & Research (Hong Kong) Limited (investment adviser firm, 2017).
Jonathan Davis (1968)
Year of Election or Appointment: 2010
Assistant Treasurer
Mr. Davis also serves as Assistant Treasurer of other funds. Mr. Davis serves as Assistant Treasurer of FMR Capital, Inc. (2017-present) and is an employee of Fidelity Investments. Previously, Mr. Davis served as Vice President and Associate General Counsel of FMR LLC (diversified financial services company, 2003-2010).
Laura M. Del Prato (1964)
Year of Election or Appointment: 2018
Assistant Treasurer
Ms. Del Prato also serves as an officer of other funds. Ms. Del Prato is an employee of Fidelity Investments (2017-present). Previously, Ms. Del Prato served as President and Treasurer of The North Carolina Capital Management Trust: Cash Portfolio and Term Portfolio (2018-2020). Prior to joining Fidelity Investments, Ms. Del Prato served as a Managing Director and Treasurer of the JPMorgan Mutual Funds (2014-2017). Prior to JPMorgan, Ms. Del Prato served as a partner at Cohen Fund Audit Services (accounting firm, 2012-2013) and KPMG LLP (accounting firm, 2004-2012).
Colm A. Hogan (1973)
Year of Election or Appointment: 2020
Assistant Treasurer
Mr. Hogan also serves as an officer of other funds. Mr. Hogan serves as Assistant Treasurer of FMR Capital, Inc. (2017-present) and is an employee of Fidelity Investments (2005-present). Previously, Mr. Hogan served as Deputy Treasurer of certain Fidelity® funds (2016-2020) and Assistant Treasurer of certain Fidelity® funds (2016-2018).
Pamela R. Holding (1964)
Year of Election or Appointment: 2018
Vice President
Ms. Holding also serves as Vice President of other funds. Ms. Holding serves as Co-Head of Equity (2018-present) and is an employee of Fidelity Investments (2013-present). Previously, Ms. Holding served as Executive Vice President of Fidelity SelectCo, LLC (2019) and as Chief Investment Officer of Fidelity Institutional Asset Management (2013-2018).
Cynthia Lo Bessette (1969)
Year of Election or Appointment: 2019
Secretary and Chief Legal Officer (CLO)
Ms. Lo Bessette also serves as an officer of other funds. Ms. Lo Bessette serves as CLO, Secretary, and Senior Vice President of Fidelity Management & Research Company LLC (investment adviser firm, 2019-present); and CLO of Fidelity Management & Research (Hong Kong) Limited, FMR Investment Management (UK) Limited, and Fidelity Management & Research (Japan) Limited (investment adviser firms, 2019-present). She is a Senior Vice President and Deputy General Counsel of FMR LLC (diversified financial services company, 2019-present), and is an employee of Fidelity Investments. Previously, Ms. Lo Bessette served as CLO, Secretary, and Senior Vice President of FMR Co., Inc. (investment adviser firm, 2019); Secretary of Fidelity SelectCo, LLC and Fidelity Investments Money Management, Inc. (investment adviser firms, 2019). Prior to joining Fidelity Investments, Ms. Lo Bessette was Executive Vice President, General Counsel (2016-2019) and Senior Vice President, Deputy General Counsel (2015-2016) of OppenheimerFunds (investment management company) and Deputy Chief Legal Officer (2013-2015) of Jennison Associates LLC (investment adviser firm).
Chris Maher (1972)
Year of Election or Appointment: 2020
Deputy Treasurer
Mr. Maher also serves as an officer of other funds. Mr. Maher serves as Assistant Treasurer of FMR Capital, Inc. (2017-present), and is an employee of Fidelity Investments (2008-present). Previously, Mr. Maher served as Assistant Treasurer of certain funds (2013-2020); Vice President of Asset Management Compliance (2013), Vice President of the Program Management Group of FMR (investment adviser firm, 2010-2013), and Vice President of Valuation Oversight (2008-2010).
Jason P. Pogorelec (1975)
Year of Election or Appointment: 2020
Chief Compliance Officer
Mr. Pogorelec also serves as Chief Compliance Officer of other funds. Mr. Pogorelec is a senior Vice President of Asset Management Compliance for Fidelity Investments and is an employee of Fidelity Investments (2006-present). Previously, Mr. Pogorelec served as Vice President, Associate General Counsel for Fidelity Investments (2010-2020) and Assistant Secretary of certain Fidelity funds (2015-2020).
Stacie M. Smith (1974)
Year of Election or Appointment: 2016
President and Treasurer
Ms. Smith also serves as an officer of other funds. Ms. Smith serves as Assistant Treasurer of FMR Capital, Inc. (2017-present), is an employee of Fidelity Investments (2009-present), and has served in other fund officer roles. Prior to joining Fidelity Investments, Ms. Smith served as Senior Audit Manager of Ernst & Young LLP (accounting firm, 1996-2009). Previously, Ms. Smith served as Assistant Treasurer (2013-2019) and Deputy Treasurer (2013-2016) of certain Fidelity® funds.
Marc L. Spector (1972)
Year of Election or Appointment: 2016
Assistant Treasurer
Mr. Spector also serves as an officer of other funds. Mr. Spector serves as Assistant Treasurer of FMR Capital, Inc. (2017-present) and is an employee of Fidelity Investments (2016-present). Prior to joining Fidelity Investments, Mr. Spector served as Director at the Siegfried Group (accounting firm, 2013-2016), and prior to Siegfried Group as audit senior manager at Deloitte & Touche LLP (accounting firm, 2005-2013).
Jim Wegmann (1979)
Year of Election or Appointment: 2019
Assistant Treasurer
Mr. Wegmann also serves as Assistant Treasurer of other funds. Mr. Wegmann is an employee of Fidelity Investments (2011-present).
Shareholder Expense Example
As a shareholder, you incur two types of costs: (1) transaction costs, which may include sales charges (loads) on purchase payments or redemption proceeds, as applicable and (2) ongoing costs, which generally include management fees, distribution and/or service (12b-1) fees and other Fund expenses. This Example is intended to help you understand your ongoing costs (in dollars) of investing in a fund and to compare these costs with the ongoing costs of investing in other mutual funds.
The Example is based on an investment of $1,000 invested at the beginning of the period and held for the entire period (February 1, 2020 to July 31, 2020).
Actual Expenses
The first line of the accompanying table provides information about actual account values and actual expenses. You may use the information in this line, together with the amount you invested, to estimate the expenses that you paid over the period. Simply divide your account value by $1,000.00 (for example, an $8,600 account value divided by $1,000.00 = 8.6), then multiply the result by the number in the first line for a class/Fund under the heading entitled "Expenses Paid During Period" to estimate the expenses you paid on your account during this period. If any fund is a shareholder of any underlying mutual funds or exchange-traded funds (ETFs) (the Underlying Funds), such fund indirectly bears its proportional share of the expenses of the Underlying Funds in addition to the direct expenses incurred presented in the table. These fees and expenses are not included in the annualized expense ratio used to calculate the expense estimate in the table below.
Hypothetical Example for Comparison Purposes
The second line of the accompanying table provides information about hypothetical account values and hypothetical expenses based on the actual expense ratio and an assumed rate of return of 5% per year before expenses, which is not the actual return. The hypothetical account values and expenses may not be used to estimate the actual ending account balance or expenses you paid for the period. You may use this information to compare the ongoing costs of investing in the Fund and other funds. To do so, compare this 5% hypothetical example with the 5% hypothetical examples that appear in the shareholder reports of the other funds. If any fund is a shareholder of any Underlying Funds, such fund indirectly bears its proportional share of the expenses of the Underlying Funds in addition to the direct expenses as presented in the table. These fees and expenses are not included in the annualized expense ratio used to calculate the expense estimate in the table below.
Please note that the expenses shown in the table are meant to highlight your ongoing costs only and do not reflect any transaction costs. Therefore, the second line of the table is useful in comparing ongoing costs only, and will not help you determine the relative total costs of owning different funds.
| | Annualized Expense Ratio-A | Beginning
Account Value
February 1, 2020 | Ending
Account Value
July 31, 2020 | Expenses Paid
During Period-B
February 1, 2020
to July 31, 2020 |
| Fidelity Dividend Growth Fund | | | | |
| Dividend Growth | .48% | | | |
| Actual | | $1,000.00 | $882.30 | $2.25 |
| Hypothetical-C | | $1,000.00 | $1,022.48 | $2.41 |
| Class K | .37% | | | |
| Actual | | $1,000.00 | $883.10 | $1.73 |
| Hypothetical-C | | $1,000.00 | $1,023.02 | $1.86 |
A Annualized expense ratio reflects expenses net of applicable fee waivers.
B Expenses are equal to the annualized expense ratio, multiplied by the average account value over the period, multiplied by 182/ 366 (to reflect the one-half year period). The fees and expenses of any Underlying Funds are not included in each annualized expense ratio.
C 5% return per year before expenses
Distributions (Unaudited)
The fund hereby designates as a capital gain dividend with respect to the taxable year ended July 31, 2020, $63,717,753, or, if subsequently determined to be different, the net capital gain of such year.
Dividend Growth and Class K designate 100% of the dividends distributed in September and December during the fiscal year as qualifying for the dividends–received deduction for corporate shareholders.
Dividend Growth and Class K designate 100% of the dividends distributed during the fiscal year as amounts which may be taken into account as a dividend for purposes of the maximum rate under section 1(h)(11) of the Internal Revenue Code.
The fund will notify shareholders in January 2021 of amounts for use in preparing 2020 income tax returns.
Liquidity Risk Management Program
The Securities and Exchange Commission adopted Rule 22e-4 under the Investment Company Act of 1940 (the Liquidity Rule) to promote effective liquidity risk management throughout the open-end investment company industry, thereby reducing the risk that funds will be unable to meet their redemption obligations and mitigating dilution of the interests of fund shareholders.
The Fund has adopted and implemented a liquidity risk management program pursuant to the Liquidity Rule (the Program) effective December 1, 2018. The Program is reasonably designed to assess and manage the Fund’s liquidity risk and to comply with the requirements of the Liquidity Rule. The Fund’s Board of Trustees (the Board) has designated the Fund’s investment adviser as administrator of the Program. The Fidelity advisers have established a Liquidity Risk Management Committee (the LRM Committee) to manage the Program for each of the Fidelity Funds. The LRM Committee monitors the adequacy and effectiveness of implementation of the Program and on a periodic basis assesses each Fund’s liquidity risk based on a variety of factors including (1) the Fund’s investment strategy, (2) portfolio liquidity and cash flow projections during normal and reasonably foreseeable stressed conditions, (3) shareholder redemptions, (4) borrowings and other funding sources and (5) in the case of exchange-traded funds, certain additional factors including the effect of the Fund’s prices and spreads, market participants, and basket compositions on the overall liquidity of the Fund’s portfolio, as applicable.
In accordance with the Program, each of the Fund’s portfolio investments is classified into one of four liquidity categories described below based on a determination of a reasonable expectation for how long it would take to convert the investment to cash (or sell or dispose of the investment) without significantly changing its market value.
- Highly liquid investments – cash or convertible to cash within three business days or less
- Moderately liquid investments – convertible to cash in three to seven calendar days
- Less liquid investments – can be sold or disposed of, but not settled, within seven calendar days
- Illiquid investments – cannot be sold or disposed of within seven calendar days
Liquidity classification determinations take into account a variety of factors including various market, trading and investment-specific considerations, as well as market depth, and generally utilize analysis from a third-party liquidity metrics service.
The Liquidity Rule places a 15% limit on a fund’s illiquid investments and requires funds that do not primarily hold assets that are highly liquid investments to determine and maintain a minimum percentage of the fund’s net assets to be invested in highly liquid investments (highly liquid investment minimum or HLIM). The Program includes provisions reasonably designed to comply with the 15% limit on illiquid investments and for determining, periodically reviewing and complying with the HLIM requirement as applicable.
At a recent meeting of the Fund’s Board of Trustees, the LRM Committee provided a written report to the Board pertaining to the operation, adequacy, and effectiveness of implementation of the Program for the annual period from December 1, 2018 through November 30, 2019. The report concluded that the Program has been implemented and is operating effectively and is reasonably designed to assess and manage the Fund’s liquidity risk.
Proxy Voting Results
A special meeting of shareholders was held on June 9, 2020. The results of votes taken among shareholders on the proposals before them are reported below. Each vote reported represents one dollar of net asset value held on the record date for the meeting.
PROPOSAL 1
To elect a Board of Trustees.
| | # of
Votes | % of
Votes |
| Dennis J. Dirks |
| Affirmative | 43,167,428,219.785 | 94.885 |
| Withheld | 2,327,070,930.034 | 5.115 |
| TOTAL | 45,494,499,149.820 | 100.000 |
| Donald F. Donahue |
| Affirmative | 43,161,668,935.467 | 94.872 |
| Withheld | 2,333,065,287.611 | 5.128 |
| TOTAL | 45,494,734,223.077 | 100.000 |
| Bettina Doulton |
| Affirmative | 43,304,465,213.969 | 95.186 |
| Withheld | 2,190,010,062.903 | 4.814 |
| TOTAL | 45,494,475,276.872 | 100.000 |
| Vicki L. Fuller |
| Affirmative | 43,380,442,631.493 | 95.353 |
| Withheld | 2,114,180,614.639 | 4.647 |
| TOTAL | 45,494,623,246.132 | 100.000 |
| Patricia L. Kampling |
| Affirmative | 43,128,008,796.761 | 94.798 |
| Withheld | 2,366,685,422.999 | 5.202 |
| TOTAL | 45,494,694,219.760 | 100.000 |
| Alan J. Lacy |
| Affirmative | 42,904,065,046.958 | 94.305 |
| Withheld | 2,590,717,567.229 | 5.695 |
| TOTAL | 45,494,782,614.187 | 100.000 |
| Ned C. Lautenbach |
| Affirmative | 42,802,778,827.017 | 94.083 |
| Withheld | 2,692,003,787.170 | 5.917 |
| TOTAL | 45,494,782,614.187 | 100.000 |
| Robert A. Lawrence |
| Affirmative | 42,971,258,294.203 | 94.453 |
| Withheld | 2,523,524,319.984 | 5.547 |
| TOTAL | 45,494,782,614.187 | 100.000 |
| Joseph Mauriello |
| Affirmative | 42,874,562,778.490 | 94.241 |
| Withheld | 2,620,171,874.731 | 5.759 |
| TOTAL | 45,494,734,653.220 | 100.000 |
| Cornelia M. Small |
| Affirmative | 43,029,040,988.063 | 94.580 |
| Withheld | 2,465,741,626.124 | 5.420 |
| TOTAL | 45,494,782,614.187 | 100.000 |
| Garnett A. Smith |
| Affirmative | 42,892,814,945.159 | 94.281 |
| Withheld | 2,601,967,669.028 | 5.719 |
| TOTAL | 45,494,782,614.187 | 100.000 |
| David M. Thomas |
| Affirmative | 42,936,080,036.111 | 94.376 |
| Withheld | 2,558,702,578.076 | 5.624 |
| TOTAL | 45,494,782,614.187 | 100.000 |
| Susan Tomasky |
| Affirmative | 43,147,934,105.796 | 94.842 |
| Withheld | 2,346,571,066.028 | 5.158 |
| TOTAL | 45,494,782,614.187 | 100.000 |
| Michael E. Wiley |
| Affirmative | 42,885,333,102.972 | 94.264 |
| Withheld | 2,609,449,511.215 | 5.736 |
| TOTAL | 45,494,782,614.187 | 100.000 |
PROPOSAL 2
To convert a fundamental investment policy to a non-fundamental investment policy.
| | # of
Votes | % of
Votes |
| Affirmative | 2,679,820,315.532 | 72.920 |
| Against | 510,593,615.491 | 13.894 |
| Abstain | 391,092,082.122 | 10.642 |
| Broker Non-Vote | 93,529,565.100 | 2.545 |
| TOTAL | 3,675,035,578.245 | 100.000 |
PROPOSAL 5
A shareholder proposal to institute procedures to avoid holding investments in companies that contribute to genocide or crimes against humanity.
| | # of
Votes | % of
Votes |
| Affirmative | 1,247,197,623.783 | 33.937 |
| Against | 2,050,278,536.677 | 55.789 |
| Abstain | 283,648,670.340 | 7.718 |
| Broker Non-Vote | 93,910,747.445 | 2.555 |
| TOTAL | 3,675,035,578.245 | 100.000 |
| Proposal 1 reflects trust wide proposal and voting results. |
| Proposal 5 was not approved by shareholders. |
DGF-ANN-0920
1.536090.123
Fidelity® Blue Chip Value Fund
Annual Report
July 31, 2020
See the inside front cover for important information about access to your fund’s shareholder reports.
Beginning on January 1, 2021, as permitted by regulations adopted by the Securities and Exchange Commission, paper copies of a fund’s shareholder reports will no longer be sent by mail, unless you specifically request paper copies of the reports from the fund or from your financial intermediary, such as a financial advisor, broker-dealer or bank. Instead, the reports will be made available on a website, and you will be notified by mail each time a report is posted and provided with a website link to access the report.
If you already elected to receive shareholder reports electronically, you will not be affected by this change and you need not take any action. You may elect to receive shareholder reports and other communications from a fund electronically, by contacting your financial intermediary. For Fidelity customers, visit Fidelity's web site or call Fidelity using the contact information listed below.
You may elect to receive all future reports in paper free of charge. If you wish to continue receiving paper copies of your shareholder reports, you may contact your financial intermediary or, if you are a Fidelity customer, visit Fidelity’s website, or call Fidelity at the applicable toll-free number listed below. Your election to receive reports in paper will apply to all funds held with the fund complex/your financial intermediary.
| Account Type | Website | Phone Number |
| Brokerage, Mutual Fund, or Annuity Contracts: | fidelity.com/mailpreferences | 1-800-343-3548 |
| Employer Provided Retirement Accounts: | netbenefits.fidelity.com/preferences (choose 'no' under Required Disclosures to continue to print) | 1-800-343-0860 |
| Advisor Sold Accounts Serviced Through Your Financial Intermediary: | Contact Your Financial Intermediary | Your Financial Intermediary's phone number |
| Advisor Sold Accounts Serviced by Fidelity: | institutional.fidelity.com | 1-877-208-0098 |
Contents
To view a fund's proxy voting guidelines and proxy voting record for the 12-month period ended June 30, visit http://www.fidelity.com/proxyvotingresults or visit the Securities and Exchange Commission's (SEC) web site at http://www.sec.gov.
You may also call 1-800-544-8544 to request a free copy of the proxy voting guidelines.
Standard & Poor's, S&P and S&P 500 are registered service marks of The McGraw-Hill Companies, Inc. and have been licensed for use by Fidelity Distributors Corporation.
Other third-party marks appearing herein are the property of their respective owners.
All other marks appearing herein are registered or unregistered trademarks or service marks of FMR LLC or an affiliated company. © 2020 FMR LLC. All rights reserved.
This report and the financial statements contained herein are submitted for the general information of the shareholders of the Fund. This report is not authorized for distribution to prospective investors in the Fund unless preceded or accompanied by an effective prospectus.
A fund files its complete schedule of portfolio holdings with the SEC for the first and third quarters of each fiscal year on Form N-PORT. Forms N-PORT are available on the SEC’s web site at http://www.sec.gov. A fund's Forms N-PORT may be reviewed and copied at the SEC’s Public Reference Room in Washington, DC. Information regarding the operation of the SEC's Public Reference Room may be obtained by calling 1-800-SEC-0330.
For a complete list of a fund's portfolio holdings, view the most recent holdings listing, semiannual report, or annual report on Fidelity's web site at http://www.fidelity.com, http://www.institutional.fidelity.com, or http://www.401k.com, as applicable.
NOT FDIC INSURED •MAY LOSE VALUE •NO BANK GUARANTEE
Neither the Fund nor Fidelity Distributors Corporation is a bank.
Note to Shareholders:
Early in 2020, the outbreak and spread of a new coronavirus emerged as a public health emergency that had a major influence on financial markets, primarily based on its impact on the global economy and the outlook for corporate earnings. The virus causes a respiratory disease known as COVID-19. On March 11, the World Health Organization declared the COVID-19 outbreak a pandemic, citing sustained risk of further global spread.
In the weeks following, as the crisis worsened, we witnessed an escalating human tragedy with wide-scale social and economic consequences from coronavirus-containment measures. The outbreak of COVID-19 prompted a number of measures to limit the spread, including travel and border restrictions, quarantines, and restrictions on large gatherings. In turn, these resulted in lower consumer activity, diminished demand for a wide range of products and services, disruption in manufacturing and supply chains, and – given the wide variability in outcomes regarding the outbreak – significant market uncertainty and volatility. Amid the turmoil, the U.S. government took unprecedented action – in concert with the U.S. Federal Reserve and central banks around the world – to help support consumers, businesses, and the broader economy, and to limit disruption to the financial system.
The situation continues to unfold, and the extent and duration of its impact on financial markets and the economy remain highly uncertain. Extreme events such as the coronavirus crisis are “exogenous shocks” that can have significant adverse effects on mutual funds and their investments. Although multiple asset classes may be affected by market disruption, the duration and impact may not be the same for all types of assets.
Fidelity is committed to helping you stay informed amid news about COVID-19 and during increased market volatility, and we’re taking extra steps to be responsive to customer needs. We encourage you to visit our websites, where we offer ongoing updates, commentary, and analysis on the markets and our funds.
Performance: The Bottom Line
Average annual total return reflects the change in the value of an investment, assuming reinvestment of distributions from dividend income and capital gains (the profits earned upon the sale of securities that have grown in value, if any) and assuming a constant rate of performance each year. The hypothetical investment and the average annual total returns do not reflect the deduction of taxes that a shareholder would pay on fund distributions or the redemption of fund shares. During periods of reimbursement by Fidelity, a fund’s total return will be greater than it would be had the reimbursement not occurred. How a fund did yesterday is no guarantee of how it will do tomorrow.
Average Annual Total Returns
| For the periods ended July 31, 2020 | Past 1 year | Past 5 years | Past 10 years |
| Fidelity® Blue Chip Value Fund | (12.03)% | 1.75% | 7.32% |
$10,000 Over 10 Years
Let's say hypothetically that $10,000 was invested in Fidelity® Blue Chip Value Fund on July 31, 2010.
The chart shows how the value of your investment would have changed, and also shows how the Russell 1000® Value Index performed over the same period.

| Period Ending Values |
| $20,266 | Fidelity® Blue Chip Value Fund |
| $26,213 | Russell 1000® Value Index |
Management's Discussion of Fund Performance
Market Recap: The S&P 500
® index gained 11.96% for the 12 months ending July 31, 2020, in what was a bumpy ride for U.S. equity investors, marked by a steep but brief decline due to the early-2020 outbreak and spread of the coronavirus, followed by a historic rebound. Declared a pandemic on March 11, the COVID-19 crisis and containment efforts caused broad contraction in economic activity, along with extreme uncertainty, volatility and dislocation in financial markets. By mid-March, U.S. stocks entered bear-market territory less than a month after hitting an all-time high and extending the longest-running bull market in American history. Stocks slid in late February, after a surge in COVID-19 cases outside China. The sudden downtrend continued in March (-12%), capping the index’s worst quarter since 2008. A historically rapid and expansive U.S. monetary/fiscal-policy response provided a partial offset to the economic disruption and fueled a sharp uptrend. Aggressive support for financial markets by the U.S. Federal Reserve, plans for reopening the economy and improving infection data boosted stocks in April (+13%) and May (+5%). In June and July, the index gained amid progress on potential treatments and signs of an early recovery in economic activity. For the full 12 months, growth stocks widely topped value, while large-caps handily bested smaller-caps. The information technology sector (+39%) led the way, followed by consumer discretionary (+22%). In contrast, energy (-38%) fell hard along with the price of crude oil.
Comments from Portfolio Manager Sean Gavin: For the fiscal year ending July 31, 2020, the fund returned -12.03%, trailing the -6.01% result of the benchmark Russell 1000
® Value Index. The largest detractor from performance versus the benchmark was an overweighting in energy. Stock picking and an overweighting in financials also hindered relative performance. Also hurting the portfolio's result versus the benchmark was stock selection in the consumer staples sector, primarily within the food, beverage & tobacco industry. The fund's largest individual relative detractor was an overweighting in Wells Fargo, which returned approximately -46% the past 12 months. The company was among the biggest holdings in the fund this period. Another notable relative detractor was our lighter-than-benchmark stake in Intel (+3%), a position we established this period. Also hindering performance was our outsized stake in PVH, which returned -44%. PVH was not held at period end. Conversely, the largest contributor to performance versus the benchmark was stock picks and an overweighting in health care. Also lifting the fund's relative result was an overweighting in information technology and an underweighting in real estate. Our non-benchmark stake in Roche was the fund's largest individual relative contributor, driven by a roughly 33% advance. This was among the largest holdings in the fund. Also helping performance was our outsized stake in Dollar General, which gained 46%. Another notable relative contributor was our overweighting in Best Buy (+47%), a position we established this period. Notable changes in positioning include a higher allocation to the information technology and industrials sectors.
The views expressed above reflect those of the portfolio manager(s) only through the end of the period as stated on the cover of this report and do not necessarily represent the views of Fidelity or any other person in the Fidelity organization. Any such views are subject to change at any time based upon market or other conditions and Fidelity disclaims any responsibility to update such views. These views may not be relied on as investment advice and, because investment decisions for a Fidelity fund are based on numerous factors, may not be relied on as an indication of trading intent on behalf of any Fidelity fund.
Investment Summary (Unaudited)
Top Ten Stocks as of July 31, 2020
| | % of fund's net assets |
| Berkshire Hathaway, Inc. Class B | 5.1 |
| UnitedHealth Group, Inc. | 4.2 |
| Cisco Systems, Inc. | 4.1 |
| Intel Corp. | 3.9 |
| Roche Holding AG (participation certificate) | 3.7 |
| Bank of America Corp. | 3.4 |
| Samsung Electronics Co. Ltd. | 3.4 |
| CVS Health Corp. | 3.0 |
| Comcast Corp. Class A | 2.7 |
| Anthem, Inc. | 2.6 |
| | 36.1 |
Top Five Market Sectors as of July 31, 2020
| | % of fund's net assets |
| Financials | 28.7 |
| Health Care | 22.6 |
| Information Technology | 15.8 |
| Industrials | 9.2 |
| Consumer Staples | 5.9 |
Asset Allocation (% of fund's net assets)
| As of July 31, 2020* |
| | Stocks | 96.9% |
| | Short-Term Investments and Net Other Assets (Liabilities) | 3.1% |

* Foreign investments - 19.2%
Schedule of Investments July 31, 2020
Showing Percentage of Net Assets
| Common Stocks - 93.5% | | | |
| | | Shares | Value |
| COMMUNICATION SERVICES - 2.7% | | | |
| Media - 2.7% | | | |
| Comcast Corp. Class A | | 241,400 | $10,331,920 |
| CONSUMER DISCRETIONARY - 5.2% | | | |
| Multiline Retail - 2.0% | | | |
| Dollar General Corp. | | 38,300 | 7,292,320 |
| Specialty Retail - 2.2% | | | |
| Best Buy Co., Inc. | | 83,500 | 8,315,765 |
| Textiles, Apparel & Luxury Goods - 1.0% | | | |
| Tapestry, Inc. | | 289,500 | 3,867,720 |
|
| TOTAL CONSUMER DISCRETIONARY | | | 19,475,805 |
|
| CONSUMER STAPLES - 5.9% | | | |
| Beverages - 1.6% | | | |
| C&C Group PLC (United Kingdom) | | 1,951,000 | 5,912,184 |
| Food Products - 1.8% | | | |
| Tyson Foods, Inc. Class A | | 109,400 | 6,722,630 |
| Tobacco - 2.5% | | | |
| Altria Group, Inc. | | 232,800 | 9,579,720 |
|
| TOTAL CONSUMER STAPLES | | | 22,214,534 |
|
| ENERGY - 4.8% | | | |
| Oil, Gas & Consumable Fuels - 4.8% | | | |
| BP PLC sponsored ADR | | 173,100 | 3,815,124 |
| Parex Resources, Inc. (a) | | 555,000 | 6,712,457 |
| Teekay LNG Partners LP (b) | | 286,400 | 3,116,032 |
| Total SA sponsored ADR | | 119,700 | 4,507,902 |
| | | | 18,151,515 |
| FINANCIALS - 28.7% | | | |
| Banks - 7.0% | | | |
| Bank of America Corp. | | 516,700 | 12,855,496 |
| M&T Bank Corp. | | 47,400 | 5,022,030 |
| Wells Fargo & Co. | | 340,000 | 8,248,400 |
| | | | 26,125,926 |
| Capital Markets - 4.3% | | | |
| Affiliated Managers Group, Inc. | | 106,900 | 7,353,651 |
| State Street Corp. | | 138,500 | 8,834,915 |
| | | | 16,188,566 |
| Consumer Finance - 3.0% | | | |
| Capital One Financial Corp. | | 100,600 | 6,418,280 |
| Discover Financial Services | | 97,800 | 4,834,254 |
| | | | 11,252,534 |
| Diversified Financial Services - 5.1% | | | |
| Berkshire Hathaway, Inc. Class B (a) | | 97,700 | 19,127,705 |
| Insurance - 9.3% | | | |
| Allstate Corp. | | 94,900 | 8,957,611 |
| Chubb Ltd. | | 75,500 | 9,606,620 |
| MetLife, Inc. | | 216,500 | 8,194,525 |
| The Travelers Companies, Inc. | | 72,800 | 8,329,776 |
| | | | 35,088,532 |
|
| TOTAL FINANCIALS | | | 107,783,263 |
|
| HEALTH CARE - 22.6% | | | |
| Biotechnology - 3.2% | | | |
| Alexion Pharmaceuticals, Inc. (a) | | 75,400 | 7,727,746 |
| Amgen, Inc. | | 17,900 | 4,379,593 |
| | | | 12,107,339 |
| Health Care Providers & Services - 14.4% | | | |
| Anthem, Inc. | | 35,900 | 9,829,420 |
| Cigna Corp. | | 54,400 | 9,394,336 |
| CVS Health Corp. | | 180,300 | 11,348,082 |
| Humana, Inc. | | 20,000 | 7,849,000 |
| UnitedHealth Group, Inc. | | 52,100 | 15,774,838 |
| | | | 54,195,676 |
| Pharmaceuticals - 5.0% | | | |
| Bristol-Myers Squibb Co. rights (a) | | 107,800 | 388,080 |
| Roche Holding AG (participation certificate) | | 40,600 | 14,062,077 |
| Sanofi SA sponsored ADR | | 83,200 | 4,363,840 |
| | | | 18,813,997 |
|
| TOTAL HEALTH CARE | | | 85,117,012 |
|
| INDUSTRIALS - 9.2% | | | |
| Aerospace & Defense - 0.8% | | | |
| General Dynamics Corp. | | 20,200 | 2,964,148 |
| Airlines - 1.5% | | | |
| Alaska Air Group, Inc. | | 158,500 | 5,458,740 |
| Building Products - 1.7% | | | |
| Owens Corning | | 108,100 | 6,536,807 |
| Electrical Equipment - 2.8% | | | |
| Acuity Brands, Inc. | | 71,400 | 7,075,740 |
| Regal Beloit Corp. | | 35,672 | 3,280,754 |
| | | | 10,356,494 |
| Machinery - 0.5% | | | |
| Oshkosh Corp. | | 26,300 | 2,070,336 |
| Trading Companies & Distributors - 1.9% | | | |
| HD Supply Holdings, Inc. (a) | | 201,900 | 7,086,690 |
|
| TOTAL INDUSTRIALS | | | 34,473,215 |
|
| INFORMATION TECHNOLOGY - 12.4% | | | |
| Communications Equipment - 4.1% | | | |
| Cisco Systems, Inc. | | 331,200 | 15,599,520 |
| IT Services - 4.4% | | | |
| Amdocs Ltd. | | 122,000 | 7,576,200 |
| Cognizant Technology Solutions Corp. Class A | | 131,700 | 8,997,744 |
| | | | 16,573,944 |
| Semiconductors & Semiconductor Equipment - 3.9% | | | |
| Intel Corp. | | 304,100 | 14,514,693 |
|
| TOTAL INFORMATION TECHNOLOGY | | | 46,688,157 |
|
| REAL ESTATE - 2.0% | | | |
| Real Estate Management & Development - 2.0% | | | |
| CBRE Group, Inc. (a) | | 167,500 | 7,338,175 |
| TOTAL COMMON STOCKS | | | |
| (Cost $366,762,670) | | | 351,573,596 |
|
| Nonconvertible Preferred Stocks - 3.4% | | | |
| INFORMATION TECHNOLOGY - 3.4% | | | |
| Technology Hardware, Storage & Peripherals - 3.4% | | | |
| Samsung Electronics Co. Ltd. | | | |
| (Cost $12,039,916) | | 306,000 | 12,666,198 |
|
| Money Market Funds - 2.8% | | | |
| Fidelity Cash Central Fund 0.14% (c) | | 10,518,673 | 10,521,829 |
| Fidelity Securities Lending Cash Central Fund 0.13% (c)(d) | | 1,125 | 1,125 |
| TOTAL MONEY MARKET FUNDS | | | |
| (Cost $10,521,941) | | | 10,522,954 |
| TOTAL INVESTMENT IN SECURITIES - 99.7% | | | |
| (Cost $389,324,527) | | | 374,762,748 |
| NET OTHER ASSETS (LIABILITIES) - 0.3% | | | 1,022,989 |
| NET ASSETS - 100% | | | $375,785,737 |
Legend
(a) Non-income producing
(b) Security or a portion of the security is on loan at period end.
(c) Affiliated fund that is generally available only to investment companies and other accounts managed by Fidelity Investments. The rate quoted is the annualized seven-day yield of the fund at period end. A complete unaudited listing of the fund's holdings as of its most recent quarter end is available upon request. In addition, each Fidelity Central Fund's financial statements, which are not covered by the Fund's Report of Independent Registered Public Accounting Firm, are available on the SEC's website or upon request.
(d) Investment made with cash collateral received from securities on loan.
Affiliated Central Funds
Information regarding fiscal year to date income earned by the Fund from investments in Fidelity Central Funds is as follows:
| Fund | Income earned |
| Fidelity Cash Central Fund | $180,150 |
| Fidelity Securities Lending Cash Central Fund | 1,373 |
| Total | $181,523 |
Amounts in the income column in the above table include any capital gain distributions from underlying funds, which are presented in the corresponding line-item in the Statement of Operations, if applicable. Amount for Fidelity Securities Lending Cash Central Fund represents the income earned on investing cash collateral, less rebates paid to borrowers and any lending agent fees associated with the loan, plus any premium payments received for lending certain types of securities.
Investment Valuation
The following is a summary of the inputs used, as of July 31, 2020, involving the Fund's assets and liabilities carried at fair value. The inputs or methodology used for valuing securities may not be an indication of the risk associated with investing in those securities. For more information on valuation inputs, and their aggregation into the levels used below, please refer to the Investment Valuation section in the accompanying Notes to Financial Statements.
| | Valuation Inputs at Reporting Date: |
| Description | Total | Level 1 | Level 2 | Level 3 |
| Investments in Securities: | | | | |
| Equities: | | | | |
| Communication Services | $10,331,920 | $10,331,920 | $-- | $-- |
| Consumer Discretionary | 19,475,805 | 19,475,805 | -- | -- |
| Consumer Staples | 22,214,534 | 22,214,534 | -- | -- |
| Energy | 18,151,515 | 18,151,515 | -- | -- |
| Financials | 107,783,263 | 107,783,263 | -- | -- |
| Health Care | 85,117,012 | 71,054,935 | 14,062,077 | -- |
| Industrials | 34,473,215 | 34,473,215 | -- | -- |
| Information Technology | 59,354,355 | 59,354,355 | -- | -- |
| Real Estate | 7,338,175 | 7,338,175 | -- | -- |
| Money Market Funds | 10,522,954 | 10,522,954 | -- | -- |
| Total Investments in Securities: | $374,762,748 | $360,700,671 | $14,062,077 | $-- |
Other Information
Distribution of investments by country or territory of incorporation, as a percentage of Total Net Assets, is as follows (Unaudited):
| United States of America | 80.8% |
| Switzerland | 6.2% |
| Korea (South) | 3.4% |
| France | 2.4% |
| Bailiwick of Guernsey | 2.0% |
| Canada | 1.8% |
| Ireland | 1.6% |
| United Kingdom | 1.0% |
| Others (Individually Less Than 1%) | 0.8% |
| | 100.0% |
See accompanying notes which are an integral part of the financial statements.
Financial Statements
Statement of Assets and Liabilities
| | | July 31, 2020 |
| Assets | | |
Investment in securities, at value (including securities loaned of $1,088) — See accompanying schedule:
Unaffiliated issuers (cost $378,802,586) | $364,239,794 | |
| Fidelity Central Funds (cost $10,521,941) | 10,522,954 | |
| Total Investment in Securities (cost $389,324,527) | | $374,762,748 |
| Receivable for investments sold | | 1,226,248 |
| Receivable for fund shares sold | | 485,734 |
| Dividends receivable | | 451,402 |
| Distributions receivable from Fidelity Central Funds | | 1,420 |
| Prepaid expenses | | 75 |
| Other receivables | | 39,258 |
| Total assets | | 376,966,885 |
| Liabilities | | |
| Payable for investments purchased | $589,492 | |
| Payable for fund shares redeemed | 369,235 | |
| Accrued management fee | 96,284 | |
| Transfer agent fee payable | 59,843 | |
| Other affiliated payables | 12,228 | |
| Other payables and accrued expenses | 52,941 | |
| Collateral on securities loaned | 1,125 | |
| Total liabilities | | 1,181,148 |
| Net Assets | | $375,785,737 |
| Net Assets consist of: | | |
| Paid in capital | | $411,865,703 |
| Total accumulated earnings (loss) | | (36,079,966) |
| Net Assets | | $375,785,737 |
| Net Asset Value, offering price and redemption price per share ($375,785,737 ÷ 22,077,348 shares) | | $17.02 |
See accompanying notes which are an integral part of the financial statements.
Statement of Operations
| | | Year ended July 31, 2020 |
| Investment Income | | |
| Dividends | | $9,816,948 |
| Income from Fidelity Central Funds (including $1,373 from security lending) | | 181,523 |
| Total income | | 9,998,471 |
| Expenses | | |
| Management fee | | |
| Basic fee | $2,305,263 | |
| Performance adjustment | (680,155) | |
| Transfer agent fees | 774,370 | |
| Accounting fees | 168,185 | |
| Custodian fees and expenses | 14,109 | |
| Independent trustees' fees and expenses | 2,788 | |
| Registration fees | 46,777 | |
| Audit | 57,353 | |
| Legal | 2,223 | |
| Interest | 285 | |
| Miscellaneous | 10,532 | |
| Total expenses before reductions | 2,701,730 | |
| Expense reductions | (73,799) | |
| Total expenses after reductions | | 2,627,931 |
| Net investment income (loss) | | 7,370,540 |
| Realized and Unrealized Gain (Loss) | | |
| Net realized gain (loss) on: | | |
| Investment securities: | | |
| Unaffiliated issuers | (3,133,173) | |
| Fidelity Central Funds | (438) | |
| Foreign currency transactions | (4,436) | |
| Total net realized gain (loss) | | (3,138,047) |
| Change in net unrealized appreciation (depreciation) on: | | |
| Investment securities: | | |
| Unaffiliated issuers | (55,641,202) | |
| Fidelity Central Funds | 908 | |
| Assets and liabilities in foreign currencies | 14,477 | |
| Total change in net unrealized appreciation (depreciation) | | (55,625,817) |
| Net gain (loss) | | (58,763,864) |
| Net increase (decrease) in net assets resulting from operations | | $(51,393,324) |
See accompanying notes which are an integral part of the financial statements.
Statement of Changes in Net Assets
| | Year ended July 31, 2020 | Year ended July 31, 2019 |
| Increase (Decrease) in Net Assets | | |
| Operations | | |
| Net investment income (loss) | $7,370,540 | $7,369,646 |
| Net realized gain (loss) | (3,138,047) | (16,632,779) |
| Change in net unrealized appreciation (depreciation) | (55,625,817) | 22,180,185 |
| Net increase (decrease) in net assets resulting from operations | (51,393,324) | 12,917,052 |
| Distributions to shareholders | (8,938,882) | (7,544,165) |
| Share transactions | | |
| Proceeds from sales of shares | 202,642,931 | 199,999,548 |
| Reinvestment of distributions | 6,231,606 | 6,832,544 |
| Cost of shares redeemed | (250,462,635) | (128,002,430) |
| Net increase (decrease) in net assets resulting from share transactions | (41,588,098) | 78,829,662 |
| Total increase (decrease) in net assets | (101,920,304) | 84,202,549 |
| Net Assets | | |
| Beginning of period | 477,706,041 | 393,503,492 |
| End of period | $375,785,737 | $477,706,041 |
| Other Information | | |
| Shares | | |
| Sold | 12,491,357 | 10,886,053 |
| Issued in reinvestment of distributions | 315,279 | 358,609 |
| Redeemed | (14,965,007) | (6,786,952) |
| Net increase (decrease) | (2,158,371) | 4,457,710 |
See accompanying notes which are an integral part of the financial statements.
Financial Highlights
Fidelity Blue Chip Value Fund
| | | | | | |
| Years ended July 31, | 2020 | 2019 | 2018 | 2017 | 2016 |
| Selected Per–Share Data | | | | | |
| Net asset value, beginning of period | $19.71 | $19.90 | $18.85 | $16.19 | $16.88 |
| Income from Investment Operations | | | | | |
| Net investment income (loss)A | .31 | .32 | .26 | .18 | .19 |
| Net realized and unrealized gain (loss) | (2.63) | (.14)B,C | 1.01 | 2.66 | (.59) |
| Total from investment operations | (2.32) | .18 | 1.27 | 2.84 | (.40) |
| Distributions from net investment income | (.31) | (.29) | (.21) | (.18) | (.28) |
| Distributions from net realized gain | (.06) | (.09) | –D | – | (.01) |
| Total distributions | (.37) | (.37)E | (.22)F | (.18) | (.29) |
| Net asset value, end of period | $17.02 | $19.71 | $19.90 | $18.85 | $16.19 |
| Total ReturnG | (12.03)% | .99%C | 6.79% | 17.68% | (2.31)% |
| Ratios to Average Net AssetsH,I | | | | | |
| Expenses before reductions | .63% | .65% | .70% | .79% | .88% |
| Expenses net of fee waivers, if any | .63% | .65% | .70% | .79% | .88% |
| Expenses net of all reductions | .61% | .65% | .70% | .78% | .88% |
| Net investment income (loss) | 1.71% | 1.67% | 1.34% | 1.04% | 1.23% |
| Supplemental Data | | | | | |
| Net assets, end of period (000 omitted) | $375,786 | $477,706 | $393,503 | $412,230 | $457,177 |
| Portfolio turnover rateJ | 119% | 44% | 45% | 32% | 54% |
A Calculated based on average shares outstanding during the period.
B The amount shown for a share outstanding does not correspond with the aggregate net gain (loss) on investments for the period due to the timing of sales and repurchases of shares in relation to fluctuating market values of the investments of the Fund.
C Net realized and unrealized gain (loss) per share reflects proceeds received from litigation which amounted to $.02 per share. Excluding these litigation proceeds, the total return would have been .91%.
D Amount represents less than $.005 per share.
E Total distributions of $.37 per share is comprised of distributions from net investment income of $.285 and distributions from net realized gain of $.087 per share.
F Total distributions of $.22 per share is comprised of distributions from net investment income of $.213 and distributions from net realized gain of $.004 per share.
G Total returns would have been lower if certain expenses had not been reduced during the applicable periods shown.
H Fees and expenses of any underlying mutual funds or exchange-traded funds (ETFs) are not included in the Fund's expense ratio. The Fund indirectly bears its proportionate share of these expenses. For additional expense information related to investments in Fidelity Central Funds, please refer to the "Investments in Fidelity Central Funds" note found in the Notes to Financial Statements section of the most recent Annual or Semi-Annual report.
I Expense ratios reflect operating expenses of the Fund. Expenses before reductions do not reflect amounts reimbursed by the investment adviser or reductions from brokerage service arrangements or reductions from other expense offset arrangements and do not represent the amount paid by the Fund during periods when reimbursements or reductions occur. Expenses net of fee waivers reflect expenses after reimbursement by the investment adviser but prior to reductions from brokerage service arrangements or other expense offset arrangements. Expenses net of all reductions represent the net expenses paid by the Fund.
J Amount does not include the portfolio activity of any underlying Fidelity Central Funds.
See accompanying notes which are an integral part of the financial statements.
Notes to Financial Statements
For the period ended July 31, 2020
1. Organization.
Fidelity Blue Chip Value Fund (the Fund) is a fund of Fidelity Securities Fund (the Trust) and is authorized to issue an unlimited number of shares. Share transactions on the Statement of Changes in Net Assets may contain exchanges between affiliated funds. The Trust is registered under the Investment Company Act of 1940, as amended (the 1940 Act), as an open-end management investment company organized as a Massachusetts business trust.
Effective January 1, 2020:
Investment advisers Fidelity Investments Money Management, Inc., FMR Co., Inc., and Fidelity SelectCo, LLC, merged with and into Fidelity Management & Research Company. In connection with the merger transactions, the resulting, merged investment adviser was then redomiciled from Massachusetts to Delaware, changed its corporate structure from a corporation to a limited liability company, and changed its name to "Fidelity Management & Research Company LLC".
Fidelity Investments Institutional Operations Company, Inc. converted from a Massachusetts corporation to a Massachusetts LLC, and changed its name to "Fidelity Investments Institutional Operations Company LLC".
2. Investments in Fidelity Central Funds.
The Fund invests in Fidelity Central Funds, which are open-end investment companies generally available only to other investment companies and accounts managed by the investment adviser and its affiliates. The Fund's Schedule of Investments lists each of the Fidelity Central Funds held as of period end, if any, as an investment of the Fund, but does not include the underlying holdings of each Fidelity Central Fund. As an Investing Fund, the Fund indirectly bears its proportionate share of the expenses of the underlying Fidelity Central Funds.
The Money Market Central Funds seek preservation of capital and current income and are managed by the investment adviser. Annualized expenses of the Money Market Central Funds as of their most recent shareholder report date ranged from less than .005% to .01%.
A complete unaudited list of holdings for each Fidelity Central Fund is available upon request or at the Securities and Exchange Commission (the SEC) website at www.sec.gov. In addition, the financial statements of the Fidelity Central Funds, which are not covered by the Fund's Report of Independent Registered Public Accounting Firm, are available on the SEC website or upon request.
3. Significant Accounting Policies.
The Fund is an investment company and applies the accounting and reporting guidance of the Financial Accounting Standards Board (FASB) Accounting Standards Codification Topic 946 Financial Services – Investment Companies. The financial statements have been prepared in conformity with accounting principles generally accepted in the United States of America (GAAP), which require management to make certain estimates and assumptions at the date of the financial statements. Actual results could differ from those estimates. Subsequent events, if any, through the date that the financial statements were issued have been evaluated in the preparation of the financial statements. The following summarizes the significant accounting policies of the Fund:
Investment Valuation. Investments are valued as of 4:00 p.m. Eastern time on the last calendar day of the period. The Board of Trustees (the Board) has delegated the day to day responsibility for the valuation of the Fund's investments to the Fair Value Committee (the Committee) established by the Fund's investment adviser. In accordance with valuation policies and procedures approved by the Board, the Fund attempts to obtain prices from one or more third party pricing vendors or brokers to value its investments. When current market prices, quotations or currency exchange rates are not readily available or reliable, investments will be fair valued in good faith by the Committee, in accordance with procedures adopted by the Board. Factors used in determining fair value vary by investment type and may include market or investment specific events. The frequency with which these procedures are used cannot be predicted and they may be utilized to a significant extent. The Committee oversees the Fund's valuation policies and procedures and reports to the Board on the Committee's activities and fair value determinations. The Board monitors the appropriateness of the procedures used in valuing the Fund's investments and ratifies the fair value determinations of the Committee.
The Fund categorizes the inputs to valuation techniques used to value its investments into a disclosure hierarchy consisting of three levels as shown below:
- Level 1 – quoted prices in active markets for identical investments
- Level 2 – other significant observable inputs (including quoted prices for similar investments, interest rates, prepayment speeds, etc.)
- Level 3 – unobservable inputs (including the Fund's own assumptions based on the best information available)
Valuation techniques used to value the Fund's investments by major category are as follows:
Equity securities, including restricted securities, for which market quotations are readily available, are valued at the last reported sale price or official closing price as reported by a third party pricing vendor on the primary market or exchange on which they are traded and are categorized as Level 1 in the hierarchy. In the event there were no sales during the day or closing prices are not available, securities are valued at the last quoted bid price or may be valued using the last available price and are generally categorized as Level 2 in the hierarchy. For foreign equity securities, when market or security specific events arise, comparisons to the valuation of American Depositary Receipts (ADRs), futures contracts, Exchange-Traded Funds (ETFs) and certain indexes as well as quoted prices for similar securities may be used and would be categorized as Level 2 in the hierarchy. For equity securities, including restricted securities, where observable inputs are limited, assumptions about market activity and risk are used and these securities may be categorized as Level 3 in the hierarchy.
Investments in open-end mutual funds, including the Fidelity Central Funds, are valued at their closing net asset value (NAV) each business day and are categorized as Level 1 in the hierarchy.
Changes in valuation techniques may result in transfers in or out of an assigned level within the disclosure hierarchy. The aggregate value of investments by input level as of July 31, 2020 is included at the end of the Fund's Schedule of Investments.
Foreign Currency. The Fund may use foreign currency contracts to facilitate transactions in foreign-denominated securities. Gains and losses from these transactions may arise from changes in the value of the foreign currency or if the counterparties do not perform under the contracts' terms.
Foreign-denominated assets, including investment securities, and liabilities are translated into U.S. dollars at the exchange rates at period end. Purchases and sales of investment securities, income and dividends received and expenses denominated in foreign currencies are translated into U.S. dollars at the exchange rate in effect on the transaction date.
The effects of exchange rate fluctuations on investments are included with the net realized and unrealized gain (loss) on investment securities. Other foreign currency transactions resulting in realized and unrealized gain (loss) are disclosed separately.
Investment Transactions and Income. For financial reporting purposes, the Fund's investment holdings and NAV include trades executed through the end of the last business day of the period. The NAV per share for processing shareholder transactions is calculated as of the close of business of the New York Stock Exchange (NYSE), normally 4:00 p.m. Eastern time and includes trades executed through the end of the prior business day. Gains and losses on securities sold are determined on the basis of identified cost and include proceeds received from litigation. Dividend income is recorded on the ex-dividend date, except for certain dividends from foreign securities where the ex-dividend date may have passed, which are recorded as soon as the Fund is informed of the ex-dividend date. Non-cash dividends included in dividend income, if any, are recorded at the fair market value of the securities received. Income and capital gain distributions from Fidelity Central Funds, if any, are recorded on the ex-dividend date. Certain distributions received by the Fund represent a return of capital or capital gain. The Fund determines the components of these distributions subsequent to the ex-dividend date, based upon receipt of tax filings or other correspondence relating to the underlying investment. These distributions are recorded as a reduction of cost of investments and/or as a realized gain. Investment income is recorded net of foreign taxes withheld where recovery of such taxes is uncertain.
Expenses. Expenses directly attributable to a fund are charged to that fund. Expenses attributable to more than one fund are allocated among the respective funds on the basis of relative net assets or other appropriate methods. Expense estimates are accrued in the period to which they relate and adjustments are made when actual amounts are known.
Income Tax Information and Distributions to Shareholders. Each year, the Fund intends to qualify as a regulated investment company under Subchapter M of the Internal Revenue Code, including distributing substantially all of its taxable income and realized gains. As a result, no provision for U.S. Federal income taxes is required. As of July 31, 2020, the Fund did not have any unrecognized tax benefits in the financial statements; nor is the Fund aware of any tax positions for which it is reasonably possible that the total amounts of unrecognized tax benefits will significantly change in the next twelve months. The Fund files a U.S. federal tax return, in addition to state and local tax returns as required. The Fund's federal income tax returns are subject to examination by the Internal Revenue Service (IRS) for a period of three fiscal years after they are filed. State and local tax returns may be subject to examination for an additional fiscal year depending on the jurisdiction. Foreign taxes are provided for based on the Fund's understanding of the tax rules and rates that exist in the foreign markets in which it invests.
Distributions are declared and recorded on the ex-dividend date. Income and capital gain distributions are determined in accordance with income tax regulations, which may differ from GAAP. In addition, the Fund claimed a portion of the payment made to redeeming shareholders as a distribution for income tax purposes.
Capital accounts within the financial statements are adjusted for permanent book-tax differences. These adjustments have no impact on net assets or the results of operations. Capital accounts are not adjusted for temporary book-tax differences which will reverse in a subsequent period.
Book-tax differences are primarily due to foreign currency transactions, partnerships, capital loss carryforwards and losses deferred due to wash sales.
As of period end, the cost and unrealized appreciation (depreciation) in securities, and derivatives if applicable, for federal income tax purposes were as follows:
| Gross unrealized appreciation | $31,902,712 |
| Gross unrealized depreciation | (48,923,046) |
| Net unrealized appreciation (depreciation) | $(17,020,334) |
| Tax Cost | $391,783,082 |
The tax-based components of distributable earnings as of period end were as follows:
| Undistributed ordinary income | $2,582,507 |
| Capital loss carryforward | $(21,215,763) |
| Net unrealized appreciation (depreciation) on securities and other investments | $(17,446,709) |
Capital loss carryforwards are only available to offset future capital gains of the Fund to the extent provided by regulations and may be limited. The capital loss carryforward information presented below, including any applicable limitation, is estimated as of fiscal period end and is subject to adjustment.
| No expiration | |
| Short-term | $(15,583,954) |
| Long-term | (5,631,809) |
| Total capital loss carryforward | $(21,215,763) |
The tax character of distributions paid was as follows:
| | July 31, 2020 | July 31, 2019 |
| Ordinary Income | $8,938,882 | $ 5,834,651 |
| Long-term Capital Gains | – | 1,709,514 |
| Total | $8,938,882 | $ 7,544,165 |
4. Purchases and Sales of Investments.
Purchases and sales of securities, other than short-term securities, are noted in the table below.
| | Purchases ($) | Sales ($) |
| Fidelity Blue Chip Value Fund | 498,879,021 | 537,192,434 |
5. Fees and Other Transactions with Affiliates.
Management Fee. Fidelity Management & Research Company LLC (the investment adviser) and its affiliates provide the Fund with investment management related services for which the Fund pays a monthly management fee. The management fee is the sum of an individual fund fee rate that is based on an annual rate of .30% of the Fund's average net assets and an annualized group fee rate that averaged .23% during the period. The group fee rate is based upon the monthly average net assets of a group of registered investment companies with which the investment adviser has management contracts. The group fee rate decreases as assets under management increase and increases as assets under management decrease. In addition, the management fee is subject to a performance adjustment (up to a maximum of +/- .20% of the Fund's average net assets over a 36 month performance period). The upward or downward adjustment to the management fee is based on the Fund's relative investment performance as compared to its benchmark index, the Russell 1000 Value Index, over the same 36 month performance period. For the reporting period, the total annual management fee rate, including the performance adjustment, was .38% of the Fund's average net assets. The performance adjustment included in the management fee rate may be higher or lower than the maximum performance adjustment rate due to the difference between the average net assets for the reporting and performance periods.
Transfer Agent Fees. Fidelity Investments Institutional Operations Company LLC (FIIOC), an affiliate of the investment adviser, is the Fund's transfer, dividend disbursing and shareholder servicing agent. FIIOC receives account fees and asset-based fees that vary according to account size and type of account. FIIOC pays for typesetting, printing and mailing of shareholder reports, except proxy statements. For the period, the transfer agent fees were equivalent to an annual rate of .18% of average net assets.
Accounting Fees. Fidelity Service Company, Inc. (FSC), an affiliate of the investment adviser, maintains the Fund's accounting records. The accounting fee is based on the level of average net assets for each month. For the period, the fees were equivalent to the following annual rates:
| | % of Average Net Assets |
| Fidelity Blue Chip Value Fund | .04 |
Brokerage Commissions. A portion of portfolio transactions were placed with brokerage firms which are affiliates of the investment adviser. Brokerage commissions are included in net realized gain (loss) and change in net unrealized appreciation (depreciation) in the Statement of Operations. The commissions paid to these affiliated firms were as follows:
| | Amount |
| Fidelity Blue Chip Value Fund | $17,222 |
Interfund Lending Program. Pursuant to an Exemptive Order issued by the SEC, the fund, along with other registered investment companies having management contracts with Fidelity Management & Research Company LLC (FMR), or other affiliated entities of FMR, may participate in an interfund lending program. This program provides an alternative credit facility allowing the fund to borrow from, or lend money to, other participating affiliated funds. At period end, there were no interfund loans outstanding. Activity in this program during the period for which loans were outstanding was as follows:
| | Borrower or Lender | Average Loan Balance | Weighted Average Interest Rate | Interest Expense |
| Fidelity Blue Chip Value Fund | Borrower | $7,546,000 | 1.36% | $285 |
Interfund Trades. Funds may purchase from or sell securities to other Fidelity Funds under procedures adopted by the Board. The procedures have been designed to ensure these interfund trades are executed in accordance with Rule 17a-7 of the 1940 Act. Interfund trades are included within the respective purchases and sales amounts shown in the Purchases and Sales of Investments note.
Other. During the period, the investment adviser reimbursed the Fund for certain losses in the amount of $2,274.
6. Committed Line of Credit.
Certain Funds participate with other funds managed by the investment adviser or an affiliate in a $4.25 billion credit facility (the "line of credit") to be utilized for temporary or emergency purposes to fund shareholder redemptions or for other short-term liquidity purposes. The participating funds have agreed to pay commitment fees on their pro-rata portion of the line of credit, which are reflected in Miscellaneous expenses on the Statement of Operations, and are as follows:
| | Amount |
| Fidelity Blue Chip Value Fund | $1,079 |
During the period, there were no borrowings on this line of credit.
7. Security Lending.
The Fund lends portfolio securities from time to time in order to earn additional income. Lending agents are used, including National Financial Services (NFS), an affiliate of the Fund. Pursuant to a securities lending agreement, NFS will receive a fee, which is capped at 9.9% of daily lending revenue, for its services as lending agent. The Fund may lend securities to certain qualified borrowers, including NFS. On the settlement date of the loan, the Fund receives collateral (in the form of U.S. Treasury obligations, letters of credit and/or cash) against the loaned securities and maintains collateral in an amount not less than 100% of the market value of the loaned securities during the period of the loan. The market value of the loaned securities is determined at the close of business of the Fund and any additional required collateral is delivered to the Fund on the next business day. The Fund or borrower may terminate the loan at any time, and if the borrower defaults on its obligation to return the securities loaned because of insolvency or other reasons, the Fund may apply collateral received from the borrower against the obligation. The Fund may experience delays and costs in recovering the securities loaned. Any cash collateral received is invested in the Fidelity Securities Lending Cash Central Fund. The value of loaned securities and cash collateral at period end are disclosed on the Fund's Statement of Assets and Liabilities. Total fees paid by the Fund to NFS, as lending agent, amounted to $129. Security lending income represents the income earned on investing cash collateral, less rebates paid to borrowers and any lending agent fees associated with the loan, plus any premium payments received for lending certain types of securities. Net income from the Fidelity Securities Lending Cash Central Fund during the period is presented in the Statement of Operations as a component of income from Fidelity Central Funds. During the period, there were no securities loaned to NFS.
8. Expense Reductions.
Commissions paid to certain brokers with whom the investment adviser, or its affiliates, places trades on behalf of the Fund include an amount in addition to trade execution, which may be rebated back to the Fund to offset certain expenses. This amount totaled $71,717 for the period. In addition, through arrangements with the Fund's custodian, credits realized as a result of certain uninvested cash balances were used to reduce the Fund's expenses by $72.
In addition, during the period the investment adviser or an affiliate reimbursed and/or waived a portion of operating expenses in the amount of $2,010.
9. Other.
The Fund's organizational documents provide former and current trustees and officers with a limited indemnification against liabilities arising in connection with the performance of their duties to the Fund. In the normal course of business, the Fund may also enter into contracts that provide general indemnifications. The Fund's maximum exposure under these arrangements is unknown as this would be dependent on future claims that may be made against the Fund. The risk of material loss from such claims is considered remote.
10. Coronavirus (COVID-19) Pandemic.
An outbreak of COVID-19 first detected in China during December 2019 has since spread globally and was declared a pandemic by the World Health Organization during March 2020. Developments that disrupt global economies and financial markets, such as the COVID-19 pandemic, may magnify factors that affect the Fund's performance.
Report of Independent Registered Public Accounting Firm
To the Board of Trustees of Fidelity Securities Fund and Shareholders of Fidelity Blue Chip Value Fund
Opinion on the Financial Statements
We have audited the accompanying statement of assets and liabilities, including the schedule of investments, of Fidelity Blue Chip Value Fund (one of the funds constituting Fidelity Securities Fund, referred to hereafter as the “Fund”) as of July 31, 2020, the related statement of operations for the year ended July 31, 2020, the statement of changes in net assets for each of the two years in the period ended July 31, 2020, including the related notes, and the financial highlights for each of the five years in the period ended July 31, 2020 (collectively referred to as the “financial statements”). In our opinion, the financial statements present fairly, in all material respects, the financial position of the Fund as of July 31, 2020, the results of its operations for the year then ended, the changes in its net assets for each of the two years in the period ended July 31, 2020 and the financial highlights for each of the five years in the period ended July 31, 2020 in conformity with accounting principles generally accepted in the United States of America.
Basis for Opinion
These financial statements are the responsibility of the Fund’s management. Our responsibility is to express an opinion on the Fund’s financial statements based on our audits. We are a public accounting firm registered with the Public Company Accounting Oversight Board (United States) (PCAOB) and are required to be independent with respect to the Fund in accordance with the U.S. federal securities laws and the applicable rules and regulations of the Securities and Exchange Commission and the PCAOB.
We conducted our audits of these financial statements in accordance with the standards of the PCAOB. Those standards require that we plan and perform the audit to obtain reasonable assurance about whether the financial statements are free of material misstatement, whether due to error or fraud.
Our audits included performing procedures to assess the risks of material misstatement of the financial statements, whether due to error or fraud, and performing procedures that respond to those risks. Such procedures included examining, on a test basis, evidence regarding the amounts and disclosures in the financial statements. Our audits also included evaluating the accounting principles used and significant estimates made by management, as well as evaluating the overall presentation of the financial statements. Our procedures included confirmation of securities owned as of July 31, 2020 by correspondence with the custodian and brokers; when replies were not received from brokers, we performed other auditing procedures. We believe that our audits provide a reasonable basis for our opinion.
/s/ PricewaterhouseCoopers LLP
Boston, Massachusetts
September 9, 2020
We have served as the auditor of one or more investment companies in the Fidelity group of funds since 1932.
Trustees and Officers
The Trustees, Members of the Advisory Board (if any), and officers of the trust and fund, as applicable, are listed below. The Board of Trustees governs the fund and is responsible for protecting the interests of shareholders. The Trustees are experienced executives who meet periodically throughout the year to oversee the fund's activities, review contractual arrangements with companies that provide services to the fund, oversee management of the risks associated with such activities and contractual arrangements, and review the fund's performance. Except for Jonathan Chiel, each of the Trustees oversees 311 funds. Mr. Chiel oversees 174 funds.
The Trustees hold office without limit in time except that (a) any Trustee may resign; (b) any Trustee may be removed by written instrument, signed by at least two-thirds of the number of Trustees prior to such removal; (c) any Trustee who requests to be retired or who has become incapacitated by illness or injury may be retired by written instrument signed by a majority of the other Trustees; and (d) any Trustee may be removed at any special meeting of shareholders by a two-thirds vote of the outstanding voting securities of the trust. Each Trustee who is not an interested person (as defined in the 1940 Act) of the trust and the fund is referred to herein as an Independent Trustee. Each Independent Trustee shall retire not later than the last day of the calendar year in which his or her 75th birthday occurs. The Independent Trustees may waive this mandatory retirement age policy with respect to individual Trustees. Officers and Advisory Board Members hold office without limit in time, except that any officer or Advisory Board Member may resign or may be removed by a vote of a majority of the Trustees at any regular meeting or any special meeting of the Trustees. Except as indicated, each individual has held the office shown or other offices in the same company for the past five years.
The fund’s Statement of Additional Information (SAI) includes more information about the Trustees. To request a free copy, call Fidelity at 1-800-544-8544.
Experience, Skills, Attributes, and Qualifications of the Trustees. The Governance and Nominating Committee has adopted a statement of policy that describes the experience, qualifications, attributes, and skills that are necessary and desirable for potential Independent Trustee candidates (Statement of Policy). The Board believes that each Trustee satisfied at the time he or she was initially elected or appointed a Trustee, and continues to satisfy, the standards contemplated by the Statement of Policy. The Governance and Nominating Committee also engages professional search firms to help identify potential Independent Trustee candidates who have the experience, qualifications, attributes, and skills consistent with the Statement of Policy. From time to time, additional criteria based on the composition and skills of the current Independent Trustees, as well as experience or skills that may be appropriate in light of future changes to board composition, business conditions, and regulatory or other developments, have also been considered by the professional search firms and the Governance and Nominating Committee. In addition, the Board takes into account the Trustees' commitment and participation in Board and committee meetings, as well as their leadership of standing and ad hoc committees throughout their tenure.
In determining that a particular Trustee was and continues to be qualified to serve as a Trustee, the Board has considered a variety of criteria, none of which, in isolation, was controlling. The Board believes that, collectively, the Trustees have balanced and diverse experience, qualifications, attributes, and skills, which allow the Board to operate effectively in governing the fund and protecting the interests of shareholders. Information about the specific experience, skills, attributes, and qualifications of each Trustee, which in each case led to the Board's conclusion that the Trustee should serve (or continue to serve) as a trustee of the fund, is provided below.
Board Structure and Oversight Function. Robert A. Lawrence is an interested person and currently serves as Acting Chairman. The Trustees have determined that an interested Chairman is appropriate and benefits shareholders because an interested Chairman has a personal and professional stake in the quality and continuity of services provided to the fund. Independent Trustees exercise their informed business judgment to appoint an individual of their choosing to serve as Chairman, regardless of whether the Trustee happens to be independent or a member of management. The Independent Trustees have determined that they can act independently and effectively without having an Independent Trustee serve as Chairman and that a key structural component for assuring that they are in a position to do so is for the Independent Trustees to constitute a substantial majority for the Board. The Independent Trustees also regularly meet in executive session. Ned C. Lautenbach and David M. Thomas serve as Co-Lead Independent Trustees and as such each (i) acts as a liaison between the Independent Trustees and management with respect to matters important to the Independent Trustees and (ii) with management prepares agendas for Board meetings.
Fidelity® funds are overseen by different Boards of Trustees. The fund's Board oversees Fidelity's high income and certain equity funds, and other Boards oversee Fidelity's investment-grade bond, money market, asset allocation, and other equity funds. The asset allocation funds may invest in Fidelity® funds overseen by the fund's Board. The use of separate Boards, each with its own committee structure, allows the Trustees of each group of Fidelity® funds to focus on the unique issues of the funds they oversee, including common research, investment, and operational issues. On occasion, the separate Boards establish joint committees to address issues of overlapping consequences for the Fidelity® funds overseen by each Board.
The Trustees operate using a system of committees to facilitate the timely and efficient consideration of all matters of importance to the Trustees, the fund, and fund shareholders and to facilitate compliance with legal and regulatory requirements and oversight of the fund's activities and associated risks. The Board, acting through its committees, has charged FMR and its affiliates with (i) identifying events or circumstances the occurrence of which could have demonstrably adverse effects on the fund's business and/or reputation; (ii) implementing processes and controls to lessen the possibility that such events or circumstances occur or to mitigate the effects of such events or circumstances if they do occur; and (iii) creating and maintaining a system designed to evaluate continuously business and market conditions in order to facilitate the identification and implementation processes described in (i) and (ii) above. Because the day-to-day operations and activities of the fund are carried out by or through FMR, its affiliates, and other service providers, the fund's exposure to risks is mitigated but not eliminated by the processes overseen by the Trustees. While each of the Board's committees has responsibility for overseeing different aspects of the fund's activities, oversight is exercised primarily through the Operations, Audit, and Compliance Committees. Appropriate personnel, including but not limited to the fund's Chief Compliance Officer (CCO), FMR's internal auditor, the independent accountants, the fund's Treasurer and portfolio management personnel, make periodic reports to the Board's committees, as appropriate, including an annual review of Fidelity's risk management program for the Fidelity® funds. The responsibilities of each standing committee, including their oversight responsibilities, are described further under "Standing Committees of the Trustees."
Interested Trustees*:
Correspondence intended for a Trustee who is an interested person may be sent to Fidelity Investments, 245 Summer Street, Boston, Massachusetts 02210.
Name, Year of Birth; Principal Occupations and Other Relevant Experience+
Jonathan Chiel (1957)
Year of Election or Appointment: 2016
Trustee
Mr. Chiel also serves as Trustee of other Fidelity® funds. Mr. Chiel is Executive Vice President and General Counsel for FMR LLC (diversified financial services company, 2012-present). Previously, Mr. Chiel served as general counsel (2004-2012) and senior vice president and deputy general counsel (2000-2004) for John Hancock Financial Services; a partner with Choate, Hall & Stewart (1996-2000) (law firm); and an Assistant United States Attorney for the United States Attorney’s Office of the District of Massachusetts (1986-95), including Chief of the Criminal Division (1993-1995). Mr. Chiel is a director on the boards of the Boston Bar Foundation and the Maimonides School.
Robert A. Lawrence (1952)
Year of Election or Appointment: 2020
Trustee
Acting Chairman of the Board of Trustees
Mr. Lawrence also serves as Trustee of other funds. Previously, Mr. Lawrence served as a Member of the Advisory Board of certain funds. Prior to his retirement in 2008, Mr. Lawrence served as Vice President of certain Fidelity® funds (2006-2008), Senior Vice President, Head of High Income Division of Fidelity Management & Research Company (investment adviser firm, 2006-2008), and President of Fidelity Strategic Investments (investment adviser firm, 2002-2005).
* Determined to be an “Interested Trustee” by virtue of, among other things, his or her affiliation with the trust or various entities under common control with FMR.
+ The information includes the Trustee's principal occupation during the last five years and other information relating to the experience, attributes, and skills relevant to the Trustee's qualifications to serve as a Trustee, which led to the conclusion that the Trustee should serve as a Trustee for the fund.
Independent Trustees:
Correspondence intended for an Independent Trustee may be sent to Fidelity Investments, P.O. Box 55235, Boston, Massachusetts 02205-5235.
Name, Year of Birth; Principal Occupations and Other Relevant Experience+
Dennis J. Dirks (1948)
Year of Election or Appointment: 2005
Trustee
Mr. Dirks also serves as Trustee of other Fidelity® funds. Prior to his retirement in May 2003, Mr. Dirks served as Chief Operating Officer and as a member of the Board of The Depository Trust & Clearing Corporation (financial markets infrastructure), President, Chief Operating Officer and a member of the Board of The Depository Trust Company (DTC), President and a member of the Board of the National Securities Clearing Corporation (NSCC), Chief Executive Officer and a member of the Board of the Government Securities Clearing Corporation and Chief Executive Officer and a member of the Board of the Mortgage-Backed Securities Clearing Corporation. Mr. Dirks currently serves as a member of the Finance Committee (2016-present) and Board (2017-present) and is Treasurer (2018-present) of the Asolo Repertory Theatre.
Donald F. Donahue (1950)
Year of Election or Appointment: 2018
Trustee
Mr. Donahue also serves as Trustee of other Fidelity® funds. Mr. Donahue serves as President and Chief Executive Officer of Miranda Partners, LLC (risk consulting for the financial services industry, 2012-present). Previously, Mr. Donahue served as Chief Executive Officer (2006-2012), Chief Operating Officer (2003-2006) and Managing Director, Customer Marketing and Development (1999-2003) of The Depository Trust & Clearing Corporation (financial markets infrastructure). Mr. Donahue currently serves as a member (2007-present) and Co-Chairman (2016-present) of the Board of United Way of New York, a member of the Board of NYC Leadership Academy (2012-present) and a member of the Board of Advisors of Ripple Labs, Inc. (financial services, 2015-present). Mr. Donahue previously served as a member of the Advisory Board of certain Fidelity® funds (2015-2018).
Vicki L. Fuller (1957)
Year of Election or Appointment: 2020
Trustee
Ms. Fuller also serves as Trustee of other Fidelity® funds. Previously, Ms. Fuller served as a member of the Advisory Board of certain Fidelity® funds (2018-2020), Chief Investment Officer of the New York State Common Retirement Fund (2012-2018) and held a variety of positions at AllianceBernstein L.P. (global asset management, 1985-2012), including Managing Director (2006-2012) and Senior Vice President and Senior Portfolio Manager (2001-2006). Ms. Fuller currently serves as a member of the Board, Audit Committee and Nominating and Governance Committee of The Williams Companies, Inc. (natural gas infrastructure, 2018-present) and as a member of the Board of Treliant, LLC (consulting, 2019-present).
Patricia L. Kampling (1959)
Year of Election or Appointment: 2020
Trustee
Ms. Kampling also serves as Trustee of other Fidelity® funds. Prior to her retirement, Ms. Kampling served as Chairman of the Board and Chief Executive Officer (2012-2019), President and Chief Operating Officer (2011-2012) and Executive Vice President and Chief Financial Officer (2010-2011) of Alliant Energy Corporation. Ms. Kampling currently serves as a member of the Board, Compensation Committee and Executive Committee and as Chair of the Audit Committee of Briggs & Stratton Corporation (manufacturing, 2011-present) and as a member of the Board, Audit, Finance and Risk Committee and Safety, Environmental, Technology and Operations Committee of American Water Works Company, Inc. (utilities company, 2019-present). In addition, Ms. Kampling currently serves as a member of the Board of the Nature Conservancy, Wisconsin Chapter (2019-present). Previously, Ms. Kampling served as a Member of the Advisory Board of certain Fidelity® funds (2020), a member of the Board of Interstate Power and Light Company (2012-2019) and Wisconsin Power and Light Company (2012-2019) (each a subsidiary of Alliant Energy Corporation) and as a member of the Board and Workforce Development Committee of the Business Roundtable (2018-2019).
Alan J. Lacy (1953)
Year of Election or Appointment: 2008
Trustee
Mr. Lacy also serves as Trustee of other Fidelity® funds. Previously, Mr. Lacy served as Senior Adviser (2007-2014) of Oak Hill Capital Partners, L.P. (private equity), Chief Executive Officer (2005) and Vice Chairman (2005-2006) of Sears Holdings Corporation (retail), Chief Executive Officer and Chairman of the Board of Sears, Roebuck and Co. (retail, 2000-2005), Chairman (2014-2017) and a member of the Board (2010-2017) of Dave & Buster’s Entertainment, Inc. (restaurant and entertainment complexes) and a member of the Board of Bristol-Myers Squibb Company (global pharmaceuticals, 2008-2020). Mr. Lacy currently serves as a Trustee of the California Chapter of The Nature Conservancy (2015-present) and a member of the Board of the Center for Advanced Study in the Behavioral Sciences at Stanford University (2015-present).
Ned C. Lautenbach (1944)
Year of Election or Appointment: 2000
Trustee
Co-Lead Independent Trustee
Mr. Lautenbach also serves as Trustee of other Fidelity® funds. Mr. Lautenbach currently serves as Chair of the Board of Governors, State University System of Florida (2013-present) and is a member of the Council on Foreign Relations (1994-present). He is also a member and has in the past served as Chairman of the Board of Directors of Artis-Naples (2012-present). Previously, Mr. Lautenbach served as a member and then Lead Director of the Board of Directors of Eaton Corporation (diversified industrial, 1997-2016). He was also a Partner at Clayton, Dubilier & Rice, LLC (private equity investment, 1998-2010); as well as Director of Sony Corporation (2006-2007). In addition, Mr. Lautenbach had a 30-year career with IBM (technology company), during which time he served as Senior Vice President and as a member of the Corporate Executive Committee (1968-1998).
Joseph Mauriello (1944)
Year of Election or Appointment: 2008
Trustee
Mr. Mauriello also serves as Trustee of other Fidelity® funds. Prior to his retirement in January 2006, Mr. Mauriello served in numerous senior management positions including Deputy Chairman and Chief Operating Officer (2004-2005), and Vice Chairman of Financial Services (2002-2004) of KPMG LLP US (professional services, 1965-2005). Mr. Mauriello currently serves as a member of the Independent Directors Council Governing Council (2015-present). Previously, Mr. Mauriello served as a member of the Board of XL Group plc. (global insurance and re-insurance, 2006-2018).
Cornelia M. Small (1944)
Year of Election or Appointment: 2005
Trustee
Ms. Small also serves as Trustee of other Fidelity® funds. Previously, Ms. Small served as Chief Investment Officer, Director of Global Equity Investments and a member of Scudder, Stevens & Clark and Scudder Kemper Investments. Ms. Small previously served as a member of the Board (2009-2019) and Chair of the Investment Committee (2010-2019) of the Teagle Foundation and a member of the Investment Committee of the Berkshire Taconic Community Foundation (2008-2019).
Garnett A. Smith (1947)
Year of Election or Appointment: 2018
Trustee
Mr. Smith also serves as Trustee of other Fidelity® funds. Prior to his retirement, Mr. Smith served as Chairman and Chief Executive Officer (1990-1997) and President (1986-1990) of Inbrand Corp. (manufacturer of personal absorbent products). Prior to his employment with Inbrand Corp., he was employed by a retail fabric chain and North Carolina National Bank (now Bank of America). Mr. Smith previously served as a member of the Advisory Board of certain Fidelity® funds (2012-2013).
David M. Thomas (1949)
Year of Election or Appointment: 2008
Trustee
Co-Lead Independent Trustee
Mr. Thomas also serves as Trustee of other Fidelity® funds. Previously, Mr. Thomas served as Executive Chairman (2005-2006) and Chairman and Chief Executive Officer (2000-2005) of IMS Health, Inc. (pharmaceutical and healthcare information solutions). Mr. Thomas currently serves as Non-Executive Chairman of the Board of Fortune Brands Home and Security (home and security products, 2011-present), and a member of the Board (2004-present) and Presiding Director (2013-present) of Interpublic Group of Companies, Inc. (marketing communication).
Susan Tomasky (1953)
Year of Election or Appointment: 2020
Trustee
Ms. Tomasky also serves as Trustee of other Fidelity® funds. Prior to her retirement, Ms. Tomasky served in various executive officer positions at American Electric Power Company, Inc. (1998-2011), including most recently as President of AEP Transmission (2007-2011). Ms. Tomasky currently serves as a member of the Board and Sustainability Committee and as Chair of the Audit Committee of Marathon Petroleum Corporation (2018-present) and as a member of the Board, Corporate Governance Committee and Organization and Compensation Committee and as Chair of the Audit Committee of Public Service Enterprise Group, Inc. (utilities company, 2012-present). In addition, Ms. Tomasky currently serves as a member of the Board of the Columbus Regional Airport Authority (2007-present), as a member of the Board of the Royal Shakespeare Company – America (2009-present), as a member of the Board of the Columbus Association for the Performing Arts (2011-present) and as a member of the Board of Kenyon College (2016-present). Previously, Ms. Tomasky served as a Member of the Advisory Board of certain Fidelity® funds (2020), a member of the Board (2011-2019) and as Lead Independent Director (2015-2018) of Andeavor Corporation (previously Tesoro Corporation) (independent oil refiner and marketer) and as a member of the Board of Summit Midstream Partners LP (energy, 2012-2018).
Michael E. Wiley (1950)
Year of Election or Appointment: 2020
Trustee
Mr. Wiley also serves as Trustee of other Fidelity® funds. Previously, Mr. Wiley served as a member of the Advisory Board of certain Fidelity® funds (2018-2020), Chairman, President and CEO of Baker Hughes, Inc. (oilfield services, 2000-2004). Mr. Wiley also previously served as a member of the Board of Andeavor Corporation (independent oil refiner and marketer, 2005-2018), a member of the Board of Andeavor Logistics LP (natural resources logistics, 2015-2018) and a member of the Board of High Point Resources (exploration and production, 2005-2020).
+ The information includes the Trustee's principal occupation during the last five years and other information relating to the experience, attributes, and skills relevant to the Trustee's qualifications to serve as a Trustee, which led to the conclusion that the Trustee should serve as a Trustee for the fund.
Advisory Board Members and Officers:
Correspondence intended for a Member of the Advisory Board (if any) may be sent to Fidelity Investments, P.O. Box 55235, Boston, Massachusetts 02205-5235. Correspondence intended for an officer or Peter S. Lynch may be sent to Fidelity Investments, 245 Summer Street, Boston, Massachusetts 02210. Officers appear below in alphabetical order.
Name, Year of Birth; Principal Occupation
Peter S. Lynch (1944)
Year of Election or Appointment: 2003
Member of the Advisory Board
Mr. Lynch also serves as a Member of the Advisory Board of other Fidelity® funds. Mr. Lynch is Vice Chairman and a Director of Fidelity Management & Research Company LLC (investment adviser firm). In addition, Mr. Lynch serves as a Trustee of Boston College and as the Chairman of the Inner-City Scholarship Fund. Previously, Mr. Lynch served as Vice Chairman and a Director of FMR Co., Inc. (investment adviser firm) and on the Special Olympics International Board of Directors (1997-2006).
Elizabeth Paige Baumann (1968)
Year of Election or Appointment: 2017
Anti-Money Laundering (AML) Officer
Ms. Baumann also serves as AML Officer of other funds. She is Chief AML Officer (2012-present) and Senior Vice President (2014-present) of FMR LLC (diversified financial services company) and is an employee of Fidelity Investments. Previously, Ms. Baumann served as AML Officer of certain funds (2017-2019), as AML Officer of the funds (2012-2016), and Vice President (2007-2014) and Deputy Anti-Money Laundering Officer (2007-2012) of FMR LLC.
Craig S. Brown (1977)
Year of Election or Appointment: 2019
Assistant Treasurer
Mr. Brown also serves as Assistant Treasurer of other funds. Mr. Brown is an employee of Fidelity Investments (2013-present).
John J. Burke III (1964)
Year of Election or Appointment: 2018
Chief Financial Officer
Mr. Burke also serves as Chief Financial Officer of other funds. Mr. Burke serves as Head of Investment Operations for Fidelity Fund and Investment Operations (2018-present) and is an employee of Fidelity Investments (1998-present). Previously Mr. Burke served as head of Asset Management Investment Operations (2012-2018).
William C. Coffey (1969)
Year of Election or Appointment: 2019
Assistant Secretary
Mr. Coffey also serves as Assistant Secretary of other funds. He is Senior Vice President and Deputy General Counsel of FMR LLC (diversified financial services company, 2010-present), and is an employee of Fidelity Investments. Previously, Mr. Coffey served as Secretary and CLO of certain funds (2018-2019); CLO, Secretary, and Senior Vice President of Fidelity Management & Research Company and FMR Co., Inc. (investment adviser firms, 2018-2019); Secretary of Fidelity SelectCo, LLC and Fidelity Investments Money Management, Inc. (investment adviser firms, 2018-2019); CLO of Fidelity Management & Research (Hong Kong) Limited, FMR Investment Management (UK) Limited, and Fidelity Management & Research (Japan) Limited (investment adviser firms, 2018-2019); and Assistant Secretary of certain funds (2009-2018).
Timothy M. Cohen (1969)
Year of Election or Appointment: 2018
Vice President
Mr. Cohen also serves as Vice President of other funds. Mr. Cohen serves as Co-Head of Equity (2018-present), a Director of Fidelity Management & Research (Japan) Limited (investment adviser firm, 2016-present), and is an employee of Fidelity Investments. Previously, Mr. Cohen served as Executive Vice President of Fidelity SelectCo, LLC (2019), Head of Global Equity Research (2016-2018), Chief Investment Officer - Equity and a Director of Fidelity Management & Research (U.K.) Inc. (investment adviser firm, 2013-2015) and as a Director of Fidelity Management & Research (Hong Kong) Limited (investment adviser firm, 2017).
Jonathan Davis (1968)
Year of Election or Appointment: 2010
Assistant Treasurer
Mr. Davis also serves as Assistant Treasurer of other funds. Mr. Davis serves as Assistant Treasurer of FMR Capital, Inc. (2017-present) and is an employee of Fidelity Investments. Previously, Mr. Davis served as Vice President and Associate General Counsel of FMR LLC (diversified financial services company, 2003-2010).
Laura M. Del Prato (1964)
Year of Election or Appointment: 2018
Assistant Treasurer
Ms. Del Prato also serves as an officer of other funds. Ms. Del Prato is an employee of Fidelity Investments (2017-present). Previously, Ms. Del Prato served as President and Treasurer of The North Carolina Capital Management Trust: Cash Portfolio and Term Portfolio (2018-2020). Prior to joining Fidelity Investments, Ms. Del Prato served as a Managing Director and Treasurer of the JPMorgan Mutual Funds (2014-2017). Prior to JPMorgan, Ms. Del Prato served as a partner at Cohen Fund Audit Services (accounting firm, 2012-2013) and KPMG LLP (accounting firm, 2004-2012).
Colm A. Hogan (1973)
Year of Election or Appointment: 2020
Assistant Treasurer
Mr. Hogan also serves as an officer of other funds. Mr. Hogan serves as Assistant Treasurer of FMR Capital, Inc. (2017-present) and is an employee of Fidelity Investments (2005-present). Previously, Mr. Hogan served as Deputy Treasurer of certain Fidelity® funds (2016-2020) and Assistant Treasurer of certain Fidelity® funds (2016-2018).
Pamela R. Holding (1964)
Year of Election or Appointment: 2018
Vice President
Ms. Holding also serves as Vice President of other funds. Ms. Holding serves as Co-Head of Equity (2018-present) and is an employee of Fidelity Investments (2013-present). Previously, Ms. Holding served as Executive Vice President of Fidelity SelectCo, LLC (2019) and as Chief Investment Officer of Fidelity Institutional Asset Management (2013-2018).
Cynthia Lo Bessette (1969)
Year of Election or Appointment: 2019
Secretary and Chief Legal Officer (CLO)
Ms. Lo Bessette also serves as an officer of other funds. Ms. Lo Bessette serves as CLO, Secretary, and Senior Vice President of Fidelity Management & Research Company LLC (investment adviser firm, 2019-present); and CLO of Fidelity Management & Research (Hong Kong) Limited, FMR Investment Management (UK) Limited, and Fidelity Management & Research (Japan) Limited (investment adviser firms, 2019-present). She is a Senior Vice President and Deputy General Counsel of FMR LLC (diversified financial services company, 2019-present), and is an employee of Fidelity Investments. Previously, Ms. Lo Bessette served as CLO, Secretary, and Senior Vice President of FMR Co., Inc. (investment adviser firm, 2019); Secretary of Fidelity SelectCo, LLC and Fidelity Investments Money Management, Inc. (investment adviser firms, 2019). Prior to joining Fidelity Investments, Ms. Lo Bessette was Executive Vice President, General Counsel (2016-2019) and Senior Vice President, Deputy General Counsel (2015-2016) of OppenheimerFunds (investment management company) and Deputy Chief Legal Officer (2013-2015) of Jennison Associates LLC (investment adviser firm).
Chris Maher (1972)
Year of Election or Appointment: 2020
Deputy Treasurer
Mr. Maher also serves as an officer of other funds. Mr. Maher serves as Assistant Treasurer of FMR Capital, Inc. (2017-present), and is an employee of Fidelity Investments (2008-present). Previously, Mr. Maher served as Assistant Treasurer of certain funds (2013-2020); Vice President of Asset Management Compliance (2013), Vice President of the Program Management Group of FMR (investment adviser firm, 2010-2013), and Vice President of Valuation Oversight (2008-2010).
Jason P. Pogorelec (1975)
Year of Election or Appointment: 2020
Chief Compliance Officer
Mr. Pogorelec also serves as Chief Compliance Officer of other funds. Mr. Pogorelec is a senior Vice President of Asset Management Compliance for Fidelity Investments and is an employee of Fidelity Investments (2006-present). Previously, Mr. Pogorelec served as Vice President, Associate General Counsel for Fidelity Investments (2010-2020) and Assistant Secretary of certain Fidelity funds (2015-2020).
Stacie M. Smith (1974)
Year of Election or Appointment: 2016
President and Treasurer
Ms. Smith also serves as an officer of other funds. Ms. Smith serves as Assistant Treasurer of FMR Capital, Inc. (2017-present), is an employee of Fidelity Investments (2009-present), and has served in other fund officer roles. Prior to joining Fidelity Investments, Ms. Smith served as Senior Audit Manager of Ernst & Young LLP (accounting firm, 1996-2009). Previously, Ms. Smith served as Assistant Treasurer (2013-2019) and Deputy Treasurer (2013-2016) of certain Fidelity® funds.
Marc L. Spector (1972)
Year of Election or Appointment: 2016
Assistant Treasurer
Mr. Spector also serves as an officer of other funds. Mr. Spector serves as Assistant Treasurer of FMR Capital, Inc. (2017-present) and is an employee of Fidelity Investments (2016-present). Prior to joining Fidelity Investments, Mr. Spector served as Director at the Siegfried Group (accounting firm, 2013-2016), and prior to Siegfried Group as audit senior manager at Deloitte & Touche LLP (accounting firm, 2005-2013).
Jim Wegmann (1979)
Year of Election or Appointment: 2019
Assistant Treasurer
Mr. Wegmann also serves as Assistant Treasurer of other funds. Mr. Wegmann is an employee of Fidelity Investments (2011-present).
Shareholder Expense Example
As a shareholder, you incur two types of costs: (1) transaction costs, which may include sales charges (loads) on purchase payments or redemption proceeds, as applicable and (2) ongoing costs, which generally include management fees, distribution and/or service (12b-1) fees and other Fund expenses. This Example is intended to help you understand your ongoing costs (in dollars) of investing in a fund and to compare these costs with the ongoing costs of investing in other mutual funds.
The Example is based on an investment of $1,000 invested at the beginning of the period and held for the entire period (February 1, 2020 to July 31, 2020).
Actual Expenses
The first line of the accompanying table provides information about actual account values and actual expenses. You may use the information in this line, together with the amount you invested, to estimate the expenses that you paid over the period. Simply divide your account value by $1,000.00 (for example, an $8,600 account value divided by $1,000.00 = 8.6), then multiply the result by the number in the first line for a class/Fund under the heading entitled "Expenses Paid During Period" to estimate the expenses you paid on your account during this period. If any fund is a shareholder of any underlying mutual funds or exchange-traded funds (ETFs) (the Underlying Funds), such fund indirectly bears its proportional share of the expenses of the Underlying Funds in addition to the direct expenses incurred presented in the table. These fees and expenses are not included in the annualized expense ratio used to calculate the expense estimate in the table below.
Hypothetical Example for Comparison Purposes
The second line of the accompanying table provides information about hypothetical account values and hypothetical expenses based on the actual expense ratio and an assumed rate of return of 5% per year before expenses, which is not the actual return. The hypothetical account values and expenses may not be used to estimate the actual ending account balance or expenses you paid for the period. You may use this information to compare the ongoing costs of investing in the Fund and other funds. To do so, compare this 5% hypothetical example with the 5% hypothetical examples that appear in the shareholder reports of the other funds. If any fund is a shareholder of any Underlying Funds, such fund indirectly bears its proportional share of the expenses of the Underlying Funds in addition to the direct expenses as presented in the table. These fees and expenses are not included in the annualized expense ratio used to calculate the expense estimate in the table below.
Please note that the expenses shown in the table are meant to highlight your ongoing costs only and do not reflect any transaction costs. Therefore, the second line of the table is useful in comparing ongoing costs only, and will not help you determine the relative total costs of owning different funds.
| | Annualized Expense Ratio-A | Beginning
Account Value
February 1, 2020 | Ending
Account Value
July 31, 2020 | Expenses Paid
During Period-B
February 1, 2020
to July 31, 2020 |
| Fidelity Blue Chip Value Fund | .58% | | | |
| Actual | | $1,000.00 | $857.90 | $2.68 |
| Hypothetical-C | | $1,000.00 | $1,021.98 | $2.92 |
A Annualized expense ratio reflects expenses net of applicable fee waivers.
B Expenses are equal to the annualized expense ratio, multiplied by the average account value over the period, multiplied by 182/ 366 (to reflect the one-half year period). The fees and expenses of any Underlying Funds are not included in each annualized expense ratio.
C 5% return per year before expenses
Distributions (Unaudited)
The fund designates 63% and 74% of the dividends distributed in September and December, respectively during the fiscal year as qualifying for the dividends–received deduction for corporate shareholders.
The fund designates 92% and 100% of the dividends distributed in September and December, respectively during the fiscal year as amounts which may be taken into account as a dividend for the purposes of the maximum rate under section 1(h)(11) of the Internal Revenue Code.
The fund designates 9% and 1% of the dividends distributed in September and December, respectively during the fiscal year as a section 199A dividend.
The fund will notify shareholders in January 2021 of amounts for use in preparing 2020 income tax returns.
Liquidity Risk Management Program
The Securities and Exchange Commission adopted Rule 22e-4 under the Investment Company Act of 1940 (the Liquidity Rule) to promote effective liquidity risk management throughout the open-end investment company industry, thereby reducing the risk that funds will be unable to meet their redemption obligations and mitigating dilution of the interests of fund shareholders.
The Fund has adopted and implemented a liquidity risk management program pursuant to the Liquidity Rule (the Program) effective December 1, 2018. The Program is reasonably designed to assess and manage the Fund’s liquidity risk and to comply with the requirements of the Liquidity Rule. The Fund’s Board of Trustees (the Board) has designated the Fund’s investment adviser as administrator of the Program. The Fidelity advisers have established a Liquidity Risk Management Committee (the LRM Committee) to manage the Program for each of the Fidelity Funds. The LRM Committee monitors the adequacy and effectiveness of implementation of the Program and on a periodic basis assesses each Fund’s liquidity risk based on a variety of factors including (1) the Fund’s investment strategy, (2) portfolio liquidity and cash flow projections during normal and reasonably foreseeable stressed conditions, (3) shareholder redemptions, (4) borrowings and other funding sources and (5) in the case of exchange-traded funds, certain additional factors including the effect of the Fund’s prices and spreads, market participants, and basket compositions on the overall liquidity of the Fund’s portfolio, as applicable.
In accordance with the Program, each of the Fund’s portfolio investments is classified into one of four liquidity categories described below based on a determination of a reasonable expectation for how long it would take to convert the investment to cash (or sell or dispose of the investment) without significantly changing its market value.
- Highly liquid investments – cash or convertible to cash within three business days or less
- Moderately liquid investments – convertible to cash in three to seven calendar days
- Less liquid investments – can be sold or disposed of, but not settled, within seven calendar days
- Illiquid investments – cannot be sold or disposed of within seven calendar days
Liquidity classification determinations take into account a variety of factors including various market, trading and investment-specific considerations, as well as market depth, and generally utilize analysis from a third-party liquidity metrics service.
The Liquidity Rule places a 15% limit on a fund’s illiquid investments and requires funds that do not primarily hold assets that are highly liquid investments to determine and maintain a minimum percentage of the fund’s net assets to be invested in highly liquid investments (highly liquid investment minimum or HLIM). The Program includes provisions reasonably designed to comply with the 15% limit on illiquid investments and for determining, periodically reviewing and complying with the HLIM requirement as applicable.
At a recent meeting of the Fund’s Board of Trustees, the LRM Committee provided a written report to the Board pertaining to the operation, adequacy, and effectiveness of implementation of the Program for the annual period from December 1, 2018 through November 30, 2019. The report concluded that the Program has been implemented and is operating effectively and is reasonably designed to assess and manage the Fund’s liquidity risk.
Proxy Voting Results
A special meeting of shareholders was held on June 9, 2020. The results of votes taken among shareholders on the proposals before them are reported below. Each vote reported represents one dollar of net asset value held on the record date for the meeting.
PROPOSAL 1
To elect a Board of Trustees.
| | # of
Votes | % of
Votes |
| Dennis J. Dirks |
| Affirmative | 43,167,428,219.785 | 94.885 |
| Withheld | 2,327,070,930.034 | 5.115 |
| TOTAL | 45,494,499,149.820 | 100.000 |
| Donald F. Donahue |
| Affirmative | 43,161,668,935.467 | 94.872 |
| Withheld | 2,333,065,287.611 | 5.128 |
| TOTAL | 45,494,734,223.077 | 100.000 |
| Bettina Doulton |
| Affirmative | 43,304,465,213.969 | 95.186 |
| Withheld | 2,190,010,062.903 | 4.814 |
| TOTAL | 45,494,475,276.872 | 100.000 |
| Vicki L. Fuller |
| Affirmative | 43,380,442,631.493 | 95.353 |
| Withheld | 2,114,180,614.639 | 4.647 |
| TOTAL | 45,494,623,246.132 | 100.000 |
| Patricia L. Kampling |
| Affirmative | 43,128,008,796.761 | 94.798 |
| Withheld | 2,366,685,422.999 | 5.202 |
| TOTAL | 45,494,694,219.760 | 100.000 |
| Alan J. Lacy |
| Affirmative | 42,904,065,046.958 | 94.305 |
| Withheld | 2,590,717,567.229 | 5.695 |
| TOTAL | 45,494,782,614.187 | 100.000 |
| Ned C. Lautenbach |
| Affirmative | 42,802,778,827.017 | 94.083 |
| Withheld | 2,692,003,787.170 | 5.917 |
| TOTAL | 45,494,782,614.187 | 100.000 |
| Robert A. Lawrence |
| Affirmative | 42,971,258,294.203 | 94.453 |
| Withheld | 2,523,524,319.984 | 5.547 |
| TOTAL | 45,494,782,614.187 | 100.000 |
| Joseph Mauriello |
| Affirmative | 42,874,562,778.490 | 94.241 |
| Withheld | 2,620,171,874.731 | 5.759 |
| TOTAL | 45,494,734,653.220 | 100.000 |
| Cornelia M. Small |
| Affirmative | 43,029,040,988.063 | 94.580 |
| Withheld | 2,465,741,626.124 | 5.420 |
| TOTAL | 45,494,782,614.187 | 100.000 |
| Garnett A. Smith |
| Affirmative | 42,892,814,945.159 | 94.281 |
| Withheld | 2,601,967,669.028 | 5.719 |
| TOTAL | 45,494,782,614.187 | 100.000 |
| David M. Thomas |
| Affirmative | 42,936,080,036.111 | 94.376 |
| Withheld | 2,558,702,578.076 | 5.624 |
| TOTAL | 45,494,782,614.187 | 100.000 |
| Susan Tomasky |
| Affirmative | 43,147,934,105.796 | 94.842 |
| Withheld | 2,346,571,066.028 | 5.158 |
| TOTAL | 45,494,782,614.187 | 100.000 |
| Michael E. Wiley |
| Affirmative | 42,885,333,102.972 | 94.264 |
| Withheld | 2,609,449,511.215 | 5.736 |
| TOTAL | 45,494,782,614.187 | 100.000 |
PROPOSAL 2
To convert a fundamental investment policy to a non-fundamental investment policy.
| | # of
Votes | % of
Votes |
| Affirmative | 171,419,806.701 | 75.422 |
| Against | 29,378,812.043 | 12.926 |
| Abstain | 21,172,301.355 | 9.315 |
| Broker Non-Vote | 5,309,691.470 | 2.336 |
| TOTAL | 227,280,611.569 | 100.000 |
|
| Proposal 1 reflects trust wide proposal and voting results. |
BCV-ANN-0920
1.788861.117
Fidelity® Small Cap Growth Fund
Annual Report
July 31, 2020
Includes Fidelity and Fidelity Advisor share classes
See the inside front cover for important information about access to your fund’s shareholder reports.
Beginning on January 1, 2021, as permitted by regulations adopted by the Securities and Exchange Commission, paper copies of a fund’s shareholder reports will no longer be sent by mail, unless you specifically request paper copies of the reports from the fund or from your financial intermediary, such as a financial advisor, broker-dealer or bank. Instead, the reports will be made available on a website, and you will be notified by mail each time a report is posted and provided with a website link to access the report.
If you already elected to receive shareholder reports electronically, you will not be affected by this change and you need not take any action. You may elect to receive shareholder reports and other communications from a fund electronically, by contacting your financial intermediary. For Fidelity customers, visit Fidelity's web site or call Fidelity using the contact information listed below.
You may elect to receive all future reports in paper free of charge. If you wish to continue receiving paper copies of your shareholder reports, you may contact your financial intermediary or, if you are a Fidelity customer, visit Fidelity’s website, or call Fidelity at the applicable toll-free number listed below. Your election to receive reports in paper will apply to all funds held with the fund complex/your financial intermediary.
| Account Type | Website | Phone Number |
| Brokerage, Mutual Fund, or Annuity Contracts: | fidelity.com/mailpreferences | 1-800-343-3548 |
| Employer Provided Retirement Accounts: | netbenefits.fidelity.com/preferences (choose 'no' under Required Disclosures to continue to print) | 1-800-343-0860 |
| Advisor Sold Accounts Serviced Through Your Financial Intermediary: | Contact Your Financial Intermediary | Your Financial Intermediary's phone number |
| Advisor Sold Accounts Serviced by Fidelity: | institutional.fidelity.com | 1-877-208-0098 |
Contents
To view a fund's proxy voting guidelines and proxy voting record for the 12-month period ended June 30, visit http://www.fidelity.com/proxyvotingresults or visit the Securities and Exchange Commission's (SEC) web site at http://www.sec.gov.
You may also call 1-800-544-8544 if you’re an individual investing directly with Fidelity, call 1-800-835-5092 if you’re a plan sponsor or participant with Fidelity as your recordkeeper or call 1-877-208-0098 on institutional accounts or if you’re an advisor or invest through one to request a free copy of the proxy voting guidelines.
Standard & Poor's, S&P and S&P 500 are registered service marks of The McGraw-Hill Companies, Inc. and have been licensed for use by Fidelity Distributors Corporation.
Other third-party marks appearing herein are the property of their respective owners.
All other marks appearing herein are registered or unregistered trademarks or service marks of FMR LLC or an affiliated company. © 2020 FMR LLC. All rights reserved.
This report and the financial statements contained herein are submitted for the general information of the shareholders of the Fund. This report is not authorized for distribution to prospective investors in the Fund unless preceded or accompanied by an effective prospectus.
A fund files its complete schedule of portfolio holdings with the SEC for the first and third quarters of each fiscal year on Form N-PORT. Forms N-PORT are available on the SEC’s web site at http://www.sec.gov. A fund's Forms N-PORT may be reviewed and copied at the SEC’s Public Reference Room in Washington, DC. Information regarding the operation of the SEC's Public Reference Room may be obtained by calling 1-800-SEC-0330.
For a complete list of a fund's portfolio holdings, view the most recent holdings listing, semiannual report, or annual report on Fidelity's web site at http://www.fidelity.com, http://www.institutional.fidelity.com, or http://www.401k.com, as applicable.
NOT FDIC INSURED •MAY LOSE VALUE •NO BANK GUARANTEE
Neither the Fund nor Fidelity Distributors Corporation is a bank.
Note to Shareholders:
Early in 2020, the outbreak and spread of a new coronavirus emerged as a public health emergency that had a major influence on financial markets, primarily based on its impact on the global economy and the outlook for corporate earnings. The virus causes a respiratory disease known as COVID-19. On March 11, the World Health Organization declared the COVID-19 outbreak a pandemic, citing sustained risk of further global spread.
In the weeks following, as the crisis worsened, we witnessed an escalating human tragedy with wide-scale social and economic consequences from coronavirus-containment measures. The outbreak of COVID-19 prompted a number of measures to limit the spread, including travel and border restrictions, quarantines, and restrictions on large gatherings. In turn, these resulted in lower consumer activity, diminished demand for a wide range of products and services, disruption in manufacturing and supply chains, and – given the wide variability in outcomes regarding the outbreak – significant market uncertainty and volatility. Amid the turmoil, the U.S. government took unprecedented action – in concert with the U.S. Federal Reserve and central banks around the world – to help support consumers, businesses, and the broader economy, and to limit disruption to the financial system.
The situation continues to unfold, and the extent and duration of its impact on financial markets and the economy remain highly uncertain. Extreme events such as the coronavirus crisis are “exogenous shocks” that can have significant adverse effects on mutual funds and their investments. Although multiple asset classes may be affected by market disruption, the duration and impact may not be the same for all types of assets.
Fidelity is committed to helping you stay informed amid news about COVID-19 and during increased market volatility, and we’re taking extra steps to be responsive to customer needs. We encourage you to visit our websites, where we offer ongoing updates, commentary, and analysis on the markets and our funds.
Performance: The Bottom Line
Average annual total return reflects the change in the value of an investment, assuming reinvestment of distributions from dividend income and capital gains (the profits earned upon the sale of securities that have grown in value, if any) and assuming a constant rate of performance each year. The hypothetical investment and the average annual total returns do not reflect the deduction of taxes that a shareholder would pay on fund distributions or the redemption of fund shares. During periods of reimbursement by Fidelity, a fund’s total return will be greater than it would be had the reimbursement not occurred. How a fund did yesterday is no guarantee of how it will do tomorrow.
Average Annual Total Returns
| For the periods ended July 31, 2020 | Past 1 year | Past 5 years | Past 10 years |
| Class A (incl. 5.75% sales charge) | 2.16% | 10.29% | 14.10% |
| Class M (incl. 3.50% sales charge) | 4.35% | 10.52% | 14.07% |
| Class C (incl. contingent deferred sales charge) | 6.62% | 10.75% | 13.91% |
| Fidelity® Small Cap Growth Fund | 8.72% | 11.91% | 15.12% |
| Class I | 8.70% | 11.91% | 15.12% |
| Class Z | 8.87% | 12.02% | 15.17% |
Class C shares' contingent deferred sales charges included in the past one year, past five years and past ten years total return figures are 1%, 0% and 0%, respectively.
The initial offering of Class Z shares took place on February 1, 2017. Returns prior to February 1, 2017, are those of Class I.
$10,000 Over 10 Years
Let's say hypothetically that $10,000 was invested in Fidelity® Small Cap Growth Fund, a class of the fund, on July 31, 2010.
The chart shows how the value of your investment would have changed, and also shows how the Russell 2000® Growth Index performed over the same period.
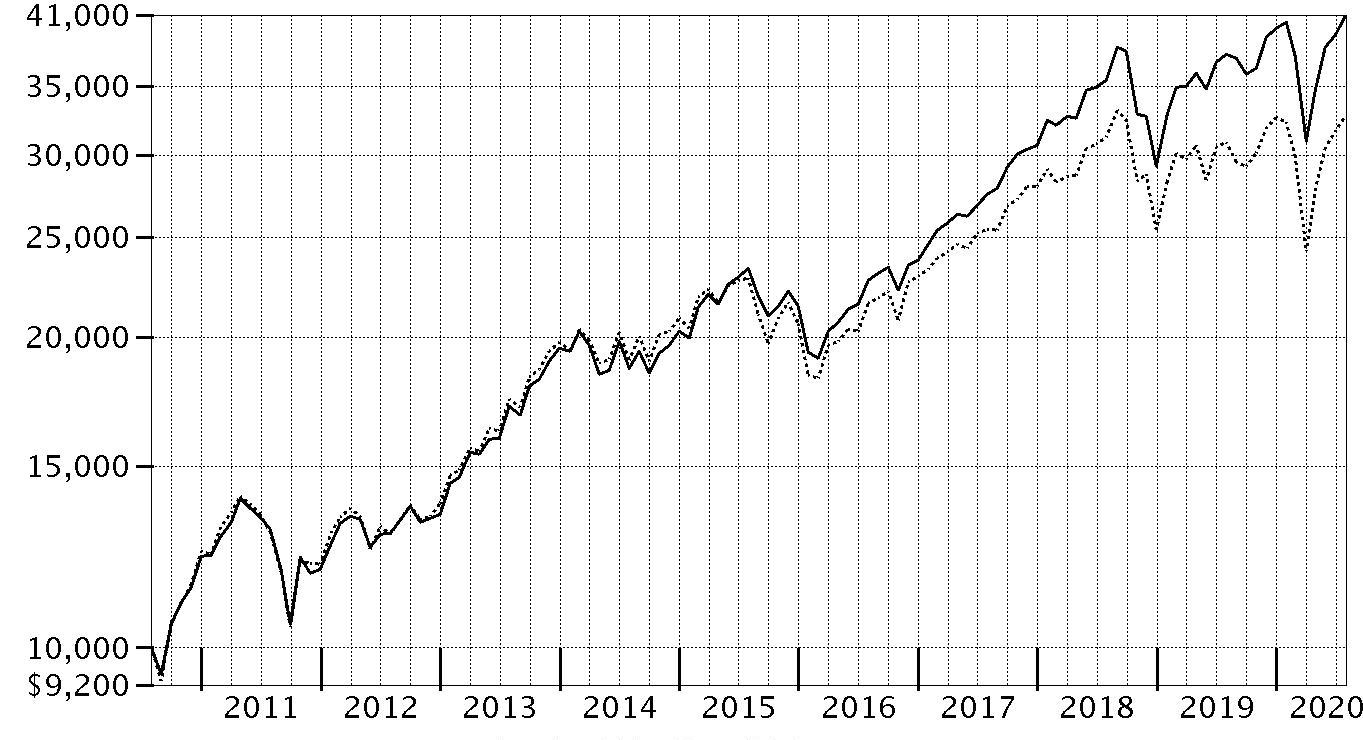
| Period Ending Values |
| $40,882 | Fidelity® Small Cap Growth Fund |
| $32,699 | Russell 2000® Growth Index |
Management's Discussion of Fund Performance
Market Recap: The S&P 500
® index gained 11.96% for the 12 months ending July 31, 2020, in what was a bumpy ride for U.S. equity investors, marked by a steep but brief decline due to the early-2020 outbreak and spread of the coronavirus, followed by a historic rebound. Declared a pandemic on March 11, the COVID-19 crisis and containment efforts caused broad contraction in economic activity, along with extreme uncertainty, volatility and dislocation in financial markets. By mid-March, U.S. stocks entered bear-market territory less than a month after hitting an all-time high and extending the longest-running bull market in American history. Stocks slid in late February, after a surge in COVID-19 cases outside China. The sudden downtrend continued in March (-12%), capping the index’s worst quarter since 2008. A historically rapid and expansive U.S. monetary/fiscal-policy response provided a partial offset to the economic disruption and fueled a sharp uptrend. Aggressive support for financial markets by the U.S. Federal Reserve, plans for reopening the economy and improving infection data boosted stocks in April (+13%) and May (+5%). In June and July, the index gained amid progress on potential treatments and signs of an early recovery in economic activity. For the full 12 months, growth stocks widely topped value, while large-caps handily bested smaller-caps. The information technology sector (+39%) led the way, followed by consumer discretionary (+22%). In contrast, energy (-38%) fell hard along with the price of crude oil.
Comments from Portfolio Manager Patrick Venanzi: For the fiscal year ending July 31, 2020, the fund's share classes gained about 8% to 9% (excluding sales charges, if applicable), outperforming the 6.00% result of the benchmark Russell 2000
® Growth Index. The top contributor to performance versus the benchmark was security selection in the information technology sector, primarily driven by the software & services industry. Strong picks in the communication services sector, especially within the media & entertainment industry, also boosted the fund's relative result, as did choices in health care equipment & services. Looking at individual stocks, an overweight position in Cardlytics (+126%) and a non-benchmark stake in Insulet (+66%) added notable value. Another notable relative contributor was an overweighting in Generac Holdings (+114%). Insulet and Generac were among the largest holdings in the fund. We reduced the fund’s positions in Cardlytics, Insulet and Generac by July 31. Conversely, security selection in consumer discretionary and materials detracted from the fund’s relative result, as did an overweighting in the media & entertainment industry. The fund's biggest individual relative detractor was our lighter-than-benchmark stake in Teladoc Health, which gained roughly 123% for the fund the past 12 months. Also hurting performance was our overweighting in The Children’s Place, which returned about -76%. Neither Teladoc Health nor The Children’s Place were held in the fund at period end. Notable changes in positioning included a lower allocation to the communication services and financials sectors.
The views expressed above reflect those of the portfolio manager(s) only through the end of the period as stated on the cover of this report and do not necessarily represent the views of Fidelity or any other person in the Fidelity organization. Any such views are subject to change at any time based upon market or other conditions and Fidelity disclaims any responsibility to update such views. These views may not be relied on as investment advice and, because investment decisions for a Fidelity fund are based on numerous factors, may not be relied on as an indication of trading intent on behalf of any Fidelity fund.
Investment Summary (Unaudited)
Top Ten Stocks as of July 31, 2020
| | % of fund's net assets |
| Williams-Sonoma, Inc. | 2.0 |
| LHC Group, Inc. | 1.5 |
| Insulet Corp. | 1.4 |
| Five9, Inc. | 1.4 |
| Molina Healthcare, Inc. | 1.2 |
| Kornit Digital Ltd. | 1.2 |
| SiTime Corp. | 1.2 |
| Compass, Inc. Series E | 1.1 |
| Tenable Holdings, Inc. | 1.0 |
| Generac Holdings, Inc. | 1.0 |
| | 13.0 |
Top Five Market Sectors as of July 31, 2020
| | % of fund's net assets |
| Health Care | 31.2 |
| Information Technology | 23.2 |
| Industrials | 15.9 |
| Consumer Discretionary | 13.7 |
| Financials | 4.8 |
Asset Allocation (% of fund's net assets)
| As of July 31, 2020 * |
| | Stocks | 97.9% |
| | Convertible Securities | 1.7% |
| | Short-Term Investments and Net Other Assets (Liabilities) | 0.4% |

* Foreign investments - 12.6%
Schedule of Investments July 31, 2020
Showing Percentage of Net Assets
| Common Stocks - 97.9% | | | |
| | | Shares | Value |
| COMMUNICATION SERVICES - 3.5% | | | |
| Diversified Telecommunication Services - 1.2% | | | |
| Bandwidth, Inc. (a)(b) | | 114,506 | $16,578,179 |
| Cogent Communications Group, Inc. | | 243,351 | 21,928,359 |
| Iridium Communications, Inc. (a) | | 397,377 | 10,884,156 |
| | | | 49,390,694 |
| Entertainment - 1.4% | | | |
| Gaia, Inc. Class A (a) | | 682,435 | 6,264,753 |
| Take-Two Interactive Software, Inc. (a) | | 204,775 | 33,587,196 |
| Zynga, Inc. (a) | | 1,578,861 | 15,520,204 |
| | | | 55,372,153 |
| Interactive Media & Services - 0.2% | | | |
| CarGurus, Inc. Class A (a) | | 219,062 | 6,328,701 |
| Media - 0.7% | | | |
| Cardlytics, Inc. (a) | | 211,286 | 14,033,616 |
| Nexstar Broadcasting Group, Inc. Class A | | 178,453 | 15,641,405 |
| | | | 29,675,021 |
|
| TOTAL COMMUNICATION SERVICES | | | 140,766,569 |
|
| CONSUMER DISCRETIONARY - 13.7% | | | |
| Diversified Consumer Services - 1.2% | | | |
| Arco Platform Ltd. Class A (a) | | 579,766 | 25,248,809 |
| Grand Canyon Education, Inc. (a) | | 126,823 | 11,254,273 |
| Strategic Education, Inc. | | 94,176 | 11,885,953 |
| | | | 48,389,035 |
| Hotels, Restaurants & Leisure - 1.6% | | | |
| Churchill Downs, Inc. | | 92,091 | 12,756,445 |
| Dunkin' Brands Group, Inc. | | 274,600 | 18,873,258 |
| Lindblad Expeditions Holdings (a) | | 570,036 | 4,132,761 |
| Wingstop, Inc. | | 168,305 | 26,297,656 |
| | | | 62,060,120 |
| Household Durables - 3.6% | | | |
| Helen of Troy Ltd. (a) | | 177,675 | 33,447,319 |
| iRobot Corp. (a) | | 49,710 | 3,613,420 |
| LGI Homes, Inc. (a) | | 237,169 | 27,063,355 |
| M/I Homes, Inc. (a) | | 163,691 | 6,814,456 |
| Taylor Morrison Home Corp. (a) | | 1,586,746 | 37,209,194 |
| Whirlpool Corp. | | 214,991 | 35,069,332 |
| | | | 143,217,076 |
| Internet & Direct Marketing Retail - 2.7% | | | |
| 1-800-FLOWERS.com, Inc. Class A (a)(b) | | 1,031,500 | 29,139,875 |
| Farfetch Ltd. Class A (a)(b) | | 880,311 | 22,562,371 |
| Kogan.Com Ltd. | | 562,110 | 6,690,648 |
| Revolve Group, Inc. (a)(b) | | 709,162 | 11,608,982 |
| Stamps.com, Inc. (a) | | 151,466 | 39,423,570 |
| | | | 109,425,446 |
| Leisure Products - 0.4% | | | |
| Vista Outdoor, Inc. (a) | | 807,800 | 13,853,770 |
| Multiline Retail - 0.3% | | | |
| Ollie's Bargain Outlet Holdings, Inc. (a) | | 111,002 | 11,666,310 |
| Specialty Retail - 3.0% | | | |
| Floor & Decor Holdings, Inc. Class A (a) | | 256,118 | 16,878,176 |
| Michaels Companies, Inc. (a)(b) | | 3,018,600 | 21,673,548 |
| Vroom, Inc. | | 73,200 | 4,332,708 |
| Williams-Sonoma, Inc. (b) | | 895,573 | 78,022,319 |
| | | | 120,906,751 |
| Textiles, Apparel & Luxury Goods - 0.9% | | | |
| Crocs, Inc. (a) | | 700,200 | 25,165,188 |
| Deckers Outdoor Corp. (a) | | 60,170 | 12,590,573 |
| | | | 37,755,761 |
|
| TOTAL CONSUMER DISCRETIONARY | | | 547,274,269 |
|
| CONSUMER STAPLES - 4.2% | | | |
| Food & Staples Retailing - 1.8% | | | |
| BJ's Wholesale Club Holdings, Inc. (a) | | 1,022,000 | 40,931,100 |
| Grocery Outlet Holding Corp. (a) | | 383,214 | 16,857,584 |
| Performance Food Group Co. (a) | | 331,977 | 9,301,996 |
| Sprouts Farmers Market LLC (a) | | 211,701 | 5,584,672 |
| | | | 72,675,352 |
| Food Products - 1.7% | | | |
| Freshpet, Inc. (a) | | 172,226 | 16,542,307 |
| Nomad Foods Ltd. (a) | | 800,501 | 18,459,553 |
| Post Holdings, Inc. (a) | | 214,957 | 19,075,284 |
| The Simply Good Foods Co. (a) | | 506,042 | 12,165,250 |
| | | | 66,242,394 |
| Personal Products - 0.7% | | | |
| BellRing Brands, Inc. Class A (a) | | 496,489 | 9,865,236 |
| Herbalife Nutrition Ltd. (a) | | 360,000 | 18,446,400 |
| | | | 28,311,636 |
|
| TOTAL CONSUMER STAPLES | | | 167,229,382 |
|
| FINANCIALS - 4.8% | | | |
| Capital Markets - 1.7% | | | |
| Apollo Global Management LLC Class A | | 95,236 | 4,676,088 |
| Cowen Group, Inc. Class A | | 980,213 | 16,144,108 |
| Lazard Ltd. Class A | | 377,811 | 11,077,419 |
| LPL Financial | | 147,956 | 11,691,483 |
| Morningstar, Inc. | | 132,534 | 22,271,013 |
| | | | 65,860,111 |
| Consumer Finance - 0.4% | | | |
| First Cash Financial Services, Inc. | | 298,026 | 17,178,219 |
| Diversified Financial Services - 0.8% | | | |
| StepStone Group Holdings LLC (c)(d)(e) | | 15,533 | 14,799,842 |
| StepStone Group LP Class A (c)(d)(e) | | 15,533 | 14,799,842 |
| | | | 29,599,684 |
| Insurance - 1.2% | | | |
| BRP Group, Inc. (a) | | 439,000 | 7,660,550 |
| Old Republic International Corp. | | 1,035,526 | 16,640,903 |
| RenaissanceRe Holdings Ltd. | | 137,808 | 24,857,807 |
| | | | 49,159,260 |
| Thrifts & Mortgage Finance - 0.7% | | | |
| Essent Group Ltd. | | 504,927 | 18,091,534 |
| Pennymac Financial Services, Inc. | | 228,302 | 11,017,855 |
| | | | 29,109,389 |
|
| TOTAL FINANCIALS | | | 190,906,663 |
|
| HEALTH CARE - 31.2% | | | |
| Biotechnology - 13.7% | | | |
| Acceleron Pharma, Inc. (a) | | 281,956 | 27,961,577 |
| ADC Therapeutics SA (a) | | 125,014 | 5,813,151 |
| Agios Pharmaceuticals, Inc. (a) | | 142,859 | 6,474,370 |
| ALX Oncology Holdings, Inc. (a) | | 279,400 | 9,136,380 |
| Annexon, Inc. (a)(b) | | 248,800 | 4,535,624 |
| Aprea Therapeutics, Inc. (b) | | 442,771 | 12,145,209 |
| Arena Pharmaceuticals, Inc. (a) | | 262,979 | 16,144,281 |
| Argenx SE ADR (a) | | 149,226 | 34,341,379 |
| Ascendis Pharma A/S sponsored ADR (a) | | 243,002 | 33,439,505 |
| Blueprint Medicines Corp. (a) | | 94,875 | 6,942,953 |
| CareDx, Inc. (a) | | 263,378 | 8,783,656 |
| Castle Biosciences, Inc. | | 247,400 | 9,579,328 |
| Deciphera Pharmaceuticals, Inc. (a) | | 198,816 | 9,219,098 |
| Emergent BioSolutions, Inc. (a) | | 203,502 | 22,637,562 |
| FibroGen, Inc. (a) | | 631,994 | 25,576,797 |
| Forma Therapeutics Holdings, Inc. | | 95,700 | 3,345,672 |
| Fusion Pharmaceuticals, Inc. (a) | | 30,400 | 418,304 |
| G1 Therapeutics, Inc. (a) | | 507,098 | 7,439,128 |
| Global Blood Therapeutics, Inc. (a) | | 379,551 | 25,612,101 |
| Immunomedics, Inc. (a) | | 587,468 | 24,808,774 |
| Insmed, Inc. (a) | | 335,704 | 8,768,588 |
| Invitae Corp. (a)(b) | | 136,200 | 3,977,040 |
| Iovance Biotherapeutics, Inc. (a) | | 424,655 | 12,344,721 |
| Keros Therapeutics, Inc. | | 145,088 | 4,657,325 |
| Kura Oncology, Inc. (a) | | 698,741 | 11,487,302 |
| Mersana Therapeutics, Inc. (a) | | 267,680 | 5,321,478 |
| Mirati Therapeutics, Inc. (a) | | 47,906 | 5,811,477 |
| Momenta Pharmaceuticals, Inc. (a) | | 115,814 | 3,415,355 |
| Morphic Holding, Inc. (a) | | 336,199 | 7,567,839 |
| Myovant Sciences Ltd. (a)(b) | | 1,044,870 | 15,882,024 |
| Natera, Inc. (a) | | 482,088 | 23,149,866 |
| Nkarta, Inc. (a)(b) | | 16,700 | 430,025 |
| ORIC Pharmaceuticals, Inc. (a) | | 27,358 | 549,075 |
| Passage Bio, Inc. | | 417,071 | 6,522,990 |
| Poseida Therapeutics, Inc. (a) | | 17,500 | 227,150 |
| Protagonist Therapeutics, Inc. (a) | | 53,742 | 845,362 |
| PTC Therapeutics, Inc. (a) | | 91,700 | 4,248,461 |
| Relay Therapeutics, Inc. (a)(b) | | 266,737 | 9,458,494 |
| Repare Therapeutics, Inc. | | 446,700 | 10,658,262 |
| Repligen Corp. (a) | | 134,038 | 20,227,675 |
| Revolution Medicines, Inc. | | 435,641 | 10,507,661 |
| Revolution Medicines, Inc. | | 394,470 | 9,038,886 |
| Sarepta Therapeutics, Inc. (a) | | 134,045 | 20,578,588 |
| TG Therapeutics, Inc. (a)(b) | | 1,067,560 | 20,902,825 |
| Turning Point Therapeutics, Inc. (a) | | 367,973 | 21,795,041 |
| Viela Bio, Inc. | | 381,321 | 13,960,162 |
| Zymeworks, Inc. (a) | | 42,679 | 1,302,990 |
| | | | 547,991,511 |
| Health Care Equipment & Supplies - 6.7% | | | |
| Cerus Corp. (a) | | 339,702 | 2,422,075 |
| CryoPort, Inc. (a)(b) | | 322,112 | 10,674,792 |
| Haemonetics Corp. (a) | | 132,815 | 11,642,563 |
| Insulet Corp. (a) | | 283,584 | 57,669,642 |
| Integer Holdings Corp. (a) | | 376,415 | 24,756,815 |
| iRhythm Technologies, Inc. (a) | | 159,970 | 19,913,066 |
| Masimo Corp. (a) | | 122,930 | 27,059,352 |
| Nevro Corp. (a) | | 209,230 | 27,819,221 |
| OrthoPediatrics Corp. (a)(b) | | 192,800 | 8,134,232 |
| Quidel Corp. (a) | | 69,048 | 19,503,989 |
| Tandem Diabetes Care, Inc. (a) | | 346,803 | 36,227,041 |
| TransMedics Group, Inc. (a)(b) | | 717,906 | 12,965,382 |
| ViewRay, Inc. (a)(b) | | 2,866,999 | 7,941,587 |
| | | | 266,729,757 |
| Health Care Providers & Services - 4.4% | | | |
| 1Life Healthcare, Inc. (a)(b) | | 608,458 | 18,016,441 |
| Chemed Corp. | | 38,600 | 18,998,534 |
| Guardant Health, Inc. (a) | | 67,151 | 5,719,922 |
| LHC Group, Inc. (a) | | 308,942 | 60,277,674 |
| Molina Healthcare, Inc. (a) | | 259,246 | 47,882,736 |
| Progyny, Inc. (a) | | 891,069 | 23,724,712 |
| | | | 174,620,019 |
| Health Care Technology - 2.9% | | | |
| Health Catalyst, Inc. (b) | | 432,908 | 15,108,489 |
| HMS Holdings Corp. (a) | | 736,078 | 23,922,535 |
| Inovalon Holdings, Inc. Class A (a) | | 1,031,517 | 24,271,595 |
| Inspire Medical Systems, Inc. (a) | | 294,180 | 29,229,725 |
| Phreesia, Inc. | | 406,056 | 12,206,043 |
| Schrodinger, Inc. (b) | | 180,762 | 13,083,554 |
| | | | 117,821,941 |
| Life Sciences Tools & Services - 2.2% | | | |
| 10X Genomics, Inc. (a) | | 188,406 | 18,533,498 |
| Berkeley Lights, Inc. (a) | | 18,640 | 1,117,841 |
| Bruker Corp. | | 338,652 | 15,110,652 |
| Charles River Laboratories International, Inc. (a) | | 12,005 | 2,388,875 |
| Nanostring Technologies, Inc. (a) | | 588,347 | 21,245,210 |
| Syneos Health, Inc. (a) | | 457,071 | 28,516,660 |
| | | | 86,912,736 |
| Pharmaceuticals - 1.3% | | | |
| Allovir, Inc. (a) | | 52,200 | 1,299,780 |
| Arvinas Holding Co. LLC (a) | | 358,671 | 11,298,137 |
| Axsome Therapeutics, Inc. (a) | | 174,600 | 12,454,218 |
| IMARA, Inc. | | 151,514 | 3,059,068 |
| Kala Pharmaceuticals, Inc. (a)(b) | | 1,107,452 | 9,690,205 |
| MyoKardia, Inc. (a) | | 58,019 | 5,229,252 |
| SCYNEXIS, Inc. warrants 6/21/21 (a) | | 168,750 | 17 |
| Theravance Biopharma, Inc. (a) | | 422,648 | 8,207,824 |
| | | | 51,238,501 |
|
| TOTAL HEALTH CARE | | | 1,245,314,465 |
|
| INDUSTRIALS - 15.6% | | | |
| Aerospace & Defense - 1.8% | | | |
| Axon Enterprise, Inc. (a) | | 488,150 | 40,579,910 |
| BWX Technologies, Inc. | | 568,584 | 30,999,200 |
| | | | 71,579,110 |
| Air Freight & Logistics - 0.3% | | | |
| Air Transport Services Group, Inc. (a) | | 529,900 | 12,913,663 |
| Building Products - 1.9% | | | |
| Fortune Brands Home & Security, Inc. | | 388,782 | 29,741,823 |
| The AZEK Co., Inc. | | 765,700 | 26,416,650 |
| Trex Co., Inc. (a) | | 146,278 | 20,380,914 |
| | | | 76,539,387 |
| Commercial Services & Supplies - 0.6% | | | |
| Montrose Environmental Group, Inc. (a) | | 695,000 | 15,116,250 |
| Tetra Tech, Inc. | | 122,000 | 10,815,300 |
| | | | 25,931,550 |
| Construction & Engineering - 0.8% | | | |
| AECOM (a) | | 327,681 | 11,858,775 |
| Dycom Industries, Inc. (a)(b) | | 514,199 | 22,023,143 |
| | | | 33,881,918 |
| Electrical Equipment - 1.6% | | | |
| Atkore International Group, Inc. (a) | | 511,499 | 13,641,678 |
| Generac Holdings, Inc. (a) | | 260,207 | 41,003,419 |
| Sensata Technologies, Inc. PLC (a) | | 218,568 | 8,301,213 |
| | | | 62,946,310 |
| Machinery - 4.0% | | | |
| Allison Transmission Holdings, Inc. | | 304,934 | 11,392,334 |
| ESCO Technologies, Inc. | | 228,514 | 19,638,493 |
| IDEX Corp. | | 125,006 | 20,603,489 |
| ITT, Inc. | | 375,164 | 21,658,218 |
| Kornit Digital Ltd. (a) | | 889,904 | 47,689,955 |
| Nordson Corp. | | 101,678 | 19,687,911 |
| Shenzhen Inovance Technology Co. Ltd. (A Shares) | | 2,683,500 | 19,336,173 |
| | | | 160,006,573 |
| Marine - 0.3% | | | |
| SITC International Holdings Co. Ltd. | | 12,041,000 | 12,071,606 |
| Professional Services - 3.6% | | | |
| ASGN, Inc. (a) | | 324,902 | 22,242,791 |
| Clarivate Analytics PLC (a) | | 980,348 | 27,106,622 |
| Exponent, Inc. | | 128,021 | 10,761,445 |
| FTI Consulting, Inc. (a) | | 121,798 | 14,547,553 |
| Insperity, Inc. | | 483,932 | 32,355,694 |
| TriNet Group, Inc. (a) | | 531,670 | 35,090,220 |
| | | | 142,104,325 |
| Road & Rail - 0.7% | | | |
| Knight-Swift Transportation Holdings, Inc. Class A | | 607,548 | 26,422,263 |
|
| TOTAL INDUSTRIALS | | | 624,396,705 |
|
| INFORMATION TECHNOLOGY - 21.8% | | | |
| Communications Equipment - 0.4% | | | |
| Ciena Corp. (a) | | 287,662 | 17,118,766 |
| Electronic Equipment & Components - 1.9% | | | |
| Fabrinet (a) | | 403,461 | 29,303,372 |
| II-VI, Inc. (a)(b) | | 414,623 | 21,029,679 |
| SYNNEX Corp. | | 176,935 | 22,070,872 |
| Wrap Technologies, Inc. (a)(b) | | 356,900 | 3,497,620 |
| | | | 75,901,543 |
| IT Services - 4.8% | | | |
| Black Knight, Inc. (a) | | 202,761 | 15,190,854 |
| Booz Allen Hamilton Holding Corp. Class A | | 247,324 | 20,221,210 |
| CACI International, Inc. Class A (a) | | 119,822 | 24,901,408 |
| Fastly, Inc. Class A (a)(b) | | 284,711 | 27,471,764 |
| Genpact Ltd. | | 541,195 | 21,550,385 |
| KBR, Inc. | | 1,618,290 | 35,990,770 |
| Maximus, Inc. | | 134,966 | 10,015,827 |
| Repay Holdings Corp. (a) | | 344,015 | 7,613,052 |
| Science Applications International Corp. | | 176,700 | 14,132,466 |
| WNS Holdings Ltd. sponsored ADR (a) | | 190,720 | 12,198,451 |
| | | | 189,286,187 |
| Semiconductors & Semiconductor Equipment - 4.0% | | | |
| Advanced Energy Industries, Inc. (a) | | 226,393 | 16,655,733 |
| Cabot Microelectronics Corp. | | 159,789 | 24,083,398 |
| Cirrus Logic, Inc. (a) | | 328,828 | 22,534,583 |
| Enphase Energy, Inc. (a) | | 298,605 | 18,023,798 |
| Inphi Corp. (a) | | 229,137 | 29,939,040 |
| PDF Solutions, Inc. (a) | | 118,671 | 2,916,933 |
| SiTime Corp. (f) | | 876,400 | 46,580,660 |
| | | | 160,734,145 |
| Software - 10.7% | | | |
| 2U, Inc. (a)(b) | | 360,761 | 16,990,039 |
| Agora, Inc. ADR (a)(b) | | 114,345 | 4,978,581 |
| Anaplan, Inc. (a) | | 174,203 | 7,910,558 |
| Avalara, Inc. (a) | | 132,431 | 17,805,348 |
| BlackLine, Inc. (a) | | 89,137 | 7,925,171 |
| Ceridian HCM Holding, Inc. (a) | | 214,491 | 16,792,500 |
| Cloudera, Inc. (a)(b) | | 1,542,800 | 17,387,356 |
| Digital Turbine, Inc. (a) | | 125,082 | 1,736,138 |
| Dynatrace, Inc. | | 706,027 | 29,533,109 |
| Elastic NV (a) | | 307,824 | 29,609,591 |
| Everbridge, Inc. (a)(b) | | 198,973 | 28,413,344 |
| Five9, Inc. (a) | | 456,782 | 55,188,401 |
| Globant SA (a) | | 119,640 | 20,690,542 |
| Jamf Holding Corp. (a) | | 5,000 | 203,000 |
| Lightspeed POS, Inc. (a) | | 567,750 | 16,039,165 |
| LivePerson, Inc. (a)(b) | | 579,446 | 24,904,589 |
| Manhattan Associates, Inc. (a) | | 168,603 | 16,150,481 |
| Nuance Communications, Inc. (a) | | 432,247 | 11,821,955 |
| Onespan, Inc. (a) | | 194,213 | 6,047,793 |
| Ping Identity Holding Corp. (a) | | 392,300 | 13,479,428 |
| Qualys, Inc. (a) | | 98,413 | 12,152,037 |
| Rapid7, Inc. (a) | | 193,600 | 11,532,752 |
| Tenable Holdings, Inc. (a) | | 1,212,708 | 41,147,182 |
| Varonis Systems, Inc. (a) | | 188,800 | 20,456,480 |
| | | | 428,895,540 |
|
| TOTAL INFORMATION TECHNOLOGY | | | 871,936,181 |
|
| MATERIALS - 1.7% | | | |
| Chemicals - 0.6% | | | |
| Axalta Coating Systems Ltd. (a) | | 523,782 | 11,627,960 |
| Valvoline, Inc. | | 535,521 | 10,988,891 |
| | | | 22,616,851 |
| Construction Materials - 0.3% | | | |
| Summit Materials, Inc. (a) | | 871,735 | 12,831,939 |
| Containers & Packaging - 0.5% | | | |
| Avery Dennison Corp. | | 170,692 | 19,346,231 |
| Metals & Mining - 0.3% | | | |
| Yamana Gold, Inc. | | 2,049,200 | 13,309,971 |
|
| TOTAL MATERIALS | | | 68,104,992 |
|
| REAL ESTATE - 1.4% | | | |
| Equity Real Estate Investment Trusts (REITs) - 0.9% | | | |
| Americold Realty Trust | | 336,456 | 13,576,000 |
| Terreno Realty Corp. | | 320,742 | 19,488,284 |
| | | | 33,064,284 |
| Real Estate Management & Development - 0.5% | | | |
| Jones Lang LaSalle, Inc. | | 126,888 | 12,550,492 |
| Redfin Corp. (a) | | 187,000 | 7,775,460 |
| | | | 20,325,952 |
|
| TOTAL REAL ESTATE | | | 53,390,236 |
|
| TOTAL COMMON STOCKS | | | |
| (Cost $3,050,138,655) | | | 3,909,319,462 |
|
| Convertible Preferred Stocks - 1.7% | | | |
| INDUSTRIALS - 0.3% | | | |
| Road & Rail - 0.3% | | | |
| Convoy, Inc. Series D (d)(e) | | 913,444 | 12,304,091 |
| INFORMATION TECHNOLOGY - 1.4% | | | |
| IT Services - 0.3% | | | |
| Yanka Industries, Inc. Series E (d)(e) | | 869,641 | 10,504,568 |
| Software - 1.1% | | | |
| Compass, Inc. Series E (a)(d)(e) | | 353,803 | 44,710,085 |
|
| TOTAL INFORMATION TECHNOLOGY | | | 55,214,653 |
|
| TOTAL CONVERTIBLE PREFERRED STOCKS | | | |
| (Cost $46,746,590) | | | 67,518,744 |
|
| Money Market Funds - 5.8% | | | |
| Fidelity Cash Central Fund 0.14% (g) | | 8,482,764 | 8,485,309 |
| Fidelity Securities Lending Cash Central Fund 0.13% (g)(h) | | 223,605,778 | 223,628,139 |
| TOTAL MONEY MARKET FUNDS | | | |
| (Cost $232,112,599) | | | 232,113,448 |
| TOTAL INVESTMENT IN SECURITIES - 105.4% | | | |
| (Cost $3,328,997,844) | | | 4,208,951,654 |
| NET OTHER ASSETS (LIABILITIES) - (5.4)% | | | (214,225,712) |
| NET ASSETS - 100% | | | $3,994,725,942 |
Legend
(a) Non-income producing
(b) Security or a portion of the security is on loan at period end.
(c) Investment is owned by a wholly-owned subsidiary (Subsidiary) that is treated as a corporation for U.S. tax purposes.
(d) Restricted securities (including private placements) - Investment in securities not registered under the Securities Act of 1933 (excluding 144A issues). At the end of the period, the value of restricted securities (excluding 144A issues) amounted to $97,118,428 or 2.4% of net assets.
(e) Level 3 security
(f) Affiliated company
(g) Affiliated fund that is generally available only to investment companies and other accounts managed by Fidelity Investments. The rate quoted is the annualized seven-day yield of the fund at period end. A complete unaudited listing of the fund's holdings as of its most recent quarter end is available upon request. In addition, each Fidelity Central Fund's financial statements, which are not covered by the Fund's Report of Independent Registered Public Accounting Firm, are available on the SEC's website or upon request.
(h) Investment made with cash collateral received from securities on loan.
Additional information on each restricted holding is as follows:
| Security | Acquisition Date | Acquisition Cost |
| Compass, Inc. Series E | 11/3/17 | $23,873,990 |
| Convoy, Inc. Series D | 10/30/19 | $12,368,032 |
| StepStone Group Holdings LLC | 8/19/19 | $12,426,400 |
| StepStone Group LP Class A | 8/19/19 | $12,426,400 |
| Yanka Industries, Inc. Series E | 5/15/20 | $10,504,568 |
Affiliated Central Funds
Information regarding fiscal year to date income earned by the Fund from investments in Fidelity Central Funds is as follows:
| Fund | Income earned |
| Fidelity Cash Central Fund | $434,697 |
| Fidelity Securities Lending Cash Central Fund | 2,774,004 |
| Total | $3,208,701 |
Amounts in the income column in the above table include any capital gain distributions from underlying funds, which are presented in the corresponding line-item in the Statement of Operations, if applicable. Amount for Fidelity Securities Lending Cash Central Fund represents the income earned on investing cash collateral, less rebates paid to borrowers and any lending agent fees associated with the loan, plus any premium payments received for lending certain types of securities.
Other Affiliated Issuers
An affiliated company is a company in which the Fund has ownership of at least 5% of the voting securities. Fiscal year to date transactions with companies which are or were affiliates are as follows:
| Affiliate | Value, beginning of period | Purchases | Sales Proceeds(a) | Dividend Income | Realized Gain (loss) | Change in Unrealized appreciation (depreciation) | Value, end of period |
| Cardlytics, Inc. | $50,647,708 | $22,022,726 | $117,860,666 | $-- | $71,737,769 | $(12,513,921) | $-- |
| SiTime Corp. | -- | 30,058,396 | -- | -- | -- | 16,522,264 | 46,580,660 |
| Total | $50,647,708 | $52,081,122 | $117,860,666 | $-- | $71,737,769 | $4,008,343 | $46,580,660 |
(a) Includes the value of securities delivered through in-kind transactions, if applicable.
Investment Valuation
The following is a summary of the inputs used, as of July 31, 2020, involving the Fund's assets and liabilities carried at fair value. The inputs or methodology used for valuing securities may not be an indication of the risk associated with investing in those securities. For more information on valuation inputs, and their aggregation into the levels used below, please refer to the Investment Valuation section in the accompanying Notes to Financial Statements.
| | Valuation Inputs at Reporting Date: |
| Description | Total | Level 1 | Level 2 | Level 3 |
| Investments in Securities: | | | | |
| Equities: | | | | |
| Communication Services | $140,766,569 | $140,766,569 | $-- | $-- |
| Consumer Discretionary | 547,274,269 | 547,274,269 | -- | -- |
| Consumer Staples | 167,229,382 | 167,229,382 | -- | -- |
| Financials | 190,906,663 | 161,306,979 | -- | 29,599,684 |
| Health Care | 1,245,314,465 | 1,236,275,562 | 9,038,903 | -- |
| Industrials | 636,700,796 | 624,396,705 | -- | 12,304,091 |
| Information Technology | 927,150,834 | 871,936,181 | -- | 55,214,653 |
| Materials | 68,104,992 | 68,104,992 | -- | -- |
| Real Estate | 53,390,236 | 53,390,236 | -- | -- |
| Money Market Funds | 232,113,448 | 232,113,448 | -- | -- |
| Total Investments in Securities: | $4,208,951,654 | $4,102,794,323 | $9,038,903 | $97,118,428 |
The following is a reconciliation of Investments in Securities for which Level 3 inputs were used in determining value:
| Investments in Securities: | |
| Equities - Information Technology | |
| Beginning Balance | $55,905,792 |
| Net Realized Gain (Loss) on Investment Securities | -- |
| Net Unrealized Gain (Loss) on Investment Securities | (11,195,707) |
| Cost of Purchases | 10,504,568 |
| Proceeds of Sales | -- |
| Amortization/Accretion | -- |
| Transfers into Level 3 | -- |
| Transfers out of Level 3 | -- |
| Ending Balance | $55,214,653 |
| The change in unrealized gain (loss) for the period attributable to Level 3 securities held at July 31, 2020 | $(11,195,707) |
| Equities - Other Investments in Securities | |
| Beginning Balance | $3,954,314 |
| Net Realized Gain (Loss) on Investment Securities | (12,485,784) |
| Net Unrealized Gain (Loss) on Investment Securities | 17,162,933 |
| Cost of Purchases | 37,226,552 |
| Proceeds of Sales | -- |
| Amortization/Accretion | -- |
| Transfers into Level 3 | -- |
| Transfers out of Level 3 | (3,954,240) |
| Ending Balance | $41,903,775 |
| The change in unrealized gain (loss) for the period attributable to Level 3 securities held at July 31, 2020 | $4,677,223 |
| | |
The information used in the above reconciliations represents fiscal year to date activity for any Investments in Securities identified as using Level 3 inputs at either the beginning or the end of the current fiscal period. Cost of purchases and proceeds of sales may include securities received and/or delivered through in-kind transactions. Transfers in or out of Level 3 represent the beginning value of any Security or Instrument where a change in the pricing level occurred from the beginning to the end of the period. The cost of purchases and the proceeds of sales may include securities received or delivered through corporate actions or exchanges. Realized and unrealized gains (losses) disclosed in the reconciliation are included in Net Gain (Loss) on the Fund's Statement of Operations.
Other Information
Distribution of investments by country or territory of incorporation, as a percentage of Total Net Assets, is as follows (Unaudited):
| United States of America | 87.4% |
| Bermuda | 3.3% |
| Cayman Islands | 1.8% |
| Netherlands | 1.7% |
| Israel | 1.2% |
| Bailiwick of Jersey | 1.0% |
| Others (Individually Less Than 1%) | 3.6% |
| | 100.0% |
See accompanying notes which are an integral part of the financial statements.
Financial Statements
Statement of Assets and Liabilities
| | | July 31, 2020 |
| Assets | | |
Investment in securities, at value (including securities loaned of $217,857,060) — See accompanying schedule:
Unaffiliated issuers (cost $3,066,826,849) | $3,930,257,546 | |
| Fidelity Central Funds (cost $232,112,599) | 232,113,448 | |
| Other affiliated issuers (cost $30,058,396) | 46,580,660 | |
| Total Investment in Securities (cost $3,328,997,844) | | $4,208,951,654 |
| Restricted cash | | 1,230,182 |
| Receivable for investments sold | | 52,947,061 |
| Receivable for fund shares sold | | 2,538,993 |
| Dividends receivable | | 443,981 |
| Distributions receivable from Fidelity Central Funds | | 396,255 |
| Prepaid expenses | | 899 |
| Other receivables | | 163,069 |
| Total assets | | 4,266,672,094 |
| Liabilities | | |
| Payable for investments purchased | $32,600,202 | |
| Payable for fund shares redeemed | 11,999,825 | |
| Accrued management fee | 2,900,449 | |
| Distribution and service plan fees payable | 147,738 | |
| Other affiliated payables | 599,744 | |
| Other payables and accrued expenses | 81,004 | |
| Collateral on securities loaned | 223,617,190 | |
| Total liabilities | | 271,946,152 |
| Net Assets | | $3,994,725,942 |
| Net Assets consist of: | | |
| Paid in capital | | $2,921,812,885 |
| Total accumulated earnings (loss) | | 1,072,913,057 |
| Net Assets | | $3,994,725,942 |
| Net Asset Value and Maximum Offering Price | | |
| Class A: | | |
| Net Asset Value and redemption price per share ($268,448,455 ÷ 10,075,326 shares)(a) | | $26.64 |
| Maximum offering price per share (100/94.25 of $26.64) | | $28.27 |
| Class M: | | |
| Net Asset Value and redemption price per share ($70,604,790 ÷ 2,762,639 shares)(a) | | $25.56 |
| Maximum offering price per share (100/96.50 of $25.56) | | $26.49 |
| Class C: | | |
| Net Asset Value and offering price per share ($77,849,786 ÷ 3,374,690 shares)(a) | | $23.07 |
| Small Cap Growth: | | |
| Net Asset Value, offering price and redemption price per share ($2,839,506,118 ÷ 101,148,358 shares) | | $28.07 |
| Class I: | | |
| Net Asset Value, offering price and redemption price per share ($540,553,118 ÷ 19,202,588 shares) | | $28.15 |
| Class Z: | | |
| Net Asset Value, offering price and redemption price per share ($197,763,675 ÷ 6,997,556 shares) | | $28.26 |
(a) Redemption price per share is equal to net asset value less any applicable contingent deferred sales charge.
See accompanying notes which are an integral part of the financial statements.
Statement of Operations
| | | Year ended July 31, 2020 |
| Investment Income | | |
| Dividends | | $18,029,164 |
| Income from Fidelity Central Funds (including $2,774,004 from security lending) | | 3,208,701 |
| Total income | | 21,237,865 |
| Expenses | | |
| Management fee | | |
| Basic fee | $26,104,287 | |
| Performance adjustment | 7,656,293 | |
| Transfer agent fees | 6,258,926 | |
| Distribution and service plan fees | 1,823,879 | |
| Accounting fees | 1,018,526 | |
| Custodian fees and expenses | 52,981 | |
| Independent trustees' fees and expenses | 24,188 | |
| Registration fees | 142,040 | |
| Audit | 80,467 | |
| Legal | 12,879 | |
| Interest | 6,436 | |
| Miscellaneous | 86,084 | |
| Total expenses before reductions | 43,266,986 | |
| Expense reductions | (425,795) | |
| Total expenses after reductions | | 42,841,191 |
| Net investment income (loss) | | (21,603,326) |
| Realized and Unrealized Gain (Loss) | | |
| Net realized gain (loss) on: | | |
| Investment securities: | | |
| Unaffiliated issuers | 218,094,507 | |
| Fidelity Central Funds | 11,632 | |
| Other affiliated issuers | 71,967,677 | |
| Foreign currency transactions | 68,701 | |
| Total net realized gain (loss) | | 290,142,517 |
| Change in net unrealized appreciation (depreciation) on: | | |
| Investment securities: | | |
| Unaffiliated issuers | 32,263,359 | |
| Fidelity Central Funds | 849 | |
| Other affiliated issuers | 4,008,343 | |
| Assets and liabilities in foreign currencies | 2,114 | |
| Total change in net unrealized appreciation (depreciation) | | 36,274,665 |
| Net gain (loss) | | 326,417,182 |
| Net increase (decrease) in net assets resulting from operations | | $304,813,856 |
See accompanying notes which are an integral part of the financial statements.
Statement of Changes in Net Assets
| | Year ended July 31, 2020 | Year ended July 31, 2019 |
| Increase (Decrease) in Net Assets | | |
| Operations | | |
| Net investment income (loss) | $(21,603,326) | $(25,723,754) |
| Net realized gain (loss) | 290,142,517 | 318,467,319 |
| Change in net unrealized appreciation (depreciation) | 36,274,665 | (84,135,999) |
| Net increase (decrease) in net assets resulting from operations | 304,813,856 | 208,607,566 |
| Distributions to shareholders | (217,764,832) | (497,059,513) |
| Share transactions - net increase (decrease) | (211,257,791) | (211,501,516) |
| Total increase (decrease) in net assets | (124,208,767) | (499,953,463) |
| Net Assets | | |
| Beginning of period | 4,118,934,709 | 4,618,888,172 |
| End of period | $3,994,725,942 | $4,118,934,709 |
See accompanying notes which are an integral part of the financial statements.
Financial Highlights
Fidelity Small Cap Growth Fund Class A
| Years ended July 31, | 2020 | 2019 | 2018 | 2017 | 2016 |
| Selected Per–Share Data | | | | | |
| Net asset value, beginning of period | $26.03 | $27.45 | $22.99 | $19.17 | $20.55 |
| Income from Investment Operations | | | | | |
| Net investment income (loss)A | (.20) | (.21) | (.18) | (.14) | (.10) |
| Net realized and unrealized gain (loss) | 2.26 | 1.79 | 6.32 | 4.12 | (.51) |
| Total from investment operations | 2.06 | 1.58 | 6.14 | 3.98 | (.61) |
| Distributions from net realized gain | (1.45) | (3.00) | (1.68) | (.16) | (.78) |
| Total distributions | (1.45) | (3.00) | (1.68) | (.16) | (.78) |
| Redemption fees added to paid in capital | – | – | –A,B | –A,B | .01A |
| Net asset value, end of period | $26.64 | $26.03 | $27.45 | $22.99 | $19.17 |
| Total ReturnC,D | 8.39% | 5.88% | 28.47% | 20.90% | (2.85)% |
| Ratios to Average Net AssetsE,F | | | | | |
| Expenses before reductions | 1.37% | 1.33% | 1.31% | 1.35% | 1.37% |
| Expenses net of fee waivers, if any | 1.37% | 1.33% | 1.31% | 1.35% | 1.37% |
| Expenses net of all reductions | 1.36% | 1.32% | 1.30% | 1.34% | 1.36% |
| Net investment income (loss) | (.80)% | (.85)% | (.74)% | (.66)% | (.58)% |
| Supplemental Data | | | | | |
| Net assets, end of period (000 omitted) | $268,448 | $285,554 | $315,894 | $218,905 | $176,988 |
| Portfolio turnover rateG | 126%H | 91%H | 106%H | 140%H | 143% |
A Calculated based on average shares outstanding during the period.
B Amount represents less than $.005 per share.
C Total returns would have been lower if certain expenses had not been reduced during the applicable periods shown.
D Total returns do not include the effect of the sales charges.
E Fees and expenses of any underlying mutual funds or exchange-traded funds (ETFs) are not included in the Fund's expense ratio. The Fund indirectly bears its proportionate share of these expenses. For additional expense information related to investments in Fidelity Central Funds, please refer to the "Investments in Fidelity Central Funds" note found in the Notes to Financial Statements section of the most recent Annual or Semi-Annual report.
F Expense ratios reflect operating expenses of the class. Expenses before reductions do not reflect amounts reimbursed by the investment adviser or reductions from brokerage service arrangements or reductions from other expense offset arrangements and do not represent the amount paid by the class during periods when reimbursements or reductions occur. Expenses net of fee waivers reflect expenses after reimbursement by the investment adviser but prior to reductions from brokerage service arrangements or other expense offset arrangements. Expenses net of all reductions represent the net expenses paid by the class.
G Amount does not include the portfolio activity of any underlying Fidelity Central Funds.
H Portfolio turnover rate excludes securities received or delivered in-kind.
See accompanying notes which are an integral part of the financial statements.
Fidelity Small Cap Growth Fund Class M
| Years ended July 31, | 2020 | 2019 | 2018 | 2017 | 2016 |
| Selected Per–Share Data | | | | | |
| Net asset value, beginning of period | $25.09 | $26.59 | $22.35 | $18.69 | $20.08 |
| Income from Investment Operations | | | | | |
| Net investment income (loss)A | (.25) | (.26) | (.24) | (.19) | (.15) |
| Net realized and unrealized gain (loss) | 2.17 | 1.72 | 6.13 | 4.01 | (.50) |
| Total from investment operations | 1.92 | 1.46 | 5.89 | 3.82 | (.65) |
| Distributions from net realized gain | (1.45) | (2.96) | (1.65) | (.16) | (.75) |
| Total distributions | (1.45) | (2.96) | (1.65) | (.16) | (.75) |
| Redemption fees added to paid in capital | – | – | –A,B | –A,B | .01A |
| Net asset value, end of period | $25.56 | $25.09 | $26.59 | $22.35 | $18.69 |
| Total ReturnC,D | 8.14% | 5.60% | 28.15% | 20.57% | (3.14)% |
| Ratios to Average Net AssetsE,F | | | | | |
| Expenses before reductions | 1.63% | 1.60% | 1.58% | 1.62% | 1.66% |
| Expenses net of fee waivers, if any | 1.63% | 1.60% | 1.58% | 1.62% | 1.66% |
| Expenses net of all reductions | 1.62% | 1.59% | 1.57% | 1.61% | 1.64% |
| Net investment income (loss) | (1.06)% | (1.12)% | (1.01)% | (.94)% | (.87)% |
| Supplemental Data | | | | | |
| Net assets, end of period (000 omitted) | $70,605 | $75,030 | $82,567 | $64,034 | $53,447 |
| Portfolio turnover rateG | 126%H | 91%H | 106%H | 140%H | 143% |
A Calculated based on average shares outstanding during the period.
B Amount represents less than $.005 per share.
C Total returns would have been lower if certain expenses had not been reduced during the applicable periods shown.
D Total returns do not include the effect of the sales charges.
E Fees and expenses of any underlying mutual funds or exchange-traded funds (ETFs) are not included in the Fund's expense ratio. The Fund indirectly bears its proportionate share of these expenses. For additional expense information related to investments in Fidelity Central Funds, please refer to the "Investments in Fidelity Central Funds" note found in the Notes to Financial Statements section of the most recent Annual or Semi-Annual report.
F Expense ratios reflect operating expenses of the class. Expenses before reductions do not reflect amounts reimbursed by the investment adviser or reductions from brokerage service arrangements or reductions from other expense offset arrangements and do not represent the amount paid by the class during periods when reimbursements or reductions occur. Expenses net of fee waivers reflect expenses after reimbursement by the investment adviser but prior to reductions from brokerage service arrangements or other expense offset arrangements. Expenses net of all reductions represent the net expenses paid by the class.
G Amount does not include the portfolio activity of any underlying Fidelity Central Funds.
H Portfolio turnover rate excludes securities received or delivered in-kind.
See accompanying notes which are an integral part of the financial statements.
Fidelity Small Cap Growth Fund Class C
| Years ended July 31, | 2020 | 2019 | 2018 | 2017 | 2016 |
| Selected Per–Share Data | | | | | |
| Net asset value, beginning of period | $22.89 | $24.56 | $20.83 | $17.52 | $18.90 |
| Income from Investment Operations | | | | | |
| Net investment income (loss)A | (.34) | (.35) | (.34) | (.27) | (.22) |
| Net realized and unrealized gain (loss) | 1.97 | 1.58 | 5.69 | 3.74 | (.48) |
| Total from investment operations | 1.63 | 1.23 | 5.35 | 3.47 | (.70) |
| Distributions from net realized gain | (1.45) | (2.90) | (1.62) | (.16) | (.69) |
| Total distributions | (1.45) | (2.90) | (1.62) | (.16) | (.69) |
| Redemption fees added to paid in capital | – | – | –A,B | –A,B | .01A |
| Net asset value, end of period | $23.07 | $22.89 | $24.56 | $20.83 | $17.52 |
| Total ReturnC,D | 7.62% | 5.06% | 27.51% | 19.95% | (3.64)% |
| Ratios to Average Net AssetsE,F | | | | | |
| Expenses before reductions | 2.13% | 2.09% | 2.07% | 2.11% | 2.16% |
| Expenses net of fee waivers, if any | 2.13% | 2.09% | 2.07% | 2.11% | 2.16% |
| Expenses net of all reductions | 2.12% | 2.08% | 2.06% | 2.10% | 2.14% |
| Net investment income (loss) | (1.56)% | (1.61)% | (1.50)% | (1.43)% | (1.37)% |
| Supplemental Data | | | | | |
| Net assets, end of period (000 omitted) | $77,850 | $96,449 | $139,375 | $102,669 | $73,731 |
| Portfolio turnover rateG | 126%H | 91%H | 106%H | 140%H | 143% |
A Calculated based on average shares outstanding during the period.
B Amount represents less than $.005 per share.
C Total returns would have been lower if certain expenses had not been reduced during the applicable periods shown.
D Total returns do not include the effect of the contingent deferred sales charge.
E Fees and expenses of any underlying mutual funds or exchange-traded funds (ETFs) are not included in the Fund's expense ratio. The Fund indirectly bears its proportionate share of these expenses. For additional expense information related to investments in Fidelity Central Funds, please refer to the "Investments in Fidelity Central Funds" note found in the Notes to Financial Statements section of the most recent Annual or Semi-Annual report.
F Expense ratios reflect operating expenses of the class. Expenses before reductions do not reflect amounts reimbursed by the investment adviser or reductions from brokerage service arrangements or reductions from other expense offset arrangements and do not represent the amount paid by the class during periods when reimbursements or reductions occur. Expenses net of fee waivers reflect expenses after reimbursement by the investment adviser but prior to reductions from brokerage service arrangements or other expense offset arrangements. Expenses net of all reductions represent the net expenses paid by the class.
G Amount does not include the portfolio activity of any underlying Fidelity Central Funds.
H Portfolio turnover rate excludes securities received or delivered in-kind.
See accompanying notes which are an integral part of the financial statements.
Fidelity Small Cap Growth Fund
| Years ended July 31, | 2020 | 2019 | 2018 | 2017 | 2016 |
| Selected Per–Share Data | | | | | |
| Net asset value, beginning of period | $27.27 | $28.59 | $23.84 | $19.82 | $21.20 |
| Income from Investment Operations | | | | | |
| Net investment income (loss)A | (.13) | (.15) | (.12) | (.09) | (.06) |
| Net realized and unrealized gain (loss) | 2.38 | 1.87 | 6.57 | 4.27 | (.52) |
| Total from investment operations | 2.25 | 1.72 | 6.45 | 4.18 | (.58) |
| Distributions from net realized gain | (1.45) | (3.04) | (1.70) | (.16) | (.81) |
| Total distributions | (1.45) | (3.04) | (1.70) | (.16) | (.81) |
| Redemption fees added to paid in capital | – | – | –A,B | –A,B | .01A |
| Net asset value, end of period | $28.07 | $27.27 | $28.59 | $23.84 | $19.82 |
| Total ReturnC | 8.72% | 6.17% | 28.81% | 21.22% | (2.63)% |
| Ratios to Average Net AssetsD,E | | | | | |
| Expenses before reductions | 1.08% | 1.05% | 1.02% | 1.08% | 1.12% |
| Expenses net of fee waivers, if any | 1.08% | 1.05% | 1.02% | 1.08% | 1.12% |
| Expenses net of all reductions | 1.07% | 1.04% | 1.01% | 1.07% | 1.11% |
| Net investment income (loss) | (.52)% | (.57)% | (.45)% | (.40)% | (.33)% |
| Supplemental Data | | | | | |
| Net assets, end of period (000 omitted) | $2,839,506 | $2,888,038 | $3,269,548 | $2,336,762 | $1,580,264 |
| Portfolio turnover rateF | 126%G | 91%G | 106%G | 140%G | 143% |
A Calculated based on average shares outstanding during the period.
B Amount represents less than $.005 per share.
C Total returns would have been lower if certain expenses had not been reduced during the applicable periods shown.
D Fees and expenses of any underlying mutual funds or exchange-traded funds (ETFs) are not included in the Fund's expense ratio. The Fund indirectly bears its proportionate share of these expenses. For additional expense information related to investments in Fidelity Central Funds, please refer to the "Investments in Fidelity Central Funds" note found in the Notes to Financial Statements section of the most recent Annual or Semi-Annual report.
E Expense ratios reflect operating expenses of the class. Expenses before reductions do not reflect amounts reimbursed by the investment adviser or reductions from brokerage service arrangements or reductions from other expense offset arrangements and do not represent the amount paid by the class during periods when reimbursements or reductions occur. Expenses net of fee waivers reflect expenses after reimbursement by the investment adviser but prior to reductions from brokerage service arrangements or other expense offset arrangements. Expenses net of all reductions represent the net expenses paid by the class.
F Amount does not include the portfolio activity of any underlying Fidelity Central Funds.
G Portfolio turnover rate excludes securities received or delivered in-kind.
See accompanying notes which are an integral part of the financial statements.
Fidelity Small Cap Growth Fund Class I
| Years ended July 31, | 2020 | 2019 | 2018 | 2017 | 2016 |
| Selected Per–Share Data | | | | | |
| Net asset value, beginning of period | $27.35 | $28.66 | $23.90 | $19.86 | $21.24 |
| Income from Investment Operations | | | | | |
| Net investment income (loss)A | (.14) | (.15) | (.12) | (.08) | (.05) |
| Net realized and unrealized gain (loss) | 2.39 | 1.88 | 6.58 | 4.28 | (.53) |
| Total from investment operations | 2.25 | 1.73 | 6.46 | 4.20 | (.58) |
| Distributions from net realized gain | (1.45) | (3.04) | (1.70) | (.16) | (.81) |
| Total distributions | (1.45) | (3.04) | (1.70) | (.16) | (.81) |
| Redemption fees added to paid in capital | – | – | –A,B | –A,B | .01A |
| Net asset value, end of period | $28.15 | $27.35 | $28.66 | $23.90 | $19.86 |
| Total ReturnC | 8.70% | 6.18% | 28.78% | 21.28% | (2.62)% |
| Ratios to Average Net AssetsD,E | | | | | |
| Expenses before reductions | 1.11% | 1.06% | 1.03% | 1.06% | 1.09% |
| Expenses net of fee waivers, if any | 1.11% | 1.06% | 1.03% | 1.06% | 1.09% |
| Expenses net of all reductions | 1.10% | 1.06% | 1.02% | 1.05% | 1.07% |
| Net investment income (loss) | (.54)% | (.58)% | (.46)% | (.38)% | (.30)% |
| Supplemental Data | | | | | |
| Net assets, end of period (000 omitted) | $540,553 | $590,311 | $678,576 | $390,032 | $163,696 |
| Portfolio turnover rateF | 126%G | 91%G | 106%G | 140%G | 143% |
A Calculated based on average shares outstanding during the period.
B Amount represents less than $.005 per share.
C Total returns would have been lower if certain expenses had not been reduced during the applicable periods shown.
D Fees and expenses of any underlying mutual funds or exchange-traded funds (ETFs) are not included in the Fund's expense ratio. The Fund indirectly bears its proportionate share of these expenses. For additional expense information related to investments in Fidelity Central Funds, please refer to the "Investments in Fidelity Central Funds" note found in the Notes to Financial Statements section of the most recent Annual or Semi-Annual report.
E Expense ratios reflect operating expenses of the class. Expenses before reductions do not reflect amounts reimbursed by the investment adviser or reductions from brokerage service arrangements or reductions from other expense offset arrangements and do not represent the amount paid by the class during periods when reimbursements or reductions occur. Expenses net of fee waivers reflect expenses after reimbursement by the investment adviser but prior to reductions from brokerage service arrangements or other expense offset arrangements. Expenses net of all reductions represent the net expenses paid by the class.
F Amount does not include the portfolio activity of any underlying Fidelity Central Funds.
G Portfolio turnover rate excludes securities received or delivered in-kind.
See accompanying notes which are an integral part of the financial statements.
Fidelity Small Cap Growth Fund Class Z
| Years ended July 31, | 2020 | 2019 | 2018 | 2017 A |
| Selected Per–Share Data | | | | |
| Net asset value, beginning of period | $27.41 | $28.71 | $23.91 | $21.39 |
| Income from Investment Operations | | | | |
| Net investment income (loss)B | (.10) | (.11) | (.09) | (.05) |
| Net realized and unrealized gain (loss) | 2.40 | 1.87 | 6.61 | 2.57 |
| Total from investment operations | 2.30 | 1.76 | 6.52 | 2.52 |
| Distributions from net realized gain | (1.45) | (3.06) | (1.72) | – |
| Total distributions | (1.45) | (3.06) | (1.72) | – |
| Redemption fees added to paid in capital | – | – | –B,C | –B,C |
| Net asset value, end of period | $28.26 | $27.41 | $28.71 | $23.91 |
| Total ReturnD,E | 8.87% | 6.29% | 29.02% | 11.78% |
| Ratios to Average Net AssetsF,G | | | | |
| Expenses before reductions | .97% | .92% | .89% | .90%H |
| Expenses net of fee waivers, if any | .96% | .92% | .89% | .90%H |
| Expenses net of all reductions | .95% | .92% | .88% | .89%H |
| Net investment income (loss) | (.40)% | (.44)% | (.32)% | (.44)%H |
| Supplemental Data | | | | |
| Net assets, end of period (000 omitted) | $197,764 | $183,552 | $132,928 | $18,447 |
| Portfolio turnover rateI | 126%J | 91%J | 106%J | 140%J |
A For the period February 1, 2017 (commencement of sale of shares) to July 31, 2017.
B Calculated based on average shares outstanding during the period.
C Amount represents less than $.005 per share.
D Total returns for periods of less than one year are not annualized.
E Total returns would have been lower if certain expenses had not been reduced during the applicable periods shown.
F Fees and expenses of any underlying mutual funds or exchange-traded funds (ETFs) are not included in the Fund's expense ratio. The Fund indirectly bears its proportionate share of these expenses. For additional expense information related to investments in Fidelity Central Funds, please refer to the "Investments in Fidelity Central Funds" note found in the Notes to Financial Statements section of the most recent Annual or Semi-Annual report.
G Expense ratios reflect operating expenses of the class. Expenses before reductions do not reflect amounts reimbursed by the investment adviser or reductions from brokerage service arrangements or reductions from other expense offset arrangements and do not represent the amount paid by the class during periods when reimbursements or reductions occur. Expense ratios before reductions for start-up periods may not be representative of longer-term operating periods. Expenses net of fee waivers reflect expenses after reimbursement by the investment adviser but prior to reductions from brokerage service arrangements or other expense offset arrangements. Expenses net of all reductions represent the net expenses paid by the class.
H Annualized
I Amount does not include the portfolio activity of any underlying Fidelity Central Funds.
J Portfolio turnover rate excludes securities received or delivered in-kind.
See accompanying notes which are an integral part of the financial statements.
Notes to Financial Statements
For the period ended July 31, 2020
1. Organization.
Fidelity Small Cap Growth Fund (the Fund) is a fund of Fidelity Securities Fund (the Trust) and is authorized to issue an unlimited number of shares. The Trust is registered under the Investment Company Act of 1940, as amended (the 1940 Act), as an open-end management investment company organized as a Massachusetts business trust. The Fund offers Class A, Class M, Class C, Fidelity Small Cap Growth, Class I and Class Z shares, each of which has equal rights as to assets and voting privileges. Each class has exclusive voting rights with respect to matters that affect that class. Class C shares will automatically convert to Class A shares after a holding period of ten years from the initial date of purchase, with certain exceptions.
Effective January 1, 2020:
Investment advisers Fidelity Investments Money Management, Inc., FMR Co., Inc., and Fidelity SelectCo, LLC, merged with and into Fidelity Management & Research Company. In connection with the merger transactions, the resulting, merged investment adviser was then redomiciled from Massachusetts to Delaware, changed its corporate structure from a corporation to a limited liability company, and changed its name to "Fidelity Management & Research Company LLC".
Broker-dealer Fidelity Distributors Corporation merged with and into Fidelity Investments Institutional Services Company, Inc. ("FIISC"). FIISC was then redomiciled from Massachusetts to Delaware, changed its corporate structure from a corporation to a limited liability company, and changed its name to "Fidelity Distributors Company LLC".
Fidelity Investments Institutional Operations Company, Inc. converted from a Massachusetts corporation to a Massachusetts LLC, and changed its name to "Fidelity Investments Institutional Operations Company LLC".
2. Investments in Fidelity Central Funds.
The Fund invests in Fidelity Central Funds, which are open-end investment companies generally available only to other investment companies and accounts managed by the investment adviser and its affiliates. The Fund's Schedule of Investments lists each of the Fidelity Central Funds held as of period end, if any, as an investment of the Fund, but does not include the underlying holdings of each Fidelity Central Fund. As an Investing Fund, the Fund indirectly bears its proportionate share of the expenses of the underlying Fidelity Central Funds.
The Money Market Central Funds seek preservation of capital and current income and are managed by the investment adviser. Annualized expenses of the Money Market Central Funds as of their most recent shareholder report date ranged from less than .005% to .01%.
A complete unaudited list of holdings for each Fidelity Central Fund is available upon request or at the Securities and Exchange Commission (the SEC) website at www.sec.gov. In addition, the financial statements of the Fidelity Central Funds, which are not covered by the Fund's Report of Independent Registered Public Accounting Firm, are available on the SEC website or upon request.
3. Significant Accounting Policies.
The Fund is an investment company and applies the accounting and reporting guidance of the Financial Accounting Standards Board (FASB) Accounting Standards Codification Topic 946 Financial Services – Investment Companies. The financial statements have been prepared in conformity with accounting principles generally accepted in the United States of America (GAAP), which require management to make certain estimates and assumptions at the date of the financial statements. Actual results could differ from those estimates. Subsequent events, if any, through the date that the financial statements were issued have been evaluated in the preparation of the financial statements. The following summarizes the significant accounting policies of the Fund:
Investment Valuation. Investments are valued as of 4:00 p.m. Eastern time on the last calendar day of the period. The Board of Trustees (the Board) has delegated the day to day responsibility for the valuation of the Fund's investments to the Fair Value Committee (the Committee) established by the Fund's investment adviser. In accordance with valuation policies and procedures approved by the Board, the Fund attempts to obtain prices from one or more third party pricing vendors or brokers to value its investments. When current market prices, quotations or currency exchange rates are not readily available or reliable, investments will be fair valued in good faith by the Committee, in accordance with procedures adopted by the Board. Factors used in determining fair value vary by investment type and may include market or investment specific events. The frequency with which these procedures are used cannot be predicted and they may be utilized to a significant extent. The Committee oversees the Fund's valuation policies and procedures and reports to the Board on the Committee's activities and fair value determinations. The Board monitors the appropriateness of the procedures used in valuing the Fund's investments and ratifies the fair value determinations of the Committee.
The Fund categorizes the inputs to valuation techniques used to value its investments into a disclosure hierarchy consisting of three levels as shown below:
- Level 1 – quoted prices in active markets for identical investments
- Level 2 – other significant observable inputs (including quoted prices for similar investments, interest rates, prepayment speeds, etc.)
- Level 3 – unobservable inputs (including the Fund's own assumptions based on the best information available)
Valuation techniques used to value the Fund's investments by major category are as follows:
Equity securities, including restricted securities, for which market quotations are readily available, are valued at the last reported sale price or official closing price as reported by a third party pricing vendor on the primary market or exchange on which they are traded and are categorized as Level 1 in the hierarchy. In the event there were no sales during the day or closing prices are not available, securities are valued at the last quoted bid price or may be valued using the last available price and are generally categorized as Level 2 in the hierarchy. For foreign equity securities, when market or security specific events arise, comparisons to the valuation of American Depositary Receipts (ADRs), futures contracts, Exchange-Traded Funds (ETFs) and certain indexes as well as quoted prices for similar securities may be used and would be categorized as Level 2 in the hierarchy. For equity securities, including restricted securities, where observable inputs are limited, assumptions about market activity and risk are used and these securities may be categorized as Level 3 in the hierarchy. Securities, including private placements or other restricted securities, for which observable inputs are not available are valued using alternate valuation approaches, including the market approach, the income approach and cost approach, and are categorized as Level 3 in the hierarchy. The market approach considers factors including the price of recent investments in the same or a similar security or financial metrics of comparable securities. The income approach considers factors including expected future cash flows, security specific risks and corresponding discount rates. The cost approach considers factors including the value of the security's underlying assets and liabilities.
Investments in open-end mutual funds, including the Fidelity Central Funds, are valued at their closing net asset value (NAV) each business day and are categorized as Level 1 in the hierarchy.
The following provides information on Level 3 securities held by the Fund that were valued at period end based on unobservable inputs. These amounts exclude valuations provided by a broker.
| Asset Type | Fair Value | Valuation Technique(s) | Unobservable Input | Amount or Range/Weighted Average | Impact to Valuation from an Increase in Input(a) |
| Equities | $ 97,118,428 | Market approach | Transaction price | $12.08 | Increase |
| | | Market comparable | Enterprise value/EBITDA multiple (EV/EBITDA) | 13.6 | Increase |
| | | | Discount rate | 32.5%-69.2% / 56.2% | Decrease |
| | | | Enterprise value/Sales multiple (EV/S) | 1.5 – 1.8/ 1.5 | Increase |
| | | | Conversion ratio | 1.0 | Increase |
(a) Represents the directional change in the fair value of the Level 3 investments that could have resulted from an increase in the corresponding input as of period end. A decrease to the unobservable input would have had the opposite effect. Significant changes in these inputs may have resulted in a significantly higher or lower fair value measurement at period end.
Changes in valuation techniques may result in transfers in or out of an assigned level within the disclosure hierarchy. The aggregate value of investments by input level as of July 31, 2020, as well as a roll forward of Level 3 investments, is included at the end of the Fund's Schedule of Investments.
Foreign Currency. The Fund may use foreign currency contracts to facilitate transactions in foreign-denominated securities. Gains and losses from these transactions may arise from changes in the value of the foreign currency or if the counterparties do not perform under the contracts' terms.
Foreign-denominated assets, including investment securities, and liabilities are translated into U.S. dollars at the exchange rates at period end. Purchases and sales of investment securities, income and dividends received and expenses denominated in foreign currencies are translated into U.S. dollars at the exchange rate in effect on the transaction date.
The effects of exchange rate fluctuations on investments are included with the net realized and unrealized gain (loss) on investment securities. Other foreign currency transactions resulting in realized and unrealized gain (loss) are disclosed separately.
Investment Transactions and Income. For financial reporting purposes, the Fund's investment holdings and NAV include trades executed through the end of the last business day of the period. The NAV per share for processing shareholder transactions is calculated as of the close of business of the New York Stock Exchange (NYSE), normally 4:00 p.m. Eastern time and includes trades executed through the end of the prior business day. Gains and losses on securities sold are determined on the basis of identified cost and include proceeds received from litigation. Dividend income is recorded on the ex-dividend date, except for certain dividends from foreign securities where the ex-dividend date may have passed, which are recorded as soon as the Fund is informed of the ex-dividend date. Non-cash dividends included in dividend income, if any, are recorded at the fair market value of the securities received. Income and capital gain distributions from Fidelity Central Funds, if any, are recorded on the ex-dividend date. Certain distributions received by the Fund represent a return of capital or capital gain. The Fund determines the components of these distributions subsequent to the ex-dividend date, based upon receipt of tax filings or other correspondence relating to the underlying investment. These distributions are recorded as a reduction of cost of investments and/or as a realized gain. Investment income is recorded net of foreign taxes withheld where recovery of such taxes is uncertain.
Class Allocations and Expenses. Investment income, realized and unrealized capital gains and losses, common expenses of the Fund, and certain fund-level expense reductions, if any, are allocated daily on a pro-rata basis to each class based on the relative net assets of each class to the total net assets of the Fund. Each class differs with respect to transfer agent and distribution and service plan fees incurred. Certain expense reductions may also differ by class. For the reporting period, the allocated portion of income and expenses to each class as a percent of its average net assets may vary due to the timing of recording these transactions in relation to fluctuating net assets of the classes. Expenses directly attributable to a fund are charged to that fund. Expenses attributable to more than one fund are allocated among the respective funds on the basis of relative net assets or other appropriate methods. Expense estimates are accrued in the period to which they relate and adjustments are made when actual amounts are known.
Income Tax Information and Distributions to Shareholders. Each year, the Fund intends to qualify as a regulated investment company under Subchapter M of the Internal Revenue Code, including distributing substantially all of its taxable income and realized gains. As a result, no provision for U.S. Federal income taxes is required. As of July 31, 2020, the Fund did not have any unrecognized tax benefits in the financial statements; nor is the Fund aware of any tax positions for which it is reasonably possible that the total amounts of unrecognized tax benefits will significantly change in the next twelve months. The Fund files a U.S. federal tax return, in addition to state and local tax returns as required. The Fund's federal income tax returns are subject to examination by the Internal Revenue Service (IRS) for a period of three fiscal years after they are filed. State and local tax returns may be subject to examination for an additional fiscal year depending on the jurisdiction. Foreign taxes are provided for based on the Fund's understanding of the tax rules and rates that exist in the foreign markets in which it invests.
Distributions are declared and recorded on the ex-dividend date. Income and capital gain distributions are declared separately for each class. Income and capital gain distributions are determined in accordance with income tax regulations, which may differ from GAAP. In addition, the Fund claimed a portion of the payment made to redeeming shareholders as a distribution for income tax purposes.
Capital accounts within the financial statements are adjusted for permanent book-tax differences. These adjustments have no impact on net assets or the results of operations. Capital accounts are not adjusted for temporary book-tax differences which will reverse in a subsequent period.
Book-tax differences are primarily due to foreign currency transactions, passive foreign investment companies (PFIC), redemptions in kind, partnerships, net operating losses and losses deferred due to wash sales and excise tax.
As of period end, the cost and unrealized appreciation (depreciation) in securities, and derivatives if applicable, for federal income tax purposes were as follows:
| Gross unrealized appreciation | $970,644,729 |
| Gross unrealized depreciation | (117,458,437) |
| Net unrealized appreciation (depreciation) | $853,186,292 |
| Tax Cost | $3,355,765,362 |
The tax-based components of distributable earnings as of period end were as follows:
| Undistributed ordinary income | $232,248,199 |
| Net unrealized appreciation (depreciation) on securities and other investments | $853,188,272 |
The Fund intends to elect to defer to its next fiscal year $12,523,414 of ordinary losses recognized during the period January 1, 2020 to July 31, 2020.
The tax character of distributions paid was as follows:
| | July 31, 2020 | July 31, 2019 |
| Ordinary Income | $– | $ 178,839,342 |
| Long-term Capital Gains | 217,764,832 | 318,220,171 |
| Total | $217,764,832 | $ 497,059,513 |
Restricted Securities (including Private Placements). The Fund may invest in securities that are subject to legal or contractual restrictions on resale. These securities generally may be resold in transactions exempt from registration or to the public if the securities are registered. Disposal of these securities may involve time-consuming negotiations and expense, and prompt sale at an acceptable price may be difficult. Information regarding restricted securities is included at the end of the Fund's Schedule of Investments.
Consolidated Subsidiary. The Fund invests in certain investments through a wholly-owned subsidiary ("Subsidiary"), which may be subject to federal and state taxes upon disposition.
As of period end, the Fund held an investment of $30,829,866 in this Subsidiary, representing .77% of the Fund's net assets. The financial statements have been consolidated and include accounts of the Fund and the Subsidiary. Accordingly, all inter-company transactions and balances have been eliminated.
Any cash held by the Subsidiary is restricted as to its use and is presented as Restricted cash in the Statement of Assets and Liabilities.
4. Purchases and Sales of Investments.
Purchases and sales of securities, other than short-term securities, and in-kind transactions are noted in the table below.
| | Purchases ($) | Sales ($) |
| Fidelity Small Cap Growth Fund | 4,775,806,818 | 5,107,563,359 |
Unaffiliated Redemptions In-Kind. During the period, 1,198,281 shares of the Fund were redeemed in-kind for investments and cash with a value of $32,422,959. The net realized gain of $9,910,437 on investments delivered through in-kind redemptions is included in the accompanying Statement of Operations. The amount of the in-kind redemptions is included in share transactions in the accompanying Statement of Changes in Net Assets as well as the Notes to Financial Statements. The Fund recognized no gain or loss for federal income tax purposes.
Prior Fiscal Year Unaffiliated Redemptions In-Kind. During the prior period, shares of the Fidelity Small Cap Growth Fund were redeemed in-kind for investments. The amount of the in-kind redemptions is included in share transactions in the accompanying Statement of Changes in Net Assets. For additional information of the Fidelity Small Cap Growth Fund in-kind transactions, please refer to the Fidelity Small Cap Growth Fund prior annual shareholder report.
5. Fees and Other Transactions with Affiliates.
Management Fee. Fidelity Management & Research Company LLC (the investment adviser) and its affiliates provide the Fund with investment management related services for which the Fund pays a monthly management fee. The management fee is the sum of an individual fund fee rate that is based on an annual rate of .45% of the Fund's average net assets and an annualized group fee rate that averaged .23% during the period. The group fee rate is based upon the monthly average net assets of a group of registered investment companies with which the investment adviser has management contracts. The group fee rate decreases as assets under management increase and increases as assets under management decrease. In addition, the management fee is subject to a performance adjustment (up to a maximum of +/- .20% of the Fund's average net assets over a 36 month performance period). The upward or downward adjustment to the management fee is based on the relative investment performance of Small Cap Growth as compared to its benchmark index, the Russell 2000 Growth Index, over the same 36 month performance period. For the reporting period, the total annual management fee rate, including the performance adjustment, was .88% of the Fund's average net assets. The performance adjustment included in the management fee rate may be higher or lower than the maximum performance adjustment rate due to the difference between the average net assets for the reporting and performance periods.
Distribution and Service Plan Fees. In accordance with Rule 12b-1 of the 1940 Act, the Fund has adopted separate Distribution and Service Plans for each class of shares. Certain classes pay Fidelity Distributors Company LLC (FDC), an affiliate of the investment adviser, separate Distribution and Service Fees, each of which is based on an annual percentage of each class' average net assets. In addition, FDC may pay financial intermediaries for selling shares of the Fund and providing shareholder support services. For the period, the Distribution and Service Fee rates, total fees and amounts retained by FDC were as follows:
| | Distribution Fee | Service Fee | Total Fees | Retained by FDC |
| Class A | -% | .25% | $655,352 | $13,368 |
| Class M | .25% | .25% | 342,668 | 1,846 |
| Class C | .75% | .25% | 825,859 | 29,227 |
| | | | $1,823,879 | $44,441 |
Sales Load. FDC may receive a front-end sales charge of up to 5.75% for selling Class A shares and 3.50% for selling Class M shares, some of which is paid to financial intermediaries for selling shares of the Fund. Depending on the holding period, FDC may receive contingent deferred sales charges levied on Class A, Class M and Class C redemptions. The deferred sales charges are 1.00% for Class C shares, 1.00% for certain purchases of Class A shares and .25% for certain purchases of Class M shares.
For the period, sales charge amounts retained by FDC were as follows:
| | Retained by FDC |
| Class A | $32,539 |
| Class M | 4,177 |
| Class C(a) | 2,409 |
| | $39,125 |
(a) When Class C shares are initially sold, FDC pays commissions from its own resources to financial intermediaries through which the sales are made.
Transfer Agent Fees. Fidelity Investments Institutional Operations Company LLC (FIIOC), an affiliate of the investment adviser, is the transfer, dividend disbursing and shareholder servicing agent for each class of the Fund. FIIOC receives account fees and asset-based fees that vary according to the account size and type of account of the shareholders of the respective classes of the Fund, except for Class Z. FIIOC receives an asset-based fee of Class Z's average net assets. FIIOC pays for typesetting, printing and mailing of shareholder reports, except proxy statements. Effective February 1, 2020, the Board approved to change the fee for Class Z from .046% to .044%.
For the period, transfer agent fees for each class were as follows:
| | Amount | % of Class-Level Average Net Assets |
| Class A | $512,002 | .20 |
| Class M | 142,002 | .21 |
| Class C | 172,640 | .21 |
| Small Cap Growth | 4,347,182 | .16 |
| Class I | 1,003,153 | .19 |
| Class Z | 81,947 | .04 |
| | $6,258,926 | |
Accounting Fees. Fidelity Service Company, Inc. (FSC), an affiliate of the investment adviser, maintains the Fund's accounting records. The accounting fee is based on the level of average net assets for each month. For the period, the fees were equivalent to the following annual rates:
| | % of Average Net Assets |
| Fidelity Small Cap Growth Fund | .03 |
Brokerage Commissions. A portion of portfolio transactions were placed with brokerage firms which are affiliates of the investment adviser. Brokerage commissions are included in net realized gain (loss) and change in net unrealized appreciation (depreciation) in the Statement of Operations. The commissions paid to these affiliated firms were as follows:
| | Amount |
| Fidelity Small Cap Growth Fund | $194,599 |
Interfund Lending Program. Pursuant to an Exemptive Order issued by the SEC, the fund, along with other registered investment companies having management contracts with Fidelity Management & Research Company LLC (FMR), or other affiliated entities of FMR, may participate in an interfund lending program. This program provides an alternative credit facility allowing the fund to borrow from, or lend money to, other participating affiliated funds. At period end, there were no interfund loans outstanding. Activity in this program during the period for which loans were outstanding was as follows:
| | Borrower or Lender | Average Loan Balance | Weighted Average Interest Rate | Interest Expense |
| Fidelity Small Cap Growth Fund | Borrower | $11,149,211 | 1.09% | $6,436 |
Interfund Trades. Funds may purchase from or sell securities to other Fidelity Funds under procedures adopted by the Board. The procedures have been designed to ensure these interfund trades are executed in accordance with Rule 17a-7 of the 1940 Act. Interfund trades are included within the respective purchases and sales amounts shown in the Purchases and Sales of Investments note.
Other. During the period, the investment adviser reimbursed the Fund for certain losses in the amount of $20,602.
6. Committed Line of Credit.
Certain Funds participate with other funds managed by the investment adviser or an affiliate in a $4.25 billion credit facility (the "line of credit") to be utilized for temporary or emergency purposes to fund shareholder redemptions or for other short-term liquidity purposes. The participating funds have agreed to pay commitment fees on their pro-rata portion of the line of credit, which are reflected in Miscellaneous expenses on the Statement of Operations, and are as follows:
| | Amount |
| Fidelity Small Cap Growth Fund | $9,376 |
7. Security Lending.
The Fund lends portfolio securities from time to time in order to earn additional income. Lending agents are used, including National Financial Services (NFS), an affiliate of the Fund. Pursuant to a securities lending agreement, NFS will receive a fee, which is capped at 9.9% of daily lending revenue, for its services as lending agent. The Fund may lend securities to certain qualified borrowers, including NFS. On the settlement date of the loan, the Fund receives collateral (in the form of U.S. Treasury obligations, letters of credit and/or cash) against the loaned securities and maintains collateral in an amount not less than 100% of the market value of the loaned securities during the period of the loan. The market value of the loaned securities is determined at the close of business of the Fund and any additional required collateral is delivered to the Fund on the next business day. The Fund or borrower may terminate the loan at any time, and if the borrower defaults on its obligation to return the securities loaned because of insolvency or other reasons, the Fund may apply collateral received from the borrower against the obligation. The Fund may experience delays and costs in recovering the securities loaned. Any cash collateral received is invested in the Fidelity Securities Lending Cash Central Fund. The value of loaned securities and cash collateral at period end are disclosed on the Fund's Statement of Assets and Liabilities. The value of securities loaned to NFS, as affiliated borrower, at period end was $4,350,194. Total fees paid by the Fund to NFS, as lending agent, amounted to $265,462. Security lending income represents the income earned on investing cash collateral, less rebates paid to borrowers and any lending agent fees associated with the loan, plus any premium payments received for lending certain types of securities. Net income from the Fidelity Securities Lending Cash Central Fund during the period is presented in the Statement of Operations as a component of income from Fidelity Central Funds (and includes $159,202 from securities loaned to NFS, as affiliated borrower).
8. Expense Reductions.
Commissions paid to certain brokers with whom the investment adviser, or its affiliates, places trades on behalf of the Fund include an amount in addition to trade execution, which may be rebated back to the Fund to offset certain expenses. This amount totaled $384,238 for the period. In addition, through arrangements with the Fund's custodian, credits realized as a result of certain uninvested cash balances were used to reduce the Fund's expenses. During the period, custodian credits reduced the Fund's expenses by $6,105. During the period, transfer agent credits reduced each class' expenses as noted in the table below.
| | Expense reduction |
| Small Cap Growth | $41 |
In addition, during the period the investment adviser or an affiliate reimbursed and/or waived a portion of fund-level operating expenses in the amount of $16,391.
In addition, during the period the investment adviser or an affiliate reimbursed the Fund $19,020 for an operational error which is included in the accompanying Statement of Operations.
9. Distributions to Shareholders.
Distributions to shareholders of each class were as follows:
| | Year ended
July 31, 2020 | Year ended
July 31, 2019 |
| Distributions to shareholders | | |
| Class A | $15,614,129 | $34,685,218 |
| Class M | 4,255,045 | 9,164,126 |
| Class C | 5,910,629 | 16,135,660 |
| Small Cap Growth | 151,308,285 | 350,367,749 |
| Class I | 30,684,941 | 71,811,488 |
| Class Z | 9,991,803 | 14,895,272 |
| Total | $217,764,832 | $497,059,513 |
10. Share Transactions.
Share transactions for each class were as follows and may contain automatic conversions between classes or exchanges between affiliated funds:
| | Shares | Shares | Dollars | Dollars |
| | Year ended July 31, 2020 | Year ended July 31, 2019 | Year ended July 31, 2020 | Year ended July 31, 2019 |
| Class A | | | | |
| Shares sold | 1,796,708 | 2,133,430 | $43,999,208 | $51,723,419 |
| Reinvestment of distributions | 624,197 | 1,321,086 | 15,459,513 | 34,480,523 |
| Shares redeemed | (3,317,701) | (3,991,085) | (79,344,299) | (95,100,431) |
| Net increase (decrease) | (896,796) | (536,569) | $(19,885,578) | $(8,896,489) |
| Class M | | | | |
| Shares sold | 324,349 | 317,719 | $7,533,494 | $7,433,229 |
| Reinvestment of distributions | 177,347 | 361,926 | 4,224,131 | 9,120,199 |
| Shares redeemed | (730,012) | (794,185) | (17,016,572) | (18,054,920) |
| Net increase (decrease) | (228,316) | (114,540) | $(5,258,947) | $(1,501,492) |
| Class C | | | | |
| Shares sold | 292,659 | 309,686 | $6,119,973 | $6,516,456 |
| Reinvestment of distributions | 267,451 | 689,073 | 5,778,310 | 15,944,303 |
| Shares redeemed | (1,398,488) | (2,460,326) | (28,909,752) | (52,214,985) |
| Net increase (decrease) | (838,378) | (1,461,567) | $(17,011,469) | $(29,754,226) |
| Small Cap Growth | | | | |
| Shares sold | 23,920,724 | 17,891,444 | $595,471,617 | $464,089,780 |
| Reinvestment of distributions | 5,544,742 | 12,256,590 | 144,309,689 | 334,955,420 |
| Shares redeemed | (34,227,420)(a) | (38,604,543)(b) | (855,432,691)(a) | (977,681,337)(b) |
| Net increase (decrease) | (4,761,954) | (8,456,509) | $(115,651,385) | $(178,636,137) |
| Class I | | | | |
| Shares sold | 4,983,369 | 4,729,284 | $126,413,853 | $123,093,185 |
| Reinvestment of distributions | 1,151,125 | 2,543,850 | 30,047,788 | 69,666,847 |
| Shares redeemed | (8,518,254)(a) | (9,361,050) | (218,079,633)(a) | (237,801,656) |
| Net increase (decrease) | (2,383,760) | (2,087,916) | $(61,617,992) | $(45,041,624) |
| Class Z | | | | |
| Shares sold | 2,771,561 | 3,951,932 | $71,827,246 | $99,696,861 |
| Reinvestment of distributions | 306,867 | 395,743 | 8,038,145 | 10,820,866 |
| Shares redeemed | (2,777,073) | (2,281,679) | (71,697,811) | (58,189,275) |
| Net increase (decrease) | 301,355 | 2,065,996 | $8,167,580 | $52,328,452 |
(a) Amount includes in-kind redemptions (see Unaffiliated Redemptions In-Kind note for additional details).
(b) Amount includes in-kind redemptions (see the Prior Fiscal Year Unaffiliated Redemptions In-Kind note for additional details).
11. Other.
The Fund's organizational documents provide former and current trustees and officers with a limited indemnification against liabilities arising in connection with the performance of their duties to the Fund. In the normal course of business, the Fund may also enter into contracts that provide general indemnifications. The Fund's maximum exposure under these arrangements is unknown as this would be dependent on future claims that may be made against the Fund. The risk of material loss from such claims is considered remote.
12. Coronavirus (COVID-19) Pandemic.
An outbreak of COVID-19 first detected in China during December 2019 has since spread globally and was declared a pandemic by the World Health Organization during March 2020. Developments that disrupt global economies and financial markets, such as the COVID-19 pandemic, may magnify factors that affect the Fund's performance.
Report of Independent Registered Public Accounting Firm
To the Board of Trustees of Fidelity Securities Fund and Shareholders of Fidelity Small Cap Growth Fund
Opinion on the Financial Statements
We have audited the accompanying statement of assets and liabilities, including the schedule of investments, of Fidelity Small Cap Growth Fund (one of the funds constituting Fidelity Securities Fund, referred to hereafter as the “Fund”) as of July 31, 2020, the related statement of operations for the year ended July 31, 2020, the statement of changes in net assets for each of the two years in the period ended July 31, 2020, including the related notes, and the financial highlights for each of the periods indicated therein (collectively referred to as the “financial statements”). In our opinion, the financial statements present fairly, in all material respects, the financial position of the Fund as of July 31, 2020, the results of its operations for the year then ended, the changes in its net assets for each of the two years in the period ended July 31, 2020 and the financial highlights for each of the periods indicated therein in conformity with accounting principles generally accepted in the United States of America.
Basis for Opinion
These financial statements are the responsibility of the Fund’s management. Our responsibility is to express an opinion on the Fund’s financial statements based on our audits. We are a public accounting firm registered with the Public Company Accounting Oversight Board (United States) (PCAOB) and are required to be independent with respect to the Fund in accordance with the U.S. federal securities laws and the applicable rules and regulations of the Securities and Exchange Commission and the PCAOB.
We conducted our audits of these financial statements in accordance with the standards of the PCAOB. Those standards require that we plan and perform the audit to obtain reasonable assurance about whether the financial statements are free of material misstatement, whether due to error or fraud.
Our audits included performing procedures to assess the risks of material misstatement of the financial statements, whether due to error or fraud, and performing procedures that respond to those risks. Such procedures included examining, on a test basis, evidence regarding the amounts and disclosures in the financial statements. Our audits also included evaluating the accounting principles used and significant estimates made by management, as well as evaluating the overall presentation of the financial statements. Our procedures included confirmation of securities owned as of July 31, 2020 by correspondence with the custodian, issuers of privately offered securities and brokers; when replies were not received from brokers, we performed other auditing procedures. We believe that our audits provide a reasonable basis for our opinion.
/s/ PricewaterhouseCoopers LLP
Boston, Massachusetts
September 14, 2020
We have served as the auditor of one or more investment companies in the Fidelity group of funds since 1932.
Trustees and Officers
The Trustees, Members of the Advisory Board (if any), and officers of the trust and fund, as applicable, are listed below. The Board of Trustees governs the fund and is responsible for protecting the interests of shareholders. The Trustees are experienced executives who meet periodically throughout the year to oversee the fund's activities, review contractual arrangements with companies that provide services to the fund, oversee management of the risks associated with such activities and contractual arrangements, and review the fund's performance. Except for Mr. Chiel, each of the Trustees oversees 311 funds. Mr. Chiel oversees 174 funds.
The Trustees hold office without limit in time except that (a) any Trustee may resign; (b) any Trustee may be removed by written instrument, signed by at least two-thirds of the number of Trustees prior to such removal; (c) any Trustee who requests to be retired or who has become incapacitated by illness or injury may be retired by written instrument signed by a majority of the other Trustees; and (d) any Trustee may be removed at any special meeting of shareholders by a two-thirds vote of the outstanding voting securities of the trust. Each Trustee who is not an interested person (as defined in the 1940 Act) of the trust and the fund is referred to herein as an Independent Trustee. Each Independent Trustee shall retire not later than the last day of the calendar year in which his or her 75th birthday occurs. The Independent Trustees may waive this mandatory retirement age policy with respect to individual Trustees. Officers and Advisory Board Members hold office without limit in time, except that any officer or Advisory Board Member may resign or may be removed by a vote of a majority of the Trustees at any regular meeting or any special meeting of the Trustees. Except as indicated, each individual has held the office shown or other offices in the same company for the past five years.
The fund's Statement of Additional Information (SAI) includes more information about the Trustees. To request a free copy, call Fidelity at 1-800-544-8544 if you’re an individual investing directly with Fidelity, call 1-800-835-5092 if you’re a plan sponsor or participant with Fidelity as your recordkeeper or call 1-877-208-0098 on institutional accounts or if you’re an advisor or invest through one.
Experience, Skills, Attributes, and Qualifications of the Trustees. The Governance and Nominating Committee has adopted a statement of policy that describes the experience, qualifications, attributes, and skills that are necessary and desirable for potential Independent Trustee candidates (Statement of Policy). The Board believes that each Trustee satisfied at the time he or she was initially elected or appointed a Trustee, and continues to satisfy, the standards contemplated by the Statement of Policy. The Governance and Nominating Committee also engages professional search firms to help identify potential Independent Trustee candidates who have the experience, qualifications, attributes, and skills consistent with the Statement of Policy. From time to time, additional criteria based on the composition and skills of the current Independent Trustees, as well as experience or skills that may be appropriate in light of future changes to board composition, business conditions, and regulatory or other developments, have also been considered by the professional search firms and the Governance and Nominating Committee. In addition, the Board takes into account the Trustees' commitment and participation in Board and committee meetings, as well as their leadership of standing and ad hoc committees throughout their tenure.
In determining that a particular Trustee was and continues to be qualified to serve as a Trustee, the Board has considered a variety of criteria, none of which, in isolation, was controlling. The Board believes that, collectively, the Trustees have balanced and diverse experience, qualifications, attributes, and skills, which allow the Board to operate effectively in governing the fund and protecting the interests of shareholders. Information about the specific experience, skills, attributes, and qualifications of each Trustee, which in each case led to the Board's conclusion that the Trustee should serve (or continue to serve) as a trustee of the fund, is provided below.
Board Structure and Oversight Function. Robert A. Lawrence is an interested person and currently serves as Acting Chairman. The Trustees have determined that an interested Chairman is appropriate and benefits shareholders because an interested Chairman has a personal and professional stake in the quality and continuity of services provided to the fund. Independent Trustees exercise their informed business judgment to appoint an individual of their choosing to serve as Chairman, regardless of whether the Trustee happens to be independent or a member of management. The Independent Trustees have determined that they can act independently and effectively without having an Independent Trustee serve as Chairman and that a key structural component for assuring that they are in a position to do so is for the Independent Trustees to constitute a substantial majority for the Board. The Independent Trustees also regularly meet in executive session. Ned C. Lautenbach and David M. Thomas serve as Co-Lead Independent Trustees and as such each (i) acts as a liaison between the Independent Trustees and management with respect to matters important to the Independent Trustees and (ii) with management prepares agendas for Board meetings.
Fidelity® funds are overseen by different Boards of Trustees. The fund's Board oversees Fidelity's high income and certain equity funds, and other Boards oversee Fidelity's investment-grade bond, money market, asset allocation, and other equity funds. The asset allocation funds may invest in Fidelity® funds overseen by the fund's Board. The use of separate Boards, each with its own committee structure, allows the Trustees of each group of Fidelity® funds to focus on the unique issues of the funds they oversee, including common research, investment, and operational issues. On occasion, the separate Boards establish joint committees to address issues of overlapping consequences for the Fidelity® funds overseen by each Board.
The Trustees operate using a system of committees to facilitate the timely and efficient consideration of all matters of importance to the Trustees, the fund, and fund shareholders and to facilitate compliance with legal and regulatory requirements and oversight of the fund's activities and associated risks. The Board, acting through its committees, has charged FMR and its affiliates with (i) identifying events or circumstances the occurrence of which could have demonstrably adverse effects on the fund's business and/or reputation; (ii) implementing processes and controls to lessen the possibility that such events or circumstances occur or to mitigate the effects of such events or circumstances if they do occur; and (iii) creating and maintaining a system designed to evaluate continuously business and market conditions in order to facilitate the identification and implementation processes described in (i) and (ii) above. Because the day-to-day operations and activities of the fund are carried out by or through FMR, its affiliates, and other service providers, the fund's exposure to risks is mitigated but not eliminated by the processes overseen by the Trustees. While each of the Board's committees has responsibility for overseeing different aspects of the fund's activities, oversight is exercised primarily through the Operations, Audit, and Compliance Committees. Appropriate personnel, including but not limited to the fund's Chief Compliance Officer (CCO), FMR's internal auditor, the independent accountants, the fund's Treasurer and portfolio management personnel, make periodic reports to the Board's committees, as appropriate, including an annual review of Fidelity's risk management program for the Fidelity® funds. The responsibilities of each standing committee, including their oversight responsibilities, are described further under "Standing Committees of the Trustees."
Interested Trustees*:
Correspondence intended for a Trustee who is an interested person may be sent to Fidelity Investments, 245 Summer Street, Boston, Massachusetts 02210.
Name, Year of Birth; Principal Occupations and Other Relevant Experience+
Jonathan Chiel (1957)
Year of Election or Appointment: 2016
Trustee
Mr. Chiel also serves as Trustee of other Fidelity® funds. Mr. Chiel is Executive Vice President and General Counsel for FMR LLC (diversified financial services company, 2012-present). Previously, Mr. Chiel served as general counsel (2004-2012) and senior vice president and deputy general counsel (2000-2004) for John Hancock Financial Services; a partner with Choate, Hall & Stewart (1996-2000) (law firm); and an Assistant United States Attorney for the United States Attorney’s Office of the District of Massachusetts (1986-95), including Chief of the Criminal Division (1993-1995). Mr. Chiel is a director on the boards of the Boston Bar Foundation and the Maimonides School.
Robert A. Lawrence (1952)
Year of Election or Appointment: 2020
Trustee
Acting Chairman of the Board of Trustees
Mr. Lawrence also serves as Trustee of other funds. Previously, Mr. Lawrence served as a Member of the Advisory Board of certain funds. Prior to his retirement in 2008, Mr. Lawrence served as Vice President of certain Fidelity® funds (2006-2008), Senior Vice President, Head of High Income Division of Fidelity Management & Research Company (investment adviser firm, 2006-2008), and President of Fidelity Strategic Investments (investment adviser firm, 2002-2005).
* Determined to be an “Interested Trustee” by virtue of, among other things, his or her affiliation with the trust or various entities under common control with FMR.
+ The information includes the Trustee's principal occupation during the last five years and other information relating to the experience, attributes, and skills relevant to the Trustee's qualifications to serve as a Trustee, which led to the conclusion that the Trustee should serve as a Trustee for the fund.
Independent Trustees:
Correspondence intended for an Independent Trustee may be sent to Fidelity Investments, P.O. Box 55235, Boston, Massachusetts 02205-5235.
Name, Year of Birth; Principal Occupations and Other Relevant Experience+
Dennis J. Dirks (1948)
Year of Election or Appointment: 2005
Trustee
Mr. Dirks also serves as Trustee of other Fidelity® funds. Prior to his retirement in May 2003, Mr. Dirks served as Chief Operating Officer and as a member of the Board of The Depository Trust & Clearing Corporation (financial markets infrastructure), President, Chief Operating Officer and a member of the Board of The Depository Trust Company (DTC), President and a member of the Board of the National Securities Clearing Corporation (NSCC), Chief Executive Officer and a member of the Board of the Government Securities Clearing Corporation and Chief Executive Officer and a member of the Board of the Mortgage-Backed Securities Clearing Corporation. Mr. Dirks currently serves as a member of the Finance Committee (2016-present) and Board (2017-present) and is Treasurer (2018-present) of the Asolo Repertory Theatre.
Donald F. Donahue (1950)
Year of Election or Appointment: 2018
Trustee
Mr. Donahue also serves as Trustee of other Fidelity® funds. Mr. Donahue serves as President and Chief Executive Officer of Miranda Partners, LLC (risk consulting for the financial services industry, 2012-present). Previously, Mr. Donahue served as Chief Executive Officer (2006-2012), Chief Operating Officer (2003-2006) and Managing Director, Customer Marketing and Development (1999-2003) of The Depository Trust & Clearing Corporation (financial markets infrastructure). Mr. Donahue currently serves as a member (2007-present) and Co-Chairman (2016-present) of the Board of United Way of New York, a member of the Board of NYC Leadership Academy (2012-present) and a member of the Board of Advisors of Ripple Labs, Inc. (financial services, 2015-present). Mr. Donahue previously served as a member of the Advisory Board of certain Fidelity® funds (2015-2018).
Vicki L. Fuller (1957)
Year of Election or Appointment: 2020
Trustee
Ms. Fuller also serves as Trustee of other Fidelity® funds. Previously, Ms. Fuller served as a member of the Advisory Board of certain Fidelity® funds (2018-2020), Chief Investment Officer of the New York State Common Retirement Fund (2012-2018) and held a variety of positions at AllianceBernstein L.P. (global asset management, 1985-2012), including Managing Director (2006-2012) and Senior Vice President and Senior Portfolio Manager (2001-2006). Ms. Fuller currently serves as a member of the Board, Audit Committee and Nominating and Governance Committee of The Williams Companies, Inc. (natural gas infrastructure, 2018-present) and as a member of the Board of Treliant, LLC (consulting, 2019-present).
Patricia L. Kampling (1959)
Year of Election or Appointment: 2020
Trustee
Ms. Kampling also serves as Trustee of other Fidelity® funds. Prior to her retirement, Ms. Kampling served as Chairman of the Board and Chief Executive Officer (2012-2019), President and Chief Operating Officer (2011-2012) and Executive Vice President and Chief Financial Officer (2010-2011) of Alliant Energy Corporation. Ms. Kampling currently serves as a member of the Board, Compensation Committee and Executive Committee and as Chair of the Audit Committee of Briggs & Stratton Corporation (manufacturing, 2011-present) and as a member of the Board, Audit, Finance and Risk Committee and Safety, Environmental, Technology and Operations Committee of American Water Works Company, Inc. (utilities company, 2019-present). In addition, Ms. Kampling currently serves as a member of the Board of the Nature Conservancy, Wisconsin Chapter (2019-present). Previously, Ms. Kampling served as a Member of the Advisory Board of certain Fidelity® funds (2020), a member of the Board of Interstate Power and Light Company (2012-2019) and Wisconsin Power and Light Company (2012-2019) (each a subsidiary of Alliant Energy Corporation) and as a member of the Board and Workforce Development Committee of the Business Roundtable (2018-2019).
Alan J. Lacy (1953)
Year of Election or Appointment: 2008
Trustee
Mr. Lacy also serves as Trustee of other Fidelity® funds. Previously, Mr. Lacy served as Senior Adviser (2007-2014) of Oak Hill Capital Partners, L.P. (private equity), Chief Executive Officer (2005) and Vice Chairman (2005-2006) of Sears Holdings Corporation (retail), Chief Executive Officer and Chairman of the Board of Sears, Roebuck and Co. (retail, 2000-2005), Chairman (2014-2017) and a member of the Board (2010-2017) of Dave & Buster’s Entertainment, Inc. (restaurant and entertainment complexes) and a member of the Board of Bristol-Myers Squibb Company (global pharmaceuticals, 2008-2020). Mr. Lacy currently serves as a Trustee of the California Chapter of The Nature Conservancy (2015-present) and a member of the Board of the Center for Advanced Study in the Behavioral Sciences at Stanford University (2015-present).
Ned C. Lautenbach (1944)
Year of Election or Appointment: 2000
Trustee
Co-Lead Independent Trustee
Mr. Lautenbach also serves as Trustee of other Fidelity® funds. Mr. Lautenbach currently serves as Chair of the Board of Governors, State University System of Florida (2013-present) and is a member of the Council on Foreign Relations (1994-present). He is also a member and has in the past served as Chairman of the Board of Directors of Artis-Naples (2012-present). Previously, Mr. Lautenbach served as a member and then Lead Director of the Board of Directors of Eaton Corporation (diversified industrial, 1997-2016). He was also a Partner at Clayton, Dubilier & Rice, LLC (private equity investment, 1998-2010); as well as Director of Sony Corporation (2006-2007). In addition, Mr. Lautenbach had a 30-year career with IBM (technology company), during which time he served as Senior Vice President and as a member of the Corporate Executive Committee (1968-1998).
Joseph Mauriello (1944)
Year of Election or Appointment: 2008
Trustee
Mr. Mauriello also serves as Trustee of other Fidelity® funds. Prior to his retirement in January 2006, Mr. Mauriello served in numerous senior management positions including Deputy Chairman and Chief Operating Officer (2004-2005), and Vice Chairman of Financial Services (2002-2004) of KPMG LLP US (professional services, 1965-2005). Mr. Mauriello currently serves as a member of the Independent Directors Council Governing Council (2015-present). Previously, Mr. Mauriello served as a member of the Board of XL Group plc. (global insurance and re-insurance, 2006-2018).
Cornelia M. Small (1944)
Year of Election or Appointment: 2005
Trustee
Ms. Small also serves as Trustee of other Fidelity® funds. Previously, Ms. Small served as Chief Investment Officer, Director of Global Equity Investments and a member of Scudder, Stevens & Clark and Scudder Kemper Investments. Ms. Small previously served as a member of the Board (2009-2019) and Chair of the Investment Committee (2010-2019) of the Teagle Foundation and a member of the Investment Committee of the Berkshire Taconic Community Foundation (2008-2019).
Garnett A. Smith (1947)
Year of Election or Appointment: 2018
Trustee
Mr. Smith also serves as Trustee of other Fidelity® funds. Prior to his retirement, Mr. Smith served as Chairman and Chief Executive Officer (1990-1997) and President (1986-1990) of Inbrand Corp. (manufacturer of personal absorbent products). Prior to his employment with Inbrand Corp., he was employed by a retail fabric chain and North Carolina National Bank (now Bank of America). Mr. Smith previously served as a member of the Advisory Board of certain Fidelity® funds (2012-2013).
David M. Thomas (1949)
Year of Election or Appointment: 2008
Trustee
Co-Lead Independent Trustee
Mr. Thomas also serves as Trustee of other Fidelity® funds. Previously, Mr. Thomas served as Executive Chairman (2005-2006) and Chairman and Chief Executive Officer (2000-2005) of IMS Health, Inc. (pharmaceutical and healthcare information solutions). Mr. Thomas currently serves as Non-Executive Chairman of the Board of Fortune Brands Home and Security (home and security products, 2011-present), and a member of the Board (2004-present) and Presiding Director (2013-present) of Interpublic Group of Companies, Inc. (marketing communication).
Susan Tomasky (1953)
Year of Election or Appointment: 2020
Trustee
Ms. Tomasky also serves as Trustee of other Fidelity® funds. Prior to her retirement, Ms. Tomasky served in various executive officer positions at American Electric Power Company, Inc. (1998-2011), including most recently as President of AEP Transmission (2007-2011). Ms. Tomasky currently serves as a member of the Board and Sustainability Committee and as Chair of the Audit Committee of Marathon Petroleum Corporation (2018-present) and as a member of the Board, Corporate Governance Committee and Organization and Compensation Committee and as Chair of the Audit Committee of Public Service Enterprise Group, Inc. (utilities company, 2012-present). In addition, Ms. Tomasky currently serves as a member of the Board of the Columbus Regional Airport Authority (2007-present), as a member of the Board of the Royal Shakespeare Company – America (2009-present), as a member of the Board of the Columbus Association for the Performing Arts (2011-present) and as a member of the Board of Kenyon College (2016-present). Previously, Ms. Tomasky served as a Member of the Advisory Board of certain Fidelity® funds (2020), a member of the Board (2011-2019) and as Lead Independent Director (2015-2018) of Andeavor Corporation (previously Tesoro Corporation) (independent oil refiner and marketer) and as a member of the Board of Summit Midstream Partners LP (energy, 2012-2018).
Michael E. Wiley (1950)
Year of Election or Appointment: 2020
Trustee
Mr. Wiley also serves as Trustee of other Fidelity® funds. Previously, Mr. Wiley served as a member of the Advisory Board of certain Fidelity® funds (2018-2020), Chairman, President and CEO of Baker Hughes, Inc. (oilfield services, 2000-2004). Mr. Wiley also previously served as a member of the Board of Andeavor Corporation (independent oil refiner and marketer, 2005-2018), a member of the Board of Andeavor Logistics LP (natural resources logistics, 2015-2018) and a member of the Board of High Point Resources (exploration and production, 2005-2020).
+ The information includes the Trustee's principal occupation during the last five years and other information relating to the experience, attributes, and skills relevant to the Trustee's qualifications to serve as a Trustee, which led to the conclusion that the Trustee should serve as a Trustee for the fund.
Advisory Board Members and Officers:
Correspondence intended for a Member of the Advisory Board (if any) may be sent to Fidelity Investments, P.O. Box 55235, Boston, Massachusetts 02205-5235. Correspondence intended for an officer or Peter S. Lynch may be sent to Fidelity Investments, 245 Summer Street, Boston, Massachusetts 02210. Officers appear below in alphabetical order.
Name, Year of Birth; Principal Occupation
Peter S. Lynch (1944)
Year of Election or Appointment: 2003
Member of the Advisory Board
Mr. Lynch also serves as a Member of the Advisory Board of other Fidelity® funds. Mr. Lynch is Vice Chairman and a Director of Fidelity Management & Research Company LLC (investment adviser firm). In addition, Mr. Lynch serves as a Trustee of Boston College and as the Chairman of the Inner-City Scholarship Fund. Previously, Mr. Lynch served as Vice Chairman and a Director of FMR Co., Inc. (investment adviser firm) and on the Special Olympics International Board of Directors (1997-2006).
Elizabeth Paige Baumann (1968)
Year of Election or Appointment: 2017
Anti-Money Laundering (AML) Officer
Ms. Baumann also serves as AML Officer of other funds. She is Chief AML Officer (2012-present) and Senior Vice President (2014-present) of FMR LLC (diversified financial services company) and is an employee of Fidelity Investments. Previously, Ms. Baumann served as AML Officer of certain funds (2017-2019), as AML Officer of the funds (2012-2016), and Vice President (2007-2014) and Deputy Anti-Money Laundering Officer (2007-2012) of FMR LLC.
Craig S. Brown (1977)
Year of Election or Appointment: 2019
Assistant Treasurer
Mr. Brown also serves as Assistant Treasurer of other funds. Mr. Brown is an employee of Fidelity Investments (2013-present).
John J. Burke III (1964)
Year of Election or Appointment: 2018
Chief Financial Officer
Mr. Burke also serves as Chief Financial Officer of other funds. Mr. Burke serves as Head of Investment Operations for Fidelity Fund and Investment Operations (2018-present) and is an employee of Fidelity Investments (1998-present). Previously Mr. Burke served as head of Asset Management Investment Operations (2012-2018).
William C. Coffey (1969)
Year of Election or Appointment: 2019
Assistant Secretary
Mr. Coffey also serves as Assistant Secretary of other funds. He is Senior Vice President and Deputy General Counsel of FMR LLC (diversified financial services company, 2010-present), and is an employee of Fidelity Investments. Previously, Mr. Coffey served as Secretary and CLO of certain funds (2018-2019); CLO, Secretary, and Senior Vice President of Fidelity Management & Research Company and FMR Co., Inc. (investment adviser firms, 2018-2019); Secretary of Fidelity SelectCo, LLC and Fidelity Investments Money Management, Inc. (investment adviser firms, 2018-2019); CLO of Fidelity Management & Research (Hong Kong) Limited, FMR Investment Management (UK) Limited, and Fidelity Management & Research (Japan) Limited (investment adviser firms, 2018-2019); and Assistant Secretary of certain funds (2009-2018).
Timothy M. Cohen (1969)
Year of Election or Appointment: 2018
Vice President
Mr. Cohen also serves as Vice President of other funds. Mr. Cohen serves as Co-Head of Equity (2018-present), a Director of Fidelity Management & Research (Japan) Limited (investment adviser firm, 2016-present), and is an employee of Fidelity Investments. Previously, Mr. Cohen served as Executive Vice President of Fidelity SelectCo, LLC (2019), Head of Global Equity Research (2016-2018), Chief Investment Officer - Equity and a Director of Fidelity Management & Research (U.K.) Inc. (investment adviser firm, 2013-2015) and as a Director of Fidelity Management & Research (Hong Kong) Limited (investment adviser firm, 2017).
Jonathan Davis (1968)
Year of Election or Appointment: 2010
Assistant Treasurer
Mr. Davis also serves as Assistant Treasurer of other funds. Mr. Davis serves as Assistant Treasurer of FMR Capital, Inc. (2017-present) and is an employee of Fidelity Investments. Previously, Mr. Davis served as Vice President and Associate General Counsel of FMR LLC (diversified financial services company, 2003-2010).
Laura M. Del Prato (1964)
Year of Election or Appointment: 2018
Assistant Treasurer
Ms. Del Prato also serves as an officer of other funds. Ms. Del Prato is an employee of Fidelity Investments (2017-present). Previously, Ms. Del Prato served as President and Treasurer of The North Carolina Capital Management Trust: Cash Portfolio and Term Portfolio (2018-2020). Prior to joining Fidelity Investments, Ms. Del Prato served as a Managing Director and Treasurer of the JPMorgan Mutual Funds (2014-2017). Prior to JPMorgan, Ms. Del Prato served as a partner at Cohen Fund Audit Services (accounting firm, 2012-2013) and KPMG LLP (accounting firm, 2004-2012).
Colm A. Hogan (1973)
Year of Election or Appointment: 2020
Assistant Treasurer
Mr. Hogan also serves as an officer of other funds. Mr. Hogan serves as Assistant Treasurer of FMR Capital, Inc. (2017-present) and is an employee of Fidelity Investments (2005-present). Previously, Mr. Hogan served as Deputy Treasurer of certain Fidelity® funds (2016-2020) and Assistant Treasurer of certain Fidelity® funds (2016-2018).
Pamela R. Holding (1964)
Year of Election or Appointment: 2018
Vice President
Ms. Holding also serves as Vice President of other funds. Ms. Holding serves as Co-Head of Equity (2018-present) and is an employee of Fidelity Investments (2013-present). Previously, Ms. Holding served as Executive Vice President of Fidelity SelectCo, LLC (2019) and as Chief Investment Officer of Fidelity Institutional Asset Management (2013-2018).
Cynthia Lo Bessette (1969)
Year of Election or Appointment: 2019
Secretary and Chief Legal Officer (CLO)
Ms. Lo Bessette also serves as an officer of other funds. Ms. Lo Bessette serves as CLO, Secretary, and Senior Vice President of Fidelity Management & Research Company LLC (investment adviser firm, 2019-present); and CLO of Fidelity Management & Research (Hong Kong) Limited, FMR Investment Management (UK) Limited, and Fidelity Management & Research (Japan) Limited (investment adviser firms, 2019-present). She is a Senior Vice President and Deputy General Counsel of FMR LLC (diversified financial services company, 2019-present), and is an employee of Fidelity Investments. Previously, Ms. Lo Bessette served as CLO, Secretary, and Senior Vice President of FMR Co., Inc. (investment adviser firm, 2019); Secretary of Fidelity SelectCo, LLC and Fidelity Investments Money Management, Inc. (investment adviser firms, 2019). Prior to joining Fidelity Investments, Ms. Lo Bessette was Executive Vice President, General Counsel (2016-2019) and Senior Vice President, Deputy General Counsel (2015-2016) of OppenheimerFunds (investment management company) and Deputy Chief Legal Officer (2013-2015) of Jennison Associates LLC (investment adviser firm).
Chris Maher (1972)
Year of Election or Appointment: 2020
Deputy Treasurer
Mr. Maher also serves as an officer of other funds. Mr. Maher serves as Assistant Treasurer of FMR Capital, Inc. (2017-present), and is an employee of Fidelity Investments (2008-present). Previously, Mr. Maher served as Assistant Treasurer of certain funds (2013-2020); Vice President of Asset Management Compliance (2013), Vice President of the Program Management Group of FMR (investment adviser firm, 2010-2013), and Vice President of Valuation Oversight (2008-2010).
Jason P. Pogorelec (1975)
Year of Election or Appointment: 2020
Chief Compliance Officer
Mr. Pogorelec also serves as Chief Compliance Officer of other funds. Mr. Pogorelec is a senior Vice President of Asset Management Compliance for Fidelity Investments and is an employee of Fidelity Investments (2006-present). Previously, Mr. Pogorelec served as Vice President, Associate General Counsel for Fidelity Investments (2010-2020) and Assistant Secretary of certain Fidelity funds (2015-2020).
Stacie M. Smith (1974)
Year of Election or Appointment: 2016
President and Treasurer
Ms. Smith also serves as an officer of other funds. Ms. Smith serves as Assistant Treasurer of FMR Capital, Inc. (2017-present), is an employee of Fidelity Investments (2009-present), and has served in other fund officer roles. Prior to joining Fidelity Investments, Ms. Smith served as Senior Audit Manager of Ernst & Young LLP (accounting firm, 1996-2009). Previously, Ms. Smith served as Assistant Treasurer (2013-2019) and Deputy Treasurer (2013-2016) of certain Fidelity® funds.
Marc L. Spector (1972)
Year of Election or Appointment: 2016
Assistant Treasurer
Mr. Spector also serves as an officer of other funds. Mr. Spector serves as Assistant Treasurer of FMR Capital, Inc. (2017-present) and is an employee of Fidelity Investments (2016-present). Prior to joining Fidelity Investments, Mr. Spector served as Director at the Siegfried Group (accounting firm, 2013-2016), and prior to Siegfried Group as audit senior manager at Deloitte & Touche LLP (accounting firm, 2005-2013).
Jim Wegmann (1979)
Year of Election or Appointment: 2019
Assistant Treasurer
Mr. Wegmann also serves as Assistant Treasurer of other funds. Mr. Wegmann is an employee of Fidelity Investments (2011-present).
Shareholder Expense Example
As a shareholder, you incur two types of costs: (1) transaction costs, which may include sales charges (loads) on purchase payments or redemption proceeds, as applicable and (2) ongoing costs, which generally include management fees, distribution and/or service (12b-1) fees and other Fund expenses. This Example is intended to help you understand your ongoing costs (in dollars) of investing in a fund and to compare these costs with the ongoing costs of investing in other mutual funds.
The Example is based on an investment of $1,000 invested at the beginning of the period and held for the entire period (February 1, 2020 to July 31, 2020).
Actual Expenses
The first line of the accompanying table provides information about actual account values and actual expenses. You may use the information in this line, together with the amount you invested, to estimate the expenses that you paid over the period. Simply divide your account value by $1,000.00 (for example, an $8,600 account value divided by $1,000.00 = 8.6), then multiply the result by the number in the first line for a class/Fund under the heading entitled "Expenses Paid During Period" to estimate the expenses you paid on your account during this period. If any fund is a shareholder of any underlying mutual funds or exchange-traded funds (ETFs) (the Underlying Funds), such fund indirectly bears its proportional share of the expenses of the Underlying Funds in addition to the direct expenses incurred presented in the table. These fees and expenses are not included in the annualized expense ratio used to calculate the expense estimate in the table below.
Hypothetical Example for Comparison Purposes
The second line of the accompanying table provides information about hypothetical account values and hypothetical expenses based on the actual expense ratio and an assumed rate of return of 5% per year before expenses, which is not the actual return. The hypothetical account values and expenses may not be used to estimate the actual ending account balance or expenses you paid for the period. You may use this information to compare the ongoing costs of investing in the Fund and other funds. To do so, compare this 5% hypothetical example with the 5% hypothetical examples that appear in the shareholder reports of the other funds. If any fund is a shareholder of any Underlying Funds, such fund indirectly bears its proportional share of the expenses of the Underlying Funds in addition to the direct expenses as presented in the table. These fees and expenses are not included in the annualized expense ratio used to calculate the expense estimate in the table below.
Please note that the expenses shown in the table are meant to highlight your ongoing costs only and do not reflect any transaction costs. Therefore, the second line of the table is useful in comparing ongoing costs only, and will not help you determine the relative total costs of owning different funds. In addition, if these transactional costs were included, your costs would have been higher.
| | Annualized Expense Ratio-A | Beginning
Account Value
February 1, 2020 | Ending
Account Value
July 31, 2020 | Expenses Paid
During Period-B
February 1, 2020
to July 31, 2020 |
| Fidelity Small Cap Growth Fund | | | | |
| Class A | 1.39% | | | |
| Actual | | $1,000.00 | $1,012.90 | $6.96 |
| Hypothetical-C | | $1,000.00 | $1,017.95 | $6.97 |
| Class M | 1.65% | | | |
| Actual | | $1,000.00 | $1,011.90 | $8.25 |
| Hypothetical-C | | $1,000.00 | $1,016.66 | $8.27 |
| Class C | 2.16% | | | |
| Actual | | $1,000.00 | $1,009.20 | $10.79 |
| Hypothetical-C | | $1,000.00 | $1,014.12 | $10.82 |
| Small Cap Growth | 1.10% | | | |
| Actual | | $1,000.00 | $1,014.50 | $5.51 |
| Hypothetical-C | | $1,000.00 | $1,019.39 | $5.52 |
| Class I | 1.13% | | | |
| Actual | | $1,000.00 | $1,014.40 | $5.66 |
| Hypothetical-C | | $1,000.00 | $1,019.24 | $5.67 |
| Class Z | .98% | | | |
| Actual | | $1,000.00 | $1,015.10 | $4.91 |
| Hypothetical-C | | $1,000.00 | $1,019.99 | $4.92 |
A Annualized expense ratio reflects expenses net of applicable fee waivers.
B Expenses are equal to the annualized expense ratio, multiplied by the average account value over the period, multiplied by 182/ 366 (to reflect the one-half year period). The fees and expenses of any Underlying Funds are not included in each annualized expense ratio.
C 5% return per year before expenses
Distributions (Unaudited)
The Board of Trustees of Fidelity Small Cap Growth Fund voted to pay to shareholders of record at the opening of business on record date, the following distributions per share derived from capital gains realized from sales of portfolio securities:
| | Pay Date | Record Date | Capital Gains |
| Fidelity Small Cap Growth Fund | | | |
| Class A | 09/14/20 | 09/11/20 | $1.610 |
| Class M | 09/14/20 | 09/11/20 | $1.610 |
| Class C | 09/14/20 | 09/11/20 | $1.610 |
| Small Cap Growth | 09/14/20 | 09/11/20 | $1.610 |
| Class I | 09/14/20 | 09/11/20 | $1.610 |
| Class Z | 09/14/20 | 09/11/20 | $1.610 |
|
The fund hereby designates as a capital gain dividend with respect to the taxable year ended July 31, 2020, $299,518,651, or, if subsequently determined to be different, the net capital gain of such year.
The fund will notify shareholders in January 2021 of amounts for use in preparing 2020 income tax returns.
Liquidity Risk Management Program
The Securities and Exchange Commission adopted Rule 22e-4 under the Investment Company Act of 1940 (the Liquidity Rule) to promote effective liquidity risk management throughout the open-end investment company industry, thereby reducing the risk that funds will be unable to meet their redemption obligations and mitigating dilution of the interests of fund shareholders.
The Fund has adopted and implemented a liquidity risk management program pursuant to the Liquidity Rule (the Program) effective December 1, 2018. The Program is reasonably designed to assess and manage the Fund’s liquidity risk and to comply with the requirements of the Liquidity Rule. The Fund’s Board of Trustees (the Board) has designated the Fund’s investment adviser as administrator of the Program. The Fidelity advisers have established a Liquidity Risk Management Committee (the LRM Committee) to manage the Program for each of the Fidelity Funds. The LRM Committee monitors the adequacy and effectiveness of implementation of the Program and on a periodic basis assesses each Fund’s liquidity risk based on a variety of factors including (1) the Fund’s investment strategy, (2) portfolio liquidity and cash flow projections during normal and reasonably foreseeable stressed conditions, (3) shareholder redemptions, (4) borrowings and other funding sources and (5) in the case of exchange-traded funds, certain additional factors including the effect of the Fund’s prices and spreads, market participants, and basket compositions on the overall liquidity of the Fund’s portfolio, as applicable.
In accordance with the Program, each of the Fund’s portfolio investments is classified into one of four liquidity categories described below based on a determination of a reasonable expectation for how long it would take to convert the investment to cash (or sell or dispose of the investment) without significantly changing its market value.
- Highly liquid investments – cash or convertible to cash within three business days or less
- Moderately liquid investments – convertible to cash in three to seven calendar days
- Less liquid investments – can be sold or disposed of, but not settled, within seven calendar days
- Illiquid investments – cannot be sold or disposed of within seven calendar days
Liquidity classification determinations take into account a variety of factors including various market, trading and investment-specific considerations, as well as market depth, and generally utilize analysis from a third-party liquidity metrics service.
The Liquidity Rule places a 15% limit on a fund’s illiquid investments and requires funds that do not primarily hold assets that are highly liquid investments to determine and maintain a minimum percentage of the fund’s net assets to be invested in highly liquid investments (highly liquid investment minimum or HLIM). The Program includes provisions reasonably designed to comply with the 15% limit on illiquid investments and for determining, periodically reviewing and complying with the HLIM requirement as applicable.
At a recent meeting of the Fund’s Board of Trustees, the LRM Committee provided a written report to the Board pertaining to the operation, adequacy, and effectiveness of implementation of the Program for the annual period from December 1, 2018 through November 30, 2019. The report concluded that the Program has been implemented and is operating effectively and is reasonably designed to assess and manage the Fund’s liquidity risk.
Proxy Voting Results
A special meeting of shareholders was held on June 9, 2020. The results of votes taken among shareholders on the proposals before them are reported below. Each vote reported represents one dollar of net asset value held on the record date for the meeting.
PROPOSAL 1
To elect a Board of Trustees.
| | # of
Votes | % of
Votes |
| Dennis J. Dirks |
| Affirmative | 43,167,428,219.785 | 94.885 |
| Withheld | 2,327,070,930.034 | 5.115 |
| TOTAL | 45,494,499,149.820 | 100.000 |
| Donald F. Donahue |
| Affirmative | 43,161,668,935.467 | 94.872 |
| Withheld | 2,333,065,287.611 | 5.128 |
| TOTAL | 45,494,734,223.077 | 100.000 |
| Bettina Doulton |
| Affirmative | 43,304,465,213.969 | 95.186 |
| Withheld | 2,190,010,062.903 | 4.814 |
| TOTAL | 45,494,475,276.872 | 100.000 |
| Vicki L. Fuller |
| Affirmative | 43,380,442,631.493 | 95.353 |
| Withheld | 2,114,180,614.639 | 4.647 |
| TOTAL | 45,494,623,246.132 | 100.000 |
| Patricia L. Kampling |
| Affirmative | 43,128,008,796.761 | 94.798 |
| Withheld | 2,366,685,422.999 | 5.202 |
| TOTAL | 45,494,694,219.760 | 100.000 |
| Alan J. Lacy |
| Affirmative | 42,904,065,046.958 | 94.305 |
| Withheld | 2,590,717,567.229 | 5.695 |
| TOTAL | 45,494,782,614.187 | 100.000 |
| Ned C. Lautenbach |
| Affirmative | 42,802,778,827.017 | 94.083 |
| Withheld | 2,692,003,787.170 | 5.917 |
| TOTAL | 45,494,782,614.187 | 100.000 |
| Robert A. Lawrence |
| Affirmative | 42,971,258,294.203 | 94.453 |
| Withheld | 2,523,524,319.984 | 5.547 |
| TOTAL | 45,494,782,614.187 | 100.000 |
| Joseph Mauriello |
| Affirmative | 42,874,562,778.490 | 94.241 |
| Withheld | 2,620,171,874.731 | 5.759 |
| TOTAL | 45,494,734,653.220 | 100.000 |
| Cornelia M. Small |
| Affirmative | 43,029,040,988.063 | 94.580 |
| Withheld | 2,465,741,626.124 | 5.420 |
| TOTAL | 45,494,782,614.187 | 100.000 |
| Garnett A. Smith |
| Affirmative | 42,892,814,945.159 | 94.281 |
| Withheld | 2,601,967,669.028 | 5.719 |
| TOTAL | 45,494,782,614.187 | 100.000 |
| David M. Thomas |
| Affirmative | 42,936,080,036.111 | 94.376 |
| Withheld | 2,558,702,578.076 | 5.624 |
| TOTAL | 45,494,782,614.187 | 100.000 |
| Susan Tomasky |
| Affirmative | 43,147,934,105.796 | 94.842 |
| Withheld | 2,346,571,066.028 | 5.158 |
| TOTAL | 45,494,782,614.187 | 100.000 |
| Michael E. Wiley |
| Affirmative | 42,885,333,102.972 | 94.264 |
| Withheld | 2,609,449,511.215 | 5.736 |
| TOTAL | 45,494,782,614.187 | 100.000 |
PROPOSAL 2
To convert a fundamental investment policy to a non-fundamental investment policy.
| | # of
Votes | % of
Votes |
| Affirmative | 991,711,698.612 | 62.930 |
| Against | 206,242,317.600 | 13.087 |
| Abstain | 129,204,726.003 | 8.199 |
| Broker Non-Vote | 248,745,587.010 | 15.784 |
| TOTAL | 1,575,904,329.224 | 100.000 |
| Proposal 1 reflects trust wide proposal and voting results. |
| Proposal 2 was not approved by shareholders. |
SCP-ANN-0920
1.803695.115
Fidelity® Small Cap Value Fund
Annual Report
July 31, 2020
Includes Fidelity and Fidelity Advisor share classes
See the inside front cover for important information about access to your fund’s shareholder reports.
Beginning on January 1, 2021, as permitted by regulations adopted by the Securities and Exchange Commission, paper copies of a fund’s shareholder reports will no longer be sent by mail, unless you specifically request paper copies of the reports from the fund or from your financial intermediary, such as a financial advisor, broker-dealer or bank. Instead, the reports will be made available on a website, and you will be notified by mail each time a report is posted and provided with a website link to access the report.
If you already elected to receive shareholder reports electronically, you will not be affected by this change and you need not take any action. You may elect to receive shareholder reports and other communications from a fund electronically, by contacting your financial intermediary. For Fidelity customers, visit Fidelity's web site or call Fidelity using the contact information listed below.
You may elect to receive all future reports in paper free of charge. If you wish to continue receiving paper copies of your shareholder reports, you may contact your financial intermediary or, if you are a Fidelity customer, visit Fidelity’s website, or call Fidelity at the applicable toll-free number listed below. Your election to receive reports in paper will apply to all funds held with the fund complex/your financial intermediary.
| Account Type | Website | Phone Number |
| Brokerage, Mutual Fund, or Annuity Contracts: | fidelity.com/mailpreferences | 1-800-343-3548 |
| Employer Provided Retirement Accounts: | netbenefits.fidelity.com/preferences (choose 'no' under Required Disclosures to continue to print) | 1-800-343-0860 |
| Advisor Sold Accounts Serviced Through Your Financial Intermediary: | Contact Your Financial Intermediary | Your Financial Intermediary's phone number |
| Advisor Sold Accounts Serviced by Fidelity: | institutional.fidelity.com | 1-877-208-0098 |
Contents
To view a fund's proxy voting guidelines and proxy voting record for the 12-month period ended June 30, visit http://www.fidelity.com/proxyvotingresults or visit the Securities and Exchange Commission's (SEC) web site at http://www.sec.gov.
You may also call 1-800-544-8544 if you’re an individual investing directly with Fidelity, call 1-800-835-5092 if you’re a plan sponsor or participant with Fidelity as your recordkeeper or call 1-877-208-0098 on institutional accounts or if you’re an advisor or invest through one to request a free copy of the proxy voting guidelines.
Standard & Poor's, S&P and S&P 500 are registered service marks of The McGraw-Hill Companies, Inc. and have been licensed for use by Fidelity Distributors Corporation.
Other third-party marks appearing herein are the property of their respective owners.
All other marks appearing herein are registered or unregistered trademarks or service marks of FMR LLC or an affiliated company. © 2020 FMR LLC. All rights reserved.
This report and the financial statements contained herein are submitted for the general information of the shareholders of the Fund. This report is not authorized for distribution to prospective investors in the Fund unless preceded or accompanied by an effective prospectus.
A fund files its complete schedule of portfolio holdings with the SEC for the first and third quarters of each fiscal year on Form N-PORT. Forms N-PORT are available on the SEC’s web site at http://www.sec.gov. A fund's Forms N-PORT may be reviewed and copied at the SEC’s Public Reference Room in Washington, DC. Information regarding the operation of the SEC's Public Reference Room may be obtained by calling 1-800-SEC-0330.
For a complete list of a fund's portfolio holdings, view the most recent holdings listing, semiannual report, or annual report on Fidelity's web site at http://www.fidelity.com, http://www.institutional.fidelity.com, or http://www.401k.com, as applicable.
NOT FDIC INSURED •MAY LOSE VALUE •NO BANK GUARANTEE
Neither the Fund nor Fidelity Distributors Corporation is a bank.
Note to Shareholders:
Early in 2020, the outbreak and spread of a new coronavirus emerged as a public health emergency that had a major influence on financial markets, primarily based on its impact on the global economy and the outlook for corporate earnings. The virus causes a respiratory disease known as COVID-19. On March 11, the World Health Organization declared the COVID-19 outbreak a pandemic, citing sustained risk of further global spread.
In the weeks following, as the crisis worsened, we witnessed an escalating human tragedy with wide-scale social and economic consequences from coronavirus-containment measures. The outbreak of COVID-19 prompted a number of measures to limit the spread, including travel and border restrictions, quarantines, and restrictions on large gatherings. In turn, these resulted in lower consumer activity, diminished demand for a wide range of products and services, disruption in manufacturing and supply chains, and – given the wide variability in outcomes regarding the outbreak – significant market uncertainty and volatility. Amid the turmoil, the U.S. government took unprecedented action – in concert with the U.S. Federal Reserve and central banks around the world – to help support consumers, businesses, and the broader economy, and to limit disruption to the financial system.
The situation continues to unfold, and the extent and duration of its impact on financial markets and the economy remain highly uncertain. Extreme events such as the coronavirus crisis are “exogenous shocks” that can have significant adverse effects on mutual funds and their investments. Although multiple asset classes may be affected by market disruption, the duration and impact may not be the same for all types of assets.
Fidelity is committed to helping you stay informed amid news about COVID-19 and during increased market volatility, and we’re taking extra steps to be responsive to customer needs. We encourage you to visit our websites, where we offer ongoing updates, commentary, and analysis on the markets and our funds.
Performance: The Bottom Line
Average annual total return reflects the change in the value of an investment, assuming reinvestment of distributions from dividend income and capital gains (the profits earned upon the sale of securities that have grown in value, if any) and assuming a constant rate of performance each year. The hypothetical investment and the average annual total returns do not reflect the deduction of taxes that a shareholder would pay on fund distributions or the redemption of fund shares. During periods of reimbursement by Fidelity, a fund’s total return will be greater than it would be had the reimbursement not occurred. How a fund did yesterday is no guarantee of how it will do tomorrow.
Average Annual Total Returns
| For the periods ended July 31, 2020 | Past 1 year | Past 5 years | Past 10 years |
| Class A (incl. 5.75% sales charge) | (18.09)% | 0.57% | 7.49% |
| Class M (incl. 3.50% sales charge) | (16.33)% | 0.79% | 7.49% |
| Class C (incl. contingent deferred sales charge) | (14.57)% | 0.98% | 7.32% |
| Fidelity® Small Cap Value Fund | (12.88)% | 2.01% | 8.43% |
| Class I | (12.82)% | 2.03% | 8.43% |
| Class Z | (12.73)% | 2.09% | 8.46% |
Class C shares' contingent deferred sales charges included in the past one year, past five years and past ten years total return figures are 1%, 0% and 0%, respectively.
The initial offering of Class Z shares took place on October 2, 2018. Returns prior to October 2, 2018, are those of Class I.
$10,000 Over 10 Years
Let's say hypothetically that $10,000 was invested in Fidelity® Small Cap Value Fund, a class of the fund, on July 31, 2010.
The chart shows how the value of your investment would have changed, and also shows how the Russell 2000® Value Index performed over the same period.
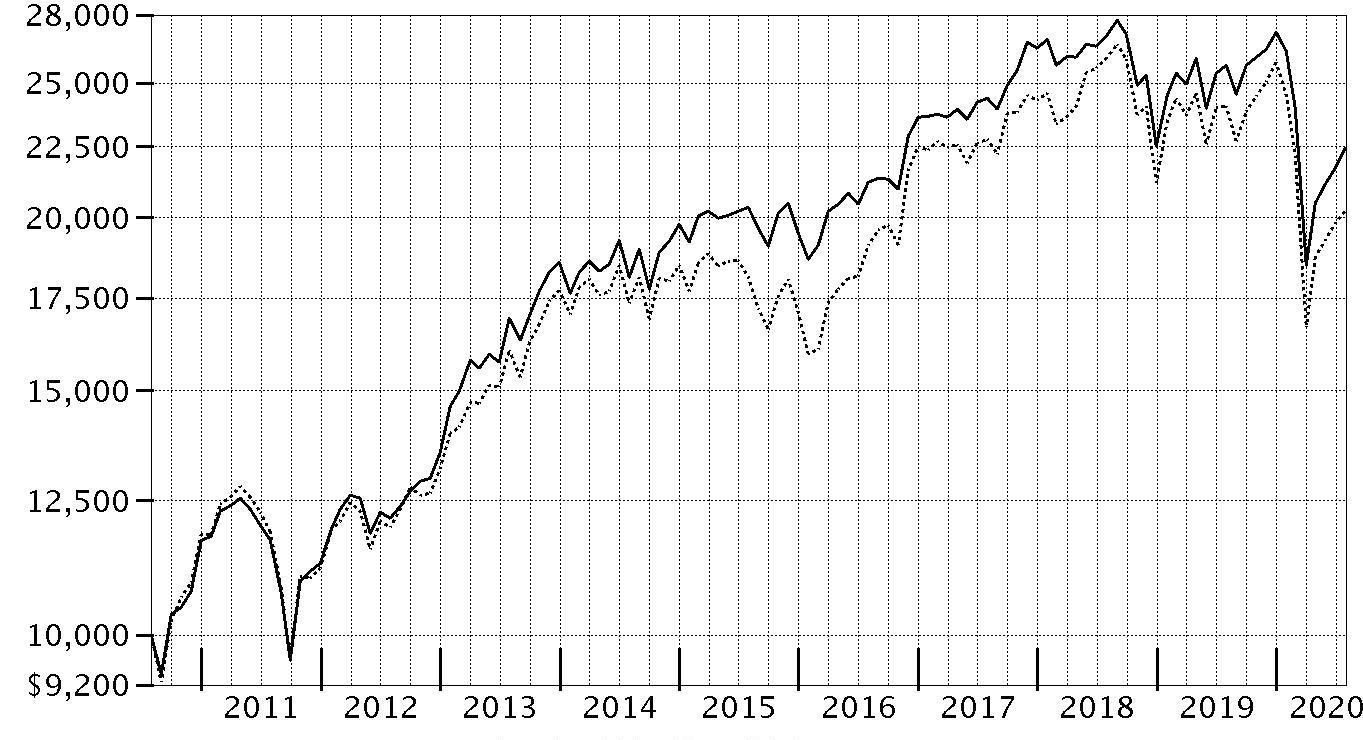
| Period Ending Values |
| $22,457 | Fidelity® Small Cap Value Fund |
| $20,227 | Russell 2000® Value Index |
Management's Discussion of Fund Performance
Market Recap: The S&P 500
® index gained 11.96% for the 12 months ending July 31, 2020, in what was a bumpy ride for U.S. equity investors, marked by a steep but brief decline due to the early-2020 outbreak and spread of the coronavirus, followed by a historic rebound. Declared a pandemic on March 11, the COVID-19 crisis and containment efforts caused broad contraction in economic activity, along with extreme uncertainty, volatility and dislocation in financial markets. By mid-March, U.S. stocks entered bear-market territory less than a month after hitting an all-time high and extending the longest-running bull market in American history. Stocks slid in late February, after a surge in COVID-19 cases outside China. The sudden downtrend continued in March (-12%), capping the index’s worst quarter since 2008. A historically rapid and expansive U.S. monetary/fiscal-policy response provided a partial offset to the economic disruption and fueled a sharp uptrend. Aggressive support for financial markets by the U.S. Federal Reserve, plans for reopening the economy and improving infection data boosted stocks in April (+13%) and May (+5%). In June and July, the index gained amid progress on potential treatments and signs of an early recovery in economic activity. For the full 12 months, growth stocks widely topped value, while large-caps handily bested smaller-caps. The information technology sector (+39%) led the way, followed by consumer discretionary (+22%). In contrast, energy (-38%) fell hard along with the price of crude oil.
Comments from Portfolio Manager Clint Lawrence: For the fiscal year ending July 31, 2020, the fund's share classes returned about -13% to -14%, outperforming the -15.91% result of the benchmark Russell 2000 Value Index. The top contributor to performance versus the benchmark was stock selection in financials. Security selection in real estate and industrials also lifted performance. The fund's biggest individual relative contributor was our overweighting in BJ's Wholesale Club, which gained approximately 29%. This is a position that was sold the past year. The fund's non-benchmark stake in Synnex gained about 25%. We decreased our stake in the company the past 12 months. Another top relative contributor was an out-of-benchmark stake in Schneider National (+33%). We added to our position in the company the past 12 months. The fund's roughly 1% stake in cash, on average, also helped in a down market. Conversely, the primary detractor from performance versus the benchmark was stock selection in consumer discretionary. Also hampering the fund's relative result was security selection in energy. Stock picking and an underweighting in the health care sector, primarily within the pharmaceuticals, biotechnology & life sciences industry, further hindered relative results. Our non-benchmark stake in Viper Energy Partners was the fund's largest individual relative detractor, due to its -75% result. The position in Viper Energy Partners was sold the past year. Another notable relative detractor was an out-of-benchmark stake in Shawcor (-86%). This position was not held at the end of the period. Also hindering performance was our outsized stake in Titan Machinery, which returned -62%. Titan Machinery was not held at period end. Notable changes in positioning include a higher allocation to the consumer discretionary and industrials sectors.
The views expressed above reflect those of the portfolio manager(s) only through the end of the period as stated on the cover of this report and do not necessarily represent the views of Fidelity or any other person in the Fidelity organization. Any such views are subject to change at any time based upon market or other conditions and Fidelity disclaims any responsibility to update such views. These views may not be relied on as investment advice and, because investment decisions for a Fidelity fund are based on numerous factors, may not be relied on as an indication of trading intent on behalf of any Fidelity fund.
Note to shareholders: On July 1, 2020, Derek Janssen came off the fund, leaving Clint Lawrence as sole manager.
Investment Summary (Unaudited)
Top Ten Stocks as of July 31, 2020
| | % of fund's net assets |
| KB Home | 2.2 |
| SPX Flow, Inc. | 2.1 |
| TRI Pointe Homes, Inc. | 2.1 |
| The Bank of NT Butterfield & Son Ltd. | 2.0 |
| Potlatch Corp. | 2.0 |
| Signature Bank | 1.9 |
| Valvoline, Inc. | 1.8 |
| Enstar Group Ltd. | 1.9 |
| Jeld-Wen Holding, Inc. | 1.8 |
| U.S. Foods Holding Corp. | 1.8 |
| | 19.6 |
Top Five Market Sectors as of July 31, 2020
| | % of fund's net assets |
| Financials | 28.4 |
| Industrials | 17.6 |
| Consumer Discretionary | 14.7 |
| Materials | 8.3 |
| Information Technology | 8.1 |
Asset Allocation (% of fund's net assets)
| As of July 31, 2020 * |
| | Stocks | 97.7% |
| | Short-Term Investments and Net Other Assets (Liabilities) | 2.3% |

* Foreign investments - 19.6%
Schedule of Investments July 31, 2020
Showing Percentage of Net Assets
| Common Stocks - 97.7% | | | |
| | | Shares | Value |
| COMMUNICATION SERVICES - 2.0% | | | |
| Entertainment - 0.5% | | | |
| Cinemark Holdings, Inc. (a) | | 656,200 | $7,762,846 |
| Media - 1.5% | | | |
| Nexstar Broadcasting Group, Inc. Class A | | 298,500 | 26,163,525 |
|
| TOTAL COMMUNICATION SERVICES | | | 33,926,371 |
|
| CONSUMER DISCRETIONARY - 14.7% | | | |
| Auto Components - 1.5% | | | |
| Lear Corp. | | 60,100 | 6,633,838 |
| Standard Motor Products, Inc. | | 428,942 | 19,508,282 |
| | | | 26,142,120 |
| Hotels, Restaurants & Leisure - 2.6% | | | |
| Hilton Grand Vacations, Inc. (b) | | 1,214,900 | 24,662,470 |
| International Game Technology PLC (a) | | 1,986,500 | 19,586,890 |
| | | | 44,249,360 |
| Household Durables - 4.3% | | | |
| KB Home | | 1,125,900 | 37,875,276 |
| TRI Pointe Homes, Inc. (b) | | 2,089,600 | 34,938,112 |
| | | | 72,813,388 |
| Leisure Products - 1.1% | | | |
| BRP, Inc. | | 336,200 | 15,059,913 |
| Callaway Golf Co. | | 179,933 | 3,427,724 |
| | | | 18,487,637 |
| Specialty Retail - 2.8% | | | |
| Bed Bath & Beyond, Inc. (a) | | 2,040,100 | 22,073,882 |
| Rent-A-Center, Inc. | | 253,900 | 7,342,788 |
| Williams-Sonoma, Inc. (a) | | 205,600 | 17,911,872 |
| | | | 47,328,542 |
| Textiles, Apparel & Luxury Goods - 2.4% | | | |
| Oxford Industries, Inc. | | 378,700 | 16,261,378 |
| Tapestry, Inc. | | 1,824,000 | 24,368,640 |
| | | | 40,630,018 |
|
| TOTAL CONSUMER DISCRETIONARY | | | 249,651,065 |
|
| CONSUMER STAPLES - 2.5% | | | |
| Food & Staples Retailing - 1.8% | | | |
| U.S. Foods Holding Corp. (b) | | 1,505,600 | 30,563,680 |
| Food Products - 0.7% | | | |
| Nomad Foods Ltd. (b) | | 512,000 | 11,806,720 |
|
| TOTAL CONSUMER STAPLES | | | 42,370,400 |
|
| ENERGY - 2.4% | | | |
| Oil, Gas & Consumable Fuels - 2.4% | | | |
| Brigham Minerals, Inc. Class A | | 855,700 | 9,481,156 |
| BW Energy Ltd. | | 2,403,500 | 4,534,034 |
| Euronav NV | | 842,000 | 8,243,180 |
| Renewable Energy Group, Inc. (b) | | 391,500 | 10,797,570 |
| WPX Energy, Inc. (b) | | 1,157,900 | 6,912,663 |
| | | | 39,968,603 |
| FINANCIALS - 28.4% | | | |
| Banks - 15.0% | | | |
| BankUnited, Inc. | | 484,601 | 9,759,864 |
| Camden National Corp. | | 187,830 | 5,952,333 |
| Citizens Financial Group, Inc. | | 736,900 | 18,282,489 |
| Comerica, Inc. | | 580,400 | 22,357,008 |
| Cullen/Frost Bankers, Inc. (a) | | 392,200 | 28,261,932 |
| First Citizens Bancshares, Inc. | | 17,424 | 7,420,359 |
| Hanmi Financial Corp. | | 859,209 | 7,930,499 |
| Signature Bank | | 312,300 | 32,020,119 |
| Sterling Bancorp | | 1,986,100 | 22,343,625 |
| Synovus Financial Corp. | | 1,303,500 | 26,265,525 |
| The Bank of NT Butterfield & Son Ltd. | | 1,313,600 | 34,193,008 |
| Trico Bancshares | | 714,897 | 20,017,116 |
| Western Alliance Bancorp. | | 533,400 | 19,175,730 |
| | | | 253,979,607 |
| Capital Markets - 3.6% | | | |
| Affiliated Managers Group, Inc. | | 67,900 | 4,670,841 |
| AllianceBernstein Holding LP | | 930,800 | 26,444,028 |
| BrightSphere Investment Group, Inc. | | 1,040,199 | 13,980,275 |
| Lazard Ltd. Class A | | 522,500 | 15,319,700 |
| | | | 60,414,844 |
| Consumer Finance - 1.2% | | | |
| Encore Capital Group, Inc. (a)(b) | | 549,000 | 20,054,970 |
| Diversified Financial Services - 1.3% | | | |
| ECN Capital Corp. | | 6,414,251 | 22,602,758 |
| Insurance - 7.3% | | | |
| Axis Capital Holdings Ltd. | | 760,900 | 30,527,308 |
| Enstar Group Ltd. (b) | | 187,496 | 31,489,953 |
| First American Financial Corp. | | 326,575 | 16,658,591 |
| Old Republic International Corp. | | 1,707,200 | 27,434,704 |
| Primerica, Inc. | | 145,100 | 17,362,666 |
| | | | 123,473,222 |
|
| TOTAL FINANCIALS | | | 480,525,401 |
|
| HEALTH CARE - 4.4% | | | |
| Health Care Providers & Services - 1.8% | | | |
| Premier, Inc. (b) | | 746,977 | 26,121,786 |
| Universal Health Services, Inc. Class B | | 35,200 | 3,868,480 |
| | | | 29,990,266 |
| Health Care Technology - 1.6% | | | |
| Cegedim SA (b) | | 870,113 | 27,878,629 |
| Pharmaceuticals - 1.0% | | | |
| Jazz Pharmaceuticals PLC (b) | | 151,500 | 16,399,875 |
|
| TOTAL HEALTH CARE | | | 74,268,770 |
|
| INDUSTRIALS - 17.6% | | | |
| Building Products - 3.3% | | | |
| American Woodmark Corp. (b) | | 139,900 | 11,278,738 |
| Jeld-Wen Holding, Inc. (b) | | 1,595,800 | 31,277,680 |
| Owens Corning | | 221,600 | 13,400,152 |
| | | | 55,956,570 |
| Commercial Services & Supplies - 1.1% | | | |
| HNI Corp. | | 359,200 | 10,668,240 |
| Knoll, Inc. | | 715,200 | 8,374,992 |
| | | | 19,043,232 |
| Construction & Engineering - 2.5% | | | |
| AECOM (b) | | 762,100 | 27,580,399 |
| Arcosa, Inc. | | 226,100 | 9,545,942 |
| Argan, Inc. (a) | | 134,597 | 5,774,211 |
| | | | 42,900,552 |
| Electrical Equipment - 1.8% | | | |
| Regal Beloit Corp. | | 327,968 | 30,163,217 |
| Machinery - 4.2% | | | |
| ITT, Inc. | | 344,900 | 19,911,077 |
| Luxfer Holdings PLC sponsored | | 1,191,600 | 15,133,320 |
| SPX Flow, Inc. (b) | | 893,800 | 35,823,504 |
| | | | 70,867,901 |
| Professional Services - 1.5% | | | |
| Kelly Services, Inc. Class A (non-vtg.) | | 595,500 | 8,819,355 |
| Manpower, Inc. | | 232,000 | 15,959,280 |
| | | | 24,778,635 |
| Road & Rail - 1.8% | | | |
| ArcBest Corp. | | 217,200 | 6,600,708 |
| Knight-Swift Transportation Holdings, Inc. Class A (a) | | 217,500 | 9,459,075 |
| Schneider National, Inc. Class B | | 559,700 | 14,065,261 |
| | | | 30,125,044 |
| Trading Companies & Distributors - 1.4% | | | |
| AerCap Holdings NV (b) | | 404,500 | 10,893,185 |
| Beacon Roofing Supply, Inc. (b) | | 424,800 | 13,236,768 |
| | | | 24,129,953 |
|
| TOTAL INDUSTRIALS | | | 297,965,104 |
|
| INFORMATION TECHNOLOGY - 8.1% | | | |
| Electronic Equipment & Components - 4.7% | | | |
| Avnet, Inc. | | 222,500 | 5,945,200 |
| Insight Enterprises, Inc. (b) | | 254,400 | 12,679,296 |
| Jabil, Inc. | | 797,700 | 27,807,822 |
| SYNNEX Corp. | | 110,860 | 13,828,676 |
| TTM Technologies, Inc. (b) | | 1,560,700 | 19,212,217 |
| | | | 79,473,211 |
| IT Services - 1.1% | | | |
| Perspecta, Inc. | | 593,900 | 12,709,460 |
| Unisys Corp. (a)(b) | | 501,400 | 5,961,646 |
| | | | 18,671,106 |
| Semiconductors & Semiconductor Equipment - 0.7% | | | |
| Kulicke & Soffa Industries, Inc. | | 501,500 | 11,885,550 |
| Software - 1.6% | | | |
| Xperi Holding Corp. | | 1,513,601 | 27,910,802 |
|
| TOTAL INFORMATION TECHNOLOGY | | | 137,940,669 |
|
| MATERIALS - 8.3% | | | |
| Chemicals - 2.8% | | | |
| Olin Corp. | | 427,276 | 4,802,582 |
| Valvoline, Inc. | | 1,540,000 | 31,600,800 |
| Westlake Chemical Corp. (a) | | 220,000 | 11,990,000 |
| | | | 48,393,382 |
| Construction Materials - 0.6% | | | |
| Eagle Materials, Inc. | | 118,100 | 9,475,163 |
| Containers & Packaging - 3.3% | | | |
| Ardagh Group SA | | 1,843,055 | 25,083,979 |
| O-I Glass, Inc. | | 1,650,000 | 17,226,000 |
| WestRock Co. | | 500,400 | 13,440,744 |
| | | | 55,750,723 |
| Metals & Mining - 1.6% | | | |
| Commercial Metals Co. | | 855,800 | 17,697,944 |
| Highland Gold Mining Ltd. | | 2,247,700 | 8,709,028 |
| | | | 26,406,972 |
|
| TOTAL MATERIALS | | | 140,026,240 |
|
| REAL ESTATE - 6.7% | | | |
| Equity Real Estate Investment Trusts (REITs) - 4.5% | | | |
| Corporate Office Properties Trust (SBI) | | 560,400 | 14,839,392 |
| Equity Commonwealth | | 185,400 | 5,853,078 |
| Potlatch Corp. | | 777,000 | 33,263,370 |
| RLJ Lodging Trust | | 2,633,300 | 21,092,733 |
| | | | 75,048,573 |
| Real Estate Management & Development - 2.2% | | | |
| DIC Asset AG | | 2,221,200 | 28,781,088 |
| DIC Asset AG rights (b)(c) | | 2,221,200 | 1,334,396 |
| Jones Lang LaSalle, Inc. | | 76,900 | 7,606,179 |
| | | | 37,721,663 |
|
| TOTAL REAL ESTATE | | | 112,770,236 |
|
| UTILITIES - 2.6% | | | |
| Electric Utilities - 0.7% | | | |
| Portland General Electric Co. | | 259,500 | 11,451,735 |
| Gas Utilities - 1.1% | | | |
| ONE Gas, Inc. | | 108,400 | 8,205,880 |
| Spire, Inc. | | 119,900 | 7,393,034 |
| Towngas China Co. Ltd. | | 8,525,000 | 4,102,841 |
| | | | 19,701,755 |
| Independent Power and Renewable Electricity Producers - 0.8% | | | |
| Clearway Energy, Inc. Class C | | 561,000 | 13,766,940 |
|
| TOTAL UTILITIES | | | 44,920,430 |
|
| TOTAL COMMON STOCKS | | | |
| (Cost $1,558,992,943) | | | 1,654,333,289 |
|
| Money Market Funds - 4.5% | | | |
| Fidelity Cash Central Fund 0.14% (d) | | 2,702,169 | 2,702,979 |
| Fidelity Securities Lending Cash Central Fund 0.13% (d)(e) | | 73,341,523 | 73,348,857 |
| TOTAL MONEY MARKET FUNDS | | | |
| (Cost $76,051,836) | | | 76,051,836 |
| TOTAL INVESTMENT IN SECURITIES - 102.2% | | | |
| (Cost $1,635,044,779) | | | 1,730,385,125 |
| NET OTHER ASSETS (LIABILITIES) - (2.2)% | | | (37,099,908) |
| NET ASSETS - 100% | | | $1,693,285,217 |
Legend
(a) Security or a portion of the security is on loan at period end.
(b) Non-income producing
(c) Security or a portion of the security purchased on a delayed delivery or when-issued basis.
(d) Affiliated fund that is generally available only to investment companies and other accounts managed by Fidelity Investments. The rate quoted is the annualized seven-day yield of the fund at period end. A complete unaudited listing of the fund's holdings as of its most recent quarter end is available upon request. In addition, each Fidelity Central Fund's financial statements, which are not covered by the Fund's Report of Independent Registered Public Accounting Firm, are available on the SEC's website or upon request.
(e) Investment made with cash collateral received from securities on loan.
Affiliated Central Funds
Information regarding fiscal year to date income earned by the Fund from investments in Fidelity Central Funds is as follows:
| Fund | Income earned |
| Fidelity Cash Central Fund | $302,894 |
| Fidelity Securities Lending Cash Central Fund | 87,444 |
| Total | $390,338 |
Amounts in the income column in the above table include any capital gain distributions from underlying funds, which are presented in the corresponding line-item in the Statement of Operations, if applicable. Amount for Fidelity Securities Lending Cash Central Fund represents the income earned on investing cash collateral, less rebates paid to borrowers and any lending agent fees associated with the loan, plus any premium payments received for lending certain types of securities.
Other Affiliated Issuers
An affiliated company is a company in which the Fund has ownership of at least 5% of the voting securities. Fiscal year to date transactions with companies which are or were affiliates are as follows:
| Affiliate | Value, beginning of period | Purchases | Sales Proceeds | Dividend Income | Realized Gain (loss) | Change in Unrealized appreciation (depreciation) | Value, end of period |
| Titan Machinery, Inc. | $24,865,352 | $983,407 | $14,911,090 | $-- | $(8,386,002) | $(2,551,667) | $-- |
| Total | $24,865,352 | $983,407 | $14,911,090 | $-- | $(8,386,002) | $(2,551,667) | $-- |
Investment Valuation
The following is a summary of the inputs used, as of July 31, 2020, involving the Fund's assets and liabilities carried at fair value. The inputs or methodology used for valuing securities may not be an indication of the risk associated with investing in those securities. For more information on valuation inputs, and their aggregation into the levels used below, please refer to the Investment Valuation section in the accompanying Notes to Financial Statements.
| | Valuation Inputs at Reporting Date: |
| Description | Total | Level 1 | Level 2 | Level 3 |
| Investments in Securities: | | | | |
| Equities: | | | | |
| Communication Services | $33,926,371 | $33,926,371 | $-- | $-- |
| Consumer Discretionary | 249,651,065 | 249,651,065 | -- | -- |
| Consumer Staples | 42,370,400 | 42,370,400 | -- | -- |
| Energy | 39,968,603 | 39,968,603 | -- | -- |
| Financials | 480,525,401 | 480,525,401 | -- | -- |
| Health Care | 74,268,770 | 74,268,770 | -- | -- |
| Industrials | 297,965,104 | 297,965,104 | -- | -- |
| Information Technology | 137,940,669 | 137,940,669 | -- | -- |
| Materials | 140,026,240 | 140,026,240 | -- | -- |
| Real Estate | 112,770,236 | 112,770,236 | -- | -- |
| Utilities | 44,920,430 | 44,920,430 | -- | -- |
| Money Market Funds | 76,051,836 | 76,051,836 | -- | -- |
| Total Investments in Securities: | $1,730,385,125 | $1,730,385,125 | $-- | $-- |
Other Information
Distribution of investments by country or territory of incorporation, as a percentage of Total Net Assets, is as follows (Unaudited):
| United States of America | 80.4% |
| Bermuda | 6.6% |
| Canada | 2.2% |
| United Kingdom | 2.1% |
| Germany | 1.8% |
| France | 1.6% |
| Luxembourg | 1.5% |
| Ireland | 1.0% |
| Others (Individually Less Than 1%) | 2.8% |
| | 100.0% |
See accompanying notes which are an integral part of the financial statements.
Financial Statements
Statement of Assets and Liabilities
| | | July 31, 2020 |
| Assets | | |
Investment in securities, at value (including securities loaned of $70,588,890) — See accompanying schedule:
Unaffiliated issuers (cost $1,558,992,943) | $1,654,333,289 | |
| Fidelity Central Funds (cost $76,051,836) | 76,051,836 | |
| Total Investment in Securities (cost $1,635,044,779) | | $1,730,385,125 |
| Receivable for investments sold | | 37,598,760 |
| Receivable for fund shares sold | | 1,660,209 |
| Dividends receivable | | 3,076,681 |
| Distributions receivable from Fidelity Central Funds | | 48,313 |
| Prepaid expenses | | 323 |
| Other receivables | | 185,808 |
| Total assets | | 1,772,955,219 |
| Liabilities | | |
| Payable for investments purchased | | |
| Regular delivery | $1,588,604 | |
| Delayed delivery | 1,334,396 | |
| Payable for fund shares redeemed | 1,890,859 | |
| Accrued management fee | 1,073,280 | |
| Distribution and service plan fees payable | 47,799 | |
| Other affiliated payables | 314,589 | |
| Other payables and accrued expenses | 77,200 | |
| Collateral on securities loaned | 73,343,275 | |
| Total liabilities | | 79,670,002 |
| Net Assets | | $1,693,285,217 |
| Net Assets consist of: | | |
| Paid in capital | | $1,838,878,881 |
| Total accumulated earnings (loss) | | (145,593,664) |
| Net Assets | | $1,693,285,217 |
| Net Asset Value and Maximum Offering Price | | |
| Class A: | | |
| Net Asset Value and redemption price per share ($101,675,234 ÷ 8,247,489 shares)(a) | | $12.33 |
| Maximum offering price per share (100/94.25 of $12.33) | | $13.08 |
| Class M: | | |
| Net Asset Value and redemption price per share ($38,048,675 ÷ 3,189,691 shares)(a) | | $11.93 |
| Maximum offering price per share (100/96.50 of $11.93) | | $12.36 |
| Class C: | | |
| Net Asset Value and offering price per share ($13,747,996 ÷ 1,277,437 shares)(a) | | $10.76 |
| Small Cap Value: | | |
| Net Asset Value, offering price and redemption price per share ($1,231,427,239 ÷ 97,384,578 shares) | | $12.64 |
| Class I: | | |
| Net Asset Value, offering price and redemption price per share ($214,537,553 ÷ 16,959,832 shares) | | $12.65 |
| Class Z: | | |
| Net Asset Value, offering price and redemption price per share ($93,848,520 ÷ 7,419,424 shares) | | $12.65 |
(a) Redemption price per share is equal to net asset value less any applicable contingent deferred sales charge.
See accompanying notes which are an integral part of the financial statements.
Statement of Operations
| | | Year ended July 31, 2020 |
| Investment Income | | |
| Dividends | | $37,145,022 |
| Interest | | 3,871 |
| Income from Fidelity Central Funds (including $87,444 from security lending) | | 390,338 |
| Total income | | 37,539,231 |
| Expenses | | |
| Management fee | | |
| Basic fee | $12,616,317 | |
| Performance adjustment | 616,588 | |
| Transfer agent fees | 3,464,157 | |
| Distribution and service plan fees | 680,042 | |
| Accounting fees | 564,902 | |
| Custodian fees and expenses | 56,300 | |
| Independent trustees' fees and expenses | 11,940 | |
| Registration fees | 133,060 | |
| Audit | 59,629 | |
| Legal | 5,956 | |
| Interest | 1,217 | |
| Miscellaneous | 49,914 | |
| Total expenses before reductions | 18,260,022 | |
| Expense reductions | (391,548) | |
| Total expenses after reductions | | 17,868,474 |
| Net investment income (loss) | | 19,670,757 |
| Realized and Unrealized Gain (Loss) | | |
| Net realized gain (loss) on: | | |
| Investment securities: | | |
| Unaffiliated issuers | (215,615,427) | |
| Fidelity Central Funds | 12,515 | |
| Other affiliated issuers | (8,386,002) | |
| Foreign currency transactions | (8,104) | |
| Total net realized gain (loss) | | (223,997,018) |
| Change in net unrealized appreciation (depreciation) on: | | |
| Investment securities: | | |
| Unaffiliated issuers | (45,132,235) | |
| Affiliated issuers | (2,551,667) | |
| Assets and liabilities in foreign currencies | 5,239 | |
| Total change in net unrealized appreciation (depreciation) | | (47,678,663) |
| Net gain (loss) | | (271,675,681) |
| Net increase (decrease) in net assets resulting from operations | | $(252,004,924) |
See accompanying notes which are an integral part of the financial statements.
Statement of Changes in Net Assets
| | Year ended July 31, 2020 | Year ended July 31, 2019 |
| Increase (Decrease) in Net Assets | | |
| Operations | | |
| Net investment income (loss) | $19,670,757 | $25,033,624 |
| Net realized gain (loss) | (223,997,018) | 181,039,028 |
| Change in net unrealized appreciation (depreciation) | (47,678,663) | (337,584,395) |
| Net increase (decrease) in net assets resulting from operations | (252,004,924) | (131,511,743) |
| Distributions to shareholders | (73,266,231) | (631,100,390) |
| Share transactions - net increase (decrease) | (66,967,350) | 59,792,211 |
| Total increase (decrease) in net assets | (392,238,505) | (702,819,922) |
| Net Assets | | |
| Beginning of period | 2,085,523,722 | 2,788,343,644 |
| End of period | $1,693,285,217 | $2,085,523,722 |
See accompanying notes which are an integral part of the financial statements.
Financial Highlights
Fidelity Small Cap Value Fund Class A
| Years ended July 31, | 2020 | 2019 | 2018 | 2017 | 2016 |
| Selected Per–Share Data | | | | | |
| Net asset value, beginning of period | $14.68 | $20.33 | $19.05 | $17.92 | $19.14 |
| Income from Investment Operations | | | | | |
| Net investment income (loss)A | .11 | .14B | .10C | .20D | .07 |
| Net realized and unrealized gain (loss) | (1.96) | (.98) | 1.87 | 2.23 | .56 |
| Total from investment operations | (1.85) | (.84) | 1.97 | 2.43 | .63 |
| Distributions from net investment income | (.09) | (.10) | (.17) | (.10) | (.11) |
| Distributions from net realized gain | (.41) | (4.71) | (.52) | (1.20) | (1.75) |
| Total distributions | (.50) | (4.81) | (.69) | (1.30) | (1.85)E |
| Redemption fees added to paid in capitalA | – | – | –F | –F | –F |
| Net asset value, end of period | $12.33 | $14.68 | $20.33 | $19.05 | $17.92 |
| Total ReturnG,H | (13.09)% | (4.85)% | 10.65% | 14.61% | 4.07% |
| Ratios to Average Net AssetsI,J | | | | | |
| Expenses before reductions | 1.22% | .92% | 1.18% | 1.24% | 1.41% |
| Expenses net of fee waivers, if any | 1.22% | .92% | 1.17% | 1.24% | 1.41% |
| Expenses net of all reductions | 1.20% | .91% | 1.17% | 1.24% | 1.41% |
| Net investment income (loss) | .84% | .91%B | .49%C | 1.10%D | .43% |
| Supplemental Data | | | | | |
| Net assets, end of period (000 omitted) | $101,675 | $129,115 | $162,572 | $184,306 | $218,364 |
| Portfolio turnover rateK | 109% | 79% | 55% | 26% | 33% |
A Calculated based on average shares outstanding during the period.
B Net investment income per share reflects a large, non-recurring dividend which amounted to $.03 per share. Excluding this non-recurring dividend, the ratio of net investment income (loss) to average net assets would have been .71%.
C Net investment income per share reflects a large, non-recurring dividend which amounted to $.04 per share. Excluding this non-recurring dividend, the ratio of net investment income (loss) to average net assets would have been .29%.
D Net investment income per share reflects a large, non-recurring dividend which amounted to $.09 per share. Excluding this non-recurring dividend, the ratio of net investment income (loss) to average net assets would have been .61%.
E Total distributions of $1.85 per share is comprised of distributions from net investment income of $.105 and distributions from net realized gain of $1.747 per share.
F Amount represents less than $.005 per share.
G Total returns would have been lower if certain expenses had not been reduced during the applicable periods shown.
H Total returns do not include the effect of the sales charges.
I Fees and expenses of any underlying mutual funds or exchange-traded funds (ETFs) are not included in the Fund's expense ratio. The Fund indirectly bears its proportionate share of these expenses. For additional expense information related to investments in Fidelity Central Funds, please refer to the "Investments in Fidelity Central Funds" note found in the Notes to Financial Statements section of the most recent Annual or Semi-Annual report.
J Expense ratios reflect operating expenses of the class. Expenses before reductions do not reflect amounts reimbursed by the investment adviser or reductions from brokerage service arrangements or reductions from other expense offset arrangements and do not represent the amount paid by the class during periods when reimbursements or reductions occur. Expenses net of fee waivers reflect expenses after reimbursement by the investment adviser but prior to reductions from brokerage service arrangements or other expense offset arrangements. Expenses net of all reductions represent the net expenses paid by the class.
K Amount does not include the portfolio activity of any underlying Fidelity Central Funds.
See accompanying notes which are an integral part of the financial statements.
Fidelity Small Cap Value Fund Class M
| Years ended July 31, | 2020 | 2019 | 2018 | 2017 | 2016 |
| Selected Per–Share Data | | | | | |
| Net asset value, beginning of period | $14.22 | $19.84 | $18.61 | $17.54 | $18.78 |
| Income from Investment Operations | | | | | |
| Net investment income (loss)A | .08 | .10B | .05C | .15D | .03 |
| Net realized and unrealized gain (loss) | (1.91) | (.96) | 1.82 | 2.18 | .54 |
| Total from investment operations | (1.83) | (.86) | 1.87 | 2.33 | .57 |
| Distributions from net investment income | (.05) | (.05) | (.13) | (.07) | (.06) |
| Distributions from net realized gain | (.41) | (4.71) | (.52) | (1.20) | (1.75) |
| Total distributions | (.46) | (4.76) | (.64)E | (1.26)F | (1.81) |
| Redemption fees added to paid in capitalA | – | – | –G | –G | –G |
| Net asset value, end of period | $11.93 | $14.22 | $19.84 | $18.61 | $17.54 |
| Total ReturnH,I | (13.29)% | (5.08)% | 10.39% | 14.35% | 3.76% |
| Ratios to Average Net AssetsJ,K | | | | | |
| Expenses before reductions | 1.46% | 1.17% | 1.42% | 1.49% | 1.66% |
| Expenses net of fee waivers, if any | 1.46% | 1.17% | 1.42% | 1.49% | 1.66% |
| Expenses net of all reductions | 1.44% | 1.16% | 1.41% | 1.49% | 1.65% |
| Net investment income (loss) | .59% | .66%B | .25%C | .86%D | .19% |
| Supplemental Data | | | | | |
| Net assets, end of period (000 omitted) | $38,049 | $53,612 | $69,380 | $78,852 | $82,337 |
| Portfolio turnover rateL | 109% | 79% | 55% | 26% | 33% |
A Calculated based on average shares outstanding during the period.
B Net investment income per share reflects a large, non-recurring dividend which amounted to $.03 per share. Excluding this non-recurring dividend, the ratio of net investment income (loss) to average net assets would have been .46%.
C Net investment income per share reflects a large, non-recurring dividend which amounted to $.04 per share. Excluding this non-recurring dividend, the ratio of net investment income (loss) to average net assets would have been .04%.
D Net investment income per share reflects a large, non-recurring dividend which amounted to $.09 per share. Excluding this non-recurring dividend, the ratio of net investment income (loss) to average net assets would have been .36%.
E Total distributions of $.64 per share is comprised of distributions from net investment income of $.125 and distributions from net realized gain of $.519 per share.
F Total distributions of $1.26 per share is comprised of distributions from net investment income of $.067 and distributions from net realized gain of $1.195 per share.
G Amount represents less than $.005 per share.
H Total returns would have been lower if certain expenses had not been reduced during the applicable periods shown.
I Total returns do not include the effect of the sales charges.
J Fees and expenses of any underlying mutual funds or exchange-traded funds (ETFs) are not included in the Fund's expense ratio. The Fund indirectly bears its proportionate share of these expenses. For additional expense information related to investments in Fidelity Central Funds, please refer to the "Investments in Fidelity Central Funds" note found in the Notes to Financial Statements section of the most recent Annual or Semi-Annual report.
K Expense ratios reflect operating expenses of the class. Expenses before reductions do not reflect amounts reimbursed by the investment adviser or reductions from brokerage service arrangements or reductions from other expense offset arrangements and do not represent the amount paid by the class during periods when reimbursements or reductions occur. Expenses net of fee waivers reflect expenses after reimbursement by the investment adviser but prior to reductions from brokerage service arrangements or other expense offset arrangements. Expenses net of all reductions represent the net expenses paid by the class.
L Amount does not include the portfolio activity of any underlying Fidelity Central Funds.
See accompanying notes which are an integral part of the financial statements.
Fidelity Small Cap Value Fund Class C
| Years ended July 31, | 2020 | 2019 | 2018 | 2017 | 2016 |
| Selected Per–Share Data | | | | | |
| Net asset value, beginning of period | $12.91 | $18.50 | $17.39 | $16.52 | $17.82 |
| Income from Investment Operations | | | | | |
| Net investment income (loss)A | .01 | .02B | (.05)C | .06D | (.05) |
| Net realized and unrealized gain (loss) | (1.72) | (.89) | 1.71 | 2.04 | .50 |
| Total from investment operations | (1.71) | (.87) | 1.66 | 2.10 | .45 |
| Distributions from net investment income | (.03) | (.02) | (.03) | (.04) | – |
| Distributions from net realized gain | (.41) | (4.71) | (.52) | (1.20) | (1.75) |
| Total distributions | (.44) | (4.72)E | (.55) | (1.23)F | (1.75) |
| Redemption fees added to paid in capitalA | – | – | –G | –G | –G |
| Net asset value, end of period | $10.76 | $12.91 | $18.50 | $17.39 | $16.52 |
| Total ReturnH,I | (13.74)% | (5.63)% | 9.84% | 13.79% | 3.20% |
| Ratios to Average Net AssetsJ,K | | | | | |
| Expenses before reductions | 2.00% | 1.68% | 1.93% | 2.00% | 2.18% |
| Expenses net of fee waivers, if any | 1.99% | 1.68% | 1.93% | 2.00% | 2.17% |
| Expenses net of all reductions | 1.97% | 1.67% | 1.92% | 2.00% | 2.17% |
| Net investment income (loss) | .06% | .15%B | (.26)%C | .35%D | (.33)% |
| Supplemental Data | | | | | |
| Net assets, end of period (000 omitted) | $13,748 | $22,187 | $44,396 | $52,227 | $57,231 |
| Portfolio turnover rateL | 109% | 79% | 55% | 26% | 33% |
A Calculated based on average shares outstanding during the period.
B Net investment income per share reflects a large, non-recurring dividend which amounted to $.03 per share. Excluding this non-recurring dividend, the ratio of net investment income (loss) to average net assets would have been (.05) %.
C Net investment income per share reflects a large, non-recurring dividend which amounted to $.04 per share. Excluding this non-recurring dividend, the ratio of net investment income (loss) to average net assets would have been (.47) %.
D Net investment income per share reflects a large, non-recurring dividend which amounted to $.08 per share. Excluding this non-recurring dividend, the ratio of net investment income (loss) to average net assets would have been (.15) %.
E Total distributions of $4.72 per share is comprised of distributions from net investment income of $.016 and distributions from net realized gain of $4.707 per share.
F Total distributions of $1.23 per share is comprised of distributions from net investment income of $.036 and distributions from net realized gain of $1.195 per share.
G Amount represents less than $.005 per share.
H Total returns would have been lower if certain expenses had not been reduced during the applicable periods shown.
I Total returns do not include the effect of the contingent deferred sales charge.
J Fees and expenses of any underlying mutual funds or exchange-traded funds (ETFs) are not included in the Fund's expense ratio. The Fund indirectly bears its proportionate share of these expenses. For additional expense information related to investments in Fidelity Central Funds, please refer to the "Investments in Fidelity Central Funds" note found in the Notes to Financial Statements section of the most recent Annual or Semi-Annual report.
K Expense ratios reflect operating expenses of the class. Expenses before reductions do not reflect amounts reimbursed by the investment adviser or reductions from brokerage service arrangements or reductions from other expense offset arrangements and do not represent the amount paid by the class during periods when reimbursements or reductions occur. Expenses net of fee waivers reflect expenses after reimbursement by the investment adviser but prior to reductions from brokerage service arrangements or other expense offset arrangements. Expenses net of all reductions represent the net expenses paid by the class.
L Amount does not include the portfolio activity of any underlying Fidelity Central Funds.
See accompanying notes which are an integral part of the financial statements.
Fidelity Small Cap Value Fund
| Years ended July 31, | 2020 | 2019 | 2018 | 2017 | 2016 |
| Selected Per–Share Data | | | | | |
| Net asset value, beginning of period | $15.04 | $20.71 | $19.41 | $18.22 | $19.45 |
| Income from Investment Operations | | | | | |
| Net investment income (loss)A | .15 | .18B | .15C | .25D | .12 |
| Net realized and unrealized gain (loss) | (2.01) | (1.00) | 1.89 | 2.28 | .55 |
| Total from investment operations | (1.86) | (.82) | 2.04 | 2.53 | .67 |
| Distributions from net investment income | (.12) | (.15) | (.22) | (.15) | (.15) |
| Distributions from net realized gain | (.41) | (4.71) | (.52) | (1.20) | (1.75) |
| Total distributions | (.54)E | (4.85)F | (.74) | (1.34)G | (1.90) |
| Redemption fees added to paid in capitalA | – | – | –H | –H | –H |
| Net asset value, end of period | $12.64 | $15.04 | $20.71 | $19.41 | $18.22 |
| Total ReturnI | (12.88)% | (4.58)% | 10.88% | 14.99% | 4.23% |
| Ratios to Average Net AssetsJ,K | | | | | |
| Expenses before reductions | .96% | .66% | .91% | .99% | 1.18% |
| Expenses net of fee waivers, if any | .96% | .66% | .91% | .99% | 1.18% |
| Expenses net of all reductions | .94% | .64% | .91% | .99% | 1.17% |
| Net investment income (loss) | 1.10% | 1.17%B | .76%C | 1.36%D | .67% |
| Supplemental Data | | | | | |
| Net assets, end of period (000 omitted) | $1,231,427 | $1,611,032 | $2,052,664 | $2,637,843 | $2,460,714 |
| Portfolio turnover rateL | 109% | 79% | 55% | 26% | 33% |
A Calculated based on average shares outstanding during the period.
B Net investment income per share reflects a large, non-recurring dividend which amounted to $.03 per share. Excluding this non-recurring dividend, the ratio of net investment income (loss) to average net assets would have been .98%.
C Net investment income per share reflects a large, non-recurring dividend which amounted to $.04 per share. Excluding this non-recurring dividend, the ratio of net investment income (loss) to average net assets would have been .55%.
D Net investment income per share reflects a large, non-recurring dividend which amounted to $.09 per share. Excluding this non-recurring dividend, the ratio of net investment income (loss) to average net assets would have been .86%.
E Total distributions of $.54 per share is comprised of distributions from net investment income of $.124 and distributions from net realized gain of $.411 per share.
F Total distributions of $4.85 per share is comprised of distributions from net investment income of $.145 and distributions from net realized gain of $4.707 per share.
G Total distributions of $1.34 per share is comprised of distributions from net investment income of $.145 and distributions from net realized gain of $1.195 per share.
H Amount represents less than $.005 per share.
I Total returns would have been lower if certain expenses had not been reduced during the applicable periods shown.
J Fees and expenses of any underlying mutual funds or exchange-traded funds (ETFs) are not included in the Fund's expense ratio. The Fund indirectly bears its proportionate share of these expenses. For additional expense information related to investments in Fidelity Central Funds, please refer to the "Investments in Fidelity Central Funds" note found in the Notes to Financial Statements section of the most recent Annual or Semi-Annual report.
K Expense ratios reflect operating expenses of the class. Expenses before reductions do not reflect amounts reimbursed by the investment adviser or reductions from brokerage service arrangements or reductions from other expense offset arrangements and do not represent the amount paid by the class during periods when reimbursements or reductions occur. Expenses net of fee waivers reflect expenses after reimbursement by the investment adviser but prior to reductions from brokerage service arrangements or other expense offset arrangements. Expenses net of all reductions represent the net expenses paid by the class.
L Amount does not include the portfolio activity of any underlying Fidelity Central Funds.
See accompanying notes which are an integral part of the financial statements.
Fidelity Small Cap Value Fund Class I
| Years ended July 31, | 2020 | 2019 | 2018 | 2017 | 2016 |
| Selected Per–Share Data | | | | | |
| Net asset value, beginning of period | $15.04 | $20.72 | $19.41 | $18.23 | $19.45 |
| Income from Investment Operations | | | | | |
| Net investment income (loss)A | .15 | .18B | .15C | .25D | .12 |
| Net realized and unrealized gain (loss) | (2.01) | (1.01) | 1.90 | 2.28 | .56 |
| Total from investment operations | (1.86) | (.83) | 2.05 | 2.53 | .68 |
| Distributions from net investment income | (.12) | (.15) | (.22) | (.15) | (.16) |
| Distributions from net realized gain | (.41) | (4.71) | (.52) | (1.20) | (1.75) |
| Total distributions | (.53) | (4.85)E | (.74) | (1.35) | (1.90)F |
| Redemption fees added to paid in capitalA | – | – | –G | –G | –G |
| Net asset value, end of period | $12.65 | $15.04 | $20.72 | $19.41 | $18.23 |
| Total ReturnH | (12.82)% | (4.63)% | 10.93% | 14.96% | 4.31% |
| Ratios to Average Net AssetsI,J | | | | | |
| Expenses before reductions | .95% | .66% | .91% | .98% | 1.14% |
| Expenses net of fee waivers, if any | .95% | .66% | .91% | .97% | 1.14% |
| Expenses net of all reductions | .93% | .65% | .90% | .97% | 1.14% |
| Net investment income (loss) | 1.10% | 1.17%B | .76%C | 1.37%D | .70% |
| Supplemental Data | | | | | |
| Net assets, end of period (000 omitted) | $214,538 | $243,571 | $459,332 | $466,730 | $389,928 |
| Portfolio turnover rateK | 109% | 79% | 55% | 26% | 33% |
A Calculated based on average shares outstanding during the period.
B Net investment income per share reflects a large, non-recurring dividend which amounted to $.03 per share. Excluding this non-recurring dividend, the ratio of net investment income (loss) to average net assets would have been .97%.
C Net investment income per share reflects a large, non-recurring dividend which amounted to $.04 per share. Excluding this non-recurring dividend, the ratio of net investment income (loss) to average net assets would have been .55%.
D Net investment income per share reflects a large, non-recurring dividend which amounted to $.09 per share. Excluding this non-recurring dividend, the ratio of net investment income (loss) to average net assets would have been .88%.
E Total distributions of $4.85 per share is comprised of distributions from net investment income of $.146 and distributions from net realized gain of $4.707 per share.
F Total distributions of $1.90 per share is comprised of distributions from net investment income of $.157 and distributions from net realized gain of $1.747 per share.
G Amount represents less than $.005 per share.
H Total returns would have been lower if certain expenses had not been reduced during the applicable periods shown.
I Fees and expenses of any underlying mutual funds or exchange-traded funds (ETFs) are not included in the Fund's expense ratio. The Fund indirectly bears its proportionate share of these expenses. For additional expense information related to investments in Fidelity Central Funds, please refer to the "Investments in Fidelity Central Funds" note found in the Notes to Financial Statements section of the most recent Annual or Semi-Annual report.
J Expense ratios reflect operating expenses of the class. Expenses before reductions do not reflect amounts reimbursed by the investment adviser or reductions from brokerage service arrangements or reductions from other expense offset arrangements and do not represent the amount paid by the class during periods when reimbursements or reductions occur. Expenses net of fee waivers reflect expenses after reimbursement by the investment adviser but prior to reductions from brokerage service arrangements or other expense offset arrangements. Expenses net of all reductions represent the net expenses paid by the class.
K Amount does not include the portfolio activity of any underlying Fidelity Central Funds.
See accompanying notes which are an integral part of the financial statements.
Fidelity Small Cap Value Fund Class Z
| Years ended July 31, | 2020 | 2019 A |
| Selected Per–Share Data | | |
| Net asset value, beginning of period | $15.05 | $16.90 |
| Income from Investment Operations | | |
| Net investment income (loss)B | .17 | (.08)C |
| Net realized and unrealized gain (loss) | (2.01) | (.66)D |
| Total from investment operations | (1.84) | (.74) |
| Distributions from net investment income | (.15) | (.09) |
| Distributions from net realized gain | (.41) | (1.02) |
| Total distributions | (.56) | (1.11) |
| Net asset value, end of period | $12.65 | $15.05 |
| Total ReturnE,F | (12.73)% | (3.75)% |
| Ratios to Average Net AssetsG,H | | |
| Expenses before reductions | .81% | .52%I |
| Expenses net of fee waivers, if any | .81% | .52%I |
| Expenses net of all reductions | .79% | .51%I |
| Net investment income (loss) | 1.25% | (.63)%C,I |
| Supplemental Data | | |
| Net assets, end of period (000 omitted) | $93,849 | $26,006 |
| Portfolio turnover rateJ | 109% | 79% |
A For the period October 2, 2018 (commencement of sale of shares) to July 31, 2019.
B Calculated based on average shares outstanding during the period.
C Net investment income per share reflects a large, non-recurring dividend which amounted to $.02 per share. Excluding this non-recurring dividend, the ratio of net investment income (loss) to average net assets would have been (.82) %.
D The amount shown for a share outstanding does not correspond with the aggregate net gain (loss) on investments for the period due to the timing of sales and repurchases of shares in relation to fluctuating market values of the investments of the Fund.
E Total returns for periods of less than one year are not annualized.
F Total returns would have been lower if certain expenses had not been reduced during the applicable periods shown.
G Fees and expenses of any underlying mutual funds or exchange-traded funds (ETFs) are not included in the Fund's expense ratio. The Fund indirectly bears its proportionate share of these expenses. For additional expense information related to investments in Fidelity Central Funds, please refer to the "Investments in Fidelity Central Funds" note found in the Notes to Financial Statements section of the most recent Annual or Semi-Annual report.
H Expense ratios reflect operating expenses of the class. Expenses before reductions do not reflect amounts reimbursed by the investment adviser or reductions from brokerage service arrangements or reductions from other expense offset arrangements and do not represent the amount paid by the class during periods when reimbursements or reductions occur. Expense ratios before reductions for start-up periods may not be representative of longer-term operating periods. Expenses net of fee waivers reflect expenses after reimbursement by the investment adviser but prior to reductions from brokerage service arrangements or other expense offset arrangements. Expenses net of all reductions represent the net expenses paid by the class.
I Annualized
J Amount does not include the portfolio activity of any underlying Fidelity Central Funds.
See accompanying notes which are an integral part of the financial statements.
Notes to Financial Statements
For the period ended July 31, 2020
1. Organization.
Fidelity Small Cap Value Fund (the Fund) is a fund of Fidelity Securities Fund (the Trust) and is authorized to issue an unlimited number of shares. The Trust is registered under the Investment Company Act of 1940, as amended (the 1940 Act), as an open-end management investment company organized as a Massachusetts business trust. The Fund offers Class A, Class M, Class C, Small Cap Value, Class I and Class Z shares, each of which has equal rights as to assets and voting privileges. Each class has exclusive voting rights with respect to matters that affect that class. Class C shares will automatically convert to Class A shares after a holding period of ten years from the initial date of purchase, with certain exceptions.
Effective January 1, 2020:
Investment advisers Fidelity Investments Money Management, Inc., FMR Co., Inc., and Fidelity SelectCo, LLC, merged with and into Fidelity Management & Research Company. In connection with the merger transactions, the resulting, merged investment adviser was then redomiciled from Massachusetts to Delaware, changed its corporate structure from a corporation to a limited liability company, and changed its name to "Fidelity Management & Research Company LLC".
Broker-dealer Fidelity Distributors Corporation merged with and into Fidelity Investments Institutional Services Company, Inc. ("FIISC"). FIISC was then redomiciled from Massachusetts to Delaware, changed its corporate structure from a corporation to a limited liability company, and changed its name to "Fidelity Distributors Company LLC".
Fidelity Investments Institutional Operations Company, Inc. converted from a Massachusetts corporation to a Massachusetts LLC, and changed its name to "Fidelity Investments Institutional Operations Company LLC".
2. Investments in Fidelity Central Funds.
The Fund invests in Fidelity Central Funds, which are open-end investment companies generally available only to other investment companies and accounts managed by the investment adviser and its affiliates. The Fund's Schedule of Investments lists each of the Fidelity Central Funds held as of period end, if any, as an investment of the Fund, but does not include the underlying holdings of each Fidelity Central Fund. As an Investing Fund, the Fund indirectly bears its proportionate share of the expenses of the underlying Fidelity Central Funds.
The Money Market Central Funds seek preservation of capital and current income and are managed by the investment adviser. Annualized expenses of the Money Market Central Funds as of their most recent shareholder report date ranged from less than .005% to .01%.
A complete unaudited list of holdings for each Fidelity Central Fund is available upon request or at the Securities and Exchange Commission (the SEC) website at www.sec.gov. In addition, the financial statements of the Fidelity Central Funds, which are not covered by the Fund's Report of Independent Registered Public Accounting Firm, are available on the SEC website or upon request.
3. Significant Accounting Policies.
The Fund is an investment company and applies the accounting and reporting guidance of the Financial Accounting Standards Board (FASB) Accounting Standards Codification Topic 946 Financial Services – Investment Companies. The financial statements have been prepared in conformity with accounting principles generally accepted in the United States of America (GAAP), which require management to make certain estimates and assumptions at the date of the financial statements. Actual results could differ from those estimates. Subsequent events, if any, through the date that the financial statements were issued have been evaluated in the preparation of the financial statements. The following summarizes the significant accounting policies of the Fund:
Investment Valuation. Investments are valued as of 4:00 p.m. Eastern time on the last calendar day of the period. The Board of Trustees (the Board) has delegated the day to day responsibility for the valuation of the Fund's investments to the Fair Value Committee (the Committee) established by the Fund's investment adviser. In accordance with valuation policies and procedures approved by the Board, the Fund attempts to obtain prices from one or more third party pricing vendors or brokers to value its investments. When current market prices, quotations or currency exchange rates are not readily available or reliable, investments will be fair valued in good faith by the Committee, in accordance with procedures adopted by the Board. Factors used in determining fair value vary by investment type and may include market or investment specific events. The frequency with which these procedures are used cannot be predicted and they may be utilized to a significant extent. The Committee oversees the Fund's valuation policies and procedures and reports to the Board on the Committee's activities and fair value determinations. The Board monitors the appropriateness of the procedures used in valuing the Fund's investments and ratifies the fair value determinations of the Committee.
The Fund categorizes the inputs to valuation techniques used to value its investments into a disclosure hierarchy consisting of three levels as shown below:
- Level 1 – quoted prices in active markets for identical investments
- Level 2 – other significant observable inputs (including quoted prices for similar investments, interest rates, prepayment speeds, etc.)
- Level 3 – unobservable inputs (including the Fund's own assumptions based on the best information available)
Valuation techniques used to value the Fund's investments by major category are as follows:
Equity securities, including restricted securities, for which market quotations are readily available, are valued at the last reported sale price or official closing price as reported by a third party pricing vendor on the primary market or exchange on which they are traded and are categorized as Level 1 in the hierarchy. In the event there were no sales during the day or closing prices are not available, securities are valued at the last quoted bid price or may be valued using the last available price and are generally categorized as Level 2 in the hierarchy. For foreign equity securities, when market or security specific events arise, comparisons to the valuation of American Depositary Receipts (ADRs), futures contracts, Exchange-Traded Funds (ETFs) and certain indexes as well as quoted prices for similar securities may be used and would be categorized as Level 2 in the hierarchy. For equity securities, including restricted securities, where observable inputs are limited, assumptions about market activity and risk are used and these securities may be categorized as Level 3 in the hierarchy.
Investments in open-end mutual funds, including the Fidelity Central Funds, are valued at their closing net asset value (NAV) each business day and are categorized as Level 1 in the hierarchy.
Changes in valuation techniques may result in transfers in or out of an assigned level within the disclosure hierarchy. The aggregate value of investments by input level as of July 31, 2020 is included at the end of the Fund's Schedule of Investments.
Foreign Currency. The Fund may use foreign currency contracts to facilitate transactions in foreign-denominated securities. Gains and losses from these transactions may arise from changes in the value of the foreign currency or if the counterparties do not perform under the contracts' terms.
Foreign-denominated assets, including investment securities, and liabilities are translated into U.S. dollars at the exchange rates at period end. Purchases and sales of investment securities, income and dividends received and expenses denominated in foreign currencies are translated into U.S. dollars at the exchange rate in effect on the transaction date.
The effects of exchange rate fluctuations on investments are included with the net realized and unrealized gain (loss) on investment securities. Other foreign currency transactions resulting in realized and unrealized gain (loss) are disclosed separately.
Investment Transactions and Income. For financial reporting purposes, the Fund's investment holdings and NAV include trades executed through the end of the last business day of the period. The NAV per share for processing shareholder transactions is calculated as of the close of business of the New York Stock Exchange (NYSE), normally 4:00 p.m. Eastern time and includes trades executed through the end of the prior business day. Gains and losses on securities sold are determined on the basis of identified cost. Dividend income is recorded on the ex-dividend date, except for certain dividends from foreign securities where the ex-dividend date may have passed, which are recorded as soon as the Fund is informed of the ex-dividend date. Non-cash dividends included in dividend income, if any, are recorded at the fair market value of the securities received. Income and capital gain distributions from Fidelity Central Funds, if any, are recorded on the ex-dividend date. Certain distributions received by the Fund represent a return of capital or capital gain. The Fund determines the components of these distributions subsequent to the ex-dividend date, based upon receipt of tax filings or other correspondence relating to the underlying investment. These distributions are recorded as a reduction of cost of investments and/or as a realized gain. Interest income is accrued as earned and includes coupon interest and amortization of premium and accretion of discount on debt securities as applicable. Investment income is recorded net of foreign taxes withheld where recovery of such taxes is uncertain.
Class Allocations and Expenses. Investment income, realized and unrealized capital gains and losses, common expenses of the Fund, and certain fund-level expense reductions, if any, are allocated daily on a pro-rata basis to each class based on the relative net assets of each class to the total net assets of the Fund. Each class differs with respect to transfer agent and distribution and service plan fees incurred. Certain expense reductions may also differ by class. For the reporting period, the allocated portion of income and expenses to each class as a percent of its average net assets may vary due to the timing of recording these transactions in relation to fluctuating net assets of the classes. Expenses directly attributable to a fund are charged to that fund. Expenses attributable to more than one fund are allocated among the respective funds on the basis of relative net assets or other appropriate methods. Expense estimates are accrued in the period to which they relate and adjustments are made when actual amounts are known.
Income Tax Information and Distributions to Shareholders. Each year, the Fund intends to qualify as a regulated investment company under Subchapter M of the Internal Revenue Code, including distributing substantially all of its taxable income and realized gains. As a result, no provision for U.S. Federal income taxes is required. As of July 31, 2020, the Fund did not have any unrecognized tax benefits in the financial statements; nor is the Fund aware of any tax positions for which it is reasonably possible that the total amounts of unrecognized tax benefits will significantly change in the next twelve months. The Fund files a U.S. federal tax return, in addition to state and local tax returns as required. The Fund's federal income tax returns are subject to examination by the Internal Revenue Service (IRS) for a period of three fiscal years after they are filed. State and local tax returns may be subject to examination for an additional fiscal year depending on the jurisdiction. Foreign taxes are provided for based on the Fund's understanding of the tax rules and rates that exist in the foreign markets in which it invests.
Distributions are declared and recorded on the ex-dividend date. Income and capital gain distributions are declared separately for each class. Income and capital gain distributions are determined in accordance with income tax regulations, which may differ from GAAP. In addition, the Fund claimed a portion of the payment made to redeeming shareholders as a distribution for income tax purposes.
Capital accounts within the financial statements are adjusted for permanent book-tax differences. These adjustments have no impact on net assets or the results of operations. Capital accounts are not adjusted for temporary book-tax differences which will reverse in a subsequent period.
Book-tax differences are primarily due to foreign currency transactions, partnerships and losses deferred due to wash sales and excise tax regulations.
As of period end, the cost and unrealized appreciation (depreciation) in securities, and derivatives if applicable, for federal income tax purposes were as follows:
| Gross unrealized appreciation | $197,298,521 |
| Gross unrealized depreciation | (109,213,078) |
| Net unrealized appreciation (depreciation) | $88,085,443 |
| Tax Cost | $1,642,299,682 |
The tax-based components of distributable earnings as of period end were as follows:
| Undistributed ordinary income | $1,648,996 |
| Net unrealized appreciation (depreciation) on securities and other investments | $88,090,682 |
The Fund intends to elect to defer to its next fiscal year $235,333,340 of capital losses recognized during the period November 1, 2019 to July 31, 2020.
The tax character of distributions paid was as follows:
| | July 31, 2020 | July 31, 2019 |
| Ordinary Income | $21,008,672 | $ 18,692,764 |
| Long-term Capital Gains | 52,257,559 | 612,407,626 |
| Total | $73,266,231 | $ 631,100,390 |
Delayed Delivery Transactions and When-Issued Securities. During the period, the Fund transacted in securities on a delayed delivery or when-issued basis. Payment and delivery may take place after the customary settlement period for that security. The price of the underlying securities and the date when the securities will be delivered and paid for are fixed at the time the transaction is negotiated. The securities purchased on a delayed delivery or when-issued basis are identified as such in the Fund's Schedule of Investments. Losses may arise due to changes in the value of the underlying securities or if the counterparty does not perform under the contract's terms, or if the issuer does not issue the securities due to political, economic, or other factors.
4. Purchases and Sales of Investments.
Purchases and sales of securities, other than short-term securities are noted in the table below.
| | Purchases ($) | Sales ($) |
| Fidelity Small Cap Value Fund | 1,988,079,138 | 2,075,216,332 |
5. Fees and Other Transactions with Affiliates.
Management Fee. Fidelity Management & Research Company LLC (the investment adviser) and its affiliates provide the Fund with investment management related services for which the Fund pays a monthly management fee. The management fee is the sum of an individual fund fee rate that is based on an annual rate of .45% of the Fund's average net assets and an annualized group fee rate that averaged .23% during the period. The group fee rate is based upon the monthly average net assets of a group of registered investment companies with which the investment adviser has management contracts. The group fee rate decreases as assets under management increase and increases as assets under management decrease. In addition, the management fee is subject to a performance adjustment (up to a maximum of +/- .20% of the Fund's average net assets over a 36 month performance period). The upward or downward adjustment to the management fee is based on the relative investment performance of Small Cap Value as compared to its benchmark index, the Russell 2000 Value Index, over the same 36 month performance period. For the reporting period, the total annual management fee rate, including the performance adjustment, was .72% of the Fund's average net assets. The performance adjustment included in the management fee rate may be higher or lower than the maximum performance adjustment rate due to the difference between the average net assets for the reporting and performance periods.
Distribution and Service Plan Fees. In accordance with Rule 12b-1 of the 1940 Act, the Fund has adopted separate Distribution and Service Plans for each class of shares. Certain classes pay Fidelity Distributors Company LLC (FDC), an affiliate of the investment adviser, separate Distribution and Service Fees, each of which is based on an annual percentage of each class' average net assets. In addition, FDC may pay financial intermediaries for selling shares of the Fund and providing shareholder support services. For the period, the Distribution and Service Fee rates, total fees and amounts retained by FDC were as follows:
| | Distribution Fee | Service Fee | Total Fees | Retained by FDC |
| Class A | -% | .25% | $279,941 | $4,530 |
| Class M | .25% | .25% | 224,058 | 752 |
| Class C | .75% | .25% | 176,043 | 16,089 |
| | | | $680,042 | $21,371 |
Sales Load. FDC may receive a front-end sales charge of up to 5.75% for selling Class A shares and 3.50% for selling Class M shares, some of which is paid to financial intermediaries for selling shares of the Fund. Depending on the holding period, FDC may receive contingent deferred sales charges levied on Class A, Class M and Class C redemptions. The deferred sales charges are 1.00% for Class C shares, 1.00% for certain purchases of Class A shares and .25% for certain purchases of Class M shares.
For the period, sales charge amounts retained by FDC were as follows:
| | Retained by FDC |
| Class A | $29,274 |
| Class M | 1,973 |
| Class C(a) | 1,160 |
| | $32,407 |
(a) When Class C shares are initially sold, FDC pays commissions from its own resources to financial intermediaries through which the sales are made.
Transfer Agent Fees. Fidelity Investments Institutional Operations Company LLC (FIIOC), an affiliate of the investment adviser, is the transfer, dividend disbursing and shareholder servicing agent for each class of the Fund. FIIOC receives account fees and asset-based fees that vary according to the account size and type of account of the shareholders of the respective classes of the Fund, except for Class Z. FIIOC receives an asset-based fee of Class Z's average net assets. FIIOC pays for typesetting, printing and mailing of shareholder reports, except proxy statements. Effective February 1, 2020, the Board approved to change the fee for and Class Z from .046% to .044%.
For the period, transfer agent fees for each class were as follows:
| | Amount | % of Class-Level Average Net Assets |
| Class A | $229,552 | .21 |
| Class M | 88,605 | .20 |
| Class C | 40,106 | .23 |
| Small Cap Value | 2,657,300 | .19 |
| Class I | 414,823 | .19 |
| Class Z | 33,771 | .04 |
| | $3,464,157 | |
Accounting Fees. Fidelity Service Company, Inc. (FSC), an affiliate of the investment adviser, maintains the Fund's accounting records. The accounting fee is based on the level of average net assets for each month. For the period, the fees were equivalent to the following annual rates:
| | % of Average Net Assets |
| Fidelity Small Cap Value Fund | .03 |
Brokerage Commissions. A portion of portfolio transactions were placed with brokerage firms which are affiliates of the investment adviser. Brokerage commissions are included in net realized gain (loss) and change in net unrealized appreciation (depreciation) in the Statement of Operations. The commissions paid to these affiliated firms were as follows:
| | Amount |
| Fidelity Small Cap Value Fund | $130,001 |
Interfund Lending Program. Pursuant to an Exemptive Order issued by the SEC, the fund, along with other registered investment companies having management contracts with Fidelity Management & Research Company LLC (FMR), or other affiliated entities of FMR, may participate in an interfund lending program. This program provides an alternative credit facility allowing the fund to borrow from, or lend money to, other participating affiliated funds. At period end, there were no interfund loans outstanding. Activity in this program during the period for which loans were outstanding was as follows:
| | Borrower or Lender | Average Loan Balance | Weighted Average Interest Rate | Interest Expense |
| Fidelity Small Cap Value Fund | Borrower | $7,728,333 | .46% | $1,180 |
Interfund Trades. Funds may purchase from or sell securities to other Fidelity Funds under procedures adopted by the Board. The procedures have been designed to ensure these interfund trades are executed in accordance with Rule 17a-7 of the 1940 Act. Interfund trades are included within the respective purchases and sales amounts shown in the Purchases and Sales of Investments note.
6. Committed Line of Credit.
Certain Funds participate with other funds managed by the investment adviser or an affiliate in a $4.25 billion credit facility (the "line of credit") to be utilized for temporary or emergency purposes to fund shareholder redemptions or for other short-term liquidity purposes. The participating funds have agreed to pay commitment fees on their pro-rata portion of the line of credit, which are reflected in Miscellaneous expenses on the Statement of Operations, and are as follows:
| | Amount |
| Fidelity Small Cap Value Fund | $4,602 |
During the period, there were no borrowings on this line of credit.
7. Security Lending.
The Fund lends portfolio securities from time to time in order to earn additional income. Lending agents are used, including National Financial Services (NFS), an affiliate of the Fund. Pursuant to a securities lending agreement, NFS will receive a fee, which is capped at 9.9% of daily lending revenue, for its services as lending agent. The Fund may lend securities to certain qualified borrowers, including NFS. On the settlement date of the loan, the Fund receives collateral (in the form of U.S. Treasury obligations, letters of credit and/or cash) against the loaned securities and maintains collateral in an amount not less than 100% of the market value of the loaned securities during the period of the loan. The market value of the loaned securities is determined at the close of business of the Fund and any additional required collateral is delivered to the Fund on the next business day. The Fund or borrower may terminate the loan at any time, and if the borrower defaults on its obligation to return the securities loaned because of insolvency or other reasons, the Fund may apply collateral received from the borrower against the obligation. The Fund may experience delays and costs in recovering the securities loaned. Any cash collateral received is invested in the Fidelity Securities Lending Cash Central Fund. The value of loaned securities and cash collateral at period end are disclosed on the Fund's Statement of Assets and Liabilities. The value of securities loaned to NFS, as affiliated borrower, at period end was $2,579,488. Total fees paid by the Fund to NFS, as lending agent, amounted to $6,712. Security lending income represents the income earned on investing cash collateral, less rebates paid to borrowers and any lending agent fees associated with the loan, plus any premium payments received for lending certain types of securities. Net income from the Fidelity Securities Lending Cash Central Fund during the period is presented in the Statement of Operations as a component of income from Fidelity Central Funds (and includes $252 from securities loaned to NFS, as affiliated borrower).
8. Bank Borrowings.
The Fund is permitted to have bank borrowings for temporary or emergency purposes to fund shareholder redemptions or for other short-term liquidity requirements. The Fund has established borrowing arrangements with certain banks. The interest rate on the borrowings is the bank's base rate, as revised from time to time. Any open loans, including accrued interest, at period end are presented under the caption "Notes payable" in the Statement of Assets and Liabilities, if applicable. Activity in this program during the period for which loans were outstanding was as follows:
| | Average Loan Balance | Weighted Average Interest Rate | Interest Expense |
| Fidelity Small Cap Value Fund | $2,445,000 | .55% | $37 |
9. Expense Reductions.
Commissions paid to certain brokers with whom the investment adviser, or its affiliates, places trades on behalf of the Fund include an amount in addition to trade execution, which may be rebated back to the Fund to offset certain expenses. This amount totaled $374,447 for the period.
In addition, during the period the investment adviser or an affiliate reimbursed and/or waived a portion of fund-level operating expenses in the amount of $8,541.
In addition, during the period the investment adviser or an affiliate reimbursed the Fund $8,560 for an operational error which is included in the accompanying Statement of Operations.
10. Distributions to Shareholders.
Distributions to shareholders of each class were as follows:
| | Year ended
July 31, 2020 | Year ended
July 31, 2019(a) |
| Distributions to shareholders | | |
| Class A | $4,271,933 | $38,710,047 |
| Class M | 1,681,883 | 17,014,124 |
| Class C | 713,172 | 11,414,739 |
| Small Cap Value | 55,235,533 | 469,819,892 |
| Class I | 8,502,077 | 93,391,322 |
| Class Z | 2,861,633 | 750,266 |
| Total | $73,266,231 | $631,100,390 |
(a) Distributions for Class Z are for the period October 2, 2018 (commencement of sale of shares) to July 31, 2019.
11. Share Transactions.
Share transactions for each class were as follows and may contain automatic conversions between classes or exchanges between affiliated funds:
| | Shares | Shares | Dollars | Dollars |
| | Year ended July 31, 2020 | Year ended July 31, 2019(a) | Year ended July 31, 2020 | Year ended July 31, 2019(a) |
| Class A | | | | |
| Shares sold | 1,787,862 | 1,638,428 | $22,886,888 | $24,084,415 |
| Reinvestment of distributions | 291,014 | 2,371,085 | 4,193,040 | 37,759,513 |
| Shares redeemed | (2,628,607) | (3,209,827) | (34,504,372) | (47,744,776) |
| Net increase (decrease) | (549,731) | 799,686 | $(7,424,444) | $14,099,152 |
| Class M | | | | |
| Shares sold | 437,459 | 389,836 | $5,423,700 | $5,611,447 |
| Reinvestment of distributions | 119,893 | 1,095,649 | 1,673,368 | 16,926,149 |
| Shares redeemed | (1,138,348) | (1,212,074) | (14,599,356) | (17,550,968) |
| Net increase (decrease) | (580,996) | 273,411 | $(7,502,288) | $4,986,628 |
| Class C | | | | |
| Shares sold | 411,614 | 221,718 | $4,675,916 | $2,936,109 |
| Reinvestment of distributions | 55,052 | 777,498 | 693,834 | 11,029,853 |
| Shares redeemed | (907,145) | (1,681,515) | (10,345,563) | (21,680,140) |
| Net increase (decrease) | (440,479) | (682,299) | $(4,975,813) | $(7,714,178) |
| Small Cap Value | | | | |
| Shares sold | 24,352,600 | 12,928,047 | $316,956,165 | $198,016,884 |
| Reinvestment of distributions | 3,586,007 | 27,312,687 | 52,941,837 | 443,826,642 |
| Shares redeemed | (37,663,110) | (32,223,973) | (502,490,454) | (519,137,502) |
| Net increase (decrease) | (9,724,503) | 8,016,761 | $(132,592,452) | $122,706,024 |
| Class I | | | | |
| Shares sold | 8,263,886 | 3,573,241 | $106,069,906 | $55,460,309 |
| Reinvestment of distributions | 514,583 | 4,767,058 | 7,603,951 | 77,894,990 |
| Shares redeemed | (8,008,780) | (14,318,939) | (106,942,585) | (233,477,236) |
| Net increase (decrease) | 769,689 | (5,978,640) | $6,731,272 | $(100,121,937) |
| Class Z | | | | |
| Shares sold | 7,882,221 | 1,964,572 | $105,643,200 | $29,307,629 |
| Reinvestment of distributions | 182,948 | 54,128 | 2,704,975 | 741,553 |
| Shares redeemed | (2,374,102) | (290,343) | (29,551,800) | (4,212,660) |
| Net increase (decrease) | 5,691,067 | 1,728,357 | $78,796,375 | $25,836,522 |
(a) Share transactions for Class Z are for the period October 2, 2018 (commencement of sale of shares) to July 31, 2019.
12. Other.
The Fund's organizational documents provide former and current trustees and officers with a limited indemnification against liabilities arising in connection with the performance of their duties to the Fund. In the normal course of business, the Fund may also enter into contracts that provide general indemnifications. The Fund's maximum exposure under these arrangements is unknown as this would be dependent on future claims that may be made against the Fund. The risk of material loss from such claims is considered remote.
13. Coronavirus (COVID-19) Pandemic.
An outbreak of COVID-19 first detected in China during December 2019 has since spread globally and was declared a pandemic by the World Health Organization during March 2020. Developments that disrupt global economies and financial markets, such as the COVID-19 pandemic, may magnify factors that affect the Fund's performance.
Report of Independent Registered Public Accounting Firm
To the Board of Trustees of Fidelity Securities Fund and Shareholders of Fidelity Small Cap Value Fund
Opinion on the Financial Statements
We have audited the accompanying statement of assets and liabilities, including the schedule of investments, of Fidelity Small Cap Value Fund (one of the funds constituting Fidelity Securities Fund, referred to hereafter as the “Fund”) as of July 31, 2020, the related statement of operations for the year ended July 31, 2020, the statement of changes in net assets for each of the two years in the period ended July 31, 2020, including the related notes, and the financial highlights for each of the periods indicated therein (collectively referred to as the “financial statements”). In our opinion, the financial statements present fairly, in all material respects, the financial position of the Fund as of July 31, 2020, the results of its operations for the year then ended, the changes in its net assets for each of the two years in the period ended July 31, 2020 and the financial highlights for each of the periods indicated therein in conformity with accounting principles generally accepted in the United States of America.
Basis for Opinion
These financial statements are the responsibility of the Fund’s management. Our responsibility is to express an opinion on the Fund’s financial statements based on our audits. We are a public accounting firm registered with the Public Company Accounting Oversight Board (United States) (PCAOB) and are required to be independent with respect to the Fund in accordance with the U.S. federal securities laws and the applicable rules and regulations of the Securities and Exchange Commission and the PCAOB.
We conducted our audits of these financial statements in accordance with the standards of the PCAOB. Those standards require that we plan and perform the audit to obtain reasonable assurance about whether the financial statements are free of material misstatement, whether due to error or fraud.
Our audits included performing procedures to assess the risks of material misstatement of the financial statements, whether due to error or fraud, and performing procedures that respond to those risks. Such procedures included examining, on a test basis, evidence regarding the amounts and disclosures in the financial statements. Our audits also included evaluating the accounting principles used and significant estimates made by management, as well as evaluating the overall presentation of the financial statements. Our procedures included confirmation of securities owned as of July 31, 2020 by correspondence with the custodian and brokers; when replies were not received from brokers, we performed other auditing procedures. We believe that our audits provide a reasonable basis for our opinion.
/s/ PricewaterhouseCoopers LLP
Boston, Massachusetts
September 9, 2020
We have served as the auditor of one or more investment companies in the Fidelity group of funds since 1932.
Trustees and Officers
The Trustees, Members of the Advisory Board (if any), and officers of the trust and fund, as applicable, are listed below. The Board of Trustees governs the fund and is responsible for protecting the interests of shareholders. The Trustees are experienced executives who meet periodically throughout the year to oversee the fund's activities, review contractual arrangements with companies that provide services to the fund, oversee management of the risks associated with such activities and contractual arrangements, and review the fund's performance. Except for Jonathan Chiel, each of the Trustees oversees 311 funds. Mr. Chiel oversees 174 funds.
The Trustees hold office without limit in time except that (a) any Trustee may resign; (b) any Trustee may be removed by written instrument, signed by at least two-thirds of the number of Trustees prior to such removal; (c) any Trustee who requests to be retired or who has become incapacitated by illness or injury may be retired by written instrument signed by a majority of the other Trustees; and (d) any Trustee may be removed at any special meeting of shareholders by a two-thirds vote of the outstanding voting securities of the trust. Each Trustee who is not an interested person (as defined in the 1940 Act) of the trust and the fund is referred to herein as an Independent Trustee. Each Independent Trustee shall retire not later than the last day of the calendar year in which his or her 75th birthday occurs. The Independent Trustees may waive this mandatory retirement age policy with respect to individual Trustees. Officers and Advisory Board Members hold office without limit in time, except that any officer or Advisory Board Member may resign or may be removed by a vote of a majority of the Trustees at any regular meeting or any special meeting of the Trustees. Except as indicated, each individual has held the office shown or other offices in the same company for the past five years.
The fund's Statement of Additional Information (SAI) includes more information about the Trustees. To request a free copy, call Fidelity at 1-800-544-8544 if you’re an individual investing directly with Fidelity, call 1-800-835-5092 if you’re a plan sponsor or participant with Fidelity as your recordkeeper or call 1-877-208-0098 on institutional accounts or if you’re an advisor or invest through one.
Experience, Skills, Attributes, and Qualifications of the Trustees. The Governance and Nominating Committee has adopted a statement of policy that describes the experience, qualifications, attributes, and skills that are necessary and desirable for potential Independent Trustee candidates (Statement of Policy). The Board believes that each Trustee satisfied at the time he or she was initially elected or appointed a Trustee, and continues to satisfy, the standards contemplated by the Statement of Policy. The Governance and Nominating Committee also engages professional search firms to help identify potential Independent Trustee candidates who have the experience, qualifications, attributes, and skills consistent with the Statement of Policy. From time to time, additional criteria based on the composition and skills of the current Independent Trustees, as well as experience or skills that may be appropriate in light of future changes to board composition, business conditions, and regulatory or other developments, have also been considered by the professional search firms and the Governance and Nominating Committee. In addition, the Board takes into account the Trustees' commitment and participation in Board and committee meetings, as well as their leadership of standing and ad hoc committees throughout their tenure.
In determining that a particular Trustee was and continues to be qualified to serve as a Trustee, the Board has considered a variety of criteria, none of which, in isolation, was controlling. The Board believes that, collectively, the Trustees have balanced and diverse experience, qualifications, attributes, and skills, which allow the Board to operate effectively in governing the fund and protecting the interests of shareholders. Information about the specific experience, skills, attributes, and qualifications of each Trustee, which in each case led to the Board's conclusion that the Trustee should serve (or continue to serve) as a trustee of the fund, is provided below.
Board Structure and Oversight Function. Robert A. Lawrence is an interested person and currently serves as Acting Chairman. The Trustees have determined that an interested Chairman is appropriate and benefits shareholders because an interested Chairman has a personal and professional stake in the quality and continuity of services provided to the fund. Independent Trustees exercise their informed business judgment to appoint an individual of their choosing to serve as Chairman, regardless of whether the Trustee happens to be independent or a member of management. The Independent Trustees have determined that they can act independently and effectively without having an Independent Trustee serve as Chairman and that a key structural component for assuring that they are in a position to do so is for the Independent Trustees to constitute a substantial majority for the Board. The Independent Trustees also regularly meet in executive session. Ned C. Lautenbach and David M. Thomas serve as Co-Lead Independent Trustees and as such each (i) acts as a liaison between the Independent Trustees and management with respect to matters important to the Independent Trustees and (ii) with management prepares agendas for Board meetings.
Fidelity® funds are overseen by different Boards of Trustees. The fund's Board oversees Fidelity's high income and certain equity funds, and other Boards oversee Fidelity's investment-grade bond, money market, asset allocation, and other equity funds. The asset allocation funds may invest in Fidelity® funds overseen by the fund's Board. The use of separate Boards, each with its own committee structure, allows the Trustees of each group of Fidelity® funds to focus on the unique issues of the funds they oversee, including common research, investment, and operational issues. On occasion, the separate Boards establish joint committees to address issues of overlapping consequences for the Fidelity® funds overseen by each Board.
The Trustees operate using a system of committees to facilitate the timely and efficient consideration of all matters of importance to the Trustees, the fund, and fund shareholders and to facilitate compliance with legal and regulatory requirements and oversight of the fund's activities and associated risks. The Board, acting through its committees, has charged FMR and its affiliates with (i) identifying events or circumstances the occurrence of which could have demonstrably adverse effects on the fund's business and/or reputation; (ii) implementing processes and controls to lessen the possibility that such events or circumstances occur or to mitigate the effects of such events or circumstances if they do occur; and (iii) creating and maintaining a system designed to evaluate continuously business and market conditions in order to facilitate the identification and implementation processes described in (i) and (ii) above. Because the day-to-day operations and activities of the fund are carried out by or through FMR, its affiliates, and other service providers, the fund's exposure to risks is mitigated but not eliminated by the processes overseen by the Trustees. While each of the Board's committees has responsibility for overseeing different aspects of the fund's activities, oversight is exercised primarily through the Operations, Audit, and Compliance Committees. Appropriate personnel, including but not limited to the fund's Chief Compliance Officer (CCO), FMR's internal auditor, the independent accountants, the fund's Treasurer and portfolio management personnel, make periodic reports to the Board's committees, as appropriate, including an annual review of Fidelity's risk management program for the Fidelity® funds. The responsibilities of each standing committee, including their oversight responsibilities, are described further under "Standing Committees of the Trustees."
Interested Trustees*:
Correspondence intended for a Trustee who is an interested person may be sent to Fidelity Investments, 245 Summer Street, Boston, Massachusetts 02210.
Name, Year of Birth; Principal Occupations and Other Relevant Experience+
Jonathan Chiel (1957)
Year of Election or Appointment: 2016
Trustee
Mr. Chiel also serves as Trustee of other Fidelity® funds. Mr. Chiel is Executive Vice President and General Counsel for FMR LLC (diversified financial services company, 2012-present). Previously, Mr. Chiel served as general counsel (2004-2012) and senior vice president and deputy general counsel (2000-2004) for John Hancock Financial Services; a partner with Choate, Hall & Stewart (1996-2000) (law firm); and an Assistant United States Attorney for the United States Attorney’s Office of the District of Massachusetts (1986-95), including Chief of the Criminal Division (1993-1995). Mr. Chiel is a director on the boards of the Boston Bar Foundation and the Maimonides School.
Robert A. Lawrence (1952)
Year of Election or Appointment: 2020
Trustee
Acting Chairman of the Board of Trustees
Mr. Lawrence also serves as Trustee of other funds. Previously, Mr. Lawrence served as a Member of the Advisory Board of certain funds. Prior to his retirement in 2008, Mr. Lawrence served as Vice President of certain Fidelity® funds (2006-2008), Senior Vice President, Head of High Income Division of Fidelity Management & Research Company (investment adviser firm, 2006-2008), and President of Fidelity Strategic Investments (investment adviser firm, 2002-2005).
* Determined to be an “Interested Trustee” by virtue of, among other things, his or her affiliation with the trust or various entities under common control with FMR.
+ The information includes the Trustee's principal occupation during the last five years and other information relating to the experience, attributes, and skills relevant to the Trustee's qualifications to serve as a Trustee, which led to the conclusion that the Trustee should serve as a Trustee for the fund.
Independent Trustees:
Correspondence intended for an Independent Trustee may be sent to Fidelity Investments, P.O. Box 55235, Boston, Massachusetts 02205-5235.
Name, Year of Birth; Principal Occupations and Other Relevant Experience+
Dennis J. Dirks (1948)
Year of Election or Appointment: 2005
Trustee
Mr. Dirks also serves as Trustee of other Fidelity® funds. Prior to his retirement in May 2003, Mr. Dirks served as Chief Operating Officer and as a member of the Board of The Depository Trust & Clearing Corporation (financial markets infrastructure), President, Chief Operating Officer and a member of the Board of The Depository Trust Company (DTC), President and a member of the Board of the National Securities Clearing Corporation (NSCC), Chief Executive Officer and a member of the Board of the Government Securities Clearing Corporation and Chief Executive Officer and a member of the Board of the Mortgage-Backed Securities Clearing Corporation. Mr. Dirks currently serves as a member of the Finance Committee (2016-present) and Board (2017-present) and is Treasurer (2018-present) of the Asolo Repertory Theatre.
Donald F. Donahue (1950)
Year of Election or Appointment: 2018
Trustee
Mr. Donahue also serves as Trustee of other Fidelity® funds. Mr. Donahue serves as President and Chief Executive Officer of Miranda Partners, LLC (risk consulting for the financial services industry, 2012-present). Previously, Mr. Donahue served as Chief Executive Officer (2006-2012), Chief Operating Officer (2003-2006) and Managing Director, Customer Marketing and Development (1999-2003) of The Depository Trust & Clearing Corporation (financial markets infrastructure). Mr. Donahue currently serves as a member (2007-present) and Co-Chairman (2016-present) of the Board of United Way of New York, a member of the Board of NYC Leadership Academy (2012-present) and a member of the Board of Advisors of Ripple Labs, Inc. (financial services, 2015-present). Mr. Donahue previously served as a member of the Advisory Board of certain Fidelity® funds (2015-2018).
Vicki L. Fuller (1957)
Year of Election or Appointment: 2020
Trustee
Ms. Fuller also serves as Trustee of other Fidelity® funds. Previously, Ms. Fuller served as a member of the Advisory Board of certain Fidelity® funds (2018-2020), Chief Investment Officer of the New York State Common Retirement Fund (2012-2018) and held a variety of positions at AllianceBernstein L.P. (global asset management, 1985-2012), including Managing Director (2006-2012) and Senior Vice President and Senior Portfolio Manager (2001-2006). Ms. Fuller currently serves as a member of the Board, Audit Committee and Nominating and Governance Committee of The Williams Companies, Inc. (natural gas infrastructure, 2018-present) and as a member of the Board of Treliant, LLC (consulting, 2019-present).
Patricia L. Kampling (1959)
Year of Election or Appointment: 2020
Trustee
Ms. Kampling also serves as Trustee of other Fidelity® funds. Prior to her retirement, Ms. Kampling served as Chairman of the Board and Chief Executive Officer (2012-2019), President and Chief Operating Officer (2011-2012) and Executive Vice President and Chief Financial Officer (2010-2011) of Alliant Energy Corporation. Ms. Kampling currently serves as a member of the Board, Compensation Committee and Executive Committee and as Chair of the Audit Committee of Briggs & Stratton Corporation (manufacturing, 2011-present) and as a member of the Board, Audit, Finance and Risk Committee and Safety, Environmental, Technology and Operations Committee of American Water Works Company, Inc. (utilities company, 2019-present). In addition, Ms. Kampling currently serves as a member of the Board of the Nature Conservancy, Wisconsin Chapter (2019-present). Previously, Ms. Kampling served as a Member of the Advisory Board of certain Fidelity® funds (2020), a member of the Board of Interstate Power and Light Company (2012-2019) and Wisconsin Power and Light Company (2012-2019) (each a subsidiary of Alliant Energy Corporation) and as a member of the Board and Workforce Development Committee of the Business Roundtable (2018-2019).
Alan J. Lacy (1953)
Year of Election or Appointment: 2008
Trustee
Mr. Lacy also serves as Trustee of other Fidelity® funds. Previously, Mr. Lacy served as Senior Adviser (2007-2014) of Oak Hill Capital Partners, L.P. (private equity), Chief Executive Officer (2005) and Vice Chairman (2005-2006) of Sears Holdings Corporation (retail), Chief Executive Officer and Chairman of the Board of Sears, Roebuck and Co. (retail, 2000-2005), Chairman (2014-2017) and a member of the Board (2010-2017) of Dave & Buster’s Entertainment, Inc. (restaurant and entertainment complexes) and a member of the Board of Bristol-Myers Squibb Company (global pharmaceuticals, 2008-2020). Mr. Lacy currently serves as a Trustee of the California Chapter of The Nature Conservancy (2015-present) and a member of the Board of the Center for Advanced Study in the Behavioral Sciences at Stanford University (2015-present).
Ned C. Lautenbach (1944)
Year of Election or Appointment: 2000
Trustee
Co-Lead Independent Trustee
Mr. Lautenbach also serves as Trustee of other Fidelity® funds. Mr. Lautenbach currently serves as Chair of the Board of Governors, State University System of Florida (2013-present) and is a member of the Council on Foreign Relations (1994-present). He is also a member and has in the past served as Chairman of the Board of Directors of Artis-Naples (2012-present). Previously, Mr. Lautenbach served as a member and then Lead Director of the Board of Directors of Eaton Corporation (diversified industrial, 1997-2016). He was also a Partner at Clayton, Dubilier & Rice, LLC (private equity investment, 1998-2010); as well as Director of Sony Corporation (2006-2007). In addition, Mr. Lautenbach had a 30-year career with IBM (technology company), during which time he served as Senior Vice President and as a member of the Corporate Executive Committee (1968-1998).
Joseph Mauriello (1944)
Year of Election or Appointment: 2008
Trustee
Mr. Mauriello also serves as Trustee of other Fidelity® funds. Prior to his retirement in January 2006, Mr. Mauriello served in numerous senior management positions including Deputy Chairman and Chief Operating Officer (2004-2005), and Vice Chairman of Financial Services (2002-2004) of KPMG LLP US (professional services, 1965-2005). Mr. Mauriello currently serves as a member of the Independent Directors Council Governing Council (2015-present). Previously, Mr. Mauriello served as a member of the Board of XL Group plc. (global insurance and re-insurance, 2006-2018).
Cornelia M. Small (1944)
Year of Election or Appointment: 2005
Trustee
Ms. Small also serves as Trustee of other Fidelity® funds. Previously, Ms. Small served as Chief Investment Officer, Director of Global Equity Investments and a member of Scudder, Stevens & Clark and Scudder Kemper Investments. Ms. Small previously served as a member of the Board (2009-2019) and Chair of the Investment Committee (2010-2019) of the Teagle Foundation and a member of the Investment Committee of the Berkshire Taconic Community Foundation (2008-2019).
Garnett A. Smith (1947)
Year of Election or Appointment: 2018
Trustee
Mr. Smith also serves as Trustee of other Fidelity® funds. Prior to his retirement, Mr. Smith served as Chairman and Chief Executive Officer (1990-1997) and President (1986-1990) of Inbrand Corp. (manufacturer of personal absorbent products). Prior to his employment with Inbrand Corp., he was employed by a retail fabric chain and North Carolina National Bank (now Bank of America). Mr. Smith previously served as a member of the Advisory Board of certain Fidelity® funds (2012-2013).
David M. Thomas (1949)
Year of Election or Appointment: 2008
Trustee
Co-Lead Independent Trustee
Mr. Thomas also serves as Trustee of other Fidelity® funds. Previously, Mr. Thomas served as Executive Chairman (2005-2006) and Chairman and Chief Executive Officer (2000-2005) of IMS Health, Inc. (pharmaceutical and healthcare information solutions). Mr. Thomas currently serves as Non-Executive Chairman of the Board of Fortune Brands Home and Security (home and security products, 2011-present), and a member of the Board (2004-present) and Presiding Director (2013-present) of Interpublic Group of Companies, Inc. (marketing communication).
Susan Tomasky (1953)
Year of Election or Appointment: 2020
Trustee
Ms. Tomasky also serves as Trustee of other Fidelity® funds. Prior to her retirement, Ms. Tomasky served in various executive officer positions at American Electric Power Company, Inc. (1998-2011), including most recently as President of AEP Transmission (2007-2011). Ms. Tomasky currently serves as a member of the Board and Sustainability Committee and as Chair of the Audit Committee of Marathon Petroleum Corporation (2018-present) and as a member of the Board, Corporate Governance Committee and Organization and Compensation Committee and as Chair of the Audit Committee of Public Service Enterprise Group, Inc. (utilities company, 2012-present). In addition, Ms. Tomasky currently serves as a member of the Board of the Columbus Regional Airport Authority (2007-present), as a member of the Board of the Royal Shakespeare Company – America (2009-present), as a member of the Board of the Columbus Association for the Performing Arts (2011-present) and as a member of the Board of Kenyon College (2016-present). Previously, Ms. Tomasky served as a Member of the Advisory Board of certain Fidelity® funds (2020), a member of the Board (2011-2019) and as Lead Independent Director (2015-2018) of Andeavor Corporation (previously Tesoro Corporation) (independent oil refiner and marketer) and as a member of the Board of Summit Midstream Partners LP (energy, 2012-2018).
Michael E. Wiley (1950)
Year of Election or Appointment: 2020
Trustee
Mr. Wiley also serves as Trustee of other Fidelity® funds. Previously, Mr. Wiley served as a member of the Advisory Board of certain Fidelity® funds (2018-2020), Chairman, President and CEO of Baker Hughes, Inc. (oilfield services, 2000-2004). Mr. Wiley also previously served as a member of the Board of Andeavor Corporation (independent oil refiner and marketer, 2005-2018), a member of the Board of Andeavor Logistics LP (natural resources logistics, 2015-2018) and a member of the Board of High Point Resources (exploration and production, 2005-2020).
+ The information includes the Trustee's principal occupation during the last five years and other information relating to the experience, attributes, and skills relevant to the Trustee's qualifications to serve as a Trustee, which led to the conclusion that the Trustee should serve as a Trustee for the fund.
Advisory Board Members and Officers:
Correspondence intended for a Member of the Advisory Board (if any) may be sent to Fidelity Investments, P.O. Box 55235, Boston, Massachusetts 02205-5235. Correspondence intended for an officer or Peter S. Lynch may be sent to Fidelity Investments, 245 Summer Street, Boston, Massachusetts 02210. Officers appear below in alphabetical order.
Name, Year of Birth; Principal Occupation
Peter S. Lynch (1944)
Year of Election or Appointment: 2003
Member of the Advisory Board
Mr. Lynch also serves as a Member of the Advisory Board of other Fidelity® funds. Mr. Lynch is Vice Chairman and a Director of Fidelity Management & Research Company LLC (investment adviser firm). In addition, Mr. Lynch serves as a Trustee of Boston College and as the Chairman of the Inner-City Scholarship Fund. Previously, Mr. Lynch served as Vice Chairman and a Director of FMR Co., Inc. (investment adviser firm) and on the Special Olympics International Board of Directors (1997-2006).
Elizabeth Paige Baumann (1968)
Year of Election or Appointment: 2017
Anti-Money Laundering (AML) Officer
Ms. Baumann also serves as AML Officer of other funds. She is Chief AML Officer (2012-present) and Senior Vice President (2014-present) of FMR LLC (diversified financial services company) and is an employee of Fidelity Investments. Previously, Ms. Baumann served as AML Officer of certain funds (2017-2019), as AML Officer of the funds (2012-2016), and Vice President (2007-2014) and Deputy Anti-Money Laundering Officer (2007-2012) of FMR LLC.
Craig S. Brown (1977)
Year of Election or Appointment: 2019
Assistant Treasurer
Mr. Brown also serves as Assistant Treasurer of other funds. Mr. Brown is an employee of Fidelity Investments (2013-present).
John J. Burke III (1964)
Year of Election or Appointment: 2018
Chief Financial Officer
Mr. Burke also serves as Chief Financial Officer of other funds. Mr. Burke serves as Head of Investment Operations for Fidelity Fund and Investment Operations (2018-present) and is an employee of Fidelity Investments (1998-present). Previously Mr. Burke served as head of Asset Management Investment Operations (2012-2018).
William C. Coffey (1969)
Year of Election or Appointment: 2019
Assistant Secretary
Mr. Coffey also serves as Assistant Secretary of other funds. He is Senior Vice President and Deputy General Counsel of FMR LLC (diversified financial services company, 2010-present), and is an employee of Fidelity Investments. Previously, Mr. Coffey served as Secretary and CLO of certain funds (2018-2019); CLO, Secretary, and Senior Vice President of Fidelity Management & Research Company and FMR Co., Inc. (investment adviser firms, 2018-2019); Secretary of Fidelity SelectCo, LLC and Fidelity Investments Money Management, Inc. (investment adviser firms, 2018-2019); CLO of Fidelity Management & Research (Hong Kong) Limited, FMR Investment Management (UK) Limited, and Fidelity Management & Research (Japan) Limited (investment adviser firms, 2018-2019); and Assistant Secretary of certain funds (2009-2018).
Timothy M. Cohen (1969)
Year of Election or Appointment: 2018
Vice President
Mr. Cohen also serves as Vice President of other funds. Mr. Cohen serves as Co-Head of Equity (2018-present), a Director of Fidelity Management & Research (Japan) Limited (investment adviser firm, 2016-present), and is an employee of Fidelity Investments. Previously, Mr. Cohen served as Executive Vice President of Fidelity SelectCo, LLC (2019), Head of Global Equity Research (2016-2018), Chief Investment Officer - Equity and a Director of Fidelity Management & Research (U.K.) Inc. (investment adviser firm, 2013-2015) and as a Director of Fidelity Management & Research (Hong Kong) Limited (investment adviser firm, 2017).
Jonathan Davis (1968)
Year of Election or Appointment: 2010
Assistant Treasurer
Mr. Davis also serves as Assistant Treasurer of other funds. Mr. Davis serves as Assistant Treasurer of FMR Capital, Inc. (2017-present) and is an employee of Fidelity Investments. Previously, Mr. Davis served as Vice President and Associate General Counsel of FMR LLC (diversified financial services company, 2003-2010).
Laura M. Del Prato (1964)
Year of Election or Appointment: 2018
Assistant Treasurer
Ms. Del Prato also serves as an officer of other funds. Ms. Del Prato is an employee of Fidelity Investments (2017-present). Previously, Ms. Del Prato served as President and Treasurer of The North Carolina Capital Management Trust: Cash Portfolio and Term Portfolio (2018-2020). Prior to joining Fidelity Investments, Ms. Del Prato served as a Managing Director and Treasurer of the JPMorgan Mutual Funds (2014-2017). Prior to JPMorgan, Ms. Del Prato served as a partner at Cohen Fund Audit Services (accounting firm, 2012-2013) and KPMG LLP (accounting firm, 2004-2012).
Colm A. Hogan (1973)
Year of Election or Appointment: 2020
Assistant Treasurer
Mr. Hogan also serves as an officer of other funds. Mr. Hogan serves as Assistant Treasurer of FMR Capital, Inc. (2017-present) and is an employee of Fidelity Investments (2005-present). Previously, Mr. Hogan served as Deputy Treasurer of certain Fidelity® funds (2016-2020) and Assistant Treasurer of certain Fidelity® funds (2016-2018).
Pamela R. Holding (1964)
Year of Election or Appointment: 2018
Vice President
Ms. Holding also serves as Vice President of other funds. Ms. Holding serves as Co-Head of Equity (2018-present) and is an employee of Fidelity Investments (2013-present). Previously, Ms. Holding served as Executive Vice President of Fidelity SelectCo, LLC (2019) and as Chief Investment Officer of Fidelity Institutional Asset Management (2013-2018).
Cynthia Lo Bessette (1969)
Year of Election or Appointment: 2019
Secretary and Chief Legal Officer (CLO)
Ms. Lo Bessette also serves as an officer of other funds. Ms. Lo Bessette serves as CLO, Secretary, and Senior Vice President of Fidelity Management & Research Company LLC (investment adviser firm, 2019-present); and CLO of Fidelity Management & Research (Hong Kong) Limited, FMR Investment Management (UK) Limited, and Fidelity Management & Research (Japan) Limited (investment adviser firms, 2019-present). She is a Senior Vice President and Deputy General Counsel of FMR LLC (diversified financial services company, 2019-present), and is an employee of Fidelity Investments. Previously, Ms. Lo Bessette served as CLO, Secretary, and Senior Vice President of FMR Co., Inc. (investment adviser firm, 2019); Secretary of Fidelity SelectCo, LLC and Fidelity Investments Money Management, Inc. (investment adviser firms, 2019). Prior to joining Fidelity Investments, Ms. Lo Bessette was Executive Vice President, General Counsel (2016-2019) and Senior Vice President, Deputy General Counsel (2015-2016) of OppenheimerFunds (investment management company) and Deputy Chief Legal Officer (2013-2015) of Jennison Associates LLC (investment adviser firm).
Chris Maher (1972)
Year of Election or Appointment: 2020
Deputy Treasurer
Mr. Maher also serves as an officer of other funds. Mr. Maher serves as Assistant Treasurer of FMR Capital, Inc. (2017-present), and is an employee of Fidelity Investments (2008-present). Previously, Mr. Maher served as Assistant Treasurer of certain funds (2013-2020); Vice President of Asset Management Compliance (2013), Vice President of the Program Management Group of FMR (investment adviser firm, 2010-2013), and Vice President of Valuation Oversight (2008-2010).
Jason P. Pogorelec (1975)
Year of Election or Appointment: 2020
Chief Compliance Officer
Mr. Pogorelec also serves as Chief Compliance Officer of other funds. Mr. Pogorelec is a senior Vice President of Asset Management Compliance for Fidelity Investments and is an employee of Fidelity Investments (2006-present). Previously, Mr. Pogorelec served as Vice President, Associate General Counsel for Fidelity Investments (2010-2020) and Assistant Secretary of certain Fidelity funds (2015-2020).
Stacie M. Smith (1974)
Year of Election or Appointment: 2016
President and Treasurer
Ms. Smith also serves as an officer of other funds. Ms. Smith serves as Assistant Treasurer of FMR Capital, Inc. (2017-present), is an employee of Fidelity Investments (2009-present), and has served in other fund officer roles. Prior to joining Fidelity Investments, Ms. Smith served as Senior Audit Manager of Ernst & Young LLP (accounting firm, 1996-2009). Previously, Ms. Smith served as Assistant Treasurer (2013-2019) and Deputy Treasurer (2013-2016) of certain Fidelity® funds.
Marc L. Spector (1972)
Year of Election or Appointment: 2016
Assistant Treasurer
Mr. Spector also serves as an officer of other funds. Mr. Spector serves as Assistant Treasurer of FMR Capital, Inc. (2017-present) and is an employee of Fidelity Investments (2016-present). Prior to joining Fidelity Investments, Mr. Spector served as Director at the Siegfried Group (accounting firm, 2013-2016), and prior to Siegfried Group as audit senior manager at Deloitte & Touche LLP (accounting firm, 2005-2013).
Jim Wegmann (1979)
Year of Election or Appointment: 2019
Assistant Treasurer
Mr. Wegmann also serves as Assistant Treasurer of other funds. Mr. Wegmann is an employee of Fidelity Investments (2011-present).
Shareholder Expense Example
As a shareholder, you incur two types of costs: (1) transaction costs, which may include sales charges (loads) on purchase payments or redemption proceeds, as applicable and (2) ongoing costs, which generally include management fees, distribution and/or service (12b-1) fees and other Fund expenses. This Example is intended to help you understand your ongoing costs (in dollars) of investing in a fund and to compare these costs with the ongoing costs of investing in other mutual funds.
The Example is based on an investment of $1,000 invested at the beginning of the period and held for the entire period (February 1, 2020 to July 31, 2020).
Actual Expenses
The first line of the accompanying table provides information about actual account values and actual expenses. You may use the information in this line, together with the amount you invested, to estimate the expenses that you paid over the period. Simply divide your account value by $1,000.00 (for example, an $8,600 account value divided by $1,000.00 = 8.6), then multiply the result by the number in the first line for a class/Fund under the heading entitled "Expenses Paid During Period" to estimate the expenses you paid on your account during this period. If any fund is a shareholder of any underlying mutual funds or exchange-traded funds (ETFs) (the Underlying Funds), such fund indirectly bears its proportional share of the expenses of the Underlying Funds in addition to the direct expenses incurred presented in the table. These fees and expenses are not included in the annualized expense ratio used to calculate the expense estimate in the table below.
Hypothetical Example for Comparison Purposes
The second line of the accompanying table provides information about hypothetical account values and hypothetical expenses based on the actual expense ratio and an assumed rate of return of 5% per year before expenses, which is not the actual return. The hypothetical account values and expenses may not be used to estimate the actual ending account balance or expenses you paid for the period. You may use this information to compare the ongoing costs of investing in the Fund and other funds. To do so, compare this 5% hypothetical example with the 5% hypothetical examples that appear in the shareholder reports of the other funds. If any fund is a shareholder of any Underlying Funds, such fund indirectly bears its proportional share of the expenses of the Underlying Funds in addition to the direct expenses as presented in the table. These fees and expenses are not included in the annualized expense ratio used to calculate the expense estimate in the table below.
Please note that the expenses shown in the table are meant to highlight your ongoing costs only and do not reflect any transaction costs. Therefore, the second line of the table is useful in comparing ongoing costs only, and will not help you determine the relative total costs of owning different funds. In addition, if these transactional costs were included, your costs would have been higher.
| | Annualized Expense Ratio-A | Beginning
Account Value
February 1, 2020 | Ending
Account Value
July 31, 2020 | Expenses Paid
During Period-B
February 1, 2020
to July 31, 2020 |
| Fidelity Small Cap Value Fund | | | | |
| Class A | 1.29% | | | |
| Actual | | $1,000.00 | $850.90 | $5.94 |
| Hypothetical-C | | $1,000.00 | $1,018.45 | $6.47 |
| Class M | 1.53% | | | |
| Actual | | $1,000.00 | $849.70 | $7.04 |
| Hypothetical-C | | $1,000.00 | $1,017.26 | $7.67 |
| Class C | 2.08% | | | |
| Actual | | $1,000.00 | $847.20 | $9.55 |
| Hypothetical-C | | $1,000.00 | $1,014.52 | $10.42 |
| Small Cap Value | 1.03% | | | |
| Actual | | $1,000.00 | $851.80 | $4.74 |
| Hypothetical-C | | $1,000.00 | $1,019.74 | $5.17 |
| Class I | 1.01% | | | |
| Actual | | $1,000.00 | $851.90 | $4.65 |
| Hypothetical-C | | $1,000.00 | $1,019.84 | $5.07 |
| Class Z | .85% | | | |
| Actual | | $1,000.00 | $852.40 | $3.91 |
| Hypothetical-C | | $1,000.00 | $1,020.64 | $4.27 |
A Annualized expense ratio reflects expenses net of applicable fee waivers.
B Expenses are equal to the annualized expense ratio, multiplied by the average account value over the period, multiplied by 182/ 366 (to reflect the one-half year period). The fees and expenses of any Underlying Funds are not included in each annualized expense ratio.
C 5% return per year before expenses
Distributions (Unaudited)
The fund hereby designates as a capital gain dividend with respect to the taxable year ended July 31, 2020, $15,024,959, or, if subsequently determined to be different, the net capital gain of such year.
A percentage of the dividends distributed during the fiscal year qualify for the dividends–received deduction for corporate shareholders:
| | Class A | Class M | Class C | Small Cap Value | Class I | Class Z |
| September 6, 2019 | 100% | – | – | 100% | 100% | 93% |
| December 20, 2019 | 93% | 100% | 100% | 81% | 81% | 75% |
A percentage of the dividends distributed during the fiscal year as amounts which may be taken into account as a dividend for purposes of the maximum rate under section 1(h)(11) of the Internal Revenue Code:
| | Class A | Class M | Class C | Small Cap Value | Class I | Class Z |
| September 6, 2019 | 100% | – | – | 100% | 100% | 100% |
| December 20, 2019 | 100% | 100% | 100% | 99% | 99% | 92% |
A percentage of the dividends distributed during the fiscal year as a section 199A dividend:
| | Class A | Class M | Class C | Small Cap Value | Class I | Class Z |
| September 6, 2019 | – | – | – | – | – | 1% |
| December 20, 2019 | – | – | – | 2% | 2% | 9% |
The fund will notify shareholders in January 2021 of amounts for use in preparing 2020 income tax returns.
Liquidity Risk Management Program
The Securities and Exchange Commission adopted Rule 22e-4 under the Investment Company Act of 1940 (the Liquidity Rule) to promote effective liquidity risk management throughout the open-end investment company industry, thereby reducing the risk that funds will be unable to meet their redemption obligations and mitigating dilution of the interests of fund shareholders.
The Fund has adopted and implemented a liquidity risk management program pursuant to the Liquidity Rule (the Program) effective December 1, 2018. The Program is reasonably designed to assess and manage the Fund’s liquidity risk and to comply with the requirements of the Liquidity Rule. The Fund’s Board of Trustees (the Board) has designated the Fund’s investment adviser as administrator of the Program. The Fidelity advisers have established a Liquidity Risk Management Committee (the LRM Committee) to manage the Program for each of the Fidelity Funds. The LRM Committee monitors the adequacy and effectiveness of implementation of the Program and on a periodic basis assesses each Fund’s liquidity risk based on a variety of factors including (1) the Fund’s investment strategy, (2) portfolio liquidity and cash flow projections during normal and reasonably foreseeable stressed conditions, (3) shareholder redemptions, (4) borrowings and other funding sources and (5) in the case of exchange-traded funds, certain additional factors including the effect of the Fund’s prices and spreads, market participants, and basket compositions on the overall liquidity of the Fund’s portfolio, as applicable.
In accordance with the Program, each of the Fund’s portfolio investments is classified into one of four liquidity categories described below based on a determination of a reasonable expectation for how long it would take to convert the investment to cash (or sell or dispose of the investment) without significantly changing its market value.
- Highly liquid investments – cash or convertible to cash within three business days or less
- Moderately liquid investments – convertible to cash in three to seven calendar days
- Less liquid investments – can be sold or disposed of, but not settled, within seven calendar days
- Illiquid investments – cannot be sold or disposed of within seven calendar days
Liquidity classification determinations take into account a variety of factors including various market, trading and investment-specific considerations, as well as market depth, and generally utilize analysis from a third-party liquidity metrics service.
The Liquidity Rule places a 15% limit on a fund’s illiquid investments and requires funds that do not primarily hold assets that are highly liquid investments to determine and maintain a minimum percentage of the fund’s net assets to be invested in highly liquid investments (highly liquid investment minimum or HLIM). The Program includes provisions reasonably designed to comply with the 15% limit on illiquid investments and for determining, periodically reviewing and complying with the HLIM requirement as applicable.
At a recent meeting of the Fund’s Board of Trustees, the LRM Committee provided a written report to the Board pertaining to the operation, adequacy, and effectiveness of implementation of the Program for the annual period from December 1, 2018 through November 30, 2019. The report concluded that the Program has been implemented and is operating effectively and is reasonably designed to assess and manage the Fund’s liquidity risk.
Proxy Voting Results
A special meeting of shareholders was held on June 9, 2020. The results of votes taken among shareholders on the proposal before them are reported below. Each vote reported represents one dollar of net asset value held on the record date for the meeting.
PROPOSAL 1
To elect a Board of Trustees.
| | # of
Votes | % of
Votes |
| Dennis J. Dirks |
| Affirmative | 43,167,428,219.785 | 94.885 |
| Withheld | 2,327,070,930.034 | 5.115 |
| TOTAL | 45,494,499,149.820 | 100.000 |
| Donald F. Donahue |
| Affirmative | 43,161,668,935.467 | 94.872 |
| Withheld | 2,333,065,287.611 | 5.128 |
| TOTAL | 45,494,734,223.077 | 100.000 |
| Bettina Doulton |
| Affirmative | 43,304,465,213.969 | 95.186 |
| Withheld | 2,190,010,062.903 | 4.814 |
| TOTAL | 45,494,475,276.872 | 100.000 |
| Vicki L. Fuller |
| Affirmative | 43,380,442,631.493 | 95.353 |
| Withheld | 2,114,180,614.639 | 4.647 |
| TOTAL | 45,494,623,246.132 | 100.000 |
| Patricia L. Kampling |
| Affirmative | 43,128,008,796.761 | 94.798 |
| Withheld | 2,366,685,422.999 | 5.202 |
| TOTAL | 45,494,694,219.760 | 100.000 |
| Alan J. Lacy |
| Affirmative | 42,904,065,046.958 | 94.305 |
| Withheld | 2,590,717,567.229 | 5.695 |
| TOTAL | 45,494,782,614.187 | 100.000 |
| Ned C. Lautenbach |
| Affirmative | 42,802,778,827.017 | 94.083 |
| Withheld | 2,692,003,787.170 | 5.917 |
| TOTAL | 45,494,782,614.187 | 100.000 |
| Robert A. Lawrence |
| Affirmative | 42,971,258,294.203 | 94.453 |
| Withheld | 2,523,524,319.984 | 5.547 |
| TOTAL | 45,494,782,614.187 | 100.000 |
| Joseph Mauriello |
| Affirmative | 42,874,562,778.490 | 94.241 |
| Withheld | 2,620,171,874.731 | 5.759 |
| TOTAL | 45,494,734,653.220 | 100.000 |
| Cornelia M. Small |
| Affirmative | 43,029,040,988.063 | 94.580 |
| Withheld | 2,465,741,626.124 | 5.420 |
| TOTAL | 45,494,782,614.187 | 100.000 |
| Garnett A. Smith |
| Affirmative | 42,892,814,945.159 | 94.281 |
| Withheld | 2,601,967,669.028 | 5.719 |
| TOTAL | 45,494,782,614.187 | 100.000 |
| David M. Thomas |
| Affirmative | 42,936,080,036.111 | 94.376 |
| Withheld | 2,558,702,578.076 | 5.624 |
| TOTAL | 45,494,782,614.187 | 100.000 |
| Susan Tomasky |
| Affirmative | 43,147,934,105.796 | 94.842 |
| Withheld | 2,346,571,066.028 | 5.158 |
| TOTAL | 45,494,782,614.187 | 100.000 |
| Michael E. Wiley |
| Affirmative | 42,885,333,102.972 | 94.264 |
| Withheld | 2,609,449,511.215 | 5.736 |
| TOTAL | 45,494,782,614.187 | 100.000 |
|
| Proposal 1 reflects trust wide proposal and voting results. |
SCV-ANN-0920
1.803706.115
Fidelity® Series Small Cap Opportunities Fund
Annual Report
July 31, 2020
See the inside front cover for important information about access to your fund’s shareholder reports.
Beginning on January 1, 2021, as permitted by regulations adopted by the Securities and Exchange Commission, paper copies of a fund’s shareholder reports will no longer be sent by mail, unless you specifically request paper copies of the reports from the fund or from your financial intermediary, such as a financial advisor, broker-dealer or bank. Instead, the reports will be made available on a website, and you will be notified by mail each time a report is posted and provided with a website link to access the report.
If you already elected to receive shareholder reports electronically, you will not be affected by this change and you need not take any action. You may elect to receive shareholder reports and other communications from a fund electronically, by contacting your financial intermediary. For Fidelity customers, visit Fidelity's web site or call Fidelity using the contact information listed below.
You may elect to receive all future reports in paper free of charge. If you wish to continue receiving paper copies of your shareholder reports, you may contact your financial intermediary or, if you are a Fidelity customer, visit Fidelity’s website, or call Fidelity at the applicable toll-free number listed below. Your election to receive reports in paper will apply to all funds held with the fund complex/your financial intermediary.
| Account Type | Website | Phone Number |
| Brokerage, Mutual Fund, or Annuity Contracts: | fidelity.com/mailpreferences | 1-800-343-3548 |
| Employer Provided Retirement Accounts: | netbenefits.fidelity.com/preferences (choose 'no' under Required Disclosures to continue to print) | 1-800-343-0860 |
| Advisor Sold Accounts Serviced Through Your Financial Intermediary: | Contact Your Financial Intermediary | Your Financial Intermediary's phone number |
| Advisor Sold Accounts Serviced by Fidelity: | institutional.fidelity.com | 1-877-208-0098 |
Contents
To view a fund's proxy voting guidelines and proxy voting record for the 12-month period ended June 30, visit http://www.fidelity.com/proxyvotingresults or visit the Securities and Exchange Commission's (SEC) web site at http://www.sec.gov.
You may also call 1-800-544-8544 to request a free copy of the proxy voting guidelines.
Standard & Poor's, S&P and S&P 500 are registered service marks of The McGraw-Hill Companies, Inc. and have been licensed for use by Fidelity Distributors Corporation.
Other third-party marks appearing herein are the property of their respective owners.
All other marks appearing herein are registered or unregistered trademarks or service marks of FMR LLC or an affiliated company. © 2020 FMR LLC. All rights reserved.
This report and the financial statements contained herein are submitted for the general information of the shareholders of the Fund. This report is not authorized for distribution to prospective investors in the Fund unless preceded or accompanied by an effective prospectus.
A fund files its complete schedule of portfolio holdings with the SEC for the first and third quarters of each fiscal year on Form N-PORT. Forms N-PORT are available on the SEC’s web site at http://www.sec.gov. A fund's Forms N-PORT may be reviewed and copied at the SEC’s Public Reference Room in Washington, DC. Information regarding the operation of the SEC's Public Reference Room may be obtained by calling 1-800-SEC-0330.
For a complete list of a fund's portfolio holdings, view the most recent holdings listing, semiannual report, or annual report on Fidelity's web site at http://www.fidelity.com, http://www.institutional.fidelity.com, or http://www.401k.com, as applicable.
NOT FDIC INSURED •MAY LOSE VALUE •NO BANK GUARANTEE
Neither the Fund nor Fidelity Distributors Corporation is a bank.
Note to Shareholders:
Early in 2020, the outbreak and spread of a new coronavirus emerged as a public health emergency that had a major influence on financial markets, primarily based on its impact on the global economy and the outlook for corporate earnings. The virus causes a respiratory disease known as COVID-19. On March 11, the World Health Organization declared the COVID-19 outbreak a pandemic, citing sustained risk of further global spread.
In the weeks following, as the crisis worsened, we witnessed an escalating human tragedy with wide-scale social and economic consequences from coronavirus-containment measures. The outbreak of COVID-19 prompted a number of measures to limit the spread, including travel and border restrictions, quarantines, and restrictions on large gatherings. In turn, these resulted in lower consumer activity, diminished demand for a wide range of products and services, disruption in manufacturing and supply chains, and – given the wide variability in outcomes regarding the outbreak – significant market uncertainty and volatility. Amid the turmoil, the U.S. government took unprecedented action – in concert with the U.S. Federal Reserve and central banks around the world – to help support consumers, businesses, and the broader economy, and to limit disruption to the financial system.
The situation continues to unfold, and the extent and duration of its impact on financial markets and the economy remain highly uncertain. Extreme events such as the coronavirus crisis are “exogenous shocks” that can have significant adverse effects on mutual funds and their investments. Although multiple asset classes may be affected by market disruption, the duration and impact may not be the same for all types of assets.
Fidelity is committed to helping you stay informed amid news about COVID-19 and during increased market volatility, and we’re taking extra steps to be responsive to customer needs. We encourage you to visit our websites, where we offer ongoing updates, commentary, and analysis on the markets and our funds.
Performance: The Bottom Line
Average annual total return reflects the change in the value of an investment, assuming reinvestment of distributions from dividend income and capital gains (the profits earned upon the sale of securities that have grown in value, if any) and assuming a constant rate of performance each year. The hypothetical investment and the average annual total returns do not reflect the deduction of taxes that a shareholder would pay on fund distributions or the redemption of fund shares. During periods of reimbursement by Fidelity, a fund’s total return will be greater than it would be had the reimbursement not occurred. How a fund did yesterday is no guarantee of how it will do tomorrow.
Average Annual Total Returns
| For the periods ended July 31, 2020 | Past 1 year | Past 5 years | Past 10 years |
| Fidelity® Series Small Cap Opportunities Fund | (3.44)% | 5.58% | 10.05% |
$10,000 Over 10 Years
Let's say hypothetically that $10,000 was invested in Fidelity® Series Small Cap Opportunities Fund on July 31, 2010.
The chart shows how the value of your investment would have changed, and also shows how the Russell 2000® Index performed over the same period.

| Period Ending Values |
| $26,051 | Fidelity® Series Small Cap Opportunities Fund |
| $26,100 | Russell 2000® Index |
Management's Discussion of Fund Performance
Market Recap: The S&P 500
® index gained 11.96% for the 12 months ending July 31, 2020, in what was a bumpy ride for U.S. equity investors, marked by a steep but brief decline due to the early-2020 outbreak and spread of the coronavirus, followed by a historic rebound. Declared a pandemic on March 11, the COVID-19 crisis and containment efforts caused broad contraction in economic activity, along with extreme uncertainty, volatility and dislocation in financial markets. By mid-March, U.S. stocks entered bear-market territory less than a month after hitting an all-time high and extending the longest-running bull market in American history. Stocks slid in late February, after a surge in COVID-19 cases outside China. The sudden downtrend continued in March (-12%), capping the index’s worst quarter since 2008. A historically rapid and expansive U.S. monetary/fiscal-policy response provided a partial offset to the economic disruption and fueled a sharp uptrend. Aggressive support for financial markets by the U.S. Federal Reserve, plans for reopening the economy and improving infection data boosted stocks in April (+13%) and May (+5%). In June and July, the index gained amid progress on potential treatments and signs of an early recovery in economic activity. For the full 12 months, growth stocks widely topped value, while large-caps handily bested smaller-caps. The information technology sector (+39%) led the way, followed by consumer discretionary (+22%). In contrast, energy (-38%) fell hard along with the price of crude oil.
Comments from Lead Manager Morgen Peck: For the fiscal year ending July 31, 2020, the fund returned -3.44%, outperforming the -4.59% result of the benchmark Russell 2000 Index. Versus the benchmark, security selection was the primary contributor, especially within the software & services area of the information technology sector. Security selection in real estate and materials also boosted the fund's relative result. The fund's largest individual relative contributor was an outsized stake in Five9, which gained 140% for the fund the past 12 months. We decreased our stake in this company by period end. Also lifting performance was our overweighting in Generac Holdings, which gained 117% for the fund. We reduced our Generac position the past year as well. Another notable relative contributor was our outsized stake in Allakos (+242% for the fund), a position not held at period end. Conversely, the largest detractor from performance versus the benchmark was stock selection in the financials sector, primarily within the banking industry. An underweighting in the health care sector, especially within the health care equipment & services industry, also hurt the relative result, as did security selection in utilities. The fund's largest individual relative detractor was our lighter-than-benchmark stake in Teladoc Health, which gained 183% for the fund the past 12 months. Teladoc Health was not held at period end. Also hampering performance was our outsized stake in Delek US Holdings, which returned -58% for the fund.
The views expressed above reflect those of the portfolio manager(s) only through the end of the period as stated on the cover of this report and do not necessarily represent the views of Fidelity or any other person in the Fidelity organization. Any such views are subject to change at any time based upon market or other conditions and Fidelity disclaims any responsibility to update such views. These views may not be relied on as investment advice and, because investment decisions for a Fidelity fund are based on numerous factors, may not be relied on as an indication of trading intent on behalf of any Fidelity fund.
Investment Summary (Unaudited)
Top Ten Stocks as of July 31, 2020
| | % of fund's net assets |
| Molina Healthcare, Inc. | 1.0 |
| LHC Group, Inc. | 0.9 |
| Simpson Manufacturing Co. Ltd. | 0.9 |
| Terreno Realty Corp. | 0.8 |
| Cabot Microelectronics Corp. | 0.8 |
| Bio-Rad Laboratories, Inc. Class A | 0.8 |
| Comfort Systems U.S.A., Inc. | 0.7 |
| Lithia Motors, Inc. Class A (sub. vtg.) | 0.7 |
| ESCO Technologies, Inc. | 0.7 |
| Louisiana-Pacific Corp. | 0.7 |
| | 8.0 |
Top Five Market Sectors as of July 31, 2020
| | % of fund's net assets |
| Health Care | 18.8 |
| Industrials | 15.1 |
| Financials | 15.0 |
| Information Technology | 14.5 |
| Consumer Discretionary | 12.3 |
Asset Allocation (% of fund's net assets)
| As of July 31, 2020 * |
| | Stocks and Equity Futures | 98.7% |
| | Short-Term Investments and Net Other Assets (Liabilities) | 1.3% |

* Foreign investments - 8.4%
Schedule of Investments July 31, 2020
Showing Percentage of Net Assets
| Common Stocks - 98.0% | | | |
| | | Shares | Value |
| COMMUNICATION SERVICES - 2.6% | | | |
| Diversified Telecommunication Services - 1.1% | | | |
| Bandwidth, Inc. (a)(b) | | 108,009 | $15,637,543 |
| Cogent Communications Group, Inc. | | 243,131 | 21,908,534 |
| Iridium Communications, Inc. (a) | | 687,792 | 18,838,623 |
| | | | 56,384,700 |
| Media - 1.5% | | | |
| 4Imprint Group PLC | | 263,898 | 8,221,531 |
| Cogeco Communications, Inc. | | 131,396 | 10,015,702 |
| Nexstar Broadcasting Group, Inc. Class A | | 126,561 | 11,093,072 |
| TechTarget, Inc. (a) | | 329,585 | 11,960,640 |
| Tegna, Inc. | | 1,561,142 | 18,390,253 |
| The New York Times Co. Class A (b) | | 258,830 | 11,942,416 |
| | | | 71,623,614 |
|
| TOTAL COMMUNICATION SERVICES | | | 128,008,314 |
|
| CONSUMER DISCRETIONARY - 12.3% | | | |
| Auto Components - 1.0% | | | |
| Fox Factory Holding Corp. (a)(b) | | 250,800 | 22,321,200 |
| Standard Motor Products, Inc. | | 275,634 | 12,535,834 |
| Stoneridge, Inc. (a) | | 809,600 | 16,774,912 |
| | | | 51,631,946 |
| Hotels, Restaurants & Leisure - 3.2% | | | |
| Boyd Gaming Corp. | | 750,000 | 17,752,500 |
| Churchill Downs, Inc. | | 242,700 | 33,618,804 |
| Dunkin' Brands Group, Inc. | | 227,700 | 15,649,821 |
| Marriott Vacations Worldwide Corp. | | 260,800 | 22,079,328 |
| Texas Roadhouse, Inc. Class A | | 424,300 | 23,841,417 |
| Wendy's Co. | | 692,600 | 16,054,468 |
| Wingstop, Inc. | | 186,500 | 29,140,625 |
| | | | 158,136,963 |
| Household Durables - 2.7% | | | |
| Helen of Troy Ltd. (a) | | 134,379 | 25,296,847 |
| M.D.C. Holdings, Inc. | | 633,900 | 28,417,737 |
| Skyline Champion Corp. (a) | | 692,698 | 19,554,865 |
| Taylor Morrison Home Corp. (a) | | 1,227,900 | 28,794,255 |
| TopBuild Corp. (a) | | 225,489 | 29,746,509 |
| | | | 131,810,213 |
| Leisure Products - 1.5% | | | |
| Acushnet Holdings Corp. (b) | | 408,600 | 15,547,230 |
| Brunswick Corp. | | 252,700 | 16,925,846 |
| Clarus Corp. | | 711,992 | 8,529,664 |
| Johnson Outdoors, Inc. Class A | | 163,093 | 14,280,423 |
| YETI Holdings, Inc. (a)(b) | | 380,000 | 18,578,200 |
| | | | 73,861,363 |
| Specialty Retail - 1.8% | | | |
| Dick's Sporting Goods, Inc. | | 309,900 | 14,137,638 |
| Lithia Motors, Inc. Class A (sub. vtg.) | | 154,800 | 35,472,420 |
| Murphy U.S.A., Inc. (a) | | 178,600 | 23,648,426 |
| Williams-Sonoma, Inc. | | 159,300 | 13,878,216 |
| | | | 87,136,700 |
| Textiles, Apparel & Luxury Goods - 2.1% | | | |
| Carter's, Inc. | | 146,500 | 11,532,480 |
| Crocs, Inc. (a) | | 711,800 | 25,582,092 |
| Deckers Outdoor Corp. (a) | | 155,900 | 32,622,075 |
| G-III Apparel Group Ltd. (a)(b) | | 1,040,600 | 10,291,534 |
| Oxford Industries, Inc. (b) | | 243,600 | 10,460,184 |
| Steven Madden Ltd. | | 741,615 | 15,707,406 |
| | | | 106,195,771 |
|
| TOTAL CONSUMER DISCRETIONARY | | | 608,772,956 |
|
| CONSUMER STAPLES - 3.4% | | | |
| Food & Staples Retailing - 1.1% | | | |
| BJ's Wholesale Club Holdings, Inc. (a) | | 723,500 | 28,976,175 |
| Casey's General Stores, Inc. | | 90,600 | 14,422,614 |
| Grocery Outlet Holding Corp. (a) | | 209,300 | 9,207,107 |
| | | | 52,605,896 |
| Food Products - 1.5% | | | |
| Freshpet, Inc. (a) | | 217,700 | 20,910,085 |
| Nomad Foods Ltd. (a) | | 683,800 | 15,768,428 |
| Post Holdings, Inc. (a) | | 151,000 | 13,399,740 |
| The Simply Good Foods Co. (a) | | 896,000 | 21,539,840 |
| | | | 71,618,093 |
| Household Products - 0.5% | | | |
| Central Garden & Pet Co. (a) | | 343,000 | 12,985,980 |
| Reynolds Consumer Products, Inc. | | 347,000 | 11,818,820 |
| | | | 24,804,800 |
| Personal Products - 0.3% | | | |
| BellRing Brands, Inc. Class A (a) | | 841,900 | 16,728,553 |
|
| TOTAL CONSUMER STAPLES | | | 165,757,342 |
|
| ENERGY - 2.0% | | | |
| Energy Equipment & Services - 0.2% | | | |
| Liberty Oilfield Services, Inc. Class A (b) | | 2,193,554 | 12,393,580 |
| Oil, Gas & Consumable Fuels - 1.8% | | | |
| Delek U.S. Holdings, Inc. (b) | | 945,400 | 16,525,592 |
| Diamondback Energy, Inc. | | 341,893 | 13,627,855 |
| EQT Corp. | | 1,018,100 | 14,782,812 |
| Northern Oil & Gas, Inc. (a)(b) | | 13,711,062 | 10,989,416 |
| PDC Energy, Inc. (a) | | 1,224,877 | 17,466,746 |
| WPX Energy, Inc. (a) | | 2,195,910 | 13,109,583 |
| | | | 86,502,004 |
|
| TOTAL ENERGY | | | 98,895,584 |
|
| FINANCIALS - 15.0% | | | |
| Banks - 8.7% | | | |
| Camden National Corp. | | 392,324 | 12,432,748 |
| City Holding Co. | | 322,278 | 20,129,484 |
| Community Bank System, Inc. | | 398,300 | 22,396,409 |
| ConnectOne Bancorp, Inc. | | 1,637,647 | 22,583,152 |
| First Bancorp, Puerto Rico | | 4,171,694 | 22,694,015 |
| First Citizens Bancshares, Inc. | | 62,300 | 26,531,701 |
| First Interstate Bancsystem, Inc. | | 900,838 | 26,223,394 |
| First Merchants Corp. | | 1,081,870 | 26,430,084 |
| Glacier Bancorp, Inc. | | 979,319 | 34,579,754 |
| Heartland Financial U.S.A., Inc. | | 887,043 | 27,711,223 |
| Independent Bank Corp., Massachusetts | | 449,781 | 29,019,870 |
| Preferred Bank, Los Angeles | | 512,101 | 19,075,762 |
| Signature Bank | | 235,800 | 24,176,574 |
| Stock Yards Bancorp, Inc. | | 301,213 | 11,774,416 |
| Synovus Financial Corp. | | 1,169,200 | 23,559,380 |
| Trico Bancshares | | 973,643 | 27,262,004 |
| United Community Bank, Inc. | | 1,489,681 | 26,709,980 |
| Western Alliance Bancorp. | | 646,100 | 23,227,295 |
| | | | 426,517,245 |
| Capital Markets - 2.7% | | | |
| AllianceBernstein Holding LP | | 726,652 | 20,644,183 |
| Cohen & Steers, Inc. | | 222,800 | 13,408,104 |
| Hamilton Lane, Inc. Class A | | 198,698 | 14,353,944 |
| Houlihan Lokey | | 439,178 | 24,066,954 |
| Lazard Ltd. Class A | | 652,100 | 19,119,572 |
| Moelis & Co. Class A (b) | | 455,100 | 13,557,429 |
| Morningstar, Inc. | | 52,138 | 8,761,270 |
| PJT Partners, Inc. | | 400,620 | 21,445,189 |
| | | | 135,356,645 |
| Consumer Finance - 0.4% | | | |
| First Cash Financial Services, Inc. | | 333,800 | 19,240,232 |
| Diversified Financial Services - 0.5% | | | |
| Cannae Holdings, Inc. (a) | | 666,997 | 25,132,447 |
| Insurance - 2.0% | | | |
| Amerisafe, Inc. | | 316,672 | 20,096,005 |
| First American Financial Corp. | | 502,300 | 25,622,323 |
| Old Republic International Corp. | | 947,100 | 15,219,897 |
| Primerica, Inc. | | 195,000 | 23,333,700 |
| White Mountains Insurance Group Ltd. | | 17,592 | 15,483,247 |
| | | | 99,755,172 |
| Thrifts & Mortgage Finance - 0.7% | | | |
| Essent Group Ltd. | | 627,600 | 22,486,908 |
| NMI Holdings, Inc. (a) | | 634,708 | 9,850,668 |
| | | | 32,337,576 |
|
| TOTAL FINANCIALS | | | 738,339,317 |
|
| HEALTH CARE - 18.8% | | | |
| Biotechnology - 10.6% | | | |
| ACADIA Pharmaceuticals, Inc. (a) | | 2 | 83 |
| Acceleron Pharma, Inc. (a) | | 159,700 | 15,837,449 |
| ADC Therapeutics SA (a) | | 347,505 | 16,158,983 |
| Agios Pharmaceuticals, Inc. (a) | | 202,545 | 9,179,339 |
| Amicus Therapeutics, Inc. (a) | | 1,364,200 | 19,712,690 |
| Aprea Therapeutics, Inc. | | 384,700 | 10,552,321 |
| Arcutis Biotherapeutics, Inc. (a)(b) | | 622,373 | 16,617,359 |
| Argenx SE ADR (a) | | 126,600 | 29,134,458 |
| Ascendis Pharma A/S sponsored ADR (a) | | 155,748 | 21,432,482 |
| ChemoCentryx, Inc. (a) | | 353,000 | 18,606,630 |
| Crinetics Pharmaceuticals, Inc. (a) | | 619,928 | 8,604,601 |
| FibroGen, Inc. (a) | | 522,900 | 21,161,763 |
| G1 Therapeutics, Inc. (a) | | 567,400 | 8,323,758 |
| Immunomedics, Inc. (a)(b) | | 498,500 | 21,051,655 |
| Insmed, Inc. (a) | | 936,000 | 24,448,320 |
| Intercept Pharmaceuticals, Inc. (a)(b) | | 223,698 | 10,209,577 |
| Ionis Pharmaceuticals, Inc. (a) | | 152,372 | 8,770,532 |
| Kura Oncology, Inc. (a) | | 824,238 | 13,550,473 |
| Mirati Therapeutics, Inc. (a) | | 183,600 | 22,272,516 |
| Morphic Holding, Inc. (a) | | 479,962 | 10,803,945 |
| Neurocrine Biosciences, Inc. (a) | | 194,400 | 23,397,984 |
| Passage Bio, Inc. | | 271,740 | 4,250,014 |
| Poseida Therapeutics, Inc. (a)(b) | | 58,500 | 759,330 |
| Principia Biopharma, Inc. (a) | | 346,700 | 28,984,120 |
| Protagonist Therapeutics, Inc. (a) | | 1,390,429 | 21,871,448 |
| PTC Therapeutics, Inc. (a) | | 472,600 | 21,895,558 |
| Revolution Medicines, Inc. | | 534,400 | 12,889,728 |
| Sage Therapeutics, Inc. (a) | | 134,175 | 6,114,355 |
| Sarepta Therapeutics, Inc. (a) | | 131,400 | 20,172,528 |
| Stoke Therapeutics, Inc. (a) | | 26,996 | 680,029 |
| TG Therapeutics, Inc. (a)(b) | | 1,279,000 | 25,042,820 |
| Turning Point Therapeutics, Inc. (a) | | 283,400 | 16,785,782 |
| Viela Bio, Inc. | | 537,982 | 19,695,521 |
| Xenon Pharmaceuticals, Inc. (a) | | 1,038,759 | 11,353,636 |
| Zymeworks, Inc. (a) | | 144,600 | 4,414,638 |
| | | | 524,736,425 |
| Health Care Equipment & Supplies - 1.6% | | | |
| Haemonetics Corp. (a) | | 185,300 | 16,243,398 |
| Masimo Corp. (a) | | 101,000 | 22,232,120 |
| Nevro Corp. (a) | | 195,100 | 25,940,496 |
| Quidel Corp. (a) | | 59,403 | 16,779,565 |
| | | | 81,195,579 |
| Health Care Providers & Services - 2.4% | | | |
| Chemed Corp. | | 48,500 | 23,871,215 |
| LHC Group, Inc. (a) | | 234,900 | 45,831,339 |
| Molina Healthcare, Inc. (a) | | 265,600 | 49,056,317 |
| | | | 118,758,871 |
| Health Care Technology - 1.1% | | | |
| HMS Holdings Corp. (a) | | 791,600 | 25,727,000 |
| Inspire Medical Systems, Inc. (a) | | 269,743 | 26,801,664 |
| | | | 52,528,664 |
| Life Sciences Tools & Services - 1.9% | | | |
| Berkeley Lights, Inc. (a) | | 6,300 | 377,811 |
| Bio-Rad Laboratories, Inc. Class A (a) | | 72,800 | 38,211,992 |
| Bruker Corp. | | 558,300 | 24,911,346 |
| Syneos Health, Inc. (a) | | 485,207 | 30,272,065 |
| | | | 93,773,214 |
| Pharmaceuticals - 1.2% | | | |
| Arvinas Holding Co. LLC (a) | | 437,900 | 13,793,850 |
| IMARA, Inc. | | 299,898 | 6,054,941 |
| MyoKardia, Inc. (a) | | 273,115 | 24,615,855 |
| Theravance Biopharma, Inc. (a) | | 683,172 | 13,267,200 |
| | | | 57,731,846 |
|
| TOTAL HEALTH CARE | | | 928,724,599 |
|
| INDUSTRIALS - 15.1% | | | |
| Aerospace & Defense - 0.9% | | | |
| Kaman Corp. | | 539,543 | 21,306,553 |
| Teledyne Technologies, Inc. (a) | | 71,112 | 21,810,050 |
| | | | 43,116,603 |
| Air Freight & Logistics - 0.6% | | | |
| Air Transport Services Group, Inc. (a) | | 1,230,469 | 29,986,530 |
| Building Products - 2.1% | | | |
| Armstrong World Industries, Inc. | | 275,963 | 19,659,604 |
| Fortune Brands Home & Security, Inc. | | 248,400 | 19,002,600 |
| Jeld-Wen Holding, Inc. (a) | | 1,134,600 | 22,238,160 |
| Simpson Manufacturing Co. Ltd. | | 454,085 | 43,846,448 |
| | | | 104,746,812 |
| Commercial Services & Supplies - 1.1% | | | |
| MSA Safety, Inc. | | 178,300 | 21,133,899 |
| Tetra Tech, Inc. | | 353,416 | 31,330,328 |
| | | | 52,464,227 |
| Construction & Engineering - 2.1% | | | |
| Comfort Systems U.S.A., Inc. | | 723,330 | 35,956,734 |
| Construction Partners, Inc. Class A (a)(b) | | 914,102 | 15,128,388 |
| EMCOR Group, Inc. | | 474,098 | 32,475,713 |
| Jacobs Engineering Group, Inc. | | 214,373 | 18,296,736 |
| | | | 101,857,571 |
| Electrical Equipment - 1.4% | | | |
| Atkore International Group, Inc. (a) | | 1,180,081 | 31,472,760 |
| Bloom Energy Corp. Class A (a) | | 689,900 | 8,389,184 |
| Generac Holdings, Inc. (a) | | 200,473 | 31,590,535 |
| | | | 71,452,479 |
| Machinery - 3.7% | | | |
| Allison Transmission Holdings, Inc. | | 492,861 | 18,413,287 |
| ESCO Technologies, Inc. | | 410,978 | 35,319,449 |
| Federal Signal Corp. | | 796,421 | 24,617,373 |
| ITT, Inc. | | 514,785 | 29,718,538 |
| Kadant, Inc. | | 192,400 | 20,877,324 |
| Oshkosh Corp. | | 236,700 | 18,633,024 |
| SPX Flow, Inc. (a) | | 858,507 | 34,408,961 |
| | | | 181,987,956 |
| Professional Services - 1.6% | | | |
| ASGN, Inc. (a) | | 437,200 | 29,930,712 |
| CBIZ, Inc. (a) | | 885,225 | 21,404,741 |
| TriNet Group, Inc. (a) | | 397,500 | 26,235,000 |
| | | | 77,570,453 |
| Road & Rail - 0.8% | | | |
| Landstar System, Inc. | | 130,229 | 15,859,288 |
| Saia, Inc. (a) | | 218,000 | 26,040,100 |
| | | | 41,899,388 |
| Trading Companies & Distributors - 0.8% | | | |
| Rush Enterprises, Inc. Class A | | 342,276 | 16,285,492 |
| Univar, Inc. (a) | | 1,275,654 | 22,540,806 |
| | | | 38,826,298 |
|
| TOTAL INDUSTRIALS | | | 743,908,317 |
|
| INFORMATION TECHNOLOGY - 14.5% | | | |
| Electronic Equipment & Components - 2.7% | | | |
| ePlus, Inc. (a) | | 311,922 | 23,250,666 |
| Fabrinet (a) | | 417,174 | 30,299,348 |
| II-VI, Inc. (a)(b) | | 583,900 | 29,615,408 |
| Insight Enterprises, Inc. (a) | | 493,700 | 24,606,008 |
| TTM Technologies, Inc. (a) | | 1,912,485 | 23,542,690 |
| | | | 131,314,120 |
| IT Services - 3.6% | | | |
| CACI International, Inc. Class A (a) | | 92,171 | 19,154,977 |
| Endava PLC ADR (a) | | 524,006 | 27,064,910 |
| EPAM Systems, Inc. (a) | | 59,548 | 17,273,684 |
| ExlService Holdings, Inc. (a) | | 390,284 | 25,001,593 |
| ManTech International Corp. Class A | | 329,944 | 22,957,504 |
| Perspecta, Inc. | | 1,035,309 | 22,155,613 |
| Shift4 Payments, Inc. | | 422,700 | 16,189,410 |
| WNS Holdings Ltd. sponsored ADR (a) | | 436,603 | 27,925,128 |
| | | | 177,722,819 |
| Semiconductors & Semiconductor Equipment - 4.0% | | | |
| Advanced Energy Industries, Inc. (a) | | 438,699 | 32,275,085 |
| Cabot Microelectronics Corp. | | 259,400 | 39,096,768 |
| Diodes, Inc. (a) | | 238,566 | 12,274,221 |
| Entegris, Inc. | | 391,313 | 28,139,318 |
| MKS Instruments, Inc. | | 197,400 | 25,156,656 |
| Semtech Corp. (a) | | 494,600 | 27,564,058 |
| Synaptics, Inc. (a) | | 405,500 | 32,448,110 |
| | | | 196,954,216 |
| Software - 4.2% | | | |
| Altair Engineering, Inc. Class A (a)(b) | | 468,300 | 18,872,490 |
| Cerence, Inc. (a)(b) | | 388,100 | 15,392,046 |
| Everbridge, Inc. (a)(b) | | 153,600 | 21,934,080 |
| Five9, Inc. (a) | | 234,500 | 28,332,290 |
| Manhattan Associates, Inc. (a) | | 254,100 | 24,340,239 |
| Model N, Inc. (a) | | 614,900 | 23,649,054 |
| Pegasystems, Inc. | | 131,000 | 15,312,590 |
| Ping Identity Holding Corp. (a)(b) | | 455,900 | 15,664,724 |
| Tenable Holdings, Inc. (a) | | 720,100 | 24,432,993 |
| Workiva, Inc. (a) | | 388,800 | 21,733,920 |
| | | | 209,664,426 |
|
| TOTAL INFORMATION TECHNOLOGY | | | 715,655,581 |
|
| MATERIALS - 4.0% | | | |
| Chemicals - 1.4% | | | |
| Chase Corp. (b) | | 202,794 | 20,392,965 |
| Innospec, Inc. | | 358,600 | 26,955,962 |
| Olin Corp. | | 728,700 | 8,190,588 |
| Tronox Holdings PLC | | 1,906,700 | 14,529,054 |
| | | | 70,068,569 |
| Construction Materials - 0.4% | | | |
| Eagle Materials, Inc. | | 271,600 | 21,790,468 |
| Containers & Packaging - 0.3% | | | |
| O-I Glass, Inc. | | 1,459,500 | 15,237,180 |
| Metals & Mining - 1.2% | | | |
| B2Gold Corp. | | 4,774,200 | 33,076,693 |
| Commercial Metals Co. | | 1,124,500 | 23,254,660 |
| | | | 56,331,353 |
| Paper & Forest Products - 0.7% | | | |
| Louisiana-Pacific Corp. | | 1,107,300 | 35,068,191 |
|
| TOTAL MATERIALS | | | 198,495,761 |
|
| REAL ESTATE - 7.0% | | | |
| Equity Real Estate Investment Trusts (REITs) - 6.5% | | | |
| Americold Realty Trust | | 778,600 | 31,416,510 |
| CoreSite Realty Corp. | | 226,000 | 29,165,300 |
| CubeSmart | | 813,600 | 24,139,512 |
| Equity Lifestyle Properties, Inc. | | 353,158 | 24,127,755 |
| Four Corners Property Trust, Inc. | | 1,161,800 | 29,277,360 |
| Lexington Corporate Properties Trust | | 2,839,300 | 32,935,880 |
| Potlatch Corp. | | 739,400 | 31,653,714 |
| Rexford Industrial Realty, Inc. | | 615,100 | 28,866,643 |
| RLJ Lodging Trust | | 2,913,700 | 23,338,737 |
| Sunstone Hotel Investors, Inc. | | 3,391,400 | 25,367,672 |
| Terreno Realty Corp. | | 669,400 | 40,672,744 |
| | | | 320,961,827 |
| Real Estate Management & Development - 0.5% | | | |
| Cushman & Wakefield PLC (a) | | 2,144,500 | 22,946,150 |
|
| TOTAL REAL ESTATE | | | 343,907,977 |
|
| UTILITIES - 3.3% | | | |
| Electric Utilities - 1.5% | | | |
| Allete, Inc. | | 353,800 | 20,980,340 |
| Hawaiian Electric Industries, Inc. (b) | | 254,700 | 9,235,422 |
| IDACORP, Inc. | | 167,800 | 15,647,350 |
| PNM Resources, Inc. (b) | | 604,862 | 25,543,322 |
| | | | 71,406,434 |
| Gas Utilities - 0.8% | | | |
| Brookfield Infrastructure Corp. A Shares | | 424,900 | 19,392,436 |
| Spire, Inc. | | 321,608 | 19,830,349 |
| | | | 39,222,785 |
| Independent Power and Renewable Electricity Producers - 0.7% | | | |
| Clearway Energy, Inc. Class C | | 805,900 | 19,776,786 |
| Vistra Corp. | | 714,751 | 13,337,254 |
| | | | 33,114,040 |
| Multi-Utilities - 0.3% | | | |
| Algonquin Power & Utilities Corp. (b) | | 1,201,300 | 16,565,927 |
|
| TOTAL UTILITIES | | | 160,309,186 |
|
| TOTAL COMMON STOCKS | | | |
| (Cost $4,074,973,192) | | | 4,830,774,934 |
| | | Principal Amount | Value |
|
| U.S. Treasury Obligations - 0.1% | | | |
| U.S. Treasury Bills, yield at date of purchase 0.13% 9/3/20 | | | |
| (Cost $2,689,671) | | 2,690,000 | 2,689,786 |
| | | Shares | Value |
|
| Money Market Funds - 4.4% | | | |
| Fidelity Cash Central Fund 0.14% (c) | | 68,509,248 | $68,529,801 |
| Fidelity Securities Lending Cash Central Fund 0.13% (c)(d) | | 150,879,411 | 150,894,499 |
| TOTAL MONEY MARKET FUNDS | | | |
| (Cost $219,418,618) | | | 219,424,300 |
| TOTAL INVESTMENT IN SECURITIES - 102.5% | | | |
| (Cost $4,297,081,481) | | | 5,052,889,020 |
| NET OTHER ASSETS (LIABILITIES) - (2.5)% | | | (121,696,890) |
| NET ASSETS - 100% | | | $4,931,192,130 |
| Futures Contracts | | | | | |
| | Number of contracts | Expiration Date | Notional Amount | Value | Unrealized Appreciation/(Depreciation) |
| Purchased | | | | | |
| Equity Index Contracts | | | | | |
| CME E-mini Russell 2000 Index Contracts (United States) | 461 | Sept. 2020 | $34,063,290 | $278,573 | $278,573 |
The notional amount of futures purchased as a percentage of Net Assets is 0.7%
Legend
(a) Non-income producing
(b) Security or a portion of the security is on loan at period end.
(c) Affiliated fund that is generally available only to investment companies and other accounts managed by Fidelity Investments. The rate quoted is the annualized seven-day yield of the fund at period end. A complete unaudited listing of the fund's holdings as of its most recent quarter end is available upon request. In addition, each Fidelity Central Fund's financial statements, which are not covered by the Fund's Report of Independent Registered Public Accounting Firm, are available on the SEC's website or upon request.
(d) Investment made with cash collateral received from securities on loan.
Affiliated Central Funds
Information regarding fiscal year to date income earned by the Fund from investments in Fidelity Central Funds is as follows:
| Fund | Income earned |
| Fidelity Cash Central Fund | $1,413,442 |
| Fidelity Securities Lending Cash Central Fund | 484,099 |
| Total | $1,897,541 |
Amounts in the income column in the above table include any capital gain distributions from underlying funds, which are presented in the corresponding line-item in the Statement of Operations, if applicable. Amount for Fidelity Securities Lending Cash Central Fund represents the income earned on investing cash collateral, less rebates paid to borrowers and any lending agent fees associated with the loan, plus any premium payments received for lending certain types of securities.
Investment Valuation
The following is a summary of the inputs used, as of July 31, 2020, involving the Fund's assets and liabilities carried at fair value. The inputs or methodology used for valuing securities may not be an indication of the risk associated with investing in those securities. For more information on valuation inputs, and their aggregation into the levels used below, please refer to the Investment Valuation section in the accompanying Notes to Financial Statements.
| | Valuation Inputs at Reporting Date: |
| Description | Total | Level 1 | Level 2 | Level 3 |
| Investments in Securities: | | | | |
| Equities: | | | | |
| Communication Services | $128,008,314 | $128,008,314 | $-- | $-- |
| Consumer Discretionary | 608,772,956 | 608,772,956 | -- | -- |
| Consumer Staples | 165,757,342 | 165,757,342 | -- | -- |
| Energy | 98,895,584 | 98,895,584 | -- | -- |
| Financials | 738,339,317 | 738,339,317 | -- | -- |
| Health Care | 928,724,599 | 928,724,599 | -- | -- |
| Industrials | 743,908,317 | 743,908,317 | -- | -- |
| Information Technology | 715,655,581 | 715,655,581 | -- | -- |
| Materials | 198,495,761 | 198,495,761 | -- | -- |
| Real Estate | 343,907,977 | 343,907,977 | -- | -- |
| Utilities | 160,309,186 | 160,309,186 | -- | -- |
| U.S. Government and Government Agency Obligations | 2,689,786 | -- | 2,689,786 | -- |
| Money Market Funds | 219,424,300 | 219,424,300 | -- | -- |
| Total Investments in Securities: | $5,052,889,020 | $5,050,199,234 | $2,689,786 | $-- |
| Derivative Instruments: | | | | |
| Assets | | | | |
| Futures Contracts | $278,573 | $278,573 | $-- | $-- |
| Total Assets | $278,573 | $278,573 | $-- | $-- |
| Total Derivative Instruments: | $278,573 | $278,573 | $-- | $-- |
Value of Derivative Instruments
The following table is a summary of the Fund's value of derivative instruments by primary risk exposure as of July 31, 2020. For additional information on derivative instruments, please refer to the Derivative Instruments section in the accompanying Notes to Financial Statements.
| Primary Risk Exposure / Derivative Type | Value |
| | Asset | Liability |
| Equity Risk | | |
| Futures Contracts(a) | $278,573 | $0 |
| Total Equity Risk | 278,573 | 0 |
| Total Value of Derivatives | $278,573 | $0 |
(a) Reflects gross cumulative appreciation (depreciation) on futures contracts as presented in the Schedule of Investments. In the Statement of Assets and Liabilities, the period end daily variation margin is included in receivable or payable for daily variation margin on futures contracts, and the net cumulative appreciation (depreciation) is included in Total accumulated earnings (loss).
See accompanying notes which are an integral part of the financial statements.
Financial Statements
Statement of Assets and Liabilities
| | | July 31, 2020 |
| Assets | | |
Investment in securities, at value (including securities loaned of $145,170,903) — See accompanying schedule:
Unaffiliated issuers (cost $4,077,662,863) | $4,833,464,720 | |
| Fidelity Central Funds (cost $219,418,618) | 219,424,300 | |
| Total Investment in Securities (cost $4,297,081,481) | | $5,052,889,020 |
| Receivable for investments sold | | 42,415,271 |
| Receivable for fund shares sold | | 3,980,877 |
| Dividends receivable | | 1,389,279 |
| Distributions receivable from Fidelity Central Funds | | 78,159 |
| Receivable for daily variation margin on futures contracts | | 278,573 |
| Other receivables | | 317,153 |
| Total assets | | 5,101,348,332 |
| Liabilities | | |
| Payable to custodian bank | $4,544,716 | |
| Payable for investments purchased | 6,630,884 | |
| Payable for fund shares redeemed | 8,061,796 | |
| Other payables and accrued expenses | 30,088 | |
| Collateral on securities loaned | 150,888,718 | |
| Total liabilities | | 170,156,202 |
| Net Assets | | $4,931,192,130 |
| Net Assets consist of: | | |
| Paid in capital | | $4,237,224,619 |
| Total accumulated earnings (loss) | | 693,967,511 |
| Net Assets | | $4,931,192,130 |
| Net Asset Value, offering price and redemption price per share ($4,931,192,130 ÷ 389,490,483 shares) | | $12.66 |
See accompanying notes which are an integral part of the financial statements.
Statement of Operations
| | | Year ended July 31, 2020 |
| Investment Income | | |
| Dividends | | $57,725,118 |
| Interest | | 66,917 |
| Income from Fidelity Central Funds (including $484,099 from security lending) | | 1,897,541 |
| Total income | | 59,689,576 |
| Expenses | | |
| Custodian fees and expenses | $73,381 | |
| Independent trustees' fees and expenses | 32,855 | |
| Miscellaneous | 12,724 | |
| Total expenses | | 118,960 |
| Net investment income (loss) | | 59,570,616 |
| Realized and Unrealized Gain (Loss) | | |
| Net realized gain (loss) on: | | |
| Investment securities: | | |
| Unaffiliated issuers | (24,752,352) | |
| Fidelity Central Funds | 371 | |
| Foreign currency transactions | (1,421) | |
| Futures contracts | (3,081,389) | |
| Total net realized gain (loss) | | (27,834,791) |
| Change in net unrealized appreciation (depreciation) on: | | |
| Investment securities: | | |
| Unaffiliated issuers | (200,546,492) | |
| Fidelity Central Funds | 4,062 | |
| Assets and liabilities in foreign currencies | 31,540 | |
| Futures contracts | (84,410) | |
| Total change in net unrealized appreciation (depreciation) | | (200,595,300) |
| Net gain (loss) | | (228,430,091) |
| Net increase (decrease) in net assets resulting from operations | | $(168,859,475) |
See accompanying notes which are an integral part of the financial statements.
Statement of Changes in Net Assets
| | Year ended July 31, 2020 | Year ended July 31, 2019 |
| Increase (Decrease) in Net Assets | | |
| Operations | | |
| Net investment income (loss) | $59,570,616 | $64,419,488 |
| Net realized gain (loss) | (27,834,791) | 407,626,897 |
| Change in net unrealized appreciation (depreciation) | (200,595,300) | (363,323,342) |
| Net increase (decrease) in net assets resulting from operations | (168,859,475) | 108,723,043 |
| Distributions to shareholders | (370,412,069) | (659,882,676) |
| Share transactions | | |
| Proceeds from sales of shares | 697,418,642 | 506,733,820 |
| Reinvestment of distributions | 370,412,069 | 659,882,676 |
| Cost of shares redeemed | (1,264,824,598) | (945,329,771) |
| Net increase (decrease) in net assets resulting from share transactions | (196,993,887) | 221,286,725 |
| Total increase (decrease) in net assets | (736,265,431) | (329,872,908) |
| Net Assets | | |
| Beginning of period | 5,667,457,561 | 5,997,330,469 |
| End of period | $4,931,192,130 | $5,667,457,561 |
| Other Information | | |
| Shares | | |
| Sold | 55,543,419 | 37,656,564 |
| Issued in reinvestment of distributions | 27,933,067 | 47,034,659 |
| Redeemed | (97,637,825) | (68,970,531) |
| Net increase (decrease) | (14,161,339) | 15,720,692 |
See accompanying notes which are an integral part of the financial statements.
Financial Highlights
Fidelity Series Small Cap Opportunities Fund
| | | | | | |
| Years ended July 31, | 2020 | 2019 | 2018 | 2017 | 2016 |
| Selected Per–Share Data | | | | | |
| Net asset value, beginning of period | $14.04 | $15.46 | $14.42 | $12.94 | $13.83 |
| Income from Investment Operations | | | | | |
| Net investment income (loss)A | .15 | .15 | .16 | .06 | .06 |
| Net realized and unrealized gain (loss) | (.60) | .12 | 2.44 | 1.52 | (.22) |
| Total from investment operations | (.45) | .27 | 2.60 | 1.58 | (.16) |
| Distributions from net investment income | (.16) | (.14) | (.12) | (.07) | (.05) |
| Distributions from net realized gain | (.77) | (1.55) | (1.45) | (.03) | (.68) |
| Total distributions | (.93) | (1.69) | (1.56)B | (.10) | (.73) |
| Net asset value, end of period | $12.66 | $14.04 | $15.46 | $14.42 | $12.94 |
| Total ReturnC | (3.44)% | 1.98% | 19.84% | 12.22% | (.94)% |
| Ratios to Average Net AssetsD,E | | | | | |
| Expenses before reductions | - %F | - %F | - %F | .66% | .85% |
| Expenses net of fee waivers, if any | - %F | - %F | - %F | .66% | .85% |
| Expenses net of all reductions | - %F | - %F | - %F | .65% | .84% |
| Net investment income (loss) | 1.17% | 1.13% | 1.10% | .42% | .46% |
| Supplemental Data | | | | | |
| Net assets, end of period (000 omitted) | $4,931,192 | $5,667,458 | $5,997,330 | $2,509,347 | $2,433,489 |
| Portfolio turnover rateG | 61%H | 59% | 68% | 58% | 58% |
A Calculated based on average shares outstanding during the period.
B Total distributions of $1.56 per share is comprised of distributions from net investment income of $.117 and distributions from net realized gain of $1.447 per share.
C Total returns would have been lower if certain expenses had not been reduced during the applicable periods shown.
D Fees and expenses of any underlying mutual funds or exchange-traded funds (ETFs) are not included in the Fund's expense ratio. The Fund indirectly bears its proportionate share of these expenses. For additional expense information related to investments in Fidelity Central Funds, please refer to the "Investments in Fidelity Central Funds" note found in the Notes to Financial Statements section of the most recent Annual or Semi-Annual report.
E Expense ratios reflect operating expenses of the Fund. Expenses before reductions do not reflect amounts reimbursed by the investment adviser or reductions from brokerage service arrangements or reductions from other expense offset arrangements and do not represent the amount paid by the Fund during periods when reimbursements or reductions occur. Expenses net of fee waivers reflect expenses after reimbursement by the investment adviser but prior to reductions from brokerage service arrangements or other expense offset arrangements. Expenses net of all reductions represent the net expenses paid by the Fund.
F Amount represents less than .005%.
G Amount does not include the portfolio activity of any underlying Fidelity Central Funds.
H Portfolio turnover rate excludes securities received or delivered in-kind.
See accompanying notes which are an integral part of the financial statements.
Notes to Financial Statements
For the period ended July 31, 2020
1. Organization.
Fidelity Series Small Cap Opportunities Fund (the Fund) is a fund of Fidelity Securities Fund (the Trust) and is authorized to issue an unlimited number of shares. Shares are offered only to certain other Fidelity funds and Fidelity managed 529 plans. The Trust is registered under the Investment Company Act of 1940, as amended (the 1940 Act), as an open-end management investment company organized as a Massachusetts business trust.
Effective January 1, 2020:
Investment advisers Fidelity Investments Money Management, Inc., FMR Co., Inc., and Fidelity SelectCo, LLC, merged with and into Fidelity Management & Research Company. In connection with the merger transactions, the resulting, merged investment adviser was then redomiciled from Massachusetts to Delaware, changed its corporate structure from a corporation to a limited liability company, and changed its name to "Fidelity Management & Research Company LLC".
2. Investments in Fidelity Central Funds.
The Fund invests in Fidelity Central Funds, which are open-end investment companies generally available only to other investment companies and accounts managed by the investment adviser and its affiliates. The Fund's Schedule of Investments lists each of the Fidelity Central Funds held as of period end, if any, as an investment of the Fund, but does not include the underlying holdings of each Fidelity Central Fund. As an Investing Fund, the Fund indirectly bears its proportionate share of the expenses of the underlying Fidelity Central Funds.
The Money Market Central Funds seek preservation of capital and current income and are managed by the investment adviser. Annualized expenses of the Money Market Central Funds as of their most recent shareholder report date ranged from less than .005% to .01%.
A complete unaudited list of holdings for each Fidelity Central Fund is available upon request or at the Securities and Exchange Commission (the SEC) website at www.sec.gov. In addition, the financial statements of the Fidelity Central Funds, which are not covered by the Fund's Report of Independent Registered Public Accounting Firm, are available on the SEC website or upon request.
3. Significant Accounting Policies.
The Fund is an investment company and applies the accounting and reporting guidance of the Financial Accounting Standards Board (FASB) Accounting Standards Codification Topic 946 Financial Services – Investment Companies. The financial statements have been prepared in conformity with accounting principles generally accepted in the United States of America (GAAP), which require management to make certain estimates and assumptions at the date of the financial statements. Actual results could differ from those estimates. Subsequent events, if any, through the date that the financial statements were issued have been evaluated in the preparation of the financial statements. The following summarizes the significant accounting policies of the Fund:
Investment Valuation. Investments are valued as of 4:00 p.m. Eastern time on the last calendar day of the period. The Board of Trustees (the Board) has delegated the day to day responsibility for the valuation of the Fund's investments to the Fair Value Committee (the Committee) established by the Fund's investment adviser. In accordance with valuation policies and procedures approved by the Board, the Fund attempts to obtain prices from one or more third party pricing vendors or brokers to value its investments. When current market prices, quotations or currency exchange rates are not readily available or reliable, investments will be fair valued in good faith by the Committee, in accordance with procedures adopted by the Board. Factors used in determining fair value vary by investment type and may include market or investment specific events, changes in interest rates and credit quality. The frequency with which these procedures are used cannot be predicted and they may be utilized to a significant extent. The Committee oversees the Fund's valuation policies and procedures and reports to the Board on the Committee's activities and fair value determinations. The Board monitors the appropriateness of the procedures used in valuing the Fund's investments and ratifies the fair value determinations of the Committee.
The Fund categorizes the inputs to valuation techniques used to value its investments into a disclosure hierarchy consisting of three levels as shown below:
- Level 1 – quoted prices in active markets for identical investments
- Level 2 – other significant observable inputs (including quoted prices for similar investments, interest rates, prepayment speeds, etc.)
- Level 3 – unobservable inputs (including the Fund's own assumptions based on the best information available)
Valuation techniques used to value the Fund's investments by major category are as follows:
Equity securities, including restricted securities, for which market quotations are readily available, are valued at the last reported sale price or official closing price as reported by a third party pricing vendor on the primary market or exchange on which they are traded and are categorized as Level 1 in the hierarchy. In the event there were no sales during the day or closing prices are not available, securities are valued at the last quoted bid price or may be valued using the last available price and are generally categorized as Level 2 in the hierarchy. For foreign equity securities, when market or security specific events arise, comparisons to the valuation of American Depositary Receipts (ADRs), futures contracts, Exchange-Traded Funds (ETFs) and certain indexes as well as quoted prices for similar securities may be used and would be categorized as Level 2 in the hierarchy. For equity securities, including restricted securities, where observable inputs are limited, assumptions about market activity and risk are used and these securities may be categorized as Level 3 in the hierarchy.
Debt securities, including restricted securities, are valued based on evaluated prices received from third party pricing vendors or from brokers who make markets in such securities. U.S. government and government agency obligations are valued by pricing vendors who utilize matrix pricing which considers yield or price of bonds of comparable quality, coupon, maturity and type or by broker-supplied prices. When independent prices are unavailable or unreliable, debt securities may be valued utilizing pricing methodologies which consider similar factors that would be used by third party pricing vendors. Debt securities are generally categorized as Level 2 in the hierarchy but may be Level 3 depending on the circumstances.
Futures contracts are valued at the settlement price established each day by the board of trade or exchange on which they are traded and are categorized as Level 1 in the hierarchy. Investments in open-end mutual funds ,including the Fidelity Central Funds, are valued at their closing net asset value (NAV) each business day and are categorized as Level 1 in the hierarchy.
Changes in valuation techniques may result in transfers in or out of an assigned level within the disclosure hierarchy. The aggregate value of investments by input level as of July 31, 2020 is included at the end of the Fund's Schedule of Investments.
Foreign Currency. The Fund may use foreign currency contracts to facilitate transactions in foreign-denominated securities. Gains and losses from these transactions may arise from changes in the value of the foreign currency or if the counterparties do not perform under the contracts' terms.
Foreign-denominated assets, including investment securities, and liabilities are translated into U.S. dollars at the exchange rates at period end. Purchases and sales of investment securities, income and dividends received and expenses denominated in foreign currencies are translated into U.S. dollars at the exchange rate in effect on the transaction date.
The effects of exchange rate fluctuations on investments are included with the net realized and unrealized gain (loss) on investment securities. Other foreign currency transactions resulting in realized and unrealized gain (loss) are disclosed separately.
Investment Transactions and Income. For financial reporting purposes, the Fund's investment holdings and NAV include trades executed through the end of the last business day of the period. The NAV per share for processing shareholder transactions is calculated as of the close of business of the New York Stock Exchange (NYSE), normally 4:00 p.m. Eastern time and includes trades executed through the end of the prior business day. Gains and losses on securities sold are determined on the basis of identified cost and include proceeds received from litigation. Dividend income is recorded on the ex-dividend date, except for certain dividends from foreign securities where the ex-dividend date may have passed, which are recorded as soon as the Fund is informed of the ex-dividend date. Non-cash dividends included in dividend income, if any, are recorded at the fair market value of the securities received. Income and capital gain distributions from Fidelity Central Funds, if any, are recorded on the ex-dividend date. Certain distributions received by the Fund represent a return of capital or capital gain. The Fund determines the components of these distributions subsequent to the ex-dividend date, based upon receipt of tax filings or other correspondence relating to the underlying investment. These distributions are recorded as a reduction of cost of investments and/or as a realized gain. Interest income is accrued as earned and includes coupon interest and amortization of premium and accretion of discount on debt securities as applicable. Investment income is recorded net of foreign taxes withheld where recovery of such taxes is uncertain.
Expenses. Expenses directly attributable to a fund are charged to that fund. Expenses attributable to more than one fund are allocated among the respective funds on the basis of relative net assets or other appropriate methods. Expense estimates are accrued in the period to which they relate and adjustments are made when actual amounts are known.
Income Tax Information and Distributions to Shareholders. Each year, the Fund intends to qualify as a regulated investment company under Subchapter M of the Internal Revenue Code, including distributing substantially all of its taxable income and realized gains. As a result, no provision for U.S. Federal income taxes is required. As of July 31, 2020, the Fund did not have any unrecognized tax benefits in the financial statements; nor is the Fund aware of any tax positions for which it is reasonably possible that the total amounts of unrecognized tax benefits will significantly change in the next twelve months. The Fund files a U.S. federal tax return, in addition to state and local tax returns as required. The Fund's federal income tax returns are subject to examination by the Internal Revenue Service (IRS) for a period of three fiscal years after they are filed. State and local tax returns may be subject to examination for an additional fiscal year depending on the jurisdiction. Foreign taxes are provided for based on the Fund's understanding of the tax rules and rates that exist in the foreign markets in which it invests.
Distributions are declared and recorded on the ex-dividend date. Income and capital gain distributions are determined in accordance with income tax regulations, which may differ from GAAP.
Capital accounts within the financial statements are adjusted for permanent book-tax differences. These adjustments have no impact on net assets or the results of operations. Capital accounts are not adjusted for temporary book-tax differences which will reverse in a subsequent period.
Book-tax differences are primarily due to futures contracts, foreign currency transactions, market discount, partnerships, passive foreign investment companies (PFIC), capital loss carryforwards and losses deferred due to wash sales and excise tax regulations.
As of period end, the cost and unrealized appreciation (depreciation) in securities, and derivatives if applicable, for federal income tax purposes were as follows:
| Gross unrealized appreciation | $1,117,377,472 |
| Gross unrealized depreciation | (383,874,855) |
| Net unrealized appreciation (depreciation) | $733,502,617 |
| Tax Cost | $4,319,386,403 |
The tax-based components of distributable earnings as of period end were as follows:
| Undistributed ordinary income | $28,949,982 |
| Capital loss carryforward | $(68,496,247) |
| Net unrealized appreciation (depreciation) on securities and other investments | $733,513,777 |
Capital loss carryforwards are only available to offset future capital gains of the Fund to the extent provided by regulations and may be limited. The capital loss carryforward information presented below, including any applicable limitation, is estimated as of fiscal period end and is subject to adjustment.
| No expiration | |
| Short-term | $(68,496,247) |
The tax character of distributions paid was as follows:
| | July 31, 2020 | July 31, 2019 |
| Ordinary Income | $65,433,454 | $ 190,031,648 |
| Long-term Capital Gains | 304,978,615 | 469,851,028 |
| Total | $370,412,069 | $ 659,882,676 |
4. Derivative Instruments.
Risk Exposures and the Use of Derivative Instruments. The Fund's investment objective allows the Fund to enter into various types of derivative contracts, including futures contracts. Derivatives are investments whose value is primarily derived from underlying assets, indices or reference rates and may be transacted on an exchange or over-the-counter (OTC). Derivatives may involve a future commitment to buy or sell a specified asset based on specified terms, to exchange future cash flows at periodic intervals based on a notional principal amount, or for one party to make one or more payments upon the occurrence of specified events in exchange for periodic payments from the other party.
The Fund used derivatives to increase returns and to manage exposure to certain risks as defined below. The success of any strategy involving derivatives depends on analysis of numerous economic factors, and if the strategies for investment do not work as intended, the Fund may not achieve its objectives.
The Fund's use of derivatives increased or decreased its exposure to the following risk:
| Equity Risk | Equity risk relates to the fluctuations in the value of financial instruments as a result of changes in market prices (other than those arising from interest rate risk or foreign exchange risk), whether caused by factors specific to an individual investment, its issuer, or all factors affecting all instruments traded in a market or market segment.
|
The Fund is also exposed to additional risks from investing in derivatives, such as liquidity risk and counterparty credit risk. Liquidity risk is the risk that the Fund will be unable to close out the derivative in the open market in a timely manner. Counterparty credit risk is the risk that the counterparty will not be able to fulfill its obligation to the Fund. Counterparty credit risk related to exchange-traded futures contracts may be mitigated by the protection provided by the exchange on which they trade.
Investing in derivatives may involve greater risks than investing in the underlying assets directly and, to varying degrees, may involve risk of loss in excess of any initial investment and collateral received and amounts recognized in the Statement of Assets and Liabilities. In addition, there may be the risk that the change in value of the derivative contract does not correspond to the change in value of the underlying instrument.
Futures Contracts. A futures contract is an agreement between two parties to buy or sell a specified underlying instrument for a fixed price at a specified future date. The Fund used futures contracts to manage its exposure to the stock market.
Upon entering into a futures contract, a fund is required to deposit either cash or securities (initial margin) with a clearing broker in an amount equal to a certain percentage of the face value of the contract. Futures contracts are marked-to-market daily and subsequent daily payments (variation margin) are made or received by a fund depending on the daily fluctuations in the value of the futures contracts and are recorded as unrealized appreciation or (depreciation). This receivable and/or payable, if any, is included in daily variation margin on futures contracts in the Statement of Assets and Liabilities. Realized gain or (loss) is recorded upon the expiration or closing of a futures contract. The net realized gain (loss) and change in net unrealized appreciation (depreciation) on futures contracts during the period is presented in the Statement of Operations.
Any open futures contracts at period end are presented in the Schedule of Investments under the caption "Futures Contracts". The notional amount at value reflects each contract's exposure to the underlying instrument or index at period end and is representative of volume of activity during the period. Securities deposited to meet initial margin requirements are identified in the Schedule of Investments.
5. Purchases and Sales of Investments.
Purchases and sales of securities, other than short-term securities and in-kind transactions, are noted in the table below.
| | Purchases ($) | Sales ($) |
| Fidelity Series Small Cap Opportunities Fund | 3,061,011,818 | 3,759,245,776 |
6. Fees and Other Transactions with Affiliates.
Management Fee. Fidelity Management & Research Company LLC (the investment adviser) and its affiliates provide the Fund with investment management related services for which the Fund does not pay a management fee. Under the management contract, the investment adviser or an affiliate pays all ordinary operating expenses of the Fund, except custody fees, fees and expenses of the independent Trustees, and certain miscellaneous expenses such as proxy and shareholder meeting expenses.
Brokerage Commissions. A portion of portfolio transactions were placed with brokerage firms which are affiliates of the investment adviser. Brokerage commissions are included in net realized gain (loss) and change in net unrealized appreciation (depreciation) in the Statement of Operations. The commissions paid to these affiliated firms were as follows:
| | Amount |
| Fidelity Series Small Cap Opportunities Fund | $156,941 |
Interfund Trades. Funds may purchase from or sell securities to other Fidelity Funds under procedures adopted by the Board. The procedures have been designed to ensure these interfund trades are executed in accordance with Rule 17a-7 of the 1940 Act. Interfund trades are included within the respective purchases and sales amounts shown in the Purchases and Sales of Investments note.
Other. During the period, the investment adviser reimbursed the Fund for certain losses in the amount of $109,435.
Affiliated Exchanges In-Kind. During the period, the Fund received investments and cash valued at $177,449,561 in exchange for 13,874,086 shares of the Fund. The amount of in-kind exchanges is included in share transactions in the accompanying Statement of Changes in Net Assets.
7. Committed Line of Credit.
Certain Funds participate with other funds managed by the investment adviser or an affiliate in a $4.25 billion credit facility (the "line of credit") to be utilized for temporary or emergency purposes to fund shareholder redemptions or for other short-term liquidity purposes. The participating funds have agreed to pay commitment fees on their pro-rata portion of the line of credit, which are reflected in Miscellaneous expenses on the Statement of Operations, and are as follows:
| | Amount |
| Fidelity Series Small Cap Opportunities Fund | $12,659 |
During the period, there were no borrowings on this line of credit.
8. Security Lending.
The Fund lends portfolio securities from time to time in order to earn additional income. Lending agents are used, including National Financial Services (NFS), an affiliate of the Fund. Pursuant to a securities lending agreement, NFS will receive a fee, which is capped at 9.9% of daily lending revenue, for its services as lending agent. The Fund may lend securities to certain qualified borrowers, including NFS. On the settlement date of the loan, the Fund receives collateral (in the form of U.S. Treasury obligations, letters of credit and/or cash) against the loaned securities and maintains collateral in an amount not less than 100% of the market value of the loaned securities during the period of the loan. The market value of the loaned securities is determined at the close of business of the Fund and any additional required collateral is delivered to the Fund on the next business day. The Fund or borrower may terminate the loan at any time, and if the borrower defaults on its obligation to return the securities loaned because of insolvency or other reasons, the Fund may apply collateral received from the borrower against the obligation. The Fund may experience delays and costs in recovering the securities loaned. Any cash collateral received is invested in the Fidelity Securities Lending Cash Central Fund. The value of loaned securities and cash collateral at period end are disclosed on the Fund's Statement of Assets and Liabilities. At period end, there were no security loans outstanding with NFS, as affiliated borrower. Total fees paid by the Fund to NFS, as lending agent, amounted to $46,120. Security lending income represents the income earned on investing cash collateral, less rebates paid to borrowers and any lending agent fees associated with the loan, plus any premium payments received for lending certain types of securities. Net income from the Fidelity Securities Lending Cash Central Fund during the period is presented in the Statement of Operations as a component of income from Fidelity Central Funds (and includes $6,924 from securities loaned to NFS, as affiliated borrower).
9. Other.
The Fund's organizational documents provide former and current trustees and officers with a limited indemnification against liabilities arising in connection with the performance of their duties to the Fund. In the normal course of business, the Fund may also enter into contracts that provide general indemnifications. The Fund's maximum exposure under these arrangements is unknown as this would be dependent on future claims that may be made against the Fund. The risk of material loss from such claims is considered remote.
At the end of the period, mutual funds and accounts managed by the investment adviser or its affiliates were the owners of record of all of the outstanding shares of the Fund.
10. Coronavirus (COVID-19) Pandemic.
An outbreak of COVID-19 first detected in China during December 2019 has since spread globally and was declared a pandemic by the World Health Organization during March 2020. Developments that disrupt global economies and financial markets, such as the COVID-19 pandemic, may magnify factors that affect the Fund's performance.
Report of Independent Registered Public Accounting Firm
To the Board of Trustees of Fidelity Securities Fund and Shareholders of Fidelity Series Small Cap Opportunities Fund:
Opinion on the Financial Statements and Financial Highlights
We have audited the accompanying statement of assets and liabilities of Fidelity Series Small Cap Opportunities Fund (the "Fund"), a fund of Fidelity Securities Fund, including the schedule of investments, as of July 31, 2020, the related statement of operations for the year then ended, the statement of changes in net assets for each of the two years in the period then ended, the financial highlights for each of the five years in the period then ended, and the related notes. In our opinion, the financial statements and financial highlights present fairly, in all material respects, the financial position of the Fund as of July 31, 2020, and the results of its operations for the year then ended, the changes in its net assets for each of the two years in the period then ended, and the financial highlights for each of the five years in the period then ended in conformity with accounting principles generally accepted in the United States of America.
Basis for Opinion
These financial statements and financial highlights are the responsibility of the Fund's management. Our responsibility is to express an opinion on the Fund's financial statements and financial highlights based on our audits. We are a public accounting firm registered with the Public Company Accounting Oversight Board (United States) (PCAOB) and are required to be independent with respect to the Fund in accordance with the U.S. federal securities laws and the applicable rules and regulations of the Securities and Exchange Commission and the PCAOB.
We conducted our audits in accordance with the standards of the PCAOB. Those standards require that we plan and perform the audit to obtain reasonable assurance about whether the financial statements and financial highlights are free of material misstatement, whether due to error or fraud. The Fund is not required to have, nor were we engaged to perform, an audit of its internal control over financial reporting. As part of our audits we are required to obtain an understanding of internal control over financial reporting but not for the purpose of expressing an opinion on the effectiveness of the Fund’s internal control over financial reporting. Accordingly, we express no such opinion.
Our audits included performing procedures to assess the risks of material misstatement of the financial statements and financial highlights, whether due to error or fraud, and performing procedures that respond to those risks. Such procedures included examining, on a test basis, evidence regarding the amounts and disclosures in the financial statements and financial highlights. Our audits also included evaluating the accounting principles used and significant estimates made by management, as well as evaluating the overall presentation of the financial statements and financial highlights. Our procedures included confirmation of securities owned as of July 31, 2020, by correspondence with the custodian and brokers ; when replies were not received from brokers, we performed other auditing procedures. We believe that our audits provide a reasonable basis for our opinion.
/s/ Deloitte & Touche LLP
Boston, Massachusetts
September 14, 2020
We have served as the auditor of one or more of the Fidelity investment companies since 1999.
Trustees and Officers
The Trustees, Members of the Advisory Board (if any), and officers of the trust and fund, as applicable, are listed below. The Board of Trustees governs the fund and is responsible for protecting the interests of shareholders. The Trustees are experienced executives who meet periodically throughout the year to oversee the fund's activities, review contractual arrangements with companies that provide services to the fund, oversee management of the risks associated with such activities and contractual arrangements, and review the fund's performance. Except for Jonathan Chiel, each of the Trustees oversees 311 funds. Mr. Chiel oversees 174 funds.
The Trustees hold office without limit in time except that (a) any Trustee may resign; (b) any Trustee may be removed by written instrument, signed by at least two-thirds of the number of Trustees prior to such removal; (c) any Trustee who requests to be retired or who has become incapacitated by illness or injury may be retired by written instrument signed by a majority of the other Trustees; and (d) any Trustee may be removed at any special meeting of shareholders by a two-thirds vote of the outstanding voting securities of the trust. Each Trustee who is not an interested person (as defined in the 1940 Act) of the trust and the fund is referred to herein as an Independent Trustee. Each Independent Trustee shall retire not later than the last day of the calendar year in which his or her 75th birthday occurs. The Independent Trustees may waive this mandatory retirement age policy with respect to individual Trustees. Officers and Advisory Board Members hold office without limit in time, except that any officer or Advisory Board Member may resign or may be removed by a vote of a majority of the Trustees at any regular meeting or any special meeting of the Trustees. Except as indicated, each individual has held the office shown or other offices in the same company for the past five years.
The fund’s Statement of Additional Information (SAI) includes more information about the Trustees. To request a free copy, call Fidelity at 1-877-208-0098.
Experience, Skills, Attributes, and Qualifications of the Trustees. The Governance and Nominating Committee has adopted a statement of policy that describes the experience, qualifications, attributes, and skills that are necessary and desirable for potential Independent Trustee candidates (Statement of Policy). The Board believes that each Trustee satisfied at the time he or she was initially elected or appointed a Trustee, and continues to satisfy, the standards contemplated by the Statement of Policy. The Governance and Nominating Committee also engages professional search firms to help identify potential Independent Trustee candidates who have the experience, qualifications, attributes, and skills consistent with the Statement of Policy. From time to time, additional criteria based on the composition and skills of the current Independent Trustees, as well as experience or skills that may be appropriate in light of future changes to board composition, business conditions, and regulatory or other developments, have also been considered by the professional search firms and the Governance and Nominating Committee. In addition, the Board takes into account the Trustees' commitment and participation in Board and committee meetings, as well as their leadership of standing and ad hoc committees throughout their tenure.
In determining that a particular Trustee was and continues to be qualified to serve as a Trustee, the Board has considered a variety of criteria, none of which, in isolation, was controlling. The Board believes that, collectively, the Trustees have balanced and diverse experience, qualifications, attributes, and skills, which allow the Board to operate effectively in governing the fund and protecting the interests of shareholders. Information about the specific experience, skills, attributes, and qualifications of each Trustee, which in each case led to the Board's conclusion that the Trustee should serve (or continue to serve) as a trustee of the fund, is provided below.
Board Structure and Oversight Function. Robert A. Lawrence is an interested person and currently serves as Acting Chairman. The Trustees have determined that an interested Chairman is appropriate and benefits shareholders because an interested Chairman has a personal and professional stake in the quality and continuity of services provided to the fund. Independent Trustees exercise their informed business judgment to appoint an individual of their choosing to serve as Chairman, regardless of whether the Trustee happens to be independent or a member of management. The Independent Trustees have determined that they can act independently and effectively without having an Independent Trustee serve as Chairman and that a key structural component for assuring that they are in a position to do so is for the Independent Trustees to constitute a substantial majority for the Board. The Independent Trustees also regularly meet in executive session. Ned C. Lautenbach and David M. Thomas serve as Co-Lead Independent Trustees and as such each (i) acts as a liaison between the Independent Trustees and management with respect to matters important to the Independent Trustees and (ii) with management prepares agendas for Board meetings.
Fidelity® funds are overseen by different Boards of Trustees. The fund's Board oversees Fidelity's high income and certain equity funds, and other Boards oversee Fidelity's investment-grade bond, money market, asset allocation, and other equity funds. The asset allocation funds may invest in Fidelity® funds overseen by the fund's Board. The use of separate Boards, each with its own committee structure, allows the Trustees of each group of Fidelity® funds to focus on the unique issues of the funds they oversee, including common research, investment, and operational issues. On occasion, the separate Boards establish joint committees to address issues of overlapping consequences for the Fidelity® funds overseen by each Board.
The Trustees operate using a system of committees to facilitate the timely and efficient consideration of all matters of importance to the Trustees, the fund, and fund shareholders and to facilitate compliance with legal and regulatory requirements and oversight of the fund's activities and associated risks. The Board, acting through its committees, has charged FMR and its affiliates with (i) identifying events or circumstances the occurrence of which could have demonstrably adverse effects on the fund's business and/or reputation; (ii) implementing processes and controls to lessen the possibility that such events or circumstances occur or to mitigate the effects of such events or circumstances if they do occur; and (iii) creating and maintaining a system designed to evaluate continuously business and market conditions in order to facilitate the identification and implementation processes described in (i) and (ii) above. Because the day-to-day operations and activities of the fund are carried out by or through FMR, its affiliates, and other service providers, the fund's exposure to risks is mitigated but not eliminated by the processes overseen by the Trustees. While each of the Board's committees has responsibility for overseeing different aspects of the fund's activities, oversight is exercised primarily through the Operations, Audit, and Compliance Committees. Appropriate personnel, including but not limited to the fund's Chief Compliance Officer (CCO), FMR's internal auditor, the independent accountants, the fund's Treasurer and portfolio management personnel, make periodic reports to the Board's committees, as appropriate, including an annual review of Fidelity's risk management program for the Fidelity® funds. The responsibilities of each standing committee, including their oversight responsibilities, are described further under "Standing Committees of the Trustees."
Interested Trustees*:
Correspondence intended for a Trustee who is an interested person may be sent to Fidelity Investments, 245 Summer Street, Boston, Massachusetts 02210.
Name, Year of Birth; Principal Occupations and Other Relevant Experience+
Jonathan Chiel (1957)
Year of Election or Appointment: 2016
Trustee
Mr. Chiel also serves as Trustee of other Fidelity® funds. Mr. Chiel is Executive Vice President and General Counsel for FMR LLC (diversified financial services company, 2012-present). Previously, Mr. Chiel served as general counsel (2004-2012) and senior vice president and deputy general counsel (2000-2004) for John Hancock Financial Services; a partner with Choate, Hall & Stewart (1996-2000) (law firm); and an Assistant United States Attorney for the United States Attorney’s Office of the District of Massachusetts (1986-95), including Chief of the Criminal Division (1993-1995). Mr. Chiel is a director on the boards of the Boston Bar Foundation and the Maimonides School.
Robert A. Lawrence (1952)
Year of Election or Appointment: 2020
Trustee
Acting Chairman of the Board of Trustees
Mr. Lawrence also serves as Trustee of other funds. Previously, Mr. Lawrence served as a Member of the Advisory Board of certain funds. Prior to his retirement in 2008, Mr. Lawrence served as Vice President of certain Fidelity® funds (2006-2008), Senior Vice President, Head of High Income Division of Fidelity Management & Research Company (investment adviser firm, 2006-2008), and President of Fidelity Strategic Investments (investment adviser firm, 2002-2005).
* Determined to be an “Interested Trustee” by virtue of, among other things, his or her affiliation with the trust or various entities under common control with FMR.
+ The information includes the Trustee's principal occupation during the last five years and other information relating to the experience, attributes, and skills relevant to the Trustee's qualifications to serve as a Trustee, which led to the conclusion that the Trustee should serve as a Trustee for the fund.
Independent Trustees:
Correspondence intended for an Independent Trustee may be sent to Fidelity Investments, P.O. Box 55235, Boston, Massachusetts 02205-5235.
Name, Year of Birth; Principal Occupations and Other Relevant Experience+
Dennis J. Dirks (1948)
Year of Election or Appointment: 2005
Trustee
Mr. Dirks also serves as Trustee of other Fidelity® funds. Prior to his retirement in May 2003, Mr. Dirks served as Chief Operating Officer and as a member of the Board of The Depository Trust & Clearing Corporation (financial markets infrastructure), President, Chief Operating Officer and a member of the Board of The Depository Trust Company (DTC), President and a member of the Board of the National Securities Clearing Corporation (NSCC), Chief Executive Officer and a member of the Board of the Government Securities Clearing Corporation and Chief Executive Officer and a member of the Board of the Mortgage-Backed Securities Clearing Corporation. Mr. Dirks currently serves as a member of the Finance Committee (2016-present) and Board (2017-present) and is Treasurer (2018-present) of the Asolo Repertory Theatre.
Donald F. Donahue (1950)
Year of Election or Appointment: 2018
Trustee
Mr. Donahue also serves as Trustee of other Fidelity® funds. Mr. Donahue serves as President and Chief Executive Officer of Miranda Partners, LLC (risk consulting for the financial services industry, 2012-present). Previously, Mr. Donahue served as Chief Executive Officer (2006-2012), Chief Operating Officer (2003-2006) and Managing Director, Customer Marketing and Development (1999-2003) of The Depository Trust & Clearing Corporation (financial markets infrastructure). Mr. Donahue currently serves as a member (2007-present) and Co-Chairman (2016-present) of the Board of United Way of New York, a member of the Board of NYC Leadership Academy (2012-present) and a member of the Board of Advisors of Ripple Labs, Inc. (financial services, 2015-present). Mr. Donahue previously served as a member of the Advisory Board of certain Fidelity® funds (2015-2018).
Vicki L. Fuller (1957)
Year of Election or Appointment: 2020
Trustee
Ms. Fuller also serves as Trustee of other Fidelity® funds. Previously, Ms. Fuller served as a member of the Advisory Board of certain Fidelity® funds (2018-2020), Chief Investment Officer of the New York State Common Retirement Fund (2012-2018) and held a variety of positions at AllianceBernstein L.P. (global asset management, 1985-2012), including Managing Director (2006-2012) and Senior Vice President and Senior Portfolio Manager (2001-2006). Ms. Fuller currently serves as a member of the Board, Audit Committee and Nominating and Governance Committee of The Williams Companies, Inc. (natural gas infrastructure, 2018-present) and as a member of the Board of Treliant, LLC (consulting, 2019-present).
Patricia L. Kampling (1959)
Year of Election or Appointment: 2020
Trustee
Ms. Kampling also serves as Trustee of other Fidelity® funds. Prior to her retirement, Ms. Kampling served as Chairman of the Board and Chief Executive Officer (2012-2019), President and Chief Operating Officer (2011-2012) and Executive Vice President and Chief Financial Officer (2010-2011) of Alliant Energy Corporation. Ms. Kampling currently serves as a member of the Board, Compensation Committee and Executive Committee and as Chair of the Audit Committee of Briggs & Stratton Corporation (manufacturing, 2011-present) and as a member of the Board, Audit, Finance and Risk Committee and Safety, Environmental, Technology and Operations Committee of American Water Works Company, Inc. (utilities company, 2019-present). In addition, Ms. Kampling currently serves as a member of the Board of the Nature Conservancy, Wisconsin Chapter (2019-present). Previously, Ms. Kampling served as a Member of the Advisory Board of certain Fidelity® funds (2020), a member of the Board of Interstate Power and Light Company (2012-2019) and Wisconsin Power and Light Company (2012-2019) (each a subsidiary of Alliant Energy Corporation) and as a member of the Board and Workforce Development Committee of the Business Roundtable (2018-2019).
Alan J. Lacy (1953)
Year of Election or Appointment: 2008
Trustee
Mr. Lacy also serves as Trustee of other Fidelity® funds. Previously, Mr. Lacy served as Senior Adviser (2007-2014) of Oak Hill Capital Partners, L.P. (private equity), Chief Executive Officer (2005) and Vice Chairman (2005-2006) of Sears Holdings Corporation (retail), Chief Executive Officer and Chairman of the Board of Sears, Roebuck and Co. (retail, 2000-2005), Chairman (2014-2017) and a member of the Board (2010-2017) of Dave & Buster’s Entertainment, Inc. (restaurant and entertainment complexes) and a member of the Board of Bristol-Myers Squibb Company (global pharmaceuticals, 2008-2020). Mr. Lacy currently serves as a Trustee of the California Chapter of The Nature Conservancy (2015-present) and a member of the Board of the Center for Advanced Study in the Behavioral Sciences at Stanford University (2015-present).
Ned C. Lautenbach (1944)
Year of Election or Appointment: 2000
Trustee
Co-Lead Independent Trustee
Mr. Lautenbach also serves as Trustee of other Fidelity® funds. Mr. Lautenbach currently serves as Chair of the Board of Governors, State University System of Florida (2013-present) and is a member of the Council on Foreign Relations (1994-present). He is also a member and has in the past served as Chairman of the Board of Directors of Artis-Naples (2012-present). Previously, Mr. Lautenbach served as a member and then Lead Director of the Board of Directors of Eaton Corporation (diversified industrial, 1997-2016). He was also a Partner at Clayton, Dubilier & Rice, LLC (private equity investment, 1998-2010); as well as Director of Sony Corporation (2006-2007). In addition, Mr. Lautenbach had a 30-year career with IBM (technology company), during which time he served as Senior Vice President and as a member of the Corporate Executive Committee (1968-1998).
Joseph Mauriello (1944)
Year of Election or Appointment: 2008
Trustee
Mr. Mauriello also serves as Trustee of other Fidelity® funds. Prior to his retirement in January 2006, Mr. Mauriello served in numerous senior management positions including Deputy Chairman and Chief Operating Officer (2004-2005), and Vice Chairman of Financial Services (2002-2004) of KPMG LLP US (professional services, 1965-2005). Mr. Mauriello currently serves as a member of the Independent Directors Council Governing Council (2015-present). Previously, Mr. Mauriello served as a member of the Board of XL Group plc. (global insurance and re-insurance, 2006-2018).
Cornelia M. Small (1944)
Year of Election or Appointment: 2005
Trustee
Ms. Small also serves as Trustee of other Fidelity® funds. Previously, Ms. Small served as Chief Investment Officer, Director of Global Equity Investments and a member of Scudder, Stevens & Clark and Scudder Kemper Investments. Ms. Small previously served as a member of the Board (2009-2019) and Chair of the Investment Committee (2010-2019) of the Teagle Foundation and a member of the Investment Committee of the Berkshire Taconic Community Foundation (2008-2019).
Garnett A. Smith (1947)
Year of Election or Appointment: 2018
Trustee
Mr. Smith also serves as Trustee of other Fidelity® funds. Prior to his retirement, Mr. Smith served as Chairman and Chief Executive Officer (1990-1997) and President (1986-1990) of Inbrand Corp. (manufacturer of personal absorbent products). Prior to his employment with Inbrand Corp., he was employed by a retail fabric chain and North Carolina National Bank (now Bank of America). Mr. Smith previously served as a member of the Advisory Board of certain Fidelity® funds (2012-2013).
David M. Thomas (1949)
Year of Election or Appointment: 2008
Trustee
Co-Lead Independent Trustee
Mr. Thomas also serves as Trustee of other Fidelity® funds. Previously, Mr. Thomas served as Executive Chairman (2005-2006) and Chairman and Chief Executive Officer (2000-2005) of IMS Health, Inc. (pharmaceutical and healthcare information solutions). Mr. Thomas currently serves as Non-Executive Chairman of the Board of Fortune Brands Home and Security (home and security products, 2011-present), and a member of the Board (2004-present) and Presiding Director (2013-present) of Interpublic Group of Companies, Inc. (marketing communication).
Susan Tomasky (1953)
Year of Election or Appointment: 2020
Trustee
Ms. Tomasky also serves as Trustee of other Fidelity® funds. Prior to her retirement, Ms. Tomasky served in various executive officer positions at American Electric Power Company, Inc. (1998-2011), including most recently as President of AEP Transmission (2007-2011). Ms. Tomasky currently serves as a member of the Board and Sustainability Committee and as Chair of the Audit Committee of Marathon Petroleum Corporation (2018-present) and as a member of the Board, Corporate Governance Committee and Organization and Compensation Committee and as Chair of the Audit Committee of Public Service Enterprise Group, Inc. (utilities company, 2012-present). In addition, Ms. Tomasky currently serves as a member of the Board of the Columbus Regional Airport Authority (2007-present), as a member of the Board of the Royal Shakespeare Company – America (2009-present), as a member of the Board of the Columbus Association for the Performing Arts (2011-present) and as a member of the Board of Kenyon College (2016-present). Previously, Ms. Tomasky served as a Member of the Advisory Board of certain Fidelity® funds (2020), a member of the Board (2011-2019) and as Lead Independent Director (2015-2018) of Andeavor Corporation (previously Tesoro Corporation) (independent oil refiner and marketer) and as a member of the Board of Summit Midstream Partners LP (energy, 2012-2018).
Michael E. Wiley (1950)
Year of Election or Appointment: 2020
Trustee
Mr. Wiley also serves as Trustee of other Fidelity® funds. Previously, Mr. Wiley served as a member of the Advisory Board of certain Fidelity® funds (2018-2020), Chairman, President and CEO of Baker Hughes, Inc. (oilfield services, 2000-2004). Mr. Wiley also previously served as a member of the Board of Andeavor Corporation (independent oil refiner and marketer, 2005-2018), a member of the Board of Andeavor Logistics LP (natural resources logistics, 2015-2018) and a member of the Board of High Point Resources (exploration and production, 2005-2020).
+ The information includes the Trustee's principal occupation during the last five years and other information relating to the experience, attributes, and skills relevant to the Trustee's qualifications to serve as a Trustee, which led to the conclusion that the Trustee should serve as a Trustee for the fund.
Advisory Board Members and Officers:
Correspondence intended for a Member of the Advisory Board (if any) may be sent to Fidelity Investments, P.O. Box 55235, Boston, Massachusetts 02205-5235. Correspondence intended for an officer or Peter S. Lynch may be sent to Fidelity Investments, 245 Summer Street, Boston, Massachusetts 02210. Officers appear below in alphabetical order.
Name, Year of Birth; Principal Occupation
Peter S. Lynch (1944)
Year of Election or Appointment: 2003
Member of the Advisory Board
Mr. Lynch also serves as a Member of the Advisory Board of other Fidelity® funds. Mr. Lynch is Vice Chairman and a Director of Fidelity Management & Research Company LLC (investment adviser firm). In addition, Mr. Lynch serves as a Trustee of Boston College and as the Chairman of the Inner-City Scholarship Fund. Previously, Mr. Lynch served as Vice Chairman and a Director of FMR Co., Inc. (investment adviser firm) and on the Special Olympics International Board of Directors (1997-2006).
Elizabeth Paige Baumann (1968)
Year of Election or Appointment: 2017
Anti-Money Laundering (AML) Officer
Ms. Baumann also serves as AML Officer of other funds. She is Chief AML Officer (2012-present) and Senior Vice President (2014-present) of FMR LLC (diversified financial services company) and is an employee of Fidelity Investments. Previously, Ms. Baumann served as AML Officer of certain funds (2017-2019), as AML Officer of the funds (2012-2016), and Vice President (2007-2014) and Deputy Anti-Money Laundering Officer (2007-2012) of FMR LLC.
Craig S. Brown (1977)
Year of Election or Appointment: 2019
Assistant Treasurer
Mr. Brown also serves as Assistant Treasurer of other funds. Mr. Brown is an employee of Fidelity Investments (2013-present).
John J. Burke III (1964)
Year of Election or Appointment: 2018
Chief Financial Officer
Mr. Burke also serves as Chief Financial Officer of other funds. Mr. Burke serves as Head of Investment Operations for Fidelity Fund and Investment Operations (2018-present) and is an employee of Fidelity Investments (1998-present). Previously Mr. Burke served as head of Asset Management Investment Operations (2012-2018).
William C. Coffey (1969)
Year of Election or Appointment: 2019
Assistant Secretary
Mr. Coffey also serves as Assistant Secretary of other funds. He is Senior Vice President and Deputy General Counsel of FMR LLC (diversified financial services company, 2010-present), and is an employee of Fidelity Investments. Previously, Mr. Coffey served as Secretary and CLO of certain funds (2018-2019); CLO, Secretary, and Senior Vice President of Fidelity Management & Research Company and FMR Co., Inc. (investment adviser firms, 2018-2019); Secretary of Fidelity SelectCo, LLC and Fidelity Investments Money Management, Inc. (investment adviser firms, 2018-2019); CLO of Fidelity Management & Research (Hong Kong) Limited, FMR Investment Management (UK) Limited, and Fidelity Management & Research (Japan) Limited (investment adviser firms, 2018-2019); and Assistant Secretary of certain funds (2009-2018).
Timothy M. Cohen (1969)
Year of Election or Appointment: 2018
Vice President
Mr. Cohen also serves as Vice President of other funds. Mr. Cohen serves as Co-Head of Equity (2018-present), a Director of Fidelity Management & Research (Japan) Limited (investment adviser firm, 2016-present), and is an employee of Fidelity Investments. Previously, Mr. Cohen served as Executive Vice President of Fidelity SelectCo, LLC (2019), Head of Global Equity Research (2016-2018), Chief Investment Officer - Equity and a Director of Fidelity Management & Research (U.K.) Inc. (investment adviser firm, 2013-2015) and as a Director of Fidelity Management & Research (Hong Kong) Limited (investment adviser firm, 2017).
Jonathan Davis (1968)
Year of Election or Appointment: 2010
Assistant Treasurer
Mr. Davis also serves as Assistant Treasurer of other funds. Mr. Davis serves as Assistant Treasurer of FMR Capital, Inc. (2017-present) and is an employee of Fidelity Investments. Previously, Mr. Davis served as Vice President and Associate General Counsel of FMR LLC (diversified financial services company, 2003-2010).
Laura M. Del Prato (1964)
Year of Election or Appointment: 2018
Assistant Treasurer
Ms. Del Prato also serves as an officer of other funds. Ms. Del Prato is an employee of Fidelity Investments (2017-present). Previously, Ms. Del Prato served as President and Treasurer of The North Carolina Capital Management Trust: Cash Portfolio and Term Portfolio (2018-2020). Prior to joining Fidelity Investments, Ms. Del Prato served as a Managing Director and Treasurer of the JPMorgan Mutual Funds (2014-2017). Prior to JPMorgan, Ms. Del Prato served as a partner at Cohen Fund Audit Services (accounting firm, 2012-2013) and KPMG LLP (accounting firm, 2004-2012).
Colm A. Hogan (1973)
Year of Election or Appointment: 2020
Assistant Treasurer
Mr. Hogan also serves as an officer of other funds. Mr. Hogan serves as Assistant Treasurer of FMR Capital, Inc. (2017-present) and is an employee of Fidelity Investments (2005-present). Previously, Mr. Hogan served as Deputy Treasurer of certain Fidelity® funds (2016-2020) and Assistant Treasurer of certain Fidelity® funds (2016-2018).
Pamela R. Holding (1964)
Year of Election or Appointment: 2018
Vice President
Ms. Holding also serves as Vice President of other funds. Ms. Holding serves as Co-Head of Equity (2018-present) and is an employee of Fidelity Investments (2013-present). Previously, Ms. Holding served as Executive Vice President of Fidelity SelectCo, LLC (2019) and as Chief Investment Officer of Fidelity Institutional Asset Management (2013-2018).
Cynthia Lo Bessette (1969)
Year of Election or Appointment: 2019
Secretary and Chief Legal Officer (CLO)
Ms. Lo Bessette also serves as an officer of other funds. Ms. Lo Bessette serves as CLO, Secretary, and Senior Vice President of Fidelity Management & Research Company LLC (investment adviser firm, 2019-present); and CLO of Fidelity Management & Research (Hong Kong) Limited, FMR Investment Management (UK) Limited, and Fidelity Management & Research (Japan) Limited (investment adviser firms, 2019-present). She is a Senior Vice President and Deputy General Counsel of FMR LLC (diversified financial services company, 2019-present), and is an employee of Fidelity Investments. Previously, Ms. Lo Bessette served as CLO, Secretary, and Senior Vice President of FMR Co., Inc. (investment adviser firm, 2019); Secretary of Fidelity SelectCo, LLC and Fidelity Investments Money Management, Inc. (investment adviser firms, 2019). Prior to joining Fidelity Investments, Ms. Lo Bessette was Executive Vice President, General Counsel (2016-2019) and Senior Vice President, Deputy General Counsel (2015-2016) of OppenheimerFunds (investment management company) and Deputy Chief Legal Officer (2013-2015) of Jennison Associates LLC (investment adviser firm).
Chris Maher (1972)
Year of Election or Appointment: 2020
Deputy Treasurer
Mr. Maher also serves as an officer of other funds. Mr. Maher serves as Assistant Treasurer of FMR Capital, Inc. (2017-present), and is an employee of Fidelity Investments (2008-present). Previously, Mr. Maher served as Assistant Treasurer of certain funds (2013-2020); Vice President of Asset Management Compliance (2013), Vice President of the Program Management Group of FMR (investment adviser firm, 2010-2013), and Vice President of Valuation Oversight (2008-2010).
Jason P. Pogorelec (1975)
Year of Election or Appointment: 2020
Chief Compliance Officer
Mr. Pogorelec also serves as Chief Compliance Officer of other funds. Mr. Pogorelec is a senior Vice President of Asset Management Compliance for Fidelity Investments and is an employee of Fidelity Investments (2006-present). Previously, Mr. Pogorelec served as Vice President, Associate General Counsel for Fidelity Investments (2010-2020) and Assistant Secretary of certain Fidelity funds (2015-2020).
Stacie M. Smith (1974)
Year of Election or Appointment: 2016
President and Treasurer
Ms. Smith also serves as an officer of other funds. Ms. Smith serves as Assistant Treasurer of FMR Capital, Inc. (2017-present), is an employee of Fidelity Investments (2009-present), and has served in other fund officer roles. Prior to joining Fidelity Investments, Ms. Smith served as Senior Audit Manager of Ernst & Young LLP (accounting firm, 1996-2009). Previously, Ms. Smith served as Assistant Treasurer (2013-2019) and Deputy Treasurer (2013-2016) of certain Fidelity® funds.
Marc L. Spector (1972)
Year of Election or Appointment: 2016
Assistant Treasurer
Mr. Spector also serves as an officer of other funds. Mr. Spector serves as Assistant Treasurer of FMR Capital, Inc. (2017-present) and is an employee of Fidelity Investments (2016-present). Prior to joining Fidelity Investments, Mr. Spector served as Director at the Siegfried Group (accounting firm, 2013-2016), and prior to Siegfried Group as audit senior manager at Deloitte & Touche LLP (accounting firm, 2005-2013).
Jim Wegmann (1979)
Year of Election or Appointment: 2019
Assistant Treasurer
Mr. Wegmann also serves as Assistant Treasurer of other funds. Mr. Wegmann is an employee of Fidelity Investments (2011-present).
Shareholder Expense Example
As a shareholder, you incur two types of costs: (1) transaction costs, which may include sales charges (loads) on purchase payments or redemption proceeds, as applicable and (2) ongoing costs, which generally include management fees, distribution and/or service (12b-1) fees and other Fund expenses. This Example is intended to help you understand your ongoing costs (in dollars) of investing in a fund and to compare these costs with the ongoing costs of investing in other mutual funds.
The Example is based on an investment of $1,000 invested at the beginning of the period and held for the entire period (February 1, 2020 to July 31, 2020).
Actual Expenses
The first line of the accompanying table provides information about actual account values and actual expenses. You may use the information in this line, together with the amount you invested, to estimate the expenses that you paid over the period. Simply divide your account value by $1,000.00 (for example, an $8,600 account value divided by $1,000.00 = 8.6), then multiply the result by the number in the first line for a class/Fund under the heading entitled "Expenses Paid During Period" to estimate the expenses you paid on your account during this period. If any fund is a shareholder of any underlying mutual funds or exchange-traded funds (ETFs) (the Underlying Funds), such fund indirectly bears its proportional share of the expenses of the Underlying Funds in addition to the direct expenses incurred presented in the table. These fees and expenses are not included in the annualized expense ratio used to calculate the expense estimate in the table below.
Hypothetical Example for Comparison Purposes
The second line of the accompanying table provides information about hypothetical account values and hypothetical expenses based on the actual expense ratio and an assumed rate of return of 5% per year before expenses, which is not the actual return. The hypothetical account values and expenses may not be used to estimate the actual ending account balance or expenses you paid for the period. You may use this information to compare the ongoing costs of investing in the Fund and other funds. To do so, compare this 5% hypothetical example with the 5% hypothetical examples that appear in the shareholder reports of the other funds. If any fund is a shareholder of any Underlying Funds, such fund indirectly bears its proportional share of the expenses of the Underlying Funds in addition to the direct expenses as presented in the table. These fees and expenses are not included in the annualized expense ratio used to calculate the expense estimate in the table below.
Please note that the expenses shown in the table are meant to highlight your ongoing costs only and do not reflect any transaction costs. Therefore, the second line of the table is useful in comparing ongoing costs only, and will not help you determine the relative total costs of owning different funds.
| | Annualized Expense Ratio-A | Beginning
Account Value
February 1, 2020 | Ending
Account Value
July 31, 2020 | Expenses Paid
During Period-B
February 1, 2020
to July 31, 2020 |
| Fidelity Series Small Cap Opportunities Fund | - %-C | | | |
| Actual | | $1,000.00 | $921.40 | $--D |
| Hypothetical-E | | $1,000.00 | $1,024.86 | $--D |
A Annualized expense ratio reflects expenses net of applicable fee waivers.
B Expenses are equal to the annualized expense ratio, multiplied by the average account value over the period, multiplied by 182/ 366 (to reflect the one-half year period). The fees and expenses of any Underlying Funds are not included in each annualized expense ratio.
C Amount represents less than .005%.
D Amount represents less than $.005.
E 5% return per year before expenses
Distributions (Unaudited)
The fund designates 66% and 69% of the dividends distributed in September and December, respectively during the fiscal year as qualifying for the dividends–received deduction for corporate shareholders.
The fund designates 78% and 75% of the dividends distributed in September and December, respectively during the fiscal year as amounts which may be taken into account as a dividend for the purposes of the maximum rate under section 1(h)(11) of the Internal Revenue Code.
The fund designates 23% and 21% of the dividends distributed in September and December, respectively during the fiscal year as a section 199A dividend.
The fund will notify shareholders in January 2021 of amounts for use in preparing 2020 income tax returns.
Liquidity Risk Management Program
The Securities and Exchange Commission adopted Rule 22e-4 under the Investment Company Act of 1940 (the Liquidity Rule) to promote effective liquidity risk management throughout the open-end investment company industry, thereby reducing the risk that funds will be unable to meet their redemption obligations and mitigating dilution of the interests of fund shareholders.
The Fund has adopted and implemented a liquidity risk management program pursuant to the Liquidity Rule (the Program) effective December 1, 2018. The Program is reasonably designed to assess and manage the Fund’s liquidity risk and to comply with the requirements of the Liquidity Rule. The Fund’s Board of Trustees (the Board) has designated the Fund’s investment adviser as administrator of the Program. The Fidelity advisers have established a Liquidity Risk Management Committee (the LRM Committee) to manage the Program for each of the Fidelity Funds. The LRM Committee monitors the adequacy and effectiveness of implementation of the Program and on a periodic basis assesses each Fund’s liquidity risk based on a variety of factors including (1) the Fund’s investment strategy, (2) portfolio liquidity and cash flow projections during normal and reasonably foreseeable stressed conditions, (3) shareholder redemptions, (4) borrowings and other funding sources and (5) in the case of exchange-traded funds, certain additional factors including the effect of the Fund’s prices and spreads, market participants, and basket compositions on the overall liquidity of the Fund’s portfolio, as applicable.
In accordance with the Program, each of the Fund’s portfolio investments is classified into one of four liquidity categories described below based on a determination of a reasonable expectation for how long it would take to convert the investment to cash (or sell or dispose of the investment) without significantly changing its market value.
- Highly liquid investments – cash or convertible to cash within three business days or less
- Moderately liquid investments – convertible to cash in three to seven calendar days
- Less liquid investments – can be sold or disposed of, but not settled, within seven calendar days
- Illiquid investments – cannot be sold or disposed of within seven calendar days
Liquidity classification determinations take into account a variety of factors including various market, trading and investment-specific considerations, as well as market depth, and generally utilize analysis from a third-party liquidity metrics service.
The Liquidity Rule places a 15% limit on a fund’s illiquid investments and requires funds that do not primarily hold assets that are highly liquid investments to determine and maintain a minimum percentage of the fund’s net assets to be invested in highly liquid investments (highly liquid investment minimum or HLIM). The Program includes provisions reasonably designed to comply with the 15% limit on illiquid investments and for determining, periodically reviewing and complying with the HLIM requirement as applicable.
At a recent meeting of the Fund’s Board of Trustees, the LRM Committee provided a written report to the Board pertaining to the operation, adequacy, and effectiveness of implementation of the Program for the annual period from December 1, 2018 through November 30, 2019. The report concluded that the Program has been implemented and is operating effectively and is reasonably designed to assess and manage the Fund’s liquidity risk.
Proxy Voting Results
A special meeting of shareholders was held on June 9, 2020. The results of votes taken among shareholders on the proposals before them are reported below. Each vote reported represents one dollar of net asset value held on the record date for the meeting.
PROPOSAL 1
To elect a Board of Trustees.
| | # of
Votes | % of
Votes |
| Dennis J. Dirks |
| Affirmative | 43,167,428,219.785 | 94.885 |
| Withheld | 2,327,070,930.034 | 5.115 |
| TOTAL | 45,494,499,149.820 | 100.000 |
| Donald F. Donahue |
| Affirmative | 43,161,668,935.467 | 94.872 |
| Withheld | 2,333,065,287.611 | 5.128 |
| TOTAL | 45,494,734,223.077 | 100.000 |
| Bettina Doulton |
| Affirmative | 43,304,465,213.969 | 95.186 |
| Withheld | 2,190,010,062.903 | 4.814 |
| TOTAL | 45,494,475,276.872 | 100.000 |
| Vicki L. Fuller |
| Affirmative | 43,380,442,631.493 | 95.353 |
| Withheld | 2,114,180,614.639 | 4.647 |
| TOTAL | 45,494,623,246.132 | 100.000 |
| Patricia L. Kampling |
| Affirmative | 43,128,008,796.761 | 94.798 |
| Withheld | 2,366,685,422.999 | 5.202 |
| TOTAL | 45,494,694,219.760 | 100.000 |
| Alan J. Lacy |
| Affirmative | 42,904,065,046.958 | 94.305 |
| Withheld | 2,590,717,567.229 | 5.695 |
| TOTAL | 45,494,782,614.187 | 100.000 |
| Ned C. Lautenbach |
| Affirmative | 42,802,778,827.017 | 94.083 |
| Withheld | 2,692,003,787.170 | 5.917 |
| TOTAL | 45,494,782,614.187 | 100.000 |
| Robert A. Lawrence |
| Affirmative | 42,971,258,294.203 | 94.453 |
| Withheld | 2,523,524,319.984 | 5.547 |
| TOTAL | 45,494,782,614.187 | 100.000 |
| Joseph Mauriello |
| Affirmative | 42,874,562,778.490 | 94.241 |
| Withheld | 2,620,171,874.731 | 5.759 |
| TOTAL | 45,494,734,653.220 | 100.000 |
| Cornelia M. Small |
| Affirmative | 43,029,040,988.063 | 94.580 |
| Withheld | 2,465,741,626.124 | 5.420 |
| TOTAL | 45,494,782,614.187 | 100.000 |
| Garnett A. Smith |
| Affirmative | 42,892,814,945.159 | 94.281 |
| Withheld | 2,601,967,669.028 | 5.719 |
| TOTAL | 45,494,782,614.187 | 100.000 |
| David M. Thomas |
| Affirmative | 42,936,080,036.111 | 94.376 |
| Withheld | 2,558,702,578.076 | 5.624 |
| TOTAL | 45,494,782,614.187 | 100.000 |
| Susan Tomasky |
| Affirmative | 43,147,934,105.796 | 94.842 |
| Withheld | 2,346,571,066.028 | 5.158 |
| TOTAL | 45,494,782,614.187 | 100.000 |
| Michael E. Wiley |
| Affirmative | 42,885,333,102.972 | 94.264 |
| Withheld | 2,609,449,511.215 | 5.736 |
| TOTAL | 45,494,782,614.187 | 100.000 |
PROPOSAL 2
To convert a fundamental investment policy to a non-fundamental investment policy.
| | # of
Votes | % of
Votes |
| Affirmative | 4,183,304,349.131 | 100.000 |
| Against | 0.000 | 0.000 |
| Abstain | 0.000 | 0.000 |
| Broker Non-Vote | 0.000 | 0.000 |
| TOTAL | 4,183,304,349.131 | 100.000 |
|
| Proposal 1 reflects trust wide proposal and voting results. |
SMO-ANN-0920
1.839807.113
Fidelity® Real Estate Income Fund
Annual Report
July 31, 2020
Includes Fidelity and Fidelity Advisor share classes
See the inside front cover for important information about access to your fund’s shareholder reports.
Beginning on January 1, 2021, as permitted by regulations adopted by the Securities and Exchange Commission, paper copies of a fund’s shareholder reports will no longer be sent by mail, unless you specifically request paper copies of the reports from the fund or from your financial intermediary, such as a financial advisor, broker-dealer or bank. Instead, the reports will be made available on a website, and you will be notified by mail each time a report is posted and provided with a website link to access the report.
If you already elected to receive shareholder reports electronically, you will not be affected by this change and you need not take any action. You may elect to receive shareholder reports and other communications from a fund electronically, by contacting your financial intermediary. For Fidelity customers, visit Fidelity's web site or call Fidelity using the contact information listed below.
You may elect to receive all future reports in paper free of charge. If you wish to continue receiving paper copies of your shareholder reports, you may contact your financial intermediary or, if you are a Fidelity customer, visit Fidelity’s website, or call Fidelity at the applicable toll-free number listed below. Your election to receive reports in paper will apply to all funds held with the fund complex/your financial intermediary.
| Account Type | Website | Phone Number |
| Brokerage, Mutual Fund, or Annuity Contracts: | fidelity.com/mailpreferences | 1-800-343-3548 |
| Employer Provided Retirement Accounts: | netbenefits.fidelity.com/preferences (choose 'no' under Required Disclosures to continue to print) | 1-800-343-0860 |
| Advisor Sold Accounts Serviced Through Your Financial Intermediary: | Contact Your Financial Intermediary | Your Financial Intermediary's phone number |
| Advisor Sold Accounts Serviced by Fidelity: | institutional.fidelity.com | 1-877-208-0098 |
Contents
To view a fund's proxy voting guidelines and proxy voting record for the 12-month period ended June 30, visit http://www.fidelity.com/proxyvotingresults or visit the Securities and Exchange Commission's (SEC) web site at http://www.sec.gov.
You may also call 1-800-544-8544 if you’re an individual investing directly with Fidelity, call 1-800-835-5092 if you’re a plan sponsor or participant with Fidelity as your recordkeeper or call 1-877-208-0098 on institutional accounts or if you’re an advisor or invest through one to request a free copy of the proxy voting guidelines.
Standard & Poor's, S&P and S&P 500 are registered service marks of The McGraw-Hill Companies, Inc. and have been licensed for use by Fidelity Distributors Corporation.
Other third-party marks appearing herein are the property of their respective owners.
All other marks appearing herein are registered or unregistered trademarks or service marks of FMR LLC or an affiliated company. © 2020 FMR LLC. All rights reserved.
This report and the financial statements contained herein are submitted for the general information of the shareholders of the Fund. This report is not authorized for distribution to prospective investors in the Fund unless preceded or accompanied by an effective prospectus.
A fund files its complete schedule of portfolio holdings with the SEC for the first and third quarters of each fiscal year on Form N-PORT. Forms N-PORT are available on the SEC’s web site at http://www.sec.gov. A fund's Forms N-PORT may be reviewed and copied at the SEC’s Public Reference Room in Washington, DC. Information regarding the operation of the SEC's Public Reference Room may be obtained by calling 1-800-SEC-0330.
For a complete list of a fund's portfolio holdings, view the most recent holdings listing, semiannual report, or annual report on Fidelity's web site at http://www.fidelity.com, http://www.institutional.fidelity.com, or http://www.401k.com, as applicable.
NOT FDIC INSURED •MAY LOSE VALUE •NO BANK GUARANTEE
Neither the Fund nor Fidelity Distributors Corporation is a bank.
Note to Shareholders:
Early in 2020, the outbreak and spread of a new coronavirus emerged as a public health emergency that had a major influence on financial markets, primarily based on its impact on the global economy and the outlook for corporate earnings. The virus causes a respiratory disease known as COVID-19. On March 11, the World Health Organization declared the COVID-19 outbreak a pandemic, citing sustained risk of further global spread.
In the weeks following, as the crisis worsened, we witnessed an escalating human tragedy with wide-scale social and economic consequences from coronavirus-containment measures. The outbreak of COVID-19 prompted a number of measures to limit the spread, including travel and border restrictions, quarantines, and restrictions on large gatherings. In turn, these resulted in lower consumer activity, diminished demand for a wide range of products and services, disruption in manufacturing and supply chains, and – given the wide variability in outcomes regarding the outbreak – significant market uncertainty and volatility. Amid the turmoil, the U.S. government took unprecedented action – in concert with the U.S. Federal Reserve and central banks around the world – to help support consumers, businesses, and the broader economy, and to limit disruption to the financial system.
The situation continues to unfold, and the extent and duration of its impact on financial markets and the economy remain highly uncertain. Extreme events such as the coronavirus crisis are “exogenous shocks” that can have significant adverse effects on mutual funds and their investments. Although multiple asset classes may be affected by market disruption, the duration and impact may not be the same for all types of assets.
Fidelity is committed to helping you stay informed amid news about COVID-19 and during increased market volatility, and we’re taking extra steps to be responsive to customer needs. We encourage you to visit our websites, where we offer ongoing updates, commentary, and analysis on the markets and our funds.
Performance: The Bottom Line
Average annual total return reflects the change in the value of an investment, assuming reinvestment of distributions from dividend income and capital gains (the profits earned upon the sale of securities that have grown in value, if any) and assuming a constant rate of performance each year. The hypothetical investment and the average annual total returns do not reflect the deduction of taxes that a shareholder would pay on fund distributions or the redemption of fund shares. During periods of reimbursement by Fidelity, a fund’s total return will be greater than it would be had the reimbursement not occurred. How a fund did yesterday is no guarantee of how it will do tomorrow.
Average Annual Total Returns
| For the periods ended July 31, 2020 | Past 1 year | Past 5 years | Past 10 years |
| Class A (incl. 4.00% sales charge) | (10.60)% | 3.30% | 6.40% |
| Class M (incl. 4.00% sales charge) | (10.61)% | 3.28% | 6.37% |
| Class C (incl. contingent deferred sales charge) | (8.38)% | 3.39% | 6.03% |
| Fidelity® Real Estate Income Fund | (6.58)% | 4.43% | 7.08% |
| Class I | (6.62)% | 4.43% | 7.11% |
| Class Z | (6.50)% | 4.48% | 7.13% |
Class C shares' contingent deferred sales charges included in the past one year, past five years and past ten years total return figures are 1%, 0% and 0%, respectively.
The initial offering of Class Z shares took place on October 2, 2018. Returns prior to October 2, 2018, are those of Class I.
$10,000 Over 10 Years
Let's say hypothetically that $10,000 was invested in Fidelity® Real Estate Income Fund, a class of the fund, on July 31, 2010.
The chart shows how the value of your investment would have changed, and also shows how the S&P 500® Index performed over the same period.

| Period Ending Values |
| $19,828 | Fidelity® Real Estate Income Fund |
| $36,558 | S&P 500® Index |
Management's Discussion of Fund Performance
Market Recap: For the first half of the 12-month period ending July 31, 2020, U.S. real estate securities experienced a generally favorable market environment. Conditions became tumultuous, however, about halfway through the first quarter of 2020, as the COVID-19 pandemic forced economic shutdowns around the country. This situation led to questions about whether certain real estate segments – such as retail, hotels and offices – would experience long-term challenges as a result of concern about social gathering. Meanwhile, other property types remained intact despite the pandemic. These included industrial, data-center and mobile communication tower real estate investment trusts (REITs), which stood to benefit from similar worries. In this environment, real estate securities fell sharply between late February and mid-March. Then, as economies reopened and the U.S. Federal Reserve pursued aggressive economic stimulus, real estate securities bounced back sharply, regaining a portion of their value as the fiscal year proceeded. For the full 12 months, REIT common stocks, as measured by the FTSE
® NAREIT
® All REITs Index, returned -6.38%. Real estate preferred stocks, as measured by the MSCI REIT Preferred Index, returned -4.86%. Real estate bonds, captured by the ICE BofA
® US Real Estate Index – a market-capitalization-weighted measure of investment-grade corporate debt in the domestic real estate sector – gained 8.71%, benefiting from the steep drop in rates.
Comments from Co-Portfolio Manager Mark Snyderman: For the fiscal year, the fund's share classes (excluding sales charges, if applicable) returned roughly -7% to -8%, lagging the 0.38% advance of the Fidelity Real Estate Income Composite Index℠. The Composite index is a 40/40/20 blend of the MSCI REIT Preferred Index, the ICE BofA
® U.S. Real Estate Index and the FTSE
® NAREIT
® All REITs Index. Most of the fund's performance shortfall came in the first quarter of 2020, when some of our investments fell sharply along with volatile markets. Then, many of these same investments, which include some smaller-issue-size holdings that are less-widely owned, were slower to bounce back as markets recovered in the period's final months. Despite their underperformance, as of July 31 we remained optimistic about these positions' opportunity to recover. For the 12 months, our biggest performance challenge was on the bond side of the portfolio. Our commercial mortgage-backed securities, investment-grade real estate bonds and high-yield real estate bonds all lagged the roughly 9% gain of the ICE BofA index, due primarily to the lower duration of our holdings in an environment of sharply falling interest rates. Meanwhile, the fund's real estate common stock holdings trailed the FTSE NAREIT index by several percentage points, largely reflecting difficulty with certain mortgage real estate investment trust and health care common stocks. We also lost ground among real estate preferred stocks, which returned about -10% for the portfolio. This trailed the MSCI index by several percentage points, due primarily to challenges involving mortgage REIT preferreds.
The views expressed above reflect those of the portfolio manager(s) only through the end of the period as stated on the cover of this report and do not necessarily represent the views of Fidelity or any other person in the Fidelity organization. Any such views are subject to change at any time based upon market or other conditions and Fidelity disclaims any responsibility to update such views. These views may not be relied on as investment advice and, because investment decisions for a Fidelity fund are based on numerous factors, may not be relied on as an indication of trading intent on behalf of any Fidelity fund.
Investment Summary (Unaudited)
Top Five Stocks as of July 31, 2020
| | % of fund's net assets |
| American Tower Corp. | 3.1 |
| Equity Lifestyle Properties, Inc. | 2.9 |
| Apartment Investment & Management Co. Class A | 1.9 |
| Mid-America Apartment Communities, Inc. | 1.7 |
| Crown Castle International Corp. | 1.5 |
| | 11.1 |
Top 5 Bonds as of July 31, 2020
| | % of fund's net assets |
| Kennedy-Wilson, Inc. 5.875% 4/1/24 | 0.9 |
| Redwood Trust, Inc. 5.625% 7/15/24 | 0.9 |
| Western Asset Mortgage Capital Corp. 6.75% 10/1/22 | 0.9 |
| Senior Housing Properties Trust 4.75% 5/1/24 | 0.8 |
| Howard Hughes Corp. 5.375% 3/15/25 | 0.6 |
| | 4.1 |
Top Five REIT Sectors as of July 31, 2020
| | % of fund's net assets |
| REITs - Mortgage | 22.0 |
| REITs - Diversified | 10.8 |
| REITs - Management/Investment | 6.7 |
| REITs - Apartments | 6.1 |
| REITs - Health Care | 4.4 |
Asset Allocation (% of fund's net assets)
| As of July 31, 2020* |
| | Stocks | 50.4% |
| | Bonds | 29.1% |
| | Convertible Securities | 7.1% |
| | Other Investments | 4.4% |
| | Short-Term Investments and Net Other Assets (Liabilities) | 9.0% |

* Foreign investments - 2.3%
Schedule of Investments July 31, 2020
Showing Percentage of Net Assets
| Common Stocks - 28.4% | | | |
| | | Shares | Value |
| FINANCIALS - 6.2% | | | |
| Capital Markets - 0.6% | | | |
| Brookfield Asset Management, Inc. (Canada) Class A | | 890,300 | $28,753,875 |
| Mortgage Real Estate Investment Trusts - 5.6% | | | |
| AGNC Investment Corp. | | 5,255,532 | 71,475,235 |
| Anworth Mortgage Asset Corp. | | 332,018 | 600,953 |
| Broadmark Realty Capital, Inc. (a) | | 1,388,400 | 12,801,048 |
| Capstead Mortgage Corp. | | 1,229,200 | 7,559,580 |
| Chimera Investment Corp. | | 1,056,000 | 9,493,440 |
| Colony NorthStar Credit Real Estate, Inc. | | 2,059,250 | 12,973,275 |
| Dynex Capital, Inc. (b) | | 2,072,262 | 32,016,448 |
| Ellington Financial LLC | | 1,548,275 | 18,207,714 |
| Ellington Residential Mortgage REIT | | 430,700 | 4,759,235 |
| Great Ajax Corp. (a)(b) | | 1,663,364 | 14,338,198 |
| Hunt Companies Finance Trust, Inc. | | 516,601 | 1,141,688 |
| MFA Financial, Inc. | | 13,519,819 | 35,557,124 |
| New Residential Investment Corp. | | 7,401,975 | 58,697,662 |
| Nexpoint Real Estate Finance, Inc. (b) | | 419,700 | 6,673,230 |
| Redwood Trust, Inc. | | 1,127,752 | 8,040,872 |
| Two Harbors Investment Corp. | | 777,670 | 4,222,748 |
| | | | 298,558,450 |
|
| TOTAL FINANCIALS | | | 327,312,325 |
|
| INDUSTRIALS - 0.3% | | | |
| Construction & Engineering - 0.3% | | | |
| Willscot Mobile Mini Holdings (c) | | 1,210,400 | 18,228,624 |
| REAL ESTATE - 21.9% | | | |
| Equity Real Estate Investment Trusts (REITs) - 21.9% | | | |
| Acadia Realty Trust (SBI) | | 3,436,126 | 41,370,957 |
| American Homes 4 Rent Class A | | 1,031,800 | 29,922,200 |
| American Tower Corp. | | 638,400 | 166,871,356 |
| Apartment Investment & Management Co. Class A | | 2,557,573 | 99,284,984 |
| AvalonBay Communities, Inc. | | 108,200 | 16,567,584 |
| Colony Capital, Inc. | | 6,411,155 | 12,309,418 |
| CoreSite Realty Corp. | | 38,400 | 4,955,520 |
| Crown Castle International Corp. | | 484,910 | 80,834,497 |
| Easterly Government Properties, Inc. | | 852,200 | 20,836,290 |
| Equinix, Inc. | | 83,100 | 65,273,388 |
| Equity Lifestyle Properties, Inc. | | 2,265,296 | 154,765,023 |
| Equity Residential (SBI) | | 108,203 | 5,802,927 |
| Gaming & Leisure Properties | | 547,178 | 19,813,315 |
| Healthcare Trust of America, Inc. | | 1,179,260 | 32,559,369 |
| Invitation Homes, Inc. | | 509,400 | 15,190,308 |
| iStar Financial, Inc. | | 3,005,913 | 34,898,650 |
| Lexington Corporate Properties Trust | | 5,594,274 | 64,893,578 |
| Mid-America Apartment Communities, Inc. | | 739,506 | 88,141,720 |
| Monmouth Real Estate Investment Corp. Class A | | 1,753,569 | 25,304,001 |
| NexPoint Residential Trust, Inc. | | 301,300 | 11,518,699 |
| Public Storage | | 65,300 | 13,052,164 |
| Retail Value, Inc. | | 258,002 | 3,266,305 |
| Sabra Health Care REIT, Inc. | | 1,554,475 | 22,912,962 |
| Safety Income and Growth, Inc. (a) | | 360,835 | 18,196,909 |
| Diversified Healthcare Trust (SBI) | | 1,437,389 | 5,598,630 |
| SITE Centers Corp. | | 1,602,638 | 11,747,337 |
| Terreno Realty Corp. | | 119,528 | 7,262,521 |
| UMH Properties, Inc. | | 433,623 | 5,333,563 |
| Ventas, Inc. | | 1,172,386 | 44,972,727 |
| Washington REIT (SBI) | | 558,347 | 12,484,639 |
| Weyerhaeuser Co. | | 915,700 | 25,465,617 |
| | | | 1,161,407,158 |
| TOTAL COMMON STOCKS | | | |
| (Cost $1,377,531,744) | | | 1,506,948,107 |
|
| Preferred Stocks - 23.2% | | | |
| Convertible Preferred Stocks - 1.2% | | | |
| FINANCIALS - 0.5% | | | |
| Mortgage Real Estate Investment Trusts - 0.5% | | | |
| Great Ajax Corp. 7.25% (b) | | 611,442 | 14,735,752 |
| ZAIS Financial Corp. 7.00% | | 404,062 | 9,293,426 |
| | | | 24,029,178 |
| REAL ESTATE - 0.7% | | | |
| Equity Real Estate Investment Trusts (REITs) - 0.6% | | | |
| Braemar Hotels & Resorts, Inc. 5.50% | | 98,091 | 1,116,276 |
| Lexington Corporate Properties Trust Series C, 6.50% | | 440,102 | 23,446,350 |
| RLJ Lodging Trust Series A, 1.95% | | 31,585 | 695,818 |
| Wheeler REIT, Inc. 8.75% (c) | | 510,973 | 6,575,050 |
| | | | 31,833,494 |
| Real Estate Management & Development - 0.1% | | | |
| Landmark Infrastructure Partners LP 3 month U.S. LIBOR + 4.690% 6.856% (d)(e) | | 189,650 | 4,648,581 |
| TOTAL REAL ESTATE | | | 36,482,075 |
|
| TOTAL CONVERTIBLE PREFERRED STOCKS | | | 60,511,253 |
|
| Nonconvertible Preferred Stocks - 22.0% | | | |
| ENERGY - 0.6% | | | |
| Oil, Gas & Consumable Fuels - 0.6% | | | |
| DCP Midstream Partners LP: | | | |
| 7.95% (d) | | 328,262 | 5,370,366 |
| Series B, 7.875% (d) | | 256,314 | 4,106,150 |
| Enbridge, Inc.: | | | |
| Series 1 5 year U.S. Treasury Index + 3.140% 5.949% (d)(e) | | 498,275 | 8,351,089 |
| Series L 5 year U.S. Treasury Index + 3.150% 4.959% (d)(e) | | 111,400 | 1,626,440 |
| Energy Transfer Partners LP 7.60% (d) | | 471,751 | 8,996,292 |
| Global Partners LP 9.75% (d) | | 161,507 | 3,916,545 |
| | | | 32,366,882 |
| FINANCIALS - 13.1% | | | |
| Mortgage Real Estate Investment Trusts - 13.0% | | | |
| AG Mortgage Investment Trust, Inc.: | | | |
| 8.00% | | 611,362 | 8,966,785 |
| 8.25% | | 38,510 | 564,172 |
| Series C 8.00% (d) | | 638,138 | 9,399,773 |
| AGNC Investment Corp.: | | | |
| 6.125% (d) | | 653,900 | 14,398,878 |
| 6.875% (d) | | 874,072 | 19,823,953 |
| Series C, 7.00% (d) | | 958,602 | 22,613,421 |
| Series E 6.50% (d) | | 1,171,418 | 26,596,929 |
| Annaly Capital Management, Inc.: | | | |
| 6.75% (d) | | 535,092 | 12,109,132 |
| Series D, 7.50% | | 599,401 | 15,044,965 |
| Series F, 6.95% (d) | | 2,050,060 | 46,064,848 |
| Series G, 6.50% (d) | | 1,229,790 | 26,256,017 |
| Anworth Mortgage Asset Corp. Series A, 8.625% | | 235,600 | 5,513,040 |
| Arbor Realty Trust, Inc.: | | | |
| Series A, 8.25% | | 186,964 | 4,677,839 |
| Series B, 7.75% | | 237,325 | 5,695,800 |
| Series C, 8.50% | | 98,875 | 2,532,050 |
| Arlington Asset Investment Corp.: | | | |
| 6.625% | | 240,823 | 5,668,973 |
| 8.25% (d) | | 147,125 | 2,845,398 |
| Armour Residential REIT, Inc. Series C 7.00% | | 102,500 | 2,330,850 |
| Capstead Mortgage Corp. Series E, 7.50% | | 488,533 | 11,216,718 |
| Cherry Hill Mortgage Investment Corp.: | | | |
| 8.25% (d) | | 245,925 | 5,090,648 |
| Series A, 8.20% | | 248,750 | 5,679,087 |
| Chimera Investment Corp.: | | | |
| 8.00% (d) | | 938,131 | 18,884,577 |
| Series A, 8.00% | | 202,500 | 4,645,350 |
| Series B, 8.00% (d) | | 2,133,504 | 43,566,152 |
| Series C, 7.75% (d) | | 2,359,586 | 46,483,844 |
| Dynex Capital, Inc.: | | | |
| Series B, 7.625% (b) | | 154,355 | 3,741,565 |
| Series C 6.90% (b)(d) | | 372,483 | 8,492,612 |
| Ellington Financial LLC 6.75% (d) | | 368,770 | 7,497,094 |
| Exantas Capital Corp. 8.625% (d) | | 236,708 | 3,100,875 |
| Invesco Mortgage Capital, Inc.: | | | |
| 7.50% (d) | | 1,602,689 | 33,560,308 |
| Series A, 7.75% | | 121,967 | 2,793,044 |
| Series B, 7.75% (d) | | 898,846 | 19,091,489 |
| MFA Financial, Inc.: | | | |
| 6.50% (d) | | 1,093,451 | 19,725,856 |
| 8.00% | | 624,016 | 14,583,254 |
| Series B, 7.50% | | 609,332 | 13,039,705 |
| New Residential Investment Corp.: | | | |
| 7.125% (d) | | 1,354,712 | 27,487,106 |
| Series A 7.50% (d) | | 725,327 | 15,790,369 |
| Series C 6.375% (d) | | 1,130,054 | 21,301,518 |
| New York Mortgage Trust, Inc.: | | | |
| Series B, 7.75% | | 281,092 | 5,644,327 |
| Series C, 7.875% | | 317,125 | 6,377,384 |
| Series D, 8.00% (d) | | 317,918 | 6,247,089 |
| PennyMac Mortgage Investment Trust: | | | |
| 8.125% (d) | | 414,254 | 9,987,664 |
| Series B, 8.00% (d) | | 750,421 | 18,025,112 |
| Two Harbors Investment Corp.: | | | |
| 7.50% | | 491,117 | 10,613,038 |
| 7.75% | | 117,103 | 2,595,237 |
| Series A, 8.125% (d) | | 697,850 | 15,192,195 |
| Series B, 7.625% (d) | | 1,483,255 | 30,703,379 |
| Series C, 7.25% (d) | | 899,517 | 17,945,364 |
| ZAIS Financial Corp. Series C 6.20% | | 378,550 | 7,786,774 |
| | | | 687,991,557 |
| Real Estate Management & Development - 0.1% | | | |
| Brookfield Properties Corp. Series EE, 5.10% (d) | | 679,025 | 8,111,090 |
| TOTAL FINANCIALS | | | 696,102,647 |
| REAL ESTATE - 8.2% | | | |
| Equity Real Estate Investment Trusts (REITs) - 8.1% | | | |
| American Finance Trust, Inc. 7.50% | | 874,787 | 20,181,336 |
| American Homes 4 Rent: | | | |
| 6.25% | | 98,905 | 2,709,997 |
| Series D, 6.50% | | 276,875 | 7,243,050 |
| Series E, 6.35% | | 250,075 | 6,504,451 |
| Series F, 5.875% | | 248,009 | 6,527,597 |
| Series G, 5.875% | | 199,750 | 5,195,498 |
| Armada Hoffler Properties, Inc. 6.75% | | 154,250 | 4,268,098 |
| Ashford Hospitality Trust, Inc.: | | | |
| Series D, 8.45% | | 292,820 | 1,559,267 |
| Series F, 7.375% | | 494,500 | 2,294,480 |
| Series G, 7.375% | | 238,068 | 1,028,454 |
| Series H, 7.50% | | 231,565 | 1,024,328 |
| Series I, 7.50% | | 323,909 | 1,392,809 |
| Bluerock Residential Growth (REIT), Inc.: | | | |
| Series A, 8.25% | | 481,325 | 11,970,553 |
| Series C, 7.625% | | 252,994 | 6,052,704 |
| Series D, 7.125% | | 168,100 | 3,773,845 |
| Braemar Hotels & Resorts, Inc. Series D, 8.25% | | 173,050 | 2,465,963 |
| Cedar Realty Trust, Inc.: | | | |
| Series B, 7.25% | | 181,872 | 4,133,951 |
| Series C, 6.50% | | 291,600 | 5,155,488 |
| City Office REIT, Inc. Series A, 6.625% | | 178,475 | 4,015,688 |
| Colony Capital, Inc.: | | | |
| Series G, 7.50% | | 583,284 | 11,782,337 |
| Series H, 7.125% | | 727,701 | 14,546,743 |
| Series I, 7.15% | | 874,492 | 17,157,533 |
| Series J, 7.15% | | 1,151,024 | 22,640,642 |
| Digital Realty Trust, Inc.: | | | |
| Series C, 6.625% | | 83,050 | 2,210,791 |
| Series G, 5.875% | | 39,994 | 1,022,247 |
| Farmland Partners, Inc. Series B, 6.00% | | 623,150 | 14,830,970 |
| Gladstone Commercial Corp.: | | | |
| 6.625% | | 98,875 | 2,393,912 |
| Series D, 7.00% | | 532,775 | 13,138,232 |
| Gladstone Land Corp. Series A, 6.375% | | 63,275 | 1,649,111 |
| Global Medical REIT, Inc. Series A, 7.50% | | 150,848 | 3,807,554 |
| Global Net Lease, Inc.: | | | |
| Series A, 7.25% | | 531,595 | 13,145,122 |
| Series B 6.875% | | 294,000 | 6,909,000 |
| Government Properties Income Trust 5.875% | | 200,225 | 5,021,643 |
| Healthcare Trust, Inc. Series A 7.375% | | 128,500 | 2,697,215 |
| Hersha Hospitality Trust: | | | |
| Series C, 6.875% | | 49,450 | 546,423 |
| Series D, 6.50% | | 197,750 | 2,129,768 |
| Investors Real Estate Trust Series C, 6.625% | | 317,300 | 8,259,319 |
| iStar Financial, Inc.: | | | |
| Series D, 8.00% | | 340,621 | 8,600,680 |
| Series G, 7.65% | | 366,879 | 8,805,096 |
| Series I, 7.50% | | 391,996 | 9,411,824 |
| Jernigan Capital, Inc. Series B, 7.00% | | 143,983 | 3,396,559 |
| Monmouth Real Estate Investment Corp. Series C, 6.125% | | 342,800 | 8,669,378 |
| National Storage Affiliates Trust Series A, 6.00% | | 91,575 | 2,457,873 |
| Pebblebrook Hotel Trust: | | | |
| 6.30% | | 260,697 | 5,253,045 |
| 6.375% | | 363,953 | 7,266,686 |
| Series C, 6.50% | | 232,046 | 4,749,982 |
| Series D, 6.375% | | 364,302 | 7,453,619 |
| Pennsylvania (REIT): | | | |
| Series B, 7.375% | | 99,385 | 721,595 |
| Series C, 7.20% | | 50,325 | 320,067 |
| Series D, 6.875% | | 150,100 | 965,143 |
| Plymouth Industrial REIT, Inc. Series A, 7.50% | | 171,625 | 4,287,193 |
| Prologis, Inc. Series Q, 8.54% | | 93,396 | 6,891,691 |
| PS Business Parks, Inc. Series Z 4.875% | | 52,000 | 1,325,480 |
| QTS Realty Trust, Inc. Series A, 7.125% | | 29,675 | 807,056 |
| Rexford Industrial Realty, Inc.: | | | |
| Series A, 5.875% | | 133,500 | 3,400,245 |
| Series B, 5.875% | | 78,600 | 2,007,444 |
| Series C 5.625% | | 68,225 | 1,756,794 |
| Saul Centers, Inc.: | | | |
| Series D, 6.125% | | 82,775 | 1,907,964 |
| Series E 6.00% | | 76,841 | 1,754,280 |
| Senior Housing Properties Trust 5.625% | | 3,750 | 70,313 |
| Seritage Growth Properties Series A, 7.00% | | 91,986 | 1,195,827 |
| SITE Centers Corp. Series K, 6.25% | | 226,338 | 5,158,243 |
| Sotherly Hotels, Inc.: | | | |
| Series B, 8.00% | | 67,250 | 412,915 |
| Series C, 7.875% | | 107,000 | 648,420 |
| Spirit Realty Capital, Inc. Series A, 6.00% | | 94,125 | 2,371,009 |
| Stag Industrial, Inc. Series C, 6.875% | | 82,075 | 2,128,508 |
| Summit Hotel Properties, Inc.: | | | |
| Series D, 6.45% | | 214,950 | 3,892,745 |
| Series E, 6.25% | | 299,093 | 5,533,221 |
| Sunstone Hotel Investors, Inc.: | | | |
| Series E, 6.95% | | 41,525 | 996,600 |
| Series F, 6.45% | | 83,050 | 1,935,896 |
| Taubman Centers, Inc. Series K, 6.25% | | 155,572 | 3,358,799 |
| UMH Properties, Inc.: | | | |
| Series B, 8.00% | | 316,029 | 8,080,862 |
| Series C, 6.75% | | 430,965 | 10,558,643 |
| Series D, 6.375% | | 513,725 | 12,380,773 |
| Urstadt Biddle Properties, Inc.: | | | |
| Series H, 6.25% | | 281,325 | 6,431,090 |
| Series K 5.875% | | 69,225 | 1,487,645 |
| VEREIT, Inc. Series F, 6.70% | | 1,123,811 | 28,938,133 |
| Washington Prime Group, Inc.: | | | |
| Series H, 7.50% | | 181,934 | 1,371,782 |
| Series I, 6.875% | | 284,728 | 2,050,070 |
| | | | 432,597,307 |
| Real Estate Management & Development - 0.1% | | | |
| Brookfield Property Partners LP: | | | |
| 5.75% | | 43,000 | 774,000 |
| 6.50% | | 34,125 | 680,111 |
| Landmark Infrastructure Partners LP Series B, 7.90% | | 116,375 | 2,676,625 |
| | | | 4,130,736 |
| TOTAL REAL ESTATE | | | 436,728,043 |
| UTILITIES - 0.1% | | | |
| Multi-Utilities - 0.1% | | | |
| Brookfield Infrastructure Partners LP Series 5, 5.35% (d) | | 182,825 | 3,167,993 |
|
| TOTAL NONCONVERTIBLE PREFERRED STOCKS | | | 1,168,365,565 |
|
| TOTAL PREFERRED STOCKS | | | |
| (Cost $1,427,879,237) | | | 1,228,876,818 |
| | | Principal Amount | Value |
|
| Corporate Bonds - 19.9% | | | |
| Convertible Bonds - 5.9% | | | |
| FINANCIALS - 5.6% | | | |
| Mortgage Real Estate Investment Trusts - 5.6% | | | |
| Arbor Realty Trust, Inc. 4.75% 11/1/22 (f) | | 19,326,000 | 18,009,799 |
| Blackstone Mortgage Trust, Inc. 4.75% 3/15/23 | | 3,856,000 | 3,603,128 |
| Chimera Investment Corp. 7% 4/1/23 | | 3,400,000 | 4,618,951 |
| Colony Financial, Inc. 5% 4/15/23 | | 25,791,000 | 23,727,720 |
| Granite Point Mortgage Trust, Inc.: | | | |
| 5.625% 12/1/22 (f) | | 6,694,000 | 5,288,260 |
| 6.375% 10/1/23 | | 10,099,000 | 7,536,379 |
| KKR Real Estate Finance Trust, Inc. 6.125% 5/15/23 | | 15,629,000 | 15,335,956 |
| MFA Financial, Inc. 6.25% 6/15/24 | | 25,352,000 | 23,038,630 |
| New York Mortgage Trust, Inc. 6.25% 1/15/22 | | 2,472,000 | 2,203,170 |
| PennyMac Corp. 5.5% 11/1/24 (f) | | 34,434,000 | 32,623,316 |
| Redwood Trust, Inc.: | | | |
| 4.75% 8/15/23 | | 13,195,000 | 11,699,065 |
| 5.625% 7/15/24 | | 55,436,000 | 47,976,647 |
| RWT Holdings, Inc. 5.75% 10/1/25 (f) | | 30,970,000 | 25,812,813 |
| Starwood Property Trust, Inc. 4.375% 4/1/23 | | 10,956,000 | 10,540,953 |
| Two Harbors Investment Corp. 6.25% 1/15/22 | | 19,951,000 | 19,726,551 |
| Western Asset Mortgage Capital Corp. 6.75% 10/1/22 | | 63,526,000 | 47,034,650 |
| | | | 298,775,988 |
| REAL ESTATE - 0.3% | | | |
| Equity Real Estate Investment Trusts (REITs) - 0.3% | | | |
| Colony Capital Operating Co. LLC 5.75% 7/15/25 (f) | | 11,370,000 | 13,143,936 |
|
| TOTAL CONVERTIBLE BONDS | | | 311,919,924 |
|
| Nonconvertible Bonds - 14.0% | | | |
| CONSUMER DISCRETIONARY - 3.9% | | | |
| Hotels, Restaurants & Leisure - 0.2% | | | |
| Marriott Ownership Resorts, Inc. 6.5% 9/15/26 | | 3,955,000 | 4,053,875 |
| Times Square Hotel Trust 8.528% 8/1/26 (f) | | 5,208,537 | 5,639,105 |
| | | | 9,692,980 |
| Household Durables - 3.7% | | | |
| Adams Homes, Inc. 7.5% 2/15/25 (f) | | 9,530,000 | 9,339,400 |
| Ashton Woods U.S.A. LLC/Ashton Woods Finance Co.: | | | |
| 6.625% 1/15/28 (f) | | 9,925,000 | 9,999,438 |
| 6.75% 8/1/25 (f) | | 26,458,000 | 26,854,870 |
| 9.875% 4/1/27 (f) | | 21,220,000 | 22,917,600 |
| Beazer Homes U.S.A., Inc. 5.875% 10/15/27 | | 9,216,000 | 9,252,772 |
| Brookfield Residential Properties, Inc./Brookfield Residential U.S. Corp.: | | | |
| 4.875% 2/15/30 (f) | | 1,590,000 | 1,442,925 |
| 6.25% 9/15/27 (f) | | 8,533,000 | 8,533,000 |
| Century Communities, Inc.: | | | |
| 5.875% 7/15/25 | | 5,982,000 | 6,155,957 |
| 6.75% 6/1/27 | | 11,230,000 | 11,992,966 |
| LGI Homes, Inc. 6.875% 7/15/26 (f) | | 24,116,000 | 25,683,540 |
| M/I Homes, Inc. 5.625% 8/1/25 | | 10,842,000 | 11,275,680 |
| Meritage Homes Corp.: | | | |
| 5.125% 6/6/27 | | 2,181,000 | 2,333,670 |
| 6% 6/1/25 | | 33,000 | 37,877 |
| New Home Co. LLC 7.25% 4/1/22 | | 16,142,000 | 15,254,190 |
| Picasso Finance Sub, Inc. 6.125% 6/15/25 (f) | | 8,000,000 | 8,500,000 |
| TRI Pointe Homes, Inc.: | | | |
| 5.25% 6/1/27 | | 11,458,000 | 12,030,900 |
| 5.7% 6/15/28 | | 3,000,000 | 3,300,000 |
| 5.875% 6/15/24 | | 12,175,000 | 13,121,119 |
| | | | 198,025,904 |
| TOTAL CONSUMER DISCRETIONARY | | | 207,718,884 |
| ENERGY - 0.4% | | | |
| Oil, Gas & Consumable Fuels - 0.4% | | | |
| EG Global Finance PLC: | | | |
| 6.75% 2/7/25 (f) | | 7,750,000 | 8,097,200 |
| 8.5% 10/30/25 (f) | | 3,560,000 | 3,889,015 |
| Global Partners LP/GLP Finance Corp.: | | | |
| 7% 6/15/23 | | 3,955,000 | 3,896,466 |
| 7% 8/1/27 | | 3,955,000 | 3,826,463 |
| | | | 19,709,144 |
| FINANCIALS - 0.4% | | | |
| Diversified Financial Services - 0.3% | | | |
| Five Point Operation Co. LP 7.875% 11/15/25 (f) | | 18,463,000 | 17,840,243 |
| Mortgage Real Estate Investment Trusts - 0.0% | | | |
| Starwood Property Trust, Inc. 4.75% 3/15/25 | | 2,588,000 | 2,490,950 |
| Thrifts & Mortgage Finance - 0.1% | | | |
| NMI Holdings, Inc. 7.375% 6/1/25 (f) | | 3,000,000 | 3,261,330 |
| TOTAL FINANCIALS | | | 23,592,523 |
| HEALTH CARE - 0.6% | | | |
| Health Care Providers & Services - 0.6% | | | |
| Sabra Health Care LP: | | | |
| 3.9% 10/15/29 | | 989,000 | 934,178 |
| 4.8% 6/1/24 | | 7,475,000 | 7,580,455 |
| 5.125% 8/15/26 | | 20,264,000 | 21,568,677 |
| | | | 30,083,310 |
| INDUSTRIALS - 0.5% | | | |
| Building Products - 0.3% | | | |
| Shea Homes Ltd. Partnership/Corp.: | | | |
| 4.75% 2/15/28 (f) | | 4,305,000 | 4,516,591 |
| 6.125% 4/1/25 (f) | | 10,051,000 | 10,352,530 |
| | | | 14,869,121 |
| Trading Companies & Distributors - 0.2% | | | |
| Williams Scotsman International, Inc. 6.875% 8/15/23 (f) | | 11,866,000 | 12,254,137 |
| TOTAL INDUSTRIALS | | | 27,123,258 |
| REAL ESTATE - 8.2% | | | |
| Equity Real Estate Investment Trusts (REITs) - 4.5% | | | |
| CBL & Associates LP: | | | |
| 4.6% 10/15/24 | | 26,459,000 | 6,350,160 |
| 5.25% 12/1/23 | | 11,371,000 | 2,729,040 |
| 5.95% 12/15/26 | | 10,317,000 | 2,398,703 |
| CTR Partnership LP/CareTrust Capital Corp. 5.25% 6/1/25 | | 6,992,000 | 7,098,348 |
| ESH Hospitality, Inc. 5.25% 5/1/25 (f) | | 2,154,000 | 2,200,268 |
| GLP Capital LP/GLP Financing II, Inc.: | | | |
| 4% 1/15/31 | | 1,000,000 | 1,037,750 |
| 5.25% 6/1/25 | | 4,500,000 | 4,846,950 |
| Government Properties Income Trust 4.25% 5/15/24 | | 4,974,000 | 4,981,089 |
| Hospitality Properties Trust: | | | |
| 4.65% 3/15/24 | | 3,500,000 | 3,202,500 |
| 5% 8/15/22 | | 3,141,000 | 3,101,207 |
| 7.5% 9/15/25 | | 7,950,000 | 8,428,917 |
| iStar Financial, Inc.: | | | |
| 4.25% 8/1/25 | | 16,925,000 | 16,269,156 |
| 4.75% 10/1/24 | | 25,920,000 | 25,596,000 |
| 5.25% 9/15/22 | | 13,900,000 | 13,900,000 |
| Lexington Corporate Properties Trust 4.4% 6/15/24 | | 2,156,000 | 2,209,033 |
| Omega Healthcare Investors, Inc.: | | | |
| 4.5% 4/1/27 | | 2,434,000 | 2,581,243 |
| 4.75% 1/15/28 | | 4,567,000 | 4,977,370 |
| 4.95% 4/1/24 | | 2,866,000 | 3,040,390 |
| Select Income REIT: | | | |
| 4.15% 2/1/22 | | 11,045,000 | 11,084,874 |
| 4.5% 2/1/25 | | 21,056,000 | 21,169,053 |
| Senior Housing Properties Trust: | | | |
| 4.75% 5/1/24 | | 44,393,000 | 40,629,353 |
| 4.75% 2/15/28 | | 9,933,000 | 8,648,188 |
| 6.75% 12/15/21 | | 7,910,000 | 7,976,606 |
| 9.75% 6/15/25 | | 21,500,000 | 23,730,625 |
| SITE Centers Corp. 3.625% 2/1/25 | | 3,285,000 | 3,356,144 |
| Uniti Group, Inc. 7.875% 2/15/25 (f) | | 5,000,000 | 5,262,500 |
| VEREIT Operating Partnership LP 4.875% 6/1/26 | | 436,000 | 486,517 |
| | | | 237,291,984 |
| Real Estate Management & Development - 3.7% | | | |
| DTZ U.S. Borrower LLC 6.75% 5/15/28 (f) | | 1,000,000 | 1,070,000 |
| Forestar Group, Inc.: | | | |
| 5% 3/1/28 (f) | | 12,000,000 | 12,000,000 |
| 8% 4/15/24 (f) | | 25,132,000 | 26,963,118 |
| Greystar Real Estate Partners 5.75% 12/1/25 (f) | | 13,480,000 | 13,581,100 |
| Howard Hughes Corp. 5.375% 3/15/25 (f) | | 34,007,000 | 34,349,450 |
| Kennedy-Wilson, Inc. 5.875% 4/1/24 | | 48,339,000 | 48,520,271 |
| Mack-Cali Realty LP: | | | |
| 3.15% 5/15/23 | | 10,000 | 8,976 |
| 4.5% 4/18/22 | | 517,000 | 502,471 |
| Mattamy Group Corp.: | | | |
| 4.625% 3/1/30 (f) | | 13,265,000 | 13,463,975 |
| 5.25% 12/15/27 (f) | | 13,411,000 | 13,913,913 |
| Mid-America Apartments LP 4.3% 10/15/23 | | 2,178,000 | 2,384,120 |
| Realogy Group LLC/Realogy Co-Issuer Corp. 7.625% 6/15/25 (f) | | 3,025,000 | 3,174,647 |
| Taylor Morrison Communities, Inc./Monarch Communities, Inc.: | | | |
| 5.625% 3/1/24 (f) | | 5,434,000 | 5,787,210 |
| 5.875% 1/31/25 (f) | | 2,193,000 | 2,258,790 |
| 5.875% 6/15/27 (f) | | 1,798,000 | 1,986,790 |
| 6% 9/1/23 (f) | | 681,000 | 701,430 |
| 6.625% 7/15/27 (f) | | 8,573,000 | 9,344,570 |
| Washington Prime Group LP 6.45% 8/15/24 | | 23,181,000 | 9,098,543 |
| | | | 199,109,374 |
| TOTAL REAL ESTATE | | | 436,401,358 |
|
| TOTAL NONCONVERTIBLE BONDS | | | 744,628,477 |
|
| TOTAL CORPORATE BONDS | | | |
| (Cost $1,117,349,079) | | | 1,056,548,401 |
|
| Asset-Backed Securities - 2.0% | | | |
| American Homes 4 Rent: | | | |
| Series 2015-SFR1 Class F, 5.885% 4/17/52 (f) | | 2,000,000 | 2,011,665 |
| Series 2015-SFR2: | | | |
| Class E, 6.07% 10/17/52 (f) | | 8,259,000 | 9,281,020 |
| Class XS, 0% 10/17/52 (d)(f)(g)(h) | | 4,647,665 | 46 |
| Capital Trust RE CDO Ltd. Series 2005-1A Class D, 1 month U.S. LIBOR + 1.500% 3.3464% 3/20/50 (d)(e)(f)(h) | | 2,250,000 | 225 |
| Conseco Finance Securitizations Corp. Series 2002-2 Class M2, 9.163% 3/1/33 | | 394,514 | 371,331 |
| Deutsche Financial Capital Securitization LLC Series 1997-I Class M, 7.275% 9/15/27 | | 81,755 | 81,620 |
| GPMT Ltd. Series 2019-FL2 Class D, 1 month U.S. LIBOR + 2.950% 3.1299% 2/22/36 (d)(e)(f) | | 2,142,000 | 1,974,881 |
| Green Tree Financial Corp.: | | | |
| Series 1996-4 Class M1, 7.75% 6/15/27 (d) | | 581,828 | 585,818 |
| Series 1997-3 Class M1, 7.53% 3/15/28 | | 4,137,525 | 4,177,785 |
| Home Partners America Trust Series 2019-2 Class F, 3.866% 10/19/39 (f) | | 2,959,969 | 2,824,222 |
| Home Partners of America Credit Trust Series 2017-1 Class F, 1 month U.S. LIBOR + 3.530% 3.7199% 7/17/34 (d)(e)(f) | | 6,318,500 | 6,302,616 |
| Home Partners of America Trust Series 2018-1 Class F, 1 month U.S. LIBOR + 2.350% 2.5309% 7/17/37 (d)(e)(f) | | 3,896,000 | 3,731,749 |
| Invitation Homes Trust Series 2018-SFR2 Class F, 1 month U.S. LIBOR + 2.250% 2.6% 6/17/37 (d)(e)(f) | | 1,394,074 | 1,335,151 |
| Kref Ltd. Series 2018-FL1 Class D, 1 month U.S. LIBOR + 2.550% 2.7309% 6/15/36 (d)(e)(f) | | 2,560,000 | 2,392,314 |
| Lehman ABS Manufactured Housing Contract Trust Series 2001-B Class M2, 7.17% 4/15/40 | | 613,335 | 506,047 |
| Merit Securities Corp. Series 13 Class M1, 7.7764% 12/28/33 (d) | | 1,305,128 | 1,352,162 |
| Progress Residential Trust: | | | |
| Series 2017-SFR1 Class F, 5.35% 8/17/34 (f) | | 3,073,000 | 3,149,298 |
| Series 2017-SFR2 Class F, 4.836% 12/17/34 (f) | | 2,568,000 | 2,545,554 |
| Series 2018-SFR2 Class F, 4.953% 8/17/35 (f) | | 5,083,000 | 5,109,648 |
| Series 2018-SFR3: | | | |
| Class F, 5.368% 10/17/35 (f) | | 3,412,000 | 3,503,587 |
| Class G, 5.618% 10/17/35 (f) | | 4,000,000 | 4,046,940 |
| Series 2019-SFR1 Class F, 5.061% 8/17/35 (f) | | 3,000,000 | 3,089,513 |
| Series 2019-SFR2 Class F, 4.837% 5/17/36 (f) | | 3,902,000 | 3,771,174 |
| Series 2020-SFR1 Class H, 5.268% 4/17/37 (f) | | 3,633,000 | 3,468,496 |
| Starwood Waypoint Homes Trust Series 2017-1 Class F, 1 month U.S. LIBOR + 3.400% 3.5748% 1/17/35 (d)(e)(f) | | 12,529,000 | 12,395,089 |
| Taberna Preferred Funding III Ltd. Series 2005-3A Class D, 3 month U.S. LIBOR + 2.650% 4.5405% 2/5/36 (d)(e)(f)(h) | | 4,815,416 | 361 |
| Tricon American Homes: | | | |
| Series 2016-SFR1 Class F, 5.769% 11/17/33 (f) | | 7,544,000 | 7,467,250 |
| Series 2017-SFR1 Class F, 5.151% 9/17/34 (f) | | 8,442,000 | 8,621,981 |
| Series 2017-SFR2 Class F, 5.104% 1/17/36 (f) | | 3,785,000 | 3,927,941 |
| Series 2018-SFR1 Class F, 4.96% 5/17/37 (f) | | 8,282,000 | 8,389,511 |
| VB-S1 Issuer LLC Series 2018-1A Class F, 5.25% 2/15/48 (f) | | 1,354,000 | 1,380,808 |
| TOTAL ASSET-BACKED SECURITIES | | | |
| (Cost $110,796,176) | | | 107,795,803 |
|
| Collateralized Mortgage Obligations - 0.0% | | | |
| U.S. Government Agency - 0.0% | | | |
| Fannie Mae REMIC Trust: | | | |
| Series 2002-W1 subordinate REMIC pass thru certificates, Class 3B3, 3.9255% 2/25/42 (d)(f) | | 36,621 | 10,545 |
| Series 2003-W10 subordinate REMIC pass thru certificates, Class 2B3, 3.9103% 6/25/43 (d)(f) | | 64,789 | 35,825 |
| TOTAL COLLATERALIZED MORTGAGE OBLIGATIONS | | | |
| (Cost $80,145) | | | 46,370 |
|
| Commercial Mortgage Securities - 13.1% | | | |
| BAMLL Commercial Mortgage Securities Trust floater Series 2019-AHT Class C, 1 month U.S. LIBOR + 2.000% 2.1748% 3/15/34 (d)(e)(f) | | 7,168,000 | 6,538,151 |
| BANK: | | | |
| Series 2017-BNK8 Class E, 2.8% 11/15/50 (f) | | 11,374,393 | 6,353,431 |
| Series 2018-BN12 Class D, 3% 5/15/61 (f) | | 1,682,000 | 1,093,081 |
| Series 2019-BN21 Class F, 2.6818% 10/17/52 (f) | | 12,047,000 | 5,352,485 |
| Barclays Commercial Mortgage Securities LLC: | | | |
| Series 2015-STP: | | | |
| Class E, 4.2844% 9/10/28 (d)(f) | | 8,413,000 | 8,353,256 |
| Class F, 4.2844% 9/10/28 (d)(f) | | 4,074,000 | 4,042,851 |
| Series 2019-C5 Class F, 2.6014% 11/15/52 (d)(f) | | 4,000,000 | 1,638,420 |
| Benchmark Mortgage Trust: | | | |
| sequential payer Series 2019-B14: | | | |
| Class 225D, 3.2943% 12/15/62 (d)(f) | | 3,427,000 | 3,174,679 |
| Class 225E, 3.2943% 12/15/62 (d)(f) | | 5,141,000 | 4,484,204 |
| Series 2020-B18 Class AGNG, 4.534% 7/15/53 (f) | | 11,379,000 | 10,167,296 |
| Braemar Hotels & Resorts Trust floater Series 2018-PRME Class E, 1 month U.S. LIBOR + 2.400% 2.5748% 6/15/35 (d)(e)(f) | | 1,500,000 | 1,197,335 |
| BX Commercial Mortgage Trust floater: | | | |
| Series 2019-CALM Class E, 1 month U.S. LIBOR + 2.000% 2.1748% 11/25/32 (d)(e)(f) | | 6,426,000 | 6,114,259 |
| Series 2020-BXLP Class G, 1 month U.S. LIBOR + 2.500% 2.6748% 12/15/36 (d)(e)(f) | | 6,007,502 | 5,799,890 |
| BX Trust: | | | |
| floater: | | | |
| Series 2018-IND: | | | |
| Class G, 1 month U.S. LIBOR + 2.050% 2.2248% 11/15/35 (d)(e)(f) | | 3,281,600 | 3,232,165 |
| Class H, 1 month U.S. LIBOR + 3.000% 3.1748% 11/15/35 (d)(e)(f) | | 6,206,900 | 6,025,949 |
| Series 2019-IMC Class G, 1 month U.S. LIBOR + 3.600% 3.7748% 4/15/34 (d)(e)(f) | | 5,181,000 | 3,885,997 |
| Series 2019-XL Class G, 1 month U.S. LIBOR + 2.300% 2.4748% 10/15/36 (d)(e)(f) | | 2,444,442 | 2,383,127 |
| Series 2019-OC11 Class E, 4.0755% 12/9/41 (d)(f) | | 20,085,000 | 18,154,100 |
| CALI Mortgage Trust Series 2019-101C Class F, 4.3244% 3/10/39 (d)(f) | | 4,099,000 | 3,703,146 |
| CAMB Commercial Mortgage Trust floater Series 2019-LIFE Class G, 1 month U.S. LIBOR + 3.250% 3.4248% 12/15/37 (d)(e)(f) | | 7,428,000 | 7,012,932 |
| CD Mortgage Trust Series 2017-CD3 Class D, 3.25% 2/10/50 (f) | | 3,353,000 | 2,439,546 |
| CGMS Commercial Mortgage Trust Series 2017-MDRB: | | | |
| Class D, 1 month U.S. LIBOR + 3.250% 3.4248% 7/15/30 (d)(e)(f) | | 6,131,000 | 5,553,304 |
| Class E, 1 month U.S. LIBOR + 3.870% 4.0463% 7/15/30 (d)(e)(f) | | 6,666,000 | 5,644,940 |
| CHC Commercial Mortgage Trust floater Series 2019-CHC Class F, 1 month U.S. LIBOR + 2.600% 2.783% 6/15/34 (d)(e)(f) | | 1,493,555 | 1,156,439 |
| Citigroup Commercial Mortgage Trust: | | | |
| Series 2013-GC15 Class D, 5.2129% 9/10/46 (d)(f) | | 5,254,000 | 4,771,773 |
| Series 2016-C3 Class D, 3% 11/15/49 (f) | | 7,010,000 | 4,223,847 |
| COMM Mortgage Trust: | | | |
| floater Series 2018-HCLV: | | | |
| Class F, 1 month U.S. LIBOR + 3.050% 3.2248% 9/15/33 (d)(e)(f) | | 4,265,000 | 3,199,816 |
| Class G, 1 month U.S. LIBOR + 5.050% 5.2311% 9/15/33 (d)(e)(f) | | 4,265,000 | 3,094,652 |
| sequential payer Series 2013-LC6 Class E, 3.5% 1/10/46 (f) | | 4,741,000 | 2,812,943 |
| Series 2012-CR1: | | | |
| Class D, 5.3196% 5/15/45 (d)(f) | | 5,550,000 | 3,658,588 |
| Class G, 2.462% 5/15/45 (f)(h) | | 6,346,000 | 844,955 |
| Series 2012-LC4 Class C, 5.536% 12/10/44 (d) | | 1,978,000 | 1,478,712 |
| Series 2013-CR10 Class D, 4.7894% 8/10/46 (d)(f) | | 4,544,000 | 4,167,885 |
| Series 2013-CR12 Class D, 5.0713% 10/10/46 (d)(f) | | 1,959,000 | 1,135,323 |
| Series 2013-LC6 Class D, 4.3181% 1/10/46 (d)(f) | | 8,301,000 | 5,665,489 |
| Series 2014-CR17 Class E, 4.8473% 5/10/47 (d)(f)(h) | | 3,098,000 | 1,474,523 |
| Series 2014-UBS2 Class D, 5.0026% 3/10/47 (d)(f) | | 3,713,000 | 2,575,869 |
| Series 2017-CD4 Class D, 3.3% 5/10/50 (f) | | 2,769,000 | 2,251,120 |
| COMM Trust Series 2017-COR2 Class D, 3% 9/10/50 (f) | | 2,769,000 | 2,029,451 |
| Commercial Mortgage Trust pass-thru certificates Series 2012-CR2: | | | |
| Class D, 4.8308% 8/15/45 (d)(f) | | 4,500,000 | 3,771,287 |
| Class E, 4.8308% 8/15/45 (d)(f) | | 8,000,000 | 5,218,516 |
| Class F, 4.25% 8/15/45 (f) | | 2,000,000 | 955,359 |
| Credit Suisse Mortgage Trust floater: | | | |
| Series 2019-ICE4 Class F, 1 month U.S. LIBOR + 2.650% 2.8248% 5/15/36 (d)(e)(f) | | 9,767,000 | 9,436,179 |
| Series 2019-SKLZ Class D, 1 month U.S. LIBOR + 3.600% 3.7748% 1/15/34 (d)(e)(f) | | 7,788,000 | 7,233,505 |
| CSAIL Commercial Mortgage Trust: | | | |
| Series 2017-C8 Class D, 4.4701% 6/15/50 (f) | | 4,297,000 | 3,478,603 |
| Series 2017-CX10 Class UESD, 4.2366% 10/15/32 (d)(f) | | 7,129,000 | 6,520,327 |
| Series 2017-CX9 Class D, 4.1508% 9/15/50 (d)(f) | | 2,539,000 | 1,689,580 |
| DBCCRE Mortgage Trust Series 2014-ARCP Class E, 4.9345% 1/10/34 (d)(f) | | 10,732,000 | 9,899,201 |
| DBUBS Mortgage Trust: | | | |
| Series 2011-LC1A: | | | |
| Class E, 5.6866% 11/10/46 (d)(f) | | 13,874,000 | 13,460,230 |
| Class G, 4.652% 11/10/46 (f) | | 12,222,000 | 11,235,549 |
| Series 2011-LC3A Class D, 5.3349% 8/10/44 (d)(f)(h) | | 3,945,000 | 2,587,855 |
| Freddie Mac: | | | |
| pass-thru certificates: | | | |
| Series K011 Class X3, 2.5736% 12/25/43 (d)(g) | | 12,069,096 | 25,681 |
| Series K012 Class X3, 2.249% 1/25/41 (d)(g) | | 20,492,732 | 73,604 |
| Series K013 Class X3, 2.8137% 1/25/43 (d)(g) | | 14,199,000 | 71,552 |
| Series KAIV Class X2, 3.6147% 6/25/41 (d)(g) | | 7,430,000 | 154,040 |
| GPMT Ltd. floater Series 2018-FL1 Class D, 1 month U.S. LIBOR + 2.950% 3.1299% 11/21/35 (d)(e)(f) | | 2,500,000 | 2,287,500 |
| GS Mortgage Securities Corp. Trust floater Series 2019-SOHO Class F, 1 month U.S. LIBOR + 2.200% 2.3748% 6/15/36 (d)(e)(f) | | 2,000,000 | 1,660,198 |
| GS Mortgage Securities Trust: | | | |
| floater Series 2018-RIVR Class G, 1 month U.S. LIBOR + 2.600% 2.7748% 7/15/35 (d)(e)(f) | | 3,808,000 | 2,876,425 |
| Series 2010-C2 Class D, 5.1787% 12/10/43 (d)(f) | | 3,000,000 | 2,965,357 |
| Series 2011-GC5: | | | |
| Class C, 5.3885% 8/10/44 (d)(f) | | 8,899,000 | 8,020,850 |
| Class D, 5.3885% 8/10/44 (d)(f) | | 2,733,635 | 2,075,880 |
| Class E, 5.3885% 8/10/44 (d)(f) | | 8,138,000 | 5,532,195 |
| Class F, 4.5% 8/10/44 (f) | | 7,897,000 | 4,303,973 |
| Series 2012-GC6: | | | |
| Class C, 5.6508% 1/10/45 (d)(f) | | 3,560,000 | 2,973,368 |
| Class D, 5.6508% 1/10/45 (d)(f) | | 6,590,000 | 4,313,070 |
| Class E, 5% 1/10/45 (d)(f) | | 7,432,000 | 4,148,273 |
| Series 2012-GCJ7 Class D, 5.7041% 5/10/45 (d)(f) | | 10,078,000 | 8,638,936 |
| Series 2012-GCJ9: | | | |
| Class D, 4.7403% 11/10/45 (d)(f) | | 5,503,000 | 4,836,139 |
| Class E, 4.7403% 11/10/45 (d)(f) | | 1,908,000 | 1,369,589 |
| Series 2013-GC14 Class D, 4.7441% 8/10/46 (d)(f) | | 1,661,000 | 1,234,482 |
| Series 2013-GC16: | | | |
| Class D, 5.3107% 11/10/46 (d)(f) | | 3,708,000 | 3,223,353 |
| Class F, 3.5% 11/10/46 (f) | | 7,221,000 | 4,485,008 |
| Series 2016-REMZ Class MZB, 7.727% 2/10/21 (f) | | 29,492,000 | 28,541,378 |
| Series 2016-RENT Class F, 4.0667% 2/10/29 (d)(f) | | 19,971,000 | 19,269,029 |
| Hilton U.S.A. Trust: | | | |
| Series 2016-HHV Class F, 4.1935% 11/5/38 (d)(f) | | 8,440,000 | 7,270,140 |
| Series 2016-SFP Class F, 6.1552% 11/5/35 (f) | | 10,093,000 | 9,681,467 |
| IMT Trust Series 2017-APTS: | | | |
| Class EFX, 3.4966% 6/15/34 (d)(f) | | 9,213,000 | 8,104,355 |
| Class FFL, 1 month U.S. LIBOR + 2.850% 3.0248% 6/15/34 (d)(e)(f) | | 3,532,751 | 2,982,420 |
| Independence Plaza Trust Series 2018-INDP Class E, 4.996% 7/10/35 (f) | | 2,896,000 | 2,779,748 |
| Invitation Homes Trust floater: | | | |
| Series 2018-SFR3 Class F, 1 month U.S. LIBOR + 2.250% 2.5% 7/17/37 (d)(e)(f) | | 924,535 | 885,458 |
| Series 2018-SFR4 Class F, 1 month U.S. LIBOR + 2.200% 2.3809% 1/17/38 (d)(e)(f) | | 7,410,000 | 7,054,514 |
| JP Morgan Chase Commercial Mortgage Securities Trust floater Series 2018-LAQ: | | | |
| Class C, 1 month U.S. LIBOR + 1.600% 1.7748% 6/15/32 (d)(e)(f) | | 4,879,301 | 4,487,769 |
| Class E, 1 month U.S. LIBOR + 3.000% 3.35% 6/15/35 (d)(e)(f) | | 1,350,753 | 1,208,511 |
| JPMBB Commercial Mortgage Securities Trust: | | | |
| Series 2014-C23 Class UH5, 4.7094% 9/15/47 (f) | | 8,640,000 | 7,491,941 |
| Series 2014-C26 Class D, 3.8809% 1/15/48 (d)(f) | | 3,398,000 | 2,942,551 |
| JPMCC Commercial Mortgage Securities Trust Series 2016-JP4 Class D, 3.4224% 12/15/49 (d)(f) | | 10,126,000 | 7,109,685 |
| JPMDB Commercial Mortgage Securities Trust: | | | |
| Series 2016-C4 Class D, 3.0889% 12/15/49 (d)(f) | | 4,388,000 | 2,789,737 |
| Series 2018-C8 Class D, 3.2439% 6/15/51 (d)(f) | | 1,698,000 | 1,154,188 |
| JPMorgan Chase Commercial Mortgage Securities Corp. Series 2012-CBX: | | | |
| Class C, 5.1317% 6/15/45 (d) | | 4,479,000 | 4,083,226 |
| Class E, 5.1317% 6/15/45 (d)(f) | | 5,892,000 | 4,048,456 |
| Class F, 4% 6/15/45 (f) | | 8,192,000 | 4,182,713 |
| Class G 4% 6/15/45 (f) | | 4,044,000 | 1,442,216 |
| JPMorgan Chase Commercial Mortgage Securities Trust: | | | |
| Series 2011-C3: | | | |
| Class E, 5.6691% 2/15/46 (d)(f) | | 13,774,000 | 5,201,820 |
| Class G, 4.409% 2/15/46 (d)(f) | | 4,671,000 | 1,061,088 |
| Class H, 4.409% 2/15/46 (d)(f)(h) | | 7,077,000 | 707,700 |
| Series 2011-C4 Class F, 3.873% 7/15/46 (f) | | 1,400,000 | 1,284,524 |
| Series 2013-LC11: | | | |
| Class D, 4.1673% 4/15/46 (d) | | 7,722,000 | 5,024,237 |
| Class E, 3.25% 4/15/46 (d)(f) | | 472,000 | 270,769 |
| Class F, 3.25% 4/15/46 (d)(f) | | 2,518,000 | 1,101,575 |
| Series 2014-DSTY Class E, 3.8046% 6/10/27 (d)(f)(h) | | 8,161,000 | 164,744 |
| Series 2018-AON Class F, 4.6132% 7/5/31 (d)(f) | | 5,039,000 | 4,867,752 |
| Morgan Stanley BAML Trust: | | | |
| Series 2012-C6 Class D, 4.6067% 11/15/45 (d)(f) | | 2,000,000 | 1,710,933 |
| Series 2012-C6, Class F, 4.6067% 11/15/45 (d)(f) | | 2,500,000 | 1,299,127 |
| Series 2013-C12 Class D, 4.7632% 10/15/46 (d)(f) | | 7,164,000 | 5,594,060 |
| Series 2013-C13: | | | |
| Class D, 4.9037% 11/15/46 (d)(f) | | 6,218,000 | 4,832,169 |
| Class E, 4.9037% 11/15/46 (d)(f) | | 3,341,000 | 2,147,961 |
| Series 2013-C7: | | | |
| Class D, 4.2372% 2/15/46 (d)(f) | | 4,024,000 | 2,454,522 |
| Class E, 4.2372% 2/15/46 (d)(f)(h) | | 989,000 | 573,583 |
| Series 2013-C9: | | | |
| Class C, 4.0335% 5/15/46 (d) | | 3,302,000 | 3,250,569 |
| Class D, 4.1215% 5/15/46 (d)(f) | | 5,137,000 | 4,239,618 |
| Series 2016-C30 Class D, 3% 9/15/49 (f) | | 2,726,000 | 1,526,445 |
| Series 2016-C31 Class D, 3% 11/15/49 (d)(f) | | 1,483,000 | 844,858 |
| Morgan Stanley Capital I Trust: | | | |
| floater Series 2019-AGLN: | | | |
| Class F, 1 month U.S. LIBOR + 2.600% 2.7748% 3/15/34 (d)(e)(f) | | 3,955,000 | 3,128,543 |
| Class G, 1 month U.S. LIBOR + 3.150% 3.3248% 3/15/34 (d)(e)(f) | | 5,946,000 | 4,687,973 |
| Series 1998-CF1 Class G, 7.35% 7/15/32 (d)(f) | | 128,418 | 130,948 |
| Series 2011-C2: | | | |
| Class D, 5.4782% 6/15/44 (d)(f) | | 5,387,000 | 3,724,729 |
| Class E, 5.4782% 6/15/44 (d)(f) | | 2,470,000 | 1,494,164 |
| Class F, 5.4782% 6/15/44 (d)(f) | | 4,440,000 | 2,019,664 |
| Class XB, 0.3249% 6/15/44 (d)(f)(g) | | 55,708,619 | 450,014 |
| Series 2011-C3: | | | |
| Class D, 5.2444% 7/15/49 (d)(f) | | 7,317,000 | 6,070,411 |
| Class E, 5.2444% 7/15/49 (d)(f) | | 3,456,000 | 2,291,188 |
| Class F, 5.2444% 7/15/49 (d)(f) | | 5,624,050 | 2,741,443 |
| Class G, 5.2444% 7/15/49 (d)(f) | | 5,049,500 | 2,102,645 |
| Series 2012-C4 Class D, 5.4189% 3/15/45 (d)(f) | | 6,310,000 | 3,589,494 |
| Series 2015-MS1 Class D, 4.0312% 5/15/48 (d)(f) | | 10,833,000 | 8,497,377 |
| Series 2015-UBS8 Class D, 3.18% 12/15/48 (f) | | 4,957,000 | 3,355,824 |
| Series 2016-BNK2 Class C, 3% 11/15/49 (f) | | 2,966,000 | 2,099,069 |
| Motel 6 Trust floater: | | | |
| Series 2017-M6MZ, Class M, 1 month U.S. LIBOR + 6.920% 7.1013% 8/15/24 (d)(e)(f) | | 5,099,673 | 3,965,998 |
| Series 2017-MTL6 Class C, 1 month U.S. LIBOR + 1.400% 1.5748% 8/15/34 (d)(e)(f) | | 8,477,059 | 8,116,749 |
| Series 2017-MTL6, Class F, 1 month U.S. LIBOR + 4.250% 4.4248% 8/15/34 (d)(e)(f) | | 10,881,193 | 9,789,488 |
| MRCD Series 2019-PARK Class G, 2.7175% 12/15/36 (f) | | 2,000,000 | 1,717,884 |
| MSCCG Trust: | | | |
| floater Series 2018-SELF Class E, 1 month U.S. LIBOR + 2.150% 2.3248% 10/15/37 (d)(e)(f) | | 5,061,000 | 4,774,785 |
| Series 2016-SNR: | | | |
| Class D, 6.55% 11/15/34 (f) | | 7,362,929 | 7,234,032 |
| Class E, 6.8087% 11/15/34 (f) | | 9,551,450 | 8,731,984 |
| MSJP Commercial Securities Mortgage Trust Series 2015-HAUL Class E, 4.851% 9/5/47 (d)(f) | | 1,500,000 | 1,185,380 |
| Natixis Commercial Mortgage Securities Trust: | | | |
| floater Series 2018-FL1: | | | |
| Class WAN1, 1 month U.S. LIBOR + 2.750% 2.935% 6/15/35 (d)(e)(f) | | 1,743,000 | 1,570,599 |
| Class WAN2, 1 month U.S. LIBOR + 3.750% 3.935% 6/15/35 (d)(e)(f) | | 651,000 | 584,457 |
| Series 2019-1776: | | | |
| Class E, 3.9017% 10/15/36 (f) | | 4,000,000 | 3,846,300 |
| Class F, 4.2988% 10/15/36 (f) | | 3,454,000 | 3,194,423 |
| Series 2020-2PAC Class AMZ3, 3.5% 1/15/37 (d)(f) | | 2,502,675 | 2,060,107 |
| Progress Residential Trust Series 2019-SFR3 Class F, 3.867% 9/17/36 (f) | | 1,000,000 | 980,787 |
| Providence Place Group Ltd. Partnership Series 2000-C1 Class A2, 7.75% 7/20/28 (f) | | 3,674,950 | 4,320,819 |
| ReadyCap Commercial Mortgage Trust floater Series 2019-FL3 Class D, 1 month U.S. LIBOR + 2.900% 3.0716% 3/25/34 (d)(e)(f) | | 3,401,000 | 2,918,320 |
| SG Commercial Mortgage Securities Trust Series 2020-COVE Class F, 3.8518% 3/15/37 (d)(f) | | 5,000,000 | 4,294,612 |
| UBS Commercial Mortgage Trust Series 2012-C1: | | | |
| Class D, 5.569% 5/10/45 (d)(f) | | 2,296,000 | 1,662,937 |
| Class E, 5% 5/10/45 (d)(f) | | 6,268,000 | 3,461,074 |
| Class F, 5% 5/10/45 (d)(f)(h) | | 2,221,350 | 449,416 |
| UBS-BAMLL Trust Series 12-WRM Class D, 4.238% 6/10/30 (d)(f)(h) | | 2,143,000 | 1,025,421 |
| UBS-Citigroup Commercial Mortgage Trust Series 2011-C1: | | | |
| Class B, 6.0503% 1/10/45 (d)(f) | | 2,966,000 | 3,034,518 |
| Class C, 6.0503% 1/10/45 (d)(f) | | 4,746,000 | 4,450,012 |
| Wells Fargo Commercial Mortgage Trust: | | | |
| floater Series 2020-SOP Class E, 1 month U.S. LIBOR + 2.710% 2.8848% 1/15/35 (d)(e)(f) | | 3,250,000 | 2,810,998 |
| Series 2012-LC5: | | | |
| Class D, 4.7591% 10/15/45 (d)(f) | | 12,819,000 | 12,605,523 |
| Class E, 4.7591% 10/15/45 (d)(f) | | 8,347,000 | 6,853,649 |
| Class F, 4.7591% 10/15/45 (d)(f) | | 2,000,000 | 1,302,052 |
| Series 2016-BNK1 Class D, 3% 8/15/49 (f) | | 6,979,000 | 3,792,420 |
| Series 2016-C35 Class D, 3.142% 7/15/48 (f) | | 13,073,000 | 8,803,438 |
| Series 2016-NXS6 Class D, 3.059% 11/15/49 (f) | | 5,037,000 | 3,381,200 |
| WF-RBS Commercial Mortgage Trust: | | | |
| sequential payer Series 2011-C4I Class G, 5% 6/15/44 (h) | | 3,955,000 | 652,575 |
| Series 2011-C3: | | | |
| Class C, 5.335% 3/15/44 (f) | | 4,845,000 | 4,706,046 |
| Class D, 5.6804% 3/15/44 (d)(f) | | 2,000,000 | 931,760 |
| Class E, 5% 3/15/44 (f) | | 2,966,000 | 792,456 |
| Series 2011-C5: | | | |
| Class E, 5.6559% 11/15/44 (d)(f) | | 5,097,000 | 4,088,561 |
| Class F, 5.25% 11/15/44 (d)(f) | | 3,500,000 | 2,359,042 |
| Class G, 5.25% 11/15/44 (d)(f) | | 2,000,000 | 1,267,806 |
| Series 2012-C7: | | | |
| Class D, 4.8113% 6/15/45 (d)(f) | | 2,380,000 | 1,314,016 |
| Class F, 4.5% 6/15/45 (f) | | 2,000,000 | 400,000 |
| Series 2012-C8 Class E, 4.8839% 8/15/45 (d)(f) | | 2,889,500 | 2,438,886 |
| Series 2013-C11: | | | |
| Class D, 4.2565% 3/15/45 (d)(f) | | 5,765,000 | 4,957,922 |
| Class E, 4.2565% 3/15/45 (d)(f) | | 4,727,000 | 3,406,963 |
| Series 2013-C13 Class D, 4.14% 5/15/45 (d)(f) | | 3,955,000 | 3,553,594 |
| Series 2013-C16 Class D, 5.0208% 9/15/46 (d)(f) | | 3,686,000 | 2,170,986 |
| Series 2013-UBS1 Class D, 4.7365% 3/15/46 (d)(f) | | 4,538,000 | 3,952,833 |
| WP Glimcher Mall Trust Series 2015-WPG: | | | |
| Class PR1, 3.516% 6/5/35 (d)(f) | | 6,725,000 | 5,137,558 |
| Class PR2, 3.516% 6/5/35 (d)(f) | | 2,541,000 | 1,898,733 |
| TOTAL COMMERCIAL MORTGAGE SECURITIES | | | |
| (Cost $824,540,775) | | | 696,641,754 |
|
| Bank Loan Obligations - 4.3% | | | |
| CONSUMER DISCRETIONARY - 0.8% | | | |
| Diversified Consumer Services - 0.1% | | | |
| Airbnb, Inc. Tranche B 1LN, term loan 3 month U.S. LIBOR + 7.500% 8.5% 4/17/25 (d)(e)(i) | | 2,640,000 | 2,765,400 |
| Hotels, Restaurants & Leisure - 0.7% | | | |
| Caesars Resort Collection LLC Tranche B 1LN, term loan 3 month U.S. LIBOR + 2.750% 2.9111% 12/22/24 (d)(e)(i) | | 7,937,374 | 7,290,478 |
| LTF Merger Sub, Inc. Tranche B, term loan 3 month U.S. LIBOR + 2.750% 3.75% 6/10/22 (d)(e)(i) | | 6,150,981 | 5,533,853 |
| Marriott Ownership Resorts, Inc. Tranche B 1LN, term loan 3 month U.S. LIBOR + 1.750% 1.9111% 8/31/25 (d)(e)(i) | | 4,004,465 | 3,815,494 |
| Playa Resorts Holding BV Tranche B, term loan 3 month U.S. LIBOR + 2.750% 3.75% 4/27/24 (d)(e)(i) | | 25,686,805 | 21,883,616 |
| | | | 38,523,441 |
|
| TOTAL CONSUMER DISCRETIONARY | | | 41,288,841 |
|
| ENERGY - 0.4% | | | |
| Energy Equipment & Services - 0.1% | | | |
| Kestrel Acquisition LLC Tranche B, term loan 3 month U.S. LIBOR + 4.250% 5.25% 6/1/25 (d)(e)(i) | | 5,883,684 | 5,162,933 |
| Oil, Gas & Consumable Fuels - 0.3% | | | |
| Hamilton Projs. Acquiror LLC Tranche B 1LN, term loan 3 month U.S. LIBOR + 4.750% 5.75% 6/17/27 (d)(e)(i) | | 18,640,000 | 18,529,278 |
|
| TOTAL ENERGY | | | 23,692,211 |
|
| FINANCIALS - 0.6% | | | |
| Capital Markets - 0.1% | | | |
| Blackstone CQP Holdco LP Tranche B, term loan 3 month U.S. LIBOR + 3.500% 3.8064% 9/30/24 (d)(e)(i) | | 5,091,094 | 4,943,656 |
| Diversified Financial Services - 0.4% | | | |
| Agellan Portfolio 9% 8/7/25 (d)(h)(i) | | 6,611,000 | 6,611,000 |
| Veritas-B Junior Mezz C LLC 10.48% 2/6/21 (d)(h)(i) | | 12,171,000 | 11,962,876 |
| | | | 18,573,876 |
| Thrifts & Mortgage Finance - 0.1% | | | |
| Ocwen Loan Servicing LLC Tranche B, term loan 3 month U.S. LIBOR + 6.000% 7% 5/15/22 (d)(e)(i) | | 6,495,372 | 6,311,359 |
|
| TOTAL FINANCIALS | | | 29,828,891 |
|
| INDUSTRIALS - 0.2% | | | |
| Commercial Services & Supplies - 0.2% | | | |
| Lineage Logistics Holdings, LLC. Tranche B, term loan 3 month U.S. LIBOR + 3.000% 4% 2/27/25 (d)(e)(i) | | 13,262,451 | 13,013,780 |
| INFORMATION TECHNOLOGY - 0.2% | | | |
| Electronic Equipment & Components - 0.2% | | | |
| Compass Power Generation LLC Tranche B 1LN, term loan 3 month U.S. LIBOR + 3.500% 4.5% 12/20/24 (d)(e)(i) | | 8,633,371 | 8,279,403 |
| REAL ESTATE - 1.4% | | | |
| Equity Real Estate Investment Trusts (REITs) - 0.6% | | | |
| CoreCivic, Inc. Tranche B 1LN, term loan 3 month U.S. LIBOR + 4.500% 5.5% 12/18/24 (d)(e)(i) | | 2,288,967 | 2,243,187 |
| Invitation Homes Operating Par Tranche B, term loan 3 month U.S. LIBOR + 1.700% 1.8663% 2/6/22 (d)(e)(i) | | 14,975,000 | 14,450,875 |
| iStar Financial, Inc. Tranche B 1LN, term loan 3 month U.S. LIBOR + 2.750% 2.9198% 6/28/23 (d)(e)(i) | | 13,038,214 | 12,679,663 |
| | | | 29,373,725 |
| Real Estate Management & Development - 0.8% | | | |
| Aragon Junior Mezzanine 1 month U.S. LIBOR + 6.000% 7.25% 1/15/25 (d)(e)(h)(i) | | 9,500,000 | 9,452,500 |
| DTZ U.S. Borrower LLC Tranche B 1LN, term loan 3 month U.S. LIBOR + 2.750% 2.9111% 8/21/25 (d)(e)(i) | | 13,400,194 | 12,780,435 |
| Lightstone Holdco LLC: | | | |
| Tranche B 1LN, term loan 3 month U.S. LIBOR + 3.750% 4.75% 1/30/24 (d)(e)(i) | | 16,797,750 | 14,215,096 |
| Tranche C 1LN, term loan 3 month U.S. LIBOR + 3.750% 4.75% 1/30/24 (d)(e)(i) | | 947,420 | 801,754 |
| Realogy Group LLC Tranche B, term loan 3 month U.S. LIBOR + 2.250% 3% 2/8/25 (d)(e)(i) | | 3,919,598 | 3,704,020 |
| VICI Properties, LLC Tranche B 1LN, term loan 3 month U.S. LIBOR + 1.750% 1.9256% 12/22/24 (d)(e)(i) | | 3,235,000 | 3,104,856 |
| | | | 44,058,661 |
|
| TOTAL REAL ESTATE | | | 73,432,386 |
|
| UTILITIES - 0.7% | | | |
| Electric Utilities - 0.6% | | | |
| Granite Generation LLC 1LN, term loan 3 month U.S. LIBOR + 3.750% 4.75% 11/1/26 (d)(e)(i) | | 5,822,454 | 5,731,507 |
| Green Energy Partners/Stonewall LLC: | | | |
| Tranche B 1LN, term loan 3 month U.S. LIBOR + 5.500% 6.5% 11/13/21 (d)(e)(i) | | 10,875,213 | 9,484,708 |
| Tranche B 2LN, term loan 3 month U.S. LIBOR + 5.500% 6.5% 11/13/21 (d)(e)(i) | | 1,920,380 | 1,674,840 |
| Lonestar II Generation Holding: | | | |
| Tranche B 1LN, term loan 3 month U.S. LIBOR + 5.000% 5.1611% 4/10/26 (d)(e)(i) | | 10,506,621 | 10,265,809 |
| Tranche C 1LN, term loan 3 month U.S. LIBOR + 5.000% 5.1611% 4/10/26 (d)(e)(i) | | 1,273,530 | 1,244,340 |
| Southeast Powergen LLC Tranche B, term loan 3 month U.S. LIBOR + 3.500% 4.5% 12/2/21 (d)(e)(i) | | 1,288,564 | 1,172,593 |
| | | | 29,573,797 |
| Independent Power and Renewable Electricity Producers - 0.1% | | | |
| Oregon Clean Energy LLC Tranche B 1LN, term loan 3 month U.S. LIBOR + 3.750% 4.75% 3/1/26 (d)(e)(i) | | 5,748,253 | 5,642,888 |
|
| TOTAL UTILITIES | | | 35,216,685 |
|
| TOTAL BANK LOAN OBLIGATIONS | | | |
| (Cost $237,097,227) | | | 224,752,197 |
|
| Preferred Securities - 0.1% | | | |
| ENERGY - 0.1% | | | |
| Oil, Gas & Consumable Fuels - 0.1% | | | |
| Energy Transfer Partners LP 7.125% (d) | | 6,000,000 | 5,078,122 |
| FINANCIALS - 0.0% | | | |
| Diversified Financial Services - 0.0% | | | |
| Crest Dartmouth Street 2003-1 Ltd. Series 2003-1A Class PS, 6/28/38 (f)(h) | | 1,220,000 | 122 |
| Thrifts & Mortgage Finance - 0.0% | | | |
| Crest Clarendon Street 2002-1 Ltd. Series 2002-1A Class PS, 12/28/35 (f)(h) | | 500,000 | 10,000 |
|
| TOTAL FINANCIALS | | | 10,122 |
|
| TOTAL PREFERRED SECURITIES | | | |
| (Cost $7,297,768) | | | 5,088,244 |
| | | Shares | Value |
|
| Money Market Funds - 8.7% | | | |
| Fidelity Cash Central Fund 0.14% (j) | | 449,955,194 | 450,090,181 |
| Fidelity Securities Lending Cash Central Fund 0.13% (j)(k) | | 13,012,002 | 13,013,303 |
| TOTAL MONEY MARKET FUNDS | | | |
| (Cost $463,021,524) | | | 463,103,484 |
| TOTAL INVESTMENT IN SECURITIES - 99.7% | | | |
| (Cost $5,565,593,675) | | | 5,289,801,178 |
| NET OTHER ASSETS (LIABILITIES) - 0.3% | | | 15,403,438 |
| NET ASSETS - 100% | | | $5,305,204,616 |
Legend
(a) Security or a portion of the security is on loan at period end.
(b) Affiliated company
(c) Non-income producing
(d) Coupon rates for floating and adjustable rate securities reflect the rates in effect at period end.
(e) Coupon is indexed to a floating interest rate which may be multiplied by a specified factor and/or subject to caps or floors.
(f) Security exempt from registration under Rule 144A of the Securities Act of 1933. These securities may be resold in transactions exempt from registration, normally to qualified institutional buyers. At the end of the period, the value of these securities amounted to $1,202,661,899 or 22.7% of net assets.
(g) Security represents right to receive monthly interest payments on an underlying pool of mortgages or assets. Principal shown is the outstanding par amount of the pool as of the end of the period.
(h) Level 3 security
(i) Remaining maturities of bank loan obligations may be less than the stated maturities shown as a result of contractual or optional prepayments by the borrower. Such prepayments cannot be predicted with certainty.
(j) Affiliated fund that is generally available only to investment companies and other accounts managed by Fidelity Investments. The rate quoted is the annualized seven-day yield of the fund at period end. A complete unaudited listing of the fund's holdings as of its most recent quarter end is available upon request. In addition, each Fidelity Central Fund's financial statements, which are not covered by the Fund's Report of Independent Registered Public Accounting Firm, are available on the SEC's website or upon request.
(k) Investment made with cash collateral received from securities on loan.
Affiliated Central Funds
Information regarding fiscal year to date income earned by the Fund from investments in Fidelity Central Funds is as follows:
| Fund | Income earned |
| Fidelity Cash Central Fund | $5,586,376 |
| Fidelity Securities Lending Cash Central Fund | 114,202 |
| Total | $5,700,578 |
Amounts in the income column in the above table include any capital gain distributions from underlying funds, which are presented in the corresponding line-item in the Statement of Operations, if applicable. Amount for Fidelity Securities Lending Cash Central Fund represents the income earned on investing cash collateral, less rebates paid to borrowers and any lending agent fees associated with the loan, plus any premium payments received for lending certain types of securities.
Other Affiliated Issuers
An affiliated company is a company in which the Fund has ownership of at least 5% of the voting securities. Fiscal year to date transactions with companies which are or were affiliates are as follows:
| Affiliate | Value, beginning of period | Purchases | Sales Proceeds(a) | Dividend Income | Realized Gain (loss) | Change in Unrealized appreciation (depreciation) | Value, end of period |
| Dynex Capital, Inc. | $32,908,461 | $1,751,423 | $703,534 | $673,645 | $(401,242) | $1,543,624 | $32,016,448 |
| Dynex Capital, Inc. Series A, 8.50% | 9,278,320 | -- | 9,076,650 | 508,448 | 3,350 | (205,020) | -- |
| Dynex Capital, Inc. Series B, 7.625% | 6,300,479 | -- | 2,444,749 | 416,112 | 1,330 | (115,495) | 3,741,565 |
| Dynex Capital, Inc. Series C 6.90% | -- | 9,072,551 | -- | 246,746 | -- | (579,939) | 8,492,612 |
| Ellington Financial LLC | 29,822,348 | 1,009,514 | 1,505,193 | 2,218,058 | (2,541,569) | (8,167,507) | -- |
| Great Ajax Corp. | 21,946,669 | 1,512,804 | 561,415 | 1,089,255 | (464,804) | (7,730,255) | 14,338,198 |
| Great Ajax Corp. 7.25% | 9,285,423 | 5,967,842 | 109,609 | 748,041 | 9,615 | (417,518) | 14,735,752 |
| Nexpoint Real Estate Finance, Inc. | -- | 9,975,000 | 1,580,020 | 323,275 | (420,680) | (1,301,070) | 6,673,230 |
| Trinity Merger Corp. Class A | -- | 180,949 | 181,477 | -- | 528 | -- | -- |
| Total | $109,541,700 | $29,470,083 | $16,162,647 | $6,223,580 | $(3,813,472) | $(16,973,180) | $79,997,805 |
(a) Includes the value of securities delivered through in-kind transactions, if applicable.
Investment Valuation
The following is a summary of the inputs used, as of July 31, 2020, involving the Fund's assets and liabilities carried at fair value. The inputs or methodology used for valuing securities may not be an indication of the risk associated with investing in those securities. For more information on valuation inputs, and their aggregation into the levels used below, please refer to the Investment Valuation section in the accompanying Notes to Financial Statements.
| | Valuation Inputs at Reporting Date: |
| Description | Total | Level 1 | Level 2 | Level 3 |
| Investments in Securities: | | | | |
| Equities: | | | | |
| Energy | $32,366,882 | $32,366,882 | $-- | $-- |
| Financials | 1,047,444,150 | 1,023,414,972 | 24,029,178 | -- |
| Industrials | 18,228,624 | 18,228,624 | -- | -- |
| Real Estate | 1,634,617,276 | 1,598,135,201 | 36,482,075 | -- |
| Utilities | 3,167,993 | 3,167,993 | -- | -- |
| Corporate Bonds | 1,056,548,401 | -- | 1,056,548,401 | -- |
| Asset-Backed Securities | 107,795,803 | -- | 107,795,171 | 632 |
| Collateralized Mortgage Obligations | 46,370 | -- | 46,370 | -- |
| Commercial Mortgage Securities | 696,641,754 | -- | 688,160,982 | 8,480,772 |
| Bank Loan Obligations | 224,752,197 | -- | 196,725,821 | 28,026,376 |
| Preferred Securities | 5,088,244 | -- | 5,078,122 | 10,122 |
| Money Market Funds | 463,103,484 | 463,103,484 | -- | -- |
| Total Investments in Securities: | $5,289,801,178 | $3,138,417,156 | $2,114,866,120 | $36,517,902 |
Other Information
The composition of credit quality ratings as a percentage of Total Net Assets is as follows (Unaudited):
| AAA,AA,A | 1.1% |
| BBB | 3.8% |
| BB | 9.4% |
| B | 9.9% |
| CCC,CC,C | 2.5% |
| Not Rated | 12.7% |
| Equities | 51.6% |
| Short-Term Investments and Net Other Assets | 9.0% |
| | 100.0% |
We have used ratings from Moody's Investors Service, Inc. Where Moody's® ratings are not available, we have used S&P® ratings. All ratings are as of the date indicated and do not reflect subsequent changes.
See accompanying notes which are an integral part of the financial statements.
Financial Statements
Statement of Assets and Liabilities
| | | July 31, 2020 |
| Assets | | |
Investment in securities, at value (including securities loaned of $12,639,001) — See accompanying schedule:
Unaffiliated issuers (cost $5,011,585,408) | $4,746,699,889 | |
| Fidelity Central Funds (cost $463,021,524) | 463,103,484 | |
| Other affiliated issuers (cost $90,986,743) | 79,997,805 | |
| Total Investment in Securities (cost $5,565,593,675) | | $5,289,801,178 |
| Cash | | 8,215 |
| Receivable for investments sold | | 11,518,825 |
| Receivable for fund shares sold | | 6,243,395 |
| Dividends receivable | | 3,770,232 |
| Interest receivable | | 23,861,261 |
| Distributions receivable from Fidelity Central Funds | | 52,143 |
| Prepaid expenses | | 968 |
| Other receivables | | 35,666 |
| Total assets | | 5,335,291,883 |
| Liabilities | | |
| Payable for investments purchased | $2,502,834 | |
| Payable for fund shares redeemed | 11,272,997 | |
| Accrued management fee | 2,265,476 | |
| Distribution and service plan fees payable | 205,859 | |
| Other affiliated payables | 760,015 | |
| Other payables and accrued expenses | 68,715 | |
| Collateral on securities loaned | 13,011,371 | |
| Total liabilities | | 30,087,267 |
| Net Assets | | $5,305,204,616 |
| Net Assets consist of: | | |
| Paid in capital | | $5,602,933,881 |
| Total accumulated earnings (loss) | | (297,729,265) |
| Net Assets | | $5,305,204,616 |
| Net Asset Value and Maximum Offering Price | | |
| Class A: | | |
| Net Asset Value and redemption price per share ($324,031,127 ÷ 29,403,136 shares)(a) | | $11.02 |
| Maximum offering price per share (100/96.00 of $11.02) | | $11.48 |
| Class M: | | |
| Net Asset Value and redemption price per share ($49,386,738 ÷ 4,480,268 shares)(a) | | $11.02 |
| Maximum offering price per share (100/96.00 of $11.02) | | $11.48 |
| Class C: | | |
| Net Asset Value and offering price per share ($150,653,132 ÷ 13,851,793 shares)(a) | | $10.88 |
| Real Estate Income: | | |
| Net Asset Value, offering price and redemption price per share ($2,205,319,089 ÷ 198,924,880 shares) | | $11.09 |
| Class I: | | |
| Net Asset Value, offering price and redemption price per share ($1,782,594,167 ÷ 161,417,716 shares) | | $11.04 |
| Class Z: | | |
| Net Asset Value, offering price and redemption price per share ($793,220,363 ÷ 71,836,427 shares) | | $11.04 |
(a) Redemption price per share is equal to net asset value less any applicable contingent deferred sales charge.
See accompanying notes which are an integral part of the financial statements.
Statement of Operations
| | | Year ended July 31, 2020 |
| Investment Income | | |
| Dividends (including $6,223,580 earned from other affiliated issuers) | | $124,257,942 |
| Interest | | 151,489,927 |
| Income from Fidelity Central Funds (including $114,202 from security lending) | | 5,700,578 |
| Total income | | 281,448,447 |
| Expenses | | |
| Management fee | $30,991,637 | |
| Transfer agent fees | 8,799,556 | |
| Distribution and service plan fees | 2,947,895 | |
| Accounting fees | 1,399,842 | |
| Custodian fees and expenses | 63,613 | |
| Independent trustees' fees and expenses | 37,289 | |
| Registration fees | 316,508 | |
| Audit | 103,164 | |
| Legal | 13,535 | |
| Miscellaneous | 277,978 | |
| Total expenses before reductions | 44,951,017 | |
| Expense reductions | (185,001) | |
| Total expenses after reductions | | 44,766,016 |
| Net investment income (loss) | | 236,682,431 |
| Realized and Unrealized Gain (Loss) | | |
| Net realized gain (loss) on: | | |
| Investment securities: | | |
| Unaffiliated issuers | (38,704,228) | |
| Redemptions in-kind with affiliated entities | 12,315,468 | |
| Fidelity Central Funds | 39,788 | |
| Other affiliated issuers | (3,813,472) | |
| Foreign currency transactions | 31,041 | |
| Total net realized gain (loss) | | (30,131,403) |
| Change in net unrealized appreciation (depreciation) on: | | |
| Investment securities: | | |
| Unaffiliated issuers | (751,930,453) | |
| Fidelity Central Funds | 25,242 | |
| Other affiliated issuers | (16,973,180) | |
| Assets and liabilities in foreign currencies | 101 | |
| Total change in net unrealized appreciation (depreciation) | | (768,878,290) |
| Net gain (loss) | | (799,009,693) |
| Net increase (decrease) in net assets resulting from operations | | $(562,327,262) |
See accompanying notes which are an integral part of the financial statements.
Statement of Changes in Net Assets
| | Year ended July 31, 2020 | Year ended July 31, 2019 |
| Increase (Decrease) in Net Assets | | |
| Operations | | |
| Net investment income (loss) | $236,682,431 | $251,654,617 |
| Net realized gain (loss) | (30,131,403) | 75,252,607 |
| Change in net unrealized appreciation (depreciation) | (768,878,290) | 239,246,951 |
| Net increase (decrease) in net assets resulting from operations | (562,327,262) | 566,154,175 |
| Distributions to shareholders | (314,618,976) | (340,039,890) |
| Share transactions - net increase (decrease) | 40,706,105 | 661,318,743 |
| Total increase (decrease) in net assets | (836,240,133) | 887,433,028 |
| Net Assets | | |
| Beginning of period | 6,141,444,749 | 5,254,011,721 |
| End of period | $5,305,204,616 | $6,141,444,749 |
See accompanying notes which are an integral part of the financial statements.
Financial Highlights
Fidelity Real Estate Income Fund Class A
| Years ended July 31, | 2020 | 2019 | 2018 | 2017 | 2016 |
| Selected Per–Share Data | | | | | |
| Net asset value, beginning of period | $12.43 | $11.99 | $12.32 | $12.25 | $11.66 |
| Income from Investment Operations | | | | | |
| Net investment income (loss)A | .45 | .51 | .47 | .49 | .49 |
| Net realized and unrealized gain (loss) | (1.25) | .65 | (.22) | .14 | .73 |
| Total from investment operations | (.80) | 1.16 | .25 | .63 | 1.22 |
| Distributions from net investment income | (.44) | (.51) | (.45) | (.48) | (.48) |
| Distributions from net realized gain | (.16) | (.21) | (.13) | (.08) | (.14) |
| Total distributions | (.61)B | (.72) | (.58) | (.56) | (.63)C |
| Redemption fees added to paid in capitalA | – | – | –D | –D | –D |
| Net asset value, end of period | $11.02 | $12.43 | $11.99 | $12.32 | $12.25 |
| Total ReturnE,F | (6.88)% | 10.15% | 2.13% | 5.37% | 11.01% |
| Ratios to Average Net AssetsG,H | | | | | |
| Expenses before reductions | 1.01% | 1.01% | 1.02% | 1.03% | 1.03% |
| Expenses net of fee waivers, if any | 1.01% | 1.01% | 1.02% | 1.03% | 1.03% |
| Expenses net of all reductions | 1.00% | 1.01% | 1.01% | 1.02% | 1.03% |
| Net investment income (loss) | 3.85% | 4.29% | 3.98% | 4.08% | 4.29% |
| Supplemental Data | | | | | |
| Net assets, end of period (000 omitted) | $324,031 | $325,296 | $297,722 | $355,400 | $548,649 |
| Portfolio turnover rateI | 32%J | 17% | 27% | 22% | 26% |
A Calculated based on average shares outstanding during the period.
B Total distributions of $.61 per share is comprised of distributions from net investment income of $.442 and distributions from net realized gain of $.163 per share.
C Total distributions of $.63 per share is comprised of distributions from net investment income of $.483 and distributions from net realized gain of $.142 per share.
D Amount represents less than $.005 per share.
E Total returns would have been lower if certain expenses had not been reduced during the applicable periods shown.
F Total returns do not include the effect of the sales charges.
G Fees and expenses of any underlying mutual funds or exchange-traded funds (ETFs) are not included in the Fund's expense ratio. The Fund indirectly bears its proportionate share of these expenses. For additional expense information related to investments in Fidelity Central Funds, please refer to the "Investments in Fidelity Central Funds" note found in the Notes to Financial Statements section of the most recent Annual or Semi-Annual report.
H Expense ratios reflect operating expenses of the class. Expenses before reductions do not reflect amounts reimbursed by the investment adviser or reductions from brokerage service arrangements or reductions from other expense offset arrangements and do not represent the amount paid by the class during periods when reimbursements or reductions occur. Expenses net of fee waivers reflect expenses after reimbursement by the investment adviser but prior to reductions from brokerage service arrangements or other expense offset arrangements. Expenses net of all reductions represent the net expenses paid by the class.
I Amount does not include the portfolio activity of any underlying Fidelity Central Funds.
J Portfolio turnover rate excludes securities received or delivered in-kind.
See accompanying notes which are an integral part of the financial statements.
Fidelity Real Estate Income Fund Class M
| Years ended July 31, | 2020 | 2019 | 2018 | 2017 | 2016 |
| Selected Per–Share Data | | | | | |
| Net asset value, beginning of period | $12.43 | $11.99 | $12.32 | $12.26 | $11.66 |
| Income from Investment Operations | | | | | |
| Net investment income (loss)A | .45 | .51 | .47 | .49 | .49 |
| Net realized and unrealized gain (loss) | (1.26) | .65 | (.22) | .13 | .73 |
| Total from investment operations | (.81) | 1.16 | .25 | .62 | 1.22 |
| Distributions from net investment income | (.44) | (.51) | (.45) | (.48) | (.48) |
| Distributions from net realized gain | (.16) | (.21) | (.13) | (.08) | (.14) |
| Total distributions | (.60) | (.72) | (.58) | (.56) | (.62) |
| Redemption fees added to paid in capitalA | – | – | –B | –B | –B |
| Net asset value, end of period | $11.02 | $12.43 | $11.99 | $12.32 | $12.26 |
| Total ReturnC,D | (6.89)% | 10.12% | 2.10% | 5.26% | 11.06% |
| Ratios to Average Net AssetsE,F | | | | | |
| Expenses before reductions | 1.03% | 1.04% | 1.04% | 1.06% | 1.07% |
| Expenses net of fee waivers, if any | 1.03% | 1.04% | 1.04% | 1.06% | 1.07% |
| Expenses net of all reductions | 1.03% | 1.04% | 1.04% | 1.05% | 1.06% |
| Net investment income (loss) | 3.82% | 4.26% | 3.95% | 4.05% | 4.26% |
| Supplemental Data | | | | | |
| Net assets, end of period (000 omitted) | $49,387 | $60,540 | $55,175 | $64,158 | $59,788 |
| Portfolio turnover rateG | 32%H | 17% | 27% | 22% | 26% |
A Calculated based on average shares outstanding during the period.
B Amount represents less than $.005 per share.
C Total returns would have been lower if certain expenses had not been reduced during the applicable periods shown.
D Total returns do not include the effect of the sales charges.
E Fees and expenses of any underlying mutual funds or exchange-traded funds (ETFs) are not included in the Fund's expense ratio. The Fund indirectly bears its proportionate share of these expenses. For additional expense information related to investments in Fidelity Central Funds, please refer to the "Investments in Fidelity Central Funds" note found in the Notes to Financial Statements section of the most recent Annual or Semi-Annual report.
F Expense ratios reflect operating expenses of the class. Expenses before reductions do not reflect amounts reimbursed by the investment adviser or reductions from brokerage service arrangements or reductions from other expense offset arrangements and do not represent the amount paid by the class during periods when reimbursements or reductions occur. Expenses net of fee waivers reflect expenses after reimbursement by the investment adviser but prior to reductions from brokerage service arrangements or other expense offset arrangements. Expenses net of all reductions represent the net expenses paid by the class.
G Amount does not include the portfolio activity of any underlying Fidelity Central Funds.
H Portfolio turnover rate excludes securities received or delivered in-kind.
See accompanying notes which are an integral part of the financial statements.
Fidelity Real Estate Income Fund Class C
| Years ended July 31, | 2020 | 2019 | 2018 | 2017 | 2016 |
| Selected Per–Share Data | | | | | |
| Net asset value, beginning of period | $12.28 | $11.85 | $12.20 | $12.14 | $11.55 |
| Income from Investment Operations | | | | | |
| Net investment income (loss)A | .36 | .42 | .38 | .40 | .40 |
| Net realized and unrealized gain (loss) | (1.23) | .64 | (.22) | .13 | .73 |
| Total from investment operations | (.87) | 1.06 | .16 | .53 | 1.13 |
| Distributions from net investment income | (.36) | (.42) | (.37) | (.39) | (.40) |
| Distributions from net realized gain | (.16) | (.21) | (.13) | (.08) | (.14) |
| Total distributions | (.53)B | (.63) | (.51)C | (.47) | (.54) |
| Redemption fees added to paid in capitalA | – | – | –D | –D | –D |
| Net asset value, end of period | $10.88 | $12.28 | $11.85 | $12.20 | $12.14 |
| Total ReturnE,F | (7.50)% | 9.34% | 1.31% | 4.54% | 10.29% |
| Ratios to Average Net AssetsG,H | | | | | |
| Expenses before reductions | 1.76% | 1.76% | 1.76% | 1.78% | 1.79% |
| Expenses net of fee waivers, if any | 1.76% | 1.76% | 1.76% | 1.78% | 1.78% |
| Expenses net of all reductions | 1.76% | 1.76% | 1.76% | 1.78% | 1.78% |
| Net investment income (loss) | 3.09% | 3.54% | 3.23% | 3.32% | 3.54% |
| Supplemental Data | | | | | |
| Net assets, end of period (000 omitted) | $150,653 | $210,156 | $227,458 | $287,598 | $289,430 |
| Portfolio turnover rateI | 32%J | 17% | 27% | 22% | 26% |
A Calculated based on average shares outstanding during the period.
B Total distributions of $.53 per share is comprised of distributions from net investment income of $.363 and distributions from net realized gain of $.163 per share.
C Total distributions of $.51 per share is comprised of distributions from net investment income of $.373 and distributions from net realized gain of $.132 per share.
D Amount represents less than $.005 per share.
E Total returns would have been lower if certain expenses had not been reduced during the applicable periods shown.
F Total returns do not include the effect of the contingent deferred sales charge.
G Fees and expenses of any underlying mutual funds or exchange-traded funds (ETFs) are not included in the Fund's expense ratio. The Fund indirectly bears its proportionate share of these expenses. For additional expense information related to investments in Fidelity Central Funds, please refer to the "Investments in Fidelity Central Funds" note found in the Notes to Financial Statements section of the most recent Annual or Semi-Annual report.
H Expense ratios reflect operating expenses of the class. Expenses before reductions do not reflect amounts reimbursed by the investment adviser or reductions from brokerage service arrangements or reductions from other expense offset arrangements and do not represent the amount paid by the class during periods when reimbursements or reductions occur. Expenses net of fee waivers reflect expenses after reimbursement by the investment adviser but prior to reductions from brokerage service arrangements or other expense offset arrangements. Expenses net of all reductions represent the net expenses paid by the class.
I Amount does not include the portfolio activity of any underlying Fidelity Central Funds.
J Portfolio turnover rate excludes securities received or delivered in-kind.
See accompanying notes which are an integral part of the financial statements.
Fidelity Real Estate Income Fund
| Years ended July 31, | 2020 | 2019 | 2018 | 2017 | 2016 |
| Selected Per–Share Data | | | | | |
| Net asset value, beginning of period | $12.50 | $12.05 | $12.38 | $12.31 | $11.71 |
| Income from Investment Operations | | | | | |
| Net investment income (loss)A | .48 | .54 | .51 | .52 | .52 |
| Net realized and unrealized gain (loss) | (1.25) | .66 | (.22) | .14 | .73 |
| Total from investment operations | (.77) | 1.20 | .29 | .66 | 1.25 |
| Distributions from net investment income | (.48) | (.54) | (.48) | (.51) | (.51) |
| Distributions from net realized gain | (.16) | (.21) | (.13) | (.08) | (.14) |
| Total distributions | (.64) | (.75) | (.62)B | (.59) | (.65) |
| Redemption fees added to paid in capitalA | – | – | –C | –C | –C |
| Net asset value, end of period | $11.09 | $12.50 | $12.05 | $12.38 | $12.31 |
| Total ReturnD | (6.58)% | 10.47% | 2.40% | 5.60% | 11.29% |
| Ratios to Average Net AssetsE,F | | | | | |
| Expenses before reductions | .73% | .75% | .75% | .78% | .82% |
| Expenses net of fee waivers, if any | .73% | .75% | .75% | .78% | .81% |
| Expenses net of all reductions | .73% | .75% | .75% | .77% | .81% |
| Net investment income (loss) | 4.12% | 4.55% | 4.24% | 4.33% | 4.51% |
| Supplemental Data | | | | | |
| Net assets, end of period (000 omitted) | $2,205,319 | $2,691,820 | $2,531,397 | $2,630,901 | $2,719,387 |
| Portfolio turnover rateG | 32%H | 17% | 27% | 22% | 26% |
A Calculated based on average shares outstanding during the period.
B Total distributions of $.62 per share is comprised of distributions from net investment income of $.484 and distributions from net realized gain of $.132 per share.
C Amount represents less than $.005 per share.
D Total returns would have been lower if certain expenses had not been reduced during the applicable periods shown.
E Fees and expenses of any underlying mutual funds or exchange-traded funds (ETFs) are not included in the Fund's expense ratio. The Fund indirectly bears its proportionate share of these expenses. For additional expense information related to investments in Fidelity Central Funds, please refer to the "Investments in Fidelity Central Funds" note found in the Notes to Financial Statements section of the most recent Annual or Semi-Annual report.
F Expense ratios reflect operating expenses of the class. Expenses before reductions do not reflect amounts reimbursed by the investment adviser or reductions from brokerage service arrangements or reductions from other expense offset arrangements and do not represent the amount paid by the class during periods when reimbursements or reductions occur. Expenses net of fee waivers reflect expenses after reimbursement by the investment adviser but prior to reductions from brokerage service arrangements or other expense offset arrangements. Expenses net of all reductions represent the net expenses paid by the class.
G Amount does not include the portfolio activity of any underlying Fidelity Central Funds.
H Portfolio turnover rate excludes securities received or delivered in-kind.
See accompanying notes which are an integral part of the financial statements.
Fidelity Real Estate Income Fund Class I
| Years ended July 31, | 2020 | 2019 | 2018 | 2017 | 2016 |
| Selected Per–Share Data | | | | | |
| Net asset value, beginning of period | $12.45 | $12.01 | $12.34 | $12.27 | $11.68 |
| Income from Investment Operations | | | | | |
| Net investment income (loss)A | .48 | .54 | .51 | .52 | .52 |
| Net realized and unrealized gain (loss) | (1.25) | .65 | (.22) | .14 | .73 |
| Total from investment operations | (.77) | 1.19 | .29 | .66 | 1.25 |
| Distributions from net investment income | (.47) | (.54) | (.49) | (.51) | (.52) |
| Distributions from net realized gain | (.16) | (.21) | (.13) | (.08) | (.14) |
| Total distributions | (.64)B | (.75) | (.62) | (.59) | (.66) |
| Redemption fees added to paid in capitalA | – | – | –C | –C | –C |
| Net asset value, end of period | $11.04 | $12.45 | $12.01 | $12.34 | $12.27 |
| Total ReturnD | (6.62)% | 10.43% | 2.41% | 5.66% | 11.30% |
| Ratios to Average Net AssetsE,F | | | | | |
| Expenses before reductions | .74% | .75% | .75% | .76% | .77% |
| Expenses net of fee waivers, if any | .74% | .74% | .75% | .76% | .77% |
| Expenses net of all reductions | .74% | .74% | .75% | .76% | .76% |
| Net investment income (loss) | 4.11% | 4.55% | 4.25% | 4.34% | 4.56% |
| Supplemental Data | | | | | |
| Net assets, end of period (000 omitted) | $1,782,594 | $2,386,308 | $2,142,260 | $1,951,293 | $1,239,950 |
| Portfolio turnover rateG | 32%H | 17% | 27% | 22% | 26% |
A Calculated based on average shares outstanding during the period.
B Total distributions of $.64 per share is comprised of distributions from net investment income of $.474 and distributions from net realized gain of $.163 per share.
C Amount represents less than $.005 per share.
D Total returns would have been lower if certain expenses had not been reduced during the applicable periods shown.
E Fees and expenses of any underlying mutual funds or exchange-traded funds (ETFs) are not included in the Fund's expense ratio. The Fund indirectly bears its proportionate share of these expenses. For additional expense information related to investments in Fidelity Central Funds, please refer to the "Investments in Fidelity Central Funds" note found in the Notes to Financial Statements section of the most recent Annual or Semi-Annual report.
F Expense ratios reflect operating expenses of the class. Expenses before reductions do not reflect amounts reimbursed by the investment adviser or reductions from brokerage service arrangements or reductions from other expense offset arrangements and do not represent the amount paid by the class during periods when reimbursements or reductions occur. Expenses net of fee waivers reflect expenses after reimbursement by the investment adviser but prior to reductions from brokerage service arrangements or other expense offset arrangements. Expenses net of all reductions represent the net expenses paid by the class.
G Amount does not include the portfolio activity of any underlying Fidelity Central Funds.
H Portfolio turnover rate excludes securities received or delivered in-kind.
See accompanying notes which are an integral part of the financial statements.
Fidelity Real Estate Income Fund Class Z
| Years ended July 31, | 2020 | 2019 A |
| Selected Per–Share Data | | |
| Net asset value, beginning of period | $12.45 | $11.74 |
| Income from Investment Operations | | |
| Net investment income (loss)B | .49 | .47 |
| Net realized and unrealized gain (loss) | (1.25) | .67 |
| Total from investment operations | (.76) | 1.14 |
| Distributions from net investment income | (.49) | (.42) |
| Distributions from net realized gain | (.16) | (.02) |
| Total distributions | (.65) | (.43)C |
| Net asset value, end of period | $11.04 | $12.45 |
| Total ReturnD,E | (6.50)% | 10.00% |
| Ratios to Average Net AssetsF,G | | |
| Expenses before reductions | .62% | .62%H |
| Expenses net of fee waivers, if any | .62% | .62%H |
| Expenses net of all reductions | .61% | .62%H |
| Net investment income (loss) | 4.24% | 4.71%H |
| Supplemental Data | | |
| Net assets, end of period (000 omitted) | $793,220 | $467,324 |
| Portfolio turnover rateI | 32%J | 17% |
A For the period October 2, 2018 (commencement of sale of shares) to July 31, 2019.
B Calculated based on average shares outstanding during the period.
C Total distributions of $.43 per share is comprised of distributions from net investment income of $.416 and distributions from net realized gain of $.017 per share.
D Total returns for periods of less than one year are not annualized.
E Total returns would have been lower if certain expenses had not been reduced during the applicable periods shown.
F Fees and expenses of any underlying mutual funds or exchange-traded funds (ETFs) are not included in the Fund's expense ratio. The Fund indirectly bears its proportionate share of these expenses. For additional expense information related to investments in Fidelity Central Funds, please refer to the "Investments in Fidelity Central Funds" note found in the Notes to Financial Statements section of the most recent Annual or Semi-Annual report.
G Expense ratios reflect operating expenses of the class. Expenses before reductions do not reflect amounts reimbursed by the investment adviser or reductions from brokerage service arrangements or reductions from other expense offset arrangements and do not represent the amount paid by the class during periods when reimbursements or reductions occur. Expense ratios before reductions for start-up periods may not be representative of longer-term operating periods. Expenses net of fee waivers reflect expenses after reimbursement by the investment adviser but prior to reductions from brokerage service arrangements or other expense offset arrangements. Expenses net of all reductions represent the net expenses paid by the class.
H Annualized
I Amount does not include the portfolio activity of any underlying Fidelity Central Funds.
J Portfolio turnover rate excludes securities received or delivered in-kind.
See accompanying notes which are an integral part of the financial statements.
Notes to Financial Statements
For the period ended July 31, 2020
1. Organization.
Fidelity Real Estate Income Fund (the Fund) is a fund of Fidelity Securities Fund (the Trust) and is authorized to issue an unlimited number of shares. The Trust is registered under the Investment Company Act of 1940, as amended (the 1940 Act), as an open-end management investment company organized as a Massachusetts business trust. The Fund offers Class A, Class M, Class C, Real Estate Income, Class I and Class Z shares, each of which has equal rights as to assets and voting privileges. Each class has exclusive voting rights with respect to matters that affect that class. Class C shares will automatically convert to Class A shares after a holding period of ten years from the initial date of purchase, with certain exceptions.
Effective January 1, 2020:
Investment advisers Fidelity Investments Money Management, Inc., FMR Co., Inc., and Fidelity SelectCo, LLC, merged with and into Fidelity Management & Research Company. In connection with the merger transactions, the resulting, merged investment adviser was then redomiciled from Massachusetts to Delaware, changed its corporate structure from a corporation to a limited liability company, and changed its name to "Fidelity Management & Research Company LLC".
Broker-dealer Fidelity Distributors Corporation merged with and into Fidelity Investments Institutional Services Company, Inc. ("FIISC"). FIISC was then redomiciled from Massachusetts to Delaware, changed its corporate structure from a corporation to a limited liability company, and changed its name to "Fidelity Distributors Company LLC".
Fidelity Investments Institutional Operations Company, Inc. converted from a Massachusetts corporation to a Massachusetts LLC, and changed its name to "Fidelity Investments Institutional Operations Company LLC".
2. Investments in Fidelity Central Funds.
The Fund invests in Fidelity Central Funds, which are open-end investment companies generally available only to other investment companies and accounts managed by the investment adviser and its affiliates. The Fund's Schedule of Investments lists each of the Fidelity Central Funds held as of period end, if any, as an investment of the Fund, but does not include the underlying holdings of each Fidelity Central Fund. As an Investing Fund, the Fund indirectly bears its proportionate share of the expenses of the underlying Fidelity Central Funds.
The Money Market Central Funds seek preservation of capital and current income and are managed by the investment adviser. Annualized expenses of the Money Market Central Funds as of their most recent shareholder report date ranged from less than .005% to .01%.
A complete unaudited list of holdings for each Fidelity Central Fund is available upon request or at the Securities and Exchange Commission (the SEC) website at www.sec.gov. In addition, the financial statements of the Fidelity Central Funds, which are not covered by the Fund's Report of Independent Registered Public Accounting Firm, are available on the SEC website or upon request.
3. Significant Accounting Policies.
The Fund is an investment company and applies the accounting and reporting guidance of the Financial Accounting Standards Board (FASB) Accounting Standards Codification Topic 946 Financial Services – Investment Companies. The financial statements have been prepared in conformity with accounting principles generally accepted in the United States of America (GAAP), which require management to make certain estimates and assumptions at the date of the financial statements. Actual results could differ from those estimates. Subsequent events, if any, through the date that the financial statements were issued have been evaluated in the preparation of the financial statements. The following summarizes the significant accounting policies of the Fund:
Investment Valuation. Investments are valued as of 4:00 p.m. Eastern time on the last calendar day of the period. The Board of Trustees (the Board) has delegated the day to day responsibility for the valuation of the Fund's investments to the Fair Value Committee (the Committee) established by the Fund's investment adviser. In accordance with valuation policies and procedures approved by the Board, the Fund attempts to obtain prices from one or more third party pricing vendors or brokers to value its investments. When current market prices, quotations or currency exchange rates are not readily available or reliable, investments will be fair valued in good faith by the Committee, in accordance with procedures adopted by the Board. Factors used in determining fair value vary by investment type and may include market or investment specific events, changes in interest rates and credit quality. The frequency with which these procedures are used cannot be predicted and they may be utilized to a significant extent. The Committee oversees the Fund's valuation policies and procedures and reports to the Board on the Committee's activities and fair value determinations. The Board monitors the appropriateness of the procedures used in valuing the Fund's investments and ratifies the fair value determinations of the Committee.
The Fund categorizes the inputs to valuation techniques used to value its investments into a disclosure hierarchy consisting of three levels as shown below:
- Level 1 – quoted prices in active markets for identical investments
- Level 2 – other significant observable inputs (including quoted prices for similar investments, interest rates, prepayment speeds, etc.)
- Level 3 – unobservable inputs (including the Fund's own assumptions based on the best information available)
Valuation techniques used to value the Fund's investments by major category are as follows:
Equity securities, including restricted securities, for which market quotations are readily available, are valued at the last reported sale price or official closing price as reported by a third party pricing vendor on the primary market or exchange on which they are traded and are categorized as Level 1 in the hierarchy. In the event there were no sales during the day or closing prices are not available, securities are valued at the last quoted bid price or may be valued using the last available price and are generally categorized as Level 2 in the hierarchy. For foreign equity securities, when market or security specific events arise, comparisons to the valuation of American Depositary Receipts (ADRs), futures contracts, Exchange-Traded Funds (ETFs) and certain indexes as well as quoted prices for similar securities may be used and would be categorized as Level 2 in the hierarchy. For equity securities, including restricted securities, where observable inputs are limited, assumptions about market activity and risk are used and these securities may be categorized as Level 3 in the hierarchy.
Debt securities, including restricted securities, are valued based on evaluated prices received from third party pricing vendors or from brokers who make markets in such securities. Corporate bonds, bank loan obligations and preferred securities are valued by pricing vendors who utilize matrix pricing which considers yield or price of bonds of comparable quality, coupon, maturity and type or by broker-supplied prices. Asset backed securities, collateralized mortgage obligations and commercial mortgage securities are valued by pricing vendors who utilize matrix pricing which considers prepayment speed assumptions, attributes of the collateral, yield or price of bonds of comparable quality, coupon, maturity and type or by broker-supplied prices. When independent prices are unavailable or unreliable, debt securities may be valued utilizing pricing methodologies which consider similar factors that would be used by third party pricing vendors. Debt securities are generally categorized as Level 2 in the hierarchy but may be Level 3 depending on the circumstances.
Investments in open-end mutual funds, including the Fidelity Central Funds, are valued at their closing net asset value (NAV) each business day and are categorized as Level 1 in the hierarchy.
Changes in valuation techniques may result in transfers in or out of an assigned level within the disclosure hierarchy. The aggregate value of investments by input level as of July 31, 2020 is included at the end of the Fund's Schedule of Investments.
Foreign Currency. The Fund may use foreign currency contracts to facilitate transactions in foreign-denominated securities. Gains and losses from these transactions may arise from changes in the value of the foreign currency or if the counterparties do not perform under the contracts' terms.
Foreign-denominated assets, including investment securities, and liabilities are translated into U.S. dollars at the exchange rates at period end. Purchases and sales of investment securities, income and dividends received and expenses denominated in foreign currencies are translated into U.S. dollars at the exchange rate in effect on the transaction date.
The effects of exchange rate fluctuations on investments are included with the net realized and unrealized gain (loss) on investment securities. Other foreign currency transactions resulting in realized and unrealized gain (loss) are disclosed separately.
Investment Transactions and Income. For financial reporting purposes, the Fund's investment holdings and NAV include trades executed through the end of the last business day of the period. The NAV per share for processing shareholder transactions is calculated as of the close of business of the New York Stock Exchange (NYSE), normally 4:00 p.m. Eastern time and includes trades executed through the end of the prior business day. Gains and losses on securities sold are determined on the basis of identified cost. Dividend income is recorded on the ex-dividend date, except for certain dividends from foreign securities where the ex-dividend date may have passed, which are recorded as soon as the Fund is informed of the ex-dividend date. Non-cash dividends included in dividend income, if any, are recorded at the fair market value of the securities received. Income and capital gain distributions from Fidelity Central Funds, if any, are recorded on the ex-dividend date. Certain distributions received by the Fund represent a return of capital or capital gain. The Fund determines the components of these distributions subsequent to the ex-dividend date, based upon receipt of tax filings or other correspondence relating to the underlying investment. These distributions are recorded as a reduction of cost of investments and/or as a realized gain. Interest income is accrued as earned and includes coupon interest and amortization of premium and accretion of discount on debt securities as applicable. For certain lower credit quality securitized assets that have contractual cash flows (for example, asset backed securities, collateralized mortgage obligations and commercial mortgage-backed securities), changes in estimated cash flows are periodically evaluated and the estimated yield is adjusted on a prospective basis, resulting in increases or decreases to Interest Income in the accompanying Statement of Operations. Investment income is recorded net of foreign taxes withheld where recovery of such taxes is uncertain. Debt obligations may be placed on non-accrual status and related interest income may be reduced by ceasing current accruals and writing off interest receivables when the collection of all or a portion of interest has become doubtful based on consistently applied procedures. A debt obligation is removed from non-accrual status when the issuer resumes interest payments or when collectability of interest is reasonably assured.
Class Allocations and Expenses. Investment income, realized and unrealized capital gains and losses, common expenses of the Fund, and certain fund-level expense reductions, if any, are allocated daily on a pro-rata basis to each class based on the relative net assets of each class to the total net assets of the Fund. Each class differs with respect to transfer agent and distribution and service plan fees incurred. Certain expense reductions may also differ by class. For the reporting period, the allocated portion of income and expenses to each class as a percent of its average net assets may vary due to the timing of recording these transactions in relation to fluctuating net assets of the classes. Expenses directly attributable to a fund are charged to that fund. Expenses attributable to more than one fund are allocated among the respective funds on the basis of relative net assets or other appropriate methods. Expense estimates are accrued in the period to which they relate and adjustments are made when actual amounts are known.
Income Tax Information and Distributions to Shareholders. Each year, the Fund intends to qualify as a regulated investment company under Subchapter M of the Internal Revenue Code, including distributing substantially all of its taxable income and realized gains. As a result, no provision for U.S. Federal income taxes is required. As of July 31, 2020, the Fund did not have any unrecognized tax benefits in the financial statements; nor is the Fund aware of any tax positions for which it is reasonably possible that the total amounts of unrecognized tax benefits will significantly change in the next twelve months. The Fund files a U.S. federal tax return, in addition to state and local tax returns as required. The Fund's federal income tax returns are subject to examination by the Internal Revenue Service (IRS) for a period of three fiscal years after they are filed. State and local tax returns may be subject to examination for an additional fiscal year depending on the jurisdiction. Foreign taxes are provided for based on the Fund's understanding of the tax rules and rates that exist in the foreign markets in which it invests.
Distributions are declared and recorded on the ex-dividend date. Income and capital gain distributions are declared separately for each class. Income and capital gain distributions are determined in accordance with income tax regulations, which may differ from GAAP. In addition, the Fund claimed a portion of the payment made to redeeming shareholders as a distribution for income tax purposes.
Capital accounts within the financial statements are adjusted for permanent book-tax differences. These adjustments have no impact on net assets or the results of operations. Capital accounts are not adjusted for temporary book-tax differences which will reverse in a subsequent period.
Book-tax differences are primarily due to the short-term gain distributions from the Underlying Funds, foreign currency transactions, passive foreign investment companies (PFIC), market discount, equity-debt classifications, certain conversion ratio adjustments, redemptions in kind, partnerships, losses deferred due to wash sales and excise tax regulations.
As of period end, the cost and unrealized appreciation (depreciation) in securities, and derivatives if applicable, for federal income tax purposes were as follows:
| Gross unrealized appreciation | $473,773,665 |
| Gross unrealized depreciation | (784,704,950) |
| Net unrealized appreciation (depreciation) | $(310,931,285) |
| Tax Cost | $5,600,732,463 |
The tax-based components of distributable earnings as of period end were as follows:
| Undistributed ordinary income | $43,489,291 |
| Net unrealized appreciation (depreciation) on securities and other investments | $(310,931,240) |
The Fund intends to elect to defer to its next fiscal year $30,023,661 of capital losses recognized during the period November 1, 2019 to July 31, 2020.
The tax character of distributions paid was as follows:
| | July 31, 2020 | July 31, 2019 |
| Ordinary Income | $235,626,525 | $ 250,774,684 |
| Long-term Capital Gains | 78,992,451 | 89,265,206 |
| Total | $314,618,976 | $ 340,039,890 |
Restricted Securities (including Private Placements). The Fund may invest in securities that are subject to legal or contractual restrictions on resale. These securities generally may be resold in transactions exempt from registration or to the public if the securities are registered. Disposal of these securities may involve time-consuming negotiations and expense, and prompt sale at an acceptable price may be difficult. Information regarding restricted securities is included at the end of the Fund's Schedule of Investments.
Loans and Other Direct Debt Instruments. The Fund invests in direct debt instruments which are interests in amounts owed to lenders by corporate or other borrowers. These instruments may be in the form of loans, trade claims or other receivables and may include standby financing commitments such as revolving credit facilities that obligate the Fund to supply additional cash to the borrower on demand. Loans may be acquired through assignment or participation. The Fund did not have any unfunded loan commitments, which are contractual obligations for future funding, at period end.
4. Purchases and Sales of Investments.
Purchases and sales of securities, other than short-term securities and U.S. government securities and in-kind transactions are noted in the table below.
| | Purchases ($) | Sales ($) |
| Fidelity Real Estate Income Fund | 1,785,593,898 | 1,728,974,111 |
5. Fees and Other Transactions with Affiliates.
Management Fee. Fidelity Management & Research Company LLC (the investment adviser) and its affiliates provide the Fund with investment management related services for which the Fund pays a monthly management fee. The management fee is the sum of an individual fund fee rate that is based on an annual rate of .30% of the Fund's average net assets and an annualized group fee rate that averaged .23% during the period. The group fee rate is based upon the monthly average net assets of a group of registered investment companies with which the investment adviser has management contracts. The group fee rate decreases as assets under management increase and increases as assets under management decrease. For the reporting period, the total annual management fee rate was .53% of the Fund's average net assets.
Distribution and Service Plan Fees. In accordance with Rule 12b-1 of the 1940 Act, the Fund has adopted separate Distribution and Service Plans for each class of shares. Certain classes pay Fidelity Distributors Company LLC (FDC), an affiliate of the investment adviser, separate Distribution and Service Fees, each of which is based on an annual percentage of each class' average net assets. In addition, FDC may pay financial intermediaries for selling shares of the Fund and providing shareholder support services. For the period, the Distribution and Service Fee rates, total fees and amounts retained by FDC were as follows:
| | Distribution Fee | Service Fee | Total Fees | Retained by FDC |
| Class A | -% | .25% | $875,353 | $38,265 |
| Class M | -% | .25% | 144,575 | 245 |
| Class C | .75% | .25% | 1,927,967 | 238,531 |
| | | | $2,947,895 | $277,041 |
Sales Load. FDC may receive a front-end sales charge of up to 4.00% for selling Class A shares and Class M shares, some of which is paid to financial intermediaries for selling shares of the Fund. Depending on the holding period, FDC may receive contingent deferred sales charges levied on Class A, Class M and Class C redemptions. The deferred sales charges are 1.00% for Class C shares, 1.00% for certain purchases of Class A shares and .25% for certain purchases of Class M shares.
For the period, sales charge amounts retained by FDC were as follows:
| | Retained by FDC |
| Class A | $81,811 |
| Class M | 6,461 |
| Class C(a) | 21,164 |
| | $109,436 |
(a) When Class C shares are initially sold, FDC pays commissions from its own resources to financial intermediaries through which the sales are made.
Transfer Agent Fees. Fidelity Investments Institutional Operations Company LLC (FIIOC), an affiliate of the investment adviser, is the transfer, dividend disbursing and shareholder servicing agent for each class of the Fund. FIIOC receives account fees and asset-based fees that vary according to the account size and type of account of the shareholders of the respective classes of the Fund, except for Class Z. FIIOC receives an asset-based fee of Class Z's average net assets. FIIOC pays for typesetting, printing and mailing of shareholder reports, except proxy statements. Effective February 1, 2020, the Board approved to change the fee for Class Z from .046% to .044%.
For the period, transfer agent fees for each class were as follows:
| | Amount | % of Class-Level Average Net Assets |
| Class A | $642,283 | .18 |
| Class M | 120,353 | .21 |
| Class C | 355,471 | .18 |
| Real Estate Income | 3,525,813 | .16 |
| Class I | 3,826,631 | .17 |
| Class Z | 329,005 | .04 |
| | $8,799,556 | |
Accounting Fees. Fidelity Service Company, Inc. (FSC), an affiliate of the investment adviser, maintains the Fund's accounting records. The accounting fee is based on the level of average net assets for each month. For the period, the fees were equivalent to the following annual rates:
| | % of Average Net Assets |
| Fidelity Real Estate Income Fund | .02 |
Brokerage Commissions. A portion of portfolio transactions were placed with brokerage firms which are affiliates of the investment adviser. Brokerage commissions are included in net realized gain (loss) and change in net unrealized appreciation (depreciation) in the Statement of Operations. The commissions paid to these affiliated firms were as follows:
| | Amount |
| Fidelity Real Estate Income Fund | $31,450 |
Interfund Trades. Funds may purchase from or sell securities to other Fidelity Funds under procedures adopted by the Board. The procedures have been designed to ensure these interfund trades are executed in accordance with Rule 17a-7 of the 1940 Act. Interfund trades are included within the respective purchases and sales amounts shown in the Purchases and Sales of Investments note.
Affiliated Redemptions In-Kind. During the period, 5,621,404 shares of the Fund were redeemed in-kind for investments, including accrued interest and cash with a value of $71,229,507. The net realized gain of $12,315,468 on investments delivered through in-kind redemptions is included in the accompanying Statement of Operations. The amount of the in-kind redemptions is included in share transactions in the accompanying Statement of Changes in Net Assets as well as the Notes to Financial Statements. The Fund recognized no gain or loss for federal income tax purposes.
6. Committed Line of Credit.
Certain Funds participate with other funds managed by the investment adviser or an affiliate in a $4.25 billion credit facility (the "line of credit") to be utilized for temporary or emergency purposes to fund shareholder redemptions or for other short-term liquidity purposes. The participating funds have agreed to pay commitment fees on their pro-rata portion of the line of credit, which are reflected in Miscellaneous expenses on the Statement of Operations, and are as follows:
| | Amount |
| Fidelity Real Estate Income Fund | $14,465 |
During the period, there were no borrowings on this line of credit.
7. Security Lending.
The Fund lends portfolio securities from time to time in order to earn additional income. Lending agents are used, including National Financial Services (NFS), an affiliate of the Fund. Pursuant to a securities lending agreement, NFS will receive a fee, which is capped at 9.9% of daily lending revenue, for its services as lending agent. The Fund may lend securities to certain qualified borrowers, including NFS. On the settlement date of the loan, the Fund receives collateral (in the form of U.S. Treasury obligations, letters of credit and/or cash) against the loaned securities and maintains collateral in an amount not less than 100% of the market value of the loaned securities during the period of the loan. The market value of the loaned securities is determined at the close of business of the Fund and any additional required collateral is delivered to the Fund on the next business day. The Fund or borrower may terminate the loan at any time, and if the borrower defaults on its obligation to return the securities loaned because of insolvency or other reasons, the Fund may apply collateral received from the borrower against the obligation. The Fund may experience delays and costs in recovering the securities loaned. Any cash collateral received is invested in the Fidelity Securities Lending Cash Central Fund. The value of loaned securities and cash collateral at period end are disclosed on the Fund's Statement of Assets and Liabilities. At period end, there were no security loans outstanding with NFS, as affiliated borrower. Total fees paid by the Fund to NFS, as lending agent, amounted to $2,268. Security lending income represents the income earned on investing cash collateral, less rebates paid to borrowers and any lending agent fees associated with the loan, plus any premium payments received for lending certain types of securities. Net income from the Fidelity Securities Lending Cash Central Fund during the period is presented in the Statement of Operations as a component of income from Fidelity Central Funds (and includes amount less than one dollar from securities loaned to NFS, as affiliated borrower).
8. Expense Reductions.
Commissions paid to certain brokers with whom the investment adviser, or its affiliates, places trades on behalf of the Fund include an amount in addition to trade execution, which may be rebated back to the Fund to offset certain expenses. This amount totaled $108,379 for the period. In addition, through arrangements with the Fund's custodian, credits realized as a result of certain uninvested cash balances were used to reduce the Fund's expenses. During the period, custodian credits reduced the Fund's expenses by $40,344.
In addition, during the period the investment adviser or an affiliate reimbursed and/or waived a portion of fund-level operating expenses in the amount of $25,878.
In addition, during the period the investment adviser or an affiliate reimbursed the Fund $10,400 for an operational error which is included in the accompanying Statement of Operations.
9. Distributions to Shareholders.
Distributions to shareholders of each class were as follows:
| | Year ended
July 31, 2020 | Year ended
July 31, 2019(a) |
| Distributions to shareholders | | |
| Class A | $16,800,423 | $17,756,264 |
| Class M | 2,986,781 | 3,318,773 |
| Class C | 8,903,773 | 11,711,511 |
| Real Estate Income | 123,469,997 | 164,869,904 |
| Class I | 124,750,021 | 135,048,536 |
| Class Z | 37,707,981 | 7,334,902 |
| Total | $314,618,976 | $340,039,890 |
(a) Distributions for Class Z are for the period October 2, 2018 (commencement of sale of shares) to July 31, 2019.
10. Share Transactions.
Share transactions for each class were as follows and may contain automatic conversions between classes or exchanges between affiliated funds:
| | Shares | Shares | Dollars | Dollars |
| | Year ended July 31, 2020 | Year ended July 31, 2019(a) | Year ended July 31, 2020 | Year ended July 31, 2019(a) |
| Class A | | | | |
| Shares sold | 15,823,808 | 7,652,744 | $191,280,675 | $91,491,023 |
| Reinvestment of distributions | 1,297,338 | 1,474,957 | 15,857,157 | 17,330,478 |
| Shares redeemed | (13,892,033) | (7,793,544) | (150,346,336) | (92,014,816) |
| Net increase (decrease) | 3,229,113 | 1,334,157 | $56,791,496 | $16,806,685 |
| Class M | | | | |
| Shares sold | 824,443 | 1,028,225 | $9,998,224 | $12,240,983 |
| Reinvestment of distributions | 241,612 | 277,847 | 2,949,239 | 3,265,577 |
| Shares redeemed | (1,455,093) | (1,038,297) | (15,879,636) | (12,307,088) |
| Net increase (decrease) | (389,038) | 267,775 | $(2,932,173) | $3,199,472 |
| Class C | | | | |
| Shares sold | 2,587,714 | 2,842,876 | $31,014,372 | $33,441,407 |
| Reinvestment of distributions | 684,373 | 940,228 | 8,286,994 | 10,920,406 |
| Shares redeemed | (6,528,756) | (5,865,438) | (70,751,926) | (68,911,422) |
| Net increase (decrease) | (3,256,669) | (2,082,334) | $(31,450,560) | $(24,549,609) |
| Real Estate Income | | | | |
| Shares sold | 94,882,819 | 73,051,353 | $1,065,881,914 | $873,951,868 |
| Reinvestment of distributions | 8,576,887 | 12,299,627 | 105,168,710 | 145,249,096 |
| Shares redeemed | (119,906,772)(b) | (80,067,017) | (1,382,675,657)(b) | (959,494,113) |
| Net increase (decrease) | (16,447,066) | 5,283,963 | $(211,625,033) | $59,706,851 |
| Class I | | | | |
| Shares sold | 86,049,187 | 77,184,509 | $1,004,030,203 | $918,900,015 |
| Reinvestment of distributions | 8,675,341 | 9,707,377 | 106,049,306 | 114,247,360 |
| Shares redeemed | (124,939,225)(b) | (73,658,363) | (1,352,340,746)(b) | (875,126,254) |
| Net increase (decrease) | (30,214,697) | 13,233,523 | $(242,261,237) | $158,021,121 |
| Class Z | | | | |
| Shares sold | 81,818,897 | 39,008,440 | $961,480,276 | $465,579,262 |
| Reinvestment of distributions | 2,404,207 | 397,454 | 29,213,996 | 4,775,264 |
| Shares redeemed | (49,917,594) | (1,874,977) | (518,510,660) | (22,220,303) |
| Net increase (decrease) | 34,305,510 | 37,530,917 | $472,183,612 | $448,134,223 |
(a) Share transactions for Class Z are for the period October 2, 2018 (commencement of sale of shares) to July 31, 2019.
(b) Amount includes in-kind redemptions (see the Affiliated Redemptions In-Kind note for additional details).
11. Other.
The Fund's organizational documents provide former and current trustees and officers with a limited indemnification against liabilities arising in connection with the performance of their duties to the Fund. In the normal course of business, the Fund may also enter into contracts that provide general indemnifications. The Fund's maximum exposure under these arrangements is unknown as this would be dependent on future claims that may be made against the Fund. The risk of material loss from such claims is considered remote.
12. Coronavirus (COVID-19) Pandemic.
An outbreak of COVID-19 first detected in China during December 2019 has since spread globally and was declared a pandemic by the World Health Organization during March 2020. Developments that disrupt global economies and financial markets, such as the COVID-19 pandemic, may magnify factors that affect the Fund's performance.
Report of Independent Registered Public Accounting Firm
To the Board of Trustees of Fidelity Securities Fund and Shareholders of Fidelity Real Estate Income Fund
Opinion on the Financial Statements and Financial Highlights
We have audited the accompanying statement of assets and liabilities of Fidelity Real Estate Income Fund (the "Fund"), a fund of Fidelity Securities Fund, including the schedule of investments, as of July 31, 2020, the related statement of operations for the year then ended, the statement of changes in net assets for each of the two years in the period then ended, the financial highlights for each of the five years in the period then ended, and the related notes. In our opinion, the financial statements and financial highlights present fairly, in all material respects, the financial position of the Fund as of July 31, 2020, and the results of its operations for the year then ended, the changes in its net assets for each of the two years in the period then ended, and the financial highlights for each of the five years in the period then ended in conformity with accounting principles generally accepted in the United States of America.
Basis for Opinion
These financial statements and financial highlights are the responsibility of the Fund's management. Our responsibility is to express an opinion on the Fund's financial statements and financial highlights based on our audits. We are a public accounting firm registered with the Public Company Accounting Oversight Board (United States) (PCAOB) and are required to be independent with respect to the Fund in accordance with the U.S. federal securities laws and the applicable rules and regulations of the Securities and Exchange Commission and the PCAOB.
We conducted our audits in accordance with the standards of the PCAOB. Those standards require that we plan and perform the audit to obtain reasonable assurance about whether the financial statements and financial highlights are free of material misstatement, whether due to error or fraud. The Fund is not required to have, nor were we engaged to perform, an audit of its internal control over financial reporting. As part of our audits we are required to obtain an understanding of internal control over financial reporting but not for the purpose of expressing an opinion on the effectiveness of the Fund’s internal control over financial reporting. Accordingly, we express no such opinion.
Our audits included performing procedures to assess the risks of material misstatement of the financial statements and financial highlights, whether due to error or fraud, and performing procedures that respond to those risks. Such procedures included examining, on a test basis, evidence regarding the amounts and disclosures in the financial statements and financial highlights. Our audits also included evaluating the accounting principles used and significant estimates made by management, as well as evaluating the overall presentation of the financial statements and financial highlights. Our procedures included confirmation of securities owned as of July 31, 2020, by correspondence with the custodian, brokers and agent banks; when replies were not received from brokers or agent banks, we performed other auditing procedures. We believe that our audits provide a reasonable basis for our opinion.
/s/ Deloitte & Touche LLP
Boston, Massachusetts
September 14, 2020
We have served as the auditor of one or more of the Fidelity investment companies since 1999.
Trustees and Officers
The Trustees, Members of the Advisory Board (if any), and officers of the trust and fund, as applicable, are listed below. The Board of Trustees governs the fund and is responsible for protecting the interests of shareholders. The Trustees are experienced executives who meet periodically throughout the year to oversee the fund's activities, review contractual arrangements with companies that provide services to the fund, oversee management of the risks associated with such activities and contractual arrangements, and review the fund's performance. Except for Jonathan Chiel, each of the Trustees oversees 311 funds. Mr. Chiel oversees 174 funds.
The Trustees hold office without limit in time except that (a) any Trustee may resign; (b) any Trustee may be removed by written instrument, signed by at least two-thirds of the number of Trustees prior to such removal; (c) any Trustee who requests to be retired or who has become incapacitated by illness or injury may be retired by written instrument signed by a majority of the other Trustees; and (d) any Trustee may be removed at any special meeting of shareholders by a two-thirds vote of the outstanding voting securities of the trust. Each Trustee who is not an interested person (as defined in the 1940 Act) of the trust and the fund is referred to herein as an Independent Trustee. Each Independent Trustee shall retire not later than the last day of the calendar year in which his or her 75th birthday occurs. The Independent Trustees may waive this mandatory retirement age policy with respect to individual Trustees. Officers and Advisory Board Members hold office without limit in time, except that any officer or Advisory Board Member may resign or may be removed by a vote of a majority of the Trustees at any regular meeting or any special meeting of the Trustees. Except as indicated, each individual has held the office shown or other offices in the same company for the past five years.
The fund's Statement of Additional Information (SAI) includes more information about the Trustees. To request a free copy, call Fidelity at 1-800-544-8544 if you’re an individual investing directly with Fidelity, call 1-800-835-5092 if you’re a plan sponsor or participant with Fidelity as your recordkeeper or call 1-877-208-0098 on institutional accounts or if you’re an advisor or invest through one.
Experience, Skills, Attributes, and Qualifications of the Trustees. The Governance and Nominating Committee has adopted a statement of policy that describes the experience, qualifications, attributes, and skills that are necessary and desirable for potential Independent Trustee candidates (Statement of Policy). The Board believes that each Trustee satisfied at the time he or she was initially elected or appointed a Trustee, and continues to satisfy, the standards contemplated by the Statement of Policy. The Governance and Nominating Committee also engages professional search firms to help identify potential Independent Trustee candidates who have the experience, qualifications, attributes, and skills consistent with the Statement of Policy. From time to time, additional criteria based on the composition and skills of the current Independent Trustees, as well as experience or skills that may be appropriate in light of future changes to board composition, business conditions, and regulatory or other developments, have also been considered by the professional search firms and the Governance and Nominating Committee. In addition, the Board takes into account the Trustees' commitment and participation in Board and committee meetings, as well as their leadership of standing and ad hoc committees throughout their tenure.
In determining that a particular Trustee was and continues to be qualified to serve as a Trustee, the Board has considered a variety of criteria, none of which, in isolation, was controlling. The Board believes that, collectively, the Trustees have balanced and diverse experience, qualifications, attributes, and skills, which allow the Board to operate effectively in governing the fund and protecting the interests of shareholders. Information about the specific experience, skills, attributes, and qualifications of each Trustee, which in each case led to the Board's conclusion that the Trustee should serve (or continue to serve) as a trustee of the fund, is provided below.
Board Structure and Oversight Function. Robert A. Lawrence is an interested person and currently serves as Acting Chairman. The Trustees have determined that an interested Chairman is appropriate and benefits shareholders because an interested Chairman has a personal and professional stake in the quality and continuity of services provided to the fund. Independent Trustees exercise their informed business judgment to appoint an individual of their choosing to serve as Chairman, regardless of whether the Trustee happens to be independent or a member of management. The Independent Trustees have determined that they can act independently and effectively without having an Independent Trustee serve as Chairman and that a key structural component for assuring that they are in a position to do so is for the Independent Trustees to constitute a substantial majority for the Board. The Independent Trustees also regularly meet in executive session. Ned C. Lautenbach and David M. Thomas serve as Co-Lead Independent Trustees and as such each (i) acts as a liaison between the Independent Trustees and management with respect to matters important to the Independent Trustees and (ii) with management prepares agendas for Board meetings.
Fidelity® funds are overseen by different Boards of Trustees. The fund's Board oversees Fidelity's high income and certain equity funds, and other Boards oversee Fidelity's investment-grade bond, money market, asset allocation, and other equity funds. The asset allocation funds may invest in Fidelity® funds overseen by the fund's Board. The use of separate Boards, each with its own committee structure, allows the Trustees of each group of Fidelity® funds to focus on the unique issues of the funds they oversee, including common research, investment, and operational issues. On occasion, the separate Boards establish joint committees to address issues of overlapping consequences for the Fidelity® funds overseen by each Board.
The Trustees operate using a system of committees to facilitate the timely and efficient consideration of all matters of importance to the Trustees, the fund, and fund shareholders and to facilitate compliance with legal and regulatory requirements and oversight of the fund's activities and associated risks. The Board, acting through its committees, has charged FMR and its affiliates with (i) identifying events or circumstances the occurrence of which could have demonstrably adverse effects on the fund's business and/or reputation; (ii) implementing processes and controls to lessen the possibility that such events or circumstances occur or to mitigate the effects of such events or circumstances if they do occur; and (iii) creating and maintaining a system designed to evaluate continuously business and market conditions in order to facilitate the identification and implementation processes described in (i) and (ii) above. Because the day-to-day operations and activities of the fund are carried out by or through FMR, its affiliates, and other service providers, the fund's exposure to risks is mitigated but not eliminated by the processes overseen by the Trustees. While each of the Board's committees has responsibility for overseeing different aspects of the fund's activities, oversight is exercised primarily through the Operations, Audit, and Compliance Committees. Appropriate personnel, including but not limited to the fund's Chief Compliance Officer (CCO), FMR's internal auditor, the independent accountants, the fund's Treasurer and portfolio management personnel, make periodic reports to the Board's committees, as appropriate, including an annual review of Fidelity's risk management program for the Fidelity® funds. The responsibilities of each standing committee, including their oversight responsibilities, are described further under "Standing Committees of the Trustees."
Interested Trustees*:
Correspondence intended for a Trustee who is an interested person may be sent to Fidelity Investments, 245 Summer Street, Boston, Massachusetts 02210.
Name, Year of Birth; Principal Occupations and Other Relevant Experience+
Jonathan Chiel (1957)
Year of Election or Appointment: 2016
Trustee
Mr. Chiel also serves as Trustee of other Fidelity® funds. Mr. Chiel is Executive Vice President and General Counsel for FMR LLC (diversified financial services company, 2012-present). Previously, Mr. Chiel served as general counsel (2004-2012) and senior vice president and deputy general counsel (2000-2004) for John Hancock Financial Services; a partner with Choate, Hall & Stewart (1996-2000) (law firm); and an Assistant United States Attorney for the United States Attorney’s Office of the District of Massachusetts (1986-95), including Chief of the Criminal Division (1993-1995). Mr. Chiel is a director on the boards of the Boston Bar Foundation and the Maimonides School.
Robert A. Lawrence (1952)
Year of Election or Appointment: 2020
Trustee
Acting Chairman of the Board of Trustees
Mr. Lawrence also serves as Trustee of other funds. Previously, Mr. Lawrence served as a Member of the Advisory Board of certain funds. Prior to his retirement in 2008, Mr. Lawrence served as Vice President of certain Fidelity® funds (2006-2008), Senior Vice President, Head of High Income Division of Fidelity Management & Research Company (investment adviser firm, 2006-2008), and President of Fidelity Strategic Investments (investment adviser firm, 2002-2005).
* Determined to be an “Interested Trustee” by virtue of, among other things, his or her affiliation with the trust or various entities under common control with FMR.
+ The information includes the Trustee's principal occupation during the last five years and other information relating to the experience, attributes, and skills relevant to the Trustee's qualifications to serve as a Trustee, which led to the conclusion that the Trustee should serve as a Trustee for the fund.
Independent Trustees:
Correspondence intended for an Independent Trustee may be sent to Fidelity Investments, P.O. Box 55235, Boston, Massachusetts 02205-5235.
Name, Year of Birth; Principal Occupations and Other Relevant Experience+
Dennis J. Dirks (1948)
Year of Election or Appointment: 2005
Trustee
Mr. Dirks also serves as Trustee of other Fidelity® funds. Prior to his retirement in May 2003, Mr. Dirks served as Chief Operating Officer and as a member of the Board of The Depository Trust & Clearing Corporation (financial markets infrastructure), President, Chief Operating Officer and a member of the Board of The Depository Trust Company (DTC), President and a member of the Board of the National Securities Clearing Corporation (NSCC), Chief Executive Officer and a member of the Board of the Government Securities Clearing Corporation and Chief Executive Officer and a member of the Board of the Mortgage-Backed Securities Clearing Corporation. Mr. Dirks currently serves as a member of the Finance Committee (2016-present) and Board (2017-present) and is Treasurer (2018-present) of the Asolo Repertory Theatre.
Donald F. Donahue (1950)
Year of Election or Appointment: 2018
Trustee
Mr. Donahue also serves as Trustee of other Fidelity® funds. Mr. Donahue serves as President and Chief Executive Officer of Miranda Partners, LLC (risk consulting for the financial services industry, 2012-present). Previously, Mr. Donahue served as Chief Executive Officer (2006-2012), Chief Operating Officer (2003-2006) and Managing Director, Customer Marketing and Development (1999-2003) of The Depository Trust & Clearing Corporation (financial markets infrastructure). Mr. Donahue currently serves as a member (2007-present) and Co-Chairman (2016-present) of the Board of United Way of New York, a member of the Board of NYC Leadership Academy (2012-present) and a member of the Board of Advisors of Ripple Labs, Inc. (financial services, 2015-present). Mr. Donahue previously served as a member of the Advisory Board of certain Fidelity® funds (2015-2018).
Vicki L. Fuller (1957)
Year of Election or Appointment: 2020
Trustee
Ms. Fuller also serves as Trustee of other Fidelity® funds. Previously, Ms. Fuller served as a member of the Advisory Board of certain Fidelity® funds (2018-2020), Chief Investment Officer of the New York State Common Retirement Fund (2012-2018) and held a variety of positions at AllianceBernstein L.P. (global asset management, 1985-2012), including Managing Director (2006-2012) and Senior Vice President and Senior Portfolio Manager (2001-2006). Ms. Fuller currently serves as a member of the Board, Audit Committee and Nominating and Governance Committee of The Williams Companies, Inc. (natural gas infrastructure, 2018-present) and as a member of the Board of Treliant, LLC (consulting, 2019-present).
Patricia L. Kampling (1959)
Year of Election or Appointment: 2020
Trustee
Ms. Kampling also serves as Trustee of other Fidelity® funds. Prior to her retirement, Ms. Kampling served as Chairman of the Board and Chief Executive Officer (2012-2019), President and Chief Operating Officer (2011-2012) and Executive Vice President and Chief Financial Officer (2010-2011) of Alliant Energy Corporation. Ms. Kampling currently serves as a member of the Board, Compensation Committee and Executive Committee and as Chair of the Audit Committee of Briggs & Stratton Corporation (manufacturing, 2011-present) and as a member of the Board, Audit, Finance and Risk Committee and Safety, Environmental, Technology and Operations Committee of American Water Works Company, Inc. (utilities company, 2019-present). In addition, Ms. Kampling currently serves as a member of the Board of the Nature Conservancy, Wisconsin Chapter (2019-present). Previously, Ms. Kampling served as a Member of the Advisory Board of certain Fidelity® funds (2020), a member of the Board of Interstate Power and Light Company (2012-2019) and Wisconsin Power and Light Company (2012-2019) (each a subsidiary of Alliant Energy Corporation) and as a member of the Board and Workforce Development Committee of the Business Roundtable (2018-2019).
Alan J. Lacy (1953)
Year of Election or Appointment: 2008
Trustee
Mr. Lacy also serves as Trustee of other Fidelity® funds. Previously, Mr. Lacy served as Senior Adviser (2007-2014) of Oak Hill Capital Partners, L.P. (private equity), Chief Executive Officer (2005) and Vice Chairman (2005-2006) of Sears Holdings Corporation (retail), Chief Executive Officer and Chairman of the Board of Sears, Roebuck and Co. (retail, 2000-2005), Chairman (2014-2017) and a member of the Board (2010-2017) of Dave & Buster’s Entertainment, Inc. (restaurant and entertainment complexes) and a member of the Board of Bristol-Myers Squibb Company (global pharmaceuticals, 2008-2020). Mr. Lacy currently serves as a Trustee of the California Chapter of The Nature Conservancy (2015-present) and a member of the Board of the Center for Advanced Study in the Behavioral Sciences at Stanford University (2015-present).
Ned C. Lautenbach (1944)
Year of Election or Appointment: 2000
Trustee
Co-Lead Independent Trustee
Mr. Lautenbach also serves as Trustee of other Fidelity® funds. Mr. Lautenbach currently serves as Chair of the Board of Governors, State University System of Florida (2013-present) and is a member of the Council on Foreign Relations (1994-present). He is also a member and has in the past served as Chairman of the Board of Directors of Artis-Naples (2012-present). Previously, Mr. Lautenbach served as a member and then Lead Director of the Board of Directors of Eaton Corporation (diversified industrial, 1997-2016). He was also a Partner at Clayton, Dubilier & Rice, LLC (private equity investment, 1998-2010); as well as Director of Sony Corporation (2006-2007). In addition, Mr. Lautenbach had a 30-year career with IBM (technology company), during which time he served as Senior Vice President and as a member of the Corporate Executive Committee (1968-1998).
Joseph Mauriello (1944)
Year of Election or Appointment: 2008
Trustee
Mr. Mauriello also serves as Trustee of other Fidelity® funds. Prior to his retirement in January 2006, Mr. Mauriello served in numerous senior management positions including Deputy Chairman and Chief Operating Officer (2004-2005), and Vice Chairman of Financial Services (2002-2004) of KPMG LLP US (professional services, 1965-2005). Mr. Mauriello currently serves as a member of the Independent Directors Council Governing Council (2015-present). Previously, Mr. Mauriello served as a member of the Board of XL Group plc. (global insurance and re-insurance, 2006-2018).
Cornelia M. Small (1944)
Year of Election or Appointment: 2005
Trustee
Ms. Small also serves as Trustee of other Fidelity® funds. Previously, Ms. Small served as Chief Investment Officer, Director of Global Equity Investments and a member of Scudder, Stevens & Clark and Scudder Kemper Investments. Ms. Small previously served as a member of the Board (2009-2019) and Chair of the Investment Committee (2010-2019) of the Teagle Foundation and a member of the Investment Committee of the Berkshire Taconic Community Foundation (2008-2019).
Garnett A. Smith (1947)
Year of Election or Appointment: 2018
Trustee
Mr. Smith also serves as Trustee of other Fidelity® funds. Prior to his retirement, Mr. Smith served as Chairman and Chief Executive Officer (1990-1997) and President (1986-1990) of Inbrand Corp. (manufacturer of personal absorbent products). Prior to his employment with Inbrand Corp., he was employed by a retail fabric chain and North Carolina National Bank (now Bank of America). Mr. Smith previously served as a member of the Advisory Board of certain Fidelity® funds (2012-2013).
David M. Thomas (1949)
Year of Election or Appointment: 2008
Trustee
Co-Lead Independent Trustee
Mr. Thomas also serves as Trustee of other Fidelity® funds. Previously, Mr. Thomas served as Executive Chairman (2005-2006) and Chairman and Chief Executive Officer (2000-2005) of IMS Health, Inc. (pharmaceutical and healthcare information solutions). Mr. Thomas currently serves as Non-Executive Chairman of the Board of Fortune Brands Home and Security (home and security products, 2011-present), and a member of the Board (2004-present) and Presiding Director (2013-present) of Interpublic Group of Companies, Inc. (marketing communication).
Susan Tomasky (1953)
Year of Election or Appointment: 2020
Trustee
Ms. Tomasky also serves as Trustee of other Fidelity® funds. Prior to her retirement, Ms. Tomasky served in various executive officer positions at American Electric Power Company, Inc. (1998-2011), including most recently as President of AEP Transmission (2007-2011). Ms. Tomasky currently serves as a member of the Board and Sustainability Committee and as Chair of the Audit Committee of Marathon Petroleum Corporation (2018-present) and as a member of the Board, Corporate Governance Committee and Organization and Compensation Committee and as Chair of the Audit Committee of Public Service Enterprise Group, Inc. (utilities company, 2012-present). In addition, Ms. Tomasky currently serves as a member of the Board of the Columbus Regional Airport Authority (2007-present), as a member of the Board of the Royal Shakespeare Company – America (2009-present), as a member of the Board of the Columbus Association for the Performing Arts (2011-present) and as a member of the Board of Kenyon College (2016-present). Previously, Ms. Tomasky served as a Member of the Advisory Board of certain Fidelity® funds (2020), a member of the Board (2011-2019) and as Lead Independent Director (2015-2018) of Andeavor Corporation (previously Tesoro Corporation) (independent oil refiner and marketer) and as a member of the Board of Summit Midstream Partners LP (energy, 2012-2018).
Michael E. Wiley (1950)
Year of Election or Appointment: 2020
Trustee
Mr. Wiley also serves as Trustee of other Fidelity® funds. Previously, Mr. Wiley served as a member of the Advisory Board of certain Fidelity® funds (2018-2020), Chairman, President and CEO of Baker Hughes, Inc. (oilfield services, 2000-2004). Mr. Wiley also previously served as a member of the Board of Andeavor Corporation (independent oil refiner and marketer, 2005-2018), a member of the Board of Andeavor Logistics LP (natural resources logistics, 2015-2018) and a member of the Board of High Point Resources (exploration and production, 2005-2020).
+ The information includes the Trustee's principal occupation during the last five years and other information relating to the experience, attributes, and skills relevant to the Trustee's qualifications to serve as a Trustee, which led to the conclusion that the Trustee should serve as a Trustee for the fund.
Advisory Board Members and Officers:
Correspondence intended for a Member of the Advisory Board (if any) may be sent to Fidelity Investments, P.O. Box 55235, Boston, Massachusetts 02205-5235. Correspondence intended for an officer or Peter S. Lynch may be sent to Fidelity Investments, 245 Summer Street, Boston, Massachusetts 02210. Officers appear below in alphabetical order.
Name, Year of Birth; Principal Occupation
Peter S. Lynch (1944)
Year of Election or Appointment: 2003
Member of the Advisory Board
Mr. Lynch also serves as a Member of the Advisory Board of other Fidelity® funds. Mr. Lynch is Vice Chairman and a Director of Fidelity Management & Research Company LLC (investment adviser firm). In addition, Mr. Lynch serves as a Trustee of Boston College and as the Chairman of the Inner-City Scholarship Fund. Previously, Mr. Lynch served as Vice Chairman and a Director of FMR Co., Inc. (investment adviser firm) and on the Special Olympics International Board of Directors (1997-2006).
Elizabeth Paige Baumann (1968)
Year of Election or Appointment: 2017
Anti-Money Laundering (AML) Officer
Ms. Baumann also serves as AML Officer of other funds. She is Chief AML Officer (2012-present) and Senior Vice President (2014-present) of FMR LLC (diversified financial services company) and is an employee of Fidelity Investments. Previously, Ms. Baumann served as AML Officer of certain funds (2017-2019), as AML Officer of the funds (2012-2016), and Vice President (2007-2014) and Deputy Anti-Money Laundering Officer (2007-2012) of FMR LLC.
Craig S. Brown (1977)
Year of Election or Appointment: 2019
Assistant Treasurer
Mr. Brown also serves as Assistant Treasurer of other funds. Mr. Brown is an employee of Fidelity Investments (2013-present).
John J. Burke III (1964)
Year of Election or Appointment: 2018
Chief Financial Officer
Mr. Burke also serves as Chief Financial Officer of other funds. Mr. Burke serves as Head of Investment Operations for Fidelity Fund and Investment Operations (2018-present) and is an employee of Fidelity Investments (1998-present). Previously Mr. Burke served as head of Asset Management Investment Operations (2012-2018).
William C. Coffey (1969)
Year of Election or Appointment: 2019
Assistant Secretary
Mr. Coffey also serves as Assistant Secretary of other funds. He is Senior Vice President and Deputy General Counsel of FMR LLC (diversified financial services company, 2010-present), and is an employee of Fidelity Investments. Previously, Mr. Coffey served as Secretary and CLO of certain funds (2018-2019); CLO, Secretary, and Senior Vice President of Fidelity Management & Research Company and FMR Co., Inc. (investment adviser firms, 2018-2019); Secretary of Fidelity SelectCo, LLC and Fidelity Investments Money Management, Inc. (investment adviser firms, 2018-2019); CLO of Fidelity Management & Research (Hong Kong) Limited, FMR Investment Management (UK) Limited, and Fidelity Management & Research (Japan) Limited (investment adviser firms, 2018-2019); and Assistant Secretary of certain funds (2009-2018).
Timothy M. Cohen (1969)
Year of Election or Appointment: 2018
Vice President
Mr. Cohen also serves as Vice President of other funds. Mr. Cohen serves as Co-Head of Equity (2018-present), a Director of Fidelity Management & Research (Japan) Limited (investment adviser firm, 2016-present), and is an employee of Fidelity Investments. Previously, Mr. Cohen served as Executive Vice President of Fidelity SelectCo, LLC (2019), Head of Global Equity Research (2016-2018), Chief Investment Officer - Equity and a Director of Fidelity Management & Research (U.K.) Inc. (investment adviser firm, 2013-2015) and as a Director of Fidelity Management & Research (Hong Kong) Limited (investment adviser firm, 2017).
Jonathan Davis (1968)
Year of Election or Appointment: 2010
Assistant Treasurer
Mr. Davis also serves as Assistant Treasurer of other funds. Mr. Davis serves as Assistant Treasurer of FMR Capital, Inc. (2017-present) and is an employee of Fidelity Investments. Previously, Mr. Davis served as Vice President and Associate General Counsel of FMR LLC (diversified financial services company, 2003-2010).
Laura M. Del Prato (1964)
Year of Election or Appointment: 2018
Assistant Treasurer
Ms. Del Prato also serves as an officer of other funds. Ms. Del Prato is an employee of Fidelity Investments (2017-present). Previously, Ms. Del Prato served as President and Treasurer of The North Carolina Capital Management Trust: Cash Portfolio and Term Portfolio (2018-2020). Prior to joining Fidelity Investments, Ms. Del Prato served as a Managing Director and Treasurer of the JPMorgan Mutual Funds (2014-2017). Prior to JPMorgan, Ms. Del Prato served as a partner at Cohen Fund Audit Services (accounting firm, 2012-2013) and KPMG LLP (accounting firm, 2004-2012).
Colm A. Hogan (1973)
Year of Election or Appointment: 2020
Assistant Treasurer
Mr. Hogan also serves as an officer of other funds. Mr. Hogan serves as Assistant Treasurer of FMR Capital, Inc. (2017-present) and is an employee of Fidelity Investments (2005-present). Previously, Mr. Hogan served as Deputy Treasurer of certain Fidelity® funds (2016-2020) and Assistant Treasurer of certain Fidelity® funds (2016-2018).
Pamela R. Holding (1964)
Year of Election or Appointment: 2018
Vice President
Ms. Holding also serves as Vice President of other funds. Ms. Holding serves as Co-Head of Equity (2018-present) and is an employee of Fidelity Investments (2013-present). Previously, Ms. Holding served as Executive Vice President of Fidelity SelectCo, LLC (2019) and as Chief Investment Officer of Fidelity Institutional Asset Management (2013-2018).
Cynthia Lo Bessette (1969)
Year of Election or Appointment: 2019
Secretary and Chief Legal Officer (CLO)
Ms. Lo Bessette also serves as an officer of other funds. Ms. Lo Bessette serves as CLO, Secretary, and Senior Vice President of Fidelity Management & Research Company LLC (investment adviser firm, 2019-present); and CLO of Fidelity Management & Research (Hong Kong) Limited, FMR Investment Management (UK) Limited, and Fidelity Management & Research (Japan) Limited (investment adviser firms, 2019-present). She is a Senior Vice President and Deputy General Counsel of FMR LLC (diversified financial services company, 2019-present), and is an employee of Fidelity Investments. Previously, Ms. Lo Bessette served as CLO, Secretary, and Senior Vice President of FMR Co., Inc. (investment adviser firm, 2019); Secretary of Fidelity SelectCo, LLC and Fidelity Investments Money Management, Inc. (investment adviser firms, 2019). Prior to joining Fidelity Investments, Ms. Lo Bessette was Executive Vice President, General Counsel (2016-2019) and Senior Vice President, Deputy General Counsel (2015-2016) of OppenheimerFunds (investment management company) and Deputy Chief Legal Officer (2013-2015) of Jennison Associates LLC (investment adviser firm).
Chris Maher (1972)
Year of Election or Appointment: 2020
Deputy Treasurer
Mr. Maher also serves as an officer of other funds. Mr. Maher serves as Assistant Treasurer of FMR Capital, Inc. (2017-present), and is an employee of Fidelity Investments (2008-present). Previously, Mr. Maher served as Assistant Treasurer of certain funds (2013-2020); Vice President of Asset Management Compliance (2013), Vice President of the Program Management Group of FMR (investment adviser firm, 2010-2013), and Vice President of Valuation Oversight (2008-2010).
Jason P. Pogorelec (1975)
Year of Election or Appointment: 2020
Chief Compliance Officer
Mr. Pogorelec also serves as Chief Compliance Officer of other funds. Mr. Pogorelec is a senior Vice President of Asset Management Compliance for Fidelity Investments and is an employee of Fidelity Investments (2006-present). Previously, Mr. Pogorelec served as Vice President, Associate General Counsel for Fidelity Investments (2010-2020) and Assistant Secretary of certain Fidelity funds (2015-2020).
Stacie M. Smith (1974)
Year of Election or Appointment: 2016
President and Treasurer
Ms. Smith also serves as an officer of other funds. Ms. Smith serves as Assistant Treasurer of FMR Capital, Inc. (2017-present), is an employee of Fidelity Investments (2009-present), and has served in other fund officer roles. Prior to joining Fidelity Investments, Ms. Smith served as Senior Audit Manager of Ernst & Young LLP (accounting firm, 1996-2009). Previously, Ms. Smith served as Assistant Treasurer (2013-2019) and Deputy Treasurer (2013-2016) of certain Fidelity® funds.
Marc L. Spector (1972)
Year of Election or Appointment: 2016
Assistant Treasurer
Mr. Spector also serves as an officer of other funds. Mr. Spector serves as Assistant Treasurer of FMR Capital, Inc. (2017-present) and is an employee of Fidelity Investments (2016-present). Prior to joining Fidelity Investments, Mr. Spector served as Director at the Siegfried Group (accounting firm, 2013-2016), and prior to Siegfried Group as audit senior manager at Deloitte & Touche LLP (accounting firm, 2005-2013).
Jim Wegmann (1979)
Year of Election or Appointment: 2019
Assistant Treasurer
Mr. Wegmann also serves as Assistant Treasurer of other funds. Mr. Wegmann is an employee of Fidelity Investments (2011-present).
Shareholder Expense Example
As a shareholder, you incur two types of costs: (1) transaction costs, which may include sales charges (loads) on purchase payments or redemption proceeds, as applicable and (2) ongoing costs, which generally include management fees, distribution and/or service (12b-1) fees and other Fund expenses. This Example is intended to help you understand your ongoing costs (in dollars) of investing in a fund and to compare these costs with the ongoing costs of investing in other mutual funds.
The Example is based on an investment of $1,000 invested at the beginning of the period and held for the entire period (February 1, 2020 to July 31, 2020).
Actual Expenses
The first line of the accompanying table provides information about actual account values and actual expenses. You may use the information in this line, together with the amount you invested, to estimate the expenses that you paid over the period. Simply divide your account value by $1,000.00 (for example, an $8,600 account value divided by $1,000.00 = 8.6), then multiply the result by the number in the first line for a class/Fund under the heading entitled "Expenses Paid During Period" to estimate the expenses you paid on your account during this period. If any fund is a shareholder of any underlying mutual funds or exchange-traded funds (ETFs) (the Underlying Funds), such fund indirectly bears its proportional share of the expenses of the Underlying Funds in addition to the direct expenses incurred presented in the table. These fees and expenses are not included in the annualized expense ratio used to calculate the expense estimate in the table below.
Hypothetical Example for Comparison Purposes
The second line of the accompanying table provides information about hypothetical account values and hypothetical expenses based on the actual expense ratio and an assumed rate of return of 5% per year before expenses, which is not the actual return. The hypothetical account values and expenses may not be used to estimate the actual ending account balance or expenses you paid for the period. You may use this information to compare the ongoing costs of investing in the Fund and other funds. To do so, compare this 5% hypothetical example with the 5% hypothetical examples that appear in the shareholder reports of the other funds. If any fund is a shareholder of any Underlying Funds, such fund indirectly bears its proportional share of the expenses of the Underlying Funds in addition to the direct expenses as presented in the table. These fees and expenses are not included in the annualized expense ratio used to calculate the expense estimate in the table below.
Please note that the expenses shown in the table are meant to highlight your ongoing costs only and do not reflect any transaction costs. Therefore, the second line of the table is useful in comparing ongoing costs only, and will not help you determine the relative total costs of owning different funds. In addition, if these transactional costs were included, your costs would have been higher.
| | Annualized Expense Ratio-A | Beginning
Account Value
February 1, 2020 | Ending
Account Value
July 31, 2020 | Expenses Paid
During Period-B
February 1, 2020
to July 31, 2020 |
| Fidelity Real Estate Income Fund | | | | |
| Class A | 1.02% | | | |
| Actual | | $1,000.00 | $881.30 | $4.77 |
| Hypothetical-C | | $1,000.00 | $1,019.79 | $5.12 |
| Class M | 1.05% | | | |
| Actual | | $1,000.00 | $880.60 | $4.91 |
| Hypothetical-C | | $1,000.00 | $1,019.64 | $5.27 |
| Class C | 1.77% | | | |
| Actual | | $1,000.00 | $878.00 | $8.26 |
| Hypothetical-C | | $1,000.00 | $1,016.06 | $8.87 |
| Real Estate Income | .75% | | | |
| Actual | | $1,000.00 | $882.20 | $3.51 |
| Hypothetical-C | | $1,000.00 | $1,021.13 | $3.77 |
| Class I | .75% | | | |
| Actual | | $1,000.00 | $881.70 | $3.51 |
| Hypothetical-C | | $1,000.00 | $1,021.13 | $3.77 |
| Class Z | .62% | | | |
| Actual | | $1,000.00 | $882.80 | $2.90 |
| Hypothetical-C | | $1,000.00 | $1,021.78 | $3.12 |
A Annualized expense ratio reflects expenses net of applicable fee waivers.
B Expenses are equal to the annualized expense ratio, multiplied by the average account value over the period, multiplied by 182/ 366 (to reflect the one-half year period). The fees and expenses of any Underlying Funds are not included in each annualized expense ratio.
C 5% return per year before expenses
Distributions (Unaudited)
The fund hereby designates as a capital gain dividend with respect to the taxable year ended July 31, 2020, $27,687,406, or, if subsequently determined to be different, the net capital gain of such year.
A total of 0.42% of the dividends distributed during the fiscal year was derived from interest on U.S. Government securities which is generally exempt from state income tax.
The fund designates $45,220,793 of distributions paid during the period January 1, 2020 to July 31, 2020 as qualifying to be taxed as interest-related dividends for nonresident alien shareholders.
Class A designates 2%, 13%, and 6%; Class M designates 2%, 13%, and 6%; Class C designates 2%, 0%, and 8%; Real Estate Income designates 2%, 6%, and 6%; Class I designates 2%, 6%, and 6%; and Class Z designates 2%, 5%, and 6%; of the dividends distributed in December, March, and June, respectively during the fiscal year as qualifying for the dividends–received deduction for corporate shareholders.
Class A designates 1%, 4%, 12%, and 6%; Class M designates 1%, 4%, 12%, and 6%; Class C designates 1%, 4%, 0%, and 8%; Real Estate Income designates 1%, 4%, 6%, and 6%; Class I designates 1%, 4%, 6%, and 6%; and Class Z designates 1%, 3%, 5%, and 5%; of the dividends distributed in September, December, March, and June, respectively during the fiscal year as amounts which may be taken into account as a dividend for purposes of the maximum rate under section 1(h)(11) of the Internal Revenue Code.
Class A designates 89% and 49%; Class M designates 90% and 49%; Class C designates 100% and 57%; Real Estate Income designates 85% and 46%; Class I designates 85% and 46%; and Class Z designates 82% and 45%; of the dividends distributed in September and December, respectively during the fiscal year as a section 199A dividend.
The fund will notify shareholders in January 2021 of amounts for use in preparing 2020 income tax returns.
Liquidity Risk Management Program
The Securities and Exchange Commission adopted Rule 22e-4 under the Investment Company Act of 1940 (the Liquidity Rule) to promote effective liquidity risk management throughout the open-end investment company industry, thereby reducing the risk that funds will be unable to meet their redemption obligations and mitigating dilution of the interests of fund shareholders.
The Fund has adopted and implemented a liquidity risk management program pursuant to the Liquidity Rule (the Program) effective December 1, 2018. The Program is reasonably designed to assess and manage the Fund’s liquidity risk and to comply with the requirements of the Liquidity Rule. The Fund’s Board of Trustees (the Board) has designated the Fund’s investment adviser as administrator of the Program. The Fidelity advisers have established a Liquidity Risk Management Committee (the LRM Committee) to manage the Program for each of the Fidelity Funds. The LRM Committee monitors the adequacy and effectiveness of implementation of the Program and on a periodic basis assesses each Fund’s liquidity risk based on a variety of factors including (1) the Fund’s investment strategy, (2) portfolio liquidity and cash flow projections during normal and reasonably foreseeable stressed conditions, (3) shareholder redemptions, (4) borrowings and other funding sources and (5) in the case of exchange-traded funds, certain additional factors including the effect of the Fund’s prices and spreads, market participants, and basket compositions on the overall liquidity of the Fund’s portfolio, as applicable.
In accordance with the Program, each of the Fund’s portfolio investments is classified into one of four liquidity categories described below based on a determination of a reasonable expectation for how long it would take to convert the investment to cash (or sell or dispose of the investment) without significantly changing its market value.
- Highly liquid investments – cash or convertible to cash within three business days or less
- Moderately liquid investments – convertible to cash in three to seven calendar days
- Less liquid investments – can be sold or disposed of, but not settled, within seven calendar days
- Illiquid investments – cannot be sold or disposed of within seven calendar days
Liquidity classification determinations take into account a variety of factors including various market, trading and investment-specific considerations, as well as market depth, and generally utilize analysis from a third-party liquidity metrics service.
The Liquidity Rule places a 15% limit on a fund’s illiquid investments and requires funds that do not primarily hold assets that are highly liquid investments to determine and maintain a minimum percentage of the fund’s net assets to be invested in highly liquid investments (highly liquid investment minimum or HLIM). The Program includes provisions reasonably designed to comply with the 15% limit on illiquid investments and for determining, periodically reviewing and complying with the HLIM requirement as applicable.
At a recent meeting of the Fund’s Board of Trustees, the LRM Committee provided a written report to the Board pertaining to the operation, adequacy, and effectiveness of implementation of the Program for the annual period from December 1, 2018 through November 30, 2019. The report concluded that the Program has been implemented and is operating effectively and is reasonably designed to assess and manage the Fund’s liquidity risk.
Proxy Voting Results
A special meeting of shareholders was held on June 9, 2020. The results of votes taken among shareholders on the proposals before them are reported below. Each vote reported represents one dollar of net asset value held on the record date for the meeting.
PROPOSAL 1
To elect a Board of Trustees.
| | # of
Votes | % of
Votes |
| Dennis J. Dirks |
| Affirmative | 43,167,428,219.785 | 94.885 |
| Withheld | 2,327,070,930.034 | 5.115 |
| TOTAL | 45,494,499,149.820 | 100.000 |
| Donald F. Donahue |
| Affirmative | 43,161,668,935.467 | 94.872 |
| Withheld | 2,333,065,287.611 | 5.128 |
| TOTAL | 45,494,734,223.077 | 100.000 |
| Bettina Doulton |
| Affirmative | 43,304,465,213.969 | 95.186 |
| Withheld | 2,190,010,062.903 | 4.814 |
| TOTAL | 45,494,475,276.872 | 100.000 |
| Vicki L. Fuller |
| Affirmative | 43,380,442,631.493 | 95.353 |
| Withheld | 2,114,180,614.639 | 4.647 |
| TOTAL | 45,494,623,246.132 | 100.000 |
| Patricia L. Kampling |
| Affirmative | 43,128,008,796.761 | 94.798 |
| Withheld | 2,366,685,422.999 | 5.202 |
| TOTAL | 45,494,694,219.760 | 100.000 |
| Alan J. Lacy |
| Affirmative | 42,904,065,046.958 | 94.305 |
| Withheld | 2,590,717,567.229 | 5.695 |
| TOTAL | 45,494,782,614.187 | 100.000 |
| Ned C. Lautenbach |
| Affirmative | 42,802,778,827.017 | 94.083 |
| Withheld | 2,692,003,787.170 | 5.917 |
| TOTAL | 45,494,782,614.187 | 100.000 |
| Robert A. Lawrence |
| Affirmative | 42,971,258,294.203 | 94.453 |
| Withheld | 2,523,524,319.984 | 5.547 |
| TOTAL | 45,494,782,614.187 | 100.000 |
| Joseph Mauriello |
| Affirmative | 42,874,562,778.490 | 94.241 |
| Withheld | 2,620,171,874.731 | 5.759 |
| TOTAL | 45,494,734,653.220 | 100.000 |
| Cornelia M. Small |
| Affirmative | 43,029,040,988.063 | 94.580 |
| Withheld | 2,465,741,626.124 | 5.420 |
| TOTAL | 45,494,782,614.187 | 100.000 |
| Garnett A. Smith |
| Affirmative | 42,892,814,945.159 | 94.281 |
| Withheld | 2,601,967,669.028 | 5.719 |
| TOTAL | 45,494,782,614.187 | 100.000 |
| David M. Thomas |
| Affirmative | 42,936,080,036.111 | 94.376 |
| Withheld | 2,558,702,578.076 | 5.624 |
| TOTAL | 45,494,782,614.187 | 100.000 |
| Susan Tomasky |
| Affirmative | 43,147,934,105.796 | 94.842 |
| Withheld | 2,346,571,066.028 | 5.158 |
| TOTAL | 45,494,782,614.187 | 100.000 |
| Michael E. Wiley |
| Affirmative | 42,885,333,102.972 | 94.264 |
| Withheld | 2,609,449,511.215 | 5.736 |
| TOTAL | 45,494,782,614.187 | 100.000 |
PROPOSAL 2
To convert a fundamental investment policy to a non-fundamental investment policy.
| | # of
Votes | % of
Votes |
| Affirmative | 1,346,024,884.581 | 39.760 |
| Against | 675,038,375.817 | 19.940 |
| Abstain | 178,506,615.986 | 5.273 |
| Broker Non-Vote | 1,185,828,430.860 | 35.028 |
| TOTAL | 3,385,398,307.243 | 100.000 |
| Proposal 1 reflects trust wide proposal and voting results. |
| Proposal 2 was not approved by shareholders. |
REI-ANN-0920
1.788862.117
Fidelity® Series Real Estate Income Fund
Annual Report
July 31, 2020
See the inside front cover for important information about access to your fund’s shareholder reports.
Beginning on January 1, 2021, as permitted by regulations adopted by the Securities and Exchange Commission, paper copies of a fund’s shareholder reports will no longer be sent by mail, unless you specifically request paper copies of the reports from the fund or from your financial intermediary, such as a financial advisor, broker-dealer or bank. Instead, the reports will be made available on a website, and you will be notified by mail each time a report is posted and provided with a website link to access the report.
If you already elected to receive shareholder reports electronically, you will not be affected by this change and you need not take any action. You may elect to receive shareholder reports and other communications from a fund electronically, by contacting your financial intermediary. For Fidelity customers, visit Fidelity's web site or call Fidelity using the contact information listed below.
You may elect to receive all future reports in paper free of charge. If you wish to continue receiving paper copies of your shareholder reports, you may contact your financial intermediary or, if you are a Fidelity customer, visit Fidelity’s website, or call Fidelity at the applicable toll-free number listed below. Your election to receive reports in paper will apply to all funds held with the fund complex/your financial intermediary.
| Account Type | Website | Phone Number |
| Brokerage, Mutual Fund, or Annuity Contracts: | fidelity.com/mailpreferences | 1-800-343-3548 |
| Employer Provided Retirement Accounts: | netbenefits.fidelity.com/preferences (choose 'no' under Required Disclosures to continue to print) | 1-800-343-0860 |
| Advisor Sold Accounts Serviced Through Your Financial Intermediary: | Contact Your Financial Intermediary | Your Financial Intermediary's phone number |
| Advisor Sold Accounts Serviced by Fidelity: | institutional.fidelity.com | 1-877-208-0098 |
Contents
To view a fund's proxy voting guidelines and proxy voting record for the 12-month period ended June 30, visit http://www.fidelity.com/proxyvotingresults or visit the Securities and Exchange Commission's (SEC) web site at http://www.sec.gov.
You may also call 1-800-544-8544 to request a free copy of the proxy voting guidelines.
Standard & Poor's, S&P and S&P 500 are registered service marks of The McGraw-Hill Companies, Inc. and have been licensed for use by Fidelity Distributors Corporation.
Other third-party marks appearing herein are the property of their respective owners.
All other marks appearing herein are registered or unregistered trademarks or service marks of FMR LLC or an affiliated company. © 2020 FMR LLC. All rights reserved.
This report and the financial statements contained herein are submitted for the general information of the shareholders of the Fund. This report is not authorized for distribution to prospective investors in the Fund unless preceded or accompanied by an effective prospectus.
A fund files its complete schedule of portfolio holdings with the SEC for the first and third quarters of each fiscal year on Form N-PORT. Forms N-PORT are available on the SEC’s web site at http://www.sec.gov. A fund's Forms N-PORT may be reviewed and copied at the SEC’s Public Reference Room in Washington, DC. Information regarding the operation of the SEC's Public Reference Room may be obtained by calling 1-800-SEC-0330.
For a complete list of a fund's portfolio holdings, view the most recent holdings listing, semiannual report, or annual report on Fidelity's web site at http://www.fidelity.com, http://www.institutional.fidelity.com, or http://www.401k.com, as applicable.
NOT FDIC INSURED •MAY LOSE VALUE •NO BANK GUARANTEE
Neither the Fund nor Fidelity Distributors Corporation is a bank.
Note to Shareholders:
Early in 2020, the outbreak and spread of a new coronavirus emerged as a public health emergency that had a major influence on financial markets, primarily based on its impact on the global economy and the outlook for corporate earnings. The virus causes a respiratory disease known as COVID-19. On March 11, the World Health Organization declared the COVID-19 outbreak a pandemic, citing sustained risk of further global spread.
In the weeks following, as the crisis worsened, we witnessed an escalating human tragedy with wide-scale social and economic consequences from coronavirus-containment measures. The outbreak of COVID-19 prompted a number of measures to limit the spread, including travel and border restrictions, quarantines, and restrictions on large gatherings. In turn, these resulted in lower consumer activity, diminished demand for a wide range of products and services, disruption in manufacturing and supply chains, and – given the wide variability in outcomes regarding the outbreak – significant market uncertainty and volatility. Amid the turmoil, the U.S. government took unprecedented action – in concert with the U.S. Federal Reserve and central banks around the world – to help support consumers, businesses, and the broader economy, and to limit disruption to the financial system.
The situation continues to unfold, and the extent and duration of its impact on financial markets and the economy remain highly uncertain. Extreme events such as the coronavirus crisis are “exogenous shocks” that can have significant adverse effects on mutual funds and their investments. Although multiple asset classes may be affected by market disruption, the duration and impact may not be the same for all types of assets.
Fidelity is committed to helping you stay informed amid news about COVID-19 and during increased market volatility, and we’re taking extra steps to be responsive to customer needs. We encourage you to visit our websites, where we offer ongoing updates, commentary, and analysis on the markets and our funds.
Performance: The Bottom Line
Average annual total return reflects the change in the value of an investment, assuming reinvestment of distributions from dividend income and capital gains (the profits earned upon the sale of securities that have grown in value, if any) and assuming a constant rate of performance each year. The hypothetical investment and the average annual total returns do not reflect the deduction of taxes that a shareholder would pay on fund distributions or the redemption of fund shares. During periods of reimbursement by Fidelity, a fund’s total return will be greater than it would be had the reimbursement not occurred. How a fund did yesterday is no guarantee of how it will do tomorrow.
Average Annual Total Returns
| For the periods ended July 31, 2020 | Past 1 year | Past 5 years | Life of fundA |
| Fidelity® Series Real Estate Income Fund | (5.68)% | 4.33% | 6.80% |
A From October 20, 2011
$10,000 Over Life of Fund
Let's say hypothetically that $10,000 was invested in Fidelity® Series Real Estate Income Fund on October 20, 2011, when the fund started.
The chart shows how the value of your investment would have changed, and also shows how the S&P 500® Index performed over the same period.
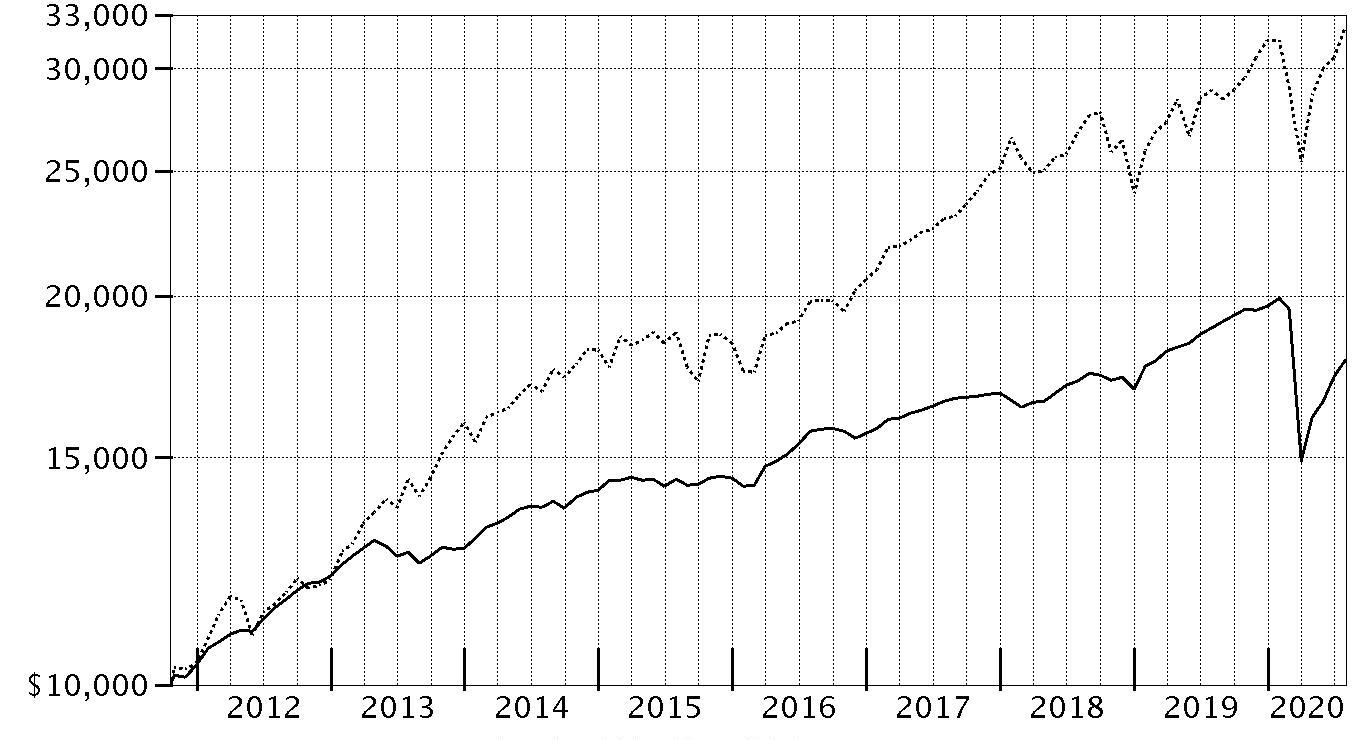
| Period Ending Values |
| $17,823 | Fidelity® Series Real Estate Income Fund |
| $32,309 | S&P 500® Index |
Management's Discussion of Fund Performance
Market Recap: For the first half of the fiscal year ending July 31, 2020, U.S. real estate securities experienced a generally favorable market environment. Conditions became tumultuous, however, about halfway through the first quarter of 2020 as the COVID-19 pandemic forced economic shutdowns around the country. This situation led to questions about whether certain real estate sectors – such as retail, hotels and offices – would experience long-term challenges as a result of concern about social gathering. Meanwhile, other property types whose business models remained intact despite the pandemic – such as industrial, data-center and mobile communication tower real estate investment trusts (REITs) – stood to benefit from similar worries. In this environment, real estate securities fell sharply between late February and mid-March. Then, as economies reopened and the U.S. Federal Reserve pursued aggressive economic stimulus, real estate securities bounced back sharply, regaining a portion of their value as the fiscal year proceeded. For the full 12-month period, REIT common stocks, as measured by the FTSE
® NAREIT
® All REITs Index, returned -6.38%. Real estate preferred stocks, as measured by the MSCI REIT Preferred Index, returned -4.86%. Real estate bonds, captured by the ICE BofAML
® US Real Estate Index – a market-capitalization-weighted measure of investment grade corporate debt in the domestic real estate sector – gained 8.71%, benefiting from the steep drop in rates.
Comments from Co-Portfolio Manager Mark Snyderman: For the fiscal year, the fund returned -5.68%, lagging the 1.90% advance of the Fidelity Series Real Estate Income Composite Index℠. The Composite index is a 40/50/10 blend of the MSCI REIT Preferred Index, the ICE BofA
® U.S. Real Estate Index and the FTSE
® NAREIT
® All REITs Index. Most of the fund's performance shortfall came in the first quarter of 2020, when some of our investments fell sharply along with volatile markets. Then, many of these same investments, which include some smaller-issue-size holdings that are less-widely owned, were slower to bounce back as markets recovered in the period's final months. Despite their underperformance, as of July 31 we remained optimistic about these positions' opportunity to recover. For the 12 months, our biggest performance challenge was on the bond side of the portfolio. Our commercial mortgage-backed securities, investment-grade real estate bonds and high-yield real estate bonds all lagged the roughly 9% gain of the ICE BofA index, due primarily to the lower duration of our holdings in an environment of sharply falling interest rates. Meanwhile, the fund's real estate common stock holdings trailed the FTSE NAREIT index by several percentage points, largely reflecting difficulty with certain mortgage real estate investment trust (REIT) and health care common stocks. We also lost ground among real estate preferred stocks, which returned -10% for the portfolio. This trailed the MSCI index by several percentage points, due primarily to challenges involving mortgage REIT preferreds.
The views expressed above reflect those of the portfolio manager(s) only through the end of the period as stated on the cover of this report and do not necessarily represent the views of Fidelity or any other person in the Fidelity organization. Any such views are subject to change at any time based upon market or other conditions and Fidelity disclaims any responsibility to update such views. These views may not be relied on as investment advice and, because investment decisions for a Fidelity fund are based on numerous factors, may not be relied on as an indication of trading intent on behalf of any Fidelity fund.
Investment Summary (Unaudited)
Top Five Stocks as of July 31, 2020
| | % of fund's net assets |
| American Tower Corp. | 1.6 |
| Equity Lifestyle Properties, Inc. | 1.4 |
| Annaly Capital Management, Inc. Series F, 6.95% | 1.1 |
| Two Harbors Investment Corp. Series B, 7.625% | 1.0 |
| Apartment Investment & Management Co. Class A | 1.0 |
| | 6.1 |
Top 5 Bonds as of July 31, 2020
| | % of fund's net assets |
| Senior Housing Properties Trust 4.75% 5/1/24 | 1.2 |
| Redwood Trust, Inc. 5.625% 7/15/24 | 1.1 |
| Kennedy-Wilson, Inc. 5.875% 4/1/24 | 1.1 |
| Howard Hughes Corp. 5.375% 3/15/25 | 0.9 |
| RWT Holdings, Inc. 5.75% 10/1/25 | 0.8 |
| | 5.1 |
Top Five REIT Sectors as of July 31, 2020
| | % of fund's net assets |
| REITs - Mortgage | 24.7 |
| REITs - Diversified | 10.3 |
| REITs - Health Care | 5.8 |
| REITs - Apartments | 4.4 |
| REITs - Management/Investment | 4.1 |
Asset Allocation (% of fund's net assets)
| As of July 31, 2020* |
| | Commons Stocks | 14.1% |
| | Preferred Stocks | 26.6% |
| | Bonds | 40.7% |
| | Convertible Securities | 9.5% |
| | Other Investments | 4.8% |
| | Short-Term Investments and Net Other Assets (Liabilities) | 4.3% |

* Foreign investments - 1.5%
Schedule of Investments July 31, 2020
Showing Percentage of Net Assets
| Common Stocks - 14.1% | | | |
| | | Shares | Value |
| FINANCIALS - 2.9% | | | |
| Mortgage Real Estate Investment Trusts - 2.9% | | | |
| AGNC Investment Corp. | | 452,200 | $6,149,920 |
| Anworth Mortgage Asset Corp. | | 39,712 | 71,879 |
| Broadmark Realty Capital, Inc. | | 131,700 | 1,214,274 |
| Capstead Mortgage Corp. | | 99,600 | 612,540 |
| Chimera Investment Corp. | | 112,100 | 1,007,779 |
| Colony NorthStar Credit Real Estate, Inc. | | 165,240 | 1,041,012 |
| Dynex Capital, Inc. | | 184,666 | 2,853,090 |
| Ellington Financial LLC | | 152,651 | 1,795,176 |
| Ellington Residential Mortgage REIT | | 45,300 | 500,565 |
| Great Ajax Corp. | | 225,246 | 1,941,621 |
| Hunt Companies Finance Trust, Inc. | | 23,108 | 51,069 |
| MFA Financial, Inc. | | 1,265,900 | 3,329,317 |
| New Residential Investment Corp. | | 643,600 | 5,103,748 |
| Redwood Trust, Inc. | | 100,500 | 716,565 |
| Two Harbors Investment Corp. | | 103,904 | 564,199 |
| | | | 26,952,754 |
| INDUSTRIALS - 0.1% | | | |
| Construction & Engineering - 0.1% | | | |
| Willscot Mobile Mini Holdings (a) | | 62,900 | 947,274 |
| REAL ESTATE - 11.1% | | | |
| Equity Real Estate Investment Trusts (REITs) - 11.1% | | | |
| Acadia Realty Trust (SBI) | | 296,600 | 3,571,064 |
| American Homes 4 Rent Class A | | 85,700 | 2,485,300 |
| American Tower Corp. | | 57,900 | 15,134,469 |
| Apartment Investment & Management Co. Class A | | 231,602 | 8,990,790 |
| AvalonBay Communities, Inc. | | 10,400 | 1,592,448 |
| Colony Capital, Inc. | | 570,699 | 1,095,742 |
| CoreSite Realty Corp. | | 3,800 | 490,390 |
| Crown Castle International Corp. | | 47,300 | 7,884,910 |
| Diversified Healthcare Trust (SBI) | | 118,500 | 461,558 |
| Easterly Government Properties, Inc. | | 78,600 | 1,921,770 |
| Equinix, Inc. | | 7,500 | 5,891,100 |
| Equity Lifestyle Properties, Inc. | | 185,900 | 12,700,688 |
| Equity Residential (SBI) | | 10,300 | 552,389 |
| Gaming & Leisure Properties | | 47,994 | 1,737,863 |
| Healthcare Trust of America, Inc. | | 86,550 | 2,389,646 |
| Invitation Homes, Inc. | | 44,900 | 1,338,918 |
| iStar Financial, Inc. | | 405,987 | 4,713,509 |
| Lexington Corporate Properties Trust | | 470,722 | 5,460,375 |
| Mid-America Apartment Communities, Inc. | | 66,714 | 7,951,642 |
| Monmouth Real Estate Investment Corp. Class A | | 162,995 | 2,352,018 |
| NexPoint Residential Trust, Inc. | | 16,100 | 615,503 |
| Public Storage | | 5,500 | 1,099,340 |
| Retail Value, Inc. | | 22,650 | 286,749 |
| Sabra Health Care REIT, Inc. | | 142,800 | 2,104,872 |
| Safety Income and Growth, Inc. | | 32,000 | 1,613,760 |
| SITE Centers Corp. | | 146,700 | 1,075,311 |
| Terreno Realty Corp. | | 11,880 | 721,829 |
| UMH Properties, Inc. | | 37,800 | 464,940 |
| Ventas, Inc. | | 106,155 | 4,072,106 |
| Washington REIT (SBI) | | 41,600 | 930,176 |
| Weyerhaeuser Co. | | 86,300 | 2,400,003 |
| | | | 104,101,178 |
| TOTAL COMMON STOCKS | | | |
| (Cost $115,063,495) | | | 132,001,206 |
|
| Preferred Stocks - 28.7% | | | |
| Convertible Preferred Stocks - 2.1% | | | |
| FINANCIALS - 1.0% | | | |
| Mortgage Real Estate Investment Trusts - 1.0% | | | |
| Great Ajax Corp. 7.25% | | 310,550 | 7,484,255 |
| ZAIS Financial Corp. 7.00% | | 73,475 | 1,689,925 |
| | | | 9,174,180 |
| REAL ESTATE - 1.1% | | | |
| Equity Real Estate Investment Trusts (REITs) - 1.0% | | | |
| Braemar Hotels & Resorts, Inc. 5.50% | | 18,883 | 214,889 |
| Lexington Corporate Properties Trust Series C, 6.50% | | 71,519 | 3,810,161 |
| QTS Realty Trust, Inc. 6.50% | | 8,475 | 1,347,569 |
| RLJ Lodging Trust Series A, 1.95% | | 38,950 | 858,069 |
| Wheeler REIT, Inc. 8.75% (a) | | 213,775 | 2,750,794 |
| | | | 8,981,482 |
| Real Estate Management & Development - 0.1% | | | |
| Landmark Infrastructure Partners LP 3 month U.S. LIBOR + 4.690% 6.856% (b)(c) | | 57,650 | 1,413,080 |
| TOTAL REAL ESTATE | | | 10,394,562 |
|
| TOTAL CONVERTIBLE PREFERRED STOCKS | | | 19,568,742 |
|
| Nonconvertible Preferred Stocks - 26.6% | | | |
| ENERGY - 0.4% | | | |
| Oil, Gas & Consumable Fuels - 0.4% | | | |
| DCP Midstream Partners LP: | | | |
| 7.95% (b) | | 36,975 | 604,911 |
| Series B, 7.875% (b) | | 34,150 | 547,083 |
| Enbridge, Inc.: | | | |
| Series 1 5 year U.S. Treasury Index + 3.140% 5.949% (b)(c) | | 99,425 | 1,666,363 |
| Series L 5 year U.S. Treasury Index + 3.150% 4.959% (b)(c) | | 19,600 | 286,160 |
| Energy Transfer Partners LP 7.60% (b) | | 54,425 | 1,037,885 |
| Global Partners LP 9.75% (b) | | 1,825 | 44,256 |
| | | | 4,186,658 |
| FINANCIALS - 16.3% | | | |
| Mortgage Real Estate Investment Trusts - 16.3% | | | |
| AG Mortgage Investment Trust, Inc.: | | | |
| 8.00% | | 144,509 | 2,119,499 |
| 8.25% | | 1,725 | 25,271 |
| Series C 8.00% (b) | | 103,493 | 1,524,452 |
| AGNC Investment Corp.: | | | |
| 6.125% (b) | | 144,800 | 3,188,496 |
| 6.875% (b) | | 130,650 | 2,963,142 |
| Series C, 7.00% (b) | | 319,899 | 7,546,417 |
| Series E 6.50% (b) | | 280,250 | 6,363,048 |
| Annaly Capital Management, Inc.: | | | |
| 6.75% (b) | | 163,400 | 3,697,742 |
| Series D, 7.50% | | 88,175 | 2,213,193 |
| Series F, 6.95% (b) | | 447,200 | 10,048,584 |
| Series G, 6.50% (b) | | 195,110 | 4,165,599 |
| Anworth Mortgage Asset Corp. Series A, 8.625% | | 111,413 | 2,607,064 |
| Arbor Realty Trust, Inc.: | | | |
| Series A, 8.25% | | 44,047 | 1,102,056 |
| Series B, 7.75% | | 42,675 | 1,024,200 |
| Series C, 8.50% | | 16,125 | 412,939 |
| Arlington Asset Investment Corp.: | | | |
| 6.625% | | 39,038 | 918,955 |
| 8.25% (b) | | 22,175 | 428,865 |
| Armour Residential REIT, Inc. Series C 7.00% | | 16,500 | 375,210 |
| Capstead Mortgage Corp. Series E, 7.50% | | 132,416 | 3,040,271 |
| Cherry Hill Mortgage Investment Corp.: | | | |
| 8.25% (b) | | 36,575 | 757,103 |
| Series A, 8.20% | | 64,250 | 1,466,860 |
| Chimera Investment Corp.: | | | |
| 8.00% (b) | | 180,700 | 3,637,491 |
| Series A, 8.00% | | 38,500 | 883,190 |
| Series B, 8.00% (b) | | 412,958 | 8,432,602 |
| Series C, 7.75% (b) | | 303,766 | 5,984,190 |
| Dynex Capital, Inc.: | | | |
| Series B, 7.625% | | 31,088 | 753,573 |
| Series C 6.90% (b) | | 143,400 | 3,269,520 |
| Ellington Financial LLC 6.75% (b) | | 83,222 | 1,691,903 |
| Exantas Capital Corp. 8.625% (b) | | 16,193 | 212,128 |
| Invesco Mortgage Capital, Inc.: | | | |
| 7.50% (b) | | 397,081 | 8,314,876 |
| Series A, 7.75% | | 31,526 | 721,945 |
| Series B, 7.75% (b) | | 236,491 | 5,023,069 |
| MFA Financial, Inc.: | | | |
| 6.50% (b) | | 183,900 | 3,317,556 |
| 8.00% | | 114,772 | 2,682,222 |
| Series B, 7.50% | | 195,649 | 4,186,889 |
| New Residential Investment Corp.: | | | |
| 7.125% (b) | | 253,336 | 5,140,187 |
| Series A 7.50% (b) | | 236,909 | 5,157,509 |
| Series C 6.375% (b) | | 86,946 | 1,638,932 |
| New York Mortgage Trust, Inc.: | | | |
| Series B, 7.75% | | 81,977 | 1,646,098 |
| Series C, 7.875% | | 121,233 | 2,437,996 |
| Series D, 8.00% (b) | | 78,000 | 1,532,700 |
| PennyMac Mortgage Investment Trust: | | | |
| 8.125% (b) | | 85,550 | 2,062,611 |
| Series B, 8.00% (b) | | 152,605 | 3,665,572 |
| Two Harbors Investment Corp.: | | | |
| 7.50% | | 118,883 | 2,569,062 |
| 7.75% | | 11,639 | 257,944 |
| Series A, 8.125% (b) | | 258,732 | 5,632,596 |
| Series B, 7.625% (b) | | 438,172 | 9,070,160 |
| Series C, 7.25% (b) | | 207,472 | 4,139,066 |
| ZAIS Financial Corp. Series C 6.20% | | 136,450 | 2,806,777 |
| | | | 152,857,330 |
| Real Estate Management & Development - 0.0% | | | |
| Brookfield Properties Corp. Series EE, 5.10% (b) | | 7,675 | 91,679 |
| TOTAL FINANCIALS | | | 152,949,009 |
| REAL ESTATE - 9.8% | | | |
| Equity Real Estate Investment Trusts (REITs) - 9.7% | | | |
| American Finance Trust, Inc. 7.50% | | 114,598 | 2,643,776 |
| American Homes 4 Rent: | | | |
| 6.25% | | 18,925 | 518,545 |
| Series D, 6.50% | | 47,325 | 1,238,022 |
| Series E, 6.35% | | 57,650 | 1,499,477 |
| Series F, 5.875% | | 47,683 | 1,255,017 |
| Series G, 5.875% | | 37,050 | 963,671 |
| Armada Hoffler Properties, Inc. 6.75% | | 25,750 | 712,503 |
| Ashford Hospitality Trust, Inc.: | | | |
| Series D, 8.45% | | 61,574 | 327,882 |
| Series F, 7.375% | | 95,700 | 444,048 |
| Series G, 7.375% | | 34,229 | 147,869 |
| Series H, 7.50% | | 35,575 | 157,366 |
| Series I, 7.50% | | 58,911 | 253,317 |
| Bluerock Residential Growth (REIT), Inc.: | | | |
| Series A, 8.25% | | 107,850 | 2,682,230 |
| Series C, 7.625% | | 44,175 | 1,056,856 |
| Series D, 7.125% | | 31,900 | 716,155 |
| Braemar Hotels & Resorts, Inc. Series D, 8.25% | | 35,150 | 500,888 |
| Cedar Realty Trust, Inc.: | | | |
| Series B, 7.25% | | 40,856 | 928,657 |
| Series C, 6.50% | | 53,500 | 945,880 |
| City Office REIT, Inc. Series A, 6.625% | | 27,525 | 619,313 |
| Colony Capital, Inc.: | | | |
| Series G, 7.50% | | 116,671 | 2,356,754 |
| Series H, 7.125% | | 187,112 | 3,740,369 |
| Series I, 7.15% | | 205,785 | 4,037,502 |
| Series J, 7.15% | | 277,243 | 5,453,370 |
| Digital Realty Trust, Inc.: | | | |
| Series C, 6.625% | | 16,950 | 451,209 |
| Series G, 5.875% | | 28,720 | 734,083 |
| Farmland Partners, Inc. Series B, 6.00% | | 117,050 | 2,785,790 |
| Gladstone Commercial Corp.: | | | |
| 6.625% | | 41,125 | 995,698 |
| Series D, 7.00% | | 107,225 | 2,644,169 |
| Gladstone Land Corp. Series A, 6.375% | | 11,725 | 305,584 |
| Global Medical REIT, Inc. Series A, 7.50% | | 27,461 | 693,143 |
| Global Net Lease, Inc.: | | | |
| Series A, 7.25% | | 129,625 | 3,205,328 |
| Series B 6.875% | | 47,200 | 1,109,200 |
| Government Properties Income Trust 5.875% | | 39,775 | 997,557 |
| Healthcare Trust, Inc. Series A 7.375% | | 24,500 | 514,255 |
| Hersha Hospitality Trust: | | | |
| Series C, 6.875% | | 550 | 6,078 |
| Series D, 6.50% | | 42,250 | 455,033 |
| Investors Real Estate Trust Series C, 6.625% | | 57,700 | 1,501,931 |
| iStar Financial, Inc.: | | | |
| Series D, 8.00% | | 66,892 | 1,689,023 |
| Series G, 7.65% | | 103,167 | 2,476,008 |
| Series I, 7.50% | | 78,745 | 1,890,667 |
| Jernigan Capital, Inc. Series B, 7.00% | | 50,892 | 1,200,542 |
| Kimco Realty Corp. Series M, 5.25% | | 22,400 | 551,040 |
| Monmouth Real Estate Investment Corp. Series C, 6.125% | | 99,636 | 2,519,784 |
| National Storage Affiliates Trust Series A, 6.00% | | 12,325 | 330,803 |
| Pebblebrook Hotel Trust: | | | |
| 6.30% | | 53,702 | 1,082,095 |
| 6.375% | | 53,792 | 1,074,011 |
| Series C, 6.50% | | 73,405 | 1,502,600 |
| Series D, 6.375% | | 55,189 | 1,129,167 |
| Pennsylvania (REIT): | | | |
| Series B, 7.375% | | 56,533 | 410,464 |
| Series C, 7.20% | | 9,575 | 60,897 |
| Series D, 6.875% | | 27,400 | 176,182 |
| Plymouth Industrial REIT, Inc. Series A, 7.50% | | 30,350 | 758,143 |
| Prologis (REIT), Inc. Series Q, 8.54% | | 16,850 | 1,243,362 |
| PS Business Parks, Inc. Series Z 4.875% | | 8,000 | 203,920 |
| Public Storage Series F, 5.15% | | 29,950 | 790,680 |
| QTS Realty Trust, Inc. Series A, 7.125% | | 32,825 | 892,725 |
| Rexford Industrial Realty, Inc.: | | | |
| Series A, 5.875% | | 26,500 | 674,955 |
| Series B, 5.875% | | 50,000 | 1,277,000 |
| Series C 5.625% | | 11,775 | 303,206 |
| Saul Centers, Inc.: | | | |
| Series D, 6.125% | | 15,958 | 367,832 |
| Series E 6.00% | | 13,475 | 307,634 |
| Senior Housing Properties Trust 5.625% | | 1,057 | 19,819 |
| Seritage Growth Properties Series A, 7.00% | | 1,050 | 13,650 |
| SITE Centers Corp. Series K, 6.25% | | 28,039 | 639,009 |
| Sotherly Hotels, Inc.: | | | |
| Series B, 8.00% | | 12,750 | 78,285 |
| Series C, 7.875% | | 19,300 | 116,958 |
| Spirit Realty Capital, Inc. Series A, 6.00% | | 16,575 | 417,524 |
| Stag Industrial, Inc. Series C, 6.875% | | 17,925 | 464,862 |
| Summit Hotel Properties, Inc.: | | | |
| Series D, 6.45% | | 42,350 | 766,959 |
| Series E, 6.25% | | 52,084 | 963,554 |
| Sunstone Hotel Investors, Inc.: | | | |
| Series E, 6.95% | | 8,475 | 203,400 |
| Series F, 6.45% | | 16,950 | 395,105 |
| Taubman Centers, Inc. Series K, 6.25% | | 21,311 | 460,104 |
| UMH Properties, Inc.: | | | |
| Series B, 8.00% | | 154,275 | 3,944,812 |
| Series C, 6.75% | | 78,695 | 1,928,028 |
| Series D, 6.375% | | 49,775 | 1,199,578 |
| Urstadt Biddle Properties, Inc.: | | | |
| Series H, 6.25% | | 51,175 | 1,169,861 |
| Series K 5.875% | | 28,775 | 618,375 |
| VEREIT, Inc. Series F, 6.70% | | 160,311 | 4,128,008 |
| Washington Prime Group, Inc.: | | | |
| Series H, 7.50% | | 51,689 | 389,735 |
| Series I, 6.875% | | 12,908 | 92,939 |
| | | | 90,521,830 |
| Real Estate Management & Development - 0.1% | | | |
| Brookfield Property Partners LP: | | | |
| 5.75% | | 7,000 | 126,000 |
| 6.50% | | 5,875 | 117,089 |
| Landmark Infrastructure Partners LP Series B, 7.90% | | 22,125 | 508,875 |
| | | | 751,964 |
| TOTAL REAL ESTATE | | | 91,273,794 |
| UTILITIES - 0.1% | | | |
| Multi-Utilities - 0.1% | | | |
| Brookfield Infrastructure Partners LP Series 5, 5.35% (b) | | 35,775 | 619,909 |
|
| TOTAL NONCONVERTIBLE PREFERRED STOCKS | | | 249,029,370 |
|
| TOTAL PREFERRED STOCKS | | | |
| (Cost $301,673,401) | | | 268,598,112 |
| | | Principal Amount | Value |
|
| Corporate Bonds - 26.3% | | | |
| Convertible Bonds - 7.4% | | | |
| FINANCIALS - 6.9% | | | |
| Mortgage Real Estate Investment Trusts - 6.9% | | | |
| Arbor Realty Trust, Inc. 4.75% 11/1/22 (d) | | 4,274,000 | 3,982,918 |
| Blackstone Mortgage Trust, Inc. 4.75% 3/15/23 | | 1,644,000 | 1,536,189 |
| Chimera Investment Corp. 7% 4/1/23 | | 1,500,000 | 2,037,773 |
| Colony Financial, Inc. 5% 4/15/23 | | 3,687,000 | 3,392,040 |
| Granite Point Mortgage Trust, Inc.: | | | |
| 5.625% 12/1/22 (d) | | 2,696,000 | 2,129,840 |
| 6.375% 10/1/23 | | 1,901,000 | 1,418,621 |
| KKR Real Estate Finance Trust, Inc. 6.125% 5/15/23 | | 4,821,000 | 4,730,606 |
| MFA Financial, Inc. 6.25% 6/15/24 | | 4,363,000 | 3,964,876 |
| New York Mortgage Trust, Inc. 6.25% 1/15/22 | | 28,000 | 24,955 |
| PennyMac Corp. 5.5% 11/1/24 (d) | | 7,066,000 | 6,694,440 |
| Redwood Trust, Inc.: | | | |
| 4.75% 8/15/23 | | 2,555,000 | 2,265,336 |
| 5.625% 7/15/24 | | 11,945,000 | 10,337,706 |
| RWT Holdings, Inc. 5.75% 10/1/25 (d) | | 8,800,000 | 7,334,606 |
| Starwood Property Trust, Inc. 4.375% 4/1/23 | | 2,804,000 | 2,697,776 |
| Two Harbors Investment Corp. 6.25% 1/15/22 | | 4,844,000 | 4,789,505 |
| Western Asset Mortgage Capital Corp. 6.75% 10/1/22 | | 9,744,000 | 7,214,458 |
| | | | 64,551,645 |
| REAL ESTATE - 0.5% | | | |
| Equity Real Estate Investment Trusts (REITs) - 0.5% | | | |
| Colony Capital Operating Co. LLC 5.75% 7/15/25 (d) | | 2,040,000 | 2,358,279 |
| VEREIT, Inc. 3.75% 12/15/20 | | 2,660,000 | 2,659,574 |
| | | | 5,017,853 |
|
| TOTAL CONVERTIBLE BONDS | | | 69,569,498 |
|
| Nonconvertible Bonds - 18.9% | | | |
| CONSUMER DISCRETIONARY - 3.8% | | | |
| Hotels, Restaurants & Leisure - 0.3% | | | |
| Hilton Grand Vacations Borrower LLC/Hilton Grand Vacations Borrower, Inc. 6.125% 12/1/24 | | 460,000 | 464,600 |
| Marriott Ownership Resorts, Inc. 6.5% 9/15/26 | | 45,000 | 46,125 |
| Times Square Hotel Trust 8.528% 8/1/26 (d) | | 1,696,634 | 1,836,888 |
| | | | 2,347,613 |
| Household Durables - 3.5% | | | |
| Adams Homes, Inc. 7.5% 2/15/25 (d) | | 1,550,000 | 1,519,000 |
| Ashton Woods U.S.A. LLC/Ashton Woods Finance Co.: | | | |
| 6.75% 8/1/25 (d) | | 4,354,000 | 4,419,310 |
| 9.875% 4/1/27 (d) | | 3,780,000 | 4,082,400 |
| Beazer Homes U.S.A., Inc. 5.875% 10/15/27 | | 1,679,000 | 1,685,699 |
| Brookfield Residential Properties, Inc./Brookfield Residential U.S. Corp.: | | | |
| 4.875% 2/15/30 (d) | | 255,000 | 231,413 |
| 6.25% 9/15/27 (d) | | 1,467,000 | 1,467,000 |
| Century Communities, Inc.: | | | |
| 5.875% 7/15/25 | | 1,518,000 | 1,562,143 |
| 6.75% 6/1/27 | | 1,770,000 | 1,890,254 |
| LGI Homes, Inc. 6.875% 7/15/26 (d) | | 4,133,000 | 4,401,645 |
| M/I Homes, Inc. 5.625% 8/1/25 | | 1,518,000 | 1,578,720 |
| Meritage Homes Corp.: | | | |
| 5.125% 6/6/27 | | 941,000 | 1,006,870 |
| 6% 6/1/25 | | 2,130,000 | 2,444,814 |
| New Home Co. LLC 7.25% 4/1/22 | | 2,698,000 | 2,549,610 |
| Picasso Finance Sub, Inc. 6.125% 6/15/25 (d) | | 800,000 | 850,000 |
| TRI Pointe Homes, Inc.: | | | |
| 5.25% 6/1/27 | | 2,042,000 | 2,144,100 |
| 5.875% 6/15/24 | | 1,250,000 | 1,347,138 |
| | | | 33,180,116 |
| TOTAL CONSUMER DISCRETIONARY | | | 35,527,729 |
| ENERGY - 0.4% | | | |
| Oil, Gas & Consumable Fuels - 0.4% | | | |
| EG Global Finance PLC: | | | |
| 6.75% 2/7/25 (d) | | 1,250,000 | 1,306,000 |
| 8.5% 10/30/25 (d) | | 640,000 | 699,149 |
| Global Partners LP/GLP Finance Corp.: | | | |
| 7% 6/15/23 | | 45,000 | 44,334 |
| 7% 8/1/27 | | 2,045,000 | 1,978,538 |
| | | | 4,028,021 |
| FINANCIALS - 0.6% | | | |
| Diversified Financial Services - 0.6% | | | |
| Brixmor Operating Partnership LP 3.85% 2/1/25 | | 1,753,000 | 1,839,277 |
| Five Point Operation Co. LP 7.875% 11/15/25 (d) | | 3,734,000 | 3,608,052 |
| | | | 5,447,329 |
| Mortgage Real Estate Investment Trusts - 0.0% | | | |
| Starwood Property Trust, Inc. 4.75% 3/15/25 | | 412,000 | 396,550 |
| TOTAL FINANCIALS | | | 5,843,879 |
| HEALTH CARE - 1.0% | | | |
| Health Care Providers & Services - 1.0% | | | |
| Sabra Health Care LP: | | | |
| 3.9% 10/15/29 | | 1,011,000 | 954,958 |
| 4.8% 6/1/24 | | 1,267,000 | 1,284,874 |
| 5.125% 8/15/26 | | 6,615,000 | 7,040,900 |
| | | | 9,280,732 |
| INDUSTRIALS - 0.3% | | | |
| Building Products - 0.3% | | | |
| Shea Homes Ltd. Partnership/Corp.: | | | |
| 4.75% 2/15/28 (d) | | 695,000 | 729,159 |
| 6.125% 4/1/25 (d) | | 1,446,000 | 1,489,380 |
| | | | 2,218,539 |
| Trading Companies & Distributors - 0.0% | | | |
| Williams Scotsman International, Inc. 6.875% 8/15/23 (d) | | 134,000 | 138,383 |
| TOTAL INDUSTRIALS | | | 2,356,922 |
| REAL ESTATE - 12.8% | | | |
| Equity Real Estate Investment Trusts (REITs) - 8.7% | | | |
| American Homes 4 Rent LP 4.25% 2/15/28 | | 2,000,000 | 2,227,511 |
| ARC Properties Operating Partnership LP 4.6% 2/6/24 | | 1,757,000 | 1,889,775 |
| CBL & Associates LP: | | | |
| 4.6% 10/15/24 | | 5,700,000 | 1,368,000 |
| 5.25% 12/1/23 | | 3,629,000 | 870,960 |
| 5.95% 12/15/26 | | 2,551,000 | 593,108 |
| CTR Partnership LP/CareTrust Capital Corp. 5.25% 6/1/25 | | 1,428,000 | 1,449,720 |
| ESH Hospitality, Inc. 5.25% 5/1/25 (d) | | 2,346,000 | 2,396,392 |
| GLP Capital LP/GLP Financing II, Inc.: | | | |
| 4% 1/15/31 | | 500,000 | 518,875 |
| 5.25% 6/1/25 | | 2,375,000 | 2,558,113 |
| Government Properties Income Trust 4.25% 5/15/24 | | 946,000 | 947,348 |
| HCP, Inc. 4% 6/1/25 | | 2,011,000 | 2,248,293 |
| Healthcare Realty Trust, Inc. 3.75% 4/15/23 | | 978,000 | 1,030,337 |
| Hospitality Properties Trust: | | | |
| 4.65% 3/15/24 | | 1,556,000 | 1,423,740 |
| 5% 8/15/22 | | 859,000 | 848,117 |
| 7.5% 9/15/25 | | 1,480,000 | 1,569,157 |
| iStar Financial, Inc.: | | | |
| 4.25% 8/1/25 | | 3,200,000 | 3,076,000 |
| 4.75% 10/1/24 | | 7,120,000 | 7,031,000 |
| 5.25% 9/15/22 | | 2,843,000 | 2,843,000 |
| Lexington Corporate Properties Trust: | | | |
| 4.25% 6/15/23 | | 2,500,000 | 2,541,853 |
| 4.4% 6/15/24 | | 409,000 | 419,060 |
| MPT Operating Partnership LP/MPT Finance Corp.: | | | |
| 4.625% 8/1/29 | | 1,506,000 | 1,591,179 |
| 5% 10/15/27 | | 4,237,000 | 4,544,183 |
| 5.25% 8/1/26 | | 1,466,000 | 1,539,300 |
| Omega Healthcare Investors, Inc.: | | | |
| 4.5% 4/1/27 | | 483,000 | 512,219 |
| 4.75% 1/15/28 | | 1,616,000 | 1,761,206 |
| 4.95% 4/1/24 | | 659,000 | 699,099 |
| 5.25% 1/15/26 | | 22,000 | 24,115 |
| Select Income REIT: | | | |
| 4.15% 2/1/22 | | 2,117,000 | 2,124,643 |
| 4.5% 2/1/25 | | 3,695,000 | 3,714,839 |
| Senior Housing Properties Trust: | | | |
| 4.75% 5/1/24 | | 12,480,000 | 11,421,943 |
| 4.75% 2/15/28 | | 5,067,000 | 4,411,594 |
| 6.75% 12/15/21 | | 2,090,000 | 2,107,599 |
| 9.75% 6/15/25 | | 2,000,000 | 2,207,500 |
| SITE Centers Corp. 3.625% 2/1/25 | | 114,000 | 116,469 |
| Uniti Group, Inc. 7.875% 2/15/25 (d) | | 1,000,000 | 1,052,500 |
| VEREIT Operating Partnership LP: | | | |
| 3.1% 12/15/29 | | 1,000,000 | 1,011,111 |
| 4.875% 6/1/26 | | 1,593,000 | 1,777,572 |
| VICI Properties, Inc.: | | | |
| 4.125% 8/15/30 (d) | | 975,000 | 986,700 |
| 4.625% 12/1/29 (d) | | 1,095,000 | 1,152,488 |
| WP Carey, Inc.: | | | |
| 4% 2/1/25 | | 422,000 | 453,193 |
| 4.25% 10/1/26 | | 459,000 | 515,814 |
| | | | 81,575,625 |
| Real Estate Management & Development - 4.1% | | | |
| DTZ U.S. Borrower LLC 6.75% 5/15/28 (d) | | 875,000 | 936,250 |
| Forestar Group, Inc. 8% 4/15/24 (d) | | 2,784,000 | 2,986,842 |
| Greystar Real Estate Partners 5.75% 12/1/25 (d) | | 3,430,000 | 3,455,725 |
| Howard Hughes Corp. 5.375% 3/15/25 (d) | | 7,940,000 | 8,019,956 |
| Kennedy-Wilson, Inc. 5.875% 4/1/24 | | 10,281,000 | 10,319,554 |
| Mack-Cali Realty LP: | | | |
| 3.15% 5/15/23 | | 5,000 | 4,488 |
| 4.5% 4/18/22 | | 91,000 | 88,443 |
| Mattamy Group Corp.: | | | |
| 4.625% 3/1/30 (d) | | 2,735,000 | 2,776,025 |
| 5.25% 12/15/27 (d) | | 2,855,000 | 2,962,063 |
| Mid-America Apartments LP: | | | |
| 3.75% 6/15/24 | | 356,000 | 387,259 |
| 4.3% 10/15/23 | | 765,000 | 837,397 |
| Taylor Morrison Communities, Inc./Monarch Communities, Inc.: | | | |
| 5.625% 3/1/24 (d) | | 806,000 | 858,390 |
| 5.875% 1/31/25 (d) | | 443,000 | 456,290 |
| 5.875% 6/15/27 (d) | | 202,000 | 223,210 |
| 6% 9/1/23 (d) | | 13,000 | 13,390 |
| 6.625% 7/15/27 (d) | | 1,427,000 | 1,555,430 |
| Washington Prime Group LP 6.45% 8/15/24 | | 5,316,000 | 2,086,530 |
| | | | 37,967,242 |
| TOTAL REAL ESTATE | | | 119,542,867 |
|
| TOTAL NONCONVERTIBLE BONDS | | | 176,580,150 |
|
| TOTAL CORPORATE BONDS | | | |
| (Cost $258,292,214) | | | 246,149,648 |
|
| Asset-Backed Securities - 3.2% | | | |
| American Homes 4 Rent: | | | |
| Series 2014-SFR3 Class E, 6.418% 12/17/36 (d) | | 1,841,000 | 2,060,930 |
| Series 2015-SFR2: | | | |
| Class E, 6.07% 10/17/52 (d) | | 1,624,000 | 1,824,964 |
| Class XS, 0% 10/17/52 (b)(d)(e)(f) | | 918,691 | 9 |
| Conseco Finance Securitizations Corp.: | | | |
| Series 2002-1 Class M2, 9.546% 12/1/33 | | 1,216,000 | 1,256,819 |
| Series 2002-2 Class M2, 9.163% 3/1/33 | | 1,622,778 | 1,527,419 |
| Deutsche Financial Capital Securitization LLC Series 1997-I Class M, 7.275% 9/15/27 | | 15,082 | 15,057 |
| GPMT Ltd. Series 2019-FL2 Class D, 1 month U.S. LIBOR + 2.950% 3.1299% 2/22/36 (b)(c)(d) | | 358,000 | 330,069 |
| Green Tree Financial Corp.: | | | |
| Series 1996-4 Class M1, 7.75% 6/15/27 (b) | | 6,471 | 6,516 |
| Series 1997-3 Class M1, 7.53% 3/15/28 | | 46,873 | 47,329 |
| Home Partners of America Credit Trust Series 2017-1 Class F, 1 month U.S. LIBOR + 3.530% 3.7199% 7/17/34 (b)(c)(d) | | 2,115,000 | 2,109,683 |
| Home Partners of America Trust Series 2018-1 Class F, 1 month U.S. LIBOR + 2.350% 2.5309% 7/17/37 (b)(c)(d) | | 604,000 | 578,536 |
| Invitation Homes Trust Series 2018-SFR2 Class F, 1 month U.S. LIBOR + 2.250% 2.6% 6/17/37 (b)(c)(d) | | 464,691 | 445,050 |
| Kref Ltd. Series 2018-FL1 Class D, 1 month U.S. LIBOR + 2.550% 2.7309% 6/15/36 (b)(c)(d) | | 440,000 | 411,179 |
| Lehman ABS Manufactured Housing Contract Trust Series 2001-B Class M2, 7.17% 4/15/40 | | 2,093,941 | 1,727,659 |
| Progress Residential Trust: | | | |
| Series 2017-SFR1 Class F, 5.35% 8/17/34 (d) | | 526,000 | 539,060 |
| Series 2017-SFR2 Class F, 4.836% 12/17/34 (d) | | 783,000 | 776,156 |
| Series 2018-SFR2 Class F, 4.953% 8/17/35 (d) | | 892,000 | 896,676 |
| Series 2018-SFR3 Class F, 5.368% 10/17/35 (d) | | 588,000 | 603,783 |
| Series 2019-SFR4 Class F, 3.684% 10/17/36 (d) | | 1,000,000 | 971,510 |
| Series 2020-SFR1 Class H, 5.268% 4/17/37 (d) | | 588,000 | 561,375 |
| Starwood Waypoint Homes Trust Series 2017-1: | | | |
| Class E, 1 month U.S. LIBOR + 2.600% 2.7748% 1/17/35 (b)(c)(d) | | 994,000 | 982,084 |
| Class F, 1 month U.S. LIBOR + 3.400% 3.5748% 1/17/35 (b)(c)(d) | | 2,274,000 | 2,249,695 |
| Tricon American Homes: | | | |
| Series 2016-SFR1 Class F, 5.769% 11/17/33 (d) | | 3,956,000 | 3,915,753 |
| Series 2017-SFR1 Class F, 5.151% 9/17/34 (d) | | 1,632,000 | 1,666,794 |
| Series 2017-SFR2 Class F, 5.104% 1/17/36 (d) | | 628,000 | 651,717 |
| Series 2018-SFR1 Class F, 4.96% 5/17/37 (d) | | 1,386,000 | 1,403,992 |
| VB-S1 Issuer LLC Series 2018-1A Class F, 5.25% 2/15/48 (d) | | 2,044,000 | 2,084,469 |
| TOTAL ASSET-BACKED SECURITIES | | | |
| (Cost $29,346,681) | | | 29,644,283 |
|
| Commercial Mortgage Securities - 18.6% | | | |
| BANK: | | | |
| Series 2017-BNK4 Class D, 3.357% 5/15/50 (d) | | 625,000 | 430,868 |
| Series 2017-BNK8 Class E, 2.8% 11/15/50 (d) | | 1,848,000 | 1,032,243 |
| Series 2018-BN12 Class D, 3% 5/15/61 (d) | | 318,000 | 206,659 |
| Series 2019-BN21 Class F, 2.6818% 10/17/52 (d) | | 1,953,000 | 867,718 |
| Barclays Commercial Mortgage Securities LLC Series 2015-STP: | | | |
| Class E, 4.2844% 9/10/28 (b)(d) | | 1,626,000 | 1,614,453 |
| Class F, 4.2844% 9/10/28 (b)(d) | | 800,000 | 793,883 |
| Benchmark Mortgage Trust: | | | |
| sequential payer Series 2019-B14: | | | |
| Class 225D, 3.2943% 12/15/62 (b)(d) | | 573,000 | 530,812 |
| Class 225E, 3.2943% 12/15/62 (b)(d) | | 859,000 | 749,257 |
| Series 2020-B18 Class AGNG, 4.534% 7/15/53 (d) | | 2,058,000 | 1,838,852 |
| BX Commercial Mortgage Trust: | | | |
| floater: | | | |
| Series 2018-BIOA Class F, 1 month U.S. LIBOR + 2.470% 2.6458% 3/15/37 (b)(c)(d) | | 2,000,000 | 1,916,196 |
| Series 2019-CALM Class E, 1 month U.S. LIBOR + 2.000% 2.1748% 11/25/32 (b)(c)(d) | | 1,071,000 | 1,019,043 |
| Series 2020-BXLP Class G, 1 month U.S. LIBOR + 2.500% 2.6748% 12/15/36 (b)(c)(d) | | 986,097 | 952,019 |
| Series 2020-VIVA: | | | |
| Class D, 3.667% 3/9/44 (b)(d) | | 1,505,000 | 1,371,826 |
| Class E, 3.667% 3/9/44 (b)(d) | | 968,000 | 814,134 |
| BX Trust: | | | |
| floater: | | | |
| Series 2018-IND:�� | | | |
| Class G, 1 month U.S. LIBOR + 2.050% 2.2248% 11/15/35 (b)(c)(d) | | 1,190,700 | 1,172,763 |
| Class H, 1 month U.S. LIBOR + 3.000% 3.1748% 11/15/35 (b)(c)(d) | | 1,157,800 | 1,124,046 |
| Series 2019-IMC Class G, 1 month U.S. LIBOR + 3.600% 3.7748% 4/15/34 (b)(c)(d) | | 819,000 | 614,289 |
| Series 2019-XL Class J, 1 month U.S. LIBOR + 2.650% 2.8248% 10/15/36 (b)(c)(d) | | 1,778,984 | 1,731,425 |
| Series 2019-OC11 Class E, 4.0755% 12/9/41 (b)(d) | | 4,330,000 | 3,913,729 |
| CALI Mortgage Trust Series 2019-101C Class F, 4.3244% 3/10/39 (b)(d) | | 651,000 | 588,131 |
| CAMB Commercial Mortgage Trust floater Series 2019-LIFE Class G, 1 month U.S. LIBOR + 3.250% 3.4248% 12/15/37 (b)(c)(d) | | 1,021,000 | 963,948 |
| CD Mortgage Trust Series 2017-CD3 Class D, 3.25% 2/10/50 (d) | | 2,226,000 | 1,619,573 |
| CGMS Commercial Mortgage Trust Series 2017-MDRB: | | | |
| Class D, 1 month U.S. LIBOR + 3.250% 3.4248% 7/15/30 (b)(c)(d) | | 69,000 | 62,498 |
| Class E, 1 month U.S. LIBOR + 3.870% 4.0463% 7/15/30 (b)(c)(d) | | 1,229,000 | 1,040,749 |
| CHC Commercial Mortgage Trust floater Series 2019-CHC Class F, 1 month U.S. LIBOR + 2.600% 2.783% 6/15/34 (b)(c)(d) | | 995,703 | 770,960 |
| Citigroup Commercial Mortgage Trust: | | | |
| Series 2013-GC15 Class D, 5.2129% 9/10/46 (b)(d) | | 2,496,000 | 2,266,910 |
| Series 2016-C3 Class D, 3% 11/15/49 (d) | | 2,990,000 | 1,801,612 |
| COMM Mortgage Trust: | | | |
| floater Series 2018-HCLV: | | | |
| Class F, 1 month U.S. LIBOR + 3.050% 3.2248% 9/15/33 (b)(c)(d) | | 735,000 | 551,434 |
| Class G, 1 month U.S. LIBOR + 5.050% 5.2311% 9/15/33 (b)(c)(d) | | 735,000 | 533,310 |
| sequential payer Series 2013-LC6 Class E, 3.5% 1/10/46 (d) | | 1,299,000 | 770,726 |
| Series 2012-CR1: | | | |
| Class C, 5.3196% 5/15/45 (b) | | 3,011,000 | 2,358,614 |
| Class D, 5.3196% 5/15/45 (b)(d) | | 1,917,000 | 1,263,696 |
| Class G, 2.462% 5/15/45 (d)(f) | | 1,133,000 | 150,856 |
| Series 2012-LC4 Class C, 5.536% 12/10/44 (b) | | 802,000 | 599,559 |
| Series 2013-CR10 Class D, 4.7894% 8/10/46 (b)(d) | | 1,756,000 | 1,610,653 |
| Series 2013-CR12 Class D, 5.0713% 10/10/46 (b)(d) | | 1,262,000 | 731,382 |
| Series 2013-LC6 Class D, 4.3181% 1/10/46 (b)(d) | | 2,732,000 | 1,864,609 |
| Series 2014-UBS2 Class D, 5.0026% 3/10/47 (b)(d) | | 537,000 | 372,540 |
| Series 2017-CD4 Class D, 3.3% 5/10/50 (d) | | 1,192,000 | 969,063 |
| Series 2019-CD4 Class C, 4.349% 5/10/50 (b) | | 1,006,000 | 973,735 |
| COMM Mortgage Trust pass-thru certificates Series 2005-LP5 Class F, 7.2048% 5/10/43 (b)(d) | | 153,956 | 153,855 |
| COMM Trust Series 2017-COR2 Class D, 3% 9/10/50 (d) | | 31,000 | 22,720 |
| Commercial Mortgage Trust pass-thru certificates Series 2012-CR2: | | | |
| Class D, 4.8308% 8/15/45 (b)(d) | | 836,000 | 700,621 |
| Class F, 4.25% 8/15/45 (d) | | 783,000 | 374,023 |
| Credit Suisse Mortgage Trust floater: | | | |
| Series 2019-ICE4 Class F, 1 month U.S. LIBOR + 2.650% 2.8248% 5/15/36 (b)(c)(d) | | 3,233,000 | 3,123,494 |
| Series 2019-SKLZ Class D, 1 month U.S. LIBOR + 3.600% 3.7748% 1/15/34 (b)(c)(d) | | 1,430,000 | 1,328,186 |
| CSAIL Commercial Mortgage Trust: | | | |
| Series 2017-C8 Class D, 4.4701% 6/15/50 (d) | | 1,766,000 | 1,429,652 |
| Series 2017-CX10 Class UESD, 4.2366% 10/15/32 (b)(d) | | 1,287,000 | 1,177,116 |
| Series 2017-CX9 Class D, 4.1508% 9/15/50 (b)(d) | | 461,000 | 306,773 |
| DBCCRE Mortgage Trust Series 2014-ARCP Class E, 4.9345% 1/10/34 (b)(d) | | 2,168,000 | 1,999,764 |
| DBGS Mortgage Trust Series 2018-C1 Class C, 4.6362% 10/15/51 (b) | | 1,000,000 | 1,001,103 |
| DBUBS Mortgage Trust: | | | |
| Series 2011-LC1A: | | | |
| Class E, 5.6866% 11/10/46 (b)(d) | | 2,902,000 | 2,815,452 |
| Class G, 4.652% 11/10/46 (d) | | 2,778,000 | 2,553,785 |
| Series 2011-LC3A Class D, 5.3349% 8/10/44 (b)(d)(f) | | 728,000 | 477,556 |
| Freddie Mac pass-thru certificates: | | | |
| Series K011 Class X3, 2.5736% 12/25/43 (b)(e) | | 5,084,000 | 10,818 |
| Series K012 Class X3, 2.249% 1/25/41 (b)(e) | | 3,032,079 | 10,890 |
| Series K013 Class X3, 2.8137% 1/25/43 (b)(e) | | 4,967,000 | 25,030 |
| GPMT Ltd. floater Series 2018-FL1 Class D, 1 month U.S. LIBOR + 2.950% 3.1299% 11/21/35 (b)(c)(d) | | 1,500,000 | 1,372,500 |
| GS Mortgage Securities Trust: | | | |
| floater Series 2018-RIVR Class G, 1 month U.S. LIBOR + 2.600% 2.7748% 7/15/35 (b)(c)(d) | | 669,000 | 505,338 |
| Series 2010-C2 Class D, 5.1787% 12/10/43 (b)(d) | | 2,000,000 | 1,976,904 |
| Series 2011-GC5: | | | |
| Class C, 5.3885% 8/10/44 (b)(d) | | 101,000 | 91,033 |
| Class D, 5.3885% 8/10/44 (b)(d) | | 759,236 | 576,552 |
| Class E, 5.3885% 8/10/44 (b)(d) | | 848,000 | 576,469 |
| Class F, 4.5% 8/10/44 (d) | | 677,000 | 368,974 |
| Series 2012-GC6: | | | |
| Class C, 5.6508% 1/10/45 (b)(d) | | 2,440,000 | 2,037,926 |
| Class D, 5.6508% 1/10/45 (b)(d) | | 1,891,000 | 1,237,635 |
| Class E, 5% 1/10/45 (b)(d) | | 2,889,000 | 1,612,535 |
| Series 2012-GCJ7 Class D, 5.7041% 5/10/45 (b)(d) | | 3,539,000 | 3,033,657 |
| Series 2012-GCJ9: | | | |
| Class D, 4.7403% 11/10/45 (b)(d) | | 1,569,000 | 1,378,867 |
| Class E, 4.7403% 11/10/45 (b)(d) | | 355,000 | 254,824 |
| Series 2013-GC14 Class D, 4.7441% 8/10/46 (b)(d) | | 339,000 | 251,950 |
| Series 2013-GC16: | | | |
| Class D, 5.3107% 11/10/46 (b)(d) | | 3,292,000 | 2,861,725 |
| Class F, 3.5% 11/10/46 (d) | | 1,510,000 | 937,870 |
| Series 2016-GS2 Class D, 2.753% 5/10/49 (d) | | 1,964,000 | 1,354,364 |
| Series 2016-REMZ Class MZB, 7.727% 2/10/21 (d) | | 5,857,000 | 5,668,210 |
| Series 2016-RENT: | | | |
| Class E, 4.0667% 2/10/29 (b)(d) | | 2,614,000 | 2,571,209 |
| Class F, 4.0667% 2/10/29 (b)(d) | | 4,029,000 | 3,887,383 |
| Hilton U.S.A. Trust: | | | |
| Series 2016-HHV Class F, 4.1935% 11/5/38 (b)(d) | | 1,460,000 | 1,257,631 |
| Series 2016-SFP Class F, 6.1552% 11/5/35 (d) | | 4,557,000 | 4,371,192 |
| IMT Trust Series 2017-APTS: | | | |
| Class EFX, 3.4966% 6/15/34 (b)(d) | | 1,693,000 | 1,489,273 |
| Class FFL, 1 month U.S. LIBOR + 2.850% 3.0248% 6/15/34 (b)(c)(d) | | 600,089 | 506,607 |
| Independence Plaza Trust Series 2018-INDP Class E, 4.996% 7/10/35 (d) | | 504,000 | 483,768 |
| Invitation Homes Trust floater: | | | |
| Series 2018-SFR3 Class F, 1 month U.S. LIBOR + 2.250% 2.5% 7/17/37 (b)(c)(d) | | 383,894 | 367,668 |
| Series 2018-SFR4 Class F, 1 month U.S. LIBOR + 2.200% 2.3809% 1/17/38 (b)(c)(d) | | 590,000 | 561,695 |
| JP Morgan Chase Commercial Mortgage Securities Trust floater Series 2018-LAQ: | | | |
| Class C, 1 month U.S. LIBOR + 1.600% 1.7748% 6/15/32 (b)(c)(d) | | 1,626,434 | 1,495,923 |
| Class E, 1 month U.S. LIBOR + 3.000% 3.35% 6/15/35 (b)(c)(d) | | 15,451 | 13,824 |
| JPMBB Commercial Mortgage Securities Trust: | | | |
| Series 2014-C23 Class UH5, 4.7094% 9/15/47 (d) | | 1,624,000 | 1,408,207 |
| Series 2014-C26 Class D, 3.8809% 1/15/48 (b)(d) | | 602,000 | 521,311 |
| JPMCC Commercial Mortgage Securities Trust Series 2016-JP4 Class D, 3.4224% 12/15/49 (b)(d) | | 1,924,000 | 1,350,882 |
| JPMDB Commercial Mortgage Securities Trust: | | | |
| Series 2016-C4 Class D, 3.0889% 12/15/49 (b)(d) | | 1,308,000 | 831,581 |
| Series 2018-C8 Class D, 3.2439% 6/15/51 (b)(d) | | 302,000 | 205,280 |
| JPMorgan Chase Commercial Mortgage Securities Corp. Series 2012-CBX: | | | |
| Class C, 5.1317% 6/15/45 (b) | | 1,291,000 | 1,176,925 |
| Class E, 5.1317% 6/15/45 (b)(d) | | 1,078,000 | 740,705 |
| Class G 4% 6/15/45 (d) | | 805,000 | 287,088 |
| JPMorgan Chase Commercial Mortgage Securities Trust: | | | |
| Series 2011-C3: | | | |
| Class E, 5.6691% 2/15/46 (b)(d) | | 3,467,000 | 1,309,330 |
| Class G, 4.409% 2/15/46 (b)(d) | | 1,680,000 | 381,637 |
| Class H, 4.409% 2/15/46 (b)(d)(f) | | 1,320,000 | 132,000 |
| Series 2011-C4 Class E, 5.4806% 7/15/46 (b)(d) | | 1,390,000 | 1,316,933 |
| Series 2013-LC11: | | | |
| Class D, 4.1673% 4/15/46 (b) | | 1,316,000 | 856,241 |
| Class F, 3.25% 4/15/46 (b)(d) | | 482,000 | 210,865 |
| Series 2014-DSTY Class E, 3.8046% 6/10/27 (b)(d)(f) | | 924,000 | 18,653 |
| Series 2018-AON Class F, 4.6132% 7/5/31 (b)(d) | | 961,000 | 928,341 |
| Morgan Stanley BAML Trust: | | | |
| Series 2012-C6 Class D, 4.6067% 11/15/45 (b)(d) | | 2,000,000 | 1,710,933 |
| Series 2012-C6, Class F, 4.6067% 11/15/45 (b)(d) | | 1,000,000 | 519,651 |
| Series 2013-C12 Class D, 4.7632% 10/15/46 (b)(d) | | 1,500,000 | 1,171,286 |
| Series 2013-C13: | | | |
| Class D, 4.9037% 11/15/46 (b)(d) | | 2,994,000 | 2,326,715 |
| Class E, 4.9037% 11/15/46 (b)(d) | | 659,000 | 423,677 |
| Series 2013-C7: | | | |
| Class D, 4.2372% 2/15/46 (b)(d) | | 764,000 | 466,018 |
| Class E, 4.2372% 2/15/46 (b)(d)(f) | | 1,501,000 | 870,524 |
| Series 2013-C9 Class C, 4.0335% 5/15/46 (b) | | 625,000 | 615,265 |
| Series 2016-C30 Class D, 3% 9/15/49 (d) | | 522,000 | 292,298 |
| Series 2016-C31 Class D, 3% 11/15/49 (b)(d) | | 1,517,000 | 864,227 |
| Morgan Stanley Capital I Trust: | | | |
| floater Series 2019-AGLN: | | | |
| Class F, 1 month U.S. LIBOR + 2.600% 2.7748% 3/15/34 (b)(c)(d) | | 45,000 | 35,597 |
| Class G, 1 month U.S. LIBOR + 3.150% 3.3248% 3/15/34 (b)(c)(d) | | 1,054,000 | 831,000 |
| sequential payer Series 2011-C1 Class G, 4.193% 9/15/47 (d) | | 1,500,000 | 1,352,204 |
| Series 1998-CF1 Class G, 7.35% 7/15/32 (b)(d) | | 90,000 | 91,773 |
| Series 2011-C2: | | | |
| Class D, 5.4782% 6/15/44 (b)(d) | | 2,382,000 | 1,646,984 |
| Class E, 5.4782% 6/15/44 (b)(d) | | 520,000 | 314,561 |
| Class F, 5.4782% 6/15/44 (b)(d) | | 1,467,000 | 667,308 |
| Class XB, 0.3249% 6/15/44 (b)(d)(e) | | 45,156,633 | 364,775 |
| Series 2011-C3: | | | |
| Class C, 5.2444% 7/15/49 (b)(d) | | 2,446,000 | 2,204,205 |
| Class D, 5.2444% 7/15/49 (b)(d) | | 83,000 | 68,859 |
| Class E, 5.2444% 7/15/49 (b)(d) | | 652,000 | 432,250 |
| Class F, 5.2444% 7/15/49 (b)(d) | | 636,000 | 310,018 |
| Class G, 5.2444% 7/15/49 (b)(d) | | 979,600 | 407,912 |
| Series 2012-C4 Class D, 5.4189% 3/15/45 (b)(d) | | 1,640,000 | 932,927 |
| Series 2015-MS1 Class D, 4.0312% 5/15/48(b)(d) | | 2,045,000 | 1,604,093 |
| Series 2015-UBS8 Class D, 3.18% 12/15/48 (d) | | 1,043,000 | 706,097 |
| Series 2016-BNK2 Class C, 3% 11/15/49 (d) | | 2,346,000 | 1,660,289 |
| Motel 6 Trust floater: | | | |
| Series 2017-M6MZ, Class M, 1 month U.S. LIBOR + 6.920% 7.1013% 8/15/24 (b)(c)(d) | | 869,480 | 676,191 |
| Series 2017-MTL6 Class C, 1 month U.S. LIBOR + 1.400% 1.5748% 8/15/34 (b)(c)(d) | | 751,091 | 719,167 |
| Series 2017-MTL6, Class F, 1 month U.S. LIBOR + 4.250% 4.4248% 8/15/34 (b)(c)(d) | | 1,990,071 | 1,790,408 |
| MSCCG Trust: | | | |
| floater Series 2018-SELF Class E, 1 month U.S. LIBOR + 2.150% 2.3248% 10/15/37 (b)(c)(d) | | 939,000 | 885,897 |
| Series 2016-SNR: | | | |
| Class D, 6.55% 11/15/34 (d) | | 2,588,146 | 2,542,837 |
| Class E, 6.8087% 11/15/34 (d) | | 1,854,700 | 1,695,576 |
| MSJP Commercial Securities Mortgage Trust Series 2015-HAUL Class E, 4.851% 9/5/47 (b)(d) | | 1,000,000 | 790,253 |
| Natixis Commercial Mortgage Securities Trust: | | | |
| floater Series 2018-FL1: | | | |
| Class WAN1, 1 month U.S. LIBOR + 2.750% 2.935% 6/15/35 (b)(c)(d) | | 315,000 | 283,843 |
| Class WAN2, 1 month U.S. LIBOR + 3.750% 3.935% 6/15/35 (b)(c)(d) | | 113,725 | 102,100 |
| Series 2019-1776 Class F, 4.2988% 10/15/36 (d) | | 1,894,500 | 1,752,123 |
| Progress Residential Trust Series 2019-SFR3 Class F, 3.867% 9/17/36 (d) | | 1,000,000 | 980,787 |
| Providence Place Group Ltd. Partnership Series 2000-C1 Class A2, 7.75% 7/20/28 (d) | | 1,009,386 | 1,186,785 |
| ReadyCap Commercial Mortgage Trust floater Series 2019-FL3 Class D, 1 month U.S. LIBOR + 2.900% 3.0716% 3/25/34 (b)(c)(d) | | 599,000 | 513,988 |
| SG Commercial Mortgage Securities Trust Series 2019-PREZ Class F, 3.5929% 9/15/39 (b)(d) | | 2,000,000 | 1,727,979 |
| UBS Commercial Mortgage Trust Series 2012-C1: | | | |
| Class D, 5.569% 5/10/45 (b)(d) | | 492,000 | 356,344 |
| Class E, 5% 5/10/45 (b)(d) | | 1,236,000 | 682,496 |
| Class F, 5% 5/10/45 (b)(d)(f) | | 399,000 | 80,724 |
| UBS-BAMLL Trust Series 12-WRM Class D, 4.238% 6/10/30 (b)(d)(f) | | 1,817,000 | 869,431 |
| UBS-Citigroup Commercial Mortgage Trust Series 2011-C1 Class B, 6.0503% 1/10/45 (b)(d) | | 34,000 | 34,785 |
| Wells Fargo Commercial Mortgage Trust: | | | |
| Series 2012-LC5: | | | |
| Class D, 4.7591% 10/15/45 (b)(d) | | 637,000 | 626,392 |
| Class E, 4.7591% 10/15/45 (b)(d) | | 1,539,000 | 1,263,660 |
| Class F, 4.7591% 10/15/45 (b)(d) | | 774,000 | 503,894 |
| Series 2016-BNK1 Class D, 3% 8/15/49 (d) | | 1,260,000 | 684,690 |
| Series 2016-C35 Class D, 3.142% 7/15/48 (d) | | 2,512,000 | 1,691,596 |
| Series 2016-NXS6 Class D, 3.059% 11/15/49 (d) | | 963,000 | 646,435 |
| WF-RBS Commercial Mortgage Trust: | | | |
| sequential payer Series 2011-C4I Class G, 5% 6/15/44 (f) | | 45,000 | 7,425 |
| Series 2011-C3: | | | |
| Class C, 5.335% 3/15/44 (d) | | 2,155,000 | 2,093,195 |
| Class D, 5.6804% 3/15/44 (b)(d) | | 3,352,000 | 1,561,630 |
| Class E, 5% 3/15/44 (d) | | 34,000 | 9,084 |
| Series 2011-C5: | | | |
| Class C, 5.6559% 11/15/44 (b)(d) | | 1,250,000 | 1,253,395 |
| Class E, 5.6559% 11/15/44 (b)(d) | | 903,000 | 724,342 |
| Class F, 5.25% 11/15/44 (b)(d) | | 2,000,000 | 1,348,024 |
| Class G, 5.25% 11/15/44 (b)(d) | | 1,000,000 | 633,903 |
| Series 2012-C7 Class D, 4.8113% 6/15/45 (b)(d) | | 620,000 | 342,307 |
| Series 2012-C8 Class E, 4.8839% 8/15/45 (b)(d) | | 557,000 | 470,136 |
| Series 2013-C11: | | | |
| Class D, 4.2565% 3/15/45 (b)(d) | | 65,000 | 55,900 |
| Class E, 4.2565% 3/15/45 (b)(d) | | 53,000 | 38,200 |
| Series 2013-C13 Class D, 4.14% 5/15/45 (b)(d) | | 45,000 | 40,433 |
| Series 2013-C16 Class D, 5.0208% 9/15/46 (b)(d) | | 715,000 | 421,122 |
| Series 2013-UBS1 Class D, 4.7365% 3/15/46 (b)(d) | | 910,000 | 792,657 |
| WP Glimcher Mall Trust Series 2015-WPG: | | | |
| Class PR1, 3.516% 6/5/35 (b)(d) | | 1,168,000 | 892,293 |
| Class PR2, 3.516% 6/5/35 (b)(d) | | 459,000 | 342,982 |
| TOTAL COMMERCIAL MORTGAGE SECURITIES | | | |
| (Cost $200,745,335) | | | 173,855,951 |
|
| Bank Loan Obligations - 4.8% | | | |
| COMMUNICATION SERVICES - 0.4% | | | |
| Wireless Telecommunication Services - 0.4% | | | |
| SBA Senior Finance II, LLC Tranche B, term loan 3 month U.S. LIBOR + 1.750% 1.92% 4/11/25 (b)(c)(g) | | 3,704,876 | 3,589,951 |
| CONSUMER DISCRETIONARY - 0.6% | | | |
| Diversified Consumer Services - 0.1% | | | |
| Airbnb, Inc. Tranche B 1LN, term loan 3 month U.S. LIBOR + 7.500% 8.5% 4/17/25 (b)(c)(g) | | 465,000 | 487,088 |
| Hotels, Restaurants & Leisure - 0.5% | | | |
| Caesars Resort Collection LLC Tranche B 1LN, term loan 3 month U.S. LIBOR + 2.750% 2.9111% 12/22/24 (b)(c)(g) | | 840,637 | 772,125 |
| LTF Merger Sub, Inc. Tranche B, term loan 3 month U.S. LIBOR + 2.750% 3.75% 6/10/22 (b)(c)(g) | | 725,419 | 652,638 |
| Playa Resorts Holding BV Tranche B, term loan 3 month U.S. LIBOR + 2.750% 3.75% 4/27/24 (b)(c)(g) | | 4,008,674 | 3,415,150 |
| | | | 4,839,913 |
|
| TOTAL CONSUMER DISCRETIONARY | | | 5,327,001 |
|
| ENERGY - 0.5% | | | |
| Energy Equipment & Services - 0.1% | | | |
| Kestrel Acquisition LLC Tranche B, term loan 3 month U.S. LIBOR + 4.250% 5.25% 6/1/25 (b)(c)(g) | | 1,470,000 | 1,289,925 |
| Oil, Gas & Consumable Fuels - 0.4% | | | |
| Hamilton Projs. Acquiror LLC Tranche B 1LN, term loan 3 month U.S. LIBOR + 4.750% 5.75% 6/17/27 (b)(c)(g) | | 3,360,000 | 3,340,042 |
|
| TOTAL ENERGY | | | 4,629,967 |
|
| FINANCIALS - 0.7% | | | |
| Capital Markets - 0.1% | | | |
| Blackstone CQP Holdco LP Tranche B, term loan 3 month U.S. LIBOR + 3.500% 3.8064% 9/30/24 (b)(c)(g) | | 992,481 | 963,739 |
| Diversified Financial Services - 0.5% | | | |
| Agellan Portfolio 9% 8/7/25 (b)(f)(g) | | 1,217,000 | 1,217,000 |
| Veritas-B Junior Mezz C LLC 10.48% 2/6/21 (b)(f)(g) | | 3,629,000 | 3,566,944 |
| | | | 4,783,944 |
| Thrifts & Mortgage Finance - 0.1% | | | |
| Ocwen Loan Servicing LLC Tranche B, term loan 3 month U.S. LIBOR + 6.000% 7% 5/15/22 (b)(c)(g) | | 907,808 | 882,090 |
|
| TOTAL FINANCIALS | | | 6,629,773 |
|
| INDUSTRIALS - 0.4% | | | |
| Commercial Services & Supplies - 0.4% | | | |
| Lineage Logistics Holdings, LLC. Tranche B, term loan 3 month U.S. LIBOR + 3.000% 4% 2/27/25 (b)(c)(g) | | 3,391,806 | 3,328,209 |
| INFORMATION TECHNOLOGY - 0.1% | | | |
| Electronic Equipment & Components - 0.1% | | | |
| Compass Power Generation LLC Tranche B 1LN, term loan 3 month U.S. LIBOR + 3.500% 4.5% 12/20/24 (b)(c)(g) | | 927,886 | 889,842 |
| REAL ESTATE - 2.1% | | | |
| Equity Real Estate Investment Trusts (REITs) - 0.9% | | | |
| CoreCivic, Inc. Tranche B 1LN, term loan 3 month U.S. LIBOR + 4.500% 5.5% 12/18/24 (b)(c)(g) | | 381,005 | 373,385 |
| ESH Hospitality, Inc. 1LN, term loan 3 month U.S. LIBOR + 2.000% 2.1611% 9/18/26 (b)(c)(g) | | 1,356,403 | 1,307,654 |
| Invitation Homes Operating Par Tranche B, term loan 3 month U.S. LIBOR + 1.700% 1.8663% 2/6/22 (b)(c)(g) | | 5,332,000 | 5,145,380 |
| iStar Financial, Inc. Tranche B 1LN, term loan 3 month U.S. LIBOR + 2.750% 2.9198% 6/28/23 (b)(c)(g) | | 2,003,869 | 1,948,762 |
| | | | 8,775,181 |
| Real Estate Management & Development - 1.2% | | | |
| Aragon Junior Mezzanine 1 month U.S. LIBOR + 6.000% 7.25% 1/15/25 (b)(c)(f)(g) | | 1,500,000 | 1,492,500 |
| DTZ U.S. Borrower LLC Tranche B 1LN, term loan 3 month U.S. LIBOR + 2.750% 2.9111% 8/21/25 (b)(c)(g) | | 4,736,040 | 4,516,999 |
| Lightstone Holdco LLC: | | | |
| Tranche B 1LN, term loan 3 month U.S. LIBOR + 3.750% 4.75% 1/30/24 (b)(c)(g) | | 1,856,919 | 1,571,418 |
| Tranche C 1LN, term loan 3 month U.S. LIBOR + 3.750% 4.75% 1/30/24 (b)(c)(g) | | 104,733 | 88,630 |
| VICI Properties, LLC Tranche B 1LN, term loan 3 month U.S. LIBOR + 1.750% 1.9256% 12/22/24 (b)(c)(g) | | 3,765,000 | 3,613,534 |
| | | | 11,283,081 |
|
| TOTAL REAL ESTATE | | | 20,058,262 |
|
| UTILITIES - 0.0% | | | |
| Electric Utilities - 0.0% | | | |
| Southeast Powergen LLC Tranche B, term loan 3 month U.S. LIBOR + 3.500% 4.5% 12/2/21 (b)(c)(g) | | 248,874 | 226,476 |
| TOTAL BANK LOAN OBLIGATIONS | | | |
| (Cost $46,652,166) | | | 44,679,481 |
| | | Shares | Value |
|
| Money Market Funds - 3.6% | | | |
| Fidelity Cash Central Fund 0.14% (h) | | | |
| (Cost $33,914,070) | | 33,910,913 | 33,921,087 |
| TOTAL INVESTMENT IN SECURITIES - 99.3% | | | |
| (Cost $985,687,362) | | | 928,849,768 |
| NET OTHER ASSETS (LIABILITIES) - 0.7% | | | 6,204,471 |
| NET ASSETS - 100% | | | $935,054,239 |
Percentages shown as 0.0% in the Schedule of Investments may reflect amounts less than 0.05%.
Legend
(a) Non-income producing
(b) Coupon rates for floating and adjustable rate securities reflect the rates in effect at period end.
(c) Coupon is indexed to a floating interest rate which may be multiplied by a specified factor and/or subject to caps or floors.
(d) Security exempt from registration under Rule 144A of the Securities Act of 1933. These securities may be resold in transactions exempt from registration, normally to qualified institutional buyers. At the end of the period, the value of these securities amounted to $270,393,343 or 28.9% of net assets.
(e) Security represents right to receive monthly interest payments on an underlying pool of mortgages or assets. Principal shown is the outstanding par amount of the pool as of the end of the period.
(f) Level 3 security
(g) Remaining maturities of bank loan obligations may be less than the stated maturities shown as a result of contractual or optional prepayments by the borrower. Such prepayments cannot be predicted with certainty.
(h) Affiliated fund that is generally available only to investment companies and other accounts managed by Fidelity Investments. The rate quoted is the annualized seven-day yield of the fund at period end. A complete unaudited listing of the fund's holdings as of its most recent quarter end is available upon request. In addition, each Fidelity Central Fund's financial statements, which are not covered by the Fund's Report of Independent Registered Public Accounting Firm, are available on the SEC's website or upon request.
Affiliated Central Funds
Information regarding fiscal year to date income earned by the Fund from investments in Fidelity Central Funds is as follows:
| Fund | Income earned |
| Fidelity Cash Central Fund | $519,749 |
| Total | $519,749 |
Amounts in the income column in the above table include any capital gain distributions from underlying funds, which are presented in the corresponding line-item in the Statement of Operations, if applicable.
Investment Valuation
The following is a summary of the inputs used, as of July 31, 2020, involving the Fund's assets and liabilities carried at fair value. The inputs or methodology used for valuing securities may not be an indication of the risk associated with investing in those securities. For more information on valuation inputs, and their aggregation into the levels used below, please refer to the Investment Valuation section in the accompanying Notes to Financial Statements.
| | Valuation Inputs at Reporting Date: |
| Description | Total | Level 1 | Level 2 | Level 3 |
| Investments in Securities: | | | | |
| Equities: | | | | |
| Energy | $4,186,658 | $4,186,658 | $-- | $-- |
| Financials | 189,075,943 | 179,901,763 | 9,174,180 | -- |
| Industrials | 947,274 | 947,274 | -- | -- |
| Real Estate | 205,769,534 | 195,374,972 | 10,394,562 | -- |
| Utilities | 619,909 | 619,909 | -- | -- |
| Corporate Bonds | 246,149,648 | -- | 246,149,648 | -- |
| Asset-Backed Securities | 29,644,283 | -- | 29,644,274 | 9 |
| Commercial Mortgage Securities | 173,855,951 | -- | 171,248,782 | 2,607,169 |
| Bank Loan Obligations | 44,679,481 | -- | 38,403,037 | 6,276,444 |
| Money Market Funds | 33,921,087 | 33,921,087 | -- | -- |
| Total Investments in Securities: | $928,849,768 | $414,951,663 | $505,014,483 | $8,883,622 |
The following is a reconciliation of Investments in Securities for which Level 3 inputs were used in determining value:
| Investments in Securities: | |
| Beginning Balance | $6,549,947 |
| Net Realized Gain (Loss) on Investment Securities | -- |
| Net Unrealized Gain (Loss) on Investment Securities | (3,947,964) |
| Cost of Purchases | 4,831,113 |
| Proceeds of Sales | -- |
| Amortization/Accretion | (107,732) |
| Transfers into Level 3 | 6,433,258 |
| Transfers out of Level 3 | (4,875,000) |
| Ending Balance | $8,883,622 |
| The change in unrealized gain (loss) for the period attributable to Level 3 securities held at July 31, 2020 | $(3,947,964) |
The information used in the above reconciliation represents fiscal year to date activity for any Investments in Securities identified as using Level 3 inputs at either the beginning or the end of the current fiscal period. Cost of purchases and proceeds of sales may include securities received and/or delivered through in-kind transactions. Transfers in or out of Level 3 represent the beginning value of any Security or Instrument where a change in the pricing level occurred from the beginning to the end of the period. The cost of purchases and the proceeds of sales may include securities received or delivered through corporate actions or exchanges. Realized and unrealized gains (losses) disclosed in the reconciliation{s} are included in Net Gain (Loss) on the Fund's Statement of Operations.
Other Information
The composition of credit quality ratings as a percentage of Total Net Assets is as follows (Unaudited):
| U.S. Government and U.S. Government Agency Obligations | 0.0% |
| AAA,AA,A | 1.5% |
| BBB | 6.9% |
| BB | 13.6% |
| B | 10.8% |
| CCC,CC,C | 2.9% |
| Not Rated | 17.2% |
| Equities | 42.8% |
| Short-Term Investments and Net Other Assets | 4.3% |
| | 100.0% |
We have used ratings from Moody's Investors Service, Inc. Where Moody's® ratings are not available, we have used S&P® ratings. All ratings are as of the date indicated and do not reflect subsequent changes.
See accompanying notes which are an integral part of the financial statements.
Financial Statements
Statement of Assets and Liabilities
| | | July 31, 2020 |
| Assets | | |
Investment in securities, at value — See accompanying schedule:
Unaffiliated issuers (cost $951,773,292) | $894,928,681 | |
| Fidelity Central Funds (cost $33,914,070) | 33,921,087 | |
| Total Investment in Securities (cost $985,687,362) | | $928,849,768 |
| Cash | | 1,847,905 |
| Receivable for investments sold | | 1,099,688 |
| Receivable for fund shares sold | | 439,417 |
| Dividends receivable | | 507,504 |
| Interest receivable | | 5,370,924 |
| Distributions receivable from Fidelity Central Funds | | 4,456 |
| Other receivables | | 51 |
| Total assets | | 938,119,713 |
| Liabilities | | |
| Payable for investments purchased | $2,390,762 | |
| Payable for fund shares redeemed | 667,887 | |
| Other payables and accrued expenses | 6,825 | |
| Total liabilities | | 3,065,474 |
| Net Assets | | $935,054,239 |
| Net Assets consist of: | | |
| Paid in capital | | $983,545,987 |
| Total accumulated earnings (loss) | | (48,491,748) |
| Net Assets | | $935,054,239 |
| Net Asset Value, offering price and redemption price per share ($935,054,239 ÷ 94,111,567 shares) | | $9.94 |
See accompanying notes which are an integral part of the financial statements.
Statement of Operations
| | | Year ended July 31, 2020 |
| Investment Income | | |
| Dividends | | $19,472,026 |
| Interest | | 32,260,950 |
| Income from Fidelity Central Funds | | 519,749 |
| Total income | | 52,252,725 |
| Expenses | | |
| Custodian fees and expenses | $23,317 | |
| Independent trustees' fees and expenses | 6,168 | |
| Commitment fee | 2,395 | |
| Miscellaneous | 62 | |
| Total expenses before reductions | 31,942 | |
| Expense reductions | (9,100) | |
| Total expenses after reductions | | 22,842 |
| Net investment income (loss) | | 52,229,883 |
| Realized and Unrealized Gain (Loss) | | |
| Net realized gain (loss) on: | | |
| Investment securities: | | |
| Unaffiliated issuers | 1,921,865 | |
| Fidelity Central Funds | (204) | |
| Foreign currency transactions | 213 | |
| Total net realized gain (loss) | | 1,921,874 |
| Change in net unrealized appreciation (depreciation) on: | | |
| Investment securities: | | |
| Unaffiliated issuers | (117,279,811) | |
| Fidelity Central Funds | 3,391 | |
| Total change in net unrealized appreciation (depreciation) | | (117,276,420) |
| Net gain (loss) | | (115,354,546) |
| Net increase (decrease) in net assets resulting from operations | | $(63,124,663) |
See accompanying notes which are an integral part of the financial statements.
Statement of Changes in Net Assets
| | Year ended July 31, 2020 | Year ended July 31, 2019 |
| Increase (Decrease) in Net Assets | | |
| Operations | | |
| Net investment income (loss) | $52,229,883 | $52,395,103 |
| Net realized gain (loss) | 1,921,874 | 10,804,891 |
| Change in net unrealized appreciation (depreciation) | (117,276,420) | 25,145,397 |
| Net increase (decrease) in net assets resulting from operations | (63,124,663) | 88,345,391 |
| Distributions to shareholders | (61,647,911) | (66,053,733) |
| Share transactions | | |
| Proceeds from sales of shares | 145,680,876 | 67,097,399 |
| Reinvestment of distributions | 61,647,911 | 66,053,733 |
| Cost of shares redeemed | (119,143,355) | (91,189,244) |
| Net increase (decrease) in net assets resulting from share transactions | 88,185,432 | 41,961,888 |
| Total increase (decrease) in net assets | (36,587,142) | 64,253,546 |
| Net Assets | | |
| Beginning of period | 971,641,381 | 907,387,835 |
| End of period | $935,054,239 | $971,641,381 |
| Other Information | | |
| Shares | | |
| Sold | 13,247,736 | 6,193,639 |
| Issued in reinvestment of distributions | 5,716,683 | 6,181,072 |
| Redeemed | (11,515,197) | (8,439,782) |
| Net increase (decrease) | 7,449,222 | 3,934,929 |
See accompanying notes which are an integral part of the financial statements.
Financial Highlights
Fidelity Series Real Estate Income Fund
| | | | | | |
| Years ended July 31, | 2020 | 2019 | 2018 | 2017 | 2016 |
| Selected Per–Share Data | | | | | |
| Net asset value, beginning of period | $11.21 | $10.97 | $11.34 | $11.43 | $11.13 |
| Income from Investment Operations | | | | | |
| Net investment income (loss)A | .56 | .61 | .59 | .55 | .52 |
| Net realized and unrealized gain (loss) | (1.16) | .42 | (.20) | .06 | .42 |
| Total from investment operations | (.60) | 1.03 | .39 | .61 | .94 |
| Distributions from net investment income | (.55) | (.62) | (.60) | (.52) | (.53) |
| Distributions from net realized gain | (.12) | (.17) | (.16) | (.18) | (.11) |
| Total distributions | (.67) | (.79) | (.76) | (.70) | (.64) |
| Net asset value, end of period | $9.94 | $11.21 | $10.97 | $11.34 | $11.43 |
| Total ReturnB | (5.68)% | 9.91% | 3.61% | 5.65% | 8.93% |
| Ratios to Average Net AssetsC,D | | | | | |
| Expenses before reductions | - %E | - %E | - %E | .63% | .77% |
| Expenses net of fee waivers, if any | - %E | - %E | - %E | .63% | .77% |
| Expenses net of all reductions | - %E | - %E | - %E | .63% | .77% |
| Net investment income (loss) | 5.36% | 5.67% | 5.36% | 4.89% | 4.81% |
| Supplemental Data | | | | | |
| Net assets, end of period (000 omitted) | $935,054 | $971,641 | $907,388 | $423,538 | $411,102 |
| Portfolio turnover rateF | 25%G | 16% | 27% | 24% | 24% |
A Calculated based on average shares outstanding during the period.
B Total returns would have been lower if certain expenses had not been reduced during the applicable periods shown.
C Fees and expenses of any underlying mutual funds or exchange-traded funds (ETFs) are not included in the Fund's expense ratio. The Fund indirectly bears its proportionate share of these expenses. For additional expense information related to investments in Fidelity Central Funds, please refer to the "Investments in Fidelity Central Funds" note found in the Notes to Financial Statements section of the most recent Annual or Semi-Annual report.
D Expense ratios reflect operating expenses of the Fund. Expenses before reductions do not reflect amounts reimbursed by the investment adviser or reductions from brokerage service arrangements or reductions from other expense offset arrangements and do not represent the amount paid by the Fund during periods when reimbursements or reductions occur. Expenses net of fee waivers reflect expenses after reimbursement by the investment adviser but prior to reductions from brokerage service arrangements or other expense offset arrangements. Expenses net of all reductions represent the net expenses paid by the Fund.
E Amount represents less than .005%.
F Amount does not include the portfolio activity of any underlying Fidelity Central Funds.
G Portfolio turnover rate excludes securities received or delivered in-kind.
See accompanying notes which are an integral part of the financial statements.
Notes to Financial Statements
For the period ended July 31, 2020
1. Organization.
Fidelity Series Real Estate Income Fund (the Fund) is a fund of Fidelity Securities Fund (the Trust) and is authorized to issue an unlimited number of shares. Shares are offered only to certain other Fidelity funds and Fidelity managed 529 plans. The Trust is registered under the Investment Company Act of 1940, as amended (the 1940 Act), as an open-end management investment company organized as a Massachusetts business trust.
Effective January 1, 2020:
Investment advisers Fidelity Investments Money Management, Inc., FMR Co., Inc., and Fidelity SelectCo, LLC, merged with and into Fidelity Management & Research Company. In connection with the merger transactions, the resulting, merged investment adviser was then redomiciled from Massachusetts to Delaware, changed its corporate structure from a corporation to a limited liability company, and changed its name to "Fidelity Management & Research Company LLC".
2. Investments in Fidelity Central Funds.
The Fund invests in Fidelity Central Funds, which are open-end investment companies generally available only to other investment companies and accounts managed by the investment adviser and its affiliates. The Fund's Schedule of Investments lists each of the Fidelity Central Funds held as of period end, if any, as an investment of the Fund, but does not include the underlying holdings of each Fidelity Central Fund. As an Investing Fund, the Fund indirectly bears its proportionate share of the expenses of the underlying Fidelity Central Funds.
The Money Market Central Funds seek preservation of capital and current income and are managed by the investment adviser. Annualized expenses of the Money Market Central Funds as of their most recent shareholder report date ranged from less than .005% to .01%.
A complete unaudited list of holdings for each Fidelity Central Fund is available upon request or at the Securities and Exchange Commission (the SEC) website at www.sec.gov. In addition, the financial statements of the Fidelity Central Funds, which are not covered by the Fund's Report of Independent Registered Public Accounting Firm, are available on the SEC website or upon request.
3. Significant Accounting Policies.
The Fund is an investment company and applies the accounting and reporting guidance of the Financial Accounting Standards Board (FASB) Accounting Standards Codification Topic 946 Financial Services – Investment Companies. The financial statements have been prepared in conformity with accounting principles generally accepted in the United States of America (GAAP), which require management to make certain estimates and assumptions at the date of the financial statements. Actual results could differ from those estimates. Subsequent events, if any, through the date that the financial statements were issued have been evaluated in the preparation of the financial statements. The following summarizes the significant accounting policies of the Fund:
Investment Valuation. Investments are valued as of 4:00 p.m. Eastern time on the last calendar day of the period. The Board of Trustees (the Board) has delegated the day to day responsibility for the valuation of the Fund's investments to the Fair Value Committee (the Committee) established by the Fund's investment adviser. In accordance with valuation policies and procedures approved by the Board, the Fund attempts to obtain prices from one or more third party pricing vendors or brokers to value its investments. When current market prices, quotations or currency exchange rates are not readily available or reliable, investments will be fair valued in good faith by the Committee, in accordance with procedures adopted by the Board. Factors used in determining fair value vary by investment type and may include market or investment specific events, changes in interest rates and credit quality. The frequency with which these procedures are used cannot be predicted and they may be utilized to a significant extent. The Committee oversees the Fund's valuation policies and procedures and reports to the Board on the Committee's activities and fair value determinations. The Board monitors the appropriateness of the procedures used in valuing the Fund's investments and ratifies the fair value determinations of the Committee.
The Fund categorizes the inputs to valuation techniques used to value its investments into a disclosure hierarchy consisting of three levels as shown below:
- Level 1 – quoted prices in active markets for identical investments
- Level 2 – other significant observable inputs (including quoted prices for similar investments, interest rates, prepayment speeds, etc.)
- Level 3 – unobservable inputs (including the Fund's own assumptions based on the best information available)
Valuation techniques used to value the Fund's investments by major category are as follows:
Equity securities, including restricted securities, for which market quotations are readily available, are valued at the last reported sale price or official closing price as reported by a third party pricing vendor on the primary market or exchange on which they are traded and are categorized as Level 1 in the hierarchy. In the event there were no sales during the day or closing prices are not available, securities are valued at the last quoted bid price or may be valued using the last available price and are generally categorized as Level 2 in the hierarchy. For foreign equity securities, when market or security specific events arise, comparisons to the valuation of American Depositary Receipts (ADRs), futures contracts, Exchange-Traded Funds (ETFs) and certain indexes as well as quoted prices for similar securities may be used and would be categorized as Level 2 in the hierarchy. For equity securities, including restricted securities, where observable inputs are limited, assumptions about market activity and risk are used and these securities may be categorized as Level 3 in the hierarchy.
Debt securities, including restricted securities, are valued based on evaluated prices received from third party pricing vendors or from brokers who make markets in such securities. Corporate bonds and bank loan obligations are valued by pricing vendors who utilize matrix pricing which considers yield or price of bonds of comparable quality, coupon, maturity and type or by broker-supplied prices. Asset backed securities and commercial mortgage securities are valued by pricing vendors who utilize matrix pricing which considers prepayment speed assumptions, attributes of the collateral, yield or price of bonds of comparable quality, coupon, maturity and type or by broker-supplied prices. Independent prices obtained from a single source or broker are evaluated by management and may be categorized as Level 3 in the hierarchy. When independent prices are unavailable or unreliable, debt securities may be valued utilizing pricing methodologies which consider similar factors that would be used by third party pricing vendors. Debt securities are generally categorized as Level 2 in the hierarchy but may be Level 3 depending on the circumstances. The Fund invests a significant portion of its assets in below investment grade securities. The value of these securities can be more volatile due to changes in the credit quality of the issuer and is sensitive to changes in economic, market and regulatory conditions.
Investments in open-end mutual funds, including the Fidelity Central Funds, are valued at their closing net asset value (NAV) each business day and are categorized as Level 1 in the hierarchy.
Changes in valuation techniques may result in transfers in or out of an assigned level within the disclosure hierarchy. The aggregate value of investments by input level as of July 31, 2020 is included at the end of the Fund's Schedule of Investments.
Foreign Currency. The Fund may use foreign currency contracts to facilitate transactions in foreign-denominated securities. Gains and losses from these transactions may arise from changes in the value of the foreign currency or if the counterparties do not perform under the contracts' terms.
Foreign-denominated assets, including investment securities, and liabilities are translated into U.S. dollars at the exchange rates at period end. Purchases and sales of investment securities, income and dividends received and expenses denominated in foreign currencies are translated into U.S. dollars at the exchange rate in effect on the transaction date.
The effects of exchange rate fluctuations on investments are included with the net realized and unrealized gain (loss) on investment securities. Other foreign currency transactions resulting in realized and unrealized gain (loss) are disclosed separately.
Investment Transactions and Income. For financial reporting purposes, the Fund's investment holdings and NAV include trades executed through the end of the last business day of the period. The NAV per share for processing shareholder transactions is calculated as of the close of business of the New York Stock Exchange (NYSE), normally 4:00 p.m. Eastern time and includes trades executed through the end of the prior business day. Gains and losses on securities sold are determined on the basis of identified cost. Dividend income is recorded on the ex-dividend date, except for certain dividends from foreign securities where the ex-dividend date may have passed, which are recorded as soon as the Fund is informed of the ex-dividend date. Non-cash dividends included in dividend income, if any, are recorded at the fair market value of the securities received. Income and capital gain distributions from Fidelity Central Funds, if any, are recorded on the ex-dividend date. Certain distributions received by the Fund represent a return of capital or capital gain. The Fund determines the components of these distributions subsequent to the ex-dividend date, based upon receipt of tax filings or other correspondence relating to the underlying investment. These distributions are recorded as a reduction of cost of investments and/or as a realized gain. Interest income is accrued as earned and includes coupon interest and amortization of premium and accretion of discount on debt securities as applicable. Investment income is recorded net of foreign taxes withheld where recovery of such taxes is uncertain. Debt obligations may be placed on non-accrual status and related interest income may be reduced by ceasing current accruals and writing off interest receivables when the collection of all or a portion of interest has become doubtful based on consistently applied procedures. A debt obligation is removed from non-accrual status when the issuer resumes interest payments or when collectability of interest is reasonably assured.
Expenses. Expenses directly attributable to a fund are charged to that fund. Expenses attributable to more than one fund are allocated among the respective funds on the basis of relative net assets or other appropriate methods. Expense estimates are accrued in the period to which they relate and adjustments are made when actual amounts are known.
Income Tax Information and Distributions to Shareholders. Each year, the Fund intends to qualify as a regulated investment company under Subchapter M of the Internal Revenue Code, including distributing substantially all of its taxable income and realized gains. As a result, no provision for U.S. Federal income taxes is required. As of July 31, 2020, the Fund did not have any unrecognized tax benefits in the financial statements; nor is the Fund aware of any tax positions for which it is reasonably possible that the total amounts of unrecognized tax benefits will significantly change in the next twelve months. The Fund files a U.S. federal tax return, in addition to state and local tax returns as required. The Fund's federal income tax returns are subject to examination by the Internal Revenue Service (IRS) for a period of three fiscal years after they are filed. State and local tax returns may be subject to examination for an additional fiscal year depending on the jurisdiction. Foreign taxes are provided for based on the Fund's understanding of the tax rules and rates that exist in the foreign markets in which it invests.
Distributions are declared and recorded on the ex-dividend date. Income and capital gain distributions are determined in accordance with income tax regulations, which may differ from GAAP.
Capital accounts within the financial statements are adjusted for permanent book-tax differences. These adjustments have no impact on net assets or the results of operations. Capital accounts are not adjusted for temporary book-tax differences which will reverse in a subsequent period.
Book-tax differences are primarily due to Equity-debt classifications, certain conversion ratio, foreign currency transactions, partnerships and losses deferred due to wash sales and excise tax regulations.
As of period end, the cost and unrealized appreciation (depreciation) in securities, and derivatives if applicable, for federal income tax purposes were as follows:
| Gross unrealized appreciation | $56,652,610 |
| Gross unrealized depreciation | (118,091,348) |
| Net unrealized appreciation (depreciation) | $(61,438,738) |
| Tax Cost | $990,288,506 |
The tax-based components of distributable earnings as of period end were as follows:
| Undistributed ordinary income | $10,572,058 |
| Undistributed long-term capital gain | $4,053,530 |
| Net unrealized appreciation (depreciation) on securities and other investments | $(61,438,738) |
The Fund intends to elect to defer to its next fiscal year $1,594,057 of capital losses recognized during the period November 1, 2019 to July 31, 2020.
The tax character of distributions paid was as follows:
| | July 31, 2020 | July 31, 2019 |
| Ordinary Income | $52,030,276 | $ 53,148,092 |
| Long-term Capital Gains | 9,617,635 | 12,905,641 |
| Total | $61,647,911 | $ 66,053,733 |
Restricted Securities (including Private Placements). The Fund may invest in securities that are subject to legal or contractual restrictions on resale. These securities generally may be resold in transactions exempt from registration or to the public if the securities are registered. Disposal of these securities may involve time-consuming negotiations and expense, and prompt sale at an acceptable price may be difficult. Information regarding restricted securities is included at the end of the Fund's Schedule of Investments.
Loans and Other Direct Debt Instruments. The Fund invests in direct debt instruments which are interests in amounts owed to lenders by corporate or other borrowers. These instruments may be in the form of loans, trade claims or other receivables and may include standby financing commitments such as revolving credit facilities that obligate the Fund to supply additional cash to the borrower on demand. Loans may be acquired through assignment or participation. The Fund did not have any unfunded loan commitments, which are contractual obligations for future funding, at period end.
4. Purchases and Sales of Investments.
Purchases and sales of securities, other than short-term securities and in-kind transactions are noted in the table below.
| | Purchases ($) | Sales ($) |
| Fidelity Series Real Estate Income Fund | 269,887,920 | 232,296,205 |
5. Fees and Other Transactions with Affiliates.
Management Fee. Fidelity Management & Research Company LLC (the investment adviser) and its affiliates provide the Fund with investment management related services for which the Fund does not pay a management fee. Under the management contract, the investment adviser or an affiliate pays all ordinary operating expenses of the Fund, except custody fees, fees and expenses of the independent Trustees, and certain miscellaneous expenses such as proxy and shareholder meeting expenses.
Brokerage Commissions. A portion of portfolio transactions were placed with brokerage firms which are affiliates of the investment adviser. Brokerage commissions are included in net realized gain (loss) and change in net unrealized appreciation (depreciation) in the Statement of Operations. The commissions paid to these affiliated firms were as follows:
| | Amount |
| Fidelity Series Real Estate Income Fund | $2,387 |
Interfund Trades. Funds may purchase from or sell securities to other Fidelity Funds under procedures adopted by the Board. The procedures have been designed to ensure these interfund trades are executed in accordance with Rule 17a-7 of the 1940 Act. Interfund trades are included within the respective purchases and sales amounts shown in the Purchases and Sales of Investments note.
Affiliated Exchanges In-Kind. During the period, the Fund received investments, including accrued interest, and cash valued at $71,229,507 in exchange for 6,309,079 shares of the Fund. The amount of in-kind exchanges is included in share transactions in the accompanying Statement of Changes in Net Assets.
6. Committed Line of Credit.
Certain Funds participate with other funds managed by the investment adviser or an affiliate in a $4.25 billion credit facility (the "line of credit") to be utilized for temporary or emergency purposes to fund shareholder redemptions or for other short-term liquidity purposes. The participating funds have agreed to pay commitment fees on their pro-rata portion of the line of credit, which are reflected in Miscellaneous expenses on the Statement of Operations, and are as follows:
| | Amount |
| Fidelity Series Real Estate Income Fund | $2,395 |
During the period, there were no borrowings on this line of credit.
7. Expense Reductions.
Through arrangements with the Fund's custodian, credits realized as a result of certain uninvested cash balances were used to reduce the Fund's expenses by $9,100.
8. Other.
The Fund's organizational documents provide former and current trustees and officers with a limited indemnification against liabilities arising in connection with the performance of their duties to the Fund. In the normal course of business, the Fund may also enter into contracts that provide general indemnifications. The Fund's maximum exposure under these arrangements is unknown as this would be dependent on future claims that may be made against the Fund. The risk of material loss from such claims is considered remote.
At the end of the period, mutual funds and accounts managed by the investment adviser or its affiliates were the owners of record of all of the outstanding shares of the Fund.
9. Coronavirus (COVID-19) Pandemic.
An outbreak of COVID-19 first detected in China during December 2019 has since spread globally and was declared a pandemic by the World Health Organization during March 2020. Developments that disrupt global economies and financial markets, such as the COVID-19 pandemic, may magnify factors that affect the Fund's performance.
Report of Independent Registered Public Accounting Firm
To the Board of Trustees of Fidelity Securities Fund and Shareholders of Fidelity Series Real Estate Income Fund
Opinion on the Financial Statements and Financial Highlights
We have audited the accompanying statement of assets and liabilities of Fidelity Series Real Estate Income Fund (the "Fund"), a fund of Fidelity Securities Fund, including the schedule of investments, as of July 31, 2020, the related statement of operations for the year then ended, the statement of changes in net assets for each of the two years in the period then ended, the financial highlights for each of the five years in the period then ended, and the related notes. In our opinion, the financial statements and financial highlights present fairly, in all material respects, the financial position of the Fund as of July 31, 2020, and the results of its operations for the year then ended, the changes in its net assets for each of the two years in the period then ended, and the financial highlights for each of the five years in the period then ended in conformity with accounting principles generally accepted in the United States of America.
Basis for Opinion
These financial statements and financial highlights are the responsibility of the Fund's management. Our responsibility is to express an opinion on the Fund's financial statements and financial highlights based on our audits. We are a public accounting firm registered with the Public Company Accounting Oversight Board (United States) (PCAOB) and are required to be independent with respect to the Fund in accordance with the U.S. federal securities laws and the applicable rules and regulations of the Securities and Exchange Commission and the PCAOB.
We conducted our audits in accordance with the standards of the PCAOB. Those standards require that we plan and perform the audit to obtain reasonable assurance about whether the financial statements and financial highlights are free of material misstatement, whether due to error or fraud. The Fund is not required to have, nor were we engaged to perform, an audit of its internal control over financial reporting. As part of our audits we are required to obtain an understanding of internal control over financial reporting but not for the purpose of expressing an opinion on the effectiveness of the Fund’s internal control over financial reporting. Accordingly, we express no such opinion.
Our audits included performing procedures to assess the risks of material misstatement of the financial statements and financial highlights, whether due to error or fraud, and performing procedures that respond to those risks. Such procedures included examining, on a test basis, evidence regarding the amounts and disclosures in the financial statements and financial highlights. Our audits also included evaluating the accounting principles used and significant estimates made by management, as well as evaluating the overall presentation of the financial statements and financial highlights. Our procedures included confirmation of securities owned as of July 31, 2020, by correspondence with the custodian, brokers and agent banks; when replies were not received from brokers or agent banks, we performed other auditing procedures. We believe that our audits provide a reasonable basis for our opinion.
/s/ Deloitte & Touche LLP
Boston, Massachusetts
September 10, 2020
We have served as the auditor of one or more of the Fidelity investment companies since 1999.
Trustees and Officers
The Trustees, Members of the Advisory Board (if any), and officers of the trust and fund, as applicable, are listed below. The Board of Trustees governs the fund and is responsible for protecting the interests of shareholders. The Trustees are experienced executives who meet periodically throughout the year to oversee the fund's activities, review contractual arrangements with companies that provide services to the fund, oversee management of the risks associated with such activities and contractual arrangements, and review the fund's performance. Except for Jonathan Chiel, each of the Trustees oversees 311 funds. Mr. Chiel oversees 174 funds.
The Trustees hold office without limit in time except that (a) any Trustee may resign; (b) any Trustee may be removed by written instrument, signed by at least two-thirds of the number of Trustees prior to such removal; (c) any Trustee who requests to be retired or who has become incapacitated by illness or injury may be retired by written instrument signed by a majority of the other Trustees; and (d) any Trustee may be removed at any special meeting of shareholders by a two-thirds vote of the outstanding voting securities of the trust. Each Trustee who is not an interested person (as defined in the 1940 Act) of the trust and the fund is referred to herein as an Independent Trustee. Each Independent Trustee shall retire not later than the last day of the calendar year in which his or her 75th birthday occurs. The Independent Trustees may waive this mandatory retirement age policy with respect to individual Trustees. Officers and Advisory Board Members hold office without limit in time, except that any officer or Advisory Board Member may resign or may be removed by a vote of a majority of the Trustees at any regular meeting or any special meeting of the Trustees. Except as indicated, each individual has held the office shown or other offices in the same company for the past five years.
The fund’s Statement of Additional Information (SAI) includes more information about the Trustees. To request a free copy, call Fidelity at 1-800-544-8544.
Experience, Skills, Attributes, and Qualifications of the Trustees. The Governance and Nominating Committee has adopted a statement of policy that describes the experience, qualifications, attributes, and skills that are necessary and desirable for potential Independent Trustee candidates (Statement of Policy). The Board believes that each Trustee satisfied at the time he or she was initially elected or appointed a Trustee, and continues to satisfy, the standards contemplated by the Statement of Policy. The Governance and Nominating Committee also engages professional search firms to help identify potential Independent Trustee candidates who have the experience, qualifications, attributes, and skills consistent with the Statement of Policy. From time to time, additional criteria based on the composition and skills of the current Independent Trustees, as well as experience or skills that may be appropriate in light of future changes to board composition, business conditions, and regulatory or other developments, have also been considered by the professional search firms and the Governance and Nominating Committee. In addition, the Board takes into account the Trustees' commitment and participation in Board and committee meetings, as well as their leadership of standing and ad hoc committees throughout their tenure.
In determining that a particular Trustee was and continues to be qualified to serve as a Trustee, the Board has considered a variety of criteria, none of which, in isolation, was controlling. The Board believes that, collectively, the Trustees have balanced and diverse experience, qualifications, attributes, and skills, which allow the Board to operate effectively in governing the fund and protecting the interests of shareholders. Information about the specific experience, skills, attributes, and qualifications of each Trustee, which in each case led to the Board's conclusion that the Trustee should serve (or continue to serve) as a trustee of the fund, is provided below.
Board Structure and Oversight Function. Robert A. Lawrence is an interested person and currently serves as Acting Chairman. The Trustees have determined that an interested Chairman is appropriate and benefits shareholders because an interested Chairman has a personal and professional stake in the quality and continuity of services provided to the fund. Independent Trustees exercise their informed business judgment to appoint an individual of their choosing to serve as Chairman, regardless of whether the Trustee happens to be independent or a member of management. The Independent Trustees have determined that they can act independently and effectively without having an Independent Trustee serve as Chairman and that a key structural component for assuring that they are in a position to do so is for the Independent Trustees to constitute a substantial majority for the Board. The Independent Trustees also regularly meet in executive session. Ned C. Lautenbach and David M. Thomas serve as Co-Lead Independent Trustees and as such each (i) acts as a liaison between the Independent Trustees and management with respect to matters important to the Independent Trustees and (ii) with management prepares agendas for Board meetings.
Fidelity® funds are overseen by different Boards of Trustees. The fund's Board oversees Fidelity's high income and certain equity funds, and other Boards oversee Fidelity's investment-grade bond, money market, asset allocation, and other equity funds. The asset allocation funds may invest in Fidelity® funds overseen by the fund's Board. The use of separate Boards, each with its own committee structure, allows the Trustees of each group of Fidelity® funds to focus on the unique issues of the funds they oversee, including common research, investment, and operational issues. On occasion, the separate Boards establish joint committees to address issues of overlapping consequences for the Fidelity® funds overseen by each Board.
The Trustees operate using a system of committees to facilitate the timely and efficient consideration of all matters of importance to the Trustees, the fund, and fund shareholders and to facilitate compliance with legal and regulatory requirements and oversight of the fund's activities and associated risks. The Board, acting through its committees, has charged FMR and its affiliates with (i) identifying events or circumstances the occurrence of which could have demonstrably adverse effects on the fund's business and/or reputation; (ii) implementing processes and controls to lessen the possibility that such events or circumstances occur or to mitigate the effects of such events or circumstances if they do occur; and (iii) creating and maintaining a system designed to evaluate continuously business and market conditions in order to facilitate the identification and implementation processes described in (i) and (ii) above. Because the day-to-day operations and activities of the fund are carried out by or through FMR, its affiliates, and other service providers, the fund's exposure to risks is mitigated but not eliminated by the processes overseen by the Trustees. While each of the Board's committees has responsibility for overseeing different aspects of the fund's activities, oversight is exercised primarily through the Operations, Audit, and Compliance Committees. Appropriate personnel, including but not limited to the fund's Chief Compliance Officer (CCO), FMR's internal auditor, the independent accountants, the fund's Treasurer and portfolio management personnel, make periodic reports to the Board's committees, as appropriate, including an annual review of Fidelity's risk management program for the Fidelity® funds. The responsibilities of each standing committee, including their oversight responsibilities, are described further under "Standing Committees of the Trustees."
Interested Trustees*:
Correspondence intended for a Trustee who is an interested person may be sent to Fidelity Investments, 245 Summer Street, Boston, Massachusetts 02210.
Name, Year of Birth; Principal Occupations and Other Relevant Experience+
Jonathan Chiel (1957)
Year of Election or Appointment: 2016
Trustee
Mr. Chiel also serves as Trustee of other Fidelity® funds. Mr. Chiel is Executive Vice President and General Counsel for FMR LLC (diversified financial services company, 2012-present). Previously, Mr. Chiel served as general counsel (2004-2012) and senior vice president and deputy general counsel (2000-2004) for John Hancock Financial Services; a partner with Choate, Hall & Stewart (1996-2000) (law firm); and an Assistant United States Attorney for the United States Attorney’s Office of the District of Massachusetts (1986-95), including Chief of the Criminal Division (1993-1995). Mr. Chiel is a director on the boards of the Boston Bar Foundation and the Maimonides School.
Robert A. Lawrence (1952)
Year of Election or Appointment: 2020
Trustee
Acting Chairman of the Board of Trustees
Mr. Lawrence also serves as Trustee of other funds. Previously, Mr. Lawrence served as a Member of the Advisory Board of certain funds. Prior to his retirement in 2008, Mr. Lawrence served as Vice President of certain Fidelity® funds (2006-2008), Senior Vice President, Head of High Income Division of Fidelity Management & Research Company (investment adviser firm, 2006-2008), and President of Fidelity Strategic Investments (investment adviser firm, 2002-2005).
* Determined to be an “Interested Trustee” by virtue of, among other things, his or her affiliation with the trust or various entities under common control with FMR.
+ The information includes the Trustee's principal occupation during the last five years and other information relating to the experience, attributes, and skills relevant to the Trustee's qualifications to serve as a Trustee, which led to the conclusion that the Trustee should serve as a Trustee for the fund.
Independent Trustees:
Correspondence intended for an Independent Trustee may be sent to Fidelity Investments, P.O. Box 55235, Boston, Massachusetts 02205-5235.
Name, Year of Birth; Principal Occupations and Other Relevant Experience+
Dennis J. Dirks (1948)
Year of Election or Appointment: 2005
Trustee
Mr. Dirks also serves as Trustee of other Fidelity® funds. Prior to his retirement in May 2003, Mr. Dirks served as Chief Operating Officer and as a member of the Board of The Depository Trust & Clearing Corporation (financial markets infrastructure), President, Chief Operating Officer and a member of the Board of The Depository Trust Company (DTC), President and a member of the Board of the National Securities Clearing Corporation (NSCC), Chief Executive Officer and a member of the Board of the Government Securities Clearing Corporation and Chief Executive Officer and a member of the Board of the Mortgage-Backed Securities Clearing Corporation. Mr. Dirks currently serves as a member of the Finance Committee (2016-present) and Board (2017-present) and is Treasurer (2018-present) of the Asolo Repertory Theatre.
Donald F. Donahue (1950)
Year of Election or Appointment: 2018
Trustee
Mr. Donahue also serves as Trustee of other Fidelity® funds. Mr. Donahue serves as President and Chief Executive Officer of Miranda Partners, LLC (risk consulting for the financial services industry, 2012-present). Previously, Mr. Donahue served as Chief Executive Officer (2006-2012), Chief Operating Officer (2003-2006) and Managing Director, Customer Marketing and Development (1999-2003) of The Depository Trust & Clearing Corporation (financial markets infrastructure). Mr. Donahue currently serves as a member (2007-present) and Co-Chairman (2016-present) of the Board of United Way of New York, a member of the Board of NYC Leadership Academy (2012-present) and a member of the Board of Advisors of Ripple Labs, Inc. (financial services, 2015-present). Mr. Donahue previously served as a member of the Advisory Board of certain Fidelity® funds (2015-2018).
Vicki L. Fuller (1957)
Year of Election or Appointment: 2020
Trustee
Ms. Fuller also serves as Trustee of other Fidelity® funds. Previously, Ms. Fuller served as a member of the Advisory Board of certain Fidelity® funds (2018-2020), Chief Investment Officer of the New York State Common Retirement Fund (2012-2018) and held a variety of positions at AllianceBernstein L.P. (global asset management, 1985-2012), including Managing Director (2006-2012) and Senior Vice President and Senior Portfolio Manager (2001-2006). Ms. Fuller currently serves as a member of the Board, Audit Committee and Nominating and Governance Committee of The Williams Companies, Inc. (natural gas infrastructure, 2018-present) and as a member of the Board of Treliant, LLC (consulting, 2019-present).
Patricia L. Kampling (1959)
Year of Election or Appointment: 2020
Trustee
Ms. Kampling also serves as Trustee of other Fidelity® funds. Prior to her retirement, Ms. Kampling served as Chairman of the Board and Chief Executive Officer (2012-2019), President and Chief Operating Officer (2011-2012) and Executive Vice President and Chief Financial Officer (2010-2011) of Alliant Energy Corporation. Ms. Kampling currently serves as a member of the Board, Compensation Committee and Executive Committee and as Chair of the Audit Committee of Briggs & Stratton Corporation (manufacturing, 2011-present) and as a member of the Board, Audit, Finance and Risk Committee and Safety, Environmental, Technology and Operations Committee of American Water Works Company, Inc. (utilities company, 2019-present). In addition, Ms. Kampling currently serves as a member of the Board of the Nature Conservancy, Wisconsin Chapter (2019-present). Previously, Ms. Kampling served as a Member of the Advisory Board of certain Fidelity® funds (2020), a member of the Board of Interstate Power and Light Company (2012-2019) and Wisconsin Power and Light Company (2012-2019) (each a subsidiary of Alliant Energy Corporation) and as a member of the Board and Workforce Development Committee of the Business Roundtable (2018-2019).
Alan J. Lacy (1953)
Year of Election or Appointment: 2008
Trustee
Mr. Lacy also serves as Trustee of other Fidelity® funds. Previously, Mr. Lacy served as Senior Adviser (2007-2014) of Oak Hill Capital Partners, L.P. (private equity), Chief Executive Officer (2005) and Vice Chairman (2005-2006) of Sears Holdings Corporation (retail), Chief Executive Officer and Chairman of the Board of Sears, Roebuck and Co. (retail, 2000-2005), Chairman (2014-2017) and a member of the Board (2010-2017) of Dave & Buster’s Entertainment, Inc. (restaurant and entertainment complexes) and a member of the Board of Bristol-Myers Squibb Company (global pharmaceuticals, 2008-2020). Mr. Lacy currently serves as a Trustee of the California Chapter of The Nature Conservancy (2015-present) and a member of the Board of the Center for Advanced Study in the Behavioral Sciences at Stanford University (2015-present).
Ned C. Lautenbach (1944)
Year of Election or Appointment: 2000
Trustee
Co-Lead Independent Trustee
Mr. Lautenbach also serves as Trustee of other Fidelity® funds. Mr. Lautenbach currently serves as Chair of the Board of Governors, State University System of Florida (2013-present) and is a member of the Council on Foreign Relations (1994-present). He is also a member and has in the past served as Chairman of the Board of Directors of Artis-Naples (2012-present). Previously, Mr. Lautenbach served as a member and then Lead Director of the Board of Directors of Eaton Corporation (diversified industrial, 1997-2016). He was also a Partner at Clayton, Dubilier & Rice, LLC (private equity investment, 1998-2010); as well as Director of Sony Corporation (2006-2007). In addition, Mr. Lautenbach had a 30-year career with IBM (technology company), during which time he served as Senior Vice President and as a member of the Corporate Executive Committee (1968-1998).
Joseph Mauriello (1944)
Year of Election or Appointment: 2008
Trustee
Mr. Mauriello also serves as Trustee of other Fidelity® funds. Prior to his retirement in January 2006, Mr. Mauriello served in numerous senior management positions including Deputy Chairman and Chief Operating Officer (2004-2005), and Vice Chairman of Financial Services (2002-2004) of KPMG LLP US (professional services, 1965-2005). Mr. Mauriello currently serves as a member of the Independent Directors Council Governing Council (2015-present). Previously, Mr. Mauriello served as a member of the Board of XL Group plc. (global insurance and re-insurance, 2006-2018).
Cornelia M. Small (1944)
Year of Election or Appointment: 2005
Trustee
Ms. Small also serves as Trustee of other Fidelity® funds. Previously, Ms. Small served as Chief Investment Officer, Director of Global Equity Investments and a member of Scudder, Stevens & Clark and Scudder Kemper Investments. Ms. Small previously served as a member of the Board (2009-2019) and Chair of the Investment Committee (2010-2019) of the Teagle Foundation and a member of the Investment Committee of the Berkshire Taconic Community Foundation (2008-2019).
Garnett A. Smith (1947)
Year of Election or Appointment: 2018
Trustee
Mr. Smith also serves as Trustee of other Fidelity® funds. Prior to his retirement, Mr. Smith served as Chairman and Chief Executive Officer (1990-1997) and President (1986-1990) of Inbrand Corp. (manufacturer of personal absorbent products). Prior to his employment with Inbrand Corp., he was employed by a retail fabric chain and North Carolina National Bank (now Bank of America). Mr. Smith previously served as a member of the Advisory Board of certain Fidelity® funds (2012-2013).
David M. Thomas (1949)
Year of Election or Appointment: 2008
Trustee
Co-Lead Independent Trustee
Mr. Thomas also serves as Trustee of other Fidelity® funds. Previously, Mr. Thomas served as Executive Chairman (2005-2006) and Chairman and Chief Executive Officer (2000-2005) of IMS Health, Inc. (pharmaceutical and healthcare information solutions). Mr. Thomas currently serves as Non-Executive Chairman of the Board of Fortune Brands Home and Security (home and security products, 2011-present), and a member of the Board (2004-present) and Presiding Director (2013-present) of Interpublic Group of Companies, Inc. (marketing communication).
Susan Tomasky (1953)
Year of Election or Appointment: 2020
Trustee
Ms. Tomasky also serves as Trustee of other Fidelity® funds. Prior to her retirement, Ms. Tomasky served in various executive officer positions at American Electric Power Company, Inc. (1998-2011), including most recently as President of AEP Transmission (2007-2011). Ms. Tomasky currently serves as a member of the Board and Sustainability Committee and as Chair of the Audit Committee of Marathon Petroleum Corporation (2018-present) and as a member of the Board, Corporate Governance Committee and Organization and Compensation Committee and as Chair of the Audit Committee of Public Service Enterprise Group, Inc. (utilities company, 2012-present). In addition, Ms. Tomasky currently serves as a member of the Board of the Columbus Regional Airport Authority (2007-present), as a member of the Board of the Royal Shakespeare Company – America (2009-present), as a member of the Board of the Columbus Association for the Performing Arts (2011-present) and as a member of the Board of Kenyon College (2016-present). Previously, Ms. Tomasky served as a Member of the Advisory Board of certain Fidelity® funds (2020), a member of the Board (2011-2019) and as Lead Independent Director (2015-2018) of Andeavor Corporation (previously Tesoro Corporation) (independent oil refiner and marketer) and as a member of the Board of Summit Midstream Partners LP (energy, 2012-2018).
Michael E. Wiley (1950)
Year of Election or Appointment: 2020
Trustee
Mr. Wiley also serves as Trustee of other Fidelity® funds. Previously, Mr. Wiley served as a member of the Advisory Board of certain Fidelity® funds (2018-2020), Chairman, President and CEO of Baker Hughes, Inc. (oilfield services, 2000-2004). Mr. Wiley also previously served as a member of the Board of Andeavor Corporation (independent oil refiner and marketer, 2005-2018), a member of the Board of Andeavor Logistics LP (natural resources logistics, 2015-2018) and a member of the Board of High Point Resources (exploration and production, 2005-2020).
+ The information includes the Trustee's principal occupation during the last five years and other information relating to the experience, attributes, and skills relevant to the Trustee's qualifications to serve as a Trustee, which led to the conclusion that the Trustee should serve as a Trustee for the fund.
Advisory Board Members and Officers:
Correspondence intended for a Member of the Advisory Board (if any) may be sent to Fidelity Investments, P.O. Box 55235, Boston, Massachusetts 02205-5235. Correspondence intended for an officer or Peter S. Lynch may be sent to Fidelity Investments, 245 Summer Street, Boston, Massachusetts 02210. Officers appear below in alphabetical order.
Name, Year of Birth; Principal Occupation
Peter S. Lynch (1944)
Year of Election or Appointment: 2003
Member of the Advisory Board
Mr. Lynch also serves as a Member of the Advisory Board of other Fidelity® funds. Mr. Lynch is Vice Chairman and a Director of Fidelity Management & Research Company LLC (investment adviser firm). In addition, Mr. Lynch serves as a Trustee of Boston College and as the Chairman of the Inner-City Scholarship Fund. Previously, Mr. Lynch served as Vice Chairman and a Director of FMR Co., Inc. (investment adviser firm) and on the Special Olympics International Board of Directors (1997-2006).
Elizabeth Paige Baumann (1968)
Year of Election or Appointment: 2017
Anti-Money Laundering (AML) Officer
Ms. Baumann also serves as AML Officer of other funds. She is Chief AML Officer (2012-present) and Senior Vice President (2014-present) of FMR LLC (diversified financial services company) and is an employee of Fidelity Investments. Previously, Ms. Baumann served as AML Officer of certain funds (2017-2019), as AML Officer of the funds (2012-2016), and Vice President (2007-2014) and Deputy Anti-Money Laundering Officer (2007-2012) of FMR LLC.
Craig S. Brown (1977)
Year of Election or Appointment: 2019
Assistant Treasurer
Mr. Brown also serves as Assistant Treasurer of other funds. Mr. Brown is an employee of Fidelity Investments (2013-present).
John J. Burke III (1964)
Year of Election or Appointment: 2018
Chief Financial Officer
Mr. Burke also serves as Chief Financial Officer of other funds. Mr. Burke serves as Head of Investment Operations for Fidelity Fund and Investment Operations (2018-present) and is an employee of Fidelity Investments (1998-present). Previously Mr. Burke served as head of Asset Management Investment Operations (2012-2018).
William C. Coffey (1969)
Year of Election or Appointment: 2019
Assistant Secretary
Mr. Coffey also serves as Assistant Secretary of other funds. He is Senior Vice President and Deputy General Counsel of FMR LLC (diversified financial services company, 2010-present), and is an employee of Fidelity Investments. Previously, Mr. Coffey served as Secretary and CLO of certain funds (2018-2019); CLO, Secretary, and Senior Vice President of Fidelity Management & Research Company and FMR Co., Inc. (investment adviser firms, 2018-2019); Secretary of Fidelity SelectCo, LLC and Fidelity Investments Money Management, Inc. (investment adviser firms, 2018-2019); CLO of Fidelity Management & Research (Hong Kong) Limited, FMR Investment Management (UK) Limited, and Fidelity Management & Research (Japan) Limited (investment adviser firms, 2018-2019); and Assistant Secretary of certain funds (2009-2018).
Timothy M. Cohen (1969)
Year of Election or Appointment: 2018
Vice President
Mr. Cohen also serves as Vice President of other funds. Mr. Cohen serves as Co-Head of Equity (2018-present), a Director of Fidelity Management & Research (Japan) Limited (investment adviser firm, 2016-present), and is an employee of Fidelity Investments. Previously, Mr. Cohen served as Executive Vice President of Fidelity SelectCo, LLC (2019), Head of Global Equity Research (2016-2018), Chief Investment Officer - Equity and a Director of Fidelity Management & Research (U.K.) Inc. (investment adviser firm, 2013-2015) and as a Director of Fidelity Management & Research (Hong Kong) Limited (investment adviser firm, 2017).
Jonathan Davis (1968)
Year of Election or Appointment: 2010
Assistant Treasurer
Mr. Davis also serves as Assistant Treasurer of other funds. Mr. Davis serves as Assistant Treasurer of FMR Capital, Inc. (2017-present) and is an employee of Fidelity Investments. Previously, Mr. Davis served as Vice President and Associate General Counsel of FMR LLC (diversified financial services company, 2003-2010).
Laura M. Del Prato (1964)
Year of Election or Appointment: 2018
Assistant Treasurer
Ms. Del Prato also serves as an officer of other funds. Ms. Del Prato is an employee of Fidelity Investments (2017-present). Previously, Ms. Del Prato served as President and Treasurer of The North Carolina Capital Management Trust: Cash Portfolio and Term Portfolio (2018-2020). Prior to joining Fidelity Investments, Ms. Del Prato served as a Managing Director and Treasurer of the JPMorgan Mutual Funds (2014-2017). Prior to JPMorgan, Ms. Del Prato served as a partner at Cohen Fund Audit Services (accounting firm, 2012-2013) and KPMG LLP (accounting firm, 2004-2012).
Colm A. Hogan (1973)
Year of Election or Appointment: 2020
Assistant Treasurer
Mr. Hogan also serves as an officer of other funds. Mr. Hogan serves as Assistant Treasurer of FMR Capital, Inc. (2017-present) and is an employee of Fidelity Investments (2005-present). Previously, Mr. Hogan served as Deputy Treasurer of certain Fidelity® funds (2016-2020) and Assistant Treasurer of certain Fidelity® funds (2016-2018).
Pamela R. Holding (1964)
Year of Election or Appointment: 2018
Vice President
Ms. Holding also serves as Vice President of other funds. Ms. Holding serves as Co-Head of Equity (2018-present) and is an employee of Fidelity Investments (2013-present). Previously, Ms. Holding served as Executive Vice President of Fidelity SelectCo, LLC (2019) and as Chief Investment Officer of Fidelity Institutional Asset Management (2013-2018).
Cynthia Lo Bessette (1969)
Year of Election or Appointment: 2019
Secretary and Chief Legal Officer (CLO)
Ms. Lo Bessette also serves as an officer of other funds. Ms. Lo Bessette serves as CLO, Secretary, and Senior Vice President of Fidelity Management & Research Company LLC (investment adviser firm, 2019-present); and CLO of Fidelity Management & Research (Hong Kong) Limited, FMR Investment Management (UK) Limited, and Fidelity Management & Research (Japan) Limited (investment adviser firms, 2019-present). She is a Senior Vice President and Deputy General Counsel of FMR LLC (diversified financial services company, 2019-present), and is an employee of Fidelity Investments. Previously, Ms. Lo Bessette served as CLO, Secretary, and Senior Vice President of FMR Co., Inc. (investment adviser firm, 2019); Secretary of Fidelity SelectCo, LLC and Fidelity Investments Money Management, Inc. (investment adviser firms, 2019). Prior to joining Fidelity Investments, Ms. Lo Bessette was Executive Vice President, General Counsel (2016-2019) and Senior Vice President, Deputy General Counsel (2015-2016) of OppenheimerFunds (investment management company) and Deputy Chief Legal Officer (2013-2015) of Jennison Associates LLC (investment adviser firm).
Chris Maher (1972)
Year of Election or Appointment: 2020
Deputy Treasurer
Mr. Maher also serves as an officer of other funds. Mr. Maher serves as Assistant Treasurer of FMR Capital, Inc. (2017-present), and is an employee of Fidelity Investments (2008-present). Previously, Mr. Maher served as Assistant Treasurer of certain funds (2013-2020); Vice President of Asset Management Compliance (2013), Vice President of the Program Management Group of FMR (investment adviser firm, 2010-2013), and Vice President of Valuation Oversight (2008-2010).
Jason P. Pogorelec (1975)
Year of Election or Appointment: 2020
Chief Compliance Officer
Mr. Pogorelec also serves as Chief Compliance Officer of other funds. Mr. Pogorelec is a senior Vice President of Asset Management Compliance for Fidelity Investments and is an employee of Fidelity Investments (2006-present). Previously, Mr. Pogorelec served as Vice President, Associate General Counsel for Fidelity Investments (2010-2020) and Assistant Secretary of certain Fidelity funds (2015-2020).
Stacie M. Smith (1974)
Year of Election or Appointment: 2016
President and Treasurer
Ms. Smith also serves as an officer of other funds. Ms. Smith serves as Assistant Treasurer of FMR Capital, Inc. (2017-present), is an employee of Fidelity Investments (2009-present), and has served in other fund officer roles. Prior to joining Fidelity Investments, Ms. Smith served as Senior Audit Manager of Ernst & Young LLP (accounting firm, 1996-2009). Previously, Ms. Smith served as Assistant Treasurer (2013-2019) and Deputy Treasurer (2013-2016) of certain Fidelity® funds.
Marc L. Spector (1972)
Year of Election or Appointment: 2016
Assistant Treasurer
Mr. Spector also serves as an officer of other funds. Mr. Spector serves as Assistant Treasurer of FMR Capital, Inc. (2017-present) and is an employee of Fidelity Investments (2016-present). Prior to joining Fidelity Investments, Mr. Spector served as Director at the Siegfried Group (accounting firm, 2013-2016), and prior to Siegfried Group as audit senior manager at Deloitte & Touche LLP (accounting firm, 2005-2013).
Jim Wegmann (1979)
Year of Election or Appointment: 2019
Assistant Treasurer
Mr. Wegmann also serves as Assistant Treasurer of other funds. Mr. Wegmann is an employee of Fidelity Investments (2011-present).
Shareholder Expense Example
As a shareholder, you incur two types of costs: (1) transaction costs, which may include sales charges (loads) on purchase payments or redemption proceeds, as applicable and (2) ongoing costs, which generally include management fees, distribution and/or service (12b-1) fees and other Fund expenses. This Example is intended to help you understand your ongoing costs (in dollars) of investing in a fund and to compare these costs with the ongoing costs of investing in other mutual funds.
The Example is based on an investment of $1,000 invested at the beginning of the period and held for the entire period (February 1, 2020 to July 31, 2020).
Actual Expenses
The first line of the accompanying table provides information about actual account values and actual expenses. You may use the information in this line, together with the amount you invested, to estimate the expenses that you paid over the period. Simply divide your account value by $1,000.00 (for example, an $8,600 account value divided by $1,000.00 = 8.6), then multiply the result by the number in the first line for a class/Fund under the heading entitled "Expenses Paid During Period" to estimate the expenses you paid on your account during this period. If any fund is a shareholder of any underlying mutual funds or exchange-traded funds (ETFs) (the Underlying Funds), such fund indirectly bears its proportional share of the expenses of the Underlying Funds in addition to the direct expenses incurred presented in the table. These fees and expenses are not included in the annualized expense ratio used to calculate the expense estimate in the table below.
Hypothetical Example for Comparison Purposes
The second line of the accompanying table provides information about hypothetical account values and hypothetical expenses based on the actual expense ratio and an assumed rate of return of 5% per year before expenses, which is not the actual return. The hypothetical account values and expenses may not be used to estimate the actual ending account balance or expenses you paid for the period. You may use this information to compare the ongoing costs of investing in the Fund and other funds. To do so, compare this 5% hypothetical example with the 5% hypothetical examples that appear in the shareholder reports of the other funds. If any fund is a shareholder of any Underlying Funds, such fund indirectly bears its proportional share of the expenses of the Underlying Funds in addition to the direct expenses as presented in the table. These fees and expenses are not included in the annualized expense ratio used to calculate the expense estimate in the table below.
Please note that the expenses shown in the table are meant to highlight your ongoing costs only and do not reflect any transaction costs. Therefore, the second line of the table is useful in comparing ongoing costs only, and will not help you determine the relative total costs of owning different funds.
| | Annualized Expense Ratio-A | Beginning
Account Value
February 1, 2020 | Ending
Account Value
July 31, 2020 | Expenses Paid
During Period-B
February 1, 2020
to July 31, 2020 |
| Fidelity Series Real Estate Income Fund | - %-C | | | |
| Actual | | $1,000.00 | $894.70 | $--D |
| Hypothetical-E | | $1,000.00 | $1,024.86 | $--D |
A Annualized expense ratio reflects expenses net of applicable fee waivers.
B Expenses are equal to the annualized expense ratio, multiplied by the average account value over the period, multiplied by 182/ 366 (to reflect the one-half year period). The fees and expenses of any Underlying Funds are not included in each annualized expense ratio.
C Amount represents less than .005%.
D Amount represents less than $.005.
E 5% return per year before expenses
Distributions (Unaudited)
The Board of Trustees of Fidelity Series Real Estate Income Fund voted to pay on September 8, 2020, to shareholders of record at the opening of business on September 4, 2020, a distribution of $0.045 per share derived from capital gains realized from sales of portfolio securities and a dividend of $0.145 per share from net investment income.
The fund hereby designates as a capital gain dividend with respect to the taxable year ended July 31, 2020, $6,297,432, or, if subsequently determined to be different, the net capital gain of such year.
A total of 0.22% of the dividends distributed during the fiscal year was derived from interest on U.S. Government securities which is generally exempt from state income tax.
The fund designates 1%, 3%, 7%, and 7% of the dividends distributed in September, December, March, and June, respectively during the fiscal year as qualifying for the dividends–received deduction for corporate shareholders.
The fund designates 1%, 3%, 7%, and 7% of the dividends distributed in September, December, March, and June, respectively during the fiscal year as amounts which may be taken into account as a dividend for the purposes of the maximum rate under section 1(h)(11) of the Internal Revenue Code.
The fund designates 17% and 38% of the dividends distributed in September and December, respectively during the fiscal year as a section 199A dividend.
The fund will notify shareholders in January 2021 of amounts for use in preparing 2020 income tax returns.
Liquidity Risk Management Program
The Securities and Exchange Commission adopted Rule 22e-4 under the Investment Company Act of 1940 (the Liquidity Rule) to promote effective liquidity risk management throughout the open-end investment company industry, thereby reducing the risk that funds will be unable to meet their redemption obligations and mitigating dilution of the interests of fund shareholders.
The Fund has adopted and implemented a liquidity risk management program pursuant to the Liquidity Rule (the Program) effective December 1, 2018. The Program is reasonably designed to assess and manage the Fund’s liquidity risk and to comply with the requirements of the Liquidity Rule. The Fund’s Board of Trustees (the Board) has designated the Fund’s investment adviser as administrator of the Program. The Fidelity advisers have established a Liquidity Risk Management Committee (the LRM Committee) to manage the Program for each of the Fidelity Funds. The LRM Committee monitors the adequacy and effectiveness of implementation of the Program and on a periodic basis assesses each Fund’s liquidity risk based on a variety of factors including (1) the Fund’s investment strategy, (2) portfolio liquidity and cash flow projections during normal and reasonably foreseeable stressed conditions, (3) shareholder redemptions, (4) borrowings and other funding sources and (5) in the case of exchange-traded funds, certain additional factors including the effect of the Fund’s prices and spreads, market participants, and basket compositions on the overall liquidity of the Fund’s portfolio, as applicable.
In accordance with the Program, each of the Fund’s portfolio investments is classified into one of four liquidity categories described below based on a determination of a reasonable expectation for how long it would take to convert the investment to cash (or sell or dispose of the investment) without significantly changing its market value.
- Highly liquid investments – cash or convertible to cash within three business days or less
- Moderately liquid investments – convertible to cash in three to seven calendar days
- Less liquid investments – can be sold or disposed of, but not settled, within seven calendar days
- Illiquid investments – cannot be sold or disposed of within seven calendar days
Liquidity classification determinations take into account a variety of factors including various market, trading and investment-specific considerations, as well as market depth, and generally utilize analysis from a third-party liquidity metrics service.
The Liquidity Rule places a 15% limit on a fund’s illiquid investments and requires funds that do not primarily hold assets that are highly liquid investments to determine and maintain a minimum percentage of the fund’s net assets to be invested in highly liquid investments (highly liquid investment minimum or HLIM). The Program includes provisions reasonably designed to comply with the 15% limit on illiquid investments and for determining, periodically reviewing and complying with the HLIM requirement as applicable.
At a recent meeting of the Fund’s Board of Trustees, the LRM Committee provided a written report to the Board pertaining to the operation, adequacy, and effectiveness of implementation of the Program for the annual period from December 1, 2018 through November 30, 2019. The report concluded that the Program has been implemented and is operating effectively and is reasonably designed to assess and manage the Fund’s liquidity risk.
Proxy Voting Results
A special meeting of shareholders was held on June 9, 2020. The results of votes taken among shareholders on the proposals before them are reported below. Each vote reported represents one dollar of net asset value held on the record date for the meeting.
PROPOSAL 1
To elect a Board of Trustees.
| | # of
Votes | % of
Votes |
| Dennis J. Dirks |
| Affirmative | 43,167,428,219.785 | 94.885 |
| Withheld | 2,327,070,930.034 | 5.115 |
| TOTAL | 45,494,499,149.820 | 100.000 |
| Donald F. Donahue |
| Affirmative | 43,161,668,935.467 | 94.872 |
| Withheld | 2,333,065,287.611 | 5.128 |
| TOTAL | 45,494,734,223.077 | 100.000 |
| Bettina Doulton |
| Affirmative | 43,304,465,213.969 | 95.186 |
| Withheld | 2,190,010,062.903 | 4.814 |
| TOTAL | 45,494,475,276.872 | 100.000 |
| Vicki L. Fuller |
| Affirmative | 43,380,442,631.493 | 95.353 |
| Withheld | 2,114,180,614.639 | 4.647 |
| TOTAL | 45,494,623,246.132 | 100.000 |
| Patricia L. Kampling |
| Affirmative | 43,128,008,796.761 | 94.798 |
| Withheld | 2,366,685,422.999 | 5.202 |
| TOTAL | 45,494,694,219.760 | 100.000 |
| Alan J. Lacy |
| Affirmative | 42,904,065,046.958 | 94.305 |
| Withheld | 2,590,717,567.229 | 5.695 |
| TOTAL | 45,494,782,614.187 | 100.000 |
| Ned C. Lautenbach |
| Affirmative | 42,802,778,827.017 | 94.083 |
| Withheld | 2,692,003,787.170 | 5.917 |
| TOTAL | 45,494,782,614.187 | 100.000 |
| Robert A. Lawrence |
| Affirmative | 42,971,258,294.203 | 94.453 |
| Withheld | 2,523,524,319.984 | 5.547 |
| TOTAL | 45,494,782,614.187 | 100.000 |
| Joseph Mauriello |
| Affirmative | 42,874,562,778.490 | 94.241 |
| Withheld | 2,620,171,874.731 | 5.759 |
| TOTAL | 45,494,734,653.220 | 100.000 |
| Cornelia M. Small |
| Affirmative | 43,029,040,988.063 | 94.580 |
| Withheld | 2,465,741,626.124 | 5.420 |
| TOTAL | 45,494,782,614.187 | 100.000 |
| Garnett A. Smith |
| Affirmative | 42,892,814,945.159 | 94.281 |
| Withheld | 2,601,967,669.028 | 5.719 |
| TOTAL | 45,494,782,614.187 | 100.000 |
| David M. Thomas |
| Affirmative | 42,936,080,036.111 | 94.376 |
| Withheld | 2,558,702,578.076 | 5.624 |
| TOTAL | 45,494,782,614.187 | 100.000 |
| Susan Tomasky |
| Affirmative | 43,147,934,105.796 | 94.842 |
| Withheld | 2,346,571,066.028 | 5.158 |
| TOTAL | 45,494,782,614.187 | 100.000 |
| Michael E. Wiley |
| Affirmative | 42,885,333,102.972 | 94.264 |
| Withheld | 2,609,449,511.215 | 5.736 |
| TOTAL | 45,494,782,614.187 | 100.000 |
PROPOSAL 2
To convert a fundamental investment policy to a non-fundamental investment policy.
| | # of
Votes | % of
Votes |
| Affirmative | 838,939,956.860 | 100.000 |
| Against | 0.000 | 0.000 |
| Abstain | 0.000 | 0.000 |
| Broker Non-Vote | 0.000 | 0.000 |
| TOTAL | 838,939,956.860 | 100.000 |
|
| Proposal 1 reflects trust wide proposal and voting results. |
SRE-ANN-0920
1.924310.108
Fidelity® Series Blue Chip Growth Fund
Annual Report
July 31, 2020
See the inside front cover for important information about access to your fund’s shareholder reports.
Beginning on January 1, 2021, as permitted by regulations adopted by the Securities and Exchange Commission, paper copies of a fund’s shareholder reports will no longer be sent by mail, unless you specifically request paper copies of the reports from the fund or from your financial intermediary, such as a financial advisor, broker-dealer or bank. Instead, the reports will be made available on a website, and you will be notified by mail each time a report is posted and provided with a website link to access the report.
If you already elected to receive shareholder reports electronically, you will not be affected by this change and you need not take any action. You may elect to receive shareholder reports and other communications from a fund electronically, by contacting your financial intermediary. For Fidelity customers, visit Fidelity's web site or call Fidelity using the contact information listed below.
You may elect to receive all future reports in paper free of charge. If you wish to continue receiving paper copies of your shareholder reports, you may contact your financial intermediary or, if you are a Fidelity customer, visit Fidelity’s website, or call Fidelity at the applicable toll-free number listed below. Your election to receive reports in paper will apply to all funds held with the fund complex/your financial intermediary.
| Account Type | Website | Phone Number |
| Brokerage, Mutual Fund, or Annuity Contracts: | fidelity.com/mailpreferences | 1-800-343-3548 |
| Employer Provided Retirement Accounts: | netbenefits.fidelity.com/preferences (choose 'no' under Required Disclosures to continue to print) | 1-800-343-0860 |
| Advisor Sold Accounts Serviced Through Your Financial Intermediary: | Contact Your Financial Intermediary | Your Financial Intermediary's phone number |
| Advisor Sold Accounts Serviced by Fidelity: | institutional.fidelity.com | 1-877-208-0098 |
Contents
To view a fund's proxy voting guidelines and proxy voting record for the 12-month period ended June 30, visit http://www.fidelity.com/proxyvotingresults or visit the Securities and Exchange Commission's (SEC) web site at http://www.sec.gov.
You may also call 1-800-544-8544 to request a free copy of the proxy voting guidelines.
Standard & Poor's, S&P and S&P 500 are registered service marks of The McGraw-Hill Companies, Inc. and have been licensed for use by Fidelity Distributors Corporation.
Other third-party marks appearing herein are the property of their respective owners.
All other marks appearing herein are registered or unregistered trademarks or service marks of FMR LLC or an affiliated company. © 2020 FMR LLC. All rights reserved.
This report and the financial statements contained herein are submitted for the general information of the shareholders of the Fund. This report is not authorized for distribution to prospective investors in the Fund unless preceded or accompanied by an effective prospectus.
A fund files its complete schedule of portfolio holdings with the SEC for the first and third quarters of each fiscal year on Form N-PORT. Forms N-PORT are available on the SEC’s web site at http://www.sec.gov. A fund's Forms N-PORT may be reviewed and copied at the SEC’s Public Reference Room in Washington, DC. Information regarding the operation of the SEC's Public Reference Room may be obtained by calling 1-800-SEC-0330.
For a complete list of a fund's portfolio holdings, view the most recent holdings listing, semiannual report, or annual report on Fidelity's web site at http://www.fidelity.com, http://www.institutional.fidelity.com, or http://www.401k.com, as applicable.
NOT FDIC INSURED •MAY LOSE VALUE •NO BANK GUARANTEE
Neither the Fund nor Fidelity Distributors Corporation is a bank.
Note to Shareholders:
Early in 2020, the outbreak and spread of a new coronavirus emerged as a public health emergency that had a major influence on financial markets, primarily based on its impact on the global economy and the outlook for corporate earnings. The virus causes a respiratory disease known as COVID-19. On March 11, the World Health Organization declared the COVID-19 outbreak a pandemic, citing sustained risk of further global spread.
In the weeks following, as the crisis worsened, we witnessed an escalating human tragedy with wide-scale social and economic consequences from coronavirus-containment measures. The outbreak of COVID-19 prompted a number of measures to limit the spread, including travel and border restrictions, quarantines, and restrictions on large gatherings. In turn, these resulted in lower consumer activity, diminished demand for a wide range of products and services, disruption in manufacturing and supply chains, and – given the wide variability in outcomes regarding the outbreak – significant market uncertainty and volatility. Amid the turmoil, the U.S. government took unprecedented action – in concert with the U.S. Federal Reserve and central banks around the world – to help support consumers, businesses, and the broader economy, and to limit disruption to the financial system.
The situation continues to unfold, and the extent and duration of its impact on financial markets and the economy remain highly uncertain. Extreme events such as the coronavirus crisis are “exogenous shocks” that can have significant adverse effects on mutual funds and their investments. Although multiple asset classes may be affected by market disruption, the duration and impact may not be the same for all types of assets.
Fidelity is committed to helping you stay informed amid news about COVID-19 and during increased market volatility, and we’re taking extra steps to be responsive to customer needs. We encourage you to visit our websites, where we offer ongoing updates, commentary, and analysis on the markets and our funds.
Performance: The Bottom Line
Average annual total return reflects the change in the value of an investment, assuming reinvestment of distributions from dividend income and capital gains (the profits earned upon the sale of securities that have grown in value, if any) and assuming a constant rate of performance each year. The hypothetical investment and the average annual total returns do not reflect the deduction of taxes that a shareholder would pay on fund distributions or the redemption of fund shares. During periods of reimbursement by Fidelity, a fund’s total return will be greater than it would be had the reimbursement not occurred. How a fund did yesterday is no guarantee of how it will do tomorrow.
Average Annual Total Returns
| For the periods ended July 31, 2020 | Past 1 year | Past 5 years | Life of fundA |
| Fidelity® Series Blue Chip Growth Fund | 39.00% | 18.98% | 18.98% |
A From November 7, 2013
$10,000 Over Life of Fund
Let's say hypothetically that $10,000 was invested in Fidelity® Series Blue Chip Growth Fund on November 7, 2013, when the fund started.
The chart shows how the value of your investment would have changed, and also shows how the Russell 1000® Growth Index performed over the same period.
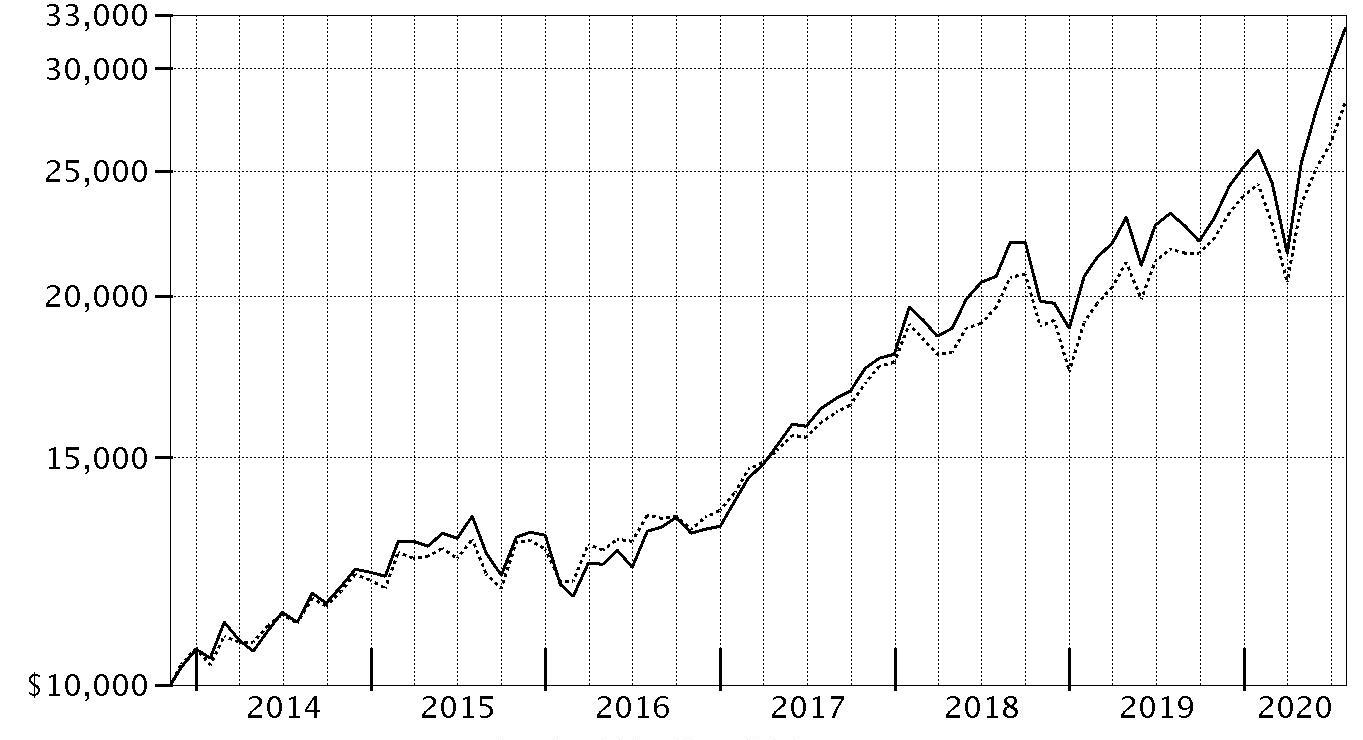
| Period Ending Values |
| $32,221 | Fidelity® Series Blue Chip Growth Fund |
| $28,232 | Russell 1000® Growth Index |
Management's Discussion of Fund Performance
Market Recap: The S&P 500
® index gained 11.96% for the 12 months ending July 31, 2020, in what was a bumpy ride for U.S. equity investors, marked by a steep but brief decline due to the early-2020 outbreak and spread of the coronavirus, followed by a historic rebound. Declared a pandemic on March 11, the COVID-19 crisis and containment efforts caused broad contraction in economic activity, along with extreme uncertainty, volatility and dislocation in financial markets. By mid-March, U.S. stocks entered bear-market territory less than a month after hitting an all-time high and extending the longest-running bull market in American history. Stocks slid in late February, after a surge in COVID-19 cases outside China. The sudden downtrend continued in March (-12%), capping the index’s worst quarter since 2008. A historically rapid and expansive U.S. monetary/fiscal-policy response provided a partial offset to the economic disruption and fueled a sharp uptrend. Aggressive support for financial markets by the U.S. Federal Reserve, plans for reopening the economy and improving infection data boosted stocks in April (+13%) and May (+5%). In June and July, the index gained amid progress on potential treatments and signs of an early recovery in economic activity. For the full 12 months, growth stocks widely topped value, while large-caps handily bested smaller-caps. The information technology sector (+39%) led the way, followed by consumer discretionary (+22%). In contrast, energy (-38%) fell hard along with the price of crude oil.
Comments from Portfolio Manager Sonu Kalra: For the fiscal year ending July 31, 2020, the fund gained 39%, outperforming the 29.84% result of the benchmark Russell 1000 Growth Index. Top contributors to performance versus the benchmark were security selection – especially in information technology and communication services – and an overweighting in consumer discretionary. The fund's top individual relative contributor was an overweighting in Tesla, which gained about 489% the past 12 months. We decreased our stake in this company by period end. Also adding value was our outsized stake in Nvidia, which gained roughly 153%. Nvidia was among our larger holdings for the 12 months, on average. The fund's non-benchmark stake in Shopify gained 222%. Conversely, the primary detractor from performance versus the benchmark was stock picks in the consumer staples sector, primarily within the food, beverage & tobacco industry. Weak picks in the industrials sector, especially within the transportation industry, also hindered relative performance, as did an underweighting in information technology. Our non-benchmark stake in JUUL Labs was the fund's biggest individual relative detractor, due to its -65% result. Also hindering performance was our out-of-index stake in Lyft, which returned about -51%. Lyft was not held at period end. An underweighting in Apple, a very large component in the benchmark that performed well, also detracted. Notable changes in positioning by period end included increased exposure to the consumer discretionary sector and a lower allocation to industrials.
The views expressed above reflect those of the portfolio manager(s) only through the end of the period as stated on the cover of this report and do not necessarily represent the views of Fidelity or any other person in the Fidelity organization. Any such views are subject to change at any time based upon market or other conditions and Fidelity disclaims any responsibility to update such views. These views may not be relied on as investment advice and, because investment decisions for a Fidelity fund are based on numerous factors, may not be relied on as an indication of trading intent on behalf of any Fidelity fund.
Investment Summary (Unaudited)
Top Ten Stocks as of July 31, 2020
| | % of fund's net assets |
| Amazon.com, Inc. | 9.0 |
| Apple, Inc. | 8.0 |
| Microsoft Corp. | 6.0 |
| Alphabet, Inc. Class A | 4.9 |
| Facebook, Inc. Class A | 4.4 |
| lululemon athletica, Inc. | 3.2 |
| Tesla, Inc. | 2.8 |
| NVIDIA Corp. | 2.8 |
| Marvell Technology Group Ltd. | 2.7 |
| Salesforce.com, Inc. | 1.7 |
| | 45.5 |
Top Five Market Sectors as of July 31, 2020
| | % of fund's net assets |
| Information Technology | 35.7 |
| Consumer Discretionary | 29.5 |
| Communication Services | 14.1 |
| Health Care | 10.5 |
| Industrials | 4.4 |
Asset Allocation (% of fund's net assets)
| As of July 31, 2020 * |
| | Stocks | 97.0% |
| | Convertible Securities | 2.8% |
| | Short-Term Investments and Net Other Assets (Liabilities) | 0.2% |

* Foreign investments - 12.9%
Schedule of Investments July 31, 2020
Showing Percentage of Net Assets
| Common Stocks - 96.9% | | | |
| | | Shares | Value |
| COMMUNICATION SERVICES - 14.1% | | | |
| Entertainment - 3.2% | | | |
| Activision Blizzard, Inc. | | 367,248 | $30,345,702 |
| CD Projekt RED SA (a) | | 5,700 | 611,799 |
| CD Projekt RED SA ADR (a) | | 104,800 | 2,903,484 |
| Electronic Arts, Inc. (a) | | 25,800 | 3,653,796 |
| Netflix, Inc. (a) | | 138,424 | 67,672,725 |
| Nintendo Co. Ltd. | | 10,700 | 4,705,970 |
| Nintendo Co. Ltd. ADR | | 32,500 | 1,787,825 |
| Roku, Inc. Class A (a) | | 68,455 | 10,602,995 |
| Sea Ltd. ADR (a) | | 425,931 | 52,048,768 |
| Spotify Technology SA (a) | | 25,300 | 6,522,846 |
| Take-Two Interactive Software, Inc. (a) | | 8,300 | 1,361,366 |
| WME Entertainment Parent, LLC Class A (a)(b)(c)(d) | | 3,194,617 | 4,759,979 |
| | | | 186,977,255 |
| Interactive Media & Services - 10.6% | | | |
| Alphabet, Inc. Class A (a) | | 190,313 | 283,176,228 |
| CarGurus, Inc. Class A (a) | | 253,100 | 7,312,059 |
| Facebook, Inc. Class A (a) | | 1,007,710 | 255,625,796 |
| Match Group, Inc. (a) | | 124,463 | 12,782,350 |
| Pinterest, Inc. Class A (a) | | 23,800 | 816,102 |
| Snap, Inc. Class A (a) | | 388,100 | 8,701,202 |
| Tencent Holdings Ltd. | | 371,200 | 25,463,658 |
| Twitter, Inc. (a) | | 89,300 | 3,250,520 |
| Yandex NV Series A (a) | | 50,300 | 2,894,262 |
| Zoominfo Technologies, Inc. | | 293,700 | 12,003,519 |
| | | | 612,025,696 |
| Media - 0.0% | | | |
| The New York Times Co. Class A | | 39,700 | 1,831,758 |
| Wireless Telecommunication Services - 0.3% | | | |
| T-Mobile U.S., Inc. | | 126,334 | 13,565,745 |
|
| TOTAL COMMUNICATION SERVICES | | | 814,400,454 |
|
| CONSUMER DISCRETIONARY - 29.0% | | | |
| Auto Components - 0.1% | | | |
| BorgWarner, Inc. | | 87,700 | 3,209,820 |
| Lear Corp. | | 7,117 | 785,574 |
| | | | 3,995,394 |
| Automobiles - 2.8% | | | |
| Harley-Davidson, Inc. (e) | | 108,200 | 2,816,446 |
| Li Auto, Inc. ADR (a) | | 93,800 | 1,500,800 |
| Tesla, Inc. (a) | | 112,707 | 161,256,667 |
| | | | 165,573,913 |
| Distributors - 0.0% | | | |
| Pool Corp. | | 6,900 | 2,185,230 |
| Diversified Consumer Services - 0.0% | | | |
| Bright Horizons Family Solutions, Inc. (a) | | 5,500 | 589,820 |
| Youdao, Inc. ADR (a) | | 19,600 | 829,276 |
| | | | 1,419,096 |
| Hotels, Restaurants & Leisure - 2.6% | | | |
| Boyd Gaming Corp. | | 304,200 | 7,200,414 |
| Caesars Entertainment, Inc. (a) | | 570,247 | 17,706,169 |
| Chipotle Mexican Grill, Inc. (a) | | 24,442 | 28,234,421 |
| Churchill Downs, Inc. | | 67,052 | 9,288,043 |
| Darden Restaurants, Inc. | | 62,529 | 4,745,951 |
| Domino's Pizza, Inc. | | 4,400 | 1,701,084 |
| DraftKings, Inc. Class A (a)(e) | | 57,900 | 1,932,413 |
| Evolution Gaming Group AB (f) | | 56,700 | 3,864,251 |
| Hilton Worldwide Holdings, Inc. | | 73,900 | 5,546,195 |
| Kambi Group PLC (a) | | 57,198 | 1,374,529 |
| Las Vegas Sands Corp. | | 74,500 | 3,251,180 |
| Marriott International, Inc. Class A | | 87,200 | 7,309,540 |
| Penn National Gaming, Inc. (a) | | 790,332 | 26,752,738 |
| Starbucks Corp. | | 145,939 | 11,168,712 |
| Texas Roadhouse, Inc. Class A | | 110,000 | 6,180,900 |
| Vail Resorts, Inc. | | 36,676 | 7,042,892 |
| Wingstop, Inc. | | 20,300 | 3,171,875 |
| Wynn Resorts Ltd. | | 42,300 | 3,063,789 |
| | | | 149,535,096 |
| Household Durables - 0.8% | | | |
| D.R. Horton, Inc. | | 45,100 | 2,983,816 |
| iRobot Corp. (a)(e) | | 72,300 | 5,255,487 |
| KB Home | | 89,400 | 3,007,416 |
| Leggett & Platt, Inc. | | 31,600 | 1,266,844 |
| Lennar Corp. Class A | | 72,400 | 5,238,140 |
| NVR, Inc. (a) | | 800 | 3,144,120 |
| PulteGroup, Inc. | | 31,900 | 1,390,840 |
| Sony Corp. sponsored ADR | | 68,800 | 5,363,648 |
| Taylor Morrison Home Corp. (a) | | 236,100 | 5,536,545 |
| Tempur Sealy International, Inc. (a) | | 61,700 | 4,994,615 |
| Toll Brothers, Inc. | | 127,400 | 4,866,680 |
| TRI Pointe Homes, Inc. (a) | | 340,600 | 5,694,832 |
| Whirlpool Corp. | | 7,800 | 1,272,336 |
| | | | 50,015,319 |
| Internet & Direct Marketing Retail - 12.3% | | | |
| Alibaba Group Holding Ltd. sponsored ADR (a) | | 129,788 | 32,579,384 |
| Amazon.com, Inc. (a) | | 164,080 | 519,260,693 |
| Chewy, Inc. (a)(e) | | 13,700 | 719,113 |
| Delivery Hero AG (a)(f) | | 29,000 | 3,339,535 |
| eBay, Inc. | | 73,400 | 4,057,552 |
| Expedia, Inc. | | 101,000 | 8,182,010 |
| Farfetch Ltd. Class A (a) | | 188,300 | 4,826,129 |
| Fiverr International Ltd. (a) | | 35,800 | 3,344,794 |
| JD.com, Inc.: | | | |
| Class A | | 60,000 | 1,864,186 |
| sponsored ADR (a) | | 99,500 | 6,347,105 |
| Kogan.Com Ltd. | | 152,091 | 1,810,299 |
| MercadoLibre, Inc. (a) | | 14,182 | 15,949,361 |
| Ocado Group PLC (a) | | 157,963 | 4,245,061 |
| Pinduoduo, Inc. ADR (a) | | 362,698 | 33,295,676 |
| The Booking Holdings, Inc. (a) | | 12,512 | 20,796,571 |
| The Honest Co., Inc. (a)(c)(d) | | 71,609 | 1,185,129 |
| The RealReal, Inc. (a)(e) | | 547,431 | 7,466,959 |
| Wayfair LLC Class A (a) | | 158,988 | 42,305,117 |
| | | | 711,574,674 |
| Leisure Products - 0.6% | | | |
| Bafang Electric Suzhou Co. Ltd. (A Shares) | | 27,100 | 619,965 |
| BRP, Inc. | | 42,600 | 1,908,246 |
| Callaway Golf Co. | | 112,300 | 2,139,315 |
| Peloton Interactive, Inc. Class A (a) | | 342,552 | 23,368,897 |
| Polaris, Inc. | | 12,800 | 1,326,464 |
| Vista Outdoor, Inc. (a) | | 249,700 | 4,282,355 |
| | | | 33,645,242 |
| Multiline Retail - 0.5% | | | |
| Dollar General Corp. | | 28,525 | 5,431,160 |
| Dollar Tree, Inc. (a) | | 155,004 | 14,469,623 |
| Nordstrom, Inc. (e) | | 31,200 | 427,128 |
| Ollie's Bargain Outlet Holdings, Inc. (a) | | 32,400 | 3,405,240 |
| Target Corp. | | 25,800 | 3,247,704 |
| | | | 26,980,855 |
| Specialty Retail - 4.6% | | | |
| Advance Auto Parts, Inc. | | 4,300 | 645,602 |
| Bed Bath & Beyond, Inc. (e) | | 46,251 | 500,436 |
| Burlington Stores, Inc. (a) | | 45,703 | 8,592,164 |
| Carvana Co. Class A (a)(e) | | 236,031 | 36,573,003 |
| Dick's Sporting Goods, Inc. | | 76,700 | 3,499,054 |
| Five Below, Inc. (a) | | 75,784 | 8,253,635 |
| Floor & Decor Holdings, Inc. Class A (a) | | 214,640 | 14,144,776 |
| Gap, Inc. | | 230,069 | 3,076,023 |
| Lowe's Companies, Inc. | | 445,606 | 66,355,189 |
| Michaels Companies, Inc. (a) | | 377,900 | 2,713,322 |
| RH (a)(e) | | 298,804 | 85,885,234 |
| The Home Depot, Inc. | | 111,203 | 29,523,284 |
| Vroom, Inc. | | 28,900 | 1,710,591 |
| Williams-Sonoma, Inc. | | 37,000 | 3,223,440 |
| | | | 264,695,753 |
| Textiles, Apparel & Luxury Goods - 4.7% | | | |
| adidas AG | | 23,895 | 6,583,610 |
| Allbirds, Inc. (a)(c)(d) | | 40,405 | 416,172 |
| Anta Sports Products Ltd. | | 58,000 | 550,043 |
| Aritzia LP (a) | | 144,900 | 1,918,009 |
| Crocs, Inc. (a) | | 371,384 | 13,347,541 |
| Deckers Outdoor Corp. (a) | | 45,395 | 9,498,904 |
| lululemon athletica, Inc. (a) | | 570,774 | 185,838,307 |
| LVMH Moet Hennessy Louis Vuitton SE | | 16,261 | 7,070,985 |
| Moncler SpA | | 139,623 | 5,361,687 |
| NIKE, Inc. Class B | | 291,813 | 28,483,867 |
| PVH Corp. | | 87,820 | 4,273,321 |
| Tory Burch LLC (a)(b)(c)(d) | | 106,817 | 5,997,775 |
| VF Corp. | | 36,600 | 2,209,176 |
| | | | 271,549,397 |
|
| TOTAL CONSUMER DISCRETIONARY | | | 1,681,169,969 |
|
| CONSUMER STAPLES - 2.0% | | | |
| Beverages - 0.5% | | | |
| Boston Beer Co., Inc. Class A (a) | | 13,500 | 10,940,940 |
| Keurig Dr. Pepper, Inc. | | 184,800 | 5,653,032 |
| Monster Beverage Corp. (a) | | 135,200 | 10,610,496 |
| | | | 27,204,468 |
| Food & Staples Retailing - 0.5% | | | |
| BJ's Wholesale Club Holdings, Inc. (a) | | 233,200 | 9,339,660 |
| Costco Wholesale Corp. | | 22,156 | 7,212,443 |
| Kroger Co. | | 213,300 | 7,420,707 |
| Performance Food Group Co. (a) | | 179,055 | 5,017,121 |
| Zur Rose Group AG (a) | | 3,920 | 1,082,281 |
| | | | 30,072,212 |
| Food Products - 0.1% | | | |
| Act II Global Acquisition Corp. Class A (a) | | 274,900 | 1,907,806 |
| Freshpet, Inc. (a) | | 18,300 | 1,757,715 |
| JDE Peet's BV | | 80,900 | 3,597,430 |
| | | | 7,262,951 |
| Household Products - 0.7% | | | |
| Clorox Co. | | 56,575 | 13,380,553 |
| Procter & Gamble Co. | | 151,500 | 19,864,680 |
| Reckitt Benckiser Group PLC | | 39,900 | 4,000,758 |
| | | | 37,245,991 |
| Personal Products - 0.1% | | | |
| Herbalife Nutrition Ltd. (a) | | 132,900 | 6,809,796 |
| Tobacco - 0.1% | | | |
| JUUL Labs, Inc. Class B (a)(c)(d) | | 2,450 | 246,397 |
| Swedish Match Co. AB | | 67,600 | 5,181,463 |
| | | | 5,427,860 |
|
| TOTAL CONSUMER STAPLES | | | 114,023,278 |
|
| ENERGY - 0.6% | | | |
| Oil, Gas & Consumable Fuels - 0.6% | | | |
| Occidental Petroleum Corp. warrants 8/3/27 (a) | | 4,112 | 23,027 |
| Reliance Industries Ltd. | | 1,060,921 | 29,271,620 |
| Reliance Industries Ltd. (a) | | 70,728 | 1,111,427 |
| Reliance Industries Ltd. sponsored GDR (f) | | 68,500 | 3,774,350 |
| | | | 34,180,424 |
| FINANCIALS - 0.9% | | | |
| Banks - 0.0% | | | |
| Kotak Mahindra Bank Ltd. | | 118,376 | 2,157,929 |
| Capital Markets - 0.5% | | | |
| BlackRock, Inc. Class A | | 11,600 | 6,670,116 |
| Goldman Sachs Group, Inc. | | 12,200 | 2,415,112 |
| Insurance Acquisition Corp. Class A (a) | | 206,800 | 2,214,828 |
| London Stock Exchange Group PLC | | 28,921 | 3,194,583 |
| Moody's Corp. | | 4,200 | 1,181,460 |
| Morgan Stanley | | 52,900 | 2,585,752 |
| MSCI, Inc. | | 19,555 | 7,352,289 |
| Open Lending Corp. (a)(e) | | 34,700 | 588,512 |
| | | | 26,202,652 |
| Consumer Finance - 0.2% | | | |
| Ally Financial, Inc. | | 296,987 | 5,969,439 |
| Capital One Financial Corp. | | 61,200 | 3,904,560 |
| Discover Financial Services | | 36,100 | 1,784,423 |
| Synchrony Financial | | 23,600 | 522,268 |
| | | | 12,180,690 |
| Diversified Financial Services - 0.0% | | | |
| dMY Technology Group, Inc. (a) | | 133,703 | 1,415,246 |
| Insurance - 0.2% | | | |
| eHealth, Inc. (a)(e) | | 117,737 | 8,140,336 |
|
| TOTAL FINANCIALS | | | 50,096,853 |
|
| HEALTH CARE - 10.3% | | | |
| Biotechnology - 4.2% | | | |
| ACADIA Pharmaceuticals, Inc. (a) | | 83,157 | 3,456,836 |
| Acceleron Pharma, Inc. (a) | | 76,120 | 7,548,820 |
| ADC Therapeutics SA (a) | | 52,100 | 2,422,650 |
| Agios Pharmaceuticals, Inc. (a) | | 108,111 | 4,899,591 |
| Aimmune Therapeutics, Inc. (a)(e) | | 141,182 | 1,865,014 |
| Akouos, Inc. (a) | | 43,100 | 842,605 |
| Allakos, Inc. (a)(e) | | 23,230 | 1,743,876 |
| Alnylam Pharmaceuticals, Inc. (a) | | 223,381 | 32,560,015 |
| Annexon, Inc. (a)(e) | | 75,200 | 1,370,896 |
| Arcutis Biotherapeutics, Inc. (a) | | 73,700 | 1,967,790 |
| Argenx SE ADR (a) | | 18,637 | 4,288,933 |
| Ascendis Pharma A/S sponsored ADR (a) | | 140,596 | 19,347,416 |
| Avidity Biosciences, Inc. | | 36,700 | 1,034,573 |
| BeiGene Ltd. (a) | | 148,600 | 2,444,615 |
| BeiGene Ltd. ADR (a) | | 26,506 | 5,539,754 |
| BioNTech SE: | | | |
| ADR (a) | | 23,418 | 1,922,852 |
| rights 8/14/20 (a) | | 17,518 | 0 |
| BioXcel Therapeutics, Inc. (a) | | 11,300 | 512,568 |
| Bridgebio Pharma, Inc. (a)(e) | | 36,934 | 1,039,323 |
| Cibus Corp.: | | | |
| Series C (a)(b)(c)(d) | | 726,554 | 1,211,995 |
| Series D (a)(b)(c)(d) | | 398,640 | 498,300 |
| Coherus BioSciences, Inc. (a)(e) | | 138,170 | 2,430,410 |
| Crinetics Pharmaceuticals, Inc. (a) | | 81,548 | 1,131,886 |
| CytomX Therapeutics, Inc. (a)(f) | | 137,854 | 966,357 |
| FibroGen, Inc. (a) | | 71,286 | 2,884,944 |
| Forma Therapeutics Holdings, Inc. | | 28,900 | 1,010,344 |
| Fusion Pharmaceuticals, Inc. (a) | | 48,200 | 663,232 |
| Generation Bio Co. | | 15,200 | 298,528 |
| Generation Bio Co. | | 123,522 | 2,183,374 |
| Global Blood Therapeutics, Inc. (a) | | 161,895 | 10,924,675 |
| Immunomedics, Inc. (a) | | 36,900 | 1,558,287 |
| Insmed, Inc. (a) | | 40,300 | 1,052,636 |
| Intercept Pharmaceuticals, Inc. (a) | | 72,614 | 3,314,103 |
| Ionis Pharmaceuticals, Inc. (a) | | 72,666 | 4,182,655 |
| Karuna Therapeutics, Inc. (a) | | 40,000 | 3,272,000 |
| Mirati Therapeutics, Inc. (a) | | 11,900 | 1,443,589 |
| Moderna, Inc. (a) | | 47,300 | 3,504,930 |
| Morphic Holding, Inc. (a) | | 43,594 | 981,301 |
| Myovant Sciences Ltd. (a) | | 135,700 | 2,062,640 |
| Neurocrine Biosciences, Inc. (a) | | 71,188 | 8,568,188 |
| Nkarta, Inc. (a)(e) | | 20,533 | 528,725 |
| Principia Biopharma, Inc. (a) | | 44,107 | 3,687,345 |
| Protagonist Therapeutics, Inc. (a) | | 36,900 | 580,437 |
| Regeneron Pharmaceuticals, Inc. (a) | | 76,300 | 48,226,941 |
| Relay Therapeutics, Inc. (a) | | 25,400 | 900,684 |
| Revolution Medicines, Inc. | | 61,300 | 1,478,556 |
| Sage Therapeutics, Inc. (a) | | 169,867 | 7,740,839 |
| Sarepta Therapeutics, Inc. (a) | | 63,336 | 9,723,343 |
| Seattle Genetics, Inc. (a) | | 18,800 | 3,125,876 |
| Turning Point Therapeutics, Inc. (a) | | 88,249 | 5,226,988 |
| Vaxcyte, Inc. | | 68,700 | 2,157,867 |
| Viela Bio, Inc. | | 9,655 | 353,470 |
| Xencor, Inc. (a) | | 114,918 | 3,457,883 |
| Zai Lab Ltd. ADR (a) | | 107,664 | 8,194,307 |
| | | | 244,335,762 |
| Health Care Equipment & Supplies - 3.1% | | | |
| Atricure, Inc. (a) | | 11,700 | 477,477 |
| Axonics Modulation Technologies, Inc. (a) | | 130,420 | 5,524,591 |
| Becton, Dickinson & Co. | | 103,600 | 29,146,824 |
| Danaher Corp. | | 15,600 | 3,179,280 |
| DexCom, Inc.(a) | | 53,215 | 23,177,261 |
| Hologic, Inc. (a) | | 103,600 | 7,229,208 |
| InMode Ltd. (a)(e) | | 82,100 | 2,656,756 |
| Insulet Corp. (a) | | 94,198 | 19,156,105 |
| Intuitive Surgical, Inc. (a) | | 46,346 | 31,767,402 |
| Masimo Corp. (a) | | 29,900 | 6,581,588 |
| Novocure Ltd. (a) | | 44,807 | 3,395,923 |
| Quidel Corp. (a) | | 89,400 | 25,252,818 |
| Shockwave Medical, Inc. (a) | | 181,584 | 8,955,723 |
| Tandem Diabetes Care, Inc. (a) | | 96,817 | 10,113,504 |
| West Pharmaceutical Services, Inc. | | 22,000 | 5,915,140 |
| | | | 182,529,600 |
| Health Care Providers & Services - 1.0% | | | |
| 1Life Healthcare, Inc. (a) | | 106,059 | 3,140,407 |
| Alignment Healthcare Partners unit (c)(d) | | 54,574 | 870,925 |
| Cigna Corp. | | 15,700 | 2,711,233 |
| Guardant Health, Inc. (a) | | 60,680 | 5,168,722 |
| Humana, Inc. | | 29,709 | 11,659,297 |
| UnitedHealth Group, Inc. | | 107,228 | 32,466,494 |
| | | | 56,017,078 |
| Life Sciences Tools & Services - 0.5% | | | |
| 10X Genomics, Inc. (a) | | 60,933 | 5,993,979 |
| Berkeley Lights, Inc. (a) | | 7,700 | 461,769 |
| Eurofins Scientific SA | | 1,700 | 1,104,988 |
| Nanostring Technologies, Inc. (a) | | 56,100 | 2,025,771 |
| Thermo Fisher Scientific, Inc. | | 46,338 | 19,181,615 |
| | | | 28,768,122 |
| Pharmaceuticals - 1.5% | | | |
| AstraZeneca PLC sponsored ADR | | 350,535 | 19,552,842 |
| Chiasma, Inc. warrants 12/16/24 (a) | | 23,784 | 20,895 |
| Eli Lilly & Co. | | 149,100 | 22,408,239 |
| Hansoh Pharmaceutical Group Co. Ltd. (a)(f) | | 492,000 | 2,126,627 |
| Horizon Pharma PLC (a) | | 90,099 | 5,513,158 |
| Intra-Cellular Therapies, Inc. (a) | | 90,800 | 1,800,110 |
| MyoKardia, Inc. (a) | | 30,455 | 2,744,909 |
| Nektar Therapeutics (a) | | 142,751 | 3,163,362 |
| OptiNose, Inc. (a)(e) | | 244,379 | 1,245,111 |
| Roche Holding AG (participation certificate) | | 15,301 | 5,299,602 |
| Royalty Pharma PLC | | 36,400 | 1,567,020 |
| Zoetis, Inc. Class A | | 126,479 | 19,184,335 |
| | | | 84,626,210 |
|
| TOTAL HEALTH CARE | | | 596,276,772 |
|
| INDUSTRIALS - 4.2% | | | |
| Aerospace & Defense - 0.2% | | | |
| Avon Rubber PLC | | 29,400 | 1,277,689 |
| Axon Enterprise, Inc. (a) | | 35,800 | 2,976,054 |
| Space Exploration Technologies Corp.: | | | |
| Class A (a)(c)(d) | | 22,703 | 6,129,810 |
| Class C (a)(c)(d) | | 686 | 185,220 |
| | | | 10,568,773 |
| Air Freight & Logistics - 0.0% | | | |
| XPO Logistics, Inc. (a) | | 41,400 | 3,105,828 |
| Airlines - 0.1% | | | |
| Spirit Airlines, Inc. (a)(e) | | 277,440 | 4,386,326 |
| Building Products - 0.1% | | | |
| Fortune Brands Home & Security, Inc. | | 33,200 | 2,539,800 |
| The AZEK Co., Inc. | | 31,500 | 1,086,750 |
| | | | 3,626,550 |
| Commercial Services & Supplies - 0.2% | | | |
| Copart, Inc. (a) | | 59,991 | 5,594,161 |
| HNI Corp. | | 32,500 | 965,250 |
| HomeServe PLC | | 268,899 | 4,674,411 |
| Knoll, Inc. | | 90,500 | 1,059,755 |
| Steelcase, Inc. Class A | | 113,500 | 1,217,855 |
| | | | 13,511,432 |
| Construction & Engineering - 0.1% | | | |
| Dycom Industries, Inc. (a) | | 138,707 | 5,940,821 |
| Electrical Equipment - 0.0% | | | |
| Sensata Technologies, Inc. PLC (a) | | 74,500 | 2,829,510 |
| Machinery - 0.2% | | | |
| Nikola Corp. (a) | | 404,116 | 12,123,480 |
| Professional Services - 0.2% | | | |
| Equifax, Inc. | | 54,187 | 8,808,639 |
| Manpower, Inc. | | 49,300 | 3,391,347 |
| | | | 12,199,986 |
| Road & Rail - 3.1% | | | |
| Knight-Swift Transportation Holdings, Inc. Class A | | 190,952 | 8,304,502 |
| Lyft, Inc. (a)(e) | | 2,692,172 | 78,692,188 |
| Uber Technologies, Inc. (a) | | 2,994,875 | 90,624,918 |
| | | | 177,621,608 |
|
| TOTAL INDUSTRIALS | | | 245,914,314 |
|
| INFORMATION TECHNOLOGY - 35.1% | | | |
| Electronic Equipment & Components - 0.8% | | | |
| Flextronics International Ltd. (a) | | 359,800 | 4,134,102 |
| FLIR Systems, Inc. | | 140,100 | 5,836,566 |
| II-VI, Inc. (a) | | 427,600 | 21,687,872 |
| Jabil, Inc. | | 322,400 | 11,238,864 |
| | | | 42,897,404 |
| IT Services - 6.2% | | | |
| Alliance Data Systems Corp. | | 56,100 | 2,488,596 |
| Endava PLC ADR (a) | | 67,124 | 3,466,955 |
| MasterCard, Inc. Class A | | 209,381 | 64,600,320 |
| MongoDB, Inc. Class A (a) | | 41,580 | 9,525,146 |
| PayPal Holdings, Inc. (a) | | 277,062 | 54,323,546 |
| Repay Holdings Corp. (a) | | 90,300 | 1,998,339 |
| Riskified Ltd. (c)(d) | | 80,450 | 765,433 |
| Riskified Ltd. warrants (a)(c)(d) | | 692 | 1 |
| Shopify, Inc. Class A (a) | | 76,614 | 78,348,818 |
| Square, Inc. (a) | | 98,600 | 12,803,210 |
| Twilio, Inc. Class A (a) | | 111,470 | 30,924,007 |
| Visa, Inc. Class A | | 467,121 | 88,939,838 |
| Wix.com Ltd. (a) | | 38,600 | 11,212,528 |
| | | | 359,396,737 |
| Semiconductors & Semiconductor Equipment - 8.8% | | | |
| Advanced Micro Devices, Inc. (a) | | 473,452 | 36,659,388 |
| Cirrus Logic, Inc. (a) | | 48,100 | 3,296,293 |
| Enphase Energy, Inc. (a) | | 93,700 | 5,655,732 |
| Inphi Corp. (a) | | 11,300 | 1,476,458 |
| Lam Research Corp. | | 8,900 | 3,356,724 |
| Lattice Semiconductor Corp. (a) | | 97,900 | 3,043,711 |
| Marvell Technology Group Ltd. | | 4,223,579 | 154,033,926 |
| MediaTek, Inc. | | 128,000 | 3,055,923 |
| Micron Technology, Inc. (a) | | 491,606 | 24,607,338 |
| Monolithic Power Systems, Inc. | | 2,400 | 636,024 |
| NVIDIA Corp. | | 375,999 | 159,645,415 |
| NXP Semiconductors NV | | 741,635 | 87,164,362 |
| ON Semiconductor Corp. (a) | | 85,700 | 1,765,420 |
| SolarEdge Technologies, Inc. (a) | | 32,400 | 5,673,240 |
| STMicroelectronics NV (NY Shares) unit | | 108,900 | 3,042,666 |
| Synaptics, Inc. (a) | | 33,400 | 2,672,668 |
| Taiwan Semiconductor Manufacturing Co. Ltd. sponsored ADR | | 36,000 | 2,840,040 |
| Universal Display Corp. | | 33,173 | 5,787,030 |
| Xilinx, Inc. | | 48,100 | 5,163,535 |
| | | | 509,575,893 |
| Software - 11.3% | | | |
| Adobe, Inc. (a) | | 155,471 | 69,078,875 |
| Atom Tickets LLC (a)(b)(c)(d) | | 344,068 | 461,051 |
| Avalara, Inc. (a) | | 23,200 | 3,119,240 |
| Bill.Com Holdings, Inc. (a) | | 50,600 | 4,711,366 |
| Cloudflare, Inc. (a) | | 406,580 | 16,921,860 |
| Coupa Software, Inc. (a) | | 30,014 | 9,197,790 |
| Crowdstrike Holdings, Inc. (a) | | 102,000 | 11,546,400 |
| DocuSign, Inc. (a) | | 42,200 | 9,150,226 |
| Dynatrace, Inc. | | 49,200 | 2,058,036 |
| Elastic NV (a) | | 109,650 | 10,547,234 |
| Epic Games, Inc. (c)(d) | | 1,076 | 618,700 |
| Five9, Inc. (a) | | 24,100 | 2,911,762 |
| HubSpot, Inc. (a) | | 35,792 | 8,397,161 |
| Lightspeed POS, Inc. (a) | | 206,333 | 5,828,990 |
| Microsoft Corp. | | 1,697,800 | 348,065,978 |
| Paycom Software, Inc. (a) | | 8,335 | 2,370,224 |
| Ping Identity Holding Corp. (a) | | 57,900 | 1,989,444 |
| RingCentral, Inc. (a) | | 29,539 | 8,574,286 |
| Salesforce.com, Inc. (a) | | 496,970 | 96,834,605 |
| ServiceNow, Inc. (a) | | 37,123 | 16,304,422 |
| Slack Technologies, Inc. Class A (a)(e) | | 108,900 | 3,217,995 |
| Smartsheet, Inc. (a) | | 23,800 | 1,136,212 |
| Snowflake Computing, Inc. Class B (c)(d) | | 4,224 | 163,764 |
| Tanium, Inc. Class B (a)(c)(d) | | 151,000 | 1,720,675 |
| The Trade Desk, Inc. (a)(e) | | 25,405 | 11,465,785 |
| Workday, Inc. Class A (a) | | 19,000 | 3,437,480 |
| Zoom Video Communications, Inc. Class A (a) | | 25,700 | 6,525,487 |
| | | | 656,355,048 |
| Technology Hardware, Storage & Peripherals - 8.0% | | | |
| Apple, Inc. | | 1,093,234 | 464,668,179 |
|
| TOTAL INFORMATION TECHNOLOGY | | | 2,032,893,261 |
|
| MATERIALS - 0.3% | | | |
| Chemicals - 0.2% | | | |
| The Chemours Co. LLC | | 609,807 | 11,299,724 |
| Metals & Mining - 0.1% | | | |
| ArcelorMittal SA Class A unit (a) | | 194,000 | 2,128,180 |
| Barrick Gold Corp. | | 21,400 | 618,674 |
| Lundin Mining Corp. | | 14,100 | 78,950 |
| MMC Norilsk Nickel PJSC sponsored ADR | | 23,000 | 604,210 |
| | | | 3,430,014 |
|
| TOTAL MATERIALS | | | 14,729,738 |
|
| REAL ESTATE - 0.4% | | | |
| Equity Real Estate Investment Trusts (REITs) - 0.2% | | | |
| Ant International Co. Ltd. Class C (a)(c)(d) | | 1,065,661 | 11,146,814 |
| Douglas Emmett, Inc. | | 38,700 | 1,127,718 |
| Equinix, Inc. | | 3,800 | 2,984,824 |
| | | | 15,259,356 |
| Real Estate Management & Development - 0.2% | | | |
| Redfin Corp. (a) | | 258,281 | 10,739,324 |
|
| TOTAL REAL ESTATE | | | 25,998,680 |
|
| TOTAL COMMON STOCKS | | | |
| (Cost $2,322,056,211) | | | 5,609,683,743 |
|
| Preferred Stocks - 2.9% | | | |
| Convertible Preferred Stocks - 2.8% | | | |
| CONSUMER DISCRETIONARY - 0.5% | | | |
| Automobiles - 0.1% | | | |
| Rivian Automotive, Inc. Series E (c)(d) | | 399,926 | 6,194,854 |
| Hotels, Restaurants & Leisure - 0.1% | | | |
| MOD Super Fast Pizza Holdings LLC: | | | |
| Series 3 (a)(b)(c)(d) | | 22,518 | 3,084,925 |
| Series 4 (a)(b)(c)(d) | | 2,055 | 287,556 |
| Series 5 (a)(b)(c)(d) | | 8,253 | 1,176,218 |
| Topgolf International, Inc. Series F (a)(c)(d) | | 106,191 | 1,346,502 |
| | | | 5,895,201 |
| Internet & Direct Marketing Retail - 0.3% | | | |
| Reddit, Inc. Series B (a)(c)(d) | | 129,280 | 6,429,094 |
| The Honest Co., Inc.: | | | |
| Series C (a)(c)(d) | | 167,087 | 6,457,913 |
| Series D (a)(c)(d) | | 27,712 | 1,268,101 |
| Series E (a)(c)(d) | | 143,059 | 2,803,956 |
| | | | 16,959,064 |
| Textiles, Apparel & Luxury Goods - 0.0% | | | |
| Allbirds, Inc.: | | | |
| Series A (a)(c)(d) | | 15,945 | 164,234 |
| Series B (a)(c)(d) | | 2,800 | 28,840 |
| Series C (a)(c)(d) | | 26,775 | 275,783 |
| Series Seed (a)(c)(d) | | 8,575 | 88,323 |
| | | | 557,180 |
| TOTAL CONSUMER DISCRETIONARY | | | 29,606,299 |
| CONSUMER STAPLES - 1.4% | | | |
| Food & Staples Retailing - 0.2% | | | |
| Blink Health LLC Series C (c)(d) | | 19,765 | 754,628 |
| Sweetgreen, Inc. Series H (a)(c)(d) | | 725,140 | 10,790,083 |
| | | | 11,544,711 |
| Food Products - 0.0% | | | |
| Agbiome LLC Series C (a)(c)(d) | | 266,499 | 1,687,925 |
| Tobacco - 1.2% | | | |
| JUUL Labs, Inc.: | | | |
| Series C (a)(c)(d) | | 660,029 | 66,379,117 |
| Series D (a)(c)(d) | | 5,110 | 513,913 |
| | | | 66,893,030 |
| TOTAL CONSUMER STAPLES | | | 80,125,666 |
| HEALTH CARE - 0.1% | | | |
| Biotechnology - 0.0% | | | |
| 23andMe, Inc. Series F (a)(c)(d) | | 195,114 | 2,038,941 |
| Immunocore Ltd. Series A (a)(c)(d) | | 4,035 | 629,170 |
| | | | 2,668,111 |
| Health Care Providers & Services - 0.1% | | | |
| Mulberry Health, Inc. Series A-8 (a)(c)(d) | | 813,618 | 3,700,706 |
| Pharmaceuticals - 0.0% | | | |
| Castle Creek Pharmaceutical Holdings, Inc. Series B (a)(c)(d) | | 1,069 | 515,568 |
| TOTAL HEALTH CARE | | | 6,884,385 |
| INDUSTRIALS - 0.2% | | | |
| Aerospace & Defense - 0.2% | | | |
| Space Exploration Technologies Corp.: | | | |
| Series G (a)(c)(d) | | 42,650 | 11,515,500 |
| Series H (a)(c)(d) | | 6,348 | 1,713,960 |
| | | | 13,229,460 |
| Professional Services - 0.0% | | | |
| YourPeople, Inc. Series C (a)(c)(d) | | 253,888 | 484,926 |
| TOTAL INDUSTRIALS | | | 13,714,386 |
| INFORMATION TECHNOLOGY - 0.6% | | | |
| Internet Software & Services - 0.2% | | | |
| ContextLogic, Inc. Series G (a)(c)(d) | | 34,750 | 6,076,038 |
| Starry, Inc.: | | | |
| Series C (a)(c)(d) | | 1,477,502 | 2,112,828 |
| Series D (a)(c)(d) | | 402,931 | 576,191 |
| | | | 8,765,057 |
| IT Services - 0.0% | | | |
| AppNexus, Inc. Series E (Escrow) (a)(c)(d) | | 307,049 | 9,617 |
| Riskified Ltd. Series E (c)(d) | | 82,500 | 784,938 |
| | | | 794,555 |
| Software - 0.4% | | | |
| ACV Auctions, Inc. Series E (c)(d) | | 191,408 | 1,133,135 |
| Compass, Inc. Series E (a)(c)(d) | | 13,605 | 1,719,264 |
| Dataminr, Inc. Series D (a)(c)(d) | | 115,901 | 1,274,911 |
| Delphix Corp. Series D (a)(c)(d) | | 242,876 | 1,233,810 |
| Jet.Com, Inc. Series B1 (Escrow) (a)(c)(d) | | 922,232 | 9 |
| Malwarebytes Corp. Series B (a)(c)(d) | | 329,349 | 6,708,839 |
| Taboola.Com Ltd. Series E (a)(c)(d) | | 289,958 | 9,867,271 |
| | | | 21,937,239 |
| TOTAL INFORMATION TECHNOLOGY | | | 31,496,851 |
|
| TOTAL CONVERTIBLE PREFERRED STOCKS | | | 161,827,587 |
|
| Nonconvertible Preferred Stocks - 0.1% | | | |
| CONSUMER DISCRETIONARY - 0.0% | | | |
| Automobiles - 0.0% | | | |
| Neutron Holdings, Inc. Series 1C (c)(d) | | 12,405,800 | 248,116 |
| Waymo LLC Series A2 (c)(d) | | 15,200 | 1,305,181 |
| | | | 1,553,297 |
| HEALTH CARE - 0.1% | | | |
| Pharmaceuticals - 0.1% | | | |
| Castle Creek Pharmaceutical Holdings, Inc. Series A4 (a)(c)(d) | | 9,636 | 4,647,346 |
|
| TOTAL NONCONVERTIBLE PREFERRED STOCKS | | | 6,200,643 |
|
| TOTAL PREFERRED STOCKS | | | |
| (Cost $78,787,417) | | | 168,028,230 |
| | | Principal Amount | Value |
|
| Convertible Bonds - 0.0% | | | |
| CONSUMER DISCRETIONARY - 0.0% | | | |
| Automobiles - 0.0% | | | |
| Neutron Holdings, Inc.: | | | |
| 4% 5/22/27 (c)(d) | | 433,800 | 433,800 |
| 4% 6/12/27 (c)(d) | | 115,200 | 115,200 |
| TOTAL CONVERTIBLE BONDS | | | |
| (Cost $549,000) | | | 549,000 |
| | | Shares | Value |
|
| Money Market Funds - 2.3% | | | |
| Fidelity Cash Central Fund 0.14% (g) | | 6,876,014 | 6,878,077 |
| Fidelity Securities Lending Cash Central Fund 0.13% (g)(h) | | 124,663,073 | 124,675,539 |
| TOTAL MONEY MARKET FUNDS | | | |
| (Cost $131,552,929) | | | 131,553,616 |
| TOTAL INVESTMENT IN SECURITIES - 102.1% | | | |
| (Cost $2,532,945,557) | | | 5,909,814,589 |
| NET OTHER ASSETS (LIABILITIES) - (2.1)% | | | (120,380,212) |
| NET ASSETS - 100% | | | $5,789,434,377 |
Legend
(a) Non-income producing
(b) Investment is owned by a wholly-owned subsidiary (Subsidiary) that is treated as a corporation for U.S. tax purposes.
(c) Restricted securities (including private placements) - Investment in securities not registered under the Securities Act of 1933 (excluding 144A issues). At the end of the period, the value of restricted securities (excluding 144A issues) amounted to $204,955,368 or 3.5% of net assets.
(d) Level 3 security
(e) Security or a portion of the security is on loan at period end.
(f) Security exempt from registration under Rule 144A of the Securities Act of 1933. These securities may be resold in transactions exempt from registration, normally to qualified institutional buyers. At the end of the period, the value of these securities amounted to $14,071,120 or 0.2% of net assets.
(g) Affiliated fund that is generally available only to investment companies and other accounts managed by Fidelity Investments. The rate quoted is the annualized seven-day yield of the fund at period end. A complete unaudited listing of the fund's holdings as of its most recent quarter end is available upon request. In addition, each Fidelity Central Fund's financial statements, which are not covered by the Fund's Report of Independent Registered Public Accounting Firm, are available on the SEC's website or upon request.
(h) Investment made with cash collateral received from securities on loan.
Additional information on each restricted holding is as follows:
| Security | Acquisition Date | Acquisition Cost |
| 23andMe, Inc. Series F | 8/31/17 | $2,709,002 |
| ACV Auctions, Inc. Series E | 11/6/19 | $1,058,525 |
| Agbiome LLC Series C | 6/29/18 | $1,687,925 |
| Alignment Healthcare Partners unit | 2/28/20 | $661,361 |
| Allbirds, Inc. | 10/9/18 | $443,128 |
| Allbirds, Inc. Series A | 10/9/18 | $174,871 |
| Allbirds, Inc. Series B | 10/9/18 | $30,708 |
| Allbirds, Inc. Series C | 10/9/18 | $293,646 |
| Allbirds, Inc. Series Seed | 10/9/18 | $94,043 |
| Ant International Co. Ltd. Class C | 5/16/18 | $5,978,358 |
| AppNexus, Inc. Series E (Escrow) | 8/1/14 | $0 |
| Atom Tickets LLC | 8/15/17 | $1,999,998 |
| Blink Health LLC Series C | 11/7/19 | $754,549 |
| Castle Creek Pharmaceutical Holdings, Inc. Series A4 | 9/29/16 | $3,185,523 |
| Castle Creek Pharmaceutical Holdings, Inc. Series B | 10/9/18 | $440,268 |
| Cibus Corp. Series C | 2/16/18 | $1,525,763 |
| Cibus Corp. Series D | 5/10/19 | 498,300 |
| Compass, Inc. Series E | 11/3/17 | $918,041 |
| ContextLogic, Inc. Series G | 10/24/17 | $4,675,022 |
| Dataminr, Inc. Series D | 3/6/15 | $1,477,738 |
| Delphix Corp. Series D | 7/10/15 | $2,185,884 |
| Epic Games, Inc. | 7/30/20 | $618,700 |
| Immunocore Ltd. Series A | 7/27/15 | $759,303 |
| Jet.Com, Inc. Series B1 (Escrow) | 3/19/18 | $0 |
| JUUL Labs, Inc. Class B | 11/21/17 | $0 |
| JUUL Labs, Inc. Series C | 5/22/15 - 7/6/18 | $0 |
| JUUL Labs, Inc. Series D | 6/25/18 - 7/6/18 | $0 |
| Malwarebytes Corp. Series B | 12/21/15 | $3,416,996 |
| MOD Super Fast Pizza Holdings LLC Series 3 | 11/3/16 | $3,084,966 |
| MOD Super Fast Pizza Holdings LLC Series 4 | 12/14/17 | 287,556 |
| MOD Super Fast Pizza Holdings LLC Series 5 | 5/15/19 | 1,176,218 |
| Mulberry Health, Inc. Series A-8 | 1/20/16 | $5,495,786 |
| Neutron Holdings, Inc. Series 1C | 7/3/18 | $2,268,276 |
| Neutron Holdings, Inc. 4% 5/22/27 | 6/4/20 | $433,800 |
| Neutron Holdings, Inc. 4% 6/12/27 | 6/12/20 | $115,200 |
| Reddit, Inc. Series B | 7/26/17 | $1,835,324 |
| Riskified Ltd. | 12/20/19 - 4/15/20 | $727,408 |
| Riskified Ltd. Series E | 10/28/19 | $784,938 |
| Riskified Ltd. warrants | 10/28/19 | $1 |
| Rivian Automotive, Inc. Series E | 7/10/20 | $6,194,854 |
| Snowflake Computing, Inc. Class B | 3/19/20 | $163,834 |
| Space Exploration Technologies Corp. Class A | 4/6/17 - 9/11/17 | $2,534,625 |
| Space Exploration Technologies Corp. Class C | 9/11/17 | $92,610 |
| Space Exploration Technologies Corp. Series G | 1/20/15 | $3,303,669 |
| Space Exploration Technologies Corp. Series H | 8/4/17 | $856,980 |
| Starry, Inc. Series C | 12/8/17 | $1,362,257 |
| Starry, Inc. Series D | 7/30/20 | $576,191 |
| Sweetgreen, Inc. Series H | 11/9/18 | $9,455,826 |
| Taboola.Com Ltd. Series E | 12/22/14 | $3,022,928 |
| Tanium, Inc. Class B | 4/21/17 | $749,609 |
| The Honest Co., Inc. | 8/21/14 | $1,937,546 |
| The Honest Co., Inc. Series C | 8/21/14 | $4,520,923 |
| The Honest Co., Inc. Series D | 8/3/15 | $1,267,963 |
| The Honest Co., Inc. Series E | 9/28/17 | $2,804,643 |
| Topgolf International, Inc. Series F | 11/10/17 | $1,468,993 |
| Tory Burch LLC | 5/14/15 | $7,600,030 |
| Waymo LLC Series A2 | 5/8/20 | $1,305,181 |
| WME Entertainment Parent, LLC Class A | 4/13/16 - 8/16/16 | $5,974,752 |
| YourPeople, Inc. Series C | 5/1/15 | $3,783,205 |
Affiliated Central Funds
Information regarding fiscal year to date income earned by the Fund from investments in Fidelity Central Funds is as follows:
| Fund | Income earned |
| Fidelity Cash Central Fund | $271,558 |
| Fidelity Securities Lending Cash Central Fund | 2,616,352 |
| Total | $2,887,910 |
Amounts in the income column in the above table include any capital gain distributions from underlying funds, which are presented in the corresponding line-item in the Statement of Operations, if applicable. Amount for Fidelity Securities Lending Cash Central Fund represents the income earned on investing cash collateral, less rebates paid to borrowers and any lending agent fees associated with the loan, plus any premium payments received for lending certain types of securities.
Investment Valuation
The following is a summary of the inputs used, as of July 31, 2020, involving the Fund's assets and liabilities carried at fair value. The inputs or methodology used for valuing securities may not be an indication of the risk associated with investing in those securities. For more information on valuation inputs, and their aggregation into the levels used below, please refer to the Investment Valuation section in the accompanying Notes to Financial Statements.
| | Valuation Inputs at Reporting Date: |
| Description | Total | Level 1 | Level 2 | Level 3 |
| Investments in Securities: | | | | |
| Equities: | | | | |
| Communication Services | $814,400,454 | $779,470,847 | $30,169,628 | $4,759,979 |
| Consumer Discretionary | 1,712,329,565 | 1,666,499,908 | 7,070,985 | 38,758,672 |
| Consumer Staples | 194,148,944 | 109,776,123 | 4,000,758 | 80,372,063 |
| Energy | 34,180,424 | 34,180,424 | -- | -- |
| Financials | 50,096,853 | 46,902,270 | 3,194,583 | -- |
| Health Care | 607,808,503 | 586,191,681 | 7,503,871 | 14,112,951 |
| Industrials | 259,628,700 | 239,599,284 | -- | 20,029,416 |
| Information Technology | 2,064,390,112 | 2,029,163,637 | -- | 35,226,475 |
| Materials | 14,729,738 | 14,729,738 | -- | -- |
| Real Estate | 25,998,680 | 14,851,866 | -- | 11,146,814 |
| Corporate Bonds | 549,000 | -- | -- | 549,000 |
| Money Market Funds | 131,553,616 | 131,553,616 | -- | -- |
| Total Investments in Securities: | $5,909,814,589 | $5,652,919,394 | $51,939,825 | $204,955,370 |
The following is a reconciliation of Investments in Securities for which Level 3 inputs were used in determining value:
| Investments in Securities: | |
| Equities - Consumer Staples | |
| Beginning Balance | $204,799,036 |
| Net Realized Gain (Loss) on Investment Securities | 2,085,371 |
| Net Unrealized Gain (Loss) on Investment Securities | (125,181,522) |
| Cost of Purchases | 754,549 |
| Proceeds of Sales | (2,085,371) |
| Amortization/Accretion | -- |
| Transfers into Level 3 | -- |
| Transfers out of Level 3 | -- |
| Ending Balance | $80,372,063 |
| The change in unrealized gain (loss) for the period attributable to Level 3 securities held at July 31, 2020 | $(125,181,522) |
| Other Investment in Securities | |
| Beginning Balance | $135,471,398 |
| Net Realized Gain (Loss) on Investment Securities | (34,145) |
| Net Unrealized Gain (Loss) on Investment Securities | (412,720) |
| Cost of Purchases | 12,805,212 |
| Proceeds of Sales | (573,373) |
| Amortization/Accretion | -- |
| Transfers into Level 3 | 3,008,407 |
| Transfers out of Level 3 | (25,681,472) |
| Ending Balance | $124,583,307 |
| The change in unrealized gain (loss) for the period attributable to Level 3 securities held at July 31, 2020 | $(412,720) |
The information used in the above reconciliations represents fiscal year to date activity for any Investments in Securities identified as using Level 3 inputs at either the beginning or the end of the current fiscal period. Cost of purchases and proceeds of sales may include securities received and/or delivered through in-kind transactions. Transfers in or out of Level 3 represent the beginning value of any Security or Instrument where a change in the pricing level occurred from the beginning to the end of the period. The cost of purchases and the proceeds of sales may include securities received or delivered through corporate actions or exchanges. Realized and unrealized gains (losses) disclosed in the reconciliations are included in Net Gain (Loss) on the Fund's Statement of Operations.
Other Information
Distribution of investments by country or territory of incorporation, as a percentage of Total Net Assets, is as follows (Unaudited):
| United States of America | 87.1% |
| Cayman Islands | 3.2% |
| Bermuda | 2.7% |
| Netherlands | 2.0% |
| Canada | 1.5% |
| Others (Individually Less Than 1%) | 3.5% |
| | 100.0% |
See accompanying notes which are an integral part of the financial statements.
Financial Statements
Statement of Assets and Liabilities
| | | July 31, 2020 |
| Assets | | |
Investment in securities, at value (including securities loaned of $121,501,536) — See accompanying schedule:
Unaffiliated issuers (cost $2,401,392,628) | $5,778,260,973 | |
| Fidelity Central Funds (cost $131,552,929) | 131,553,616 | |
| Total Investment in Securities (cost $2,532,945,557) | | $5,909,814,589 |
| Cash | | 7,710 |
| Restricted cash | | 281,462 |
| Foreign currency held at value (cost $15,371) | | 15,367 |
| Receivable for investments sold | | 333,982,489 |
| Receivable for fund shares sold | | 2,437,587 |
| Dividends receivable | | 1,162,882 |
| Interest receivable | | 3,380 |
| Distributions receivable from Fidelity Central Funds | | 155,940 |
| Other receivables | | 14,918 |
| Total assets | | 6,247,876,324 |
| Liabilities | | |
| Payable for investments purchased | $71,366,594 | |
| Payable for fund shares redeemed | 260,556,141 | |
| Other payables and accrued expenses | 1,855,112 | |
| Collateral on securities loaned | 124,664,100 | |
| Total liabilities | | 458,441,947 |
| Net Assets | | $5,789,434,377 |
| Net Assets consist of: | | |
| Paid in capital | | $1,290,190,528 |
| Total accumulated earnings (loss) | | 4,499,243,849 |
| Net Assets | | $5,789,434,377 |
| Net Asset Value, offering price and redemption price per share ($5,789,434,377 ÷ 300,794,568 shares) | | $19.25 |
See accompanying notes which are an integral part of the financial statements.
Statement of Operations
| | | Year ended July 31, 2020 |
| Investment Income | | |
| Dividends | | $31,159,759 |
| Interest | | 3,324 |
| Income from Fidelity Central Funds (including $2,616,352 from security lending) | | 2,887,910 |
| Total income | | 34,050,993 |
| Expenses | | |
| Custodian fees and expenses | $152,741 | |
| Independent trustees' fees and expenses | 36,067 | |
| Legal | 200 | |
| Interest | 65,941 | |
| Miscellaneous | 13,953 | |
| Total expenses before reductions | 268,902 | |
| Expense reductions | (1,824) | |
| Total expenses after reductions | | 267,078 |
| Net investment income (loss) | | 33,783,915 |
| Realized and Unrealized Gain (Loss) | | |
| Net realized gain (loss) on: | | |
| Investment securities: | | |
| Unaffiliated issuers | 1,178,184,481 | |
| Fidelity Central Funds | 4,963 | |
| Foreign currency transactions | (45,864) | |
| Futures contracts | 4,275,609 | |
| Total net realized gain (loss) | | 1,182,419,189 |
| Change in net unrealized appreciation (depreciation) on: | | |
| Investment securities: | | |
| Unaffiliated issuers (net of increase in deferred foreign taxes of $1,658,507) | 705,710,578 | |
| Fidelity Central Funds | 687 | |
| Assets and liabilities in foreign currencies | 9,851 | |
| Total change in net unrealized appreciation (depreciation) | | 705,721,116 |
| Net gain (loss) | | 1,888,140,305 |
| Net increase (decrease) in net assets resulting from operations | | $1,921,924,220 |
See accompanying notes which are an integral part of the financial statements.
Statement of Changes in Net Assets
| | Year ended July 31, 2020 | Year ended July 31, 2019 |
| Increase (Decrease) in Net Assets | | |
| Operations | | |
| Net investment income (loss) | $33,783,915 | $42,336,847 |
| Net realized gain (loss) | 1,182,419,189 | 703,191,197 |
| Change in net unrealized appreciation (depreciation) | 705,721,116 | (62,335,178) |
| Net increase (decrease) in net assets resulting from operations | 1,921,924,220 | 683,192,866 |
| Distributions to shareholders | (641,776,468) | (763,496,173) |
| Share transactions | | |
| Proceeds from sales of shares | 764,339,309 | 705,675,801 |
| Reinvestment of distributions | 641,776,468 | 763,496,173 |
| Cost of shares redeemed | (2,743,794,312) | (1,547,883,663) |
| Net increase (decrease) in net assets resulting from share transactions | (1,337,678,535) | (78,711,689) |
| Total increase (decrease) in net assets | (57,530,783) | (159,014,996) |
| Net Assets | | |
| Beginning of period | 5,846,965,160 | 6,005,980,156 |
| End of period | $5,789,434,377 | $5,846,965,160 |
| Other Information | | |
| Shares | | |
| Sold | 52,915,457 | 48,279,568 |
| Issued in reinvestment of distributions | 46,186,696 | 52,744,114 |
| Redeemed | (173,939,394) | (103,007,932) |
| Net increase (decrease) | (74,837,241) | (1,984,250) |
See accompanying notes which are an integral part of the financial statements.
Financial Highlights
Fidelity Series Blue Chip Growth Fund
| | | | | | |
| Years ended July 31, | 2020 | 2019 | 2018 | 2017 | 2016 |
| Selected Per–Share Data | | | | | |
| Net asset value, beginning of period | $15.57 | $15.90 | $14.07 | $11.47 | $13.36 |
| Income from Investment Operations | | | | | |
| Net investment income (loss)A | .09 | .10 | .12B | .03 | .02 |
| Net realized and unrealized gain (loss) | 5.30 | 1.58 | 3.28 | 2.74 | (.42) |
| Total from investment operations | 5.39 | 1.68 | 3.40 | 2.77 | (.40) |
| Distributions from net investment income | (.11) | (.12) | (.07) | (.03) | (.02) |
| Distributions from net realized gain | (1.60) | (1.89) | (1.50) | (.14) | (1.48) |
| Total distributions | (1.71) | (2.01) | (1.57) | (.17) | (1.49)C |
| Net asset value, end of period | $19.25 | $15.57 | $15.90 | $14.07 | $11.47 |
| Total ReturnD | 39.00% | 11.85% | 26.54% | 24.50% | (2.63)% |
| Ratios to Average Net AssetsE,F | | | | | |
| Expenses before reductions | - %G | - %G | - %G | .59% | .73% |
| Expenses net of fee waivers, if any | - %G | - %G | - %G | .59% | .73% |
| Expenses net of all reductions | - %G | - %G | - %G | .59% | .73% |
| Net investment income (loss) | .59% | .71% | .81%B | .26% | .17% |
| Supplemental Data | | | | | |
| Net assets, end of period (000 omitted) | $5,789,434 | $5,846,965 | $6,005,980 | $2,208,451 | $2,417,952 |
| Portfolio turnover rateH | 52%I | 53% | 41% | 47% | 55% |
A Calculated based on average shares outstanding during the period.
B Net investment income per share reflects a large, non-recurring dividend which amounted to $.01 per share. Excluding this non-recurring dividend, the ratio of net investment income (loss) to average net assets would have been .71%.
C Total distributions of $1.49 per share is comprised of distributions from net investment income of $.015 and distributions from net realized gain of $1.477 per share.
D Total returns would have been lower if certain expenses had not been reduced during the applicable periods shown.
E Fees and expenses of any underlying mutual funds or exchange-traded funds (ETFs) are not included in the Fund's expense ratio. The Fund indirectly bears its proportionate share of these expenses. For additional expense information related to investments in Fidelity Central Funds, please refer to the "Investments in Fidelity Central Funds" note found in the Notes to Financial Statements section of the most recent Annual or Semi-Annual report.
F Expense ratios reflect operating expenses of the Fund. Expenses before reductions do not reflect amounts reimbursed by the investment adviser or reductions from brokerage service arrangements or reductions from other expense offset arrangements and do not represent the amount paid by the Fund during periods when reimbursements or reductions occur. Expenses net of fee waivers reflect expenses after reimbursement by the investment adviser but prior to reductions from brokerage service arrangements or other expense offset arrangements. Expenses net of all reductions represent the net expenses paid by the Fund.
G Amount represents less than .005%.
H Amount does not include the portfolio activity of any underlying Fidelity Central Funds.
I Portfolio turnover rate excludes securities received or delivered in-kind.
See accompanying notes which are an integral part of the financial statements.
Notes to Financial Statements
For the period ended July 31, 2020
1. Organization.
Fidelity Series Blue Chip Growth Fund (the Fund) is a fund of Fidelity Securities Fund (the Trust) and is authorized to issue an unlimited number of shares. Shares are offered only to certain other Fidelity funds and Fidelity managed 529 plans. The Trust is registered under the Investment Company Act of 1940, as amended (the 1940 Act), as an open-end management investment company organized as a Massachusetts business trust.
Effective January 1, 2020:
Investment advisers Fidelity Investments Money Management, Inc., FMR Co., Inc., and Fidelity SelectCo, LLC, merged with and into Fidelity Management & Research Company. In connection with the merger transactions, the resulting, merged investment adviser was then redomiciled from Massachusetts to Delaware, changed its corporate structure from a corporation to a limited liability company, and changed its name to "Fidelity Management & Research Company LLC".
2. Investments in Fidelity Central Funds.
The Fund invests in Fidelity Central Funds, which are open-end investment companies generally available only to other investment companies and accounts managed by the investment adviser and its affiliates. The Fund's Schedule of Investments lists each of the Fidelity Central Funds held as of period end, if any, as an investment of the Fund, but does not include the underlying holdings of each Fidelity Central Fund. As an Investing Fund, the Fund indirectly bears its proportionate share of the expenses of the underlying Fidelity Central Funds.
The Money Market Central Funds seek preservation of capital and current income and are managed by the investment adviser. Annualized expenses of the Money Market Central Funds as of their most recent shareholder report date ranged from less than .005% to .01%.
A complete unaudited list of holdings for each Fidelity Central Fund is available upon request or at the Securities and Exchange Commission (the SEC) website at www.sec.gov. In addition, the financial statements of the Fidelity Central Funds, which are not covered by the Fund's Report of Independent Registered Public Accounting Firm, are available on the SEC website or upon request.
3. Significant Accounting Policies.
The Fund is an investment company and applies the accounting and reporting guidance of the Financial Accounting Standards Board (FASB) Accounting Standards Codification Topic 946 Financial Services – Investment Companies. The financial statements have been prepared in conformity with accounting principles generally accepted in the United States of America (GAAP), which require management to make certain estimates and assumptions at the date of the financial statements. Actual results could differ from those estimates. Subsequent events, if any, through the date that the financial statements were issued have been evaluated in the preparation of the financial statements. The following summarizes the significant accounting policies of the Fund:
Investment Valuation. Investments are valued as of 4:00 p.m. Eastern time on the last calendar day of the period. The Board of Trustees (the Board) has delegated the day to day responsibility for the valuation of the Fund's investments to the Fair Value Committee (the Committee) established by the Fund's investment adviser. In accordance with valuation policies and procedures approved by the Board, the Fund attempts to obtain prices from one or more third party pricing vendors or brokers to value its investments. When current market prices, quotations or currency exchange rates are not readily available or reliable, investments will be fair valued in good faith by the Committee, in accordance with procedures adopted by the Board. Factors used in determining fair value vary by investment type and may include market or investment specific events, changes in interest rates and credit quality. The frequency with which these procedures are used cannot be predicted and they may be utilized to a significant extent. The Committee oversees the Fund's valuation policies and procedures and reports to the Board on the Committee's activities and fair value determinations. The Board monitors the appropriateness of the procedures used in valuing the Fund's investments and ratifies the fair value determinations of the Committee.
The Fund categorizes the inputs to valuation techniques used to value its investments into a disclosure hierarchy consisting of three levels as shown below:
- Level 1 – quoted prices in active markets for identical investments
- Level 2 – other significant observable inputs (including quoted prices for similar investments, interest rates, prepayment speeds, etc.)
- Level 3 – unobservable inputs (including the Fund's own assumptions based on the best information available)
Valuation techniques used to value the Fund's investments by major category are as follows:
Equity securities, including restricted securities, for which market quotations are readily available, are valued at the last reported sale price or official closing price as reported by a third party pricing vendor on the primary market or exchange on which they are traded and are categorized as Level 1 in the hierarchy. In the event there were no sales during the day or closing prices are not available, securities are valued at the last quoted bid price or may be valued using the last available price and are generally categorized as Level 2 in the hierarchy. For foreign equity securities, when market or security specific events arise, comparisons to the valuation of American Depositary Receipts (ADRs), futures contracts, Exchange-Traded Funds (ETFs) and certain indexes as well as quoted prices for similar securities may be used and would be categorized as Level 2 in the hierarchy. For equity securities, including restricted securities, where observable inputs are limited, assumptions about market activity and risk are used and these securities may be categorized as Level 3 in the hierarchy. Securities, including private placements or other restricted securities, for which observable inputs are not available are valued using alternate valuation approaches, including the market approach, the income approach and cost approach, and are categorized as Level 3 in the hierarchy. The market approach considers factors including the price of recent investments in the same or a similar security or financial metrics of comparable securities. The income approach considers factors including expected future cash flows, security specific risks and corresponding discount rates. The cost approach considers factors including the value of the security's underlying assets and liabilities.
Debt securities, including restricted securities, are valued based on evaluated prices received from third party pricing vendors or from brokers who make markets in such securities. Corporate bonds are valued by pricing vendors who utilize matrix pricing which considers yield or price of bonds of comparable quality, coupon, maturity and type or by broker-supplied prices. When independent prices are unavailable or unreliable, debt securities may be valued utilizing pricing methodologies which consider similar factors that would be used by third party pricing vendors. Debt securities are generally categorized as Level 2 in the hierarchy but may be Level 3 depending on the circumstances.
Investments in open-end mutual funds, including the Fidelity Central Funds, are valued at their closing net asset value (NAV) each business day and are categorized as Level 1 in the hierarchy.
The following provides information on Level 3 securities held by the Fund that were valued at period end based on unobservable inputs. These amounts exclude valuations provided by a broker.
| Asset Type | Fair Value | Valuation Technique(s) | Unobservable Input | Amount or Range/Weighted Average | Impact to Valuation from an Increase in Input(a) |
| Equities | $204,406,370 | Market approach | Transaction price | $0.02-$575.00/$116.81 | Increase |
| | | Recovery value | Recovery value | 0.0% | Increase |
| | | Market comparable | Transaction price | $1.43 - $411.85 / $258.31 | Increase |
| | | | Enterprise value/EBITDA multiple (EV/EBITDA) | 11.8 | Increase |
| | | | Discount rate | 0.8% - 75.0% / 19.5% | Decrease |
| | | | Enterprise value/Sales multiple (EV/S) | 1.2 - 20.1 / 6.3 | Increase |
| | | | Discount for lack of marketability | 10.0% - 20.0% / 11.1% | Decrease |
| | | | Premium rate | 5.7% - 172.9% / 90.0% | Increase |
| | | | Liquidity preference | $19.60-$142.52 / $93.93 | Increase
|
| | | | Conversion ratio | 1.0 | Increase
|
| Corporate Bonds | $549,000 | Market approach | Transaction price | $100.00 | Increase |
(a) Represents the directional change in the fair value of the Level 3 investments that could have resulted from an increase in the corresponding input as of period end. A decrease to the unobservable input would have had the opposite effect. Significant changes in these inputs may have resulted in a significantly higher or lower fair value measurement at period end.
Changes in valuation techniques may result in transfers in or out of an assigned level within the disclosure hierarchy. The aggregate value of investments by input level as of July 31, 2020 is included at the end of the Fund's Schedule of Investments.
Foreign Currency. The Fund may use foreign currency contracts to facilitate transactions in foreign-denominated securities. Gains and losses from these transactions may arise from changes in the value of the foreign currency or if the counterparties do not perform under the contracts' terms.
Foreign-denominated assets, including investment securities, and liabilities are translated into U.S. dollars at the exchange rates at period end. Purchases and sales of investment securities, income and dividends received and expenses denominated in foreign currencies are translated into U.S. dollars at the exchange rate in effect on the transaction date.
The effects of exchange rate fluctuations on investments are included with the net realized and unrealized gain (loss) on investment securities. Other foreign currency transactions resulting in realized and unrealized gain (loss) are disclosed separately.
Investment Transactions and Income. For financial reporting purposes, the Fund's investment holdings and NAV include trades executed through the end of the last business day of the period. The NAV per share for processing shareholder transactions is calculated as of the close of business of the New York Stock Exchange (NYSE), normally 4:00 p.m. Eastern time and includes trades executed through the end of the prior business day. Gains and losses on securities sold are determined on the basis of identified cost and include proceeds received from litigation. Dividend income is recorded on the ex-dividend date, except for certain dividends from foreign securities where the ex-dividend date may have passed, which are recorded as soon as the Fund is informed of the ex-dividend date. Non-cash dividends included in dividend income, if any, are recorded at the fair market value of the securities received. Income and capital gain distributions from Fidelity Central Funds, if any, are recorded on the ex-dividend date. Certain distributions received by the Fund represent a return of capital or capital gain. The Fund determines the components of these distributions subsequent to the ex-dividend date, based upon receipt of tax filings or other correspondence relating to the underlying investment. These distributions are recorded as a reduction of cost of investments and/or as a realized gain. Interest income is accrued as earned and includes coupon interest and amortization of premium and accretion of discount on debt securities as applicable. Investment income is recorded net of foreign taxes withheld where recovery of such taxes is uncertain.
Expenses. Expenses directly attributable to a fund are charged to that fund. Expenses attributable to more than one fund are allocated among the respective funds on the basis of relative net assets or other appropriate methods. Expense estimates are accrued in the period to which they relate and adjustments are made when actual amounts are known.
Income Tax Information and Distributions to Shareholders. Each year, the Fund intends to qualify as a regulated investment company under Subchapter M of the Internal Revenue Code, including distributing substantially all of its taxable income and realized gains. As a result, no provision for U.S. Federal income taxes is required. As of July 31, 2020, the Fund did not have any unrecognized tax benefits in the financial statements; nor is the Fund aware of any tax positions for which it is reasonably possible that the total amounts of unrecognized tax benefits will significantly change in the next twelve months. The Fund files a U.S. federal tax return, in addition to state and local tax returns as required. The Fund's federal income tax returns are subject to examination by the Internal Revenue Service (IRS) for a period of three fiscal years after they are filed. State and local tax returns may be subject to examination for an additional fiscal year depending on the jurisdiction. Foreign taxes are provided for based on the Fund's understanding of the tax rules and rates that exist in the foreign markets in which it invests. The Fund is subject to a tax imposed on capital gains by certain countries in which it invests. An estimated deferred tax liability for net unrealized appreciation on the applicable securities is included in Other payables and accrued expenses on the Statement of Assets & Liabilities.
Distributions are declared and recorded on the ex-dividend date. Income and capital gain distributions are determined in accordance with income tax regulations, which may differ from GAAP.
Capital accounts within the financial statements are adjusted for permanent book-tax differences. These adjustments have no impact on net assets or the results of operations. Capital accounts are not adjusted for temporary book-tax differences which will reverse in a subsequent period.
Book-tax differences are primarily due to futures contracts, foreign currency transactions, passive foreign investment companies (PFIC), partnerships, and losses deferred due to wash sales.
As of period end, the cost and unrealized appreciation (depreciation) in securities, and derivatives if applicable, for federal income tax purposes were as follows:
| Gross unrealized appreciation | $3,450,674,435 |
| Gross unrealized depreciation | (91,517,219) |
| Net unrealized appreciation (depreciation) | $3,359,157,216 |
| Tax Cost | $2,550,657,373 |
The tax-based components of distributable earnings as of period end were as follows:
| Undistributed ordinary income | $60,709,093 |
| Undistributed long-term capital gain | $1,081,023,556 |
| Net unrealized appreciation (depreciation) on securities and other investments | $3,359,169,706 |
The tax character of distributions paid was as follows:
| | July 31, 2020 | July 31, 2019 |
| Ordinary Income | $42,854,714 | $ 70,273,964 |
| Long-term Capital Gains | 598,921,754 | 693,222,209 |
| Total | $641,776,468 | $ 763,496,173 |
Restricted Securities (including Private Placements). The Fund may invest in securities that are subject to legal or contractual restrictions on resale. These securities generally may be resold in transactions exempt from registration or to the public if the securities are registered. Disposal of these securities may involve time-consuming negotiations and expense, and prompt sale at an acceptable price may be difficult. Information regarding restricted securities is included at the end of the Fund's Schedule of Investments.
Consolidated Subsidiary. The Fund invests in certain investments through a wholly-owned subsidiary ("Subsidiary"), which may be subject to federal and state taxes upon disposition.
As of period end, the Fund held an investment of $17,759,261 in these Subsidiaries, representing .31% of the Fund's net assets. The financial statements have been consolidated and include accounts of the Fund and each Subsidiary. Accordingly, all inter-company transactions and balances have been eliminated.
Any cash held by the Subsidiaries is restricted as to its use and is presented as Restricted cash in the Statement of Assets and Liabilities.
4. Derivative Instruments.
Risk Exposures and the Use of Derivative Instruments. The Fund's investment objective allows the Fund to enter into various types of derivative contracts, including futures contracts. Derivatives are investments whose value is primarily derived from underlying assets, indices or reference rates and may be transacted on an exchange or over-the-counter (OTC). Derivatives may involve a future commitment to buy or sell a specified asset based on specified terms, to exchange future cash flows at periodic intervals based on a notional principal amount, or for one party to make one or more payments upon the occurrence of specified events in exchange for periodic payments from the other party.
The Fund used derivatives to increase returns and to manage exposure to certain risks as defined below. The success of any strategy involving derivatives depends on analysis of numerous economic factors, and if the strategies for investment do not work as intended, the Fund may not achieve its objectives.
The Fund's use of derivatives increased or decreased its exposure to the following risk:
| Equity Risk | Equity risk relates to the fluctuations in the value of financial instruments as a result of changes in market prices (other than those arising from interest rate risk or foreign exchange risk), whether caused by factors specific to an individual investment, its issuer, or all factors affecting all instruments traded in a market or market segment.
|
The Fund is also exposed to additional risks from investing in derivatives, such as liquidity risk and counterparty credit risk. Liquidity risk is the risk that the Fund will be unable to close out the derivative in the open market in a timely manner. Counterparty credit risk is the risk that the counterparty will not be able to fulfill its obligation to the Fund. Counterparty credit risk related to exchange-traded futures contracts may be mitigated by the protection provided by the exchange on which they trade.
Investing in derivatives may involve greater risks than investing in the underlying assets directly and, to varying degrees, may involve risk of loss in excess of any initial investment and collateral received and amounts recognized in the Statement of Assets and Liabilities. In addition, there may be the risk that the change in value of the derivative contract does not correspond to the change in value of the underlying instrument.
Futures Contracts. A futures contract is an agreement between two parties to buy or sell a specified underlying instrument for a fixed price at a specified future date. The Fund used futures contracts to manage its exposure to the stock market.
Upon entering into a futures contract, a fund is required to deposit either cash or securities (initial margin) with a clearing broker in an amount equal to a certain percentage of the face value of the contract. Futures contracts are marked-to-market daily and subsequent daily payments (variation margin) are made or received by a fund depending on the daily fluctuations in the value of the futures contracts and are recorded as unrealized appreciation or (depreciation). This receivable and/or payable, if any, is included in daily variation margin on futures contracts in the Statement of Assets and Liabilities. Realized gain or (loss) is recorded upon the expiration or closing of a futures contract. The net realized gain (loss) and change in net unrealized appreciation (depreciation) on futures contracts during the period is presented in the Statement of Operations.
Any open futures contracts at period end are presented in the Schedule of Investments under the caption "Futures Contracts". The notional amount at value reflects each contract's exposure to the underlying instrument or index at period end and is representative of volume of activity during the period.
5. Purchases and Sales of Investments.
Purchases and sales of securities, other than short-term securities and in-kind transactions, are noted in the table below.
| | Purchases ($) | Sales ($) |
| Fidelity Series Blue Chip Growth Fund | 2,927,463,412 | 5,126,722,094 |
6. Fees and Other Transactions with Affiliates.
Management Fee. Fidelity Management & Research Company LLC (the investment adviser) and its affiliates provide the Fund with investment management related services for which the Fund does not pay a management fee. Under the management contract, the investment adviser or an affiliate pays all ordinary operating expenses of the Fund, except custody fees, fees and expenses of the independent Trustees, and certain miscellaneous expenses such as proxy and shareholder meeting expenses.
Brokerage Commissions. A portion of portfolio transactions were placed with brokerage firms which are affiliates of the investment adviser. Brokerage commissions are included in net realized gain (loss) and change in net unrealized appreciation (depreciation) in the Statement of Operations. The commissions paid to these affiliated firms were as follows:
| | Amount |
| Fidelity Series Blue Chip Growth Fund | $82,881 |
Interfund Lending Program. Pursuant to an Exemptive Order issued by the SEC, the fund, along with other registered investment companies having management contracts with Fidelity Management & Research Company LLC (FMR), or other affiliated entities of FMR, may participate in an interfund lending program. This program provides an alternative credit facility allowing the fund to borrow from, or lend money to, other participating affiliated funds. At period end, there were no interfund loans outstanding. Activity in this program during the period for which loans were outstanding was as follows:
| | Borrower or Lender | Average Loan Balance | Weighted Average Interest Rate | Interest Expense |
| Fidelity Series Blue Chip Growth Fund | Borrower | $45,416,065 | 1.14% | $65,941 |
Interfund Trades. Funds may purchase from or sell securities to other Fidelity Funds under procedures adopted by the Board. The procedures have been designed to ensure these interfund trades are executed in accordance with Rule 17a-7 of the 1940 Act. Interfund trades are included within the respective purchases and sales amounts shown in the Purchases and Sales of Investments note.
Affiliated Exchanges In-Kind. During the period, the Fund received investments and cash valued at $256,703,045 in exchange for 19,043,253 shares of the Fund. The amount of in-kind exchanges is included in share transactions in the accompanying Statement of Changes in Net Assets.
Other. During the period, the investment adviser reimbursed the Fund for certain losses in the amount of $47,230.
7. Committed Line of Credit.
Certain Funds participate with other funds managed by the investment adviser or an affiliate in a $4.25 billion credit facility (the "line of credit") to be utilized for temporary or emergency purposes to fund shareholder redemptions or for other short-term liquidity purposes. The participating funds have agreed to pay commitment fees on their pro-rata portion of the line of credit, which are reflected in Miscellaneous expenses on the Statement of Operations, and are as follows:
| | Amount |
| Fidelity Series Blue Chip Growth Fund | $13,895 |
During the period, there were no borrowings on this line of credit.
8. Security Lending.
The Fund lends portfolio securities from time to time in order to earn additional income. Lending agents are used, including National Financial Services (NFS), an affiliate of the Fund. Pursuant to a securities lending agreement, NFS will receive a fee, which is capped at 9.9% of daily lending revenue, for its services as lending agent. The Fund may lend securities to certain qualified borrowers, including NFS. On the settlement date of the loan, the Fund receives collateral (in the form of U.S. Treasury obligations, letters of credit and/or cash) against the loaned securities and maintains collateral in an amount not less than 100% of the market value of the loaned securities during the period of the loan. The market value of the loaned securities is determined at the close of business of the Fund and any additional required collateral is delivered to the Fund on the next business day. The Fund or borrower may terminate the loan at any time, and if the borrower defaults on its obligation to return the securities loaned because of insolvency or other reasons, the Fund may apply collateral received from the borrower against the obligation. The Fund may experience delays and costs in recovering the securities loaned. Any cash collateral received is invested in the Fidelity Securities Lending Cash Central Fund. The value of loaned securities and cash collateral at period end are disclosed on the Fund's Statement of Assets and Liabilities. The value of securities loaned to NFS, as affiliated borrower, at period end was $452,679. Total fees paid by the Fund to NFS, as lending agent, amounted to $261,182. Security lending income represents the income earned on investing cash collateral, less rebates paid to borrowers and any lending agent fees associated with the loan, plus any premium payments received for lending certain types of securities. Net income from the Fidelity Securities Lending Cash Central Fund during the period is presented in the Statement of Operations as a component of income from Fidelity Central Funds (and includes $53,398 from securities loaned to NFS, as affiliated borrower).
9. Expense Reductions.
Through arrangements with the Fund's custodian, credits realized as a result of certain uninvested cash balances were used to reduce the Fund's expenses by $1,824.
10. Other.
The Fund's organizational documents provide former and current trustees and officers with a limited indemnification against liabilities arising in connection with the performance of their duties to the Fund. In the normal course of business, the Fund may also enter into contracts that provide general indemnifications. The Fund's maximum exposure under these arrangements is unknown as this would be dependent on future claims that may be made against the Fund. The risk of material loss from such claims is considered remote.
At the end of the period, mutual funds and accounts managed by the investment adviser or its affiliates were the owners of record of all of the outstanding shares of the Fund.
11. Coronavirus (COVID-19) Pandemic.
An outbreak of COVID-19 first detected in China during December 2019 has since spread globally and was declared a pandemic by the World Health Organization during March 2020. Developments that disrupt global economies and financial markets, such as the COVID-19 pandemic, may magnify factors that affect the Fund's performance.
Report of Independent Registered Public Accounting Firm
To the Board of Trustees of Fidelity Securities Fund and Shareholders of Fidelity Series Blue Chip Growth Fund
Opinion on the Financial Statements and Financial Highlights
We have audited the accompanying statement of assets and liabilities of Fidelity Series Blue Chip Growth Fund (the "Fund"), a fund of Fidelity Securities Fund, including the schedule of investments, as of July 31, 2020, the related statement of operations for the year then ended, the statement of changes in net assets for each of the two years in the period then ended, the financial highlights for each of the five years in the period then ended, and the related notes. In our opinion, the financial statements and financial highlights present fairly, in all material respects, the financial position of the Fund as of July 31, 2020, and the results of its operations for the year then ended, the changes in its net assets for each of the two years in the period then ended, and the financial highlights for each of the five years in the period then ended in conformity with accounting principles generally accepted in the United States of America.
Basis for Opinion
These financial statements and financial highlights are the responsibility of the Fund's management. Our responsibility is to express an opinion on the Fund's financial statements and financial highlights based on our audits. We are a public accounting firm registered with the Public Company Accounting Oversight Board (United States) (PCAOB) and are required to be independent with respect to the Fund in accordance with the U.S. federal securities laws and the applicable rules and regulations of the Securities and Exchange Commission and the PCAOB.
We conducted our audits in accordance with the standards of the PCAOB. Those standards require that we plan and perform the audit to obtain reasonable assurance about whether the financial statements and financial highlights are free of material misstatement, whether due to error or fraud. The Fund is not required to have, nor were we engaged to perform, an audit of its internal control over financial reporting. As part of our audits we are required to obtain an understanding of internal control over financial reporting but not for the purpose of expressing an opinion on the effectiveness of the Fund’s internal control over financial reporting. Accordingly, we express no such opinion.
Our audits included performing procedures to assess the risks of material misstatement of the financial statements and financial highlights, whether due to error or fraud, and performing procedures that respond to those risks. Such procedures included examining, on a test basis, evidence regarding the amounts and disclosures in the financial statements and financial highlights. Our audits also included evaluating the accounting principles used and significant estimates made by management, as well as evaluating the overall presentation of the financial statements and financial highlights. Our procedures included confirmation of securities owned as of July 31, 2020, by correspondence with the custodian and brokers; when replies were not received from brokers, we performed other auditing procedures. We believe that our audits provide a reasonable basis for our opinion.
/s/ Deloitte & Touche LLP
Boston, Massachusetts
September 15, 2020
We have served as the auditor of one or more of the Fidelity investment companies since 1999.
Trustees and Officers
The Trustees, Members of the Advisory Board (if any), and officers of the trust and fund, as applicable, are listed below. The Board of Trustees governs the fund and is responsible for protecting the interests of shareholders. The Trustees are experienced executives who meet periodically throughout the year to oversee the fund's activities, review contractual arrangements with companies that provide services to the fund, oversee management of the risks associated with such activities and contractual arrangements, and review the fund's performance. Except for Jonathan Chiel, each of the Trustees oversees 311 funds. Mr. Chiel oversees 174 funds.
The Trustees hold office without limit in time except that (a) any Trustee may resign; (b) any Trustee may be removed by written instrument, signed by at least two-thirds of the number of Trustees prior to such removal; (c) any Trustee who requests to be retired or who has become incapacitated by illness or injury may be retired by written instrument signed by a majority of the other Trustees; and (d) any Trustee may be removed at any special meeting of shareholders by a two-thirds vote of the outstanding voting securities of the trust. Each Trustee who is not an interested person (as defined in the 1940 Act) of the trust and the fund is referred to herein as an Independent Trustee. Each Independent Trustee shall retire not later than the last day of the calendar year in which his or her 75th birthday occurs. The Independent Trustees may waive this mandatory retirement age policy with respect to individual Trustees. Officers and Advisory Board Members hold office without limit in time, except that any officer or Advisory Board Member may resign or may be removed by a vote of a majority of the Trustees at any regular meeting or any special meeting of the Trustees. Except as indicated, each individual has held the office shown or other offices in the same company for the past five years.
The fund’s Statement of Additional Information (SAI) includes more information about the Trustees. To request a free copy, call Fidelity at 1-800-544-8544.
Experience, Skills, Attributes, and Qualifications of the Trustees. The Governance and Nominating Committee has adopted a statement of policy that describes the experience, qualifications, attributes, and skills that are necessary and desirable for potential Independent Trustee candidates (Statement of Policy). The Board believes that each Trustee satisfied at the time he or she was initially elected or appointed a Trustee, and continues to satisfy, the standards contemplated by the Statement of Policy. The Governance and Nominating Committee also engages professional search firms to help identify potential Independent Trustee candidates who have the experience, qualifications, attributes, and skills consistent with the Statement of Policy. From time to time, additional criteria based on the composition and skills of the current Independent Trustees, as well as experience or skills that may be appropriate in light of future changes to board composition, business conditions, and regulatory or other developments, have also been considered by the professional search firms and the Governance and Nominating Committee. In addition, the Board takes into account the Trustees' commitment and participation in Board and committee meetings, as well as their leadership of standing and ad hoc committees throughout their tenure.
In determining that a particular Trustee was and continues to be qualified to serve as a Trustee, the Board has considered a variety of criteria, none of which, in isolation, was controlling. The Board believes that, collectively, the Trustees have balanced and diverse experience, qualifications, attributes, and skills, which allow the Board to operate effectively in governing the fund and protecting the interests of shareholders. Information about the specific experience, skills, attributes, and qualifications of each Trustee, which in each case led to the Board's conclusion that the Trustee should serve (or continue to serve) as a trustee of the fund, is provided below.
Board Structure and Oversight Function. Robert A. Lawrence is an interested person and currently serves as Acting Chairman. The Trustees have determined that an interested Chairman is appropriate and benefits shareholders because an interested Chairman has a personal and professional stake in the quality and continuity of services provided to the fund. Independent Trustees exercise their informed business judgment to appoint an individual of their choosing to serve as Chairman, regardless of whether the Trustee happens to be independent or a member of management. The Independent Trustees have determined that they can act independently and effectively without having an Independent Trustee serve as Chairman and that a key structural component for assuring that they are in a position to do so is for the Independent Trustees to constitute a substantial majority for the Board. The Independent Trustees also regularly meet in executive session. Ned C. Lautenbach and David M. Thomas serve as Co-Lead Independent Trustees and as such each (i) acts as a liaison between the Independent Trustees and management with respect to matters important to the Independent Trustees and (ii) with management prepares agendas for Board meetings.
Fidelity® funds are overseen by different Boards of Trustees. The fund's Board oversees Fidelity's high income and certain equity funds, and other Boards oversee Fidelity's investment-grade bond, money market, asset allocation, and other equity funds. The asset allocation funds may invest in Fidelity® funds overseen by the fund's Board. The use of separate Boards, each with its own committee structure, allows the Trustees of each group of Fidelity® funds to focus on the unique issues of the funds they oversee, including common research, investment, and operational issues. On occasion, the separate Boards establish joint committees to address issues of overlapping consequences for the Fidelity® funds overseen by each Board.
The Trustees operate using a system of committees to facilitate the timely and efficient consideration of all matters of importance to the Trustees, the fund, and fund shareholders and to facilitate compliance with legal and regulatory requirements and oversight of the fund's activities and associated risks. The Board, acting through its committees, has charged FMR and its affiliates with (i) identifying events or circumstances the occurrence of which could have demonstrably adverse effects on the fund's business and/or reputation; (ii) implementing processes and controls to lessen the possibility that such events or circumstances occur or to mitigate the effects of such events or circumstances if they do occur; and (iii) creating and maintaining a system designed to evaluate continuously business and market conditions in order to facilitate the identification and implementation processes described in (i) and (ii) above. Because the day-to-day operations and activities of the fund are carried out by or through FMR, its affiliates, and other service providers, the fund's exposure to risks is mitigated but not eliminated by the processes overseen by the Trustees. While each of the Board's committees has responsibility for overseeing different aspects of the fund's activities, oversight is exercised primarily through the Operations, Audit, and Compliance Committees. Appropriate personnel, including but not limited to the fund's Chief Compliance Officer (CCO), FMR's internal auditor, the independent accountants, the fund's Treasurer and portfolio management personnel, make periodic reports to the Board's committees, as appropriate, including an annual review of Fidelity's risk management program for the Fidelity® funds. The responsibilities of each standing committee, including their oversight responsibilities, are described further under "Standing Committees of the Trustees."
Interested Trustees*:
Correspondence intended for a Trustee who is an interested person may be sent to Fidelity Investments, 245 Summer Street, Boston, Massachusetts 02210.
Name, Year of Birth; Principal Occupations and Other Relevant Experience+
Jonathan Chiel (1957)
Year of Election or Appointment: 2016
Trustee
Mr. Chiel also serves as Trustee of other Fidelity® funds. Mr. Chiel is Executive Vice President and General Counsel for FMR LLC (diversified financial services company, 2012-present). Previously, Mr. Chiel served as general counsel (2004-2012) and senior vice president and deputy general counsel (2000-2004) for John Hancock Financial Services; a partner with Choate, Hall & Stewart (1996-2000) (law firm); and an Assistant United States Attorney for the United States Attorney’s Office of the District of Massachusetts (1986-95), including Chief of the Criminal Division (1993-1995). Mr. Chiel is a director on the boards of the Boston Bar Foundation and the Maimonides School.
Robert A. Lawrence (1952)
Year of Election or Appointment: 2020
Trustee
Acting Chairman of the Board of Trustees
Mr. Lawrence also serves as Trustee of other funds. Previously, Mr. Lawrence served as a Member of the Advisory Board of certain funds. Prior to his retirement in 2008, Mr. Lawrence served as Vice President of certain Fidelity® funds (2006-2008), Senior Vice President, Head of High Income Division of Fidelity Management & Research Company (investment adviser firm, 2006-2008), and President of Fidelity Strategic Investments (investment adviser firm, 2002-2005).
* Determined to be an “Interested Trustee” by virtue of, among other things, his or her affiliation with the trust or various entities under common control with FMR.
+ The information includes the Trustee's principal occupation during the last five years and other information relating to the experience, attributes, and skills relevant to the Trustee's qualifications to serve as a Trustee, which led to the conclusion that the Trustee should serve as a Trustee for the fund.
Independent Trustees:
Correspondence intended for an Independent Trustee may be sent to Fidelity Investments, P.O. Box 55235, Boston, Massachusetts 02205-5235.
Name, Year of Birth; Principal Occupations and Other Relevant Experience+
Dennis J. Dirks (1948)
Year of Election or Appointment: 2005
Trustee
Mr. Dirks also serves as Trustee of other Fidelity® funds. Prior to his retirement in May 2003, Mr. Dirks served as Chief Operating Officer and as a member of the Board of The Depository Trust & Clearing Corporation (financial markets infrastructure), President, Chief Operating Officer and a member of the Board of The Depository Trust Company (DTC), President and a member of the Board of the National Securities Clearing Corporation (NSCC), Chief Executive Officer and a member of the Board of the Government Securities Clearing Corporation and Chief Executive Officer and a member of the Board of the Mortgage-Backed Securities Clearing Corporation. Mr. Dirks currently serves as a member of the Finance Committee (2016-present) and Board (2017-present) and is Treasurer (2018-present) of the Asolo Repertory Theatre.
Donald F. Donahue (1950)
Year of Election or Appointment: 2018
Trustee
Mr. Donahue also serves as Trustee of other Fidelity® funds. Mr. Donahue serves as President and Chief Executive Officer of Miranda Partners, LLC (risk consulting for the financial services industry, 2012-present). Previously, Mr. Donahue served as Chief Executive Officer (2006-2012), Chief Operating Officer (2003-2006) and Managing Director, Customer Marketing and Development (1999-2003) of The Depository Trust & Clearing Corporation (financial markets infrastructure). Mr. Donahue currently serves as a member (2007-present) and Co-Chairman (2016-present) of the Board of United Way of New York, a member of the Board of NYC Leadership Academy (2012-present) and a member of the Board of Advisors of Ripple Labs, Inc. (financial services, 2015-present). Mr. Donahue previously served as a member of the Advisory Board of certain Fidelity® funds (2015-2018).
Vicki L. Fuller (1957)
Year of Election or Appointment: 2020
Trustee
Ms. Fuller also serves as Trustee of other Fidelity® funds. Previously, Ms. Fuller served as a member of the Advisory Board of certain Fidelity® funds (2018-2020), Chief Investment Officer of the New York State Common Retirement Fund (2012-2018) and held a variety of positions at AllianceBernstein L.P. (global asset management, 1985-2012), including Managing Director (2006-2012) and Senior Vice President and Senior Portfolio Manager (2001-2006). Ms. Fuller currently serves as a member of the Board, Audit Committee and Nominating and Governance Committee of The Williams Companies, Inc. (natural gas infrastructure, 2018-present) and as a member of the Board of Treliant, LLC (consulting, 2019-present).
Patricia L. Kampling (1959)
Year of Election or Appointment: 2020
Trustee
Ms. Kampling also serves as Trustee of other Fidelity® funds. Prior to her retirement, Ms. Kampling served as Chairman of the Board and Chief Executive Officer (2012-2019), President and Chief Operating Officer (2011-2012) and Executive Vice President and Chief Financial Officer (2010-2011) of Alliant Energy Corporation. Ms. Kampling currently serves as a member of the Board, Compensation Committee and Executive Committee and as Chair of the Audit Committee of Briggs & Stratton Corporation (manufacturing, 2011-present) and as a member of the Board, Audit, Finance and Risk Committee and Safety, Environmental, Technology and Operations Committee of American Water Works Company, Inc. (utilities company, 2019-present). In addition, Ms. Kampling currently serves as a member of the Board of the Nature Conservancy, Wisconsin Chapter (2019-present). Previously, Ms. Kampling served as a Member of the Advisory Board of certain Fidelity® funds (2020), a member of the Board of Interstate Power and Light Company (2012-2019) and Wisconsin Power and Light Company (2012-2019) (each a subsidiary of Alliant Energy Corporation) and as a member of the Board and Workforce Development Committee of the Business Roundtable (2018-2019).
Alan J. Lacy (1953)
Year of Election or Appointment: 2008
Trustee
Mr. Lacy also serves as Trustee of other Fidelity® funds. Previously, Mr. Lacy served as Senior Adviser (2007-2014) of Oak Hill Capital Partners, L.P. (private equity), Chief Executive Officer (2005) and Vice Chairman (2005-2006) of Sears Holdings Corporation (retail), Chief Executive Officer and Chairman of the Board of Sears, Roebuck and Co. (retail, 2000-2005), Chairman (2014-2017) and a member of the Board (2010-2017) of Dave & Buster’s Entertainment, Inc. (restaurant and entertainment complexes) and a member of the Board of Bristol-Myers Squibb Company (global pharmaceuticals, 2008-2020). Mr. Lacy currently serves as a Trustee of the California Chapter of The Nature Conservancy (2015-present) and a member of the Board of the Center for Advanced Study in the Behavioral Sciences at Stanford University (2015-present).
Ned C. Lautenbach (1944)
Year of Election or Appointment: 2000
Trustee
Co-Lead Independent Trustee
Mr. Lautenbach also serves as Trustee of other Fidelity® funds. Mr. Lautenbach currently serves as Chair of the Board of Governors, State University System of Florida (2013-present) and is a member of the Council on Foreign Relations (1994-present). He is also a member and has in the past served as Chairman of the Board of Directors of Artis-Naples (2012-present). Previously, Mr. Lautenbach served as a member and then Lead Director of the Board of Directors of Eaton Corporation (diversified industrial, 1997-2016). He was also a Partner at Clayton, Dubilier & Rice, LLC (private equity investment, 1998-2010); as well as Director of Sony Corporation (2006-2007). In addition, Mr. Lautenbach had a 30-year career with IBM (technology company), during which time he served as Senior Vice President and as a member of the Corporate Executive Committee (1968-1998).
Joseph Mauriello (1944)
Year of Election or Appointment: 2008
Trustee
Mr. Mauriello also serves as Trustee of other Fidelity® funds. Prior to his retirement in January 2006, Mr. Mauriello served in numerous senior management positions including Deputy Chairman and Chief Operating Officer (2004-2005), and Vice Chairman of Financial Services (2002-2004) of KPMG LLP US (professional services, 1965-2005). Mr. Mauriello currently serves as a member of the Independent Directors Council Governing Council (2015-present). Previously, Mr. Mauriello served as a member of the Board of XL Group plc. (global insurance and re-insurance, 2006-2018).
Cornelia M. Small (1944)
Year of Election or Appointment: 2005
Trustee
Ms. Small also serves as Trustee of other Fidelity® funds. Previously, Ms. Small served as Chief Investment Officer, Director of Global Equity Investments and a member of Scudder, Stevens & Clark and Scudder Kemper Investments. Ms. Small previously served as a member of the Board (2009-2019) and Chair of the Investment Committee (2010-2019) of the Teagle Foundation and a member of the Investment Committee of the Berkshire Taconic Community Foundation (2008-2019).
Garnett A. Smith (1947)
Year of Election or Appointment: 2018
Trustee
Mr. Smith also serves as Trustee of other Fidelity® funds. Prior to his retirement, Mr. Smith served as Chairman and Chief Executive Officer (1990-1997) and President (1986-1990) of Inbrand Corp. (manufacturer of personal absorbent products). Prior to his employment with Inbrand Corp., he was employed by a retail fabric chain and North Carolina National Bank (now Bank of America). Mr. Smith previously served as a member of the Advisory Board of certain Fidelity® funds (2012-2013).
David M. Thomas (1949)
Year of Election or Appointment: 2008
Trustee
Co-Lead Independent Trustee
Mr. Thomas also serves as Trustee of other Fidelity® funds. Previously, Mr. Thomas served as Executive Chairman (2005-2006) and Chairman and Chief Executive Officer (2000-2005) of IMS Health, Inc. (pharmaceutical and healthcare information solutions). Mr. Thomas currently serves as Non-Executive Chairman of the Board of Fortune Brands Home and Security (home and security products, 2011-present), and a member of the Board (2004-present) and Presiding Director (2013-present) of Interpublic Group of Companies, Inc. (marketing communication).
Susan Tomasky (1953)
Year of Election or Appointment: 2020
Trustee
Ms. Tomasky also serves as Trustee of other Fidelity® funds. Prior to her retirement, Ms. Tomasky served in various executive officer positions at American Electric Power Company, Inc. (1998-2011), including most recently as President of AEP Transmission (2007-2011). Ms. Tomasky currently serves as a member of the Board and Sustainability Committee and as Chair of the Audit Committee of Marathon Petroleum Corporation (2018-present) and as a member of the Board, Corporate Governance Committee and Organization and Compensation Committee and as Chair of the Audit Committee of Public Service Enterprise Group, Inc. (utilities company, 2012-present). In addition, Ms. Tomasky currently serves as a member of the Board of the Columbus Regional Airport Authority (2007-present), as a member of the Board of the Royal Shakespeare Company – America (2009-present), as a member of the Board of the Columbus Association for the Performing Arts (2011-present) and as a member of the Board of Kenyon College (2016-present). Previously, Ms. Tomasky served as a Member of the Advisory Board of certain Fidelity® funds (2020), a member of the Board (2011-2019) and as Lead Independent Director (2015-2018) of Andeavor Corporation (previously Tesoro Corporation) (independent oil refiner and marketer) and as a member of the Board of Summit Midstream Partners LP (energy, 2012-2018).
Michael E. Wiley (1950)
Year of Election or Appointment: 2020
Trustee
Mr. Wiley also serves as Trustee of other Fidelity® funds. Previously, Mr. Wiley served as a member of the Advisory Board of certain Fidelity® funds (2018-2020), Chairman, President and CEO of Baker Hughes, Inc. (oilfield services, 2000-2004). Mr. Wiley also previously served as a member of the Board of Andeavor Corporation (independent oil refiner and marketer, 2005-2018), a member of the Board of Andeavor Logistics LP (natural resources logistics, 2015-2018) and a member of the Board of High Point Resources (exploration and production, 2005-2020).
+ The information includes the Trustee's principal occupation during the last five years and other information relating to the experience, attributes, and skills relevant to the Trustee's qualifications to serve as a Trustee, which led to the conclusion that the Trustee should serve as a Trustee for the fund.
Advisory Board Members and Officers:
Correspondence intended for a Member of the Advisory Board (if any) may be sent to Fidelity Investments, P.O. Box 55235, Boston, Massachusetts 02205-5235. Correspondence intended for an officer or Peter S. Lynch may be sent to Fidelity Investments, 245 Summer Street, Boston, Massachusetts 02210. Officers appear below in alphabetical order.
Name, Year of Birth; Principal Occupation
Peter S. Lynch (1944)
Year of Election or Appointment: 2003
Member of the Advisory Board
Mr. Lynch also serves as a Member of the Advisory Board of other Fidelity® funds. Mr. Lynch is Vice Chairman and a Director of Fidelity Management & Research Company LLC (investment adviser firm). In addition, Mr. Lynch serves as a Trustee of Boston College and as the Chairman of the Inner-City Scholarship Fund. Previously, Mr. Lynch served as Vice Chairman and a Director of FMR Co., Inc. (investment adviser firm) and on the Special Olympics International Board of Directors (1997-2006).
Elizabeth Paige Baumann (1968)
Year of Election or Appointment: 2017
Anti-Money Laundering (AML) Officer
Ms. Baumann also serves as AML Officer of other funds. She is Chief AML Officer (2012-present) and Senior Vice President (2014-present) of FMR LLC (diversified financial services company) and is an employee of Fidelity Investments. Previously, Ms. Baumann served as AML Officer of certain funds (2017-2019), as AML Officer of the funds (2012-2016), and Vice President (2007-2014) and Deputy Anti-Money Laundering Officer (2007-2012) of FMR LLC.
Craig S. Brown (1977)
Year of Election or Appointment: 2019
Assistant Treasurer
Mr. Brown also serves as Assistant Treasurer of other funds. Mr. Brown is an employee of Fidelity Investments (2013-present).
John J. Burke III (1964)
Year of Election or Appointment: 2018
Chief Financial Officer
Mr. Burke also serves as Chief Financial Officer of other funds. Mr. Burke serves as Head of Investment Operations for Fidelity Fund and Investment Operations (2018-present) and is an employee of Fidelity Investments (1998-present). Previously Mr. Burke served as head of Asset Management Investment Operations (2012-2018).
William C. Coffey (1969)
Year of Election or Appointment: 2019
Assistant Secretary
Mr. Coffey also serves as Assistant Secretary of other funds. He is Senior Vice President and Deputy General Counsel of FMR LLC (diversified financial services company, 2010-present), and is an employee of Fidelity Investments. Previously, Mr. Coffey served as Secretary and CLO of certain funds (2018-2019); CLO, Secretary, and Senior Vice President of Fidelity Management & Research Company and FMR Co., Inc. (investment adviser firms, 2018-2019); Secretary of Fidelity SelectCo, LLC and Fidelity Investments Money Management, Inc. (investment adviser firms, 2018-2019); CLO of Fidelity Management & Research (Hong Kong) Limited, FMR Investment Management (UK) Limited, and Fidelity Management & Research (Japan) Limited (investment adviser firms, 2018-2019); and Assistant Secretary of certain funds (2009-2018).
Timothy M. Cohen (1969)
Year of Election or Appointment: 2018
Vice President
Mr. Cohen also serves as Vice President of other funds. Mr. Cohen serves as Co-Head of Equity (2018-present), a Director of Fidelity Management & Research (Japan) Limited (investment adviser firm, 2016-present), and is an employee of Fidelity Investments. Previously, Mr. Cohen served as Executive Vice President of Fidelity SelectCo, LLC (2019), Head of Global Equity Research (2016-2018), Chief Investment Officer - Equity and a Director of Fidelity Management & Research (U.K.) Inc. (investment adviser firm, 2013-2015) and as a Director of Fidelity Management & Research (Hong Kong) Limited (investment adviser firm, 2017).
Jonathan Davis (1968)
Year of Election or Appointment: 2010
Assistant Treasurer
Mr. Davis also serves as Assistant Treasurer of other funds. Mr. Davis serves as Assistant Treasurer of FMR Capital, Inc. (2017-present) and is an employee of Fidelity Investments. Previously, Mr. Davis served as Vice President and Associate General Counsel of FMR LLC (diversified financial services company, 2003-2010).
Laura M. Del Prato (1964)
Year of Election or Appointment: 2018
Assistant Treasurer
Ms. Del Prato also serves as an officer of other funds. Ms. Del Prato is an employee of Fidelity Investments (2017-present). Previously, Ms. Del Prato served as President and Treasurer of The North Carolina Capital Management Trust: Cash Portfolio and Term Portfolio (2018-2020). Prior to joining Fidelity Investments, Ms. Del Prato served as a Managing Director and Treasurer of the JPMorgan Mutual Funds (2014-2017). Prior to JPMorgan, Ms. Del Prato served as a partner at Cohen Fund Audit Services (accounting firm, 2012-2013) and KPMG LLP (accounting firm, 2004-2012).
Colm A. Hogan (1973)
Year of Election or Appointment: 2020
Assistant Treasurer
Mr. Hogan also serves as an officer of other funds. Mr. Hogan serves as Assistant Treasurer of FMR Capital, Inc. (2017-present) and is an employee of Fidelity Investments (2005-present). Previously, Mr. Hogan served as Deputy Treasurer of certain Fidelity® funds (2016-2020) and Assistant Treasurer of certain Fidelity® funds (2016-2018).
Pamela R. Holding (1964)
Year of Election or Appointment: 2018
Vice President
Ms. Holding also serves as Vice President of other funds. Ms. Holding serves as Co-Head of Equity (2018-present) and is an employee of Fidelity Investments (2013-present). Previously, Ms. Holding served as Executive Vice President of Fidelity SelectCo, LLC (2019) and as Chief Investment Officer of Fidelity Institutional Asset Management (2013-2018).
Cynthia Lo Bessette (1969)
Year of Election or Appointment: 2019
Secretary and Chief Legal Officer (CLO)
Ms. Lo Bessette also serves as an officer of other funds. Ms. Lo Bessette serves as CLO, Secretary, and Senior Vice President of Fidelity Management & Research Company LLC (investment adviser firm, 2019-present); and CLO of Fidelity Management & Research (Hong Kong) Limited, FMR Investment Management (UK) Limited, and Fidelity Management & Research (Japan) Limited (investment adviser firms, 2019-present). She is a Senior Vice President and Deputy General Counsel of FMR LLC (diversified financial services company, 2019-present), and is an employee of Fidelity Investments. Previously, Ms. Lo Bessette served as CLO, Secretary, and Senior Vice President of FMR Co., Inc. (investment adviser firm, 2019); Secretary of Fidelity SelectCo, LLC and Fidelity Investments Money Management, Inc. (investment adviser firms, 2019). Prior to joining Fidelity Investments, Ms. Lo Bessette was Executive Vice President, General Counsel (2016-2019) and Senior Vice President, Deputy General Counsel (2015-2016) of OppenheimerFunds (investment management company) and Deputy Chief Legal Officer (2013-2015) of Jennison Associates LLC (investment adviser firm).
Chris Maher (1972)
Year of Election or Appointment: 2020
Deputy Treasurer
Mr. Maher also serves as an officer of other funds. Mr. Maher serves as Assistant Treasurer of FMR Capital, Inc. (2017-present), and is an employee of Fidelity Investments (2008-present). Previously, Mr. Maher served as Assistant Treasurer of certain funds (2013-2020); Vice President of Asset Management Compliance (2013), Vice President of the Program Management Group of FMR (investment adviser firm, 2010-2013), and Vice President of Valuation Oversight (2008-2010).
Jason P. Pogorelec (1975)
Year of Election or Appointment: 2020
Chief Compliance Officer
Mr. Pogorelec also serves as Chief Compliance Officer of other funds. Mr. Pogorelec is a senior Vice President of Asset Management Compliance for Fidelity Investments and is an employee of Fidelity Investments (2006-present). Previously, Mr. Pogorelec served as Vice President, Associate General Counsel for Fidelity Investments (2010-2020) and Assistant Secretary of certain Fidelity funds (2015-2020).
Stacie M. Smith (1974)
Year of Election or Appointment: 2016
President and Treasurer
Ms. Smith also serves as an officer of other funds. Ms. Smith serves as Assistant Treasurer of FMR Capital, Inc. (2017-present), is an employee of Fidelity Investments (2009-present), and has served in other fund officer roles. Prior to joining Fidelity Investments, Ms. Smith served as Senior Audit Manager of Ernst & Young LLP (accounting firm, 1996-2009). Previously, Ms. Smith served as Assistant Treasurer (2013-2019) and Deputy Treasurer (2013-2016) of certain Fidelity® funds.
Marc L. Spector (1972)
Year of Election or Appointment: 2016
Assistant Treasurer
Mr. Spector also serves as an officer of other funds. Mr. Spector serves as Assistant Treasurer of FMR Capital, Inc. (2017-present) and is an employee of Fidelity Investments (2016-present). Prior to joining Fidelity Investments, Mr. Spector served as Director at the Siegfried Group (accounting firm, 2013-2016), and prior to Siegfried Group as audit senior manager at Deloitte & Touche LLP (accounting firm, 2005-2013).
Jim Wegmann (1979)
Year of Election or Appointment: 2019
Assistant Treasurer
Mr. Wegmann also serves as Assistant Treasurer of other funds. Mr. Wegmann is an employee of Fidelity Investments (2011-present).
Shareholder Expense Example
As a shareholder, you incur two types of costs: (1) transaction costs, which may include sales charges (loads) on purchase payments or redemption proceeds, as applicable and (2) ongoing costs, which generally include management fees, distribution and/or service (12b-1) fees and other Fund expenses. This Example is intended to help you understand your ongoing costs (in dollars) of investing in a fund and to compare these costs with the ongoing costs of investing in other mutual funds.
The Example is based on an investment of $1,000 invested at the beginning of the period and held for the entire period (February 1, 2020 to July 31, 2020).
Actual Expenses
The first line of the accompanying table provides information about actual account values and actual expenses. You may use the information in this line, together with the amount you invested, to estimate the expenses that you paid over the period. Simply divide your account value by $1,000.00 (for example, an $8,600 account value divided by $1,000.00 = 8.6), then multiply the result by the number in the first line for a class/Fund under the heading entitled "Expenses Paid During Period" to estimate the expenses you paid on your account during this period. If any fund is a shareholder of any underlying mutual funds or exchange-traded funds (ETFs) (the Underlying Funds), such fund indirectly bears its proportional share of the expenses of the Underlying Funds in addition to the direct expenses incurred presented in the table. These fees and expenses are not included in the annualized expense ratio used to calculate the expense estimate in the table below.
Hypothetical Example for Comparison Purposes
The second line of the accompanying table provides information about hypothetical account values and hypothetical expenses based on the actual expense ratio and an assumed rate of return of 5% per year before expenses, which is not the actual return. The hypothetical account values and expenses may not be used to estimate the actual ending account balance or expenses you paid for the period. You may use this information to compare the ongoing costs of investing in the Fund and other funds. To do so, compare this 5% hypothetical example with the 5% hypothetical examples that appear in the shareholder reports of the other funds. If any fund is a shareholder of any Underlying Funds, such fund indirectly bears its proportional share of the expenses of the Underlying Funds in addition to the direct expenses as presented in the table. These fees and expenses are not included in the annualized expense ratio used to calculate the expense estimate in the table below.
Please note that the expenses shown in the table are meant to highlight your ongoing costs only and do not reflect any transaction costs. Therefore, the second line of the table is useful in comparing ongoing costs only, and will not help you determine the relative total costs of owning different funds.
| | Annualized Expense Ratio-A | Beginning
Account Value
February 1, 2020 | Ending
Account Value
July 31, 2020 | Expenses Paid
During Period-B
February 1, 2020
to July 31, 2020 |
| Fidelity Series Blue Chip Growth Fund | - %-C | | | |
| Actual | | $1,000.00 | $1,241.90 | $- -D |
| Hypothetical-E | | $1,000.00 | $1,024.86 | $- -D |
A Annualized expense ratio reflects expenses net of applicable fee waivers.
B Expenses are equal to the annualized expense ratio, multiplied by the average account value over the period, multiplied by 182/ 366 (to reflect the one-half year period). The fees and expenses of any Underlying Funds are not included in each annualized expense ratio.
C Amount represents less than .005%.
D Amount represents less than $.005.
E 5% return per year before expenses
Distributions (Unaudited)
The Board of Trustees of Fidelity Series Blue Chip Growth Fund voted to pay on September 14, 2020, to shareholders of record at the opening of business on September 11, 2020, a distribution of $4.152 per share derived from capital gains realized from sales of portfolio securities and a dividend of $0.084 per share from net investment income.
The fund hereby designates as a capital gain dividend with respect to the taxable year ended July 31, 2020, $1,135,077,612, or, if subsequently determined to be different, the net capital gain of such year.
The fund designates 77% and 83% of the dividends distributed in September and December, respectively during the fiscal year as qualifying for the dividends–received deduction for corporate shareholders.
The fund designates 87% and 98% of the dividends distributed in September and December, respectively during the fiscal year as amounts which may be taken into account as a dividend for the purposes of the maximum rate under section 1(h)(11) of the Internal Revenue Code.
The fund designates 1% of the dividends distributed during the fiscal year as a section 199A dividend.
The fund will notify shareholders in January 2021 of amounts for use in preparing 2020 income tax returns.
Liquidity Risk Management Program
The Securities and Exchange Commission adopted Rule 22e-4 under the Investment Company Act of 1940 (the Liquidity Rule) to promote effective liquidity risk management throughout the open-end investment company industry, thereby reducing the risk that funds will be unable to meet their redemption obligations and mitigating dilution of the interests of fund shareholders.
The Fund has adopted and implemented a liquidity risk management program pursuant to the Liquidity Rule (the Program) effective December 1, 2018. The Program is reasonably designed to assess and manage the Fund’s liquidity risk and to comply with the requirements of the Liquidity Rule. The Fund’s Board of Trustees (the Board) has designated the Fund’s investment adviser as administrator of the Program. The Fidelity advisers have established a Liquidity Risk Management Committee (the LRM Committee) to manage the Program for each of the Fidelity Funds. The LRM Committee monitors the adequacy and effectiveness of implementation of the Program and on a periodic basis assesses each Fund’s liquidity risk based on a variety of factors including (1) the Fund’s investment strategy, (2) portfolio liquidity and cash flow projections during normal and reasonably foreseeable stressed conditions, (3) shareholder redemptions, (4) borrowings and other funding sources and (5) in the case of exchange-traded funds, certain additional factors including the effect of the Fund’s prices and spreads, market participants, and basket compositions on the overall liquidity of the Fund’s portfolio, as applicable.
In accordance with the Program, each of the Fund’s portfolio investments is classified into one of four liquidity categories described below based on a determination of a reasonable expectation for how long it would take to convert the investment to cash (or sell or dispose of the investment) without significantly changing its market value.
- Highly liquid investments – cash or convertible to cash within three business days or less
- Moderately liquid investments – convertible to cash in three to seven calendar days
- Less liquid investments – can be sold or disposed of, but not settled, within seven calendar days
- Illiquid investments – cannot be sold or disposed of within seven calendar days
Liquidity classification determinations take into account a variety of factors including various market, trading and investment-specific considerations, as well as market depth, and generally utilize analysis from a third-party liquidity metrics service.
The Liquidity Rule places a 15% limit on a fund’s illiquid investments and requires funds that do not primarily hold assets that are highly liquid investments to determine and maintain a minimum percentage of the fund’s net assets to be invested in highly liquid investments (highly liquid investment minimum or HLIM). The Program includes provisions reasonably designed to comply with the 15% limit on illiquid investments and for determining, periodically reviewing and complying with the HLIM requirement as applicable.
At a recent meeting of the Fund’s Board of Trustees, the LRM Committee provided a written report to the Board pertaining to the operation, adequacy, and effectiveness of implementation of the Program for the annual period from December 1, 2018 through November 30, 2019. The report concluded that the Program has been implemented and is operating effectively and is reasonably designed to assess and manage the Fund’s liquidity risk.
Proxy Voting Results
A special meeting of shareholders was held on June 9, 2020. The results of votes taken among shareholders on the proposals before them are reported below. Each vote reported represents one dollar of net asset value held on the record date for the meeting.
PROPOSAL 1
To elect a Board of Trustees.
| | # of
Votes | % of
Votes |
| Dennis J. Dirks |
| Affirmative | 43,167,428,219.785 | 94.885 |
| Withheld | 2,327,070,930.034 | 5.115 |
| TOTAL | 45,494,499,149.820 | 100.000 |
| Donald F. Donahue |
| Affirmative | 43,161,668,935.467 | 94.872 |
| Withheld | 2,333,065,287.611 | 5.128 |
| TOTAL | 45,494,734,223.077 | 100.000 |
| Bettina Doulton |
| Affirmative | 43,304,465,213.969 | 95.186 |
| Withheld | 2,190,010,062.903 | 4.814 |
| TOTAL | 45,494,475,276.872 | 100.000 |
| Vicki L. Fuller |
| Affirmative | 43,380,442,631.493 | 95.353 |
| Withheld | 2,114,180,614.639 | 4.647 |
| TOTAL | 45,494,623,246.132 | 100.000 |
| Patricia L. Kampling |
| Affirmative | 43,128,008,796.761 | 94.798 |
| Withheld | 2,366,685,422.999 | 5.202 |
| TOTAL | 45,494,694,219.760 | 100.000 |
| Alan J. Lacy |
| Affirmative | 42,904,065,046.958 | 94.305 |
| Withheld | 2,590,717,567.229 | 5.695 |
| TOTAL | 45,494,782,614.187 | 100.000 |
| Ned C. Lautenbach |
| Affirmative | 42,802,778,827.017 | 94.083 |
| Withheld | 2,692,003,787.170 | 5.917 |
| TOTAL | 45,494,782,614.187 | 100.000 |
| Robert A. Lawrence |
| Affirmative | 42,971,258,294.203 | 94.453 |
| Withheld | 2,523,524,319.984 | 5.547 |
| TOTAL | 45,494,782,614.187 | 100.000 |
| Joseph Mauriello |
| Affirmative | 42,874,562,778.490 | 94.241 |
| Withheld | 2,620,171,874.731 | 5.759 |
| TOTAL | 45,494,734,653.220 | 100.000 |
| Cornelia M. Small |
| Affirmative | 43,029,040,988.063 | 94.580 |
| Withheld | 2,465,741,626.124 | 5.420 |
| TOTAL | 45,494,782,614.187 | 100.000 |
| Garnett A. Smith |
| Affirmative | 42,892,814,945.159 | 94.281 |
| Withheld | 2,601,967,669.028 | 5.719 |
| TOTAL | 45,494,782,614.187 | 100.000 |
| David M. Thomas |
| Affirmative | 42,936,080,036.111 | 94.376 |
| Withheld | 2,558,702,578.076 | 5.624 |
| TOTAL | 45,494,782,614.187 | 100.000 |
| Susan Tomasky |
| Affirmative | 43,147,934,105.796 | 94.842 |
| Withheld | 2,346,571,066.028 | 5.158 |
| TOTAL | 45,494,782,614.187 | 100.000 |
| Michael E. Wiley |
| Affirmative | 42,885,333,102.972 | 94.264 |
| Withheld | 2,609,449,511.215 | 5.736 |
| TOTAL | 45,494,782,614.187 | 100.000 |
PROPOSAL 2
To convert a fundamental investment policy to a non-fundamental investment policy.
| | # of
Votes | % of
Votes |
| Affirmative | 5,015,841,455.529 | 100.000 |
| Against | 0.000 | 0.000 |
| Abstain | 0.000 | 0.000 |
| Broker Non-Vote | 0.000 | 0.000 |
| TOTAL | 5,015,841,455.529 | 100.000 |
|
| Proposal 1 reflects trust wide proposal and voting results. |
XS1-ANN-0920
1.967985.106
Fidelity Flex® Funds
Fidelity Flex® Large Cap Growth Fund
Annual Report
July 31, 2020
See the inside front cover for important information about access to your fund’s shareholder reports.
Beginning on January 1, 2021, as permitted by regulations adopted by the Securities and Exchange Commission, paper copies of a fund’s shareholder reports will no longer be sent by mail, unless you specifically request paper copies of the reports from the fund or from your financial intermediary, such as a financial advisor, broker-dealer or bank. Instead, the reports will be made available on a website, and you will be notified by mail each time a report is posted and provided with a website link to access the report.
If you already elected to receive shareholder reports electronically, you will not be affected by this change and you need not take any action. You may elect to receive shareholder reports and other communications from a fund electronically, by contacting your financial intermediary. For Fidelity customers, visit Fidelity's web site or call Fidelity using the contact information listed below.
You may elect to receive all future reports in paper free of charge. If you wish to continue receiving paper copies of your shareholder reports, you may contact your financial intermediary or, if you are a Fidelity customer, visit Fidelity’s website, or call Fidelity at the applicable toll-free number listed below. Your election to receive reports in paper will apply to all funds held with the fund complex/your financial intermediary.
| Account Type | Website | Phone Number |
| Brokerage, Mutual Fund, or Annuity Contracts: | fidelity.com/mailpreferences | 1-800-343-3548 |
| Employer Provided Retirement Accounts: | netbenefits.fidelity.com/preferences (choose 'no' under Required Disclosures to continue to print) | 1-800-343-0860 |
| Advisor Sold Accounts Serviced Through Your Financial Intermediary: | Contact Your Financial Intermediary | Your Financial Intermediary's phone number |
| Advisor Sold Accounts Serviced by Fidelity: | institutional.fidelity.com | 1-877-208-0098 |
Contents
To view a fund's proxy voting guidelines and proxy voting record for the 12-month period ended June 30, visit http://www.fidelity.com/proxyvotingresults or visit the Securities and Exchange Commission's (SEC) web site at http://www.sec.gov.
You may also call 1-800-544-3455 (for managed account clients) or 1-800-835-5092 (for retirement plan participants) to request a free copy of the proxy voting guidelines.
Standard & Poor's, S&P and S&P 500 are registered service marks of The McGraw-Hill Companies, Inc. and have been licensed for use by Fidelity Distributors Corporation.
Other third-party marks appearing herein are the property of their respective owners.
All other marks appearing herein are registered or unregistered trademarks or service marks of FMR LLC or an affiliated company. © 2020 FMR LLC. All rights reserved.
This report and the financial statements contained herein are submitted for the general information of the shareholders of the Fund. This report is not authorized for distribution to prospective investors in the Fund unless preceded or accompanied by an effective prospectus.
A fund files its complete schedule of portfolio holdings with the SEC for the first and third quarters of each fiscal year on Form N-PORT. Forms N-PORT are available on the SEC’s web site at http://www.sec.gov. A fund's Forms N-PORT may be reviewed and copied at the SEC’s Public Reference Room in Washington, DC. Information regarding the operation of the SEC's Public Reference Room may be obtained by calling 1-800-SEC-0330.
For a complete list of a fund's portfolio holdings, view the most recent holdings listing, semiannual report, or annual report on Fidelity's web site at http://www.fidelity.com, http://www.institutional.fidelity.com, or http://www.401k.com, as applicable.
NOT FDIC INSURED •MAY LOSE VALUE •NO BANK GUARANTEE
Neither the Fund nor Fidelity Distributors Corporation is a bank.
Note to Shareholders:
Early in 2020, the outbreak and spread of a new coronavirus emerged as a public health emergency that had a major influence on financial markets, primarily based on its impact on the global economy and the outlook for corporate earnings. The virus causes a respiratory disease known as COVID-19. On March 11, the World Health Organization declared the COVID-19 outbreak a pandemic, citing sustained risk of further global spread.
In the weeks following, as the crisis worsened, we witnessed an escalating human tragedy with wide-scale social and economic consequences from coronavirus-containment measures. The outbreak of COVID-19 prompted a number of measures to limit the spread, including travel and border restrictions, quarantines, and restrictions on large gatherings. In turn, these resulted in lower consumer activity, diminished demand for a wide range of products and services, disruption in manufacturing and supply chains, and – given the wide variability in outcomes regarding the outbreak – significant market uncertainty and volatility. Amid the turmoil, the U.S. government took unprecedented action – in concert with the U.S. Federal Reserve and central banks around the world – to help support consumers, businesses, and the broader economy, and to limit disruption to the financial system.
The situation continues to unfold, and the extent and duration of its impact on financial markets and the economy remain highly uncertain. Extreme events such as the coronavirus crisis are “exogenous shocks” that can have significant adverse effects on mutual funds and their investments. Although multiple asset classes may be affected by market disruption, the duration and impact may not be the same for all types of assets.
Fidelity is committed to helping you stay informed amid news about COVID-19 and during increased market volatility, and we’re taking extra steps to be responsive to customer needs. We encourage you to visit our websites, where we offer ongoing updates, commentary, and analysis on the markets and our funds.
Performance: The Bottom Line
Average annual total return reflects the change in the value of an investment, assuming reinvestment of distributions from dividend income and capital gains (the profits earned upon the sale of securities that have grown in value, if any) and assuming a constant rate of performance each year. The hypothetical investment and the average annual total returns do not reflect the deduction of taxes that a shareholder would pay on fund distributions or the redemption of fund shares. During periods of reimbursement by Fidelity, a fund’s total return will be greater than it would be had the reimbursement not occurred. How a fund did yesterday is no guarantee of how it will do tomorrow.
Average Annual Total Returns
| For the periods ended July 31, 2020 | Past 1 year | Life of fundA |
| Fidelity Flex® Large Cap Growth Fund | 42.45% | 25.94% |
A From March 8, 2017
$10,000 Over Life of Fund
Let's say hypothetically that $10,000 was invested in Fidelity Flex® Large Cap Growth Fund on March 8, 2017, when the fund started.
The chart shows how the value of your investment would have changed, and also shows how the Russell 1000® Growth Index performed over the same period.
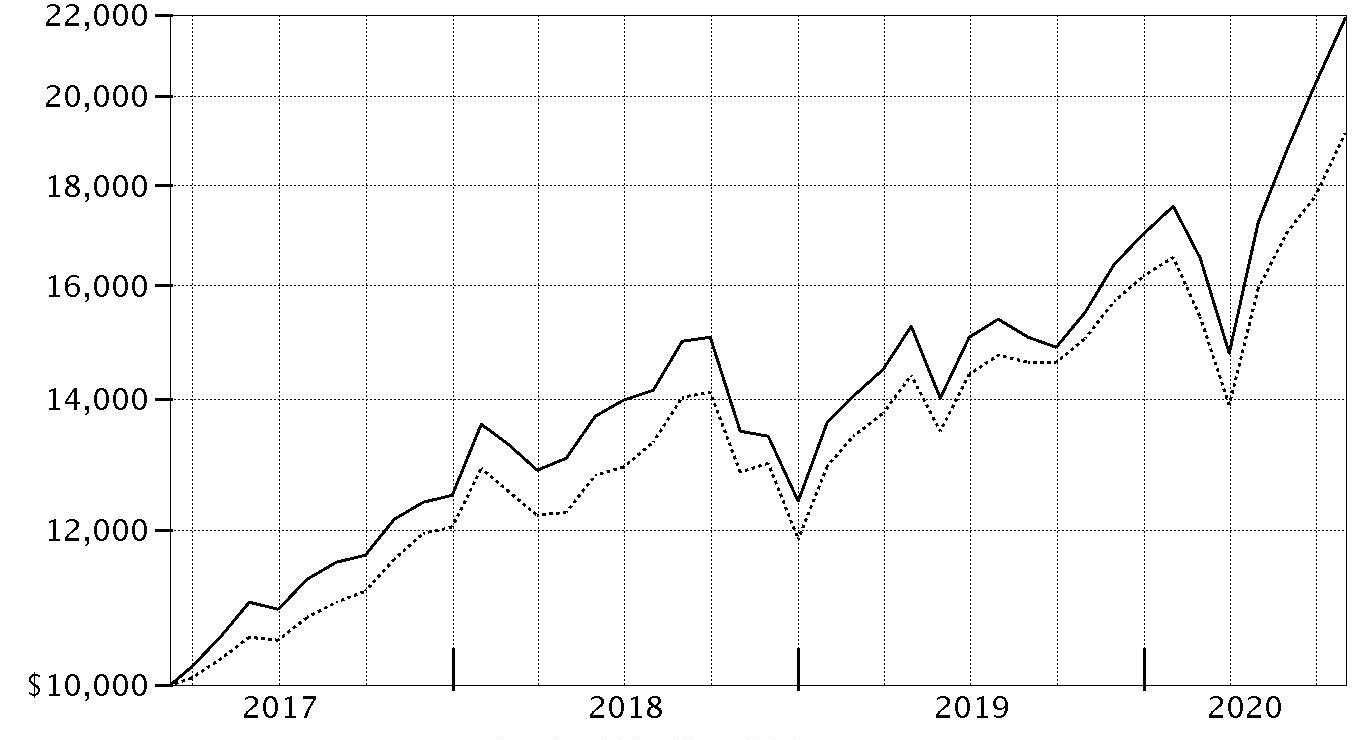
| Period Ending Values |
| $21,904 | Fidelity Flex® Large Cap Growth Fund |
| $19,137 | Russell 1000® Growth Index |
Management's Discussion of Fund Performance
Market Recap: The S&P 500
® index gained 11.96% for the 12 months ending July 31, 2020, in what was a bumpy ride for U.S. equity investors, marked by a steep but brief decline due to the early-2020 outbreak and spread of the coronavirus, followed by a historic rebound. Declared a pandemic on March 11, the COVID-19 crisis and containment efforts caused broad contraction in economic activity, along with extreme uncertainty, volatility and dislocation in financial markets. By mid-March, U.S. stocks entered bear-market territory less than a month after hitting an all-time high and extending the longest-running bull market in American history. Stocks slid in late February, after a surge in COVID-19 cases outside China. The sudden downtrend continued in March (-12%), capping the index’s worst quarter since 2008. A historically rapid and expansive U.S. monetary/fiscal-policy response provided a partial offset to the economic disruption and fueled a sharp uptrend. Aggressive support for financial markets by the U.S. Federal Reserve, plans for reopening the economy and improving infection data boosted stocks in April (+13%) and May (+5%). In June and July, the index gained amid progress on potential treatments and signs of an early recovery in economic activity. For the full 12 months, growth stocks widely topped value, while large-caps handily bested smaller-caps. The information technology sector (+39%) led the way, followed by consumer discretionary (+22%). In contrast, energy (-38%) fell hard along with the price of crude oil.
Comments from Portfolio Manager Sonu Kalra: For the fiscal year ending July 31, 2020, the fund gained 42.45%, outperforming the 29.84% result of the benchmark Russell 1000
® Growth Index. Stock selection and an overweighting in consumer discretionary contributed the most to the fund’s relative performance. Strong picks in information technology also helped, as did picks in the media & entertainment industry. The fund's biggest individual relative contributor was an overweighting in Tesla, which gained approximately 494% the past year. Also bolstering performance was an outsized stake in Nvidia, which gained 153%. Tesla and Nvidia were among the fund’s largest holdings for the 12 months, on average. Also of note, the fund's non-benchmark stake in Sea gained 248% for the period. Conversely, security selection in the transportation industry detracted notably. Weak picks in the consumer staples sector, especially within the food, beverage & tobacco industry, also hurt the relative result, as did an underweighting in information technology. The fund's biggest individual relative detractor was an out-of-index stake in Lyft, which returned roughly -50%. We sold this position by period end. Holding an out-of-benchmark stake in General Electric (-35%) hurt as well. This was a position that was not held at the end of the period. Another notable relative detractor was an underweighting in Microsoft (+52%). The company was among the largest holdings in the fund, on average. Notable changes in positioning included increased exposure to the consumer discretionary sector and a lower allocation to industrials.
The views expressed above reflect those of the portfolio manager(s) only through the end of the period as stated on the cover of this report and do not necessarily represent the views of Fidelity or any other person in the Fidelity organization. Any such views are subject to change at any time based upon market or other conditions and Fidelity disclaims any responsibility to update such views. These views may not be relied on as investment advice and, because investment decisions for a Fidelity fund are based on numerous factors, may not be relied on as an indication of trading intent on behalf of any Fidelity fund.
Investment Summary (Unaudited)
Top Ten Stocks as of July 31, 2020
| | % of fund's net assets |
| Amazon.com, Inc. | 9.4 |
| Apple, Inc. | 9.4 |
| Microsoft Corp. | 6.7 |
| Alphabet, Inc. Class A | 4.6 |
| Facebook, Inc. Class A | 4.3 |
| NVIDIA Corp. | 3.9 |
| Tesla, Inc. | 3.1 |
| Marvell Technology Group Ltd. | 2.6 |
| Salesforce.com, Inc. | 2.2 |
| Visa, Inc. Class A | 2.1 |
| | 48.3 |
Top Five Market Sectors as of July 31, 2020
| | % of fund's net assets |
| Information Technology | 39.3 |
| Consumer Discretionary | 26.9 |
| Communication Services | 14.7 |
| Health Care | 9.5 |
| Industrials | 3.9 |
Asset Allocation (% of fund's net assets)
| As of July 31, 2020 * |
| | Stocks | 98.1% |
| | Convertible Securities | 0.4% |
| | Short-Term Investments and Net Other Assets (Liabilities) | 1.5% |

* Foreign investments - 12.0%
Schedule of Investments July 31, 2020
Showing Percentage of Net Assets
| Common Stocks - 98.1% | | | |
| | | Shares | Value |
| COMMUNICATION SERVICES - 14.7% | | | |
| Entertainment - 3.9% | | | |
| Activision Blizzard, Inc. | | 4,851 | $400,838 |
| CD Projekt RED SA ADR (a) | | 1,104 | 30,586 |
| Electronic Arts, Inc. (a) | | 295 | 41,778 |
| Netflix, Inc. (a) | | 1,772 | 866,295 |
| Nintendo Co. Ltd. | | 102 | 44,861 |
| Nintendo Co. Ltd. ADR | | 331 | 18,208 |
| Roku, Inc. Class A (a) | | 774 | 119,885 |
| Sea Ltd. ADR (a) | | 6,058 | 740,288 |
| Spotify Technology SA (a) | | 253 | 65,228 |
| Take-Two Interactive Software, Inc. (a) | | 70 | 11,481 |
| | | | 2,339,448 |
| Interactive Media & Services - 10.5% | | | |
| Alphabet, Inc. Class A (a) | | 1,867 | 2,778,003 |
| CarGurus, Inc. Class A (a) | | 2,648 | 76,501 |
| Facebook, Inc. Class A (a) | | 10,098 | 2,561,560 |
| Match Group, Inc. (a) | | 1,372 | 140,904 |
| Pinterest, Inc. Class A (a) | | 234 | 8,024 |
| Snap, Inc. Class A (a) | | 3,976 | 89,142 |
| Tencent Holdings Ltd. | | 6,013 | 412,481 |
| Twitter, Inc. (a) | | 940 | 34,216 |
| Yandex NV Series A (a) | | 635 | 36,538 |
| Zoominfo Technologies, Inc. | | 2,579 | 105,404 |
| | | | 6,242,773 |
| Media - 0.0% | | | |
| The New York Times Co. Class A | | 388 | 17,902 |
| Wireless Telecommunication Services - 0.3% | | | |
| T-Mobile U.S., Inc. | | 1,589 | 170,627 |
|
| TOTAL COMMUNICATION SERVICES | | | 8,770,750 |
|
| CONSUMER DISCRETIONARY - 26.8% | | | |
| Auto Components - 0.1% | | | |
| BorgWarner, Inc. | | 860 | 31,476 |
| Automobiles - 3.2% | | | |
| Harley-Davidson, Inc. | | 1,286 | 33,475 |
| Li Auto, Inc. ADR (a) | | 900 | 14,400 |
| Tesla, Inc. (a) | | 1,298 | 1,857,126 |
| | | | 1,905,001 |
| Distributors - 0.0% | | | |
| Pool Corp. | | 60 | 19,002 |
| Diversified Consumer Services - 0.0% | | | |
| Bright Horizons Family Solutions, Inc. (a) | | 47 | 5,040 |
| Youdao, Inc. ADR (a) | | 193 | 8,166 |
| | | | 13,206 |
| Hotels, Restaurants & Leisure - 2.4% | | | |
| Boyd Gaming Corp. | | 3,131 | 74,111 |
| Caesars Entertainment, Inc. (a) | | 3,293 | 102,248 |
| Chipotle Mexican Grill, Inc. (a) | | 257 | 296,876 |
| Churchill Downs, Inc. | | 708 | 98,072 |
| Darden Restaurants, Inc. | | 798 | 60,568 |
| Domino's Pizza, Inc. | | 44 | 17,011 |
| DraftKings, Inc. Class A (a) | | 535 | 17,856 |
| Evolution Gaming Group AB (b) | | 467 | 31,827 |
| Hilton Worldwide Holdings, Inc. | | 790 | 59,290 |
| Kambi Group PLC (a) | | 712 | 17,110 |
| Las Vegas Sands Corp. | | 944 | 41,196 |
| Marriott International, Inc. Class A | | 914 | 76,616 |
| Penn National Gaming, Inc. (a) | | 5,992 | 202,829 |
| Starbucks Corp. | | 1,817 | 139,055 |
| Texas Roadhouse, Inc. Class A | | 1,286 | 72,260 |
| Vail Resorts, Inc. | | 348 | 66,826 |
| Wingstop, Inc. | | 227 | 35,469 |
| Wynn Resorts Ltd. | | 372 | 26,944 |
| | | | 1,436,164 |
| Household Durables - 0.9% | | | |
| D.R. Horton, Inc. | | 463 | 30,632 |
| iRobot Corp. (a) | | 780 | 56,698 |
| KB Home | | 827 | 27,820 |
| Leggett & Platt, Inc. | | 276 | 11,065 |
| Lennar Corp. Class A | | 708 | 51,224 |
| NVR, Inc. (a) | | 8 | 31,441 |
| PulteGroup, Inc. | | 312 | 13,603 |
| Sony Corp. sponsored ADR | | 645 | 50,284 |
| Taylor Morrison Home Corp. (a) | | 2,638 | 61,861 |
| Tempur Sealy International, Inc. (a) | | 720 | 58,284 |
| Toll Brothers, Inc. | | 1,335 | 50,997 |
| TRI Pointe Homes, Inc. (a) | | 3,725 | 62,282 |
| Whirlpool Corp. | | 76 | 12,397 |
| | | | 518,588 |
| Internet & Direct Marketing Retail - 12.7% | | | |
| Alibaba Group Holding Ltd. sponsored ADR (a) | | 1,934 | 485,473 |
| Amazon.com, Inc. (a) | | 1,771 | 5,604,648 |
| Chewy, Inc. (a) | | 114 | 5,984 |
| Delivery Hero AG (a)(b) | | 291 | 33,511 |
| eBay, Inc. | | 759 | 41,958 |
| Expedia, Inc. | | 979 | 79,309 |
| Farfetch Ltd. Class A (a) | | 2,117 | 54,259 |
| Fiverr International Ltd. (a) | | 415 | 38,773 |
| JD.com, Inc.: | | | |
| Class A | | 516 | 16,032 |
| sponsored ADR (a) | | 1,060 | 67,617 |
| Kogan.Com Ltd. | | 1,428 | 16,997 |
| MercadoLibre, Inc. (a) | | 189 | 212,553 |
| Ocado Group PLC (a) | | 886 | 23,810 |
| Pinduoduo, Inc. ADR (a) | | 4,605 | 422,739 |
| The Booking Holdings, Inc. (a) | | 182 | 302,508 |
| The RealReal, Inc. (a) | | 5,712 | 77,912 |
| Wayfair LLC Class A (a) | | 523 | 139,165 |
| | | | 7,623,248 |
| Leisure Products - 0.5% | | | |
| Bafang Electric Suzhou Co. Ltd. (A Shares) | | 265 | 6,062 |
| BRP, Inc. | | 383 | 17,156 |
| Callaway Golf Co. | | 1,267 | 24,136 |
| Peloton Interactive, Inc. Class A (a) | | 2,456 | 167,548 |
| Polaris, Inc. | | 110 | 11,399 |
| Vista Outdoor, Inc. (a) | | 3,073 | 52,702 |
| | | | 279,003 |
| Multiline Retail - 0.4% | | | |
| Dollar General Corp. | | 292 | 55,597 |
| Dollar Tree, Inc. (a) | | 1,489 | 138,998 |
| Ollie's Bargain Outlet Holdings, Inc. (a) | | 384 | 40,358 |
| Target Corp. | | 275 | 34,617 |
| | | | 269,570 |
| Specialty Retail - 4.3% | | | |
| Advance Auto Parts, Inc. | | 37 | 5,555 |
| Bed Bath & Beyond, Inc. | | 1,590 | 17,204 |
| Burlington Stores, Inc. (a) | | 662 | 124,456 |
| Carvana Co. Class A (a) | | 2,664 | 412,787 |
| Dick's Sporting Goods, Inc. | | 822 | 37,500 |
| Five Below, Inc. (a) | | 1,012 | 110,217 |
| Floor & Decor Holdings, Inc. Class A (a) | | 2,839 | 187,090 |
| Gap, Inc. | | 2,405 | 32,155 |
| Lowe's Companies, Inc. | | 5,560 | 827,940 |
| Michaels Companies, Inc. (a) | | 3,705 | 26,602 |
| RH (a) | | 864 | 248,340 |
| The Home Depot, Inc. | | 1,835 | 487,174 |
| Vroom, Inc. | | 419 | 24,801 |
| Williams-Sonoma, Inc. | | 380 | 33,106 |
| | | | 2,574,927 |
| Textiles, Apparel & Luxury Goods - 2.3% | | | |
| adidas AG | | 457 | 125,914 |
| Allbirds, Inc. (a)(c)(d) | | 215 | 2,215 |
| Anta Sports Products Ltd. | | 465 | 4,410 |
| Aritzia LP (a) | | 1,262 | 16,705 |
| Crocs, Inc. (a) | | 4,177 | 150,121 |
| Deckers Outdoor Corp. (a) | | 471 | 98,557 |
| lululemon athletica, Inc. (a) | | 1,157 | 376,708 |
| LVMH Moet Hennessy Louis Vuitton SE | | 167 | 72,619 |
| Moncler SpA | | 1,488 | 57,141 |
| NIKE, Inc. Class B | | 3,860 | 376,775 |
| PVH Corp. | | 1,109 | 53,964 |
| VF Corp. | | 482 | 29,094 |
| | | | 1,364,223 |
|
| TOTAL CONSUMER DISCRETIONARY | | | 16,034,408 |
|
| CONSUMER STAPLES - 2.1% | | | |
| Beverages - 0.5% | | | |
| Boston Beer Co., Inc. Class A (a) | | 138 | 111,841 |
| Keurig Dr. Pepper, Inc. | | 2,009 | 61,455 |
| Monster Beverage Corp. (a) | | 1,310 | 102,809 |
| | | | 276,105 |
| Food & Staples Retailing - 0.6% | | | |
| BJ's Wholesale Club Holdings, Inc. (a) | | 2,423 | 97,041 |
| Costco Wholesale Corp. | | 457 | 148,767 |
| Kroger Co. | | 2,206 | 76,747 |
| Performance Food Group Co. (a) | | 1,634 | 45,785 |
| Zur Rose Group AG (a) | | 38 | 10,492 |
| | | | 378,832 |
| Food Products - 0.1% | | | |
| Act II Global Acquisition Corp. Class A (a) | | 2,886 | 20,029 |
| Freshpet, Inc. (a) | | 157 | 15,080 |
| JDE Peet's BV | | 700 | 31,127 |
| | | | 66,236 |
| Household Products - 0.7% | | | |
| Clorox Co. | | 569 | 134,574 |
| Procter & Gamble Co. | | 1,567 | 205,465 |
| Reckitt Benckiser Group PLC | | 399 | 40,008 |
| | | | 380,047 |
| Personal Products - 0.1% | | | |
| Herbalife Nutrition Ltd. (a) | | 1,447 | 74,144 |
| Tobacco - 0.1% | | | |
| JUUL Labs, Inc. Class A (a)(c)(d) | | 217 | 21,824 |
| Swedish Match Co. AB | | 674 | 51,661 |
| | | | 73,485 |
|
| TOTAL CONSUMER STAPLES | | | 1,248,849 |
|
| ENERGY - 0.7% | | | |
| Oil, Gas & Consumable Fuels - 0.7% | | | |
| Occidental Petroleum Corp. warrants 8/3/27 (a) | | 35 | 196 |
| Reliance Industries Ltd. | | 13,054 | 360,170 |
| Reliance Industries Ltd. (a) | | 885 | 13,907 |
| Reliance Industries Ltd. sponsored GDR (b) | | 593 | 32,674 |
| | | | 406,947 |
| FINANCIALS - 0.8% | | | |
| Banks - 0.0% | | | |
| Kotak Mahindra Bank Ltd. | | 733 | 13,362 |
| Capital Markets - 0.4% | | | |
| BlackRock, Inc. Class A | | 123 | 70,726 |
| Goldman Sachs Group, Inc. | | 131 | 25,933 |
| Insurance Acquisition Corp. Class A (a) | | 1,916 | 20,520 |
| London Stock Exchange Group PLC | | 180 | 19,883 |
| Moody's Corp. | | 36 | 10,127 |
| Morgan Stanley | | 557 | 27,226 |
| MSCI, Inc. | | 207 | 77,828 |
| Open Lending Corp. (a) | | 339 | 5,749 |
| | | | 257,992 |
| Consumer Finance - 0.2% | | | |
| Ally Financial, Inc. | | 2,868 | 57,647 |
| Capital One Financial Corp. | | 693 | 44,213 |
| Discover Financial Services | | 228 | 11,270 |
| | | | 113,130 |
| Diversified Financial Services - 0.0% | | | |
| dMY Technology Group, Inc. (a) | | 1,499 | 15,867 |
| Insurance - 0.2% | | | |
| eHealth, Inc. (a) | | 1,217 | 84,143 |
| Thrifts & Mortgage Finance - 0.0% | | | |
| Housing Development Finance Corp. Ltd. | | 365 | 8,681 |
|
| TOTAL FINANCIALS | | | 493,175 |
|
| HEALTH CARE - 9.4% | | | |
| Biotechnology - 2.8% | | | |
| ACADIA Pharmaceuticals, Inc. (a) | | 311 | 12,928 |
| Acceleron Pharma, Inc. (a) | | 663 | 65,750 |
| ADC Therapeutics SA (a) | | 500 | 23,250 |
| Agios Pharmaceuticals, Inc. (a) | | 116 | 5,257 |
| Aimmune Therapeutics, Inc. (a) | | 405 | 5,350 |
| Akouos, Inc. (a) | | 400 | 7,820 |
| Allakos, Inc. (a) | | 276 | 20,719 |
| Alnylam Pharmaceuticals, Inc. (a) | | 1,197 | 174,475 |
| Annexon, Inc. (a) | | 735 | 13,399 |
| Arcutis Biotherapeutics, Inc. (a) | | 400 | 10,680 |
| Argenx SE ADR (a) | | 76 | 17,490 |
| Ascendis Pharma A/S sponsored ADR (a) | | 382 | 52,567 |
| Avidity Biosciences, Inc. | | 300 | 8,457 |
| BeiGene Ltd. (a) | | 331 | 5,445 |
| BeiGene Ltd. ADR (a) | | 79 | 16,511 |
| BioNTech SE: | | | |
| ADR (a) | | 81 | 6,651 |
| rights 8/14/20 (a) | | 23 | 0 |
| BioXcel Therapeutics, Inc. (a) | | 112 | 5,080 |
| Bridgebio Pharma, Inc. (a) | | 201 | 5,656 |
| Coherus BioSciences, Inc. (a) | | 288 | 5,066 |
| Crinetics Pharmaceuticals, Inc. (a) | | 261 | 3,623 |
| FibroGen, Inc. (a) | | 496 | 20,073 |
| Forma Therapeutics Holdings, Inc. | | 300 | 10,488 |
| Fusion Pharmaceuticals, Inc. (a) | | 400 | 5,504 |
| Generation Bio Co. | | 300 | 5,892 |
| Generation Bio Co. | | 452 | 7,989 |
| Global Blood Therapeutics, Inc. (a) | | 1,441 | 97,239 |
| Immunomedics, Inc. (a) | | 308 | 13,007 |
| Insmed, Inc. (a) | | 354 | 9,246 |
| Ionis Pharmaceuticals, Inc. (a) | | 36 | 2,072 |
| Karuna Therapeutics, Inc. (a) | | 173 | 14,151 |
| Mirati Therapeutics, Inc. (a) | | 58 | 7,036 |
| Moderna, Inc. (a) | | 562 | 41,644 |
| Morphic Holding, Inc. (a) | | 168 | 3,782 |
| Myovant Sciences Ltd. (a) | | 1,167 | 17,738 |
| Neurocrine Biosciences, Inc. (a) | | 748 | 90,029 |
| Principia Biopharma, Inc. (a) | | 279 | 23,324 |
| Protagonist Therapeutics, Inc. (a) | | 326 | 5,128 |
| Regeneron Pharmaceuticals, Inc. (a) | | 830 | 524,618 |
| Relay Therapeutics, Inc. (a) | | 300 | 10,638 |
| Revolution Medicines, Inc. | | 653 | 15,750 |
| Sage Therapeutics, Inc. (a) | | 506 | 23,058 |
| Sarepta Therapeutics, Inc. (a) | | 805 | 123,584 |
| Seattle Genetics, Inc. (a) | | 124 | 20,617 |
| Turning Point Therapeutics, Inc. (a) | | 663 | 39,269 |
| Vaxcyte, Inc. | | 600 | 18,846 |
| Xencor, Inc. (a) | | 200 | 6,018 |
| Zai Lab Ltd. ADR (a) | | 793 | 60,355 |
| | | | 1,683,269 |
| Health Care Equipment & Supplies - 3.3% | | | |
| Atricure, Inc. (a) | | 104 | 4,244 |
| Axonics Modulation Technologies, Inc. (a) | | 1,281 | 54,263 |
| Becton, Dickinson & Co. | | 1,044 | 293,719 |
| Danaher Corp. | | 197 | 40,149 |
| DexCom, Inc. (a) | | 634 | 276,132 |
| Hologic, Inc. (a) | | 998 | 69,640 |
| InMode Ltd. (a) | | 716 | 23,170 |
| Insulet Corp. (a) | | 526 | 106,967 |
| Intuitive Surgical, Inc. (a) | | 755 | 517,507 |
| Masimo Corp. (a) | | 330 | 72,640 |
| Novocure Ltd. (a) | | 183 | 13,870 |
| Quidel Corp. (a) | | 868 | 245,184 |
| Shockwave Medical, Inc. (a) | | 1,092 | 53,857 |
| Tandem Diabetes Care, Inc. (a) | | 1,137 | 118,771 |
| West Pharmaceutical Services, Inc. | | 232 | 62,378 |
| | | | 1,952,491 |
| Health Care Providers & Services - 1.0% | | | |
| 1Life Healthcare, Inc. (a) | | 996 | 29,492 |
| Alignment Healthcare Partners unit (c)(d) | | 380 | 6,064 |
| Guardant Health, Inc. (a) | | 551 | 46,934 |
| Humana, Inc. | | 400 | 156,980 |
| UnitedHealth Group, Inc. | | 1,245 | 376,961 |
| | | | 616,431 |
| Life Sciences Tools & Services - 0.8% | | | |
| 10X Genomics, Inc. (a) | | 463 | 45,545 |
| Berkeley Lights, Inc. (a) | | 300 | 17,991 |
| Eurofins Scientific SA | | 15 | 9,750 |
| Nanostring Technologies, Inc. (a) | | 490 | 17,694 |
| Thermo Fisher Scientific, Inc. | | 965 | 399,462 |
| | | | 490,442 |
| Pharmaceuticals - 1.5% | | | |
| AstraZeneca PLC sponsored ADR | | 4,139 | 230,873 |
| Eli Lilly & Co. | | 1,632 | 245,273 |
| Hansoh Pharmaceutical Group Co. Ltd. (a)(b) | | 2,259 | 9,764 |
| Horizon Pharma PLC (a) | | 636 | 38,917 |
| Intra-Cellular Therapies, Inc. (a) | | 520 | 10,309 |
| MyoKardia, Inc. (a) | | 95 | 8,562 |
| Nektar Therapeutics (a) | | 664 | 14,714 |
| OptiNose, Inc. (a) | | 996 | 5,075 |
| Roche Holding AG (participation certificate) | | 139 | 48,144 |
| Royalty Pharma PLC | | 397 | 17,091 |
| Zoetis, Inc. Class A | | 1,667 | 252,851 |
| | | | 881,573 |
|
| TOTAL HEALTH CARE | | | 5,624,206 |
|
| INDUSTRIALS - 3.9% | | | |
| Aerospace & Defense - 0.1% | | | |
| Avon Rubber PLC | | 258 | 11,212 |
| Axon Enterprise, Inc. (a) | | 370 | 30,758 |
| | | | 41,970 |
| Air Freight & Logistics - 0.1% | | | |
| XPO Logistics, Inc. (a) | | 482 | 36,160 |
| Airlines - 0.0% | | | |
| Spirit Airlines, Inc. (a) | | 1,456 | 23,019 |
| Building Products - 0.0% | | | |
| Fortune Brands Home & Security, Inc. | | 266 | 20,349 |
| The AZEK Co., Inc. | | 300 | 10,350 |
| | | | 30,699 |
| Commercial Services & Supplies - 0.2% | | | |
| Copart, Inc. (a) | | 591 | 55,111 |
| HNI Corp. | | 282 | 8,375 |
| HomeServe PLC | | 1,213 | 21,086 |
| Knoll, Inc. | | 786 | 9,204 |
| Steelcase, Inc. Class A | | 986 | 10,580 |
| | | | 104,356 |
| Construction & Engineering - 0.1% | | | |
| Dycom Industries, Inc. (a) | | 1,949 | 83,476 |
| Electrical Equipment - 0.1% | | | |
| Sensata Technologies, Inc. PLC (a) | | 850 | 32,283 |
| Machinery - 0.1% | | | |
| Nikola Corp. (a) | | 1,724 | 51,720 |
| Professional Services - 0.3% | | | |
| Equifax, Inc. | | 741 | 120,457 |
| Manpower, Inc. | | 573 | 39,417 |
| | | | 159,874 |
| Road & Rail - 2.9% | | | |
| Knight-Swift Transportation Holdings, Inc. Class A | | 1,891 | 82,240 |
| Lyft, Inc. (a) | | 29,972 | 876,082 |
| Uber Technologies, Inc. (a) | | 26,464 | 800,801 |
| | | | 1,759,123 |
|
| TOTAL INDUSTRIALS | | | 2,322,680 |
|
| INFORMATION TECHNOLOGY - 39.2% | | | |
| Electronic Equipment & Components - 0.7% | | | |
| Flextronics International Ltd. (a) | | 2,341 | 26,898 |
| FLIR Systems, Inc. | | 1,351 | 56,283 |
| II-VI, Inc. (a) | | 4,743 | 240,565 |
| Jabil, Inc. | | 2,853 | 99,456 |
| | | | 423,202 |
| IT Services - 6.5% | | | |
| Alliance Data Systems Corp. | | 386 | 17,123 |
| Endava PLC ADR (a) | | 414 | 21,383 |
| MasterCard, Inc. Class A | | 2,816 | 868,820 |
| MongoDB, Inc. Class A (a) | | 373 | 85,447 |
| PayPal Holdings, Inc. (a) | | 3,734 | 732,125 |
| Repay Holdings Corp. (a) | | 979 | 21,665 |
| Riskified Ltd. warrants (a)(c)(d) | | 5 | 0 |
| Shopify, Inc. Class A (a) | | 288 | 294,521 |
| Square, Inc. (a) | | 995 | 129,201 |
| Twilio, Inc. Class A (a) | | 1,347 | 373,685 |
| Visa, Inc. Class A | | 6,543 | 1,245,787 |
| Wix.com Ltd. (a) | | 406 | 117,935 |
| | | | 3,907,692 |
| Semiconductors & Semiconductor Equipment - 10.0% | | | |
| Advanced Micro Devices, Inc. (a) | | 5,585 | 432,447 |
| Cirrus Logic, Inc. (a) | | 455 | 31,181 |
| Enphase Energy, Inc. (a) | | 914 | 55,169 |
| Inphi Corp. (a) | | 94 | 12,282 |
| Lam Research Corp. | | 100 | 37,716 |
| Lattice Semiconductor Corp. (a) | | 1,033 | 32,116 |
| Marvell Technology Group Ltd. | | 41,953 | 1,530,026 |
| MediaTek, Inc. | | 1,136 | 27,121 |
| Micron Technology, Inc. (a) | | 5,832 | 291,921 |
| Monolithic Power Systems, Inc. | | 24 | 6,360 |
| NVIDIA Corp. | | 5,436 | 2,308,071 |
| NXP Semiconductors NV | | 7,892 | 927,547 |
| ON Semiconductor Corp. (a) | | 840 | 17,304 |
| SolarEdge Technologies, Inc. (a) | | 206 | 36,071 |
| STMicroelectronics NV (NY Shares) unit | | 1,294 | 36,154 |
| Synaptics, Inc. (a) | | 267 | 21,365 |
| Taiwan Semiconductor Manufacturing Co. Ltd. sponsored ADR | | 428 | 33,765 |
| Universal Display Corp. | | 315 | 54,952 |
| Xilinx, Inc. | | 512 | 54,963 |
| | | | 5,946,531 |
| Software - 12.6% | | | |
| Adobe, Inc. (a) | | 1,855 | 824,214 |
| Avalara, Inc. (a) | | 259 | 34,823 |
| Bill.Com Holdings, Inc. (a) | | 555 | 51,676 |
| Cloudflare, Inc. (a) | | 300 | 12,486 |
| Coupa Software, Inc. (a) | | 274 | 83,967 |
| Crowdstrike Holdings, Inc. (a) | | 1,052 | 119,086 |
| DocuSign, Inc. (a) | | 400 | 86,732 |
| Dynatrace, Inc. | | 550 | 23,007 |
| Elastic NV (a) | | 887 | 85,321 |
| Epic Games, Inc. (c)(d) | | 9 | 5,175 |
| Five9, Inc. (a) | | 253 | 30,567 |
| HubSpot, Inc. (a) | | 346 | 81,175 |
| Lightspeed POS, Inc. (a) | | 2,644 | 74,694 |
| Microsoft Corp. | | 19,509 | 3,999,540 |
| Paycom Software, Inc. (a) | | 182 | 51,755 |
| Ping Identity Holding Corp. (a) | | 503 | 17,283 |
| RingCentral, Inc. (a) | | 421 | 122,204 |
| Salesforce.com, Inc. (a) | | 6,786 | 1,322,252 |
| ServiceNow, Inc.(a) | | 464 | 203,789 |
| Slack Technologies, Inc. Class A (a) | | 1,268 | 37,469 |
| Smartsheet, Inc. (a) | | 204 | 9,739 |
| Snowflake Computing, Inc. Class B (c)(d) | | 47 | 1,822 |
| Tanium, Inc. Class B(a)(c)(d) | | 131 | 1,493 |
| The Trade Desk, Inc. (a) | | 385 | 173,758 |
| Workday, Inc. Class A (a) | | 211 | 38,174 |
| Zoom Video Communications, Inc. Class A (a) | | 258 | 65,509 |
| | | | 7,557,710 |
| Technology Hardware, Storage & Peripherals - 9.4% | | | |
| Apple, Inc. | | 13,181 | 5,602,452 |
|
| TOTAL INFORMATION TECHNOLOGY | | | 23,437,587 |
|
| MATERIALS - 0.2% | | | |
| Chemicals - 0.2% | | | |
| The Chemours Co. LLC | | 5,392 | 99,914 |
| Metals & Mining - 0.0% | | | |
| ArcelorMittal SA Class A unit (a) | | 1,702 | 18,671 |
| Barrick Gold Corp. | | 209 | 6,042 |
| MMC Norilsk Nickel PJSC sponsored ADR | | 225 | 5,911 |
| | | | 30,624 |
|
| TOTAL MATERIALS | | | 130,538 |
|
| REAL ESTATE - 0.3% | | | |
| Equity Real Estate Investment Trusts (REITs) - 0.1% | | | |
| Ant International Co. Ltd. Class C(a)(c)(d) | | 2,450 | 25,627 |
| Douglas Emmett, Inc. | | 442 | 12,880 |
| Equinix, Inc. | | 46 | 36,132 |
| | | | 74,639 |
| Real Estate Management & Development - 0.2% | | | |
| Redfin Corp. (a) | | 2,828 | 117,588 |
|
| TOTAL REAL ESTATE | | | 192,227 |
|
| TOTAL COMMON STOCKS | | | |
| (Cost $38,632,199) | | | 58,661,367 |
|
| Preferred Stocks - 0.4% | | | |
| Convertible Preferred Stocks - 0.4% | | | |
| CONSUMER DISCRETIONARY - 0.1% | | | |
| Automobiles - 0.1% | | | |
| Rivian Automotive, Inc. Series E (c)(d) | | 3,444 | 53,348 |
| Hotels, Restaurants & Leisure - 0.0% | | | |
| Topgolf International, Inc. Series F (a)(c)(d) | | 217 | 2,752 |
| Internet & Direct Marketing Retail - 0.0% | | | |
| The Honest Co., Inc. Series E(a)(c)(d) | | 282 | 5,527 |
| Textiles, Apparel & Luxury Goods - 0.0% | | | |
| Allbirds, Inc.: | | | |
| Series A (a)(c)(d) | | 85 | 876 |
| Series B (a)(c)(d) | | 15 | 155 |
| Series C (a)(c)(d) | | 140 | 1,442 |
| Series Seed (a)(c)(d) | | 45 | 464 |
| | | | 2,937 |
| TOTAL CONSUMER DISCRETIONARY | | | 64,564 |
| CONSUMER STAPLES - 0.1% | | | |
| Food & Staples Retailing - 0.1% | | | |
| Blink Health LLC Series C (c)(d) | | 78 | 2,978 |
| Roofoods Ltd. Series F(a)(c)(d) | | 17 | 5,908 |
| Sweetgreen, Inc.: | | | |
| Series C (c)(d) | | 13 | 193 |
| Series D (c)(d) | | 205 | 3,050 |
| Series H (a)(c)(d) | | 1,969 | 29,299 |
| Series I (c)(d) | | 482 | 7,172 |
| | | | 48,600 |
| Food Products - 0.0% | | | |
| Agbiome LLC Series C (a)(c)(d) | | 557 | 3,528 |
| Tobacco - 0.0% | | | |
| JUUL Labs, Inc. Series E (a)(c)(d) | | 127 | 12,772 |
| TOTAL CONSUMER STAPLES | | | 64,900 |
| FINANCIALS - 0.0% | | | |
| Diversified Financial Services - 0.0% | | | |
| Sonder Holdings, Inc. Series D (c)(d) | | 528 | 5,685 |
| HEALTH CARE - 0.1% | | | |
| Biotechnology - 0.1% | | | |
| 23andMe, Inc. Series F (a)(c)(d) | | 339 | 3,543 |
| Nuvation Bio, Inc. Series A (a)(c)(d)(e) | | 7,400 | 6,956 |
| | | | 10,499 |
| INFORMATION TECHNOLOGY - 0.1% | | | |
| Internet Software & Services - 0.0% | | | |
| ContextLogic, Inc. Series G (a)(c)(d) | | 67 | 11,715 |
| Starry, Inc.: | | | |
| Series C(a)(c)(d) | | 3,181 | 4,549 |
| Series D(a)(c)(d) | | 7,310 | 10,453 |
| | | | 26,717 |
| IT Services - 0.0% | | | |
| Riskified Ltd. Series E (c)(d) | | 625 | 5,947 |
| Software - 0.1% | | | |
| ACV Auctions, Inc. Series E (c)(d) | | 754 | 4,464 |
| Bird Rides, Inc.: | | | |
| Series C (a)(c)(d) | | 1,434 | 14,942 |
| Series D (c)(d) | | 200 | 2,084 |
| Compass, Inc. Series E (a)(c)(d) | | 28 | 3,538 |
| UiPath, Inc.: | | | |
| Series A1 (a)(c)(d) | | 273 | 5,076 |
| Series B1 (a)(c)(d) | | 15 | 279 |
| Series B2 (a)(c)(d) | | 69 | 1,283 |
| | | | 31,666 |
| TOTAL INFORMATION TECHNOLOGY | | | 64,330 |
|
| TOTAL CONVERTIBLE PREFERRED STOCKS | | | 209,978 |
|
| Nonconvertible Preferred Stocks - 0.0% | | | |
| CONSUMER DISCRETIONARY - 0.0% | | | |
| Automobiles - 0.0% | | | |
| Neutron Holdings, Inc.: | | | |
| Series 1C (c)(d) | | 26,100 | 522 |
| Series 1D (c)(d) | | 58,561 | 1,171 |
| Waymo LLC Series A2 (c)(d) | | 127 | 10,905 |
| | | | 12,598 |
| TOTAL PREFERRED STOCKS | | | |
| (Cost $222,783) | | | 222,576 |
| | | Principal Amount | Value |
|
| Convertible Bonds - 0.0% | | | |
| CONSUMER DISCRETIONARY - 0.0% | | | |
| Automobiles - 0.0% | | | |
| Neutron Holdings, Inc.: | | | |
| 4% 5/22/27 (c)(d) | | 5,000 | 5,000 |
| 4% 6/12/27 (c)(d) | | 3,170 | 3,170 |
| TOTAL CONVERTIBLE BONDS | | | |
| (Cost $8,170) | | | 8,170 |
| | | Shares | Value |
|
| Money Market Funds - 1.3% | | | |
| Fidelity Cash Central Fund 0.14% (f) | | 773,133 | 773,365 |
| Fidelity Securities Lending Cash Central Fund 0.13% (f)(g) | | 13,208 | 13,210 |
| TOTAL MONEY MARKET FUNDS | | | |
| (Cost $786,521) | | | 786,575 |
| TOTAL INVESTMENT IN SECURITIES - 99.8% | | | |
| (Cost $39,649,673) | | | 59,678,688 |
| NET OTHER ASSETS (LIABILITIES) - 0.2% | | | 147,301 |
| NET ASSETS - 100% | | | $59,825,989 |
Legend
(a) Non-income producing
(b) Security exempt from registration under Rule 144A of the Securities Act of 1933. These securities may be resold in transactions exempt from registration, normally to qualified institutional buyers. At the end of the period, the value of these securities amounted to $107,776 or 0.2% of net assets.
(c) Restricted securities (including private placements) - Investment in securities not registered under the Securities Act of 1933 (excluding 144A issues). At the end of the period, the value of restricted securities (excluding 144A issues) amounted to $294,964 or 0.5% of net assets.
(d) Level 3 security
(e) Security or a portion of the security purchased on a delayed delivery or when-issued basis.
(f) Affiliated fund that is generally available only to investment companies and other accounts managed by Fidelity Investments. The rate quoted is the annualized seven-day yield of the fund at period end. A complete unaudited listing of the fund's holdings as of its most recent quarter end is available upon request. In addition, each Fidelity Central Fund's financial statements, which are not covered by the Fund's Report of Independent Registered Public Accounting Firm, are available on the SEC's website or upon request.
(g) Investment made with cash collateral received from securities on loan.
Additional information on each restricted holding is as follows:
| Security | Acquisition Date | Acquisition Cost |
| 23andMe, Inc. Series F | 8/31/17 | $4,707 |
| ACV Auctions, Inc. Series E | 11/6/19 | $4,170 |
| Agbiome LLC Series C | 6/29/18 | $3,528 |
| Alignment Healthcare Partners unit | 2/28/20 | $4,605 |
| Allbirds, Inc. | 10/9/18 | $2,358 |
| Allbirds, Inc. Series A | 10/9/18 | $932 |
| Allbirds, Inc. Series B | 10/9/18 | $165 |
| Allbirds, Inc. Series C | 10/9/18 | $1,535 |
| Allbirds, Inc. Series Seed | 10/9/18 | $494 |
| Ant International Co. Ltd. Class C | 5/16/18 | $13,745 |
| Bird Rides, Inc. Series C | 12/21/18 | $16,843 |
| Bird Rides, Inc. Series D | 9/30/19 | $2,584 |
| Blink Health LLC Series C | 11/7/19 | $2,978 |
| Compass, Inc. Series E | 11/3/17 | $1,889 |
| ContextLogic, Inc. Series G | 10/24/17 | $9,014 |
| Epic Games, Inc. | 7/30/20 | $5,175 |
| JUUL Labs, Inc. Class A | 12/20/17 - 7/6/18 | $5,804 |
| JUUL Labs, Inc. Series E | 12/20/17 - 7/6/18 | $3,263 |
| Neutron Holdings, Inc. Series 1C | 7/3/18 | $4,772 |
| Neutron Holdings, Inc. Series 1D | 1/25/19 | $14,201 |
| Neutron Holdings, Inc. 4% 5/22/27 | 6/4/20 | $5,000 |
| Neutron Holdings, Inc. 4% 6/12/27 | 6/12/20 | $3,170 |
| Nuvation Bio, Inc. Series A | 6/17/19 | $5,708 |
| Riskified Ltd. Series E | 10/28/19 | $5,947 |
| Riskified Ltd. warrants | 10/28/19 | $0 |
| Rivian Automotive, Inc. Series E | 7/10/20 | $53,348 |
| Roofoods Ltd. Series F | 9/12/17 | $6,011 |
| Snowflake Computing, Inc. Class B | 3/19/20 | $1,823 |
| Sonder Holdings, Inc. Series D | 12/20/19 | $5,542 |
| Starry, Inc. Series C | 12/8/17 | $2,933 |
| Starry, Inc. Series D | 3/6/19 - 7/30/20 | $10,453 |
| Sweetgreen, Inc. Series C | 9/13/19 | $222 |
| Sweetgreen, Inc. Series D | 9/13/19 | $3,506 |
| Sweetgreen, Inc. Series H | 11/9/18 | $25,676 |
| Sweetgreen, Inc. Series I | 9/13/19 | $8,242 |
| Tanium, Inc. Class B | 4/21/17 | $650 |
| The Honest Co., Inc. Series E | 9/28/17 | $5,529 |
| Topgolf International, Inc. Series F | 11/10/17 | $3,002 |
| UiPath, Inc. Series A1 | 6/14/19 | $3,581 |
| UiPath, Inc. Series B1 | 6/14/19 | $197 |
| UiPath, Inc. Series B2 | 6/14/19 | $905 |
| Waymo LLC Series A2 | 5/8/20 | $10,905 |
Affiliated Central Funds
Information regarding fiscal year to date income earned by the Fund from investments in Fidelity Central Funds is as follows:
| Fund | Income earned |
| Fidelity Cash Central Fund | $6,939 |
| Fidelity Securities Lending Cash Central Fund | 454 |
| Total | $7,393 |
Amounts in the income column in the above table include any capital gain distributions from underlying funds, which are presented in the corresponding line-item in the Statement of Operations, if applicable. Amount for Fidelity Securities Lending Cash Central Fund represents the income earned on investing cash collateral, less rebates paid to borrowers and any lending agent fees associated with the loan, plus any premium payments received for lending certain types of securities.
Investment Valuation
The following is a summary of the inputs used, as of July 31, 2020, involving the Fund's assets and liabilities carried at fair value. The inputs or methodology used for valuing securities may not be an indication of the risk associated with investing in those securities. For more information on valuation inputs, and their aggregation into the levels used below, please refer to the Investment Valuation section in the accompanying Notes to Financial Statements.
| | Valuation Inputs at Reporting Date: |
| Description | Total | Level 1 | Level 2 | Level 3 |
| Investments in Securities: | | | | |
| Equities: | | | | |
| Communication Services | $8,770,750 | $8,313,408 | $457,342 | $-- |
| Consumer Discretionary | 16,111,570 | 15,959,574 | 72,619 | 79,377 |
| Consumer Staples | 1,313,749 | 1,187,017 | 40,008 | 86,724 |
| Energy | 406,947 | 406,947 | -- | -- |
| Financials | 498,860 | 473,292 | 19,883 | 5,685 |
| Health Care | 5,634,705 | 5,562,009 | 56,133 | 16,563 |
| Industrials | 2,322,680 | 2,322,680 | -- | -- |
| Information Technology | 23,501,917 | 23,429,097 | -- | 72,820 |
| Materials | 130,538 | 130,538 | -- | -- |
| Real Estate | 192,227 | 166,600 | -- | 25,627 |
| Corporate Bonds | 8,170 | -- | -- | 8,170 |
| Money Market Funds | 786,575 | 786,575 | -- | -- |
| Total Investments in Securities: | $59,678,688 | $58,737,737 | $645,985 | $294,966 |
Other Information
Distribution of investments by country or territory of incorporation, as a percentage of Total Net Assets, is as follows (Unaudited):
| United States of America | 88.0% |
| Cayman Islands | 3.7% |
| Bermuda | 2.6% |
| Netherlands | 1.9% |
| Others (Individually Less Than 1%) | 3.8% |
| | 100.0% |
See accompanying notes which are an integral part of the financial statements.
Financial Statements
Statement of Assets and Liabilities
| | | July 31, 2020 |
| Assets | | |
Investment in securities, at value (including securities loaned of $12,691) — See accompanying schedule:
Unaffiliated issuers (cost $38,863,152) | $58,892,113 | |
| Fidelity Central Funds (cost $786,521) | 786,575 | |
| Total Investment in Securities (cost $39,649,673) | | $59,678,688 |
| Cash | | 65,422 |
| Foreign currency held at value (cost $201) | | 201 |
| Receivable for investments sold | | 813,732 |
| Receivable for fund shares sold | | 42,459 |
| Dividends receivable | | 9,784 |
| Interest receivable | | 49 |
| Distributions receivable from Fidelity Central Funds | | 455 |
| Total assets | | 60,610,790 |
| Liabilities | | |
| Payable for investments purchased | | |
| Regular delivery | $722,709 | |
| Delayed delivery | 2,854 | |
| Payable for fund shares redeemed | 23,247 | |
| Other payables and accrued expenses | 22,781 | |
| Collateral on securities loaned | 13,210 | |
| Total liabilities | | 784,801 |
| Net Assets | | $59,825,989 |
| Net Assets consist of: | | |
| Paid in capital | | $39,738,345 |
| Total accumulated earnings (loss) | | 20,087,644 |
| Net Assets | | $59,825,989 |
| Net Asset Value, offering price and redemption price per share ($59,825,989 ÷ 2,868,076 shares) | | $20.86 |
See accompanying notes which are an integral part of the financial statements.
Statement of Operations
| | | Year ended July 31, 2020 |
| Investment Income | | |
| Dividends | | $219,000 |
| Interest | | 49 |
| Income from Fidelity Central Funds (including $454 from security lending) | | 7,393 |
| Total income | | 226,442 |
| Expenses | | |
| Independent trustees' fees and expenses | $207 | |
| Proxy | 1,095 | |
| Commitment fees | 81 | |
| Total expenses before reductions | 1,383 | |
| Expense reductions | (105) | |
| Total expenses after reductions | | 1,278 |
| Net investment income (loss) | | 225,164 |
| Realized and Unrealized Gain (Loss) | | |
| Net realized gain (loss) on: | | |
| Investment securities: | | |
| Unaffiliated issuers | 143,494 | |
| Fidelity Central Funds | 135 | |
| Foreign currency transactions | (59) | |
| Total net realized gain (loss) | | 143,570 |
| Change in net unrealized appreciation (depreciation) on: | | |
| Investment securities: | | |
| Unaffiliated issuers (net of increase in deferred foreign taxes of $21,729) | 14,913,300 | |
| Fidelity Central Funds | 54 | |
| Assets and liabilities in foreign currencies | 55 | |
| Total change in net unrealized appreciation (depreciation) | | 14,913,409 |
| Net gain (loss) | | 15,056,979 |
| Net increase (decrease) in net assets resulting from operations | | $15,282,143 |
See accompanying notes which are an integral part of the financial statements.
Statement of Changes in Net Assets
| | Year ended July 31, 2020 | Year ended July 31, 2019 |
| Increase (Decrease) in Net Assets | | |
| Operations | | |
| Net investment income (loss) | $225,164 | $163,516 |
| Net realized gain (loss) | 143,570 | (33,301) |
| Change in net unrealized appreciation (depreciation) | 14,913,409 | 1,999,557 |
| Net increase (decrease) in net assets resulting from operations | 15,282,143 | 2,129,772 |
| Distributions to shareholders | (196,937) | (527,366) |
| Share transactions | | |
| Proceeds from sales of shares | 37,477,878 | 13,070,532 |
| Reinvestment of distributions | 196,937 | 527,366 |
| Cost of shares redeemed | (17,266,806) | (5,508,574) |
| Net increase (decrease) in net assets resulting from share transactions | 20,408,009 | 8,089,324 |
| Total increase (decrease) in net assets | 35,493,215 | 9,691,730 |
| Net Assets | | |
| Beginning of period | 24,332,774 | 14,641,044 |
| End of period | $59,825,989 | $24,332,774 |
| Other Information | | |
| Shares | | |
| Sold | 2,290,467 | 960,082 |
| Issued in reinvestment of distributions | 13,044 | 38,970 |
| Redeemed | (1,084,183) | (392,765) |
| Net increase (decrease) | 1,219,328 | 606,287 |
See accompanying notes which are an integral part of the financial statements.
Financial Highlights
Fidelity Flex Large Cap Growth Fund
| | | | | |
| Years ended July 31, | 2020 | 2019 | 2018 | 2017 A |
| Selected Per–Share Data | | | | |
| Net asset value, beginning of period | $14.76 | $14.04 | $11.33 | $10.00 |
| Income from Investment Operations | | | | |
| Net investment income (loss)B | .10 | .11 | .11C | .03 |
| Net realized and unrealized gain (loss) | 6.12 | 1.06 | 2.69 | 1.30 |
| Total from investment operations | 6.22 | 1.17 | 2.80 | 1.33 |
| Distributions from net investment income | (.12) | (.11) | (.06) | – |
| Distributions from net realized gain | – | (.35) | (.04) | – |
| Total distributions | (.12) | (.45)D | (.09)E | – |
| Net asset value, end of period | $20.86 | $14.76 | $14.04 | $11.33 |
| Total ReturnF,G | 42.45% | 8.66% | 24.90% | 13.30% |
| Ratios to Average Net AssetsH,I | | | | |
| Expenses before reductionsJ | -% | -% | -% | - %K |
| Expenses net of fee waivers, if anyJ | -% | -% | -% | - %K |
| Expenses net of all reductionsJ | -% | -% | -% | - %K |
| Net investment income (loss) | .62% | .83% | .87%C | .79%K |
| Supplemental Data | | | | |
| Net assets, end of period (000 omitted) | $59,826 | $24,333 | $14,641 | $8,576 |
| Portfolio turnover rateL | 70% | 55% | 65% | 17%M |
A For the period March 8, 2017 (commencement of operations) to July 31, 2017.
B Calculated based on average shares outstanding during the period.
C Net investment income per share reflects a large, non-recurring dividend which amounted to $.01 per share. Excluding this non-recurring dividend, the ratio of net investment income (loss) to average net assets would have been .77%.
D Total distributions of $.45 per share is comprised of distributions from net investment income of $.107 and distributions from net realized gain of $.347 per share.
E Total distributions of $.09 per share is comprised of distributions from net investment income of $.059 and distributions from net realized gain of $.035 per share.
F Total returns for periods of less than one year are not annualized.
G Total returns would have been lower if certain expenses had not been reduced during the applicable periods shown.
H Fees and expenses of any underlying mutual funds or exchange-traded funds (ETFs) are not included in the Fund's expense ratio. The Fund indirectly bears its proportionate share of these expenses. For additional expense information related to investments in Fidelity Central Funds, please refer to the "Investments in Fidelity Central Funds" note found in the Notes to Financial Statements section of the most recent Annual or Semi-Annual report.
I Expense ratios reflect operating expenses of the Fund. Expenses before reductions do not reflect amounts reimbursed by the investment adviser or reductions from expense offset arrangements and do not represent the amount paid by the Fund during periods when reimbursements or reductions occur. Expenses net of fee waivers reflect expenses after reimbursement by the investment adviser but prior to reductions from expense offset arrangements. Expenses net of all reductions represent the net expenses paid by the Fund.
J Amount represents less than .005%.
K Annualized
L Amount does not include the portfolio activity of any underlying Fidelity Central Funds.
M Amount not annualized.
See accompanying notes which are an integral part of the financial statements.
Notes to Financial Statements
For the period ended July 31, 2020
1. Organization.
Fidelity Flex Large Cap Growth Fund (the Fund) is a fund of Fidelity Securities Fund (the Trust) and is authorized to issue an unlimited number of shares. Share transactions on the Statement of Changes in Net Assets may contain exchanges between affiliated funds. The Trust is registered under the Investment Company Act of 1940, as amended (the 1940 Act), as an open-end management investment company organized as a Massachusetts business trust. The Fund is available only to certain fee-based accounts offered by Fidelity.
Effective January 1, 2020:
Investment advisers Fidelity Investments Money Management, Inc., FMR Co., Inc., and Fidelity SelectCo, LLC, merged with and into Fidelity Management & Research Company. In connection with the merger transactions, the resulting, merged investment adviser was then redomiciled from Massachusetts to Delaware, changed its corporate structure from a corporation to a limited liability company, and changed its name to "Fidelity Management & Research Company LLC".
2. Investments in Fidelity Central Funds.
The Fund invests in Fidelity Central Funds, which are open-end investment companies generally available only to other investment companies and accounts managed by the investment adviser and its affiliates. The Fund's Schedule of Investments lists each of the Fidelity Central Funds held as of period end, if any, as an investment of the Fund, but does not include the underlying holdings of each Fidelity Central Fund. As an Investing Fund, the Fund indirectly bears its proportionate share of the expenses of the underlying Fidelity Central Funds.
The Money Market Central Funds seek preservation of capital and current income and are managed by the investment adviser. Annualized expenses of the Money Market Central Funds as of their most recent shareholder report date ranged from less than .005% to .01%.
A complete unaudited list of holdings for each Fidelity Central Fund is available upon request or at the Securities and Exchange Commission (the SEC) website at www.sec.gov. In addition, the financial statements of the Fidelity Central Funds, which are not covered by the Fund's Report of Independent Registered Public Accounting Firm, are available on the SEC website or upon request.
3. Significant Accounting Policies.
The Fund is an investment company and applies the accounting and reporting guidance of the Financial Accounting Standards Board (FASB) Accounting Standards Codification Topic 946 Financial Services – Investment Companies. The financial statements have been prepared in conformity with accounting principles generally accepted in the United States of America (GAAP), which require management to make certain estimates and assumptions at the date of the financial statements. Actual results could differ from those estimates. Subsequent events, if any, through the date that the financial statements were issued have been evaluated in the preparation of the financial statements. The following summarizes the significant accounting policies of the Fund:
Investment Valuation. Investments are valued as of 4:00 p.m. Eastern time on the last calendar day of the period. The Board of Trustees (the Board) has delegated the day to day responsibility for the valuation of the Fund's investments to the Fair Value Committee (the Committee) established by the Fund's investment adviser. In accordance with valuation policies and procedures approved by the Board, the Fund attempts to obtain prices from one or more third party pricing vendors or brokers to value its investments. When current market prices, quotations or currency exchange rates are not readily available or reliable, investments will be fair valued in good faith by the Committee, in accordance with procedures adopted by the Board. Factors used in determining fair value vary by investment type and may include market or investment specific events, changes in interest rates and credit quality. The frequency with which these procedures are used cannot be predicted and they may be utilized to a significant extent. The Committee oversees the Fund's valuation policies and procedures and reports to the Board on the Committee's activities and fair value determinations. The Board monitors the appropriateness of the procedures used in valuing the Fund's investments and ratifies the fair value determinations of the Committee.
The Fund categorizes the inputs to valuation techniques used to value its investments into a disclosure hierarchy consisting of three levels as shown below:
- Level 1 – quoted prices in active markets for identical investments
- Level 2 – other significant observable inputs (including quoted prices for similar investments, interest rates, prepayment speeds, etc.)
- Level 3 – unobservable inputs (including the Fund's own assumptions based on the best information available)
Valuation techniques used to value the Fund's investments by major category are as follows:
Equity securities, including restricted securities, for which market quotations are readily available, are valued at the last reported sale price or official closing price as reported by a third party pricing vendor on the primary market or exchange on which they are traded and are categorized as Level 1 in the hierarchy. In the event there were no sales during the day or closing prices are not available, securities are valued at the last quoted bid price or may be valued using the last available price and are generally categorized as Level 2 in the hierarchy. For foreign equity securities, when market or security specific events arise, comparisons to the valuation of American Depositary Receipts (ADRs), futures contracts, Exchange-Traded Funds (ETFs) and certain indexes as well as quoted prices for similar securities may be used and would be categorized as Level 2 in the hierarchy. For equity securities, including restricted securities, where observable inputs are limited, assumptions about market activity and risk are used and these securities may be categorized as Level 3 in the hierarchy.
Debt securities, including restricted securities, are valued based on evaluated prices received from third party pricing vendors or from brokers who make markets in such securities. Corporate bonds are valued by pricing vendors who utilize matrix pricing which considers yield or price of bonds of comparable quality, coupon, maturity and type or by broker-supplied prices. When independent prices are unavailable or unreliable, debt securities may be valued utilizing pricing methodologies which consider similar factors that would be used by third party pricing vendors. Debt securities are generally categorized as Level 2 in the hierarchy but may be Level 3 depending on the circumstances.
Investments in open-end mutual funds, including the Fidelity Central Funds, are valued at their closing net asset value (NAV) each business day and are categorized as Level 1 in the hierarchy.
Changes in valuation techniques may result in transfers in or out of an assigned level within the disclosure hierarchy. The aggregate value of investments by input level as of July 31, 2020 is included at the end of the Fund's Schedule of Investments.
Foreign Currency. The Fund may use foreign currency contracts to facilitate transactions in foreign-denominated securities. Gains and losses from these transactions may arise from changes in the value of the foreign currency or if the counterparties do not perform under the contracts' terms.
Foreign-denominated assets, including investment securities, and liabilities are translated into U.S. dollars at the exchange rates at period end. Purchases and sales of investment securities, income and dividends received and expenses denominated in foreign currencies are translated into U.S. dollars at the exchange rate in effect on the transaction date.
The effects of exchange rate fluctuations on investments are included with the net realized and unrealized gain (loss) on investment securities. Other foreign currency transactions resulting in realized and unrealized gain (loss) are disclosed separately.
Investment Transactions and Income. For financial reporting purposes, the Fund's investment holdings and NAV include trades executed through the end of the last business day of the period. The NAV per share for processing shareholder transactions is calculated as of the close of business of the New York Stock Exchange (NYSE), normally 4:00 p.m. Eastern time and includes trades executed through the end of the prior business day. Gains and losses on securities sold are determined on the basis of identified cost. Dividend income is recorded on the ex-dividend date, except for certain dividends from foreign securities where the ex-dividend date may have passed, which are recorded as soon as the Fund is informed of the ex-dividend date. Non-cash dividends included in dividend income, if any, are recorded at the fair market value of the securities received. Income and capital gain distributions from Fidelity Central Funds, if any, are recorded on the ex-dividend date. Certain distributions received by the Fund represent a return of capital or capital gain. The Fund determines the components of these distributions subsequent to the ex-dividend date, based upon receipt of tax filings or other correspondence relating to the underlying investment. These distributions are recorded as a reduction of cost of investments and/or as a realized gain. Interest income is accrued as earned and includes coupon interest and amortization of premium and accretion of discount on debt securities as applicable. Investment income is recorded net of foreign taxes withheld where recovery of such taxes is uncertain.
Expenses. Expenses directly attributable to a fund are charged to that fund. Expenses attributable to more than one fund are allocated among the respective funds on the basis of relative net assets or other appropriate methods. Expense estimates are accrued in the period to which they relate and adjustments are made when actual amounts are known.
Income Tax Information and Distributions to Shareholders. Each year, the Fund intends to qualify as a regulated investment company under Subchapter M of the Internal Revenue Code, including distributing substantially all of its taxable income and realized gains. As a result, no provision for U.S. Federal income taxes is required. As of July 31, 2020, the Fund did not have any unrecognized tax benefits in the financial statements; nor is the Fund aware of any tax positions for which it is reasonably possible that the total amounts of unrecognized tax benefits will significantly change in the next twelve months. The Fund files a U.S. federal tax return, in addition to state and local tax returns as required. The Fund's federal income tax returns are subject to examination by the Internal Revenue Service (IRS) for a period of three fiscal years after they are filed. State and local tax returns may be subject to examination for an additional fiscal year depending on the jurisdiction. Foreign taxes are provided for based on the Fund's understanding of the tax rules and rates that exist in the foreign markets in which it invests. The Fund is subject to a tax imposed on capital gains by certain countries in which it invests. An estimated deferred tax liability for net unrealized appreciation on the applicable securities is included in Other payables and accrued expenses on the Statement of Assets & Liabilities.
Distributions are declared and recorded on the ex-dividend date. Income and capital gain distributions are determined in accordance with income tax regulations, which may differ from GAAP.
Capital accounts within the financial statements are adjusted for permanent book-tax differences. These adjustments have no impact on net assets or the results of operations. Capital accounts are not adjusted for temporary book-tax differences which will reverse in a subsequent period.
Book-tax differences are primarily due to foreign currency transactions, partnerships, passive foreign investment companies (PFIC), and losses deferred due to wash sales and excise tax regulations.
As of period end, the cost and unrealized appreciation (depreciation) in securities, and derivatives if applicable, for federal income tax purposes were as follows:
| Gross unrealized appreciation | $20,644,423 |
| Gross unrealized depreciation | (987,148) |
| Net unrealized appreciation (depreciation) | $19,657,275 |
| Tax Cost | $40,021,413 |
The tax-based components of distributable earnings as of period end were as follows:
| Undistributed ordinary income | $164,400 |
| Undistributed long-term capital gain | $287,675 |
| Net unrealized appreciation (depreciation) on securities and other investments | $19,657,298 |
The tax character of distributions paid was as follows:
| | July 31, 2020 | July 31, 2019 |
| Ordinary Income | $196,937 | $ 308,405 |
| Long-term Capital Gains | – | 218,961 |
| Total | $196,937 | $ 527,366 |
Delayed Delivery Transactions and When-Issued Securities. During the period, the Fund transacted in securities on a delayed delivery or when-issued basis. Payment and delivery may take place after the customary settlement period for that security. The price of the underlying securities and the date when the securities will be delivered and paid for are fixed at the time the transaction is negotiated. The securities purchased on a delayed delivery or when-issued basis are identified as such in the Fund's Schedule of Investments. Losses may arise due to changes in the value of the underlying securities or if the counterparty does not perform under the contract's terms, or if the issuer does not issue the securities due to political, economic, or other factors.
Restricted Securities (including Private Placements). The Fund may invest in securities that are subject to legal or contractual restrictions on resale. These securities generally may be resold in transactions exempt from registration or to the public if the securities are registered. Disposal of these securities may involve time-consuming negotiations and expense, and prompt sale at an acceptable price may be difficult. Information regarding restricted securities is included at the end of the Fund's Schedule of Investments.
4. Purchases and Sales of Investments.
Purchases and sales of securities, other than short-term securities, are noted in the table below.
| | Purchases ($) | Sales ($) |
| Fidelity Flex Large Cap Growth Fund | 44,717,407 | 25,197,073 |
5. Fees and Other Transactions with Affiliates.
Management Fee. Fidelity Management & Research Company LLC (the investment adviser) and its affiliates provide the Fund with investment management related services and the Fund does not pay any fees for these services. Under the management contract, the investment adviser or an affiliate pays all other expenses of the Fund, excluding fees and expenses of the independent Trustees, and certain miscellaneous expenses such as proxy and shareholder meeting expenses.
Brokerage Commissions. A portion of portfolio transactions were placed with brokerage firms which are affiliates of the investment adviser. Brokerage commissions are included in net realized gain (loss) and change in net unrealized appreciation (depreciation) in the Statement of Operations. The commissions paid to these affiliated firms were as follows:
| | Amount |
| Fidelity Flex Large Cap Growth Fund | $1,772 |
Interfund Trades. Funds may purchase from or sell securities to other Fidelity Funds under procedures adopted by the Board. The procedures have been designed to ensure these interfund trades are executed in accordance with Rule 17a-7 of the 1940 Act. Interfund trades are included within the respective purchases and sales amounts shown in the Purchases and Sales of Investments note.
6. Committed Line of Credit.
Certain Funds participate with other funds managed by the investment adviser or an affiliate in a $4.25 billion credit facility (the "line of credit") to be utilized for temporary or emergency purposes to fund shareholder redemptions or for other short-term liquidity purposes. The participating funds have agreed to pay commitment fees on their pro-rata portion of the line of credit, which are reflected in Miscellaneous expenses on the Statement of Operations, and are as follows:
| | Amount |
| Fidelity Flex Large Cap Growth Fund | $81 |
During the period, there were no borrowings on this line of credit.
7. Security Lending.
The Fund lends portfolio securities through a lending agent from time to time in order to earn additional income. On the settlement date of the loan, the Fund receives collateral (in the form of U.S. Treasury obligations, letters of credit and/or cash) against the loaned securities and maintains collateral in an amount not less than 100% of the market value of the loaned securities during the period of the loan. The market value of the loaned securities is determined at the close of business of the Fund and any additional required collateral is delivered to the Fund on the next business day. The Fund or borrower may terminate the loan at any time, and if the borrower defaults on its obligation to return the securities loaned because of insolvency or other reasons, the Fund may apply collateral received from the borrower against the obligation. The Fund may experience delays and costs in recovering the securities loaned. Any cash collateral received is invested in the Fidelity Securities Lending Cash Central Fund. The value of loaned securities and cash collateral at period end are disclosed on the Fund's Statement of Assets and Liabilities. Security lending income represents the income earned on investing cash collateral, less rebates paid to borrowers and any lending agent fees associated with the loan, plus any premium payments received for lending certain types of securities. Net income from Fidelity Central Funds is presented in the Statement of Operations as a component of income from Fidelity Central Funds.
8. Expense Reductions.
Through arrangements with the Fund's custodian, credits realized as a result of certain uninvested cash balances were used to reduce the Fund's expenses by $105.
9. Other.
The Fund's organizational documents provide former and current trustees and officers with a limited indemnification against liabilities arising in connection with the performance of their duties to the Fund. In the normal course of business, the Fund may also enter into contracts that provide general indemnifications. The Fund's maximum exposure under these arrangements is unknown as this would be dependent on future claims that may be made against the Fund. The risk of material loss from such claims is considered remote.
At the end of the period, the investment adviser or its affiliates were the owners of record of 18% of the total outstanding shares of the Fund.
10. Coronavirus (COVID-19) Pandemic.
An outbreak of COVID-19 first detected in China during December 2019 has since spread globally and was declared a pandemic by the World Health Organization during March 2020. Developments that disrupt global economies and financial markets, such as the COVID-19 pandemic, may magnify factors that affect the Fund's performance.
Report of Independent Registered Public Accounting Firm
To the Board of Trustees of Fidelity Securities Fund and Shareholders of Fidelity Flex Large Cap Growth Fund
Opinion on the Financial Statements and Financial Highlights
We have audited the accompanying statement of assets and liabilities of Fidelity Flex Large Cap Growth Fund (the "Fund"), a fund of Fidelity Securities Fund, including the schedule of investments, as of July 31, 2020, the related statement of operations for the year then ended, the statement of changes in net assets for each of the two years in the period then ended, the financial highlights for each of the three years in the period then ended and for the period from March 8, 2017 (commencement of operations) to July 31, 2017, and the related notes. In our opinion, the financial statements and financial highlights present fairly, in all material respects, the financial position of the Fund as of July 31, 2020, and the results of its operations for the year then ended, the changes in its net assets for each of the two years in the period then ended, and the financial highlights for each of the three years in the period then ended and for the period from March 8, 2017 (commencement of operations) to July 31, 2017 in conformity with accounting principles generally accepted in the United States of America.
Basis for Opinion
These financial statements and financial highlights are the responsibility of the Fund's management. Our responsibility is to express an opinion on the Fund's financial statements and financial highlights based on our audits. We are a public accounting firm registered with the Public Company Accounting Oversight Board (United States) (PCAOB) and are required to be independent with respect to the Fund in accordance with the U.S. federal securities laws and the applicable rules and regulations of the Securities and Exchange Commission and the PCAOB.
We conducted our audits in accordance with the standards of the PCAOB. Those standards require that we plan and perform the audit to obtain reasonable assurance about whether the financial statements and financial highlights are free of material misstatement, whether due to error or fraud. The Fund is not required to have, nor were we engaged to perform, an audit of its internal control over financial reporting. As part of our audits we are required to obtain an understanding of internal control over financial reporting but not for the purpose of expressing an opinion on the effectiveness of the Fund’s internal control over financial reporting. Accordingly, we express no such opinion.
Our audits included performing procedures to assess the risks of material misstatement of the financial statements and financial highlights, whether due to error or fraud, and performing procedures that respond to those risks. Such procedures included examining, on a test basis, evidence regarding the amounts and disclosures in the financial statements and financial highlights. Our audits also included evaluating the accounting principles used and significant estimates made by management, as well as evaluating the overall presentation of the financial statements and financial highlights. Our procedures included confirmation of securities owned as of July 31, 2020, by correspondence with the custodian and brokers; when replies were not received from brokers, we performed other auditing procedures. We believe that our audits provide a reasonable basis for our opinion.
/s/ Deloitte & Touche LLP
Boston, Massachusetts
September 15, 2020
We have served as the auditor of one or more of the Fidelity investment companies since 1999.
Trustees and Officers
The Trustees, Members of the Advisory Board (if any), and officers of the trust and fund, as applicable, are listed below. The Board of Trustees governs the fund and is responsible for protecting the interests of shareholders. The Trustees are experienced executives who meet periodically throughout the year to oversee the fund's activities, review contractual arrangements with companies that provide services to the fund, oversee management of the risks associated with such activities and contractual arrangements, and review the fund's performance. Except for Jonathan Chiel, each of the Trustees oversees 311 funds. Mr. Chiel oversees 174 funds.
The Trustees hold office without limit in time except that (a) any Trustee may resign; (b) any Trustee may be removed by written instrument, signed by at least two-thirds of the number of Trustees prior to such removal; (c) any Trustee who requests to be retired or who has become incapacitated by illness or injury may be retired by written instrument signed by a majority of the other Trustees; and (d) any Trustee may be removed at any special meeting of shareholders by a two-thirds vote of the outstanding voting securities of the trust. Each Trustee who is not an interested person (as defined in the 1940 Act) of the trust and the fund is referred to herein as an Independent Trustee. Each Independent Trustee shall retire not later than the last day of the calendar year in which his or her 75th birthday occurs. The Independent Trustees may waive this mandatory retirement age policy with respect to individual Trustees. Officers and Advisory Board Members hold office without limit in time, except that any officer or Advisory Board Member may resign or may be removed by a vote of a majority of the Trustees at any regular meeting or any special meeting of the Trustees. Except as indicated, each individual has held the office shown or other offices in the same company for the past five years.
The fund’s Statement of Additional Information (SAI) includes more information about the Trustees. To request a free copy, call Fidelity at 1-800-544-3455 (for managed account clients) or 1-800-835-5092 (for retirement plan participants).
Experience, Skills, Attributes, and Qualifications of the Trustees. The Governance and Nominating Committee has adopted a statement of policy that describes the experience, qualifications, attributes, and skills that are necessary and desirable for potential Independent Trustee candidates (Statement of Policy). The Board believes that each Trustee satisfied at the time he or she was initially elected or appointed a Trustee, and continues to satisfy, the standards contemplated by the Statement of Policy. The Governance and Nominating Committee also engages professional search firms to help identify potential Independent Trustee candidates who have the experience, qualifications, attributes, and skills consistent with the Statement of Policy. From time to time, additional criteria based on the composition and skills of the current Independent Trustees, as well as experience or skills that may be appropriate in light of future changes to board composition, business conditions, and regulatory or other developments, have also been considered by the professional search firms and the Governance and Nominating Committee. In addition, the Board takes into account the Trustees' commitment and participation in Board and committee meetings, as well as their leadership of standing and ad hoc committees throughout their tenure.
In determining that a particular Trustee was and continues to be qualified to serve as a Trustee, the Board has considered a variety of criteria, none of which, in isolation, was controlling. The Board believes that, collectively, the Trustees have balanced and diverse experience, qualifications, attributes, and skills, which allow the Board to operate effectively in governing the fund and protecting the interests of shareholders. Information about the specific experience, skills, attributes, and qualifications of each Trustee, which in each case led to the Board's conclusion that the Trustee should serve (or continue to serve) as a trustee of the fund, is provided below.
Board Structure and Oversight Function. Robert A. Lawrence is an interested person and currently serves as Acting Chairman. The Trustees have determined that an interested Chairman is appropriate and benefits shareholders because an interested Chairman has a personal and professional stake in the quality and continuity of services provided to the fund. Independent Trustees exercise their informed business judgment to appoint an individual of their choosing to serve as Chairman, regardless of whether the Trustee happens to be independent or a member of management. The Independent Trustees have determined that they can act independently and effectively without having an Independent Trustee serve as Chairman and that a key structural component for assuring that they are in a position to do so is for the Independent Trustees to constitute a substantial majority for the Board. The Independent Trustees also regularly meet in executive session. Ned C. Lautenbach and David M. Thomas serve as Co-Lead Independent Trustees and as such each (i) acts as a liaison between the Independent Trustees and management with respect to matters important to the Independent Trustees and (ii) with management prepares agendas for Board meetings.
Fidelity® funds are overseen by different Boards of Trustees. The fund's Board oversees Fidelity's high income and certain equity funds, and other Boards oversee Fidelity's investment-grade bond, money market, asset allocation, and other equity funds. The asset allocation funds may invest in Fidelity® funds overseen by the fund's Board. The use of separate Boards, each with its own committee structure, allows the Trustees of each group of Fidelity® funds to focus on the unique issues of the funds they oversee, including common research, investment, and operational issues. On occasion, the separate Boards establish joint committees to address issues of overlapping consequences for the Fidelity® funds overseen by each Board.
The Trustees operate using a system of committees to facilitate the timely and efficient consideration of all matters of importance to the Trustees, the fund, and fund shareholders and to facilitate compliance with legal and regulatory requirements and oversight of the fund's activities and associated risks. The Board, acting through its committees, has charged FMR and its affiliates with (i) identifying events or circumstances the occurrence of which could have demonstrably adverse effects on the fund's business and/or reputation; (ii) implementing processes and controls to lessen the possibility that such events or circumstances occur or to mitigate the effects of such events or circumstances if they do occur; and (iii) creating and maintaining a system designed to evaluate continuously business and market conditions in order to facilitate the identification and implementation processes described in (i) and (ii) above. Because the day-to-day operations and activities of the fund are carried out by or through FMR, its affiliates, and other service providers, the fund's exposure to risks is mitigated but not eliminated by the processes overseen by the Trustees. While each of the Board's committees has responsibility for overseeing different aspects of the fund's activities, oversight is exercised primarily through the Operations, Audit, and Compliance Committees. Appropriate personnel, including but not limited to the fund's Chief Compliance Officer (CCO), FMR's internal auditor, the independent accountants, the fund's Treasurer and portfolio management personnel, make periodic reports to the Board's committees, as appropriate, including an annual review of Fidelity's risk management program for the Fidelity® funds. The responsibilities of each standing committee, including their oversight responsibilities, are described further under "Standing Committees of the Trustees."
Interested Trustees*:
Correspondence intended for a Trustee who is an interested person may be sent to Fidelity Investments, 245 Summer Street, Boston, Massachusetts 02210.
Name, Year of Birth; Principal Occupations and Other Relevant Experience+
Jonathan Chiel (1957)
Year of Election or Appointment: 2016
Trustee
Mr. Chiel also serves as Trustee of other Fidelity® funds. Mr. Chiel is Executive Vice President and General Counsel for FMR LLC (diversified financial services company, 2012-present). Previously, Mr. Chiel served as general counsel (2004-2012) and senior vice president and deputy general counsel (2000-2004) for John Hancock Financial Services; a partner with Choate, Hall & Stewart (1996-2000) (law firm); and an Assistant United States Attorney for the United States Attorney’s Office of the District of Massachusetts (1986-95), including Chief of the Criminal Division (1993-1995). Mr. Chiel is a director on the boards of the Boston Bar Foundation and the Maimonides School.
Robert A. Lawrence (1952)
Year of Election or Appointment: 2020
Trustee
Acting Chairman of the Board of Trustees
Mr. Lawrence also serves as Trustee of other funds. Previously, Mr. Lawrence served as a Member of the Advisory Board of certain funds. Prior to his retirement in 2008, Mr. Lawrence served as Vice President of certain Fidelity® funds (2006-2008), Senior Vice President, Head of High Income Division of Fidelity Management & Research Company (investment adviser firm, 2006-2008), and President of Fidelity Strategic Investments (investment adviser firm, 2002-2005).
* Determined to be an “Interested Trustee” by virtue of, among other things, his or her affiliation with the trust or various entities under common control with FMR.
+ The information includes the Trustee's principal occupation during the last five years and other information relating to the experience, attributes, and skills relevant to the Trustee's qualifications to serve as a Trustee, which led to the conclusion that the Trustee should serve as a Trustee for the fund.
Independent Trustees:
Correspondence intended for an Independent Trustee may be sent to Fidelity Investments, P.O. Box 55235, Boston, Massachusetts 02205-5235.
Name, Year of Birth; Principal Occupations and Other Relevant Experience+
Dennis J. Dirks (1948)
Year of Election or Appointment: 2005
Trustee
Mr. Dirks also serves as Trustee of other Fidelity® funds. Prior to his retirement in May 2003, Mr. Dirks served as Chief Operating Officer and as a member of the Board of The Depository Trust & Clearing Corporation (financial markets infrastructure), President, Chief Operating Officer and a member of the Board of The Depository Trust Company (DTC), President and a member of the Board of the National Securities Clearing Corporation (NSCC), Chief Executive Officer and a member of the Board of the Government Securities Clearing Corporation and Chief Executive Officer and a member of the Board of the Mortgage-Backed Securities Clearing Corporation. Mr. Dirks currently serves as a member of the Finance Committee (2016-present) and Board (2017-present) and is Treasurer (2018-present) of the Asolo Repertory Theatre.
Donald F. Donahue (1950)
Year of Election or Appointment: 2018
Trustee
Mr. Donahue also serves as Trustee of other Fidelity® funds. Mr. Donahue serves as President and Chief Executive Officer of Miranda Partners, LLC (risk consulting for the financial services industry, 2012-present). Previously, Mr. Donahue served as Chief Executive Officer (2006-2012), Chief Operating Officer (2003-2006) and Managing Director, Customer Marketing and Development (1999-2003) of The Depository Trust & Clearing Corporation (financial markets infrastructure). Mr. Donahue currently serves as a member (2007-present) and Co-Chairman (2016-present) of the Board of United Way of New York, a member of the Board of NYC Leadership Academy (2012-present) and a member of the Board of Advisors of Ripple Labs, Inc. (financial services, 2015-present). Mr. Donahue previously served as a member of the Advisory Board of certain Fidelity® funds (2015-2018).
Vicki L. Fuller (1957)
Year of Election or Appointment: 2020
Trustee
Ms. Fuller also serves as Trustee of other Fidelity® funds. Previously, Ms. Fuller served as a member of the Advisory Board of certain Fidelity® funds (2018-2020), Chief Investment Officer of the New York State Common Retirement Fund (2012-2018) and held a variety of positions at AllianceBernstein L.P. (global asset management, 1985-2012), including Managing Director (2006-2012) and Senior Vice President and Senior Portfolio Manager (2001-2006). Ms. Fuller currently serves as a member of the Board, Audit Committee and Nominating and Governance Committee of The Williams Companies, Inc. (natural gas infrastructure, 2018-present) and as a member of the Board of Treliant, LLC (consulting, 2019-present).
Patricia L. Kampling (1959)
Year of Election or Appointment: 2020
Trustee
Ms. Kampling also serves as Trustee of other Fidelity® funds. Prior to her retirement, Ms. Kampling served as Chairman of the Board and Chief Executive Officer (2012-2019), President and Chief Operating Officer (2011-2012) and Executive Vice President and Chief Financial Officer (2010-2011) of Alliant Energy Corporation. Ms. Kampling currently serves as a member of the Board, Compensation Committee and Executive Committee and as Chair of the Audit Committee of Briggs & Stratton Corporation (manufacturing, 2011-present) and as a member of the Board, Audit, Finance and Risk Committee and Safety, Environmental, Technology and Operations Committee of American Water Works Company, Inc. (utilities company, 2019-present). In addition, Ms. Kampling currently serves as a member of the Board of the Nature Conservancy, Wisconsin Chapter (2019-present). Previously, Ms. Kampling served as a Member of the Advisory Board of certain Fidelity® funds (2020), a member of the Board of Interstate Power and Light Company (2012-2019) and Wisconsin Power and Light Company (2012-2019) (each a subsidiary of Alliant Energy Corporation) and as a member of the Board and Workforce Development Committee of the Business Roundtable (2018-2019).
Alan J. Lacy (1953)
Year of Election or Appointment: 2008
Trustee
Mr. Lacy also serves as Trustee of other Fidelity® funds. Previously, Mr. Lacy served as Senior Adviser (2007-2014) of Oak Hill Capital Partners, L.P. (private equity), Chief Executive Officer (2005) and Vice Chairman (2005-2006) of Sears Holdings Corporation (retail), Chief Executive Officer and Chairman of the Board of Sears, Roebuck and Co. (retail, 2000-2005), Chairman (2014-2017) and a member of the Board (2010-2017) of Dave & Buster’s Entertainment, Inc. (restaurant and entertainment complexes) and a member of the Board of Bristol-Myers Squibb Company (global pharmaceuticals, 2008-2020). Mr. Lacy currently serves as a Trustee of the California Chapter of The Nature Conservancy (2015-present) and a member of the Board of the Center for Advanced Study in the Behavioral Sciences at Stanford University (2015-present).
Ned C. Lautenbach (1944)
Year of Election or Appointment: 2000
Trustee
Co-Lead Independent Trustee
Mr. Lautenbach also serves as Trustee of other Fidelity® funds. Mr. Lautenbach currently serves as Chair of the Board of Governors, State University System of Florida (2013-present) and is a member of the Council on Foreign Relations (1994-present). He is also a member and has in the past served as Chairman of the Board of Directors of Artis-Naples (2012-present). Previously, Mr. Lautenbach served as a member and then Lead Director of the Board of Directors of Eaton Corporation (diversified industrial, 1997-2016). He was also a Partner at Clayton, Dubilier & Rice, LLC (private equity investment, 1998-2010); as well as Director of Sony Corporation (2006-2007). In addition, Mr. Lautenbach had a 30-year career with IBM (technology company), during which time he served as Senior Vice President and as a member of the Corporate Executive Committee (1968-1998).
Joseph Mauriello (1944)
Year of Election or Appointment: 2008
Trustee
Mr. Mauriello also serves as Trustee of other Fidelity® funds. Prior to his retirement in January 2006, Mr. Mauriello served in numerous senior management positions including Deputy Chairman and Chief Operating Officer (2004-2005), and Vice Chairman of Financial Services (2002-2004) of KPMG LLP US (professional services, 1965-2005). Mr. Mauriello currently serves as a member of the Independent Directors Council Governing Council (2015-present). Previously, Mr. Mauriello served as a member of the Board of XL Group plc. (global insurance and re-insurance, 2006-2018).
Cornelia M. Small (1944)
Year of Election or Appointment: 2005
Trustee
Ms. Small also serves as Trustee of other Fidelity® funds. Previously, Ms. Small served as Chief Investment Officer, Director of Global Equity Investments and a member of Scudder, Stevens & Clark and Scudder Kemper Investments. Ms. Small previously served as a member of the Board (2009-2019) and Chair of the Investment Committee (2010-2019) of the Teagle Foundation and a member of the Investment Committee of the Berkshire Taconic Community Foundation (2008-2019).
Garnett A. Smith (1947)
Year of Election or Appointment: 2018
Trustee
Mr. Smith also serves as Trustee of other Fidelity® funds. Prior to his retirement, Mr. Smith served as Chairman and Chief Executive Officer (1990-1997) and President (1986-1990) of Inbrand Corp. (manufacturer of personal absorbent products). Prior to his employment with Inbrand Corp., he was employed by a retail fabric chain and North Carolina National Bank (now Bank of America). Mr. Smith previously served as a member of the Advisory Board of certain Fidelity® funds (2012-2013).
David M. Thomas (1949)
Year of Election or Appointment: 2008
Trustee
Co-Lead Independent Trustee
Mr. Thomas also serves as Trustee of other Fidelity® funds. Previously, Mr. Thomas served as Executive Chairman (2005-2006) and Chairman and Chief Executive Officer (2000-2005) of IMS Health, Inc. (pharmaceutical and healthcare information solutions). Mr. Thomas currently serves as Non-Executive Chairman of the Board of Fortune Brands Home and Security (home and security products, 2011-present), and a member of the Board (2004-present) and Presiding Director (2013-present) of Interpublic Group of Companies, Inc. (marketing communication).
Susan Tomasky (1953)
Year of Election or Appointment: 2020
Trustee
Ms. Tomasky also serves as Trustee of other Fidelity® funds. Prior to her retirement, Ms. Tomasky served in various executive officer positions at American Electric Power Company, Inc. (1998-2011), including most recently as President of AEP Transmission (2007-2011). Ms. Tomasky currently serves as a member of the Board and Sustainability Committee and as Chair of the Audit Committee of Marathon Petroleum Corporation (2018-present) and as a member of the Board, Corporate Governance Committee and Organization and Compensation Committee and as Chair of the Audit Committee of Public Service Enterprise Group, Inc. (utilities company, 2012-present). In addition, Ms. Tomasky currently serves as a member of the Board of the Columbus Regional Airport Authority (2007-present), as a member of the Board of the Royal Shakespeare Company – America (2009-present), as a member of the Board of the Columbus Association for the Performing Arts (2011-present) and as a member of the Board of Kenyon College (2016-present). Previously, Ms. Tomasky served as a Member of the Advisory Board of certain Fidelity® funds (2020), a member of the Board (2011-2019) and as Lead Independent Director (2015-2018) of Andeavor Corporation (previously Tesoro Corporation) (independent oil refiner and marketer) and as a member of the Board of Summit Midstream Partners LP (energy, 2012-2018).
Michael E. Wiley (1950)
Year of Election or Appointment: 2020
Trustee
Mr. Wiley also serves as Trustee of other Fidelity® funds. Previously, Mr. Wiley served as a member of the Advisory Board of certain Fidelity® funds (2018-2020), Chairman, President and CEO of Baker Hughes, Inc. (oilfield services, 2000-2004). Mr. Wiley also previously served as a member of the Board of Andeavor Corporation (independent oil refiner and marketer, 2005-2018), a member of the Board of Andeavor Logistics LP (natural resources logistics, 2015-2018) and a member of the Board of High Point Resources (exploration and production, 2005-2020).
+ The information includes the Trustee's principal occupation during the last five years and other information relating to the experience, attributes, and skills relevant to the Trustee's qualifications to serve as a Trustee, which led to the conclusion that the Trustee should serve as a Trustee for the fund.
Advisory Board Members and Officers:
Correspondence intended for a Member of the Advisory Board (if any) may be sent to Fidelity Investments, P.O. Box 55235, Boston, Massachusetts 02205-5235. Correspondence intended for an officer or Peter S. Lynch may be sent to Fidelity Investments, 245 Summer Street, Boston, Massachusetts 02210. Officers appear below in alphabetical order.
Name, Year of Birth; Principal Occupation
Peter S. Lynch (1944)
Year of Election or Appointment: 2003
Member of the Advisory Board
Mr. Lynch also serves as a Member of the Advisory Board of other Fidelity® funds. Mr. Lynch is Vice Chairman and a Director of Fidelity Management & Research Company LLC (investment adviser firm). In addition, Mr. Lynch serves as a Trustee of Boston College and as the Chairman of the Inner-City Scholarship Fund. Previously, Mr. Lynch served as Vice Chairman and a Director of FMR Co., Inc. (investment adviser firm) and on the Special Olympics International Board of Directors (1997-2006).
Elizabeth Paige Baumann (1968)
Year of Election or Appointment: 2017
Anti-Money Laundering (AML) Officer
Ms. Baumann also serves as AML Officer of other funds. She is Chief AML Officer (2012-present) and Senior Vice President (2014-present) of FMR LLC (diversified financial services company) and is an employee of Fidelity Investments. Previously, Ms. Baumann served as AML Officer of certain funds (2017-2019), as AML Officer of the funds (2012-2016), and Vice President (2007-2014) and Deputy Anti-Money Laundering Officer (2007-2012) of FMR LLC.
Craig S. Brown (1977)
Year of Election or Appointment: 2019
Assistant Treasurer
Mr. Brown also serves as Assistant Treasurer of other funds. Mr. Brown is an employee of Fidelity Investments (2013-present).
John J. Burke III (1964)
Year of Election or Appointment: 2018
Chief Financial Officer
Mr. Burke also serves as Chief Financial Officer of other funds. Mr. Burke serves as Head of Investment Operations for Fidelity Fund and Investment Operations (2018-present) and is an employee of Fidelity Investments (1998-present). Previously Mr. Burke served as head of Asset Management Investment Operations (2012-2018).
William C. Coffey (1969)
Year of Election or Appointment: 2019
Assistant Secretary
Mr. Coffey also serves as Assistant Secretary of other funds. He is Senior Vice President and Deputy General Counsel of FMR LLC (diversified financial services company, 2010-present), and is an employee of Fidelity Investments. Previously, Mr. Coffey served as Secretary and CLO of certain funds (2018-2019); CLO, Secretary, and Senior Vice President of Fidelity Management & Research Company and FMR Co., Inc. (investment adviser firms, 2018-2019); Secretary of Fidelity SelectCo, LLC and Fidelity Investments Money Management, Inc. (investment adviser firms, 2018-2019); CLO of Fidelity Management & Research (Hong Kong) Limited, FMR Investment Management (UK) Limited, and Fidelity Management & Research (Japan) Limited (investment adviser firms, 2018-2019); and Assistant Secretary of certain funds (2009-2018).
Timothy M. Cohen (1969)
Year of Election or Appointment: 2018
Vice President
Mr. Cohen also serves as Vice President of other funds. Mr. Cohen serves as Co-Head of Equity (2018-present), a Director of Fidelity Management & Research (Japan) Limited (investment adviser firm, 2016-present), and is an employee of Fidelity Investments. Previously, Mr. Cohen served as Executive Vice President of Fidelity SelectCo, LLC (2019), Head of Global Equity Research (2016-2018), Chief Investment Officer - Equity and a Director of Fidelity Management & Research (U.K.) Inc. (investment adviser firm, 2013-2015) and as a Director of Fidelity Management & Research (Hong Kong) Limited (investment adviser firm, 2017).
Jonathan Davis (1968)
Year of Election or Appointment: 2010
Assistant Treasurer
Mr. Davis also serves as Assistant Treasurer of other funds. Mr. Davis serves as Assistant Treasurer of FMR Capital, Inc. (2017-present) and is an employee of Fidelity Investments. Previously, Mr. Davis served as Vice President and Associate General Counsel of FMR LLC (diversified financial services company, 2003-2010).
Laura M. Del Prato (1964)
Year of Election or Appointment: 2018
Assistant Treasurer
Ms. Del Prato also serves as an officer of other funds. Ms. Del Prato is an employee of Fidelity Investments (2017-present). Previously, Ms. Del Prato served as President and Treasurer of The North Carolina Capital Management Trust: Cash Portfolio and Term Portfolio (2018-2020). Prior to joining Fidelity Investments, Ms. Del Prato served as a Managing Director and Treasurer of the JPMorgan Mutual Funds (2014-2017). Prior to JPMorgan, Ms. Del Prato served as a partner at Cohen Fund Audit Services (accounting firm, 2012-2013) and KPMG LLP (accounting firm, 2004-2012).
Colm A. Hogan (1973)
Year of Election or Appointment: 2020
Assistant Treasurer
Mr. Hogan also serves as an officer of other funds. Mr. Hogan serves as Assistant Treasurer of FMR Capital, Inc. (2017-present) and is an employee of Fidelity Investments (2005-present). Previously, Mr. Hogan served as Deputy Treasurer of certain Fidelity® funds (2016-2020) and Assistant Treasurer of certain Fidelity® funds (2016-2018).
Pamela R. Holding (1964)
Year of Election or Appointment: 2018
Vice President
Ms. Holding also serves as Vice President of other funds. Ms. Holding serves as Co-Head of Equity (2018-present) and is an employee of Fidelity Investments (2013-present). Previously, Ms. Holding served as Executive Vice President of Fidelity SelectCo, LLC (2019) and as Chief Investment Officer of Fidelity Institutional Asset Management (2013-2018).
Cynthia Lo Bessette (1969)
Year of Election or Appointment: 2019
Secretary and Chief Legal Officer (CLO)
Ms. Lo Bessette also serves as an officer of other funds. Ms. Lo Bessette serves as CLO, Secretary, and Senior Vice President of Fidelity Management & Research Company LLC (investment adviser firm, 2019-present); and CLO of Fidelity Management & Research (Hong Kong) Limited, FMR Investment Management (UK) Limited, and Fidelity Management & Research (Japan) Limited (investment adviser firms, 2019-present). She is a Senior Vice President and Deputy General Counsel of FMR LLC (diversified financial services company, 2019-present), and is an employee of Fidelity Investments. Previously, Ms. Lo Bessette served as CLO, Secretary, and Senior Vice President of FMR Co., Inc. (investment adviser firm, 2019); Secretary of Fidelity SelectCo, LLC and Fidelity Investments Money Management, Inc. (investment adviser firms, 2019). Prior to joining Fidelity Investments, Ms. Lo Bessette was Executive Vice President, General Counsel (2016-2019) and Senior Vice President, Deputy General Counsel (2015-2016) of OppenheimerFunds (investment management company) and Deputy Chief Legal Officer (2013-2015) of Jennison Associates LLC (investment adviser firm).
Chris Maher (1972)
Year of Election or Appointment: 2020
Deputy Treasurer
Mr. Maher also serves as an officer of other funds. Mr. Maher serves as Assistant Treasurer of FMR Capital, Inc. (2017-present), and is an employee of Fidelity Investments (2008-present). Previously, Mr. Maher served as Assistant Treasurer of certain funds (2013-2020); Vice President of Asset Management Compliance (2013), Vice President of the Program Management Group of FMR (investment adviser firm, 2010-2013), and Vice President of Valuation Oversight (2008-2010).
Jason P. Pogorelec (1975)
Year of Election or Appointment: 2020
Chief Compliance Officer
Mr. Pogorelec also serves as Chief Compliance Officer of other funds. Mr. Pogorelec is a senior Vice President of Asset Management Compliance for Fidelity Investments and is an employee of Fidelity Investments (2006-present). Previously, Mr. Pogorelec served as Vice President, Associate General Counsel for Fidelity Investments (2010-2020) and Assistant Secretary of certain Fidelity funds (2015-2020).
Stacie M. Smith (1974)
Year of Election or Appointment: 2016
President and Treasurer
Ms. Smith also serves as an officer of other funds. Ms. Smith serves as Assistant Treasurer of FMR Capital, Inc. (2017-present), is an employee of Fidelity Investments (2009-present), and has served in other fund officer roles. Prior to joining Fidelity Investments, Ms. Smith served as Senior Audit Manager of Ernst & Young LLP (accounting firm, 1996-2009). Previously, Ms. Smith served as Assistant Treasurer (2013-2019) and Deputy Treasurer (2013-2016) of certain Fidelity® funds.
Marc L. Spector (1972)
Year of Election or Appointment: 2016
Assistant Treasurer
Mr. Spector also serves as an officer of other funds. Mr. Spector serves as Assistant Treasurer of FMR Capital, Inc. (2017-present) and is an employee of Fidelity Investments (2016-present). Prior to joining Fidelity Investments, Mr. Spector served as Director at the Siegfried Group (accounting firm, 2013-2016), and prior to Siegfried Group as audit senior manager at Deloitte & Touche LLP (accounting firm, 2005-2013).
Jim Wegmann (1979)
Year of Election or Appointment: 2019
Assistant Treasurer
Mr. Wegmann also serves as Assistant Treasurer of other funds. Mr. Wegmann is an employee of Fidelity Investments (2011-present).
Shareholder Expense Example
As a shareholder, you incur two types of costs: (1) transaction costs, which may include sales charges (loads) on purchase payments or redemption proceeds, as applicable and (2) ongoing costs, which generally include management fees, distribution and/or service (12b-1) fees and other Fund expenses. This Example is intended to help you understand your ongoing costs (in dollars) of investing in a fund and to compare these costs with the ongoing costs of investing in other mutual funds.
The Example is based on an investment of $1,000 invested at the beginning of the period and held for the entire period (February 1, 2020 to July 31, 2020).
Actual Expenses
The first line of the accompanying table provides information about actual account values and actual expenses. You may use the information in this line, together with the amount you invested, to estimate the expenses that you paid over the period. Simply divide your account value by $1,000.00 (for example, an $8,600 account value divided by $1,000.00 = 8.6), then multiply the result by the number in the first line for a class/Fund under the heading entitled "Expenses Paid During Period" to estimate the expenses you paid on your account during this period. If any fund is a shareholder of any underlying mutual funds or exchange-traded funds (ETFs) (the Underlying Funds), such fund indirectly bears its proportional share of the expenses of the Underlying Funds in addition to the direct expenses incurred presented in the table. These fees and expenses are not included in the annualized expense ratio used to calculate the expense estimate in the table below.
Hypothetical Example for Comparison Purposes
The second line of the accompanying table provides information about hypothetical account values and hypothetical expenses based on the actual expense ratio and an assumed rate of return of 5% per year before expenses, which is not the actual return. The hypothetical account values and expenses may not be used to estimate the actual ending account balance or expenses you paid for the period. You may use this information to compare the ongoing costs of investing in the Fund and other funds. To do so, compare this 5% hypothetical example with the 5% hypothetical examples that appear in the shareholder reports of the other funds. If any fund is a shareholder of any Underlying Funds, such fund indirectly bears its proportional share of the expenses of the Underlying Funds in addition to the direct expenses as presented in the table. These fees and expenses are not included in the annualized expense ratio used to calculate the expense estimate in the table below.
Please note that the expenses shown in the table are meant to highlight your ongoing costs only and do not reflect any transaction costs. Therefore, the second line of the table is useful in comparing ongoing costs only, and will not help you determine the relative total costs of owning different funds.
| | Annualized Expense Ratio-A | Beginning
Account Value
February 1, 2020 | Ending
Account Value
July 31, 2020 | Expenses Paid
During Period-B
February 1, 2020
to July 31, 2020 |
| Fidelity Flex Large Cap Growth Fund | .01% | | | |
| Actual | | $1,000.00 | $1,247.60 | $.06 |
| Hypothetical-C | | $1,000.00 | $1,024.81 | $.05 |
A Annualized expense ratio reflects expenses net of applicable fee waivers.
B Expenses are equal to the annualized expense ratio, multiplied by the average account value over the period, multiplied by 182/ 366 (to reflect the one-half year period). The fees and expenses of any Underlying Funds are not included in each annualized expense ratio.
C 5% return per year before expenses
Distributions (Unaudited)
The Board of Trustees of Fidelity Flex Large Cap Growth Fund voted to pay on September 14, 2020, to shareholders of record at the opening of business on September 11, 2020, a distribution of $0.097 per share derived from capital gains realized from sales of portfolio securities and a dividend of $0.055 per share from net investment income.
The fund hereby designates as a capital gain dividend with respect to the taxable year ended July 31, 2020, $287,675 or, if subsequently determined to be different, the net capital gain of such year.
The fund designates 85% and 82 % of the dividends distributed in September and December, respectively during the fiscal year as qualifying for the dividends–received deduction for corporate shareholders.
The fund designates 96 % and 94 % of the dividends distributed in September and December, respectively during the fiscal year as amounts which may be taken into account as a dividend for the purposes of the maximum rate under section 1(h)(11) of the Internal Revenue Code.
The fund designates 1% of the dividends distributed during the fiscal year as a section 199A dividend.
The fund will notify shareholders in January 2021 of amounts for use in preparing 2020 income tax returns.
Liquidity Risk Management Program
The Securities and Exchange Commission adopted Rule 22e-4 under the Investment Company Act of 1940 (the Liquidity Rule) to promote effective liquidity risk management throughout the open-end investment company industry, thereby reducing the risk that funds will be unable to meet their redemption obligations and mitigating dilution of the interests of fund shareholders.
The Fund has adopted and implemented a liquidity risk management program pursuant to the Liquidity Rule (the Program) effective December 1, 2018. The Program is reasonably designed to assess and manage the Fund’s liquidity risk and to comply with the requirements of the Liquidity Rule. The Fund’s Board of Trustees (the Board) has designated the Fund’s investment adviser as administrator of the Program. The Fidelity advisers have established a Liquidity Risk Management Committee (the LRM Committee) to manage the Program for each of the Fidelity Funds. The LRM Committee monitors the adequacy and effectiveness of implementation of the Program and on a periodic basis assesses each Fund’s liquidity risk based on a variety of factors including (1) the Fund’s investment strategy, (2) portfolio liquidity and cash flow projections during normal and reasonably foreseeable stressed conditions, (3) shareholder redemptions, (4) borrowings and other funding sources and (5) in the case of exchange-traded funds, certain additional factors including the effect of the Fund’s prices and spreads, market participants, and basket compositions on the overall liquidity of the Fund’s portfolio, as applicable.
In accordance with the Program, each of the Fund’s portfolio investments is classified into one of four liquidity categories described below based on a determination of a reasonable expectation for how long it would take to convert the investment to cash (or sell or dispose of the investment) without significantly changing its market value.
- Highly liquid investments – cash or convertible to cash within three business days or less
- Moderately liquid investments – convertible to cash in three to seven calendar days
- Less liquid investments – can be sold or disposed of, but not settled, within seven calendar days
- Illiquid investments – cannot be sold or disposed of within seven calendar days
Liquidity classification determinations take into account a variety of factors including various market, trading and investment-specific considerations, as well as market depth, and generally utilize analysis from a third-party liquidity metrics service.
The Liquidity Rule places a 15% limit on a fund’s illiquid investments and requires funds that do not primarily hold assets that are highly liquid investments to determine and maintain a minimum percentage of the fund’s net assets to be invested in highly liquid investments (highly liquid investment minimum or HLIM). The Program includes provisions reasonably designed to comply with the 15% limit on illiquid investments and for determining, periodically reviewing and complying with the HLIM requirement as applicable.
At a recent meeting of the Fund’s Board of Trustees, the LRM Committee provided a written report to the Board pertaining to the operation, adequacy, and effectiveness of implementation of the Program for the annual period from December 1, 2018 through November 30, 2019. The report concluded that the Program has been implemented and is operating effectively and is reasonably designed to assess and manage the Fund’s liquidity risk.
Proxy Voting Results
A special meeting of shareholders was held on June 9, 2020. The results of votes taken among shareholders on the proposal before them are reported below. Each vote reported represents one dollar of net asset value held on the record date for the meeting.
PROPOSAL 1
To elect a Board of Trustees.
| | # of
Votes | % of
Votes |
| Dennis J. Dirks |
| Affirmative | 43,167,428,219.785 | 94.885 |
| Withheld | 2,327,070,930.034 | 5.115 |
| TOTAL | 45,494,499,149.820 | 100.000 |
| Donald F. Donahue |
| Affirmative | 43,161,668,935.467 | 94.872 |
| Withheld | 2,333,065,287.611 | 5.128 |
| TOTAL | 45,494,734,223.077 | 100.000 |
| Bettina Doulton |
| Affirmative | 43,304,465,213.969 | 95.186 |
| Withheld | 2,190,010,062.903 | 4.814 |
| TOTAL | 45,494,475,276.872 | 100.000 |
| Vicki L. Fuller |
| Affirmative | 43,380,442,631.493 | 95.353 |
| Withheld | 2,114,180,614.639 | 4.647 |
| TOTAL | 45,494,623,246.132 | 100.000 |
| Patricia L. Kampling |
| Affirmative | 43,128,008,796.761 | 94.798 |
| Withheld | 2,366,685,422.999 | 5.202 |
| TOTAL | 45,494,694,219.760 | 100.000 |
| Alan J. Lacy |
| Affirmative | 42,904,065,046.958 | 94.305 |
| Withheld | 2,590,717,567.229 | 5.695 |
| TOTAL | 45,494,782,614.187 | 100.000 |
| Ned C. Lautenbach |
| Affirmative | 42,802,778,827.017 | 94.083 |
| Withheld | 2,692,003,787.170 | 5.917 |
| TOTAL | 45,494,782,614.187 | 100.000 |
| Robert A. Lawrence |
| Affirmative | 42,971,258,294.203 | 94.453 |
| Withheld | 2,523,524,319.984 | 5.547 |
| TOTAL | 45,494,782,614.187 | 100.000 |
| Joseph Mauriello |
| Affirmative | 42,874,562,778.490 | 94.241 |
| Withheld | 2,620,171,874.731 | 5.759 |
| TOTAL | 45,494,734,653.220 | 100.000 |
| Cornelia M. Small |
| Affirmative | 43,029,040,988.063 | 94.580 |
| Withheld | 2,465,741,626.124 | 5.420 |
| TOTAL | 45,494,782,614.187 | 100.000 |
| Garnett A. Smith |
| Affirmative | 42,892,814,945.159 | 94.281 |
| Withheld | 2,601,967,669.028 | 5.719 |
| TOTAL | 45,494,782,614.187 | 100.000 |
| David M. Thomas |
| Affirmative | 42,936,080,036.111 | 94.376 |
| Withheld | 2,558,702,578.076 | 5.624 |
| TOTAL | 45,494,782,614.187 | 100.000 |
| Susan Tomasky |
| Affirmative | 43,147,934,105.796 | 94.842 |
| Withheld | 2,346,571,066.028 | 5.158 |
| TOTAL | 45,494,782,614.187 | 100.000 |
| Michael E. Wiley |
| Affirmative | 42,885,333,102.972 | 94.264 |
| Withheld | 2,609,449,511.215 | 5.736 |
| TOTAL | 45,494,782,614.187 | 100.000 |
|
| Proposal 1 reflects trust wide proposal and voting results. |
ZLG-ANN-0920
1.9881575.103
Fidelity® Blue Chip Growth K6 Fund
Annual Report
July 31, 2020
See the inside front cover for important information about access to your fund’s shareholder reports.
Beginning on January 1, 2021, as permitted by regulations adopted by the Securities and Exchange Commission, paper copies of a fund’s shareholder reports will no longer be sent by mail, unless you specifically request paper copies of the reports from the fund or from your financial intermediary, such as a financial advisor, broker-dealer or bank. Instead, the reports will be made available on a website, and you will be notified by mail each time a report is posted and provided with a website link to access the report.
If you already elected to receive shareholder reports electronically, you will not be affected by this change and you need not take any action. You may elect to receive shareholder reports and other communications from a fund electronically, by contacting your financial intermediary. For Fidelity customers, visit Fidelity's web site or call Fidelity using the contact information listed below.
You may elect to receive all future reports in paper free of charge. If you wish to continue receiving paper copies of your shareholder reports, you may contact your financial intermediary or, if you are a Fidelity customer, visit Fidelity’s website, or call Fidelity at the applicable toll-free number listed below. Your election to receive reports in paper will apply to all funds held with the fund complex/your financial intermediary.
| Account Type | Website | Phone Number |
| Brokerage, Mutual Fund, or Annuity Contracts: | fidelity.com/mailpreferences | 1-800-343-3548 |
| Employer Provided Retirement Accounts: | netbenefits.fidelity.com/preferences (choose 'no' under Required Disclosures to continue to print) | 1-800-343-0860 |
| Advisor Sold Accounts Serviced Through Your Financial Intermediary: | Contact Your Financial Intermediary | Your Financial Intermediary's phone number |
| Advisor Sold Accounts Serviced by Fidelity: | institutional.fidelity.com | 1-877-208-0098 |
Contents
To view a fund's proxy voting guidelines and proxy voting record for the 12-month period ended June 30, visit http://www.fidelity.com/proxyvotingresults or visit the Securities and Exchange Commission's (SEC) web site at http://www.sec.gov.
You may also call 1-800-835-5092 to request a free copy of the proxy voting guidelines.
Standard & Poor's, S&P and S&P 500 are registered service marks of The McGraw-Hill Companies, Inc. and have been licensed for use by Fidelity Distributors Corporation.
Other third-party marks appearing herein are the property of their respective owners.
All other marks appearing herein are registered or unregistered trademarks or service marks of FMR LLC or an affiliated company. © 2020 FMR LLC. All rights reserved.
This report and the financial statements contained herein are submitted for the general information of the shareholders of the Fund. This report is not authorized for distribution to prospective investors in the Fund unless preceded or accompanied by an effective prospectus.
A fund files its complete schedule of portfolio holdings with the SEC for the first and third quarters of each fiscal year on Form N-PORT. Forms N-PORT are available on the SEC’s web site at http://www.sec.gov. A fund's Forms N-PORT may be reviewed and copied at the SEC’s Public Reference Room in Washington, DC. Information regarding the operation of the SEC's Public Reference Room may be obtained by calling 1-800-SEC-0330.
For a complete list of a fund's portfolio holdings, view the most recent holdings listing, semiannual report, or annual report on Fidelity's web site at http://www.fidelity.com, http://www.institutional.fidelity.com, or http://www.401k.com, as applicable.
NOT FDIC INSURED •MAY LOSE VALUE •NO BANK GUARANTEE
Neither the Fund nor Fidelity Distributors Corporation is a bank.
Note to Shareholders:
Early in 2020, the outbreak and spread of a new coronavirus emerged as a public health emergency that had a major influence on financial markets, primarily based on its impact on the global economy and the outlook for corporate earnings. The virus causes a respiratory disease known as COVID-19. On March 11, the World Health Organization declared the COVID-19 outbreak a pandemic, citing sustained risk of further global spread.
In the weeks following, as the crisis worsened, we witnessed an escalating human tragedy with wide-scale social and economic consequences from coronavirus-containment measures. The outbreak of COVID-19 prompted a number of measures to limit the spread, including travel and border restrictions, quarantines, and restrictions on large gatherings. In turn, these resulted in lower consumer activity, diminished demand for a wide range of products and services, disruption in manufacturing and supply chains, and – given the wide variability in outcomes regarding the outbreak – significant market uncertainty and volatility. Amid the turmoil, the U.S. government took unprecedented action – in concert with the U.S. Federal Reserve and central banks around the world – to help support consumers, businesses, and the broader economy, and to limit disruption to the financial system.
The situation continues to unfold, and the extent and duration of its impact on financial markets and the economy remain highly uncertain. Extreme events such as the coronavirus crisis are “exogenous shocks” that can have significant adverse effects on mutual funds and their investments. Although multiple asset classes may be affected by market disruption, the duration and impact may not be the same for all types of assets.
Fidelity is committed to helping you stay informed amid news about COVID-19 and during increased market volatility, and we’re taking extra steps to be responsive to customer needs. We encourage you to visit our websites, where we offer ongoing updates, commentary, and analysis on the markets and our funds.
Performance: The Bottom Line
Average annual total return reflects the change in the value of an investment, assuming reinvestment of distributions from dividend income and capital gains (the profits earned upon the sale of securities that have grown in value, if any) and assuming a constant rate of performance each year. The hypothetical investment and the average annual total returns do not reflect the deduction of taxes that a shareholder would pay on fund distributions or the redemption of fund shares. During periods of reimbursement by Fidelity, a fund’s total return will be greater than it would be had the reimbursement not occurred. How a fund did yesterday is no guarantee of how it will do tomorrow.
Average Annual Total Returns
| For the periods ended July 31, 2020 | Past 1 year | Life of fundA |
| Fidelity® Blue Chip Growth K6 Fund | 41.55% | 23.28% |
A From May 25, 2017
$10,000 Over Life of Fund
Let's say hypothetically that $10,000 was invested in Fidelity® Blue Chip Growth K6 Fund on May 25, 2017, when the fund started.
The chart shows how the value of your investment would have changed, and also shows how the Russell 1000® Growth Index performed over the same period.
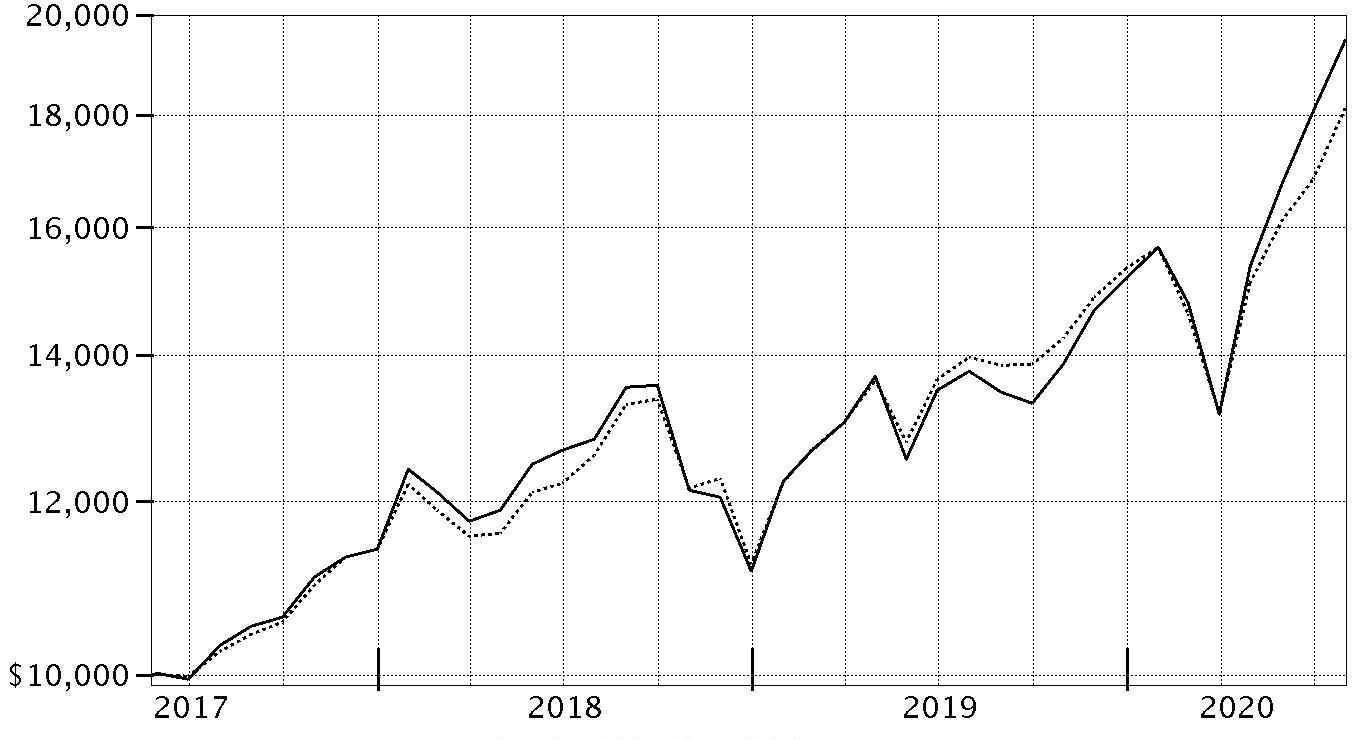
| Period Ending Values |
| $19,483 | Fidelity® Blue Chip Growth K6 Fund |
| $18,126 | Russell 1000® Growth Index |
Management's Discussion of Fund Performance
Market Recap: The S&P 500
® index gained 11.96% for the 12 months ending July 31, 2020, in what was a bumpy ride for U.S. equity investors, marked by a steep but brief decline due to the early-2020 outbreak and spread of the coronavirus, followed by a historic rebound. Declared a pandemic on March 11, the COVID-19 crisis and containment efforts caused broad contraction in economic activity, along with extreme uncertainty, volatility and dislocation in financial markets. By mid-March, U.S. stocks entered bear-market territory less than a month after hitting an all-time high and extending the longest-running bull market in American history. Stocks slid in late February, after a surge in COVID-19 cases outside China. The sudden downtrend continued in March (-12%), capping the index’s worst quarter since 2008. A historically rapid and expansive U.S. monetary/fiscal-policy response provided a partial offset to the economic disruption and fueled a sharp uptrend. Aggressive support for financial markets by the U.S. Federal Reserve, plans for reopening the economy and improving infection data boosted stocks in April (+13%) and May (+5%). In June and July, the index gained amid progress on potential treatments and signs of an early recovery in economic activity. For the full 12 months, growth stocks widely topped value, while large-caps handily bested smaller-caps. The information technology sector (+39%) led the way, followed by consumer discretionary (+22%). In contrast, energy (-38%) fell hard along with the price of crude oil.
Comments from Portfolio Manager Sonu Kalra: For the fiscal year ending July 31, 2020, the fund gained 41.55%, outperforming the 29.84% result of the benchmark Russell 1000 Growth Index. The primary contributor to performance versus the benchmark was security selection and overweighting in consumer discretionary. Strong picks in information technology also helped, as did stock selection in the communication services sector – especially within the media & entertainment industry. The biggest individual relative contributor was an overweight position in Tesla (+491%). Also adding value was our overweighting in Nvidia, which gained about 153%. Nvidia and Tesla were among the largest fund holdings, on average. Another key contributor was our out-of-benchmark position in SEA (+249%). Conversely, stock picks in the transportation industry, an underweighting in information technology and security selection in consumer staples all hindered relative performance. Among individual stocks, out-of-index positions in Lyft (-50%) and General Electric (-36%) detracted notably. We no longer held General Electric by period end but increased the fund’s stake in Lyft. An underweighting in Apple, a very large component in the benchmark that performed well, also detracted. Notable changes in positioning included increased exposure to the consumer discretionary sector and a lower allocation to communication services.
The views expressed above reflect those of the portfolio manager(s) only through the end of the period as stated on the cover of this report and do not necessarily represent the views of Fidelity or any other person in the Fidelity organization. Any such views are subject to change at any time based upon market or other conditions and Fidelity disclaims any responsibility to update such views. These views may not be relied on as investment advice and, because investment decisions for a Fidelity fund are based on numerous factors, may not be relied on as an indication of trading intent on behalf of any Fidelity fund.
Investment Summary (Unaudited)
Top Ten Stocks as of July 31, 2020
| | % of fund's net assets |
| Amazon.com, Inc. | 9.2 |
| Apple, Inc. | 9.0 |
| Microsoft Corp. | 5.9 |
| Alphabet, Inc. Class A | 4.6 |
| Facebook, Inc. Class A | 4.3 |
| NVIDIA Corp. | 3.7 |
| Tesla, Inc. | 3.1 |
| Marvell Technology Group Ltd. | 2.5 |
| Salesforce.com, Inc. | 2.5 |
| Visa, Inc. Class A | 2.1 |
| | 46.9 |
Top Five Market Sectors as of July 31, 2020
| | % of fund's net assets |
| Information Technology | 38.7 |
| Consumer Discretionary | 27.7 |
| Communication Services | 14.8 |
| Health Care | 9.8 |
| Industrials | 3.8 |
Asset Allocation (% of fund's net assets)
| As of July 31, 2020* |
| | Stocks | 98.8% |
| | Convertible Securities | 0.5% |
| | Short-Term Investments and Net Other Assets (Liabilities) | 0.7% |

* Foreign investments - 12.5%
Schedule of Investments July 31, 2020
Showing Percentage of Net Assets
| Common Stocks - 98.8% | | | |
| | | Shares | Value |
| COMMUNICATION SERVICES - 14.8% | | | |
| Entertainment - 4.2% | | | |
| Activision Blizzard, Inc. | | 332,718 | $27,492,488 |
| CD Projekt RED SA (a) | | 88 | 9,445 |
| CD Projekt RED SA ADR (a) | | 71,503 | 1,980,991 |
| Electronic Arts, Inc. (a) | | 19,100 | 2,704,942 |
| Netflix, Inc. (a) | | 131,357 | 64,217,810 |
| Nintendo Co. Ltd. | | 6,448 | 2,835,897 |
| Nintendo Co. Ltd. ADR | | 17,257 | 949,308 |
| Roku, Inc. Class A (a) | | 51,095 | 7,914,105 |
| Sea Ltd. ADR (a) | | 386,262 | 47,201,216 |
| Spotify Technology SA (a) | | 16,766 | 4,322,610 |
| Take-Two Interactive Software, Inc. (a) | | 4,368 | 716,439 |
| | | | 160,345,251 |
| Interactive Media & Services - 10.3% | | | |
| Alphabet, Inc. Class A (a) | | 118,742 | 176,682,159 |
| CarGurus, Inc. Class A (a) | | 173,709 | 5,018,453 |
| Facebook, Inc. Class A (a) | | 655,680 | 166,326,346 |
| Match Group, Inc. (a) | | 82,272 | 8,449,334 |
| Pinterest, Inc. Class A (a) | | 15,100 | 517,779 |
| Snap, Inc. Class A (a) | | 262,548 | 5,886,326 |
| Tencent Holdings Ltd. | | 357,253 | 24,506,919 |
| Twitter, Inc. (a) | | 60,300 | 2,194,920 |
| Yandex NV Series A (a) | | 42,171 | 2,426,519 |
| Zoominfo Technologies, Inc. | | 166,870 | 6,819,977 |
| | | | 398,828,732 |
| Media - 0.0% | | | |
| The New York Times Co. Class A | | 25,300 | 1,167,342 |
| Wireless Telecommunication Services - 0.3% | | | |
| T-Mobile U.S., Inc. | | 103,443 | 11,107,709 |
|
| TOTAL COMMUNICATION SERVICES | | | 571,449,034 |
|
| CONSUMER DISCRETIONARY - 27.6% | | | |
| Auto Components - 0.1% | | | |
| BorgWarner, Inc. | | 53,898 | 1,972,667 |
| Lear Corp. | | 4,846 | 534,901 |
| | | | 2,507,568 |
| Automobiles - 3.2% | | | |
| Harley-Davidson, Inc. | | 83,100 | 2,163,093 |
| Li Auto, Inc. ADR (a) | | 59,700 | 955,200 |
| Tesla, Inc. (a) | | 83,618 | 119,637,290 |
| | | | 122,755,583 |
| Distributors - 0.0% | | | |
| Pool Corp. | | 3,948 | 1,250,332 |
| Diversified Consumer Services - 0.0% | | | |
| Bright Horizons Family Solutions, Inc. (a) | | 3,187 | 341,774 |
| Youdao, Inc. ADR (a) | | 12,400 | 524,644 |
| | | | 866,418 |
| Hotels, Restaurants & Leisure - 2.5% | | | |
| Boyd Gaming Corp. | | 177,745 | 4,207,224 |
| Caesars Entertainment, Inc. (a) | | 272,190 | 8,451,500 |
| Chipotle Mexican Grill, Inc. (a) | | 16,560 | 19,129,450 |
| Churchill Downs, Inc. | | 45,516 | 6,304,876 |
| Darden Restaurants, Inc. | | 48,641 | 3,691,852 |
| Domino's Pizza, Inc. | | 2,900 | 1,121,169 |
| DraftKings, Inc. Class A (a) | | 34,800 | 1,161,450 |
| Evolution Gaming Group AB (b) | | 35,559 | 2,423,437 |
| Hilton Worldwide Holdings, Inc. | | 50,974 | 3,825,599 |
| Kambi Group PLC (a) | | 36,400 | 874,731 |
| Las Vegas Sands Corp. | | 59,597 | 2,600,813 |
| Marriott International, Inc. Class A | | 59,102 | 4,954,225 |
| Penn National Gaming, Inc. (a) | | 385,587 | 13,052,120 |
| Planet Fitness, Inc. (a) | | 2,645 | 138,069 |
| Starbucks Corp. | | 137,671 | 10,535,962 |
| Texas Roadhouse, Inc. Class A | | 76,382 | 4,291,905 |
| Vail Resorts, Inc. | | 22,986 | 4,414,002 |
| Wingstop, Inc. | | 14,875 | 2,324,219 |
| Wynn Resorts Ltd. | | 27,729 | 2,008,411 |
| | | | 95,511,014 |
| Household Durables - 0.9% | | | |
| D.R. Horton, Inc. | | 29,834 | 1,973,817 |
| iRobot Corp. (a)(c) | | 51,782 | 3,764,034 |
| KB Home | | 54,361 | 1,828,704 |
| Leggett & Platt, Inc. | | 17,995 | 721,420 |
| Lennar Corp. Class A | | 47,322 | 3,423,747 |
| NVR, Inc. (a) | | 415 | 1,631,012 |
| PulteGroup, Inc. | | 20,300 | 885,080 |
| Sony Corp. sponsored ADR | | 45,382 | 3,537,981 |
| Taylor Morrison Home Corp. (a) | | 172,129 | 4,036,425 |
| Tempur Sealy International, Inc. (a) | | 40,908 | 3,311,503 |
| Toll Brothers, Inc. | | 88,173 | 3,368,209 |
| TRI Pointe Homes, Inc. (a) | | 242,710 | 4,058,111 |
| Whirlpool Corp. | | 5,000 | 815,600 |
| | | | 33,355,643 |
| Internet & Direct Marketing Retail - 13.0% | | | |
| Alibaba Group Holding Ltd. sponsored ADR (a) | | 138,323 | 34,721,839 |
| Amazon.com, Inc. (a) | | 112,108 | 354,785,939 |
| Chewy, Inc. (a)(c) | | 7,276 | 381,917 |
| Delivery Hero AG (a)(b) | | 17,274 | 1,989,212 |
| eBay, Inc. | | 50,349 | 2,783,293 |
| Expedia, Inc. | | 64,054 | 5,189,015 |
| Farfetch Ltd. Class A (a) | | 136,001 | 3,485,706 |
| Fiverr International Ltd. (a) | | 26,726 | 2,497,010 |
| JD.com, Inc.: | | | |
| Class A | | 34,927 | 1,085,174 |
| sponsored ADR (a) | | 68,689 | 4,381,671 |
| Kogan.Com Ltd. | | 93,203 | 1,109,371 |
| MercadoLibre, Inc. (a) | | 13,741 | 15,453,403 |
| Ocado Group PLC (a) | | 77,179 | 2,074,091 |
| Pinduoduo, Inc. ADR (a) | | 325,699 | 29,899,168 |
| The Booking Holdings, Inc. (a) | | 12,277 | 20,405,970 |
| The RealReal, Inc. (a)(c) | | 347,269 | 4,736,749 |
| Wayfair LLC Class A (a) | | 59,480 | 15,827,033 |
| | | | 500,806,561 |
| Leisure Products - 0.2% | | | |
| Bafang Electric Suzhou Co. Ltd. (A Shares) | | 17,200 | 393,483 |
| BRP, Inc. | | 25,264 | 1,131,688 |
| Callaway Golf Co. | | 71,887 | 1,369,447 |
| Peloton Interactive, Inc. Class A (a) | | 29,301 | 1,998,914 |
| Polaris, Inc. | | 7,401 | 766,966 |
| Vista Outdoor, Inc. (a) | | 193,139 | 3,312,334 |
| | | | 8,972,832 |
| Multiline Retail - 0.4% | | | |
| Dollar General Corp. | | 18,509 | 3,524,114 |
| Dollar Tree, Inc. (a) | | 97,792 | 9,128,883 |
| Nordstrom, Inc. (c) | | 22,637 | 309,901 |
| Ollie's Bargain Outlet Holdings, Inc. (a) | | 24,952 | 2,622,455 |
| Target Corp. | | 18,313 | 2,305,240 |
| | | | 17,890,593 |
| Specialty Retail - 4.5% | | | |
| Advance Auto Parts, Inc. | | 2,467 | 370,395 |
| Bed Bath & Beyond, Inc. | | 30,400 | 328,928 |
| Burlington Stores, Inc. (a) | | 45,515 | 8,556,820 |
| Carvana Co. Class A (a) | | 176,035 | 27,276,623 |
| Dick's Sporting Goods, Inc. | | 54,803 | 2,500,113 |
| Five Below, Inc. (a) | | 64,643 | 7,040,269 |
| Floor & Decor Holdings, Inc. Class A (a) | | 177,725 | 11,712,078 |
| Gap, Inc. | | 138,780 | 1,855,489 |
| Lowe's Companies, Inc. | | 379,720 | 56,544,105 |
| Michaels Companies, Inc. (a) | | 240,400 | 1,726,072 |
| RH (a)(c) | | 61,174 | 17,583,243 |
| The Home Depot, Inc. | | 127,371 | 33,815,727 |
| Vroom, Inc. | | 16,652 | 985,632 |
| Williams-Sonoma, Inc. | | 25,395 | 2,212,412 |
| | | | 172,507,906 |
| Textiles, Apparel & Luxury Goods - 2.8% | | | |
| adidas AG | | 30,078 | 8,287,166 |
| Allbirds, Inc. (a)(d)(e) | | 11,760 | 121,128 |
| Anta Sports Products Ltd. | | 29,849 | 283,073 |
| Aritzia LP (a) | | 82,390 | 1,090,578 |
| Crocs, Inc. (a) | | 245,939 | 8,839,048 |
| Deckers Outdoor Corp. (a) | | 29,907 | 6,258,040 |
| lululemon athletica, Inc. (a) | | 127,255 | 41,432,955 |
| LVMH Moet Hennessy Louis Vuitton SE | | 10,095 | 4,389,742 |
| Moncler SpA | | 85,596 | 3,286,987 |
| NIKE, Inc. Class B | | 288,930 | 28,202,457 |
| PVH Corp. | | 73,023 | 3,553,299 |
| VF Corp. | | 25,671 | 1,549,502 |
| | | | 107,293,975 |
|
| TOTAL CONSUMER DISCRETIONARY | | | 1,063,718,425 |
|
| CONSUMER STAPLES - 2.2% | | | |
| Beverages - 0.5% | | | |
| Boston Beer Co., Inc. Class A (a) | | 8,829 | 7,155,375 |
| Keurig Dr. Pepper, Inc. | | 132,030 | 4,038,798 |
| Monster Beverage Corp. (a) | | 85,280 | 6,692,774 |
| | | | 17,886,947 |
| Food & Staples Retailing - 0.7% | | | |
| BJ's Wholesale Club Holdings, Inc. (a) | | 159,630 | 6,393,182 |
| Costco Wholesale Corp. | | 31,527 | 10,262,984 |
| Kroger Co. | | 145,222 | 5,052,273 |
| Performance Food Group Co. (a) | | 97,051 | 2,719,369 |
| Zur Rose Group AG (a) | | 2,490 | 687,469 |
| | | | 25,115,277 |
| Food Products - 0.1% | | | |
| Act II Global Acquisition Corp. Class A (a) | | 191,685 | 1,330,294 |
| Freshpet, Inc. (a) | | 9,979 | 958,483 |
| JDE Peet's BV | | 45,956 | 2,043,554 |
| | | | 4,332,331 |
| Household Products - 0.7% | | | |
| Clorox Co. | | 37,535 | 8,877,403 |
| Procter & Gamble Co. | | 104,202 | 13,662,966 |
| Reckitt Benckiser Group PLC | | 26,329 | 2,639,999 |
| | | | 25,180,368 |
| Personal Products - 0.1% | | | |
| Herbalife Nutrition Ltd. (a) | | 94,854 | 4,860,319 |
| Tobacco - 0.1% | | | |
| JUUL Labs, Inc. Class A (a)(d)(e) | | 23,134 | 2,326,586 |
| Swedish Match Co. AB | | 44,134 | 3,382,821 |
| | | | 5,709,407 |
|
| TOTAL CONSUMER STAPLES | | | 83,084,649 |
|
| ENERGY - 0.6% | | | |
| Oil, Gas & Consumable Fuels - 0.6% | | | |
| Occidental Petroleum Corp. warrants 8/3/27 (a) | | 2,300 | 12,880 |
| Reliance Industries Ltd. | | 782,242 | 21,582,654 |
| Reliance Industries Ltd. (a) | | 52,149 | 819,474 |
| Reliance Industries Ltd. sponsored GDR (b) | | 39,052 | 2,151,765 |
| | | | 24,566,773 |
| FINANCIALS - 0.9% | | | |
| Banks - 0.0% | | | |
| Kotak Mahindra Bank Ltd. | | 72,602 | 1,323,494 |
| Capital Markets - 0.5% | | | |
| BlackRock, Inc. Class A | | 7,906 | 4,546,029 |
| Goldman Sachs Group, Inc. | | 8,738 | 1,729,774 |
| Insurance Acquisition Corp. Class A (a) | | 126,014 | 1,349,610 |
| London Stock Exchange Group PLC | | 17,460 | 1,928,613 |
| Moody's Corp. | | 2,285 | 642,771 |
| Morgan Stanley | | 37,217 | 1,819,167 |
| MSCI, Inc. | | 13,080 | 4,917,818 |
| Open Lending Corp. (a)(c) | | 22,000 | 373,120 |
| | | | 17,306,902 |
| Consumer Finance - 0.2% | | | |
| Ally Financial, Inc. | | 193,442 | 3,888,184 |
| Capital One Financial Corp. | | 45,107 | 2,877,827 |
| Discover Financial Services | | 20,827 | 1,029,479 |
| Synchrony Financial | | 18,183 | 402,390 |
| | | | 8,197,880 |
| Diversified Financial Services - 0.0% | | | |
| dMY Technology Group, Inc. (a) | | 85,500 | 905,018 |
| Insurance - 0.2% | | | |
| eHealth, Inc. (a)(c) | | 80,263 | 5,549,384 |
| Thrifts & Mortgage Finance - 0.0% | | | |
| Housing Development Finance Corp. Ltd. | | 65,160 | 1,549,811 |
|
| TOTAL FINANCIALS | | | 34,832,489 |
|
| HEALTH CARE - 9.8% | | | |
| Biotechnology - 3.2% | | | |
| ACADIA Pharmaceuticals, Inc. (a) | | 38,813 | 1,613,456 |
| Acceleron Pharma, Inc. (a) | | 39,833 | 3,950,239 |
| ADC Therapeutics SA (a) | | 29,618 | 1,377,237 |
| Agios Pharmaceuticals, Inc. (a) | | 37,602 | 1,704,123 |
| Aimmune Therapeutics, Inc. (a)(c) | | 65,575 | 866,246 |
| Akouos, Inc. (a) | | 24,980 | 488,359 |
| Allakos, Inc. (a)(c) | | 6,948 | 521,586 |
| Alnylam Pharmaceuticals, Inc. (a) | | 78,063 | 11,378,463 |
| Annexon, Inc. (a)(c) | | 47,800 | 871,394 |
| Arcutis Biotherapeutics, Inc. (a) | | 36,725 | 980,558 |
| Argenx SE ADR (a) | | 7,558 | 1,739,323 |
| Ascendis Pharma A/S sponsored ADR (a) | | 41,703 | 5,738,750 |
| Avidity Biosciences, Inc. | | 21,075 | 594,104 |
| BeiGene Ltd. (a) | | 51,200 | 842,290 |
| BeiGene Ltd. ADR (a) | | 13,567 | 2,835,503 |
| BioNTech SE: | | | |
| ADR (a) | | 6,260 | 514,009 |
| rights 8/14/20 (a) | | 2,460 | 0 |
| BioXcel Therapeutics, Inc. (a) | | 7,200 | 326,592 |
| Bridgebio Pharma, Inc. (a)(c) | | 12,449 | 350,315 |
| Cibus Corp.: | | | |
| Series C (a)(d)(e)(f) | | 133,810 | 239,679 |
| Series D (a)(d)(e)(f) | | 134,400 | 168,000 |
| Coherus BioSciences, Inc. (a)(c) | | 49,146 | 864,478 |
| Crinetics Pharmaceuticals, Inc. (a) | | 27,952 | 387,974 |
| FibroGen, Inc. (a) | | 44,763 | 1,811,559 |
| Forma Therapeutics Holdings, Inc. | | 16,554 | 578,728 |
| Fusion Pharmaceuticals, Inc. (a) | | 27,962 | 384,757 |
| Generation Bio Co. | | 8,739 | 171,634 |
| Generation Bio Co. | | 39,318 | 694,985 |
| Global Blood Therapeutics, Inc. (a) | | 88,880 | 5,997,622 |
| Immunomedics, Inc. (a) | | 19,651 | 829,862 |
| Insmed, Inc. (a) | | 22,566 | 589,424 |
| Intercept Pharmaceuticals, Inc. (a) | | 12,920 | 589,669 |
| Ionis Pharmaceuticals, Inc. (a) | | 17,592 | 1,012,596 |
| Karuna Therapeutics, Inc. (a) | | 17,205 | 1,407,369 |
| Mirati Therapeutics, Inc. (a) | | 5,519 | 669,510 |
| Moderna, Inc. (a) | | 36,573 | 2,710,059 |
| Morphic Holding, Inc. (a) | | 16,045 | 361,173 |
| Myovant Sciences Ltd. (a) | | 78,034 | 1,186,117 |
| Neurocrine Biosciences, Inc. (a) | | 45,076 | 5,425,347 |
| Nkarta, Inc. (a) | | 11,800 | 303,850 |
| Principia Biopharma, Inc. (a) | | 17,160 | 1,434,576 |
| Protagonist Therapeutics, Inc. (a) | | 20,835 | 327,735 |
| Regeneron Pharmaceuticals, Inc. (a) | | 56,576 | 35,759,992 |
| Relay Therapeutics, Inc. (a) | | 16,200 | 574,452 |
| Revolution Medicines, Inc. | | 34,985 | 843,838 |
| Sage Therapeutics, Inc. (a) | | 47,055 | 2,144,296 |
| Sarepta Therapeutics, Inc. (a) | | 51,322 | 7,878,953 |
| Seattle Genetics, Inc. (a) | | 10,719 | 1,782,248 |
| Turning Point Therapeutics, Inc. (a) | | 52,689 | 3,120,769 |
| Vaxcyte, Inc. | | 39,476 | 1,239,941 |
| Viela Bio, Inc. | | 5,253 | 192,312 |
| Xencor, Inc. (a) | | 34,253 | 1,030,673 |
| Zai Lab Ltd. ADR (a) | | 44,237 | 3,366,878 |
| | | | 122,773,602 |
| Health Care Equipment & Supplies - 3.3% | | | |
| Atricure, Inc. (a) | | 6,651 | 271,427 |
| Axonics Modulation Technologies, Inc. (a) | | 74,377 | 3,150,610 |
| Becton, Dickinson & Co. | | 66,205 | 18,626,115 |
| Danaher Corp. | | 12,841 | 2,616,996 |
| DexCom, Inc. (a) | | 43,165 | 18,800,084 |
| Hologic, Inc. (a) | | 64,758 | 4,518,813 |
| InMode Ltd. (a)(c) | | 46,458 | 1,503,381 |
| Insulet Corp. (a) | | 29,570 | 6,013,355 |
| Intuitive Surgical, Inc. (a) | | 50,508 | 34,620,204 |
| Masimo Corp. (a) | | 21,004 | 4,623,400 |
| Novocure Ltd. (a) | | 25,885 | 1,961,824 |
| Quidel Corp. (a) | | 57,954 | 16,370,266 |
| Shockwave Medical, Inc. (a) | | 78,061 | 3,849,969 |
| Tandem Diabetes Care, Inc. (a) | | 72,418 | 7,564,784 |
| West Pharmaceutical Services, Inc. | | 15,539 | 4,177,971 |
| | | | 128,669,199 |
| Health Care Providers & Services - 1.2% | | | |
| 1Life Healthcare, Inc. (a) | | 65,703 | 1,945,466 |
| Alignment Healthcare Partners unit (d)(e) | | 27,540 | 439,500 |
| Cigna Corp. | | 12,765 | 2,204,388 |
| Guardant Health, Inc. (a) | | 41,480 | 3,533,266 |
| Humana, Inc. | | 27,188 | 10,669,931 |
| UnitedHealth Group, Inc. | | 90,774 | 27,484,552 |
| | | | 46,277,103 |
| Life Sciences Tools & Services - 0.5% | | | |
| 10X Genomics, Inc. (a) | | 28,513 | 2,804,824 |
| Berkeley Lights, Inc. (a) | | 4,900 | 293,853 |
| Eurofins Scientific SA | | 937 | 609,043 |
| Nanostring Technologies, Inc. (a) | | 31,885 | 1,151,367 |
| Thermo Fisher Scientific, Inc. | | 35,264 | 14,597,533 |
| | | | 19,456,620 |
| Pharmaceuticals - 1.6% | | | |
| AstraZeneca PLC sponsored ADR | | 292,131 | 16,295,067 |
| Eli Lilly & Co. | | 108,130 | 16,250,858 |
| Hansoh Pharmaceutical Group Co. Ltd. (a)(b) | | 208,827 | 902,637 |
| Horizon Pharma PLC (a) | | 48,688 | 2,979,219 |
| Intra-Cellular Therapies, Inc. (a) | | 43,123 | 854,913 |
| MyoKardia, Inc. (a) | | 11,140 | 1,004,048 |
| Nektar Therapeutics (a) | | 91,752 | 2,033,224 |
| OptiNose, Inc. (a) | | 71,042 | 361,959 |
| Roche Holding AG (participation certificate) | | 9,395 | 3,254,020 |
| Royalty Pharma PLC | | 26,567 | 1,143,709 |
| Zoetis, Inc. Class A | | 106,228 | 16,112,663 |
| | | | 61,192,317 |
|
| TOTAL HEALTH CARE | | | 378,368,841 |
|
| INDUSTRIALS - 3.8% | | | |
| Aerospace & Defense - 0.1% | | | |
| Avon Rubber PLC | | 16,728 | 726,979 |
| Axon Enterprise, Inc. (a) | | 24,282 | 2,018,563 |
| | | | 2,745,542 |
| Air Freight & Logistics - 0.1% | | | |
| XPO Logistics, Inc. (a) | | 30,489 | 2,287,285 |
| Airlines - 0.0% | | | |
| Spirit Airlines, Inc. (a)(c) | | 120,506 | 1,905,200 |
| Building Products - 0.0% | | | |
| Fortune Brands Home & Security, Inc. | | 17,570 | 1,344,105 |
| The AZEK Co., Inc. | | 18,094 | 624,243 |
| | | | 1,968,348 |
| Commercial Services & Supplies - 0.2% | | | |
| Copart, Inc. (a) | | 38,911 | 3,628,451 |
| HNI Corp. | | 18,510 | 549,747 |
| HomeServe PLC | | 145,227 | 2,524,556 |
| Knoll, Inc. | | 51,447 | 602,444 |
| Steelcase, Inc. Class A | | 64,826 | 695,583 |
| | | | 8,000,781 |
| Construction & Engineering - 0.1% | | | |
| Dycom Industries, Inc. (a) | | 90,660 | 3,882,968 |
| Electrical Equipment - 0.1% | | | |
| Sensata Technologies, Inc. PLC (a) | | 56,192 | 2,134,172 |
| Machinery - 0.1% | | | |
| Nikola Corp. (a)(c) | | 170,677 | 5,120,310 |
| Professional Services - 0.3% | | | |
| Equifax, Inc. | | 44,645 | 7,257,491 |
| Manpower, Inc. | | 37,831 | 2,602,394 |
| | | | 9,859,885 |
| Road & Rail - 2.8% | | | |
| Knight-Swift Transportation Holdings, Inc. Class A | | 104,520 | 4,545,575 |
| Lyft, Inc. (a)(c) | | 1,778,983 | 51,999,673 |
| Uber Technologies, Inc. (a) | | 1,712,185 | 51,810,718 |
| | | | 108,355,966 |
|
| TOTAL INDUSTRIALS | | | 146,260,457 |
|
| INFORMATION TECHNOLOGY - 38.5% | | | |
| Electronic Equipment & Components - 0.7% | | | |
| Flextronics International Ltd. (a) | | 166,393 | 1,911,856 |
| FLIR Systems, Inc. | | 94,375 | 3,931,663 |
| II-VI, Inc. (a)(c) | | 317,384 | 16,097,716 |
| Jabil, Inc. | | 172,364 | 6,008,609 |
| | | | 27,949,844 |
| IT Services - 6.9% | | | |
| Alliance Data Systems Corp. | | 31,694 | 1,405,946 |
| Endava PLC ADR (a) | | 31,427 | 1,623,205 |
| MasterCard, Inc. Class A | | 196,861 | 60,737,524 |
| MongoDB, Inc. Class A (a) | | 21,459 | 4,915,828 |
| PayPal Holdings, Inc. (a) | | 254,316 | 49,863,738 |
| Repay Holdings Corp. (a) | | 63,599 | 1,407,446 |
| Riskified Ltd. (d)(e) | | 32,650 | 310,645 |
| Riskified Ltd. warrants (a)(d)(e) | | 273 | 0 |
| Shopify, Inc. Class A (a) | | 24,433 | 24,986,252 |
| Square, Inc. (a) | | 62,758 | 8,149,126 |
| Twilio, Inc. Class A (a) | | 91,938 | 25,505,440 |
| Visa, Inc. Class A | | 416,584 | 79,317,594 |
| Wix.com Ltd. (a) | | 25,835 | 7,504,551 |
| | | | 265,727,295 |
| Semiconductors & Semiconductor Equipment - 9.6% | | | |
| Advanced Micro Devices, Inc. (a) | | 363,091 | 28,114,136 |
| Cirrus Logic, Inc. (a) | | 30,046 | 2,059,052 |
| Enphase Energy, Inc. (a) | | 61,163 | 3,691,799 |
| Inphi Corp. (a) | | 6,029 | 787,749 |
| Lam Research Corp. | | 6,560 | 2,474,170 |
| Lattice Semiconductor Corp. (a) | | 68,542 | 2,130,971 |
| Marvell Technology Group Ltd. | | 2,687,649 | 98,018,559 |
| MediaTek, Inc. | | 73,000 | 1,742,831 |
| Micron Technology, Inc. (a) | | 418,062 | 20,926,093 |
| Monolithic Power Systems, Inc. | | 1,500 | 397,515 |
| NVIDIA Corp. | | 337,266 | 143,199,771 |
| NXP Semiconductors NV | | 427,011 | 50,186,603 |
| ON Semiconductor Corp. (a) | | 53,900 | 1,110,340 |
| SolarEdge Technologies, Inc. (a) | | 20,305 | 3,555,406 |
| STMicroelectronics NV (NY Shares) unit | | 73,189 | 2,044,901 |
| Synaptics, Inc. (a) | | 17,575 | 1,406,352 |
| Taiwan Semiconductor Manufacturing Co. Ltd. sponsored ADR | | 27,800 | 2,193,142 |
| Universal Display Corp. | | 22,744 | 3,967,691 |
| Xilinx, Inc. | | 33,104 | 3,553,714 |
| | | | 371,560,795 |
| Software - 12.3% | | | |
| Adobe, Inc. (a) | | 131,572 | 58,460,071 |
| Avalara, Inc. (a) | | 16,944 | 2,278,121 |
| Bill.Com Holdings, Inc. (a) | | 36,850 | 3,431,104 |
| Cloudflare, Inc. (a) | | 34,718 | 1,444,963 |
| Coupa Software, Inc. (a) | | 17,299 | 5,301,279 |
| Crowdstrike Holdings, Inc. (a) | | 66,303 | 7,505,500 |
| DocuSign, Inc. (a) | | 26,056 | 5,649,722 |
| Dynatrace, Inc. | | 35,848 | 1,499,522 |
| Elastic NV (a) | | 64,265 | 6,181,650 |
| Epic Games, Inc. (d)(e) | | 607 | 349,025 |
| Five9, Inc. (a) | | 16,860 | 2,037,025 |
| HubSpot, Inc. (a) | | 21,201 | 4,973,967 |
| Lightspeed POS, Inc. (a) | | 124,961 | 3,530,198 |
| Microsoft Corp. | | 1,102,366 | 225,996,054 |
| Paycom Software, Inc. (a) | | 12,985 | 3,692,544 |
| Ping Identity Holding Corp. (a) | | 34,122 | 1,172,432 |
| RingCentral, Inc. (a) | | 29,882 | 8,673,848 |
| Salesforce.com, Inc. (a) | | 487,508 | 94,990,934 |
| ServiceNow, Inc. (a) | | 31,645 | 13,898,484 |
| Slack Technologies, Inc. Class A (a) | | 82,200 | 2,429,010 |
| Smartsheet, Inc. (a) | | 13,674 | 652,797 |
| Snowflake Computing, Inc. Class B (d)(e) | | 2,136 | 82,813 |
| The Trade Desk, Inc. (a)(c) | | 25,522 | 11,518,589 |
| Workday, Inc. Class A (a) | | 13,956 | 2,524,920 |
| Zoom Video Communications, Inc. Class A (a) | | 16,678 | 4,234,711 |
| | | | 472,509,283 |
| Technology Hardware, Storage & Peripherals - 9.0% | | | |
| Apple, Inc. | | 814,109 | 346,028,889 |
|
| TOTAL INFORMATION TECHNOLOGY | | | 1,483,776,106 |
|
| MATERIALS - 0.2% | | | |
| Chemicals - 0.2% | | | |
| The Chemours Co. LLC | | 388,782 | 7,204,130 |
| Metals & Mining - 0.0% | | | |
| ArcelorMittal SA Class A unit (a) | | 112,453 | 1,233,609 |
| Barrick Gold Corp. | | 13,600 | 393,176 |
| Lundin Mining Corp. | | 8,006 | 44,828 |
| MMC Norilsk Nickel PJSC sponsored ADR | | 14,600 | 383,542 |
| | | | 2,055,155 |
|
| TOTAL MATERIALS | | | 9,259,285 |
|
| REAL ESTATE - 0.4% | | | |
| Equity Real Estate Investment Trusts (REITs) - 0.2% | | | |
| Ant International Co. Ltd. Class C (a)(d)(e) | | 274,458 | 2,870,831 |
| Douglas Emmett, Inc. | | 28,974 | 844,302 |
| Equinix, Inc. | | 2,909 | 2,284,961 |
| | | | 6,000,094 |
| Real Estate Management & Development - 0.2% | | | |
| Redfin Corp. (a)(c) | | 184,549 | 7,673,547 |
|
| TOTAL REAL ESTATE | | | 13,673,641 |
|
| TOTAL COMMON STOCKS | | | |
| (Cost $2,391,426,121) | | | 3,808,989,700 |
|
| Preferred Stocks - 0.5% | | | |
| Convertible Preferred Stocks - 0.5% | | | |
| CONSUMER DISCRETIONARY - 0.1% | | | |
| Automobiles - 0.1% | | | |
| Rivian Automotive, Inc. Series E (d)(e) | | 225,415 | 3,491,678 |
| Hotels, Restaurants & Leisure - 0.0% | | | |
| Topgolf International, Inc. Series F (a)(d)(e) | | 9,181 | 116,415 |
| Internet & Direct Marketing Retail - 0.0% | | | |
| The Honest Co., Inc. Series E (a)(d)(e) | | 11,802 | 231,319 |
| Textiles, Apparel & Luxury Goods - 0.0% | | | |
| Allbirds, Inc.: | | | |
| Series A (a)(d)(e) | | 4,640 | 47,792 |
| Series B (a)(d)(e) | | 815 | 8,395 |
| Series C (a)(d)(e) | | 7,790 | 80,237 |
| Series Seed (a)(d)(e) | | 2,495 | 25,699 |
| | | | 162,123 |
| TOTAL CONSUMER DISCRETIONARY | | | 4,001,535 |
| CONSUMER STAPLES - 0.2% | | | |
| Food & Staples Retailing - 0.1% | | | |
| Blink Health LLC Series C (d)(e) | | 7,913 | 302,118 |
| Roofoods Ltd. Series F (a)(d)(e) | | 337 | 117,114 |
| Sweetgreen, Inc.: | | | |
| Series C (d)(e) | | 1,240 | 18,451 |
| Series D (d)(e) | | 19,947 | 296,811 |
| Series H (a)(d)(e) | | 211,642 | 3,149,233 |
| Series I (d)(e) | | 47,013 | 699,553 |
| | | | 4,583,280 |
| Food Products - 0.0% | | | |
| Agbiome LLC Series C (a)(d)(e) | | 68,700 | 435,125 |
| Tobacco - 0.1% | | | |
| JUUL Labs, Inc. Series E (a)(d)(e) | | 12,508 | 1,257,930 |
| TOTAL CONSUMER STAPLES | | | 6,276,335 |
| FINANCIALS - 0.0% | | | |
| Diversified Financial Services - 0.0% | | | |
| Sonder Holdings, Inc. Series D (d)(e) | | 47,507 | 511,503 |
| HEALTH CARE - 0.0% | | | |
| Biotechnology - 0.0% | | | |
| 23andMe, Inc. Series F (a)(d)(e) | | 6,504 | 67,967 |
| Nuvation Bio, Inc. Series A (a)(d)(e)(g) | | 658,600 | 619,084 |
| | | | 687,051 |
| INFORMATION TECHNOLOGY - 0.2% | | | |
| Internet Software & Services - 0.1% | | | |
| ContextLogic, Inc. Series G (a)(d)(e) | | 2,862 | 500,421 |
| Starry, Inc.: | | | |
| Series C (a)(d)(e) | | 158,250 | 226,298 |
| Series D (a)(d)(e) | | 553,263 | 791,166 |
| | | | 1,517,885 |
| IT Services - 0.0% | | | |
| Riskified Ltd. Series E (d)(e) | | 32,500 | 309,218 |
| Software - 0.1% | | | |
| ACV Auctions, Inc. Series E (d)(e) | | 76,518 | 452,987 |
| Bird Rides, Inc.: | | | |
| Series C (a)(d)(e) | | 146,154 | 1,522,925 |
| Series D (d)(e) | | 22,200 | 231,324 |
| Compass, Inc. Series E (a)(d)(e) | | 1,181 | 149,243 |
| UiPath, Inc.: | | | |
| Series A1 (a)(d)(e) | | 29,817 | 554,401 |
| Series B1 (a)(d)(e) | | 1,485 | 27,611 |
| Series B2 (a)(d)(e) | | 7,398 | 137,554 |
| | | | 3,076,045 |
| TOTAL INFORMATION TECHNOLOGY | | | 4,903,148 |
|
| TOTAL CONVERTIBLE PREFERRED STOCKS | | | 16,379,572 |
|
| Nonconvertible Preferred Stocks - 0.0% | | | |
| CONSUMER DISCRETIONARY - 0.0% | | | |
| Automobiles - 0.0% | | | |
| Neutron Holdings, Inc.: | | | |
| Series 1C (d)(e) | | 3,178,083 | 63,562 |
| Series 1D (d)(e) | | 5,904,173 | 118,083 |
| Waymo LLC Series A2 (d)(e) | | 7,817 | 671,224 |
| | | | 852,869 |
| TOTAL PREFERRED STOCKS | | | |
| (Cost $17,574,314) | | | 17,232,441 |
| | | Principal Amount | Value |
|
| Convertible Bonds - 0.0% | | | |
| CONSUMER DISCRETIONARY - 0.0% | | | |
| Automobiles - 0.0% | | | |
| Neutron Holdings, Inc.: | | | |
| 4% 5/22/27 (d)(e) | | 237,400 | 237,400 |
| 4% 6/12/27 (d)(e) | | 64,200 | 64,200 |
| TOTAL CONVERTIBLE BONDS | | | |
| (Cost $301,600) | | | 301,600 |
| | | Shares | Value |
|
| Money Market Funds - 2.4% | | | |
| Fidelity Cash Central Fund 0.14% (h) | | 22,383,240 | 22,389,955 |
| Fidelity Securities Lending Cash Central Fund 0.13% (h)(i) | | 70,839,703 | 70,846,787 |
| TOTAL MONEY MARKET FUNDS | | | |
| (Cost $93,234,504) | | | 93,236,742 |
| TOTAL INVESTMENT IN SECURITIES - 101.7% | | | |
| (Cost $2,502,536,539) | | | 3,919,760,483 |
| NET OTHER ASSETS (LIABILITIES) - (1.7)% | | | (65,412,619) |
| NET ASSETS - 100% | | | $3,854,347,864 |
Legend
(a) Non-income producing
(b) Security exempt from registration under Rule 144A of the Securities Act of 1933. These securities may be resold in transactions exempt from registration, normally to qualified institutional buyers. At the end of the period, the value of these securities amounted to $7,467,051 or 0.2% of net assets.
(c) Security or a portion of the security is on loan at period end.
(d) Restricted securities (including private placements) - Investment in securities not registered under the Securities Act of 1933 (excluding 144A issues). At the end of the period, the value of restricted securities (excluding 144A issues) amounted to $24,442,248 or 0.6% of net assets.
(e) Level 3 security
(f) Investment is owned by a wholly-owned subsidiary (Subsidiary) that is treated as a corporation for U.S. tax purposes.
(g) Security or a portion of the security purchased on a delayed delivery or when-issued basis.
(h) Affiliated fund that is generally available only to investment companies and other accounts managed by Fidelity Investments. The rate quoted is the annualized seven-day yield of the fund at period end. A complete unaudited listing of the fund's holdings as of its most recent quarter end is available upon request. In addition, each Fidelity Central Fund's financial statements, which are not covered by the Fund's Report of Independent Registered Public Accounting Firm, are available on the SEC's website or upon request.
(i) Investment made with cash collateral received from securities on loan.
Additional information on each restricted holding is as follows:
| Security | Acquisition Date | Acquisition Cost |
| 23andMe, Inc. Series F | 8/31/17 | $90,303 |
| ACV Auctions, Inc. Series E | 11/6/19 | $423,160 |
| Agbiome LLC Series C | 6/29/18 | $435,125 |
| Alignment Healthcare Partners unit | 2/28/20 | $333,747 |
| Allbirds, Inc. | 10/9/18 | $128,974 |
| Allbirds, Inc. Series A | 10/9/18 | $50,888 |
| Allbirds, Inc. Series B | 10/9/18 | $8,938 |
| Allbirds, Inc. Series C | 10/9/18 | $85,434 |
| Allbirds, Inc. Series Seed | 10/9/18 | $27,363 |
| Ant International Co. Ltd. Class C | 5/16/18 | $1,539,709 |
| Bird Rides, Inc. Series C | 12/21/18 | $1,716,652 |
| Bird Rides, Inc. Series D | 9/30/19 | $286,773 |
| Blink Health LLC Series C | 11/7/19 | $302,087 |
| Cibus Corp. Series C | 2/16/18 | $281,001 |
| Cibus Corp. Series D | 5/10/19 | $168,000 |
| Compass, Inc. Series E | 11/3/17 | $79,692 |
| ContextLogic, Inc. Series G | 10/24/17 | $385,033 |
| Epic Games, Inc. | 7/30/20 | $349,025 |
| JUUL Labs, Inc. Class A | 12/20/17 - 7/6/18 | $645,585 |
| JUUL Labs, Inc. Series E | 12/20/17 - 7/6/18 | $342,963 |
| Neutron Holdings, Inc. Series 1C | 7/3/18 | $581,081 |
| Neutron Holdings, Inc. Series 1D | 1/25/19 | $1,431,762 |
| Neutron Holdings, Inc. 4% 5/22/27 | 6/4/20 | $237,400 |
| Neutron Holdings, Inc. 4% 6/12/27 | 6/12/20 | $64,200 |
| Nuvation Bio, Inc. Series A | 6/17/19 | $508,030 |
| Riskified Ltd. | 12/20/19 - 4/15/20 | $295,211 |
| Riskified Ltd. Series E | 10/28/19 | $309,218 |
| Riskified Ltd. warrants | 10/28/19 | $0 |
| Rivian Automotive, Inc. Series E | 7/10/20 | $3,491,678 |
| Roofoods Ltd. Series F | 9/12/17 | $119,153 |
| Snowflake Computing, Inc. Class B | 3/19/20 | $82,848 |
| Sonder Holdings, Inc. Series D | 12/20/19 | $498,633 |
| Starry, Inc. Series C | 12/8/17 | $145,907 |
| Starry, Inc. Series D | 3/6/19 - 7/30/20 | $791,166 |
| Sweetgreen, Inc. Series C | 9/13/19 | $21,204 |
| Sweetgreen, Inc. Series D | 9/13/19 | $341,094 |
| Sweetgreen, Inc. Series H | 11/9/18 | $2,759,812 |
| Sweetgreen, Inc. Series I | 9/13/19 | $803,922 |
| The Honest Co., Inc. Series E | 9/28/17 | $231,376 |
| Topgolf International, Inc. Series F | 11/10/17 | $127,005 |
| UiPath, Inc. Series A1 | 6/14/19 | $391,117 |
| UiPath, Inc. Series B1 | 6/14/19 | $19,479 |
| UiPath, Inc. Series B2 | 6/14/19 | $97,041 |
| Waymo LLC Series A2 | 5/8/20 | $671,224 |
Affiliated Central Funds
Information regarding fiscal year to date income earned by the Fund from investments in Fidelity Central Funds is as follows:
| Fund | Income earned |
| Fidelity Cash Central Fund | $491,607 |
| Fidelity Securities Lending Cash Central Fund | 1,129,671 |
| Total | $1,621,278 |
Amounts in the income column in the above table include any capital gain distributions from underlying funds, which are presented in the corresponding line-item in the Statement of Operations, if applicable. Amount for Fidelity Securities Lending Cash Central Fund represents the income earned on investing cash collateral, less rebates paid to borrowers and any lending agent fees associated with the loan, plus any premium payments received for lending certain types of securities.
Investment Valuation
The following is a summary of the inputs used, as of July 31, 2020, involving the Fund's assets and liabilities carried at fair value. The inputs or methodology used for valuing securities may not be an indication of the risk associated with investing in those securities. For more information on valuation inputs, and their aggregation into the levels used below, please refer to the Investment Valuation section in the accompanying Notes to Financial Statements.
| | Valuation Inputs at Reporting Date: |
| Description | Total | Level 1 | Level 2 | Level 3 |
| Investments in Securities: | | | | |
| Equities: | | | | |
| Communication Services | $571,449,034 | $544,106,218 | $27,342,816 | $-- |
| Consumer Discretionary | 1,068,572,829 | 1,059,207,555 | 4,389,742 | 4,975,532 |
| Consumer Staples | 89,360,984 | 78,118,064 | 2,639,999 | 8,602,921 |
| Energy | 24,566,773 | 24,566,773 | -- | -- |
| Financials | 35,343,992 | 32,903,876 | 1,928,613 | 511,503 |
| Health Care | 379,055,892 | 373,572,657 | 3,949,005 | 1,534,230 |
| Industrials | 146,260,457 | 146,260,457 | -- | -- |
| Information Technology | 1,488,679,254 | 1,483,033,623 | -- | 5,645,631 |
| Materials | 9,259,285 | 9,259,285 | -- | -- |
| Real Estate | 13,673,641 | 10,802,810 | -- | 2,870,831 |
| Corporate Bonds | 301,600 | -- | -- | 301,600 |
| Money Market Funds | 93,236,742 | 93,236,742 | -- | -- |
| Total Investments in Securities: | $3,919,760,483 | $3,855,068,060 | $40,250,175 | $24,442,248 |
Other Information
Distribution of investments by country or territory of incorporation, as a percentage of Total Net Assets, is as follows (Unaudited):
| United States of America | 87.5% |
| Cayman Islands | 4.0% |
| Bermuda | 2.5% |
| Netherlands | 1.9% |
| Others (Individually Less Than 1%) | 4.1% |
| | 100.0% |
See accompanying notes which are an integral part of the financial statements.
Financial Statements
Statement of Assets and Liabilities
| | | July 31, 2020 |
| Assets | | |
Investment in securities, at value (including securities loaned of $69,126,464) — See accompanying schedule:
Unaffiliated issuers (cost $2,409,302,035) | $3,826,523,741 | |
| Fidelity Central Funds (cost $93,234,504) | 93,236,742 | |
| Total Investment in Securities (cost $2,502,536,539) | | $3,919,760,483 |
| Cash | | 380,253 |
| Foreign currency held at value (cost $12,569) | | 12,553 |
| Receivable for investments sold | | 50,854,279 |
| Receivable for fund shares sold | | 5,485,796 |
| Dividends receivable | | 718,278 |
| Interest receivable | | 1,856 |
| Distributions receivable from Fidelity Central Funds | | 86,207 |
| Other receivables | | 11,474 |
| Total assets | | 3,977,311,179 |
| Liabilities | | |
| Payable for investments purchased | | |
| Regular delivery | $44,834,810 | |
| Delayed delivery | 254,015 | |
| Payable for fund shares redeemed | 4,482,094 | |
| Accrued management fee | 1,396,569 | |
| Other payables and accrued expenses | 1,146,312 | |
| Collateral on securities loaned | 70,849,515 | |
| Total liabilities | | 122,963,315 |
| Net Assets | | $3,854,347,864 |
| Net Assets consist of: | | |
| Paid in capital | | $2,458,044,752 |
| Total accumulated earnings (loss) | | 1,396,303,112 |
| Net Assets | | $3,854,347,864 |
| Net Asset Value, offering price and redemption price per share ($3,854,347,864 ÷ 199,469,262 shares) | | $19.32 |
See accompanying notes which are an integral part of the financial statements.
Statement of Operations
| | | Year ended July 31, 2020 |
| Investment Income | | |
| Dividends | | $15,799,124 |
| Interest | | 1,856 |
| Income from Fidelity Central Funds (including $1,129,671 from security lending) | | 1,621,278 |
| Total income | | 17,422,258 |
| Expenses | | |
| Management fee | $12,332,535 | |
| Independent trustees' fees and expenses | 16,145 | |
| Miscellaneous | 19,692 | |
| Total expenses before reductions | 12,368,372 | |
| Expense reductions | (114,519) | |
| Total expenses after reductions | | 12,253,853 |
| Net investment income (loss) | | 5,168,405 |
| Realized and Unrealized Gain (Loss) | | |
| Net realized gain (loss) on: | | |
| Investment securities: | | |
| Unaffiliated issuers | 46,398,455 | |
| Fidelity Central Funds | 3,799 | |
| Foreign currency transactions | (18,606) | |
| Total net realized gain (loss) | | 46,383,648 |
| Change in net unrealized appreciation (depreciation) on: | | |
| Investment securities: | | |
| Unaffiliated issuers (net of increase in deferred foreign taxes of $1,137,769) | 1,006,335,481 | |
| Fidelity Central Funds | 2,238 | |
| Assets and liabilities in foreign currencies | 6,346 | |
| Total change in net unrealized appreciation (depreciation) | | 1,006,344,065 |
| Net gain (loss) | | 1,052,727,713 |
| Net increase (decrease) in net assets resulting from operations | | $1,057,896,118 |
See accompanying notes which are an integral part of the financial statements.
Statement of Changes in Net Assets
| | Year ended July 31, 2020 | Year ended July 31, 2019 |
| Increase (Decrease) in Net Assets | | |
| Operations | | |
| Net investment income (loss) | $5,168,405 | $6,471,231 |
| Net realized gain (loss) | 46,383,648 | (52,938,435) |
| Change in net unrealized appreciation (depreciation) | 1,006,344,065 | 203,296,824 |
| Net increase (decrease) in net assets resulting from operations | 1,057,896,118 | 156,829,620 |
| Distributions to shareholders | (7,277,415) | (7,070,490) |
| Share transactions | | |
| Proceeds from sales of shares | 1,251,912,257 | 912,565,199 |
| Reinvestment of distributions | 7,277,415 | 7,070,490 |
| Cost of shares redeemed | (745,697,227) | (459,202,456) |
| Net increase (decrease) in net assets resulting from share transactions | 513,492,445 | 460,433,233 |
| Total increase (decrease) in net assets | 1,564,111,148 | 610,192,363 |
| Net Assets | | |
| Beginning of period | 2,290,236,716 | 1,680,044,353 |
| End of period | $3,854,347,864 | $2,290,236,716 |
| Other Information | | |
| Shares | | |
| Sold | 81,637,907 | 72,428,803 |
| Issued in reinvestment of distributions | 517,651 | 568,533 |
| Redeemed | (50,035,938) | (37,024,976) |
| Net increase (decrease) | 32,119,620 | 35,972,360 |
See accompanying notes which are an integral part of the financial statements.
Financial Highlights
Fidelity Blue Chip Growth K6 Fund
| | | | | |
| Years ended July 31, | 2020 | 2019 | 2018 | 2017 A |
| Selected Per–Share Data | | | | |
| Net asset value, beginning of period | $13.69 | $12.79 | $10.32 | $10.00 |
| Income from Investment Operations | | | | |
| Net investment income (loss)B | .03 | .04 | .05C | –D |
| Net realized and unrealized gain (loss) | 5.64 | .91 | 2.44 | .32 |
| Total from investment operations | 5.67 | .95 | 2.49 | .32 |
| Distributions from net investment income | (.04) | (.05) | (.01) | – |
| Distributions from net realized gain | –D | – | –D | – |
| Total distributions | (.04) | (.05) | (.02)E | – |
| Net asset value, end of period | $19.32 | $13.69 | $12.79 | $10.32 |
| Total ReturnF,G | 41.55% | 7.48% | 24.10% | 3.20% |
| Ratios to Average Net AssetsH,I | | | | |
| Expenses before reductions | .45% | .45% | .45% | .45%J |
| Expenses net of fee waivers, if any | .45% | .45% | .45% | .45%J |
| Expenses net of all reductions | .45% | .45% | .45% | .45%J |
| Net investment income (loss) | .19% | .34% | .45%C | (.24)%J |
| Supplemental Data | | | | |
| Net assets, end of period (000 omitted) | $3,854,348 | $2,290,237 | $1,680,044 | $180,223 |
| Portfolio turnover rateK | 49%L | 51%L | 40%L | 3%L,M |
A For the period May 25, 2017 (commencement of operations) to July 31, 2017.
B Calculated based on average shares outstanding during the period.
C Net investment income per share reflects a large, non-recurring dividend which amounted to $.02 per share. Excluding this non-recurring dividend, the ratio of net investment income (loss) to average net assets would have been .29%.
D Amount represents less than $.005 per share.
E Total distributions of $.02 per share is comprised of distributions from net investment income of $.013 and distributions from net realized gain of $.002 per share.
F Total returns for periods of less than one year are not annualized.
G Total returns would have been lower if certain expenses had not been reduced during the applicable periods shown.
H Fees and expenses of any underlying mutual funds or exchange-traded funds (ETFs) are not included in the Fund's expense ratio. The Fund indirectly bears its proportionate share of these expenses. For additional expense information related to investments in Fidelity Central Funds, please refer to the "Investments in Fidelity Central Funds" note found in the Notes to Financial Statements section of the most recent Annual or Semi-Annual report.
I Expense ratios reflect operating expenses of the Fund. Expenses before reductions do not reflect amounts reimbursed by the investment adviser or reductions from brokerage service arrangements or reductions from other expense offset arrangements and do not represent the amount paid by the Fund during periods when reimbursements or reductions occur. Expense ratios before reductions for start-up periods may not be representative of longer term operating periods. Expenses net of fee waivers reflect expenses after reimbursement by the investment adviser but prior to reductions from brokerage service arrangements or other expense offset arrangements. Expenses net of all reductions represent the net expenses paid by the Fund.
J Annualized
K Amount does not include the portfolio activity of any underlying Fidelity Central Funds.
L Portfolio turnover rate excludes securities received or delivered in-kind.
M Amount not annualized.
See accompanying notes which are an integral part of the financial statements.
Notes to Financial Statements
For the period ended July 31, 2020
1. Organization.
Fidelity Blue Chip Growth K6 Fund (the Fund) is a fund of Fidelity Securities Fund (the Trust) and is authorized to issue an unlimited number of shares. Share transactions on the Statement of Changes in Net Assets may contain exchanges between affiliated funds. The Trust is registered under the Investment Company Act of 1940, as amended (the 1940 Act), as an open-end management investment company organized as a Massachusetts business trust. Shares generally are available only to employer-sponsored retirement plans that are recordkept by Fidelity, or to certain employer-sponsored retirement plans that are not recordkept by Fidelity.
Effective January 1, 2020:
Investment advisers Fidelity Investments Money Management, Inc., FMR Co., Inc., and Fidelity SelectCo, LLC, merged with and into Fidelity Management & Research Company. In connection with the merger transactions, the resulting, merged investment adviser was then redomiciled from Massachusetts to Delaware, changed its corporate structure from a corporation to a limited liability company, and changed its name to "Fidelity Management & Research Company LLC".
2. Investments in Fidelity Central Funds.
The Fund invests in Fidelity Central Funds, which are open-end investment companies generally available only to other investment companies and accounts managed by the investment adviser and its affiliates. The Fund's Schedule of Investments lists each of the Fidelity Central Funds held as of period end, if any, as an investment of the Fund, but does not include the underlying holdings of each Fidelity Central Fund. As an Investing Fund, the Fund indirectly bears its proportionate share of the expenses of the underlying Fidelity Central Funds.
The Money Market Central Funds seek preservation of capital and current income and are managed by the investment adviser. Annualized expenses of the Money Market Central Funds as of their most recent shareholder report date ranged from less than .005% to .01%.
A complete unaudited list of holdings for each Fidelity Central Fund is available upon request or at the Securities and Exchange Commission (the SEC) website at www.sec.gov. In addition, the financial statements of the Fidelity Central Funds, which are not covered by the Fund's Report of Independent Registered Public Accounting Firm, are available on the SEC website or upon request.
3. Significant Accounting Policies.
The Fund is an investment company and applies the accounting and reporting guidance of the Financial Accounting Standards Board (FASB) Accounting Standards Codification Topic 946 Financial Services – Investment Companies. The financial statements have been prepared in conformity with accounting principles generally accepted in the United States of America (GAAP), which require management to make certain estimates and assumptions at the date of the financial statements. Actual results could differ from those estimates. Subsequent events, if any, through the date that the financial statements were issued have been evaluated in the preparation of the financial statements. The following summarizes the significant accounting policies of the Fund:
Investment Valuation. Investments are valued as of 4:00 p.m. Eastern time on the last calendar day of the period. The Board of Trustees (the Board) has delegated the day to day responsibility for the valuation of the Fund's investments to the Fair Value Committee (the Committee) established by the Fund's investment adviser. In accordance with valuation policies and procedures approved by the Board, the Fund attempts to obtain prices from one or more third party pricing vendors or brokers to value its investments. When current market prices, quotations or currency exchange rates are not readily available or reliable, investments will be fair valued in good faith by the Committee, in accordance with procedures adopted by the Board. Factors used in determining fair value vary by investment type and may include market or investment specific events, changes in interest rates and credit quality. The frequency with which these procedures are used cannot be predicted and they may be utilized to a significant extent. The Committee oversees the Fund's valuation policies and procedures and reports to the Board on the Committee's activities and fair value determinations. The Board monitors the appropriateness of the procedures used in valuing the Fund's investments and ratifies the fair value determinations of the Committee.
The Fund categorizes the inputs to valuation techniques used to value its investments into a disclosure hierarchy consisting of three levels as shown below:
- Level 1 – quoted prices in active markets for identical investments
- Level 2 – other significant observable inputs (including quoted prices for similar investments, interest rates, prepayment speeds, etc.)
- Level 3 – unobservable inputs (including the Fund's own assumptions based on the best information available)
Valuation techniques used to value the Fund's investments by major category are as follows:
Equity securities, including restricted securities, for which market quotations are readily available, are valued at the last reported sale price or official closing price as reported by a third party pricing vendor on the primary market or exchange on which they are traded and are categorized as Level 1 in the hierarchy. In the event there were no sales during the day or closing prices are not available, securities are valued at the last quoted bid price or may be valued using the last available price and are generally categorized as Level 2 in the hierarchy. For foreign equity securities, when market or security specific events arise, comparisons to the valuation of American Depositary Receipts (ADRs), futures contracts, Exchange-Traded Funds (ETFs) and certain indexes as well as quoted prices for similar securities may be used and would be categorized as Level 2 in the hierarchy. For equity securities, including restricted securities, where observable inputs are limited, assumptions about market activity and risk are used and these securities may be categorized as Level 3 in the hierarchy.
Debt securities, including restricted securities, are valued based on evaluated prices received from third party pricing vendors or from brokers who make markets in such securities. Corporate bonds are valued by pricing vendors who utilize matrix pricing which considers yield or price of bonds of comparable quality, coupon, maturity and type or by broker-supplied prices. When independent prices are unavailable or unreliable, debt securities may be valued utilizing pricing methodologies which consider similar factors that would be used by third party pricing vendors. Debt securities are generally categorized as Level 2 in the hierarchy but may be Level 3 depending on the circumstances.
Investments in open-end mutual funds, including the Fidelity Central Funds, are valued at their closing net asset value (NAV) each business day and are categorized as Level 1 in the hierarchy.
Changes in valuation techniques may result in transfers in or out of an assigned level within the disclosure hierarchy. The aggregate value of investments by input level as of July 31, 2020 is included at the end of the Fund's Schedule of Investments.
Foreign Currency. The Fund may use foreign currency contracts to facilitate transactions in foreign-denominated securities. Gains and losses from these transactions may arise from changes in the value of the foreign currency or if the counterparties do not perform under the contracts' terms.
Foreign-denominated assets, including investment securities, and liabilities are translated into U.S. dollars at the exchange rates at period end. Purchases and sales of investment securities, income and dividends received and expenses denominated in foreign currencies are translated into U.S. dollars at the exchange rate in effect on the transaction date.
The effects of exchange rate fluctuations on investments are included with the net realized and unrealized gain (loss) on investment securities. Other foreign currency transactions resulting in realized and unrealized gain (loss) are disclosed separately.
Investment Transactions and Income. For financial reporting purposes, the Fund's investment holdings and NAV include trades executed through the end of the last business day of the period. The NAV per share for processing shareholder transactions is calculated as of the close of business of the New York Stock Exchange (NYSE), normally 4:00 p.m. Eastern time and includes trades executed through the end of the prior business day. Gains and losses on securities sold are determined on the basis of identified cost. Dividend income is recorded on the ex-dividend date, except for certain dividends from foreign securities where the ex-dividend date may have passed, which are recorded as soon as the Fund is informed of the ex-dividend date. Non-cash dividends included in dividend income, if any, are recorded at the fair market value of the securities received. Income and capital gain distributions from Fidelity Central Funds, if any, are recorded on the ex-dividend date. Certain distributions received by the Fund represent a return of capital or capital gain. The Fund determines the components of these distributions subsequent to the ex-dividend date, based upon receipt of tax filings or other correspondence relating to the underlying investment. These distributions are recorded as a reduction of cost of investments and/or as a realized gain. Interest income is accrued as earned and includes coupon interest and amortization of premium and accretion of discount on debt securities as applicable. Investment income is recorded net of foreign taxes withheld where recovery of such taxes is uncertain.
Expenses. Expenses directly attributable to a fund are charged to that fund. Expenses attributable to more than one fund are allocated among the respective funds on the basis of relative net assets or other appropriate methods. Expense estimates are accrued in the period to which they relate and adjustments are made when actual amounts are known.
Income Tax Information and Distributions to Shareholders. Each year, the Fund intends to qualify as a regulated investment company under Subchapter M of the Internal Revenue Code, including distributing substantially all of its taxable income and realized gains. As a result, no provision for U.S. Federal income taxes is required. As of July 31, 2020, the Fund did not have any unrecognized tax benefits in the financial statements; nor is the Fund aware of any tax positions for which it is reasonably possible that the total amounts of unrecognized tax benefits will significantly change in the next twelve months. The Fund files a U.S. federal tax return, in addition to state and local tax returns as required. The Fund's federal income tax returns are subject to examination by the Internal Revenue Service (IRS) for a period of three fiscal years after they are filed. State and local tax returns may be subject to examination for an additional fiscal year depending on the jurisdiction. Foreign taxes are provided for based on the Fund's understanding of the tax rules and rates that exist in the foreign markets in which it invests. The Fund is subject to a tax imposed on capital gains by certain countries in which it invests. An estimated deferred tax liability for net unrealized appreciation on the applicable securities is included in Other payables and accrued expenses on the Statement of Assets & Liabilities.
Distributions are declared and recorded on the ex-dividend date. Income and capital gain distributions are determined in accordance with income tax regulations, which may differ from GAAP.
Capital accounts within the financial statements are adjusted for permanent book-tax differences. These adjustments have no impact on net assets or the results of operations. Capital accounts are not adjusted for temporary book-tax differences which will reverse in a subsequent period.
Book-tax differences are primarily due to foreign currency transactions, passive foreign investment companies (PFIC), partnerships, capital loss carryforwards and losses deferred due to wash sales.
As of period end, the cost and unrealized appreciation (depreciation) in securities, and derivatives if applicable, for federal income tax purposes were as follows:
| Gross unrealized appreciation | $1,465,171,155 |
| Gross unrealized depreciation | (60,902,860) |
| Net unrealized appreciation (depreciation) | $1,404,268,295 |
| Tax Cost | $2,515,492,188 |
The tax-based components of distributable earnings as of period end were as follows:
| Undistributed ordinary income | $3,647,032 |
| Capital loss carryforward | $(10,476,973) |
| Net unrealized appreciation (depreciation) on securities and other investments | $1,404,270,823 |
Capital loss carryforwards are only available to offset future capital gains of the Fund to the extent provided by regulations and may be limited. The capital loss carryforward information presented below, including any applicable limitation, is estimated as of fiscal period end and is subject to adjustment.
| No expiration | |
| Short-term | $(10,476,973) |
| Long-term | (–) |
| Total capital loss carryforward | $(10,476,973) |
The tax character of distributions paid was as follows:
| | July 31, 2020 | July 31, 2019 |
| Ordinary Income | $7,277,415 | $ 7,070,490 |
Delayed Delivery Transactions and When-Issued Securities. During the period, the Fund transacted in securities on a delayed delivery or when-issued basis. Payment and delivery may take place after the customary settlement period for that security. The price of the underlying securities and the date when the securities will be delivered and paid for are fixed at the time the transaction is negotiated. The securities purchased on a delayed delivery or when-issued basis are identified as such in the Fund's Schedule of Investments. Losses may arise due to changes in the value of the underlying securities or if the counterparty does not perform under the contract's terms, or if the issuer does not issue the securities due to political, economic, or other factors.
Restricted Securities (including Private Placements). The Fund may invest in securities that are subject to legal or contractual restrictions on resale. These securities generally may be resold in transactions exempt from registration or to the public if the securities are registered. Disposal of these securities may involve time-consuming negotiations and expense, and prompt sale at an acceptable price may be difficult. Information regarding restricted securities is included at the end of the Fund's Schedule of Investments.
Consolidated Subsidiary. The Fund invests in certain investments through a wholly-owned subsidiary ("Subsidiary"), which may be subject to federal and state taxes upon disposition.
As of period end, the Fund held an investment of $407,679 in these Subsidiaries, representing .01% of the Fund's net assets. The financial statements have been consolidated and include accounts of the Fund and each Subsidiary. Accordingly, all inter-company transactions and balances have been eliminated.
4. Purchases and Sales of Investments.
Purchases and sales of securities, other than short-term securities and in-kind transactions, are noted in the table below.
| | Purchases ($) | Sales ($) |
| Fidelity Blue Chip Growth K6 Fund | 1,636,850,635 | 1,322,729,486 |
Unaffiliated Exchanges In-Kind. During the period, the Fund received investments and cash valued at $195,181,806 in exchange for 11,803,131 shares of the Fund. The amount of in-kind exchanges is included in share transactions in the accompanying Statement of Changes in Net Assets.
Prior Fiscal Year Unaffiliated Exchanges In-Kind. During the prior period, the Fidelity Blue Chip Growth K6 Fund received investments in exchange for shares of the Fidelity Blue Chip Growth K6 Fund. The amount of in-kind exchanges is included in share transactions in the accompanying Statement of Changes in Net Assets. For additional information of the Fidelity Blue Chip Growth K6 Fund in-kind transactions, please refer to the Fidelity Blue Chip Growth K6 Fund prior annual shareholder report.
5. Fees and Other Transactions with Affiliates.
Management Fee. Fidelity Management & Research Company LLC (the investment adviser) and its affiliates provide the Fund with investment management related services for which the Fund pays a monthly management fee that is based on an annual rate of .45% of average net assets. Under the management contract, the investment adviser or an affiliate pays all other expenses of the Fund, excluding fees and expenses of the independent Trustees, and certain miscellaneous expenses such as proxy and shareholder meeting expenses.
Brokerage Commissions. A portion of portfolio transactions were placed with brokerage firms which are affiliates of the investment adviser. Brokerage commissions are included in net realized gain (loss) and change in net unrealized appreciation (depreciation) in the Statement of Operations. The commissions paid to these affiliated firms were as follows:
| | Amount |
| Fidelity Blue Chip Growth K6 Fund | $37,455 |
Interfund Trades. Funds may purchase from or sell securities to other Fidelity Funds under procedures adopted by the Board. The procedures have been designed to ensure these interfund trades are executed in accordance with Rule 17a-7 of the 1940 Act. Interfund trades are included within the respective purchases and sales amounts shown in the Purchases and Sales of Investments note.
Other. During the period, the investment adviser reimbursed the Fund for certain losses in the amount of $16,042.
6. Committed Line of Credit.
Certain Funds participate with other funds managed by the investment adviser or an affiliate in a $4.25 billion credit facility (the "line of credit") to be utilized for temporary or emergency purposes to fund shareholder redemptions or for other short-term liquidity purposes. The participating funds have agreed to pay commitment fees on their pro-rata portion of the line of credit, which are reflected in Miscellaneous expenses on the Statement of Operations, and are as follows:
| | Amount |
| Fidelity Blue Chip Growth K6 Fund | $6,391 |
During the period, there were no borrowings on this line of credit.
7. Security Lending.
The Fund lends portfolio securities from time to time in order to earn additional income. Lending agents are used, including National Financial Services (NFS), an affiliate of the Fund. Pursuant to a securities lending agreement, NFS will receive a fee, which is capped at 9.9% of daily lending revenue, for its services as lending agent. The Fund may lend securities to certain qualified borrowers, including NFS. On the settlement date of the loan, the Fund receives collateral (in the form of U.S. Treasury obligations, letters of credit and/or cash) against the loaned securities and maintains collateral in an amount not less than 100% of the market value of the loaned securities during the period of the loan. The market value of the loaned securities is determined at the close of business of the Fund and any additional required collateral is delivered to the Fund on the next business day. The Fund or borrower may terminate the loan at any time, and if the borrower defaults on its obligation to return the securities loaned because of insolvency or other reasons, the Fund may apply collateral received from the borrower against the obligation. The Fund may experience delays and costs in recovering the securities loaned. Any cash collateral received is invested in the Fidelity Securities Lending Cash Central Fund. The value of loaned securities and cash collateral at period end are disclosed on the Fund's Statement of Assets and Liabilities. The value of securities loaned to NFS, as affiliated borrower, at period end was $278,144. Total fees paid by the Fund to NFS, as lending agent, amounted to $110,646. Security lending income represents the income earned on investing cash collateral, less rebates paid to borrowers and any lending agent fees associated with the loan, plus any premium payments received for lending certain types of securities. Net income from the Fidelity Securities Lending Cash Central Fund during the period is presented in the Statement of Operations as a component of income from Fidelity Central Funds (and includes $117,450 from securities loaned to NFS, as affiliated borrower).
8. Expense Reductions.
Commissions paid to certain brokers with whom the investment adviser, or its affiliates, places trades on behalf of the Fund include an amount in addition to trade execution, which may be rebated back to the Fund to offset certain expenses. This amount totaled $113,804 for the period. In addition, through arrangements with the Fund's custodian, credits realized as a result of certain uninvested cash balances were used to reduce the Fund's expenses by $715.
9. Other.
The Fund's organizational documents provide former and current trustees and officers with a limited indemnification against liabilities arising in connection with the performance of their duties to the Fund. In the normal course of business, the Fund may also enter into contracts that provide general indemnifications. The Fund's maximum exposure under these arrangements is unknown as this would be dependent on future claims that may be made against the Fund. The risk of material loss from such claims is considered remote.
10. Coronavirus (COVID-19) Pandemic.
An outbreak of COVID-19 first detected in China during December 2019 has since spread globally and was declared a pandemic by the World Health Organization during March 2020. Developments that disrupt global economies and financial markets, such as the COVID-19 pandemic, may magnify factors that affect the Fund's performance.
Report of Independent Registered Public Accounting Firm
To the Board of Trustees of Fidelity Securities Fund and Shareholders of Fidelity Blue Chip Growth K6 Fund
Opinion on the Financial Statements and Financial Highlights
We have audited the accompanying statement of assets and liabilities of Fidelity Blue Chip Growth K6 Fund (the "Fund"), a fund of Fidelity Securities Fund, including the schedule of investments, as of July 31, 2020, the related statement of operations for the year then ended, the statement of changes in net assets for each of the two years in the period then ended, the financial highlights for each of the three years in the period then ended and for the period from May 25, 2017 (commencement of operations) through July 31, 2017, and the related notes. In our opinion, the financial statements and financial highlights present fairly, in all material respects, the financial position of the Fund as of July 31, 2020, and the results of its operations for the year then ended, the changes in its net assets for each of the two years in the period then ended, and the financial highlights for each of the three years in the period then ended and for the period from May 25, 2017 (commencement of operations) through July 31, 2017 in conformity with accounting principles generally accepted in the United States of America.
Basis for Opinion
These financial statements and financial highlights are the responsibility of the Fund's management. Our responsibility is to express an opinion on the Fund's financial statements and financial highlights based on our audits. We are a public accounting firm registered with the Public Company Accounting Oversight Board (United States) (PCAOB) and are required to be independent with respect to the Fund in accordance with the U.S. federal securities laws and the applicable rules and regulations of the Securities and Exchange Commission and the PCAOB.
We conducted our audits in accordance with the standards of the PCAOB. Those standards require that we plan and perform the audit to obtain reasonable assurance about whether the financial statements and financial highlights are free of material misstatement, whether due to error or fraud. The Fund is not required to have, nor were we engaged to perform, an audit of its internal control over financial reporting. As part of our audits we are required to obtain an understanding of internal control over financial reporting but not for the purpose of expressing an opinion on the effectiveness of the Fund’s internal control over financial reporting. Accordingly, we express no such opinion.
Our audits included performing procedures to assess the risks of material misstatement of the financial statements and financial highlights, whether due to error or fraud, and performing procedures that respond to those risks. Such procedures included examining, on a test basis, evidence regarding the amounts and disclosures in the financial statements and financial highlights. Our audits also included evaluating the accounting principles used and significant estimates made by management, as well as evaluating the overall presentation of the financial statements and financial highlights. Our procedures included confirmation of securities owned as of July 31, 2020, by correspondence with the custodian and brokers; when replies were not received from brokers, we performed other auditing procedures. We believe that our audits provide a reasonable basis for our opinion.
/s/ Deloitte & Touche LLP
Boston, Massachusetts
September 15, 2020
We have served as the auditor of one or more of the Fidelity investment companies since 1999.
Trustees and Officers
The Trustees, Members of the Advisory Board (if any), and officers of the trust and fund, as applicable, are listed below. The Board of Trustees governs the fund and is responsible for protecting the interests of shareholders. The Trustees are experienced executives who meet periodically throughout the year to oversee the fund's activities, review contractual arrangements with companies that provide services to the fund, oversee management of the risks associated with such activities and contractual arrangements, and review the fund's performance. Except for Jonathan Chiel, each of the Trustees oversees 311 funds. Mr. Chiel oversees 174 funds.
The Trustees hold office without limit in time except that (a) any Trustee may resign; (b) any Trustee may be removed by written instrument, signed by at least two-thirds of the number of Trustees prior to such removal; (c) any Trustee who requests to be retired or who has become incapacitated by illness or injury may be retired by written instrument signed by a majority of the other Trustees; and (d) any Trustee may be removed at any special meeting of shareholders by a two-thirds vote of the outstanding voting securities of the trust. Each Trustee who is not an interested person (as defined in the 1940 Act) of the trust and the fund is referred to herein as an Independent Trustee. Each Independent Trustee shall retire not later than the last day of the calendar year in which his or her 75th birthday occurs. The Independent Trustees may waive this mandatory retirement age policy with respect to individual Trustees. Officers and Advisory Board Members hold office without limit in time, except that any officer or Advisory Board Member may resign or may be removed by a vote of a majority of the Trustees at any regular meeting or any special meeting of the Trustees. Except as indicated, each individual has held the office shown or other offices in the same company for the past five years.
The fund’s Statement of Additional Information (SAI) includes more information about the Trustees. To request a free copy, call Fidelity at 1-800-835-5092.
Experience, Skills, Attributes, and Qualifications of the Trustees. The Governance and Nominating Committee has adopted a statement of policy that describes the experience, qualifications, attributes, and skills that are necessary and desirable for potential Independent Trustee candidates (Statement of Policy). The Board believes that each Trustee satisfied at the time he or she was initially elected or appointed a Trustee, and continues to satisfy, the standards contemplated by the Statement of Policy. The Governance and Nominating Committee also engages professional search firms to help identify potential Independent Trustee candidates who have the experience, qualifications, attributes, and skills consistent with the Statement of Policy. From time to time, additional criteria based on the composition and skills of the current Independent Trustees, as well as experience or skills that may be appropriate in light of future changes to board composition, business conditions, and regulatory or other developments, have also been considered by the professional search firms and the Governance and Nominating Committee. In addition, the Board takes into account the Trustees' commitment and participation in Board and committee meetings, as well as their leadership of standing and ad hoc committees throughout their tenure.
In determining that a particular Trustee was and continues to be qualified to serve as a Trustee, the Board has considered a variety of criteria, none of which, in isolation, was controlling. The Board believes that, collectively, the Trustees have balanced and diverse experience, qualifications, attributes, and skills, which allow the Board to operate effectively in governing the fund and protecting the interests of shareholders. Information about the specific experience, skills, attributes, and qualifications of each Trustee, which in each case led to the Board's conclusion that the Trustee should serve (or continue to serve) as a trustee of the fund, is provided below.
Board Structure and Oversight Function. Robert A. Lawrence is an interested person and currently serves as Acting Chairman. The Trustees have determined that an interested Chairman is appropriate and benefits shareholders because an interested Chairman has a personal and professional stake in the quality and continuity of services provided to the fund. Independent Trustees exercise their informed business judgment to appoint an individual of their choosing to serve as Chairman, regardless of whether the Trustee happens to be independent or a member of management. The Independent Trustees have determined that they can act independently and effectively without having an Independent Trustee serve as Chairman and that a key structural component for assuring that they are in a position to do so is for the Independent Trustees to constitute a substantial majority for the Board. The Independent Trustees also regularly meet in executive session. Ned C. Lautenbach and David M. Thomas serve as Co-Lead Independent Trustees and as such each (i) acts as a liaison between the Independent Trustees and management with respect to matters important to the Independent Trustees and (ii) with management prepares agendas for Board meetings.
Fidelity® funds are overseen by different Boards of Trustees. The fund's Board oversees Fidelity's high income and certain equity funds, and other Boards oversee Fidelity's investment-grade bond, money market, asset allocation, and other equity funds. The asset allocation funds may invest in Fidelity® funds overseen by the fund's Board. The use of separate Boards, each with its own committee structure, allows the Trustees of each group of Fidelity® funds to focus on the unique issues of the funds they oversee, including common research, investment, and operational issues. On occasion, the separate Boards establish joint committees to address issues of overlapping consequences for the Fidelity® funds overseen by each Board.
The Trustees operate using a system of committees to facilitate the timely and efficient consideration of all matters of importance to the Trustees, the fund, and fund shareholders and to facilitate compliance with legal and regulatory requirements and oversight of the fund's activities and associated risks. The Board, acting through its committees, has charged FMR and its affiliates with (i) identifying events or circumstances the occurrence of which could have demonstrably adverse effects on the fund's business and/or reputation; (ii) implementing processes and controls to lessen the possibility that such events or circumstances occur or to mitigate the effects of such events or circumstances if they do occur; and (iii) creating and maintaining a system designed to evaluate continuously business and market conditions in order to facilitate the identification and implementation processes described in (i) and (ii) above. Because the day-to-day operations and activities of the fund are carried out by or through FMR, its affiliates, and other service providers, the fund's exposure to risks is mitigated but not eliminated by the processes overseen by the Trustees. While each of the Board's committees has responsibility for overseeing different aspects of the fund's activities, oversight is exercised primarily through the Operations, Audit, and Compliance Committees. Appropriate personnel, including but not limited to the fund's Chief Compliance Officer (CCO), FMR's internal auditor, the independent accountants, the fund's Treasurer and portfolio management personnel, make periodic reports to the Board's committees, as appropriate, including an annual review of Fidelity's risk management program for the Fidelity® funds. The responsibilities of each standing committee, including their oversight responsibilities, are described further under "Standing Committees of the Trustees."
Interested Trustees*:
Correspondence intended for a Trustee who is an interested person may be sent to Fidelity Investments, 245 Summer Street, Boston, Massachusetts 02210.
Name, Year of Birth; Principal Occupations and Other Relevant Experience+
Jonathan Chiel (1957)
Year of Election or Appointment: 2016
Trustee
Mr. Chiel also serves as Trustee of other Fidelity® funds. Mr. Chiel is Executive Vice President and General Counsel for FMR LLC (diversified financial services company, 2012-present). Previously, Mr. Chiel served as general counsel (2004-2012) and senior vice president and deputy general counsel (2000-2004) for John Hancock Financial Services; a partner with Choate, Hall & Stewart (1996-2000) (law firm); and an Assistant United States Attorney for the United States Attorney’s Office of the District of Massachusetts (1986-95), including Chief of the Criminal Division (1993-1995). Mr. Chiel is a director on the boards of the Boston Bar Foundation and the Maimonides School.
Robert A. Lawrence (1952)
Year of Election or Appointment: 2020
Trustee
Acting Chairman of the Board of Trustees
Mr. Lawrence also serves as Trustee of other funds. Previously, Mr. Lawrence served as a Member of the Advisory Board of certain funds. Prior to his retirement in 2008, Mr. Lawrence served as Vice President of certain Fidelity® funds (2006-2008), Senior Vice President, Head of High Income Division of Fidelity Management & Research Company (investment adviser firm, 2006-2008), and President of Fidelity Strategic Investments (investment adviser firm, 2002-2005).
* Determined to be an “Interested Trustee” by virtue of, among other things, his or her affiliation with the trust or various entities under common control with FMR.
+ The information includes the Trustee's principal occupation during the last five years and other information relating to the experience, attributes, and skills relevant to the Trustee's qualifications to serve as a Trustee, which led to the conclusion that the Trustee should serve as a Trustee for the fund.
Independent Trustees:
Correspondence intended for an Independent Trustee may be sent to Fidelity Investments, P.O. Box 55235, Boston, Massachusetts 02205-5235.
Name, Year of Birth; Principal Occupations and Other Relevant Experience+
Dennis J. Dirks (1948)
Year of Election or Appointment: 2005
Trustee
Mr. Dirks also serves as Trustee of other Fidelity® funds. Prior to his retirement in May 2003, Mr. Dirks served as Chief Operating Officer and as a member of the Board of The Depository Trust & Clearing Corporation (financial markets infrastructure), President, Chief Operating Officer and a member of the Board of The Depository Trust Company (DTC), President and a member of the Board of the National Securities Clearing Corporation (NSCC), Chief Executive Officer and a member of the Board of the Government Securities Clearing Corporation and Chief Executive Officer and a member of the Board of the Mortgage-Backed Securities Clearing Corporation. Mr. Dirks currently serves as a member of the Finance Committee (2016-present) and Board (2017-present) and is Treasurer (2018-present) of the Asolo Repertory Theatre.
Donald F. Donahue (1950)
Year of Election or Appointment: 2018
Trustee
Mr. Donahue also serves as Trustee of other Fidelity® funds. Mr. Donahue serves as President and Chief Executive Officer of Miranda Partners, LLC (risk consulting for the financial services industry, 2012-present). Previously, Mr. Donahue served as Chief Executive Officer (2006-2012), Chief Operating Officer (2003-2006) and Managing Director, Customer Marketing and Development (1999-2003) of The Depository Trust & Clearing Corporation (financial markets infrastructure). Mr. Donahue currently serves as a member (2007-present) and Co-Chairman (2016-present) of the Board of United Way of New York, a member of the Board of NYC Leadership Academy (2012-present) and a member of the Board of Advisors of Ripple Labs, Inc. (financial services, 2015-present). Mr. Donahue previously served as a member of the Advisory Board of certain Fidelity® funds (2015-2018).
Vicki L. Fuller (1957)
Year of Election or Appointment: 2020
Trustee
Ms. Fuller also serves as Trustee of other Fidelity® funds. Previously, Ms. Fuller served as a member of the Advisory Board of certain Fidelity® funds (2018-2020), Chief Investment Officer of the New York State Common Retirement Fund (2012-2018) and held a variety of positions at AllianceBernstein L.P. (global asset management, 1985-2012), including Managing Director (2006-2012) and Senior Vice President and Senior Portfolio Manager (2001-2006). Ms. Fuller currently serves as a member of the Board, Audit Committee and Nominating and Governance Committee of The Williams Companies, Inc. (natural gas infrastructure, 2018-present) and as a member of the Board of Treliant, LLC (consulting, 2019-present).
Patricia L. Kampling (1959)
Year of Election or Appointment: 2020
Trustee
Ms. Kampling also serves as Trustee of other Fidelity® funds. Prior to her retirement, Ms. Kampling served as Chairman of the Board and Chief Executive Officer (2012-2019), President and Chief Operating Officer (2011-2012) and Executive Vice President and Chief Financial Officer (2010-2011) of Alliant Energy Corporation. Ms. Kampling currently serves as a member of the Board, Compensation Committee and Executive Committee and as Chair of the Audit Committee of Briggs & Stratton Corporation (manufacturing, 2011-present) and as a member of the Board, Audit, Finance and Risk Committee and Safety, Environmental, Technology and Operations Committee of American Water Works Company, Inc. (utilities company, 2019-present). In addition, Ms. Kampling currently serves as a member of the Board of the Nature Conservancy, Wisconsin Chapter (2019-present). Previously, Ms. Kampling served as a Member of the Advisory Board of certain Fidelity® funds (2020), a member of the Board of Interstate Power and Light Company (2012-2019) and Wisconsin Power and Light Company (2012-2019) (each a subsidiary of Alliant Energy Corporation) and as a member of the Board and Workforce Development Committee of the Business Roundtable (2018-2019).
Alan J. Lacy (1953)
Year of Election or Appointment: 2008
Trustee
Mr. Lacy also serves as Trustee of other Fidelity® funds. Previously, Mr. Lacy served as Senior Adviser (2007-2014) of Oak Hill Capital Partners, L.P. (private equity), Chief Executive Officer (2005) and Vice Chairman (2005-2006) of Sears Holdings Corporation (retail), Chief Executive Officer and Chairman of the Board of Sears, Roebuck and Co. (retail, 2000-2005), Chairman (2014-2017) and a member of the Board (2010-2017) of Dave & Buster’s Entertainment, Inc. (restaurant and entertainment complexes) and a member of the Board of Bristol-Myers Squibb Company (global pharmaceuticals, 2008-2020). Mr. Lacy currently serves as a Trustee of the California Chapter of The Nature Conservancy (2015-present) and a member of the Board of the Center for Advanced Study in the Behavioral Sciences at Stanford University (2015-present).
Ned C. Lautenbach (1944)
Year of Election or Appointment: 2000
Trustee
Co-Lead Independent Trustee
Mr. Lautenbach also serves as Trustee of other Fidelity® funds. Mr. Lautenbach currently serves as Chair of the Board of Governors, State University System of Florida (2013-present) and is a member of the Council on Foreign Relations (1994-present). He is also a member and has in the past served as Chairman of the Board of Directors of Artis-Naples (2012-present). Previously, Mr. Lautenbach served as a member and then Lead Director of the Board of Directors of Eaton Corporation (diversified industrial, 1997-2016). He was also a Partner at Clayton, Dubilier & Rice, LLC (private equity investment, 1998-2010); as well as Director of Sony Corporation (2006-2007). In addition, Mr. Lautenbach had a 30-year career with IBM (technology company), during which time he served as Senior Vice President and as a member of the Corporate Executive Committee (1968-1998).
Joseph Mauriello (1944)
Year of Election or Appointment: 2008
Trustee
Mr. Mauriello also serves as Trustee of other Fidelity® funds. Prior to his retirement in January 2006, Mr. Mauriello served in numerous senior management positions including Deputy Chairman and Chief Operating Officer (2004-2005), and Vice Chairman of Financial Services (2002-2004) of KPMG LLP US (professional services, 1965-2005). Mr. Mauriello currently serves as a member of the Independent Directors Council Governing Council (2015-present). Previously, Mr. Mauriello served as a member of the Board of XL Group plc. (global insurance and re-insurance, 2006-2018).
Cornelia M. Small (1944)
Year of Election or Appointment: 2005
Trustee
Ms. Small also serves as Trustee of other Fidelity® funds. Previously, Ms. Small served as Chief Investment Officer, Director of Global Equity Investments and a member of Scudder, Stevens & Clark and Scudder Kemper Investments. Ms. Small previously served as a member of the Board (2009-2019) and Chair of the Investment Committee (2010-2019) of the Teagle Foundation and a member of the Investment Committee of the Berkshire Taconic Community Foundation (2008-2019).
Garnett A. Smith (1947)
Year of Election or Appointment: 2018
Trustee
Mr. Smith also serves as Trustee of other Fidelity® funds. Prior to his retirement, Mr. Smith served as Chairman and Chief Executive Officer (1990-1997) and President (1986-1990) of Inbrand Corp. (manufacturer of personal absorbent products). Prior to his employment with Inbrand Corp., he was employed by a retail fabric chain and North Carolina National Bank (now Bank of America). Mr. Smith previously served as a member of the Advisory Board of certain Fidelity® funds (2012-2013).
David M. Thomas (1949)
Year of Election or Appointment: 2008
Trustee
Co-Lead Independent Trustee
Mr. Thomas also serves as Trustee of other Fidelity® funds. Previously, Mr. Thomas served as Executive Chairman (2005-2006) and Chairman and Chief Executive Officer (2000-2005) of IMS Health, Inc. (pharmaceutical and healthcare information solutions). Mr. Thomas currently serves as Non-Executive Chairman of the Board of Fortune Brands Home and Security (home and security products, 2011-present), and a member of the Board (2004-present) and Presiding Director (2013-present) of Interpublic Group of Companies, Inc. (marketing communication).
Susan Tomasky (1953)
Year of Election or Appointment: 2020
Trustee
Ms. Tomasky also serves as Trustee of other Fidelity® funds. Prior to her retirement, Ms. Tomasky served in various executive officer positions at American Electric Power Company, Inc. (1998-2011), including most recently as President of AEP Transmission (2007-2011). Ms. Tomasky currently serves as a member of the Board and Sustainability Committee and as Chair of the Audit Committee of Marathon Petroleum Corporation (2018-present) and as a member of the Board, Corporate Governance Committee and Organization and Compensation Committee and as Chair of the Audit Committee of Public Service Enterprise Group, Inc. (utilities company, 2012-present). In addition, Ms. Tomasky currently serves as a member of the Board of the Columbus Regional Airport Authority (2007-present), as a member of the Board of the Royal Shakespeare Company – America (2009-present), as a member of the Board of the Columbus Association for the Performing Arts (2011-present) and as a member of the Board of Kenyon College (2016-present). Previously, Ms. Tomasky served as a Member of the Advisory Board of certain Fidelity® funds (2020), a member of the Board (2011-2019) and as Lead Independent Director (2015-2018) of Andeavor Corporation (previously Tesoro Corporation) (independent oil refiner and marketer) and as a member of the Board of Summit Midstream Partners LP (energy, 2012-2018).
Michael E. Wiley (1950)
Year of Election or Appointment: 2020
Trustee
Mr. Wiley also serves as Trustee of other Fidelity® funds. Previously, Mr. Wiley served as a member of the Advisory Board of certain Fidelity® funds (2018-2020), Chairman, President and CEO of Baker Hughes, Inc. (oilfield services, 2000-2004). Mr. Wiley also previously served as a member of the Board of Andeavor Corporation (independent oil refiner and marketer, 2005-2018), a member of the Board of Andeavor Logistics LP (natural resources logistics, 2015-2018) and a member of the Board of High Point Resources (exploration and production, 2005-2020).
+ The information includes the Trustee's principal occupation during the last five years and other information relating to the experience, attributes, and skills relevant to the Trustee's qualifications to serve as a Trustee, which led to the conclusion that the Trustee should serve as a Trustee for the fund.
Advisory Board Members and Officers:
Correspondence intended for a Member of the Advisory Board (if any) may be sent to Fidelity Investments, P.O. Box 55235, Boston, Massachusetts 02205-5235. Correspondence intended for an officer or Peter S. Lynch may be sent to Fidelity Investments, 245 Summer Street, Boston, Massachusetts 02210. Officers appear below in alphabetical order.
Name, Year of Birth; Principal Occupation
Peter S. Lynch (1944)
Year of Election or Appointment: 2003
Member of the Advisory Board
Mr. Lynch also serves as a Member of the Advisory Board of other Fidelity® funds. Mr. Lynch is Vice Chairman and a Director of Fidelity Management & Research Company LLC (investment adviser firm). In addition, Mr. Lynch serves as a Trustee of Boston College and as the Chairman of the Inner-City Scholarship Fund. Previously, Mr. Lynch served as Vice Chairman and a Director of FMR Co., Inc. (investment adviser firm) and on the Special Olympics International Board of Directors (1997-2006).
Elizabeth Paige Baumann (1968)
Year of Election or Appointment: 2017
Anti-Money Laundering (AML) Officer
Ms. Baumann also serves as AML Officer of other funds. She is Chief AML Officer (2012-present) and Senior Vice President (2014-present) of FMR LLC (diversified financial services company) and is an employee of Fidelity Investments. Previously, Ms. Baumann served as AML Officer of certain funds (2017-2019), as AML Officer of the funds (2012-2016), and Vice President (2007-2014) and Deputy Anti-Money Laundering Officer (2007-2012) of FMR LLC.
Craig S. Brown (1977)
Year of Election or Appointment: 2019
Assistant Treasurer
Mr. Brown also serves as Assistant Treasurer of other funds. Mr. Brown is an employee of Fidelity Investments (2013-present).
John J. Burke III (1964)
Year of Election or Appointment: 2018
Chief Financial Officer
Mr. Burke also serves as Chief Financial Officer of other funds. Mr. Burke serves as Head of Investment Operations for Fidelity Fund and Investment Operations (2018-present) and is an employee of Fidelity Investments (1998-present). Previously Mr. Burke served as head of Asset Management Investment Operations (2012-2018).
William C. Coffey (1969)
Year of Election or Appointment: 2019
Assistant Secretary
Mr. Coffey also serves as Assistant Secretary of other funds. He is Senior Vice President and Deputy General Counsel of FMR LLC (diversified financial services company, 2010-present), and is an employee of Fidelity Investments. Previously, Mr. Coffey served as Secretary and CLO of certain funds (2018-2019); CLO, Secretary, and Senior Vice President of Fidelity Management & Research Company and FMR Co., Inc. (investment adviser firms, 2018-2019); Secretary of Fidelity SelectCo, LLC and Fidelity Investments Money Management, Inc. (investment adviser firms, 2018-2019); CLO of Fidelity Management & Research (Hong Kong) Limited, FMR Investment Management (UK) Limited, and Fidelity Management & Research (Japan) Limited (investment adviser firms, 2018-2019); and Assistant Secretary of certain funds (2009-2018).
Timothy M. Cohen (1969)
Year of Election or Appointment: 2018
Vice President
Mr. Cohen also serves as Vice President of other funds. Mr. Cohen serves as Co-Head of Equity (2018-present), a Director of Fidelity Management & Research (Japan) Limited (investment adviser firm, 2016-present), and is an employee of Fidelity Investments. Previously, Mr. Cohen served as Executive Vice President of Fidelity SelectCo, LLC (2019), Head of Global Equity Research (2016-2018), Chief Investment Officer - Equity and a Director of Fidelity Management & Research (U.K.) Inc. (investment adviser firm, 2013-2015) and as a Director of Fidelity Management & Research (Hong Kong) Limited (investment adviser firm, 2017).
Jonathan Davis (1968)
Year of Election or Appointment: 2010
Assistant Treasurer
Mr. Davis also serves as Assistant Treasurer of other funds. Mr. Davis serves as Assistant Treasurer of FMR Capital, Inc. (2017-present) and is an employee of Fidelity Investments. Previously, Mr. Davis served as Vice President and Associate General Counsel of FMR LLC (diversified financial services company, 2003-2010).
Laura M. Del Prato (1964)
Year of Election or Appointment: 2018
Assistant Treasurer
Ms. Del Prato also serves as an officer of other funds. Ms. Del Prato is an employee of Fidelity Investments (2017-present). Previously, Ms. Del Prato served as President and Treasurer of The North Carolina Capital Management Trust: Cash Portfolio and Term Portfolio (2018-2020). Prior to joining Fidelity Investments, Ms. Del Prato served as a Managing Director and Treasurer of the JPMorgan Mutual Funds (2014-2017). Prior to JPMorgan, Ms. Del Prato served as a partner at Cohen Fund Audit Services (accounting firm, 2012-2013) and KPMG LLP (accounting firm, 2004-2012).
Colm A. Hogan (1973)
Year of Election or Appointment: 2020
Assistant Treasurer
Mr. Hogan also serves as an officer of other funds. Mr. Hogan serves as Assistant Treasurer of FMR Capital, Inc. (2017-present) and is an employee of Fidelity Investments (2005-present). Previously, Mr. Hogan served as Deputy Treasurer of certain Fidelity® funds (2016-2020) and Assistant Treasurer of certain Fidelity® funds (2016-2018).
Pamela R. Holding (1964)
Year of Election or Appointment: 2018
Vice President
Ms. Holding also serves as Vice President of other funds. Ms. Holding serves as Co-Head of Equity (2018-present) and is an employee of Fidelity Investments (2013-present). Previously, Ms. Holding served as Executive Vice President of Fidelity SelectCo, LLC (2019) and as Chief Investment Officer of Fidelity Institutional Asset Management (2013-2018).
Cynthia Lo Bessette (1969)
Year of Election or Appointment: 2019
Secretary and Chief Legal Officer (CLO)
Ms. Lo Bessette also serves as an officer of other funds. Ms. Lo Bessette serves as CLO, Secretary, and Senior Vice President of Fidelity Management & Research Company LLC (investment adviser firm, 2019-present); and CLO of Fidelity Management & Research (Hong Kong) Limited, FMR Investment Management (UK) Limited, and Fidelity Management & Research (Japan) Limited (investment adviser firms, 2019-present). She is a Senior Vice President and Deputy General Counsel of FMR LLC (diversified financial services company, 2019-present), and is an employee of Fidelity Investments. Previously, Ms. Lo Bessette served as CLO, Secretary, and Senior Vice President of FMR Co., Inc. (investment adviser firm, 2019); Secretary of Fidelity SelectCo, LLC and Fidelity Investments Money Management, Inc. (investment adviser firms, 2019). Prior to joining Fidelity Investments, Ms. Lo Bessette was Executive Vice President, General Counsel (2016-2019) and Senior Vice President, Deputy General Counsel (2015-2016) of OppenheimerFunds (investment management company) and Deputy Chief Legal Officer (2013-2015) of Jennison Associates LLC (investment adviser firm).
Chris Maher (1972)
Year of Election or Appointment: 2020
Deputy Treasurer
Mr. Maher also serves as an officer of other funds. Mr. Maher serves as Assistant Treasurer of FMR Capital, Inc. (2017-present), and is an employee of Fidelity Investments (2008-present). Previously, Mr. Maher served as Assistant Treasurer of certain funds (2013-2020); Vice President of Asset Management Compliance (2013), Vice President of the Program Management Group of FMR (investment adviser firm, 2010-2013), and Vice President of Valuation Oversight (2008-2010).
Jason P. Pogorelec (1975)
Year of Election or Appointment: 2020
Chief Compliance Officer
Mr. Pogorelec also serves as Chief Compliance Officer of other funds. Mr. Pogorelec is a senior Vice President of Asset Management Compliance for Fidelity Investments and is an employee of Fidelity Investments (2006-present). Previously, Mr. Pogorelec served as Vice President, Associate General Counsel for Fidelity Investments (2010-2020) and Assistant Secretary of certain Fidelity funds (2015-2020).
Stacie M. Smith (1974)
Year of Election or Appointment: 2016
President and Treasurer
Ms. Smith also serves as an officer of other funds. Ms. Smith serves as Assistant Treasurer of FMR Capital, Inc. (2017-present), is an employee of Fidelity Investments (2009-present), and has served in other fund officer roles. Prior to joining Fidelity Investments, Ms. Smith served as Senior Audit Manager of Ernst & Young LLP (accounting firm, 1996-2009). Previously, Ms. Smith served as Assistant Treasurer (2013-2019) and Deputy Treasurer (2013-2016) of certain Fidelity® funds.
Marc L. Spector (1972)
Year of Election or Appointment: 2016
Assistant Treasurer
Mr. Spector also serves as an officer of other funds. Mr. Spector serves as Assistant Treasurer of FMR Capital, Inc. (2017-present) and is an employee of Fidelity Investments (2016-present). Prior to joining Fidelity Investments, Mr. Spector served as Director at the Siegfried Group (accounting firm, 2013-2016), and prior to Siegfried Group as audit senior manager at Deloitte & Touche LLP (accounting firm, 2005-2013).
Jim Wegmann (1979)
Year of Election or Appointment: 2019
Assistant Treasurer
Mr. Wegmann also serves as Assistant Treasurer of other funds. Mr. Wegmann is an employee of Fidelity Investments (2011-present).
Shareholder Expense Example
As a shareholder, you incur two types of costs: (1) transaction costs, which may include sales charges (loads) on purchase payments or redemption proceeds, as applicable and (2) ongoing costs, which generally include management fees, distribution and/or service (12b-1) fees and other Fund expenses. This Example is intended to help you understand your ongoing costs (in dollars) of investing in a fund and to compare these costs with the ongoing costs of investing in other mutual funds.
The Example is based on an investment of $1,000 invested at the beginning of the period and held for the entire period (February 1, 2020 to July 31, 2020).
Actual Expenses
The first line of the accompanying table provides information about actual account values and actual expenses. You may use the information in this line, together with the amount you invested, to estimate the expenses that you paid over the period. Simply divide your account value by $1,000.00 (for example, an $8,600 account value divided by $1,000.00 = 8.6), then multiply the result by the number in the first line for a class/Fund under the heading entitled "Expenses Paid During Period" to estimate the expenses you paid on your account during this period. If any fund is a shareholder of any underlying mutual funds or exchange-traded funds (ETFs) (the Underlying Funds), such fund indirectly bears its proportional share of the expenses of the Underlying Funds in addition to the direct expenses incurred presented in the table. These fees and expenses are not included in the annualized expense ratio used to calculate the expense estimate in the table below.
Hypothetical Example for Comparison Purposes
The second line of the accompanying table provides information about hypothetical account values and hypothetical expenses based on the actual expense ratio and an assumed rate of return of 5% per year before expenses, which is not the actual return. The hypothetical account values and expenses may not be used to estimate the actual ending account balance or expenses you paid for the period. You may use this information to compare the ongoing costs of investing in the Fund and other funds. To do so, compare this 5% hypothetical example with the 5% hypothetical examples that appear in the shareholder reports of the other funds. If any fund is a shareholder of any Underlying Funds, such fund indirectly bears its proportional share of the expenses of the Underlying Funds in addition to the direct expenses as presented in the table. These fees and expenses are not included in the annualized expense ratio used to calculate the expense estimate in the table below.
Please note that the expenses shown in the table are meant to highlight your ongoing costs only and do not reflect any transaction costs. Therefore, the second line of the table is useful in comparing ongoing costs only, and will not help you determine the relative total costs of owning different funds.
| | Annualized Expense Ratio-A | Beginning
Account Value
February 1, 2020 | Ending
Account Value
July 31, 2020 | Expenses Paid
During Period-B
February 1, 2020
to July 31, 2020 |
| Fidelity Blue Chip Growth K6 Fund | .45% | | | |
| Actual | | $1,000.00 | $1,242.40 | $2.51 |
| Hypothetical-C | | $1,000.00 | $1,022.63 | $2.26 |
A Annualized expense ratio reflects expenses net of applicable fee waivers.
B Expenses are equal to the annualized expense ratio, multiplied by the average account value over the period, multiplied by 182/ 366 (to reflect the one-half year period). The fees and expenses of any Underlying Funds are not included in each annualized expense ratio.
C 5% return per year before expenses
Distributions (Unaudited)
The fund designates 100% of the dividends distributed during the fiscal year as qualifying for the dividends–received deduction for corporate shareholders.
The fund designates 100% of the dividends distributed during the fiscal year as amounts which may be taken into account as a dividend for the purposes of the maximum rate under section 1(h)(11) of the Internal Revenue Code.
The fund will notify shareholders in January 2021 of amounts for use in preparing 2020 income tax returns.
Liquidity Risk Management Program
The Securities and Exchange Commission adopted Rule 22e-4 under the Investment Company Act of 1940 (the Liquidity Rule) to promote effective liquidity risk management throughout the open-end investment company industry, thereby reducing the risk that funds will be unable to meet their redemption obligations and mitigating dilution of the interests of fund shareholders.
The Fund has adopted and implemented a liquidity risk management program pursuant to the Liquidity Rule (the Program) effective December 1, 2018. The Program is reasonably designed to assess and manage the Fund’s liquidity risk and to comply with the requirements of the Liquidity Rule. The Fund’s Board of Trustees (the Board) has designated the Fund’s investment adviser as administrator of the Program. The Fidelity advisers have established a Liquidity Risk Management Committee (the LRM Committee) to manage the Program for each of the Fidelity Funds. The LRM Committee monitors the adequacy and effectiveness of implementation of the Program and on a periodic basis assesses each Fund’s liquidity risk based on a variety of factors including (1) the Fund’s investment strategy, (2) portfolio liquidity and cash flow projections during normal and reasonably foreseeable stressed conditions, (3) shareholder redemptions, (4) borrowings and other funding sources and (5) in the case of exchange-traded funds, certain additional factors including the effect of the Fund’s prices and spreads, market participants, and basket compositions on the overall liquidity of the Fund’s portfolio, as applicable.
In accordance with the Program, each of the Fund’s portfolio investments is classified into one of four liquidity categories described below based on a determination of a reasonable expectation for how long it would take to convert the investment to cash (or sell or dispose of the investment) without significantly changing its market value.
- Highly liquid investments – cash or convertible to cash within three business days or less
- Moderately liquid investments – convertible to cash in three to seven calendar days
- Less liquid investments – can be sold or disposed of, but not settled, within seven calendar days
- Illiquid investments – cannot be sold or disposed of within seven calendar days
Liquidity classification determinations take into account a variety of factors including various market, trading and investment-specific considerations, as well as market depth, and generally utilize analysis from a third-party liquidity metrics service.
The Liquidity Rule places a 15% limit on a fund’s illiquid investments and requires funds that do not primarily hold assets that are highly liquid investments to determine and maintain a minimum percentage of the fund’s net assets to be invested in highly liquid investments (highly liquid investment minimum or HLIM). The Program includes provisions reasonably designed to comply with the 15% limit on illiquid investments and for determining, periodically reviewing and complying with the HLIM requirement as applicable.
At a recent meeting of the Fund’s Board of Trustees, the LRM Committee provided a written report to the Board pertaining to the operation, adequacy, and effectiveness of implementation of the Program for the annual period from December 1, 2018 through November 30, 2019. The report concluded that the Program has been implemented and is operating effectively and is reasonably designed to assess and manage the Fund’s liquidity risk.
Proxy Voting Results
A special meeting of shareholders was held on June 9, 2020. The results of votes taken among shareholders on the proposal before them are reported below. Each vote reported represents one dollar of net asset value held on the record date for the meeting.
PROPOSAL 1
To elect a Board of Trustees.
| | # of
Votes | % of
Votes |
| Dennis J. Dirks |
| Affirmative | 43,167,428,219.785 | 94.885 |
| Withheld | 2,327,070,930.034 | 5.115 |
| TOTAL | 45,494,499,149.820 | 100.000 |
| Donald F. Donahue |
| Affirmative | 43,161,668,935.467 | 94.872 |
| Withheld | 2,333,065,287.611 | 5.128 |
| TOTAL | 45,494,734,223.077 | 100.000 |
| Bettina Doulton |
| Affirmative | 43,304,465,213.969 | 95.186 |
| Withheld | 2,190,010,062.903 | 4.814 |
| TOTAL | 45,494,475,276.872 | 100.000 |
| Vicki L. Fuller |
| Affirmative | 43,380,442,631.493 | 95.353 |
| Withheld | 2,114,180,614.639 | 4.647 |
| TOTAL | 45,494,623,246.132 | 100.000 |
| Patricia L. Kampling |
| Affirmative | 43,128,008,796.761 | 94.798 |
| Withheld | 2,366,685,422.999 | 5.202 |
| TOTAL | 45,494,694,219.760 | 100.000 |
| Alan J. Lacy |
| Affirmative | 42,904,065,046.958 | 94.305 |
| Withheld | 2,590,717,567.229 | 5.695 |
| TOTAL | 45,494,782,614.187 | 100.000 |
| Ned C. Lautenbach |
| Affirmative | 42,802,778,827.017 | 94.083 |
| Withheld | 2,692,003,787.170 | 5.917 |
| TOTAL | 45,494,782,614.187 | 100.000 |
| Robert A. Lawrence |
| Affirmative | 42,971,258,294.203 | 94.453 |
| Withheld | 2,523,524,319.984 | 5.547 |
| TOTAL | 45,494,782,614.187 | 100.000 |
| Joseph Mauriello |
| Affirmative | 42,874,562,778.490 | 94.241 |
| Withheld | 2,620,171,874.731 | 5.759 |
| TOTAL | 45,494,734,653.220 | 100.000 |
| Cornelia M. Small |
| Affirmative | 43,029,040,988.063 | 94.580 |
| Withheld | 2,465,741,626.124 | 5.420 |
| TOTAL | 45,494,782,614.187 | 100.000 |
| Garnett A. Smith |
| Affirmative | 42,892,814,945.159 | 94.281 |
| Withheld | 2,601,967,669.028 | 5.719 |
| TOTAL | 45,494,782,614.187 | 100.000 |
| David M. Thomas |
| Affirmative | 42,936,080,036.111 | 94.376 |
| Withheld | 2,558,702,578.076 | 5.624 |
| TOTAL | 45,494,782,614.187 | 100.000 |
| Susan Tomasky |
| Affirmative | 43,147,934,105.796 | 94.842 |
| Withheld | 2,346,571,066.028 | 5.158 |
| TOTAL | 45,494,782,614.187 | 100.000 |
| Michael E. Wiley |
| Affirmative | 42,885,333,102.972 | 94.264 |
| Withheld | 2,609,449,511.215 | 5.736 |
| TOTAL | 45,494,782,614.187 | 100.000 |
|
| Proposal 1 reflects trust wide proposal and voting results. |
BCFK6-ANN-0920
1.9884007.103
Fidelity® Small Cap Growth K6 Fund
Annual Report
July 31, 2020
See the inside front cover for important information about access to your fund’s shareholder reports.
Beginning on January 1, 2021, as permitted by regulations adopted by the Securities and Exchange Commission, paper copies of a fund’s shareholder reports will no longer be sent by mail, unless you specifically request paper copies of the reports from the fund or from your financial intermediary, such as a financial advisor, broker-dealer or bank. Instead, the reports will be made available on a website, and you will be notified by mail each time a report is posted and provided with a website link to access the report.
If you already elected to receive shareholder reports electronically, you will not be affected by this change and you need not take any action. You may elect to receive shareholder reports and other communications from a fund electronically, by contacting your financial intermediary. For Fidelity customers, visit Fidelity's web site or call Fidelity using the contact information listed below.
You may elect to receive all future reports in paper free of charge. If you wish to continue receiving paper copies of your shareholder reports, you may contact your financial intermediary or, if you are a Fidelity customer, visit Fidelity’s website, or call Fidelity at the applicable toll-free number listed below. Your election to receive reports in paper will apply to all funds held with the fund complex/your financial intermediary.
| Account Type | Website | Phone Number |
| Brokerage, Mutual Fund, or Annuity Contracts: | fidelity.com/mailpreferences | 1-800-343-3548 |
| Employer Provided Retirement Accounts: | netbenefits.fidelity.com/preferences (choose 'no' under Required Disclosures to continue to print) | 1-800-343-0860 |
| Advisor Sold Accounts Serviced Through Your Financial Intermediary: | Contact Your Financial Intermediary | Your Financial Intermediary's phone number |
| Advisor Sold Accounts Serviced by Fidelity: | institutional.fidelity.com | 1-877-208-0098 |
Contents
To view a fund's proxy voting guidelines and proxy voting record for the 12-month period ended June 30, visit http://www.fidelity.com/proxyvotingresults or visit the Securities and Exchange Commission's (SEC) web site at http://www.sec.gov.
You may also call 1-800-835-5092 to request a free copy of the proxy voting guidelines.
Standard & Poor's, S&P and S&P 500 are registered service marks of The McGraw-Hill Companies, Inc. and have been licensed for use by Fidelity Distributors Corporation.
Other third-party marks appearing herein are the property of their respective owners.
All other marks appearing herein are registered or unregistered trademarks or service marks of FMR LLC or an affiliated company. © 2020 FMR LLC. All rights reserved.
This report and the financial statements contained herein are submitted for the general information of the shareholders of the Fund. This report is not authorized for distribution to prospective investors in the Fund unless preceded or accompanied by an effective prospectus.
A fund files its complete schedule of portfolio holdings with the SEC for the first and third quarters of each fiscal year on Form N-PORT. Forms N-PORT are available on the SEC’s web site at http://www.sec.gov. A fund's Forms N-PORT may be reviewed and copied at the SEC’s Public Reference Room in Washington, DC. Information regarding the operation of the SEC's Public Reference Room may be obtained by calling 1-800-SEC-0330.
For a complete list of a fund's portfolio holdings, view the most recent holdings listing, semiannual report, or annual report on Fidelity's web site at http://www.fidelity.com, http://www.institutional.fidelity.com, or http://www.401k.com, as applicable.
NOT FDIC INSURED •MAY LOSE VALUE •NO BANK GUARANTEE
Neither the Fund nor Fidelity Distributors Corporation is a bank.
Note to Shareholders:
Early in 2020, the outbreak and spread of a new coronavirus emerged as a public health emergency that had a major influence on financial markets, primarily based on its impact on the global economy and the outlook for corporate earnings. The virus causes a respiratory disease known as COVID-19. On March 11, the World Health Organization declared the COVID-19 outbreak a pandemic, citing sustained risk of further global spread.
In the weeks following, as the crisis worsened, we witnessed an escalating human tragedy with wide-scale social and economic consequences from coronavirus-containment measures. The outbreak of COVID-19 prompted a number of measures to limit the spread, including travel and border restrictions, quarantines, and restrictions on large gatherings. In turn, these resulted in lower consumer activity, diminished demand for a wide range of products and services, disruption in manufacturing and supply chains, and – given the wide variability in outcomes regarding the outbreak – significant market uncertainty and volatility. Amid the turmoil, the U.S. government took unprecedented action – in concert with the U.S. Federal Reserve and central banks around the world – to help support consumers, businesses, and the broader economy, and to limit disruption to the financial system.
The situation continues to unfold, and the extent and duration of its impact on financial markets and the economy remain highly uncertain. Extreme events such as the coronavirus crisis are “exogenous shocks” that can have significant adverse effects on mutual funds and their investments. Although multiple asset classes may be affected by market disruption, the duration and impact may not be the same for all types of assets.
Fidelity is committed to helping you stay informed amid news about COVID-19 and during increased market volatility, and we’re taking extra steps to be responsive to customer needs. We encourage you to visit our websites, where we offer ongoing updates, commentary, and analysis on the markets and our funds.
Performance: The Bottom Line
Average annual total return reflects the change in the value of an investment, assuming reinvestment of distributions from dividend income and capital gains (the profits earned upon the sale of securities that have grown in value, if any) and assuming a constant rate of performance each year. The hypothetical investment and the average annual total returns do not reflect the deduction of taxes that a shareholder would pay on fund distributions or the redemption of fund shares. During periods of reimbursement by Fidelity, a fund’s total return will be greater than it would be had the reimbursement not occurred. How a fund did yesterday is no guarantee of how it will do tomorrow.
Average Annual Total Returns
| For the periods ended July 31, 2020 | Past 1 year | Life of fundA |
| Fidelity® Small Cap Growth K6 Fund | 9.74% | 15.03% |
A From May 25, 2017
$10,000 Over Life of Fund
Let's say hypothetically that $10,000 was invested in Fidelity® Small Cap Growth K6 Fund on May 25, 2017, when the fund started.
The chart shows how the value of your investment would have changed, and also shows how the Russell 2000® Growth Index performed over the same period.
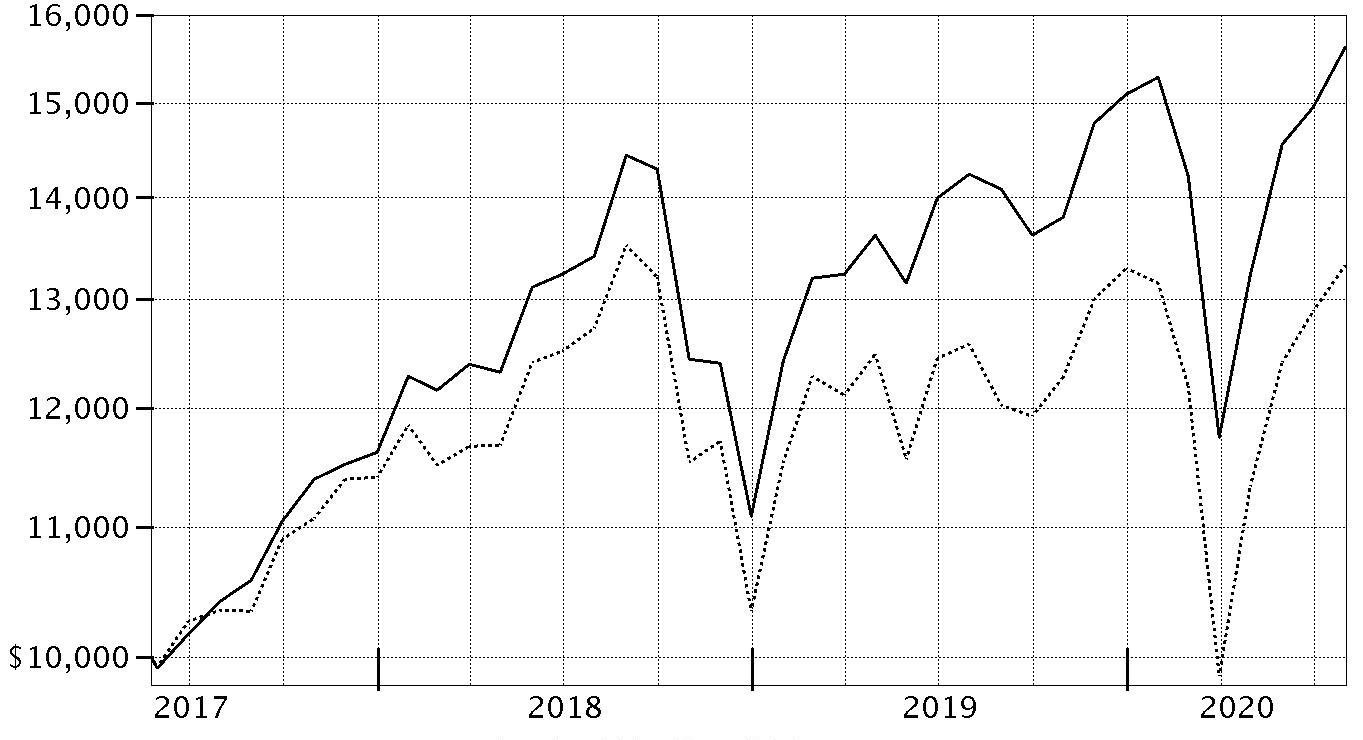
| Period Ending Values |
| $15,624 | Fidelity® Small Cap Growth K6 Fund |
| $13,326 | Russell 2000® Growth Index |
Management's Discussion of Fund Performance
Market Recap: The S&P 500
® index gained 11.96% for the 12 months ending July 31, 2020, in what was a bumpy ride for U.S. equity investors, marked by a steep but brief decline due to the early-2020 outbreak and spread of the coronavirus, followed by a historic rebound. Declared a pandemic on March 11, the COVID-19 crisis and containment efforts caused broad contraction in economic activity, along with extreme uncertainty, volatility and dislocation in financial markets. By mid-March, U.S. stocks entered bear-market territory less than a month after hitting an all-time high and extending the longest-running bull market in American history. Stocks slid in late February, after a surge in COVID-19 cases outside China. The sudden downtrend continued in March (-12%), capping the index’s worst quarter since 2008. A historically rapid and expansive U.S. monetary/fiscal-policy response provided a partial offset to the economic disruption and fueled a sharp uptrend. Aggressive support for financial markets by the U.S. Federal Reserve, plans for reopening the economy and improving infection data boosted stocks in April (+13%) and May (+5%). In June and July, the index gained amid progress on potential treatments and signs of an early recovery in economic activity. For the full 12 months, growth stocks widely topped value, while large-caps handily bested smaller-caps. The information technology sector (+39%) led the way, followed by consumer discretionary (+22%). In contrast, energy (-38%) fell hard along with the price of crude oil.
Comments from Portfolio Manager Patrick Venanzi: For the fiscal year ending July 31, 2020, the fund gained 9.74%, outperforming the 6.00% result of the benchmark Russell 2000
® Growth Index. The top contributor to performance versus the benchmark was stock selection in the information technology sector, primarily driven by the software & services industry. Strong picks in communication services, especially within the media & entertainment industry also helped, as did security selection in the health care equipment & services industry. The fund's biggest individual relative contributor was an overweighting in Cardlytics, which gained roughly 126% the past year. We reduced our position in this company by period end. Other key contributors included an out-of-benchmark position in Insulet and an outsized stake in Generac Holdings (+113%). Conversely, stock selection in consumer discretionary, an overweighting in the media & entertainment industry and stock picks in materials hurt the fund’s relative result. The fund's biggest individual relative detractor was our lighter-than-benchmark stake in Teladoc Health, which gained 183% the past 12 months. Also holding back performance was our overweighting in The Children’s Place, which returned roughly -76%. Neither Teladoc Health nor The Children’s Place were held in the fund at period end. Notable changes in positioning included a lower allocation to the communication services and financials sectors.
The views expressed above reflect those of the portfolio manager(s) only through the end of the period as stated on the cover of this report and do not necessarily represent the views of Fidelity or any other person in the Fidelity organization. Any such views are subject to change at any time based upon market or other conditions and Fidelity disclaims any responsibility to update such views. These views may not be relied on as investment advice and, because investment decisions for a Fidelity fund are based on numerous factors, may not be relied on as an indication of trading intent on behalf of any Fidelity fund.
Investment Summary (Unaudited)
Top Ten Stocks as of July 31, 2020
| | % of fund's net assets |
| Williams-Sonoma, Inc. | 2.0 |
| LHC Group, Inc. | 1.5 |
| Insulet Corp. | 1.4 |
| Five9, Inc. | 1.4 |
| Molina Healthcare, Inc. | 1.2 |
| Kornit Digital Ltd. | 1.2 |
| SiTime Corp. | 1.2 |
| BJ's Wholesale Club Holdings, Inc. | 1.0 |
| Tenable Holdings, Inc. | 1.0 |
| Generac Holdings, Inc. | 1.0 |
| | 12.9 |
Top Five Market Sectors as of July 31, 2020
| | % of fund's net assets |
| Health Care | 31.5 |
| Information Technology | 22.9 |
| Industrials | 16.0 |
| Consumer Discretionary | 13.8 |
| Financials | 4.8 |
Asset Allocation (% of fund's net assets)
| As of July 31, 2020 * |
| | Stocks | 98.6% |
| | Convertible Securities | 1.2% |
| | Short-Term Investments and Net Other Assets (Liabilities) | 0.2% |

* Foreign investments - 12.6%
Schedule of Investments July 31, 2020
Showing Percentage of Net Assets
| Common Stocks - 98.6% | | | |
| | | Shares | Value |
| COMMUNICATION SERVICES - 3.5% | | | |
| Diversified Telecommunication Services - 1.2% | | | |
| Bandwidth, Inc. (a)(b) | | 25,894 | $3,748,933 |
| Cogent Communications Group, Inc. | | 55,049 | 4,960,465 |
| Iridium Communications, Inc. (a) | | 89,523 | 2,452,035 |
| | | | 11,161,433 |
| Entertainment - 1.4% | | | |
| Gaia, Inc. Class A (a)(b) | | 159,828 | 1,467,221 |
| Take-Two Interactive Software, Inc. (a) | | 46,125 | 7,565,423 |
| Zynga, Inc. (a) | | 355,739 | 3,496,914 |
| | | | 12,529,558 |
| Interactive Media & Services - 0.2% | | | |
| CarGurus, Inc. Class A (a) | | 49,545 | 1,431,355 |
| Media - 0.7% | | | |
| Cardlytics, Inc. (a) | | 47,646 | 3,164,647 |
| Nexstar Broadcasting Group, Inc. Class A | | 41,047 | 3,597,770 |
| | | | 6,762,417 |
|
| TOTAL COMMUNICATION SERVICES | | | 31,884,763 |
|
| CONSUMER DISCRETIONARY - 13.8% | | | |
| Diversified Consumer Services - 1.2% | | | |
| Arco Platform Ltd. Class A (a) | | 130,838 | 5,697,995 |
| Grand Canyon Education, Inc. (a) | | 28,557 | 2,534,148 |
| Strategic Education, Inc. | | 21,339 | 2,693,195 |
| | | | 10,925,338 |
| Hotels, Restaurants & Leisure - 1.6% | | | |
| Churchill Downs, Inc. | | 21,111 | 2,924,296 |
| Dunkin' Brands Group, Inc. | | 61,900 | 4,254,387 |
| Lindblad Expeditions Holdings (a) | | 129,292 | 937,367 |
| Wingstop, Inc. | | 37,895 | 5,921,094 |
| | | | 14,037,144 |
| Household Durables - 3.6% | | | |
| Helen of Troy Ltd. (a) | | 41,225 | 7,760,606 |
| iRobot Corp. (a) | | 10,963 | 796,900 |
| LGI Homes, Inc. (a) | | 53,531 | 6,108,422 |
| M/I Homes, Inc. (a) | | 37,905 | 1,577,985 |
| Taylor Morrison Home Corp. (a) | | 359,754 | 8,436,231 |
| Whirlpool Corp. | | 48,709 | 7,945,412 |
| | | | 32,625,556 |
| Internet & Direct Marketing Retail - 2.7% | | | |
| 1-800-FLOWERS.com, Inc. Class A (a)(b) | | 232,100 | 6,556,825 |
| Farfetch Ltd. Class A (a)(b) | | 199,089 | 5,102,651 |
| Kogan.Com Ltd. | | 126,639 | 1,507,351 |
| Revolve Group, Inc. (a)(b) | | 158,799 | 2,599,540 |
| Stamps.com, Inc. (a) | | 34,175 | 8,895,069 |
| | | | 24,661,436 |
| Leisure Products - 0.4% | | | |
| Vista Outdoor, Inc. (a) | | 182,100 | 3,123,015 |
| Multiline Retail - 0.3% | | | |
| Ollie's Bargain Outlet Holdings, Inc. (a) | | 25,017 | 2,629,287 |
| Specialty Retail - 3.0% | | | |
| Floor & Decor Holdings, Inc. Class A (a) | | 58,629 | 3,863,651 |
| Michaels Companies, Inc. (a) | | 672,300 | 4,827,114 |
| Vroom, Inc. | | 16,500 | 976,635 |
| Williams-Sonoma, Inc. (b) | | 202,627 | 17,652,863 |
| | | | 27,320,263 |
| Textiles, Apparel & Luxury Goods - 1.0% | | | |
| Crocs, Inc. (a) | | 154,800 | 5,563,512 |
| Deckers Outdoor Corp. (a) | | 13,930 | 2,914,853 |
| | | | 8,478,365 |
|
| TOTAL CONSUMER DISCRETIONARY | | | 123,800,404 |
|
| CONSUMER STAPLES - 4.2% | | | |
| Food & Staples Retailing - 1.8% | | | |
| BJ's Wholesale Club Holdings, Inc. (a) | | 231,200 | 9,259,560 |
| Grocery Outlet Holding Corp. (a) | | 86,286 | 3,795,721 |
| Performance Food Group Co. (a) | | 81,052 | 2,271,077 |
| Sprouts Farmers Market LLC (a) | | 47,799 | 1,260,938 |
| | | | 16,587,296 |
| Food Products - 1.7% | | | |
| Freshpet, Inc. (a) | | 39,256 | 3,770,539 |
| Nomad Foods Ltd. (a) | | 183,699 | 4,236,099 |
| Post Holdings, Inc. (a) | | 49,648 | 4,405,764 |
| The Simply Good Foods Co. (a) | | 114,058 | 2,741,954 |
| | | | 15,154,356 |
| Personal Products - 0.7% | | | |
| BellRing Brands, Inc. Class A (a) | | 112,011 | 2,225,659 |
| Herbalife Nutrition Ltd. (a) | | 81,100 | 4,155,564 |
| | | | 6,381,223 |
|
| TOTAL CONSUMER STAPLES | | | 38,122,875 |
|
| FINANCIALS - 4.8% | | | |
| Capital Markets - 1.7% | | | |
| Apollo Global Management LLC Class A | | 22,150 | 1,087,565 |
| Cowen Group, Inc. Class A (b) | | 229,387 | 3,778,004 |
| Lazard Ltd. Class A | | 85,189 | 2,497,741 |
| LPL Financial | | 33,433 | 2,641,876 |
| Morningstar, Inc. | | 29,890 | 5,022,716 |
| | | | 15,027,902 |
| Consumer Finance - 0.4% | | | |
| First Cash Financial Services, Inc. | | 69,074 | 3,981,425 |
| Diversified Financial Services - 0.7% | | | |
| StepStone Group Holdings LLC (c)(d)(e) | | 3,217 | 3,065,158 |
| StepStone Group LP Class A (c)(d)(e) | | 3,217 | 3,065,158 |
| | | | 6,130,316 |
| Insurance - 1.3% | | | |
| BRP Group, Inc. (a) | | 98,900 | 1,725,805 |
| Old Republic International Corp. | | 239,374 | 3,846,740 |
| RenaissanceRe Holdings Ltd. | | 31,092 | 5,608,375 |
| | | | 11,180,920 |
| Thrifts & Mortgage Finance - 0.7% | | | |
| Essent Group Ltd. | | 113,921 | 4,081,789 |
| Pennymac Financial Services, Inc. | | 51,467 | 2,483,797 |
| | | | 6,565,586 |
|
| TOTAL FINANCIALS | | | 42,886,149 |
|
| HEALTH CARE - 31.5% | | | |
| Biotechnology - 13.9% | | | |
| Acceleron Pharma, Inc. (a) | | 63,544 | 6,301,658 |
| ADC Therapeutics SA (a) | | 38,227 | 1,777,556 |
| Agios Pharmaceuticals, Inc. (a) | | 32,541 | 1,474,758 |
| ALX Oncology Holdings, Inc. (a)(b) | | 63,100 | 2,063,370 |
| Annexon, Inc. (a)(b) | | 56,100 | 1,022,703 |
| Aprea Therapeutics, Inc. (b) | | 108,129 | 2,965,978 |
| Arena Pharmaceuticals, Inc. (a) | | 60,878 | 3,737,300 |
| Argenx SE ADR (a) | | 33,634 | 7,740,192 |
| Ascendis Pharma A/S sponsored ADR (a) | | 56,145 | 7,726,113 |
| Blueprint Medicines Corp. (a) | | 21,381 | 1,564,662 |
| CareDx, Inc. (a) | | 59,700 | 1,990,995 |
| Castle Biosciences, Inc. | | 55,800 | 2,160,576 |
| Deciphera Pharmaceuticals, Inc. (a) | | 46,484 | 2,155,463 |
| Emergent BioSolutions, Inc. (a) | | 45,798 | 5,094,570 |
| FibroGen, Inc. (a) | | 146,292 | 5,920,437 |
| Forma Therapeutics Holdings, Inc. | | 21,350 | 746,396 |
| Fusion Pharmaceuticals, Inc. (a) | | 6,900 | 94,944 |
| G1 Therapeutics, Inc. (a) | | 98,053 | 1,438,438 |
| Global Blood Therapeutics, Inc. (a)(b) | | 85,575 | 5,774,601 |
| Immunomedics, Inc. (a) | | 133,132 | 5,622,164 |
| Insmed, Inc. (a) | | 75,308 | 1,967,045 |
| Invitae Corp. (a)(b) | | 30,700 | 896,440 |
| Iovance Biotherapeutics, Inc. (a) | | 95,645 | 2,780,400 |
| Keros Therapeutics, Inc. | | 32,700 | 1,049,670 |
| Kura Oncology, Inc. (a) | | 161,291 | 2,651,624 |
| Mersana Therapeutics, Inc. (a) | | 60,389 | 1,200,533 |
| Mirati Therapeutics, Inc. (a) | | 10,794 | 1,309,420 |
| Momenta Pharmaceuticals, Inc. (a) | | 27,086 | 798,766 |
| Morphic Holding, Inc. (a) | | 75,607 | 1,701,914 |
| Myovant Sciences Ltd. (a) | | 235,670 | 3,582,184 |
| Natera, Inc. (a) | | 109,312 | 5,249,162 |
| Nkarta, Inc. (a)(b) | | 3,800 | 97,850 |
| ORIC Pharmaceuticals, Inc. (a) | | 6,542 | 131,298 |
| Passage Bio, Inc. | | 94,529 | 1,478,434 |
| Poseida Therapeutics, Inc. (a) | | 3,900 | 50,622 |
| Protagonist Therapeutics, Inc. (a) | | 12,837 | 201,926 |
| PTC Therapeutics, Inc. (a) | | 21,300 | 986,829 |
| Relay Therapeutics, Inc. (a)(b) | | 62,505 | 2,216,427 |
| Repare Therapeutics, Inc. (b) | | 100,600 | 2,400,316 |
| Repligen Corp. (a) | | 31,262 | 4,717,748 |
| Revolution Medicines, Inc. | | 97,959 | 2,362,771 |
| Revolution Medicines, Inc. | | 78,422 | 1,796,962 |
| Sarepta Therapeutics, Inc. (a) | | 29,555 | 4,537,284 |
| TG Therapeutics, Inc. (a) | | 247,140 | 4,839,001 |
| Turning Point Therapeutics, Inc. (a) | | 84,637 | 5,013,050 |
| Viela Bio, Inc. | | 86,079 | 3,151,352 |
| Zymeworks, Inc. (a) | | 10,221 | 312,047 |
| | | | 124,853,949 |
| Health Care Equipment & Supplies - 6.7% | | | |
| Cerus Corp. (a) | | 77,010 | 549,081 |
| CryoPort, Inc. (a)(b) | | 71,188 | 2,359,170 |
| Haemonetics Corp. (a) | | 29,885 | 2,619,719 |
| Insulet Corp. (a) | | 62,502 | 12,710,407 |
| Integer Holdings Corp. (a) | | 84,699 | 5,570,653 |
| iRhythm Technologies, Inc. (a)(b) | | 36,530 | 4,547,254 |
| Masimo Corp. (a) | | 27,695 | 6,096,223 |
| Nevro Corp. (a) | | 48,470 | 6,444,571 |
| OrthoPediatrics Corp. (a)(b) | | 43,500 | 1,835,265 |
| Quidel Corp. (a) | | 15,548 | 4,391,844 |
| Tandem Diabetes Care, Inc. (a) | | 78,297 | 8,178,905 |
| TransMedics Group, Inc. (a) | | 161,686 | 2,920,049 |
| ViewRay, Inc. (a)(b) | | 642,101 | 1,778,620 |
| | | | 60,001,761 |
| Health Care Providers & Services - 4.4% | | | |
| 1Life Healthcare, Inc. (a)(b) | | 137,907 | 4,083,426 |
| Chemed Corp. | | 8,800 | 4,331,272 |
| Guardant Health, Inc. (a) | | 15,649 | 1,332,982 |
| LHC Group, Inc. (a) | | 69,658 | 13,590,972 |
| Molina Healthcare, Inc. (a) | | 58,654 | 10,833,394 |
| Progyny, Inc. (a)(b) | | 201,082 | 5,353,808 |
| | | | 39,525,854 |
| Health Care Technology - 3.0% | | | |
| Health Catalyst, Inc. (b) | | 101,291 | 3,535,056 |
| HMS Holdings Corp. (a) | | 168,957 | 5,491,103 |
| Inovalon Holdings, Inc. Class A (a) | | 236,956 | 5,575,575 |
| Inspire Medical Systems, Inc. (a) | | 69,958 | 6,951,027 |
| Phreesia, Inc. | | 92,044 | 2,766,843 |
| Schrodinger, Inc. (b) | | 41,738 | 3,020,996 |
| | | | 27,340,600 |
| Life Sciences Tools & Services - 2.3% | | | |
| 10X Genomics, Inc. (a) | | 41,194 | 4,052,254 |
| Berkeley Lights, Inc. (a) | | 4,203 | 252,054 |
| Bruker Corp. | | 76,271 | 3,403,212 |
| Charles River Laboratories International, Inc. (a) | | 8,900 | 1,771,011 |
| Nanostring Technologies, Inc. (a) | | 135,453 | 4,891,208 |
| Syneos Health, Inc. (a) | | 102,900 | 6,419,931 |
| | | | 20,789,670 |
| Pharmaceuticals - 1.2% | | | |
| Allovir, Inc. (a) | | 12,780 | 318,222 |
| Arvinas Holding Co. LLC (a) | | 82,029 | 2,583,914 |
| Axsome Therapeutics, Inc. (a) | | 39,400 | 2,810,402 |
| IMARA, Inc. | | 34,886 | 704,348 |
| Kala Pharmaceuticals, Inc. (a)(b) | | 256,348 | 2,243,045 |
| MyoKardia, Inc. (a) | | 13,200 | 1,189,716 |
| Theravance Biopharma, Inc. (a) | | 54,554 | 1,059,439 |
| | | | 10,909,086 |
|
| TOTAL HEALTH CARE | | | 283,420,920 |
|
| INDUSTRIALS - 15.7% | | | |
| Aerospace & Defense - 1.8% | | | |
| Axon Enterprise, Inc. (a) | | 110,090 | 9,151,782 |
| BWX Technologies, Inc. | | 128,408 | 7,000,804 |
| | | | 16,152,586 |
| Air Freight & Logistics - 0.3% | | | |
| Air Transport Services Group, Inc. (a) | | 119,400 | 2,909,778 |
| Building Products - 1.9% | | | |
| Fortune Brands Home & Security, Inc. | | 87,418 | 6,687,477 |
| The AZEK Co., Inc. | | 173,200 | 5,975,400 |
| Trex Co., Inc. (a) | | 32,922 | 4,587,022 |
| | | | 17,249,899 |
| Commercial Services & Supplies - 0.6% | | | |
| Montrose Environmental Group, Inc. (a) | | 156,800 | 3,410,400 |
| Tetra Tech, Inc. | | 27,400 | 2,429,010 |
| | | | 5,839,410 |
| Construction & Engineering - 0.9% | | | |
| AECOM (a) | | 73,719 | 2,667,891 |
| Dycom Industries, Inc. (a)(b) | | 116,591 | 4,993,593 |
| | | | 7,661,484 |
| Electrical Equipment - 1.6% | | | |
| Atkore International Group, Inc. (a) | | 118,401 | 3,157,755 |
| Generac Holdings, Inc. (a) | | 58,543 | 9,225,206 |
| Sensata Technologies, Inc. PLC (a) | | 51,040 | 1,938,499 |
| | | | 14,321,460 |
| Machinery - 4.0% | | | |
| Allison Transmission Holdings, Inc. | | 71,472 | 2,670,194 |
| ESCO Technologies, Inc. | | 52,486 | 4,510,647 |
| IDEX Corp. | | 28,194 | 4,646,935 |
| ITT, Inc. | | 86,143 | 4,973,035 |
| Kornit Digital Ltd. (a) | | 200,696 | 10,755,299 |
| Nordson Corp. | | 22,922 | 4,438,387 |
| Shenzhen Inovance Technology Co. Ltd. (A Shares) | | 611,200 | 4,404,050 |
| | | | 36,398,547 |
| Marine - 0.3% | | | |
| SITC International Holdings Co. Ltd. | | 2,787,000 | 2,794,084 |
| Professional Services - 3.6% | | | |
| ASGN, Inc. (a) | | 75,309 | 5,155,654 |
| Clarivate Analytics PLC (a) | | 224,652 | 6,211,628 |
| Exponent, Inc. | | 28,977 | 2,435,807 |
| FTI Consulting, Inc. (a) | | 27,394 | 3,271,939 |
| Insperity, Inc. | | 108,868 | 7,278,914 |
| TriNet Group, Inc. (a) | | 119,589 | 7,892,874 |
| | | | 32,246,816 |
| Road & Rail - 0.7% | | | |
| Knight-Swift Transportation Holdings, Inc. Class A | | 136,962 | 5,956,477 |
|
| TOTAL INDUSTRIALS | | | 141,530,541 |
|
| INFORMATION TECHNOLOGY - 22.0% | | | |
| Communications Equipment - 0.4% | | | |
| Ciena Corp. (a) | | 64,867 | 3,860,235 |
| Electronic Equipment & Components - 1.9% | | | |
| Fabrinet (a) | | 91,139 | 6,619,426 |
| II-VI, Inc. (a) | | 95,018 | 4,819,313 |
| SYNNEX Corp. | | 39,808 | 4,965,650 |
| Wrap Technologies, Inc. (a)(b) | | 80,300 | 786,940 |
| | | | 17,191,329 |
| IT Services - 4.8% | | | |
| Black Knight, Inc. (a) | | 45,939 | 3,441,750 |
| Booz Allen Hamilton Holding Corp. Class A | | 57,076 | 4,666,534 |
| CACI International, Inc. Class A (a) | | 26,978 | 5,606,568 |
| Fastly, Inc. Class A (a) | | 64,189 | 6,193,597 |
| Genpact Ltd. | | 122,305 | 4,870,185 |
| KBR, Inc. | | 365,310 | 8,124,494 |
| Maximus, Inc. | | 31,234 | 2,317,875 |
| Repay Holdings Corp. (a) | | 77,785 | 1,721,382 |
| Science Applications International Corp. | | 40,000 | 3,199,200 |
| WNS Holdings Ltd. sponsored ADR (a) | | 43,931 | 2,809,827 |
| | | | 42,951,412 |
| Semiconductors & Semiconductor Equipment - 4.1% | | | |
| Advanced Energy Industries, Inc. (a) | | 52,449 | 3,858,673 |
| Cabot Microelectronics Corp. | | 36,111 | 5,442,650 |
| Cirrus Logic, Inc. (a) | | 74,332 | 5,093,972 |
| Enphase Energy, Inc. (a) | | 67,295 | 4,061,926 |
| Inphi Corp. (a) | | 52,763 | 6,894,014 |
| PDF Solutions, Inc. (a) | | 26,813 | 659,064 |
| SiTime Corp. | | 198,103 | 10,529,174 |
| | | | 36,539,473 |
| Software - 10.8% | | | |
| 2U, Inc. (a)(b) | | 81,339 | 3,830,660 |
| Agora, Inc. ADR (a)(b) | | 25,800 | 1,123,332 |
| Anaplan, Inc. (a) | | 40,004 | 1,816,582 |
| Avalara, Inc. (a) | | 30,569 | 4,110,002 |
| BlackLine, Inc. (a) | | 19,963 | 1,774,910 |
| Ceridian HCM Holding, Inc. (a) | | 48,309 | 3,782,112 |
| Cloudera, Inc. (a)(b) | | 350,000 | 3,944,500 |
| Digital Turbine, Inc. (a) | | 40,900 | 567,692 |
| Dynatrace, Inc. | | 159,773 | 6,683,305 |
| Elastic NV (a) | | 75,170 | 7,230,602 |
| Everbridge, Inc. (a) | | 44,727 | 6,387,016 |
| Five9, Inc. (a) | | 102,718 | 12,410,389 |
| Globant SA (a) | | 26,960 | 4,662,462 |
| Jamf Holding Corp. (a) | | 1,100 | 44,660 |
| Lightspeed POS, Inc. (a) | | 131,957 | 3,727,838 |
| LivePerson, Inc. (a)(b) | | 127,179 | 5,466,153 |
| Manhattan Associates, Inc. (a) | | 37,997 | 3,639,733 |
| Nuance Communications, Inc. (a) | | 100,853 | 2,758,330 |
| Onespan, Inc. (a) | | 44,132 | 1,374,270 |
| Ping Identity Holding Corp. (a) | | 88,244 | 3,032,064 |
| Qualys, Inc. (a) | | 22,087 | 2,727,303 |
| Rapid7, Inc. (a) | | 43,600 | 2,597,252 |
| Tenable Holdings, Inc. (a) | | 272,788 | 9,255,697 |
| Varonis Systems, Inc. (a) | | 42,600 | 4,615,710 |
| | | | 97,562,574 |
|
| TOTAL INFORMATION TECHNOLOGY | | | 198,105,023 |
|
| MATERIALS - 1.7% | | | |
| Chemicals - 0.6% | | | |
| Axalta Coating Systems Ltd. (a) | | 121,418 | 2,695,480 |
| Valvoline, Inc. | | 123,279 | 2,529,685 |
| | | | 5,225,165 |
| Construction Materials - 0.3% | | | |
| Summit Materials, Inc. (a) | | 196,065 | 2,886,077 |
| Containers & Packaging - 0.5% | | | |
| Avery Dennison Corp. | | 38,487 | 4,362,117 |
| Metals & Mining - 0.3% | | | |
| Yamana Gold, Inc. | | 464,300 | 3,015,723 |
|
| TOTAL MATERIALS | | | 15,489,082 |
|
| REAL ESTATE - 1.4% | | | |
| Equity Real Estate Investment Trusts (REITs) - 0.9% | | | |
| Americold Realty Trust | | 77,624 | 3,132,128 |
| Terreno Realty Corp. | | 74,871 | 4,549,162 |
| | | | 7,681,290 |
| Real Estate Management & Development - 0.5% | | | |
| Jones Lang LaSalle, Inc. | | 28,012 | 2,770,667 |
| Redfin Corp. (a) | | 42,100 | 1,750,518 |
| | | | 4,521,185 |
|
| TOTAL REAL ESTATE | | | 12,202,475 |
|
| TOTAL COMMON STOCKS | | | |
| (Cost $702,931,364) | | | 887,442,232 |
|
| Convertible Preferred Stocks - 1.2% | | | |
| INDUSTRIALS - 0.3% | | | |
| Road & Rail - 0.3% | | | |
| Convoy, Inc. Series D (d)(e) | | 192,936 | 2,598,848 |
| INFORMATION TECHNOLOGY - 0.9% | | | |
| IT Services - 0.3% | | | |
| Yanka Industries, Inc. Series E (d)(e) | | 191,029 | 2,307,478 |
| Software - 0.6% | | | |
| Compass, Inc.: | | | |
| Series E (a)(d)(e) | | 16,661 | 2,105,451 |
| Series F 0.00 (a)(d)(e) | | 27,147 | 3,350,211 |
| | | | 5,455,662 |
|
| TOTAL INFORMATION TECHNOLOGY | | | 7,763,140 |
|
| TOTAL CONVERTIBLE PREFERRED STOCKS | | | |
| (Cost $9,262,905) | | | 10,361,988 |
|
| Money Market Funds - 5.3% | | | |
| Fidelity Securities Lending Cash Central Fund 0.13% (f)(g) | | | |
| (Cost $47,734,294) | | 47,729,522 | 47,734,294 |
| TOTAL INVESTMENT IN SECURITIES - 105.1% | | | |
| (Cost $759,928,563) | | | 945,538,514 |
| NET OTHER ASSETS (LIABILITIES) - (5.1)% | | | (45,612,756) |
| NET ASSETS - 100% | | | $899,925,758 |
Legend
(a) Non-income producing
(b) Security or a portion of the security is on loan at period end.
(c) Investment is owned by a wholly-owned subsidiary (Subsidiary) that is treated as a corporation for U.S. tax purposes.
(d) Restricted securities (including private placements) - Investment in securities not registered under the Securities Act of 1933 (excluding 144A issues). At the end of the period, the value of restricted securities (excluding 144A issues) amounted to $16,492,304 or 1.8% of net assets.
(e) Level 3 security
(f) Affiliated fund that is generally available only to investment companies and other accounts managed by Fidelity Investments. The rate quoted is the annualized seven-day yield of the fund at period end. A complete unaudited listing of the fund's holdings as of its most recent quarter end is available upon request. In addition, each Fidelity Central Fund's financial statements, which are not covered by the Fund's Report of Independent Registered Public Accounting Firm, are available on the SEC's website or upon request.
(g) Investment made with cash collateral received from securities on loan.
Additional information on each restricted holding is as follows:
| Security | Acquisition Date | Acquisition Cost |
| Compass, Inc. Series E | 11/3/17 | $1,124,254 |
| Compass, Inc. Series F 0.00 | 10/22/18 | $3,218,820 |
| Convoy, Inc. Series D | 10/30/19 | $2,612,353 |
| StepStone Group Holdings LLC | 8/19/19 | $2,573,600 |
| StepStone Group LP Class A | 8/19/19 | $2,573,600 |
| Yanka Industries, Inc. Series E | 5/15/20 | $2,307,478 |
Affiliated Central Funds
Information regarding fiscal year to date income earned by the Fund from investments in Fidelity Central Funds is as follows:
| Fund | Income earned |
| Fidelity Cash Central Fund | $224,405 |
| Fidelity Securities Lending Cash Central Fund | 616,130 |
| Total | $840,535 |
Amounts in the income column in the above table include any capital gain distributions from underlying funds, which are presented in the corresponding line-item in the Statement of Operations, if applicable. Amount for Fidelity Securities Lending Cash Central Fund represents the income earned on investing cash collateral, less rebates paid to borrowers and any lending agent fees associated with the loan, plus any premium payments received for lending certain types of securities.
Investment Valuation
The following is a summary of the inputs used, as of July 31, 2020, involving the Fund's assets and liabilities carried at fair value. The inputs or methodology used for valuing securities may not be an indication of the risk associated with investing in those securities. For more information on valuation inputs, and their aggregation into the levels used below, please refer to the Investment Valuation section in the accompanying Notes to Financial Statements.
| | Valuation Inputs at Reporting Date: |
| Description | Total | Level 1 | Level 2 | Level 3 |
| Investments in Securities: | | | | |
| Equities: | | | | |
| Communication Services | $31,884,763 | $31,884,763 | $-- | $-- |
| Consumer Discretionary | 123,800,404 | 123,800,404 | -- | -- |
| Consumer Staples | 38,122,875 | 38,122,875 | -- | -- |
| Financials | 42,886,149 | 36,755,833 | -- | 6,130,316 |
| Health Care | 283,420,920 | 281,623,958 | 1,796,962 | -- |
| Industrials | 144,129,389 | 141,530,541 | -- | 2,598,848 |
| Information Technology | 205,868,163 | 198,105,023 | -- | 7,763,140 |
| Materials | 15,489,082 | 15,489,082 | -- | -- |
| Real Estate | 12,202,475 | 12,202,475 | -- | -- |
| Money Market Funds | 47,734,294 | 47,734,294 | -- | -- |
| Total Investments in Securities: | $945,538,514 | $927,249,248 | $1,796,962 | $16,492,304 |
The following is a reconciliation of Investments in Securities for which Level 3 inputs were used in determining value:
| Investments in Securities: | |
| Beginning Balance | $7,606,736 |
| Net Realized Gain (Loss) on Investment Securities | (75,512) |
| Net Unrealized Gain (Loss) on Investment Securities | (322,732) |
| Cost of Purchases | 10,069,931 |
| Proceeds of Sales | -- |
| Amortization/Accretion | -- |
| Transfers into Level 3 | -- |
| Transfers out of Level 3 | (786,119) |
| Ending Balance | $16,492,304 |
| The change in unrealized gain (loss) for the period attributable to Level 3 securities held at July 31, 2020 | $(398,238) |
The information used in the above reconciliation represents fiscal year to date activity for any Investments in Securities identified as using Level 3 inputs at either the beginning or the end of the current fiscal period. Cost of purchases and proceeds of sales may include securities received and/or delivered through in-kind transactions. Transfers in or out of Level 3 represent the beginning value of any Security or Instrument where a change in the pricing level occurred from the beginning to the end of the period. The cost of purchases and the proceeds of sales may include securities received or delivered through corporate actions or exchanges. Realized and unrealized gains (losses) disclosed in the reconciliation are included in Net Gain (Loss) on the Fund's Statement of Operations.
Other Information
Distribution of investments by country or territory of incorporation, as a percentage of Total Net Assets, is as follows (Unaudited):
| United States of America | 87.4% |
| Bermuda | 3.3% |
| Cayman Islands | 1.7% |
| Netherlands | 1.7% |
| Israel | 1.2% |
| Bailiwick of Jersey | 1.0% |
| Others (Individually Less Than 1%) | 3.7% |
| | 100.0% |
See accompanying notes which are an integral part of the financial statements.
Financial Statements
Statement of Assets and Liabilities
| | | July 31, 2020 |
| Assets | | |
Investment in securities, at value (including securities loaned of $46,587,426) — See accompanying schedule:
Unaffiliated issuers (cost $712,194,269) | $897,804,220 | |
| Fidelity Central Funds (cost $47,734,294) | 47,734,294 | |
| Total Investment in Securities (cost $759,928,563) | | $945,538,514 |
| Restricted cash | | 254,477 |
| Receivable for investments sold | | 11,030,691 |
| Receivable for fund shares sold | | 980,001 |
| Dividends receivable | | 100,152 |
| Distributions receivable from Fidelity Central Funds | | 90,539 |
| Other receivables | | 41,078 |
| Total assets | | 958,035,452 |
| Liabilities | | |
| Payable to custodian bank | $810,440 | |
| Payable for investments purchased | 7,457,865 | |
| Payable for fund shares redeemed | 1,656,317 | |
| Accrued management fee | 444,153 | |
| Other payables and accrued expenses | 8,034 | |
| Collateral on securities loaned | 47,732,885 | |
| Total liabilities | | 58,109,694 |
| Net Assets | | $899,925,758 |
| Net Assets consist of: | | |
| Paid in capital | | $733,399,005 |
| Total accumulated earnings (loss) | | 166,526,753 |
| Net Assets | | $899,925,758 |
| Net Asset Value, offering price and redemption price per share ($899,925,758 ÷ 58,737,938 shares) | | $15.32 |
See accompanying notes which are an integral part of the financial statements.
Statement of Operations
| | | Year ended July 31, 2020 |
| Investment Income | | |
| Dividends | | $3,906,070 |
| Income from Fidelity Central Funds (including $616,130 from security lending) | | 840,535 |
| Total income | | 4,746,605 |
| Expenses | | |
| Management fee | $5,006,566 | |
| Independent trustees' fees and expenses | 5,198 | |
| Interest | 1,004 | |
| Miscellaneous | 14,923 | |
| Total expenses before reductions | 5,027,691 | |
| Expense reductions | (95,588) | |
| Total expenses after reductions | | 4,932,103 |
| Net investment income (loss) | | (185,498) |
| Realized and Unrealized Gain (Loss) | | |
| Net realized gain (loss) on: | | |
| Investment securities: | | |
| Unaffiliated issuers | 14,430,966 | |
| Fidelity Central Funds | 1,706 | |
| Foreign currency transactions | 15,798 | |
| Total net realized gain (loss) | | 14,448,470 |
| Change in net unrealized appreciation (depreciation) on: | | |
| Investment securities: | | |
| Unaffiliated issuers | 56,533,485 | |
| Fidelity Central Funds | (194) | |
| Assets and liabilities in foreign currencies | 479 | |
| Total change in net unrealized appreciation (depreciation) | | 56,533,770 |
| Net gain (loss) | | 70,982,240 |
| Net increase (decrease) in net assets resulting from operations | | $70,796,742 |
See accompanying notes which are an integral part of the financial statements.
Statement of Changes in Net Assets
| | Year ended July 31, 2020 | Year ended July 31, 2019 |
| Increase (Decrease) in Net Assets | | |
| Operations | | |
| Net investment income (loss) | $(185,498) | $(654,113) |
| Net realized gain (loss) | 14,448,470 | (31,681,274) |
| Change in net unrealized appreciation (depreciation) | 56,533,770 | 69,313,135 |
| Net increase (decrease) in net assets resulting from operations | 70,796,742 | 36,977,748 |
| Distributions to shareholders | – | (11,807,695) |
| Share transactions | | |
| Proceeds from sales of shares | 283,012,488 | 454,662,840 |
| Reinvestment of distributions | – | 11,807,695 |
| Cost of shares redeemed | (287,627,670) | (220,713,670) |
| Net increase (decrease) in net assets resulting from share transactions | (4,615,182) | 245,756,865 |
| Total increase (decrease) in net assets | 66,181,560 | 270,926,918 |
| Net Assets | | |
| Beginning of period | 833,744,198 | 562,817,280 |
| End of period | $899,925,758 | $833,744,198 |
| Other Information | | |
| Shares | | |
| Sold | 20,313,303 | 34,152,569 |
| Issued in reinvestment of distributions | – | 829,775 |
| Redeemed | (21,315,157) | (17,235,891) |
| Net increase (decrease) | (1,001,854) | 17,746,453 |
See accompanying notes which are an integral part of the financial statements.
Financial Highlights
Fidelity Small Cap Growth K6 Fund
| | | | | |
| Years ended July 31, | 2020 | 2019 | 2018 | 2017 A |
| Selected Per–Share Data | | | | |
| Net asset value, beginning of period | $13.96 | $13.40 | $10.42 | $10.00 |
| Income from Investment Operations | | | | |
| Net investment income (loss)B | –C | (.01) | (.01) | (.01) |
| Net realized and unrealized gain (loss) | 1.36 | .84 | 3.00 | .43 |
| Total from investment operations | 1.36 | .83 | 2.99 | .42 |
| Distributions from net investment income | – | – | –C | – |
| Distributions from net realized gain | – | (.27) | (.01) | – |
| Total distributions | – | (.27) | (.01) | – |
| Net asset value, end of period | $15.32 | $13.96 | $13.40 | $10.42 |
| Total ReturnD,E | 9.74% | 6.14% | 28.72% | 4.20% |
| Ratios to Average Net AssetsF,G | | | | |
| Expenses before reductions | .60% | .60% | .60% | .60%H |
| Expenses net of fee waivers, if any | .60% | .60% | .60% | .60%H |
| Expenses net of all reductions | .59% | .59% | .59% | .60%H |
| Net investment income (loss) | (.02)% | (.09)% | (.06)% | (.45)%H |
| Supplemental Data | | | | |
| Net assets, end of period (000 omitted) | $899,926 | $833,744 | $562,817 | $74,821 |
| Portfolio turnover rateI | 137%J | 108%J | 114%J | 79%J,K |
A For the period May 25, 2017 (commencement of operations) to July 31, 2017.
B Calculated based on average shares outstanding during the period.
C Amount represents less than $.005 per share.
D Total returns for periods of less than one year are not annualized.
E Total returns would have been lower if certain expenses had not been reduced during the applicable periods shown.
F Fees and expenses of any underlying mutual funds or exchange-traded funds (ETFs) are not included in the Fund's expense ratio. The Fund indirectly bears its proportionate share of these expenses. For additional expense information related to investments in Fidelity Central Funds, please refer to the "Investments in Fidelity Central Funds" note found in the Notes to Financial Statements section of the most recent Annual or Semi-Annual report.
G Expense ratios reflect operating expenses of the Fund. Expenses before reductions do not reflect amounts reimbursed by the investment adviser or reductions from brokerage service arrangements or reductions from other expense offset arrangements and do not represent the amount paid by the Fund during periods when reimbursements or reductions occur. Expense ratios before reductions for start-up periods may not be representative of longer term operating periods. Expenses net of fee waivers reflect expenses after reimbursement by the investment adviser but prior to reductions from brokerage service arrangements or other expense offset arrangements. Expenses net of all reductions represent the net expenses paid by the Fund.
H Annualized
I Amount does not include the portfolio activity of any underlying Fidelity Central Funds.
J Portfolio turnover rate excludes securities received or delivered in-kind.
K Amount not annualized.
See accompanying notes which are an integral part of the financial statements.
Notes to Financial Statements
For the period ended July 31, 2020
1. Organization.
Fidelity Small Cap Growth K6 Fund (the Fund) is a fund of Fidelity Securities Fund (the Trust) and is authorized to issue an unlimited number of shares. Share transactions on the Statement of Changes in Net Assets may contain exchanges between affiliated funds. The Trust is registered under the Investment Company Act of 1940, as amended (the 1940 Act), as an open-end management investment company organized as a Massachusetts business trust. Shares generally are available only to employer-sponsored retirement plans that are recordkept by Fidelity, or to certain employer-sponsored retirement plans that are not recordkept by Fidelity.
Effective January 1, 2020:
Investment advisers Fidelity Investments Money Management, Inc., FMR Co., Inc., and Fidelity SelectCo, LLC, merged with and into Fidelity Management & Research Company. In connection with the merger transactions, the resulting, merged investment adviser was then redomiciled from Massachusetts to Delaware, changed its corporate structure from a corporation to a limited liability company, and changed its name to "Fidelity Management & Research Company LLC".
2. Investments in Fidelity Central Funds.
The Fund invests in Fidelity Central Funds, which are open-end investment companies generally available only to other investment companies and accounts managed by the investment adviser and its affiliates. The Fund's Schedule of Investments lists each of the Fidelity Central Funds held as of period end, if any, as an investment of the Fund, but does not include the underlying holdings of each Fidelity Central Fund. As an Investing Fund, the Fund indirectly bears its proportionate share of the expenses of the underlying Fidelity Central Funds.
The Money Market Central Funds seek preservation of capital and current income and are managed by the investment adviser. Annualized expenses of the Money Market Central Funds as of their most recent shareholder report date ranged from less than .005% to .01%.
A complete unaudited list of holdings for each Fidelity Central Fund is available upon request or at the Securities and Exchange Commission (the SEC) website at www.sec.gov. In addition, the financial statements of the Fidelity Central Funds, which are not covered by the Fund's Report of Independent Registered Public Accounting Firm, are available on the SEC website or upon request.
3. Significant Accounting Policies.
The Fund is an investment company and applies the accounting and reporting guidance of the Financial Accounting Standards Board (FASB) Accounting Standards Codification Topic 946 Financial Services – Investment Companies. The financial statements have been prepared in conformity with accounting principles generally accepted in the United States of America (GAAP), which require management to make certain estimates and assumptions at the date of the financial statements. Actual results could differ from those estimates. Subsequent events, if any, through the date that the financial statements were issued have been evaluated in the preparation of the financial statements. The following summarizes the significant accounting policies of the Fund:
Investment Valuation. Investments are valued as of 4:00 p.m. Eastern time on the last calendar day of the period. The Board of Trustees (the Board) has delegated the day to day responsibility for the valuation of the Fund's investments to the Fair Value Committee (the Committee) established by the Fund's investment adviser. In accordance with valuation policies and procedures approved by the Board, the Fund attempts to obtain prices from one or more third party pricing vendors or brokers to value its investments. When current market prices, quotations or currency exchange rates are not readily available or reliable, investments will be fair valued in good faith by the Committee, in accordance with procedures adopted by the Board. Factors used in determining fair value vary by investment type and may include market or investment specific events. The frequency with which these procedures are used cannot be predicted and they may be utilized to a significant extent. The Committee oversees the Fund's valuation policies and procedures and reports to the Board on the Committee's activities and fair value determinations. The Board monitors the appropriateness of the procedures used in valuing the Fund's investments and ratifies the fair value determinations of the Committee.
The Fund categorizes the inputs to valuation techniques used to value its investments into a disclosure hierarchy consisting of three levels as shown below:
- Level 1 – quoted prices in active markets for identical investments
- Level 2 – other significant observable inputs (including quoted prices for similar investments, interest rates, prepayment speeds, etc.)
- Level 3 – unobservable inputs (including the Fund's own assumptions based on the best information available)
Valuation techniques used to value the Fund's investments by major category are as follows:
Equity securities, including restricted securities, for which market quotations are readily available, are valued at the last reported sale price or official closing price as reported by a third party pricing vendor on the primary market or exchange on which they are traded and are categorized as Level 1 in the hierarchy. In the event there were no sales during the day or closing prices are not available, securities are valued at the last quoted bid price or may be valued using the last available price and are generally categorized as Level 2 in the hierarchy. For foreign equity securities, when market or security specific events arise, comparisons to the valuation of American Depositary Receipts (ADRs), futures contracts, Exchange-Traded Funds (ETFs) and certain indexes as well as quoted prices for similar securities may be used and would be categorized as Level 2 in the hierarchy. For equity securities, including restricted securities, where observable inputs are limited, assumptions about market activity and risk are used and these securities may be categorized as Level 3 in the hierarchy. Securities, including private placements or other restricted securities, for which observable inputs are not available are valued using alternate valuation approaches, including the market approach, the income approach and cost approach, and are categorized as Level 3 in the hierarchy. The market approach considers factors including the price of recent investments in the same or a similar security or financial metrics of comparable securities. The income approach considers factors including expected future cash flows, security specific risks and corresponding discount rates. The cost approach considers factors including the value of the security's underlying assets and liabilities.
Investments in open-end mutual funds, including the Fidelity Central Funds, are valued at their closing net asset value (NAV) each business day and are categorized as Level 1 in the hierarchy.
The following provides information on Level 3 securities held by the Fund that were valued at period end based on unobservable inputs. These amounts exclude valuations provided by a broker.
| Asset Type | Fair Value | Valuation Technique(s) | Unobservable Input | Amount or Range/Weighted Average | Impact to Valuation from an Increase in Input(a) |
| Equities | $ 16,492,304 | Market approach | Transaction price | $12.08 | Increase |
| | | Market comparable | Enterprise/EBITDA multiple (EV/EBITDA) | 13.6 | Increase |
| | | | Discount Rate | 32.5% - 69.1% / 52.7% | Decrease |
| | | | Enterprise value/Sales multiple (EV/S) | 1.5 – 1.8 /1.6 | Increase |
| | | | Conversion ratio | 1.0 | Increase |
(a) Represents the directional change in the fair value of the Level 3 investments that could have resulted from an increase in the corresponding input as of period end. A decrease to the unobservable input would have had the opposite effect. Significant changes in these inputs may have resulted in a significantly higher or lower fair value measurement at period end.
Changes in valuation techniques may result in transfers in or out of an assigned level within the disclosure hierarchy. The aggregate value of investments by input level as of July 31, 2020, as well as a roll forward of Level 3 investments, is included at the end of the Fund's Schedule of Investments.
Foreign Currency. The Fund may use foreign currency contracts to facilitate transactions in foreign-denominated securities. Gains and losses from these transactions may arise from changes in the value of the foreign currency or if the counterparties do not perform under the contracts' terms.
Foreign-denominated assets, including investment securities, and liabilities are translated into U.S. dollars at the exchange rates at period end. Purchases and sales of investment securities, income and dividends received and expenses denominated in foreign currencies are translated into U.S. dollars at the exchange rate in effect on the transaction date.
The effects of exchange rate fluctuations on investments are included with the net realized and unrealized gain (loss) on investment securities. Other foreign currency transactions resulting in realized and unrealized gain (loss) are disclosed separately.
Investment Transactions and Income. For financial reporting purposes, the Fund's investment holdings and NAV include trades executed through the end of the last business day of the period. The NAV per share for processing shareholder transactions is calculated as of the close of business of the New York Stock Exchange (NYSE), normally 4:00 p.m. Eastern time and includes trades executed through the end of the prior business day. Gains and losses on securities sold are determined on the basis of identified cost. Dividend income is recorded on the ex-dividend date, except for certain dividends from foreign securities where the ex-dividend date may have passed, which are recorded as soon as the Fund is informed of the ex-dividend date. Non-cash dividends included in dividend income, if any, are recorded at the fair market value of the securities received. Income and capital gain distributions from Fidelity Central Funds, if any, are recorded on the ex-dividend date. Certain distributions received by the Fund represent a return of capital or capital gain. The Fund determines the components of these distributions subsequent to the ex-dividend date, based upon receipt of tax filings or other correspondence relating to the underlying investment. These distributions are recorded as a reduction of cost of investments and/or as a realized gain. Investment income is recorded net of foreign taxes withheld where recovery of such taxes is uncertain.
Expenses. Expenses directly attributable to a fund are charged to that fund. Expenses attributable to more than one fund are allocated among the respective funds on the basis of relative net assets or other appropriate methods. Expense estimates are accrued in the period to which they relate and adjustments are made when actual amounts are known.
Income Tax Information and Distributions to Shareholders. Each year, the Fund intends to qualify as a regulated investment company under Subchapter M of the Internal Revenue Code, including distributing substantially all of its taxable income and realized gains. As a result, no provision for U.S. Federal income taxes is required. As of July 31, 2020, the Fund did not have any unrecognized tax benefits in the financial statements; nor is the Fund aware of any tax positions for which it is reasonably possible that the total amounts of unrecognized tax benefits will significantly change in the next twelve months. The Fund files a U.S. federal tax return, in addition to state and local tax returns as required. The Fund's federal income tax returns are subject to examination by the Internal Revenue Service (IRS) for a period of three fiscal years after they are filed. State and local tax returns may be subject to examination for an additional fiscal year depending on the jurisdiction. Foreign taxes are provided for based on the Fund's understanding of the tax rules and rates that exist in the foreign markets in which it invests.
Distributions are declared and recorded on the ex-dividend date. Income and capital gain distributions are determined in accordance with income tax regulations, which may differ from GAAP.
Capital accounts within the financial statements are adjusted for permanent book-tax differences. These adjustments have no impact on net assets or the results of operations. Capital accounts are not adjusted for temporary book-tax differences which will reverse in a subsequent period.
Book-tax differences are primarily due to foreign currency transactions, passive foreign investment companies (PFIC), partnerships, net operating losses, capital loss carryforwards and losses deferred due to wash sales and excise tax regulations.
As of period end, the cost and unrealized appreciation (depreciation) in securities, and derivatives if applicable, for federal income tax purposes were as follows:
| Gross unrealized appreciation | $207,083,315 |
| Gross unrealized depreciation | (28,213,039) |
| Net unrealized appreciation (depreciation) | $178,870,276 |
| Tax Cost | $766,668,238 |
The tax-based components of distributable earnings as of period end were as follows:
| Capital loss carryforward | $(12,344,003) |
| Net unrealized appreciation (depreciation) on securities and other investments | $178,870,755 |
Capital loss carryforwards are only available to offset future capital gains of the Fund to the extent provided by regulations and may be limited. The capital loss carryforward information presented below, including any applicable limitation, is estimated as of fiscal period end and is subject to adjustment.
| No expiration | |
| Short-term | $(12,344,003) |
| Total capital loss carryforward | $(12,344,003) |
The tax character of distributions paid was as follows:
| | July 31, 2020 | July 31, 2019 |
| Ordinary Income | $– | $ 11,763,636 |
| Long-term Capital Gains | – | 44,059 |
| Total | $– | $ 11,807,695 |
Restricted Securities (including Private Placements). The Fund may invest in securities that are subject to legal or contractual restrictions on resale. These securities generally may be resold in transactions exempt from registration or to the public if the securities are registered. Disposal of these securities may involve time-consuming negotiations and expense, and prompt sale at an acceptable price may be difficult. Information regarding restricted securities is included at the end of the Fund's Schedule of Investments.
Consolidated Subsidiary. The Fund invests in certain investments through a wholly-owned subsidiary ("Subsidiary"), which may be subject to federal and state taxes upon disposition.
As of period end, the Fund held an investment of $6,384,793 in this Subsidiary, representing .71% of the Fund's net assets. The financial statements have been consolidated and include accounts of the Fund and the Subsidiary. Accordingly, all inter-company transactions and balances have been eliminated.
Any cash held by the Subsidiary is restricted as to its use and is presented as Restricted cash in the Statement of Assets and Liabilities.
4. Purchases and Sales of Investments.
Purchases and sales of securities, other than short-term securities, and in-kind transactions are noted in the table below.
| | Purchases ($) | Sales ($) |
| Fidelity Small Cap Growth K6 Fund | 1,123,755,813 | 1,146,727,350 |
Unaffiliated Exchanges In-Kind. During the period, the Fund received investments and cash valued at $32,422,959 in exchange for 2,206,781 shares of the Fund. The amount of in-kind exchanges is included in share transactions in the accompanying Statement of Changes in Net Assets.
Prior Fiscal Year Unaffiliated Redemptions In-Kind. During the prior period, the Fund received investments in exchange for shares of the Fund. The amount of in-kind exchanges is included in share transactions in the accompanying Statement of Changes in Net Assets. For additional information of the Fund in-kind transactions, please refer to the Fund prior annual shareholder report.
5. Fees and Other Transactions with Affiliates.
Management Fee. Fidelity Management & Research Company LLC (the investment adviser) and its affiliates provide the Fund with investment management related services for which the Fund pays a monthly management fee that is based on an annual rate of .60% of average net assets. Under the management contract, the investment adviser or an affiliate pays all other expenses of the Fund, excluding fees and expenses of the independent Trustees, and certain miscellaneous expenses such as proxy and shareholder meeting expenses.
Brokerage Commissions. A portion of portfolio transactions were placed with brokerage firms which are affiliates of the investment adviser. Brokerage commissions are included in net realized gain (loss) and change in net unrealized appreciation (depreciation) in the Statement of Operations. The commissions paid to these affiliated firms were as follows:
| | Amount |
| Fidelity Small Cap Growth K6 Fund | $43,859 |
Interfund Lending Program. Pursuant to an Exemptive Order issued by the SEC, the fund, along with other registered investment companies having management contracts with Fidelity Management & Research Company LLC (FMR), or other affiliated entities of FMR, may participate in an interfund lending program. This program provides an alternative credit facility allowing the fund to borrow from, or lend money to, other participating affiliated funds. At period end, there were no interfund loans outstanding. Activity in this program during the period for which loans were outstanding was as follows:
| | Borrower or Lender | Average Loan Balance | Weighted Average Interest Rate | Interest Expense |
| Fidelity Small Cap Growth K6 Fund | Borrower | $7,441,235 | .29% | $1,004 |
Interfund Trades. Funds may purchase from or sell securities to other Fidelity Funds under procedures adopted by the Board. The procedures have been designed to ensure these interfund trades are executed in accordance with Rule 17a-7 of the 1940 Act. Interfund trades are included within the respective purchases and sales amounts shown in the Purchases and Sales of Investments note.
Other. During the period, the investment adviser reimbursed the Fund for certain losses in the amount of $4,791.
6. Committed Line of Credit.
Certain Funds participate with other funds managed by the investment adviser or an affiliate in a $4.25 billion credit facility (the "line of credit") to be utilized for temporary or emergency purposes to fund shareholder redemptions or for other short-term liquidity purposes. The participating funds have agreed to pay commitment fees on their pro-rata portion of the line of credit, which are reflected in Miscellaneous expenses on the Statement of Operations, and are as follows:
| | Amount |
| Fidelity Small Cap Growth K6 Fund | $2,028 |
During the period, there were no borrowings on this line of credit.
7. Security Lending.
The Fund lends portfolio securities from time to time in order to earn additional income. Lending agents are used, including National Financial Services (NFS), an affiliate of the Fund. Pursuant to a securities lending agreement, NFS will receive a fee, which is capped at 9.9% of daily lending revenue, for its services as lending agent. The Fund may lend securities to certain qualified borrowers, including NFS. On the settlement date of the loan, the Fund receives collateral (in the form of U.S. Treasury obligations, letters of credit and/or cash) against the loaned securities and maintains collateral in an amount not less than 100% of the market value of the loaned securities during the period of the loan. The market value of the loaned securities is determined at the close of business of the Fund and any additional required collateral is delivered to the Fund on the next business day. The Fund or borrower may terminate the loan at any time, and if the borrower defaults on its obligation to return the securities loaned because of insolvency or other reasons, the Fund may apply collateral received from the borrower against the obligation. The Fund may experience delays and costs in recovering the securities loaned. Any cash collateral received is invested in the Fidelity Securities Lending Cash Central Fund. The value of loaned securities and cash collateral at period end are disclosed on the Fund's Statement of Assets and Liabilities. The value of securities loaned to NFS, as affiliated borrower, at period end was $1,018,822. Total fees paid by the Fund to NFS, as lending agent, amounted to $60,236. Security lending income represents the income earned on investing cash collateral, less rebates paid to borrowers and any lending agent fees associated with the loan, plus any premium payments received for lending certain types of securities. Net income from the Fidelity Securities Lending Cash Central Fund during the period is presented in the Statement of Operations as a component of income from Fidelity Central Funds (and includes $21,233 from securities loaned to NFS, as affiliated borrower).
8. Expense Reductions.
Commissions paid to certain brokers with whom the investment adviser, or its affiliates, places trades on behalf of the Fund include an amount in addition to trade execution, which may be rebated back to the Fund to offset certain expenses. This amount totaled $93,812 for the period. In addition, through arrangements with the Fund's custodian, credits realized as a result of certain uninvested cash balances were used to reduce the Fund's expenses by $1,776.
9. Other.
The Fund's organizational documents provide former and current trustees and officers with a limited indemnification against liabilities arising in connection with the performance of their duties to the Fund. In the normal course of business, the Fund may also enter into contracts that provide general indemnifications. The Fund's maximum exposure under these arrangements is unknown as this would be dependent on future claims that may be made against the Fund. The risk of material loss from such claims is considered remote.
10. Coronavirus (COVID-19) Pandemic.
An outbreak of COVID-19 first detected in China during December 2019 has since spread globally and was declared a pandemic by the World Health Organization during March 2020. Developments that disrupt global economies and financial markets, such as the COVID-19 pandemic, may magnify factors that affect the Fund's performance.
Report of Independent Registered Public Accounting Firm
To the Board of Trustees of Fidelity Securities Fund and Shareholders of Fidelity Small Cap Growth K6 Fund
Opinion on the Financial Statements
We have audited the accompanying statement of assets and liabilities, including the schedule of investments, of Fidelity Small Cap Growth K6 Fund (one of the funds constituting Fidelity Securities Fund, referred to hereafter as the “Fund”) as of July 31, 2020, the related statement of operations for the year ended July 31, 2020, the statement of changes in net assets for each of the two years in the period ended July 31, 2020, including the related notes, and the financial highlights for each of the three years in the period ended July 31, 2020 and for the period May 25, 2017 (commencement of operations) through July 31, 2017 (collectively referred to as the “financial statements”). In our opinion, the financial statements present fairly, in all material respects, the financial position of the Fund as of July 31, 2020, the results of its operations for the year then ended, the changes in its net assets for each of the two years in the period ended July 31, 2020 and the financial highlights for each of the three years in the period ended July 31, 2020 and for the period May 25, 2017 (commencement of operations) through July 31, 2017 in conformity with accounting principles generally accepted in the United States of America.
Basis for Opinion
These financial statements are the responsibility of the Fund’s management. Our responsibility is to express an opinion on the Fund’s financial statements based on our audits. We are a public accounting firm registered with the Public Company Accounting Oversight Board (United States) (PCAOB) and are required to be independent with respect to the Fund in accordance with the U.S. federal securities laws and the applicable rules and regulations of the Securities and Exchange Commission and the PCAOB.
We conducted our audits of these financial statements in accordance with the standards of the PCAOB. Those standards require that we plan and perform the audit to obtain reasonable assurance about whether the financial statements are free of material misstatement, whether due to error or fraud.
Our audits included performing procedures to assess the risks of material misstatement of the financial statements, whether due to error or fraud, and performing procedures that respond to those risks. Such procedures included examining, on a test basis, evidence regarding the amounts and disclosures in the financial statements. Our audits also included evaluating the accounting principles used and significant estimates made by management, as well as evaluating the overall presentation of the financial statements. Our procedures included confirmation of securities owned as of July 31, 2020 by correspondence with the custodian, issuers of privately offered securities and brokers; when replies were not received from brokers, we performed other auditing procedures. We believe that our audits provide a reasonable basis for our opinion.
/s/ PricewaterhouseCoopers LLP
Boston, Massachusetts
September 14, 2020
We have served as the auditor of one or more investment companies in the Fidelity group of funds since 1932.
Trustees and Officers
The Trustees, Members of the Advisory Board (if any), and officers of the trust and fund, as applicable, are listed below. The Board of Trustees governs the fund and is responsible for protecting the interests of shareholders. The Trustees are experienced executives who meet periodically throughout the year to oversee the fund's activities, review contractual arrangements with companies that provide services to the fund, oversee management of the risks associated with such activities and contractual arrangements, and review the fund's performance. Except for Jonathan Chiel, each of the Trustees oversees 311 funds. Mr. Chiel oversees 174 funds.
The Trustees hold office without limit in time except that (a) any Trustee may resign; (b) any Trustee may be removed by written instrument, signed by at least two-thirds of the number of Trustees prior to such removal; (c) any Trustee who requests to be retired or who has become incapacitated by illness or injury may be retired by written instrument signed by a majority of the other Trustees; and (d) any Trustee may be removed at any special meeting of shareholders by a two-thirds vote of the outstanding voting securities of the trust. Each Trustee who is not an interested person (as defined in the 1940 Act) of the trust and the fund is referred to herein as an Independent Trustee. Each Independent Trustee shall retire not later than the last day of the calendar year in which his or her 75th birthday occurs. The Independent Trustees may waive this mandatory retirement age policy with respect to individual Trustees. Officers and Advisory Board Members hold office without limit in time, except that any officer or Advisory Board Member may resign or may be removed by a vote of a majority of the Trustees at any regular meeting or any special meeting of the Trustees. Except as indicated, each individual has held the office shown or other offices in the same company for the past five years.
The fund’s Statement of Additional Information (SAI) includes more information about the Trustees. To request a free copy, call Fidelity at 1-800-835-5092.
Experience, Skills, Attributes, and Qualifications of the Trustees. The Governance and Nominating Committee has adopted a statement of policy that describes the experience, qualifications, attributes, and skills that are necessary and desirable for potential Independent Trustee candidates (Statement of Policy). The Board believes that each Trustee satisfied at the time he or she was initially elected or appointed a Trustee, and continues to satisfy, the standards contemplated by the Statement of Policy. The Governance and Nominating Committee also engages professional search firms to help identify potential Independent Trustee candidates who have the experience, qualifications, attributes, and skills consistent with the Statement of Policy. From time to time, additional criteria based on the composition and skills of the current Independent Trustees, as well as experience or skills that may be appropriate in light of future changes to board composition, business conditions, and regulatory or other developments, have also been considered by the professional search firms and the Governance and Nominating Committee. In addition, the Board takes into account the Trustees' commitment and participation in Board and committee meetings, as well as their leadership of standing and ad hoc committees throughout their tenure.
In determining that a particular Trustee was and continues to be qualified to serve as a Trustee, the Board has considered a variety of criteria, none of which, in isolation, was controlling. The Board believes that, collectively, the Trustees have balanced and diverse experience, qualifications, attributes, and skills, which allow the Board to operate effectively in governing the fund and protecting the interests of shareholders. Information about the specific experience, skills, attributes, and qualifications of each Trustee, which in each case led to the Board's conclusion that the Trustee should serve (or continue to serve) as a trustee of the fund, is provided below.
Board Structure and Oversight Function. Robert A. Lawrence is an interested person and currently serves as Acting Chairman. The Trustees have determined that an interested Chairman is appropriate and benefits shareholders because an interested Chairman has a personal and professional stake in the quality and continuity of services provided to the fund. Independent Trustees exercise their informed business judgment to appoint an individual of their choosing to serve as Chairman, regardless of whether the Trustee happens to be independent or a member of management. The Independent Trustees have determined that they can act independently and effectively without having an Independent Trustee serve as Chairman and that a key structural component for assuring that they are in a position to do so is for the Independent Trustees to constitute a substantial majority for the Board. The Independent Trustees also regularly meet in executive session. Ned C. Lautenbach and David M. Thomas serve as Co-Lead Independent Trustees and as such each (i) acts as a liaison between the Independent Trustees and management with respect to matters important to the Independent Trustees and (ii) with management prepares agendas for Board meetings.
Fidelity® funds are overseen by different Boards of Trustees. The fund's Board oversees Fidelity's high income and certain equity funds, and other Boards oversee Fidelity's investment-grade bond, money market, asset allocation, and other equity funds. The asset allocation funds may invest in Fidelity® funds overseen by the fund's Board. The use of separate Boards, each with its own committee structure, allows the Trustees of each group of Fidelity® funds to focus on the unique issues of the funds they oversee, including common research, investment, and operational issues. On occasion, the separate Boards establish joint committees to address issues of overlapping consequences for the Fidelity® funds overseen by each Board.
The Trustees operate using a system of committees to facilitate the timely and efficient consideration of all matters of importance to the Trustees, the fund, and fund shareholders and to facilitate compliance with legal and regulatory requirements and oversight of the fund's activities and associated risks. The Board, acting through its committees, has charged FMR and its affiliates with (i) identifying events or circumstances the occurrence of which could have demonstrably adverse effects on the fund's business and/or reputation; (ii) implementing processes and controls to lessen the possibility that such events or circumstances occur or to mitigate the effects of such events or circumstances if they do occur; and (iii) creating and maintaining a system designed to evaluate continuously business and market conditions in order to facilitate the identification and implementation processes described in (i) and (ii) above. Because the day-to-day operations and activities of the fund are carried out by or through FMR, its affiliates, and other service providers, the fund's exposure to risks is mitigated but not eliminated by the processes overseen by the Trustees. While each of the Board's committees has responsibility for overseeing different aspects of the fund's activities, oversight is exercised primarily through the Operations, Audit, and Compliance Committees. Appropriate personnel, including but not limited to the fund's Chief Compliance Officer (CCO), FMR's internal auditor, the independent accountants, the fund's Treasurer and portfolio management personnel, make periodic reports to the Board's committees, as appropriate, including an annual review of Fidelity's risk management program for the Fidelity® funds. The responsibilities of each standing committee, including their oversight responsibilities, are described further under "Standing Committees of the Trustees."
Interested Trustees*:
Correspondence intended for a Trustee who is an interested person may be sent to Fidelity Investments, 245 Summer Street, Boston, Massachusetts 02210.
Name, Year of Birth; Principal Occupations and Other Relevant Experience+
Jonathan Chiel (1957)
Year of Election or Appointment: 2016
Trustee
Mr. Chiel also serves as Trustee of other Fidelity® funds. Mr. Chiel is Executive Vice President and General Counsel for FMR LLC (diversified financial services company, 2012-present). Previously, Mr. Chiel served as general counsel (2004-2012) and senior vice president and deputy general counsel (2000-2004) for John Hancock Financial Services; a partner with Choate, Hall & Stewart (1996-2000) (law firm); and an Assistant United States Attorney for the United States Attorney’s Office of the District of Massachusetts (1986-95), including Chief of the Criminal Division (1993-1995). Mr. Chiel is a director on the boards of the Boston Bar Foundation and the Maimonides School.
Robert A. Lawrence (1952)
Year of Election or Appointment: 2020
Trustee
Acting Chairman of the Board of Trustees
Mr. Lawrence also serves as Trustee of other funds. Previously, Mr. Lawrence served as a Member of the Advisory Board of certain funds. Prior to his retirement in 2008, Mr. Lawrence served as Vice President of certain Fidelity® funds (2006-2008), Senior Vice President, Head of High Income Division of Fidelity Management & Research Company (investment adviser firm, 2006-2008), and President of Fidelity Strategic Investments (investment adviser firm, 2002-2005).
* Determined to be an “Interested Trustee” by virtue of, among other things, his or her affiliation with the trust or various entities under common control with FMR.
+ The information includes the Trustee's principal occupation during the last five years and other information relating to the experience, attributes, and skills relevant to the Trustee's qualifications to serve as a Trustee, which led to the conclusion that the Trustee should serve as a Trustee for the fund.
Independent Trustees:
Correspondence intended for an Independent Trustee may be sent to Fidelity Investments, P.O. Box 55235, Boston, Massachusetts 02205-5235.
Name, Year of Birth; Principal Occupations and Other Relevant Experience+
Dennis J. Dirks (1948)
Year of Election or Appointment: 2005
Trustee
Mr. Dirks also serves as Trustee of other Fidelity® funds. Prior to his retirement in May 2003, Mr. Dirks served as Chief Operating Officer and as a member of the Board of The Depository Trust & Clearing Corporation (financial markets infrastructure), President, Chief Operating Officer and a member of the Board of The Depository Trust Company (DTC), President and a member of the Board of the National Securities Clearing Corporation (NSCC), Chief Executive Officer and a member of the Board of the Government Securities Clearing Corporation and Chief Executive Officer and a member of the Board of the Mortgage-Backed Securities Clearing Corporation. Mr. Dirks currently serves as a member of the Finance Committee (2016-present) and Board (2017-present) and is Treasurer (2018-present) of the Asolo Repertory Theatre.
Donald F. Donahue (1950)
Year of Election or Appointment: 2018
Trustee
Mr. Donahue also serves as Trustee of other Fidelity® funds. Mr. Donahue serves as President and Chief Executive Officer of Miranda Partners, LLC (risk consulting for the financial services industry, 2012-present). Previously, Mr. Donahue served as Chief Executive Officer (2006-2012), Chief Operating Officer (2003-2006) and Managing Director, Customer Marketing and Development (1999-2003) of The Depository Trust & Clearing Corporation (financial markets infrastructure). Mr. Donahue currently serves as a member (2007-present) and Co-Chairman (2016-present) of the Board of United Way of New York, a member of the Board of NYC Leadership Academy (2012-present) and a member of the Board of Advisors of Ripple Labs, Inc. (financial services, 2015-present). Mr. Donahue previously served as a member of the Advisory Board of certain Fidelity® funds (2015-2018).
Vicki L. Fuller (1957)
Year of Election or Appointment: 2020
Trustee
Ms. Fuller also serves as Trustee of other Fidelity® funds. Previously, Ms. Fuller served as a member of the Advisory Board of certain Fidelity® funds (2018-2020), Chief Investment Officer of the New York State Common Retirement Fund (2012-2018) and held a variety of positions at AllianceBernstein L.P. (global asset management, 1985-2012), including Managing Director (2006-2012) and Senior Vice President and Senior Portfolio Manager (2001-2006). Ms. Fuller currently serves as a member of the Board, Audit Committee and Nominating and Governance Committee of The Williams Companies, Inc. (natural gas infrastructure, 2018-present) and as a member of the Board of Treliant, LLC (consulting, 2019-present).
Patricia L. Kampling (1959)
Year of Election or Appointment: 2020
Trustee
Ms. Kampling also serves as Trustee of other Fidelity® funds. Prior to her retirement, Ms. Kampling served as Chairman of the Board and Chief Executive Officer (2012-2019), President and Chief Operating Officer (2011-2012) and Executive Vice President and Chief Financial Officer (2010-2011) of Alliant Energy Corporation. Ms. Kampling currently serves as a member of the Board, Compensation Committee and Executive Committee and as Chair of the Audit Committee of Briggs & Stratton Corporation (manufacturing, 2011-present) and as a member of the Board, Audit, Finance and Risk Committee and Safety, Environmental, Technology and Operations Committee of American Water Works Company, Inc. (utilities company, 2019-present). In addition, Ms. Kampling currently serves as a member of the Board of the Nature Conservancy, Wisconsin Chapter (2019-present). Previously, Ms. Kampling served as a Member of the Advisory Board of certain Fidelity® funds (2020), a member of the Board of Interstate Power and Light Company (2012-2019) and Wisconsin Power and Light Company (2012-2019) (each a subsidiary of Alliant Energy Corporation) and as a member of the Board and Workforce Development Committee of the Business Roundtable (2018-2019).
Alan J. Lacy (1953)
Year of Election or Appointment: 2008
Trustee
Mr. Lacy also serves as Trustee of other Fidelity® funds. Previously, Mr. Lacy served as Senior Adviser (2007-2014) of Oak Hill Capital Partners, L.P. (private equity), Chief Executive Officer (2005) and Vice Chairman (2005-2006) of Sears Holdings Corporation (retail), Chief Executive Officer and Chairman of the Board of Sears, Roebuck and Co. (retail, 2000-2005), Chairman (2014-2017) and a member of the Board (2010-2017) of Dave & Buster’s Entertainment, Inc. (restaurant and entertainment complexes) and a member of the Board of Bristol-Myers Squibb Company (global pharmaceuticals, 2008-2020). Mr. Lacy currently serves as a Trustee of the California Chapter of The Nature Conservancy (2015-present) and a member of the Board of the Center for Advanced Study in the Behavioral Sciences at Stanford University (2015-present).
Ned C. Lautenbach (1944)
Year of Election or Appointment: 2000
Trustee
Co-Lead Independent Trustee
Mr. Lautenbach also serves as Trustee of other Fidelity® funds. Mr. Lautenbach currently serves as Chair of the Board of Governors, State University System of Florida (2013-present) and is a member of the Council on Foreign Relations (1994-present). He is also a member and has in the past served as Chairman of the Board of Directors of Artis-Naples (2012-present). Previously, Mr. Lautenbach served as a member and then Lead Director of the Board of Directors of Eaton Corporation (diversified industrial, 1997-2016). He was also a Partner at Clayton, Dubilier & Rice, LLC (private equity investment, 1998-2010); as well as Director of Sony Corporation (2006-2007). In addition, Mr. Lautenbach had a 30-year career with IBM (technology company), during which time he served as Senior Vice President and as a member of the Corporate Executive Committee (1968-1998).
Joseph Mauriello (1944)
Year of Election or Appointment: 2008
Trustee
Mr. Mauriello also serves as Trustee of other Fidelity® funds. Prior to his retirement in January 2006, Mr. Mauriello served in numerous senior management positions including Deputy Chairman and Chief Operating Officer (2004-2005), and Vice Chairman of Financial Services (2002-2004) of KPMG LLP US (professional services, 1965-2005). Mr. Mauriello currently serves as a member of the Independent Directors Council Governing Council (2015-present). Previously, Mr. Mauriello served as a member of the Board of XL Group plc. (global insurance and re-insurance, 2006-2018).
Cornelia M. Small (1944)
Year of Election or Appointment: 2005
Trustee
Ms. Small also serves as Trustee of other Fidelity® funds. Previously, Ms. Small served as Chief Investment Officer, Director of Global Equity Investments and a member of Scudder, Stevens & Clark and Scudder Kemper Investments. Ms. Small previously served as a member of the Board (2009-2019) and Chair of the Investment Committee (2010-2019) of the Teagle Foundation and a member of the Investment Committee of the Berkshire Taconic Community Foundation (2008-2019).
Garnett A. Smith (1947)
Year of Election or Appointment: 2018
Trustee
Mr. Smith also serves as Trustee of other Fidelity® funds. Prior to his retirement, Mr. Smith served as Chairman and Chief Executive Officer (1990-1997) and President (1986-1990) of Inbrand Corp. (manufacturer of personal absorbent products). Prior to his employment with Inbrand Corp., he was employed by a retail fabric chain and North Carolina National Bank (now Bank of America). Mr. Smith previously served as a member of the Advisory Board of certain Fidelity® funds (2012-2013).
David M. Thomas (1949)
Year of Election or Appointment: 2008
Trustee
Co-Lead Independent Trustee
Mr. Thomas also serves as Trustee of other Fidelity® funds. Previously, Mr. Thomas served as Executive Chairman (2005-2006) and Chairman and Chief Executive Officer (2000-2005) of IMS Health, Inc. (pharmaceutical and healthcare information solutions). Mr. Thomas currently serves as Non-Executive Chairman of the Board of Fortune Brands Home and Security (home and security products, 2011-present), and a member of the Board (2004-present) and Presiding Director (2013-present) of Interpublic Group of Companies, Inc. (marketing communication).
Susan Tomasky (1953)
Year of Election or Appointment: 2020
Trustee
Ms. Tomasky also serves as Trustee of other Fidelity® funds. Prior to her retirement, Ms. Tomasky served in various executive officer positions at American Electric Power Company, Inc. (1998-2011), including most recently as President of AEP Transmission (2007-2011). Ms. Tomasky currently serves as a member of the Board and Sustainability Committee and as Chair of the Audit Committee of Marathon Petroleum Corporation (2018-present) and as a member of the Board, Corporate Governance Committee and Organization and Compensation Committee and as Chair of the Audit Committee of Public Service Enterprise Group, Inc. (utilities company, 2012-present). In addition, Ms. Tomasky currently serves as a member of the Board of the Columbus Regional Airport Authority (2007-present), as a member of the Board of the Royal Shakespeare Company – America (2009-present), as a member of the Board of the Columbus Association for the Performing Arts (2011-present) and as a member of the Board of Kenyon College (2016-present). Previously, Ms. Tomasky served as a Member of the Advisory Board of certain Fidelity® funds (2020), a member of the Board (2011-2019) and as Lead Independent Director (2015-2018) of Andeavor Corporation (previously Tesoro Corporation) (independent oil refiner and marketer) and as a member of the Board of Summit Midstream Partners LP (energy, 2012-2018).
Michael E. Wiley (1950)
Year of Election or Appointment: 2020
Trustee
Mr. Wiley also serves as Trustee of other Fidelity® funds. Previously, Mr. Wiley served as a member of the Advisory Board of certain Fidelity® funds (2018-2020), Chairman, President and CEO of Baker Hughes, Inc. (oilfield services, 2000-2004). Mr. Wiley also previously served as a member of the Board of Andeavor Corporation (independent oil refiner and marketer, 2005-2018), a member of the Board of Andeavor Logistics LP (natural resources logistics, 2015-2018) and a member of the Board of High Point Resources (exploration and production, 2005-2020).
+ The information includes the Trustee's principal occupation during the last five years and other information relating to the experience, attributes, and skills relevant to the Trustee's qualifications to serve as a Trustee, which led to the conclusion that the Trustee should serve as a Trustee for the fund.
Advisory Board Members and Officers:
Correspondence intended for a Member of the Advisory Board (if any) may be sent to Fidelity Investments, P.O. Box 55235, Boston, Massachusetts 02205-5235. Correspondence intended for an officer or Peter S. Lynch may be sent to Fidelity Investments, 245 Summer Street, Boston, Massachusetts 02210. Officers appear below in alphabetical order.
Name, Year of Birth; Principal Occupation
Peter S. Lynch (1944)
Year of Election or Appointment: 2003
Member of the Advisory Board
Mr. Lynch also serves as a Member of the Advisory Board of other Fidelity® funds. Mr. Lynch is Vice Chairman and a Director of Fidelity Management & Research Company LLC (investment adviser firm). In addition, Mr. Lynch serves as a Trustee of Boston College and as the Chairman of the Inner-City Scholarship Fund. Previously, Mr. Lynch served as Vice Chairman and a Director of FMR Co., Inc. (investment adviser firm) and on the Special Olympics International Board of Directors (1997-2006).
Elizabeth Paige Baumann (1968)
Year of Election or Appointment: 2017
Anti-Money Laundering (AML) Officer
Ms. Baumann also serves as AML Officer of other funds. She is Chief AML Officer (2012-present) and Senior Vice President (2014-present) of FMR LLC (diversified financial services company) and is an employee of Fidelity Investments. Previously, Ms. Baumann served as AML Officer of certain funds (2017-2019), as AML Officer of the funds (2012-2016), and Vice President (2007-2014) and Deputy Anti-Money Laundering Officer (2007-2012) of FMR LLC.
Craig S. Brown (1977)
Year of Election or Appointment: 2019
Assistant Treasurer
Mr. Brown also serves as Assistant Treasurer of other funds. Mr. Brown is an employee of Fidelity Investments (2013-present).
John J. Burke III (1964)
Year of Election or Appointment: 2018
Chief Financial Officer
Mr. Burke also serves as Chief Financial Officer of other funds. Mr. Burke serves as Head of Investment Operations for Fidelity Fund and Investment Operations (2018-present) and is an employee of Fidelity Investments (1998-present). Previously Mr. Burke served as head of Asset Management Investment Operations (2012-2018).
William C. Coffey (1969)
Year of Election or Appointment: 2019
Assistant Secretary
Mr. Coffey also serves as Assistant Secretary of other funds. He is Senior Vice President and Deputy General Counsel of FMR LLC (diversified financial services company, 2010-present), and is an employee of Fidelity Investments. Previously, Mr. Coffey served as Secretary and CLO of certain funds (2018-2019); CLO, Secretary, and Senior Vice President of Fidelity Management & Research Company and FMR Co., Inc. (investment adviser firms, 2018-2019); Secretary of Fidelity SelectCo, LLC and Fidelity Investments Money Management, Inc. (investment adviser firms, 2018-2019); CLO of Fidelity Management & Research (Hong Kong) Limited, FMR Investment Management (UK) Limited, and Fidelity Management & Research (Japan) Limited (investment adviser firms, 2018-2019); and Assistant Secretary of certain funds (2009-2018).
Timothy M. Cohen (1969)
Year of Election or Appointment: 2018
Vice President
Mr. Cohen also serves as Vice President of other funds. Mr. Cohen serves as Co-Head of Equity (2018-present), a Director of Fidelity Management & Research (Japan) Limited (investment adviser firm, 2016-present), and is an employee of Fidelity Investments. Previously, Mr. Cohen served as Executive Vice President of Fidelity SelectCo, LLC (2019), Head of Global Equity Research (2016-2018), Chief Investment Officer - Equity and a Director of Fidelity Management & Research (U.K.) Inc. (investment adviser firm, 2013-2015) and as a Director of Fidelity Management & Research (Hong Kong) Limited (investment adviser firm, 2017).
Jonathan Davis (1968)
Year of Election or Appointment: 2010
Assistant Treasurer
Mr. Davis also serves as Assistant Treasurer of other funds. Mr. Davis serves as Assistant Treasurer of FMR Capital, Inc. (2017-present) and is an employee of Fidelity Investments. Previously, Mr. Davis served as Vice President and Associate General Counsel of FMR LLC (diversified financial services company, 2003-2010).
Laura M. Del Prato (1964)
Year of Election or Appointment: 2018
Assistant Treasurer
Ms. Del Prato also serves as an officer of other funds. Ms. Del Prato is an employee of Fidelity Investments (2017-present). Previously, Ms. Del Prato served as President and Treasurer of The North Carolina Capital Management Trust: Cash Portfolio and Term Portfolio (2018-2020). Prior to joining Fidelity Investments, Ms. Del Prato served as a Managing Director and Treasurer of the JPMorgan Mutual Funds (2014-2017). Prior to JPMorgan, Ms. Del Prato served as a partner at Cohen Fund Audit Services (accounting firm, 2012-2013) and KPMG LLP (accounting firm, 2004-2012).
Colm A. Hogan (1973)
Year of Election or Appointment: 2020
Assistant Treasurer
Mr. Hogan also serves as an officer of other funds. Mr. Hogan serves as Assistant Treasurer of FMR Capital, Inc. (2017-present) and is an employee of Fidelity Investments (2005-present). Previously, Mr. Hogan served as Deputy Treasurer of certain Fidelity® funds (2016-2020) and Assistant Treasurer of certain Fidelity® funds (2016-2018).
Pamela R. Holding (1964)
Year of Election or Appointment: 2018
Vice President
Ms. Holding also serves as Vice President of other funds. Ms. Holding serves as Co-Head of Equity (2018-present) and is an employee of Fidelity Investments (2013-present). Previously, Ms. Holding served as Executive Vice President of Fidelity SelectCo, LLC (2019) and as Chief Investment Officer of Fidelity Institutional Asset Management (2013-2018).
Cynthia Lo Bessette (1969)
Year of Election or Appointment: 2019
Secretary and Chief Legal Officer (CLO)
Ms. Lo Bessette also serves as an officer of other funds. Ms. Lo Bessette serves as CLO, Secretary, and Senior Vice President of Fidelity Management & Research Company LLC (investment adviser firm, 2019-present); and CLO of Fidelity Management & Research (Hong Kong) Limited, FMR Investment Management (UK) Limited, and Fidelity Management & Research (Japan) Limited (investment adviser firms, 2019-present). She is a Senior Vice President and Deputy General Counsel of FMR LLC (diversified financial services company, 2019-present), and is an employee of Fidelity Investments. Previously, Ms. Lo Bessette served as CLO, Secretary, and Senior Vice President of FMR Co., Inc. (investment adviser firm, 2019); Secretary of Fidelity SelectCo, LLC and Fidelity Investments Money Management, Inc. (investment adviser firms, 2019). Prior to joining Fidelity Investments, Ms. Lo Bessette was Executive Vice President, General Counsel (2016-2019) and Senior Vice President, Deputy General Counsel (2015-2016) of OppenheimerFunds (investment management company) and Deputy Chief Legal Officer (2013-2015) of Jennison Associates LLC (investment adviser firm).
Chris Maher (1972)
Year of Election or Appointment: 2020
Deputy Treasurer
Mr. Maher also serves as an officer of other funds. Mr. Maher serves as Assistant Treasurer of FMR Capital, Inc. (2017-present), and is an employee of Fidelity Investments (2008-present). Previously, Mr. Maher served as Assistant Treasurer of certain funds (2013-2020); Vice President of Asset Management Compliance (2013), Vice President of the Program Management Group of FMR (investment adviser firm, 2010-2013), and Vice President of Valuation Oversight (2008-2010).
Jason P. Pogorelec (1975)
Year of Election or Appointment: 2020
Chief Compliance Officer
Mr. Pogorelec also serves as Chief Compliance Officer of other funds. Mr. Pogorelec is a senior Vice President of Asset Management Compliance for Fidelity Investments and is an employee of Fidelity Investments (2006-present). Previously, Mr. Pogorelec served as Vice President, Associate General Counsel for Fidelity Investments (2010-2020) and Assistant Secretary of certain Fidelity funds (2015-2020).
Stacie M. Smith (1974)
Year of Election or Appointment: 2016
President and Treasurer
Ms. Smith also serves as an officer of other funds. Ms. Smith serves as Assistant Treasurer of FMR Capital, Inc. (2017-present), is an employee of Fidelity Investments (2009-present), and has served in other fund officer roles. Prior to joining Fidelity Investments, Ms. Smith served as Senior Audit Manager of Ernst & Young LLP (accounting firm, 1996-2009). Previously, Ms. Smith served as Assistant Treasurer (2013-2019) and Deputy Treasurer (2013-2016) of certain Fidelity® funds.
Marc L. Spector (1972)
Year of Election or Appointment: 2016
Assistant Treasurer
Mr. Spector also serves as an officer of other funds. Mr. Spector serves as Assistant Treasurer of FMR Capital, Inc. (2017-present) and is an employee of Fidelity Investments (2016-present). Prior to joining Fidelity Investments, Mr. Spector served as Director at the Siegfried Group (accounting firm, 2013-2016), and prior to Siegfried Group as audit senior manager at Deloitte & Touche LLP (accounting firm, 2005-2013).
Jim Wegmann (1979)
Year of Election or Appointment: 2019
Assistant Treasurer
Mr. Wegmann also serves as Assistant Treasurer of other funds. Mr. Wegmann is an employee of Fidelity Investments (2011-present).
Shareholder Expense Example
As a shareholder, you incur two types of costs: (1) transaction costs, which may include sales charges (loads) on purchase payments or redemption proceeds, as applicable and (2) ongoing costs, which generally include management fees, distribution and/or service (12b-1) fees and other Fund expenses. This Example is intended to help you understand your ongoing costs (in dollars) of investing in a fund and to compare these costs with the ongoing costs of investing in other mutual funds.
The Example is based on an investment of $1,000 invested at the beginning of the period and held for the entire period (February 1, 2020 to July 31, 2020).
Actual Expenses
The first line of the accompanying table provides information about actual account values and actual expenses. You may use the information in this line, together with the amount you invested, to estimate the expenses that you paid over the period. Simply divide your account value by $1,000.00 (for example, an $8,600 account value divided by $1,000.00 = 8.6), then multiply the result by the number in the first line for a class/Fund under the heading entitled "Expenses Paid During Period" to estimate the expenses you paid on your account during this period. If any fund is a shareholder of any underlying mutual funds or exchange-traded funds (ETFs) (the Underlying Funds), such fund indirectly bears its proportional share of the expenses of the Underlying Funds in addition to the direct expenses incurred presented in the table. These fees and expenses are not included in the annualized expense ratio used to calculate the expense estimate in the table below.
Hypothetical Example for Comparison Purposes
The second line of the accompanying table provides information about hypothetical account values and hypothetical expenses based on the actual expense ratio and an assumed rate of return of 5% per year before expenses, which is not the actual return. The hypothetical account values and expenses may not be used to estimate the actual ending account balance or expenses you paid for the period. You may use this information to compare the ongoing costs of investing in the Fund and other funds. To do so, compare this 5% hypothetical example with the 5% hypothetical examples that appear in the shareholder reports of the other funds. If any fund is a shareholder of any Underlying Funds, such fund indirectly bears its proportional share of the expenses of the Underlying Funds in addition to the direct expenses as presented in the table. These fees and expenses are not included in the annualized expense ratio used to calculate the expense estimate in the table below.
Please note that the expenses shown in the table are meant to highlight your ongoing costs only and do not reflect any transaction costs. Therefore, the second line of the table is useful in comparing ongoing costs only, and will not help you determine the relative total costs of owning different funds.
| | Annualized Expense Ratio-A | Beginning
Account Value
February 1, 2020 | Ending
Account Value
July 31, 2020 | Expenses Paid
During Period-B
February 1, 2020
to July 31, 2020 |
| Fidelity Small Cap Growth K6 Fund | .60% | | | |
| Actual | | $1,000.00 | $1,022.00 | $3.02 |
| Hypothetical-C | | $1,000.00 | $1,021.88 | $3.02 |
A Annualized expense ratio reflects expenses net of applicable fee waivers.
B Expenses are equal to the annualized expense ratio, multiplied by the average account value over the period, multiplied by 182/ 366 (to reflect the one-half year period). The fees and expenses of any Underlying Funds are not included in each annualized expense ratio.
C 5% return per year before expenses
Liquidity Risk Management Program
The Securities and Exchange Commission adopted Rule 22e-4 under the Investment Company Act of 1940 (the Liquidity Rule) to promote effective liquidity risk management throughout the open-end investment company industry, thereby reducing the risk that funds will be unable to meet their redemption obligations and mitigating dilution of the interests of fund shareholders.
The Fund has adopted and implemented a liquidity risk management program pursuant to the Liquidity Rule (the Program) effective December 1, 2018. The Program is reasonably designed to assess and manage the Fund’s liquidity risk and to comply with the requirements of the Liquidity Rule. The Fund’s Board of Trustees (the Board) has designated the Fund’s investment adviser as administrator of the Program. The Fidelity advisers have established a Liquidity Risk Management Committee (the LRM Committee) to manage the Program for each of the Fidelity Funds. The LRM Committee monitors the adequacy and effectiveness of implementation of the Program and on a periodic basis assesses each Fund’s liquidity risk based on a variety of factors including (1) the Fund’s investment strategy, (2) portfolio liquidity and cash flow projections during normal and reasonably foreseeable stressed conditions, (3) shareholder redemptions, (4) borrowings and other funding sources and (5) in the case of exchange-traded funds, certain additional factors including the effect of the Fund’s prices and spreads, market participants, and basket compositions on the overall liquidity of the Fund’s portfolio, as applicable.
In accordance with the Program, each of the Fund’s portfolio investments is classified into one of four liquidity categories described below based on a determination of a reasonable expectation for how long it would take to convert the investment to cash (or sell or dispose of the investment) without significantly changing its market value.
- Highly liquid investments – cash or convertible to cash within three business days or less
- Moderately liquid investments – convertible to cash in three to seven calendar days
- Less liquid investments – can be sold or disposed of, but not settled, within seven calendar days
- Illiquid investments – cannot be sold or disposed of within seven calendar days
Liquidity classification determinations take into account a variety of factors including various market, trading and investment-specific considerations, as well as market depth, and generally utilize analysis from a third-party liquidity metrics service.
The Liquidity Rule places a 15% limit on a fund’s illiquid investments and requires funds that do not primarily hold assets that are highly liquid investments to determine and maintain a minimum percentage of the fund’s net assets to be invested in highly liquid investments (highly liquid investment minimum or HLIM). The Program includes provisions reasonably designed to comply with the 15% limit on illiquid investments and for determining, periodically reviewing and complying with the HLIM requirement as applicable.
At a recent meeting of the Fund’s Board of Trustees, the LRM Committee provided a written report to the Board pertaining to the operation, adequacy, and effectiveness of implementation of the Program for the annual period from December 1, 2018 through November 30, 2019. The report concluded that the Program has been implemented and is operating effectively and is reasonably designed to assess and manage the Fund’s liquidity risk.
Proxy Voting Results
A special meeting of shareholders was held on June 9, 2020. The results of votes taken among shareholders on the proposal before them are reported below. Each vote reported represents one dollar of net asset value held on the record date for the meeting.
PROPOSAL 1
To elect a Board of Trustees.
| | # of
Votes | % of
Votes |
| Dennis J. Dirks |
| Affirmative | 43,167,428,219.785 | 94.885 |
| Withheld | 2,327,070,930.034 | 5.115 |
| TOTAL | 45,494,499,149.820 | 100.000 |
| Donald F. Donahue |
| Affirmative | 43,161,668,935.467 | 94.872 |
| Withheld | 2,333,065,287.611 | 5.128 |
| TOTAL | 45,494,734,223.077 | 100.000 |
| Bettina Doulton |
| Affirmative | 43,304,465,213.969 | 95.186 |
| Withheld | 2,190,010,062.903 | 4.814 |
| TOTAL | 45,494,475,276.872 | 100.000 |
| Vicki L. Fuller |
| Affirmative | 43,380,442,631.493 | 95.353 |
| Withheld | 2,114,180,614.639 | 4.647 |
| TOTAL | 45,494,623,246.132 | 100.000 |
| Patricia L. Kampling |
| Affirmative | 43,128,008,796.761 | 94.798 |
| Withheld | 2,366,685,422.999 | 5.202 |
| TOTAL | 45,494,694,219.760 | 100.000 |
| Alan J. Lacy |
| Affirmative | 42,904,065,046.958 | 94.305 |
| Withheld | 2,590,717,567.229 | 5.695 |
| TOTAL | 45,494,782,614.187 | 100.000 |
| Ned C. Lautenbach |
| Affirmative | 42,802,778,827.017 | 94.083 |
| Withheld | 2,692,003,787.170 | 5.917 |
| TOTAL | 45,494,782,614.187 | 100.000 |
| Robert A. Lawrence |
| Affirmative | 42,971,258,294.203 | 94.453 |
| Withheld | 2,523,524,319.984 | 5.547 |
| TOTAL | 45,494,782,614.187 | 100.000 |
| Joseph Mauriello |
| Affirmative | 42,874,562,778.490 | 94.241 |
| Withheld | 2,620,171,874.731 | 5.759 |
| TOTAL | 45,494,734,653.220 | 100.000 |
| Cornelia M. Small |
| Affirmative | 43,029,040,988.063 | 94.580 |
| Withheld | 2,465,741,626.124 | 5.420 |
| TOTAL | 45,494,782,614.187 | 100.000 |
| Garnett A. Smith |
| Affirmative | 42,892,814,945.159 | 94.281 |
| Withheld | 2,601,967,669.028 | 5.719 |
| TOTAL | 45,494,782,614.187 | 100.000 |
| David M. Thomas |
| Affirmative | 42,936,080,036.111 | 94.376 |
| Withheld | 2,558,702,578.076 | 5.624 |
| TOTAL | 45,494,782,614.187 | 100.000 |
| Susan Tomasky |
| Affirmative | 43,147,934,105.796 | 94.842 |
| Withheld | 2,346,571,066.028 | 5.158 |
| TOTAL | 45,494,782,614.187 | 100.000 |
| Michael E. Wiley |
| Affirmative | 42,885,333,102.972 | 94.264 |
| Withheld | 2,609,449,511.215 | 5.736 |
| TOTAL | 45,494,782,614.187 | 100.000 |
|
| Proposal 1 reflects trust wide proposal and voting results. |
SCPK6-ANN-0920
1.9884011.103
Fidelity® OTC K6 Portfolio
Annual Report
July 31, 2020
See the inside front cover for important information about access to your fund’s shareholder reports.
Beginning on January 1, 2021, as permitted by regulations adopted by the Securities and Exchange Commission, paper copies of a fund’s shareholder reports will no longer be sent by mail, unless you specifically request paper copies of the reports from the fund or from your financial intermediary, such as a financial advisor, broker-dealer or bank. Instead, the reports will be made available on a website, and you will be notified by mail each time a report is posted and provided with a website link to access the report.
If you already elected to receive shareholder reports electronically, you will not be affected by this change and you need not take any action. You may elect to receive shareholder reports and other communications from a fund electronically, by contacting your financial intermediary. For Fidelity customers, visit Fidelity's web site or call Fidelity using the contact information listed below.
You may elect to receive all future reports in paper free of charge. If you wish to continue receiving paper copies of your shareholder reports, you may contact your financial intermediary or, if you are a Fidelity customer, visit Fidelity’s website, or call Fidelity at the applicable toll-free number listed below. Your election to receive reports in paper will apply to all funds held with the fund complex/your financial intermediary.
| Account Type | Website | Phone Number |
| Brokerage, Mutual Fund, or Annuity Contracts: | fidelity.com/mailpreferences | 1-800-343-3548 |
| Employer Provided Retirement Accounts: | netbenefits.fidelity.com/preferences (choose 'no' under Required Disclosures to continue to print) | 1-800-343-0860 |
| Advisor Sold Accounts Serviced Through Your Financial Intermediary: | Contact Your Financial Intermediary | Your Financial Intermediary's phone number |
| Advisor Sold Accounts Serviced by Fidelity: | institutional.fidelity.com | 1-877-208-0098 |
Contents
To view a fund's proxy voting guidelines and proxy voting record for the 12-month period ended June 30, visit http://www.fidelity.com/proxyvotingresults or visit the Securities and Exchange Commission's (SEC) web site at http://www.sec.gov.
You may also call 1-800-835-5092 to request a free copy of the proxy voting guidelines.
Standard & Poor's, S&P and S&P 500 are registered service marks of The McGraw-Hill Companies, Inc. and have been licensed for use by Fidelity Distributors Corporation.
Other third-party marks appearing herein are the property of their respective owners.
All other marks appearing herein are registered or unregistered trademarks or service marks of FMR LLC or an affiliated company. © 2020 FMR LLC. All rights reserved.
This report and the financial statements contained herein are submitted for the general information of the shareholders of the Fund. This report is not authorized for distribution to prospective investors in the Fund unless preceded or accompanied by an effective prospectus.
A fund files its complete schedule of portfolio holdings with the SEC for the first and third quarters of each fiscal year on Form N-PORT. Forms N-PORT are available on the SEC’s web site at http://www.sec.gov. A fund's Forms N-PORT may be reviewed and copied at the SEC’s Public Reference Room in Washington, DC. Information regarding the operation of the SEC's Public Reference Room may be obtained by calling 1-800-SEC-0330.
For a complete list of a fund's portfolio holdings, view the most recent holdings listing, semiannual report, or annual report on Fidelity's web site at http://www.fidelity.com, http://www.institutional.fidelity.com, or http://www.401k.com, as applicable.
NOT FDIC INSURED •MAY LOSE VALUE •NO BANK GUARANTEE
Neither the Fund nor Fidelity Distributors Corporation is a bank.
Note to Shareholders:
Early in 2020, the outbreak and spread of a new coronavirus emerged as a public health emergency that had a major influence on financial markets, primarily based on its impact on the global economy and the outlook for corporate earnings. The virus causes a respiratory disease known as COVID-19. On March 11, the World Health Organization declared the COVID-19 outbreak a pandemic, citing sustained risk of further global spread.
In the weeks following, as the crisis worsened, we witnessed an escalating human tragedy with wide-scale social and economic consequences from coronavirus-containment measures. The outbreak of COVID-19 prompted a number of measures to limit the spread, including travel and border restrictions, quarantines, and restrictions on large gatherings. In turn, these resulted in lower consumer activity, diminished demand for a wide range of products and services, disruption in manufacturing and supply chains, and – given the wide variability in outcomes regarding the outbreak – significant market uncertainty and volatility. Amid the turmoil, the U.S. government took unprecedented action – in concert with the U.S. Federal Reserve and central banks around the world – to help support consumers, businesses, and the broader economy, and to limit disruption to the financial system.
The situation continues to unfold, and the extent and duration of its impact on financial markets and the economy remain highly uncertain. Extreme events such as the coronavirus crisis are “exogenous shocks” that can have significant adverse effects on mutual funds and their investments. Although multiple asset classes may be affected by market disruption, the duration and impact may not be the same for all types of assets.
Fidelity is committed to helping you stay informed amid news about COVID-19 and during increased market volatility, and we’re taking extra steps to be responsive to customer needs. We encourage you to visit our websites, where we offer ongoing updates, commentary, and analysis on the markets and our funds.
Performance: The Bottom Line
Average annual total return reflects the change in the value of an investment, assuming reinvestment of distributions from dividend income and capital gains (the profits earned upon the sale of securities that have grown in value, if any) and assuming a constant rate of performance each year. The hypothetical investment and the average annual total returns do not reflect the deduction of taxes that a shareholder would pay on fund distributions or the redemption of fund shares. During periods of reimbursement by Fidelity, a fund’s total return will be greater than it would be had the reimbursement not occurred. How a fund did yesterday is no guarantee of how it will do tomorrow.
Average Annual Total Returns
| For the periods ended July 31, 2020 | Past 1 year | Life of fundA |
| Fidelity® OTC K6 Portfolio | 36.54% | 37.38% |
A From June 13, 2019
$10,000 Over Life of Fund
Let's say hypothetically that $10,000 was invested in Fidelity® OTC K6 Portfolio on June 13, 2019, when the fund started.
The chart shows how the value of your investment would have changed, and also shows how the Nasdaq Composite Index® performed over the same period.
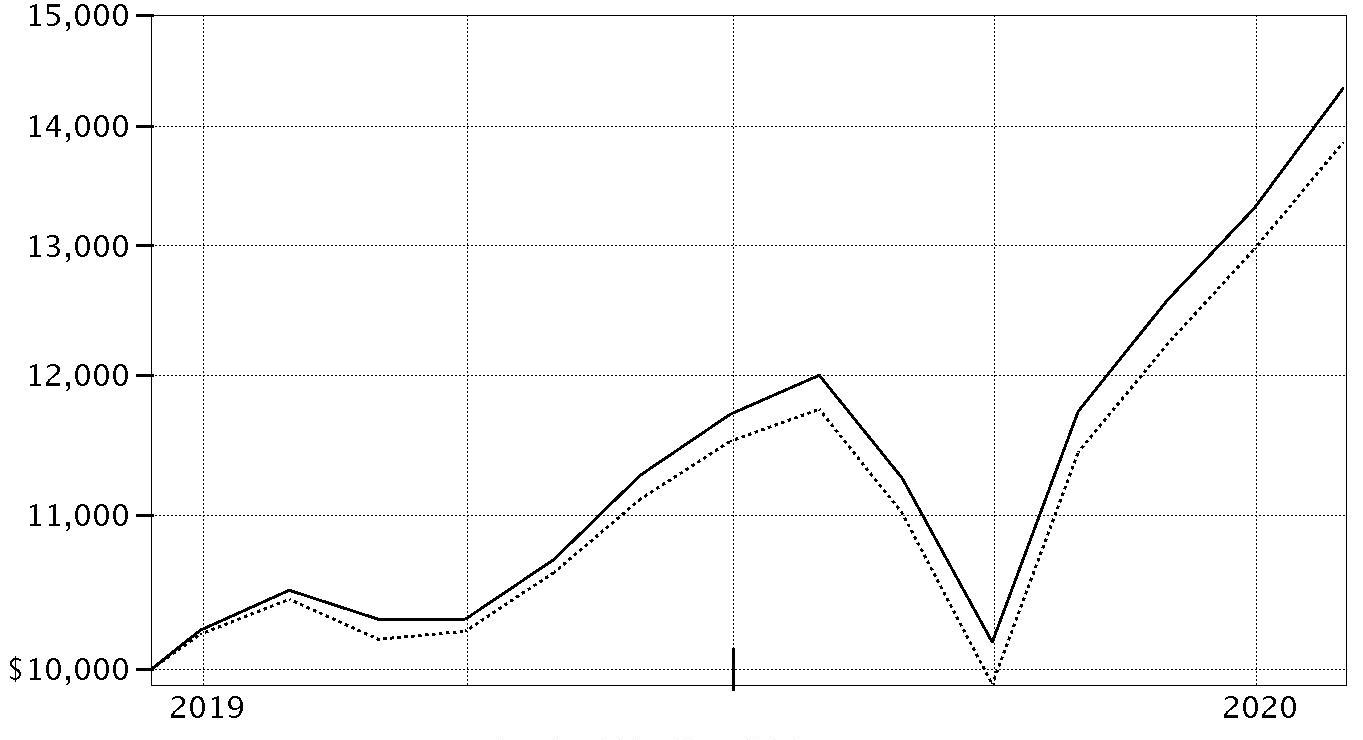
| Period Ending Values |
| $14,337 | Fidelity® OTC K6 Portfolio |
| $13,861 | Nasdaq Composite Index® |
Management's Discussion of Fund Performance
Market Recap: The S&P 500
® index gained 11.96% for the 12 months ending July 31, 2020, in what was a bumpy ride for U.S. equity investors, marked by a steep but brief decline due to the early-2020 outbreak and spread of the coronavirus, followed by a historic rebound. Declared a pandemic on March 11, the COVID-19 crisis and containment efforts caused broad contraction in economic activity, along with extreme uncertainty, volatility and dislocation in financial markets. By mid-March, U.S. stocks entered bear-market territory less than a month after hitting an all-time high and extending the longest-running bull market in American history. Stocks slid in late February, after a surge in COVID-19 cases outside China. The sudden downtrend continued in March (-12%), capping the index’s worst quarter since 2008. A historically rapid and expansive U.S. monetary/fiscal-policy response provided a partial offset to the economic disruption and fueled a sharp uptrend. Aggressive support for financial markets by the U.S. Federal Reserve, plans for reopening the economy and improving infection data boosted stocks in April (+13%) and May (+5%). In June and July, the index gained amid progress on potential treatments and signs of an early recovery in economic activity. For the full 12 months, growth stocks widely topped value, while large-caps handily bested smaller-caps. The information technology sector (+39%) led the way, followed by consumer discretionary (+22%). In contrast, energy (-38%) fell hard along with the price of crude oil.
Comments from Portfolio Manager Christopher Lin: For the fiscal year ending July 31, 2020, the fund gained 36.54%, outperforming the 32.78% advance of the benchmark NASDAQ Composite Index. The primary contributor to performance versus the benchmark was security selection in information technology. An underweighting and stock picking in financials also boosted the fund's relative result. Adding further value was security selection in the communication services sector, especially within the media & entertainment industry. The fund's top individual relative contributor was an out-of-benchmark stake in Shopify (+225%). We reduced this position the past year. Also lifting performance was our lighter-than-benchmark stake in Intel, which returned -4%. We also decreased this holding the past 12 months. The fund's non-benchmark position in Meituan Dianping, a position not held at period end, gained roughly 205%. Conversely, the primary detractor from performance versus the benchmark was stock selection in consumer discretionary. Weak picks in the health care sector, especially within the pharmaceuticals, biotechnology & life sciences industry, also hindered performance. Also detracting from the fund's relative result was stock picking in the industrials sector, primarily within the transportation industry. The biggest individual relative detractor was an underweight position in PayPal (+73%). This period we reduced our PayPal stake. Also weighing on performance versus the benchmark was an outsized stake in Lyft (-45%), as well as an underweighting in Amazon.com (+69%). Nevertheless, the latter was among our largest holdings at period end.
The views expressed above reflect those of the portfolio manager(s) only through the end of the period as stated on the cover of this report and do not necessarily represent the views of Fidelity or any other person in the Fidelity organization. Any such views are subject to change at any time based upon market or other conditions and Fidelity disclaims any responsibility to update such views. These views may not be relied on as investment advice and, because investment decisions for a Fidelity fund are based on numerous factors, may not be relied on as an indication of trading intent on behalf of any Fidelity fund.
Investment Summary (Unaudited)
Top Ten Stocks as of July 31, 2020
| | % of fund's net assets |
| Apple, Inc. | 11.3 |
| Microsoft Corp. | 10.7 |
| Amazon.com, Inc. | 10.4 |
| Alphabet, Inc. Class A | 5.5 |
| Facebook, Inc. Class A | 5.3 |
| Alphabet, Inc. Class C | 2.3 |
| Tesla, Inc. | 2.0 |
| NVIDIA Corp. | 1.8 |
| Starbucks Corp. | 1.5 |
| Adobe, Inc. | 1.4 |
| | 52.2 |
Top Five Market Sectors as of July 31, 2020
| | % of fund's net assets |
| Information Technology | 39.6 |
| Consumer Discretionary | 22.0 |
| Communication Services | 19.9 |
| Health Care | 8.0 |
| Financials | 2.7 |
Asset Allocation (% of fund's net assets)
| As of July 31, 2020* |
| | Stocks | 98.9% |
| | Short-Term Investments and Net Other Assets (Liabilities) | 1.1% |

* Foreign investments - 11.5%
Schedule of Investments July 31, 2020
Showing Percentage of Net Assets
| Common Stocks - 98.9% | | | |
| | | Shares | Value |
| COMMUNICATION SERVICES - 19.9% | | | |
| Entertainment - 2.3% | | | |
| Activision Blizzard, Inc. | | 126,462 | $10,449,555 |
| Electronic Arts, Inc. (a) | | 100 | 14,162 |
| NetEase, Inc. ADR | | 2,419 | 1,108,918 |
| Netflix, Inc. (a) | | 5,249 | 2,566,131 |
| Take-Two Interactive Software, Inc. (a) | | 20,459 | 3,355,685 |
| The Walt Disney Co. | | 40,233 | 4,704,847 |
| Zynga, Inc. (a) | | 100,445 | 987,374 |
| | | | 23,186,672 |
| Interactive Media & Services - 16.6% | | | |
| 58.com, Inc. ADR (a) | | 433 | 23,975 |
| Alphabet, Inc.: | | | |
| Class A (a) | | 37,689 | 56,079,348 |
| Class C (a) | | 16,012 | 23,745,156 |
| Eventbrite, Inc. (a) | | 943 | 8,034 |
| Facebook, Inc. Class A (a) | | 212,810 | 53,983,513 |
| InterActiveCorp (a) | | 8,452 | 1,119,214 |
| Match Group, Inc. (a) | | 61,496 | 6,315,639 |
| Tencent Holdings Ltd. sponsored ADR | | 187,168 | 12,819,136 |
| Twitter, Inc. (a) | | 287,038 | 10,448,183 |
| Yandex NV Series A (a) | | 108,962 | 6,269,673 |
| | | | 170,811,871 |
| Media - 0.7% | | | |
| Charter Communications, Inc. Class A (a) | | 11,688 | 6,779,040 |
| Wireless Telecommunication Services - 0.3% | | | |
| T-Mobile U.S., Inc. | | 34,037 | 3,654,893 |
|
| TOTAL COMMUNICATION SERVICES | | | 204,432,476 |
|
| CONSUMER DISCRETIONARY - 22.0% | | | |
| Automobiles - 2.0% | | | |
| Tesla, Inc. (a) | | 14,446 | 20,668,759 |
| Hotels, Restaurants & Leisure - 3.1% | | | |
| Caesars Entertainment, Inc. (a) | | 24,828 | 770,909 |
| Extended Stay America, Inc. unit | | 243,018 | 2,772,835 |
| Hilton Worldwide Holdings, Inc. | | 56,521 | 4,241,901 |
| Marriott International, Inc. Class A | | 96,961 | 8,127,756 |
| Starbucks Corp. | | 207,035 | 15,844,389 |
| | | | 31,757,790 |
| Household Durables - 0.9% | | | |
| Lennar Corp. Class A | | 123,962 | 8,968,651 |
| Internet & Direct Marketing Retail - 12.2% | | | |
| Alibaba Group Holding Ltd. sponsored ADR (a) | | 29,400 | 7,379,988 |
| Amazon.com, Inc. (a) | | 33,584 | 106,282,613 |
| Expedia, Inc. | | 36,556 | 2,961,402 |
| MercadoLibre, Inc. (a) | | 1,384 | 1,556,474 |
| The Booking Holdings, Inc. (a) | | 3,864 | 6,422,470 |
| | | | 124,602,947 |
| Multiline Retail - 0.7% | | | |
| Dollar Tree, Inc. (a) | | 80,918 | 7,553,695 |
| Specialty Retail - 1.5% | | | |
| Burlington Stores, Inc. (a) | | 3,084 | 579,792 |
| Five Below, Inc. (a) | | 54,512 | 5,936,902 |
| Lowe's Companies, Inc. | | 54,141 | 8,062,136 |
| The Home Depot, Inc. | | 4,500 | 1,194,705 |
| | | | 15,773,535 |
| Textiles, Apparel & Luxury Goods - 1.6% | | | |
| Kontoor Brands, Inc. | | 292 | 5,595 |
| lululemon athletica, Inc. (a) | | 41,552 | 13,528,916 |
| LVMH Moet Hennessy Louis Vuitton SE | | 6,304 | 2,741,251 |
| | | | 16,275,762 |
|
| TOTAL CONSUMER DISCRETIONARY | | | 225,601,139 |
|
| CONSUMER STAPLES - 2.2% | | | |
| Beverages - 1.6% | | | |
| Diageo PLC | | 150,345 | 5,501,222 |
| Kweichow Moutai Co. Ltd. (A Shares) | | 4,700 | 1,130,792 |
| Monster Beverage Corp. (a) | | 92,827 | 7,285,063 |
| PepsiCo, Inc. | | 17,104 | 2,354,537 |
| | | | 16,271,614 |
| Food & Staples Retailing - 0.5% | | | |
| Costco Wholesale Corp. | | 14,637 | 4,764,783 |
| Food Products - 0.1% | | | |
| Lamb Weston Holdings, Inc. | | 7,000 | 420,560 |
| Mondelez International, Inc. | | 13,714 | 760,990 |
| | | | 1,181,550 |
|
| TOTAL CONSUMER STAPLES | | | 22,217,947 |
|
| ENERGY - 1.4% | | | |
| Oil, Gas & Consumable Fuels - 1.4% | | | |
| Cenovus Energy, Inc. (Canada) | | 7,155 | 31,837 |
| Centennial Resource Development, Inc. Class A (a) | | 38,555 | 30,354 |
| EOG Resources, Inc. | | 551 | 25,814 |
| Reliance Industries Ltd. | | 396,200 | 10,931,460 |
| Reliance Industries Ltd. (a) | | 26,413 | 415,056 |
| Reliance Industries Ltd. sponsored GDR (b) | | 60,400 | 3,328,040 |
| | | | 14,762,561 |
| FINANCIALS - 2.7% | | | |
| Banks - 1.2% | | | |
| Huntington Bancshares, Inc. | | 751,092 | 6,962,623 |
| PacWest Bancorp | | 100,603 | 1,838,520 |
| Signature Bank | | 36,987 | 3,792,277 |
| | | | 12,593,420 |
| Capital Markets - 1.0% | | | |
| CME Group, Inc. | | 8,387 | 1,393,752 |
| London Stock Exchange Group PLC | | 32,800 | 3,623,053 |
| S&P Global, Inc. | | 16,167 | 5,662,492 |
| | | | 10,679,297 |
| Consumer Finance - 0.5% | | | |
| Capital One Financial Corp. | | 72,082 | 4,598,832 |
|
| TOTAL FINANCIALS | | | 27,871,549 |
|
| HEALTH CARE - 8.0% | | | |
| Biotechnology - 4.1% | | | |
| Agios Pharmaceuticals, Inc. (a) | | 11,611 | 526,211 |
| Alexion Pharmaceuticals, Inc. (a) | | 46,108 | 4,725,609 |
| Alnylam Pharmaceuticals, Inc. (a) | | 11,128 | 1,622,017 |
| Amgen, Inc. | | 38,453 | 9,408,296 |
| Arcutis Biotherapeutics, Inc. (a) | | 17,472 | 466,502 |
| Ascendis Pharma A/S sponsored ADR (a) | | 4,637 | 638,098 |
| ChemoCentryx, Inc. (a) | | 9,950 | 524,465 |
| Chimerix, Inc. (a) | | 2,008 | 6,245 |
| FibroGen, Inc. (a) | | 7,391 | 299,114 |
| G1 Therapeutics, Inc. (a) | | 12,124 | 177,859 |
| GenSight Biologics SA (a)(b) | | 9,165 | 32,280 |
| Global Blood Therapeutics, Inc. (a)(c) | | 52,885 | 3,568,680 |
| Intercept Pharmaceuticals, Inc. (a) | | 8,973 | 409,528 |
| Ionis Pharmaceuticals, Inc. (a) | | 1,410 | 81,160 |
| Neurocrine Biosciences, Inc. (a) | | 30,953 | 3,725,503 |
| Regeneron Pharmaceuticals, Inc. (a) | | 13,482 | 8,521,568 |
| Sarepta Therapeutics, Inc. (a) | | 7,987 | 1,226,164 |
| Trevena, Inc. (a)(c) | | 19,280 | 44,730 |
| Vertex Pharmaceuticals, Inc. (a) | | 15,849 | 4,310,928 |
| Xencor, Inc. (a) | | 51,674 | 1,554,871 |
| | | | 41,869,828 |
| Health Care Equipment & Supplies - 1.8% | | | |
| DexCom, Inc. (a) | | 15,595 | 6,792,246 |
| Insulet Corp. (a) | | 28,638 | 5,823,824 |
| Intuitive Surgical, Inc. (a) | | 5,879 | 4,029,702 |
| Masimo Corp. (a) | | 2,793 | 614,795 |
| Neuronetics, Inc. (a) | | 1,672 | 4,464 |
| Tandem Diabetes Care, Inc. (a) | | 8,883 | 927,918 |
| | | | 18,192,949 |
| Health Care Providers & Services - 0.5% | | | |
| Cigna Corp. | | 6,921 | 1,195,187 |
| Humana, Inc. | | 10,778 | 4,229,826 |
| | | | 5,425,013 |
| Health Care Technology - 0.0% | | | |
| Castlight Health, Inc. Class B (a) | | 2,013 | 2,214 |
| Life Sciences Tools & Services - 1.0% | | | |
| 10X Genomics, Inc. (a) | | 23,429 | 2,304,711 |
| Bruker Corp. | | 101,283 | 4,519,247 |
| Nanostring Technologies, Inc. (a) | | 85,624 | 3,091,883 |
| | | | 9,915,841 |
| Pharmaceuticals - 0.6% | | | |
| AstraZeneca PLC: | | | |
| (United Kingdom) | | 5,310 | 586,647 |
| sponsored ADR | | 60,302 | 3,363,646 |
| Elanco Animal Health, Inc. (a) | | 3,819 | 90,243 |
| Roche Holding AG (participation certificate) | | 6,120 | 2,119,702 |
| TherapeuticsMD, Inc. (a)(c) | | 14,855 | 27,482 |
| | | | 6,187,720 |
|
| TOTAL HEALTH CARE | | | 81,593,565 |
|
| INDUSTRIALS - 2.4% | | | |
| Airlines - 0.1% | | | |
| Copa Holdings SA Class A | | 17,039 | 706,096 |
| Commercial Services & Supplies - 0.3% | | | |
| Copart, Inc. (a) | | 18,238 | 1,700,694 |
| Waste Connection, Inc. (United States) | | 17,000 | 1,740,290 |
| | | | 3,440,984 |
| Industrial Conglomerates - 0.0% | | | |
| Roper Technologies, Inc. | | 1,200 | 518,940 |
| Professional Services - 0.5% | | | |
| Verisk Analytics, Inc. | | 24,505 | 4,624,339 |
| Road & Rail - 1.5% | | | |
| CSX Corp. | | 52,748 | 3,763,042 |
| Lyft, Inc. (a) | | 103,629 | 3,029,076 |
| Rumo SA (a) | | 473,000 | 2,014,753 |
| Uber Technologies, Inc. (a) | | 209,969 | 6,353,662 |
| | | | 15,160,533 |
|
| TOTAL INDUSTRIALS | | | 24,450,892 |
|
| INFORMATION TECHNOLOGY - 39.6% | | | |
| IT Services - 3.0% | | | |
| Black Knight, Inc. (a) | | 16,272 | 1,219,098 |
| Fidelity National Information Services, Inc. | | 17,099 | 2,501,755 |
| Gartner, Inc. (a) | | 58,312 | 7,268,008 |
| Genpact Ltd. | | 24,014 | 956,237 |
| MasterCard, Inc. Class A | | 28,841 | 8,898,314 |
| PayPal Holdings, Inc. (a) | | 35,886 | 7,036,168 |
| Reply SpA | | 11,200 | 1,022,461 |
| Shopify, Inc. Class A (a) | | 1,924 | 1,967,566 |
| Visa, Inc. Class A | | 2,050 | 390,320 |
| | | | 31,259,927 |
| Semiconductors & Semiconductor Equipment - 8.3% | | | |
| Advanced Micro Devices, Inc. (a) | | 36,100 | 2,795,223 |
| Analog Devices, Inc. | | 21,320 | 2,448,602 |
| Applied Materials, Inc. | | 28,616 | 1,840,867 |
| ASML Holding NV | | 15,418 | 5,453,655 |
| Intel Corp. | | 4,347 | 207,482 |
| Lam Research Corp. | | 9,470 | 3,571,705 |
| Marvell Technology Group Ltd. | | 323,441 | 11,795,893 |
| Micron Technology, Inc. (a) | | 129,461 | 6,480,170 |
| NVIDIA Corp. | | 42,297 | 17,958,883 |
| NXP Semiconductors NV | | 111,813 | 13,141,382 |
| Qualcomm, Inc. | | 133,639 | 14,113,615 |
| Skyworks Solutions, Inc. | | 5,096 | 741,876 |
| Taiwan Semiconductor Manufacturing Co. Ltd. sponsored ADR | | 58,342 | 4,602,600 |
| | | | 85,151,953 |
| Software - 16.1% | | | |
| Adobe, Inc. (a) | | 33,239 | 14,768,752 |
| ANSYS, Inc. (a) | | 5,600 | 1,739,360 |
| Aspen Technology, Inc. (a) | | 60,084 | 5,843,770 |
| Autodesk, Inc. (a) | | 17,762 | 4,199,470 |
| Dropbox, Inc. Class A (a) | | 8,329 | 189,485 |
| Elastic NV (a) | | 28,946 | 2,784,316 |
| Epic Games, Inc. (d)(e)(f) | | 1,000 | 575,000 |
| Five9, Inc. (a) | | 9,000 | 1,087,380 |
| Globant SA (a) | | 8,398 | 1,452,350 |
| HIVE Blockchain Technologies Ltd. (a) | | 108,159 | 39,163 |
| Intuit, Inc. | | 16,699 | 5,116,073 |
| Manhattan Associates, Inc. (a) | | 41,183 | 3,944,920 |
| Microsoft Corp. | | 533,917 | 109,458,324 |
| Netcompany Group A/S (a)(b) | | 2,792 | 200,511 |
| NICE Systems Ltd. sponsored ADR (a) | | 13,300 | 2,729,692 |
| Salesforce.com, Inc. (a) | | 50,553 | 9,850,252 |
| Workday, Inc. Class A (a) | | 5,824 | 1,053,678 |
| | | | 165,032,496 |
| Technology Hardware, Storage & Peripherals - 12.2% | | | |
| Apple, Inc. | | 272,214 | 115,701,838 |
| Samsung Electronics Co. Ltd. | | 63,722 | 3,085,231 |
| Western Digital Corp. | | 151,562 | 6,532,322 |
| | | | 125,319,391 |
|
| TOTAL INFORMATION TECHNOLOGY | | | 406,763,767 |
|
| MATERIALS - 0.5% | | | |
| Chemicals - 0.2% | | | |
| LG Chemical Ltd. | | 1,822 | 865,399 |
| Livent Corp. (a)(c) | | 164,379 | 1,030,656 |
| | | | 1,896,055 |
| Paper & Forest Products - 0.3% | | | |
| Suzano Papel e Celulose SA (a) | | 447,800 | 3,605,371 |
|
| TOTAL MATERIALS | | | 5,501,426 |
|
| REAL ESTATE - 0.2% | | | |
| Equity Real Estate Investment Trusts (REITs) - 0.2% | | | |
| Equinix, Inc. | | 2,069 | 1,625,158 |
| TOTAL COMMON STOCKS | | | |
| (Cost $827,226,849) | | | 1,014,820,480 |
|
| Nonconvertible Preferred Stocks - 0.0% | | | |
| CONSUMER DISCRETIONARY - 0.0% | | | |
| Automobiles - 0.0% | | | |
| Waymo LLC Series A2 (e)(f) | | | |
| (Cost $211,834) | | 2,467 | 211,834 |
|
| Money Market Funds - 1.1% | | | |
| Fidelity Cash Central Fund 0.14% (g) | | 7,877,610 | 7,879,973 |
| Fidelity Securities Lending Cash Central Fund 0.13% (g)(h) | | 2,758,093 | 2,758,369 |
| TOTAL MONEY MARKET FUNDS | | | |
| (Cost $10,638,065) | | | 10,638,342 |
| TOTAL INVESTMENT IN SECURITIES - 100.0% | | | |
| (Cost $838,076,748) | | | 1,025,670,656 |
| NET OTHER ASSETS (LIABILITIES) - 0.0% | | | 440,444 |
| NET ASSETS - 100% | | | $1,026,111,100 |
Legend
(a) Non-income producing
(b) Security exempt from registration under Rule 144A of the Securities Act of 1933. These securities may be resold in transactions exempt from registration, normally to qualified institutional buyers. At the end of the period, the value of these securities amounted to $3,560,831 or 0.3% of net assets.
(c) Security or a portion of the security is on loan at period end.
(d) Security or a portion of the security purchased on a delayed delivery or when-issued basis.
(e) Restricted securities (including private placements) - Investment in securities not registered under the Securities Act of 1933 (excluding 144A issues). At the end of the period, the value of restricted securities (excluding 144A issues) amounted to $786,834 or 0.1% of net assets.
(f) Level 3 security
(g) Affiliated fund that is generally available only to investment companies and other accounts managed by Fidelity Investments. The rate quoted is the annualized seven-day yield of the fund at period end. A complete unaudited listing of the fund's holdings as of its most recent quarter end is available upon request. In addition, each Fidelity Central Fund's financial statements, which are not covered by the Fund's Report of Independent Registered Public Accounting Firm, are available on the SEC's website or upon request.
(h) Investment made with cash collateral received from securities on loan.
Additional information on each restricted holding is as follows:
| Security | Acquisition Date | Acquisition Cost |
| Epic Games, Inc. | 7/13/20 - 7/30/20 | $575,000 |
| Waymo LLC Series A2 | 5/8/20 | $211,834 |
Affiliated Central Funds
Information regarding fiscal year to date income earned by the Fund from investments in Fidelity Central Funds is as follows:
| Fund | Income earned |
| Fidelity Cash Central Fund | $16,937 |
| Fidelity Securities Lending Cash Central Fund | 104,325 |
| Total | $121,262 |
Amounts in the income column in the above table include any capital gain distributions from underlying funds, which are presented in the corresponding line-item in the Statement of Operations, if applicable. Amount for Fidelity Securities Lending Cash Central Fund represents the income earned on investing cash collateral, less rebates paid to borrowers and any lending agent fees associated with the loan, plus any premium payments received for lending certain types of securities.
Investment Valuation
The following is a summary of the inputs used, as of July 31, 2020, involving the Fund's assets and liabilities carried at fair value. The inputs or methodology used for valuing securities may not be an indication of the risk associated with investing in those securities. For more information on valuation inputs, and their aggregation into the levels used below, please refer to the Investment Valuation section in the accompanying Notes to Financial Statements.
| | Valuation Inputs at Reporting Date: |
| Description | Total | Level 1 | Level 2 | Level 3 |
| Investments in Securities: | | | | |
| Equities: | | | | |
| Communication Services | $204,432,476 | $204,432,476 | $-- | $-- |
| Consumer Discretionary | 225,812,973 | 222,859,888 | 2,741,251 | 211,834 |
| Consumer Staples | 22,217,947 | 16,716,725 | 5,501,222 | -- |
| Energy | 14,762,561 | 14,762,561 | -- | -- |
| Financials | 27,871,549 | 24,248,496 | 3,623,053 | -- |
| Health Care | 81,593,565 | 78,887,216 | 2,706,349 | -- |
| Industrials | 24,450,892 | 24,450,892 | -- | -- |
| Information Technology | 406,763,767 | 406,188,767 | -- | 575,000 |
| Materials | 5,501,426 | 5,501,426 | -- | -- |
| Real Estate | 1,625,158 | 1,625,158 | -- | -- |
| Money Market Funds | 10,638,342 | 10,638,342 | -- | -- |
| Total Investments in Securities: | $1,025,670,656 | $1,010,311,947 | $14,571,875 | $786,834 |
Other Information
Distribution of investments by country or territory of incorporation, as a percentage of Total Net Assets, is as follows (Unaudited):
| United States of America | 88.5% |
| Netherlands | 2.7% |
| Cayman Islands | 2.0% |
| India | 1.4% |
| United Kingdom | 1.4% |
| Bermuda | 1.3% |
| Others (Individually Less Than 1%) | 2.7% |
| | 100.0% |
See accompanying notes which are an integral part of the financial statements.
Financial Statements
Statement of Assets and Liabilities
| | | July 31, 2020 |
| Assets | | |
Investment in securities, at value (including securities loaned of $2,597,089) — See accompanying schedule:
Unaffiliated issuers (cost $827,438,683) | $1,015,032,314 | |
| Fidelity Central Funds (cost $10,638,065) | 10,638,342 | |
| Total Investment in Securities (cost $838,076,748) | | $1,025,670,656 |
| Cash | | 5,047 |
| Receivable for investments sold | | 7,918,578 |
| Receivable for fund shares sold | | 1,029,129 |
| Dividends receivable | | 64,912 |
| Distributions receivable from Fidelity Central Funds | | 13,311 |
| Other receivables | | 8,816 |
| Total assets | | 1,034,710,449 |
| Liabilities | | |
| Payable for investments purchased | | |
| Regular delivery | $2,490,685 | |
| Delayed delivery | 402,500 | |
| Payable for fund shares redeemed | 1,683,659 | |
| Accrued management fee | 405,762 | |
| Other payables and accrued expenses | 858,093 | |
| Collateral on securities loaned | 2,758,650 | |
| Total liabilities | | 8,599,349 |
| Net Assets | | $1,026,111,100 |
| Net Assets consist of: | | |
| Paid in capital | | $839,583,832 |
| Total accumulated earnings (loss) | | 186,527,268 |
| Net Assets | | $1,026,111,100 |
| Net Asset Value, offering price and redemption price per share ($1,026,111,100 ÷ 71,827,298 shares) | | $14.29 |
See accompanying notes which are an integral part of the financial statements.
Statement of Operations
| | | Year ended July 31, 2020 |
| Investment Income | | |
| Dividends | | $2,458,192 |
| Income from Fidelity Central Funds (including $104,325 from security lending) | | 121,262 |
| Total income | | 2,579,454 |
| Expenses | | |
| Management fee | $1,956,927 | |
| Independent trustees' fees and expenses | 1,778 | |
| Interest | 178 | |
| Miscellaneous | 2,157 | |
| Total expenses before reductions | 1,961,040 | |
| Expense reductions | (16,857) | |
| Total expenses after reductions | | 1,944,183 |
| Net investment income (loss) | | 635,271 |
| Realized and Unrealized Gain (Loss) | | |
| Net realized gain (loss) on: | | |
| Investment securities: | | |
| Unaffiliated issuers | 45,609 | |
| Fidelity Central Funds | 344 | |
| Foreign currency transactions | (51,990) | |
| Total net realized gain (loss) | | (6,037) |
| Change in net unrealized appreciation (depreciation) on: | | |
| Investment securities: | | |
| Unaffiliated issuers (net of increase in deferred foreign taxes of $856,566) | 186,689,153 | |
| Fidelity Central Funds | 277 | |
| Assets and liabilities in foreign currencies | (276) | |
| Total change in net unrealized appreciation (depreciation) | | 186,689,154 |
| Net gain (loss) | | 186,683,117 |
| Net increase (decrease) in net assets resulting from operations | | $187,318,388 |
See accompanying notes which are an integral part of the financial statements.
Statement of Changes in Net Assets
| | Year ended July 31, 2020 | For the period
June 13, 2019 (commencement of operations) to July 31, 2019 |
| Increase (Decrease) in Net Assets | | |
| Operations | | |
| Net investment income (loss) | $635,271 | $107 |
| Net realized gain (loss) | (6,037) | 2,342 |
| Change in net unrealized appreciation (depreciation) | 186,689,154 | 47,911 |
| Net increase (decrease) in net assets resulting from operations | 187,318,388 | 50,360 |
| Distributions to shareholders | (841,481) | – |
| Share transactions | | |
| Proceeds from sales of shares | 1,008,628,171 | 1,000,000 |
| Reinvestment of distributions | 841,481 | – |
| Cost of shares redeemed | (170,885,819) | – |
| Net increase (decrease) in net assets resulting from share transactions | 838,583,833 | 1,000,000 |
| Total increase (decrease) in net assets | 1,025,060,740 | 1,050,360 |
| Net Assets | | |
| Beginning of period | 1,050,360 | – |
| End of period | $1,026,111,100 | $1,050,360 |
| Other Information | | |
| Shares | | |
| Sold | 85,930,200 | 100,000 |
| Issued in reinvestment of distributions | 74,239 | – |
| Redeemed | (14,277,141) | – |
| Net increase (decrease) | 71,727,298 | 100,000 |
See accompanying notes which are an integral part of the financial statements.
Financial Highlights
Fidelity OTC K6 Portfolio
| | | |
| Years ended July 31, | 2020 | 2019 A |
| Selected Per–Share Data | | |
| Net asset value, beginning of period | $10.50 | $10.00 |
| Income from Investment Operations | | |
| Net investment income (loss)B | .02 | –C |
| Net realized and unrealized gain (loss) | 3.81 | .50 |
| Total from investment operations | 3.83 | .50 |
| Distributions from net investment income | (.01) | – |
| Distributions from net realized gain | (.02) | – |
| Total distributions | (.04)D | – |
| Net asset value, end of period | $14.29 | $10.50 |
| Total ReturnE,F | 36.54% | 5.00% |
| Ratios to Average Net AssetsG,H | | |
| Expenses before reductions | .50% | .50%I |
| Expenses net of fee waivers, if any | .50% | .50%I |
| Expenses net of all reductions | .49% | .50%I |
| Net investment income (loss) | .16% | .08%I |
| Supplemental Data | | |
| Net assets, end of period (000 omitted) | $1,026,111 | $1,050 |
| Portfolio turnover rateJ | 102%K | 5%L |
A For the period June 13, 2019 (commencement of operations) to July 31, 2019.
B Calculated based on average shares outstanding during the period.
C Amount represents less than $.005 per share.
D Total distributions of $.04 per share is comprised of distributions from net investment income of $.013 and distributions from net realized gain of $.024 per share.
E Total returns for periods of less than one year are not annualized.
F Total returns would have been lower if certain expenses had not been reduced during the applicable periods shown.
G Fees and expenses of any underlying mutual funds or exchange-traded funds (ETFs) are not included in the Fund's expense ratio. The Fund indirectly bears its proportionate share of these expenses. For additional expense information related to investments in Fidelity Central Funds, please refer to the "Investments in Fidelity Central Funds" note found in the Notes to Financial Statements section of the most recent Annual or Semi-Annual report.
H Expense ratios reflect operating expenses of the Fund. Expenses before reductions do not reflect amounts reimbursed by the investment adviser or reductions from brokerage service arrangements or reductions from other expense offset arrangements and do not represent the amount paid by the Fund during periods when reimbursements or reductions occur. Expenses net of fee waivers reflect expenses after reimbursement by the investment adviser but prior to reductions from brokerage service arrangements or other expense offset arrangements. Expenses net of all reductions represent the net expenses paid by the Fund.
I Annualized
J Amount does not include the portfolio activity of any underlying Fidelity Central Funds.
K Portfolio turnover rate excludes securities received or delivered in-kind.
L Amount not annualized.
See accompanying notes which are an integral part of the financial statements.
Notes to Financial Statements
For the period ended July 31, 2020
1. Organization.
Fidelity OTC K6 Portfolio (the Fund) is a non-diversified fund of Fidelity Securities Fund (the Trust) and is authorized to issue an unlimited number of shares. Share transactions on the Statement of Changes in Net Assets may contain exchanges between affiliated funds. The Trust is registered under the Investment Company Act of 1940, as amended (the 1940 Act), as an open-end management investment company organized as a Massachusetts business trust. Shares generally are available only to employer-sponsored retirement plans that are recordkept by Fidelity, or to certain employer-sponsored retirement plans that are not recordkept by Fidelity.
Effective January 1, 2020:
Investment advisers Fidelity Investments Money Management, Inc., FMR Co., Inc., and Fidelity SelectCo, LLC, merged with and into Fidelity Management & Research Company. In connection with the merger transactions, the resulting, merged investment adviser was then redomiciled from Massachusetts to Delaware, changed its corporate structure from a corporation to a limited liability company, and changed its name to "Fidelity Management & Research Company LLC".
2. Investments in Fidelity Central Funds.
The Fund invests in Fidelity Central Funds, which are open-end investment companies generally available only to other investment companies and accounts managed by the investment adviser and its affiliates. The Fund's Schedule of Investments lists each of the Fidelity Central Funds held as of period end, if any as an investment of the Fund, but does not include the underlying holdings of each Fidelity Central Fund. As an Investing Fund, the Fund indirectly bears its proportionate share of the expenses of the underlying Fidelity Central Funds.
The Money Market Central Funds seek preservation of capital and current income and are managed by the investment adviser. Annualized expenses of the Money Market Central Funds as of their most recent shareholder report date ranged from less than .005% to .01%.
A complete unaudited list of holdings for each Fidelity Central Fund is available upon request or at the Securities and Exchange Commission (the SEC) website at www.sec.gov. In addition, the financial statements of the Fidelity Central Funds, which are not covered by the Fund's Report of Independent Registered Public Accounting Firm, are available on the SEC website or upon request.
3. Significant Accounting Policies.
The Fund is an investment company and applies the accounting and reporting guidance of the Financial Accounting Standards Board (FASB) Accounting Standards Codification Topic 946 Financial Services – Investment Companies. The financial statements have been prepared in conformity with accounting principles generally accepted in the United States of America (GAAP), which require management to make certain estimates and assumptions at the date of the financial statements. Actual results could differ from those estimates. Subsequent events, if any, through the date that the financial statements were issued have been evaluated in the preparation of the financial statements. The following summarizes the significant accounting policies of the Fund:
Investment Valuation. Investments are valued as of 4:00 p.m. Eastern time on the last calendar day of the period. The Board of Trustees (the Board) has delegated the day to day responsibility for the valuation of the Fund's investments to the Fair Value Committee (the Committee) established by the Fund's investment adviser. In accordance with valuation policies and procedures approved by the Board, the Fund attempts to obtain prices from one or more third party pricing vendors or brokers to value its investments. When current market prices, quotations or currency exchange rates are not readily available or reliable, investments will be fair valued in good faith by the Committee, in accordance with procedures adopted by the Board. Factors used in determining fair value vary by investment type and may include market or investment specific events. The frequency with which these procedures are used cannot be predicted and they may be utilized to a significant extent. The Committee oversees the Fund's valuation policies and procedures and reports to the Board on the Committee's activities and fair value determinations. The Board monitors the appropriateness of the procedures used in valuing the Fund's investments and ratifies the fair value determinations of the Committee.
The Fund categorizes the inputs to valuation techniques used to value its investments into a disclosure hierarchy consisting of three levels as shown below:
- Level 1 – quoted prices in active markets for identical investments
- Level 2 – other significant observable inputs (including quoted prices for similar investments, interest rates, prepayment speeds, etc.)
- Level 3 – unobservable inputs (including the Fund's own assumptions based on the best information available)
Valuation techniques used to value the Fund's investments by major category are as follows:
Equity securities, including restricted securities, for which market quotations are readily available, are valued at the last reported sale price or official closing price as reported by a third party pricing vendor on the primary market or exchange on which they are traded and are categorized as Level 1 in the hierarchy. In the event there were no sales during the day or closing prices are not available, securities are valued at the last quoted bid price or may be valued using the last available price and are generally categorized as Level 2 in the hierarchy. For foreign equity securities, when market or security specific events arise, comparisons to the valuation of American Depositary Receipts (ADRs), futures contracts, Exchange-Traded Funds (ETFs) and certain indexes as well as quoted prices for similar securities may be used and would be categorized as Level 2 in the hierarchy. For equity securities, including restricted securities, where observable inputs are limited, assumptions about market activity and risk are used and these securities may be categorized as Level 3 in the hierarchy.
Investments in open-end mutual funds, including the Fidelity Central Funds, are valued at their closing net asset value (NAV) each business day and are categorized as Level 1 in the hierarchy.
Changes in valuation techniques may result in transfers in or out of an assigned level within the disclosure hierarchy. The aggregate value of investments by input level as of July 31, 2020 is included at the end of the Fund's Schedule of Investments.
Foreign Currency. The Fund may use foreign currency contracts to facilitate transactions in foreign-denominated securities. Gains and losses from these transactions may arise from changes in the value of the foreign currency or if the counterparties do not perform under the contracts' terms.
Foreign-denominated assets, including investment securities, and liabilities are translated into U.S. dollars at the exchange rates at period end. Purchases and sales of investment securities, income and dividends received and expenses denominated in foreign currencies are translated into U.S. dollars at the exchange rate in effect on the transaction date.
The effects of exchange rate fluctuations on investments are included with the net realized and unrealized gain (loss) on investment securities. Other foreign currency transactions resulting in realized and unrealized gain (loss) are disclosed separately.
Investment Transactions and Income. For financial reporting purposes, the Fund's investment holdings and NAV include trades executed through the end of the last business day of the period. The NAV per share for processing shareholder transactions is calculated as of the close of business of the New York Stock Exchange (NYSE), normally 4:00 p.m. Eastern time and includes trades executed through the end of the prior business day. Gains and losses on securities sold are determined on the basis of identified cost. Dividend income is recorded on the ex-dividend date, except for certain dividends from foreign securities where the ex-dividend date may have passed, which are recorded as soon as the Fund is informed of the ex-dividend date. Non-cash dividends included in dividend income, if any, are recorded at the fair market value of the securities received. Income and capital gain distributions from Fidelity Central Funds, if any, are recorded on the ex-dividend date. Certain distributions received by the Fund represent a return of capital or capital gain. The Fund determines the components of these distributions subsequent to the ex-dividend date, based upon receipt of tax filings or other correspondence relating to the underlying investment. These distributions are recorded as a reduction of cost of investments and/or as a realized gain. Investment income is recorded net of foreign taxes withheld where recovery of such taxes is uncertain.
Expenses. Expenses directly attributable to a fund are charged to that fund. Expenses attributable to more than one fund are allocated among the respective funds on the basis of relative net assets or other appropriate methods. Expense estimates are accrued in the period to which they relate and adjustments are made when actual amounts are known.
Income Tax Information and Distributions to Shareholders. Each year, the Fund intends to qualify as a regulated investment company under Subchapter M of the Internal Revenue Code, including distributing substantially all of its taxable income and realized gains. As a result, no provision for U.S. Federal income taxes is required. As of July 31, 2020, the Fund did not have any unrecognized tax benefits in the financial statements; nor is the Fund aware of any tax positions for which it is reasonably possible that the total amounts of unrecognized tax benefits will significantly change in the next twelve months. The Fund files a U.S. federal tax return, in addition to state and local tax returns as required. The Fund's federal income tax returns are subject to examination by the Internal Revenue Service (IRS) for a period of three fiscal years after they are filed. State and local tax returns may be subject to examination for an additional fiscal year depending on the jurisdiction. Foreign taxes are provided for based on the Fund's understanding of the tax rules and rates that exist in the foreign markets in which it invests. The Fund is subject to a tax imposed on capital gains by certain countries in which it invests. An estimated deferred tax liability for net unrealized appreciation on the applicable securities is included in Other payables and accrued expenses on the Statement of Assets & Liabilities.
Distributions are declared and recorded on the ex-dividend date. Income and capital gain distributions are determined in accordance with income tax regulations, which may differ from GAAP.
Capital accounts within the financial statements are adjusted for permanent book-tax differences. These adjustments have no impact on net assets or the results of operations. Capital accounts are not adjusted for temporary book-tax differences which will reverse in a subsequent period.
Book-tax differences are primarily due to foreign currency transactions, passive foreign investment companies (PFIC) and losses deferred due to wash sales.
As of period end, the cost and unrealized appreciation (depreciation) in securities, and derivatives if applicable, for federal income tax purposes were as follows:
| Gross unrealized appreciation | $196,062,197 |
| Gross unrealized depreciation | (12,256,555) |
| Net unrealized appreciation (depreciation) | $183,805,642 |
| Tax Cost | $841,865,014 |
The tax-based components of distributable earnings as of period end were as follows:
| Undistributed ordinary income | $3,561,622 |
| Undistributed long-term capital gain | $16,846 |
| Net unrealized appreciation (depreciation) on securities and other investments | $183,805,365 |
Due to large subscriptions in the period, the Fund is subject to an annual limit on its use of some of its unrealized capital losses to offset capital gains in future periods. If those capital losses are realized and the limitation prevents the Fund from using any of those capital losses in a future period, those capital losses will be available to offset capital gains in subsequent periods.
The tax character of distributions paid was as follows:
| | July 31, 2020 | July 31, 2019(a) |
| Ordinary Income | $841,481 | $ - |
(a) For the period June 13, 2019 (commencement of operations) to July 31, 2019.
Delayed Delivery Transactions and When-Issued Securities. During the period, the Fund transacted in securities on a delayed delivery or when-issued basis. Payment and delivery may take place after the customary settlement period for that security. The price of the underlying securities and the date when the securities will be delivered and paid for are fixed at the time the transaction is negotiated. The securities purchased on a delayed delivery or when-issued basis are identified as such in the Fund's Schedule of Investments. Losses may arise due to changes in the value of the underlying securities or if the counterparty does not perform under the contract's terms, or if the issuer does not issue the securities due to political, economic, or other factors.
Restricted Securities (including Private Placements). The Fund may invest in securities that are subject to legal or contractual restrictions on resale. These securities generally may be resold in transactions exempt from registration or to the public if the securities are registered. Disposal of these securities may involve time-consuming negotiations and expense, and prompt sale at an acceptable price may be difficult. Information regarding restricted securities is included at the end of the Fund's Schedule of Investments.
4. Purchases and Sales of Investments.
Purchases and sales of securities, other than short-term securities and in-kind transactions, are noted in the table below.
| | Purchases ($) | Sales ($) |
| Fidelity OTC K6 Portfolio | 372,295,598 | 331,272,263 |
Unaffiliated Exchanges In-Kind. During the period, the Fund received investments, and cash, valued at $617,860,752 in exchange for 50,852,272 shares of the Fund. The amount of in-kind exchanges is included in share transactions in the accompanying Statement of Changes in Net Assets.
5. Fees and Other Transactions with Affiliates.
Management Fee. Fidelity Management & Research Company LLC (the investment adviser) and its affiliates provide the Fund with investment management related services for which the Fund pays a monthly management fee that is based on an annual rate of .50% of average net assets. Under the management contract, the investment adviser or an affiliate pays all other expenses of the Fund, excluding fees and expenses of the independent Trustees, and certain miscellaneous expenses such as proxy and shareholder meeting expenses.
Brokerage Commissions. A portion of portfolio transactions were placed with brokerage firms which are affiliates of the investment adviser. Brokerage commissions are included in net realized gain (loss) and change in net unrealized appreciation (depreciation) in the Statement of Operations. The commissions paid to these affiliated firms were as follows:
| | Amount |
| Fidelity OTC K6 Portfolio | $5,509 |
Interfund Lending Program. Pursuant to an Exemptive Order issued by the SEC, the fund, along with other registered investment companies having management contracts with Fidelity Management & Research Company LLC (FMR), or other affiliated entities of FMR, may participate in an interfund lending program. This program provides an alternative credit facility allowing the fund to borrow from, or lend money to, other participating affiliated funds. At period end, there were no interfund loans outstanding. Activity in this program during the period for which loans were outstanding was as follows:
| | Borrower or Lender | Average Loan Balance | Weighted Average Interest Rate | Interest Expense |
| Fidelity OTC K6 Portfolio | Borrower | $20,380,000 | .32% | $178 |
Interfund Trades. Funds may purchase from or sell securities to other Fidelity Funds under procedures adopted by the Board. The procedures have been designed to ensure these interfund trades are executed in accordance with Rule 17a-7 of the 1940 Act. Interfund trades are included within the respective purchases and sales amounts shown in the Purchases and Sales of Investments note.
Affiliated Exchanges In-Kind. During the period, the Fund received investments, and cash, valued at $170,107,551 in exchange for 16,726,406 shares of the Fund. The amount of in-kind exchanges is included in share transactions in the accompanying Statement of Changes in Net Assets.
6. Committed Line of Credit.
Certain Funds participate with other funds managed by the investment adviser or an affiliate in a $4.25 billion credit facility (the "line of credit") to be utilized for temporary or emergency purposes to fund shareholder redemptions or for other short-term liquidity purposes. The participating funds have agreed to pay commitment fees on their pro-rata portion of the line of credit, which are reflected in Miscellaneous expenses on the Statement of Operations, and are as follows:
| | Amount |
| Fidelity OTC K6 Portfolio | $390 |
During the period, there were no borrowings on this line of credit.
7. Security Lending.
The Fund lends portfolio securities from time to time in order to earn additional income. Lending agents are used, including National Financial Services (NFS), an affiliate of the Fund. Pursuant to a securities lending agreement, NFS will receive a fee, which is capped at 9.9% of daily lending revenue, for its services as lending agent. The Fund may lend securities to certain qualified borrowers, including NFS. On the settlement date of the loan, the Fund receives collateral (in the form of U.S. Treasury obligations, letters of credit and/or cash) against the loaned securities and maintains collateral in an amount not less than 100% of the market value of the loaned securities during the period of the loan. The market value of the loaned securities is determined at the close of business of the Fund and any additional required collateral is delivered to the Fund on the next business day. The Fund or borrower may terminate the loan at any time, and if the borrower defaults on its obligation to return the securities loaned because of insolvency or other reasons, the Fund may apply collateral received from the borrower against the obligation. The Fund may experience delays and costs in recovering the securities loaned. Any cash collateral received is invested in the Fidelity Securities Lending Cash Central Fund. The value of loaned securities and cash collateral at period end are disclosed on the Fund's Statement of Assets and Liabilities. At period end, there were no security loans outstanding with NFS, as affiliated borrower. Total fees paid by the Fund to NFS, as lending agent, amounted to $9,275. Security lending income represents the income earned on investing cash collateral, less rebates paid to borrowers and any lending agent fees associated with the loan, plus any premium payments received for lending certain types of securities. Net income from the Fidelity Securities Lending Cash Central Fund during the period is presented in the Statement of Operations as a component of income from Fidelity Central Funds (and includes $6 from securities loaned to NFS, as affiliated borrower).
8. Expense Reductions.
Commissions paid to certain brokers with whom the investment adviser, or its affiliates, places trades on behalf of the Fund include an amount in addition to trade execution, which may be rebated back to the Fund to offset certain expenses. This amount totaled $16,837 for the period. In addition, through arrangements with the Fund's custodian, credits realized as a result of certain uninvested cash balances were used to reduce the Fund's expenses by $20.
9. Other.
The Fund's organizational documents provide former and current trustees and officers with a limited indemnification against liabilities arising in connection with the performance of their duties to the Fund. In the normal course of business, the Fund may also enter into contracts that provide general indemnifications. The Fund's maximum exposure under these arrangements is unknown as this would be dependent on future claims that may be made against the Fund. The risk of material loss from such claims is considered remote.
10. Coronavirus (COVID-19) Pandemic.
An outbreak of COVID-19 first detected in China during December 2019 has since spread globally and was declared a pandemic by the World Health Organization during March 2020. Developments that disrupt global economies and financial markets, such as the COVID-19 pandemic, may magnify factors that affect the Fund's performance.
Report of Independent Registered Public Accounting Firm
To the Board of Trustees of Fidelity Securities Fund and Shareholders of Fidelity OTC K6 Portfolio
Opinion on the Financial Statements and Financial Highlights
We have audited the accompanying statement of assets and liabilities of Fidelity OTC K6 Portfolio (the "Fund"), a fund of Fidelity Securities Fund, including the schedule of investments, as of July 31, 2020, the related statement of operations for the year then ended, the statement of changes in net assets and the financial highlights for the year then ended and for the period from June 13, 2019 (commencement of operations) through July 31, 2019, and the related notes. In our opinion, the financial statements and financial highlights present fairly, in all material respects, the financial position of the Fund as of July 31, 2020, the results of its operations for the year then ended, and the changes in its net assets and the financial highlights for the year then ended and for the period from June 13, 2019 (commencement of operations) through July 31, 2019 in conformity with accounting principles generally accepted in the United States of America.
Basis for Opinion
These financial statements and financial highlights are the responsibility of the Fund's management. Our responsibility is to express an opinion on the Fund's financial statements and financial highlights based on our audits. We are a public accounting firm registered with the Public Company Accounting Oversight Board (United States) (PCAOB) and are required to be independent with respect to the Fund in accordance with the U.S. federal securities laws and the applicable rules and regulations of the Securities and Exchange Commission and the PCAOB.
We conducted our audits in accordance with the standards of the PCAOB. Those standards require that we plan and perform the audit to obtain reasonable assurance about whether the financial statements and financial highlights are free of material misstatement, whether due to error or fraud. The Fund is not required to have, nor were we engaged to perform, an audit of its internal control over financial reporting. As part of our audits we are required to obtain an understanding of internal control over financial reporting but not for the purpose of expressing an opinion on the effectiveness of the Fund’s internal control over financial reporting. Accordingly, we express no such opinion.
Our audits included performing procedures to assess the risks of material misstatement of the financial statements and financial highlights, whether due to error or fraud, and performing procedures that respond to those risks. Such procedures included examining, on a test basis, evidence regarding the amounts and disclosures in the financial statements and financial highlights. Our audits also included evaluating the accounting principles used and significant estimates made by management, as well as evaluating the overall presentation of the financial statements and financial highlights. Our procedures included confirmation of securities owned as of July 31, 2020, by correspondence with the custodian and brokers; when replies were not received from brokers, we performed other auditing procedures. We believe that our audits provide a reasonable basis for our opinion.
/s/ Deloitte & Touche LLP
Boston, Massachusetts
September 14, 2020
We have served as the auditor of one or more of the Fidelity investment companies since 1999.
Trustees and Officers
The Trustees, Members of the Advisory Board (if any), and officers of the trust and fund, as applicable, are listed below. The Board of Trustees governs the fund and is responsible for protecting the interests of shareholders. The Trustees are experienced executives who meet periodically throughout the year to oversee the fund's activities, review contractual arrangements with companies that provide services to the fund, oversee management of the risks associated with such activities and contractual arrangements, and review the fund's performance. Except for Jonathan Chiel, each of the Trustees oversees 311 funds. Mr. Chiel oversees 174 funds.
The Trustees hold office without limit in time except that (a) any Trustee may resign; (b) any Trustee may be removed by written instrument, signed by at least two-thirds of the number of Trustees prior to such removal; (c) any Trustee who requests to be retired or who has become incapacitated by illness or injury may be retired by written instrument signed by a majority of the other Trustees; and (d) any Trustee may be removed at any special meeting of shareholders by a two-thirds vote of the outstanding voting securities of the trust. Each Trustee who is not an interested person (as defined in the 1940 Act) of the trust and the fund is referred to herein as an Independent Trustee. Each Independent Trustee shall retire not later than the last day of the calendar year in which his or her 75th birthday occurs. The Independent Trustees may waive this mandatory retirement age policy with respect to individual Trustees. Officers and Advisory Board Members hold office without limit in time, except that any officer or Advisory Board Member may resign or may be removed by a vote of a majority of the Trustees at any regular meeting or any special meeting of the Trustees. Except as indicated, each individual has held the office shown or other offices in the same company for the past five years.
The fund’s Statement of Additional Information (SAI) includes more information about the Trustees. To request a free copy, call Fidelity at 1-800-835-5092.
Experience, Skills, Attributes, and Qualifications of the Trustees. The Governance and Nominating Committee has adopted a statement of policy that describes the experience, qualifications, attributes, and skills that are necessary and desirable for potential Independent Trustee candidates (Statement of Policy). The Board believes that each Trustee satisfied at the time he or she was initially elected or appointed a Trustee, and continues to satisfy, the standards contemplated by the Statement of Policy. The Governance and Nominating Committee also engages professional search firms to help identify potential Independent Trustee candidates who have the experience, qualifications, attributes, and skills consistent with the Statement of Policy. From time to time, additional criteria based on the composition and skills of the current Independent Trustees, as well as experience or skills that may be appropriate in light of future changes to board composition, business conditions, and regulatory or other developments, have also been considered by the professional search firms and the Governance and Nominating Committee. In addition, the Board takes into account the Trustees' commitment and participation in Board and committee meetings, as well as their leadership of standing and ad hoc committees throughout their tenure.
In determining that a particular Trustee was and continues to be qualified to serve as a Trustee, the Board has considered a variety of criteria, none of which, in isolation, was controlling. The Board believes that, collectively, the Trustees have balanced and diverse experience, qualifications, attributes, and skills, which allow the Board to operate effectively in governing the fund and protecting the interests of shareholders. Information about the specific experience, skills, attributes, and qualifications of each Trustee, which in each case led to the Board's conclusion that the Trustee should serve (or continue to serve) as a trustee of the fund, is provided below.
Board Structure and Oversight Function. Robert A. Lawrence is an interested person and currently serves as Acting Chairman. The Trustees have determined that an interested Chairman is appropriate and benefits shareholders because an interested Chairman has a personal and professional stake in the quality and continuity of services provided to the fund. Independent Trustees exercise their informed business judgment to appoint an individual of their choosing to serve as Chairman, regardless of whether the Trustee happens to be independent or a member of management. The Independent Trustees have determined that they can act independently and effectively without having an Independent Trustee serve as Chairman and that a key structural component for assuring that they are in a position to do so is for the Independent Trustees to constitute a substantial majority for the Board. The Independent Trustees also regularly meet in executive session. Ned C. Lautenbach and David M. Thomas serve as Co-Lead Independent Trustees and as such each (i) acts as a liaison between the Independent Trustees and management with respect to matters important to the Independent Trustees and (ii) with management prepares agendas for Board meetings.
Fidelity® funds are overseen by different Boards of Trustees. The fund's Board oversees Fidelity's high income and certain equity funds, and other Boards oversee Fidelity's investment-grade bond, money market, asset allocation, and other equity funds. The asset allocation funds may invest in Fidelity® funds overseen by the fund's Board. The use of separate Boards, each with its own committee structure, allows the Trustees of each group of Fidelity® funds to focus on the unique issues of the funds they oversee, including common research, investment, and operational issues. On occasion, the separate Boards establish joint committees to address issues of overlapping consequences for the Fidelity® funds overseen by each Board.
The Trustees operate using a system of committees to facilitate the timely and efficient consideration of all matters of importance to the Trustees, the fund, and fund shareholders and to facilitate compliance with legal and regulatory requirements and oversight of the fund's activities and associated risks. The Board, acting through its committees, has charged FMR and its affiliates with (i) identifying events or circumstances the occurrence of which could have demonstrably adverse effects on the fund's business and/or reputation; (ii) implementing processes and controls to lessen the possibility that such events or circumstances occur or to mitigate the effects of such events or circumstances if they do occur; and (iii) creating and maintaining a system designed to evaluate continuously business and market conditions in order to facilitate the identification and implementation processes described in (i) and (ii) above. Because the day-to-day operations and activities of the fund are carried out by or through FMR, its affiliates, and other service providers, the fund's exposure to risks is mitigated but not eliminated by the processes overseen by the Trustees. While each of the Board's committees has responsibility for overseeing different aspects of the fund's activities, oversight is exercised primarily through the Operations, Audit, and Compliance Committees. Appropriate personnel, including but not limited to the fund's Chief Compliance Officer (CCO), FMR's internal auditor, the independent accountants, the fund's Treasurer and portfolio management personnel, make periodic reports to the Board's committees, as appropriate, including an annual review of Fidelity's risk management program for the Fidelity® funds. The responsibilities of each standing committee, including their oversight responsibilities, are described further under "Standing Committees of the Trustees."
Interested Trustees*:
Correspondence intended for a Trustee who is an interested person may be sent to Fidelity Investments, 245 Summer Street, Boston, Massachusetts 02210.
Name, Year of Birth; Principal Occupations and Other Relevant Experience+
Jonathan Chiel (1957)
Year of Election or Appointment: 2016
Trustee
Mr. Chiel also serves as Trustee of other Fidelity® funds. Mr. Chiel is Executive Vice President and General Counsel for FMR LLC (diversified financial services company, 2012-present). Previously, Mr. Chiel served as general counsel (2004-2012) and senior vice president and deputy general counsel (2000-2004) for John Hancock Financial Services; a partner with Choate, Hall & Stewart (1996-2000) (law firm); and an Assistant United States Attorney for the United States Attorney’s Office of the District of Massachusetts (1986-95), including Chief of the Criminal Division (1993-1995). Mr. Chiel is a director on the boards of the Boston Bar Foundation and the Maimonides School.
Robert A. Lawrence (1952)
Year of Election or Appointment: 2020
Trustee
Acting Chairman of the Board of Trustees
Mr. Lawrence also serves as Trustee of other funds. Previously, Mr. Lawrence served as a Member of the Advisory Board of certain funds. Prior to his retirement in 2008, Mr. Lawrence served as Vice President of certain Fidelity® funds (2006-2008), Senior Vice President, Head of High Income Division of Fidelity Management & Research Company (investment adviser firm, 2006-2008), and President of Fidelity Strategic Investments (investment adviser firm, 2002-2005).
* Determined to be an “Interested Trustee” by virtue of, among other things, his or her affiliation with the trust or various entities under common control with FMR.
+ The information includes the Trustee's principal occupation during the last five years and other information relating to the experience, attributes, and skills relevant to the Trustee's qualifications to serve as a Trustee, which led to the conclusion that the Trustee should serve as a Trustee for the fund.
Independent Trustees:
Correspondence intended for an Independent Trustee may be sent to Fidelity Investments, P.O. Box 55235, Boston, Massachusetts 02205-5235.
Name, Year of Birth; Principal Occupations and Other Relevant Experience+
Dennis J. Dirks (1948)
Year of Election or Appointment: 2005
Trustee
Mr. Dirks also serves as Trustee of other Fidelity® funds. Prior to his retirement in May 2003, Mr. Dirks served as Chief Operating Officer and as a member of the Board of The Depository Trust & Clearing Corporation (financial markets infrastructure), President, Chief Operating Officer and a member of the Board of The Depository Trust Company (DTC), President and a member of the Board of the National Securities Clearing Corporation (NSCC), Chief Executive Officer and a member of the Board of the Government Securities Clearing Corporation and Chief Executive Officer and a member of the Board of the Mortgage-Backed Securities Clearing Corporation. Mr. Dirks currently serves as a member of the Finance Committee (2016-present) and Board (2017-present) and is Treasurer (2018-present) of the Asolo Repertory Theatre.
Donald F. Donahue (1950)
Year of Election or Appointment: 2018
Trustee
Mr. Donahue also serves as Trustee of other Fidelity® funds. Mr. Donahue serves as President and Chief Executive Officer of Miranda Partners, LLC (risk consulting for the financial services industry, 2012-present). Previously, Mr. Donahue served as Chief Executive Officer (2006-2012), Chief Operating Officer (2003-2006) and Managing Director, Customer Marketing and Development (1999-2003) of The Depository Trust & Clearing Corporation (financial markets infrastructure). Mr. Donahue currently serves as a member (2007-present) and Co-Chairman (2016-present) of the Board of United Way of New York, a member of the Board of NYC Leadership Academy (2012-present) and a member of the Board of Advisors of Ripple Labs, Inc. (financial services, 2015-present). Mr. Donahue previously served as a member of the Advisory Board of certain Fidelity® funds (2015-2018).
Vicki L. Fuller (1957)
Year of Election or Appointment: 2020
Trustee
Ms. Fuller also serves as Trustee of other Fidelity® funds. Previously, Ms. Fuller served as a member of the Advisory Board of certain Fidelity® funds (2018-2020), Chief Investment Officer of the New York State Common Retirement Fund (2012-2018) and held a variety of positions at AllianceBernstein L.P. (global asset management, 1985-2012), including Managing Director (2006-2012) and Senior Vice President and Senior Portfolio Manager (2001-2006). Ms. Fuller currently serves as a member of the Board, Audit Committee and Nominating and Governance Committee of The Williams Companies, Inc. (natural gas infrastructure, 2018-present) and as a member of the Board of Treliant, LLC (consulting, 2019-present).
Patricia L. Kampling (1959)
Year of Election or Appointment: 2020
Trustee
Ms. Kampling also serves as Trustee of other Fidelity® funds. Prior to her retirement, Ms. Kampling served as Chairman of the Board and Chief Executive Officer (2012-2019), President and Chief Operating Officer (2011-2012) and Executive Vice President and Chief Financial Officer (2010-2011) of Alliant Energy Corporation. Ms. Kampling currently serves as a member of the Board, Compensation Committee and Executive Committee and as Chair of the Audit Committee of Briggs & Stratton Corporation (manufacturing, 2011-present) and as a member of the Board, Audit, Finance and Risk Committee and Safety, Environmental, Technology and Operations Committee of American Water Works Company, Inc. (utilities company, 2019-present). In addition, Ms. Kampling currently serves as a member of the Board of the Nature Conservancy, Wisconsin Chapter (2019-present). Previously, Ms. Kampling served as a Member of the Advisory Board of certain Fidelity® funds (2020), a member of the Board of Interstate Power and Light Company (2012-2019) and Wisconsin Power and Light Company (2012-2019) (each a subsidiary of Alliant Energy Corporation) and as a member of the Board and Workforce Development Committee of the Business Roundtable (2018-2019).
Alan J. Lacy (1953)
Year of Election or Appointment: 2008
Trustee
Mr. Lacy also serves as Trustee of other Fidelity® funds. Previously, Mr. Lacy served as Senior Adviser (2007-2014) of Oak Hill Capital Partners, L.P. (private equity), Chief Executive Officer (2005) and Vice Chairman (2005-2006) of Sears Holdings Corporation (retail), Chief Executive Officer and Chairman of the Board of Sears, Roebuck and Co. (retail, 2000-2005), Chairman (2014-2017) and a member of the Board (2010-2017) of Dave & Buster’s Entertainment, Inc. (restaurant and entertainment complexes) and a member of the Board of Bristol-Myers Squibb Company (global pharmaceuticals, 2008-2020). Mr. Lacy currently serves as a Trustee of the California Chapter of The Nature Conservancy (2015-present) and a member of the Board of the Center for Advanced Study in the Behavioral Sciences at Stanford University (2015-present).
Ned C. Lautenbach (1944)
Year of Election or Appointment: 2000
Trustee
Co-Lead Independent Trustee
Mr. Lautenbach also serves as Trustee of other Fidelity® funds. Mr. Lautenbach currently serves as Chair of the Board of Governors, State University System of Florida (2013-present) and is a member of the Council on Foreign Relations (1994-present). He is also a member and has in the past served as Chairman of the Board of Directors of Artis-Naples (2012-present). Previously, Mr. Lautenbach served as a member and then Lead Director of the Board of Directors of Eaton Corporation (diversified industrial, 1997-2016). He was also a Partner at Clayton, Dubilier & Rice, LLC (private equity investment, 1998-2010); as well as Director of Sony Corporation (2006-2007). In addition, Mr. Lautenbach had a 30-year career with IBM (technology company), during which time he served as Senior Vice President and as a member of the Corporate Executive Committee (1968-1998).
Joseph Mauriello (1944)
Year of Election or Appointment: 2008
Trustee
Mr. Mauriello also serves as Trustee of other Fidelity® funds. Prior to his retirement in January 2006, Mr. Mauriello served in numerous senior management positions including Deputy Chairman and Chief Operating Officer (2004-2005), and Vice Chairman of Financial Services (2002-2004) of KPMG LLP US (professional services, 1965-2005). Mr. Mauriello currently serves as a member of the Independent Directors Council Governing Council (2015-present). Previously, Mr. Mauriello served as a member of the Board of XL Group plc. (global insurance and re-insurance, 2006-2018).
Cornelia M. Small (1944)
Year of Election or Appointment: 2005
Trustee
Ms. Small also serves as Trustee of other Fidelity® funds. Previously, Ms. Small served as Chief Investment Officer, Director of Global Equity Investments and a member of Scudder, Stevens & Clark and Scudder Kemper Investments. Ms. Small previously served as a member of the Board (2009-2019) and Chair of the Investment Committee (2010-2019) of the Teagle Foundation and a member of the Investment Committee of the Berkshire Taconic Community Foundation (2008-2019).
Garnett A. Smith (1947)
Year of Election or Appointment: 2018
Trustee
Mr. Smith also serves as Trustee of other Fidelity® funds. Prior to his retirement, Mr. Smith served as Chairman and Chief Executive Officer (1990-1997) and President (1986-1990) of Inbrand Corp. (manufacturer of personal absorbent products). Prior to his employment with Inbrand Corp., he was employed by a retail fabric chain and North Carolina National Bank (now Bank of America). Mr. Smith previously served as a member of the Advisory Board of certain Fidelity® funds (2012-2013).
David M. Thomas (1949)
Year of Election or Appointment: 2008
Trustee
Co-Lead Independent Trustee
Mr. Thomas also serves as Trustee of other Fidelity® funds. Previously, Mr. Thomas served as Executive Chairman (2005-2006) and Chairman and Chief Executive Officer (2000-2005) of IMS Health, Inc. (pharmaceutical and healthcare information solutions). Mr. Thomas currently serves as Non-Executive Chairman of the Board of Fortune Brands Home and Security (home and security products, 2011-present), and a member of the Board (2004-present) and Presiding Director (2013-present) of Interpublic Group of Companies, Inc. (marketing communication).
Susan Tomasky (1953)
Year of Election or Appointment: 2020
Trustee
Ms. Tomasky also serves as Trustee of other Fidelity® funds. Prior to her retirement, Ms. Tomasky served in various executive officer positions at American Electric Power Company, Inc. (1998-2011), including most recently as President of AEP Transmission (2007-2011). Ms. Tomasky currently serves as a member of the Board and Sustainability Committee and as Chair of the Audit Committee of Marathon Petroleum Corporation (2018-present) and as a member of the Board, Corporate Governance Committee and Organization and Compensation Committee and as Chair of the Audit Committee of Public Service Enterprise Group, Inc. (utilities company, 2012-present). In addition, Ms. Tomasky currently serves as a member of the Board of the Columbus Regional Airport Authority (2007-present), as a member of the Board of the Royal Shakespeare Company – America (2009-present), as a member of the Board of the Columbus Association for the Performing Arts (2011-present) and as a member of the Board of Kenyon College (2016-present). Previously, Ms. Tomasky served as a Member of the Advisory Board of certain Fidelity® funds (2020), a member of the Board (2011-2019) and as Lead Independent Director (2015-2018) of Andeavor Corporation (previously Tesoro Corporation) (independent oil refiner and marketer) and as a member of the Board of Summit Midstream Partners LP (energy, 2012-2018).
Michael E. Wiley (1950)
Year of Election or Appointment: 2020
Trustee
Mr. Wiley also serves as Trustee of other Fidelity® funds. Previously, Mr. Wiley served as a member of the Advisory Board of certain Fidelity® funds (2018-2020), Chairman, President and CEO of Baker Hughes, Inc. (oilfield services, 2000-2004). Mr. Wiley also previously served as a member of the Board of Andeavor Corporation (independent oil refiner and marketer, 2005-2018), a member of the Board of Andeavor Logistics LP (natural resources logistics, 2015-2018) and a member of the Board of High Point Resources (exploration and production, 2005-2020).
+ The information includes the Trustee's principal occupation during the last five years and other information relating to the experience, attributes, and skills relevant to the Trustee's qualifications to serve as a Trustee, which led to the conclusion that the Trustee should serve as a Trustee for the fund.
Advisory Board Members and Officers:
Correspondence intended for a Member of the Advisory Board (if any) may be sent to Fidelity Investments, P.O. Box 55235, Boston, Massachusetts 02205-5235. Correspondence intended for an officer or Peter S. Lynch may be sent to Fidelity Investments, 245 Summer Street, Boston, Massachusetts 02210. Officers appear below in alphabetical order.
Name, Year of Birth; Principal Occupation
Peter S. Lynch (1944)
Year of Election or Appointment: 2003
Member of the Advisory Board
Mr. Lynch also serves as a Member of the Advisory Board of other Fidelity® funds. Mr. Lynch is Vice Chairman and a Director of Fidelity Management & Research Company LLC (investment adviser firm). In addition, Mr. Lynch serves as a Trustee of Boston College and as the Chairman of the Inner-City Scholarship Fund. Previously, Mr. Lynch served as Vice Chairman and a Director of FMR Co., Inc. (investment adviser firm) and on the Special Olympics International Board of Directors (1997-2006).
Elizabeth Paige Baumann (1968)
Year of Election or Appointment: 2017
Anti-Money Laundering (AML) Officer
Ms. Baumann also serves as AML Officer of other funds. She is Chief AML Officer (2012-present) and Senior Vice President (2014-present) of FMR LLC (diversified financial services company) and is an employee of Fidelity Investments. Previously, Ms. Baumann served as AML Officer of certain funds (2017-2019), as AML Officer of the funds (2012-2016), and Vice President (2007-2014) and Deputy Anti-Money Laundering Officer (2007-2012) of FMR LLC.
Craig S. Brown (1977)
Year of Election or Appointment: 2019
Assistant Treasurer
Mr. Brown also serves as Assistant Treasurer of other funds. Mr. Brown is an employee of Fidelity Investments (2013-present).
John J. Burke III (1964)
Year of Election or Appointment: 2018
Chief Financial Officer
Mr. Burke also serves as Chief Financial Officer of other funds. Mr. Burke serves as Head of Investment Operations for Fidelity Fund and Investment Operations (2018-present) and is an employee of Fidelity Investments (1998-present). Previously Mr. Burke served as head of Asset Management Investment Operations (2012-2018).
William C. Coffey (1969)
Year of Election or Appointment: 2019
Assistant Secretary
Mr. Coffey also serves as Assistant Secretary of other funds. He is Senior Vice President and Deputy General Counsel of FMR LLC (diversified financial services company, 2010-present), and is an employee of Fidelity Investments. Previously, Mr. Coffey served as Secretary and CLO of certain funds (2018-2019); CLO, Secretary, and Senior Vice President of Fidelity Management & Research Company and FMR Co., Inc. (investment adviser firms, 2018-2019); Secretary of Fidelity SelectCo, LLC and Fidelity Investments Money Management, Inc. (investment adviser firms, 2018-2019); CLO of Fidelity Management & Research (Hong Kong) Limited, FMR Investment Management (UK) Limited, and Fidelity Management & Research (Japan) Limited (investment adviser firms, 2018-2019); and Assistant Secretary of certain funds (2009-2018).
Timothy M. Cohen (1969)
Year of Election or Appointment: 2018
Vice President
Mr. Cohen also serves as Vice President of other funds. Mr. Cohen serves as Co-Head of Equity (2018-present), a Director of Fidelity Management & Research (Japan) Limited (investment adviser firm, 2016-present), and is an employee of Fidelity Investments. Previously, Mr. Cohen served as Executive Vice President of Fidelity SelectCo, LLC (2019), Head of Global Equity Research (2016-2018), Chief Investment Officer - Equity and a Director of Fidelity Management & Research (U.K.) Inc. (investment adviser firm, 2013-2015) and as a Director of Fidelity Management & Research (Hong Kong) Limited (investment adviser firm, 2017).
Jonathan Davis (1968)
Year of Election or Appointment: 2010
Assistant Treasurer
Mr. Davis also serves as Assistant Treasurer of other funds. Mr. Davis serves as Assistant Treasurer of FMR Capital, Inc. (2017-present) and is an employee of Fidelity Investments. Previously, Mr. Davis served as Vice President and Associate General Counsel of FMR LLC (diversified financial services company, 2003-2010).
Laura M. Del Prato (1964)
Year of Election or Appointment: 2018
Assistant Treasurer
Ms. Del Prato also serves as an officer of other funds. Ms. Del Prato is an employee of Fidelity Investments (2017-present). Previously, Ms. Del Prato served as President and Treasurer of The North Carolina Capital Management Trust: Cash Portfolio and Term Portfolio (2018-2020). Prior to joining Fidelity Investments, Ms. Del Prato served as a Managing Director and Treasurer of the JPMorgan Mutual Funds (2014-2017). Prior to JPMorgan, Ms. Del Prato served as a partner at Cohen Fund Audit Services (accounting firm, 2012-2013) and KPMG LLP (accounting firm, 2004-2012).
Colm A. Hogan (1973)
Year of Election or Appointment: 2020
Assistant Treasurer
Mr. Hogan also serves as an officer of other funds. Mr. Hogan serves as Assistant Treasurer of FMR Capital, Inc. (2017-present) and is an employee of Fidelity Investments (2005-present). Previously, Mr. Hogan served as Deputy Treasurer of certain Fidelity® funds (2016-2020) and Assistant Treasurer of certain Fidelity® funds (2016-2018).
Pamela R. Holding (1964)
Year of Election or Appointment: 2018
Vice President
Ms. Holding also serves as Vice President of other funds. Ms. Holding serves as Co-Head of Equity (2018-present) and is an employee of Fidelity Investments (2013-present). Previously, Ms. Holding served as Executive Vice President of Fidelity SelectCo, LLC (2019) and as Chief Investment Officer of Fidelity Institutional Asset Management (2013-2018).
Cynthia Lo Bessette (1969)
Year of Election or Appointment: 2019
Secretary and Chief Legal Officer (CLO)
Ms. Lo Bessette also serves as an officer of other funds. Ms. Lo Bessette serves as CLO, Secretary, and Senior Vice President of Fidelity Management & Research Company LLC (investment adviser firm, 2019-present); and CLO of Fidelity Management & Research (Hong Kong) Limited, FMR Investment Management (UK) Limited, and Fidelity Management & Research (Japan) Limited (investment adviser firms, 2019-present). She is a Senior Vice President and Deputy General Counsel of FMR LLC (diversified financial services company, 2019-present), and is an employee of Fidelity Investments. Previously, Ms. Lo Bessette served as CLO, Secretary, and Senior Vice President of FMR Co., Inc. (investment adviser firm, 2019); Secretary of Fidelity SelectCo, LLC and Fidelity Investments Money Management, Inc. (investment adviser firms, 2019). Prior to joining Fidelity Investments, Ms. Lo Bessette was Executive Vice President, General Counsel (2016-2019) and Senior Vice President, Deputy General Counsel (2015-2016) of OppenheimerFunds (investment management company) and Deputy Chief Legal Officer (2013-2015) of Jennison Associates LLC (investment adviser firm).
Chris Maher (1972)
Year of Election or Appointment: 2020
Deputy Treasurer
Mr. Maher also serves as an officer of other funds. Mr. Maher serves as Assistant Treasurer of FMR Capital, Inc. (2017-present), and is an employee of Fidelity Investments (2008-present). Previously, Mr. Maher served as Assistant Treasurer of certain funds (2013-2020); Vice President of Asset Management Compliance (2013), Vice President of the Program Management Group of FMR (investment adviser firm, 2010-2013), and Vice President of Valuation Oversight (2008-2010).
Jason P. Pogorelec (1975)
Year of Election or Appointment: 2020
Chief Compliance Officer
Mr. Pogorelec also serves as Chief Compliance Officer of other funds. Mr. Pogorelec is a senior Vice President of Asset Management Compliance for Fidelity Investments and is an employee of Fidelity Investments (2006-present). Previously, Mr. Pogorelec served as Vice President, Associate General Counsel for Fidelity Investments (2010-2020) and Assistant Secretary of certain Fidelity funds (2015-2020).
Stacie M. Smith (1974)
Year of Election or Appointment: 2016
President and Treasurer
Ms. Smith also serves as an officer of other funds. Ms. Smith serves as Assistant Treasurer of FMR Capital, Inc. (2017-present), is an employee of Fidelity Investments (2009-present), and has served in other fund officer roles. Prior to joining Fidelity Investments, Ms. Smith served as Senior Audit Manager of Ernst & Young LLP (accounting firm, 1996-2009). Previously, Ms. Smith served as Assistant Treasurer (2013-2019) and Deputy Treasurer (2013-2016) of certain Fidelity® funds.
Marc L. Spector (1972)
Year of Election or Appointment: 2016
Assistant Treasurer
Mr. Spector also serves as an officer of other funds. Mr. Spector serves as Assistant Treasurer of FMR Capital, Inc. (2017-present) and is an employee of Fidelity Investments (2016-present). Prior to joining Fidelity Investments, Mr. Spector served as Director at the Siegfried Group (accounting firm, 2013-2016), and prior to Siegfried Group as audit senior manager at Deloitte & Touche LLP (accounting firm, 2005-2013).
Jim Wegmann (1979)
Year of Election or Appointment: 2019
Assistant Treasurer
Mr. Wegmann also serves as Assistant Treasurer of other funds. Mr. Wegmann is an employee of Fidelity Investments (2011-present).
Shareholder Expense Example
As a shareholder, you incur two types of costs: (1) transaction costs, which may include sales charges (loads) on purchase payments or redemption proceeds, as applicable and (2) ongoing costs, which generally include management fees, distribution and/or service (12b-1) fees and other Fund expenses. This Example is intended to help you understand your ongoing costs (in dollars) of investing in a fund and to compare these costs with the ongoing costs of investing in other mutual funds.
The Example is based on an investment of $1,000 invested at the beginning of the period and held for the entire period (February 1, 2020 to July 31, 2020).
Actual Expenses
The first line of the accompanying table provides information about actual account values and actual expenses. You may use the information in this line, together with the amount you invested, to estimate the expenses that you paid over the period. Simply divide your account value by $1,000.00 (for example, an $8,600 account value divided by $1,000.00 = 8.6), then multiply the result by the number in the first line for a class/Fund under the heading entitled "Expenses Paid During Period" to estimate the expenses you paid on your account during this period. If any fund is a shareholder of any underlying mutual funds or exchange-traded funds (ETFs) (the Underlying Funds), such fund indirectly bears its proportional share of the expenses of the Underlying Funds in addition to the direct expenses incurred presented in the table. These fees and expenses are not included in the annualized expense ratio used to calculate the expense estimate in the table below.
Hypothetical Example for Comparison Purposes
The second line of the accompanying table provides information about hypothetical account values and hypothetical expenses based on the actual expense ratio and an assumed rate of return of 5% per year before expenses, which is not the actual return. The hypothetical account values and expenses may not be used to estimate the actual ending account balance or expenses you paid for the period. You may use this information to compare the ongoing costs of investing in the Fund and other funds. To do so, compare this 5% hypothetical example with the 5% hypothetical examples that appear in the shareholder reports of the other funds. If any fund is a shareholder of any Underlying Funds, such fund indirectly bears its proportional share of the expenses of the Underlying Funds in addition to the direct expenses as presented in the table. These fees and expenses are not included in the annualized expense ratio used to calculate the expense estimate in the table below.
Please note that the expenses shown in the table are meant to highlight your ongoing costs only and do not reflect any transaction costs. Therefore, the second line of the table is useful in comparing ongoing costs only, and will not help you determine the relative total costs of owning different funds.
| | Annualized Expense Ratio-A | Beginning
Account Value
February 1, 2020 | Ending
Account Value
July 31, 2020 | Expenses Paid
During Period-B
February 1, 2020
to July 31, 2020 |
| Fidelity OTC K6 Portfolio | .49% | | | |
| Actual | | $1,000.00 | $1,194.80 | $2.67 |
| Hypothetical-C | | $1,000.00 | $1,022.43 | $2.46 |
A Annualized expense ratio reflects expenses net of applicable fee waivers.
B Expenses are equal to the annualized expense ratio, multiplied by the average account value over the period, multiplied by 182/ 366 (to reflect the one-half year period). The fees and expenses of any Underlying Funds are not included in each annualized expense ratio.
C 5% return per year before expenses
Distributions (Unaudited)
The Board of Trustees of Fidelity OTC K6 Fund voted to pay on September 14, 2020, to shareholders of record at the opening of business on September 11, 2020, a distribution of $0.042 per share derived from capital gains realized from sales of portfolio securities and a dividend of $0.008 per share from net investment income.
The fund hereby designates as a capital gain dividend with respect to the taxable year ended July 31, 2020, $16,846, or, if subsequently determined to be different, the net capital gain of such year.
The fund designates 57% and 62% of the dividends distributed in September and December, respectively during the fiscal year as qualifying for the dividends–received deduction for corporate shareholders.
The fund designates 69% and 75% of the dividends distributed in September and December, respectively during the fiscal year as amounts which may be taken into account as a dividend for the purposes of the maximum rate under section 1(h)(11) of the Internal Revenue Code.
The fund designates 1% of the dividends distributed during the fiscal year as a section 199A dividend.
The fund will notify shareholders in January 2021 of amounts for use in preparing 2020 income tax returns.
Liquidity Risk Management Program
The Securities and Exchange Commission adopted Rule 22e-4 under the Investment Company Act of 1940 (the Liquidity Rule) to promote effective liquidity risk management throughout the open-end investment company industry, thereby reducing the risk that funds will be unable to meet their redemption obligations and mitigating dilution of the interests of fund shareholders.
The Fund has adopted and implemented a liquidity risk management program pursuant to the Liquidity Rule (the Program) effective December 1, 2018. The Program is reasonably designed to assess and manage the Fund’s liquidity risk and to comply with the requirements of the Liquidity Rule. The Fund’s Board of Trustees (the Board) has designated the Fund’s investment adviser as administrator of the Program. The Fidelity advisers have established a Liquidity Risk Management Committee (the LRM Committee) to manage the Program for each of the Fidelity Funds. The LRM Committee monitors the adequacy and effectiveness of implementation of the Program and on a periodic basis assesses each Fund’s liquidity risk based on a variety of factors including (1) the Fund’s investment strategy, (2) portfolio liquidity and cash flow projections during normal and reasonably foreseeable stressed conditions, (3) shareholder redemptions, (4) borrowings and other funding sources and (5) in the case of exchange-traded funds, certain additional factors including the effect of the Fund’s prices and spreads, market participants, and basket compositions on the overall liquidity of the Fund’s portfolio, as applicable.
In accordance with the Program, each of the Fund’s portfolio investments is classified into one of four liquidity categories described below based on a determination of a reasonable expectation for how long it would take to convert the investment to cash (or sell or dispose of the investment) without significantly changing its market value.
- Highly liquid investments – cash or convertible to cash within three business days or less
- Moderately liquid investments – convertible to cash in three to seven calendar days
- Less liquid investments – can be sold or disposed of, but not settled, within seven calendar days
- Illiquid investments – cannot be sold or disposed of within seven calendar days
Liquidity classification determinations take into account a variety of factors including various market, trading and investment-specific considerations, as well as market depth, and generally utilize analysis from a third-party liquidity metrics service.
The Liquidity Rule places a 15% limit on a fund’s illiquid investments and requires funds that do not primarily hold assets that are highly liquid investments to determine and maintain a minimum percentage of the fund’s net assets to be invested in highly liquid investments (highly liquid investment minimum or HLIM). The Program includes provisions reasonably designed to comply with the 15% limit on illiquid investments and for determining, periodically reviewing and complying with the HLIM requirement as applicable.
At a recent meeting of the Fund’s Board of Trustees, the LRM Committee provided a written report to the Board pertaining to the operation, adequacy, and effectiveness of implementation of the Program for the annual period from December 1, 2018 through November 30, 2019. The report concluded that the Program has been implemented and is operating effectively and is reasonably designed to assess and manage the Fund’s liquidity risk.
Proxy Voting Results
A special meeting of shareholders was held on June 9, 2020. The results of votes taken among shareholders on the proposal before them are reported below. Each vote reported represents one dollar of net asset value held on the record date for the meeting.
PROPOSAL 1
To elect a Board of Trustees.
| | # of
Votes | % of
Votes |
| Dennis J. Dirks |
| Affirmative | 43,167,428,219.785 | 94.885 |
| Withheld | 2,327,070,930.034 | 5.115 |
| TOTAL | 45,494,499,149.820 | 100.000 |
| Donald F. Donahue |
| Affirmative | 43,161,668,935.467 | 94.872 |
| Withheld | 2,333,065,287.611 | 5.128 |
| TOTAL | 45,494,734,223.077 | 100.000 |
| Bettina Doulton |
| Affirmative | 43,304,465,213.969 | 95.186 |
| Withheld | 2,190,010,062.903 | 4.814 |
| TOTAL | 45,494,475,276.872 | 100.000 |
| Vicki L. Fuller |
| Affirmative | 43,380,442,631.493 | 95.353 |
| Withheld | 2,114,180,614.639 | 4.647 |
| TOTAL | 45,494,623,246.132 | 100.000 |
| Patricia L. Kampling |
| Affirmative | 43,128,008,796.761 | 94.798 |
| Withheld | 2,366,685,422.999 | 5.202 |
| TOTAL | 45,494,694,219.760 | 100.000 |
| Alan J. Lacy |
| Affirmative | 42,904,065,046.958 | 94.305 |
| Withheld | 2,590,717,567.229 | 5.695 |
| TOTAL | 45,494,782,614.187 | 100.000 |
| Ned C. Lautenbach |
| Affirmative | 42,802,778,827.017 | 94.083 |
| Withheld | 2,692,003,787.170 | 5.917 |
| TOTAL | 45,494,782,614.187 | 100.000 |
| Robert A. Lawrence |
| Affirmative | 42,971,258,294.203 | 94.453 |
| Withheld | 2,523,524,319.984 | 5.547 |
| TOTAL | 45,494,782,614.187 | 100.000 |
| Joseph Mauriello |
| Affirmative | 42,874,562,778.490 | 94.241 |
| Withheld | 2,620,171,874.731 | 5.759 |
| TOTAL | 45,494,734,653.220 | 100.000 |
| Cornelia M. Small |
| Affirmative | 43,029,040,988.063 | 94.580 |
| Withheld | 2,465,741,626.124 | 5.420 |
| TOTAL | 45,494,782,614.187 | 100.000 |
| Garnett A. Smith |
| Affirmative | 42,892,814,945.159 | 94.281 |
| Withheld | 2,601,967,669.028 | 5.719 |
| TOTAL | 45,494,782,614.187 | 100.000 |
| David M. Thomas |
| Affirmative | 42,936,080,036.111 | 94.376 |
| Withheld | 2,558,702,578.076 | 5.624 |
| TOTAL | 45,494,782,614.187 | 100.000 |
| Susan Tomasky |
| Affirmative | 43,147,934,105.796 | 94.842 |
| Withheld | 2,346,571,066.028 | 5.158 |
| TOTAL | 45,494,782,614.187 | 100.000 |
| Michael E. Wiley |
| Affirmative | 42,885,333,102.972 | 94.264 |
| Withheld | 2,609,449,511.215 | 5.736 |
| TOTAL | 45,494,782,614.187 | 100.000 |
|
| Proposal 1 reflects trust wide proposal and voting results. |
OTC-K6-ANN-0920
1.9893897.101
Item 2.
Code of Ethics
As of the end of the period, July 31, 2020, Fidelity Securities Fund (the trust) has adopted a code of ethics, as defined in Item 2 of Form N-CSR, that applies to its President and Treasurer and its Chief Financial Officer. A copy of the code of ethics is filed as an exhibit to this Form N-CSR.
Item 3.
Audit Committee Financial Expert
The Board of Trustees of the trust has determined that Joseph Mauriello is an audit committee financial expert, as defined in Item 3 of Form N-CSR. Mr. Mauriello is independent for purposes of Item 3 of Form N-CSR.
Item 4.
Principal Accountant Fees and Services
Fees and Services
The following table presents fees billed by Deloitte & Touche LLP, the member firms of Deloitte Touche Tohmatsu, and their respective affiliates (collectively, “Deloitte Entities”) in each of the last two fiscal years for services rendered to Fidelity Blue Chip Growth Fund, Fidelity Blue Chip Growth K6 Fund, Fidelity Flex Large Cap Growth Fund, Fidelity OTC K6 Portfolio, Fidelity OTC Portfolio, Fidelity Real Estate Income Fund, Fidelity Series Blue Chip Growth Fund, Fidelity Series Real Estate Income Fund and Fidelity Series Small Cap Opportunities Fund (the “Funds”):
Services Billed by Deloitte Entities
July 31, 2020 FeesA
| | | | |
| Audit Fees | Audit-Related Fees | Tax Fees | All Other Fees |
Fidelity Blue Chip Growth Fund | $85,000 | $- | $7,100 | $1,400 |
Fidelity Blue Chip Growth K6 Fund | $44,900 | $- | $5,700 | $900 |
Fidelity Flex Large Cap Growth Fund | $45,900 | $- | $5,700 | $900 |
Fidelity OTC K6 Portfolio | $62,700 | $- | $8,500 | $1,300 |
Fidelity OTC Portfolio | $67,800 | $- | $8,800 | $1,300 |
Fidelity Real Estate Income Fund | $81,300 | $100 | $10,400 | $1,600 |
Fidelity Series Blue Chip Growth Fund | $64,800 | $- | $7,400 | $1,300 |
Fidelity Series Real Estate Income Fund | $71,500 | $100 | $9,000 | $1,500 |
Fidelity Series Small Cap Opportunities Fund | $39,200 | $- | $7,200 | $800 |
| | | | |
| Audit Fees | Audit-Related Fees | Tax Fees | All Other Fees |
Fidelity Blue Chip Growth Fund | $93,000 | $100 | $18,000 | $2,000 |
Fidelity Blue Chip Growth K6 Fund | $76,000 | $100 | $4,000 | $1,300 |
Fidelity Flex Large Cap Growth Fund | $48,000 | $100 | $4,000 | $1,400 |
Fidelity OTC K6 Portfolio | $42,000 | $- | $6,000 | $100 |
Fidelity OTC Portfolio | $69,000 | $100 | $19,200 | $1,900 |
Fidelity Real Estate Income Fund | $84,000 | $100 | $7,400 | $2,400 |
Fidelity Series Blue Chip Growth Fund | $67,000 | $100 | $18,300 | $1,900 |
Fidelity Series Real Estate Income Fund | $74,000 | $100 | $6,200 | $2,100 |
Fidelity Series Small Cap Opportunities Fund | $41,000 | $100 | $5,300 | $1,200 |
A Amounts may reflect rounding.
B Fidelity OTC K6 Portfolio commenced operations on June 13, 2019.
The following table presents fees billed by PricewaterhouseCoopers LLP (“PwC”) in each of the last two fiscal years for services rendered to Fidelity Blue Chip Value Fund, Fidelity Dividend Growth Fund, Fidelity Growth & Income Portfolio, Fidelity Leveraged Company Stock Fund, Fidelity Small Cap Growth Fund, Fidelity Small Cap Growth K6 Fund and Fidelity Small Cap Value Fund (the “Funds”):
Services Billed by PwC
July 31, 2020 FeesA
| | | | |
| Audit Fees | Audit-Related Fees | Tax Fees | All Other Fees |
Fidelity Blue Chip Value Fund | $42,200 | $3,900 | $8,500 | $1,600 |
Fidelity Dividend Growth Fund | $50,200 | $4,500 | $9,000 | $1,900 |
Fidelity Growth & Income Portfolio | $56,800 | $5,200 | $10,800 | $2,100 |
Fidelity Leveraged Company Stock Fund | $42,100 | $4,100 | $10,300 | $1,700 |
Fidelity Small Cap Growth Fund | $65,000 | $4,000 | $8,700 | $1,600 |
Fidelity Small Cap Growth K6 Fund | $46,000 | $3,600 | $8,700 | $1,500 |
Fidelity Small Cap Value Fund | $44,500 | $4,000 | $8,300 | $1,700 |
| | | | |
| Audit Fees | Audit-Related Fees | Tax Fees | All Other Fees |
Fidelity Blue Chip Value Fund | $49,000 | $4,100 | $3,500 | $1,900 |
Fidelity Dividend Growth Fund | $57,000 | $4,700 | $3,700 | $2,200 |
Fidelity Growth & Income Portfolio | $64,000 | $5,400 | $6,600 | $2,500 |
Fidelity Leveraged Company Stock Fund | $50,000 | $4,200 | $4,600 | $2,000 |
Fidelity Small Cap Growth Fund | $68,000 | $4,100 | $3,700 | $1,900 |
Fidelity Small Cap Growth K6 Fund | $51,000 | $3,500 | $4,100 | $1,600 |
Fidelity Small Cap Value Fund | $52,000 | $4,200 | $3,300 | $1,900 |
A Amounts may reflect rounding.
The following table(s) present(s) fees billed by Deloitte Entities and PwC that were required to be approved by the Audit Committee for services that relate directly to the operations and financial reporting of the Fund(s) and that are rendered on behalf of Fidelity Management & Research Company LLC ("FMR") and entities controlling, controlled by, or under common control with FMR (not including any sub-adviser whose role is primarily portfolio management and is subcontracted with or overseen by another investment adviser) that provide ongoing services to the Fund(s) (“Fund Service Providers”):
Services Billed by Deloitte Entities
| | |
| July 31, 2020A | July 31, 2019A,B |
Audit-Related Fees | $- | $290,000 |
Tax Fees | $3,000 | $- |
All Other Fees | $- | $- |
A Amounts may reflect rounding.
B May include amounts billed prior to the Fidelity OTC K6 Portfolio’s commencement of operations.
Services Billed by PwC
| | |
| July 31, 2020A | July 31, 2019A |
Audit-Related Fees | $9,030,200 | $7,890,000 |
Tax Fees | $20,800 | $10,000 |
All Other Fees | $- | $- |
A Amounts may reflect rounding.
“Audit-Related Fees” represent fees billed for assurance and related services that are reasonably related to the performance of the fund audit or the review of the fund's financial statements and that are not reported under Audit Fees.
“Tax Fees” represent fees billed for tax compliance, tax advice or tax planning that relate directly to the operations and financial reporting of the fund.
“All Other Fees” represent fees billed for services provided to the fund or Fund Service Provider, a significant portion of which are assurance related, that relate directly to the operations and financial reporting of the fund, excluding those services that are reported under Audit Fees, Audit-Related Fees or Tax Fees.
Assurance services must be performed by an independent public accountant.
* * *
The aggregate non-audit fees billed by Deloitte Entities and PwC for services rendered to the Fund(s), FMR (not including any sub-adviser whose role is primarily portfolio management and is subcontracted with or overseen by another investment adviser), and any Fund Service Provider for each of the last two fiscal years of the Fund(s) are as follows:
| | |
Billed By | July 31, 2020A | July 31, 2019A,B |
Deloitte Entities | $585,600 | $805,000 |
PwC | $14,404,300 | $12,445,000 |
A Amounts may reflect rounding.
B May include amounts billed prior to the Fidelity OTC K6 Portfolio’s commencement of operations.
The trust's Audit Committee has considered non-audit services that were not pre-approved that were provided by Deloitte Entities and PwC to Fund Service Providers to be compatible with maintaining the independence of Deloitte Entities and PwC in its(their) audit of the Fund(s), taking into account representations from Deloitte Entities and PwC, in accordance with Public Company Accounting Oversight Board rules, regarding its independence from the Fund(s) and its(their) related entities and FMR’s review of the appropriateness and permissibility under applicable law of such non-audit services prior to their provision to the Fund(s) Service Providers.
Audit Committee Pre-Approval Policies and Procedures
The trust’s Audit Committee must pre-approve all audit and non-audit services provided by a fund’s independent registered public accounting firm relating to the operations or financial reporting of the fund. Prior to the commencement of any audit or non-audit services to a fund, the Audit Committee reviews the services to determine whether they are appropriate and permissible under applicable law.
The Audit Committee has adopted policies and procedures to, among other purposes, provide a framework for the Committee’s consideration of non-audit services by the audit firms that audit the Fidelity funds. The policies and procedures require that any non-audit service provided by a fund audit firm to a Fidelity fund and any non-audit service provided by a fund auditor to a Fund Service Provider that relates directly to the operations and financial reporting of a Fidelity fund (“Covered Service”) are subject to approval by the Audit Committee before such service is provided.
All Covered Services must be approved in advance of provision of the service either: (i) by formal resolution of the Audit Committee, or (ii) by oral or written approval of the service by the Chair of the Audit Committee (or if the Chair is unavailable, such other member of the Audit Committee as may be designated by the Chair to act in the Chair’s absence). The approval contemplated by (ii) above is permitted where the Treasurer determines that action on such an engagement is necessary before the next meeting of the Audit Committee.
Non-audit services provided by a fund audit firm to a Fund Service Provider that do not relate directly to the operations and financial reporting of a Fidelity fund are reported to the Audit Committee periodically.
Non-Audit Services Approved Pursuant to Rule 2-01(c)(7)(i)(C) and (ii) of Regulation S-X (“De Minimis Exception”)
There were no non-audit services approved or required to be approved by the Audit Committee pursuant to the De Minimis Exception during the Fund’s(s’) last two fiscal
years relating to services provided to (i) the Fund(s) or (ii) any Fund Service Provider that relate directly to the operations and financial reporting of the Fund(s).
Item 5.
Audit Committee of Listed Registrants
Not applicable.
Item 6.
Investments
(a)
Not applicable.
(b)
Not applicable.
Item 7.
Disclosure of Proxy Voting Policies and Procedures for Closed-End Management Investment Companies
Not applicable.
Item 8.
Portfolio Managers of Closed-End Management Investment Companies
Not applicable.
Item 9.
Purchase of Equity Securities by Closed-End Management Investment Company and Affiliated Purchasers
Not applicable.
Item 10.
Submission of Matters to a Vote of Security Holders
There were no material changes to the procedures by which shareholders may recommend nominees to the trust’s Board of Trustees.
Item 11.
Controls and Procedures
(a)(i) The President and Treasurer and the Chief Financial Officer have concluded that the trust’s disclosure controls and procedures (as defined in Rule 30a-3(c) under the Investment Company Act) provide reasonable assurances that material information relating to the trust is made known to them by the appropriate persons, based on their evaluation of these controls and procedures as of a date within 90 days of the filing date of this report.
(a)(ii) There was no change in the trust’s internal control over financial reporting (as defined in Rule 30a-3(d) under the Investment Company Act) that occurred during the period covered by this report that has materially affected, or is reasonably likely to materially affect, the trust’s internal control over financial reporting.
Item 12.
Disclosure of Securities Lending Activities for Closed-End Management
Investment Companies
Not applicable.
Item 13.
Exhibits
SIGNATURES
Pursuant to the requirements of the Securities Exchange Act of 1934 and the Investment Company Act of 1940, the registrant has duly caused this report to be signed on its behalf by the undersigned, thereunto duly authorized.
Fidelity Securities Fund
| |
By: | /s/Stacie M. Smith |
| Stacie M. Smith |
| President and Treasurer |
|
|
Date: | September 21, 2020 |
Pursuant to the requirements of the Securities Exchange Act of 1934 and the Investment Company Act of 1940, this report has been signed below by the following persons on behalf of the registrant and in the capacities and on the dates indicated.
| |
By: | /s/Stacie M. Smith |
| Stacie M. Smith |
| President and Treasurer |
|
|
Date: | September 21, 2020 |
| |
By: | /s/John J. Burke III |
| John J. Burke III |
| Chief Financial Officer |
|
|
Date: | September 21, 2020 |