UNITED STATES
SECURITIES AND EXCHANGE COMMISSION
Washington, D.C. 20549
FORM N-CSR
CERTIFIED SHAREHOLDER REPORT OF REGISTERED
MANAGEMENT INVESTMENT COMPANIES
Investment Company Act file number 811-4118
Fidelity Securities Fund
(Exact name of registrant as specified in charter)
245 Summer St., Boston, Massachusetts 02210
(Address of principal executive offices) (Zip code)
Marc Bryant, Secretary
245 Summer St.
Boston, Massachusetts 02210
(Name and address of agent for service)
Registrant's telephone number, including area code:
617-563-7000
| |
Date of fiscal year end: | July 31 |
| |
Date of reporting period: | July 31, 2018 |
Item 1.
Reports to Stockholders
Fidelity® OTC Portfolio
Annual Report July 31, 2018 |
 |
Contents
To view a fund's proxy voting guidelines and proxy voting record for the 12-month period ended June 30, visit http://www.fidelity.com/proxyvotingresults or visit the Securities and Exchange Commission's (SEC) web site at http://www.sec.gov.
You may also call 1-800-544-8544 to request a free copy of the proxy voting guidelines.
Standard & Poor's, S&P and S&P 500 are registered service marks of The McGraw-Hill Companies, Inc. and have been licensed for use by Fidelity Distributors Corporation.
Other third-party marks appearing herein are the property of their respective owners.
All other marks appearing herein are registered or unregistered trademarks or service marks of FMR LLC or an affiliated company. © 2018 FMR LLC. All rights reserved.
This report and the financial statements contained herein are submitted for the general information of the shareholders of the Fund. This report is not authorized for distribution to prospective investors in the Fund unless preceded or accompanied by an effective prospectus.
A fund files its complete schedule of portfolio holdings with the SEC for the first and third quarters of each fiscal year on Form N-Q. Forms N-Q are available on the SEC’s web site at http://www.sec.gov. A fund's Forms N-Q may be reviewed and copied at the SEC’s Public Reference Room in Washington, DC. Information regarding the operation of the SEC's Public Reference Room may be obtained by calling 1-800-SEC-0330.
For a complete list of a fund's portfolio holdings, view the most recent holdings listing, semiannual report, or annual report on Fidelity's web site at http://www.fidelity.com, http://www.institutional.fidelity.com, or http://www.401k.com, as applicable.
NOT FDIC INSURED •MAY LOSE VALUE •NO BANK GUARANTEE
Neither the Fund nor Fidelity Distributors Corporation is a bank.
Performance: The Bottom Line
Average annual total return reflects the change in the value of an investment, assuming reinvestment of distributions from dividend income and capital gains (the profits earned upon the sale of securities that have grown in value, if any) and assuming a constant rate of performance each year. The hypothetical investment and the average annual total returns do not reflect the deduction of taxes that a shareholder would pay on fund distributions or the redemption of fund shares. During periods of reimbursement by Fidelity, a fund’s total return will be greater than it would be had the reimbursement not occurred. How a fund did yesterday is no guarantee of how it will do tomorrow.
Average Annual Total Returns
| For the periods ended July 31, 2018 | Past 1 year | Past 5 years | Past 10 years |
| Fidelity® OTC Portfolio | 24.34% | 18.75% | 15.42% |
$10,000 Over 10 Years
Let's say hypothetically that $10,000 was invested in Fidelity® OTC Portfolio, a class of the fund, on July 31, 2008.
The chart shows how the value of your investment would have changed, and also shows how the Nasdaq Composite Index® performed over the same period.
See above for additional information regarding the performance of Fidelity® OTC Portfolio.
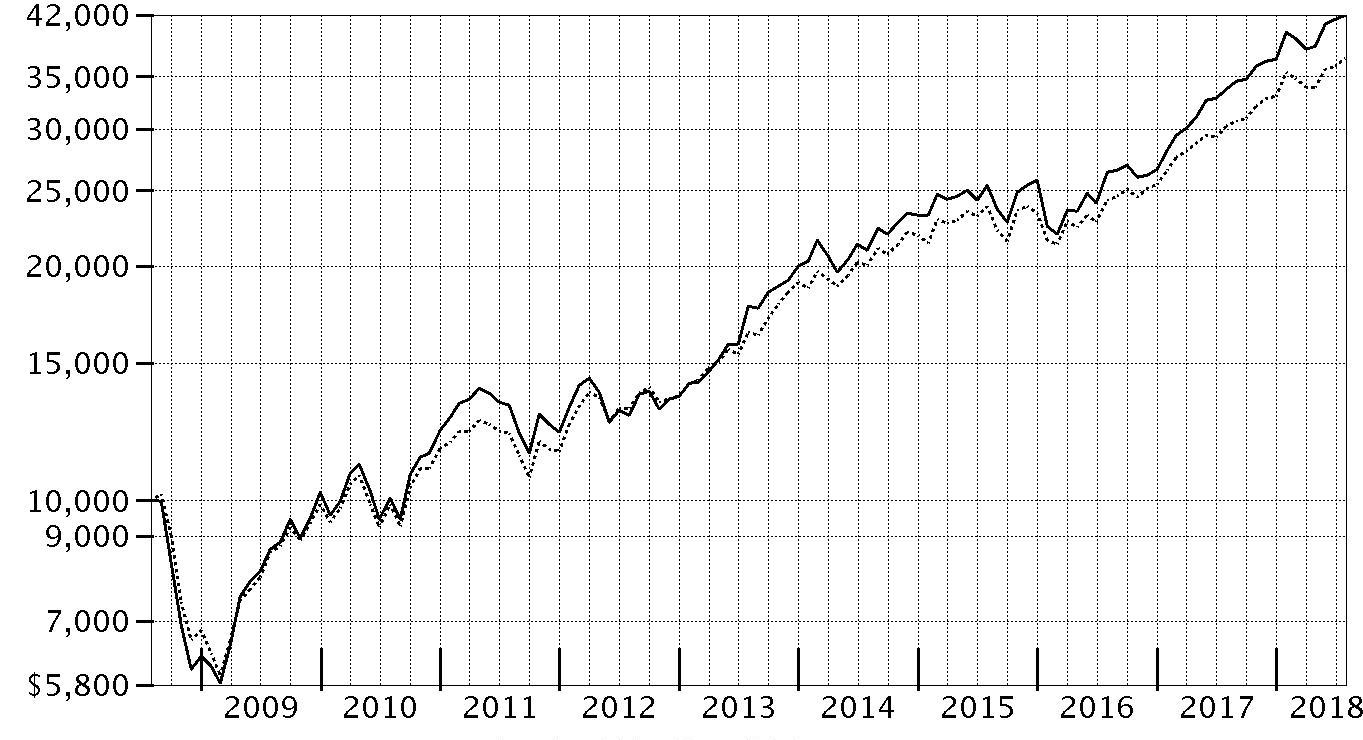
| Period Ending Values |
| $41,958 | Fidelity® OTC Portfolio |
| $36,912 | Nasdaq Composite Index® |
Management's Discussion of Fund Performance
Market Recap: The U.S. equity bellwether S&P 500
® index gained 16.24% for the 12 months ending July 31, 2018, despite a resurgence in volatility that challenged the multiyear bull market. Stocks maintained their steady growth until a sharp reversal in February, as volatility spiked amid fear that rising inflation and the potential for the economy to overheat would prompt the U.S. Federal Reserve to pick up the pace of interest rate hikes. The index posted its first negative monthly result since October 2016, and then lost further ground in March on fear of a global trade war. The market stabilized in April and turned upward through mid-June, when escalating trade tension between the U.S. and China soured investor sentiment. The resulting uncertainty lingered into July, but strong corporate earnings helped the S&P 500 rise 3.72% that month to cap the period. For the full one-year period, growth handily topped value, while small-caps bested large-caps. By sector, information technology (+28%) led the way, boosted by strong earnings growth from several major index constituents. Consumer discretionary rose roughly 24%, driven by retailers (+49%). Energy (+20%) gained alongside higher oil prices. Laggards were telecommunication services (-2%), consumer staples (0%) and utilities (+3%), defensive groups that struggled amid rising interest rates and a general preference for risk. Real estate (+5%) fared a bit better but still lagged, as did financials, industrials, health care (each up 13%) and materials (+11%).
Comments from Lead Portfolio Manager Sonu Kalra: For the fiscal year, the fund's share classes advanced about 24%, outpacing the 22.13% gain of the benchmark, the Nasdaq Composite Index
®. Versus the benchmark, choices in information technology, which made up more than half of the fund's assets for the 12 months, contributed the most. Picks in the consumer discretionary sector also helped versus the index. French videogame maker UbiSoft Entertainment, a non-index stock, added more value than any other position. The fund's shares of UbiSoft returned about 74% for the period. This firm reported strong quarterly financial results, driven by sales of popular titles, such as Far Cry
® 5 and Assassin's Creed
® Origins. An overweighting in Nutanix (+130%), a cloud-based storage provider, also contributed notably. Of note, we pared the fund’s positions in each of these holdings by period end to take profits. Conversely, choices in health care detracted. This included the fund’s stake in Tesaro (-72%). The biotechnology firm’s drug for ovarian cancer got off to a slow start, disappointing investors. The fund’s sizable position in Tesla (-8%) also hurt.
The views expressed above reflect those of the portfolio manager(s) only through the end of the period as stated on the cover of this report and do not necessarily represent the views of Fidelity or any other person in the Fidelity organization. Any such views are subject to change at any time based upon market or other conditions and Fidelity disclaims any responsibility to update such views. These views may not be relied on as investment advice and, because investment decisions for a Fidelity fund are based on numerous factors, may not be relied on as an indication of trading intent on behalf of any Fidelity fund.
Note to Shareholders: On September 16, 2017, Sonu Kalra and Chris Lin became the fund's Lead Portfolio Manager and Co-Manager, respectively, succeeding Gavin Baker.
Investment Summary (Unaudited)
Top Ten Stocks as of July 31, 2018
| | % of fund's net assets |
| Apple, Inc. | 8.7 |
| Amazon.com, Inc. | 7.6 |
| Alphabet, Inc. Class A | 7.2 |
| Microsoft Corp. | 4.9 |
| Facebook, Inc. Class A | 4.3 |
| Activision Blizzard, Inc. | 3.6 |
| NVIDIA Corp. | 3.2 |
| Alphabet, Inc. Class C | 2.7 |
| Ubisoft Entertainment SA | 2.2 |
| Tesla, Inc. | 2.1 |
| | 46.5 |
Top Five Market Sectors as of July 31, 2018
| | % of fund's net assets |
| Information Technology | 58.8 |
| Consumer Discretionary | 19.9 |
| Health Care | 9.7 |
| Financials | 4.7 |
| Consumer Staples | 3.1 |
Asset Allocation (% of fund's net assets)
| As of July 31, 2018* |
| | Stocks | 97.4% |
| | Convertible Securities | 2.6% |

* Foreign investments - 8.2%
Schedule of Investments July 31, 2018
Showing Percentage of Net Assets
| Common Stocks - 97.4% | | | |
| | | Shares | Value (000s) |
| CONSUMER DISCRETIONARY - 19.9% | | | |
| Auto Components - 0.0% | | | |
| Veoneer, Inc. (a) | | 43,800 | $2,291 |
| Automobiles - 2.1% | | | |
| Tesla, Inc. (a)(b) | | 1,441,421 | 429,745 |
| Diversified Consumer Services - 0.1% | | | |
| Adtalem Global Education, Inc. (a) | | 117,500 | 6,410 |
| Weight Watchers International, Inc. (a) | | 198,200 | 17,745 |
| | | | 24,155 |
| Hotels, Restaurants & Leisure - 2.5% | | | |
| Bluegreen Vacations Corp. | | 483,200 | 12,423 |
| Caesars Entertainment Corp. (a) | | 734,800 | 8,303 |
| Chipotle Mexican Grill, Inc. (a) | | 67,300 | 29,185 |
| Churchill Downs, Inc. | | 311,800 | 89,159 |
| Del Frisco's Restaurant Group, Inc. (a) | | 494,300 | 4,226 |
| Eldorado Resorts, Inc. (a) | | 44,900 | 1,924 |
| Hilton Grand Vacations, Inc. (a) | | 517,000 | 17,883 |
| Hilton Worldwide Holdings, Inc. | | 121,000 | 9,518 |
| International Game Technology PLC | | 245,700 | 6,211 |
| Marriott International, Inc. Class A | | 1,664,600 | 212,802 |
| Marriott Vacations Worldwide Corp. | | 27,400 | 3,264 |
| Planet Fitness, Inc. (a) | | 462,400 | 21,973 |
| Restaurant Brands International, Inc. | | 69,100 | 4,408 |
| Royal Caribbean Cruises Ltd. | | 142,200 | 16,034 |
| Texas Roadhouse, Inc. Class A | | 161,100 | 10,124 |
| U.S. Foods Holding Corp. (a) | | 1,111,300 | 37,573 |
| Vail Resorts, Inc. | | 9,362 | 2,592 |
| Wingstop, Inc. | | 508,520 | 25,095 |
| Wyndham Destinations, Inc. | | 46,000 | 2,122 |
| | | | 514,819 |
| Internet & Direct Marketing Retail - 10.9% | | | |
| Amazon.com, Inc. (a) | | 882,608 | 1,568,783 |
| Groupon, Inc. (a) | | 15,337,853 | 71,781 |
| JD.com, Inc. sponsored ADR (a) | | 757,350 | 27,159 |
| Netflix, Inc. (a) | | 836,460 | 282,263 |
| The Booking Holdings, Inc. (a) | | 96,060 | 194,879 |
| Wayfair LLC Class A (a)(b) | | 970,868 | 105,650 |
| | | | 2,250,515 |
| Media - 0.1% | | | |
| China Literature Ltd. (a)(c) | | 743,800 | 6,221 |
| The Walt Disney Co. | | 94,000 | 10,675 |
| Turn, Inc. (Escrow) (a)(d)(e) | | 1,199,041 | 797 |
| | | | 17,693 |
| Multiline Retail - 1.8% | | | |
| Avenue Supermarts Ltd. (a)(c) | | 101,832 | 2,462 |
| Dollar Tree, Inc. (a) | | 3,976,200 | 362,948 |
| | | | 365,410 |
| Specialty Retail - 1.2% | | | |
| Burlington Stores, Inc. (a) | | 164,900 | 25,198 |
| Five Below, Inc. (a) | | 306,300 | 29,760 |
| Lowe's Companies, Inc. | | 666,300 | 66,190 |
| Michaels Companies, Inc. (a) | | 112,100 | 2,288 |
| Ross Stores, Inc. | | 1,121,000 | 98,009 |
| Ulta Beauty, Inc. (a) | | 112,410 | 27,472 |
| Urban Outfitters, Inc. (a) | | 200,100 | 8,884 |
| | | | 257,801 |
| Textiles, Apparel & Luxury Goods - 1.2% | | | |
| Carbon Black, Inc. | | 30,800 | 639 |
| Columbia Sportswear Co. | | 77,800 | 6,767 |
| Crinetics Pharmaceuticals, Inc. (a) | | 95,500 | 2,350 |
| Despegar.com Corp. (b) | | 406,400 | 8,543 |
| G-III Apparel Group Ltd. (a) | | 194,900 | 8,907 |
| GreenSky, Inc. Class A | | 170,400 | 2,948 |
| Homology Medicines, Inc. (a)(b) | | 152,300 | 2,682 |
| Kering SA | | 111,200 | 59,294 |
| lululemon athletica, Inc. (a) | | 1,052,474 | 126,244 |
| LVMH Moet Hennessy - Louis Vuitton SA | | 5,927 | 2,065 |
| Pinduoduo, Inc. ADR | | 162,900 | 3,680 |
| Prada SpA | | 1,916,400 | 9,119 |
| PVH Corp. | | 78,700 | 12,082 |
| Rubius Therapeutics, Inc. (a) | | 100,500 | 2,111 |
| Scholar Rock Holding Corp. | | 100,500 | 1,632 |
| Under Armour, Inc. Class C (non-vtg.) (a) | | 146,700 | 2,749 |
| | | | 251,812 |
|
| TOTAL CONSUMER DISCRETIONARY | | | 4,114,241 |
|
| CONSUMER STAPLES - 2.9% | | | |
| Beverages - 0.8% | | | |
| Keurig Dr. Pepper, Inc. | | 318,900 | 7,657 |
| Monster Beverage Corp. (a) | | 975,540 | 58,552 |
| PepsiCo, Inc. | | 831,700 | 95,646 |
| | | | 161,855 |
| Food & Staples Retailing - 1.5% | | | |
| BJ's Wholesale Club Holdings, Inc. | | 892,000 | 22,113 |
| Costco Wholesale Corp. | | 1,145,683 | 250,572 |
| Performance Food Group Co. (a) | | 1,114,900 | 39,969 |
| | | | 312,654 |
| Food Products - 0.5% | | | |
| Darling International, Inc. (a) | | 425,700 | 8,552 |
| Mondelez International, Inc. | | 863,752 | 37,470 |
| The Kraft Heinz Co. | | 1,021,600 | 61,551 |
| | | | 107,573 |
| Personal Products - 0.1% | | | |
| Coty, Inc. Class A | | 1,139,100 | 15,275 |
|
| TOTAL CONSUMER STAPLES | | | 597,357 |
|
| ENERGY - 1.2% | | | |
| Oil, Gas & Consumable Fuels - 1.2% | | | |
| Anadarko Petroleum Corp. | | 40,900 | 2,992 |
| Andeavor | | 31,400 | 4,712 |
| BP PLC sponsored ADR | | 126,314 | 5,695 |
| Cenovus Energy, Inc. | | 189,900 | 1,905 |
| Centennial Resource Development, Inc. Class A (a) | | 1,030,700 | 18,511 |
| Delek U.S. Holdings, Inc. | | 76,600 | 4,084 |
| Diamondback Energy, Inc. | | 852,000 | 112,421 |
| EOG Resources, Inc. | | 15,700 | 2,024 |
| Extraction Oil & Gas, Inc. (a) | | 401,108 | 6,065 |
| Marathon Petroleum Corp. | | 24,500 | 1,980 |
| Reliance Industries Ltd. | | 1,937,273 | 33,561 |
| Valero Energy Corp. | | 49,500 | 5,858 |
| Whiting Petroleum Corp. (a) | | 821,700 | 40,797 |
| | | | 240,605 |
| FINANCIALS - 4.7% | | | |
| Banks - 1.7% | | | |
| Bank of America Corp. | | 644,700 | 19,908 |
| Bank of the Ozarks, Inc. | | 347,100 | 14,196 |
| BOK Financial Corp. | | 55,600 | 5,412 |
| Citigroup, Inc. | | 300,100 | 21,574 |
| Commerce Bancshares, Inc. | | 711,986 | 47,561 |
| Cullen/Frost Bankers, Inc. | | 81,400 | 8,994 |
| Fifth Third Bancorp | | 334,700 | 9,904 |
| Huntington Bancshares, Inc. | | 7,737,500 | 119,467 |
| Investors Bancorp, Inc. | | 2,669,000 | 33,416 |
| PacWest Bancorp | | 1,035,200 | 51,988 |
| UMB Financial Corp. | | 346,200 | 24,888 |
| | | | 357,308 |
| Capital Markets - 2.4% | | | |
| BlackRock, Inc. Class A | | 46,100 | 23,177 |
| Carlyle Group LP | | 630,500 | 15,353 |
| Cboe Global Markets, Inc. | | 40,800 | 3,963 |
| Charles Schwab Corp. | | 337,300 | 17,223 |
| CME Group, Inc. | | 155,600 | 24,759 |
| E*TRADE Financial Corp. (a) | | 906,520 | 54,219 |
| Monex Group, Inc. (b) | | 600,400 | 2,985 |
| Morgan Stanley | | 167,900 | 8,489 |
| Northern Trust Corp. | | 888,700 | 97,064 |
| T. Rowe Price Group, Inc. | | 16,600 | 1,977 |
| TD Ameritrade Holding Corp. | | 4,029,500 | 230,286 |
| Virtu Financial, Inc. Class A | | 389,200 | 7,842 |
| | | | 487,337 |
| Consumer Finance - 0.6% | | | |
| Capital One Financial Corp. | | 1,227,300 | 115,759 |
| Diversified Financial Services - 0.0% | | | |
| Allakos, Inc. (a) | | 59,700 | 2,434 |
| GDS Holdings Ltd. ADR (a) | | 67,900 | 1,482 |
| | | | 3,916 |
|
| TOTAL FINANCIALS | | | 964,320 |
|
| HEALTH CARE - 9.2% | | | |
| Biotechnology - 6.7% | | | |
| Acceleron Pharma, Inc. (a) | | 44,100 | 1,921 |
| Adamas Pharmaceuticals, Inc. (a)(b) | | 143,100 | 3,403 |
| Agios Pharmaceuticals, Inc. (a) | | 148,535 | 12,835 |
| Alexion Pharmaceuticals, Inc. (a) | | 1,094,089 | 145,470 |
| Alkermes PLC (a) | | 1,236,536 | 54,222 |
| Alnylam Pharmaceuticals, Inc. (a) | | 277,300 | 26,344 |
| Amgen, Inc. | | 1,173,434 | 230,638 |
| AnaptysBio, Inc. (a) | | 101,300 | 7,934 |
| Arena Pharmaceuticals, Inc. (a) | | 134,300 | 5,183 |
| Atara Biotherapeutics, Inc. (a) | | 40,700 | 1,528 |
| Audentes Therapeutics, Inc. (a) | | 49,600 | 1,867 |
| BeiGene Ltd. ADR (a) | | 52,900 | 10,033 |
| BioMarin Pharmaceutical, Inc. (a) | | 152,256 | 15,311 |
| bluebird bio, Inc. (a) | | 389,726 | 60,369 |
| Blueprint Medicines Corp. (a) | | 151,900 | 9,044 |
| Celgene Corp. (a) | | 171,000 | 15,405 |
| Cellectis SA sponsored ADR (a)(b) | | 402,400 | 11,629 |
| Chimerix, Inc. (a) | | 52,700 | 236 |
| Coherus BioSciences, Inc. (a) | | 1,199,902 | 22,858 |
| CytomX Therapeutics, Inc. (a) | | 485,000 | 12,775 |
| CytomX Therapeutics, Inc. (a)(c) | | 244,269 | 6,434 |
| DBV Technologies SA sponsored ADR (a) | | 1,065,500 | 19,211 |
| Deciphera Pharmaceuticals, Inc. (a) | | 50,800 | 1,748 |
| Denali Therapeutics, Inc. (a)(b) | | 829,800 | 10,447 |
| Dicerna Pharmaceuticals, Inc. (a) | | 307,207 | 3,871 |
| Editas Medicine, Inc. (a) | | 200,244 | 5,955 |
| Epizyme, Inc. (a) | | 127,000 | 1,638 |
| FibroGen, Inc. (a) | | 195,200 | 12,317 |
| Flexion Therapeutics, Inc. (a)(b) | | 124,500 | 2,971 |
| GenSight Biologics SA (a)(c) | | 243,848 | 613 |
| Heron Therapeutics, Inc. (a) | | 1,252,815 | 46,918 |
| ImmunoGen, Inc.(a) | | 373,100 | 3,470 |
| Intercept Pharmaceuticals, Inc. (a) | | 417,919 | 38,089 |
| Ionis Pharmaceuticals, Inc. (a) | | 428,902 | 18,734 |
| Iovance Biotherapeutics, Inc. (a) | | 360,400 | 5,118 |
| Ironwood Pharmaceuticals, Inc. Class A (a) | | 1,934,842 | 37,304 |
| Jounce Therapeutics, Inc. (a)(b) | | 561,463 | 3,964 |
| Macrogenics, Inc. (a) | | 162,600 | 3,358 |
| Madrigal Pharmaceuticals, Inc. (a) | | 6,500 | 1,671 |
| Neurocrine Biosciences, Inc. (a) | | 811,400 | 81,538 |
| Ovid Therapeutics, Inc. (a) | | 300,536 | 2,999 |
| Portola Pharmaceuticals, Inc. (a) | | 319,598 | 11,442 |
| Regeneron Pharmaceuticals, Inc. (a) | | 561,800 | 206,748 |
| Sage Therapeutics, Inc. (a) | | 233,275 | 33,666 |
| Sarepta Therapeutics, Inc. (a) | | 289,300 | 33,628 |
| Spark Therapeutics, Inc. (a) | | 334,290 | 25,647 |
| Spectrum Pharmaceuticals, Inc. (a) | | 371,400 | 7,907 |
| Surface Oncology, Inc. | | 133,100 | 1,472 |
| TESARO, Inc. (a)(b) | | 701,600 | 24,437 |
| Trevena, Inc. (a) | | 512,521 | 789 |
| Ultragenyx Pharmaceutical, Inc. (a) | | 112,096 | 8,868 |
| uniQure B.V. (a) | | 535,500 | 16,542 |
| Vertex Pharmaceuticals, Inc. (a) | | 145,900 | 25,540 |
| Xencor, Inc. (a) | | 744,287 | 27,702 |
| Zai Lab Ltd. ADR | | 130,900 | 2,869 |
| | | | 1,384,630 |
| Health Care Equipment & Supplies - 0.8% | | | |
| Align Technology, Inc. (a) | | 42,700 | 15,229 |
| AxoGen, Inc. (a) | | 86,000 | 3,864 |
| Boston Scientific Corp. (a) | | 812,400 | 27,305 |
| DexCom, Inc. (a) | | 122,300 | 11,634 |
| Inogen, Inc. (a) | | 32,500 | 6,476 |
| Insulet Corp. (a) | | 103,500 | 8,607 |
| Intuitive Surgical, Inc. (a) | | 146,746 | 74,575 |
| Quanterix Corp. (a) | | 229,300 | 3,437 |
| ViewRay, Inc. (a)(b) | | 431,200 | 5,140 |
| | | | 156,267 |
| Health Care Providers & Services - 0.3% | | | |
| G1 Therapeutics, Inc. (a) | | 322,672 | 16,569 |
| National Vision Holdings, Inc. | | 597,595 | 24,298 |
| Neuronetics, Inc. | | 44,300 | 1,105 |
| OptiNose, Inc. | | 472,328 | 9,612 |
| OptiNose, Inc. (c) | | 382,170 | 7,777 |
| R1 RCM, Inc. (a) | | 723,402 | 5,802 |
| UnitedHealth Group, Inc. | | 8,100 | 2,051 |
| | | | 67,214 |
| Health Care Technology - 0.5% | | | |
| athenahealth, Inc. (a) | | 615,283 | 92,729 |
| Castlight Health, Inc. Class B (a) | | 53,000 | 175 |
| Teladoc, Inc. (a) | | 197,200 | 11,802 |
| | | | 104,706 |
| Life Sciences Tools & Services - 0.0% | | | |
| Illumina, Inc. (a) | | 7,100 | 2,303 |
| Pharmaceuticals - 0.9% | | | |
| Akcea Therapeutics, Inc. | | 119,720 | 3,786 |
| Allergan PLC | | 26,500 | 4,878 |
| AstraZeneca PLC sponsored ADR | | 612,800 | 23,979 |
| Castle Creek Pharmaceuticals, LLC Class A-2 unit (a)(d)(e)(f)(g) | | 30,303 | 15,454 |
| Chiasma, Inc. (a) | | 779,500 | 1,091 |
| Collegium Pharmaceutical, Inc. (a)(b) | | 659,300 | 12,705 |
| Dova Pharmaceuticals, Inc. (a)(b) | | 313,700 | 6,767 |
| Intra-Cellular Therapies, Inc. (a) | | 127,636 | 2,562 |
| Jazz Pharmaceuticals PLC (a) | | 151,600 | 26,239 |
| MyoKardia, Inc. (a) | | 112,731 | 6,471 |
| Nektar Therapeutics (a) | | 859,200 | 45,194 |
| The Medicines Company (a) | | 237,700 | 9,444 |
| Theravance Biopharma, Inc. (a) | | 180,900 | 4,333 |
| Zogenix, Inc. (a) | | 284,300 | 16,134 |
| | | | 179,037 |
|
| TOTAL HEALTH CARE | | | 1,894,157 |
|
| INDUSTRIALS - 1.4% | | | |
| Aerospace & Defense - 0.2% | | | |
| Space Exploration Technologies Corp.: | | | |
| Class A (a)(d)(e) | | 203,488 | 34,389 |
| Class C (d)(e) | | 7,092 | 1,199 |
| United Technologies Corp. | | 31,500 | 4,276 |
| | | | 39,864 |
| Air Freight & Logistics - 0.0% | | | |
| Air Transport Services Group, Inc. (a) | | 46,124 | 1,039 |
| Expeditors International of Washington, Inc. | | 27,100 | 2,064 |
| | | | 3,103 |
| Airlines - 0.6% | | | |
| American Airlines Group, Inc. | | 1,272,432 | 50,312 |
| Spirit Airlines, Inc. (a) | | 677,700 | 29,439 |
| United Continental Holdings, Inc. (a) | | 537,300 | 43,199 |
| Wheels Up Partners Holdings LLC Series B (a)(d)(e)(f) | | 1,760,377 | 2,764 |
| | | | 125,714 |
| Commercial Services & Supplies - 0.1% | | | |
| Copart, Inc. (a) | | 89,600 | 5,142 |
| Evoqua Water Technologies Corp. (a) | | 268,400 | 5,728 |
| Tomra Systems ASA | | 194,000 | 4,010 |
| | | | 14,880 |
| Construction & Engineering - 0.0% | | | |
| Dycom Industries, Inc. (a) | | 21,300 | 1,899 |
| Machinery - 0.1% | | | |
| Deere & Co. | | 53,300 | 7,717 |
| PACCAR, Inc. | | 162,200 | 10,660 |
| | | | 18,377 |
| Professional Services - 0.0% | | | |
| CoStar Group, Inc. (a) | | 4,900 | 2,038 |
| Recruit Holdings Co. Ltd. | | 72,800 | 1,995 |
| | | | 4,033 |
| Road & Rail - 0.3% | | | |
| J.B. Hunt Transport Services, Inc. | | 328,191 | 39,350 |
| Knight-Swift Transportation Holdings, Inc. Class A | | 426,000 | 13,866 |
| Old Dominion Freight Lines, Inc. | | 92,100 | 13,520 |
| | | | 66,736 |
| Trading Companies & Distributors - 0.1% | | | |
| HD Supply Holdings, Inc. (a) | | 283,900 | 12,486 |
|
| TOTAL INDUSTRIALS | | | 287,092 |
|
| INFORMATION TECHNOLOGY - 57.2% | | | |
| Communications Equipment - 0.0% | | | |
| Arista Networks, Inc. (a) | | 20,800 | 5,319 |
| Cisco Systems, Inc. | | 83,900 | 3,548 |
| Lumentum Holdings, Inc. (a)(b) | | 39,200 | 2,048 |
| | | | 10,915 |
| Electronic Equipment & Components - 0.0% | | | |
| II-VI, Inc. (a) | | 47,100 | 1,846 |
| IPG Photonics Corp. (a) | | 25,000 | 4,101 |
| Jabil, Inc. | | 72,500 | 2,042 |
| | | | 7,989 |
| Internet Software & Services - 19.8% | | | |
| 2U, Inc. (a) | | 198,241 | 14,999 |
| Akamai Technologies, Inc. (a) | | 527,100 | 39,670 |
| Alibaba Group Holding Ltd. sponsored ADR (a) | | 95,600 | 17,899 |
| Alphabet, Inc.: | | | |
| Class A(a) | | 1,212,827 | 1,488,406 |
| Class C (a) | | 452,169 | 550,407 |
| ANGI Homeservices, Inc. Class A (a) | | 1,465,100 | 23,017 |
| Carbonite, Inc. (a) | | 112,300 | 3,852 |
| CarGurus, Inc. Class A (b) | | 1,818,249 | 78,821 |
| Delivery Hero AG (c) | | 45,500 | 2,585 |
| DocuSign, Inc. (b) | | 53,400 | 2,878 |
| Dropbox, Inc.: | | | |
| Class A (a)(b) | | 92,800 | 2,484 |
| Class B | | 221,016 | 5,621 |
| eBay, Inc. (a) | | 990,500 | 33,132 |
| Facebook, Inc. Class A (a) | | 5,135,614 | 886,304 |
| GMO Internet, Inc. | | 352,000 | 7,464 |
| GoDaddy, Inc. (a) | | 875,100 | 64,425 |
| GrubHub, Inc. (a) | | 29,400 | 3,584 |
| HUYA, Inc. ADR (b) | | 312,900 | 10,075 |
| IAC/InterActiveCorp (a) | | 250,745 | 36,922 |
| Instructure, Inc. (a) | | 190,579 | 7,375 |
| Match Group, Inc. (a)(b) | | 541,900 | 19,573 |
| MercadoLibre, Inc. | | 188,600 | 64,673 |
| Mercari, Inc. (a) | | 43,600 | 1,837 |
| Mimecast Ltd. (a) | | 50,900 | 1,828 |
| MINDBODY, Inc. (a) | | 881,900 | 32,939 |
| Momo, Inc. ADR (a) | | 402,600 | 16,515 |
| NetEase, Inc. ADR | | 175,440 | 45,264 |
| New Relic, Inc. (a) | | 682,083 | 66,640 |
| Nutanix, Inc.: | | | |
| Class A (a) | | 2,940,440 | 143,758 |
| Class B (a)(c) | | 311,503 | 15,229 |
| Shopify, Inc. Class A (a) | | 538,726 | 75,049 |
| Stamps.com, Inc. (a) | | 23,600 | 6,160 |
| Tencent Holdings Ltd. | | 1,503,800 | 68,445 |
| Tencent Holdings Ltd. sponsored ADR | | 935,500 | 42,752 |
| The Trade Desk, Inc. (a) | | 167,400 | 14,115 |
| Twilio, Inc. Class A (a) | | 264,558 | 15,315 |
| Twitter, Inc. (a) | | 61,500 | 1,960 |
| Wix.com Ltd. (a) | | 245,500 | 23,323 |
| Yahoo!, Inc. (a) | | 1,518,000 | 111,497 |
| YY, Inc. ADR (a) | | 117,300 | 10,936 |
| Zillow Group, Inc.: | | | |
| Class A (a) | | 1,300 | 73 |
| Class C (a) | | 351,800 | 19,595 |
| | | | 4,077,396 |
| IT Services - 2.3% | | | |
| Adyen BV (c) | | 32,075 | 20,494 |
| Alliance Data Systems Corp. | | 36,800 | 8,276 |
| AppNexus, Inc. warrants (a)(d)(e) | | 1 | 0 |
| FleetCor Technologies, Inc. (a) | | 18,500 | 4,015 |
| Global Payments, Inc. | | 138,200 | 15,557 |
| MasterCard, Inc. Class A | | 163,600 | 32,393 |
| Netcompany Group A/S | | 74,400 | 2,706 |
| PayPal Holdings, Inc. (a) | | 3,272,700 | 268,820 |
| Square, Inc. (a) | | 1,030,199 | 66,602 |
| Total System Services, Inc. | | 24,200 | 2,215 |
| Visa, Inc. Class A | | 252,500 | 34,527 |
| Worldpay, Inc. (a) | | 120,500 | 9,904 |
| | | | 465,509 |
| Semiconductors & Semiconductor Equipment - 9.0% | | | |
| Acacia Communications, Inc. (a) | | 384,200 | 12,348 |
| Advanced Micro Devices, Inc. (a) | | 1,535,100 | 28,138 |
| Analog Devices, Inc. | | 1,147,200 | 110,292 |
| ASML Holding NV | | 48,800 | 10,443 |
| Broadcom, Inc. | | 1,028,166 | 228,016 |
| Intel Corp. | | 1,604,600 | 77,181 |
| Marvell Technology Group Ltd. | | 6,968,936 | 148,508 |
| Micron Technology, Inc. (a) | | 3,247,544 | 171,438 |
| Monolithic Power Systems, Inc. | | 48,600 | 6,448 |
| NVIDIA Corp. | | 2,658,901 | 651,058 |
| NXP Semiconductors NV (a) | | 306,500 | 29,222 |
| Qorvo, Inc. (a) | | 261,800 | 21,405 |
| Qualcomm, Inc. | | 4,882,276 | 312,905 |
| Renesas Electronics Corp. (a) | | 1,366,600 | 12,173 |
| Taiwan Semiconductor Manufacturing Co. Ltd. sponsored ADR | | 297,900 | 12,276 |
| United Microelectronics Corp. sponsored ADR | | 3,297,983 | 9,234 |
| Xilinx, Inc. | | 109,000 | 7,856 |
| | | | 1,848,941 |
| Software - 17.4% | | | |
| Activision Blizzard, Inc. | | 10,202,309 | 749,054 |
| Adobe Systems, Inc. (a) | | 947,300 | 231,785 |
| Altair Engineering, Inc. Class A (a) | | 70,500 | 2,475 |
| Atlassian Corp. PLC (a) | | 1,271,585 | 92,075 |
| Atom Tickets LLC (a)(d)(e)(f) | | 516,103 | 3,000 |
| Autodesk, Inc. (a) | | 1,356,720 | 174,257 |
| Avalara, Inc. | | 27,368 | 1,049 |
| Ceridian HCM Holding, Inc. | | 62,200 | 2,038 |
| Citrix Systems, Inc. (a) | | 122,400 | 13,460 |
| Dataminr, Inc. Series E (e) | | 950,001 | 18,905 |
| Electronic Arts, Inc. (a) | | 183,300 | 23,600 |
| Ellie Mae, Inc. (a) | | 38,600 | 3,830 |
| HIVE Blockchain Technologies Ltd. (a)(b) | | 2,883,100 | 1,862 |
| HIVE Blockchain Technologies Ltd. warrants 11/14/19 (a) | | 2,163,600 | 166 |
| HubSpot, Inc. (a) | | 742,480 | 92,142 |
| Intuit, Inc. | | 604,900 | 123,545 |
| Microsoft Corp. | | 9,501,999 | 1,007,972 |
| Nintendo Co. Ltd. ADR | | 389,500 | 16,620 |
| Parametric Technology Corp. (a) | | 54,900 | 5,046 |
| Paycom Software, Inc. (a)(b) | | 274,632 | 29,180 |
| Paylocity Holding Corp. (a) | | 188,400 | 10,927 |
| Pegasystems, Inc. | | 31,900 | 1,774 |
| Pluralsight, Inc. | | 210,500 | 4,886 |
| Proofpoint, Inc. (a) | | 125,600 | 14,325 |
| Red Hat, Inc. (a) | | 252,700 | 35,689 |
| SailPoint Technologies Holding, Inc. (a) | | 224,700 | 5,413 |
| Salesforce.com, Inc. (a) | | 1,605,048 | 220,132 |
| SendGrid, Inc. (a) | | 313,200 | 7,996 |
| ServiceNow, Inc. (a) | | 13,700 | 2,411 |
| Smartsheet, Inc. | | 43,000 | 925 |
| Snap, Inc. Class A (a)(b) | | 1,077,300 | 13,466 |
| Splunk, Inc. (a) | | 76,200 | 7,323 |
| Take-Two Interactive Software, Inc. (a) | | 85,600 | 9,675 |
| Talend SA ADR (a) | | 82,000 | 4,850 |
| Tanium, Inc. Class B (a)(d)(e) | | 392,200 | 2,661 |
| Ubisoft Entertainment SA (a) | | 4,094,652 | 452,186 |
| Ultimate Software Group, Inc. (a) | | 23,500 | 6,507 |
| Workday, Inc. Class A (a) | | 165,700 | 20,550 |
| Zendesk, Inc. (a) | | 3,134,284 | 170,724 |
| Zynga, Inc. (a) | | 448,800 | 1,701 |
| | | | 3,586,182 |
| Technology Hardware, Storage & Peripherals - 8.7% | | | |
| Apple, Inc. | | 9,448,260 | 1,797,913 |
|
| TOTAL INFORMATION TECHNOLOGY | | | 11,794,845 |
|
| MATERIALS - 0.5% | | | |
| Chemicals - 0.5% | | | |
| CF Industries Holdings, Inc. | | 182,400 | 8,102 |
| FMC Corp. | | 52,180 | 4,690 |
| LG Chemical Ltd. | | 13,965 | 4,703 |
| LyondellBasell Industries NV Class A | | 794,800 | 88,056 |
| Nutrien Ltd. | | 37,400 | 2,031 |
| The Chemours Co. LLC | | 96,100 | 4,402 |
| | | | 111,984 |
| Construction Materials - 0.0% | | | |
| Loma Negra Compania Industrial Argentina SA ADR (a) | | 268,400 | 3,017 |
|
| TOTAL MATERIALS | | | 115,001 |
|
| REAL ESTATE - 0.3% | | | |
| Equity Real Estate Investment Trusts (REITs) - 0.3% | | | |
| Ant International Co. Ltd. (d)(e) | | 6,818,398 | 38,251 |
| Equinix, Inc. | | 44,300 | 19,460 |
| | | | 57,711 |
| Real Estate Management & Development - 0.0% | | | |
| WeWork Companies, Inc. Class A (a)(d)(e) | | 29,911 | 3,065 |
|
| TOTAL REAL ESTATE | | | 60,776 |
|
| TELECOMMUNICATION SERVICES - 0.1% | | | |
| Wireless Telecommunication Services - 0.1% | | | |
| Boingo Wireless, Inc. (a) | | 191,700 | 4,430 |
| T-Mobile U.S., Inc. (a) | | 200,890 | 12,053 |
| | | | 16,483 |
| TOTAL COMMON STOCKS | | | |
| (Cost $12,037,918) | | | 20,084,877 |
|
| Convertible Preferred Stocks - 2.6% | | | |
| CONSUMER DISCRETIONARY - 0.0% | | | |
| Diversified Consumer Services - 0.0% | | | |
| Handy Technologies, Inc. Series C (a)(d)(e) | | 415,643 | 2,436 |
| Internet & Direct Marketing Retail - 0.0% | | | |
| One Kings Lane, Inc. Series E (Escrow) (a)(d)(e) | | 648,635 | 259 |
| The Honest Co., Inc. Series D (a)(d)(e) | | 75,268 | 1,476 |
| | | | 1,735 |
|
| TOTAL CONSUMER DISCRETIONARY | | | 4,171 |
|
| CONSUMER STAPLES - 0.2% | | | |
| Food & Staples Retailing - 0.2% | | | |
| Roofoods Ltd. Series F (d)(e) | | 93,930 | 38,507 |
| FINANCIALS - 0.0% | | | |
| Insurance - 0.0% | | | |
| Clover Health Series D (a)(d)(e) | | 620,983 | 5,823 |
| HEALTH CARE - 0.5% | | | |
| Biotechnology - 0.3% | | | |
| 23andMe, Inc.: | | | |
| Series E (a)(d)(e) | | 1,817,170 | 31,528 |
| Series F (d)(e) | | 683,367 | 11,856 |
| Moderna Therapeutics, Inc.: | | | |
| Series B (a)(d)(e) | | 1,193,491 | 12,007 |
| Series C (a)(d)(e) | | 453,177 | 4,559 |
| | | | 59,950 |
| Health Care Providers & Services - 0.2% | | | |
| Mulberry Health, Inc. Series A8 (a)(d)(e) | | 4,342,250 | 30,981 |
|
| TOTAL HEALTH CARE | | | 90,931 |
|
| INDUSTRIALS - 0.1% | | | |
| Aerospace & Defense - 0.1% | | | |
| Space Exploration Technologies Corp.: | | | |
| Series G (a)(d)(e) | | 62,037 | 10,484 |
| Series H (d)(e) | | 65,670 | 11,098 |
| | | | 21,582 |
| Professional Services - 0.0% | | | |
| YourPeople, Inc. Series C (a)(d)(e) | | 335,546 | 1,735 |
|
| TOTAL INDUSTRIALS | | | 23,317 |
|
| INFORMATION TECHNOLOGY - 1.6% | | | |
| Internet Software & Services - 1.0% | | | |
| Jet.Com, Inc. Series B1 (Escrow) (a)(d)(e) | | 4,896,249 | 222 |
| Lyft, Inc.: | | | |
| Series H (d)(e) | | 595,228 | 28,186 |
| Series I (d)(e) | | 642,291 | 30,415 |
| Pinterest, Inc. Series G, 8.00% (a)(d)(e) | | 139,290 | 826 |
| Reddit, Inc.: | | | |
| Series B (d)(e) | | 1,337,584 | 45,411 |
| Series C (d)(e) | | 300,673 | 10,208 |
| Starry, Inc. Series B (a)(d)(e) | | 1,811,120 | 1,670 |
| Uber Technologies, Inc.: | | | |
| Series D, 8.00% (a)(d)(e) | | 2,234,768 | 89,391 |
| Series E, 8.00% (a)(d)(e) | | 148,620 | 5,945 |
| | | | 212,274 |
| IT Services - 0.2% | | | |
| AppNexus, Inc.: | | | |
| Series E (a)(d)(e) | | 1,416,796 | 28,478 |
| Series F (a)(d)(e) | | 90,913 | 2,364 |
| | | | 30,842 |
| Software - 0.4% | | | |
| Bracket Computing, Inc. Series C (a)(d)(e) | | 1,877,241 | 3,360 |
| Cloudflare, Inc. Series D, 8.00% (a)(d)(e) | | 395,787 | 3,946 |
| Dataminr, Inc. Series D (a)(d)(e) | | 2,219,446 | 44,167 |
| Delphix Corp. Series D (a)(d)(e) | | 427,177 | 3,110 |
| Jello Labs, Inc. Series C (a)(d)(e) | | 302,678 | 3,823 |
| Taboola.Com Ltd. Series E (a)(d)(e) | | 1,918,392 | 33,438 |
| | | | 91,844 |
|
| TOTAL INFORMATION TECHNOLOGY | | | 334,960 |
|
| REAL ESTATE - 0.2% | | | |
| Real Estate Management & Development - 0.2% | | | |
| WeWork Companies, Inc.: | | | |
| Series E (a)(d)(e) | | 269,198 | 27,587 |
| Series F (a)(d)(e) | | 14,513 | 1,487 |
| | | | 29,074 |
| TELECOMMUNICATION SERVICES - 0.0% | | | |
| Wireless Telecommunication Services - 0.0% | | | |
| Altiostar Networks, Inc. Series A1 (a)(d)(e) | | 2,113,909 | 2,706 |
| TOTAL CONVERTIBLE PREFERRED STOCKS | | | |
| (Cost $375,723) | | | 529,489 |
|
| Money Market Funds - 2.4% | | | |
| Fidelity Cash Central Fund, 1.96% (h) | | 16,085,085 | 16,088 |
| Fidelity Securities Lending Cash Central Fund 1.97% (h)(i) | | 484,788,035 | 484,837 |
| TOTAL MONEY MARKET FUNDS | | | |
| (Cost $500,925) | | | 500,925 |
| TOTAL INVESTMENT IN SECURITIES - 102.4% | | | |
| (Cost $12,914,566) | | | 21,115,291 |
| NET OTHER ASSETS (LIABILITIES) - (2.4)% | | | (486,893) |
| NET ASSETS - 100% | | | $20,628,398 |
Values shown as $0 in the Schedule of Investments may reflect amounts less than $500.
Legend
(a) Non-income producing
(b) Security or a portion of the security is on loan at period end.
(c) Security exempt from registration under Rule 144A of the Securities Act of 1933. These securities may be resold in transactions exempt from registration, normally to qualified institutional buyers. At the end of the period, the value of these securities amounted to $61,815,000 or 0.3% of net assets.
(d) Restricted securities - Investment in securities not registered under the Securities Act of 1933 (excluding 144A issues). At the end of the period, the value of restricted securities (excluding 144A issues) amounted to $631,069,000 or 3.1% of net assets.
(e) Level 3 security
(f) Investment is owned by a wholly-owned subsidiary (Subsidiary) that is treated as a corporation for U.S. tax purposes.
(g) Investment represents common shares and preferred shares.
(h) Affiliated fund that is generally available only to investment companies and other accounts managed by Fidelity Investments. The rate quoted is the annualized seven-day yield of the fund at period end. A complete unaudited listing of the fund's holdings as of its most recent quarter end is available upon request. In addition, each Fidelity Central Fund's financial statements, which are not covered by the Fund's Report of Independent Registered Public Accounting Firm, are available on the SEC's website or upon request.
(i) Investment made with cash collateral received from securities on loan.
Additional information on each restricted holding is as follows:
| Security | Acquisition Date | Acquisition Cost (000s) |
| 23andMe, Inc. Series E | 6/18/15 | $19,675 |
| 23andMe, Inc. Series F | 8/31/17 | $9,488 |
| Altiostar Networks, Inc. Series A1 | 1/10/17 | $9,724 |
| Ant International Co. Ltd. | 5/16/18 | $38,251 |
| AppNexus, Inc. Series E | 8/1/14 - 9/17/14 | $28,382 |
| AppNexus, Inc. Series F | 8/23/16 | $2,364 |
| AppNexus, Inc. warrants | 8/23/16 | $0 |
| Atom Tickets LLC | 8/15/17 | $3,000 |
| Bracket Computing, Inc. Series C | 9/9/15 | $14,766 |
| Castle Creek Pharmaceuticals, LLC Class A-2 unit | 9/29/16 | $10,000 |
| Cloudflare, Inc. Series D, 8.00% | 11/5/14 | $2,424 |
| Clover Health Series D | 6/7/17 | $5,823 |
| Dataminr, Inc. Series D | 2/18/15 - 3/6/15 | $28,298 |
| Delphix Corp. Series D | 7/10/15 | $3,845 |
| Handy Technologies, Inc. Series C | 10/14/15 | $2,436 |
| Jello Labs, Inc. Series C | 12/22/16 | $4,899 |
| Jet.Com, Inc. Series B1 (Escrow) | 9/9/16 | $0 |
| Lyft, Inc. Series H | 11/22/17 | $23,658 |
| Lyft, Inc. Series I | 6/27/18 | $30,415 |
| Moderna Therapeutics, Inc. Series B | 4/13/17 | $6,922 |
| Moderna Therapeutics, Inc. Series C | 4/13/17 | $2,633 |
| Mulberry Health, Inc. Series A8 | 1/20/16 | $29,331 |
| One Kings Lane, Inc. Series E (Escrow) | 1/29/14 | $429 |
| Pinterest, Inc. Series G, 8.00% | 2/27/15 | $1,000 |
| Reddit, Inc. Series B | 7/26/17 | $18,989 |
| Reddit, Inc. Series C | 7/24/17 | $4,743 |
| Roofoods Ltd. Series F | 9/12/17 | $33,211 |
| Space Exploration Technologies Corp. Class A | 10/16/15 - 9/11/17 | $21,156 |
| Space Exploration Technologies Corp. Class C | 9/11/17 | $957 |
| Space Exploration Technologies Corp. Series G | 1/20/15 | $4,805 |
| Space Exploration Technologies Corp. Series H | 8/4/17 | $8,865 |
| Starry, Inc. Series B | 12/1/16 | $980 |
| Taboola.Com Ltd. Series E | 12/22/14 | $20,000 |
| Tanium, Inc. Class B | 4/21/17 | $1,947 |
| The Honest Co., Inc. Series D | 8/3/15 | $3,444 |
| Turn, Inc. (Escrow) | 4/11/17 | $863 |
| Uber Technologies, Inc. Series D, 8.00% | 6/6/14 | $34,668 |
| Uber Technologies, Inc. Series E, 8.00% | 12/5/14 | $4,952 |
| WeWork Companies, Inc. Class A | 6/23/15 | $984 |
| WeWork Companies, Inc. Series E | 6/23/15 | $8,854 |
| WeWork Companies, Inc. Series F | 12/1/16 | $728 |
| Wheels Up Partners Holdings LLC Series B | 9/18/15 | $5,000 |
| YourPeople, Inc. Series C | 5/1/15 | $5,000 |
Affiliated Central Funds
Information regarding fiscal year to date income earned by the Fund from investments in Fidelity Central Funds is as follows:
| Fund | Income earned |
| | (Amounts in thousands) |
| Fidelity Cash Central Fund | $738 |
| Fidelity Securities Lending Cash Central Fund | 7,477 |
| Total | $8,215 |
Amounts in the income column in the above table include any capital gain distributions from underlying funds, which are presented in the corresponding line-item in the Statement of Operations if applicable.
Other Affiliated Issuers
An affiliated company is a company in which the Fund has ownership of at least 5% of the voting securities. Fiscal year to date transactions with companies which are or were affiliates are as follows:
| Affiliate (Amounts in thousands) | Value, beginning of period | Purchases | Sales Proceeds(a) | Dividend Income | Realized Gain (loss) | Change in Unrealized appreciation (depreciation) | Value, end of period |
| athenahealth, Inc. | $326,198 | $-- | $234,957 | $-- | $32,563 | $(31,075) | $-- |
| Criteo SA sponsored ADR | 266,048 | -- | 185,723 | -- | 3,728 | (84,053) | -- |
| Groupon, Inc. | 209,589 | -- | 196,964 | -- | (134,828) | 193,984 | -- |
| Ubisoft Entertainment SA | 677,873 | -- | 599,925 | -- | 519,851 | (145,613) | -- |
| Wingstop, Inc. | 49,616 | -- | 42,831 | 1,174 | 9,346 | 10,012 | -- |
| Total | $1,529,324 | $-- | $1,260,400 | $1,174 | $430,660 | $(56,745) | $-- |
(a) Includes the value of securities delivered through in-kind transactions, if applicable.
Investment Valuation
The following is a summary of the inputs used, as of July 31, 2018, involving the Fund's assets and liabilities carried at fair value. The inputs or methodology used for valuing securities may not be an indication of the risk associated with investing in those securities. For more information on valuation inputs, and their aggregation into the levels used below, please refer to the Investment Valuation section in the accompanying Notes to Financial Statements.
| | Valuation Inputs at Reporting Date: |
| Description | Total | Level 1 | Level 2 | Level 3 |
| (Amounts in thousands) | | | | |
| Investments in Securities: | | | | |
| Equities: | | | | |
| Consumer Discretionary | $4,118,412 | $4,111,379 | $2,065 | $4,968 |
| Consumer Staples | 635,864 | 597,357 | -- | 38,507 |
| Energy | 240,605 | 240,605 | -- | -- |
| Financials | 970,143 | 964,320 | -- | 5,823 |
| Health Care | 1,985,088 | 1,878,703 | -- | 106,385 |
| Industrials | 310,409 | 246,745 | 1,995 | 61,669 |
| Information Technology | 12,129,805 | 11,696,213 | 74,066 | 359,526 |
| Materials | 115,001 | 115,001 | -- | -- |
| Real Estate | 89,850 | 19,460 | -- | 70,390 |
| Telecommunication Services | 19,189 | 16,483 | -- | 2,706 |
| Money Market Funds | 500,925 | 500,925 | -- | -- |
| Total Investments in Securities: | $21,115,291 | $20,387,191 | $78,126 | $649,974 |
The following is a reconciliation of Investments in Securities for which Level 3 inputs were used in determining value:
| (Amounts in thousands) | |
| Investments in Securities: | |
| Equities - Information Technology | |
| Beginning Balance | $276,076 |
| Net Realized Gain (Loss) on Investment Securities | 1,696 |
| Net Unrealized Gain (Loss) on Investment Securities | 26,769 |
| Cost of Purchases | 71,458 |
| Proceeds of Sales | (16,473) |
| Amortization/Accretion | -- |
| Transfers into Level 3 | -- |
| Transfers out of Level 3 | -- |
| Ending Balance | $359,526 |
| The change in unrealized gain (loss) for the period attributable to Level 3 securities held at July 31, 2018 | $30,294 |
| Other Investments in Securities | |
| Beginning Balance | $210,038 |
| Net Realized Gain (Loss) on Investment Securities | -- |
| Net Unrealized Gain (Loss) on Investment Securities | 23,441 |
| Cost of Purchases | 97,811 |
| Proceeds of Sales | (40,842) |
| Amortization/Accretion | -- |
| Transfers into Level 3 | -- |
| Transfers out of Level 3 | -- |
| Ending Balance | $290,448 |
| The change in unrealized gain (loss) for the period attributable to Level 3 securities held at July 31, 2018 | $44,787 |
The information used in the above reconciliations represents fiscal year to date activity for any Investments in Securities identified as using Level 3 inputs at either the beginning or the end of the current fiscal period. Transfers in or out of Level 3 represent the beginning value of any Security or Instrument where a change in the pricing level occurred from the beginning to the end of the period. The cost of purchases and the proceeds of sales may include securities received or delivered through corporate actions or exchanges. Realized and unrealized gains (losses) disclosed in the reconciliations are included in Net Gain (Loss) on the Fund's Statement of Operations.
See accompanying notes which are an integral part of the financial statements.
Financial Statements
Statement of Assets and Liabilities
| Amounts in thousands (except per-share amounts) | | July 31, 2018 |
| Assets | | |
Investment in securities, at value (including securities loaned of $485,891) — See accompanying schedule:
Unaffiliated issuers (cost $12,413,641) | $20,614,366 | |
| Fidelity Central Funds (cost $500,925) | 500,925 | |
| Total Investment in Securities (cost $12,914,566) | | $21,115,291 |
| Cash | | 619 |
| Foreign currency held at value (cost $51) | | 51 |
| Receivable for investments sold | | 59,116 |
| Receivable for fund shares sold | | 18,589 |
| Dividends receivable | | 1,471 |
| Distributions receivable from Fidelity Central Funds | | 746 |
| Prepaid expenses | | 53 |
| Other receivables | | 907 |
| Total assets | | 21,196,843 |
| Liabilities | | |
| Payable for investments purchased | $45,740 | |
| Payable for fund shares redeemed | 21,282 | |
| Accrued management fee | 12,784 | |
| Other affiliated payables | 1,972 | |
| Other payables and accrued expenses | 1,832 | |
| Collateral on securities loaned | 484,835 | |
| Total liabilities | | 568,445 |
| Net Assets | | $20,628,398 |
| Net Assets consist of: | | |
| Paid in capital | | $11,676,525 |
| Accumulated net investment loss | | (19,053) |
| Accumulated undistributed net realized gain (loss) on investments and foreign currency transactions | | 771,238 |
| Net unrealized appreciation (depreciation) on investments and assets and liabilities in foreign currencies | | 8,199,688 |
| Net Assets | | $20,628,398 |
| OTC: | | |
| Net Asset Value, offering price and redemption price per share ($13,340,445 ÷ 1,067,232 shares) | | $12.50 |
| Class K: | | |
| Net Asset Value, offering price and redemption price per share ($7,287,953 ÷ 575,304 shares) | | $12.67 |
See accompanying notes which are an integral part of the financial statements.
Statement of Operations
| Amounts in thousands | | Year ended July 31, 2018 |
| Investment Income | | |
| Dividends (including $1,174 earned from other affiliated issuers) | | $121,380 |
| Interest | | 136 |
| Income from Fidelity Central Funds (including $7,477 from security lending) | | 8,215 |
| Total income | | 129,731 |
| Expenses | | |
| Management fee | | |
| Basic fee | $108,402 | |
| Performance adjustment | 23,144 | |
| Transfer agent fees | 21,942 | |
| Accounting and security lending fees | 1,807 | |
| Custodian fees and expenses | 368 | |
| Independent trustees' fees and expenses | 77 | |
| Registration fees | 404 | |
| Audit | 97 | |
| Legal | 44 | |
| Interest | 20 | |
| Miscellaneous | 120 | |
| Total expenses before reductions | 156,425 | |
| Expense reductions | (920) | |
| Total expenses after reductions | | 155,505 |
| Net investment income (loss) | | (25,774) |
| Realized and Unrealized Gain (Loss) | | |
| Net realized gain (loss) on: | | |
| Investment securities: | | |
| Unaffiliated issuers | 560,040 | |
| Fidelity Central Funds | 82 | |
| Other affiliated issuers | 430,660 | |
| Foreign currency transactions | (18) | |
| Total net realized gain (loss) | | 990,764 |
| Change in net unrealized appreciation (depreciation) on: | | |
| Investment securities: | | |
| Unaffiliated issuers (net of increase in deferred foreign taxes of $1,007) | 3,007,727 | |
| Fidelity Central Funds | (26) | |
| Other affiliated issuers | (56,745) | |
| Assets and liabilities in foreign currencies | 2 | |
| Total change in net unrealized appreciation (depreciation) | | 2,950,958 |
| Net gain (loss) | | 3,941,722 |
| Net increase (decrease) in net assets resulting from operations | | $3,915,948 |
See accompanying notes which are an integral part of the financial statements.
Statement of Changes in Net Assets
| Amounts in thousands | Year ended July 31, 2018 | Year ended July 31, 2017 |
| Increase (Decrease) in Net Assets | | |
| Operations | | |
| Net investment income (loss) | $(25,774) | $(18,864) |
| Net realized gain (loss) | 990,764 | 1,654,079 |
| Change in net unrealized appreciation (depreciation) | 2,950,958 | 1,836,371 |
| Net increase (decrease) in net assets resulting from operations | 3,915,948 | 3,471,586 |
| Distributions to shareholders from net realized gain | (808,260) | (413,520) |
| Total distributions | (808,260) | (413,520) |
| Share transactions - net increase (decrease) | 1,722,903 | (614,015) |
| Total increase (decrease) in net assets | 4,830,591 | 2,444,051 |
| Net Assets | | |
| Beginning of period | 15,797,807 | 13,353,756 |
| End of period | $20,628,398 | $15,797,807 |
| Other Information | | |
| Accumulated net investment loss end of period | $(19,053) | $(136) |
See accompanying notes which are an integral part of the financial statements.
Financial Highlights
Fidelity OTC Portfolio
| Years ended July 31, | 2018 | 2017 | 2016 | 2015 | 2014 |
| Selected Per–Share DataA | | | | | |
| Net asset value, beginning of period | $10.57 | $8.53 | $8.70 | $8.12 | $7.90 |
| Income from Investment Operations | | | | | |
| Net investment income (loss)B | (.02) | (.02) | (.01) | (.01) | (.01) |
| Net realized and unrealized gain (loss) | 2.48 | 2.33 | .29 | 1.62 | 1.28 |
| Total from investment operations | 2.46 | 2.31 | .28 | 1.61 | 1.27 |
| Distributions from net investment income | – | – | – | – | (.01) |
| Distributions from net realized gain | (.53) | (.27) | (.45) | (1.03) | (1.04) |
| Total distributions | (.53) | (.27) | (.45) | (1.03) | (1.05) |
| Net asset value, end of period | $12.50 | $10.57 | $8.53 | $8.70 | $8.12 |
| Total ReturnC | 24.34% | 27.97% | 3.68% | 21.34% | 17.96% |
| Ratios to Average Net AssetsD,E | | | | | |
| Expenses before reductions | .88% | .81% | .91% | .83% | .77% |
| Expenses net of fee waivers, if any | .88% | .81% | .91% | .83% | .77% |
| Expenses net of all reductions | .88% | .81% | .90% | .83% | .76% |
| Net investment income (loss) | (.17)% | (.16)% | (.07)% | (.13)% | (.08)% |
| Supplemental Data | | | | | |
| Net assets, end of period (in millions) | $13,340 | $12,136 | $9,845 | $9,710 | $7,870 |
| Portfolio turnover rateF | 38%G | 71%G | 56%G | 66%G | 106% |
A Per share amounts have been adjusted to reflect the impact of the 10 for 1 share split that occurred on May 11, 2018.
B Calculated based on average shares outstanding during the period.
C Total returns would have been lower if certain expenses had not been reduced during the applicable periods shown.
D Fees and expenses of any underlying Fidelity Central Funds are not included in the Fund's expense ratio. The Fund indirectly bears its proportionate share of the expenses of any underlying Fidelity Central Funds.
E Expense ratios reflect operating expenses of the class. Expenses before reductions do not reflect amounts reimbursed by the investment adviser or reductions from brokerage service arrangements or reductions from other expense offset arrangements and do not represent the amount paid by the class during periods when reimbursements or reductions occur. Expenses net of fee waivers reflect expenses after reimbursement by the investment adviser but prior to reductions from brokerage service arrangements or other expense offset arrangements. Expenses net of all reductions represent the net expenses paid by the class.
F Amount does not include the portfolio activity of any underlying Fidelity Central Funds.
G Portfolio turnover rate excludes securities received or delivered in-kind.
See accompanying notes which are an integral part of the financial statements.
Fidelity OTC Portfolio Class K
| Years ended July 31, | 2018 | 2017 | 2016 | 2015 | 2014 |
| Selected Per–Share DataA | | | | | |
| Net asset value, beginning of period | $10.70 | $8.62 | $8.79 | $8.20 | $7.96 |
| Income from Investment Operations | | | | | |
| Net investment income (loss)B | (.01) | (.01) | –C | –C | –C |
| Net realized and unrealized gain (loss) | 2.52 | 2.36 | .29 | 1.63 | 1.30 |
| Total from investment operations | 2.51 | 2.35 | .29 | 1.63 | 1.30 |
| Distributions from net investment income | – | – | – | – | (.01) |
| Distributions from net realized gain | (.54) | (.27) | (.46) | (1.04) | (1.05) |
| Total distributions | (.54) | (.27) | (.46) | (1.04) | (1.06) |
| Net asset value, end of period | $12.67 | $10.70 | $8.62 | $8.79 | $8.20 |
| Total ReturnD | 24.48% | 28.12% | 3.80% | 21.49% | 18.10% |
| Ratios to Average Net AssetsE,F | | | | | |
| Expenses before reductions | .78% | .70% | .79% | .72% | .65% |
| Expenses net of fee waivers, if any | .78% | .70% | .79% | .72% | .65% |
| Expenses net of all reductions | .77% | .70% | .79% | .71% | .64% |
| Net investment income (loss) | (.07)% | (.05)% | .05% | (.02)% | .05% |
| Supplemental Data | | | | | |
| Net assets, end of period (in millions) | $7,288 | $3,662 | $3,508 | $3,836 | $2,906 |
| Portfolio turnover rateG | 38%H | 71%H | 56%H | 66%H | 106% |
A Per share amounts have been adjusted to reflect the impact of the 10 for 1 share split that occurred on May 11, 2018.
B Calculated based on average shares outstanding during the period.
C Amount represents less than $.005 per share.
D Total returns would have been lower if certain expenses had not been reduced during the applicable periods shown.
E Fees and expenses of any underlying Fidelity Central Funds are not included in the Fund's expense ratio. The Fund indirectly bears its proportionate share of the expenses of any underlying Fidelity Central Funds.
F Expense ratios reflect operating expenses of the class. Expenses before reductions do not reflect amounts reimbursed by the investment adviser or reductions from brokerage service arrangements or reductions from other expense offset arrangements and do not represent the amount paid by the class during periods when reimbursements or reductions occur. Expenses net of fee waivers reflect expenses after reimbursement by the investment adviser but prior to reductions from brokerage service arrangements or other expense offset arrangements. Expenses net of all reductions represent the net expenses paid by the class.
G Amount does not include the portfolio activity of any underlying Fidelity Central Funds.
H Portfolio turnover rate excludes securities received or delivered in-kind.
See accompanying notes which are an integral part of the financial statements.
Notes to Financial Statements
For the period ended July 31, 2018
(Amounts in thousands except percentages)
1. Organization.
Fidelity OTC Portfolio (the Fund) is a non-diversified fund of Fidelity Securities Fund (the Trust) and is authorized to issue an unlimited number of shares. The Trust is registered under the Investment Company Act of 1940, as amended (the 1940 Act), as an open-end management investment company organized as a Massachusetts business trust. The Fund offers OTC and Class K shares, each of which has equal rights as to assets and voting privileges. Each class has exclusive voting rights with respect to matters that affect that class.
Effective May 11, 2018, each class underwent a 10 for 1 share split. The effect of the share split transaction was to multiply the number of outstanding share of each Class by a split factor of 10:1, with a corresponding decrease in net asset value (NAV) per share. This event does not impact the overall net assets of each class. The per share data presented in the Financial Highlights and Share Transactions presented in the Notes to Financial Statements have been retroactively adjusted to reflect this share split.
2. Investments in Fidelity Central Funds.
The Fund invests in Fidelity Central Funds, which are open-end investment companies generally available only to other investment companies and accounts managed by the investment adviser and its affiliates. The Fund's Schedule of Investments lists each of the Fidelity Central Funds held as of period end, if any, as an investment of the Fund, but does not include the underlying holdings of each Fidelity Central Fund. As an Investing Fund, the Fund indirectly bears its proportionate share of the expenses of the underlying Fidelity Central Funds.
The Money Market Central Funds seek preservation of capital and current income and are managed by Fidelity Investments Money Management, Inc. (FIMM), an affiliate of the investment adviser. Annualized expenses of the Money Market Central Funds as of their most recent shareholder report date are less than .005%.
A complete unaudited list of holdings for each Fidelity Central Fund is available upon request or at the Securities and Exchange Commission (the SEC) website at www.sec.gov. In addition, the financial statements of the Fidelity Central Funds, which are not covered by the Fund's Report of Independent Registered Public Accounting Firm, are available on the SEC website or upon request.
3. Significant Accounting Policies.
The Fund is an investment company and applies the accounting and reporting guidance of the Financial Accounting Standards Board (FASB) Accounting Standards Codification Topic 946 Financial Services – Investments Companies. The financial statements have been prepared in conformity with accounting principles generally accepted in the United States of America (GAAP), which require management to make certain estimates and assumptions at the date of the financial statements. Actual results could differ from those estimates. Subsequent events, if any, through the date that the financial statements were issued have been evaluated in the preparation of the financial statements. The following summarizes the significant accounting policies of the Fund:
Investment Valuation. Investments are valued as of 4:00 p.m. Eastern time on the last calendar day of the period. The Board of Trustees (the Board) has delegated the day to day responsibility for the valuation of the Fund's investments to the Fair Value Committee (the Committee) established by the Fund's investment adviser. In accordance with valuation policies and procedures approved by the Board, the Fund attempts to obtain prices from one or more third party pricing vendors or brokers to value its investments. When current market prices, quotations or currency exchange rates are not readily available or reliable, investments will be fair valued in good faith by the Committee, in accordance with procedures adopted by the Board. Factors used in determining fair value vary by investment type and may include market or investment specific events. The frequency with which these procedures are used cannot be predicted and they may be utilized to a significant extent. The Committee oversees the Fund's valuation policies and procedures and reports to the Board on the Committee's activities and fair value determinations. The Board monitors the appropriateness of the procedures used in valuing the Fund's investments and ratifies the fair value determinations of the Committee.
The Fund categorizes the inputs to valuation techniques used to value its investments into a disclosure hierarchy consisting of three levels as shown below:
- Level 1 – quoted prices in active markets for identical investments
- Level 2 – other significant observable inputs (including quoted prices for similar investments, interest rates, prepayment speeds, etc.)
- Level 3 – unobservable inputs (including the Fund's own assumptions based on the best information available)
Valuation techniques used to value the Fund's investments by major category are as follows:
Equity securities, including restricted securities, for which market quotations are readily available, are valued at the last reported sale price or official closing price as reported by a third party pricing vendor on the primary market or exchange on which they are traded and are categorized as Level 1 in the hierarchy. In the event there were no sales during the day or closing prices are not available, securities are valued at the last quoted bid price or may be valued using the last available price and are generally categorized as Level 2 in the hierarchy. For foreign equity securities, when market or security specific events arise, comparisons to the valuation of American Depositary Receipts (ADRs), futures contracts, Exchange-Traded Funds (ETFs) and certain indexes as well as quoted prices for similar securities may be used and would be categorized as Level 2 in the hierarchy. Utilizing these techniques may result in transfers between Level 1 and Level 2. For equity securities, including restricted securities, where observable inputs are limited, assumptions about market activity and risk are used and these securities may be categorized as Level 3 in the hierarchy. Equity securities, including restricted securities, for which observable inputs are not available are valued using alternate valuation approaches, including the market approach and the income approach and are categorized as Level 3 in the hierarchy. The market approach generally consists of using comparable market transactions while the income approach generally consists of using the net present value of estimated future cash flows, adjusted as appropriate for liquidity, credit, market and/or other risk factors.
Investments in open-end mutual funds, including the Fidelity Central Funds, are valued at their closing net asset value (NAV) each business day and are categorized as Level 1 in the hierarchy.
The following provides information on Level 3 securities held by the Fund that were valued at period end based on unobservable inputs. These amounts exclude valuations provided by a broker.
| Asset Type | Fair Value | Valuation Technique(s) | Unobservable Input | Amount or Range/Weighted Average | Impact to Valuation from an Increase in Input(a) |
| Equities | $649,974 | Market comparable | Enterprise value/Sales multiple (EV/S) | 1.5 - 12.2 / 7.0 | Increase |
| | | | Transaction price | $10.06 - $330.00 / $164.48 | Increase |
| | | | Discount rate | 6.0% - 76.0% / 51.7% | Decrease |
| | | | Conversion ratio | 3.0 | Increase |
| | | | Discount for lack of marketability | 10.0% - 25.0% / 15.2% | Decrease |
| | | | Premium rate | 7.5% - 76.0% / 72.4% | Increase |
| | | | Proxy premium | 54.5% | Increase |
| | | | Liquidity preference | $14.90 | Increase |
| | | Market approach | Transaction price | $0.81 - $169.00 / $44.50 | Increase |
| | | | Conversion ratio | 1.6 | Increase |
| | | Book value | Book value multiple | 1.0 | Increase |
| | | | Discount rate | 70.0% | Decrease |
| | | Discount cash flow | Discount rate | 9.0% | Decrease |
| | | | Discount for lack of marketability | 20.0% | Decrease |
| | | | Growth rate | 3.0% | Increase |
| | | Recovery value | Recovery value | 0.0% - 0.7% / 0.5% | Increase |
(a) Represents the expected directional change in the fair value of the Level 3 investments that would result from an increase in the corresponding input. A decrease to the unobservable input would have the opposite effect. Significant changes in these inputs could result in significantly higher or lower fair value measurements.
Changes in valuation techniques may result in transfers in or out of an assigned level within the disclosure hierarchy. The aggregate value of investments by input level as of July 31, 2018, as well as a roll forward of Level 3 investments, is included at the end of the Fund's Schedule of Investments.
Foreign Currency. The Fund may use foreign currency contracts to facilitate transactions in foreign-denominated securities. Gains and losses from these transactions may arise from changes in the value of the foreign currency or if the counterparties do not perform under the contracts' terms.
Foreign-denominated assets, including investment securities, and liabilities are translated into U.S. dollars at the exchange rates at period end. Purchases and sales of investment securities, income and dividends received and expenses denominated in foreign currencies are translated into U.S. dollars at the exchange rate in effect on the transaction date.
The effects of exchange rate fluctuations on investments are included with the net realized and unrealized gain (loss) on investment securities. Other foreign currency transactions resulting in realized and unrealized gain (loss) are disclosed separately.
Investment Transactions and Income. For financial reporting purposes, the Fund's investment holdings and NAV include trades executed through the end of the last business day of the period. The NAV per share for processing shareholder transactions is calculated as of the close of business of the New York Stock Exchange (NYSE), normally 4:00 p.m. Eastern time and includes trades executed through the end of the prior business day. Gains and losses on securities sold are determined on the basis of identified cost and include proceeds received from litigation. Dividend income is recorded on the ex-dividend date, except for certain dividends from foreign securities where the ex-dividend date may have passed, which are recorded as soon as the Fund is informed of the ex-dividend date. Non-cash dividends included in dividend income, if any, are recorded at the fair market value of the securities received. Income and capital gain distributions from Fidelity Central Funds, if any, are recorded on the ex-dividend date. Certain distributions received by the Fund represent a return of capital or capital gain. The Fund determines the components of these distributions subsequent to the ex-dividend date, based upon receipt of tax filings or other correspondence relating to the underlying investment. These distributions are recorded as a reduction of cost of investments and/or as a realized gain. Interest income is accrued as earned and includes coupon interest and amortization of premium and accretion of discount on debt securities as applicable. Investment income is recorded net of foreign taxes withheld where recovery of such taxes is uncertain.
Class Allocations and Expenses. Investment income, realized and unrealized capital gains and losses, common expenses of the Fund, and certain fund-level expense reductions, if any, are allocated daily on a pro-rata basis to each class based on the relative net assets of each class to the total net assets of the Fund. Each class differs with respect to transfer agent fees incurred. Certain expense reductions may also differ by class. For the reporting period, the allocated portion of income and expenses to each class as a percent of its average net assets may vary due to the timing of recording these transactions in relation to fluctuating net assets of the classes. Expenses directly attributable to a fund are charged to that fund. Expenses attributable to more than one fund are allocated among the respective funds on the basis of relative net assets or other appropriate methods. Expense estimates are accrued in the period to which they relate and adjustments are made when actual amounts are known.
Deferred Trustee Compensation. Under a Deferred Compensation Plan (the Plan), certain independent Trustees have elected to defer receipt of a portion of their annual compensation. Deferred amounts are invested in a cross-section of Fidelity funds, are marked-to-market and remain in the Fund until distributed in accordance with the Plan. The investment of deferred amounts and the offsetting payable to the Trustees of $592 are included in the accompanying Statement of Assets and Liabilities in other receivables and other payables and accrued expenses, respectively.
Income Tax Information and Distributions to Shareholders. Each year, the Fund intends to qualify as a regulated investment company under Subchapter M of the Internal Revenue Code, including distributing substantially all of its taxable income and realized gains. As a result, no provision for U.S. Federal income taxes is required. As of July 31, 2018, the Fund did not have any unrecognized tax benefits in the financial statements; nor is the Fund aware of any tax positions for which it is reasonably possible that the total amounts of unrecognized tax benefits will significantly change in the next twelve months. The Fund files a U.S. federal tax return, in addition to state and local tax returns as required. The Fund's federal income tax returns are subject to examination by the Internal Revenue Service (IRS) for a period of three fiscal years after they are filed. State and local tax returns may be subject to examination for an additional fiscal year depending on the jurisdiction. Foreign taxes are provided for based on the Fund's understanding of the tax rules and rates that exist in the foreign markets in which it invests. The Fund is subject to a tax imposed on capital gains by certain countries in which it invests. An estimated deferred tax liability for net unrealized appreciation on the applicable securities is included in Other payables and accrued expenses on the Statement of Assets & Liabilities.
Distributions are declared and recorded on the ex-dividend date. Income and capital gain distributions are declared separately for each class. Income and capital gain distributions are determined in accordance with income tax regulations, which may differ from GAAP. In addition, the Fund claimed a portion of the payment made to redeeming shareholders as a distribution for income tax purposes.
Capital accounts within the financial statements are adjusted for permanent book-tax differences. These adjustments have no impact on net assets or the results of operations. Capital accounts are not adjusted for temporary book-tax differences which will reverse in a subsequent period.
Book-tax differences are primarily due to foreign currency transactions, certain foreign taxes, passive foreign investment companies (PFIC), redemptions in kind, partnerships, deferred trustees compensation, net operating losses and losses deferred due to wash sales, and excise tax regulations.
As of period end, the cost and unrealized appreciation (depreciation) in securities, and derivatives if applicable, for federal income tax purposes were as follows:
| Gross unrealized appreciation | $8,726,352 |
| Gross unrealized depreciation | (565,033) |
| Net unrealized appreciation (depreciation) | $8,161,319 |
| Tax Cost | $12,953,972 |
The tax-based components of distributable earnings as of period end were as follows:
| Undistributed long-term capital gain | $810,643 |
| Net unrealized appreciation (depreciation) on securities and other investments | $8,161,290 |
The Fund intends to elect to defer to its next fiscal year $18,461 of ordinary losses recognized during the period January 1, 2018 to July, 31 2018.
The tax character of distributions paid was as follows:
| | July 31, 2018 | July 31, 2017 |
| Ordinary Income | $115,477 | $ 51,166 |
| Long-term Capital Gains | 692,783 | 362,354 |
| Total | $808,260 | $ 413,520 |
Restricted Securities. The Fund may invest in securities that are subject to legal or contractual restrictions on resale. These securities generally may be resold in transactions exempt from registration or to the public if the securities are registered. Disposal of these securities may involve time-consuming negotiations and expense, and prompt sale at an acceptable price may be difficult. Information regarding restricted securities is included at the end of the Fund's Schedule of Investments.
Consolidated Subsidiary. The Fund invests in certain investments through a wholly-owned subsidiary ("Subsidiary"), which may be subject to federal and state taxes upon disposition.
As of period end, the Fund held an investment of $21,218 in these Subsidiaries, representing .10% of the Fund's net assets. The financial statements have been consolidated and include accounts of the Fund and each Subsidiary. Accordingly, all inter-company transactions and balances have been eliminated.
4. Purchases and Sales of Investments.
Purchases and sales of securities, other than short-term securities and in-kind transactions, aggregated $7,931,522 and $6,927,301, respectively.
Redemptions In-Kind.
During the period, 6,067* shares of the Fund held by unaffiliated entities were redeemed in-kind for investments and cash with a value of $65,932. The net realized gain of $35,542 on investments delivered through in-kind redemptions is included in the accompanying Statement of Operations. The amount of the in-kind redemptions is included in share transactions in the accompanying Statement of Changes in Net Assets as well as the Notes to Financial Statements. The Fund recognized no gain or loss for federal income tax purposes.
* Share activity prior to May 11, 2018 has been adjusted to reflect the impact of the 10 for 1 share split occurred on that date.
Prior Fiscal Year Redemptions In-Kind.
During the prior period, 116,155* shares of the Fund held by unaffiliated entities were redeemed in-kind for investments and cash with a value of $1,105,548. The Fund had a net realized gain of $441,424 on investments delivered through the in-kind redemptions. The amount of the in-kind redemptions is included in share transactions in the accompanying Statement of Changes in Net Assets as well as the Notes to Financial Statements. The Fund recognized no gain or loss for federal income tax purposes.
* Share activity prior to May 11, 2018 has been adjusted to reflect the impact of the 10 for 1 share split occurred on that date.
5. Fees and Other Transactions with Affiliates.
Management Fee. Fidelity Management & Research Company (the investment adviser) and its affiliates provide the Fund with investment management related services for which the Fund pays a monthly management fee. The management fee is the sum of an individual fund fee rate that is based on an annual rate of .35% of the Fund's average net assets and an annualized group fee rate that averaged .24% during the period. The group fee rate is based upon the average net assets of all the mutual funds advised by the investment adviser, including any mutual funds previously advised by the investment adviser that are currently advised by Fidelity SelectCo, LLC, an affiliate of the investment adviser. The group fee rate decreases as assets under management increase and increases as assets under management decrease. In addition, the management fee is subject to a performance adjustment (up to a maximum of +/- .20% of the Fund's average net assets over a 36 month performance period. The upward or downward adjustment to the management fee is based on the relative investment performance of OTC as compared to its benchmark index, the Nasdaq Composite Index, over the same 36 month performance period. For the reporting period, the total annual management fee rate, including the performance adjustment, was .72% of the Fund's average net assets. The performance adjustment included in the management fee rate may be higher or lower than the maximum performance adjustment rate due to the difference between the average net assets for the reporting and performance periods.
Transfer Agent Fees. Fidelity Investments Institutional Operations Company, Inc., (FIIOC), an affiliate of the investment adviser, is the transfer, dividend disbursing and shareholder servicing agent for each class of the Fund. FIIOC receives account fees and asset-based fees that vary according to the account size and type of account of the shareholders of OTC, except for Class K. FIIOC receives an asset-based fee of Class K's average net assets. FIIOC pays for typesetting, printing and mailing of shareholder reports, except proxy statements.
For the period, transfer agent fees for each class were as follows:
| | Amount | % of Class-Level Average Net Assets |
| OTC | $19,702 | .15 |
| Class K | 2,240 | .05 |
| | $21,942 | |
Accounting and Security Lending Fees. Fidelity Service Company, Inc. (FSC), an affiliate of the investment adviser, maintains the Fund's accounting records. The accounting fee is based on the level of average net assets for each month. Under a separate contract, FSC administers the security lending program. The security lending fee is based on the number and duration of lending transactions. For the period, the fees were equivalent to an annual rate of .01%.
Brokerage Commissions. The Fund placed a portion of its portfolio transactions with brokerage firms which are affiliates of the investment adviser. Brokerage commissions are included in net realized gain (loss) and change in net unrealized appreciation (depreciation) in the Statement of Operations. The commissions paid to these affiliated firms were $173 for the period.
Interfund Lending Program. Pursuant to an Exemptive Order issued by the SEC, the Fund, along with other registered investment companies having management contracts with Fidelity Management & Research Company (FMR) or other affiliated entities of FMR, may participate in an interfund lending program. This program provides an alternative credit facility allowing the funds to borrow from, or lend money to, other participating affiliated funds. At period end, there were no interfund loans outstanding. The Fund's activity in this program during the period for which loans were outstanding was as follows:
| Borrower or Lender | Average Loan Balance | Weighted Average Interest Rate | Interest Expense |
| Borrower | $16,776 | 1.66% | $20 |
Interfund Trades. The Fund may purchase from or sell securities to other Fidelity Funds under procedures adopted by the Board. The procedures have been designed to ensure these interfund trades are executed in accordance with Rule 17a-7 of the 1940 Act. Interfund trades are included within the respective purchases and sales amounts shown in the Purchases and Sales of Investments note.
6. Committed Line of Credit.
The Fund participates with other funds managed by the investment adviser or an affiliate in a $4.25 billion credit facility (the "line of credit") to be utilized for temporary or emergency purposes to fund shareholder redemptions or for other short-term liquidity purposes. The Fund has agreed to pay commitment fees on its pro-rata portion of the line of credit, which amounted to $50 and is reflected in Miscellaneous expenses on the Statement of Operations. During the period, the Fund did not borrow on this line of credit.
7. Security Lending.
The Fund lends portfolio securities through a lending agent from time to time in order to earn additional income. For equity securities, a lending agent is used and may loan securities to certain qualified borrowers, including Fidelity Capital Markets (FCM), a broker-dealer affiliated with the Fund. On the settlement date of the loan, the Fund receives collateral (in the form of U.S. Treasury obligations, letters of credit and/or cash) against the loaned securities and maintains collateral in an amount not less than 100% of the market value of the loaned securities during the period of the loan. The market value of the loaned securities is determined at the close of business of the Fund and any additional required collateral is delivered to the Fund on the next business day. The Fund or borrower may terminate the loan at any time, and if the borrower defaults on its obligation to return the securities loaned because of insolvency or other reasons, the Fund may apply collateral received from the borrower against the obligation. The Fund may experience delays and costs in recovering the securities loaned. Any cash collateral received is invested in the Fidelity Securities Lending Cash Central Fund. The value of loaned securities and cash collateral at period end are disclosed on the Fund's Statement of Assets and Liabilities. The value of securities loaned to FCM at period end was $16,431. Security lending income represents the income earned on investing cash collateral, less rebates paid to borrowers and any lending agent fees associated with the loan, plus any premium payments received for lending certain types of securities. Security lending income is presented in the Statement of Operations as a component of income from Fidelity Central Funds and includes $492 from securities loaned to FCM.
8. Expense Reductions.
Commissions paid to certain brokers with whom the investment adviser, or its affiliates, places trades on behalf of the Fund include an amount in addition to trade execution, which may be rebated back to the Fund to offset certain expenses. This amount totaled $740 for the period. In addition, through arrangements with the Fund's custodian, credits realized as a result of certain uninvested cash balances were used to reduce the Fund's expenses. During the period, these credits reduced the Fund's custody expenses by $4.
In addition, during the period the investment adviser reimbursed and/or waived a portion of fund-level operating expenses in the amount of $176.
9. Distributions to Shareholders.
Distributions to shareholders of each class were as follows:
| | Year ended
July 31, 2018 | Year ended
July 31, 2017 |
| From net realized gain | | |
| OTC | $625,108 | $305,214 |
| Class K | 183,152 | 108,306 |
| Total | $808,260 | $413,520 |
10. Share Transactions.
Share transactions for each class were as follows and may contain automatic conversions between classes or exchanges between affiliated funds:
| | Shares | Shares | Dollars | Dollars |
| | Year ended July 31, 2018(a) | Year ended July 31, 2017(a) | Year ended July 31, 2018 | Year ended July 31, 2017 |
| OTC | | | | |
| Shares sold | 331,678 | 231,150 | $3,791,174 | $2,182,339 |
| Reinvestment of distributions | 57,393 | 35,400 | 601,211 | 294,662 |
| Shares redeemed | (470,239) | (272,940) | (5,259,220) | (2,508,373) |
| Net increase (decrease) | (81,168) | (6,390) | $(866,835) | $(31,372) |
| Class K | | | | |
| Shares sold | 342,672 | 93,950 | $3,868,013 | $878,574 |
| Reinvestment of distributions | 17,273 | 12,860 | 183,152 | 108,306 |
| Shares redeemed | (126,942)(b) | (171,420)(c) | (1,461,427)(b) | (1,569,523)(c) |
| Net increase (decrease) | 233,003 | (64,610) | $2,589,738 | $(582,643) |
(a) Share activity prior to May 11, 2018 has been adjusted to reflect the impact of the 10 for 1 share split that occurred on that date.
(b) Amount includes in-kind redemptions (see the Redemption In-Kind note for additional details).
(c) Amount includes in-kind redemptions (see the Prior Fiscal Year Redemption In-Kind note for additional details).
11. Other.
The Fund's organizational documents provide former and current trustees and officers with a limited indemnification against liabilities arising in connection with the performance of their duties to the Fund. In the normal course of business, the Fund may also enter into contracts that provide general indemnifications. The Fund's maximum exposure under these arrangements is unknown as this would be dependent on future claims that may be made against the Fund. The risk of material loss from such claims is considered remote.
Report of Independent Registered Public Accounting Firm
To the Trustees of Fidelity Securities Fund and Shareholders of Fidelity OTC Portfolio:
Opinion on the Financial Statements and Financial Highlights
We have audited the accompanying statement of assets and liabilities of Fidelity OTC Portfolio (the "Fund"), a fund of Fidelity Securities Fund, including the schedule of investments, as of July 31, 2018, and the related statement of operations for the year then ended, the statement of changes in net assets for each of the two years in the period then ended, the financial highlights for each of the five years in the period then ended, and the related notes. In our opinion, the financial statements and financial highlights present fairly, in all material respects, the financial position of the Fund as of July 31, 2018, and the results of its operations for the year then ended, the changes in its net assets for each of the two years in the period then ended, and the financial highlights for each of the five years in the period then ended, in conformity with accounting principles generally accepted in the United States of America.
Basis for Opinion
These financial statements and financial highlights are the responsibility of the Fund's management. Our responsibility is to express an opinion on the Fund's financial statements and financial highlights based on our audits. We are a public accounting firm registered with the Public Company Accounting Oversight Board (United States) (PCAOB) and are required to be independent with respect to the Fund in accordance with the U.S. federal securities laws and the applicable rules and regulations of the Securities and Exchange Commission and the PCAOB.
We conducted our audits in accordance with the standards of the PCAOB. Those standards require that we plan and perform the audit to obtain reasonable assurance about whether the financial statements and financial highlights are free of material misstatement, whether due to error or fraud. The Fund is not required to have, nor were we engaged to perform, an audit of its internal control over financial reporting. As part of our audits we are required to obtain an understanding of internal control over financial reporting but not for the purpose of expressing an opinion on the effectiveness of the Fund's internal control over financial reporting. Accordingly, we express no such opinion.
Our audits included performing procedures to assess the risks of material misstatement of the financial statements and financial highlights, whether due to error or fraud, and performing procedures that respond to those risks. Such procedures included examining, on a test basis, evidence regarding the amounts and disclosures in the financial statements and financial highlights. Our audits also included evaluating the accounting principles used and significant estimates made by management, as well as evaluating the overall presentation of the financial statements and financial highlights. Our procedures included confirmation of securities owned as of July 31, 2018, by correspondence with the custodians and brokers; when replies were not received from brokers, we performed other auditing procedures. We believe that our audits provide a reasonable basis for our opinion.
/s/ Deloitte & Touche LLP
Boston, Massachusetts
September 14, 2018
We have served as the auditor of one or more of the Fidelity investment companies since 1999.
Trustees and Officers
The Trustees, Members of the Advisory Board (if any), and officers of the trust and fund, as applicable, are listed below. The Board of Trustees governs the fund and is responsible for protecting the interests of shareholders. The Trustees are experienced executives who meet periodically throughout the year to oversee the fund's activities, review contractual arrangements with companies that provide services to the fund, oversee management of the risks associated with such activities and contractual arrangements, and review the fund's performance. Except for Jonathan Chiel, each of the Trustees oversees 286 funds. Mr. Chiel oversees 150 funds.
The Trustees hold office without limit in time except that (a) any Trustee may resign; (b) any Trustee may be removed by written instrument, signed by at least two-thirds of the number of Trustees prior to such removal; (c) any Trustee who requests to be retired or who has become incapacitated by illness or injury may be retired by written instrument signed by a majority of the other Trustees; and (d) any Trustee may be removed at any special meeting of shareholders by a two-thirds vote of the outstanding voting securities of the trust. Each Trustee who is not an interested person (as defined in the 1940 Act) of the trust and the fund is referred to herein as an Independent Trustee. Each Independent Trustee shall retire not later than the last day of the calendar year in which his or her 75th birthday occurs. The Independent Trustees may waive this mandatory retirement age policy with respect to individual Trustees. Officers and Advisory Board Members hold office without limit in time, except that any officer or Advisory Board Member may resign or may be removed by a vote of a majority of the Trustees at any regular meeting or any special meeting of the Trustees. Except as indicated, each individual has held the office shown or other offices in the same company for the past five years.
The fund’s Statement of Additional Information (SAI) includes more information about the Trustees. To request a free copy, call Fidelity at 1-800-544-8544.
Experience, Skills, Attributes, and Qualifications of the Trustees. The Governance and Nominating Committee has adopted a statement of policy that describes the experience, qualifications, attributes, and skills that are necessary and desirable for potential Independent Trustee candidates (Statement of Policy). The Board believes that each Trustee satisfied at the time he or she was initially elected or appointed a Trustee, and continues to satisfy, the standards contemplated by the Statement of Policy. The Governance and Nominating Committee also engages professional search firms to help identify potential Independent Trustee candidates who have the experience, qualifications, attributes, and skills consistent with the Statement of Policy. From time to time, additional criteria based on the composition and skills of the current Independent Trustees, as well as experience or skills that may be appropriate in light of future changes to board composition, business conditions, and regulatory or other developments, have also been considered by the professional search firms and the Governance and Nominating Committee. In addition, the Board takes into account the Trustees' commitment and participation in Board and committee meetings, as well as their leadership of standing and ad hoc committees throughout their tenure.
In determining that a particular Trustee was and continues to be qualified to serve as a Trustee, the Board has considered a variety of criteria, none of which, in isolation, was controlling. The Board believes that, collectively, the Trustees have balanced and diverse experience, qualifications, attributes, and skills, which allow the Board to operate effectively in governing the fund and protecting the interests of shareholders. Information about the specific experience, skills, attributes, and qualifications of each Trustee, which in each case led to the Board's conclusion that the Trustee should serve (or continue to serve) as a trustee of the fund, is provided below.
Board Structure and Oversight Function. James C. Curvey is an interested person and currently serves as Chairman. The Trustees have determined that an interested Chairman is appropriate and benefits shareholders because an interested Chairman has a personal and professional stake in the quality and continuity of services provided to the fund. Independent Trustees exercise their informed business judgment to appoint an individual of their choosing to serve as Chairman, regardless of whether the Trustee happens to be independent or a member of management. The Independent Trustees have determined that they can act independently and effectively without having an Independent Trustee serve as Chairman and that a key structural component for assuring that they are in a position to do so is for the Independent Trustees to constitute a substantial majority for the Board. The Independent Trustees also regularly meet in executive session. Ned C. Lautenbach serves as Chairman of the Independent Trustees and as such (i) acts as a liaison between the Independent Trustees and management with respect to matters important to the Independent Trustees and (ii) with management prepares agendas for Board meetings.
Fidelity® funds are overseen by different Boards of Trustees. The fund's Board oversees Fidelity's high income and certain equity funds, and other Boards oversee Fidelity's investment-grade bond, money market, asset allocation, and other equity funds. The asset allocation funds may invest in Fidelity® funds overseen by the fund's Board. The use of separate Boards, each with its own committee structure, allows the Trustees of each group of Fidelity® funds to focus on the unique issues of the funds they oversee, including common research, investment, and operational issues. On occasion, the separate Boards establish joint committees to address issues of overlapping consequences for the Fidelity® funds overseen by each Board.
The Trustees operate using a system of committees to facilitate the timely and efficient consideration of all matters of importance to the Trustees, the fund, and fund shareholders and to facilitate compliance with legal and regulatory requirements and oversight of the fund's activities and associated risks. The Board, acting through its committees, has charged FMR and its affiliates with (i) identifying events or circumstances the occurrence of which could have demonstrably adverse effects on the fund's business and/or reputation; (ii) implementing processes and controls to lessen the possibility that such events or circumstances occur or to mitigate the effects of such events or circumstances if they do occur; and (iii) creating and maintaining a system designed to evaluate continuously business and market conditions in order to facilitate the identification and implementation processes described in (i) and (ii) above. Because the day-to-day operations and activities of the fund are carried out by or through FMR, its affiliates, and other service providers, the fund's exposure to risks is mitigated but not eliminated by the processes overseen by the Trustees. While each of the Board's committees has responsibility for overseeing different aspects of the fund's activities, oversight is exercised primarily through the Operations, Audit, and Compliance Committees. In addition, the Independent Trustees have worked with Fidelity to enhance the Board's oversight of investment and financial risks, legal and regulatory risks, technology risks, and operational risks, including the development of additional risk reporting to the Board. Appropriate personnel, including but not limited to the fund's Chief Compliance Officer (CCO), FMR's internal auditor, the independent accountants, the fund's Treasurer and portfolio management personnel, make periodic reports to the Board's committees, as appropriate, including an annual review of Fidelity's risk management program for the Fidelity® funds. The responsibilities of each standing committee, including their oversight responsibilities, are described further under "Standing Committees of the Trustees."
Interested Trustees*:
Correspondence intended for a Trustee who is an interested person may be sent to Fidelity Investments, 245 Summer Street, Boston, Massachusetts 02210.
Name, Year of Birth; Principal Occupations and Other Relevant Experience+
Jonathan Chiel (1957)
Year of Election or Appointment: 2016
Trustee
Mr. Chiel also serves as Trustee of other Fidelity® funds. Mr. Chiel is Executive Vice President and General Counsel for FMR LLC (diversified financial services company, 2012-present). Previously, Mr. Chiel served as general counsel (2004-2012) and senior vice president and deputy general counsel (2000-2004) for John Hancock Financial Services; a partner with Choate, Hall & Stewart (1996-2000) (law firm); and an Assistant United States Attorney for the United States Attorney’s Office of the District of Massachusetts (1986-95), including Chief of the Criminal Division (1993-1995). Mr. Chiel is a director on the boards of the Boston Bar Foundation and the Maimonides School.
James C. Curvey (1935)
Year of Election or Appointment: 2007
Trustee
Chairman of the Board of Trustees
Mr. Curvey also serves as Trustee of other Fidelity® funds. Mr. Curvey is Vice Chairman (2007-present) and Director of FMR LLC (diversified financial services company). In addition, Mr. Curvey is an Overseer Emeritus for the Boston Symphony Orchestra, a Director of Artis-Naples, and a Trustee of Brewster Academy in Wolfeboro, New Hampshire. Previously, Mr. Curvey served as a Director of Fidelity Research & Analysis Co. (investment adviser firm, 2009-2018), Director of Fidelity Investments Money Management, Inc. (investment adviser firm, 2009-2014) and a Director of FMR and FMR Co., Inc. (investment adviser firms, 2007-2014).
Charles S. Morrison (1960)
Year of Election or Appointment: 2014
Trustee
Mr. Morrison also serves as Trustee of other funds. He serves as President of Fidelity SelectCo, LLC (investment adviser firm, 2017-present) and Fidelity Management & Research Company (FMR) (investment adviser firm, 2016-present), a Director of Fidelity Investments Money Management, Inc. (FIMM) (investment adviser firm, 2014-present), Director of Fidelity SelectCo, LLC (investment adviser firm, 2014-present), President, Asset Management (2014-present), and is an employee of Fidelity Investments. Previously, Mr. Morrison served as Vice President of Fidelity's Fixed Income and Asset Allocation Funds (2012-2014), President, Fixed Income (2011-2014), Vice President of Fidelity's Money Market Funds (2005-2009), President, Money Market Group Leader of FMR (investment adviser firm, 2009), and Senior Vice President, Money Market Group of FMR (2004-2009). Mr. Morrison also served as Vice President of Fidelity's Bond Funds (2002-2005), certain Balanced Funds (2002-2005), and certain Asset Allocation Funds (2002-2007), and as Senior Vice President (2002-2005) of Fidelity's Bond Division.
* Determined to be an “Interested Trustee” by virtue of, among other things, his or her affiliation with the trust or various entities under common control with FMR.
+ The information includes the Trustee's principal occupation during the last five years and other information relating to the experience, attributes, and skills relevant to the Trustee's qualifications to serve as a Trustee, which led to the conclusion that the Trustee should serve as a Trustee for the fund.
Independent Trustees:
Correspondence intended for an Independent Trustee may be sent to Fidelity Investments, P.O. Box 55235, Boston, Massachusetts 02205-5235.
Name, Year of Birth; Principal Occupations and Other Relevant Experience+
Dennis J. Dirks (1948)
Year of Election or Appointment: 2005
Trustee
Mr. Dirks also serves as Trustee of other Fidelity® funds. Prior to his retirement in May 2003, Mr. Dirks was Chief Operating Officer and a member of the Board of The Depository Trust & Clearing Corporation (DTCC). He also served as President, Chief Operating Officer, and Board member of The Depository Trust Company (DTC) and President and Board member of the National Securities Clearing Corporation (NSCC). In addition, Mr. Dirks served as Chief Executive Officer and Board member of the Government Securities Clearing Corporation, Chief Executive Officer and Board member of the Mortgage-Backed Securities Clearing Corporation, as a Trustee and a member of the Finance Committee of Manhattan College (2005-2008), as a Trustee and a member of the Finance Committee of AHRC of Nassau County (2006-2008), as a member of the Independent Directors Council (IDC) Governing Council (2010-2015), and as a member of the Board of Directors for The Brookville Center for Children’s Services, Inc. (2009-2017). Mr. Dirks is a member of the Finance Committee (2016-present), Board of Directors (2017-present) and Board of Trustees (2018-present) and is Treasurer (2018-present) of the Asolo Repertory Theatre.
Donald F. Donahue (1950)
Year of Election or Appointment: 2018
Trustee
Mr. Donahue also serves as a Trustee of other Fidelity® funds. Mr. Donahue is President and Chief Executive Officer of Miranda Partners, LLC (risk consulting for the financial services industry, 2012-present). Previously, Mr. Donahue served as a Member of the Advisory Board of certain Fidelity® funds (2015-2018) and Chief Executive Officer (2006-2012), Chief Operating Officer (2003-2006), and Managing Director, Customer Marketing and Development (1999-2003) of The Depository Trust & Clearing Corporation (financial markets infrastructure). Mr. Donahue serves as a Member (2007-present) and Co-Chairman (2016-present) of the Board of Directors of United Way of New York, Member of the Board of Directors of NYC Leadership Academy (2012-present) and Member of the Board of Advisors of Ripple Labs, Inc. (financial services, 2015-present). He also served as Chairman (2010-2012) and Member of the Board of Directors (2012-2013) of Omgeo, LLC (financial services), Treasurer of United Way of New York (2012-2016), and Member of the Board of Directors of XBRL US (financial services non-profit, 2009-2012) and the International Securities Services Association (2009-2012).
Alan J. Lacy (1953)
Year of Election or Appointment: 2008
Trustee
Mr. Lacy also serves as Trustee of other Fidelity® funds. Mr. Lacy serves as a Director of Bristol-Myers Squibb Company (global pharmaceuticals, 2008-present). He is a Trustee of the California Chapter of The Nature Conservancy (2015-present) and a Director of the Center for Advanced Study in the Behavioral Sciences at Stanford University (2015-present). In addition, Mr. Lacy served as Senior Adviser (2007-2014) of Oak Hill Capital Partners, L.P. (private equity) and also served as Chief Executive Officer (2005) and Vice Chairman (2005-2006) of Sears Holdings Corporation (retail) and Chief Executive Officer and Chairman of the Board of Sears, Roebuck and Co. (retail, 2000-2005). Previously, Mr. Lacy served as Chairman (2014-2017) and a member (2010-2017) of the Board of Directors of Dave & Buster’s Entertainment, Inc. (restaurant and entertainment complexes), as Chairman (2008-2011) and a member (2006-2015) of the Board of Trustees of the National Parks Conservation Association, and as a member of the Board of Directors for The Hillman Companies, Inc. (hardware wholesalers, 2010-2014), Earth Fare, Inc. (retail grocery, 2010-2014), and The Western Union Company (global money transfer, 2006-2011).
Ned C. Lautenbach (1944)
Year of Election or Appointment: 2000
Trustee
Chairman of the Independent Trustees
Mr. Lautenbach also serves as Trustee of other Fidelity® funds. Mr. Lautenbach currently serves as Vice Chair of the Board of Governors, State University System of Florida (2013-present) and is a member of the Council on Foreign Relations (1994-present). He is also a member and has most recently served as Chairman of the Board of Directors of Artis-Naples (2012-present). Previously, Mr. Lautenbach served as a member and then Lead Director of the Board of Directors of Eaton Corporation (diversified industrial, 1997-2016). He was also a Partner and Advisory Partner at Clayton, Dubilier & Rice, LLC (private equity investment, 1998-2010), as well as a Director of Sony Corporation (2006-2007). In addition, Mr. Lautenbach also had a 30-year career with IBM (technology company) during which time he served as Senior Vice President and a member of the Corporate Executive Committee (1968-1998).
Joseph Mauriello (1944)
Year of Election or Appointment: 2008
Trustee
Mr. Mauriello also serves as Trustee of other Fidelity® funds. Prior to his retirement in January 2006, Mr. Mauriello served in numerous senior management positions including Deputy Chairman and Chief Operating Officer (2004-2005), and Vice Chairman of Financial Services (2002-2004) of KPMG LLP US (professional services, 1965-2005). Mr. Mauriello currently serves as a member of the Board of Directors of XL Group plc. (global insurance and re-insurance, 2006-present) and the Independent Directors Council (IDC) Governing Council (2015-present). Previously, Mr. Mauriello served as a Director of the Hamilton Funds of the Bank of New York (2006-2007) and of Arcadia Resources Inc. (health care services and products, 2007-2012).
Cornelia M. Small (1944)
Year of Election or Appointment: 2005
Trustee
Ms. Small also serves as Trustee of other Fidelity® funds. Ms. Small is a member of the Board of Directors (2009-present) and Chair of the Investment Committee (2010-present) of the Teagle Foundation. Ms. Small also serves on the Investment Committee of the Berkshire Taconic Community Foundation (2008-present). Previously, Ms. Small served as Chairperson (2002-2008) and a member of the Investment Committee and Chairperson (2008-2012) and a member of the Board of Trustees of Smith College. In addition, Ms. Small served as Chief Investment Officer, Director of Global Equity Investments, and a member of the Board of Directors of Scudder, Stevens & Clark and Scudder Kemper Investments.
Garnett A. Smith (1947)
Year of Election or Appointment: 2018
Trustee
Mr. Smith also serves as Trustee of other Fidelity® funds. Prior to Mr. Smith's retirement, he served as Chairman and Chief Executive Officer of Inbrand Corp. (manufacturer of personal absorbent products, 1990-1997). He also served as President (1986-1990) of Inbrand Corp. Prior to his employment with Inbrand Corp., he was employed by a retail fabric chain and North Carolina National Bank. In addition, Mr. Smith served as a Member of the Advisory Board of certain Fidelity® funds (2012-2013) and as a board member of the Jackson Hole Land Trust (2009-2012).
David M. Thomas (1949)
Year of Election or Appointment: 2008
Trustee
Mr. Thomas also serves as Trustee of other Fidelity® funds. Mr. Thomas serves as Non-Executive Chairman of the Board of Directors of Fortune Brands Home and Security (home and security products, 2011-present), as a member of the Board of Directors (2004-present) and Presiding Director (2013-present) of Interpublic Group of Companies, Inc. (marketing communication), and as a member of the Board of Trustees of the University of Florida (2013-present). Previously, Mr. Thomas served as Executive Chairman (2005-2006) and Chairman and Chief Executive Officer (2000-2005) of IMS Health, Inc. (pharmaceutical and healthcare information solutions), and a Director of Fortune Brands, Inc. (consumer products, 2000-2011).
+ The information includes the Trustee's principal occupation during the last five years and other information relating to the experience, attributes, and skills relevant to the Trustee's qualifications to serve as a Trustee, which led to the conclusion that the Trustee should serve as a Trustee for the fund.
Advisory Board Members and Officers:
Correspondence intended for a Member of the Advisory Board (if any) may be sent to Fidelity Investments, P.O. Box 55235, Boston, Massachusetts 02205-5235. Correspondence intended for an officer or Peter S. Lynch may be sent to Fidelity Investments, 245 Summer Street, Boston, Massachusetts 02210. Officers appear below in alphabetical order.
Name, Year of Birth; Principal Occupation
Peter S. Lynch (1944)
Year of Election or Appointment: 2003
Member of the Advisory Board
Mr. Lynch also serves as Member of the Advisory Board of other Fidelity® funds. Mr. Lynch is Vice Chairman and a Director of FMR (investment adviser firm) and FMR Co., Inc. (investment adviser firm). In addition, Mr. Lynch serves as a Trustee of Boston College and as the Chairman of the Inner-City Scholarship Fund. Previously, Mr. Lynch served on the Special Olympics International Board of Directors (1997-2006).
William S. Stavropoulos (1939)
Year of Election or Appointment: 2018
Member of the Advisory Board
Mr. Stavropoulos also serves as Member of the Advisory Board of other Fidelity® funds. Mr. Stavropoulos serves as President and Founder of the Michigan Baseball Foundation, the Great Lakes Loons (2007-present). Mr. Stavropoulos is Chairman Emeritus of the Board of Directors of The Dow Chemical Company, where he previously served in numerous senior management positions, including President, CEO (1995-2000; 2002-2004), Chairman of the Executive Committee (2000-2006), and as a member of the Board of Directors (1990-2006). Currently, Mr. Stavropoulos is Chairman of the Board of Directors of Univar Inc. (global distributor of commodity and specialty chemicals), a Director of Teradata Corporation (data warehousing and technology solutions), and a member of the Advisory Board for Metalmark Capital LLC (private equity investment, 2005-present). Mr. Stavropoulos is an operating advisor to Clayton, Dubilier & Rice, LLC (private equity investment). In addition, Mr. Stavropoulos is a member of the University of Notre Dame Advisory Council for the College of Science, a Trustee of the Rollin L. Gerstacker Foundation, and a Director of Artis-Naples in Naples, Florida. Previously, Mr. Stavropoulos served as Trustee of certain Fidelity® funds (2001-2018) and as a Director of Chemical Financial Corporation (bank holding company, 1993-2012) and Tyco International, Ltd. (multinational manufacturing and services, 2007-2012).
Carol B. Tomé (1957)
Year of Election or Appointment: 2018
Member of the Advisory Board
Ms. Tomé also serves as Member of the Advisory Board of other Fidelity® funds. Ms. Tomé is Chief Financial Officer (2001-present) and Executive Vice President of Corporate Services (2007-present) of The Home Depot, Inc. (home improvement retailer) and a Director (2003-present) and Chair of the Audit Committee (2004-present) of United Parcel Service, Inc. (package delivery and supply chain management). Previously, Ms. Tomé served as Trustee of certain Fidelity® funds (2017), Senior Vice President of Finance and Accounting/Treasurer (2000-2007) and Vice President and Treasurer (1995-2000) of The Home Depot, Inc. and Chair of the Board (2010-2012), Vice Chair of the Board (2009 and 2013), and a Director (2008-2013) of the Federal Reserve Bank of Atlanta. Ms. Tomé is also a director or trustee of many community and professional organizations.
Michael E. Wiley (1950)
Year of Election or Appointment: 2018
Member of the Advisory Board
Mr. Wiley also serves as Trustee or Member of the Advisory Board of other Fidelity® funds. Mr. Wiley serves as a Director of Andeavor Corporation (independent oil refiner and marketer, 2005-present), a Director of Andeavor Logistics LP (natural resources logistics, 2015-present), and a Director of Bill Barrett Corporation (exploration and production, 2005-present). In addition, Mr. Wiley also serves as a Director of Post Oak Bank (privately-held bank, 2004-present). Previously, Mr. Wiley served as a Trustee of other Fidelity® funds (2008-2013), as a Director of Asia Pacific Exploration Consolidated (international oil and gas exploration and production, 2008-2013), as a member of the Board of Trustees of the University of Tulsa (2000-2006; 2007-2010), as a Senior Energy Advisor of Katzenbach Partners, LLC (consulting, 2006-2007), as an Advisory Director of Riverstone Holdings (private investment), Chairman, President, and CEO of Baker Hughes, Inc. (oilfield services, 2000-2004), and as Director of Spinnaker Exploration Company (exploration and production, 2001-2005).
Elizabeth Paige Baumann (1968)
Year of Election or Appointment: 2017
Anti-Money Laundering (AML) Officer
Ms. Baumann also serves as AML Officer of other funds. She is Chief AML Officer (2012-present) and Senior Vice President (2014-present) of FMR LLC (diversified financial services company) and is an employee of Fidelity Investments. Previously, Ms. Baumann served as AML Officer of the funds (2012-2016), and Vice President (2007-2014) and Deputy Anti-Money Laundering Officer (2007-2012) of FMR LLC.
Marc R. Bryant (1966)
Year of Election or Appointment: 2015
Secretary and Chief Legal Officer (CLO)
Mr. Bryant also serves as Secretary and CLO of other funds. Mr. Bryant serves as CLO, Secretary, and Senior Vice President of Fidelity Management & Research Company (investment adviser firm, 2015-present) and FMR Co., Inc. (investment adviser firm, 2015-present); Secretary of Fidelity SelectCo, LLC (investment adviser firm, 2015-present) and Fidelity Investments Money Management, Inc. (investment adviser firm, 2015-present); and CLO of Fidelity Management & Research (Hong Kong) Limited and FMR Investment Management (UK) Limited (investment adviser firms, 2015-present) and Fidelity Management & Research (Japan) Limited (investment adviser firm, 2016-present). He is Senior Vice President and Deputy General Counsel of FMR LLC (diversified financial services company). Previously, Mr. Bryant served as Secretary and CLO of Fidelity Rutland Square Trust II (2010-2014) and Assistant Secretary of Fidelity's Fixed Income and Asset Allocation Funds (2013-2015). Prior to joining Fidelity Investments, Mr. Bryant served as a Senior Vice President and the Head of Global Retail Legal for AllianceBernstein L.P. (2006-2010), and as the General Counsel for ProFund Advisors LLC (2001-2006).
John J. Burke III (1964)
Year of Election or Appointment: 2018
Chief Financial Officer
Mr. Burke also serves as Chief Financial Officer of other funds. Mr. Burke serves as Head of Investment Operations for Fidelity Fund and Investment Operations (2018-present) and is an employee of Fidelity Investments (1998-present). Previously Mr. Burke served as head of Asset Management Investment Operations (2012-2018).
William C. Coffey (1969)
Year of Election or Appointment: 2009
Assistant Secretary
Mr. Coffey also serves as Assistant Secretary of other funds. He is Senior Vice President and Deputy General Counsel of FMR LLC (diversified financial services company, 2010-present), and is an employee of Fidelity Investments. Previously, Mr. Coffey served as Vice President and Associate General Counsel of FMR LLC (2005-2009).
Timothy M. Cohen (1969)
Year of Election or Appointment: 2018
Vice President
Mr. Cohen also serves as Vice President of other funds. Mr. Cohen serves as Co-Head of Global Equity Research (2016-present), a Director of Fidelity Management & Research (Japan) Limited (investment adviser firm, 2016-present), and is an employee of Fidelity Investments. Previously, Mr. Cohen served as Chief Investment Officer - Equity and a Director of Fidelity Management & Research (U.K.) Inc. (investment adviser firm, 2013-2015) and as a Director of Fidelity Management & Research (Hong Kong) Limited (investment adviser firm, 2017).
Jonathan Davis (1968)
Year of Election or Appointment: 2010
Assistant Treasurer
Mr. Davis also serves as Assistant Treasurer of other funds. Mr. Davis serves as Assistant Treasurer of FMR Capital, Inc. (2017-present) and is an employee of Fidelity Investments. Previously, Mr. Davis served as Vice President and Associate General Counsel of FMR LLC (diversified financial services company, 2003-2010).
Adrien E. Deberghes (1967)
Year of Election or Appointment: 2016
Assistant Treasurer
Mr. Deberghes also serves as an officer of other funds. He serves as Assistant Treasurer of FMR Capital, Inc. (2017-present), Executive Vice President of Fidelity Investments Money Management, Inc. (FIMM) (investment adviser firm, 2016-present), and is an employee of Fidelity Investments (2008-present). Previously, Mr. Deberghes served as President and Treasurer of certain Fidelity® funds (2013-2018). Prior to joining Fidelity Investments, Mr. Deberghes was Senior Vice President of Mutual Fund Administration at State Street Corporation (2007-2008), Senior Director of Mutual Fund Administration at Investors Bank & Trust (2005-2007), and Director of Finance for Dunkin' Brands (2000-2005). Previously, Mr. Deberghes served in other fund officer roles.
Laura M. Del Prato (1964)
Year of Election or Appointment: 2018
Assistant Treasurer
Ms. Del Prato also serves as an officer of other funds. Ms. Del Prato is an employee of Fidelity Investments (2017-present). Prior to joining Fidelity Investments, Ms. Del Prato served as a Managing Director and Treasurer of the JPMorgan Mutual Funds (2014-2017). Prior to JPMorgan, Ms. Del Prato served as a partner at Cohen Fund Audit Services (accounting firm, 2012-2013) and KPMG LLP (accounting firm, 2004-2012).
Colm A. Hogan (1973)
Year of Election or Appointment: 2016
Deputy Treasurer
Mr. Hogan also serves as an officer of other funds. Mr. Hogan serves as Assistant Treasurer of FMR Capital, Inc. (2017-present) and is an employee of Fidelity Investments (2005-present). Previously, Mr. Hogan served as Assistant Treasurer of certain Fidelity® funds (2016-2018).
Pamela R. Holding (1964)
Year of Election or Appointment: 2018
Vice President
Ms. Holding also serves as a Vice President of other funds. Ms. Holding serves as Co-Head of Global Equity Research (2018-present) and is an employee of Fidelity Investments (2013-present).
Chris Maher (1972)
Year of Election or Appointment: 2013
Assistant Treasurer
Mr. Maher serves as Assistant Treasurer of other funds. Mr. Maher is Vice President of Valuation Oversight, serves as Assistant Treasurer of FMR Capital, Inc. (2017-present), and is an employee of Fidelity Investments. Previously, Mr. Maher served as Vice President of Asset Management Compliance (2013), Vice President of the Program Management Group of FMR (investment adviser firm, 2010-2013), and Vice President of Valuation Oversight (2008-2010).
Rieco E. Mello (1969)
Year of Election or Appointment: 2017
Assistant Treasurer
Mr. Mello also serves as Assistant Treasurer of other funds. Mr. Mello serves as Assistant Treasurer of FMR Capital, Inc. (2017-present) and is an employee of Fidelity Investments (1995-present).
Kenneth B. Robins (1969)
Year of Election or Appointment: 2016
Chief Compliance Officer
Mr. Robins also serves as an officer of other funds. Mr. Robins serves as Compliance Officer of Fidelity Management & Research Company and FMR Co., Inc. (investment adviser firms, 2016-present) and is an employee of Fidelity Investments (2004-present). Previously, Mr. Robins served as Executive Vice President of Fidelity Investments Money Management, Inc. (investment adviser firm, 2013-2016) and served in other fund officer roles.
Stacie M. Smith (1974)
Year of Election or Appointment: 2016
President and Treasurer
Ms. Smith also serves as an officer of other funds. Ms. Smith serves as Assistant Treasurer of FMR Capital, Inc. (2017-present), is an employee of Fidelity Investments (2009-present), and has served in other fund officer roles. Prior to joining Fidelity Investments, Ms. Smith served as Senior Audit Manager of Ernst & Young LLP (accounting firm, 1996-2009). Previously, Ms. Smith served as Assistant Treasurer (2013-2018) and Deputy Treasurer (2013-2016) of certain Fidelity® funds.
Marc L. Spector (1972)
Year of Election or Appointment: 2016
Assistant Treasurer
Mr. Spector also serves as an officer of other funds. Mr. Spector serves as Assistant Treasurer of FMR Capital, Inc. (2017-present) and is an employee of Fidelity Investments (2016-present). Prior to joining Fidelity Investments, Mr. Spector served as Director at the Siegfried Group (accounting firm, 2013-2016), and prior to Siegfried Group as audit senior manager at Deloitte & Touche (accounting firm, 2005-2013).
Renee Stagnone (1975)
Year of Election or Appointment: 2016
Assistant Treasurer
Ms. Stagnone also serves as an officer of other funds. Ms. Stagnone serves as Assistant Treasurer of FMR Capital, Inc. (2017-present) and is an employee of Fidelity Investments (1997-present). Previously, Ms. Stagnone served as Deputy Treasurer of certain Fidelity® funds (2013-2016).
Shareholder Expense Example
As a shareholder of the Fund, you incur two types of costs: (1) transaction costs and (2) ongoing costs, including management fees and other Fund expenses. This Example is intended to help you understand your ongoing costs (in dollars) of investing in the Fund and to compare these costs with the ongoing costs of investing in other mutual funds.
The Example is based on an investment of $1,000 invested at the beginning of the period and held for the entire period (February 1, 2018 to July 31, 2018).
Actual Expenses
The first line of the accompanying table for each class of the Fund provides information about actual account values and actual expenses. You may use the information in this line, together with the amount you invested, to estimate the expenses that you paid over the period. Simply divide your account value by $1,000.00 (for example, an $8,600 account value divided by $1,000.00 = 8.6), then multiply the result by the number in the first line for a class of the Fund under the heading entitled "Expenses Paid During Period" to estimate the expenses you paid on your account during this period. A small balance maintenance fee of $12.00 that is charged once a year may apply for certain accounts with a value of less than $2,000. This fee is not included in the table below. If it was, the estimate of expenses you paid during the period would be higher, and your ending account value lower, by this amount. In addition, the Fund, as a shareholder in the underlying Fidelity Central Funds, will indirectly bear its pro-rata share of the fees and expenses incurred by the underlying Fidelity Central Funds. These fees and expenses are not included in the Fund's annualized expense ratio used to calculate the expense estimate in the table below.
Hypothetical Example for Comparison Purposes
The second line of the accompanying table for each class of the Fund provides information about hypothetical account values and hypothetical expenses based on a Class' actual expense ratio and an assumed rate of return of 5% per year before expenses, which is not the Class' actual return. The hypothetical account values and expenses may not be used to estimate the actual ending account balance or expenses you paid for the period. You may use this information to compare the ongoing costs of investing in the Fund and other funds. To do so, compare this 5% hypothetical example with the 5% hypothetical examples that appear in the shareholder reports of the other funds. A small balance maintenance fee of $12.00 that is charged once a year may apply for certain accounts with a value of less than $2,000. This fee is not included in the table below. If it was, the estimate of expenses you paid during the period would be higher, and your ending account value lower, by this amount. In addition, the Fund, as a shareholder in the underlying Fidelity Central Funds, will indirectly bear its pro-rata share of the fees and expenses incurred by the underlying Fidelity Central Funds. These fees and expenses are not included in the Fund's annualized expense ratio used to calculate the expense estimate in the table below.
Please note that the expenses shown in the table are meant to highlight your ongoing costs only and do not reflect any transaction costs. Therefore, the second line of the table is useful in comparing ongoing costs only, and will not help you determine the relative total costs of owning different funds.
| | Annualized Expense Ratio-A | Beginning
Account Value
February 1, 2018 | Ending
Account Value
July 31, 2018 | Expenses Paid
During Period-B
February 1, 2018
to July 31, 2018 |
| OTC | .88% | | | |
| Actual | | $1,000.00 | $1,051.20 | $4.48 |
| Hypothetical-C | | $1,000.00 | $1,020.43 | $4.41 |
| Class K | .78% | | | |
| Actual | | $1,000.00 | $1,051.90 | $3.97 |
| Hypothetical-C | | $1,000.00 | $1,020.93 | $3.91 |
A Annualized expense ratio reflects expenses net of applicable fee waivers.
B Expenses are equal to each Class' annualized expense ratio, multiplied by the average account value over the period, multiplied by 181/365 (to reflect the one-half year period).
C 5% return per year before expenses
Distributions (Unaudited)
The Board of Trustees of Fidelity OTC Portfolio voted to pay to shareholders of record at the opening of business on record date, the following distributions per share derived from capital gains realized from sales of portfolio securities:
| | Pay Date | Record Date | Capital Gains |
| Fidelity OTC Portfolio | | | |
| OTC | 09/17/2018 | 09/14/2018 | $0.492 |
| Class K | 09/17/2018 | 09/14/2018 | $0.492 |
|
The fund hereby designates as a capital gain dividend with respect to the taxable year ended July 31, 2018, $940,650,299, or, if subsequently determined to be different, the net capital gain of such year.
OTC designates 39% and Class K designates 36% of the dividends distributed in September during the fiscal year as qualifying for the dividends-received deduction for corporate shareholders.
OTC designates 41% and Class K designates 38% of the dividends distributed in September during the fiscal year as amounts which may be taken into account as a dividend for the purposes of the maximum rate under section 1(h)(11) of the Internal Revenue Code.
The fund will notify shareholders in January 2019 of amounts for use in preparing 2018 income tax returns.
Board Approval of Investment Advisory Contracts
Fidelity OTC Portfolio
At its July 2018 meeting, the Board of Trustees, including the Independent Trustees (together, the Board), voted to continue the management contract with Fidelity Management & Research Company (FMR) and the sub-advisory agreements (together, the Advisory Contracts) for the fund for six months through January 31, 2019, in connection with the reunification of the Fidelity Equity High Income Funds Board, which oversees the fund, and the Sector Portfolios Board.
The Board considered that the approval of the fund's Advisory Contracts will not result in any changes in (i) the investment process or strategies employed in the management of the fund's assets; (ii) the fees and expenses paid by shareholders; (iii) the nature, extent or quality of services provided under the fund's Advisory Contracts; or (iv) the day-to-day management of the fund or the persons primarily responsible for such management. The Board concluded that the fund's Advisory Contracts are fair and reasonable, and that the fund's Advisory Contracts should be renewed, without modification, through January 31, 2019, with the understanding that the Board will consider the annual renewal for a full one year period in January 2019.
In connection with its consideration of future renewals of the fund's Advisory Contracts, the Board will consider: (i) the nature, extent and quality of services provided to the fund, including shareholder and administrative services and investment performance; (ii) the competitiveness of the management fee and total expenses for the fund; (iii) the costs of the services and profitability, including the revenues earned and the expenses incurred in conducting the business of developing, marketing, distributing, managing, administering, and servicing the fund and its shareholders, to the extent applicable, as well as potential fall-out benefits from Fidelity's non-fund businesses; and (iv) whether there have been economies of scale in respect of the Fidelity funds, whether the Fidelity funds (including the fund) have appropriately benefited from any such economies of scale, and whether there is the potential for realization of any further economies.
Based on its evaluation of all of the conclusions noted above, and after considering all factors it believed relevant, the Board ultimately concluded that the fund's management fee structure is fair and reasonable, and that the continuation of the fund's Advisory Contracts should be approved.

Corporate Headquarters
245 Summer St.
Boston, MA 02210
www.fidelity.com
OTC-ANN-0918
1.536191.121
Fidelity® OTC Portfolio Class K
Annual Report July 31, 2018 |
|
Contents
To view a fund's proxy voting guidelines and proxy voting record for the 12-month period ended June 30, visit http://www.fidelity.com/proxyvotingresults or visit the Securities and Exchange Commission's (SEC) web site at http://www.sec.gov.
You may also call 1-800-835-5092 to request a free copy of the proxy voting guidelines.
Standard & Poor's, S&P and S&P 500 are registered service marks of The McGraw-Hill Companies, Inc. and have been licensed for use by Fidelity Distributors Corporation.
Other third-party marks appearing herein are the property of their respective owners.
All other marks appearing herein are registered or unregistered trademarks or service marks of FMR LLC or an affiliated company. © 2018 FMR LLC. All rights reserved.
This report and the financial statements contained herein are submitted for the general information of the shareholders of the Fund. This report is not authorized for distribution to prospective investors in the Fund unless preceded or accompanied by an effective prospectus.
A fund files its complete schedule of portfolio holdings with the SEC for the first and third quarters of each fiscal year on Form N-Q. Forms N-Q are available on the SEC’s web site at http://www.sec.gov. A fund's Forms N-Q may be reviewed and copied at the SEC’s Public Reference Room in Washington, DC. Information regarding the operation of the SEC's Public Reference Room may be obtained by calling 1-800-SEC-0330.
For a complete list of a fund's portfolio holdings, view the most recent holdings listing, semiannual report, or annual report on Fidelity's web site at http://www.fidelity.com, http://www.institutional.fidelity.com, or http://www.401k.com, as applicable.
NOT FDIC INSURED •MAY LOSE VALUE •NO BANK GUARANTEE
Neither the Fund nor Fidelity Distributors Corporation is a bank.
Performance: The Bottom Line
Average annual total return reflects the change in the value of an investment, assuming reinvestment of distributions from dividend income and capital gains (the profits earned upon the sale of securities that have grown in value, if any) and assuming a constant rate of performance each year. The hypothetical investment and the average annual total returns do not reflect the deduction of taxes that a shareholder would pay on fund distributions or the redemption of fund shares. During periods of reimbursement by Fidelity, a fund’s total return will be greater than it would be had the reimbursement not occurred. How a fund did yesterday is no guarantee of how it will do tomorrow.
Average Annual Total Returns
| For the periods ended July 31, 2018 | Past 1 year | Past 5 years | Past 10 years |
| Class K | 24.48% | 18.89% | 15.58% |
The initial offering of Class K shares took place on May 9, 2008. Returns prior to May 9, 2008 are those of Fidelity® OTC Portfolio, the original class of the fund.
$10,000 Over 10 Years
Let's say hypothetically that $10,000 was invested in Fidelity® OTC Portfolio - Class K on July 31, 2008.
The chart shows how the value of your investment would have changed, and also shows how the Nasdaq Composite Index® performed over the same period.
See above for additional information regarding the performance of Class K.
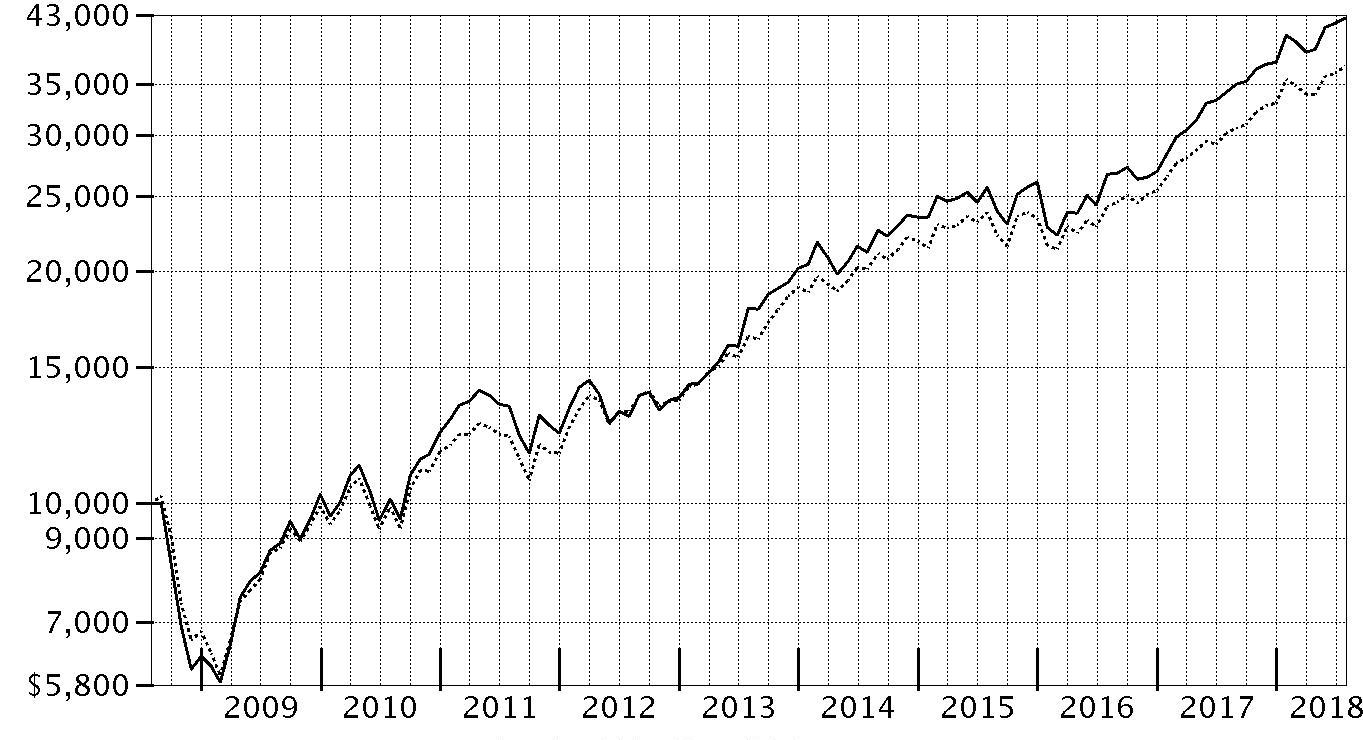
| Period Ending Values |
| $42,541 | Fidelity® OTC Portfolio - Class K |
| $36,912 | Nasdaq Composite Index® |
Management's Discussion of Fund Performance
Market Recap: The U.S. equity bellwether S&P 500
® index gained 16.24% for the 12 months ending July 31, 2018, despite a resurgence in volatility that challenged the multiyear bull market. Stocks maintained their steady growth until a sharp reversal in February, as volatility spiked amid fear that rising inflation and the potential for the economy to overheat would prompt the U.S. Federal Reserve to pick up the pace of interest rate hikes. The index posted its first negative monthly result since October 2016, and then lost further ground in March on fear of a global trade war. The market stabilized in April and turned upward through mid-June, when escalating trade tension between the U.S. and China soured investor sentiment. The resulting uncertainty lingered into July, but strong corporate earnings helped the S&P 500 rise 3.72% that month to cap the period. For the full one-year period, growth handily topped value, while small-caps bested large-caps. By sector, information technology (+28%) led the way, boosted by strong earnings growth from several major index constituents. Consumer discretionary rose roughly 24%, driven by retailers (+49%). Energy (+20%) gained alongside higher oil prices. Laggards were telecommunication services (-2%), consumer staples (0%) and utilities (+3%), defensive groups that struggled amid rising interest rates and a general preference for risk. Real estate (+5%) fared a bit better but still lagged, as did financials, industrials, health care (each up 13%) and materials (+11%).
Comments from Lead Portfolio Manager Sonu Kalra: For the fiscal year, the fund's share classes advanced about 24%, outpacing the 22.13% gain of the benchmark, the Nasdaq Composite Index
®. Versus the benchmark, choices in information technology, which made up more than half of the fund's assets for the 12 months, contributed the most. Picks in the consumer discretionary sector also helped versus the index. French videogame maker UbiSoft Entertainment, a non-index stock, added more value than any other position. The fund's shares of UbiSoft returned about 74% for the period. This firm reported strong quarterly financial results, driven by sales of popular titles, such as Far Cry
® 5 and Assassin's Creed
® Origins. An overweighting in Nutanix (+130%), a cloud-based storage provider, also contributed notably. Of note, we pared the fund’s positions in each of these holdings by period end to take profits. Conversely, choices in health care detracted. This included the fund’s stake in Tesaro (-72%). The biotechnology firm’s drug for ovarian cancer got off to a slow start, disappointing investors. The fund’s sizable position in Tesla (-8%) also hurt.
The views expressed above reflect those of the portfolio manager(s) only through the end of the period as stated on the cover of this report and do not necessarily represent the views of Fidelity or any other person in the Fidelity organization. Any such views are subject to change at any time based upon market or other conditions and Fidelity disclaims any responsibility to update such views. These views may not be relied on as investment advice and, because investment decisions for a Fidelity fund are based on numerous factors, may not be relied on as an indication of trading intent on behalf of any Fidelity fund.
Note to Shareholders: On September 16, 2017, Sonu Kalra and Chris Lin became the fund's Lead Portfolio Manager and Co-Manager, respectively, succeeding Gavin Baker.
Investment Summary (Unaudited)
Top Ten Stocks as of July 31, 2018
| | % of fund's net assets |
| Apple, Inc. | 8.7 |
| Amazon.com, Inc. | 7.6 |
| Alphabet, Inc. Class A | 7.2 |
| Microsoft Corp. | 4.9 |
| Facebook, Inc. Class A | 4.3 |
| Activision Blizzard, Inc. | 3.6 |
| NVIDIA Corp. | 3.2 |
| Alphabet, Inc. Class C | 2.7 |
| Ubisoft Entertainment SA | 2.2 |
| Tesla, Inc. | 2.1 |
| | 46.5 |
Top Five Market Sectors as of July 31, 2018
| | % of fund's net assets |
| Information Technology | 58.8 |
| Consumer Discretionary | 19.9 |
| Health Care | 9.7 |
| Financials | 4.7 |
| Consumer Staples | 3.1 |
Asset Allocation (% of fund's net assets)
| As of July 31, 2018* |
| | Stocks | 97.4% |
| | Convertible Securities | 2.6% |

* Foreign investments - 8.2%
Schedule of Investments July 31, 2018
Showing Percentage of Net Assets
| Common Stocks - 97.4% | | | |
| | | Shares | Value (000s) |
| CONSUMER DISCRETIONARY - 19.9% | | | |
| Auto Components - 0.0% | | | |
| Veoneer, Inc. (a) | | 43,800 | $2,291 |
| Automobiles - 2.1% | | | |
| Tesla, Inc. (a)(b) | | 1,441,421 | 429,745 |
| Diversified Consumer Services - 0.1% | | | |
| Adtalem Global Education, Inc. (a) | | 117,500 | 6,410 |
| Weight Watchers International, Inc. (a) | | 198,200 | 17,745 |
| | | | 24,155 |
| Hotels, Restaurants & Leisure - 2.5% | | | |
| Bluegreen Vacations Corp. | | 483,200 | 12,423 |
| Caesars Entertainment Corp. (a) | | 734,800 | 8,303 |
| Chipotle Mexican Grill, Inc. (a) | | 67,300 | 29,185 |
| Churchill Downs, Inc. | | 311,800 | 89,159 |
| Del Frisco's Restaurant Group, Inc. (a) | | 494,300 | 4,226 |
| Eldorado Resorts, Inc. (a) | | 44,900 | 1,924 |
| Hilton Grand Vacations, Inc. (a) | | 517,000 | 17,883 |
| Hilton Worldwide Holdings, Inc. | | 121,000 | 9,518 |
| International Game Technology PLC | | 245,700 | 6,211 |
| Marriott International, Inc. Class A | | 1,664,600 | 212,802 |
| Marriott Vacations Worldwide Corp. | | 27,400 | 3,264 |
| Planet Fitness, Inc. (a) | | 462,400 | 21,973 |
| Restaurant Brands International, Inc. | | 69,100 | 4,408 |
| Royal Caribbean Cruises Ltd. | | 142,200 | 16,034 |
| Texas Roadhouse, Inc. Class A | | 161,100 | 10,124 |
| U.S. Foods Holding Corp. (a) | | 1,111,300 | 37,573 |
| Vail Resorts, Inc. | | 9,362 | 2,592 |
| Wingstop, Inc. | | 508,520 | 25,095 |
| Wyndham Destinations, Inc. | | 46,000 | 2,122 |
| | | | 514,819 |
| Internet & Direct Marketing Retail - 10.9% | | | |
| Amazon.com, Inc. (a) | | 882,608 | 1,568,783 |
| Groupon, Inc. (a) | | 15,337,853 | 71,781 |
| JD.com, Inc. sponsored ADR (a) | | 757,350 | 27,159 |
| Netflix, Inc. (a) | | 836,460 | 282,263 |
| The Booking Holdings, Inc. (a) | | 96,060 | 194,879 |
| Wayfair LLC Class A (a)(b) | | 970,868 | 105,650 |
| | | | 2,250,515 |
| Media - 0.1% | | | |
| China Literature Ltd. (a)(c) | | 743,800 | 6,221 |
| The Walt Disney Co. | | 94,000 | 10,675 |
| Turn, Inc. (Escrow) (a)(d)(e) | | 1,199,041 | 797 |
| | | | 17,693 |
| Multiline Retail - 1.8% | | | |
| Avenue Supermarts Ltd. (a)(c) | | 101,832 | 2,462 |
| Dollar Tree, Inc. (a) | | 3,976,200 | 362,948 |
| | | | 365,410 |
| Specialty Retail - 1.2% | | | |
| Burlington Stores, Inc. (a) | | 164,900 | 25,198 |
| Five Below, Inc. (a) | | 306,300 | 29,760 |
| Lowe's Companies, Inc. | | 666,300 | 66,190 |
| Michaels Companies, Inc. (a) | | 112,100 | 2,288 |
| Ross Stores, Inc. | | 1,121,000 | 98,009 |
| Ulta Beauty, Inc. (a) | | 112,410 | 27,472 |
| Urban Outfitters, Inc. (a) | | 200,100 | 8,884 |
| | | | 257,801 |
| Textiles, Apparel & Luxury Goods - 1.2% | | | |
| Carbon Black, Inc. | | 30,800 | 639 |
| Columbia Sportswear Co. | | 77,800 | 6,767 |
| Crinetics Pharmaceuticals, Inc. (a) | | 95,500 | 2,350 |
| Despegar.com Corp. (b) | | 406,400 | 8,543 |
| G-III Apparel Group Ltd. (a) | | 194,900 | 8,907 |
| GreenSky, Inc. Class A | | 170,400 | 2,948 |
| Homology Medicines, Inc. (a)(b) | | 152,300 | 2,682 |
| Kering SA | | 111,200 | 59,294 |
| lululemon athletica, Inc. (a) | | 1,052,474 | 126,244 |
| LVMH Moet Hennessy - Louis Vuitton SA | | 5,927 | 2,065 |
| Pinduoduo, Inc. ADR | | 162,900 | 3,680 |
| Prada SpA | | 1,916,400 | 9,119 |
| PVH Corp. | | 78,700 | 12,082 |
| Rubius Therapeutics, Inc. (a) | | 100,500 | 2,111 |
| Scholar Rock Holding Corp. | | 100,500 | 1,632 |
| Under Armour, Inc. Class C (non-vtg.) (a) | | 146,700 | 2,749 |
| | | | 251,812 |
|
| TOTAL CONSUMER DISCRETIONARY | | | 4,114,241 |
|
| CONSUMER STAPLES - 2.9% | | | |
| Beverages - 0.8% | | | |
| Keurig Dr. Pepper, Inc. | | 318,900 | 7,657 |
| Monster Beverage Corp. (a) | | 975,540 | 58,552 |
| PepsiCo, Inc. | | 831,700 | 95,646 |
| | | | 161,855 |
| Food & Staples Retailing - 1.5% | | | |
| BJ's Wholesale Club Holdings, Inc. | | 892,000 | 22,113 |
| Costco Wholesale Corp. | | 1,145,683 | 250,572 |
| Performance Food Group Co. (a) | | 1,114,900 | 39,969 |
| | | | 312,654 |
| Food Products - 0.5% | | | |
| Darling International, Inc. (a) | | 425,700 | 8,552 |
| Mondelez International, Inc. | | 863,752 | 37,470 |
| The Kraft Heinz Co. | | 1,021,600 | 61,551 |
| | | | 107,573 |
| Personal Products - 0.1% | | | |
| Coty, Inc. Class A | | 1,139,100 | 15,275 |
|
| TOTAL CONSUMER STAPLES | | | 597,357 |
|
| ENERGY - 1.2% | | | |
| Oil, Gas & Consumable Fuels - 1.2% | | | |
| Anadarko Petroleum Corp. | | 40,900 | 2,992 |
| Andeavor | | 31,400 | 4,712 |
| BP PLC sponsored ADR | | 126,314 | 5,695 |
| Cenovus Energy, Inc. | | 189,900 | 1,905 |
| Centennial Resource Development, Inc. Class A (a) | | 1,030,700 | 18,511 |
| Delek U.S. Holdings, Inc. | | 76,600 | 4,084 |
| Diamondback Energy, Inc. | | 852,000 | 112,421 |
| EOG Resources, Inc. | | 15,700 | 2,024 |
| Extraction Oil & Gas, Inc. (a) | | 401,108 | 6,065 |
| Marathon Petroleum Corp. | | 24,500 | 1,980 |
| Reliance Industries Ltd. | | 1,937,273 | 33,561 |
| Valero Energy Corp. | | 49,500 | 5,858 |
| Whiting Petroleum Corp. (a) | | 821,700 | 40,797 |
| | | | 240,605 |
| FINANCIALS - 4.7% | | | |
| Banks - 1.7% | | | |
| Bank of America Corp. | | 644,700 | 19,908 |
| Bank of the Ozarks, Inc. | | 347,100 | 14,196 |
| BOK Financial Corp. | | 55,600 | 5,412 |
| Citigroup, Inc. | | 300,100 | 21,574 |
| Commerce Bancshares, Inc. | | 711,986 | 47,561 |
| Cullen/Frost Bankers, Inc. | | 81,400 | 8,994 |
| Fifth Third Bancorp | | 334,700 | 9,904 |
| Huntington Bancshares, Inc. | | 7,737,500 | 119,467 |
| Investors Bancorp, Inc. | | 2,669,000 | 33,416 |
| PacWest Bancorp | | 1,035,200 | 51,988 |
| UMB Financial Corp. | | 346,200 | 24,888 |
| | | | 357,308 |
| Capital Markets - 2.4% | | | |
| BlackRock, Inc. Class A | | 46,100 | 23,177 |
| Carlyle Group LP | | 630,500 | 15,353 |
| Cboe Global Markets, Inc. | | 40,800 | 3,963 |
| Charles Schwab Corp. | | 337,300 | 17,223 |
| CME Group, Inc. | | 155,600 | 24,759 |
| E*TRADE Financial Corp. (a) | | 906,520 | 54,219 |
| Monex Group, Inc. (b) | | 600,400 | 2,985 |
| Morgan Stanley | | 167,900 | 8,489 |
| Northern Trust Corp. | | 888,700 | 97,064 |
| T. Rowe Price Group, Inc. | | 16,600 | 1,977 |
| TD Ameritrade Holding Corp. | | 4,029,500 | 230,286 |
| Virtu Financial, Inc. Class A | | 389,200 | 7,842 |
| | | | 487,337 |
| Consumer Finance - 0.6% | | | |
| Capital One Financial Corp. | | 1,227,300 | 115,759 |
| Diversified Financial Services - 0.0% | | | |
| Allakos, Inc. (a) | | 59,700 | 2,434 |
| GDS Holdings Ltd. ADR (a) | | 67,900 | 1,482 |
| | | | 3,916 |
|
| TOTAL FINANCIALS | | | 964,320 |
|
| HEALTH CARE - 9.2% | | | |
| Biotechnology - 6.7% | | | |
| Acceleron Pharma, Inc. (a) | | 44,100 | 1,921 |
| Adamas Pharmaceuticals, Inc. (a)(b) | | 143,100 | 3,403 |
| Agios Pharmaceuticals, Inc. (a) | | 148,535 | 12,835 |
| Alexion Pharmaceuticals, Inc. (a) | | 1,094,089 | 145,470 |
| Alkermes PLC (a) | | 1,236,536 | 54,222 |
| Alnylam Pharmaceuticals, Inc. (a) | | 277,300 | 26,344 |
| Amgen, Inc. | | 1,173,434 | 230,638 |
| AnaptysBio, Inc. (a) | | 101,300 | 7,934 |
| Arena Pharmaceuticals, Inc. (a) | | 134,300 | 5,183 |
| Atara Biotherapeutics, Inc. (a) | | 40,700 | 1,528 |
| Audentes Therapeutics, Inc. (a) | | 49,600 | 1,867 |
| BeiGene Ltd. ADR (a) | | 52,900 | 10,033 |
| BioMarin Pharmaceutical, Inc. (a) | | 152,256 | 15,311 |
| bluebird bio, Inc. (a) | | 389,726 | 60,369 |
| Blueprint Medicines Corp. (a) | | 151,900 | 9,044 |
| Celgene Corp. (a) | | 171,000 | 15,405 |
| Cellectis SA sponsored ADR (a)(b) | | 402,400 | 11,629 |
| Chimerix, Inc. (a) | | 52,700 | 236 |
| Coherus BioSciences, Inc. (a) | | 1,199,902 | 22,858 |
| CytomX Therapeutics, Inc. (a) | | 485,000 | 12,775 |
| CytomX Therapeutics, Inc. (a)(c) | | 244,269 | 6,434 |
| DBV Technologies SA sponsored ADR (a) | | 1,065,500 | 19,211 |
| Deciphera Pharmaceuticals, Inc. (a) | | 50,800 | 1,748 |
| Denali Therapeutics, Inc. (a)(b) | | 829,800 | 10,447 |
| Dicerna Pharmaceuticals, Inc. (a) | | 307,207 | 3,871 |
| Editas Medicine, Inc. (a) | | 200,244 | 5,955 |
| Epizyme, Inc. (a) | | 127,000 | 1,638 |
| FibroGen, Inc. (a) | | 195,200 | 12,317 |
| Flexion Therapeutics, Inc. (a)(b) | | 124,500 | 2,971 |
| GenSight Biologics SA (a)(c) | | 243,848 | 613 |
| Heron Therapeutics, Inc. (a) | | 1,252,815 | 46,918 |
| ImmunoGen, Inc.(a) | | 373,100 | 3,470 |
| Intercept Pharmaceuticals, Inc. (a) | | 417,919 | 38,089 |
| Ionis Pharmaceuticals, Inc. (a) | | 428,902 | 18,734 |
| Iovance Biotherapeutics, Inc. (a) | | 360,400 | 5,118 |
| Ironwood Pharmaceuticals, Inc. Class A (a) | | 1,934,842 | 37,304 |
| Jounce Therapeutics, Inc. (a)(b) | | 561,463 | 3,964 |
| Macrogenics, Inc. (a) | | 162,600 | 3,358 |
| Madrigal Pharmaceuticals, Inc. (a) | | 6,500 | 1,671 |
| Neurocrine Biosciences, Inc. (a) | | 811,400 | 81,538 |
| Ovid Therapeutics, Inc. (a) | | 300,536 | 2,999 |
| Portola Pharmaceuticals, Inc. (a) | | 319,598 | 11,442 |
| Regeneron Pharmaceuticals, Inc. (a) | | 561,800 | 206,748 |
| Sage Therapeutics, Inc. (a) | | 233,275 | 33,666 |
| Sarepta Therapeutics, Inc. (a) | | 289,300 | 33,628 |
| Spark Therapeutics, Inc. (a) | | 334,290 | 25,647 |
| Spectrum Pharmaceuticals, Inc. (a) | | 371,400 | 7,907 |
| Surface Oncology, Inc. | | 133,100 | 1,472 |
| TESARO, Inc. (a)(b) | | 701,600 | 24,437 |
| Trevena, Inc. (a) | | 512,521 | 789 |
| Ultragenyx Pharmaceutical, Inc. (a) | | 112,096 | 8,868 |
| uniQure B.V. (a) | | 535,500 | 16,542 |
| Vertex Pharmaceuticals, Inc. (a) | | 145,900 | 25,540 |
| Xencor, Inc. (a) | | 744,287 | 27,702 |
| Zai Lab Ltd. ADR | | 130,900 | 2,869 |
| | | | 1,384,630 |
| Health Care Equipment & Supplies - 0.8% | | | |
| Align Technology, Inc. (a) | | 42,700 | 15,229 |
| AxoGen, Inc. (a) | | 86,000 | 3,864 |
| Boston Scientific Corp. (a) | | 812,400 | 27,305 |
| DexCom, Inc. (a) | | 122,300 | 11,634 |
| Inogen, Inc. (a) | | 32,500 | 6,476 |
| Insulet Corp. (a) | | 103,500 | 8,607 |
| Intuitive Surgical, Inc. (a) | | 146,746 | 74,575 |
| Quanterix Corp. (a) | | 229,300 | 3,437 |
| ViewRay, Inc. (a)(b) | | 431,200 | 5,140 |
| | | | 156,267 |
| Health Care Providers & Services - 0.3% | | | |
| G1 Therapeutics, Inc. (a) | | 322,672 | 16,569 |
| National Vision Holdings, Inc. | | 597,595 | 24,298 |
| Neuronetics, Inc. | | 44,300 | 1,105 |
| OptiNose, Inc. | | 472,328 | 9,612 |
| OptiNose, Inc. (c) | | 382,170 | 7,777 |
| R1 RCM, Inc. (a) | | 723,402 | 5,802 |
| UnitedHealth Group, Inc. | | 8,100 | 2,051 |
| | | | 67,214 |
| Health Care Technology - 0.5% | | | |
| athenahealth, Inc. (a) | | 615,283 | 92,729 |
| Castlight Health, Inc. Class B (a) | | 53,000 | 175 |
| Teladoc, Inc. (a) | | 197,200 | 11,802 |
| | | | 104,706 |
| Life Sciences Tools & Services - 0.0% | | | |
| Illumina, Inc. (a) | | 7,100 | 2,303 |
| Pharmaceuticals - 0.9% | | | |
| Akcea Therapeutics, Inc. | | 119,720 | 3,786 |
| Allergan PLC | | 26,500 | 4,878 |
| AstraZeneca PLC sponsored ADR | | 612,800 | 23,979 |
| Castle Creek Pharmaceuticals, LLC Class A-2 unit (a)(d)(e)(f)(g) | | 30,303 | 15,454 |
| Chiasma, Inc. (a) | | 779,500 | 1,091 |
| Collegium Pharmaceutical, Inc. (a)(b) | | 659,300 | 12,705 |
| Dova Pharmaceuticals, Inc. (a)(b) | | 313,700 | 6,767 |
| Intra-Cellular Therapies, Inc. (a) | | 127,636 | 2,562 |
| Jazz Pharmaceuticals PLC (a) | | 151,600 | 26,239 |
| MyoKardia, Inc. (a) | | 112,731 | 6,471 |
| Nektar Therapeutics (a) | | 859,200 | 45,194 |
| The Medicines Company (a) | | 237,700 | 9,444 |
| Theravance Biopharma, Inc. (a) | | 180,900 | 4,333 |
| Zogenix, Inc. (a) | | 284,300 | 16,134 |
| | | | 179,037 |
|
| TOTAL HEALTH CARE | | | 1,894,157 |
|
| INDUSTRIALS - 1.4% | | | |
| Aerospace & Defense - 0.2% | | | |
| Space Exploration Technologies Corp.: | | | |
| Class A (a)(d)(e) | | 203,488 | 34,389 |
| Class C (d)(e) | | 7,092 | 1,199 |
| United Technologies Corp. | | 31,500 | 4,276 |
| | | | 39,864 |
| Air Freight & Logistics - 0.0% | | | |
| Air Transport Services Group, Inc. (a) | | 46,124 | 1,039 |
| Expeditors International of Washington, Inc. | | 27,100 | 2,064 |
| | | | 3,103 |
| Airlines - 0.6% | | | |
| American Airlines Group, Inc. | | 1,272,432 | 50,312 |
| Spirit Airlines, Inc. (a) | | 677,700 | 29,439 |
| United Continental Holdings, Inc. (a) | | 537,300 | 43,199 |
| Wheels Up Partners Holdings LLC Series B (a)(d)(e)(f) | | 1,760,377 | 2,764 |
| | | | 125,714 |
| Commercial Services & Supplies - 0.1% | | | |
| Copart, Inc. (a) | | 89,600 | 5,142 |
| Evoqua Water Technologies Corp. (a) | | 268,400 | 5,728 |
| Tomra Systems ASA | | 194,000 | 4,010 |
| | | | 14,880 |
| Construction & Engineering - 0.0% | | | |
| Dycom Industries, Inc. (a) | | 21,300 | 1,899 |
| Machinery - 0.1% | | | |
| Deere & Co. | | 53,300 | 7,717 |
| PACCAR, Inc. | | 162,200 | 10,660 |
| | | | 18,377 |
| Professional Services - 0.0% | | | |
| CoStar Group, Inc. (a) | | 4,900 | 2,038 |
| Recruit Holdings Co. Ltd. | | 72,800 | 1,995 |
| | | | 4,033 |
| Road & Rail - 0.3% | | | |
| J.B. Hunt Transport Services, Inc. | | 328,191 | 39,350 |
| Knight-Swift Transportation Holdings, Inc. Class A | | 426,000 | 13,866 |
| Old Dominion Freight Lines, Inc. | | 92,100 | 13,520 |
| | | | 66,736 |
| Trading Companies & Distributors - 0.1% | | | |
| HD Supply Holdings, Inc. (a) | | 283,900 | 12,486 |
|
| TOTAL INDUSTRIALS | | | 287,092 |
|
| INFORMATION TECHNOLOGY - 57.2% | | | |
| Communications Equipment - 0.0% | | | |
| Arista Networks, Inc. (a) | | 20,800 | 5,319 |
| Cisco Systems, Inc. | | 83,900 | 3,548 |
| Lumentum Holdings, Inc. (a)(b) | | 39,200 | 2,048 |
| | | | 10,915 |
| Electronic Equipment & Components - 0.0% | | | |
| II-VI, Inc. (a) | | 47,100 | 1,846 |
| IPG Photonics Corp. (a) | | 25,000 | 4,101 |
| Jabil, Inc. | | 72,500 | 2,042 |
| | | | 7,989 |
| Internet Software & Services - 19.8% | | | |
| 2U, Inc. (a) | | 198,241 | 14,999 |
| Akamai Technologies, Inc. (a) | | 527,100 | 39,670 |
| Alibaba Group Holding Ltd. sponsored ADR (a) | | 95,600 | 17,899 |
| Alphabet, Inc.: | | | |
| Class A(a) | | 1,212,827 | 1,488,406 |
| Class C (a) | | 452,169 | 550,407 |
| ANGI Homeservices, Inc. Class A (a) | | 1,465,100 | 23,017 |
| Carbonite, Inc. (a) | | 112,300 | 3,852 |
| CarGurus, Inc. Class A (b) | | 1,818,249 | 78,821 |
| Delivery Hero AG (c) | | 45,500 | 2,585 |
| DocuSign, Inc. (b) | | 53,400 | 2,878 |
| Dropbox, Inc.: | | | |
| Class A (a)(b) | | 92,800 | 2,484 |
| Class B | | 221,016 | 5,621 |
| eBay, Inc. (a) | | 990,500 | 33,132 |
| Facebook, Inc. Class A (a) | | 5,135,614 | 886,304 |
| GMO Internet, Inc. | | 352,000 | 7,464 |
| GoDaddy, Inc. (a) | | 875,100 | 64,425 |
| GrubHub, Inc. (a) | | 29,400 | 3,584 |
| HUYA, Inc. ADR (b) | | 312,900 | 10,075 |
| IAC/InterActiveCorp (a) | | 250,745 | 36,922 |
| Instructure, Inc. (a) | | 190,579 | 7,375 |
| Match Group, Inc. (a)(b) | | 541,900 | 19,573 |
| MercadoLibre, Inc. | | 188,600 | 64,673 |
| Mercari, Inc. (a) | | 43,600 | 1,837 |
| Mimecast Ltd. (a) | | 50,900 | 1,828 |
| MINDBODY, Inc. (a) | | 881,900 | 32,939 |
| Momo, Inc. ADR (a) | | 402,600 | 16,515 |
| NetEase, Inc. ADR | | 175,440 | 45,264 |
| New Relic, Inc. (a) | | 682,083 | 66,640 |
| Nutanix, Inc.: | | | |
| Class A (a) | | 2,940,440 | 143,758 |
| Class B (a)(c) | | 311,503 | 15,229 |
| Shopify, Inc. Class A (a) | | 538,726 | 75,049 |
| Stamps.com, Inc. (a) | | 23,600 | 6,160 |
| Tencent Holdings Ltd. | | 1,503,800 | 68,445 |
| Tencent Holdings Ltd. sponsored ADR | | 935,500 | 42,752 |
| The Trade Desk, Inc. (a) | | 167,400 | 14,115 |
| Twilio, Inc. Class A (a) | | 264,558 | 15,315 |
| Twitter, Inc. (a) | | 61,500 | 1,960 |
| Wix.com Ltd. (a) | | 245,500 | 23,323 |
| Yahoo!, Inc. (a) | | 1,518,000 | 111,497 |
| YY, Inc. ADR (a) | | 117,300 | 10,936 |
| Zillow Group, Inc.: | | | |
| Class A (a) | | 1,300 | 73 |
| Class C (a) | | 351,800 | 19,595 |
| | | | 4,077,396 |
| IT Services - 2.3% | | | |
| Adyen BV (c) | | 32,075 | 20,494 |
| Alliance Data Systems Corp. | | 36,800 | 8,276 |
| AppNexus, Inc. warrants (a)(d)(e) | | 1 | 0 |
| FleetCor Technologies, Inc. (a) | | 18,500 | 4,015 |
| Global Payments, Inc. | | 138,200 | 15,557 |
| MasterCard, Inc. Class A | | 163,600 | 32,393 |
| Netcompany Group A/S | | 74,400 | 2,706 |
| PayPal Holdings, Inc. (a) | | 3,272,700 | 268,820 |
| Square, Inc. (a) | | 1,030,199 | 66,602 |
| Total System Services, Inc. | | 24,200 | 2,215 |
| Visa, Inc. Class A | | 252,500 | 34,527 |
| Worldpay, Inc. (a) | | 120,500 | 9,904 |
| | | | 465,509 |
| Semiconductors & Semiconductor Equipment - 9.0% | | | |
| Acacia Communications, Inc. (a) | | 384,200 | 12,348 |
| Advanced Micro Devices, Inc. (a) | | 1,535,100 | 28,138 |
| Analog Devices, Inc. | | 1,147,200 | 110,292 |
| ASML Holding NV | | 48,800 | 10,443 |
| Broadcom, Inc. | | 1,028,166 | 228,016 |
| Intel Corp. | | 1,604,600 | 77,181 |
| Marvell Technology Group Ltd. | | 6,968,936 | 148,508 |
| Micron Technology, Inc. (a) | | 3,247,544 | 171,438 |
| Monolithic Power Systems, Inc. | | 48,600 | 6,448 |
| NVIDIA Corp. | | 2,658,901 | 651,058 |
| NXP Semiconductors NV (a) | | 306,500 | 29,222 |
| Qorvo, Inc. (a) | | 261,800 | 21,405 |
| Qualcomm, Inc. | | 4,882,276 | 312,905 |
| Renesas Electronics Corp. (a) | | 1,366,600 | 12,173 |
| Taiwan Semiconductor Manufacturing Co. Ltd. sponsored ADR | | 297,900 | 12,276 |
| United Microelectronics Corp. sponsored ADR | | 3,297,983 | 9,234 |
| Xilinx, Inc. | | 109,000 | 7,856 |
| | | | 1,848,941 |
| Software - 17.4% | | | |
| Activision Blizzard, Inc. | | 10,202,309 | 749,054 |
| Adobe Systems, Inc. (a) | | 947,300 | 231,785 |
| Altair Engineering, Inc. Class A (a) | | 70,500 | 2,475 |
| Atlassian Corp. PLC (a) | | 1,271,585 | 92,075 |
| Atom Tickets LLC (a)(d)(e)(f) | | 516,103 | 3,000 |
| Autodesk, Inc. (a) | | 1,356,720 | 174,257 |
| Avalara, Inc. | | 27,368 | 1,049 |
| Ceridian HCM Holding, Inc. | | 62,200 | 2,038 |
| Citrix Systems, Inc. (a) | | 122,400 | 13,460 |
| Dataminr, Inc. Series E (e) | | 950,001 | 18,905 |
| Electronic Arts, Inc. (a) | | 183,300 | 23,600 |
| Ellie Mae, Inc. (a) | | 38,600 | 3,830 |
| HIVE Blockchain Technologies Ltd. (a)(b) | | 2,883,100 | 1,862 |
| HIVE Blockchain Technologies Ltd. warrants 11/14/19 (a) | | 2,163,600 | 166 |
| HubSpot, Inc. (a) | | 742,480 | 92,142 |
| Intuit, Inc. | | 604,900 | 123,545 |
| Microsoft Corp. | | 9,501,999 | 1,007,972 |
| Nintendo Co. Ltd. ADR | | 389,500 | 16,620 |
| Parametric Technology Corp. (a) | | 54,900 | 5,046 |
| Paycom Software, Inc. (a)(b) | | 274,632 | 29,180 |
| Paylocity Holding Corp. (a) | | 188,400 | 10,927 |
| Pegasystems, Inc. | | 31,900 | 1,774 |
| Pluralsight, Inc. | | 210,500 | 4,886 |
| Proofpoint, Inc. (a) | | 125,600 | 14,325 |
| Red Hat, Inc. (a) | | 252,700 | 35,689 |
| SailPoint Technologies Holding, Inc. (a) | | 224,700 | 5,413 |
| Salesforce.com, Inc. (a) | | 1,605,048 | 220,132 |
| SendGrid, Inc. (a) | | 313,200 | 7,996 |
| ServiceNow, Inc. (a) | | 13,700 | 2,411 |
| Smartsheet, Inc. | | 43,000 | 925 |
| Snap, Inc. Class A (a)(b) | | 1,077,300 | 13,466 |
| Splunk, Inc. (a) | | 76,200 | 7,323 |
| Take-Two Interactive Software, Inc. (a) | | 85,600 | 9,675 |
| Talend SA ADR (a) | | 82,000 | 4,850 |
| Tanium, Inc. Class B (a)(d)(e) | | 392,200 | 2,661 |
| Ubisoft Entertainment SA (a) | | 4,094,652 | 452,186 |
| Ultimate Software Group, Inc. (a) | | 23,500 | 6,507 |
| Workday, Inc. Class A (a) | | 165,700 | 20,550 |
| Zendesk, Inc. (a) | | 3,134,284 | 170,724 |
| Zynga, Inc. (a) | | 448,800 | 1,701 |
| | | | 3,586,182 |
| Technology Hardware, Storage & Peripherals - 8.7% | | | |
| Apple, Inc. | | 9,448,260 | 1,797,913 |
|
| TOTAL INFORMATION TECHNOLOGY | | | 11,794,845 |
|
| MATERIALS - 0.5% | | | |
| Chemicals - 0.5% | | | |
| CF Industries Holdings, Inc. | | 182,400 | 8,102 |
| FMC Corp. | | 52,180 | 4,690 |
| LG Chemical Ltd. | | 13,965 | 4,703 |
| LyondellBasell Industries NV Class A | | 794,800 | 88,056 |
| Nutrien Ltd. | | 37,400 | 2,031 |
| The Chemours Co. LLC | | 96,100 | 4,402 |
| | | | 111,984 |
| Construction Materials - 0.0% | | | |
| Loma Negra Compania Industrial Argentina SA ADR (a) | | 268,400 | 3,017 |
|
| TOTAL MATERIALS | | | 115,001 |
|
| REAL ESTATE - 0.3% | | | |
| Equity Real Estate Investment Trusts (REITs) - 0.3% | | | |
| Ant International Co. Ltd. (d)(e) | | 6,818,398 | 38,251 |
| Equinix, Inc. | | 44,300 | 19,460 |
| | | | 57,711 |
| Real Estate Management & Development - 0.0% | | | |
| WeWork Companies, Inc. Class A (a)(d)(e) | | 29,911 | 3,065 |
|
| TOTAL REAL ESTATE | | | 60,776 |
|
| TELECOMMUNICATION SERVICES - 0.1% | | | |
| Wireless Telecommunication Services - 0.1% | | | |
| Boingo Wireless, Inc. (a) | | 191,700 | 4,430 |
| T-Mobile U.S., Inc. (a) | | 200,890 | 12,053 |
| | | | 16,483 |
| TOTAL COMMON STOCKS | | | |
| (Cost $12,037,918) | | | 20,084,877 |
|
| Convertible Preferred Stocks - 2.6% | | | |
| CONSUMER DISCRETIONARY - 0.0% | | | |
| Diversified Consumer Services - 0.0% | | | |
| Handy Technologies, Inc. Series C (a)(d)(e) | | 415,643 | 2,436 |
| Internet & Direct Marketing Retail - 0.0% | | | |
| One Kings Lane, Inc. Series E (Escrow) (a)(d)(e) | | 648,635 | 259 |
| The Honest Co., Inc. Series D (a)(d)(e) | | 75,268 | 1,476 |
| | | | 1,735 |
|
| TOTAL CONSUMER DISCRETIONARY | | | 4,171 |
|
| CONSUMER STAPLES - 0.2% | | | |
| Food & Staples Retailing - 0.2% | | | |
| Roofoods Ltd. Series F (d)(e) | | 93,930 | 38,507 |
| FINANCIALS - 0.0% | | | |
| Insurance - 0.0% | | | |
| Clover Health Series D (a)(d)(e) | | 620,983 | 5,823 |
| HEALTH CARE - 0.5% | | | |
| Biotechnology - 0.3% | | | |
| 23andMe, Inc.: | | | |
| Series E (a)(d)(e) | | 1,817,170 | 31,528 |
| Series F (d)(e) | | 683,367 | 11,856 |
| Moderna Therapeutics, Inc.: | | | |
| Series B (a)(d)(e) | | 1,193,491 | 12,007 |
| Series C (a)(d)(e) | | 453,177 | 4,559 |
| | | | 59,950 |
| Health Care Providers & Services - 0.2% | | | |
| Mulberry Health, Inc. Series A8 (a)(d)(e) | | 4,342,250 | 30,981 |
|
| TOTAL HEALTH CARE | | | 90,931 |
|
| INDUSTRIALS - 0.1% | | | |
| Aerospace & Defense - 0.1% | | | |
| Space Exploration Technologies Corp.: | | | |
| Series G (a)(d)(e) | | 62,037 | 10,484 |
| Series H (d)(e) | | 65,670 | 11,098 |
| | | | 21,582 |
| Professional Services - 0.0% | | | |
| YourPeople, Inc. Series C (a)(d)(e) | | 335,546 | 1,735 |
|
| TOTAL INDUSTRIALS | | | 23,317 |
|
| INFORMATION TECHNOLOGY - 1.6% | | | |
| Internet Software & Services - 1.0% | | | |
| Jet.Com, Inc. Series B1 (Escrow) (a)(d)(e) | | 4,896,249 | 222 |
| Lyft, Inc.: | | | |
| Series H (d)(e) | | 595,228 | 28,186 |
| Series I (d)(e) | | 642,291 | 30,415 |
| Pinterest, Inc. Series G, 8.00% (a)(d)(e) | | 139,290 | 826 |
| Reddit, Inc.: | | | |
| Series B (d)(e) | | 1,337,584 | 45,411 |
| Series C (d)(e) | | 300,673 | 10,208 |
| Starry, Inc. Series B (a)(d)(e) | | 1,811,120 | 1,670 |
| Uber Technologies, Inc.: | | | |
| Series D, 8.00% (a)(d)(e) | | 2,234,768 | 89,391 |
| Series E, 8.00% (a)(d)(e) | | 148,620 | 5,945 |
| | | | 212,274 |
| IT Services - 0.2% | | | |
| AppNexus, Inc.: | | | |
| Series E (a)(d)(e) | | 1,416,796 | 28,478 |
| Series F (a)(d)(e) | | 90,913 | 2,364 |
| | | | 30,842 |
| Software - 0.4% | | | |
| Bracket Computing, Inc. Series C (a)(d)(e) | | 1,877,241 | 3,360 |
| Cloudflare, Inc. Series D, 8.00% (a)(d)(e) | | 395,787 | 3,946 |
| Dataminr, Inc. Series D (a)(d)(e) | | 2,219,446 | 44,167 |
| Delphix Corp. Series D (a)(d)(e) | | 427,177 | 3,110 |
| Jello Labs, Inc. Series C (a)(d)(e) | | 302,678 | 3,823 |
| Taboola.Com Ltd. Series E (a)(d)(e) | | 1,918,392 | 33,438 |
| | | | 91,844 |
|
| TOTAL INFORMATION TECHNOLOGY | | | 334,960 |
|
| REAL ESTATE - 0.2% | | | |
| Real Estate Management & Development - 0.2% | | | |
| WeWork Companies, Inc.: | | | |
| Series E (a)(d)(e) | | 269,198 | 27,587 |
| Series F (a)(d)(e) | | 14,513 | 1,487 |
| | | | 29,074 |
| TELECOMMUNICATION SERVICES - 0.0% | | | |
| Wireless Telecommunication Services - 0.0% | | | |
| Altiostar Networks, Inc. Series A1 (a)(d)(e) | | 2,113,909 | 2,706 |
| TOTAL CONVERTIBLE PREFERRED STOCKS | | | |
| (Cost $375,723) | | | 529,489 |
|
| Money Market Funds - 2.4% | | | |
| Fidelity Cash Central Fund, 1.96% (h) | | 16,085,085 | 16,088 |
| Fidelity Securities Lending Cash Central Fund 1.97% (h)(i) | | 484,788,035 | 484,837 |
| TOTAL MONEY MARKET FUNDS | | | |
| (Cost $500,925) | | | 500,925 |
| TOTAL INVESTMENT IN SECURITIES - 102.4% | | | |
| (Cost $12,914,566) | | | 21,115,291 |
| NET OTHER ASSETS (LIABILITIES) - (2.4)% | | | (486,893) |
| NET ASSETS - 100% | | | $20,628,398 |
Values shown as $0 in the Schedule of Investments may reflect amounts less than $500.
Legend
(a) Non-income producing
(b) Security or a portion of the security is on loan at period end.
(c) Security exempt from registration under Rule 144A of the Securities Act of 1933. These securities may be resold in transactions exempt from registration, normally to qualified institutional buyers. At the end of the period, the value of these securities amounted to $61,815,000 or 0.3% of net assets.
(d) Restricted securities - Investment in securities not registered under the Securities Act of 1933 (excluding 144A issues). At the end of the period, the value of restricted securities (excluding 144A issues) amounted to $631,069,000 or 3.1% of net assets.
(e) Level 3 security
(f) Investment is owned by a wholly-owned subsidiary (Subsidiary) that is treated as a corporation for U.S. tax purposes.
(g) Investment represents common shares and preferred shares.
(h) Affiliated fund that is generally available only to investment companies and other accounts managed by Fidelity Investments. The rate quoted is the annualized seven-day yield of the fund at period end. A complete unaudited listing of the fund's holdings as of its most recent quarter end is available upon request. In addition, each Fidelity Central Fund's financial statements, which are not covered by the Fund's Report of Independent Registered Public Accounting Firm, are available on the SEC's website or upon request.
(i) Investment made with cash collateral received from securities on loan.
Additional information on each restricted holding is as follows:
| Security | Acquisition Date | Acquisition Cost (000s) |
| 23andMe, Inc. Series E | 6/18/15 | $19,675 |
| 23andMe, Inc. Series F | 8/31/17 | $9,488 |
| Altiostar Networks, Inc. Series A1 | 1/10/17 | $9,724 |
| Ant International Co. Ltd. | 5/16/18 | $38,251 |
| AppNexus, Inc. Series E | 8/1/14 - 9/17/14 | $28,382 |
| AppNexus, Inc. Series F | 8/23/16 | $2,364 |
| AppNexus, Inc. warrants | 8/23/16 | $0 |
| Atom Tickets LLC | 8/15/17 | $3,000 |
| Bracket Computing, Inc. Series C | 9/9/15 | $14,766 |
| Castle Creek Pharmaceuticals, LLC Class A-2 unit | 9/29/16 | $10,000 |
| Cloudflare, Inc. Series D, 8.00% | 11/5/14 | $2,424 |
| Clover Health Series D | 6/7/17 | $5,823 |
| Dataminr, Inc. Series D | 2/18/15 - 3/6/15 | $28,298 |
| Delphix Corp. Series D | 7/10/15 | $3,845 |
| Handy Technologies, Inc. Series C | 10/14/15 | $2,436 |
| Jello Labs, Inc. Series C | 12/22/16 | $4,899 |
| Jet.Com, Inc. Series B1 (Escrow) | 9/9/16 | $0 |
| Lyft, Inc. Series H | 11/22/17 | $23,658 |
| Lyft, Inc. Series I | 6/27/18 | $30,415 |
| Moderna Therapeutics, Inc. Series B | 4/13/17 | $6,922 |
| Moderna Therapeutics, Inc. Series C | 4/13/17 | $2,633 |
| Mulberry Health, Inc. Series A8 | 1/20/16 | $29,331 |
| One Kings Lane, Inc. Series E (Escrow) | 1/29/14 | $429 |
| Pinterest, Inc. Series G, 8.00% | 2/27/15 | $1,000 |
| Reddit, Inc. Series B | 7/26/17 | $18,989 |
| Reddit, Inc. Series C | 7/24/17 | $4,743 |
| Roofoods Ltd. Series F | 9/12/17 | $33,211 |
| Space Exploration Technologies Corp. Class A | 10/16/15 - 9/11/17 | $21,156 |
| Space Exploration Technologies Corp. Class C | 9/11/17 | $957 |
| Space Exploration Technologies Corp. Series G | 1/20/15 | $4,805 |
| Space Exploration Technologies Corp. Series H | 8/4/17 | $8,865 |
| Starry, Inc. Series B | 12/1/16 | $980 |
| Taboola.Com Ltd. Series E | 12/22/14 | $20,000 |
| Tanium, Inc. Class B | 4/21/17 | $1,947 |
| The Honest Co., Inc. Series D | 8/3/15 | $3,444 |
| Turn, Inc. (Escrow) | 4/11/17 | $863 |
| Uber Technologies, Inc. Series D, 8.00% | 6/6/14 | $34,668 |
| Uber Technologies, Inc. Series E, 8.00% | 12/5/14 | $4,952 |
| WeWork Companies, Inc. Class A | 6/23/15 | $984 |
| WeWork Companies, Inc. Series E | 6/23/15 | $8,854 |
| WeWork Companies, Inc. Series F | 12/1/16 | $728 |
| Wheels Up Partners Holdings LLC Series B | 9/18/15 | $5,000 |
| YourPeople, Inc. Series C | 5/1/15 | $5,000 |
Affiliated Central Funds
Information regarding fiscal year to date income earned by the Fund from investments in Fidelity Central Funds is as follows:
| Fund | Income earned |
| | (Amounts in thousands) |
| Fidelity Cash Central Fund | $738 |
| Fidelity Securities Lending Cash Central Fund | 7,477 |
| Total | $8,215 |
Amounts in the income column in the above table include any capital gain distributions from underlying funds, which are presented in the corresponding line-item in the Statement of Operations if applicable.
Other Affiliated Issuers
An affiliated company is a company in which the Fund has ownership of at least 5% of the voting securities. Fiscal year to date transactions with companies which are or were affiliates are as follows:
| Affiliate (Amounts in thousands) | Value, beginning of period | Purchases | Sales Proceeds(a) | Dividend Income | Realized Gain (loss) | Change in Unrealized appreciation (depreciation) | Value, end of period |
| athenahealth, Inc. | $326,198 | $-- | $234,957 | $-- | $32,563 | $(31,075) | $-- |
| Criteo SA sponsored ADR | 266,048 | -- | 185,723 | -- | 3,728 | (84,053) | -- |
| Groupon, Inc. | 209,589 | -- | 196,964 | -- | (134,828) | 193,984 | -- |
| Ubisoft Entertainment SA | 677,873 | -- | 599,925 | -- | 519,851 | (145,613) | -- |
| Wingstop, Inc. | 49,616 | -- | 42,831 | 1,174 | 9,346 | 10,012 | -- |
| Total | $1,529,324 | $-- | $1,260,400 | $1,174 | $430,660 | $(56,745) | $-- |
(a) Includes the value of securities delivered through in-kind transactions, if applicable.
Investment Valuation
The following is a summary of the inputs used, as of July 31, 2018, involving the Fund's assets and liabilities carried at fair value. The inputs or methodology used for valuing securities may not be an indication of the risk associated with investing in those securities. For more information on valuation inputs, and their aggregation into the levels used below, please refer to the Investment Valuation section in the accompanying Notes to Financial Statements.
| | Valuation Inputs at Reporting Date: |
| Description | Total | Level 1 | Level 2 | Level 3 |
| (Amounts in thousands) | | | | |
| Investments in Securities: | | | | |
| Equities: | | | | |
| Consumer Discretionary | $4,118,412 | $4,111,379 | $2,065 | $4,968 |
| Consumer Staples | 635,864 | 597,357 | -- | 38,507 |
| Energy | 240,605 | 240,605 | -- | -- |
| Financials | 970,143 | 964,320 | -- | 5,823 |
| Health Care | 1,985,088 | 1,878,703 | -- | 106,385 |
| Industrials | 310,409 | 246,745 | 1,995 | 61,669 |
| Information Technology | 12,129,805 | 11,696,213 | 74,066 | 359,526 |
| Materials | 115,001 | 115,001 | -- | -- |
| Real Estate | 89,850 | 19,460 | -- | 70,390 |
| Telecommunication Services | 19,189 | 16,483 | -- | 2,706 |
| Money Market Funds | 500,925 | 500,925 | -- | -- |
| Total Investments in Securities: | $21,115,291 | $20,387,191 | $78,126 | $649,974 |
The following is a reconciliation of Investments in Securities for which Level 3 inputs were used in determining value:
| (Amounts in thousands) | |
| Investments in Securities: | |
| Equities - Information Technology | |
| Beginning Balance | $276,076 |
| Net Realized Gain (Loss) on Investment Securities | 1,696 |
| Net Unrealized Gain (Loss) on Investment Securities | 26,769 |
| Cost of Purchases | 71,458 |
| Proceeds of Sales | (16,473) |
| Amortization/Accretion | -- |
| Transfers into Level 3 | -- |
| Transfers out of Level 3 | -- |
| Ending Balance | $359,526 |
| The change in unrealized gain (loss) for the period attributable to Level 3 securities held at July 31, 2018 | $30,294 |
| Other Investments in Securities | |
| Beginning Balance | $210,038 |
| Net Realized Gain (Loss) on Investment Securities | -- |
| Net Unrealized Gain (Loss) on Investment Securities | 23,441 |
| Cost of Purchases | 97,811 |
| Proceeds of Sales | (40,842) |
| Amortization/Accretion | -- |
| Transfers into Level 3 | -- |
| Transfers out of Level 3 | -- |
| Ending Balance | $290,448 |
| The change in unrealized gain (loss) for the period attributable to Level 3 securities held at July 31, 2018 | $44,787 |
The information used in the above reconciliations represents fiscal year to date activity for any Investments in Securities identified as using Level 3 inputs at either the beginning or the end of the current fiscal period. Transfers in or out of Level 3 represent the beginning value of any Security or Instrument where a change in the pricing level occurred from the beginning to the end of the period. The cost of purchases and the proceeds of sales may include securities received or delivered through corporate actions or exchanges. Realized and unrealized gains (losses) disclosed in the reconciliations are included in Net Gain (Loss) on the Fund's Statement of Operations.
See accompanying notes which are an integral part of the financial statements.
Financial Statements
Statement of Assets and Liabilities
| Amounts in thousands (except per-share amounts) | | July 31, 2018 |
| Assets | | |
Investment in securities, at value (including securities loaned of $485,891) — See accompanying schedule:
Unaffiliated issuers (cost $12,413,641) | $20,614,366 | |
| Fidelity Central Funds (cost $500,925) | 500,925 | |
| Total Investment in Securities (cost $12,914,566) | | $21,115,291 |
| Cash | | 619 |
| Foreign currency held at value (cost $51) | | 51 |
| Receivable for investments sold | | 59,116 |
| Receivable for fund shares sold | | 18,589 |
| Dividends receivable | | 1,471 |
| Distributions receivable from Fidelity Central Funds | | 746 |
| Prepaid expenses | | 53 |
| Other receivables | | 907 |
| Total assets | | 21,196,843 |
| Liabilities | | |
| Payable for investments purchased | $45,740 | |
| Payable for fund shares redeemed | 21,282 | |
| Accrued management fee | 12,784 | |
| Other affiliated payables | 1,972 | |
| Other payables and accrued expenses | 1,832 | |
| Collateral on securities loaned | 484,835 | |
| Total liabilities | | 568,445 |
| Net Assets | | $20,628,398 |
| Net Assets consist of: | | |
| Paid in capital | | $11,676,525 |
| Accumulated net investment loss | | (19,053) |
| Accumulated undistributed net realized gain (loss) on investments and foreign currency transactions | | 771,238 |
| Net unrealized appreciation (depreciation) on investments and assets and liabilities in foreign currencies | | 8,199,688 |
| Net Assets | | $20,628,398 |
| OTC: | | |
| Net Asset Value, offering price and redemption price per share ($13,340,445 ÷ 1,067,232 shares) | | $12.50 |
| Class K: | | |
| Net Asset Value, offering price and redemption price per share ($7,287,953 ÷ 575,304 shares) | | $12.67 |
See accompanying notes which are an integral part of the financial statements.
Statement of Operations
| Amounts in thousands | | Year ended July 31, 2018 |
| Investment Income | | |
| Dividends (including $1,174 earned from other affiliated issuers) | | $121,380 |
| Interest | | 136 |
| Income from Fidelity Central Funds (including $7,477 from security lending) | | 8,215 |
| Total income | | 129,731 |
| Expenses | | |
| Management fee | | |
| Basic fee | $108,402 | |
| Performance adjustment | 23,144 | |
| Transfer agent fees | 21,942 | |
| Accounting and security lending fees | 1,807 | |
| Custodian fees and expenses | 368 | |
| Independent trustees' fees and expenses | 77 | |
| Registration fees | 404 | |
| Audit | 97 | |
| Legal | 44 | |
| Interest | 20 | |
| Miscellaneous | 120 | |
| Total expenses before reductions | 156,425 | |
| Expense reductions | (920) | |
| Total expenses after reductions | | 155,505 |
| Net investment income (loss) | | (25,774) |
| Realized and Unrealized Gain (Loss) | | |
| Net realized gain (loss) on: | | |
| Investment securities: | | |
| Unaffiliated issuers | 560,040 | |
| Fidelity Central Funds | 82 | |
| Other affiliated issuers | 430,660 | |
| Foreign currency transactions | (18) | |
| Total net realized gain (loss) | | 990,764 |
| Change in net unrealized appreciation (depreciation) on: | | |
| Investment securities: | | |
| Unaffiliated issuers (net of increase in deferred foreign taxes of $1,007) | 3,007,727 | |
| Fidelity Central Funds | (26) | |
| Other affiliated issuers | (56,745) | |
| Assets and liabilities in foreign currencies | 2 | |
| Total change in net unrealized appreciation (depreciation) | | 2,950,958 |
| Net gain (loss) | | 3,941,722 |
| Net increase (decrease) in net assets resulting from operations | | $3,915,948 |
See accompanying notes which are an integral part of the financial statements.
Statement of Changes in Net Assets
| Amounts in thousands | Year ended July 31, 2018 | Year ended July 31, 2017 |
| Increase (Decrease) in Net Assets | | |
| Operations | | |
| Net investment income (loss) | $(25,774) | $(18,864) |
| Net realized gain (loss) | 990,764 | 1,654,079 |
| Change in net unrealized appreciation (depreciation) | 2,950,958 | 1,836,371 |
| Net increase (decrease) in net assets resulting from operations | 3,915,948 | 3,471,586 |
| Distributions to shareholders from net realized gain | (808,260) | (413,520) |
| Total distributions | (808,260) | (413,520) |
| Share transactions - net increase (decrease) | 1,722,903 | (614,015) |
| Total increase (decrease) in net assets | 4,830,591 | 2,444,051 |
| Net Assets | | |
| Beginning of period | 15,797,807 | 13,353,756 |
| End of period | $20,628,398 | $15,797,807 |
| Other Information | | |
| Accumulated net investment loss end of period | $(19,053) | $(136) |
See accompanying notes which are an integral part of the financial statements.
Financial Highlights
Fidelity OTC Portfolio
| Years ended July 31, | 2018 | 2017 | 2016 | 2015 | 2014 |
| Selected Per–Share DataA | | | | | |
| Net asset value, beginning of period | $10.57 | $8.53 | $8.70 | $8.12 | $7.90 |
| Income from Investment Operations | | | | | |
| Net investment income (loss)B | (.02) | (.02) | (.01) | (.01) | (.01) |
| Net realized and unrealized gain (loss) | 2.48 | 2.33 | .29 | 1.62 | 1.28 |
| Total from investment operations | 2.46 | 2.31 | .28 | 1.61 | 1.27 |
| Distributions from net investment income | – | – | – | – | (.01) |
| Distributions from net realized gain | (.53) | (.27) | (.45) | (1.03) | (1.04) |
| Total distributions | (.53) | (.27) | (.45) | (1.03) | (1.05) |
| Net asset value, end of period | $12.50 | $10.57 | $8.53 | $8.70 | $8.12 |
| Total ReturnC | 24.34% | 27.97% | 3.68% | 21.34% | 17.96% |
| Ratios to Average Net AssetsD,E | | | | | |
| Expenses before reductions | .88% | .81% | .91% | .83% | .77% |
| Expenses net of fee waivers, if any | .88% | .81% | .91% | .83% | .77% |
| Expenses net of all reductions | .88% | .81% | .90% | .83% | .76% |
| Net investment income (loss) | (.17)% | (.16)% | (.07)% | (.13)% | (.08)% |
| Supplemental Data | | | | | |
| Net assets, end of period (in millions) | $13,340 | $12,136 | $9,845 | $9,710 | $7,870 |
| Portfolio turnover rateF | 38%G | 71%G | 56%G | 66%G | 106% |
A Per share amounts have been adjusted to reflect the impact of the 10 for 1 share split that occurred on May 11, 2018.
B Calculated based on average shares outstanding during the period.
C Total returns would have been lower if certain expenses had not been reduced during the applicable periods shown.
D Fees and expenses of any underlying Fidelity Central Funds are not included in the Fund's expense ratio. The Fund indirectly bears its proportionate share of the expenses of any underlying Fidelity Central Funds.
E Expense ratios reflect operating expenses of the class. Expenses before reductions do not reflect amounts reimbursed by the investment adviser or reductions from brokerage service arrangements or reductions from other expense offset arrangements and do not represent the amount paid by the class during periods when reimbursements or reductions occur. Expenses net of fee waivers reflect expenses after reimbursement by the investment adviser but prior to reductions from brokerage service arrangements or other expense offset arrangements. Expenses net of all reductions represent the net expenses paid by the class.
F Amount does not include the portfolio activity of any underlying Fidelity Central Funds.
G Portfolio turnover rate excludes securities received or delivered in-kind.
See accompanying notes which are an integral part of the financial statements.
Fidelity OTC Portfolio Class K
| Years ended July 31, | 2018 | 2017 | 2016 | 2015 | 2014 |
| Selected Per–Share DataA | | | | | |
| Net asset value, beginning of period | $10.70 | $8.62 | $8.79 | $8.20 | $7.96 |
| Income from Investment Operations | | | | | |
| Net investment income (loss)B | (.01) | (.01) | –C | –C | –C |
| Net realized and unrealized gain (loss) | 2.52 | 2.36 | .29 | 1.63 | 1.30 |
| Total from investment operations | 2.51 | 2.35 | .29 | 1.63 | 1.30 |
| Distributions from net investment income | – | – | – | – | (.01) |
| Distributions from net realized gain | (.54) | (.27) | (.46) | (1.04) | (1.05) |
| Total distributions | (.54) | (.27) | (.46) | (1.04) | (1.06) |
| Net asset value, end of period | $12.67 | $10.70 | $8.62 | $8.79 | $8.20 |
| Total ReturnD | 24.48% | 28.12% | 3.80% | 21.49% | 18.10% |
| Ratios to Average Net AssetsE,F | | | | | |
| Expenses before reductions | .78% | .70% | .79% | .72% | .65% |
| Expenses net of fee waivers, if any | .78% | .70% | .79% | .72% | .65% |
| Expenses net of all reductions | .77% | .70% | .79% | .71% | .64% |
| Net investment income (loss) | (.07)% | (.05)% | .05% | (.02)% | .05% |
| Supplemental Data | | | | | |
| Net assets, end of period (in millions) | $7,288 | $3,662 | $3,508 | $3,836 | $2,906 |
| Portfolio turnover rateG | 38%H | 71%H | 56%H | 66%H | 106% |
A Per share amounts have been adjusted to reflect the impact of the 10 for 1 share split that occurred on May 11, 2018.
B Calculated based on average shares outstanding during the period.
C Amount represents less than $.005 per share.
D Total returns would have been lower if certain expenses had not been reduced during the applicable periods shown.
E Fees and expenses of any underlying Fidelity Central Funds are not included in the Fund's expense ratio. The Fund indirectly bears its proportionate share of the expenses of any underlying Fidelity Central Funds.
F Expense ratios reflect operating expenses of the class. Expenses before reductions do not reflect amounts reimbursed by the investment adviser or reductions from brokerage service arrangements or reductions from other expense offset arrangements and do not represent the amount paid by the class during periods when reimbursements or reductions occur. Expenses net of fee waivers reflect expenses after reimbursement by the investment adviser but prior to reductions from brokerage service arrangements or other expense offset arrangements. Expenses net of all reductions represent the net expenses paid by the class.
G Amount does not include the portfolio activity of any underlying Fidelity Central Funds.
H Portfolio turnover rate excludes securities received or delivered in-kind.
See accompanying notes which are an integral part of the financial statements.
Notes to Financial Statements
For the period ended July 31, 2018
(Amounts in thousands except percentages)
1. Organization.
Fidelity OTC Portfolio (the Fund) is a non-diversified fund of Fidelity Securities Fund (the Trust) and is authorized to issue an unlimited number of shares. The Trust is registered under the Investment Company Act of 1940, as amended (the 1940 Act), as an open-end management investment company organized as a Massachusetts business trust. The Fund offers OTC and Class K shares, each of which has equal rights as to assets and voting privileges. Each class has exclusive voting rights with respect to matters that affect that class.
Effective May 11, 2018, each class underwent a 10 for 1 share split. The effect of the share split transaction was to multiply the number of outstanding share of each Class by a split factor of 10:1, with a corresponding decrease in net asset value (NAV) per share. This event does not impact the overall net assets of each class. The per share data presented in the Financial Highlights and Share Transactions presented in the Notes to Financial Statements have been retroactively adjusted to reflect this share split.
2. Investments in Fidelity Central Funds.
The Fund invests in Fidelity Central Funds, which are open-end investment companies generally available only to other investment companies and accounts managed by the investment adviser and its affiliates. The Fund's Schedule of Investments lists each of the Fidelity Central Funds held as of period end, if any, as an investment of the Fund, but does not include the underlying holdings of each Fidelity Central Fund. As an Investing Fund, the Fund indirectly bears its proportionate share of the expenses of the underlying Fidelity Central Funds.
The Money Market Central Funds seek preservation of capital and current income and are managed by Fidelity Investments Money Management, Inc. (FIMM), an affiliate of the investment adviser. Annualized expenses of the Money Market Central Funds as of their most recent shareholder report date are less than .005%.
A complete unaudited list of holdings for each Fidelity Central Fund is available upon request or at the Securities and Exchange Commission (the SEC) website at www.sec.gov. In addition, the financial statements of the Fidelity Central Funds, which are not covered by the Fund's Report of Independent Registered Public Accounting Firm, are available on the SEC website or upon request.
3. Significant Accounting Policies.
The Fund is an investment company and applies the accounting and reporting guidance of the Financial Accounting Standards Board (FASB) Accounting Standards Codification Topic 946 Financial Services – Investments Companies. The financial statements have been prepared in conformity with accounting principles generally accepted in the United States of America (GAAP), which require management to make certain estimates and assumptions at the date of the financial statements. Actual results could differ from those estimates. Subsequent events, if any, through the date that the financial statements were issued have been evaluated in the preparation of the financial statements. The following summarizes the significant accounting policies of the Fund:
Investment Valuation. Investments are valued as of 4:00 p.m. Eastern time on the last calendar day of the period. The Board of Trustees (the Board) has delegated the day to day responsibility for the valuation of the Fund's investments to the Fair Value Committee (the Committee) established by the Fund's investment adviser. In accordance with valuation policies and procedures approved by the Board, the Fund attempts to obtain prices from one or more third party pricing vendors or brokers to value its investments. When current market prices, quotations or currency exchange rates are not readily available or reliable, investments will be fair valued in good faith by the Committee, in accordance with procedures adopted by the Board. Factors used in determining fair value vary by investment type and may include market or investment specific events. The frequency with which these procedures are used cannot be predicted and they may be utilized to a significant extent. The Committee oversees the Fund's valuation policies and procedures and reports to the Board on the Committee's activities and fair value determinations. The Board monitors the appropriateness of the procedures used in valuing the Fund's investments and ratifies the fair value determinations of the Committee.
The Fund categorizes the inputs to valuation techniques used to value its investments into a disclosure hierarchy consisting of three levels as shown below:
- Level 1 – quoted prices in active markets for identical investments
- Level 2 – other significant observable inputs (including quoted prices for similar investments, interest rates, prepayment speeds, etc.)
- Level 3 – unobservable inputs (including the Fund's own assumptions based on the best information available)
Valuation techniques used to value the Fund's investments by major category are as follows:
Equity securities, including restricted securities, for which market quotations are readily available, are valued at the last reported sale price or official closing price as reported by a third party pricing vendor on the primary market or exchange on which they are traded and are categorized as Level 1 in the hierarchy. In the event there were no sales during the day or closing prices are not available, securities are valued at the last quoted bid price or may be valued using the last available price and are generally categorized as Level 2 in the hierarchy. For foreign equity securities, when market or security specific events arise, comparisons to the valuation of American Depositary Receipts (ADRs), futures contracts, Exchange-Traded Funds (ETFs) and certain indexes as well as quoted prices for similar securities may be used and would be categorized as Level 2 in the hierarchy. Utilizing these techniques may result in transfers between Level 1 and Level 2. For equity securities, including restricted securities, where observable inputs are limited, assumptions about market activity and risk are used and these securities may be categorized as Level 3 in the hierarchy. Equity securities, including restricted securities, for which observable inputs are not available are valued using alternate valuation approaches, including the market approach and the income approach and are categorized as Level 3 in the hierarchy. The market approach generally consists of using comparable market transactions while the income approach generally consists of using the net present value of estimated future cash flows, adjusted as appropriate for liquidity, credit, market and/or other risk factors.
Investments in open-end mutual funds, including the Fidelity Central Funds, are valued at their closing net asset value (NAV) each business day and are categorized as Level 1 in the hierarchy.
The following provides information on Level 3 securities held by the Fund that were valued at period end based on unobservable inputs. These amounts exclude valuations provided by a broker.
| Asset Type | Fair Value | Valuation Technique(s) | Unobservable Input | Amount or Range/Weighted Average | Impact to Valuation from an Increase in Input(a) |
| Equities | $649,974 | Market comparable | Enterprise value/Sales multiple (EV/S) | 1.5 - 12.2 / 7.0 | Increase |
| | | | Transaction price | $10.06 - $330.00 / $164.48 | Increase |
| | | | Discount rate | 6.0% - 76.0% / 51.7% | Decrease |
| | | | Conversion ratio | 3.0 | Increase |
| | | | Discount for lack of marketability | 10.0% - 25.0% / 15.2% | Decrease |
| | | | Premium rate | 7.5% - 76.0% / 72.4% | Increase |
| | | | Proxy premium | 54.5% | Increase |
| | | | Liquidity preference | $14.90 | Increase |
| | | Market approach | Transaction price | $0.81 - $169.00 / $44.50 | Increase |
| | | | Conversion ratio | 1.6 | Increase |
| | | Book value | Book value multiple | 1.0 | Increase |
| | | | Discount rate | 70.0% | Decrease |
| | | Discount cash flow | Discount rate | 9.0% | Decrease |
| | | | Discount for lack of marketability | 20.0% | Decrease |
| | | | Growth rate | 3.0% | Increase |
| | | Recovery value | Recovery value | 0.0% - 0.7% / 0.5% | Increase |
(a) Represents the expected directional change in the fair value of the Level 3 investments that would result from an increase in the corresponding input. A decrease to the unobservable input would have the opposite effect. Significant changes in these inputs could result in significantly higher or lower fair value measurements.
Changes in valuation techniques may result in transfers in or out of an assigned level within the disclosure hierarchy. The aggregate value of investments by input level as of July 31, 2018, as well as a roll forward of Level 3 investments, is included at the end of the Fund's Schedule of Investments.
Foreign Currency. The Fund may use foreign currency contracts to facilitate transactions in foreign-denominated securities. Gains and losses from these transactions may arise from changes in the value of the foreign currency or if the counterparties do not perform under the contracts' terms.
Foreign-denominated assets, including investment securities, and liabilities are translated into U.S. dollars at the exchange rates at period end. Purchases and sales of investment securities, income and dividends received and expenses denominated in foreign currencies are translated into U.S. dollars at the exchange rate in effect on the transaction date.
The effects of exchange rate fluctuations on investments are included with the net realized and unrealized gain (loss) on investment securities. Other foreign currency transactions resulting in realized and unrealized gain (loss) are disclosed separately.
Investment Transactions and Income. For financial reporting purposes, the Fund's investment holdings and NAV include trades executed through the end of the last business day of the period. The NAV per share for processing shareholder transactions is calculated as of the close of business of the New York Stock Exchange (NYSE), normally 4:00 p.m. Eastern time and includes trades executed through the end of the prior business day. Gains and losses on securities sold are determined on the basis of identified cost and include proceeds received from litigation. Dividend income is recorded on the ex-dividend date, except for certain dividends from foreign securities where the ex-dividend date may have passed, which are recorded as soon as the Fund is informed of the ex-dividend date. Non-cash dividends included in dividend income, if any, are recorded at the fair market value of the securities received. Income and capital gain distributions from Fidelity Central Funds, if any, are recorded on the ex-dividend date. Certain distributions received by the Fund represent a return of capital or capital gain. The Fund determines the components of these distributions subsequent to the ex-dividend date, based upon receipt of tax filings or other correspondence relating to the underlying investment. These distributions are recorded as a reduction of cost of investments and/or as a realized gain. Interest income is accrued as earned and includes coupon interest and amortization of premium and accretion of discount on debt securities as applicable. Investment income is recorded net of foreign taxes withheld where recovery of such taxes is uncertain.
Class Allocations and Expenses. Investment income, realized and unrealized capital gains and losses, common expenses of the Fund, and certain fund-level expense reductions, if any, are allocated daily on a pro-rata basis to each class based on the relative net assets of each class to the total net assets of the Fund. Each class differs with respect to transfer agent fees incurred. Certain expense reductions may also differ by class. For the reporting period, the allocated portion of income and expenses to each class as a percent of its average net assets may vary due to the timing of recording these transactions in relation to fluctuating net assets of the classes. Expenses directly attributable to a fund are charged to that fund. Expenses attributable to more than one fund are allocated among the respective funds on the basis of relative net assets or other appropriate methods. Expense estimates are accrued in the period to which they relate and adjustments are made when actual amounts are known.
Deferred Trustee Compensation. Under a Deferred Compensation Plan (the Plan), certain independent Trustees have elected to defer receipt of a portion of their annual compensation. Deferred amounts are invested in a cross-section of Fidelity funds, are marked-to-market and remain in the Fund until distributed in accordance with the Plan. The investment of deferred amounts and the offsetting payable to the Trustees of $592 are included in the accompanying Statement of Assets and Liabilities in other receivables and other payables and accrued expenses, respectively.
Income Tax Information and Distributions to Shareholders. Each year, the Fund intends to qualify as a regulated investment company under Subchapter M of the Internal Revenue Code, including distributing substantially all of its taxable income and realized gains. As a result, no provision for U.S. Federal income taxes is required. As of July 31, 2018, the Fund did not have any unrecognized tax benefits in the financial statements; nor is the Fund aware of any tax positions for which it is reasonably possible that the total amounts of unrecognized tax benefits will significantly change in the next twelve months. The Fund files a U.S. federal tax return, in addition to state and local tax returns as required. The Fund's federal income tax returns are subject to examination by the Internal Revenue Service (IRS) for a period of three fiscal years after they are filed. State and local tax returns may be subject to examination for an additional fiscal year depending on the jurisdiction. Foreign taxes are provided for based on the Fund's understanding of the tax rules and rates that exist in the foreign markets in which it invests. The Fund is subject to a tax imposed on capital gains by certain countries in which it invests. An estimated deferred tax liability for net unrealized appreciation on the applicable securities is included in Other payables and accrued expenses on the Statement of Assets & Liabilities.
Distributions are declared and recorded on the ex-dividend date. Income and capital gain distributions are declared separately for each class. Income and capital gain distributions are determined in accordance with income tax regulations, which may differ from GAAP. In addition, the Fund claimed a portion of the payment made to redeeming shareholders as a distribution for income tax purposes.
Capital accounts within the financial statements are adjusted for permanent book-tax differences. These adjustments have no impact on net assets or the results of operations. Capital accounts are not adjusted for temporary book-tax differences which will reverse in a subsequent period.
Book-tax differences are primarily due to foreign currency transactions, certain foreign taxes, passive foreign investment companies (PFIC), redemptions in kind, partnerships, deferred trustees compensation, net operating losses and losses deferred due to wash sales, and excise tax regulations.
As of period end, the cost and unrealized appreciation (depreciation) in securities, and derivatives if applicable, for federal income tax purposes were as follows:
| Gross unrealized appreciation | $8,726,352 |
| Gross unrealized depreciation | (565,033) |
| Net unrealized appreciation (depreciation) | $8,161,319 |
| Tax Cost | $12,953,972 |
The tax-based components of distributable earnings as of period end were as follows:
| Undistributed long-term capital gain | $810,643 |
| Net unrealized appreciation (depreciation) on securities and other investments | $8,161,290 |
The Fund intends to elect to defer to its next fiscal year $18,461 of ordinary losses recognized during the period January 1, 2018 to July, 31 2018.
The tax character of distributions paid was as follows:
| | July 31, 2018 | July 31, 2017 |
| Ordinary Income | $115,477 | $ 51,166 |
| Long-term Capital Gains | 692,783 | 362,354 |
| Total | $808,260 | $ 413,520 |
Restricted Securities. The Fund may invest in securities that are subject to legal or contractual restrictions on resale. These securities generally may be resold in transactions exempt from registration or to the public if the securities are registered. Disposal of these securities may involve time-consuming negotiations and expense, and prompt sale at an acceptable price may be difficult. Information regarding restricted securities is included at the end of the Fund's Schedule of Investments.
Consolidated Subsidiary. The Fund invests in certain investments through a wholly-owned subsidiary ("Subsidiary"), which may be subject to federal and state taxes upon disposition.
As of period end, the Fund held an investment of $21,218 in these Subsidiaries, representing .10% of the Fund's net assets. The financial statements have been consolidated and include accounts of the Fund and each Subsidiary. Accordingly, all inter-company transactions and balances have been eliminated.
4. Purchases and Sales of Investments.
Purchases and sales of securities, other than short-term securities and in-kind transactions, aggregated $7,931,522 and $6,927,301, respectively.
Redemptions In-Kind.
During the period, 6,067* shares of the Fund held by unaffiliated entities were redeemed in-kind for investments and cash with a value of $65,932. The net realized gain of $35,542 on investments delivered through in-kind redemptions is included in the accompanying Statement of Operations. The amount of the in-kind redemptions is included in share transactions in the accompanying Statement of Changes in Net Assets as well as the Notes to Financial Statements. The Fund recognized no gain or loss for federal income tax purposes.
* Share activity prior to May 11, 2018 has been adjusted to reflect the impact of the 10 for 1 share split occurred on that date.
Prior Fiscal Year Redemptions In-Kind.
During the prior period, 116,155* shares of the Fund held by unaffiliated entities were redeemed in-kind for investments and cash with a value of $1,105,548. The Fund had a net realized gain of $441,424 on investments delivered through the in-kind redemptions. The amount of the in-kind redemptions is included in share transactions in the accompanying Statement of Changes in Net Assets as well as the Notes to Financial Statements. The Fund recognized no gain or loss for federal income tax purposes.
* Share activity prior to May 11, 2018 has been adjusted to reflect the impact of the 10 for 1 share split occurred on that date.
5. Fees and Other Transactions with Affiliates.
Management Fee. Fidelity Management & Research Company (the investment adviser) and its affiliates provide the Fund with investment management related services for which the Fund pays a monthly management fee. The management fee is the sum of an individual fund fee rate that is based on an annual rate of .35% of the Fund's average net assets and an annualized group fee rate that averaged .24% during the period. The group fee rate is based upon the average net assets of all the mutual funds advised by the investment adviser, including any mutual funds previously advised by the investment adviser that are currently advised by Fidelity SelectCo, LLC, an affiliate of the investment adviser. The group fee rate decreases as assets under management increase and increases as assets under management decrease. In addition, the management fee is subject to a performance adjustment (up to a maximum of +/- .20% of the Fund's average net assets over a 36 month performance period. The upward or downward adjustment to the management fee is based on the relative investment performance of OTC as compared to its benchmark index, the Nasdaq Composite Index, over the same 36 month performance period. For the reporting period, the total annual management fee rate, including the performance adjustment, was .72% of the Fund's average net assets. The performance adjustment included in the management fee rate may be higher or lower than the maximum performance adjustment rate due to the difference between the average net assets for the reporting and performance periods.
Transfer Agent Fees. Fidelity Investments Institutional Operations Company, Inc., (FIIOC), an affiliate of the investment adviser, is the transfer, dividend disbursing and shareholder servicing agent for each class of the Fund. FIIOC receives account fees and asset-based fees that vary according to the account size and type of account of the shareholders of OTC, except for Class K. FIIOC receives an asset-based fee of Class K's average net assets. FIIOC pays for typesetting, printing and mailing of shareholder reports, except proxy statements.
For the period, transfer agent fees for each class were as follows:
| | Amount | % of Class-Level Average Net Assets |
| OTC | $19,702 | .15 |
| Class K | 2,240 | .05 |
| | $21,942 | |
Accounting and Security Lending Fees. Fidelity Service Company, Inc. (FSC), an affiliate of the investment adviser, maintains the Fund's accounting records. The accounting fee is based on the level of average net assets for each month. Under a separate contract, FSC administers the security lending program. The security lending fee is based on the number and duration of lending transactions. For the period, the fees were equivalent to an annual rate of .01%.
Brokerage Commissions. The Fund placed a portion of its portfolio transactions with brokerage firms which are affiliates of the investment adviser. Brokerage commissions are included in net realized gain (loss) and change in net unrealized appreciation (depreciation) in the Statement of Operations. The commissions paid to these affiliated firms were $173 for the period.
Interfund Lending Program. Pursuant to an Exemptive Order issued by the SEC, the Fund, along with other registered investment companies having management contracts with Fidelity Management & Research Company (FMR) or other affiliated entities of FMR, may participate in an interfund lending program. This program provides an alternative credit facility allowing the funds to borrow from, or lend money to, other participating affiliated funds. At period end, there were no interfund loans outstanding. The Fund's activity in this program during the period for which loans were outstanding was as follows:
| Borrower or Lender | Average Loan Balance | Weighted Average Interest Rate | Interest Expense |
| Borrower | $16,776 | 1.66% | $20 |
Interfund Trades. The Fund may purchase from or sell securities to other Fidelity Funds under procedures adopted by the Board. The procedures have been designed to ensure these interfund trades are executed in accordance with Rule 17a-7 of the 1940 Act. Interfund trades are included within the respective purchases and sales amounts shown in the Purchases and Sales of Investments note.
6. Committed Line of Credit.
The Fund participates with other funds managed by the investment adviser or an affiliate in a $4.25 billion credit facility (the "line of credit") to be utilized for temporary or emergency purposes to fund shareholder redemptions or for other short-term liquidity purposes. The Fund has agreed to pay commitment fees on its pro-rata portion of the line of credit, which amounted to $50 and is reflected in Miscellaneous expenses on the Statement of Operations. During the period, the Fund did not borrow on this line of credit.
7. Security Lending.
The Fund lends portfolio securities through a lending agent from time to time in order to earn additional income. For equity securities, a lending agent is used and may loan securities to certain qualified borrowers, including Fidelity Capital Markets (FCM), a broker-dealer affiliated with the Fund. On the settlement date of the loan, the Fund receives collateral (in the form of U.S. Treasury obligations, letters of credit and/or cash) against the loaned securities and maintains collateral in an amount not less than 100% of the market value of the loaned securities during the period of the loan. The market value of the loaned securities is determined at the close of business of the Fund and any additional required collateral is delivered to the Fund on the next business day. The Fund or borrower may terminate the loan at any time, and if the borrower defaults on its obligation to return the securities loaned because of insolvency or other reasons, the Fund may apply collateral received from the borrower against the obligation. The Fund may experience delays and costs in recovering the securities loaned. Any cash collateral received is invested in the Fidelity Securities Lending Cash Central Fund. The value of loaned securities and cash collateral at period end are disclosed on the Fund's Statement of Assets and Liabilities. The value of securities loaned to FCM at period end was $16,431. Security lending income represents the income earned on investing cash collateral, less rebates paid to borrowers and any lending agent fees associated with the loan, plus any premium payments received for lending certain types of securities. Security lending income is presented in the Statement of Operations as a component of income from Fidelity Central Funds and includes $492 from securities loaned to FCM.
8. Expense Reductions.
Commissions paid to certain brokers with whom the investment adviser, or its affiliates, places trades on behalf of the Fund include an amount in addition to trade execution, which may be rebated back to the Fund to offset certain expenses. This amount totaled $740 for the period. In addition, through arrangements with the Fund's custodian, credits realized as a result of certain uninvested cash balances were used to reduce the Fund's expenses. During the period, these credits reduced the Fund's custody expenses by $4.
In addition, during the period the investment adviser reimbursed and/or waived a portion of fund-level operating expenses in the amount of $176.
9. Distributions to Shareholders.
Distributions to shareholders of each class were as follows:
| | Year ended
July 31, 2018 | Year ended
July 31, 2017 |
| From net realized gain | | |
| OTC | $625,108 | $305,214 |
| Class K | 183,152 | 108,306 |
| Total | $808,260 | $413,520 |
10. Share Transactions.
Share transactions for each class were as follows and may contain automatic conversions between classes or exchanges between affiliated funds:
| | Shares | Shares | Dollars | Dollars |
| | Year ended July 31, 2018(a) | Year ended July 31, 2017(a) | Year ended July 31, 2018 | Year ended July 31, 2017 |
| OTC | | | | |
| Shares sold | 331,678 | 231,150 | $3,791,174 | $2,182,339 |
| Reinvestment of distributions | 57,393 | 35,400 | 601,211 | 294,662 |
| Shares redeemed | (470,239) | (272,940) | (5,259,220) | (2,508,373) |
| Net increase (decrease) | (81,168) | (6,390) | $(866,835) | $(31,372) |
| Class K | | | | |
| Shares sold | 342,672 | 93,950 | $3,868,013 | $878,574 |
| Reinvestment of distributions | 17,273 | 12,860 | 183,152 | 108,306 |
| Shares redeemed | (126,942)(b) | (171,420)(c) | (1,461,427)(b) | (1,569,523)(c) |
| Net increase (decrease) | 233,003 | (64,610) | $2,589,738 | $(582,643) |
(a) Share activity prior to May 11, 2018 has been adjusted to reflect the impact of the 10 for 1 share split that occurred on that date.
(b) Amount includes in-kind redemptions (see the Redemption In-Kind note for additional details).
(c) Amount includes in-kind redemptions (see the Prior Fiscal Year Redemption In-Kind note for additional details).
11. Other.
The Fund's organizational documents provide former and current trustees and officers with a limited indemnification against liabilities arising in connection with the performance of their duties to the Fund. In the normal course of business, the Fund may also enter into contracts that provide general indemnifications. The Fund's maximum exposure under these arrangements is unknown as this would be dependent on future claims that may be made against the Fund. The risk of material loss from such claims is considered remote.
Report of Independent Registered Public Accounting Firm
To the Trustees of Fidelity Securities Fund and Shareholders of Fidelity OTC Portfolio:
Opinion on the Financial Statements and Financial Highlights
We have audited the accompanying statement of assets and liabilities of Fidelity OTC Portfolio (the "Fund"), a fund of Fidelity Securities Fund, including the schedule of investments, as of July 31, 2018, and the related statement of operations for the year then ended, the statement of changes in net assets for each of the two years in the period then ended, the financial highlights for each of the five years in the period then ended, and the related notes. In our opinion, the financial statements and financial highlights present fairly, in all material respects, the financial position of the Fund as of July 31, 2018, and the results of its operations for the year then ended, the changes in its net assets for each of the two years in the period then ended, and the financial highlights for each of the five years in the period then ended, in conformity with accounting principles generally accepted in the United States of America.
Basis for Opinion
These financial statements and financial highlights are the responsibility of the Fund's management. Our responsibility is to express an opinion on the Fund's financial statements and financial highlights based on our audits. We are a public accounting firm registered with the Public Company Accounting Oversight Board (United States) (PCAOB) and are required to be independent with respect to the Fund in accordance with the U.S. federal securities laws and the applicable rules and regulations of the Securities and Exchange Commission and the PCAOB.
We conducted our audits in accordance with the standards of the PCAOB. Those standards require that we plan and perform the audit to obtain reasonable assurance about whether the financial statements and financial highlights are free of material misstatement, whether due to error or fraud. The Fund is not required to have, nor were we engaged to perform, an audit of its internal control over financial reporting. As part of our audits we are required to obtain an understanding of internal control over financial reporting but not for the purpose of expressing an opinion on the effectiveness of the Fund’s internal control over financial reporting. Accordingly, we express no such opinion.
Our audits included performing procedures to assess the risks of material misstatement of the financial statements and financial highlights, whether due to error or fraud, and performing procedures that respond to those risks. Such procedures included examining, on a test basis, evidence regarding the amounts and disclosures in the financial statements and financial highlights. Our audits also included evaluating the accounting principles used and significant estimates made by management, as well as evaluating the overall presentation of the financial statements and financial highlights. Our procedures included confirmation of securities owned as of July 31, 2018, by correspondence with the custodians and brokers; when replies were not received from brokers, we performed other auditing procedures. We believe that our audits provide a reasonable basis for our opinion.
/s/ Deloitte & Touche LLP
Boston, Massachusetts
September 14, 2018
We have served as the auditor of one or more of the Fidelity investment companies since 1999.
Trustees and Officers
The Trustees, Members of the Advisory Board (if any), and officers of the trust and fund, as applicable, are listed below. The Board of Trustees governs the fund and is responsible for protecting the interests of shareholders. The Trustees are experienced executives who meet periodically throughout the year to oversee the fund's activities, review contractual arrangements with companies that provide services to the fund, oversee management of the risks associated with such activities and contractual arrangements, and review the fund's performance. Except for Jonathan Chiel, each of the Trustees oversees 286 funds. Mr. Chiel oversees 150 funds.
The Trustees hold office without limit in time except that (a) any Trustee may resign; (b) any Trustee may be removed by written instrument, signed by at least two-thirds of the number of Trustees prior to such removal; (c) any Trustee who requests to be retired or who has become incapacitated by illness or injury may be retired by written instrument signed by a majority of the other Trustees; and (d) any Trustee may be removed at any special meeting of shareholders by a two-thirds vote of the outstanding voting securities of the trust. Each Trustee who is not an interested person (as defined in the 1940 Act) of the trust and the fund is referred to herein as an Independent Trustee. Each Independent Trustee shall retire not later than the last day of the calendar year in which his or her 75th birthday occurs. The Independent Trustees may waive this mandatory retirement age policy with respect to individual Trustees. Officers and Advisory Board Members hold office without limit in time, except that any officer or Advisory Board Member may resign or may be removed by a vote of a majority of the Trustees at any regular meeting or any special meeting of the Trustees. Except as indicated, each individual has held the office shown or other offices in the same company for the past five years.
The fund’s Statement of Additional Information (SAI) includes more information about the Trustees. To request a free copy, call Fidelity at 1-800-835-5092.
Experience, Skills, Attributes, and Qualifications of the Trustees. The Governance and Nominating Committee has adopted a statement of policy that describes the experience, qualifications, attributes, and skills that are necessary and desirable for potential Independent Trustee candidates (Statement of Policy). The Board believes that each Trustee satisfied at the time he or she was initially elected or appointed a Trustee, and continues to satisfy, the standards contemplated by the Statement of Policy. The Governance and Nominating Committee also engages professional search firms to help identify potential Independent Trustee candidates who have the experience, qualifications, attributes, and skills consistent with the Statement of Policy. From time to time, additional criteria based on the composition and skills of the current Independent Trustees, as well as experience or skills that may be appropriate in light of future changes to board composition, business conditions, and regulatory or other developments, have also been considered by the professional search firms and the Governance and Nominating Committee. In addition, the Board takes into account the Trustees' commitment and participation in Board and committee meetings, as well as their leadership of standing and ad hoc committees throughout their tenure.
In determining that a particular Trustee was and continues to be qualified to serve as a Trustee, the Board has considered a variety of criteria, none of which, in isolation, was controlling. The Board believes that, collectively, the Trustees have balanced and diverse experience, qualifications, attributes, and skills, which allow the Board to operate effectively in governing the fund and protecting the interests of shareholders. Information about the specific experience, skills, attributes, and qualifications of each Trustee, which in each case led to the Board's conclusion that the Trustee should serve (or continue to serve) as a trustee of the fund, is provided below.
Board Structure and Oversight Function. James C. Curvey is an interested person and currently serves as Chairman. The Trustees have determined that an interested Chairman is appropriate and benefits shareholders because an interested Chairman has a personal and professional stake in the quality and continuity of services provided to the fund. Independent Trustees exercise their informed business judgment to appoint an individual of their choosing to serve as Chairman, regardless of whether the Trustee happens to be independent or a member of management. The Independent Trustees have determined that they can act independently and effectively without having an Independent Trustee serve as Chairman and that a key structural component for assuring that they are in a position to do so is for the Independent Trustees to constitute a substantial majority for the Board. The Independent Trustees also regularly meet in executive session. Ned C. Lautenbach serves as Chairman of the Independent Trustees and as such (i) acts as a liaison between the Independent Trustees and management with respect to matters important to the Independent Trustees and (ii) with management prepares agendas for Board meetings.
Fidelity® funds are overseen by different Boards of Trustees. The fund's Board oversees Fidelity's high income and certain equity funds, and other Boards oversee Fidelity's investment-grade bond, money market, asset allocation, and other equity funds. The asset allocation funds may invest in Fidelity® funds overseen by the fund's Board. The use of separate Boards, each with its own committee structure, allows the Trustees of each group of Fidelity® funds to focus on the unique issues of the funds they oversee, including common research, investment, and operational issues. On occasion, the separate Boards establish joint committees to address issues of overlapping consequences for the Fidelity® funds overseen by each Board.
The Trustees operate using a system of committees to facilitate the timely and efficient consideration of all matters of importance to the Trustees, the fund, and fund shareholders and to facilitate compliance with legal and regulatory requirements and oversight of the fund's activities and associated risks. The Board, acting through its committees, has charged FMR and its affiliates with (i) identifying events or circumstances the occurrence of which could have demonstrably adverse effects on the fund's business and/or reputation; (ii) implementing processes and controls to lessen the possibility that such events or circumstances occur or to mitigate the effects of such events or circumstances if they do occur; and (iii) creating and maintaining a system designed to evaluate continuously business and market conditions in order to facilitate the identification and implementation processes described in (i) and (ii) above. Because the day-to-day operations and activities of the fund are carried out by or through FMR, its affiliates, and other service providers, the fund's exposure to risks is mitigated but not eliminated by the processes overseen by the Trustees. While each of the Board's committees has responsibility for overseeing different aspects of the fund's activities, oversight is exercised primarily through the Operations, Audit, and Compliance Committees. In addition, the Independent Trustees have worked with Fidelity to enhance the Board's oversight of investment and financial risks, legal and regulatory risks, technology risks, and operational risks, including the development of additional risk reporting to the Board. Appropriate personnel, including but not limited to the fund's Chief Compliance Officer (CCO), FMR's internal auditor, the independent accountants, the fund's Treasurer and portfolio management personnel, make periodic reports to the Board's committees, as appropriate, including an annual review of Fidelity's risk management program for the Fidelity® funds. The responsibilities of each standing committee, including their oversight responsibilities, are described further under "Standing Committees of the Trustees."
Interested Trustees*:
Correspondence intended for a Trustee who is an interested person may be sent to Fidelity Investments, 245 Summer Street, Boston, Massachusetts 02210.
Name, Year of Birth; Principal Occupations and Other Relevant Experience+
Jonathan Chiel (1957)
Year of Election or Appointment: 2016
Trustee
Mr. Chiel also serves as Trustee of other Fidelity® funds. Mr. Chiel is Executive Vice President and General Counsel for FMR LLC (diversified financial services company, 2012-present). Previously, Mr. Chiel served as general counsel (2004-2012) and senior vice president and deputy general counsel (2000-2004) for John Hancock Financial Services; a partner with Choate, Hall & Stewart (1996-2000) (law firm); and an Assistant United States Attorney for the United States Attorney’s Office of the District of Massachusetts (1986-95), including Chief of the Criminal Division (1993-1995). Mr. Chiel is a director on the boards of the Boston Bar Foundation and the Maimonides School.
James C. Curvey (1935)
Year of Election or Appointment: 2007
Trustee
Chairman of the Board of Trustees
Mr. Curvey also serves as Trustee of other Fidelity® funds. Mr. Curvey is Vice Chairman (2007-present) and Director of FMR LLC (diversified financial services company). In addition, Mr. Curvey is an Overseer Emeritus for the Boston Symphony Orchestra, a Director of Artis-Naples, and a Trustee of Brewster Academy in Wolfeboro, New Hampshire. Previously, Mr. Curvey served as a Director of Fidelity Research & Analysis Co. (investment adviser firm, 2009-2018), Director of Fidelity Investments Money Management, Inc. (investment adviser firm, 2009-2014) and a Director of FMR and FMR Co., Inc. (investment adviser firms, 2007-2014).
Charles S. Morrison (1960)
Year of Election or Appointment: 2014
Trustee
Mr. Morrison also serves as Trustee of other funds. He serves as President of Fidelity SelectCo, LLC (investment adviser firm, 2017-present) and Fidelity Management & Research Company (FMR) (investment adviser firm, 2016-present), a Director of Fidelity Investments Money Management, Inc. (FIMM) (investment adviser firm, 2014-present), Director of Fidelity SelectCo, LLC (investment adviser firm, 2014-present), President, Asset Management (2014-present), and is an employee of Fidelity Investments. Previously, Mr. Morrison served as Vice President of Fidelity's Fixed Income and Asset Allocation Funds (2012-2014), President, Fixed Income (2011-2014), Vice President of Fidelity's Money Market Funds (2005-2009), President, Money Market Group Leader of FMR (investment adviser firm, 2009), and Senior Vice President, Money Market Group of FMR (2004-2009). Mr. Morrison also served as Vice President of Fidelity's Bond Funds (2002-2005), certain Balanced Funds (2002-2005), and certain Asset Allocation Funds (2002-2007), and as Senior Vice President (2002-2005) of Fidelity's Bond Division.
* Determined to be an “Interested Trustee” by virtue of, among other things, his or her affiliation with the trust or various entities under common control with FMR.
+ The information includes the Trustee's principal occupation during the last five years and other information relating to the experience, attributes, and skills relevant to the Trustee's qualifications to serve as a Trustee, which led to the conclusion that the Trustee should serve as a Trustee for the fund.
Independent Trustees:
Correspondence intended for an Independent Trustee may be sent to Fidelity Investments, P.O. Box 55235, Boston, Massachusetts 02205-5235.
Name, Year of Birth; Principal Occupations and Other Relevant Experience+
Dennis J. Dirks (1948)
Year of Election or Appointment: 2005
Trustee
Mr. Dirks also serves as Trustee of other Fidelity® funds. Prior to his retirement in May 2003, Mr. Dirks was Chief Operating Officer and a member of the Board of The Depository Trust & Clearing Corporation (DTCC). He also served as President, Chief Operating Officer, and Board member of The Depository Trust Company (DTC) and President and Board member of the National Securities Clearing Corporation (NSCC). In addition, Mr. Dirks served as Chief Executive Officer and Board member of the Government Securities Clearing Corporation, Chief Executive Officer and Board member of the Mortgage-Backed Securities Clearing Corporation, as a Trustee and a member of the Finance Committee of Manhattan College (2005-2008), as a Trustee and a member of the Finance Committee of AHRC of Nassau County (2006-2008), as a member of the Independent Directors Council (IDC) Governing Council (2010-2015), and as a member of the Board of Directors for The Brookville Center for Children’s Services, Inc. (2009-2017). Mr. Dirks is a member of the Finance Committee (2016-present), Board of Directors (2017-present) and Board of Trustees (2018-present) and is Treasurer (2018-present) of the Asolo Repertory Theatre.
Donald F. Donahue (1950)
Year of Election or Appointment: 2018
Trustee
Mr. Donahue also serves as a Trustee of other Fidelity® funds. Mr. Donahue is President and Chief Executive Officer of Miranda Partners, LLC (risk consulting for the financial services industry, 2012-present). Previously, Mr. Donahue served as a Member of the Advisory Board of certain Fidelity® funds (2015-2018) and Chief Executive Officer (2006-2012), Chief Operating Officer (2003-2006), and Managing Director, Customer Marketing and Development (1999-2003) of The Depository Trust & Clearing Corporation (financial markets infrastructure). Mr. Donahue serves as a Member (2007-present) and Co-Chairman (2016-present) of the Board of Directors of United Way of New York, Member of the Board of Directors of NYC Leadership Academy (2012-present) and Member of the Board of Advisors of Ripple Labs, Inc. (financial services, 2015-present). He also served as Chairman (2010-2012) and Member of the Board of Directors (2012-2013) of Omgeo, LLC (financial services), Treasurer of United Way of New York (2012-2016), and Member of the Board of Directors of XBRL US (financial services non-profit, 2009-2012) and the International Securities Services Association (2009-2012).
Alan J. Lacy (1953)
Year of Election or Appointment: 2008
Trustee
Mr. Lacy also serves as Trustee of other Fidelity® funds. Mr. Lacy serves as a Director of Bristol-Myers Squibb Company (global pharmaceuticals, 2008-present). He is a Trustee of the California Chapter of The Nature Conservancy (2015-present) and a Director of the Center for Advanced Study in the Behavioral Sciences at Stanford University (2015-present). In addition, Mr. Lacy served as Senior Adviser (2007-2014) of Oak Hill Capital Partners, L.P. (private equity) and also served as Chief Executive Officer (2005) and Vice Chairman (2005-2006) of Sears Holdings Corporation (retail) and Chief Executive Officer and Chairman of the Board of Sears, Roebuck and Co. (retail, 2000-2005). Previously, Mr. Lacy served as Chairman (2014-2017) and a member (2010-2017) of the Board of Directors of Dave & Buster’s Entertainment, Inc. (restaurant and entertainment complexes), as Chairman (2008-2011) and a member (2006-2015) of the Board of Trustees of the National Parks Conservation Association, and as a member of the Board of Directors for The Hillman Companies, Inc. (hardware wholesalers, 2010-2014), Earth Fare, Inc. (retail grocery, 2010-2014), and The Western Union Company (global money transfer, 2006-2011).
Ned C. Lautenbach (1944)
Year of Election or Appointment: 2000
Trustee
Chairman of the Independent Trustees
Mr. Lautenbach also serves as Trustee of other Fidelity® funds. Mr. Lautenbach currently serves as Vice Chair of the Board of Governors, State University System of Florida (2013-present) and is a member of the Council on Foreign Relations (1994-present). He is also a member and has most recently served as Chairman of the Board of Directors of Artis-Naples (2012-present). Previously, Mr. Lautenbach served as a member and then Lead Director of the Board of Directors of Eaton Corporation (diversified industrial, 1997-2016). He was also a Partner and Advisory Partner at Clayton, Dubilier & Rice, LLC (private equity investment, 1998-2010), as well as a Director of Sony Corporation (2006-2007). In addition, Mr. Lautenbach also had a 30-year career with IBM (technology company) during which time he served as Senior Vice President and a member of the Corporate Executive Committee (1968-1998).
Joseph Mauriello (1944)
Year of Election or Appointment: 2008
Trustee
Mr. Mauriello also serves as Trustee of other Fidelity® funds. Prior to his retirement in January 2006, Mr. Mauriello served in numerous senior management positions including Deputy Chairman and Chief Operating Officer (2004-2005), and Vice Chairman of Financial Services (2002-2004) of KPMG LLP US (professional services, 1965-2005). Mr. Mauriello currently serves as a member of the Board of Directors of XL Group plc. (global insurance and re-insurance, 2006-present) and the Independent Directors Council (IDC) Governing Council (2015-present). Previously, Mr. Mauriello served as a Director of the Hamilton Funds of the Bank of New York (2006-2007) and of Arcadia Resources Inc. (health care services and products, 2007-2012).
Cornelia M. Small (1944)
Year of Election or Appointment: 2005
Trustee
Ms. Small also serves as Trustee of other Fidelity® funds. Ms. Small is a member of the Board of Directors (2009-present) and Chair of the Investment Committee (2010-present) of the Teagle Foundation. Ms. Small also serves on the Investment Committee of the Berkshire Taconic Community Foundation (2008-present). Previously, Ms. Small served as Chairperson (2002-2008) and a member of the Investment Committee and Chairperson (2008-2012) and a member of the Board of Trustees of Smith College. In addition, Ms. Small served as Chief Investment Officer, Director of Global Equity Investments, and a member of the Board of Directors of Scudder, Stevens & Clark and Scudder Kemper Investments.
Garnett A. Smith (1947)
Year of Election or Appointment: 2018
Trustee
Mr. Smith also serves as Trustee of other Fidelity® funds. Prior to Mr. Smith's retirement, he served as Chairman and Chief Executive Officer of Inbrand Corp. (manufacturer of personal absorbent products, 1990-1997). He also served as President (1986-1990) of Inbrand Corp. Prior to his employment with Inbrand Corp., he was employed by a retail fabric chain and North Carolina National Bank. In addition, Mr. Smith served as a Member of the Advisory Board of certain Fidelity® funds (2012-2013) and as a board member of the Jackson Hole Land Trust (2009-2012).
David M. Thomas (1949)
Year of Election or Appointment: 2008
Trustee
Mr. Thomas also serves as Trustee of other Fidelity® funds. Mr. Thomas serves as Non-Executive Chairman of the Board of Directors of Fortune Brands Home and Security (home and security products, 2011-present), as a member of the Board of Directors (2004-present) and Presiding Director (2013-present) of Interpublic Group of Companies, Inc. (marketing communication), and as a member of the Board of Trustees of the University of Florida (2013-present). Previously, Mr. Thomas served as Executive Chairman (2005-2006) and Chairman and Chief Executive Officer (2000-2005) of IMS Health, Inc. (pharmaceutical and healthcare information solutions), and a Director of Fortune Brands, Inc. (consumer products, 2000-2011).
+ The information includes the Trustee's principal occupation during the last five years and other information relating to the experience, attributes, and skills relevant to the Trustee's qualifications to serve as a Trustee, which led to the conclusion that the Trustee should serve as a Trustee for the fund.
Advisory Board Members and Officers:
Correspondence intended for a Member of the Advisory Board (if any) may be sent to Fidelity Investments, P.O. Box 55235, Boston, Massachusetts 02205-5235. Correspondence intended for an officer or Peter S. Lynch may be sent to Fidelity Investments, 245 Summer Street, Boston, Massachusetts 02210. Officers appear below in alphabetical order.
Name, Year of Birth; Principal Occupation
Peter S. Lynch (1944)
Year of Election or Appointment: 2003
Member of the Advisory Board
Mr. Lynch also serves as Member of the Advisory Board of other Fidelity® funds. Mr. Lynch is Vice Chairman and a Director of FMR (investment adviser firm) and FMR Co., Inc. (investment adviser firm). In addition, Mr. Lynch serves as a Trustee of Boston College and as the Chairman of the Inner-City Scholarship Fund. Previously, Mr. Lynch served on the Special Olympics International Board of Directors (1997-2006).
William S. Stavropoulos (1939)
Year of Election or Appointment: 2018
Member of the Advisory Board
Mr. Stavropoulos also serves as Member of the Advisory Board of other Fidelity® funds. Mr. Stavropoulos serves as President and Founder of the Michigan Baseball Foundation, the Great Lakes Loons (2007-present). Mr. Stavropoulos is Chairman Emeritus of the Board of Directors of The Dow Chemical Company, where he previously served in numerous senior management positions, including President, CEO (1995-2000; 2002-2004), Chairman of the Executive Committee (2000-2006), and as a member of the Board of Directors (1990-2006). Currently, Mr. Stavropoulos is Chairman of the Board of Directors of Univar Inc. (global distributor of commodity and specialty chemicals), a Director of Teradata Corporation (data warehousing and technology solutions), and a member of the Advisory Board for Metalmark Capital LLC (private equity investment, 2005-present). Mr. Stavropoulos is an operating advisor to Clayton, Dubilier & Rice, LLC (private equity investment). In addition, Mr. Stavropoulos is a member of the University of Notre Dame Advisory Council for the College of Science, a Trustee of the Rollin L. Gerstacker Foundation, and a Director of Artis-Naples in Naples, Florida. Previously, Mr. Stavropoulos served as Trustee of certain Fidelity® funds (2001-2018) and as a Director of Chemical Financial Corporation (bank holding company, 1993-2012) and Tyco International, Ltd. (multinational manufacturing and services, 2007-2012).
Carol B. Tomé (1957)
Year of Election or Appointment: 2018
Member of the Advisory Board
Ms. Tomé also serves as Member of the Advisory Board of other Fidelity® funds. Ms. Tomé is Chief Financial Officer (2001-present) and Executive Vice President of Corporate Services (2007-present) of The Home Depot, Inc. (home improvement retailer) and a Director (2003-present) and Chair of the Audit Committee (2004-present) of United Parcel Service, Inc. (package delivery and supply chain management). Previously, Ms. Tomé served as Trustee of certain Fidelity® funds (2017), Senior Vice President of Finance and Accounting/Treasurer (2000-2007) and Vice President and Treasurer (1995-2000) of The Home Depot, Inc. and Chair of the Board (2010-2012), Vice Chair of the Board (2009 and 2013), and a Director (2008-2013) of the Federal Reserve Bank of Atlanta. Ms. Tomé is also a director or trustee of many community and professional organizations.
Michael E. Wiley (1950)
Year of Election or Appointment: 2018
Member of the Advisory Board
Mr. Wiley also serves as Trustee or Member of the Advisory Board of other Fidelity® funds. Mr. Wiley serves as a Director of Andeavor Corporation (independent oil refiner and marketer, 2005-present), a Director of Andeavor Logistics LP (natural resources logistics, 2015-present), and a Director of Bill Barrett Corporation (exploration and production, 2005-present). In addition, Mr. Wiley also serves as a Director of Post Oak Bank (privately-held bank, 2004-present). Previously, Mr. Wiley served as a Trustee of other Fidelity® funds (2008-2013), as a Director of Asia Pacific Exploration Consolidated (international oil and gas exploration and production, 2008-2013), as a member of the Board of Trustees of the University of Tulsa (2000-2006; 2007-2010), as a Senior Energy Advisor of Katzenbach Partners, LLC (consulting, 2006-2007), as an Advisory Director of Riverstone Holdings (private investment), Chairman, President, and CEO of Baker Hughes, Inc. (oilfield services, 2000-2004), and as Director of Spinnaker Exploration Company (exploration and production, 2001-2005).
Elizabeth Paige Baumann (1968)
Year of Election or Appointment: 2017
Anti-Money Laundering (AML) Officer
Ms. Baumann also serves as AML Officer of other funds. She is Chief AML Officer (2012-present) and Senior Vice President (2014-present) of FMR LLC (diversified financial services company) and is an employee of Fidelity Investments. Previously, Ms. Baumann served as AML Officer of the funds (2012-2016), and Vice President (2007-2014) and Deputy Anti-Money Laundering Officer (2007-2012) of FMR LLC.
Marc R. Bryant (1966)
Year of Election or Appointment: 2015
Secretary and Chief Legal Officer (CLO)
Mr. Bryant also serves as Secretary and CLO of other funds. Mr. Bryant serves as CLO, Secretary, and Senior Vice President of Fidelity Management & Research Company (investment adviser firm, 2015-present) and FMR Co., Inc. (investment adviser firm, 2015-present); Secretary of Fidelity SelectCo, LLC (investment adviser firm, 2015-present) and Fidelity Investments Money Management, Inc. (investment adviser firm, 2015-present); and CLO of Fidelity Management & Research (Hong Kong) Limited and FMR Investment Management (UK) Limited (investment adviser firms, 2015-present) and Fidelity Management & Research (Japan) Limited (investment adviser firm, 2016-present). He is Senior Vice President and Deputy General Counsel of FMR LLC (diversified financial services company). Previously, Mr. Bryant served as Secretary and CLO of Fidelity Rutland Square Trust II (2010-2014) and Assistant Secretary of Fidelity's Fixed Income and Asset Allocation Funds (2013-2015). Prior to joining Fidelity Investments, Mr. Bryant served as a Senior Vice President and the Head of Global Retail Legal for AllianceBernstein L.P. (2006-2010), and as the General Counsel for ProFund Advisors LLC (2001-2006).
John J. Burke III (1964)
Year of Election or Appointment: 2018
Chief Financial Officer
Mr. Burke also serves as Chief Financial Officer of other funds. Mr. Burke serves as Head of Investment Operations for Fidelity Fund and Investment Operations (2018-present) and is an employee of Fidelity Investments (1998-present). Previously Mr. Burke served as head of Asset Management Investment Operations (2012-2018).
William C. Coffey (1969)
Year of Election or Appointment: 2009
Assistant Secretary
Mr. Coffey also serves as Assistant Secretary of other funds. He is Senior Vice President and Deputy General Counsel of FMR LLC (diversified financial services company, 2010-present), and is an employee of Fidelity Investments. Previously, Mr. Coffey served as Vice President and Associate General Counsel of FMR LLC (2005-2009).
Timothy M. Cohen (1969)
Year of Election or Appointment: 2018
Vice President
Mr. Cohen also serves as Vice President of other funds. Mr. Cohen serves as Co-Head of Global Equity Research (2016-present), a Director of Fidelity Management & Research (Japan) Limited (investment adviser firm, 2016-present), and is an employee of Fidelity Investments. Previously, Mr. Cohen served as Chief Investment Officer - Equity and a Director of Fidelity Management & Research (U.K.) Inc. (investment adviser firm, 2013-2015) and as a Director of Fidelity Management & Research (Hong Kong) Limited (investment adviser firm, 2017).
Jonathan Davis (1968)
Year of Election or Appointment: 2010
Assistant Treasurer
Mr. Davis also serves as Assistant Treasurer of other funds. Mr. Davis serves as Assistant Treasurer of FMR Capital, Inc. (2017-present) and is an employee of Fidelity Investments. Previously, Mr. Davis served as Vice President and Associate General Counsel of FMR LLC (diversified financial services company, 2003-2010).
Adrien E. Deberghes (1967)
Year of Election or Appointment: 2016
Assistant Treasurer
Mr. Deberghes also serves as an officer of other funds. He serves as Assistant Treasurer of FMR Capital, Inc. (2017-present), Executive Vice President of Fidelity Investments Money Management, Inc. (FIMM) (investment adviser firm, 2016-present), and is an employee of Fidelity Investments (2008-present). Previously, Mr. Deberghes served as President and Treasurer of certain Fidelity® funds (2013-2018). Prior to joining Fidelity Investments, Mr. Deberghes was Senior Vice President of Mutual Fund Administration at State Street Corporation (2007-2008), Senior Director of Mutual Fund Administration at Investors Bank & Trust (2005-2007), and Director of Finance for Dunkin' Brands (2000-2005). Previously, Mr. Deberghes served in other fund officer roles.
Laura M. Del Prato (1964)
Year of Election or Appointment: 2018
Assistant Treasurer
Ms. Del Prato also serves as an officer of other funds. Ms. Del Prato is an employee of Fidelity Investments (2017-present). Prior to joining Fidelity Investments, Ms. Del Prato served as a Managing Director and Treasurer of the JPMorgan Mutual Funds (2014-2017). Prior to JPMorgan, Ms. Del Prato served as a partner at Cohen Fund Audit Services (accounting firm, 2012-2013) and KPMG LLP (accounting firm, 2004-2012).
Colm A. Hogan (1973)
Year of Election or Appointment: 2016
Deputy Treasurer
Mr. Hogan also serves as an officer of other funds. Mr. Hogan serves as Assistant Treasurer of FMR Capital, Inc. (2017-present) and is an employee of Fidelity Investments (2005-present). Previously, Mr. Hogan served as Assistant Treasurer of certain Fidelity® funds (2016-2018).
Pamela R. Holding (1964)
Year of Election or Appointment: 2018
Vice President
Ms. Holding also serves as a Vice President of other funds. Ms. Holding serves as Co-Head of Global Equity Research (2018-present) and is an employee of Fidelity Investments (2013-present).
Chris Maher (1972)
Year of Election or Appointment: 2013
Assistant Treasurer
Mr. Maher serves as Assistant Treasurer of other funds. Mr. Maher is Vice President of Valuation Oversight, serves as Assistant Treasurer of FMR Capital, Inc. (2017-present), and is an employee of Fidelity Investments. Previously, Mr. Maher served as Vice President of Asset Management Compliance (2013), Vice President of the Program Management Group of FMR (investment adviser firm, 2010-2013), and Vice President of Valuation Oversight (2008-2010).
Rieco E. Mello (1969)
Year of Election or Appointment: 2017
Assistant Treasurer
Mr. Mello also serves as Assistant Treasurer of other funds. Mr. Mello serves as Assistant Treasurer of FMR Capital, Inc. (2017-present) and is an employee of Fidelity Investments (1995-present).
Kenneth B. Robins (1969)
Year of Election or Appointment: 2016
Chief Compliance Officer
Mr. Robins also serves as an officer of other funds. Mr. Robins serves as Compliance Officer of Fidelity Management & Research Company and FMR Co., Inc. (investment adviser firms, 2016-present) and is an employee of Fidelity Investments (2004-present). Previously, Mr. Robins served as Executive Vice President of Fidelity Investments Money Management, Inc. (investment adviser firm, 2013-2016) and served in other fund officer roles.
Stacie M. Smith (1974)
Year of Election or Appointment: 2016
President and Treasurer
Ms. Smith also serves as an officer of other funds. Ms. Smith serves as Assistant Treasurer of FMR Capital, Inc. (2017-present), is an employee of Fidelity Investments (2009-present), and has served in other fund officer roles. Prior to joining Fidelity Investments, Ms. Smith served as Senior Audit Manager of Ernst & Young LLP (accounting firm, 1996-2009). Previously, Ms. Smith served as Assistant Treasurer (2013-2018) and Deputy Treasurer (2013-2016) of certain Fidelity® funds.
Marc L. Spector (1972)
Year of Election or Appointment: 2016
Assistant Treasurer
Mr. Spector also serves as an officer of other funds. Mr. Spector serves as Assistant Treasurer of FMR Capital, Inc. (2017-present) and is an employee of Fidelity Investments (2016-present). Prior to joining Fidelity Investments, Mr. Spector served as Director at the Siegfried Group (accounting firm, 2013-2016), and prior to Siegfried Group as audit senior manager at Deloitte & Touche (accounting firm, 2005-2013).
Renee Stagnone (1975)
Year of Election or Appointment: 2016
Assistant Treasurer
Ms. Stagnone also serves as an officer of other funds. Ms. Stagnone serves as Assistant Treasurer of FMR Capital, Inc. (2017-present) and is an employee of Fidelity Investments (1997-present). Previously, Ms. Stagnone served as Deputy Treasurer of certain Fidelity® funds (2013-2016).
Shareholder Expense Example
As a shareholder of the Fund, you incur two types of costs: (1) transaction costs and (2) ongoing costs, including management fees and other Fund expenses. This Example is intended to help you understand your ongoing costs (in dollars) of investing in the Fund and to compare these costs with the ongoing costs of investing in other mutual funds.
The Example is based on an investment of $1,000 invested at the beginning of the period and held for the entire period (February 1, 2018 to July 31, 2018).
Actual Expenses
The first line of the accompanying table for each class of the Fund provides information about actual account values and actual expenses. You may use the information in this line, together with the amount you invested, to estimate the expenses that you paid over the period. Simply divide your account value by $1,000.00 (for example, an $8,600 account value divided by $1,000.00 = 8.6), then multiply the result by the number in the first line for a class of the Fund under the heading entitled "Expenses Paid During Period" to estimate the expenses you paid on your account during this period. A small balance maintenance fee of $12.00 that is charged once a year may apply for certain accounts with a value of less than $2,000. This fee is not included in the table below. If it was, the estimate of expenses you paid during the period would be higher, and your ending account value lower, by this amount. In addition, the Fund, as a shareholder in the underlying Fidelity Central Funds, will indirectly bear its pro-rata share of the fees and expenses incurred by the underlying Fidelity Central Funds. These fees and expenses are not included in the Fund's annualized expense ratio used to calculate the expense estimate in the table below.
Hypothetical Example for Comparison Purposes
The second line of the accompanying table for each class of the Fund provides information about hypothetical account values and hypothetical expenses based on a Class' actual expense ratio and an assumed rate of return of 5% per year before expenses, which is not the Class' actual return. The hypothetical account values and expenses may not be used to estimate the actual ending account balance or expenses you paid for the period. You may use this information to compare the ongoing costs of investing in the Fund and other funds. To do so, compare this 5% hypothetical example with the 5% hypothetical examples that appear in the shareholder reports of the other funds. A small balance maintenance fee of $12.00 that is charged once a year may apply for certain accounts with a value of less than $2,000. This fee is not included in the table below. If it was, the estimate of expenses you paid during the period would be higher, and your ending account value lower, by this amount. In addition, the Fund, as a shareholder in the underlying Fidelity Central Funds, will indirectly bear its pro-rata share of the fees and expenses incurred by the underlying Fidelity Central Funds. These fees and expenses are not included in the Fund's annualized expense ratio used to calculate the expense estimate in the table below.
Please note that the expenses shown in the table are meant to highlight your ongoing costs only and do not reflect any transaction costs. Therefore, the second line of the table is useful in comparing ongoing costs only, and will not help you determine the relative total costs of owning different funds.
| | Annualized Expense Ratio-A | Beginning
Account Value
February 1, 2018 | Ending
Account Value
July 31, 2018 | Expenses Paid
During Period-B
February 1, 2018
to July 31, 2018 |
| OTC | .88% | | | |
| Actual | | $1,000.00 | $1,051.20 | $4.48 |
| Hypothetical-C | | $1,000.00 | $1,020.43 | $4.41 |
| Class K | .78% | | | |
| Actual | | $1,000.00 | $1,051.90 | $3.97 |
| Hypothetical-C | | $1,000.00 | $1,020.93 | $3.91 |
A Annualized expense ratio reflects expenses net of applicable fee waivers.
B Expenses are equal to each Class' annualized expense ratio, multiplied by the average account value over the period, multiplied by 181/365 (to reflect the one-half year period).
C 5% return per year before expenses
Distributions (Unaudited)
The Board of Trustees of Fidelity OTC Portfolio voted to pay to shareholders of record at the opening of business on record date, the following distributions per share derived from capital gains realized from sales of portfolio securities:
| | Pay Date | Record Date | Capital Gains |
| Fidelity OTC Portfolio | | | |
| OTC | 09/17/2018 | 09/14/2018 | $0.492 |
| Class K | 09/17/2018 | 09/14/2018 | $0.492 |
|
The fund hereby designates as a capital gain dividend with respect to the taxable year ended July 31, 2018, $940,650,299, or, if subsequently determined to be different, the net capital gain of such year.
OTC designates 39% and Class K designates 36% of the dividends distributed in September during the fiscal year as qualifying for the dividends-received deduction for corporate shareholders.
OTC designates 41% and Class K designates 38% of the dividends distributed in September during the fiscal year as amounts which may be taken into account as a dividend for the purposes of the maximum rate under section 1(h)(11) of the Internal Revenue Code.
The fund will notify shareholders in January 2019 of amounts for use in preparing 2018 income tax returns.
Board Approval of Investment Advisory Contracts
Fidelity OTC Portfolio
At its July 2018 meeting, the Board of Trustees, including the Independent Trustees (together, the Board), voted to continue the management contract with Fidelity Management & Research Company (FMR) and the sub-advisory agreements (together, the Advisory Contracts) for the fund for six months through January 31, 2019, in connection with the reunification of the Fidelity Equity High Income Funds Board, which oversees the fund, and the Sector Portfolios Board.
The Board considered that the approval of the fund's Advisory Contracts will not result in any changes in (i) the investment process or strategies employed in the management of the fund's assets; (ii) the fees and expenses paid by shareholders; (iii) the nature, extent or quality of services provided under the fund's Advisory Contracts; or (iv) the day-to-day management of the fund or the persons primarily responsible for such management. The Board concluded that the fund's Advisory Contracts are fair and reasonable, and that the fund's Advisory Contracts should be renewed, without modification, through January 31, 2019, with the understanding that the Board will consider the annual renewal for a full one year period in January 2019.
In connection with its consideration of future renewals of the fund's Advisory Contracts, the Board will consider: (i) the nature, extent and quality of services provided to the fund, including shareholder and administrative services and investment performance; (ii) the competitiveness of the management fee and total expenses for the fund; (iii) the costs of the services and profitability, including the revenues earned and the expenses incurred in conducting the business of developing, marketing, distributing, managing, administering, and servicing the fund and its shareholders, to the extent applicable, as well as potential fall-out benefits from Fidelity's non-fund businesses; and (iv) whether there have been economies of scale in respect of the Fidelity funds, whether the Fidelity funds (including the fund) have appropriately benefited from any such economies of scale, and whether there is the potential for realization of any further economies.
Based on its evaluation of all of the conclusions noted above, and after considering all factors it believed relevant, the Board ultimately concluded that the fund's management fee structure is fair and reasonable, and that the continuation of the fund's Advisory Contracts should be approved.
Corporate Headquarters
245 Summer St.
Boston, MA 02210
www.fidelity.com
OTC-K-ANN-0918
1.863306.109
Fidelity® Growth & Income Portfolio
Annual Report July 31, 2018 |
|
Contents
To view a fund's proxy voting guidelines and proxy voting record for the 12-month period ended June 30, visit http://www.fidelity.com/proxyvotingresults or visit the Securities and Exchange Commission's (SEC) web site at http://www.sec.gov.
You may also call 1-800-544-8544 to request a free copy of the proxy voting guidelines.
Standard & Poor's, S&P and S&P 500 are registered service marks of The McGraw-Hill Companies, Inc. and have been licensed for use by Fidelity Distributors Corporation.
Other third-party marks appearing herein are the property of their respective owners.
All other marks appearing herein are registered or unregistered trademarks or service marks of FMR LLC or an affiliated company. © 2018 FMR LLC. All rights reserved.
This report and the financial statements contained herein are submitted for the general information of the shareholders of the Fund. This report is not authorized for distribution to prospective investors in the Fund unless preceded or accompanied by an effective prospectus.
A fund files its complete schedule of portfolio holdings with the SEC for the first and third quarters of each fiscal year on Form N-Q. Forms N-Q are available on the SEC’s web site at http://www.sec.gov. A fund's Forms N-Q may be reviewed and copied at the SEC’s Public Reference Room in Washington, DC. Information regarding the operation of the SEC's Public Reference Room may be obtained by calling 1-800-SEC-0330.
For a complete list of a fund's portfolio holdings, view the most recent holdings listing, semiannual report, or annual report on Fidelity's web site at http://www.fidelity.com, http://www.institutional.fidelity.com, or http://www.401k.com, as applicable.
NOT FDIC INSURED •MAY LOSE VALUE •NO BANK GUARANTEE
Neither the Fund nor Fidelity Distributors Corporation is a bank.
Performance: The Bottom Line
Average annual total return reflects the change in the value of an investment, assuming reinvestment of distributions from dividend income and capital gains (the profits earned upon the sale of securities that have grown in value, if any) and assuming a constant rate of performance each year. The hypothetical investment and the average annual total returns do not reflect the deduction of taxes that a shareholder would pay on fund distributions or the redemption of fund shares. During periods of reimbursement by Fidelity, a fund’s total return will be greater than it would be had the reimbursement not occurred. How a fund did yesterday is no guarantee of how it will do tomorrow.
Average Annual Total Returns
| For the periods ended July 31, 2018 | Past 1 year | Past 5 years | Past 10 years |
| Fidelity® Growth & Income Portfolio | 13.66% | 10.92% | 7.77% |
$10,000 Over 10 Years
Let's say hypothetically that $10,000 was invested in Fidelity® Growth & Income Portfolio, a class of the fund, on July 31, 2008.
The chart shows how the value of your investment would have changed, and also shows how the S&P 500® Index performed over the same period.
See above for additional information regarding the performance of Fidelity® Growth & Income Portfolio.
| Period Ending Values |
| $21,141 | Fidelity® Growth & Income Portfolio |
| $27,551 | S&P 500® Index |
Management's Discussion of Fund Performance
Market Recap: The U.S. equity bellwether S&P 500
® index gained 16.24% for the 12 months ending July 31, 2018, despite a resurgence in volatility that challenged the multiyear bull market. Stocks maintained their steady growth until a sharp reversal in February, as volatility spiked amid fear that rising inflation and the potential for the economy to overheat would prompt the U.S. Federal Reserve to pick up the pace of interest rate hikes. The index posted its first negative monthly result since October 2016, and then lost further ground in March on fear of a global trade war. The market stabilized in April and turned upward through mid-June, when escalating trade tension between the U.S. and China soured investor sentiment. The resulting uncertainty lingered into July, but strong corporate earnings helped the S&P 500 rise 3.72% that month to cap the period. For the full one-year period, growth handily topped value, while small-caps bested large-caps. By sector, information technology (+28%) led the way, boosted by strong earnings growth from several major index constituents. Consumer discretionary rose roughly 24%, driven by retailers (+49%). Energy (+20%) gained alongside higher oil prices. Laggards were telecommunication services (-2%), consumer staples (0%) and utilities (+3%), defensive groups that struggled amid rising interest rates and a general preference for risk. Real estate (+5%) fared a bit better but still lagged, as did financials, industrials, health care (each up 13%) and materials (+11%).
Comments from Portfolio Manager Matthew Fruhan: For the fiscal year, the fund's share classes gained roughly 14%, lagging the benchmark S&P 500
®. The fund's underperformance of the benchmark was primarily due to security selection, especially within the consumer discretionary, industrials and energy sectors. Underweights in information technology and consumer discretionary, the top sectors in the benchmark this period, also hurt our relative result. Conversely, the biggest contributor versus the benchmark was security selection in financials – especially Bank of America and JPMorgan Chase, both among the fund's top holdings on July 31 – followed by positioning in utilities, telecommunication services, real estate and materials. Within consumer discretionary, lacking exposure to two benchmarks components that performed well – internet retail giant Amazon.com and video-streaming service provider Netflix – hampered our relative result. It also hurt to overweight cable and media giant Comcast. In industrials, it hurt to overweight General Electric, which experienced multiple business challenges. Several notable relative contributors were struggling benchmark components that the fund had little or no exposure to, including telecommunication services company AT&T, which we largely avoided, and social-media giant Facebook, which we did not own at all. In energy, top relative contributors were energy producer ConocoPhillips and Suncor Energy, a non-benchmark stock and one of our largest holdings. In contrast, our position in energy pipeline operators Williams Companies and Kinder Morgan struggled and detracted. Kinder Morgan was not held at period end.
The views expressed above reflect those of the portfolio manager(s) only through the end of the period as stated on the cover of this report and do not necessarily represent the views of Fidelity or any other person in the Fidelity organization. Any such views are subject to change at any time based upon market or other conditions and Fidelity disclaims any responsibility to update such views. These views may not be relied on as investment advice and, because investment decisions for a Fidelity fund are based on numerous factors, may not be relied on as an indication of trading intent on behalf of any Fidelity fund.
Investment Summary (Unaudited)
Top Ten Stocks as of July 31, 2018
| | % of fund's net assets |
| Microsoft Corp.(a) | 4.1 |
| Bank of America Corp. | 3.3 |
| Exxon Mobil Corp. | 3.0 |
| Comcast Corp. Class A | 2.8 |
| JPMorgan Chase & Co. | 2.7 |
| Apple, Inc. | 2.5 |
| Citigroup, Inc.(a) | 2.5 |
| Chevron Corp. | 2.2 |
| Wells Fargo & Co. | 2.2 |
| Suncor Energy, Inc. | 2.0 |
| | 27.3 |
(a) Security or a portion of the security is pledged as collateral for call options written.
Top Five Market Sectors as of July 31, 2018
| | % of fund's net assets |
| Financials | 20.7 |
| Information Technology | 16.2 |
| Energy | 14.2 |
| Health Care | 13.8 |
| Industrials | 11.9 |
Asset Allocation (% of fund's net assets)
| As of July 31, 2018*,** |
| | Stocks | 98.8% |
| | Convertible Securities | 0.5% |
| | Other Investments | 0.1% |
| | Short-Term Investments and Net Other Assets (Liabilities) | 0.6% |

* Foreign investments - 13.7%
** Written options - (0.0%)
Percentages shown as 0.0% may reflect amounts less than 0.05%.
Schedule of Investments July 31, 2018
Showing Percentage of Net Assets
| Common Stocks - 98.8% | | | |
| | | Shares | Value (000s) |
| CONSUMER DISCRETIONARY - 8.5% | | | |
| Automobiles - 0.1% | | | |
| General Motors Co. | | 73,000 | $2,767 |
| Hotels, Restaurants & Leisure - 0.6% | | | |
| Cedar Fair LP (depositary unit) | | 48,500 | 2,771 |
| Dine Brands Global, Inc. | | 118,989 | 8,452 |
| Dunkin' Brands Group, Inc. (a) | | 405,000 | 28,200 |
| Starbucks Corp. | | 27,400 | 1,435 |
| | | | 40,858 |
| Media - 4.9% | | | |
| Comcast Corp. Class A | | 5,449,700 | 194,990 |
| Interpublic Group of Companies, Inc. | | 1,656,000 | 37,343 |
| Omnicom Group, Inc. | | 182,400 | 12,555 |
| The Walt Disney Co. | | 756,600 | 85,919 |
| Viacom, Inc. Class B (non-vtg.) | | 169,300 | 4,918 |
| | | | 335,725 |
| Multiline Retail - 0.3% | | | |
| Target Corp. | | 263,475 | 21,257 |
| Specialty Retail - 2.6% | | | |
| L Brands, Inc. | | 739,700 | 23,426 |
| Lowe's Companies, Inc. | | 789,179 | 78,397 |
| Ross Stores, Inc. | | 295,300 | 25,818 |
| TJX Companies, Inc. (a) | | 540,400 | 52,559 |
| | | | 180,200 |
|
| TOTAL CONSUMER DISCRETIONARY | | | 580,807 |
|
| CONSUMER STAPLES - 7.7% | | | |
| Beverages - 1.3% | | | |
| The Coca-Cola Co. | | 1,953,803 | 91,106 |
| Food & Staples Retailing - 1.4% | | | |
| Walgreens Boots Alliance, Inc. | | 82,400 | 5,572 |
| Walmart, Inc. | | 964,100 | 86,027 |
| | | | 91,599 |
| Food Products - 0.3% | | | |
| The Hershey Co. | | 218,600 | 21,469 |
| Household Products - 1.7% | | | |
| Kimberly-Clark Corp. | | 197,000 | 22,430 |
| Procter & Gamble Co. | | 1,005,315 | 81,310 |
| Spectrum Brands Holdings, Inc. | | 117,600 | 10,275 |
| | | | 114,015 |
| Tobacco - 3.0% | | | |
| Altria Group, Inc. | | 2,378,200 | 139,553 |
| British American Tobacco PLC sponsored ADR | | 1,242,100 | 68,042 |
| | | | 207,595 |
|
| TOTAL CONSUMER STAPLES | | | 525,784 |
|
| ENERGY - 14.1% | | | |
| Energy Equipment & Services - 1.4% | | | |
| Baker Hughes, a GE Co. Class A | | 1,064,400 | 36,807 |
| Nabors Industries Ltd. | | 722,900 | 4,323 |
| National Oilwell Varco, Inc. | | 521,200 | 25,341 |
| Oceaneering International, Inc. | | 776,800 | 21,253 |
| Schlumberger Ltd. | | 71,700 | 4,841 |
| | | | 92,565 |
| Oil, Gas & Consumable Fuels - 12.7% | | | |
| Anadarko Petroleum Corp. | | 188,400 | 13,781 |
| BP PLC sponsored ADR | | 1,517,198 | 68,410 |
| Cabot Oil & Gas Corp. | | 1,056,100 | 24,818 |
| Cenovus Energy, Inc. | | 8,220,400 | 82,466 |
| Cenovus Energy, Inc. | | 37,200 | 373 |
| Chevron Corp. | | 1,201,196 | 151,675 |
| ConocoPhillips Co. | | 362,400 | 26,154 |
| Enterprise Products Partners LP | | 377,500 | 10,948 |
| Equinor ASA sponsored ADR (b) | | 965,500 | 25,547 |
| Exxon Mobil Corp. | | 2,499,600 | 203,742 |
| Golar LNG Ltd. | | 642,900 | 16,722 |
| Imperial Oil Ltd. | | 868,100 | 29,730 |
| Legacy Reserves LP (c) | | 986,168 | 5,089 |
| Suncor Energy, Inc. | | 3,322,350 | 139,907 |
| Teekay LNG Partners LP | | 477,300 | 7,637 |
| The Williams Companies, Inc. | | 1,453,430 | 43,240 |
| Williams Partners LP | | 538,605 | 24,253 |
| | | | 874,492 |
|
| TOTAL ENERGY | | | 967,057 |
|
| FINANCIALS - 20.7% | | | |
| Banks - 13.8% | | | |
| Bank of America Corp. | | 7,368,056 | 227,526 |
| BNP Paribas SA | | 36,900 | 2,402 |
| Citigroup, Inc. (a) | | 2,378,030 | 170,957 |
| First Hawaiian, Inc. | | 241,600 | 6,828 |
| JPMorgan Chase & Co. | | 1,610,192 | 185,092 |
| M&T Bank Corp. | | 3,700 | 641 |
| PNC Financial Services Group, Inc. | | 405,854 | 58,780 |
| SunTrust Banks, Inc. (a) | | 1,085,066 | 78,201 |
| U.S. Bancorp | | 1,219,873 | 64,665 |
| Wells Fargo & Co. | | 2,627,241 | 150,515 |
| | | | 945,607 |
| Capital Markets - 5.7% | | | |
| Apollo Global Management LLC Class A (a) | | 348,900 | 12,386 |
| Brookfield Asset Management, Inc. | | 48,200 | 2,032 |
| Charles Schwab Corp. (a) | | 651,543 | 33,268 |
| KKR & Co. LP | | 1,919,943 | 52,568 |
| Morgan Stanley | | 916,397 | 46,333 |
| Northern Trust Corp. | | 844,164 | 92,200 |
| Oaktree Capital Group LLC Class A | | 335,300 | 14,233 |
| S&P Global, Inc. | | 143,700 | 28,803 |
| State Street Corp. | | 1,247,227 | 110,143 |
| The Blackstone Group LP | | 75,100 | 2,622 |
| | | | 394,588 |
| Insurance - 1.0% | | | |
| Chubb Ltd. | | 71,700 | 10,018 |
| Marsh & McLennan Companies, Inc. | | 272,707 | 22,733 |
| MetLife, Inc. | | 648,000 | 29,640 |
| The Travelers Companies, Inc. | | 49,000 | 6,377 |
| | | | 68,768 |
| Thrifts & Mortgage Finance - 0.2% | | | |
| Radian Group, Inc. | | 864,968 | 16,564 |
|
| TOTAL FINANCIALS | | | 1,425,527 |
|
| HEALTH CARE - 13.5% | | | |
| Biotechnology - 1.8% | | | |
| Alexion Pharmaceuticals, Inc. (c) | | 357,600 | 47,546 |
| Amgen, Inc. | | 309,612 | 60,854 |
| Intercept Pharmaceuticals, Inc. (b)(c) | | 168,426 | 15,350 |
| | | | 123,750 |
| Health Care Equipment & Supplies - 0.9% | | | |
| Becton, Dickinson & Co. | | 17,800 | 4,457 |
| Boston Scientific Corp. (c) | | 333,300 | 11,202 |
| Danaher Corp. | | 239,000 | 24,517 |
| Fisher & Paykel Healthcare Corp. | | 334,280 | 3,372 |
| ResMed, Inc. | | 52,400 | 5,543 |
| Steris PLC | | 54,400 | 6,227 |
| Zimmer Biomet Holdings, Inc. | | 53,010 | 6,654 |
| | | | 61,972 |
| Health Care Providers & Services - 5.5% | | | |
| AmerisourceBergen Corp. | | 472,600 | 38,673 |
| Anthem, Inc. | | 161,600 | 40,885 |
| Cardinal Health, Inc. | | 841,200 | 42,018 |
| Cigna Corp. | | 199,600 | 35,812 |
| CVS Health Corp. | | 1,564,604 | 101,480 |
| Fresenius Medical Care AG & Co. KGaA sponsored ADR | | 174,500 | 8,484 |
| HCA Holdings, Inc. | | 25,400 | 3,155 |
| Humana, Inc. | | 50,100 | 15,740 |
| McKesson Corp. | | 328,287 | 41,233 |
| Patterson Companies, Inc. | | 755,070 | 18,514 |
| UnitedHealth Group, Inc. | | 127,400 | 32,260 |
| | | | 378,254 |
| Pharmaceuticals - 5.3% | | | |
| Allergan PLC | | 86,100 | 15,850 |
| AstraZeneca PLC sponsored ADR | | 710,100 | 27,786 |
| Bayer AG | | 369,786 | 41,167 |
| Eli Lilly & Co. | | 105,600 | 10,434 |
| GlaxoSmithKline PLC sponsored ADR | | 2,680,022 | 111,462 |
| Johnson & Johnson | | 750,469 | 99,452 |
| Novartis AG sponsored ADR | | 58,944 | 4,945 |
| Perrigo Co. PLC | | 61,300 | 4,936 |
| Sanofi SA | | 253,613 | 22,063 |
| Teva Pharmaceutical Industries Ltd. sponsored ADR | | 1,148,720 | 27,500 |
| | | | 365,595 |
|
| TOTAL HEALTH CARE | | | 929,571 |
|
| INDUSTRIALS - 11.8% | | | |
| Aerospace & Defense - 2.3% | | | |
| General Dynamics Corp. | | 149,700 | 29,904 |
| Meggitt PLC | | 216,680 | 1,622 |
| Rolls-Royce Holdings PLC | | 1,176,600 | 15,298 |
| United Technologies Corp. | | 809,082 | 109,825 |
| | | | 156,649 |
| Air Freight & Logistics - 1.8% | | | |
| C.H. Robinson Worldwide, Inc. | | 245,600 | 22,652 |
| Expeditors International of Washington, Inc. | | 74,100 | 5,644 |
| United Parcel Service, Inc. Class B | | 790,804 | 94,809 |
| | | | 123,105 |
| Commercial Services & Supplies - 0.2% | | | |
| Healthcare Services Group, Inc. (b) | | 247,200 | 9,952 |
| Ritchie Brothers Auctioneers, Inc. | | 101,300 | 3,370 |
| | | | 13,322 |
| Electrical Equipment - 0.8% | | | |
| Acuity Brands, Inc. | | 209,700 | 29,155 |
| Hubbell, Inc. Class B | | 179,839 | 22,165 |
| Rockwell Automation, Inc. | | 22,100 | 4,145 |
| | | | 55,465 |
| Industrial Conglomerates - 1.8% | | | |
| 3M Co. | | 20,200 | 4,289 |
| General Electric Co. | | 8,615,027 | 117,423 |
| | | | 121,712 |
| Machinery - 1.1% | | | |
| Donaldson Co., Inc. | | 172,700 | 8,238 |
| Flowserve Corp. | | 866,000 | 38,390 |
| PACCAR, Inc. | | 19,500 | 1,282 |
| Snap-On, Inc. | | 20,400 | 3,460 |
| Wabtec Corp. (b) | | 238,600 | 26,322 |
| | | | 77,692 |
| Professional Services - 0.2% | | | |
| Nielsen Holdings PLC | | 602,800 | 14,202 |
| Road & Rail - 2.6% | | | |
| CSX Corp. (a) | | 428,920 | 30,316 |
| J.B. Hunt Transport Services, Inc. | | 344,040 | 41,250 |
| Norfolk Southern Corp. | | 231,399 | 39,106 |
| Union Pacific Corp. | | 464,200 | 69,579 |
| | | | 180,251 |
| Trading Companies & Distributors - 1.0% | | | |
| Bunzl PLC | | 149,953 | 4,458 |
| Fastenal Co. | | 442,500 | 25,192 |
| Howden Joinery Group PLC | | 228,700 | 1,432 |
| MSC Industrial Direct Co., Inc. Class A | | 99,700 | 8,438 |
| Watsco, Inc. | | 170,192 | 29,360 |
| | | | 68,880 |
|
| TOTAL INDUSTRIALS | | | 811,278 |
|
| INFORMATION TECHNOLOGY - 16.2% | | | |
| Communications Equipment - 1.1% | | | |
| Cisco Systems, Inc. | | 1,842,552 | 77,922 |
| Electronic Equipment & Components - 0.2% | | | |
| Avnet, Inc. | | 122,500 | 5,372 |
| Philips Lighting NV (d) | | 145,900 | 4,047 |
| | | | 9,419 |
| Internet Software & Services - 1.1% | | | |
| Alphabet, Inc.: | | | |
| Class A (c) | | 30,307 | 37,193 |
| Class C (c) | | 29,036 | 35,344 |
| LogMeIn, Inc. | | 22,800 | 1,848 |
| | | | 74,385 |
| IT Services - 3.1% | | | |
| Accenture PLC Class A | | 68,800 | 10,962 |
| IBM Corp. | | 101,800 | 14,754 |
| MasterCard, Inc. Class A | | 87,000 | 17,226 |
| Paychex, Inc. | | 803,652 | 55,468 |
| Unisys Corp. (b)(c) | | 1,267,018 | 16,281 |
| Visa, Inc. Class A (a) | | 723,684 | 98,957 |
| | | | 213,648 |
| Semiconductors & Semiconductor Equipment - 2.1% | | | |
| Analog Devices, Inc. | | 68,800 | 6,614 |
| Applied Materials, Inc. | | 244,700 | 11,900 |
| NXP Semiconductors NV (c) | | 36,100 | 3,442 |
| Qualcomm, Inc. | | 1,906,146 | 122,165 |
| United Microelectronics Corp. sponsored ADR | | 62,150 | 174 |
| | | | 144,295 |
| Software - 6.1% | | | |
| Micro Focus International PLC | | 916,962 | 14,962 |
| Microsoft Corp. (a) | | 2,674,399 | 283,706 |
| Oracle Corp. | | 1,653,953 | 78,860 |
| SAP SE sponsored ADR (b) | | 334,800 | 38,850 |
| | | | 416,378 |
| Technology Hardware, Storage & Peripherals - 2.5% | | | |
| Apple, Inc. | | 913,794 | 173,886 |
|
| TOTAL INFORMATION TECHNOLOGY | | | 1,109,933 |
|
| MATERIALS - 1.8% | | | |
| Chemicals - 1.5% | | | |
| CF Industries Holdings, Inc. | | 403,900 | 17,941 |
| DowDuPont, Inc. | | 79,900 | 5,495 |
| LyondellBasell Industries NV Class A (a) | | 276,700 | 30,656 |
| Nutrien Ltd. | | 727,880 | 39,532 |
| The Scotts Miracle-Gro Co. Class A | | 134,500 | 10,683 |
| | | | 104,307 |
| Metals & Mining - 0.3% | | | |
| BHP Billiton Ltd. sponsored ADR (b) | | 411,100 | 21,484 |
|
| TOTAL MATERIALS | | | 125,791 |
|
| REAL ESTATE - 1.5% | | | |
| Equity Real Estate Investment Trusts (REITs) - 1.5% | | | |
| American Tower Corp. | | 153,900 | 22,814 |
| CoreSite Realty Corp. | | 159,700 | 17,902 |
| Equinix, Inc. | | 62,500 | 27,455 |
| Omega Healthcare Investors, Inc. | | 138,500 | 4,112 |
| Public Storage | | 89,000 | 19,387 |
| Sabra Health Care REIT, Inc. | | 257,800 | 5,571 |
| Spirit MTA REIT (c) | | 91,630 | 915 |
| Spirit Realty Capital, Inc. | | 916,300 | 7,669 |
| | | | 105,825 |
| TELECOMMUNICATION SERVICES - 1.5% | | | |
| Diversified Telecommunication Services - 1.5% | | | |
| AT&T, Inc. | | 360,715 | 11,532 |
| Verizon Communications, Inc. | | 1,804,574 | 93,188 |
| | | | 104,720 |
| UTILITIES - 1.5% | | | |
| Electric Utilities - 1.3% | | | |
| Exelon Corp. | | 1,439,200 | 61,166 |
| PPL Corp. | | 686,800 | 19,759 |
| Southern Co. | | 221,400 | 10,760 |
| | | | 91,685 |
| Multi-Utilities - 0.2% | | | |
| Sempra Energy | | 85,300 | 9,860 |
|
| TOTAL UTILITIES | | | 101,545 |
|
| TOTAL COMMON STOCKS | | | |
| (Cost $5,925,137) | | | 6,787,838 |
|
| Preferred Stocks - 0.4% | | | |
| Convertible Preferred Stocks - 0.4% | | | |
| HEALTH CARE - 0.2% | | | |
| Health Care Equipment & Supplies - 0.2% | | | |
| Becton, Dickinson & Co. Series A, 6.125% | | 210,900 | 13,310 |
| INDUSTRIALS - 0.1% | | | |
| Commercial Services & Supplies - 0.1% | | | |
| Stericycle, Inc. 2.25% | | 117,279 | 6,131 |
| UTILITIES - 0.1% | | | |
| Electric Utilities - 0.1% | | | |
| Vistra Energy Corp. 7.00% | | 66,200 | 6,088 |
|
| TOTAL CONVERTIBLE PREFERRED STOCKS | | | 25,529 |
|
| Nonconvertible Preferred Stocks - 0.0% | | | |
| INDUSTRIALS - 0.0% | | | |
| Aerospace & Defense - 0.0% | | | |
| Rolls-Royce Holdings PLC (C Shares) | | 411,700,180 | 540 |
| TOTAL PREFERRED STOCKS | | | |
| (Cost $26,857) | | | 26,069 |
| | | Principal Amount (000s) | Value (000s) |
|
| Convertible Bonds - 0.1% | | | |
| HEALTH CARE - 0.1% | | | |
| Pharmaceuticals - 0.1% | | | |
| Bayer Capital Corp. BV 5.625% 11/22/19(d) | | | |
| (Cost $7,157) | | EUR 6,700 | 8,325 |
| | | Shares | Value (000s) |
|
| Other - 0.1% | | | |
| ENERGY - 0.1% | | | |
| Oil, Gas & Consumable - 0.1% | | | |
| Utica Shale Drilling Program (non-operating revenue interest) (e)(f)(g) | | | |
| (Cost $18,052) | | 18,052,449 | 9,510 |
|
| Money Market Funds - 1.2% | | | |
| Fidelity Cash Central Fund, 1.96% (h) | | 28,284,925 | 28,291 |
| Fidelity Securities Lending Cash Central Fund 1.97% (h)(i) | | 50,080,325 | 50,085 |
| TOTAL MONEY MARKET FUNDS | | | |
| (Cost $78,381) | | | 78,376 |
| TOTAL INVESTMENT IN SECURITIES - 100.6% | | | |
| (Cost $6,055,584) | | | 6,910,118 |
| NET OTHER ASSETS (LIABILITIES) - (0.6)% | | | (38,621) |
| NET ASSETS - 100% | | | $6,871,497 |
| Written Options | | | | | | |
| | Counterparty | Number of Contracts | Notional Amount (000s) | Exercise Price | Expiration Date | Value (000s) |
| Call Options | | | | | | |
| Apollo Global Management LLC Class A | Chicago Board Options Exchange | 908 | $3,223 | $39.00 | 9/21/18 | $(14) |
| Charles Schwab Corp. | Chicago Board Options Exchange | 1,287 | 6,571 | 60.00 | 9/21/18 | (6) |
| Citigroup, Inc. | Chicago Board Options Exchange | 2,378 | 17,095 | 72.50 | 10/19/18 | (568) |
| CSX Corp. | Chicago Board Options Exchange | 4,278 | 30,237 | 70.00 | 8/17/18 | (691) |
| Dunkin Brands Group, Inc. | Chicago Board Options Exchange | 992 | 6,907 | 75.00 | 8/17/18 | (7) |
| KKR & Co. LP | Bank of America NA | 1,899 | 5,199 | 28.00 | 9/21/18 | (115) |
| KKR & Co. LP | Bank of America NA | 1,899 | 5,199 | 29.00 | 9/21/18 | (58) |
| LyondellBasell Industries NV Class A | Chicago Board Options Exchange | 566 | 6,271 | 115.00 | 8/17/18 | (61) |
| Microsoft Corp. | Chicago Board Options Exchange | 2,667 | 28,292 | 115.00 | 10/19/18 | (332) |
| Paychex, Inc. | Bank of America NA | 1,507 | 10,401 | 72.50 | 9/21/18 | (88) |
| S&P Global, Inc. | Bank of America NA | 715 | 14,331 | 210.00 | 8/17/18 | (25) |
| SunTrust Banks, Inc. | Chicago Board Options Exchange | 1,076 | 7,755 | 75.00 | 10/19/18 | (150) |
| SunTrust Banks, Inc. | Chicago Board Options Exchange | 1,076 | 7,755 | 77.50 | 10/19/18 | (76) |
| TJX Companies, Inc. | Chicago Board Options Exchange | 1,911 | 18,586 | 97.50 | 10/19/18 | (688) |
| Visa, Inc. Class A | Chicago Board Options Exchange | 704 | 9,626 | 145.00 | 10/19/18 | (136) |
| Visa, Inc. Class A | Chicago Board Options Exchange | 704 | 9,626 | 150.00 | 10/19/18 | (64) |
| TOTAL WRITTEN OPTIONS | | | | | | $(3,079) |
Currency Abbreviations
EUR – European Monetary Unit
Legend
(a) Security or a portion of the security is pledged as collateral for call options written. At period end, the value of securities pledged amounted to $151,946,000.
(b) Security or a portion of the security is on loan at period end.
(c) Non-income producing
(d) Security exempt from registration under Rule 144A of the Securities Act of 1933. These securities may be resold in transactions exempt from registration, normally to qualified institutional buyers. At the end of the period, the value of these securities amounted to $12,372,000 or 0.2% of net assets.
(e) Investment is owned by a wholly-owned subsidiary (Subsidiary) that is treated as a corporation for U.S. tax purposes.
(f) Restricted securities - Investment in securities not registered under the Securities Act of 1933 (excluding 144A issues). At the end of the period, the value of restricted securities (excluding 144A issues) amounted to $9,510,000 or 0.1% of net assets.
(g) Level 3 security
(h) Affiliated fund that is generally available only to investment companies and other accounts managed by Fidelity Investments. The rate quoted is the annualized seven-day yield of the fund at period end. A complete unaudited listing of the fund's holdings as of its most recent quarter end is available upon request. In addition, each Fidelity Central Fund's financial statements, which are not covered by the Fund's Report of Independent Registered Public Accounting Firm, are available on the SEC's website or upon request.
(i) Investment made with cash collateral received from securities on loan.
Additional information on each restricted holding is as follows:
| Security | Acquisition Date | Acquisition Cost (000s) |
| Utica Shale Drilling Program (non-operating revenue interest) | 10/5/16 - 9/1/17 | $18,052 |
Affiliated Central Funds
Information regarding fiscal year to date income earned by the Fund from investments in Fidelity Central Funds is as follows:
| Fund | Income earned |
| | (Amounts in thousands) |
| Fidelity Cash Central Fund | $808 |
| Fidelity Securities Lending Cash Central Fund | 545 |
| Total | $1,353 |
Amounts in the income column in the above table include any capital gain distributions from underlying funds, which are presented in the corresponding line-item in the Statement of Operations if applicable.
Investment Valuation
The following is a summary of the inputs used, as of July 31, 2018, involving the Fund's assets and liabilities carried at fair value. The inputs or methodology used for valuing securities may not be an indication of the risk associated with investing in those securities. For more information on valuation inputs, and their aggregation into the levels used below, please refer to the Investment Valuation section in the accompanying Notes to Financial Statements.
| | Valuation Inputs at Reporting Date: |
| Description | Total | Level 1 | Level 2 | Level 3 |
| (Amounts in thousands) | | | | |
| Investments in Securities: | | | | |
| Equities: | | | | |
| Consumer Discretionary | $580,807 | $580,807 | $-- | $-- |
| Consumer Staples | 525,784 | 525,784 | -- | -- |
| Energy | 967,057 | 967,057 | -- | -- |
| Financials | 1,425,527 | 1,425,527 | -- | -- |
| Health Care | 942,881 | 866,341 | 76,540 | -- |
| Industrials | 817,949 | 796,520 | 21,429 | -- |
| Information Technology | 1,109,933 | 1,094,971 | 14,962 | -- |
| Materials | 125,791 | 125,791 | -- | -- |
| Real Estate | 105,825 | 105,825 | -- | -- |
| Telecommunication Services | 104,720 | 104,720 | -- | -- |
| Utilities | 107,633 | 101,545 | 6,088 | -- |
| Corporate Bonds | 8,325 | -- | 8,325 | -- |
| Other | 9,510 | -- | -- | 9,510 |
| Money Market Funds | 78,376 | 78,376 | -- | -- |
| Total Investments in Securities: | $6,910,118 | $6,773,264 | $127,344 | $9,510 |
| Derivative Instruments: | | | | |
| Liabilities | | | | |
| Written Options | $(3,079) | $(2,793) | $(286) | $-- |
| Total Liabilities | $(3,079) | $(2,793) | $(286) | $-- |
| Total Derivative Instruments: | $(3,079) | $(2,793) | $(286) | $-- |
Value of Derivative Instruments
The following table is a summary of the Fund's value of derivative instruments by primary risk exposure as of July 31, 2018. For additional information on derivative instruments, please refer to the Derivative Instruments section in the accompanying Notes to Financial Statements.
| Primary Risk Exposure / Derivative Type | Value |
| | Asset | Liability |
| (Amounts in thousands) | | |
| Equity Risk | | |
| Written Options(a) | $0 | $(3,079) |
| Total Equity Risk | 0 | (3,079) |
| Total Value of Derivatives | $0 | $(3,079) |
(a) Gross value is presented in the Statement of Assets and Liabilities in the written options, at value line-item.
Other Information
Distribution of investments by country or territory of incorporation, as a percentage of Total Net Assets, is as follows (Unaudited):
| United States of America | 86.3% |
| United Kingdom | 4.8% |
| Canada | 4.3% |
| Germany | 1.3% |
| Others (Individually Less Than 1%) | 3.3% |
| | 100.0% |
See accompanying notes which are an integral part of the financial statements.
Financial Statements
Statement of Assets and Liabilities
| Amounts in thousands (except per-share amounts) | | July 31, 2018 |
| Assets | | |
Investment in securities, at value (including securities loaned of $49,790) — See accompanying schedule:
Unaffiliated issuers (cost $5,977,203) | $6,831,742 | |
| Fidelity Central Funds (cost $78,381) | 78,376 | |
| Total Investment in Securities (cost $6,055,584) | | $6,910,118 |
| Restricted cash | | 367 |
| Receivable for investments sold | | 18,741 |
| Receivable for fund shares sold | | 1,016 |
| Dividends receivable | | 6,655 |
| Interest receivable | | 37 |
| Distributions receivable from Fidelity Central Funds | | 102 |
| Prepaid expenses | | 17 |
| Other receivables | | 955 |
| Total assets | | 6,938,008 |
| Liabilities | | |
| Payable for investments purchased | $5,768 | |
| Payable for fund shares redeemed | 3,252 | |
| Accrued management fee | 2,481 | |
| Written options, at value (premium received $3,221) | 3,079 | |
| Other affiliated payables | 888 | |
| Other payables and accrued expenses | 954 | |
| Collateral on securities loaned | 50,089 | |
| Total liabilities | | 66,511 |
| Net Assets | | $6,871,497 |
| Net Assets consist of: | | |
| Paid in capital | | $6,001,077 |
| Distributions in excess of net investment income | | (8,807) |
| Accumulated undistributed net realized gain (loss) on investments and foreign currency transactions | | 24,567 |
| Net unrealized appreciation (depreciation) on investments and assets and liabilities in foreign currencies | | 854,660 |
| Net Assets | | $6,871,497 |
| Growth and Income: | | |
| Net Asset Value, offering price and redemption price per share ($6,280,296 ÷ 159,628 shares) | | $39.34 |
| Class K: | | |
| Net Asset Value, offering price and redemption price per share ($591,201 ÷ 15,040 shares) | | $39.31 |
See accompanying notes which are an integral part of the financial statements.
Statement of Operations
| Amounts in thousands | | Year ended July 31, 2018 |
| Investment Income | | |
| Dividends | | $165,798 |
| Interest | | 449 |
| Income from Fidelity Central Funds | | 1,353 |
| Total income | | 167,600 |
| Expenses | | |
| Management fee | $31,251 | |
| Transfer agent fees | 9,855 | |
| Accounting and security lending fees | 1,183 | |
| Custodian fees and expenses | 136 | |
| Independent trustees' fees and expenses | 31 | |
| Registration fees | 67 | |
| Audit | 98 | |
| Legal | 18 | |
| Interest | 13 | |
| Miscellaneous | 54 | |
| Total expenses before reductions | 42,706 | |
| Expense reductions | (373) | |
| Total expenses after reductions | | 42,333 |
| Net investment income (loss) | | 125,267 |
| Realized and Unrealized Gain (Loss) | | |
| Net realized gain (loss) on: | | |
| Investment securities: | | |
| Unaffiliated issuers | 950,168 | |
| Fidelity Central Funds | (1) | |
| Foreign currency transactions | (64) | |
| Written options | 10,940 | |
| Total net realized gain (loss) | | 961,043 |
| Change in net unrealized appreciation (depreciation) on: | | |
| Investment securities: | | |
| Unaffiliated issuers | (184,761) | |
| Fidelity Central Funds | (3) | |
| Assets and liabilities in foreign currencies | 7 | |
| Written options | 2,554 | |
| Total change in net unrealized appreciation (depreciation) | | (182,203) |
| Net gain (loss) | | 778,840 |
| Net increase (decrease) in net assets resulting from operations | | $904,107 |
See accompanying notes which are an integral part of the financial statements.
Statement of Changes in Net Assets
| Amounts in thousands | Year ended July 31, 2018 | Year ended July 31, 2017 |
| Increase (Decrease) in Net Assets | | |
| Operations | | |
| Net investment income (loss) | $125,267 | $128,606 |
| Net realized gain (loss) | 961,043 | 555,075 |
| Change in net unrealized appreciation (depreciation) | (182,203) | 424,780 |
| Net increase (decrease) in net assets resulting from operations | 904,107 | 1,108,461 |
| Distributions to shareholders from net investment income | (140,988) | (97,619) |
| Share transactions - net increase (decrease) | (1,137,673) | (57,861) |
| Total increase (decrease) in net assets | (374,554) | 952,981 |
| Net Assets | | |
| Beginning of period | 7,246,051 | 6,293,070 |
| End of period | $6,871,497 | $7,246,051 |
| Other Information | | |
| Undistributed net investment income end of period | $– | $12,195 |
| Distributions in excess of net investment income end of period | $(8,807) | $– |
See accompanying notes which are an integral part of the financial statements.
Financial Highlights
Fidelity Growth & Income Portfolio
| Years ended July 31, | 2018 | 2017 | 2016 | 2015 | 2014 |
| Selected Per–Share Data | | | | | |
| Net asset value, beginning of period | $35.31 | $30.48 | $30.85 | $29.02 | $25.66 |
| Income from Investment Operations | | | | | |
| Net investment income (loss)A | .65 | .61 | .59 | .55 | .51 |
| Net realized and unrealized gain (loss) | 4.12 | 4.68 | (.37) | 1.82B | 3.35 |
| Total from investment operations | 4.77 | 5.29 | .22 | 2.37 | 3.86 |
| Distributions from net investment income | (.74) | (.46) | (.58) | (.54) | (.50) |
| Distributions from net realized gain | – | – | (.01) | – | (.01) |
| Total distributions | (.74) | (.46) | (.59) | (.54) | (.50)C |
| Net asset value, end of period | $39.34 | $35.31 | $30.48 | $30.85 | $29.02 |
| Total ReturnD | 13.66% | 17.48% | .88% | 8.23%B | 15.16% |
| Ratios to Average Net AssetsE,F | | | | | |
| Expenses before reductions | .61% | .63% | .64% | .64% | .65% |
| Expenses net of fee waivers, if any | .61% | .63% | .64% | .63% | .65% |
| Expenses net of all reductions | .61% | .63% | .64% | .63% | .65% |
| Net investment income (loss) | 1.76% | 1.84% | 2.05% | 1.83% | 1.86% |
| Supplemental Data | | | | | |
| Net assets, end of period (in millions) | $6,280 | $6,356 | $5,529 | $6,563 | $6,550 |
| Portfolio turnover rateG | 38% | 37% | 29% | 35% | 41%H |
A Calculated based on average shares outstanding during the period.
B Net realized and unrealized gain (loss) per share reflects proceeds received from litigation which amounted to $.06 per share. Excluding these litigation proceeds, the total return would have been 8.03%
C Total distributions of $.50 per share is comprised of distributions from net investment income of $.495 and distributions from net realized gain of $.006 per share.
D Total returns would have been lower if certain expenses had not been reduced during the applicable periods shown.
E Fees and expenses of any underlying Fidelity Central Funds are not included in the Fund's expense ratio. The Fund indirectly bears its proportionate share of the expenses of any underlying Fidelity Central Funds.
F Expense ratios reflect operating expenses of the class. Expenses before reductions do not reflect amounts reimbursed by the investment adviser or reductions from brokerage service arrangements or reductions from other expense offset arrangements and do not represent the amount paid by the class during periods when reimbursements or reductions occur. Expenses net of fee waivers reflect expenses after reimbursement by the investment adviser but prior to reductions from brokerage service arrangements or other expense offset arrangements. Expenses net of all reductions represent the net expenses paid by the class.
G Amount does not include the portfolio activity of any underlying Fidelity Central Funds.
H Portfolio turnover rate excludes securities received or delivered in-kind.
See accompanying notes which are an integral part of the financial statements.
Fidelity Growth & Income Portfolio Class K
| Years ended July 31, | 2018 | 2017 | 2016 | 2015 | 2014 |
| Selected Per–Share Data | | | | | |
| Net asset value, beginning of period | $35.28 | $30.46 | $30.82 | $29.00 | $25.64 |
| Income from Investment Operations | | | | | |
| Net investment income (loss)A | .69 | .65 | .62 | .59 | .54 |
| Net realized and unrealized gain (loss) | 4.12 | 4.67 | (.35) | 1.81B | 3.36 |
| Total from investment operations | 4.81 | 5.32 | .27 | 2.40 | 3.90 |
| Distributions from net investment income | (.78) | (.50) | (.62) | (.58) | (.53) |
| Distributions from net realized gain | – | – | (.01) | – | (.01) |
| Total distributions | (.78) | (.50) | (.63) | (.58) | (.54) |
| Net asset value, end of period | $39.31 | $35.28 | $30.46 | $30.82 | $29.00 |
| Total ReturnC | 13.79% | 17.60% | 1.04% | 8.34%B | 15.32% |
| Ratios to Average Net AssetsD,E | | | | | |
| Expenses before reductions | .51% | .52% | .52% | .52% | .52% |
| Expenses net of fee waivers, if any | .51% | .52% | .52% | .52% | .52% |
| Expenses net of all reductions | .50% | .52% | .52% | .52% | .52% |
| Net investment income (loss) | 1.86% | 1.95% | 2.17% | 1.95% | 1.99% |
| Supplemental Data | | | | | |
| Net assets, end of period (in millions) | $591 | $890 | $765 | $862 | $960 |
| Portfolio turnover rateF | 38% | 37% | 29% | 35% | 41%G |
A Calculated based on average shares outstanding during the period.
B Net realized and unrealized gain (loss) per share reflects proceeds received from litigation which amounted to $.06 per share. Excluding these litigation proceeds, the total return would have been 8.14%
C Total returns would have been lower if certain expenses had not been reduced during the applicable periods shown.
D Fees and expenses of any underlying Fidelity Central Funds are not included in the Fund's expense ratio. The Fund indirectly bears its proportionate share of the expenses of any underlying Fidelity Central Funds.
E Expense ratios reflect operating expenses of the class. Expenses before reductions do not reflect amounts reimbursed by the investment adviser or reductions from brokerage service arrangements or reductions from other expense offset arrangements and do not represent the amount paid by the class during periods when reimbursements or reductions occur. Expenses net of fee waivers reflect expenses after reimbursement by the investment adviser but prior to reductions from brokerage service arrangements or other expense offset arrangements. Expenses net of all reductions represent the net expenses paid by the class.
F Amount does not include the portfolio activity of any underlying Fidelity Central Funds.
G Portfolio turnover rate excludes securities received or delivered in-kind.
See accompanying notes which are an integral part of the financial statements.
Notes to Financial Statements
For the period ended July 31, 2018
(Amounts in thousands except percentages)
1. Organization.
Fidelity Growth & Income Portfolio (the Fund) is a fund of Fidelity Securities Fund (the Trust) and is authorized to issue an unlimited number of shares. The Trust is registered under the Investment Company Act of 1940, as amended (the 1940 Act), as an open-end management investment company organized as a Massachusetts business trust. The Fund offers Growth & Income and Class K shares, each of which has equal rights as to assets and voting privileges. Each class has exclusive voting rights with respect to matters that affect that class.
2. Investments in Fidelity Central Funds.
The Fund invests in Fidelity Central Funds, which are open-end investment companies generally available only to other investment companies and accounts managed by the investment adviser and its affiliates. The Fund's Schedule of Investments lists each of the Fidelity Central Funds held as of period end, if any, as an investment of the Fund, but does not include the underlying holdings of each Fidelity Central Fund. As an Investing Fund, the Fund indirectly bears its proportionate share of the expenses of the underlying Fidelity Central Funds.
The Money Market Central Funds seek preservation of capital and current income and are managed by Fidelity Investments Money Management, Inc. (FIMM), an affiliate of the investment adviser. Annualized expenses of the Money Market Central Funds as of their most recent shareholder report date are less than .005%.
A complete unaudited list of holdings for each Fidelity Central Fund is available upon request or at the Securities and Exchange Commission (the SEC) website at www.sec.gov. In addition, the financial statements of the Fidelity Central Funds, which are not covered by the Fund's Report of Independent Registered Public Accounting Firm, are available on the SEC website or upon request.
3. Significant Accounting Policies.
The Fund is an investment company and applies the accounting and reporting guidance of the Financial Accounting Standards Board (FASB) Accounting Standards Codification Topic 946 Financial Services – Investments Companies. The financial statements have been prepared in conformity with accounting principles generally accepted in the United States of America (GAAP), which require management to make certain estimates and assumptions at the date of the financial statements. Actual results could differ from those estimates. Subsequent events, if any, through the date that the financial statements were issued have been evaluated in the preparation of the financial statements. The following summarizes the significant accounting policies of the Fund:
Investment Valuation. Investments are valued as of 4:00 p.m. Eastern time on the last calendar day of the period. The Board of Trustees (the Board) has delegated the day to day responsibility for the valuation of the Fund's investments to the Fair Value Committee (the Committee) established by the Fund's investment adviser. In accordance with valuation policies and procedures approved by the Board, the Fund attempts to obtain prices from one or more third party pricing vendors or brokers to value its investments. When current market prices, quotations or currency exchange rates are not readily available or reliable, investments will be fair valued in good faith by the Committee, in accordance with procedures adopted by the Board. Factors used in determining fair value vary by investment type and may include market or investment specific events, changes in interest rates and credit quality. The frequency with which these procedures are used cannot be predicted and they may be utilized to a significant extent. The Committee oversees the Fund's valuation policies and procedures and reports to the Board on the Committee's activities and fair value determinations. The Board monitors the appropriateness of the procedures used in valuing the Fund's investments and ratifies the fair value determinations of the Committee.
The Fund categorizes the inputs to valuation techniques used to value its investments into a disclosure hierarchy consisting of three levels as shown below:
- Level 1 – quoted prices in active markets for identical investments
- Level 2 – other significant observable inputs (including quoted prices for similar investments, interest rates, prepayment speeds, etc.)
- Level 3 – unobservable inputs (including the Fund's own assumptions based on the best information available)
Valuation techniques used to value the Fund's investments by major category are as follows:
Equity securities, including restricted securities, for which market quotations are readily available, are valued at the last reported sale price or official closing price as reported by a third party pricing vendor on the primary market or exchange on which they are traded and are categorized as Level 1 in the hierarchy. In the event there were no sales during the day or closing prices are not available, securities are valued at the last quoted bid price or may be valued using the last available price and are generally categorized as Level 2 in the hierarchy. For foreign equity securities, when market or security specific events arise, comparisons to the valuation of American Depositary Receipts (ADRs), futures contracts, Exchange-Traded Funds (ETFs) and certain indexes as well as quoted prices for similar securities may be used and would be categorized as Level 2 in the hierarchy. Utilizing these techniques may result in transfers between Level 1 and Level 2. For equity securities, including restricted securities, where observable inputs are limited, assumptions about market activity and risk are used and these securities may be categorized as Level 3 in the hierarchy.
Debt securities, including restricted securities, are valued based on evaluated prices received from third party pricing vendors or from brokers who make markets in such securities. Corporate bonds are valued by pricing vendors who utilize matrix pricing which considers yield or price of bonds of comparable quality, coupon, maturity and type or by broker-supplied prices. When independent prices are unavailable or unreliable, debt securities may be valued utilizing pricing methodologies which consider similar factors that would be used by third party pricing vendors. Debt securities are generally categorized as Level 2 in the hierarchy but may be Level 3 depending on the circumstances.
Exchange-traded options are valued using the last sale price or, in the absence of a sale, the last offering price and are categorized as Level 1 in the hierarchy. Options traded over-the-counter are valued using vendor or broker-supplied valuations and are categorized as Level 2 in the hierarchy. Investments in open-end mutual funds, including the Fidelity Central Funds, are valued at their closing net asset value (NAV) each business day and are categorized as Level 1 in the hierarchy.
Changes in valuation techniques may result in transfers in or out of an assigned level within the disclosure hierarchy. The aggregate value of investments by input level as of July 31, 2018 is included at the end of the Fund's Schedule of Investments.
Foreign Currency. The Fund may use foreign currency contracts to facilitate transactions in foreign-denominated securities. Gains and losses from these transactions may arise from changes in the value of the foreign currency or if the counterparties do not perform under the contracts' terms.
Foreign-denominated assets, including investment securities, and liabilities are translated into U.S. dollars at the exchange rates at period end. Purchases and sales of investment securities, income and dividends received and expenses denominated in foreign currencies are translated into U.S. dollars at the exchange rate in effect on the transaction date.
The effects of exchange rate fluctuations on investments are included with the net realized and unrealized gain (loss) on investment securities. Other foreign currency transactions resulting in realized and unrealized gain (loss) are disclosed separately.
Investment Transactions and Income. For financial reporting purposes, the Fund's investment holdings and NAV include trades executed through the end of the last business day of the period. The NAV per share for processing shareholder transactions is calculated as of the close of business of the New York Stock Exchange (NYSE), normally 4:00 p.m. Eastern time and includes trades executed through the end of the prior business day. Gains and losses on securities sold are determined on the basis of identified cost and include proceeds received from litigation. Dividend income is recorded on the ex-dividend date, except for certain dividends from foreign securities where the ex-dividend date may have passed, which are recorded as soon as the Fund is informed of the ex-dividend date. Non-cash dividends included in dividend income, if any, are recorded at the fair market value of the securities received. Income and capital gain distributions from Fidelity Central Funds, if any, are recorded on the ex-dividend date. Certain distributions received by the Fund represent a return of capital or capital gain. The Fund determines the components of these distributions subsequent to the ex-dividend date, based upon receipt of tax filings or other correspondence relating to the underlying investment. These distributions are recorded as a reduction of cost of investments and/or as a realized gain. Interest income is accrued as earned and includes coupon interest and amortization of premium and accretion of discount on debt securities as applicable. Investment income is recorded net of foreign taxes withheld where recovery of such taxes is uncertain.
Class Allocations and Expenses. Investment income, realized and unrealized capital gains and losses, common expenses of the Fund, and certain fund-level expense reductions, if any, are allocated daily on a pro-rata basis to each class based on the relative net assets of each class to the total net assets of the Fund. Each class differs with respect to transfer agent fees incurred. Certain expense reductions may also differ by class. For the reporting period, the allocated portion of income and expenses to each class as a percent of its average net assets may vary due to the timing of recording these transactions in relation to fluctuating net assets of the classes. Expenses directly attributable to a fund are charged to that fund. Expenses attributable to more than one fund are allocated among the respective funds on the basis of relative net assets or other appropriate methods. Expense estimates are accrued in the period to which they relate and adjustments are made when actual amounts are known.
Deferred Trustee Compensation. Under a Deferred Compensation Plan (the Plan), certain independent Trustees have elected to defer receipt of a portion of their annual compensation. Deferred amounts are invested in a cross-section of Fidelity funds, are marked-to-market and remain in the Fund until distributed in accordance with the Plan. The investment of deferred amounts and the offsetting payable to the Trustees of $829 are included in the accompanying Statement of Assets and Liabilities in other receivables and other payables and accrued expenses, respectively.
Income Tax Information and Distributions to Shareholders. Each year, the Fund intends to qualify as a regulated investment company under Subchapter M of the Internal Revenue Code, including distributing substantially all of its taxable income and realized gains. As a result, no provision for U.S. Federal income taxes is required. As of July 31, 2018, the Fund did not have any unrecognized tax benefits in the financial statements; nor is the Fund aware of any tax positions for which it is reasonably possible that the total amounts of unrecognized tax benefits will significantly change in the next twelve months. The Fund files a U.S. federal tax return, in addition to state and local tax returns as required. The Fund's federal income tax returns are subject to examination by the Internal Revenue Service (IRS) for a period of three fiscal years after they are filed. State and local tax returns may be subject to examination for an additional fiscal year depending on the jurisdiction. Foreign taxes are provided for based on the Fund's understanding of the tax rules and rates that exist in the foreign markets in which it invests.
Distributions are declared and recorded on the ex-dividend date. Income and capital gain distributions are declared separately for each class. Income and capital gain distributions are determined in accordance with income tax regulations, which may differ from GAAP. In addition, the Fund claimed a portion of the payment made to redeeming shareholders as a distribution for income tax purposes.
Capital accounts within the financial statements are adjusted for permanent book-tax differences. These adjustments have no impact on net assets or the results of operations. Capital accounts are not adjusted for temporary book-tax differences which will reverse in a subsequent period.
Book-tax differences are primarily due to foreign currency transactions, partnerships, certain conversion ratio adjustments, equity-debt classifications, deferred trustees compensation, capital loss carryforwards, expiring capital loss carryforwards and losses deferred due to wash sales.
As of period end, the cost and unrealized appreciation (depreciation) in securities, and derivatives if applicable, for federal income tax purposes were as follows:
| Gross unrealized appreciation | $1,301,535 |
| Gross unrealized depreciation | (425,090) |
| Net unrealized appreciation (depreciation) | $876,445 |
| Tax Cost | $6,030,594 |
The tax-based components of distributable earnings as of period end were as follows:
| Undistributed ordinary income | $21,703 |
| Net unrealized appreciation (depreciation) on securities and other investments | $849,553 |
The tax character of distributions paid was as follows:
| | July 31, 2018 | July 31, 2017 |
| Ordinary Income | $140,988 | $ 97,619 |
Restricted Securities. The Fund may invest in securities that are subject to legal or contractual restrictions on resale. These securities generally may be resold in transactions exempt from registration or to the public if the securities are registered. Disposal of these securities may involve time-consuming negotiations and expense, and prompt sale at an acceptable price may be difficult. Information regarding restricted securities is included at the end of the Fund's Schedule of Investments.
Consolidated Subsidiary. The Fund invests in certain investments through a wholly-owned subsidiary ("Subsidiary"), which may be subject to federal and state taxes upon disposition.
As of period end, the Fund held an investment of $9,877 in this Subsidiary, representing .14% of the Fund's net assets. The financial statements have been consolidated and include accounts of the Fund and the Subsidiary. Accordingly, all inter-company transactions and balances have been eliminated.
Any cash held by the Subsidiary is restricted as to its use and is presented as Restricted cash in the Statement of Assets and Liabilities.
4. Derivative Instruments.
Risk Exposures and the Use of Derivative Instruments. The Fund's investment objective allows the Fund to enter into various types of derivative contracts, including options. Derivatives are investments whose value is primarily derived from underlying assets, indices or reference rates and may be transacted on an exchange or over-the-counter (OTC). Derivatives may involve a future commitment to buy or sell a specified asset based on specified terms, to exchange future cash flows at periodic intervals based on a notional principal amount, or for one party to make one or more payments upon the occurrence of specified events in exchange for periodic payments from the other party.
The Fund used derivatives to increase returns and to manage exposure to certain risks as defined below. The success of any strategy involving derivatives depends on analysis of numerous economic factors, and if the strategies for investment do not work as intended, the Fund may not achieve its objectives.
The Fund's use of derivatives increased or decreased its exposure to the following risk:
| Equity Risk | Equity risk relates to the fluctuations in the value of financial instruments as a result of changes in market prices (other than those arising from interest rate risk or foreign exchange risk), whether caused by factors specific to an individual investment, its issuer, or all factors affecting all instruments traded in a market or market segment.
|
The Fund is also exposed to additional risks from investing in derivatives, such as liquidity risk and counterparty credit risk. Liquidity risk is the risk that the Fund will be unable to close out the derivative in the open market in a timely manner. Counterparty credit risk is the risk that the counterparty will not be able to fulfill its obligation to the Fund. Derivative counterparty credit risk is managed through formal evaluation of the creditworthiness of all potential counterparties. On certain OTC derivatives such as options, the Fund attempts to reduce its exposure to counterparty credit risk by entering into an International Swaps and Derivatives Association, Inc. (ISDA) Master Agreement with each of its counterparties. The ISDA Master Agreement gives the Fund the right to terminate all transactions traded under such agreement upon the deterioration in the credit quality of the counterparty beyond specified levels. The ISDA Master Agreement gives each party the right, upon an event of default by the other party or a termination of the agreement, to close out all transactions traded under such agreement and to net amounts owed under each transaction to one net payable by one party to the other. To mitigate counterparty credit risk on bi-lateral OTC derivatives, the Fund receives collateral in the form of cash or securities once the Fund's net unrealized appreciation on outstanding derivative contracts under an ISDA Master Agreement exceeds certain applicable thresholds, subject to certain minimum transfer provisions. The collateral received is held in segregated accounts with the Fund's custodian bank in accordance with the collateral agreements entered into between the Fund, the counterparty and the Fund's custodian bank. The Fund could experience delays and costs in gaining access to the collateral even though it is held by the Fund's custodian bank. The Fund's maximum risk of loss from counterparty credit risk related to bi-lateral OTC derivatives is generally the aggregate unrealized appreciation and unpaid counterparty payments in excess of any collateral pledged by the counterparty to the Fund. The Fund may be required to pledge collateral for the benefit of the counterparties on bi-lateral OTC derivatives in an amount not less than each counterparty's unrealized appreciation on outstanding derivative contracts, subject to certain minimum transfer provisions, and any such pledged collateral is identified in the Schedule of Investments. Counterparty credit risk related to exchange-traded options may be mitigated by the protection provided by the exchange on which they trade.
Investing in derivatives may involve greater risks than investing in the underlying assets directly and, to varying degrees, may involve risk of loss in excess of any initial investment and collateral received and amounts recognized in the Statement of Assets and Liabilities. In addition, there may be the risk that the change in value of the derivative contract does not correspond to the change in value of the underlying instrument.
Options. Options give the purchaser the right, but not the obligation, to buy (call) or sell (put) an underlying security or financial instrument at an agreed exercise or strike price between or on certain dates. Options obligate the seller (writer) to buy (put) or sell (call) an underlying instrument at the exercise or strike price or cash settle an underlying derivative instrument if the holder exercises the option on or before the expiration date.
The Fund used exchange-traded and OTC written covered call options to manage its exposure to the market. When the Fund writes a covered call option, the Fund holds the underlying instrument which must be delivered to the holder upon the exercise of the option.
Upon entering into a written options contract, the Fund will receive a premium. Premiums received are reflected as a liability on the Statement of Assets and Liabilities. Options are valued daily and any unrealized appreciation (depreciation) is reflected on the Statement of Assets and Liabilities. When a written option is exercised, the premium is added to the proceeds from the sale of the underlying instrument in determining the gain or loss realized on that investment. When an option is closed the Fund will realize a gain or loss depending on whether the proceeds or amount paid for the closing sale transaction are greater or less than the premium received. When an option expires, gains and losses are realized to the extent of premiums received. The net realized gain (loss) on closed and expired written options and the change in net unrealized appreciation (depreciation) on written options are presented in the Statement of Operations.
Writing call options tends to decrease exposure to the underlying instrument and risk of loss is the change in value in excess of the premium received.
Any open options at period end are presented in the Schedule of Investments under the caption "Written Options" and are representative of volume of activity during the period.
5. Purchases and Sales of Investments.
Purchases and sales of securities, other than short-term securities, aggregated $2,675,808 and $3,837,386, respectively.
6. Fees and Other Transactions with Affiliates.
Management Fee. Fidelity Management & Research Company (the investment adviser) and its affiliates provide the Fund with investment management related services for which the Fund pays a monthly management fee. The management fee is the sum of an individual fund fee rate that is based on an annual rate of .20% of the Fund's average net assets and an annualized group fee rate that averaged .24% during the period. The group fee rate is based upon the average net assets of all the mutual funds advised by the investment adviser, including any mutual funds previously advised by the investment adviser that are currently advised by Fidelity SelectCo, LLC, an affiliate of the investment adviser. The group fee rate decreases as assets under management increase and increases as assets under management decrease. For the reporting period, the total annual management fee rate was .44% of the Fund's average net assets.
Transfer Agent Fees. Fidelity Investments Institutional Operations Company, Inc., (FIIOC), an affiliate of the investment adviser, is the transfer, dividend disbursing and shareholder servicing agent for each class of the Fund. FIIOC receives account fees and asset-based fees that vary according to the account size and type of account of the shareholders of Growth & Income, except for Class K. FIIOC receives an asset-based fee of Class K's average net assets. FIIOC pays for typesetting, printing and mailing of shareholder reports, except proxy statements.
For the period, transfer agent fees for each class were as follows:
| | Amount | % of Class-Level Average Net Assets |
| Growth and Income | $9,493 | .15 |
| Class K | 362 | .05 |
| | $9,855 | |
Accounting and Security Lending Fees. Fidelity Service Company, Inc. (FSC), an affiliate of the investment adviser, maintains the Fund's accounting records. The accounting fee is based on the level of average net assets for each month. Under a separate contract, FSC administers the security lending program. The security lending fee is based on the number and duration of lending transactions. For the period, the fees were equivalent to an annual rate of .02%.
Brokerage Commissions. The Fund placed a portion of its portfolio transactions with brokerage firms which are affiliates of the investment adviser. Brokerage commissions are included in net realized gain (loss) and change in net unrealized appreciation (depreciation) in the Statement of Operations. The commissions paid to these affiliated firms were $57 for the period.
Interfund Lending Program. Pursuant to an Exemptive Order issued by the SEC, the Fund, along with other registered investment companies having management contracts with Fidelity Management & Research Company (FMR) or other affiliated entities of FMR, may participate in an interfund lending program. This program provides an alternative credit facility allowing the funds to borrow from, or lend money to, other participating affiliated funds. At period end, there were no interfund loans outstanding. The Fund's activity in this program during the period for which loans were outstanding was as follows:
| Borrower or Lender | Average Loan Balance | Weighted Average Interest Rate | Interest Expense |
| Borrower | $7,037 | 1.46% | $11 |
Interfund Trades. The Fund may purchase from or sell securities to other Fidelity Funds under procedures adopted by the Board. The procedures have been designed to ensure these interfund trades are executed in accordance with Rule 17a-7 of the 1940 Act. Interfund trades are included within the respective purchases and sales amounts shown in the Purchases and Sales of Investments note.
7. Committed Line of Credit.
The Fund participates with other funds managed by the investment adviser or an affiliate in a $4.25 billion credit facility (the "line of credit") to be utilized for temporary or emergency purposes to fund shareholder redemptions or for other short-term liquidity purposes. The Fund has agreed to pay commitment fees on its pro-rata portion of the line of credit, which amounted to $20 and is reflected in Miscellaneous expenses on the Statement of Operations. During the period, the Fund did not borrow on this line of credit.
8. Security Lending.
The Fund lends portfolio securities through a lending agent from time to time in order to earn additional income. For equity securities, a lending agent is used and may loan securities to certain qualified borrowers, including Fidelity Capital Markets (FCM), a broker-dealer affiliated with the Fund. On the settlement date of the loan, the Fund receives collateral (in the form of U.S. Treasury obligations, letters of credit and/or cash) against the loaned securities and maintains collateral in an amount not less than 100% of the market value of the loaned securities during the period of the loan. The market value of the loaned securities is determined at the close of business of the Fund and any additional required collateral is delivered to the Fund on the next business day. The Fund or borrower may terminate the loan at any time, and if the borrower defaults on its obligation to return the securities loaned because of insolvency or other reasons, the Fund may apply collateral received from the borrower against the obligation. The Fund may experience delays and costs in recovering the securities loaned. Any cash collateral received is invested in the Fidelity Securities Lending Cash Central Fund. The value of loaned securities and cash collateral at period end are disclosed on the Fund's Statement of Assets and Liabilities. At period end, there were no security loans outstanding with FCM. Security lending income represents the income earned on investing cash collateral, less rebates paid to borrowers and any lending agent fees associated with the loan, plus any premium payments received for lending certain types of securities. Security lending income is presented in the Statement of Operations as a component of income from Fidelity Central Funds. Total security lending income during the period amounted to $545, including $16 from securities loaned to FCM.
9. Bank Borrowings.
The Fund is permitted to have bank borrowings for temporary or emergency purposes to fund shareholder redemptions or for other short-term liquidity requirements. The Fund has established borrowing arrangements with certain banks. The interest rate on the borrowings is the bank's base rate, as revised from time to time. The average loan balance during the period for which loans were outstanding amounted to $11,831. The weighted average interest rate was 1.66%. The interest expense amounted to $2 under the bank borrowing program. At period end, there were no bank borrowings outstanding.
10. Expense Reductions.
Commissions paid to certain brokers with whom the investment adviser, or its affiliates, places trades on behalf of the Fund include an amount in addition to trade execution, which may be rebated back to the Fund to offset certain expenses. This amount totaled $299 for the period.
In addition, during the period the investment adviser reimbursed and/or waived a portion of fund-level operating expenses in the amount of $74.
11. Distributions to Shareholders.
Distributions to shareholders of each class were as follows:
| | Year ended
July 31, 2018 | Year ended
July 31, 2017 |
| From net investment income | | |
| Growth and Income | $124,875 | $84,860 |
| Class K | 16,113 | 12,759 |
| Total | $140,988 | $97,619 |
12. Share Transactions.
Share transactions for each class were as follows and may contain automatic conversions between classes or exchanges between affiliated funds:
| | Shares | Shares | Dollars | Dollars |
| | Year ended July 31, 2018 | Year ended July 31, 2017 | Year ended July 31, 2018 | Year ended July 31, 2017 |
| Growth and Income | | | | |
| Shares sold | 5,407 | 18,794 | $201,160 | $607,315 |
| Reinvestment of distributions | 3,205 | 2,473 | 118,260 | 80,649 |
| Shares redeemed | (28,976) | (22,631) | (1,077,783) | (748,252) |
| Net increase (decrease) | (20,364) | (1,364) | $(758,363) | $(60,288) |
| Class K | | | | |
| Shares sold | 2,738 | 7,100 | $101,861 | $234,427 |
| Reinvestment of distributions | 438 | 391 | 16,113 | 12,759 |
| Shares redeemed | (13,364) | (7,363) | (497,284) | (244,759) |
| Net increase (decrease) | (10,188) | 128 | $(379,310) | $2,427 |
13. Other.
The Fund's organizational documents provide former and current trustees and officers with a limited indemnification against liabilities arising in connection with the performance of their duties to the Fund. In the normal course of business, the Fund may also enter into contracts that provide general indemnifications. The Fund's maximum exposure under these arrangements is unknown as this would be dependent on future claims that may be made against the Fund. The risk of material loss from such claims is considered remote.
Report of Independent Registered Public Accounting Firm
To the Board of Trustees of Fidelity Securities Fund and Shareholders of Fidelity Growth & Income Portfolio:
Opinion on the Financial Statements
We have audited the accompanying statement of assets and liabilities, including the schedule of investments, of Fidelity Growth & Income Portfolio (one of the funds constituting Fidelity Securities Fund, referred to hereafter as the "Fund") as of July 31, 2018, the related statement of operations for the year ended July 31, 2018, the statement of changes in net assets for each of the two years in the period ended July 31, 2018, including the related notes, and the financial highlights for each of the five years in the period ended July 31, 2018 (collectively referred to as the “financial statements”). In our opinion, the financial statements present fairly, in all material respects, the financial position of the Fund as of July 31, 2018, the results of its operations for the year then ended, the changes in its net assets for each of the two years in the period ended July 31, 2018 and the financial highlights for each of the five years in the period ended July 31, 2018 in conformity with accounting principles generally accepted in the United States of America.
Basis for Opinion
These financial statements are the responsibility of the Fund’s management. Our responsibility is to express an opinion on the Fund’s financial statements based on our audits. We are a public accounting firm registered with the Public Company Accounting Oversight Board (United States) (“PCAOB”) and are required to be independent with respect to the Fund in accordance with the U.S. federal securities laws and the applicable rules and regulations of the Securities and Exchange Commission and the PCAOB.
We conducted our audits of these financial statements in accordance with the standards of the PCAOB. Those standards require that we plan and perform the audit to obtain reasonable assurance about whether the financial statements are free of material misstatement, whether due to error or fraud.
Our audits included performing procedures to assess the risks of material misstatement of the financial statements, whether due to error or fraud, and performing procedures that respond to those risks. Such procedures included examining, on a test basis, evidence regarding the amounts and disclosures in the financial statements. Our audits also included evaluating the accounting principles used and significant estimates made by management, as well as evaluating the overall presentation of the financial statements. Our procedures included confirmation of securities owned as of July 31, 2018 by correspondence with the custodian and brokers; when replies were not received from brokers, we performed other auditing procedures. We believe that our audits provide a reasonable basis for our opinion.
PricewaterhouseCoopers LLP
Boston, Massachusetts
September 12, 2018
We have served as the auditor of one or more investment companies in the Fidelity group of funds since 1932.
Trustees and Officers
The Trustees, Members of the Advisory Board (if any), and officers of the trust and fund, as applicable, are listed below. The Board of Trustees governs the fund and is responsible for protecting the interests of shareholders. The Trustees are experienced executives who meet periodically throughout the year to oversee the fund's activities, review contractual arrangements with companies that provide services to the fund, oversee management of the risks associated with such activities and contractual arrangements, and review the fund's performance. Except for Jonathan Chiel, each of the Trustees oversees 286 funds. Mr. Chiel oversees 150 funds.
The Trustees hold office without limit in time except that (a) any Trustee may resign; (b) any Trustee may be removed by written instrument, signed by at least two-thirds of the number of Trustees prior to such removal; (c) any Trustee who requests to be retired or who has become incapacitated by illness or injury may be retired by written instrument signed by a majority of the other Trustees; and (d) any Trustee may be removed at any special meeting of shareholders by a two-thirds vote of the outstanding voting securities of the trust. Each Trustee who is not an interested person (as defined in the 1940 Act) of the trust and the fund is referred to herein as an Independent Trustee. Each Independent Trustee shall retire not later than the last day of the calendar year in which his or her 75th birthday occurs. The Independent Trustees may waive this mandatory retirement age policy with respect to individual Trustees. Officers and Advisory Board Members hold office without limit in time, except that any officer or Advisory Board Member may resign or may be removed by a vote of a majority of the Trustees at any regular meeting or any special meeting of the Trustees. Except as indicated, each individual has held the office shown or other offices in the same company for the past five years.
The fund’s Statement of Additional Information (SAI) includes more information about the Trustees. To request a free copy, call Fidelity at 1-800-544-8544.
Experience, Skills, Attributes, and Qualifications of the Trustees. The Governance and Nominating Committee has adopted a statement of policy that describes the experience, qualifications, attributes, and skills that are necessary and desirable for potential Independent Trustee candidates (Statement of Policy). The Board believes that each Trustee satisfied at the time he or she was initially elected or appointed a Trustee, and continues to satisfy, the standards contemplated by the Statement of Policy. The Governance and Nominating Committee also engages professional search firms to help identify potential Independent Trustee candidates who have the experience, qualifications, attributes, and skills consistent with the Statement of Policy. From time to time, additional criteria based on the composition and skills of the current Independent Trustees, as well as experience or skills that may be appropriate in light of future changes to board composition, business conditions, and regulatory or other developments, have also been considered by the professional search firms and the Governance and Nominating Committee. In addition, the Board takes into account the Trustees' commitment and participation in Board and committee meetings, as well as their leadership of standing and ad hoc committees throughout their tenure.
In determining that a particular Trustee was and continues to be qualified to serve as a Trustee, the Board has considered a variety of criteria, none of which, in isolation, was controlling. The Board believes that, collectively, the Trustees have balanced and diverse experience, qualifications, attributes, and skills, which allow the Board to operate effectively in governing the fund and protecting the interests of shareholders. Information about the specific experience, skills, attributes, and qualifications of each Trustee, which in each case led to the Board's conclusion that the Trustee should serve (or continue to serve) as a trustee of the fund, is provided below.
Board Structure and Oversight Function. James C. Curvey is an interested person and currently serves as Chairman. The Trustees have determined that an interested Chairman is appropriate and benefits shareholders because an interested Chairman has a personal and professional stake in the quality and continuity of services provided to the fund. Independent Trustees exercise their informed business judgment to appoint an individual of their choosing to serve as Chairman, regardless of whether the Trustee happens to be independent or a member of management. The Independent Trustees have determined that they can act independently and effectively without having an Independent Trustee serve as Chairman and that a key structural component for assuring that they are in a position to do so is for the Independent Trustees to constitute a substantial majority for the Board. The Independent Trustees also regularly meet in executive session. Ned C. Lautenbach serves as Chairman of the Independent Trustees and as such (i) acts as a liaison between the Independent Trustees and management with respect to matters important to the Independent Trustees and (ii) with management prepares agendas for Board meetings.
Fidelity® funds are overseen by different Boards of Trustees. The fund's Board oversees Fidelity's high income and certain equity funds, and other Boards oversee Fidelity's investment-grade bond, money market, asset allocation, and other equity funds. The asset allocation funds may invest in Fidelity® funds overseen by the fund's Board. The use of separate Boards, each with its own committee structure, allows the Trustees of each group of Fidelity® funds to focus on the unique issues of the funds they oversee, including common research, investment, and operational issues. On occasion, the separate Boards establish joint committees to address issues of overlapping consequences for the Fidelity® funds overseen by each Board.
The Trustees operate using a system of committees to facilitate the timely and efficient consideration of all matters of importance to the Trustees, the fund, and fund shareholders and to facilitate compliance with legal and regulatory requirements and oversight of the fund's activities and associated risks. The Board, acting through its committees, has charged FMR and its affiliates with (i) identifying events or circumstances the occurrence of which could have demonstrably adverse effects on the fund's business and/or reputation; (ii) implementing processes and controls to lessen the possibility that such events or circumstances occur or to mitigate the effects of such events or circumstances if they do occur; and (iii) creating and maintaining a system designed to evaluate continuously business and market conditions in order to facilitate the identification and implementation processes described in (i) and (ii) above. Because the day-to-day operations and activities of the fund are carried out by or through FMR, its affiliates, and other service providers, the fund's exposure to risks is mitigated but not eliminated by the processes overseen by the Trustees. While each of the Board's committees has responsibility for overseeing different aspects of the fund's activities, oversight is exercised primarily through the Operations, Audit, and Compliance Committees. In addition, the Independent Trustees have worked with Fidelity to enhance the Board's oversight of investment and financial risks, legal and regulatory risks, technology risks, and operational risks, including the development of additional risk reporting to the Board. Appropriate personnel, including but not limited to the fund's Chief Compliance Officer (CCO), FMR's internal auditor, the independent accountants, the fund's Treasurer and portfolio management personnel, make periodic reports to the Board's committees, as appropriate, including an annual review of Fidelity's risk management program for the Fidelity® funds. The responsibilities of each standing committee, including their oversight responsibilities, are described further under "Standing Committees of the Trustees."
Interested Trustees*:
Correspondence intended for a Trustee who is an interested person may be sent to Fidelity Investments, 245 Summer Street, Boston, Massachusetts 02210.
Name, Year of Birth; Principal Occupations and Other Relevant Experience+
Jonathan Chiel (1957)
Year of Election or Appointment: 2016
Trustee
Mr. Chiel also serves as Trustee of other Fidelity® funds. Mr. Chiel is Executive Vice President and General Counsel for FMR LLC (diversified financial services company, 2012-present). Previously, Mr. Chiel served as general counsel (2004-2012) and senior vice president and deputy general counsel (2000-2004) for John Hancock Financial Services; a partner with Choate, Hall & Stewart (1996-2000) (law firm); and an Assistant United States Attorney for the United States Attorney’s Office of the District of Massachusetts (1986-95), including Chief of the Criminal Division (1993-1995). Mr. Chiel is a director on the boards of the Boston Bar Foundation and the Maimonides School.
James C. Curvey (1935)
Year of Election or Appointment: 2007
Trustee
Chairman of the Board of Trustees
Mr. Curvey also serves as Trustee of other Fidelity® funds. Mr. Curvey is Vice Chairman (2007-present) and Director of FMR LLC (diversified financial services company). In addition, Mr. Curvey is an Overseer Emeritus for the Boston Symphony Orchestra, a Director of Artis-Naples, and a Trustee of Brewster Academy in Wolfeboro, New Hampshire. Previously, Mr. Curvey served as a Director of Fidelity Research & Analysis Co. (investment adviser firm, 2009-2018), Director of Fidelity Investments Money Management, Inc. (investment adviser firm, 2009-2014) and a Director of FMR and FMR Co., Inc. (investment adviser firms, 2007-2014).
Charles S. Morrison (1960)
Year of Election or Appointment: 2014
Trustee
Mr. Morrison also serves as Trustee of other funds. He serves as President of Fidelity SelectCo, LLC (investment adviser firm, 2017-present) and Fidelity Management & Research Company (FMR) (investment adviser firm, 2016-present), a Director of Fidelity Investments Money Management, Inc. (FIMM) (investment adviser firm, 2014-present), Director of Fidelity SelectCo, LLC (investment adviser firm, 2014-present), President, Asset Management (2014-present), and is an employee of Fidelity Investments. Previously, Mr. Morrison served as Vice President of Fidelity's Fixed Income and Asset Allocation Funds (2012-2014), President, Fixed Income (2011-2014), Vice President of Fidelity's Money Market Funds (2005-2009), President, Money Market Group Leader of FMR (investment adviser firm, 2009), and Senior Vice President, Money Market Group of FMR (2004-2009). Mr. Morrison also served as Vice President of Fidelity's Bond Funds (2002-2005), certain Balanced Funds (2002-2005), and certain Asset Allocation Funds (2002-2007), and as Senior Vice President (2002-2005) of Fidelity's Bond Division.
* Determined to be an “Interested Trustee” by virtue of, among other things, his or her affiliation with the trust or various entities under common control with FMR.
+ The information includes the Trustee's principal occupation during the last five years and other information relating to the experience, attributes, and skills relevant to the Trustee's qualifications to serve as a Trustee, which led to the conclusion that the Trustee should serve as a Trustee for the fund.
Independent Trustees:
Correspondence intended for an Independent Trustee may be sent to Fidelity Investments, P.O. Box 55235, Boston, Massachusetts 02205-5235.
Name, Year of Birth; Principal Occupations and Other Relevant Experience+
Dennis J. Dirks (1948)
Year of Election or Appointment: 2005
Trustee
Mr. Dirks also serves as Trustee of other Fidelity® funds. Prior to his retirement in May 2003, Mr. Dirks was Chief Operating Officer and a member of the Board of The Depository Trust & Clearing Corporation (DTCC). He also served as President, Chief Operating Officer, and Board member of The Depository Trust Company (DTC) and President and Board member of the National Securities Clearing Corporation (NSCC). In addition, Mr. Dirks served as Chief Executive Officer and Board member of the Government Securities Clearing Corporation, Chief Executive Officer and Board member of the Mortgage-Backed Securities Clearing Corporation, as a Trustee and a member of the Finance Committee of Manhattan College (2005-2008), as a Trustee and a member of the Finance Committee of AHRC of Nassau County (2006-2008), as a member of the Independent Directors Council (IDC) Governing Council (2010-2015), and as a member of the Board of Directors for The Brookville Center for Children’s Services, Inc. (2009-2017). Mr. Dirks is a member of the Finance Committee (2016-present), Board of Directors (2017-present) and Board of Trustees (2018-present) and is Treasurer (2018-present) of the Asolo Repertory Theatre.
Donald F. Donahue (1950)
Year of Election or Appointment: 2018
Trustee
Mr. Donahue also serves as a Trustee of other Fidelity® funds. Mr. Donahue is President and Chief Executive Officer of Miranda Partners, LLC (risk consulting for the financial services industry, 2012-present). Previously, Mr. Donahue served as a Member of the Advisory Board of certain Fidelity® funds (2015-2018) and Chief Executive Officer (2006-2012), Chief Operating Officer (2003-2006), and Managing Director, Customer Marketing and Development (1999-2003) of The Depository Trust & Clearing Corporation (financial markets infrastructure). Mr. Donahue serves as a Member (2007-present) and Co-Chairman (2016-present) of the Board of Directors of United Way of New York, Member of the Board of Directors of NYC Leadership Academy (2012-present) and Member of the Board of Advisors of Ripple Labs, Inc. (financial services, 2015-present). He also served as Chairman (2010-2012) and Member of the Board of Directors (2012-2013) of Omgeo, LLC (financial services), Treasurer of United Way of New York (2012-2016), and Member of the Board of Directors of XBRL US (financial services non-profit, 2009-2012) and the International Securities Services Association (2009-2012).
Alan J. Lacy (1953)
Year of Election or Appointment: 2008
Trustee
Mr. Lacy also serves as Trustee of other Fidelity® funds. Mr. Lacy serves as a Director of Bristol-Myers Squibb Company (global pharmaceuticals, 2008-present). He is a Trustee of the California Chapter of The Nature Conservancy (2015-present) and a Director of the Center for Advanced Study in the Behavioral Sciences at Stanford University (2015-present). In addition, Mr. Lacy served as Senior Adviser (2007-2014) of Oak Hill Capital Partners, L.P. (private equity) and also served as Chief Executive Officer (2005) and Vice Chairman (2005-2006) of Sears Holdings Corporation (retail) and Chief Executive Officer and Chairman of the Board of Sears, Roebuck and Co. (retail, 2000-2005). Previously, Mr. Lacy served as Chairman (2014-2017) and a member (2010-2017) of the Board of Directors of Dave & Buster’s Entertainment, Inc. (restaurant and entertainment complexes), as Chairman (2008-2011) and a member (2006-2015) of the Board of Trustees of the National Parks Conservation Association, and as a member of the Board of Directors for The Hillman Companies, Inc. (hardware wholesalers, 2010-2014), Earth Fare, Inc. (retail grocery, 2010-2014), and The Western Union Company (global money transfer, 2006-2011).
Ned C. Lautenbach (1944)
Year of Election or Appointment: 2000
Trustee
Chairman of the Independent Trustees
Mr. Lautenbach also serves as Trustee of other Fidelity® funds. Mr. Lautenbach currently serves as Vice Chair of the Board of Governors, State University System of Florida (2013-present) and is a member of the Council on Foreign Relations (1994-present). He is also a member and has most recently served as Chairman of the Board of Directors of Artis-Naples (2012-present). Previously, Mr. Lautenbach served as a member and then Lead Director of the Board of Directors of Eaton Corporation (diversified industrial, 1997-2016). He was also a Partner and Advisory Partner at Clayton, Dubilier & Rice, LLC (private equity investment, 1998-2010), as well as a Director of Sony Corporation (2006-2007). In addition, Mr. Lautenbach also had a 30-year career with IBM (technology company) during which time he served as Senior Vice President and a member of the Corporate Executive Committee (1968-1998).
Joseph Mauriello (1944)
Year of Election or Appointment: 2008
Trustee
Mr. Mauriello also serves as Trustee of other Fidelity® funds. Prior to his retirement in January 2006, Mr. Mauriello served in numerous senior management positions including Deputy Chairman and Chief Operating Officer (2004-2005), and Vice Chairman of Financial Services (2002-2004) of KPMG LLP US (professional services, 1965-2005). Mr. Mauriello currently serves as a member of the Board of Directors of XL Group plc. (global insurance and re-insurance, 2006-present) and the Independent Directors Council (IDC) Governing Council (2015-present). Previously, Mr. Mauriello served as a Director of the Hamilton Funds of the Bank of New York (2006-2007) and of Arcadia Resources Inc. (health care services and products, 2007-2012).
Cornelia M. Small (1944)
Year of Election or Appointment: 2005
Trustee
Ms. Small also serves as Trustee of other Fidelity® funds. Ms. Small is a member of the Board of Directors (2009-present) and Chair of the Investment Committee (2010-present) of the Teagle Foundation. Ms. Small also serves on the Investment Committee of the Berkshire Taconic Community Foundation (2008-present). Previously, Ms. Small served as Chairperson (2002-2008) and a member of the Investment Committee and Chairperson (2008-2012) and a member of the Board of Trustees of Smith College. In addition, Ms. Small served as Chief Investment Officer, Director of Global Equity Investments, and a member of the Board of Directors of Scudder, Stevens & Clark and Scudder Kemper Investments.
Garnett A. Smith (1947)
Year of Election or Appointment: 2018
Trustee
Mr. Smith also serves as Trustee of other Fidelity® funds. Prior to Mr. Smith's retirement, he served as Chairman and Chief Executive Officer of Inbrand Corp. (manufacturer of personal absorbent products, 1990-1997). He also served as President (1986-1990) of Inbrand Corp. Prior to his employment with Inbrand Corp., he was employed by a retail fabric chain and North Carolina National Bank. In addition, Mr. Smith served as a Member of the Advisory Board of certain Fidelity® funds (2012-2013) and as a board member of the Jackson Hole Land Trust (2009-2012).
David M. Thomas (1949)
Year of Election or Appointment: 2008
Trustee
Mr. Thomas also serves as Trustee of other Fidelity® funds. Mr. Thomas serves as Non-Executive Chairman of the Board of Directors of Fortune Brands Home and Security (home and security products, 2011-present), as a member of the Board of Directors (2004-present) and Presiding Director (2013-present) of Interpublic Group of Companies, Inc. (marketing communication), and as a member of the Board of Trustees of the University of Florida (2013-present). Previously, Mr. Thomas served as Executive Chairman (2005-2006) and Chairman and Chief Executive Officer (2000-2005) of IMS Health, Inc. (pharmaceutical and healthcare information solutions), and a Director of Fortune Brands, Inc. (consumer products, 2000-2011).
+ The information includes the Trustee's principal occupation during the last five years and other information relating to the experience, attributes, and skills relevant to the Trustee's qualifications to serve as a Trustee, which led to the conclusion that the Trustee should serve as a Trustee for the fund.
Advisory Board Members and Officers:
Correspondence intended for a Member of the Advisory Board (if any) may be sent to Fidelity Investments, P.O. Box 55235, Boston, Massachusetts 02205-5235. Correspondence intended for an officer or Peter S. Lynch may be sent to Fidelity Investments, 245 Summer Street, Boston, Massachusetts 02210. Officers appear below in alphabetical order.
Name, Year of Birth; Principal Occupation
Peter S. Lynch (1944)
Year of Election or Appointment: 2003
Member of the Advisory Board
Mr. Lynch also serves as Member of the Advisory Board of other Fidelity® funds. Mr. Lynch is Vice Chairman and a Director of FMR (investment adviser firm) and FMR Co., Inc. (investment adviser firm). In addition, Mr. Lynch serves as a Trustee of Boston College and as the Chairman of the Inner-City Scholarship Fund. Previously, Mr. Lynch served on the Special Olympics International Board of Directors (1997-2006).
William S. Stavropoulos (1939)
Year of Election or Appointment: 2018
Member of the Advisory Board
Mr. Stavropoulos also serves as Member of the Advisory Board of other Fidelity® funds. Mr. Stavropoulos serves as President and Founder of the Michigan Baseball Foundation, the Great Lakes Loons (2007-present). Mr. Stavropoulos is Chairman Emeritus of the Board of Directors of The Dow Chemical Company, where he previously served in numerous senior management positions, including President, CEO (1995-2000; 2002-2004), Chairman of the Executive Committee (2000-2006), and as a member of the Board of Directors (1990-2006). Currently, Mr. Stavropoulos is Chairman of the Board of Directors of Univar Inc. (global distributor of commodity and specialty chemicals), a Director of Teradata Corporation (data warehousing and technology solutions), and a member of the Advisory Board for Metalmark Capital LLC (private equity investment, 2005-present). Mr. Stavropoulos is an operating advisor to Clayton, Dubilier & Rice, LLC (private equity investment). In addition, Mr. Stavropoulos is a member of the University of Notre Dame Advisory Council for the College of Science, a Trustee of the Rollin L. Gerstacker Foundation, and a Director of Artis-Naples in Naples, Florida. Previously, Mr. Stavropoulos served as Trustee of certain Fidelity® funds (2001-2018) and as a Director of Chemical Financial Corporation (bank holding company, 1993-2012) and Tyco International, Ltd. (multinational manufacturing and services, 2007-2012).
Carol B. Tomé (1957)
Year of Election or Appointment: 2018
Member of the Advisory Board
Ms. Tomé also serves as Member of the Advisory Board of other Fidelity® funds. Ms. Tomé is Chief Financial Officer (2001-present) and Executive Vice President of Corporate Services (2007-present) of The Home Depot, Inc. (home improvement retailer) and a Director (2003-present) and Chair of the Audit Committee (2004-present) of United Parcel Service, Inc. (package delivery and supply chain management). Previously, Ms. Tomé served as Trustee of certain Fidelity® funds (2017), Senior Vice President of Finance and Accounting/Treasurer (2000-2007) and Vice President and Treasurer (1995-2000) of The Home Depot, Inc. and Chair of the Board (2010-2012), Vice Chair of the Board (2009 and 2013), and a Director (2008-2013) of the Federal Reserve Bank of Atlanta. Ms. Tomé is also a director or trustee of many community and professional organizations.
Michael E. Wiley (1950)
Year of Election or Appointment: 2018
Member of the Advisory Board
Mr. Wiley also serves as Trustee or Member of the Advisory Board of other Fidelity® funds. Mr. Wiley serves as a Director of Andeavor Corporation (independent oil refiner and marketer, 2005-present), a Director of Andeavor Logistics LP (natural resources logistics, 2015-present), and a Director of Bill Barrett Corporation (exploration and production, 2005-present). In addition, Mr. Wiley also serves as a Director of Post Oak Bank (privately-held bank, 2004-present). Previously, Mr. Wiley served as a Trustee of other Fidelity® funds (2008-2013), as a Director of Asia Pacific Exploration Consolidated (international oil and gas exploration and production, 2008-2013), as a member of the Board of Trustees of the University of Tulsa (2000-2006; 2007-2010), as a Senior Energy Advisor of Katzenbach Partners, LLC (consulting, 2006-2007), as an Advisory Director of Riverstone Holdings (private investment), Chairman, President, and CEO of Baker Hughes, Inc. (oilfield services, 2000-2004), and as Director of Spinnaker Exploration Company (exploration and production, 2001-2005).
Elizabeth Paige Baumann (1968)
Year of Election or Appointment: 2017
Anti-Money Laundering (AML) Officer
Ms. Baumann also serves as AML Officer of other funds. She is Chief AML Officer (2012-present) and Senior Vice President (2014-present) of FMR LLC (diversified financial services company) and is an employee of Fidelity Investments. Previously, Ms. Baumann served as AML Officer of the funds (2012-2016), and Vice President (2007-2014) and Deputy Anti-Money Laundering Officer (2007-2012) of FMR LLC.
Marc R. Bryant (1966)
Year of Election or Appointment: 2015
Secretary and Chief Legal Officer (CLO)
Mr. Bryant also serves as Secretary and CLO of other funds. Mr. Bryant serves as CLO, Secretary, and Senior Vice President of Fidelity Management & Research Company (investment adviser firm, 2015-present) and FMR Co., Inc. (investment adviser firm, 2015-present); Secretary of Fidelity SelectCo, LLC (investment adviser firm, 2015-present) and Fidelity Investments Money Management, Inc. (investment adviser firm, 2015-present); and CLO of Fidelity Management & Research (Hong Kong) Limited and FMR Investment Management (UK) Limited (investment adviser firms, 2015-present) and Fidelity Management & Research (Japan) Limited (investment adviser firm, 2016-present). He is Senior Vice President and Deputy General Counsel of FMR LLC (diversified financial services company). Previously, Mr. Bryant served as Secretary and CLO of Fidelity Rutland Square Trust II (2010-2014) and Assistant Secretary of Fidelity's Fixed Income and Asset Allocation Funds (2013-2015). Prior to joining Fidelity Investments, Mr. Bryant served as a Senior Vice President and the Head of Global Retail Legal for AllianceBernstein L.P. (2006-2010), and as the General Counsel for ProFund Advisors LLC (2001-2006).
John J. Burke III (1964)
Year of Election or Appointment: 2018
Chief Financial Officer
Mr. Burke also serves as Chief Financial Officer of other funds. Mr. Burke serves as Head of Investment Operations for Fidelity Fund and Investment Operations (2018-present) and is an employee of Fidelity Investments (1998-present). Previously Mr. Burke served as head of Asset Management Investment Operations (2012-2018).
William C. Coffey (1969)
Year of Election or Appointment: 2009
Assistant Secretary
Mr. Coffey also serves as Assistant Secretary of other funds. He is Senior Vice President and Deputy General Counsel of FMR LLC (diversified financial services company, 2010-present), and is an employee of Fidelity Investments. Previously, Mr. Coffey served as Vice President and Associate General Counsel of FMR LLC (2005-2009).
Timothy M. Cohen (1969)
Year of Election or Appointment: 2018
Vice President
Mr. Cohen also serves as Vice President of other funds. Mr. Cohen serves as Co-Head of Global Equity Research (2016-present), a Director of Fidelity Management & Research (Japan) Limited (investment adviser firm, 2016-present), and is an employee of Fidelity Investments. Previously, Mr. Cohen served as Chief Investment Officer - Equity and a Director of Fidelity Management & Research (U.K.) Inc. (investment adviser firm, 2013-2015) and as a Director of Fidelity Management & Research (Hong Kong) Limited (investment adviser firm, 2017).
Jonathan Davis (1968)
Year of Election or Appointment: 2010
Assistant Treasurer
Mr. Davis also serves as Assistant Treasurer of other funds. Mr. Davis serves as Assistant Treasurer of FMR Capital, Inc. (2017-present) and is an employee of Fidelity Investments. Previously, Mr. Davis served as Vice President and Associate General Counsel of FMR LLC (diversified financial services company, 2003-2010).
Adrien E. Deberghes (1967)
Year of Election or Appointment: 2016
Assistant Treasurer
Mr. Deberghes also serves as an officer of other funds. He serves as Assistant Treasurer of FMR Capital, Inc. (2017-present), Executive Vice President of Fidelity Investments Money Management, Inc. (FIMM) (investment adviser firm, 2016-present), and is an employee of Fidelity Investments (2008-present). Previously, Mr. Deberghes served as President and Treasurer of certain Fidelity® funds (2013-2018). Prior to joining Fidelity Investments, Mr. Deberghes was Senior Vice President of Mutual Fund Administration at State Street Corporation (2007-2008), Senior Director of Mutual Fund Administration at Investors Bank & Trust (2005-2007), and Director of Finance for Dunkin' Brands (2000-2005). Previously, Mr. Deberghes served in other fund officer roles.
Laura M. Del Prato (1964)
Year of Election or Appointment: 2018
Assistant Treasurer
Ms. Del Prato also serves as an officer of other funds. Ms. Del Prato is an employee of Fidelity Investments (2017-present). Prior to joining Fidelity Investments, Ms. Del Prato served as a Managing Director and Treasurer of the JPMorgan Mutual Funds (2014-2017). Prior to JPMorgan, Ms. Del Prato served as a partner at Cohen Fund Audit Services (accounting firm, 2012-2013) and KPMG LLP (accounting firm, 2004-2012).
Colm A. Hogan (1973)
Year of Election or Appointment: 2016
Deputy Treasurer
Mr. Hogan also serves as an officer of other funds. Mr. Hogan serves as Assistant Treasurer of FMR Capital, Inc. (2017-present) and is an employee of Fidelity Investments (2005-present). Previously, Mr. Hogan served as Assistant Treasurer of certain Fidelity® funds (2016-2018).
Pamela R. Holding (1964)
Year of Election or Appointment: 2018
Vice President
Ms. Holding also serves as a Vice President of other funds. Ms. Holding serves as Co-Head of Global Equity Research (2018-present) and is an employee of Fidelity Investments (2013-present).
Chris Maher (1972)
Year of Election or Appointment: 2013
Assistant Treasurer
Mr. Maher serves as Assistant Treasurer of other funds. Mr. Maher is Vice President of Valuation Oversight, serves as Assistant Treasurer of FMR Capital, Inc. (2017-present), and is an employee of Fidelity Investments. Previously, Mr. Maher served as Vice President of Asset Management Compliance (2013), Vice President of the Program Management Group of FMR (investment adviser firm, 2010-2013), and Vice President of Valuation Oversight (2008-2010).
Rieco E. Mello (1969)
Year of Election or Appointment: 2017
Assistant Treasurer
Mr. Mello also serves as Assistant Treasurer of other funds. Mr. Mello serves as Assistant Treasurer of FMR Capital, Inc. (2017-present) and is an employee of Fidelity Investments (1995-present).
Kenneth B. Robins (1969)
Year of Election or Appointment: 2016
Chief Compliance Officer
Mr. Robins also serves as an officer of other funds. Mr. Robins serves as Compliance Officer of Fidelity Management & Research Company and FMR Co., Inc. (investment adviser firms, 2016-present) and is an employee of Fidelity Investments (2004-present). Previously, Mr. Robins served as Executive Vice President of Fidelity Investments Money Management, Inc. (investment adviser firm, 2013-2016) and served in other fund officer roles.
Stacie M. Smith (1974)
Year of Election or Appointment: 2016
President and Treasurer
Ms. Smith also serves as an officer of other funds. Ms. Smith serves as Assistant Treasurer of FMR Capital, Inc. (2017-present), is an employee of Fidelity Investments (2009-present), and has served in other fund officer roles. Prior to joining Fidelity Investments, Ms. Smith served as Senior Audit Manager of Ernst & Young LLP (accounting firm, 1996-2009). Previously, Ms. Smith served as Assistant Treasurer (2013-2018) and Deputy Treasurer (2013-2016) of certain Fidelity® funds.
Marc L. Spector (1972)
Year of Election or Appointment: 2016
Assistant Treasurer
Mr. Spector also serves as an officer of other funds. Mr. Spector serves as Assistant Treasurer of FMR Capital, Inc. (2017-present) and is an employee of Fidelity Investments (2016-present). Prior to joining Fidelity Investments, Mr. Spector served as Director at the Siegfried Group (accounting firm, 2013-2016), and prior to Siegfried Group as audit senior manager at Deloitte & Touche (accounting firm, 2005-2013).
Renee Stagnone (1975)
Year of Election or Appointment: 2016
Assistant Treasurer
Ms. Stagnone also serves as an officer of other funds. Ms. Stagnone serves as Assistant Treasurer of FMR Capital, Inc. (2017-present) and is an employee of Fidelity Investments (1997-present). Previously, Ms. Stagnone served as Deputy Treasurer of certain Fidelity® funds (2013-2016).
Shareholder Expense Example
As a shareholder of the Fund, you incur two types of costs: (1) transaction costs and (2) ongoing costs, including management fees and other Fund expenses. This Example is intended to help you understand your ongoing costs (in dollars) of investing in the Fund and to compare these costs with the ongoing costs of investing in other mutual funds.
The Example is based on an investment of $1,000 invested at the beginning of the period and held for the entire period (February 1, 2018 to July 31, 2018).
Actual Expenses
The first line of the accompanying table for each class of the Fund provides information about actual account values and actual expenses. You may use the information in this line, together with the amount you invested, to estimate the expenses that you paid over the period. Simply divide your account value by $1,000.00 (for example, an $8,600 account value divided by $1,000.00 = 8.6), then multiply the result by the number in the first line for a class of the Fund under the heading entitled "Expenses Paid During Period" to estimate the expenses you paid on your account during this period. A small balance maintenance fee of $12.00 that is charged once a year may apply for certain accounts with a value of less than $2,000. This fee is not included in the table below. If it was, the estimate of expenses you paid during the period would be higher, and your ending account value lower, by this amount. In addition, the Fund, as a shareholder in the underlying Fidelity Central Funds, will indirectly bear its pro-rata share of the fees and expenses incurred by the underlying Fidelity Central Funds. These fees and expenses are not included in the Fund's annualized expense ratio used to calculate the expense estimate in the table below.
Hypothetical Example for Comparison Purposes
The second line of the accompanying table for each class of the Fund provides information about hypothetical account values and hypothetical expenses based on a Class' actual expense ratio and an assumed rate of return of 5% per year before expenses, which is not the Class' actual return. The hypothetical account values and expenses may not be used to estimate the actual ending account balance or expenses you paid for the period. You may use this information to compare the ongoing costs of investing in the Fund and other funds. To do so, compare this 5% hypothetical example with the 5% hypothetical examples that appear in the shareholder reports of the other funds. A small balance maintenance fee of $12.00 that is charged once a year may apply for certain accounts with a value of less than $2,000. This fee is not included in the table below. If it was, the estimate of expenses you paid during the period would be higher, and your ending account value lower, by this amount. In addition, the Fund, as a shareholder in the underlying Fidelity Central Funds, will indirectly bear its pro-rata share of the fees and expenses incurred by the underlying Fidelity Central Funds. These fees and expenses are not included in the Fund's annualized expense ratio used to calculate the expense estimate in the table below.
Please note that the expenses shown in the table are meant to highlight your ongoing costs only and do not reflect any transaction costs. Therefore, the second line of the table is useful in comparing ongoing costs only, and will not help you determine the relative total costs of owning different funds.
| | Annualized Expense Ratio-A | Beginning
Account Value
February 1, 2018 | Ending
Account Value
July 31, 2018 | Expenses Paid
During Period-B
February 1, 2018
to July 31, 2018 |
| Growth and Income | .61% | | | |
| Actual | | $1,000.00 | $996.50 | $3.02 |
| Hypothetical-C | | $1,000.00 | $1,021.77 | $3.06 |
| Class K | .51% | | | |
| Actual | | $1,000.00 | $997.00 | $2.53 |
| Hypothetical-C | | $1,000.00 | $1,022.27 | $2.56 |
A Annualized expense ratio reflects expenses net of applicable fee waivers.
B Expenses are equal to each Class' annualized expense ratio, multiplied by the average account value over the period, multiplied by 181/365 (to reflect the one-half year period).
C 5% return per year before expenses
Distributions (Unaudited)
The Board of Trustees of Fidelity Growth & Income Portfolio voted to pay to shareholders of record at the opening of business on record date, the following distributions per share derived from capital gains realized from sales of portfolio securities:
| | Pay Date | Record Date | Capital Gains |
| Fidelity Growth & Income Portfolio | | | |
| Growth & Income | 09/10/18 | 09/07/18 | $0.014 |
| Class K | 09/10/18 | 09/07/18 | $0.014 |
|
A total of 0.11% of the dividends distributed during the fiscal year was derived from interest on U.S. Government securities which is generally exempt from state income tax.
Growth & Income and Class K designate 100% of the dividends distributed during the fiscal year as qualifying for the dividends–received deduction for corporate shareholders.
Growth & Income, and Class K designate 100% of dividends distributed during the fiscal year as amounts which may be taken into account as a dividend for purposes of the maximum rate under section 1(h)(11) of the Internal Revenue Code.
The fund will notify shareholders in January 2019 of amounts for use in preparing 2018 income tax returns.
Board Approval of Investment Advisory Contracts
Fidelity Growth & Income Portfolio
At its July 2018 meeting, the Board of Trustees, including the Independent Trustees (together, the Board), voted to continue the management contract with Fidelity Management & Research Company (FMR) and the sub-advisory agreements (together, the Advisory Contracts) for the fund for six months through January 31, 2019, in connection with the reunification of the Fidelity Equity High Income Funds Board, which oversees the fund, and the Sector Portfolios Board.
The Board considered that the approval of the fund's Advisory Contracts will not result in any changes in (i) the investment process or strategies employed in the management of the fund's assets; (ii) the fees and expenses paid by shareholders; (iii) the nature, extent or quality of services provided under the fund's Advisory Contracts; or (iv) the day-to-day management of the fund or the persons primarily responsible for such management. The Board concluded that the fund's Advisory Contracts are fair and reasonable, and that the fund's Advisory Contracts should be renewed, without modification, through January 31, 2019, with the understanding that the Board will consider the annual renewal for a full one year period in January 2019.
In connection with its consideration of future renewals of the fund's Advisory Contracts, the Board will consider: (i) the nature, extent and quality of services provided to the fund, including shareholder and administrative services and investment performance; (ii) the competitiveness of the management fee and total expenses for the fund; (iii) the costs of the services and profitability, including the revenues earned and the expenses incurred in conducting the business of developing, marketing, distributing, managing, administering, and servicing the fund and its shareholders, to the extent applicable, as well as potential fall-out benefits from Fidelity's non-fund businesses; and (iv) whether there have been economies of scale in respect of the Fidelity funds, whether the Fidelity funds (including the fund) have appropriately benefited from any such economies of scale, and whether there is the potential for realization of any further economies.
Based on its evaluation of all of the conclusions noted above, and after considering all factors it believed relevant, the Board ultimately concluded that the fund's management fee structure is fair and reasonable, and that the continuation of the fund's Advisory Contracts should be approved.
Corporate Headquarters
245 Summer St.
Boston, MA 02210
www.fidelity.com
GAI-ANN-0918
1.536189.121
Fidelity® Growth & Income Portfolio Class K
Annual Report July 31, 2018 |
|
Contents
To view a fund's proxy voting guidelines and proxy voting record for the 12-month period ended June 30, visit http://www.fidelity.com/proxyvotingresults or visit the Securities and Exchange Commission's (SEC) web site at http://www.sec.gov.
You may also call 1-800-835-5092 to request a free copy of the proxy voting guidelines.
Standard & Poor's, S&P and S&P 500 are registered service marks of The McGraw-Hill Companies, Inc. and have been licensed for use by Fidelity Distributors Corporation.
Other third-party marks appearing herein are the property of their respective owners.
All other marks appearing herein are registered or unregistered trademarks or service marks of FMR LLC or an affiliated company. © 2018 FMR LLC. All rights reserved.
This report and the financial statements contained herein are submitted for the general information of the shareholders of the Fund. This report is not authorized for distribution to prospective investors in the Fund unless preceded or accompanied by an effective prospectus.
A fund files its complete schedule of portfolio holdings with the SEC for the first and third quarters of each fiscal year on Form N-Q. Forms N-Q are available on the SEC’s web site at http://www.sec.gov. A fund's Forms N-Q may be reviewed and copied at the SEC’s Public Reference Room in Washington, DC. Information regarding the operation of the SEC's Public Reference Room may be obtained by calling 1-800-SEC-0330.
For a complete list of a fund's portfolio holdings, view the most recent holdings listing, semiannual report, or annual report on Fidelity's web site at http://www.fidelity.com, http://www.institutional.fidelity.com, or http://www.401k.com, as applicable.
NOT FDIC INSURED •MAY LOSE VALUE •NO BANK GUARANTEE
Neither the Fund nor Fidelity Distributors Corporation is a bank.
Performance: The Bottom Line
Average annual total return reflects the change in the value of an investment, assuming reinvestment of distributions from dividend income and capital gains (the profits earned upon the sale of securities that have grown in value, if any) and assuming a constant rate of performance each year. The hypothetical investment and the average annual total returns do not reflect the deduction of taxes that a shareholder would pay on fund distributions or the redemption of fund shares. During periods of reimbursement by Fidelity, a fund’s total return will be greater than it would be had the reimbursement not occurred. How a fund did yesterday is no guarantee of how it will do tomorrow.
Average Annual Total Returns
| For the periods ended July 31, 2018 | Past 1 year | Past 5 years | Past 10 years |
| Class K | 13.79% | 11.05% | 7.94% |
$10,000 Over 10 Years
Let's say hypothetically that $10,000 was invested in Fidelity® Growth & Income Portfolio - Class K on July 31, 2008.
The chart shows how the value of your investment would have changed, and also shows how the S&P 500® Index performed over the same period.
See above for additional information regarding the performance of Class K.
| Period Ending Values |
| $21,472 | Fidelity® Growth & Income Portfolio - Class K |
| $27,551 | S&P 500® Index |
Management's Discussion of Fund Performance
Market Recap: The U.S. equity bellwether S&P 500
® index gained 16.24% for the 12 months ending July 31, 2018, despite a resurgence in volatility that challenged the multiyear bull market. Stocks maintained their steady growth until a sharp reversal in February, as volatility spiked amid fear that rising inflation and the potential for the economy to overheat would prompt the U.S. Federal Reserve to pick up the pace of interest rate hikes. The index posted its first negative monthly result since October 2016, and then lost further ground in March on fear of a global trade war. The market stabilized in April and turned upward through mid-June, when escalating trade tension between the U.S. and China soured investor sentiment. The resulting uncertainty lingered into July, but strong corporate earnings helped the S&P 500 rise 3.72% that month to cap the period. For the full one-year period, growth handily topped value, while small-caps bested large-caps. By sector, information technology (+28%) led the way, boosted by strong earnings growth from several major index constituents. Consumer discretionary rose roughly 24%, driven by retailers (+49%). Energy (+20%) gained alongside higher oil prices. Laggards were telecommunication services (-2%), consumer staples (0%) and utilities (+3%), defensive groups that struggled amid rising interest rates and a general preference for risk. Real estate (+5%) fared a bit better but still lagged, as did financials, industrials, health care (each up 13%) and materials (+11%).
Comments from Portfolio Manager Matthew Fruhan: For the fiscal year, the fund's share classes gained roughly 14%, lagging the benchmark S&P 500
®. The fund's underperformance of the benchmark was primarily due to security selection, especially within the consumer discretionary, industrials and energy sectors. Underweights in information technology and consumer discretionary, the top sectors in the benchmark this period, also hurt our relative result. Conversely, the biggest contributor versus the benchmark was security selection in financials – especially Bank of America and JPMorgan Chase, both among the fund's top holdings on July 31 – followed by positioning in utilities, telecommunication services, real estate and materials. Within consumer discretionary, lacking exposure to two benchmarks components that performed well – internet retail giant Amazon.com and video-streaming service provider Netflix – hampered our relative result. It also hurt to overweight cable and media giant Comcast. In industrials, it hurt to overweight General Electric, which experienced multiple business challenges. Several notable relative contributors were struggling benchmark components that the fund had little or no exposure to, including telecommunication services company AT&T, which we largely avoided, and social-media giant Facebook, which we did not own at all. In energy, top relative contributors were energy producer ConocoPhillips and Suncor Energy, a non-benchmark stock and one of our largest holdings. In contrast, our position in energy pipeline operators Williams Companies and Kinder Morgan struggled and detracted. Kinder Morgan was not held at period end.
The views expressed above reflect those of the portfolio manager(s) only through the end of the period as stated on the cover of this report and do not necessarily represent the views of Fidelity or any other person in the Fidelity organization. Any such views are subject to change at any time based upon market or other conditions and Fidelity disclaims any responsibility to update such views. These views may not be relied on as investment advice and, because investment decisions for a Fidelity fund are based on numerous factors, may not be relied on as an indication of trading intent on behalf of any Fidelity fund.
Investment Summary (Unaudited)
Top Ten Stocks as of July 31, 2018
| | % of fund's net assets |
| Microsoft Corp.(a) | 4.1 |
| Bank of America Corp. | 3.3 |
| Exxon Mobil Corp. | 3.0 |
| Comcast Corp. Class A | 2.8 |
| JPMorgan Chase & Co. | 2.7 |
| Apple, Inc. | 2.5 |
| Citigroup, Inc.(a) | 2.5 |
| Chevron Corp. | 2.2 |
| Wells Fargo & Co. | 2.2 |
| Suncor Energy, Inc. | 2.0 |
| | 27.3 |
(a) Security or a portion of the security is pledged as collateral for call options written.
Top Five Market Sectors as of July 31, 2018
| | % of fund's net assets |
| Financials | 20.7 |
| Information Technology | 16.2 |
| Energy | 14.2 |
| Health Care | 13.8 |
| Industrials | 11.9 |
Asset Allocation (% of fund's net assets)
| As of July 31, 2018*,** |
| | Stocks | 98.8% |
| | Convertible Securities | 0.5% |
| | Other Investments | 0.1% |
| | Short-Term Investments and Net Other Assets (Liabilities) | 0.6% |

* Foreign investments - 13.7%
** Written options - (0.0%)
Percentages shown as 0.0% may reflect amounts less than 0.05%.
Schedule of Investments July 31, 2018
Showing Percentage of Net Assets
| Common Stocks - 98.8% | | | |
| | | Shares | Value (000s) |
| CONSUMER DISCRETIONARY - 8.5% | | | |
| Automobiles - 0.1% | | | |
| General Motors Co. | | 73,000 | $2,767 |
| Hotels, Restaurants & Leisure - 0.6% | | | |
| Cedar Fair LP (depositary unit) | | 48,500 | 2,771 |
| Dine Brands Global, Inc. | | 118,989 | 8,452 |
| Dunkin' Brands Group, Inc. (a) | | 405,000 | 28,200 |
| Starbucks Corp. | | 27,400 | 1,435 |
| | | | 40,858 |
| Media - 4.9% | | | |
| Comcast Corp. Class A | | 5,449,700 | 194,990 |
| Interpublic Group of Companies, Inc. | | 1,656,000 | 37,343 |
| Omnicom Group, Inc. | | 182,400 | 12,555 |
| The Walt Disney Co. | | 756,600 | 85,919 |
| Viacom, Inc. Class B (non-vtg.) | | 169,300 | 4,918 |
| | | | 335,725 |
| Multiline Retail - 0.3% | | | |
| Target Corp. | | 263,475 | 21,257 |
| Specialty Retail - 2.6% | | | |
| L Brands, Inc. | | 739,700 | 23,426 |
| Lowe's Companies, Inc. | | 789,179 | 78,397 |
| Ross Stores, Inc. | | 295,300 | 25,818 |
| TJX Companies, Inc. (a) | | 540,400 | 52,559 |
| | | | 180,200 |
|
| TOTAL CONSUMER DISCRETIONARY | | | 580,807 |
|
| CONSUMER STAPLES - 7.7% | | | |
| Beverages - 1.3% | | | |
| The Coca-Cola Co. | | 1,953,803 | 91,106 |
| Food & Staples Retailing - 1.4% | | | |
| Walgreens Boots Alliance, Inc. | | 82,400 | 5,572 |
| Walmart, Inc. | | 964,100 | 86,027 |
| | | | 91,599 |
| Food Products - 0.3% | | | |
| The Hershey Co. | | 218,600 | 21,469 |
| Household Products - 1.7% | | | |
| Kimberly-Clark Corp. | | 197,000 | 22,430 |
| Procter & Gamble Co. | | 1,005,315 | 81,310 |
| Spectrum Brands Holdings, Inc. | | 117,600 | 10,275 |
| | | | 114,015 |
| Tobacco - 3.0% | | | |
| Altria Group, Inc. | | 2,378,200 | 139,553 |
| British American Tobacco PLC sponsored ADR | | 1,242,100 | 68,042 |
| | | | 207,595 |
|
| TOTAL CONSUMER STAPLES | | | 525,784 |
|
| ENERGY - 14.1% | | | |
| Energy Equipment & Services - 1.4% | | | |
| Baker Hughes, a GE Co. Class A | | 1,064,400 | 36,807 |
| Nabors Industries Ltd. | | 722,900 | 4,323 |
| National Oilwell Varco, Inc. | | 521,200 | 25,341 |
| Oceaneering International, Inc. | | 776,800 | 21,253 |
| Schlumberger Ltd. | | 71,700 | 4,841 |
| | | | 92,565 |
| Oil, Gas & Consumable Fuels - 12.7% | | | |
| Anadarko Petroleum Corp. | | 188,400 | 13,781 |
| BP PLC sponsored ADR | | 1,517,198 | 68,410 |
| Cabot Oil & Gas Corp. | | 1,056,100 | 24,818 |
| Cenovus Energy, Inc. | | 8,220,400 | 82,466 |
| Cenovus Energy, Inc. | | 37,200 | 373 |
| Chevron Corp. | | 1,201,196 | 151,675 |
| ConocoPhillips Co. | | 362,400 | 26,154 |
| Enterprise Products Partners LP | | 377,500 | 10,948 |
| Equinor ASA sponsored ADR (b) | | 965,500 | 25,547 |
| Exxon Mobil Corp. | | 2,499,600 | 203,742 |
| Golar LNG Ltd. | | 642,900 | 16,722 |
| Imperial Oil Ltd. | | 868,100 | 29,730 |
| Legacy Reserves LP (c) | | 986,168 | 5,089 |
| Suncor Energy, Inc. | | 3,322,350 | 139,907 |
| Teekay LNG Partners LP | | 477,300 | 7,637 |
| The Williams Companies, Inc. | | 1,453,430 | 43,240 |
| Williams Partners LP | | 538,605 | 24,253 |
| | | | 874,492 |
|
| TOTAL ENERGY | | | 967,057 |
|
| FINANCIALS - 20.7% | | | |
| Banks - 13.8% | | | |
| Bank of America Corp. | | 7,368,056 | 227,526 |
| BNP Paribas SA | | 36,900 | 2,402 |
| Citigroup, Inc. (a) | | 2,378,030 | 170,957 |
| First Hawaiian, Inc. | | 241,600 | 6,828 |
| JPMorgan Chase & Co. | | 1,610,192 | 185,092 |
| M&T Bank Corp. | | 3,700 | 641 |
| PNC Financial Services Group, Inc. | | 405,854 | 58,780 |
| SunTrust Banks, Inc. (a) | | 1,085,066 | 78,201 |
| U.S. Bancorp | | 1,219,873 | 64,665 |
| Wells Fargo & Co. | | 2,627,241 | 150,515 |
| | | | 945,607 |
| Capital Markets - 5.7% | | | |
| Apollo Global Management LLC Class A (a) | | 348,900 | 12,386 |
| Brookfield Asset Management, Inc. | | 48,200 | 2,032 |
| Charles Schwab Corp. (a) | | 651,543 | 33,268 |
| KKR & Co. LP | | 1,919,943 | 52,568 |
| Morgan Stanley | | 916,397 | 46,333 |
| Northern Trust Corp. | | 844,164 | 92,200 |
| Oaktree Capital Group LLC Class A | | 335,300 | 14,233 |
| S&P Global, Inc. | | 143,700 | 28,803 |
| State Street Corp. | | 1,247,227 | 110,143 |
| The Blackstone Group LP | | 75,100 | 2,622 |
| | | | 394,588 |
| Insurance - 1.0% | | | |
| Chubb Ltd. | | 71,700 | 10,018 |
| Marsh & McLennan Companies, Inc. | | 272,707 | 22,733 |
| MetLife, Inc. | | 648,000 | 29,640 |
| The Travelers Companies, Inc. | | 49,000 | 6,377 |
| | | | 68,768 |
| Thrifts & Mortgage Finance - 0.2% | | | |
| Radian Group, Inc. | | 864,968 | 16,564 |
|
| TOTAL FINANCIALS | | | 1,425,527 |
|
| HEALTH CARE - 13.5% | | | |
| Biotechnology - 1.8% | | | |
| Alexion Pharmaceuticals, Inc. (c) | | 357,600 | 47,546 |
| Amgen, Inc. | | 309,612 | 60,854 |
| Intercept Pharmaceuticals, Inc. (b)(c) | | 168,426 | 15,350 |
| | | | 123,750 |
| Health Care Equipment & Supplies - 0.9% | | | |
| Becton, Dickinson & Co. | | 17,800 | 4,457 |
| Boston Scientific Corp. (c) | | 333,300 | 11,202 |
| Danaher Corp. | | 239,000 | 24,517 |
| Fisher & Paykel Healthcare Corp. | | 334,280 | 3,372 |
| ResMed, Inc. | | 52,400 | 5,543 |
| Steris PLC | | 54,400 | 6,227 |
| Zimmer Biomet Holdings, Inc. | | 53,010 | 6,654 |
| | | | 61,972 |
| Health Care Providers & Services - 5.5% | | | |
| AmerisourceBergen Corp. | | 472,600 | 38,673 |
| Anthem, Inc. | | 161,600 | 40,885 |
| Cardinal Health, Inc. | | 841,200 | 42,018 |
| Cigna Corp. | | 199,600 | 35,812 |
| CVS Health Corp. | | 1,564,604 | 101,480 |
| Fresenius Medical Care AG & Co. KGaA sponsored ADR | | 174,500 | 8,484 |
| HCA Holdings, Inc. | | 25,400 | 3,155 |
| Humana, Inc. | | 50,100 | 15,740 |
| McKesson Corp. | | 328,287 | 41,233 |
| Patterson Companies, Inc. | | 755,070 | 18,514 |
| UnitedHealth Group, Inc. | | 127,400 | 32,260 |
| | | | 378,254 |
| Pharmaceuticals - 5.3% | | | |
| Allergan PLC | | 86,100 | 15,850 |
| AstraZeneca PLC sponsored ADR | | 710,100 | 27,786 |
| Bayer AG | | 369,786 | 41,167 |
| Eli Lilly & Co. | | 105,600 | 10,434 |
| GlaxoSmithKline PLC sponsored ADR | | 2,680,022 | 111,462 |
| Johnson & Johnson | | 750,469 | 99,452 |
| Novartis AG sponsored ADR | | 58,944 | 4,945 |
| Perrigo Co. PLC | | 61,300 | 4,936 |
| Sanofi SA | | 253,613 | 22,063 |
| Teva Pharmaceutical Industries Ltd. sponsored ADR | | 1,148,720 | 27,500 |
| | | | 365,595 |
|
| TOTAL HEALTH CARE | | | 929,571 |
|
| INDUSTRIALS - 11.8% | | | |
| Aerospace & Defense - 2.3% | | | |
| General Dynamics Corp. | | 149,700 | 29,904 |
| Meggitt PLC | | 216,680 | 1,622 |
| Rolls-Royce Holdings PLC | | 1,176,600 | 15,298 |
| United Technologies Corp. | | 809,082 | 109,825 |
| | | | 156,649 |
| Air Freight & Logistics - 1.8% | | | |
| C.H. Robinson Worldwide, Inc. | | 245,600 | 22,652 |
| Expeditors International of Washington, Inc. | | 74,100 | 5,644 |
| United Parcel Service, Inc. Class B | | 790,804 | 94,809 |
| | | | 123,105 |
| Commercial Services & Supplies - 0.2% | | | |
| Healthcare Services Group, Inc. (b) | | 247,200 | 9,952 |
| Ritchie Brothers Auctioneers, Inc. | | 101,300 | 3,370 |
| | | | 13,322 |
| Electrical Equipment - 0.8% | | | |
| Acuity Brands, Inc. | | 209,700 | 29,155 |
| Hubbell, Inc. Class B | | 179,839 | 22,165 |
| Rockwell Automation, Inc. | | 22,100 | 4,145 |
| | | | 55,465 |
| Industrial Conglomerates - 1.8% | | | |
| 3M Co. | | 20,200 | 4,289 |
| General Electric Co. | | 8,615,027 | 117,423 |
| | | | 121,712 |
| Machinery - 1.1% | | | |
| Donaldson Co., Inc. | | 172,700 | 8,238 |
| Flowserve Corp. | | 866,000 | 38,390 |
| PACCAR, Inc. | | 19,500 | 1,282 |
| Snap-On, Inc. | | 20,400 | 3,460 |
| Wabtec Corp. (b) | | 238,600 | 26,322 |
| | | | 77,692 |
| Professional Services - 0.2% | | | |
| Nielsen Holdings PLC | | 602,800 | 14,202 |
| Road & Rail - 2.6% | | | |
| CSX Corp. (a) | | 428,920 | 30,316 |
| J.B. Hunt Transport Services, Inc. | | 344,040 | 41,250 |
| Norfolk Southern Corp. | | 231,399 | 39,106 |
| Union Pacific Corp. | | 464,200 | 69,579 |
| | | | 180,251 |
| Trading Companies & Distributors - 1.0% | | | |
| Bunzl PLC | | 149,953 | 4,458 |
| Fastenal Co. | | 442,500 | 25,192 |
| Howden Joinery Group PLC | | 228,700 | 1,432 |
| MSC Industrial Direct Co., Inc. Class A | | 99,700 | 8,438 |
| Watsco, Inc. | | 170,192 | 29,360 |
| | | | 68,880 |
|
| TOTAL INDUSTRIALS | | | 811,278 |
|
| INFORMATION TECHNOLOGY - 16.2% | | | |
| Communications Equipment - 1.1% | | | |
| Cisco Systems, Inc. | | 1,842,552 | 77,922 |
| Electronic Equipment & Components - 0.2% | | | |
| Avnet, Inc. | | 122,500 | 5,372 |
| Philips Lighting NV (d) | | 145,900 | 4,047 |
| | | | 9,419 |
| Internet Software & Services - 1.1% | | | |
| Alphabet, Inc.: | | | |
| Class A (c) | | 30,307 | 37,193 |
| Class C (c) | | 29,036 | 35,344 |
| LogMeIn, Inc. | | 22,800 | 1,848 |
| | | | 74,385 |
| IT Services - 3.1% | | | |
| Accenture PLC Class A | | 68,800 | 10,962 |
| IBM Corp. | | 101,800 | 14,754 |
| MasterCard, Inc. Class A | | 87,000 | 17,226 |
| Paychex, Inc. | | 803,652 | 55,468 |
| Unisys Corp. (b)(c) | | 1,267,018 | 16,281 |
| Visa, Inc. Class A (a) | | 723,684 | 98,957 |
| | | | 213,648 |
| Semiconductors & Semiconductor Equipment - 2.1% | | | |
| Analog Devices, Inc. | | 68,800 | 6,614 |
| Applied Materials, Inc. | | 244,700 | 11,900 |
| NXP Semiconductors NV (c) | | 36,100 | 3,442 |
| Qualcomm, Inc. | | 1,906,146 | 122,165 |
| United Microelectronics Corp. sponsored ADR | | 62,150 | 174 |
| | | | 144,295 |
| Software - 6.1% | | | |
| Micro Focus International PLC | | 916,962 | 14,962 |
| Microsoft Corp. (a) | | 2,674,399 | 283,706 |
| Oracle Corp. | | 1,653,953 | 78,860 |
| SAP SE sponsored ADR (b) | | 334,800 | 38,850 |
| | | | 416,378 |
| Technology Hardware, Storage & Peripherals - 2.5% | | | |
| Apple, Inc. | | 913,794 | 173,886 |
|
| TOTAL INFORMATION TECHNOLOGY | | | 1,109,933 |
|
| MATERIALS - 1.8% | | | |
| Chemicals - 1.5% | | | |
| CF Industries Holdings, Inc. | | 403,900 | 17,941 |
| DowDuPont, Inc. | | 79,900 | 5,495 |
| LyondellBasell Industries NV Class A (a) | | 276,700 | 30,656 |
| Nutrien Ltd. | | 727,880 | 39,532 |
| The Scotts Miracle-Gro Co. Class A | | 134,500 | 10,683 |
| | | | 104,307 |
| Metals & Mining - 0.3% | | | |
| BHP Billiton Ltd. sponsored ADR (b) | | 411,100 | 21,484 |
|
| TOTAL MATERIALS | | | 125,791 |
|
| REAL ESTATE - 1.5% | | | |
| Equity Real Estate Investment Trusts (REITs) - 1.5% | | | |
| American Tower Corp. | | 153,900 | 22,814 |
| CoreSite Realty Corp. | | 159,700 | 17,902 |
| Equinix, Inc. | | 62,500 | 27,455 |
| Omega Healthcare Investors, Inc. | | 138,500 | 4,112 |
| Public Storage | | 89,000 | 19,387 |
| Sabra Health Care REIT, Inc. | | 257,800 | 5,571 |
| Spirit MTA REIT (c) | | 91,630 | 915 |
| Spirit Realty Capital, Inc. | | 916,300 | 7,669 |
| | | | 105,825 |
| TELECOMMUNICATION SERVICES - 1.5% | | | |
| Diversified Telecommunication Services - 1.5% | | | |
| AT&T, Inc. | | 360,715 | 11,532 |
| Verizon Communications, Inc. | | 1,804,574 | 93,188 |
| | | | 104,720 |
| UTILITIES - 1.5% | | | |
| Electric Utilities - 1.3% | | | |
| Exelon Corp. | | 1,439,200 | 61,166 |
| PPL Corp. | | 686,800 | 19,759 |
| Southern Co. | | 221,400 | 10,760 |
| | | | 91,685 |
| Multi-Utilities - 0.2% | | | |
| Sempra Energy | | 85,300 | 9,860 |
|
| TOTAL UTILITIES | | | 101,545 |
|
| TOTAL COMMON STOCKS | | | |
| (Cost $5,925,137) | | | 6,787,838 |
|
| Preferred Stocks - 0.4% | | | |
| Convertible Preferred Stocks - 0.4% | | | |
| HEALTH CARE - 0.2% | | | |
| Health Care Equipment & Supplies - 0.2% | | | |
| Becton, Dickinson & Co. Series A, 6.125% | | 210,900 | 13,310 |
| INDUSTRIALS - 0.1% | | | |
| Commercial Services & Supplies - 0.1% | | | |
| Stericycle, Inc. 2.25% | | 117,279 | 6,131 |
| UTILITIES - 0.1% | | | |
| Electric Utilities - 0.1% | | | |
| Vistra Energy Corp. 7.00% | | 66,200 | 6,088 |
|
| TOTAL CONVERTIBLE PREFERRED STOCKS | | | 25,529 |
|
| Nonconvertible Preferred Stocks - 0.0% | | | |
| INDUSTRIALS - 0.0% | | | |
| Aerospace & Defense - 0.0% | | | |
| Rolls-Royce Holdings PLC (C Shares) | | 411,700,180 | 540 |
| TOTAL PREFERRED STOCKS | | | |
| (Cost $26,857) | | | 26,069 |
| | | Principal Amount (000s) | Value (000s) |
|
| Convertible Bonds - 0.1% | | | |
| HEALTH CARE - 0.1% | | | |
| Pharmaceuticals - 0.1% | | | |
| Bayer Capital Corp. BV 5.625% 11/22/19(d) | | | |
| (Cost $7,157) | | EUR 6,700 | 8,325 |
| | | Shares | Value (000s) |
|
| Other - 0.1% | | | |
| ENERGY - 0.1% | | | |
| Oil, Gas & Consumable - 0.1% | | | |
| Utica Shale Drilling Program (non-operating revenue interest) (e)(f)(g) | | | |
| (Cost $18,052) | | 18,052,449 | 9,510 |
|
| Money Market Funds - 1.2% | | | |
| Fidelity Cash Central Fund, 1.96% (h) | | 28,284,925 | 28,291 |
| Fidelity Securities Lending Cash Central Fund 1.97% (h)(i) | | 50,080,325 | 50,085 |
| TOTAL MONEY MARKET FUNDS | | | |
| (Cost $78,381) | | | 78,376 |
| TOTAL INVESTMENT IN SECURITIES - 100.6% | | | |
| (Cost $6,055,584) | | | 6,910,118 |
| NET OTHER ASSETS (LIABILITIES) - (0.6)% | | | (38,621) |
| NET ASSETS - 100% | | | $6,871,497 |
| Written Options | | | | | | |
| | Counterparty | Number of Contracts | Notional Amount (000s) | Exercise Price | Expiration Date | Value (000s) |
| Call Options | | | | | | |
| Apollo Global Management LLC Class A | Chicago Board Options Exchange | 908 | $3,223 | $39.00 | 9/21/18 | $(14) |
| Charles Schwab Corp. | Chicago Board Options Exchange | 1,287 | 6,571 | 60.00 | 9/21/18 | (6) |
| Citigroup, Inc. | Chicago Board Options Exchange | 2,378 | 17,095 | 72.50 | 10/19/18 | (568) |
| CSX Corp. | Chicago Board Options Exchange | 4,278 | 30,237 | 70.00 | 8/17/18 | (691) |
| Dunkin Brands Group, Inc. | Chicago Board Options Exchange | 992 | 6,907 | 75.00 | 8/17/18 | (7) |
| KKR & Co. LP | Bank of America NA | 1,899 | 5,199 | 28.00 | 9/21/18 | (115) |
| KKR & Co. LP | Bank of America NA | 1,899 | 5,199 | 29.00 | 9/21/18 | (58) |
| LyondellBasell Industries NV Class A | Chicago Board Options Exchange | 566 | 6,271 | 115.00 | 8/17/18 | (61) |
| Microsoft Corp. | Chicago Board Options Exchange | 2,667 | 28,292 | 115.00 | 10/19/18 | (332) |
| Paychex, Inc. | Bank of America NA | 1,507 | 10,401 | 72.50 | 9/21/18 | (88) |
| S&P Global, Inc. | Bank of America NA | 715 | 14,331 | 210.00 | 8/17/18 | (25) |
| SunTrust Banks, Inc. | Chicago Board Options Exchange | 1,076 | 7,755 | 75.00 | 10/19/18 | (150) |
| SunTrust Banks, Inc. | Chicago Board Options Exchange | 1,076 | 7,755 | 77.50 | 10/19/18 | (76) |
| TJX Companies, Inc. | Chicago Board Options Exchange | 1,911 | 18,586 | 97.50 | 10/19/18 | (688) |
| Visa, Inc. Class A | Chicago Board Options Exchange | 704 | 9,626 | 145.00 | 10/19/18 | (136) |
| Visa, Inc. Class A | Chicago Board Options Exchange | 704 | 9,626 | 150.00 | 10/19/18 | (64) |
| TOTAL WRITTEN OPTIONS | | | | | | $(3,079) |
Currency Abbreviations
EUR – European Monetary Unit
Legend
(a) Security or a portion of the security is pledged as collateral for call options written. At period end, the value of securities pledged amounted to $151,946,000.
(b) Security or a portion of the security is on loan at period end.
(c) Non-income producing
(d) Security exempt from registration under Rule 144A of the Securities Act of 1933. These securities may be resold in transactions exempt from registration, normally to qualified institutional buyers. At the end of the period, the value of these securities amounted to $12,372,000 or 0.2% of net assets.
(e) Investment is owned by a wholly-owned subsidiary (Subsidiary) that is treated as a corporation for U.S. tax purposes.
(f) Restricted securities - Investment in securities not registered under the Securities Act of 1933 (excluding 144A issues). At the end of the period, the value of restricted securities (excluding 144A issues) amounted to $9,510,000 or 0.1% of net assets.
(g) Level 3 security
(h) Affiliated fund that is generally available only to investment companies and other accounts managed by Fidelity Investments. The rate quoted is the annualized seven-day yield of the fund at period end. A complete unaudited listing of the fund's holdings as of its most recent quarter end is available upon request. In addition, each Fidelity Central Fund's financial statements, which are not covered by the Fund's Report of Independent Registered Public Accounting Firm, are available on the SEC's website or upon request.
(i) Investment made with cash collateral received from securities on loan.
Additional information on each restricted holding is as follows:
| Security | Acquisition Date | Acquisition Cost (000s) |
| Utica Shale Drilling Program (non-operating revenue interest) | 10/5/16 - 9/1/17 | $18,052 |
Affiliated Central Funds
Information regarding fiscal year to date income earned by the Fund from investments in Fidelity Central Funds is as follows:
| Fund | Income earned |
| | (Amounts in thousands) |
| Fidelity Cash Central Fund | $808 |
| Fidelity Securities Lending Cash Central Fund | 545 |
| Total | $1,353 |
Amounts in the income column in the above table include any capital gain distributions from underlying funds, which are presented in the corresponding line-item in the Statement of Operations if applicable.
Investment Valuation
The following is a summary of the inputs used, as of July 31, 2018, involving the Fund's assets and liabilities carried at fair value. The inputs or methodology used for valuing securities may not be an indication of the risk associated with investing in those securities. For more information on valuation inputs, and their aggregation into the levels used below, please refer to the Investment Valuation section in the accompanying Notes to Financial Statements.
| | Valuation Inputs at Reporting Date: |
| Description | Total | Level 1 | Level 2 | Level 3 |
| (Amounts in thousands) | | | | |
| Investments in Securities: | | | | |
| Equities: | | | | |
| Consumer Discretionary | $580,807 | $580,807 | $-- | $-- |
| Consumer Staples | 525,784 | 525,784 | -- | -- |
| Energy | 967,057 | 967,057 | -- | -- |
| Financials | 1,425,527 | 1,425,527 | -- | -- |
| Health Care | 942,881 | 866,341 | 76,540 | -- |
| Industrials | 817,949 | 796,520 | 21,429 | -- |
| Information Technology | 1,109,933 | 1,094,971 | 14,962 | -- |
| Materials | 125,791 | 125,791 | -- | -- |
| Real Estate | 105,825 | 105,825 | -- | -- |
| Telecommunication Services | 104,720 | 104,720 | -- | -- |
| Utilities | 107,633 | 101,545 | 6,088 | -- |
| Corporate Bonds | 8,325 | -- | 8,325 | -- |
| Other | 9,510 | -- | -- | 9,510 |
| Money Market Funds | 78,376 | 78,376 | -- | -- |
| Total Investments in Securities: | $6,910,118 | $6,773,264 | $127,344 | $9,510 |
| Derivative Instruments: | | | | |
| Liabilities | | | | |
| Written Options | $(3,079) | $(2,793) | $(286) | $-- |
| Total Liabilities | $(3,079) | $(2,793) | $(286) | $-- |
| Total Derivative Instruments: | $(3,079) | $(2,793) | $(286) | $-- |
Value of Derivative Instruments
The following table is a summary of the Fund's value of derivative instruments by primary risk exposure as of July 31, 2018. For additional information on derivative instruments, please refer to the Derivative Instruments section in the accompanying Notes to Financial Statements.
| Primary Risk Exposure / Derivative Type | Value |
| | Asset | Liability |
| (Amounts in thousands) | | |
| Equity Risk | | |
| Written Options(a) | $0 | $(3,079) |
| Total Equity Risk | 0 | (3,079) |
| Total Value of Derivatives | $0 | $(3,079) |
(a) Gross value is presented in the Statement of Assets and Liabilities in the written options, at value line-item.
Other Information
Distribution of investments by country or territory of incorporation, as a percentage of Total Net Assets, is as follows (Unaudited):
| United States of America | 86.3% |
| United Kingdom | 4.8% |
| Canada | 4.3% |
| Germany | 1.3% |
| Others (Individually Less Than 1%) | 3.3% |
| | 100.0% |
See accompanying notes which are an integral part of the financial statements.
Financial Statements
Statement of Assets and Liabilities
| Amounts in thousands (except per-share amounts) | | July 31, 2018 |
| Assets | | |
Investment in securities, at value (including securities loaned of $49,790) — See accompanying schedule:
Unaffiliated issuers (cost $5,977,203) | $6,831,742 | |
| Fidelity Central Funds (cost $78,381) | 78,376 | |
| Total Investment in Securities (cost $6,055,584) | | $6,910,118 |
| Restricted cash | | 367 |
| Receivable for investments sold | | 18,741 |
| Receivable for fund shares sold | | 1,016 |
| Dividends receivable | | 6,655 |
| Interest receivable | | 37 |
| Distributions receivable from Fidelity Central Funds | | 102 |
| Prepaid expenses | | 17 |
| Other receivables | | 955 |
| Total assets | | 6,938,008 |
| Liabilities | | |
| Payable for investments purchased | $5,768 | |
| Payable for fund shares redeemed | 3,252 | |
| Accrued management fee | 2,481 | |
| Written options, at value (premium received $3,221) | 3,079 | |
| Other affiliated payables | 888 | |
| Other payables and accrued expenses | 954 | |
| Collateral on securities loaned | 50,089 | |
| Total liabilities | | 66,511 |
| Net Assets | | $6,871,497 |
| Net Assets consist of: | | |
| Paid in capital | | $6,001,077 |
| Distributions in excess of net investment income | | (8,807) |
| Accumulated undistributed net realized gain (loss) on investments and foreign currency transactions | | 24,567 |
| Net unrealized appreciation (depreciation) on investments and assets and liabilities in foreign currencies | | 854,660 |
| Net Assets | | $6,871,497 |
| Growth and Income: | | |
| Net Asset Value, offering price and redemption price per share ($6,280,296 ÷ 159,628 shares) | | $39.34 |
| Class K: | | |
| Net Asset Value, offering price and redemption price per share ($591,201 ÷ 15,040 shares) | | $39.31 |
See accompanying notes which are an integral part of the financial statements.
Statement of Operations
| Amounts in thousands | | Year ended July 31, 2018 |
| Investment Income | | |
| Dividends | | $165,798 |
| Interest | | 449 |
| Income from Fidelity Central Funds | | 1,353 |
| Total income | | 167,600 |
| Expenses | | |
| Management fee | $31,251 | |
| Transfer agent fees | 9,855 | |
| Accounting and security lending fees | 1,183 | |
| Custodian fees and expenses | 136 | |
| Independent trustees' fees and expenses | 31 | |
| Registration fees | 67 | |
| Audit | 98 | |
| Legal | 18 | |
| Interest | 13 | |
| Miscellaneous | 54 | |
| Total expenses before reductions | 42,706 | |
| Expense reductions | (373) | |
| Total expenses after reductions | | 42,333 |
| Net investment income (loss) | | 125,267 |
| Realized and Unrealized Gain (Loss) | | |
| Net realized gain (loss) on: | | |
| Investment securities: | | |
| Unaffiliated issuers | 950,168 | |
| Fidelity Central Funds | (1) | |
| Foreign currency transactions | (64) | |
| Written options | 10,940 | |
| Total net realized gain (loss) | | 961,043 |
| Change in net unrealized appreciation (depreciation) on: | | |
| Investment securities: | | |
| Unaffiliated issuers | (184,761) | |
| Fidelity Central Funds | (3) | |
| Assets and liabilities in foreign currencies | 7 | |
| Written options | 2,554 | |
| Total change in net unrealized appreciation (depreciation) | | (182,203) |
| Net gain (loss) | | 778,840 |
| Net increase (decrease) in net assets resulting from operations | | $904,107 |
See accompanying notes which are an integral part of the financial statements.
Statement of Changes in Net Assets
| Amounts in thousands | Year ended July 31, 2018 | Year ended July 31, 2017 |
| Increase (Decrease) in Net Assets | | |
| Operations | | |
| Net investment income (loss) | $125,267 | $128,606 |
| Net realized gain (loss) | 961,043 | 555,075 |
| Change in net unrealized appreciation (depreciation) | (182,203) | 424,780 |
| Net increase (decrease) in net assets resulting from operations | 904,107 | 1,108,461 |
| Distributions to shareholders from net investment income | (140,988) | (97,619) |
| Share transactions - net increase (decrease) | (1,137,673) | (57,861) |
| Total increase (decrease) in net assets | (374,554) | 952,981 |
| Net Assets | | |
| Beginning of period | 7,246,051 | 6,293,070 |
| End of period | $6,871,497 | $7,246,051 |
| Other Information | | |
| Undistributed net investment income end of period | $– | $12,195 |
| Distributions in excess of net investment income end of period | $(8,807) | $– |
See accompanying notes which are an integral part of the financial statements.
Financial Highlights
Fidelity Growth & Income Portfolio
| Years ended July 31, | 2018 | 2017 | 2016 | 2015 | 2014 |
| Selected Per–Share Data | | | | | |
| Net asset value, beginning of period | $35.31 | $30.48 | $30.85 | $29.02 | $25.66 |
| Income from Investment Operations | | | | | |
| Net investment income (loss)A | .65 | .61 | .59 | .55 | .51 |
| Net realized and unrealized gain (loss) | 4.12 | 4.68 | (.37) | 1.82B | 3.35 |
| Total from investment operations | 4.77 | 5.29 | .22 | 2.37 | 3.86 |
| Distributions from net investment income | (.74) | (.46) | (.58) | (.54) | (.50) |
| Distributions from net realized gain | – | – | (.01) | – | (.01) |
| Total distributions | (.74) | (.46) | (.59) | (.54) | (.50)C |
| Net asset value, end of period | $39.34 | $35.31 | $30.48 | $30.85 | $29.02 |
| Total ReturnD | 13.66% | 17.48% | .88% | 8.23%B | 15.16% |
| Ratios to Average Net AssetsE,F | | | | | |
| Expenses before reductions | .61% | .63% | .64% | .64% | .65% |
| Expenses net of fee waivers, if any | .61% | .63% | .64% | .63% | .65% |
| Expenses net of all reductions | .61% | .63% | .64% | .63% | .65% |
| Net investment income (loss) | 1.76% | 1.84% | 2.05% | 1.83% | 1.86% |
| Supplemental Data | | | | | |
| Net assets, end of period (in millions) | $6,280 | $6,356 | $5,529 | $6,563 | $6,550 |
| Portfolio turnover rateG | 38% | 37% | 29% | 35% | 41%H |
A Calculated based on average shares outstanding during the period.
B Net realized and unrealized gain (loss) per share reflects proceeds received from litigation which amounted to $.06 per share. Excluding these litigation proceeds, the total return would have been 8.03%
C Total distributions of $.50 per share is comprised of distributions from net investment income of $.495 and distributions from net realized gain of $.006 per share.
D Total returns would have been lower if certain expenses had not been reduced during the applicable periods shown.
E Fees and expenses of any underlying Fidelity Central Funds are not included in the Fund's expense ratio. The Fund indirectly bears its proportionate share of the expenses of any underlying Fidelity Central Funds.
F Expense ratios reflect operating expenses of the class. Expenses before reductions do not reflect amounts reimbursed by the investment adviser or reductions from brokerage service arrangements or reductions from other expense offset arrangements and do not represent the amount paid by the class during periods when reimbursements or reductions occur. Expenses net of fee waivers reflect expenses after reimbursement by the investment adviser but prior to reductions from brokerage service arrangements or other expense offset arrangements. Expenses net of all reductions represent the net expenses paid by the class.
G Amount does not include the portfolio activity of any underlying Fidelity Central Funds.
H Portfolio turnover rate excludes securities received or delivered in-kind.
See accompanying notes which are an integral part of the financial statements.
Fidelity Growth & Income Portfolio Class K
| Years ended July 31, | 2018 | 2017 | 2016 | 2015 | 2014 |
| Selected Per–Share Data | | | | | |
| Net asset value, beginning of period | $35.28 | $30.46 | $30.82 | $29.00 | $25.64 |
| Income from Investment Operations | | | | | |
| Net investment income (loss)A | .69 | .65 | .62 | .59 | .54 |
| Net realized and unrealized gain (loss) | 4.12 | 4.67 | (.35) | 1.81B | 3.36 |
| Total from investment operations | 4.81 | 5.32 | .27 | 2.40 | 3.90 |
| Distributions from net investment income | (.78) | (.50) | (.62) | (.58) | (.53) |
| Distributions from net realized gain | – | – | (.01) | – | (.01) |
| Total distributions | (.78) | (.50) | (.63) | (.58) | (.54) |
| Net asset value, end of period | $39.31 | $35.28 | $30.46 | $30.82 | $29.00 |
| Total ReturnC | 13.79% | 17.60% | 1.04% | 8.34%B | 15.32% |
| Ratios to Average Net AssetsD,E | | | | | |
| Expenses before reductions | .51% | .52% | .52% | .52% | .52% |
| Expenses net of fee waivers, if any | .51% | .52% | .52% | .52% | .52% |
| Expenses net of all reductions | .50% | .52% | .52% | .52% | .52% |
| Net investment income (loss) | 1.86% | 1.95% | 2.17% | 1.95% | 1.99% |
| Supplemental Data | | | | | |
| Net assets, end of period (in millions) | $591 | $890 | $765 | $862 | $960 |
| Portfolio turnover rateF | 38% | 37% | 29% | 35% | 41%G |
A Calculated based on average shares outstanding during the period.
B Net realized and unrealized gain (loss) per share reflects proceeds received from litigation which amounted to $.06 per share. Excluding these litigation proceeds, the total return would have been 8.14%
C Total returns would have been lower if certain expenses had not been reduced during the applicable periods shown.
D Fees and expenses of any underlying Fidelity Central Funds are not included in the Fund's expense ratio. The Fund indirectly bears its proportionate share of the expenses of any underlying Fidelity Central Funds.
E Expense ratios reflect operating expenses of the class. Expenses before reductions do not reflect amounts reimbursed by the investment adviser or reductions from brokerage service arrangements or reductions from other expense offset arrangements and do not represent the amount paid by the class during periods when reimbursements or reductions occur. Expenses net of fee waivers reflect expenses after reimbursement by the investment adviser but prior to reductions from brokerage service arrangements or other expense offset arrangements. Expenses net of all reductions represent the net expenses paid by the class.
F Amount does not include the portfolio activity of any underlying Fidelity Central Funds.
G Portfolio turnover rate excludes securities received or delivered in-kind.
See accompanying notes which are an integral part of the financial statements.
Notes to Financial Statements
For the period ended July 31, 2018
(Amounts in thousands except percentages)
1. Organization.
Fidelity Growth & Income Portfolio (the Fund) is a fund of Fidelity Securities Fund (the Trust) and is authorized to issue an unlimited number of shares. The Trust is registered under the Investment Company Act of 1940, as amended (the 1940 Act), as an open-end management investment company organized as a Massachusetts business trust. The Fund offers Growth & Income and Class K shares, each of which has equal rights as to assets and voting privileges. Each class has exclusive voting rights with respect to matters that affect that class.
2. Investments in Fidelity Central Funds.
The Fund invests in Fidelity Central Funds, which are open-end investment companies generally available only to other investment companies and accounts managed by the investment adviser and its affiliates. The Fund's Schedule of Investments lists each of the Fidelity Central Funds held as of period end, if any, as an investment of the Fund, but does not include the underlying holdings of each Fidelity Central Fund. As an Investing Fund, the Fund indirectly bears its proportionate share of the expenses of the underlying Fidelity Central Funds.
The Money Market Central Funds seek preservation of capital and current income and are managed by Fidelity Investments Money Management, Inc. (FIMM), an affiliate of the investment adviser. Annualized expenses of the Money Market Central Funds as of their most recent shareholder report date are less than .005%.
A complete unaudited list of holdings for each Fidelity Central Fund is available upon request or at the Securities and Exchange Commission (the SEC) website at www.sec.gov. In addition, the financial statements of the Fidelity Central Funds, which are not covered by the Fund's Report of Independent Registered Public Accounting Firm, are available on the SEC website or upon request.
3. Significant Accounting Policies.
The Fund is an investment company and applies the accounting and reporting guidance of the Financial Accounting Standards Board (FASB) Accounting Standards Codification Topic 946 Financial Services – Investments Companies. The financial statements have been prepared in conformity with accounting principles generally accepted in the United States of America (GAAP), which require management to make certain estimates and assumptions at the date of the financial statements. Actual results could differ from those estimates. Subsequent events, if any, through the date that the financial statements were issued have been evaluated in the preparation of the financial statements. The following summarizes the significant accounting policies of the Fund:
Investment Valuation. Investments are valued as of 4:00 p.m. Eastern time on the last calendar day of the period. The Board of Trustees (the Board) has delegated the day to day responsibility for the valuation of the Fund's investments to the Fair Value Committee (the Committee) established by the Fund's investment adviser. In accordance with valuation policies and procedures approved by the Board, the Fund attempts to obtain prices from one or more third party pricing vendors or brokers to value its investments. When current market prices, quotations or currency exchange rates are not readily available or reliable, investments will be fair valued in good faith by the Committee, in accordance with procedures adopted by the Board. Factors used in determining fair value vary by investment type and may include market or investment specific events, changes in interest rates and credit quality. The frequency with which these procedures are used cannot be predicted and they may be utilized to a significant extent. The Committee oversees the Fund's valuation policies and procedures and reports to the Board on the Committee's activities and fair value determinations. The Board monitors the appropriateness of the procedures used in valuing the Fund's investments and ratifies the fair value determinations of the Committee.
The Fund categorizes the inputs to valuation techniques used to value its investments into a disclosure hierarchy consisting of three levels as shown below:
- Level 1 – quoted prices in active markets for identical investments
- Level 2 – other significant observable inputs (including quoted prices for similar investments, interest rates, prepayment speeds, etc.)
- Level 3 – unobservable inputs (including the Fund's own assumptions based on the best information available)
Valuation techniques used to value the Fund's investments by major category are as follows:
Equity securities, including restricted securities, for which market quotations are readily available, are valued at the last reported sale price or official closing price as reported by a third party pricing vendor on the primary market or exchange on which they are traded and are categorized as Level 1 in the hierarchy. In the event there were no sales during the day or closing prices are not available, securities are valued at the last quoted bid price or may be valued using the last available price and are generally categorized as Level 2 in the hierarchy. For foreign equity securities, when market or security specific events arise, comparisons to the valuation of American Depositary Receipts (ADRs), futures contracts, Exchange-Traded Funds (ETFs) and certain indexes as well as quoted prices for similar securities may be used and would be categorized as Level 2 in the hierarchy. Utilizing these techniques may result in transfers between Level 1 and Level 2. For equity securities, including restricted securities, where observable inputs are limited, assumptions about market activity and risk are used and these securities may be categorized as Level 3 in the hierarchy.
Debt securities, including restricted securities, are valued based on evaluated prices received from third party pricing vendors or from brokers who make markets in such securities. Corporate bonds are valued by pricing vendors who utilize matrix pricing which considers yield or price of bonds of comparable quality, coupon, maturity and type or by broker-supplied prices. When independent prices are unavailable or unreliable, debt securities may be valued utilizing pricing methodologies which consider similar factors that would be used by third party pricing vendors. Debt securities are generally categorized as Level 2 in the hierarchy but may be Level 3 depending on the circumstances.
Exchange-traded options are valued using the last sale price or, in the absence of a sale, the last offering price and are categorized as Level 1 in the hierarchy. Options traded over-the-counter are valued using vendor or broker-supplied valuations and are categorized as Level 2 in the hierarchy. Investments in open-end mutual funds, including the Fidelity Central Funds, are valued at their closing net asset value (NAV) each business day and are categorized as Level 1 in the hierarchy.
Changes in valuation techniques may result in transfers in or out of an assigned level within the disclosure hierarchy. The aggregate value of investments by input level as of July 31, 2018 is included at the end of the Fund's Schedule of Investments.
Foreign Currency. The Fund may use foreign currency contracts to facilitate transactions in foreign-denominated securities. Gains and losses from these transactions may arise from changes in the value of the foreign currency or if the counterparties do not perform under the contracts' terms.
Foreign-denominated assets, including investment securities, and liabilities are translated into U.S. dollars at the exchange rates at period end. Purchases and sales of investment securities, income and dividends received and expenses denominated in foreign currencies are translated into U.S. dollars at the exchange rate in effect on the transaction date.
The effects of exchange rate fluctuations on investments are included with the net realized and unrealized gain (loss) on investment securities. Other foreign currency transactions resulting in realized and unrealized gain (loss) are disclosed separately.
Investment Transactions and Income. For financial reporting purposes, the Fund's investment holdings and NAV include trades executed through the end of the last business day of the period. The NAV per share for processing shareholder transactions is calculated as of the close of business of the New York Stock Exchange (NYSE), normally 4:00 p.m. Eastern time and includes trades executed through the end of the prior business day. Gains and losses on securities sold are determined on the basis of identified cost and include proceeds received from litigation. Dividend income is recorded on the ex-dividend date, except for certain dividends from foreign securities where the ex-dividend date may have passed, which are recorded as soon as the Fund is informed of the ex-dividend date. Non-cash dividends included in dividend income, if any, are recorded at the fair market value of the securities received. Income and capital gain distributions from Fidelity Central Funds, if any, are recorded on the ex-dividend date. Certain distributions received by the Fund represent a return of capital or capital gain. The Fund determines the components of these distributions subsequent to the ex-dividend date, based upon receipt of tax filings or other correspondence relating to the underlying investment. These distributions are recorded as a reduction of cost of investments and/or as a realized gain. Interest income is accrued as earned and includes coupon interest and amortization of premium and accretion of discount on debt securities as applicable. Investment income is recorded net of foreign taxes withheld where recovery of such taxes is uncertain.
Class Allocations and Expenses. Investment income, realized and unrealized capital gains and losses, common expenses of the Fund, and certain fund-level expense reductions, if any, are allocated daily on a pro-rata basis to each class based on the relative net assets of each class to the total net assets of the Fund. Each class differs with respect to transfer agent fees incurred. Certain expense reductions may also differ by class. For the reporting period, the allocated portion of income and expenses to each class as a percent of its average net assets may vary due to the timing of recording these transactions in relation to fluctuating net assets of the classes. Expenses directly attributable to a fund are charged to that fund. Expenses attributable to more than one fund are allocated among the respective funds on the basis of relative net assets or other appropriate methods. Expense estimates are accrued in the period to which they relate and adjustments are made when actual amounts are known.
Deferred Trustee Compensation. Under a Deferred Compensation Plan (the Plan), certain independent Trustees have elected to defer receipt of a portion of their annual compensation. Deferred amounts are invested in a cross-section of Fidelity funds, are marked-to-market and remain in the Fund until distributed in accordance with the Plan. The investment of deferred amounts and the offsetting payable to the Trustees of $829 are included in the accompanying Statement of Assets and Liabilities in other receivables and other payables and accrued expenses, respectively.
Income Tax Information and Distributions to Shareholders. Each year, the Fund intends to qualify as a regulated investment company under Subchapter M of the Internal Revenue Code, including distributing substantially all of its taxable income and realized gains. As a result, no provision for U.S. Federal income taxes is required. As of July 31, 2018, the Fund did not have any unrecognized tax benefits in the financial statements; nor is the Fund aware of any tax positions for which it is reasonably possible that the total amounts of unrecognized tax benefits will significantly change in the next twelve months. The Fund files a U.S. federal tax return, in addition to state and local tax returns as required. The Fund's federal income tax returns are subject to examination by the Internal Revenue Service (IRS) for a period of three fiscal years after they are filed. State and local tax returns may be subject to examination for an additional fiscal year depending on the jurisdiction. Foreign taxes are provided for based on the Fund's understanding of the tax rules and rates that exist in the foreign markets in which it invests.
Distributions are declared and recorded on the ex-dividend date. Income and capital gain distributions are declared separately for each class. Income and capital gain distributions are determined in accordance with income tax regulations, which may differ from GAAP. In addition, the Fund claimed a portion of the payment made to redeeming shareholders as a distribution for income tax purposes.
Capital accounts within the financial statements are adjusted for permanent book-tax differences. These adjustments have no impact on net assets or the results of operations. Capital accounts are not adjusted for temporary book-tax differences which will reverse in a subsequent period.
Book-tax differences are primarily due to foreign currency transactions, partnerships, certain conversion ratio adjustments, equity-debt classifications, deferred trustees compensation, capital loss carryforwards, expiring capital loss carryforwards and losses deferred due to wash sales.
As of period end, the cost and unrealized appreciation (depreciation) in securities, and derivatives if applicable, for federal income tax purposes were as follows:
| Gross unrealized appreciation | $1,301,535 |
| Gross unrealized depreciation | (425,090) |
| Net unrealized appreciation (depreciation) | $876,445 |
| Tax Cost | $6,030,594 |
The tax-based components of distributable earnings as of period end were as follows:
| Undistributed ordinary income | $21,703 |
| Net unrealized appreciation (depreciation) on securities and other investments | $849,553 |
The tax character of distributions paid was as follows:
| | July 31, 2018 | July 31, 2017 |
| Ordinary Income | $140,988 | $ 97,619 |
Restricted Securities. The Fund may invest in securities that are subject to legal or contractual restrictions on resale. These securities generally may be resold in transactions exempt from registration or to the public if the securities are registered. Disposal of these securities may involve time-consuming negotiations and expense, and prompt sale at an acceptable price may be difficult. Information regarding restricted securities is included at the end of the Fund's Schedule of Investments.
Consolidated Subsidiary. The Fund invests in certain investments through a wholly-owned subsidiary ("Subsidiary"), which may be subject to federal and state taxes upon disposition.
As of period end, the Fund held an investment of $9,877 in this Subsidiary, representing .14% of the Fund's net assets. The financial statements have been consolidated and include accounts of the Fund and the Subsidiary. Accordingly, all inter-company transactions and balances have been eliminated.
Any cash held by the Subsidiary is restricted as to its use and is presented as Restricted cash in the Statement of Assets and Liabilities.
4. Derivative Instruments.
Risk Exposures and the Use of Derivative Instruments. The Fund's investment objective allows the Fund to enter into various types of derivative contracts, including options. Derivatives are investments whose value is primarily derived from underlying assets, indices or reference rates and may be transacted on an exchange or over-the-counter (OTC). Derivatives may involve a future commitment to buy or sell a specified asset based on specified terms, to exchange future cash flows at periodic intervals based on a notional principal amount, or for one party to make one or more payments upon the occurrence of specified events in exchange for periodic payments from the other party.
The Fund used derivatives to increase returns and to manage exposure to certain risks as defined below. The success of any strategy involving derivatives depends on analysis of numerous economic factors, and if the strategies for investment do not work as intended, the Fund may not achieve its objectives.
The Fund's use of derivatives increased or decreased its exposure to the following risk:
| Equity Risk | Equity risk relates to the fluctuations in the value of financial instruments as a result of changes in market prices (other than those arising from interest rate risk or foreign exchange risk), whether caused by factors specific to an individual investment, its issuer, or all factors affecting all instruments traded in a market or market segment.
|
The Fund is also exposed to additional risks from investing in derivatives, such as liquidity risk and counterparty credit risk. Liquidity risk is the risk that the Fund will be unable to close out the derivative in the open market in a timely manner. Counterparty credit risk is the risk that the counterparty will not be able to fulfill its obligation to the Fund. Derivative counterparty credit risk is managed through formal evaluation of the creditworthiness of all potential counterparties. On certain OTC derivatives such as options, the Fund attempts to reduce its exposure to counterparty credit risk by entering into an International Swaps and Derivatives Association, Inc. (ISDA) Master Agreement with each of its counterparties. The ISDA Master Agreement gives the Fund the right to terminate all transactions traded under such agreement upon the deterioration in the credit quality of the counterparty beyond specified levels. The ISDA Master Agreement gives each party the right, upon an event of default by the other party or a termination of the agreement, to close out all transactions traded under such agreement and to net amounts owed under each transaction to one net payable by one party to the other. To mitigate counterparty credit risk on bi-lateral OTC derivatives, the Fund receives collateral in the form of cash or securities once the Fund's net unrealized appreciation on outstanding derivative contracts under an ISDA Master Agreement exceeds certain applicable thresholds, subject to certain minimum transfer provisions. The collateral received is held in segregated accounts with the Fund's custodian bank in accordance with the collateral agreements entered into between the Fund, the counterparty and the Fund's custodian bank. The Fund could experience delays and costs in gaining access to the collateral even though it is held by the Fund's custodian bank. The Fund's maximum risk of loss from counterparty credit risk related to bi-lateral OTC derivatives is generally the aggregate unrealized appreciation and unpaid counterparty payments in excess of any collateral pledged by the counterparty to the Fund. The Fund may be required to pledge collateral for the benefit of the counterparties on bi-lateral OTC derivatives in an amount not less than each counterparty's unrealized appreciation on outstanding derivative contracts, subject to certain minimum transfer provisions, and any such pledged collateral is identified in the Schedule of Investments. Counterparty credit risk related to exchange-traded options may be mitigated by the protection provided by the exchange on which they trade.
Investing in derivatives may involve greater risks than investing in the underlying assets directly and, to varying degrees, may involve risk of loss in excess of any initial investment and collateral received and amounts recognized in the Statement of Assets and Liabilities. In addition, there may be the risk that the change in value of the derivative contract does not correspond to the change in value of the underlying instrument.
Options. Options give the purchaser the right, but not the obligation, to buy (call) or sell (put) an underlying security or financial instrument at an agreed exercise or strike price between or on certain dates. Options obligate the seller (writer) to buy (put) or sell (call) an underlying instrument at the exercise or strike price or cash settle an underlying derivative instrument if the holder exercises the option on or before the expiration date.
The Fund used exchange-traded and OTC written covered call options to manage its exposure to the market. When the Fund writes a covered call option, the Fund holds the underlying instrument which must be delivered to the holder upon the exercise of the option.
Upon entering into a written options contract, the Fund will receive a premium. Premiums received are reflected as a liability on the Statement of Assets and Liabilities. Options are valued daily and any unrealized appreciation (depreciation) is reflected on the Statement of Assets and Liabilities. When a written option is exercised, the premium is added to the proceeds from the sale of the underlying instrument in determining the gain or loss realized on that investment. When an option is closed the Fund will realize a gain or loss depending on whether the proceeds or amount paid for the closing sale transaction are greater or less than the premium received. When an option expires, gains and losses are realized to the extent of premiums received. The net realized gain (loss) on closed and expired written options and the change in net unrealized appreciation (depreciation) on written options are presented in the Statement of Operations.
Writing call options tends to decrease exposure to the underlying instrument and risk of loss is the change in value in excess of the premium received.
Any open options at period end are presented in the Schedule of Investments under the caption "Written Options" and are representative of volume of activity during the period.
5. Purchases and Sales of Investments.
Purchases and sales of securities, other than short-term securities, aggregated $2,675,808 and $3,837,386, respectively.
6. Fees and Other Transactions with Affiliates.
Management Fee. Fidelity Management & Research Company (the investment adviser) and its affiliates provide the Fund with investment management related services for which the Fund pays a monthly management fee. The management fee is the sum of an individual fund fee rate that is based on an annual rate of .20% of the Fund's average net assets and an annualized group fee rate that averaged .24% during the period. The group fee rate is based upon the average net assets of all the mutual funds advised by the investment adviser, including any mutual funds previously advised by the investment adviser that are currently advised by Fidelity SelectCo, LLC, an affiliate of the investment adviser. The group fee rate decreases as assets under management increase and increases as assets under management decrease. For the reporting period, the total annual management fee rate was .44% of the Fund's average net assets.
Transfer Agent Fees. Fidelity Investments Institutional Operations Company, Inc., (FIIOC), an affiliate of the investment adviser, is the transfer, dividend disbursing and shareholder servicing agent for each class of the Fund. FIIOC receives account fees and asset-based fees that vary according to the account size and type of account of the shareholders of Growth & Income, except for Class K. FIIOC receives an asset-based fee of Class K's average net assets. FIIOC pays for typesetting, printing and mailing of shareholder reports, except proxy statements.
For the period, transfer agent fees for each class were as follows:
| | Amount | % of Class-Level Average Net Assets |
| Growth and Income | $9,493 | .15 |
| Class K | 362 | .05 |
| | $9,855 | |
Accounting and Security Lending Fees. Fidelity Service Company, Inc. (FSC), an affiliate of the investment adviser, maintains the Fund's accounting records. The accounting fee is based on the level of average net assets for each month. Under a separate contract, FSC administers the security lending program. The security lending fee is based on the number and duration of lending transactions. For the period, the fees were equivalent to an annual rate of .02%.
Brokerage Commissions. The Fund placed a portion of its portfolio transactions with brokerage firms which are affiliates of the investment adviser. Brokerage commissions are included in net realized gain (loss) and change in net unrealized appreciation (depreciation) in the Statement of Operations. The commissions paid to these affiliated firms were $57 for the period.
Interfund Lending Program. Pursuant to an Exemptive Order issued by the SEC, the Fund, along with other registered investment companies having management contracts with Fidelity Management & Research Company (FMR) or other affiliated entities of FMR, may participate in an interfund lending program. This program provides an alternative credit facility allowing the funds to borrow from, or lend money to, other participating affiliated funds. At period end, there were no interfund loans outstanding. The Fund's activity in this program during the period for which loans were outstanding was as follows:
| Borrower or Lender | Average Loan Balance | Weighted Average Interest Rate | Interest Expense |
| Borrower | $7,037 | 1.46% | $11 |
Interfund Trades. The Fund may purchase from or sell securities to other Fidelity Funds under procedures adopted by the Board. The procedures have been designed to ensure these interfund trades are executed in accordance with Rule 17a-7 of the 1940 Act. Interfund trades are included within the respective purchases and sales amounts shown in the Purchases and Sales of Investments note.
7. Committed Line of Credit.
The Fund participates with other funds managed by the investment adviser or an affiliate in a $4.25 billion credit facility (the "line of credit") to be utilized for temporary or emergency purposes to fund shareholder redemptions or for other short-term liquidity purposes. The Fund has agreed to pay commitment fees on its pro-rata portion of the line of credit, which amounted to $20 and is reflected in Miscellaneous expenses on the Statement of Operations. During the period, the Fund did not borrow on this line of credit.
8. Security Lending.
The Fund lends portfolio securities through a lending agent from time to time in order to earn additional income. For equity securities, a lending agent is used and may loan securities to certain qualified borrowers, including Fidelity Capital Markets (FCM), a broker-dealer affiliated with the Fund. On the settlement date of the loan, the Fund receives collateral (in the form of U.S. Treasury obligations, letters of credit and/or cash) against the loaned securities and maintains collateral in an amount not less than 100% of the market value of the loaned securities during the period of the loan. The market value of the loaned securities is determined at the close of business of the Fund and any additional required collateral is delivered to the Fund on the next business day. The Fund or borrower may terminate the loan at any time, and if the borrower defaults on its obligation to return the securities loaned because of insolvency or other reasons, the Fund may apply collateral received from the borrower against the obligation. The Fund may experience delays and costs in recovering the securities loaned. Any cash collateral received is invested in the Fidelity Securities Lending Cash Central Fund. The value of loaned securities and cash collateral at period end are disclosed on the Fund's Statement of Assets and Liabilities. At period end, there were no security loans outstanding with FCM. Security lending income represents the income earned on investing cash collateral, less rebates paid to borrowers and any lending agent fees associated with the loan, plus any premium payments received for lending certain types of securities. Security lending income is presented in the Statement of Operations as a component of income from Fidelity Central Funds. Total security lending income during the period amounted to $545, including $16 from securities loaned to FCM.
9. Bank Borrowings.
The Fund is permitted to have bank borrowings for temporary or emergency purposes to fund shareholder redemptions or for other short-term liquidity requirements. The Fund has established borrowing arrangements with certain banks. The interest rate on the borrowings is the bank's base rate, as revised from time to time. The average loan balance during the period for which loans were outstanding amounted to $11,831. The weighted average interest rate was 1.66%. The interest expense amounted to $2 under the bank borrowing program. At period end, there were no bank borrowings outstanding.
10. Expense Reductions.
Commissions paid to certain brokers with whom the investment adviser, or its affiliates, places trades on behalf of the Fund include an amount in addition to trade execution, which may be rebated back to the Fund to offset certain expenses. This amount totaled $299 for the period.
In addition, during the period the investment adviser reimbursed and/or waived a portion of fund-level operating expenses in the amount of $74.
11. Distributions to Shareholders.
Distributions to shareholders of each class were as follows:
| | Year ended
July 31, 2018 | Year ended
July 31, 2017 |
| From net investment income | | |
| Growth and Income | $124,875 | $84,860 |
| Class K | 16,113 | 12,759 |
| Total | $140,988 | $97,619 |
12. Share Transactions.
Share transactions for each class were as follows and may contain automatic conversions between classes or exchanges between affiliated funds:
| | Shares | Shares | Dollars | Dollars |
| | Year ended July 31, 2018 | Year ended July 31, 2017 | Year ended July 31, 2018 | Year ended July 31, 2017 |
| Growth and Income | | | | |
| Shares sold | 5,407 | 18,794 | $201,160 | $607,315 |
| Reinvestment of distributions | 3,205 | 2,473 | 118,260 | 80,649 |
| Shares redeemed | (28,976) | (22,631) | (1,077,783) | (748,252) |
| Net increase (decrease) | (20,364) | (1,364) | $(758,363) | $(60,288) |
| Class K | | | | |
| Shares sold | 2,738 | 7,100 | $101,861 | $234,427 |
| Reinvestment of distributions | 438 | 391 | 16,113 | 12,759 |
| Shares redeemed | (13,364) | (7,363) | (497,284) | (244,759) |
| Net increase (decrease) | (10,188) | 128 | $(379,310) | $2,427 |
13. Other.
The Fund's organizational documents provide former and current trustees and officers with a limited indemnification against liabilities arising in connection with the performance of their duties to the Fund. In the normal course of business, the Fund may also enter into contracts that provide general indemnifications. The Fund's maximum exposure under these arrangements is unknown as this would be dependent on future claims that may be made against the Fund. The risk of material loss from such claims is considered remote.
Report of Independent Registered Public Accounting Firm
To the Board of Trustees of Fidelity Securities Fund and Shareholders of Fidelity Growth & Income Portfolio:
Opinion on the Financial Statements
We have audited the accompanying statement of assets and liabilities, including the schedule of investments, of Fidelity Growth & Income Portfolio (one of the funds constituting Fidelity Securities Fund, referred to hereafter as the "Fund") as of July 31, 2018, the related statement of operations for the year ended July 31, 2018, the statement of changes in net assets for each of the two years in the period ended July 31, 2018, including the related notes, and the financial highlights for each of the five years in the period ended July 31, 2018 (collectively referred to as the “financial statements”). In our opinion, the financial statements present fairly, in all material respects, the financial position of the Fund as of July 31, 2018, the results of its operations for the year then ended, the changes in its net assets for each of the two years in the period ended July 31, 2018 and the financial highlights for each of the five years in the period ended July 31, 2018 in conformity with accounting principles generally accepted in the United States of America.
Basis for Opinion
These financial statements are the responsibility of the Fund’s management. Our responsibility is to express an opinion on the Fund’s financial statements based on our audits. We are a public accounting firm registered with the Public Company Accounting Oversight Board (United States) (“PCAOB”) and are required to be independent with respect to the Fund in accordance with the U.S. federal securities laws and the applicable rules and regulations of the Securities and Exchange Commission and the PCAOB.
We conducted our audits of these financial statements in accordance with the standards of the PCAOB. Those standards require that we plan and perform the audit to obtain reasonable assurance about whether the financial statements are free of material misstatement, whether due to error or fraud.
Our audits included performing procedures to assess the risks of material misstatement of the financial statements, whether due to error or fraud, and performing procedures that respond to those risks. Such procedures included examining, on a test basis, evidence regarding the amounts and disclosures in the financial statements. Our audits also included evaluating the accounting principles used and significant estimates made by management, as well as evaluating the overall presentation of the financial statements. Our procedures included confirmation of securities owned as of July 31, 2018 by correspondence with the custodian and brokers; when replies were not received from brokers, we performed other auditing procedures. We believe that our audits provide a reasonable basis for our opinion.
PricewaterhouseCoopers LLP
Boston, Massachusetts
September 12, 2018
We have served as the auditor of one or more investment companies in the Fidelity group of funds since 1932.
Trustees and Officers
The Trustees, Members of the Advisory Board (if any), and officers of the trust and fund, as applicable, are listed below. The Board of Trustees governs the fund and is responsible for protecting the interests of shareholders. The Trustees are experienced executives who meet periodically throughout the year to oversee the fund's activities, review contractual arrangements with companies that provide services to the fund, oversee management of the risks associated with such activities and contractual arrangements, and review the fund's performance. Except for Jonathan Chiel, each of the Trustees oversees 286 funds. Mr. Chiel oversees 150 funds.
The Trustees hold office without limit in time except that (a) any Trustee may resign; (b) any Trustee may be removed by written instrument, signed by at least two-thirds of the number of Trustees prior to such removal; (c) any Trustee who requests to be retired or who has become incapacitated by illness or injury may be retired by written instrument signed by a majority of the other Trustees; and (d) any Trustee may be removed at any special meeting of shareholders by a two-thirds vote of the outstanding voting securities of the trust. Each Trustee who is not an interested person (as defined in the 1940 Act) of the trust and the fund is referred to herein as an Independent Trustee. Each Independent Trustee shall retire not later than the last day of the calendar year in which his or her 75th birthday occurs. The Independent Trustees may waive this mandatory retirement age policy with respect to individual Trustees. Officers and Advisory Board Members hold office without limit in time, except that any officer or Advisory Board Member may resign or may be removed by a vote of a majority of the Trustees at any regular meeting or any special meeting of the Trustees. Except as indicated, each individual has held the office shown or other offices in the same company for the past five years.
The fund’s Statement of Additional Information (SAI) includes more information about the Trustees. To request a free copy, call Fidelity at 1-800-835-5092.
Experience, Skills, Attributes, and Qualifications of the Trustees. The Governance and Nominating Committee has adopted a statement of policy that describes the experience, qualifications, attributes, and skills that are necessary and desirable for potential Independent Trustee candidates (Statement of Policy). The Board believes that each Trustee satisfied at the time he or she was initially elected or appointed a Trustee, and continues to satisfy, the standards contemplated by the Statement of Policy. The Governance and Nominating Committee also engages professional search firms to help identify potential Independent Trustee candidates who have the experience, qualifications, attributes, and skills consistent with the Statement of Policy. From time to time, additional criteria based on the composition and skills of the current Independent Trustees, as well as experience or skills that may be appropriate in light of future changes to board composition, business conditions, and regulatory or other developments, have also been considered by the professional search firms and the Governance and Nominating Committee. In addition, the Board takes into account the Trustees' commitment and participation in Board and committee meetings, as well as their leadership of standing and ad hoc committees throughout their tenure.
In determining that a particular Trustee was and continues to be qualified to serve as a Trustee, the Board has considered a variety of criteria, none of which, in isolation, was controlling. The Board believes that, collectively, the Trustees have balanced and diverse experience, qualifications, attributes, and skills, which allow the Board to operate effectively in governing the fund and protecting the interests of shareholders. Information about the specific experience, skills, attributes, and qualifications of each Trustee, which in each case led to the Board's conclusion that the Trustee should serve (or continue to serve) as a trustee of the fund, is provided below.
Board Structure and Oversight Function. James C. Curvey is an interested person and currently serves as Chairman. The Trustees have determined that an interested Chairman is appropriate and benefits shareholders because an interested Chairman has a personal and professional stake in the quality and continuity of services provided to the fund. Independent Trustees exercise their informed business judgment to appoint an individual of their choosing to serve as Chairman, regardless of whether the Trustee happens to be independent or a member of management. The Independent Trustees have determined that they can act independently and effectively without having an Independent Trustee serve as Chairman and that a key structural component for assuring that they are in a position to do so is for the Independent Trustees to constitute a substantial majority for the Board. The Independent Trustees also regularly meet in executive session. Ned C. Lautenbach serves as Chairman of the Independent Trustees and as such (i) acts as a liaison between the Independent Trustees and management with respect to matters important to the Independent Trustees and (ii) with management prepares agendas for Board meetings.
Fidelity® funds are overseen by different Boards of Trustees. The fund's Board oversees Fidelity's high income and certain equity funds, and other Boards oversee Fidelity's investment-grade bond, money market, asset allocation, and other equity funds. The asset allocation funds may invest in Fidelity® funds overseen by the fund's Board. The use of separate Boards, each with its own committee structure, allows the Trustees of each group of Fidelity® funds to focus on the unique issues of the funds they oversee, including common research, investment, and operational issues. On occasion, the separate Boards establish joint committees to address issues of overlapping consequences for the Fidelity® funds overseen by each Board.
The Trustees operate using a system of committees to facilitate the timely and efficient consideration of all matters of importance to the Trustees, the fund, and fund shareholders and to facilitate compliance with legal and regulatory requirements and oversight of the fund's activities and associated risks. The Board, acting through its committees, has charged FMR and its affiliates with (i) identifying events or circumstances the occurrence of which could have demonstrably adverse effects on the fund's business and/or reputation; (ii) implementing processes and controls to lessen the possibility that such events or circumstances occur or to mitigate the effects of such events or circumstances if they do occur; and (iii) creating and maintaining a system designed to evaluate continuously business and market conditions in order to facilitate the identification and implementation processes described in (i) and (ii) above. Because the day-to-day operations and activities of the fund are carried out by or through FMR, its affiliates, and other service providers, the fund's exposure to risks is mitigated but not eliminated by the processes overseen by the Trustees. While each of the Board's committees has responsibility for overseeing different aspects of the fund's activities, oversight is exercised primarily through the Operations, Audit, and Compliance Committees. In addition, the Independent Trustees have worked with Fidelity to enhance the Board's oversight of investment and financial risks, legal and regulatory risks, technology risks, and operational risks, including the development of additional risk reporting to the Board. Appropriate personnel, including but not limited to the fund's Chief Compliance Officer (CCO), FMR's internal auditor, the independent accountants, the fund's Treasurer and portfolio management personnel, make periodic reports to the Board's committees, as appropriate, including an annual review of Fidelity's risk management program for the Fidelity® funds. The responsibilities of each standing committee, including their oversight responsibilities, are described further under "Standing Committees of the Trustees."
Interested Trustees*:
Correspondence intended for a Trustee who is an interested person may be sent to Fidelity Investments, 245 Summer Street, Boston, Massachusetts 02210.
Name, Year of Birth; Principal Occupations and Other Relevant Experience+
Jonathan Chiel (1957)
Year of Election or Appointment: 2016
Trustee
Mr. Chiel also serves as Trustee of other Fidelity® funds. Mr. Chiel is Executive Vice President and General Counsel for FMR LLC (diversified financial services company, 2012-present). Previously, Mr. Chiel served as general counsel (2004-2012) and senior vice president and deputy general counsel (2000-2004) for John Hancock Financial Services; a partner with Choate, Hall & Stewart (1996-2000) (law firm); and an Assistant United States Attorney for the United States Attorney’s Office of the District of Massachusetts (1986-95), including Chief of the Criminal Division (1993-1995). Mr. Chiel is a director on the boards of the Boston Bar Foundation and the Maimonides School.
James C. Curvey (1935)
Year of Election or Appointment: 2007
Trustee
Chairman of the Board of Trustees
Mr. Curvey also serves as Trustee of other Fidelity® funds. Mr. Curvey is Vice Chairman (2007-present) and Director of FMR LLC (diversified financial services company). In addition, Mr. Curvey is an Overseer Emeritus for the Boston Symphony Orchestra, a Director of Artis-Naples, and a Trustee of Brewster Academy in Wolfeboro, New Hampshire. Previously, Mr. Curvey served as a Director of Fidelity Research & Analysis Co. (investment adviser firm, 2009-2018), Director of Fidelity Investments Money Management, Inc. (investment adviser firm, 2009-2014) and a Director of FMR and FMR Co., Inc. (investment adviser firms, 2007-2014).
Charles S. Morrison (1960)
Year of Election or Appointment: 2014
Trustee
Mr. Morrison also serves as Trustee of other funds. He serves as President of Fidelity SelectCo, LLC (investment adviser firm, 2017-present) and Fidelity Management & Research Company (FMR) (investment adviser firm, 2016-present), a Director of Fidelity Investments Money Management, Inc. (FIMM) (investment adviser firm, 2014-present), Director of Fidelity SelectCo, LLC (investment adviser firm, 2014-present), President, Asset Management (2014-present), and is an employee of Fidelity Investments. Previously, Mr. Morrison served as Vice President of Fidelity's Fixed Income and Asset Allocation Funds (2012-2014), President, Fixed Income (2011-2014), Vice President of Fidelity's Money Market Funds (2005-2009), President, Money Market Group Leader of FMR (investment adviser firm, 2009), and Senior Vice President, Money Market Group of FMR (2004-2009). Mr. Morrison also served as Vice President of Fidelity's Bond Funds (2002-2005), certain Balanced Funds (2002-2005), and certain Asset Allocation Funds (2002-2007), and as Senior Vice President (2002-2005) of Fidelity's Bond Division.
* Determined to be an “Interested Trustee” by virtue of, among other things, his or her affiliation with the trust or various entities under common control with FMR.
+ The information includes the Trustee's principal occupation during the last five years and other information relating to the experience, attributes, and skills relevant to the Trustee's qualifications to serve as a Trustee, which led to the conclusion that the Trustee should serve as a Trustee for the fund.
Independent Trustees:
Correspondence intended for an Independent Trustee may be sent to Fidelity Investments, P.O. Box 55235, Boston, Massachusetts 02205-5235.
Name, Year of Birth; Principal Occupations and Other Relevant Experience+
Dennis J. Dirks (1948)
Year of Election or Appointment: 2005
Trustee
Mr. Dirks also serves as Trustee of other Fidelity® funds. Prior to his retirement in May 2003, Mr. Dirks was Chief Operating Officer and a member of the Board of The Depository Trust & Clearing Corporation (DTCC). He also served as President, Chief Operating Officer, and Board member of The Depository Trust Company (DTC) and President and Board member of the National Securities Clearing Corporation (NSCC). In addition, Mr. Dirks served as Chief Executive Officer and Board member of the Government Securities Clearing Corporation, Chief Executive Officer and Board member of the Mortgage-Backed Securities Clearing Corporation, as a Trustee and a member of the Finance Committee of Manhattan College (2005-2008), as a Trustee and a member of the Finance Committee of AHRC of Nassau County (2006-2008), as a member of the Independent Directors Council (IDC) Governing Council (2010-2015), and as a member of the Board of Directors for The Brookville Center for Children’s Services, Inc. (2009-2017). Mr. Dirks is a member of the Finance Committee (2016-present), Board of Directors (2017-present) and Board of Trustees (2018-present) and is Treasurer (2018-present) of the Asolo Repertory Theatre.
Donald F. Donahue (1950)
Year of Election or Appointment: 2018
Trustee
Mr. Donahue also serves as a Trustee of other Fidelity® funds. Mr. Donahue is President and Chief Executive Officer of Miranda Partners, LLC (risk consulting for the financial services industry, 2012-present). Previously, Mr. Donahue served as a Member of the Advisory Board of certain Fidelity® funds (2015-2018) and Chief Executive Officer (2006-2012), Chief Operating Officer (2003-2006), and Managing Director, Customer Marketing and Development (1999-2003) of The Depository Trust & Clearing Corporation (financial markets infrastructure). Mr. Donahue serves as a Member (2007-present) and Co-Chairman (2016-present) of the Board of Directors of United Way of New York, Member of the Board of Directors of NYC Leadership Academy (2012-present) and Member of the Board of Advisors of Ripple Labs, Inc. (financial services, 2015-present). He also served as Chairman (2010-2012) and Member of the Board of Directors (2012-2013) of Omgeo, LLC (financial services), Treasurer of United Way of New York (2012-2016), and Member of the Board of Directors of XBRL US (financial services non-profit, 2009-2012) and the International Securities Services Association (2009-2012).
Alan J. Lacy (1953)
Year of Election or Appointment: 2008
Trustee
Mr. Lacy also serves as Trustee of other Fidelity® funds. Mr. Lacy serves as a Director of Bristol-Myers Squibb Company (global pharmaceuticals, 2008-present). He is a Trustee of the California Chapter of The Nature Conservancy (2015-present) and a Director of the Center for Advanced Study in the Behavioral Sciences at Stanford University (2015-present). In addition, Mr. Lacy served as Senior Adviser (2007-2014) of Oak Hill Capital Partners, L.P. (private equity) and also served as Chief Executive Officer (2005) and Vice Chairman (2005-2006) of Sears Holdings Corporation (retail) and Chief Executive Officer and Chairman of the Board of Sears, Roebuck and Co. (retail, 2000-2005). Previously, Mr. Lacy served as Chairman (2014-2017) and a member (2010-2017) of the Board of Directors of Dave & Buster’s Entertainment, Inc. (restaurant and entertainment complexes), as Chairman (2008-2011) and a member (2006-2015) of the Board of Trustees of the National Parks Conservation Association, and as a member of the Board of Directors for The Hillman Companies, Inc. (hardware wholesalers, 2010-2014), Earth Fare, Inc. (retail grocery, 2010-2014), and The Western Union Company (global money transfer, 2006-2011).
Ned C. Lautenbach (1944)
Year of Election or Appointment: 2000
Trustee
Chairman of the Independent Trustees
Mr. Lautenbach also serves as Trustee of other Fidelity® funds. Mr. Lautenbach currently serves as Vice Chair of the Board of Governors, State University System of Florida (2013-present) and is a member of the Council on Foreign Relations (1994-present). He is also a member and has most recently served as Chairman of the Board of Directors of Artis-Naples (2012-present). Previously, Mr. Lautenbach served as a member and then Lead Director of the Board of Directors of Eaton Corporation (diversified industrial, 1997-2016). He was also a Partner and Advisory Partner at Clayton, Dubilier & Rice, LLC (private equity investment, 1998-2010), as well as a Director of Sony Corporation (2006-2007). In addition, Mr. Lautenbach also had a 30-year career with IBM (technology company) during which time he served as Senior Vice President and a member of the Corporate Executive Committee (1968-1998).
Joseph Mauriello (1944)
Year of Election or Appointment: 2008
Trustee
Mr. Mauriello also serves as Trustee of other Fidelity® funds. Prior to his retirement in January 2006, Mr. Mauriello served in numerous senior management positions including Deputy Chairman and Chief Operating Officer (2004-2005), and Vice Chairman of Financial Services (2002-2004) of KPMG LLP US (professional services, 1965-2005). Mr. Mauriello currently serves as a member of the Board of Directors of XL Group plc. (global insurance and re-insurance, 2006-present) and the Independent Directors Council (IDC) Governing Council (2015-present). Previously, Mr. Mauriello served as a Director of the Hamilton Funds of the Bank of New York (2006-2007) and of Arcadia Resources Inc. (health care services and products, 2007-2012).
Cornelia M. Small (1944)
Year of Election or Appointment: 2005
Trustee
Ms. Small also serves as Trustee of other Fidelity® funds. Ms. Small is a member of the Board of Directors (2009-present) and Chair of the Investment Committee (2010-present) of the Teagle Foundation. Ms. Small also serves on the Investment Committee of the Berkshire Taconic Community Foundation (2008-present). Previously, Ms. Small served as Chairperson (2002-2008) and a member of the Investment Committee and Chairperson (2008-2012) and a member of the Board of Trustees of Smith College. In addition, Ms. Small served as Chief Investment Officer, Director of Global Equity Investments, and a member of the Board of Directors of Scudder, Stevens & Clark and Scudder Kemper Investments.
Garnett A. Smith (1947)
Year of Election or Appointment: 2018
Trustee
Mr. Smith also serves as Trustee of other Fidelity® funds. Prior to Mr. Smith's retirement, he served as Chairman and Chief Executive Officer of Inbrand Corp. (manufacturer of personal absorbent products, 1990-1997). He also served as President (1986-1990) of Inbrand Corp. Prior to his employment with Inbrand Corp., he was employed by a retail fabric chain and North Carolina National Bank. In addition, Mr. Smith served as a Member of the Advisory Board of certain Fidelity® funds (2012-2013) and as a board member of the Jackson Hole Land Trust (2009-2012).
David M. Thomas (1949)
Year of Election or Appointment: 2008
Trustee
Mr. Thomas also serves as Trustee of other Fidelity® funds. Mr. Thomas serves as Non-Executive Chairman of the Board of Directors of Fortune Brands Home and Security (home and security products, 2011-present), as a member of the Board of Directors (2004-present) and Presiding Director (2013-present) of Interpublic Group of Companies, Inc. (marketing communication), and as a member of the Board of Trustees of the University of Florida (2013-present). Previously, Mr. Thomas served as Executive Chairman (2005-2006) and Chairman and Chief Executive Officer (2000-2005) of IMS Health, Inc. (pharmaceutical and healthcare information solutions), and a Director of Fortune Brands, Inc. (consumer products, 2000-2011).
+ The information includes the Trustee's principal occupation during the last five years and other information relating to the experience, attributes, and skills relevant to the Trustee's qualifications to serve as a Trustee, which led to the conclusion that the Trustee should serve as a Trustee for the fund.
Advisory Board Members and Officers:
Correspondence intended for a Member of the Advisory Board (if any) may be sent to Fidelity Investments, P.O. Box 55235, Boston, Massachusetts 02205-5235. Correspondence intended for an officer or Peter S. Lynch may be sent to Fidelity Investments, 245 Summer Street, Boston, Massachusetts 02210. Officers appear below in alphabetical order.
Name, Year of Birth; Principal Occupation
Peter S. Lynch (1944)
Year of Election or Appointment: 2003
Member of the Advisory Board
Mr. Lynch also serves as Member of the Advisory Board of other Fidelity® funds. Mr. Lynch is Vice Chairman and a Director of FMR (investment adviser firm) and FMR Co., Inc. (investment adviser firm). In addition, Mr. Lynch serves as a Trustee of Boston College and as the Chairman of the Inner-City Scholarship Fund. Previously, Mr. Lynch served on the Special Olympics International Board of Directors (1997-2006).
William S. Stavropoulos (1939)
Year of Election or Appointment: 2018
Member of the Advisory Board
Mr. Stavropoulos also serves as Member of the Advisory Board of other Fidelity® funds. Mr. Stavropoulos serves as President and Founder of the Michigan Baseball Foundation, the Great Lakes Loons (2007-present). Mr. Stavropoulos is Chairman Emeritus of the Board of Directors of The Dow Chemical Company, where he previously served in numerous senior management positions, including President, CEO (1995-2000; 2002-2004), Chairman of the Executive Committee (2000-2006), and as a member of the Board of Directors (1990-2006). Currently, Mr. Stavropoulos is Chairman of the Board of Directors of Univar Inc. (global distributor of commodity and specialty chemicals), a Director of Teradata Corporation (data warehousing and technology solutions), and a member of the Advisory Board for Metalmark Capital LLC (private equity investment, 2005-present). Mr. Stavropoulos is an operating advisor to Clayton, Dubilier & Rice, LLC (private equity investment). In addition, Mr. Stavropoulos is a member of the University of Notre Dame Advisory Council for the College of Science, a Trustee of the Rollin L. Gerstacker Foundation, and a Director of Artis-Naples in Naples, Florida. Previously, Mr. Stavropoulos served as Trustee of certain Fidelity® funds (2001-2018) and as a Director of Chemical Financial Corporation (bank holding company, 1993-2012) and Tyco International, Ltd. (multinational manufacturing and services, 2007-2012).
Carol B. Tomé (1957)
Year of Election or Appointment: 2018
Member of the Advisory Board
Ms. Tomé also serves as Member of the Advisory Board of other Fidelity® funds. Ms. Tomé is Chief Financial Officer (2001-present) and Executive Vice President of Corporate Services (2007-present) of The Home Depot, Inc. (home improvement retailer) and a Director (2003-present) and Chair of the Audit Committee (2004-present) of United Parcel Service, Inc. (package delivery and supply chain management). Previously, Ms. Tomé served as Trustee of certain Fidelity® funds (2017), Senior Vice President of Finance and Accounting/Treasurer (2000-2007) and Vice President and Treasurer (1995-2000) of The Home Depot, Inc. and Chair of the Board (2010-2012), Vice Chair of the Board (2009 and 2013), and a Director (2008-2013) of the Federal Reserve Bank of Atlanta. Ms. Tomé is also a director or trustee of many community and professional organizations.
Michael E. Wiley (1950)
Year of Election or Appointment: 2018
Member of the Advisory Board
Mr. Wiley also serves as Trustee or Member of the Advisory Board of other Fidelity® funds. Mr. Wiley serves as a Director of Andeavor Corporation (independent oil refiner and marketer, 2005-present), a Director of Andeavor Logistics LP (natural resources logistics, 2015-present), and a Director of Bill Barrett Corporation (exploration and production, 2005-present). In addition, Mr. Wiley also serves as a Director of Post Oak Bank (privately-held bank, 2004-present). Previously, Mr. Wiley served as a Trustee of other Fidelity® funds (2008-2013), as a Director of Asia Pacific Exploration Consolidated (international oil and gas exploration and production, 2008-2013), as a member of the Board of Trustees of the University of Tulsa (2000-2006; 2007-2010), as a Senior Energy Advisor of Katzenbach Partners, LLC (consulting, 2006-2007), as an Advisory Director of Riverstone Holdings (private investment), Chairman, President, and CEO of Baker Hughes, Inc. (oilfield services, 2000-2004), and as Director of Spinnaker Exploration Company (exploration and production, 2001-2005).
Elizabeth Paige Baumann (1968)
Year of Election or Appointment: 2017
Anti-Money Laundering (AML) Officer
Ms. Baumann also serves as AML Officer of other funds. She is Chief AML Officer (2012-present) and Senior Vice President (2014-present) of FMR LLC (diversified financial services company) and is an employee of Fidelity Investments. Previously, Ms. Baumann served as AML Officer of the funds (2012-2016), and Vice President (2007-2014) and Deputy Anti-Money Laundering Officer (2007-2012) of FMR LLC.
Marc R. Bryant (1966)
Year of Election or Appointment: 2015
Secretary and Chief Legal Officer (CLO)
Mr. Bryant also serves as Secretary and CLO of other funds. Mr. Bryant serves as CLO, Secretary, and Senior Vice President of Fidelity Management & Research Company (investment adviser firm, 2015-present) and FMR Co., Inc. (investment adviser firm, 2015-present); Secretary of Fidelity SelectCo, LLC (investment adviser firm, 2015-present) and Fidelity Investments Money Management, Inc. (investment adviser firm, 2015-present); and CLO of Fidelity Management & Research (Hong Kong) Limited and FMR Investment Management (UK) Limited (investment adviser firms, 2015-present) and Fidelity Management & Research (Japan) Limited (investment adviser firm, 2016-present). He is Senior Vice President and Deputy General Counsel of FMR LLC (diversified financial services company). Previously, Mr. Bryant served as Secretary and CLO of Fidelity Rutland Square Trust II (2010-2014) and Assistant Secretary of Fidelity's Fixed Income and Asset Allocation Funds (2013-2015). Prior to joining Fidelity Investments, Mr. Bryant served as a Senior Vice President and the Head of Global Retail Legal for AllianceBernstein L.P. (2006-2010), and as the General Counsel for ProFund Advisors LLC (2001-2006).
John J. Burke III (1964)
Year of Election or Appointment: 2018
Chief Financial Officer
Mr. Burke also serves as Chief Financial Officer of other funds. Mr. Burke serves as Head of Investment Operations for Fidelity Fund and Investment Operations (2018-present) and is an employee of Fidelity Investments (1998-present). Previously Mr. Burke served as head of Asset Management Investment Operations (2012-2018).
William C. Coffey (1969)
Year of Election or Appointment: 2009
Assistant Secretary
Mr. Coffey also serves as Assistant Secretary of other funds. He is Senior Vice President and Deputy General Counsel of FMR LLC (diversified financial services company, 2010-present), and is an employee of Fidelity Investments. Previously, Mr. Coffey served as Vice President and Associate General Counsel of FMR LLC (2005-2009).
Timothy M. Cohen (1969)
Year of Election or Appointment: 2018
Vice President
Mr. Cohen also serves as Vice President of other funds. Mr. Cohen serves as Co-Head of Global Equity Research (2016-present), a Director of Fidelity Management & Research (Japan) Limited (investment adviser firm, 2016-present), and is an employee of Fidelity Investments. Previously, Mr. Cohen served as Chief Investment Officer - Equity and a Director of Fidelity Management & Research (U.K.) Inc. (investment adviser firm, 2013-2015) and as a Director of Fidelity Management & Research (Hong Kong) Limited (investment adviser firm, 2017).
Jonathan Davis (1968)
Year of Election or Appointment: 2010
Assistant Treasurer
Mr. Davis also serves as Assistant Treasurer of other funds. Mr. Davis serves as Assistant Treasurer of FMR Capital, Inc. (2017-present) and is an employee of Fidelity Investments. Previously, Mr. Davis served as Vice President and Associate General Counsel of FMR LLC (diversified financial services company, 2003-2010).
Adrien E. Deberghes (1967)
Year of Election or Appointment: 2016
Assistant Treasurer
Mr. Deberghes also serves as an officer of other funds. He serves as Assistant Treasurer of FMR Capital, Inc. (2017-present), Executive Vice President of Fidelity Investments Money Management, Inc. (FIMM) (investment adviser firm, 2016-present), and is an employee of Fidelity Investments (2008-present). Previously, Mr. Deberghes served as President and Treasurer of certain Fidelity® funds (2013-2018). Prior to joining Fidelity Investments, Mr. Deberghes was Senior Vice President of Mutual Fund Administration at State Street Corporation (2007-2008), Senior Director of Mutual Fund Administration at Investors Bank & Trust (2005-2007), and Director of Finance for Dunkin' Brands (2000-2005). Previously, Mr. Deberghes served in other fund officer roles.
Laura M. Del Prato (1964)
Year of Election or Appointment: 2018
Assistant Treasurer
Ms. Del Prato also serves as an officer of other funds. Ms. Del Prato is an employee of Fidelity Investments (2017-present). Prior to joining Fidelity Investments, Ms. Del Prato served as a Managing Director and Treasurer of the JPMorgan Mutual Funds (2014-2017). Prior to JPMorgan, Ms. Del Prato served as a partner at Cohen Fund Audit Services (accounting firm, 2012-2013) and KPMG LLP (accounting firm, 2004-2012).
Colm A. Hogan (1973)
Year of Election or Appointment: 2016
Deputy Treasurer
Mr. Hogan also serves as an officer of other funds. Mr. Hogan serves as Assistant Treasurer of FMR Capital, Inc. (2017-present) and is an employee of Fidelity Investments (2005-present). Previously, Mr. Hogan served as Assistant Treasurer of certain Fidelity® funds (2016-2018).
Pamela R. Holding (1964)
Year of Election or Appointment: 2018
Vice President
Ms. Holding also serves as a Vice President of other funds. Ms. Holding serves as Co-Head of Global Equity Research (2018-present) and is an employee of Fidelity Investments (2013-present).
Chris Maher (1972)
Year of Election or Appointment: 2013
Assistant Treasurer
Mr. Maher serves as Assistant Treasurer of other funds. Mr. Maher is Vice President of Valuation Oversight, serves as Assistant Treasurer of FMR Capital, Inc. (2017-present), and is an employee of Fidelity Investments. Previously, Mr. Maher served as Vice President of Asset Management Compliance (2013), Vice President of the Program Management Group of FMR (investment adviser firm, 2010-2013), and Vice President of Valuation Oversight (2008-2010).
Rieco E. Mello (1969)
Year of Election or Appointment: 2017
Assistant Treasurer
Mr. Mello also serves as Assistant Treasurer of other funds. Mr. Mello serves as Assistant Treasurer of FMR Capital, Inc. (2017-present) and is an employee of Fidelity Investments (1995-present).
Kenneth B. Robins (1969)
Year of Election or Appointment: 2016
Chief Compliance Officer
Mr. Robins also serves as an officer of other funds. Mr. Robins serves as Compliance Officer of Fidelity Management & Research Company and FMR Co., Inc. (investment adviser firms, 2016-present) and is an employee of Fidelity Investments (2004-present). Previously, Mr. Robins served as Executive Vice President of Fidelity Investments Money Management, Inc. (investment adviser firm, 2013-2016) and served in other fund officer roles.
Stacie M. Smith (1974)
Year of Election or Appointment: 2016
President and Treasurer
Ms. Smith also serves as an officer of other funds. Ms. Smith serves as Assistant Treasurer of FMR Capital, Inc. (2017-present), is an employee of Fidelity Investments (2009-present), and has served in other fund officer roles. Prior to joining Fidelity Investments, Ms. Smith served as Senior Audit Manager of Ernst & Young LLP (accounting firm, 1996-2009). Previously, Ms. Smith served as Assistant Treasurer (2013-2018) and Deputy Treasurer (2013-2016) of certain Fidelity® funds.
Marc L. Spector (1972)
Year of Election or Appointment: 2016
Assistant Treasurer
Mr. Spector also serves as an officer of other funds. Mr. Spector serves as Assistant Treasurer of FMR Capital, Inc. (2017-present) and is an employee of Fidelity Investments (2016-present). Prior to joining Fidelity Investments, Mr. Spector served as Director at the Siegfried Group (accounting firm, 2013-2016), and prior to Siegfried Group as audit senior manager at Deloitte & Touche (accounting firm, 2005-2013).
Renee Stagnone (1975)
Year of Election or Appointment: 2016
Assistant Treasurer
Ms. Stagnone also serves as an officer of other funds. Ms. Stagnone serves as Assistant Treasurer of FMR Capital, Inc. (2017-present) and is an employee of Fidelity Investments (1997-present). Previously, Ms. Stagnone served as Deputy Treasurer of certain Fidelity® funds (2013-2016).
Shareholder Expense Example
As a shareholder of the Fund, you incur two types of costs: (1) transaction costs and (2) ongoing costs, including management fees and other Fund expenses. This Example is intended to help you understand your ongoing costs (in dollars) of investing in the Fund and to compare these costs with the ongoing costs of investing in other mutual funds.
The Example is based on an investment of $1,000 invested at the beginning of the period and held for the entire period (February 1, 2018 to July 31, 2018).
Actual Expenses
The first line of the accompanying table for each class of the Fund provides information about actual account values and actual expenses. You may use the information in this line, together with the amount you invested, to estimate the expenses that you paid over the period. Simply divide your account value by $1,000.00 (for example, an $8,600 account value divided by $1,000.00 = 8.6), then multiply the result by the number in the first line for a class of the Fund under the heading entitled "Expenses Paid During Period" to estimate the expenses you paid on your account during this period. A small balance maintenance fee of $12.00 that is charged once a year may apply for certain accounts with a value of less than $2,000. This fee is not included in the table below. If it was, the estimate of expenses you paid during the period would be higher, and your ending account value lower, by this amount. In addition, the Fund, as a shareholder in the underlying Fidelity Central Funds, will indirectly bear its pro-rata share of the fees and expenses incurred by the underlying Fidelity Central Funds. These fees and expenses are not included in the Fund's annualized expense ratio used to calculate the expense estimate in the table below.
Hypothetical Example for Comparison Purposes
The second line of the accompanying table for each class of the Fund provides information about hypothetical account values and hypothetical expenses based on a Class' actual expense ratio and an assumed rate of return of 5% per year before expenses, which is not the Class' actual return. The hypothetical account values and expenses may not be used to estimate the actual ending account balance or expenses you paid for the period. You may use this information to compare the ongoing costs of investing in the Fund and other funds. To do so, compare this 5% hypothetical example with the 5% hypothetical examples that appear in the shareholder reports of the other funds. A small balance maintenance fee of $12.00 that is charged once a year may apply for certain accounts with a value of less than $2,000. This fee is not included in the table below. If it was, the estimate of expenses you paid during the period would be higher, and your ending account value lower, by this amount. In addition, the Fund, as a shareholder in the underlying Fidelity Central Funds, will indirectly bear its pro-rata share of the fees and expenses incurred by the underlying Fidelity Central Funds. These fees and expenses are not included in the Fund's annualized expense ratio used to calculate the expense estimate in the table below.
Please note that the expenses shown in the table are meant to highlight your ongoing costs only and do not reflect any transaction costs. Therefore, the second line of the table is useful in comparing ongoing costs only, and will not help you determine the relative total costs of owning different funds.
| | Annualized Expense Ratio-A | Beginning
Account Value
February 1, 2018 | Ending
Account Value
July 31, 2018 | Expenses Paid
During Period-B
February 1, 2018
to July 31, 2018 |
| Growth and Income | .61% | | | |
| Actual | | $1,000.00 | $996.50 | $3.02 |
| Hypothetical-C | | $1,000.00 | $1,021.77 | $3.06 |
| Class K | .51% | | | |
| Actual | | $1,000.00 | $997.00 | $2.53 |
| Hypothetical-C | | $1,000.00 | $1,022.27 | $2.56 |
A Annualized expense ratio reflects expenses net of applicable fee waivers.
B Expenses are equal to each Class' annualized expense ratio, multiplied by the average account value over the period, multiplied by 181/365 (to reflect the one-half year period).
C 5% return per year before expenses
Distributions (Unaudited)
The Board of Trustees of Fidelity Growth & Income Portfolio voted to pay to shareholders of record at the opening of business on record date, the following distributions per share derived from capital gains realized from sales of portfolio securities:
| | Pay Date | Record Date | Capital Gains |
| Fidelity Growth & Income Portfolio | | | |
| Growth & Income | 09/10/18 | 09/07/18 | $0.014 |
| Class K | 09/10/18 | 09/07/18 | $0.014 |
|
A total of 0.11% of the dividends distributed during the fiscal year was derived from interest on U.S. Government securities which is generally exempt from state income tax.
Growth & Income and Class K designate 100% of the dividends distributed during the fiscal year as qualifying for the dividends–received deduction for corporate shareholders.
Growth & Income, and Class K designate 100% of dividends distributed during the fiscal year as amounts which may be taken into account as a dividend for purposes of the maximum rate under section 1(h)(11) of the Internal Revenue Code.
The fund will notify shareholders in January 2019 of amounts for use in preparing 2018 income tax returns.
Board Approval of Investment Advisory Contracts
Fidelity Growth & Income Portfolio
At its July 2018 meeting, the Board of Trustees, including the Independent Trustees (together, the Board), voted to continue the management contract with Fidelity Management & Research Company (FMR) and the sub-advisory agreements (together, the Advisory Contracts) for the fund for six months through January 31, 2019, in connection with the reunification of the Fidelity Equity High Income Funds Board, which oversees the fund, and the Sector Portfolios Board.
The Board considered that the approval of the fund's Advisory Contracts will not result in any changes in (i) the investment process or strategies employed in the management of the fund's assets; (ii) the fees and expenses paid by shareholders; (iii) the nature, extent or quality of services provided under the fund's Advisory Contracts; or (iv) the day-to-day management of the fund or the persons primarily responsible for such management. The Board concluded that the fund's Advisory Contracts are fair and reasonable, and that the fund's Advisory Contracts should be renewed, without modification, through January 31, 2019, with the understanding that the Board will consider the annual renewal for a full one year period in January 2019.
In connection with its consideration of future renewals of the fund's Advisory Contracts, the Board will consider: (i) the nature, extent and quality of services provided to the fund, including shareholder and administrative services and investment performance; (ii) the competitiveness of the management fee and total expenses for the fund; (iii) the costs of the services and profitability, including the revenues earned and the expenses incurred in conducting the business of developing, marketing, distributing, managing, administering, and servicing the fund and its shareholders, to the extent applicable, as well as potential fall-out benefits from Fidelity's non-fund businesses; and (iv) whether there have been economies of scale in respect of the Fidelity funds, whether the Fidelity funds (including the fund) have appropriately benefited from any such economies of scale, and whether there is the potential for realization of any further economies.
Based on its evaluation of all of the conclusions noted above, and after considering all factors it believed relevant, the Board ultimately concluded that the fund's management fee structure is fair and reasonable, and that the continuation of the fund's Advisory Contracts should be approved.
Corporate Headquarters
245 Summer St.
Boston, MA 02210
www.fidelity.com
GAI-K-ANN-0918
1.863230.109
Fidelity® Leveraged Company Stock Fund
Annual Report July 31, 2018 |
|
Contents
To view a fund's proxy voting guidelines and proxy voting record for the 12-month period ended June 30, visit http://www.fidelity.com/proxyvotingresults or visit the Securities and Exchange Commission's (SEC) web site at http://www.sec.gov.
You may also call 1-800-544-8544 to request a free copy of the proxy voting guidelines.
Standard & Poor's, S&P and S&P 500 are registered service marks of The McGraw-Hill Companies, Inc. and have been licensed for use by Fidelity Distributors Corporation.
Other third-party marks appearing herein are the property of their respective owners.
All other marks appearing herein are registered or unregistered trademarks or service marks of FMR LLC or an affiliated company. © 2018 FMR LLC. All rights reserved.
This report and the financial statements contained herein are submitted for the general information of the shareholders of the Fund. This report is not authorized for distribution to prospective investors in the Fund unless preceded or accompanied by an effective prospectus.
A fund files its complete schedule of portfolio holdings with the SEC for the first and third quarters of each fiscal year on Form N-Q. Forms N-Q are available on the SEC’s web site at http://www.sec.gov. A fund's Forms N-Q may be reviewed and copied at the SEC’s Public Reference Room in Washington, DC. Information regarding the operation of the SEC's Public Reference Room may be obtained by calling 1-800-SEC-0330.
For a complete list of a fund's portfolio holdings, view the most recent holdings listing, semiannual report, or annual report on Fidelity's web site at http://www.fidelity.com, http://www.institutional.fidelity.com, or http://www.401k.com, as applicable.
NOT FDIC INSURED •MAY LOSE VALUE •NO BANK GUARANTEE
Neither the Fund nor Fidelity Distributors Corporation is a bank.
Performance: The Bottom Line
Average annual total return reflects the change in the value of an investment, assuming reinvestment of distributions from dividend income and capital gains (the profits earned upon the sale of securities that have grown in value, if any) and assuming a constant rate of performance each year. The hypothetical investment and the average annual total returns do not reflect the deduction of taxes that a shareholder would pay on fund distributions or the redemption of fund shares. During periods of reimbursement by Fidelity, a fund’s total return will be greater than it would be had the reimbursement not occurred. How a fund did yesterday is no guarantee of how it will do tomorrow.
Average Annual Total Returns
| For the periods ended July 31, 2018 | Past 1 year | Past 5 years | Past 10 years |
| Fidelity® Leveraged Company Stock Fund | 10.91% | 7.83% | 6.79% |
$10,000 Over 10 Years
Let's say hypothetically that $10,000 was invested in Fidelity® Leveraged Company Stock Fund, a class of the fund, on July 31, 2008.
The chart shows how the value of your investment would have changed, and also shows how the S&P 500® Index performed over the same period.
| Period Ending Values |
| $19,294 | Fidelity® Leveraged Company Stock Fund |
| $27,551 | S&P 500® Index |
Management's Discussion of Fund Performance
Market Recap: The U.S. equity bellwether S&P 500
® index gained 16.24% for the 12 months ending July 31, 2018, despite a resurgence in volatility that challenged the multiyear bull market. Stocks maintained their steady growth until a sharp reversal in February, as volatility spiked amid fear that rising inflation and the potential for the economy to overheat would prompt the U.S. Federal Reserve to pick up the pace of interest rate hikes. The index posted its first negative monthly result since October 2016, and then lost further ground in March on fear of a global trade war. The market stabilized in April and turned upward through mid-June, when escalating trade tension between the U.S. and China soured investor sentiment. The resulting uncertainty lingered into July, but strong corporate earnings helped the S&P 500 rise 3.72% that month to cap the period. For the full one-year period, growth handily topped value, while small-caps bested large-caps. By sector, information technology (+28%) led the way, boosted by strong earnings growth from several major index constituents. Consumer discretionary rose roughly 24%, driven by retailers (+49%). Energy (+20%) gained alongside higher oil prices. Laggards were telecommunication services (-2%), consumer staples (0%) and utilities (+3%), defensive groups that struggled amid rising interest rates and a general preference for risk. Real estate (+5%) fared a bit better but still lagged, as did financials, industrials, health care (each up 13%) and materials (+11%).
Comments from Portfolio Manager Mark Notkin: For the fiscal year, the fund's share classes gained about 11%, lagging the benchmark S&P 500
® and topping the 7.37% result of the Credit Suisse Leveraged Equity Index. We feel the latter index represents a better basis for comparison, given the fund’s mandate to primarily invest in the common stocks of leveraged companies. I am pleased with the fund’s performance through the end of May, but the final two months of this reporting period proved disappointing, with the fund widely lagging the S&P 500. For the full 12 months, the fund’s underperformance of the benchmark was primarily due to security selection in the consumer discretionary and information technology sectors. With my focus on leveraged companies, many constituents in the S&P 500 are screened out of my process, yet still may notably influence the fund’s performance versus the benchmark. For instance, largely avoiding e-commerce giant Amazon.com and software maker Microsoft were the fund’s largest relative detractors the past year. Conversely, the fund’s relative result benefited from overall industry positioning, especially underweightings in consumer staples, utilities and health care, all of which trailed the broader market. The fund’s top contributor was Eldorado Resorts, a regional gaming operator that has grown through strategic acquisitions focused on return on investment rather than just revenue growth.
The views expressed above reflect those of the portfolio manager(s) only through the end of the period as stated on the cover of this report and do not necessarily represent the views of Fidelity or any other person in the Fidelity organization. Any such views are subject to change at any time based upon market or other conditions and Fidelity disclaims any responsibility to update such views. These views may not be relied on as investment advice and, because investment decisions for a Fidelity fund are based on numerous factors, may not be relied on as an indication of trading intent on behalf of any Fidelity fund.
Investment Summary (Unaudited)
Top Ten Stocks as of July 31, 2018
| | % of fund's net assets |
| Alibaba Group Holding Ltd. sponsored ADR | 3.0 |
| Alphabet, Inc. Class A | 2.5 |
| T-Mobile U.S., Inc. | 2.5 |
| Facebook, Inc. Class A | 2.4 |
| Melco Crown Entertainment Ltd. sponsored ADR | 2.2 |
| Eldorado Resorts, Inc. | 2.2 |
| ON Semiconductor Corp. | 2.1 |
| Air Canada | 2.1 |
| Micron Technology, Inc. | 2.0 |
| Broadcom, Inc. | 2.0 |
| | 23.0 |
Top Five Market Sectors as of July 31, 2018
| | % of fund's net assets |
| Information Technology | 34.7 |
| Consumer Discretionary | 22.8 |
| Materials | 8.5 |
| Financials | 8.0 |
| Industrials | 7.1 |
Asset Allocation (% of fund's net assets)
| As of July 31, 2018* |
| | Stocks | 98.3% |
| | Convertible Securities | 0.6% |
| | Short-Term Investments and Net Other Assets (Liabilities) | 1.1% |

* Foreign investments - 18.1%
Schedule of Investments July 31, 2018
Showing Percentage of Net Assets
| Common Stocks - 98.3% | | | |
| | | Shares | Value (000s) |
| CONSUMER DISCRETIONARY - 22.8% | | | |
| Auto Components - 1.5% | | | |
| Lear Corp. | | 227,100 | $40,908 |
| Hotels, Restaurants & Leisure - 13.1% | | | |
| Boyd Gaming Corp. | | 1,367,800 | 51,087 |
| Eldorado Resorts, Inc. (a) | | 1,413,780 | 60,580 |
| Las Vegas Sands Corp. | | 245,200 | 17,630 |
| Melco Crown Entertainment Ltd. sponsored ADR | | 2,360,000 | 61,030 |
| Penn National Gaming, Inc. (a) | | 1,416,000 | 45,383 |
| Red Rock Resorts, Inc. | | 5,847 | 207 |
| Royal Caribbean Cruises Ltd. | | 214,400 | 24,176 |
| Scientific Games Corp. Class A (a) | | 532,500 | 25,587 |
| The Stars Group, Inc. (a) | | 530,200 | 18,186 |
| Wyndham Destinations, Inc. | | 289,100 | 13,333 |
| Wyndham Hotels & Resorts, Inc. | | 289,100 | 16,768 |
| Wynn Resorts Ltd. | | 205,400 | 34,257 |
| | | | 368,224 |
| Household Durables - 1.4% | | | |
| Lennar Corp.: | | | |
| Class A | | 417,740 | 21,835 |
| Class B | | 6,642 | 287 |
| Toll Brothers, Inc. | | 513,000 | 18,088 |
| | | | 40,210 |
| Internet & Direct Marketing Retail - 2.8% | | | |
| Amazon.com, Inc. (a) | | 16,100 | 28,617 |
| JD.com, Inc. sponsored ADR (a) | | 381,900 | 13,695 |
| The Booking Holdings, Inc. (a) | | 18,200 | 36,923 |
| | | | 79,235 |
| Media - 2.7% | | | |
| Gray Television, Inc. (a) | | 1,172,964 | 18,122 |
| Naspers Ltd.: | | | |
| Class N | | 135,500 | 33,362 |
| Class N sponsored ADR (b) | | 160,400 | 7,973 |
| Nexstar Broadcasting Group, Inc. Class A | | 195,498 | 14,555 |
| | | | 74,012 |
| Specialty Retail - 0.5% | | | |
| Ulta Beauty, Inc. (a) | | 60,000 | 14,663 |
| Textiles, Apparel & Luxury Goods - 0.8% | | | |
| adidas AG | | 97,168 | 21,492 |
|
| TOTAL CONSUMER DISCRETIONARY | | | 638,744 |
|
| CONSUMER STAPLES - 2.6% | | | |
| Beverages - 0.4% | | | |
| Constellation Brands, Inc. Class A (sub. vtg.) | | 60,200 | 12,656 |
| Food Products - 2.2% | | | |
| Darling International, Inc. (a) | | 1,932,283 | 38,820 |
| JBS SA | | 9,507,900 | 22,850 |
| | | | 61,670 |
|
| TOTAL CONSUMER STAPLES | | | 74,326 |
|
| ENERGY - 6.8% | | | |
| Energy Equipment & Services - 0.4% | | | |
| SAExploration Holdings, Inc. (a)(c) | | 419,175 | 545 |
| Weatherford International PLC (a)(b) | | 2,859,400 | 9,693 |
| | | | 10,238 |
| Oil, Gas & Consumable Fuels - 6.4% | | | |
| Cheniere Energy, Inc. (a) | | 319,640 | 20,297 |
| Concho Resources, Inc. (a) | | 86,688 | 12,643 |
| Diamondback Energy, Inc. | | 225,500 | 29,755 |
| EQT Corp. | | 306,506 | 15,227 |
| MEG Energy Corp. (a) | | 1,809,300 | 11,794 |
| Parsley Energy, Inc. Class A (a) | | 821,600 | 25,823 |
| Pioneer Natural Resources Co. | | 145,200 | 27,482 |
| QEP Resources, Inc. (a) | | 458,700 | 4,766 |
| Scorpio Tankers, Inc. | | 1,959,100 | 4,212 |
| Teekay Corp. (b) | | 894,737 | 6,236 |
| Whiting Petroleum Corp. (a) | | 430,473 | 21,373 |
| | | | 179,608 |
|
| TOTAL ENERGY | | | 189,846 |
|
| FINANCIALS - 8.0% | | | |
| Banks - 4.9% | | | |
| Bank of America Corp. | | 1,618,399 | 49,976 |
| Huntington Bancshares, Inc. | | 757,980 | 11,703 |
| JPMorgan Chase & Co. | | 442,900 | 50,911 |
| Regions Financial Corp. | | 607,780 | 11,311 |
| SunTrust Banks, Inc. | | 167,900 | 12,101 |
| | | | 136,002 |
| Capital Markets - 0.4% | | | |
| MSCI, Inc. | | 73,500 | 12,215 |
| Consumer Finance - 1.8% | | | |
| OneMain Holdings, Inc. (a) | | 1,547,200 | 51,444 |
| Diversified Financial Services - 0.9% | | | |
| GDS Holdings Ltd. ADR (a)(b) | | 1,173,700 | 25,622 |
|
| TOTAL FINANCIALS | | | 225,283 |
|
| HEALTH CARE - 4.1% | | | |
| Health Care Providers & Services - 2.3% | | | |
| HCA Holdings, Inc. | | 146,500 | 18,200 |
| Humana, Inc. | | 99,700 | 31,324 |
| UnitedHealth Group, Inc. | | 60,300 | 15,269 |
| | | | 64,793 |
| Life Sciences Tools & Services - 1.0% | | | |
| Quintiles Transnational Holdings, Inc. (a) | | 234,700 | 28,619 |
| Pharmaceuticals - 0.8% | | | |
| Bausch Health Cos., Inc. (Canada) (a) | | 56,100 | 1,220 |
| Jazz Pharmaceuticals PLC (a) | | 114,300 | 19,783 |
| | | | 21,003 |
|
| TOTAL HEALTH CARE | | | 114,415 |
|
| INDUSTRIALS - 7.1% | | | |
| Air Freight & Logistics - 0.6% | | | |
| XPO Logistics, Inc. (a) | | 151,300 | 15,088 |
| Airlines - 2.6% | | | |
| Air Canada (a) | | 3,279,900 | 59,327 |
| Allegiant Travel Co. | | 104,146 | 12,872 |
| | | | 72,199 |
| Commercial Services & Supplies - 0.0% | | | |
| Novus Holdings Ltd. | | 46,866 | 14 |
| Machinery - 1.0% | | | |
| Allison Transmission Holdings, Inc. | | 617,900 | 29,041 |
| Marine - 0.0% | | | |
| Genco Shipping & Trading Ltd. (a) | | 831 | 12 |
| Trading Companies & Distributors - 2.9% | | | |
| HD Supply Holdings, Inc. (a) | | 1,016,300 | 44,697 |
| United Rentals, Inc. (a) | | 248,100 | 36,917 |
| | | | 81,614 |
|
| TOTAL INDUSTRIALS | | | 197,968 |
|
| INFORMATION TECHNOLOGY - 34.1% | | | |
| Electronic Equipment & Components - 1.5% | | | |
| CDW Corp. | | 245,300 | 20,627 |
| Control4 Corp. (a) | | 397,400 | 10,106 |
| TTM Technologies, Inc. (a) | | 589,200 | 10,229 |
| | | | 40,962 |
| Internet Software & Services - 7.9% | | | |
| Alibaba Group Holding Ltd. sponsored ADR (a) | | 451,700 | 84,573 |
| Alphabet, Inc. Class A (a) | | 56,700 | 69,583 |
| Facebook, Inc. Class A (a) | | 393,000 | 67,824 |
| | | | 221,980 |
| IT Services - 7.1% | | | |
| EPAM Systems, Inc. (a) | | 302,100 | 39,336 |
| Global Payments, Inc. | | 480,900 | 54,135 |
| MasterCard, Inc. Class A | | 152,400 | 30,175 |
| PayPal Holdings, Inc. (a) | | 453,600 | 37,259 |
| Visa, Inc. Class A | | 285,900 | 39,094 |
| | | | 199,999 |
| Semiconductors & Semiconductor Equipment - 9.9% | | | |
| Broadcom, Inc. | | 246,100 | 54,578 |
| Marvell Technology Group Ltd. | | 998,982 | 21,288 |
| Microchip Technology, Inc. | | 334,900 | 31,290 |
| Micron Technology, Inc. (a) | | 1,084,600 | 57,256 |
| NVIDIA Corp. | | 217,200 | 53,184 |
| ON Semiconductor Corp. (a) | | 2,713,000 | 59,822 |
| | | | 277,418 |
| Software - 7.7% | | | |
| Adobe Systems, Inc. (a) | | 215,600 | 52,753 |
| CDK Global, Inc. | | 215,100 | 13,433 |
| Electronic Arts, Inc. (a) | | 203,600 | 26,214 |
| Microsoft Corp. | | 369,400 | 39,186 |
| Salesforce.com, Inc. (a) | | 217,000 | 29,762 |
| SS&C Technologies Holdings, Inc. | | 581,900 | 30,881 |
| Take-Two Interactive Software, Inc. (a) | | 197,700 | 22,344 |
| | | | 214,573 |
|
| TOTAL INFORMATION TECHNOLOGY | | | 954,932 |
|
| MATERIALS - 8.5% | | | |
| Chemicals - 6.3% | | | |
| DowDuPont, Inc. | | 530,921 | 36,511 |
| Ingevity Corp. (a) | | 254,788 | 25,395 |
| LyondellBasell Industries NV Class A | | 236,755 | 26,230 |
| Platform Specialty Products Corp. (a) | | 2,635,400 | 32,574 |
| The Chemours Co. LLC | | 943,100 | 43,203 |
| Westlake Chemical Corp. | | 106,400 | 11,408 |
| | | | 175,321 |
| Containers & Packaging - 0.4% | | | |
| Crown Holdings, Inc. (a) | | 277,300 | 12,553 |
| Metals & Mining - 1.8% | | | |
| First Quantum Minerals Ltd. | | 2,129,900 | 33,221 |
| Freeport-McMoRan, Inc. | | 1,107,900 | 18,280 |
| | | | 51,501 |
|
| TOTAL MATERIALS | | | 239,375 |
|
| TELECOMMUNICATION SERVICES - 2.5% | | | |
| Wireless Telecommunication Services - 2.5% | | | |
| T-Mobile U.S., Inc. (a) | | 1,148,300 | 68,898 |
| UTILITIES - 1.8% | | | |
| Electric Utilities - 1.1% | | | |
| Vistra Energy Corp. (a) | | 1,364,665 | 30,841 |
| Independent Power and Renewable Electricity Producers - 0.7% | | | |
| NRG Energy, Inc. | | 659,500 | 20,886 |
|
| TOTAL UTILITIES | | | 51,727 |
|
| TOTAL COMMON STOCKS | | | |
| (Cost $2,205,120) | | | 2,755,514 |
|
| Convertible Preferred Stocks - 0.6% | | | |
| INFORMATION TECHNOLOGY - 0.6% | | | |
| Internet Software & Services - 0.6% | | | |
| Lyft, Inc. Series I (d)(e) | | | |
| (Cost $15,000) | | 316,764 | 15,000 |
| | | Principal Amount (000s) | Value (000s) |
|
| Nonconvertible Bonds - 0.0% | | | |
| ENERGY - 0.0% | | | |
| Oil, Gas & Consumable Fuels - 0.0% | | | |
| Jupiter Resources, Inc. 8.5% 10/1/22 (c) | | | |
| (Cost $701) | | 825 | 413 |
| | | Shares | Value (000s) |
|
| Money Market Funds - 2.7% | | | |
| Fidelity Cash Central Fund, 1.96% (f) | | 40,950,186 | 40,958 |
| Fidelity Securities Lending Cash Central Fund 1.97% (f)(g) | | 34,672,893 | 34,676 |
| TOTAL MONEY MARKET FUNDS | | | |
| (Cost $75,633) | | | 75,634 |
| TOTAL INVESTMENT IN SECURITIES - 101.6% | | | |
| (Cost $2,296,454) | | | 2,846,561 |
| NET OTHER ASSETS (LIABILITIES) - (1.6)% | | | (43,741) |
| NET ASSETS - 100% | | | $2,802,820 |
Legend
(a) Non-income producing
(b) Security or a portion of the security is on loan at period end.
(c) Security exempt from registration under Rule 144A of the Securities Act of 1933. These securities may be resold in transactions exempt from registration, normally to qualified institutional buyers. At the end of the period, the value of these securities amounted to $958,000 or 0.0% of net assets.
(d) Restricted securities - Investment in securities not registered under the Securities Act of 1933 (excluding 144A issues). At the end of the period, the value of restricted securities (excluding 144A issues) amounted to $15,000,000 or 0.5% of net assets.
(e) Level 3 security
(f) Affiliated fund that is generally available only to investment companies and other accounts managed by Fidelity Investments. The rate quoted is the annualized seven-day yield of the fund at period end. A complete unaudited listing of the fund's holdings as of its most recent quarter end is available upon request. In addition, each Fidelity Central Fund's financial statements, which are not covered by the Fund's Report of Independent Registered Public Accounting Firm, are available on the SEC's website or upon request.
(g) Investment made with cash collateral received from securities on loan.
Additional information on each restricted holding is as follows:
| Security | Acquisition Date | Acquisition Cost (000s) |
| Lyft, Inc. Series I | 6/27/18 | $15,000 |
Affiliated Central Funds
Information regarding fiscal year to date income earned by the Fund from investments in Fidelity Central Funds is as follows:
| Fund | Income earned |
| | (Amounts in thousands) |
| Fidelity Cash Central Fund | $673 |
| Fidelity Securities Lending Cash Central Fund | 726 |
| Total | $1,399 |
Amounts in the income column in the above table include any capital gain distributions from underlying funds, which are presented in the corresponding line-item in the Statement of Operations if applicable.
Investment Valuation
The following is a summary of the inputs used, as of July 31, 2018, involving the Fund's assets and liabilities carried at fair value. The inputs or methodology used for valuing securities may not be an indication of the risk associated with investing in those securities. For more information on valuation inputs, and their aggregation into the levels used below, please refer to the Investment Valuation section in the accompanying Notes to Financial Statements.
| | Valuation Inputs at Reporting Date: |
| Description | Total | Level 1 | Level 2 | Level 3 |
| (Amounts in thousands) | | | | |
| Investments in Securities: | | | | |
| Equities: | | | | |
| Consumer Discretionary | $638,744 | $638,744 | $-- | $-- |
| Consumer Staples | 74,326 | 74,326 | -- | -- |
| Energy | 189,846 | 189,846 | -- | -- |
| Financials | 225,283 | 225,283 | -- | -- |
| Health Care | 114,415 | 114,415 | -- | -- |
| Industrials | 197,968 | 197,968 | -- | -- |
| Information Technology | 969,932 | 954,932 | -- | 15,000 |
| Materials | 239,375 | 239,375 | -- | -- |
| Telecommunication Services | 68,898 | 68,898 | -- | -- |
| Utilities | 51,727 | 51,727 | -- | -- |
| Corporate Bonds | 413 | -- | 413 | -- |
| Money Market Funds | 75,634 | 75,634 | -- | -- |
| Total Investments in Securities: | $2,846,561 | $2,831,148 | $413 | $15,000 |
Other Information
Distribution of investments by country or territory of incorporation, as a percentage of Total Net Assets, is as follows (Unaudited):
| United States of America | 81.9% |
| Cayman Islands | 5.7% |
| Canada | 4.4% |
| South Africa | 1.5% |
| Ireland | 1.1% |
| Others (Individually Less Than 1%) | 5.4% |
| | 100.0% |
See accompanying notes which are an integral part of the financial statements.
Financial Statements
Statement of Assets and Liabilities
| Amounts in thousands (except per-share amounts) | | July 31, 2018 |
| Assets | | |
Investment in securities, at value (including securities loaned of $26,093) — See accompanying schedule:
Unaffiliated issuers (cost $2,220,821) | $2,770,927 | |
| Fidelity Central Funds (cost $75,633) | 75,634 | |
| Total Investment in Securities (cost $2,296,454) | | $2,846,561 |
| Cash | | 5,279 |
| Receivable for investments sold | | 10,412 |
| Receivable for fund shares sold | | 277 |
| Dividends receivable | | 263 |
| Interest receivable | | 23 |
| Distributions receivable from Fidelity Central Funds | | 76 |
| Prepaid expenses | | 7 |
| Other receivables | | 118 |
| Total assets | | 2,863,016 |
| Liabilities | | |
| Payable for investments purchased | $20,829 | |
| Payable for fund shares redeemed | 2,771 | |
| Accrued management fee | 1,412 | |
| Other affiliated payables | 398 | |
| Other payables and accrued expenses | 106 | |
| Collateral on securities loaned | 34,680 | |
| Total liabilities | | 60,196 |
| Net Assets | | $2,802,820 |
| Net Assets consist of: | | |
| Paid in capital | | $1,957,651 |
| Distributions in excess of net investment income | | (1,170) |
| Accumulated undistributed net realized gain (loss) on investments and foreign currency transactions | | 296,232 |
| Net unrealized appreciation (depreciation) on investments and assets and liabilities in foreign currencies | | 550,107 |
| Net Assets | | $2,802,820 |
| Leveraged Company Stock: | | |
| Net Asset Value, offering price and redemption price per share ($2,371,819 ÷ 69,131 shares) | | $34.31 |
| Class K: | | |
| Net Asset Value, offering price and redemption price per share ($431,001 ÷ 12,528 shares) | | $34.40 |
See accompanying notes which are an integral part of the financial statements.
Statement of Operations
| Amounts in thousands | | Year ended July 31, 2018 |
| Investment Income | | |
| Dividends | | $23,638 |
| Interest | | 91 |
| Income from Fidelity Central Funds | | 1,399 |
| Total income | | 25,128 |
| Expenses | | |
| Management fee | $17,773 | |
| Transfer agent fees | 4,081 | |
| Accounting and security lending fees | 893 | |
| Custodian fees and expenses | 54 | |
| Independent trustees' fees and expenses | 13 | |
| Registration fees | 46 | |
| Audit | 64 | |
| Legal | 15 | |
| Miscellaneous | 23 | |
| Total expenses before reductions | 22,962 | |
| Expense reductions | (403) | |
| Total expenses after reductions | | 22,559 |
| Net investment income (loss) | | 2,569 |
| Realized and Unrealized Gain (Loss) | | |
| Net realized gain (loss) on: | | |
| Investment securities: | | |
| Unaffiliated issuers | 417,891 | |
| Fidelity Central Funds | (2) | |
| Foreign currency transactions | 68 | |
| Total net realized gain (loss) | | 417,957 |
| Change in net unrealized appreciation (depreciation) on: | | |
| Investment securities: | | |
| Unaffiliated issuers | (99,612) | |
| Fidelity Central Funds | (4) | |
| Total change in net unrealized appreciation (depreciation) | | (99,616) |
| Net gain (loss) | | 318,341 |
| Net increase (decrease) in net assets resulting from operations | | $320,910 |
See accompanying notes which are an integral part of the financial statements.
Statement of Changes in Net Assets
| Amounts in thousands | Year ended July 31, 2018 | Year ended July 31, 2017 |
| Increase (Decrease) in Net Assets | | |
| Operations | | |
| Net investment income (loss) | $2,569 | $17,016 |
| Net realized gain (loss) | 417,957 | 1,032,712 |
| Change in net unrealized appreciation (depreciation) | (99,616) | (535,359) |
| Net increase (decrease) in net assets resulting from operations | 320,910 | 514,369 |
| Distributions to shareholders from net investment income | (6,187) | (31,094) |
| Distributions to shareholders from net realized gain | (529,539) | (719,647) |
| Total distributions | (535,726) | (750,741) |
| Share transactions - net increase (decrease) | (115,492) | (65,270) |
| Redemption fees | – | 27 |
| Total increase (decrease) in net assets | (330,308) | (301,615) |
| Net Assets | | |
| Beginning of period | 3,133,128 | 3,434,743 |
| End of period | $2,802,820 | $3,133,128 |
| Other Information | | |
| Undistributed net investment income end of period | $– | $3,302 |
| Distributions in excess of net investment income end of period | $(1,170) | $– |
See accompanying notes which are an integral part of the financial statements.
Financial Highlights
Fidelity Leveraged Company Stock Fund
| Years ended July 31, | 2018 | 2017 | 2016 | 2015 | 2014 |
| Selected Per–Share Data | | | | | |
| Net asset value, beginning of period | $37.25 | $40.68 | $46.90 | $45.82 | $39.44 |
| Income from Investment Operations | | | | | |
| Net investment income (loss)A | .02 | .19 | .41 | .41 | .34 |
| Net realized and unrealized gain (loss) | 3.42B | 5.53 | (3.77) | 1.01 | 6.31 |
| Total from investment operations | 3.44 | 5.72 | (3.36) | 1.42 | 6.65 |
| Distributions from net investment income | (.07) | (.37) | (.40) | (.34) | (.27) |
| Distributions from net realized gain | (6.32) | (8.78) | (2.46) | – | – |
| Total distributions | (6.38)C | (9.15) | (2.86) | (.34) | (.27) |
| Redemption fees added to paid in capitalA | – | –D | –D | –D | –D |
| Net asset value, end of period | $34.31 | $37.25 | $40.68 | $46.90 | $45.82 |
| Total ReturnE | 10.91%B | 17.45% | (7.23)% | 3.12% | 16.96% |
| Ratios to Average Net AssetsF,G | | | | | |
| Expenses before reductions | .78% | .80% | .80% | .79% | .79% |
| Expenses net of fee waivers, if any | .78% | .79% | .80% | .78% | .79% |
| Expenses net of all reductions | .77% | .78% | .80% | .78% | .79% |
| Net investment income (loss) | .07% | .51% | 1.03% | .87% | .81% |
| Supplemental Data | | | | | |
| Net assets, end of period (in millions) | $2,372 | $2,644 | $2,861 | $3,755 | $4,207 |
| Portfolio turnover rateH | 67% | 100% | 9% | 4% | 10% |
A Calculated based on average shares outstanding during the period.
B Amount includes a reimbursement from the investment adviser for an error which amounted to $.06 per share. Excluding this reimbursement, the total return would have been 10.73%.
C Total distributions of $6.38 per share is comprised of distributions from net investment income of $.066 and distributions from net realized gain of $6.318 per share.
D Amount represents less than $.005 per share.
E Total returns would have been lower if certain expenses had not been reduced during the applicable periods shown.
F Fees and expenses of any underlying Fidelity Central Funds are not included in the Fund's expense ratio. The Fund indirectly bears its proportionate share of the expenses of any underlying Fidelity Central Funds.
G Expense ratios reflect operating expenses of the class. Expenses before reductions do not reflect amounts reimbursed by the investment adviser or reductions from brokerage service arrangements or reductions from other expense offset arrangements and do not represent the amount paid by the class during periods when reimbursements or reductions occur. Expenses net of fee waivers reflect expenses after reimbursement by the investment adviser but prior to reductions from brokerage service arrangements or other expense offset arrangements. Expenses net of all reductions represent the net expenses paid by the class.
H Amount does not include the portfolio activity of any underlying Fidelity Central Funds.
See accompanying notes which are an integral part of the financial statements.
Fidelity Leveraged Company Stock Fund Class K
| Years ended July 31, | 2018 | 2017 | 2016 | 2015 | 2014 |
| Selected Per–Share Data | | | | | |
| Net asset value, beginning of period | $37.34 | $40.76 | $47.00 | $45.91 | $39.52 |
| Income from Investment Operations | | | | | |
| Net investment income (loss)A | .06 | .23 | .46 | .46 | .40 |
| Net realized and unrealized gain (loss) | 3.42B | 5.55 | (3.79) | 1.03 | 6.31 |
| Total from investment operations | 3.48 | 5.78 | (3.33) | 1.49 | 6.71 |
| Distributions from net investment income | (.11) | (.42) | (.45) | (.40) | (.32) |
| Distributions from net realized gain | (6.32) | (8.78) | (2.46) | – | – |
| Total distributions | (6.42)C | (9.20) | (2.91) | (.40) | (.32) |
| Redemption fees added to paid in capitalA | – | –D | –D | –D | –D |
| Net asset value, end of period | $34.40 | $37.34 | $40.76 | $47.00 | $45.91 |
| Total ReturnE | 11.01%B | 17.60% | (7.14)% | 3.26% | 17.10% |
| Ratios to Average Net AssetsF,G | | | | | |
| Expenses before reductions | .67% | .68% | .68% | .67% | .67% |
| Expenses net of fee waivers, if any | .67% | .68% | .68% | .67% | .67% |
| Expenses net of all reductions | .66% | .67% | .68% | .67% | .67% |
| Net investment income (loss) | .18% | .63% | 1.15% | .99% | .92% |
| Supplemental Data | | | | | |
| Net assets, end of period (in millions) | $431 | $489 | $573 | $991 | $1,173 |
| Portfolio turnover rateH | 67% | 100% | 9% | 4% | 10% |
A Calculated based on average shares outstanding during the period.
B Amount includes a reimbursement form the investment adviser for an error which amounted to $.06 per share. Excluding this reimbursement, the total return would have been 10.83%.
C Total distributions of $6.42 per share is comprised of distributions from net investment income of $.106 and distributions from net realized gain of $6.318 per share.
D Amount represents less than $.005 per share.
E Total returns would have been lower if certain expenses had not been reduced during the applicable periods shown.
F Fees and expenses of any underlying Fidelity Central Funds are not included in the Fund's expense ratio. The Fund indirectly bears its proportionate share of the expenses of any underlying Fidelity Central Funds.
G Expense ratios reflect operating expenses of the class. Expenses before reductions do not reflect amounts reimbursed by the investment adviser or reductions from brokerage service arrangements or reductions from other expense offset arrangements and do not represent the amount paid by the class during periods when reimbursements or reductions occur. Expenses net of fee waivers reflect expenses after reimbursement by the investment adviser but prior to reductions from brokerage service arrangements or other expense offset arrangements. Expenses net of all reductions represent the net expenses paid by the class.
H Amount does not include the portfolio activity of any underlying Fidelity Central Funds.
See accompanying notes which are an integral part of the financial statements.
Notes to Financial Statements
For the period ended July 31, 2018
(Amounts in thousands except percentages)
1. Organization.
Fidelity Leveraged Company Stock Fund (the Fund) is a fund of Fidelity Securities Fund (the Trust) and is authorized to issue an unlimited number of shares. The Trust is registered under the Investment Company Act of 1940, as amended (the 1940 Act), as an open-end management investment company organized as a Massachusetts business trust. The Fund offers Leveraged Company Stock and Class K shares, each of which has equal rights as to assets and voting privileges. Each class has exclusive voting rights with respect to matters that affect that class.
2. Investments in Fidelity Central Funds.
The Fund invests in Fidelity Central Funds, which are open-end investment companies generally available only to other investment companies and accounts managed by the investment adviser and its affiliates. The Fund's Schedule of Investments lists each of the Fidelity Central Funds held as of period end, if any, as an investment of the Fund, but does not include the underlying holdings of each Fidelity Central Fund. As an Investing Fund, the Fund indirectly bears its proportionate share of the expenses of the underlying Fidelity Central Funds.
The Money Market Central Funds seek preservation of capital and current income and are managed by Fidelity Investments Money Management, Inc. (FIMM), an affiliate of the investment adviser. Annualized expenses of the Money Market Central Funds as of their most recent shareholder report date are less than .005%.
A complete unaudited list of holdings for each Fidelity Central Fund is available upon request or at the Securities and Exchange Commission (the SEC) website at www.sec.gov. In addition, the financial statements of the Fidelity Central Funds, which are not covered by the Fund's Report of Independent Registered Public Accounting Firm, are available on the SEC website or upon request.
3. Significant Accounting Policies.
The Fund is an investment company and applies the accounting and reporting guidance of the Financial Accounting Standards Board (FASB) Accounting Standards Codification Topic 946 Financial Services – Investments Companies. The financial statements have been prepared in conformity with accounting principles generally accepted in the United States of America (GAAP), which require management to make certain estimates and assumptions at the date of the financial statements. Actual results could differ from those estimates. Subsequent events, if any, through the date that the financial statements were issued have been evaluated in the preparation of the financial statements. The following summarizes the significant accounting policies of the Fund:
Investment Valuation. Investments are valued as of 4:00 p.m. Eastern time on the last calendar day of the period. The Board of Trustees (the Board) has delegated the day to day responsibility for the valuation of the Fund's investments to the Fair Value Committee (the Committee) established by the Fund's investment adviser. In accordance with valuation policies and procedures approved by the Board, the Fund attempts to obtain prices from one or more third party pricing vendors or brokers to value its investments. When current market prices, quotations or currency exchange rates are not readily available or reliable, investments will be fair valued in good faith by the Committee, in accordance with procedures adopted by the Board. Factors used in determining fair value vary by investment type and may include market or investment specific events, changes in interest rates and credit quality. The frequency with which these procedures are used cannot be predicted and they may be utilized to a significant extent. The Committee oversees the Fund's valuation policies and procedures and reports to the Board on the Committee's activities and fair value determinations. The Board monitors the appropriateness of the procedures used in valuing the Fund's investments and ratifies the fair value determinations of the Committee.
The Fund categorizes the inputs to valuation techniques used to value its investments into a disclosure hierarchy consisting of three levels as shown below:
- Level 1 – quoted prices in active markets for identical investments
- Level 2 – other significant observable inputs (including quoted prices for similar investments, interest rates, prepayment speeds, etc.)
- Level 3 – unobservable inputs (including the Fund's own assumptions based on the best information available)
Valuation techniques used to value the Fund's investments by major category are as follows:
Equity securities, including restricted securities, for which market quotations are readily available, are valued at the last reported sale price or official closing price as reported by a third party pricing vendor on the primary market or exchange on which they are traded and are categorized as Level 1 in the hierarchy. In the event there were no sales during the day or closing prices are not available, securities are valued at the last quoted bid price or may be valued using the last available price and are generally categorized as Level 2 in the hierarchy. For foreign equity securities, when market or security specific events arise, comparisons to the valuation of American Depositary Receipts (ADRs), futures contracts, Exchange-Traded Funds (ETFs) and certain indexes as well as quoted prices for similar securities may be used and would be categorized as Level 2 in the hierarchy. Utilizing these techniques may result in transfers between Level 1 and Level 2. For equity securities, including restricted securities, where observable inputs are limited, assumptions about market activity and risk are used and these securities may be categorized as Level 3 in the hierarchy.
Debt securities, including restricted securities, are valued based on evaluated prices received from third party pricing vendors or from brokers who make markets in such securities. Corporate bonds are valued by pricing vendors who utilize matrix pricing which considers yield or price of bonds of comparable quality, coupon, maturity and type or by broker-supplied prices. When independent prices are unavailable or unreliable, debt securities may be valued utilizing pricing methodologies which consider similar factors that would be used by third party pricing vendors. Debt securities are generally categorized as Level 2 in the hierarchy but may be Level 3 depending on the circumstances.
Investments in open-end mutual funds, including the Fidelity Central Funds, are valued at their closing net asset value (NAV) each business day and are categorized as Level 1 in the hierarchy.
Changes in valuation techniques may result in transfers in or out of an assigned level within the disclosure hierarchy. The aggregate value of investments by input level as of July 31, 2018 is included at the end of the Fund's Schedule of Investments.
Foreign Currency. The Fund may use foreign currency contracts to facilitate transactions in foreign-denominated securities. Gains and losses from these transactions may arise from changes in the value of the foreign currency or if the counterparties do not perform under the contracts' terms.
Foreign-denominated assets, including investment securities, and liabilities are translated into U.S. dollars at the exchange rates at period end. Purchases and sales of investment securities, income and dividends received and expenses denominated in foreign currencies are translated into U.S. dollars at the exchange rate in effect on the transaction date.
The effects of exchange rate fluctuations on investments are included with the net realized and unrealized gain (loss) on investment securities. Other foreign currency transactions resulting in realized and unrealized gain (loss) are disclosed separately.
Investment Transactions and Income. For financial reporting purposes, the Fund's investment holdings and NAV include trades executed through the end of the last business day of the period. The NAV per share for processing shareholder transactions is calculated as of the close of business of the New York Stock Exchange (NYSE), normally 4:00 p.m. Eastern time and includes trades executed through the end of the prior business day. Gains and losses on securities sold are determined on the basis of identified cost and include proceeds received from litigation. Dividend income is recorded on the ex-dividend date, except for certain dividends from foreign securities where the ex-dividend date may have passed, which are recorded as soon as the Fund is informed of the ex-dividend date. Non-cash dividends included in dividend income, if any, are recorded at the fair market value of the securities received. Income and capital gain distributions from Fidelity Central Funds, if any, are recorded on the ex-dividend date. Certain distributions received by the Fund represent a return of capital or capital gain. The Fund determines the components of these distributions subsequent to the ex-dividend date, based upon receipt of tax filings or other correspondence relating to the underlying investment. These distributions are recorded as a reduction of cost of investments and/or as a realized gain. Interest income is accrued as earned and includes coupon interest and amortization of premium and accretion of discount on debt securities as applicable. Investment income is recorded net of foreign taxes withheld where recovery of such taxes is uncertain.
Class Allocations and Expenses. Investment income, realized and unrealized capital gains and losses, common expenses of the Fund, and certain fund-level expense reductions, if any, are allocated daily on a pro-rata basis to each class based on the relative net assets of each class to the total net assets of the Fund. Each class differs with respect to transfer agent fees incurred. Certain expense reductions may also differ by class. For the reporting period, the allocated portion of income and expenses to each class as a percent of its average net assets may vary due to the timing of recording these transactions in relation to fluctuating net assets of the classes. Expenses directly attributable to a fund are charged to that fund. Expenses attributable to more than one fund are allocated among the respective funds on the basis of relative net assets or other appropriate methods. Expense estimates are accrued in the period to which they relate and adjustments are made when actual amounts are known.
Income Tax Information and Distributions to Shareholders. Each year, the Fund intends to qualify as a regulated investment company under Subchapter M of the Internal Revenue Code, including distributing substantially all of its taxable income and realized gains. As a result, no provision for U.S. Federal income taxes is required. As of July 31, 2018, the Fund did not have any unrecognized tax benefits in the financial statements; nor is the Fund aware of any tax positions for which it is reasonably possible that the total amounts of unrecognized tax benefits will significantly change in the next twelve months. The Fund files a U.S. federal tax return, in addition to state and local tax returns as required. The Fund's federal income tax returns are subject to examination by the Internal Revenue Service (IRS) for a period of three fiscal years after they are filed. State and local tax returns may be subject to examination for an additional fiscal year depending on the jurisdiction. Foreign taxes are provided for based on the Fund's understanding of the tax rules and rates that exist in the foreign markets in which it invests.
Distributions are declared and recorded on the ex-dividend date. Income and capital gain distributions are declared separately for each class. Income and capital gain distributions are determined in accordance with income tax regulations, which may differ from GAAP. In addition, the Fund claimed a portion of the payment made to redeeming shareholders as a distribution for income tax purposes.
Capital accounts within the financial statements are adjusted for permanent book-tax differences. These adjustments have no impact on net assets or the results of operations. Capital accounts are not adjusted for temporary book-tax differences which will reverse in a subsequent period.
Book-tax differences are primarily due to foreign currency transactions, market discount, partnerships and losses deferred due to wash sales and excise tax regulations.
As of period end, the cost and unrealized appreciation (depreciation) in securities, and derivatives if applicable, for federal income tax purposes were as follows:
| Gross unrealized appreciation | $640,048 |
| Gross unrealized depreciation | (90,147) |
| Net unrealized appreciation (depreciation) | $549,901 |
| Tax Cost | $2,296,660 |
The tax-based components of distributable earnings as of period end were as follows:
| Undistributed ordinary income | $5,756 |
| Undistributed long-term capital gain | $290,712 |
| Net unrealized appreciation (depreciation) on securities and other investments | $549,901 |
The tax character of distributions paid was as follows:
| | July 31, 2018 | July 31, 2017 |
| Ordinary Income | $17,016 | $ 31,094 |
| Long-term Capital Gains | 518,710 | 719,647 |
| Total | $535,726 | $ 750,741 |
The Fund intends to elect to defer to its next fiscal year $1,199,814 of ordinary losses recognized during the period January 1, 2018 to July 31, 2018.
Restricted Securities. The Fund may invest in securities that are subject to legal or contractual restrictions on resale. These securities generally may be resold in transactions exempt from registration or to the public if the securities are registered. Disposal of these securities may involve time-consuming negotiations and expense, and prompt sale at an acceptable price may be difficult. Information regarding restricted securities is included at the end of the Fund's Schedule of Investments.
4. Purchases and Sales of Investments.
Purchases and sales of securities, other than short-term securities, aggregated $1,975,117 and $2,554,689, respectively.
5. Fees and Other Transactions with Affiliates.
Management Fee. Fidelity Management & Research Company (the investment adviser) and its affiliates provide the Fund with investment management related services for which the Fund pays a monthly management fee. The management fee is the sum of an individual fund fee rate that is based on an annual rate of .35% of the Fund's average net assets and an annualized group fee rate that averaged .24% during the period. The group fee rate is based upon the average net assets of all the mutual funds advised by the investment adviser, including any mutual funds previously advised by the investment adviser that are currently advised by Fidelity SelectCo, LLC, an affiliate of the investment adviser. The group fee rate decreases as assets under management increase and increases as assets under management decrease. For the reporting period, the total annual management fee rate was .59% of the Fund's average net assets.
Transfer Agent Fees. Fidelity Investments Institutional Operations Company, Inc., (FIIOC), an affiliate of the investment adviser, is the transfer, dividend disbursing and shareholder servicing agent for each class of the Fund. FIIOC receives account fees and asset-based fees that vary according to the account size and type of account of the shareholders of Leveraged Company Stock, except for Class K. FIIOC receives an asset-based fee of Class K's average net assets. FIIOC pays for typesetting, printing and mailing of shareholder reports, except proxy statements.
For the period, transfer agent fees for each class were as follows:
| | Amount | % of Class-Level Average Net Assets |
| Leveraged Company Stock | $3,867 | .15 |
| Class K | 214 | .05 |
| | $4,081 | |
Accounting and Security Lending Fees. Fidelity Service Company, Inc. (FSC), an affiliate of the investment adviser, maintains the Fund's accounting records. The accounting fee is based on the level of average net assets for each month. Under a separate contract, FSC administers the security lending program. The security lending fee is based on the number and duration of lending transactions. For the period, the fees were equivalent to an annual rate of .03%.
Brokerage Commissions. The Fund placed a portion of its portfolio transactions with brokerage firms which are affiliates of the investment adviser. Brokerage commissions are included in net realized gain (loss) and change in net unrealized appreciation (depreciation) in the Statement of Operations. The commissions paid to these affiliated firms were $49 for the period.
Interfund Trades. The Fund may purchase from or sell securities to other Fidelity Funds under procedures adopted by the Board. The procedures have been designed to ensure these interfund trades are executed in accordance with Rule 17a-7 of the 1940 Act. Interfund trades are included within the respective purchases and sales amounts shown in the Purchases and Sales of Investments note.
Other. During the period, the investment adviser reimbursed the Fund $5,279 for an error which is included in the Change in net unrealized appreciation (depreciation) on unaffiliated investment securities in the accompanying Statement of Operations.
6. Committed Line of Credit.
The Fund participates with other funds managed by the investment adviser or an affiliate in a $4.25 billion credit facility (the "line of credit") to be utilized for temporary or emergency purposes to fund shareholder redemptions or for other short-term liquidity purposes. The Fund has agreed to pay commitment fees on its pro-rata portion of the line of credit, which amounted to $9 and is reflected in Miscellaneous expenses on the Statement of Operations. During the period, the Fund did not borrow on this line of credit.
7. Security Lending.
The Fund lends portfolio securities through a lending agent from time to time in order to earn additional income. For equity securities, a lending agent is used and may loan securities to certain qualified borrowers, including Fidelity Capital Markets (FCM), a broker-dealer affiliated with the Fund. On the settlement date of the loan, the Fund receives collateral (in the form of U.S. Treasury obligations, letters of credit and/or cash) against the loaned securities and maintains collateral in an amount not less than 100% of the market value of the loaned securities during the period of the loan. The market value of the loaned securities is determined at the close of business of the Fund and any additional required collateral is delivered to the Fund on the next business day. The Fund or borrower may terminate the loan at any time, and if the borrower defaults on its obligation to return the securities loaned because of insolvency or other reasons, the Fund may apply collateral received from the borrower against the obligation. The Fund may experience delays and costs in recovering the securities loaned. Any cash collateral received is invested in the Fidelity Securities Lending Cash Central Fund. The value of loaned securities and cash collateral at period end are disclosed on the Fund's Statement of Assets and Liabilities. At period end, there were no security loans outstanding with FCM. Security lending income represents the income earned on investing cash collateral, less rebates paid to borrowers and any lending agent fees associated with the loan, plus any premium payments received for lending certain types of securities. Security lending income is presented in the Statement of Operations as a component of income from Fidelity Central Funds. Total security lending income during the period amounted to $726, including $2 from securities loaned to FCM.
8. Expense Reductions.
Commissions paid to certain brokers with whom the investment adviser, or its affiliates, places trades on behalf of the Fund include an amount in addition to trade execution, which may be rebated back to the Fund to offset certain expenses. This amount totaled $370 for the period. In addition, through arrangements with the Fund's custodian, credits realized as a result of certain uninvested cash balances were used to reduce the Fund's expenses. During the period, these credits reduced the Fund's custody expenses by $2.
In addition, during the period the investment adviser reimbursed and/or waived a portion of fund-level operating expenses in the amount of $31.
9. Distributions to Shareholders.
Distributions to shareholders of each class were as follows:
| | Year ended
July 31, 2018 | Year ended
July 31, 2017 |
| From net investment income | | |
| Leveraged Company Stock | $4,788 | $25,432 |
| Class K | 1,399 | 5,662 |
| Total | $6,187 | $31,094 |
| From net realized gain | | |
| Leveraged Company Stock | $447,843 | $601,482 |
| Class K | 81,696 | 118,165 |
| Total | $529,539 | $719,647 |
10. Share Transactions.
Share transactions for each class were as follows and may contain automatic conversions between classes or exchanges between affiliated funds:
| | Shares | Shares | Dollars | Dollars |
| | Year ended July 31, 2018 | Year ended July 31, 2017 | Year ended July 31, 2018 | Year ended July 31, 2017 |
| Leveraged Company Stock | | | | |
| Shares sold | 2,261 | 3,277 | $77,379 | $119,066 |
| Reinvestment of distributions | 13,261 | 17,338 | 427,578 | 589,414 |
| Shares redeemed | (17,365) | (19,987) | (594,962) | (729,496) |
| Net increase (decrease) | (1,843) | 628 | $(90,005) | $(21,016) |
| Class K | | | | |
| Shares sold | 989 | 1,480 | $34,063 | $53,751 |
| Reinvestment of distributions | 2,572 | 3,634 | 83,096 | 123,827 |
| Shares redeemed | (4,138) | (6,074) | (142,646) | (221,832) |
| Net increase (decrease) | (577) | (960) | $(25,487) | $(44,254) |
11. Other.
The Fund's organizational documents provide former and current trustees and officers with a limited indemnification against liabilities arising in connection with the performance of their duties to the Fund. In the normal course of business, the Fund may also enter into contracts that provide general indemnifications. The Fund's maximum exposure under these arrangements is unknown as this would be dependent on future claims that may be made against the Fund. The risk of material loss from such claims is considered remote.
Report of Independent Registered Public Accounting Firm
To the Board of Trustees of Fidelity Securities Fund and Shareholders of Fidelity Leveraged Company Stock Fund:
Opinion on the Financial Statements
We have audited the accompanying statement of assets and liabilities, including the schedule of investments, of Fidelity Leveraged Company Stock Fund (one of the funds constituting Fidelity Securities Fund, referred to hereafter as the "Fund") as of July 31, 2018, the related statement of operations for the year ended July 31, 2018, the statement of changes in net assets for each of the two years in the period ended July 31, 2018, including the related notes, and the financial highlights for each of the five years in the period ended July 31, 2018 (collectively referred to as the “financial statements”). In our opinion, the financial statements present fairly, in all material respects, the financial position of the Fund as of July 31, 2018, the results of its operations for the year then ended, the changes in its net assets for each of the two years in the period ended July 31, 2018 and the financial highlights for each of the five years in the period ended July 31, 2018 in conformity with accounting principles generally accepted in the United States of America.
Basis for Opinion
These financial statements are the responsibility of the Fund’s management. Our responsibility is to express an opinion on the Fund’s financial statements based on our audits. We are a public accounting firm registered with the Public Company Accounting Oversight Board (United States) (“PCAOB”) and are required to be independent with respect to the Fund in accordance with the U.S. federal securities laws and the applicable rules and regulations of the Securities and Exchange Commission and the PCAOB.
We conducted our audits of these financial statements in accordance with the standards of the PCAOB. Those standards require that we plan and perform the audit to obtain reasonable assurance about whether the financial statements are free of material misstatement, whether due to error or fraud.
Our audits included performing procedures to assess the risks of material misstatement of the financial statements, whether due to error or fraud, and performing procedures that respond to those risks. Such procedures included examining, on a test basis, evidence regarding the amounts and disclosures in the financial statements. Our audits also included evaluating the accounting principles used and significant estimates made by management, as well as evaluating the overall presentation of the financial statements. Our procedures included confirmation of securities owned as of July 31, 2018 by correspondence with the custodian and brokers; when replies were not received from brokers, we performed other auditing procedures. We believe that our audits provide a reasonable basis for our opinion.
PricewaterhouseCoopers LLP
Boston, Massachusetts
September 14, 2018
We have served as the auditor of one or more investment companies in the Fidelity group of funds since 1932.
Trustees and Officers
The Trustees, Members of the Advisory Board (if any), and officers of the trust and fund, as applicable, are listed below. The Board of Trustees governs the fund and is responsible for protecting the interests of shareholders. The Trustees are experienced executives who meet periodically throughout the year to oversee the fund's activities, review contractual arrangements with companies that provide services to the fund, oversee management of the risks associated with such activities and contractual arrangements, and review the fund's performance. Except for Jonathan Chiel, each of the Trustees oversees 286 funds. Mr. Chiel oversees 150 funds.
The Trustees hold office without limit in time except that (a) any Trustee may resign; (b) any Trustee may be removed by written instrument, signed by at least two-thirds of the number of Trustees prior to such removal; (c) any Trustee who requests to be retired or who has become incapacitated by illness or injury may be retired by written instrument signed by a majority of the other Trustees; and (d) any Trustee may be removed at any special meeting of shareholders by a two-thirds vote of the outstanding voting securities of the trust. Each Trustee who is not an interested person (as defined in the 1940 Act) of the trust and the fund is referred to herein as an Independent Trustee. Each Independent Trustee shall retire not later than the last day of the calendar year in which his or her 75th birthday occurs. The Independent Trustees may waive this mandatory retirement age policy with respect to individual Trustees. Officers and Advisory Board Members hold office without limit in time, except that any officer or Advisory Board Member may resign or may be removed by a vote of a majority of the Trustees at any regular meeting or any special meeting of the Trustees. Except as indicated, each individual has held the office shown or other offices in the same company for the past five years.
The fund’s Statement of Additional Information (SAI) includes more information about the Trustees. To request a free copy, call Fidelity at 1-800-544-8544.
Experience, Skills, Attributes, and Qualifications of the Trustees. The Governance and Nominating Committee has adopted a statement of policy that describes the experience, qualifications, attributes, and skills that are necessary and desirable for potential Independent Trustee candidates (Statement of Policy). The Board believes that each Trustee satisfied at the time he or she was initially elected or appointed a Trustee, and continues to satisfy, the standards contemplated by the Statement of Policy. The Governance and Nominating Committee also engages professional search firms to help identify potential Independent Trustee candidates who have the experience, qualifications, attributes, and skills consistent with the Statement of Policy. From time to time, additional criteria based on the composition and skills of the current Independent Trustees, as well as experience or skills that may be appropriate in light of future changes to board composition, business conditions, and regulatory or other developments, have also been considered by the professional search firms and the Governance and Nominating Committee. In addition, the Board takes into account the Trustees' commitment and participation in Board and committee meetings, as well as their leadership of standing and ad hoc committees throughout their tenure.
In determining that a particular Trustee was and continues to be qualified to serve as a Trustee, the Board has considered a variety of criteria, none of which, in isolation, was controlling. The Board believes that, collectively, the Trustees have balanced and diverse experience, qualifications, attributes, and skills, which allow the Board to operate effectively in governing the fund and protecting the interests of shareholders. Information about the specific experience, skills, attributes, and qualifications of each Trustee, which in each case led to the Board's conclusion that the Trustee should serve (or continue to serve) as a trustee of the fund, is provided below.
Board Structure and Oversight Function. James C. Curvey is an interested person and currently serves as Chairman. The Trustees have determined that an interested Chairman is appropriate and benefits shareholders because an interested Chairman has a personal and professional stake in the quality and continuity of services provided to the fund. Independent Trustees exercise their informed business judgment to appoint an individual of their choosing to serve as Chairman, regardless of whether the Trustee happens to be independent or a member of management. The Independent Trustees have determined that they can act independently and effectively without having an Independent Trustee serve as Chairman and that a key structural component for assuring that they are in a position to do so is for the Independent Trustees to constitute a substantial majority for the Board. The Independent Trustees also regularly meet in executive session. Ned C. Lautenbach serves as Chairman of the Independent Trustees and as such (i) acts as a liaison between the Independent Trustees and management with respect to matters important to the Independent Trustees and (ii) with management prepares agendas for Board meetings.
Fidelity® funds are overseen by different Boards of Trustees. The fund's Board oversees Fidelity's high income and certain equity funds, and other Boards oversee Fidelity's investment-grade bond, money market, asset allocation, and other equity funds. The asset allocation funds may invest in Fidelity® funds overseen by the fund's Board. The use of separate Boards, each with its own committee structure, allows the Trustees of each group of Fidelity® funds to focus on the unique issues of the funds they oversee, including common research, investment, and operational issues. On occasion, the separate Boards establish joint committees to address issues of overlapping consequences for the Fidelity® funds overseen by each Board.
The Trustees operate using a system of committees to facilitate the timely and efficient consideration of all matters of importance to the Trustees, the fund, and fund shareholders and to facilitate compliance with legal and regulatory requirements and oversight of the fund's activities and associated risks. The Board, acting through its committees, has charged FMR and its affiliates with (i) identifying events or circumstances the occurrence of which could have demonstrably adverse effects on the fund's business and/or reputation; (ii) implementing processes and controls to lessen the possibility that such events or circumstances occur or to mitigate the effects of such events or circumstances if they do occur; and (iii) creating and maintaining a system designed to evaluate continuously business and market conditions in order to facilitate the identification and implementation processes described in (i) and (ii) above. Because the day-to-day operations and activities of the fund are carried out by or through FMR, its affiliates, and other service providers, the fund's exposure to risks is mitigated but not eliminated by the processes overseen by the Trustees. While each of the Board's committees has responsibility for overseeing different aspects of the fund's activities, oversight is exercised primarily through the Operations, Audit, and Compliance Committees. In addition, the Independent Trustees have worked with Fidelity to enhance the Board's oversight of investment and financial risks, legal and regulatory risks, technology risks, and operational risks, including the development of additional risk reporting to the Board. Appropriate personnel, including but not limited to the fund's Chief Compliance Officer (CCO), FMR's internal auditor, the independent accountants, the fund's Treasurer and portfolio management personnel, make periodic reports to the Board's committees, as appropriate, including an annual review of Fidelity's risk management program for the Fidelity® funds. The responsibilities of each standing committee, including their oversight responsibilities, are described further under "Standing Committees of the Trustees."
Interested Trustees*:
Correspondence intended for a Trustee who is an interested person may be sent to Fidelity Investments, 245 Summer Street, Boston, Massachusetts 02210.
Name, Year of Birth; Principal Occupations and Other Relevant Experience+
Jonathan Chiel (1957)
Year of Election or Appointment: 2016
Trustee
Mr. Chiel also serves as Trustee of other Fidelity® funds. Mr. Chiel is Executive Vice President and General Counsel for FMR LLC (diversified financial services company, 2012-present). Previously, Mr. Chiel served as general counsel (2004-2012) and senior vice president and deputy general counsel (2000-2004) for John Hancock Financial Services; a partner with Choate, Hall & Stewart (1996-2000) (law firm); and an Assistant United States Attorney for the United States Attorney’s Office of the District of Massachusetts (1986-95), including Chief of the Criminal Division (1993-1995). Mr. Chiel is a director on the boards of the Boston Bar Foundation and the Maimonides School.
James C. Curvey (1935)
Year of Election or Appointment: 2007
Trustee
Chairman of the Board of Trustees
Mr. Curvey also serves as Trustee of other Fidelity® funds. Mr. Curvey is Vice Chairman (2007-present) and Director of FMR LLC (diversified financial services company). In addition, Mr. Curvey is an Overseer Emeritus for the Boston Symphony Orchestra, a Director of Artis-Naples, and a Trustee of Brewster Academy in Wolfeboro, New Hampshire. Previously, Mr. Curvey served as a Director of Fidelity Research & Analysis Co. (investment adviser firm, 2009-2018), Director of Fidelity Investments Money Management, Inc. (investment adviser firm, 2009-2014) and a Director of FMR and FMR Co., Inc. (investment adviser firms, 2007-2014).
Charles S. Morrison (1960)
Year of Election or Appointment: 2014
Trustee
Mr. Morrison also serves as Trustee of other funds. He serves as President of Fidelity SelectCo, LLC (investment adviser firm, 2017-present) and Fidelity Management & Research Company (FMR) (investment adviser firm, 2016-present), a Director of Fidelity Investments Money Management, Inc. (FIMM) (investment adviser firm, 2014-present), Director of Fidelity SelectCo, LLC (investment adviser firm, 2014-present), President, Asset Management (2014-present), and is an employee of Fidelity Investments. Previously, Mr. Morrison served as Vice President of Fidelity's Fixed Income and Asset Allocation Funds (2012-2014), President, Fixed Income (2011-2014), Vice President of Fidelity's Money Market Funds (2005-2009), President, Money Market Group Leader of FMR (investment adviser firm, 2009), and Senior Vice President, Money Market Group of FMR (2004-2009). Mr. Morrison also served as Vice President of Fidelity's Bond Funds (2002-2005), certain Balanced Funds (2002-2005), and certain Asset Allocation Funds (2002-2007), and as Senior Vice President (2002-2005) of Fidelity's Bond Division.
* Determined to be an “Interested Trustee” by virtue of, among other things, his or her affiliation with the trust or various entities under common control with FMR.
+ The information includes the Trustee's principal occupation during the last five years and other information relating to the experience, attributes, and skills relevant to the Trustee's qualifications to serve as a Trustee, which led to the conclusion that the Trustee should serve as a Trustee for the fund.
Independent Trustees:
Correspondence intended for an Independent Trustee may be sent to Fidelity Investments, P.O. Box 55235, Boston, Massachusetts 02205-5235.
Name, Year of Birth; Principal Occupations and Other Relevant Experience+
Dennis J. Dirks (1948)
Year of Election or Appointment: 2005
Trustee
Mr. Dirks also serves as Trustee of other Fidelity® funds. Prior to his retirement in May 2003, Mr. Dirks was Chief Operating Officer and a member of the Board of The Depository Trust & Clearing Corporation (DTCC). He also served as President, Chief Operating Officer, and Board member of The Depository Trust Company (DTC) and President and Board member of the National Securities Clearing Corporation (NSCC). In addition, Mr. Dirks served as Chief Executive Officer and Board member of the Government Securities Clearing Corporation, Chief Executive Officer and Board member of the Mortgage-Backed Securities Clearing Corporation, as a Trustee and a member of the Finance Committee of Manhattan College (2005-2008), as a Trustee and a member of the Finance Committee of AHRC of Nassau County (2006-2008), as a member of the Independent Directors Council (IDC) Governing Council (2010-2015), and as a member of the Board of Directors for The Brookville Center for Children’s Services, Inc. (2009-2017). Mr. Dirks is a member of the Finance Committee (2016-present), Board of Directors (2017-present) and Board of Trustees (2018-present) and is Treasurer (2018-present) of the Asolo Repertory Theatre.
Donald F. Donahue (1950)
Year of Election or Appointment: 2018
Trustee
Mr. Donahue also serves as a Trustee of other Fidelity® funds. Mr. Donahue is President and Chief Executive Officer of Miranda Partners, LLC (risk consulting for the financial services industry, 2012-present). Previously, Mr. Donahue served as a Member of the Advisory Board of certain Fidelity® funds (2015-2018) and Chief Executive Officer (2006-2012), Chief Operating Officer (2003-2006), and Managing Director, Customer Marketing and Development (1999-2003) of The Depository Trust & Clearing Corporation (financial markets infrastructure). Mr. Donahue serves as a Member (2007-present) and Co-Chairman (2016-present) of the Board of Directors of United Way of New York, Member of the Board of Directors of NYC Leadership Academy (2012-present) and Member of the Board of Advisors of Ripple Labs, Inc. (financial services, 2015-present). He also served as Chairman (2010-2012) and Member of the Board of Directors (2012-2013) of Omgeo, LLC (financial services), Treasurer of United Way of New York (2012-2016), and Member of the Board of Directors of XBRL US (financial services non-profit, 2009-2012) and the International Securities Services Association (2009-2012).
Alan J. Lacy (1953)
Year of Election or Appointment: 2008
Trustee
Mr. Lacy also serves as Trustee of other Fidelity® funds. Mr. Lacy serves as a Director of Bristol-Myers Squibb Company (global pharmaceuticals, 2008-present). He is a Trustee of the California Chapter of The Nature Conservancy (2015-present) and a Director of the Center for Advanced Study in the Behavioral Sciences at Stanford University (2015-present). In addition, Mr. Lacy served as Senior Adviser (2007-2014) of Oak Hill Capital Partners, L.P. (private equity) and also served as Chief Executive Officer (2005) and Vice Chairman (2005-2006) of Sears Holdings Corporation (retail) and Chief Executive Officer and Chairman of the Board of Sears, Roebuck and Co. (retail, 2000-2005). Previously, Mr. Lacy served as Chairman (2014-2017) and a member (2010-2017) of the Board of Directors of Dave & Buster’s Entertainment, Inc. (restaurant and entertainment complexes), as Chairman (2008-2011) and a member (2006-2015) of the Board of Trustees of the National Parks Conservation Association, and as a member of the Board of Directors for The Hillman Companies, Inc. (hardware wholesalers, 2010-2014), Earth Fare, Inc. (retail grocery, 2010-2014), and The Western Union Company (global money transfer, 2006-2011).
Ned C. Lautenbach (1944)
Year of Election or Appointment: 2000
Trustee
Chairman of the Independent Trustees
Mr. Lautenbach also serves as Trustee of other Fidelity® funds. Mr. Lautenbach currently serves as Vice Chair of the Board of Governors, State University System of Florida (2013-present) and is a member of the Council on Foreign Relations (1994-present). He is also a member and has most recently served as Chairman of the Board of Directors of Artis-Naples (2012-present). Previously, Mr. Lautenbach served as a member and then Lead Director of the Board of Directors of Eaton Corporation (diversified industrial, 1997-2016). He was also a Partner and Advisory Partner at Clayton, Dubilier & Rice, LLC (private equity investment, 1998-2010), as well as a Director of Sony Corporation (2006-2007). In addition, Mr. Lautenbach also had a 30-year career with IBM (technology company) during which time he served as Senior Vice President and a member of the Corporate Executive Committee (1968-1998).
Joseph Mauriello (1944)
Year of Election or Appointment: 2008
Trustee
Mr. Mauriello also serves as Trustee of other Fidelity® funds. Prior to his retirement in January 2006, Mr. Mauriello served in numerous senior management positions including Deputy Chairman and Chief Operating Officer (2004-2005), and Vice Chairman of Financial Services (2002-2004) of KPMG LLP US (professional services, 1965-2005). Mr. Mauriello currently serves as a member of the Board of Directors of XL Group plc. (global insurance and re-insurance, 2006-present) and the Independent Directors Council (IDC) Governing Council (2015-present). Previously, Mr. Mauriello served as a Director of the Hamilton Funds of the Bank of New York (2006-2007) and of Arcadia Resources Inc. (health care services and products, 2007-2012).
Cornelia M. Small (1944)
Year of Election or Appointment: 2005
Trustee
Ms. Small also serves as Trustee of other Fidelity® funds. Ms. Small is a member of the Board of Directors (2009-present) and Chair of the Investment Committee (2010-present) of the Teagle Foundation. Ms. Small also serves on the Investment Committee of the Berkshire Taconic Community Foundation (2008-present). Previously, Ms. Small served as Chairperson (2002-2008) and a member of the Investment Committee and Chairperson (2008-2012) and a member of the Board of Trustees of Smith College. In addition, Ms. Small served as Chief Investment Officer, Director of Global Equity Investments, and a member of the Board of Directors of Scudder, Stevens & Clark and Scudder Kemper Investments.
Garnett A. Smith (1947)
Year of Election or Appointment: 2018
Trustee
Mr. Smith also serves as Trustee of other Fidelity® funds. Prior to Mr. Smith's retirement, he served as Chairman and Chief Executive Officer of Inbrand Corp. (manufacturer of personal absorbent products, 1990-1997). He also served as President (1986-1990) of Inbrand Corp. Prior to his employment with Inbrand Corp., he was employed by a retail fabric chain and North Carolina National Bank. In addition, Mr. Smith served as a Member of the Advisory Board of certain Fidelity® funds (2012-2013) and as a board member of the Jackson Hole Land Trust (2009-2012).
David M. Thomas (1949)
Year of Election or Appointment: 2008
Trustee
Mr. Thomas also serves as Trustee of other Fidelity® funds. Mr. Thomas serves as Non-Executive Chairman of the Board of Directors of Fortune Brands Home and Security (home and security products, 2011-present), as a member of the Board of Directors (2004-present) and Presiding Director (2013-present) of Interpublic Group of Companies, Inc. (marketing communication), and as a member of the Board of Trustees of the University of Florida (2013-present). Previously, Mr. Thomas served as Executive Chairman (2005-2006) and Chairman and Chief Executive Officer (2000-2005) of IMS Health, Inc. (pharmaceutical and healthcare information solutions), and a Director of Fortune Brands, Inc. (consumer products, 2000-2011).
+ The information includes the Trustee's principal occupation during the last five years and other information relating to the experience, attributes, and skills relevant to the Trustee's qualifications to serve as a Trustee, which led to the conclusion that the Trustee should serve as a Trustee for the fund.
Advisory Board Members and Officers:
Correspondence intended for a Member of the Advisory Board (if any) may be sent to Fidelity Investments, P.O. Box 55235, Boston, Massachusetts 02205-5235. Correspondence intended for an officer or Peter S. Lynch may be sent to Fidelity Investments, 245 Summer Street, Boston, Massachusetts 02210. Officers appear below in alphabetical order.
Name, Year of Birth; Principal Occupation
Peter S. Lynch (1944)
Year of Election or Appointment: 2003
Member of the Advisory Board
Mr. Lynch also serves as Member of the Advisory Board of other Fidelity® funds. Mr. Lynch is Vice Chairman and a Director of FMR (investment adviser firm) and FMR Co., Inc. (investment adviser firm). In addition, Mr. Lynch serves as a Trustee of Boston College and as the Chairman of the Inner-City Scholarship Fund. Previously, Mr. Lynch served on the Special Olympics International Board of Directors (1997-2006).
William S. Stavropoulos (1939)
Year of Election or Appointment: 2018
Member of the Advisory Board
Mr. Stavropoulos also serves as Member of the Advisory Board of other Fidelity® funds. Mr. Stavropoulos serves as President and Founder of the Michigan Baseball Foundation, the Great Lakes Loons (2007-present). Mr. Stavropoulos is Chairman Emeritus of the Board of Directors of The Dow Chemical Company, where he previously served in numerous senior management positions, including President, CEO (1995-2000; 2002-2004), Chairman of the Executive Committee (2000-2006), and as a member of the Board of Directors (1990-2006). Currently, Mr. Stavropoulos is Chairman of the Board of Directors of Univar Inc. (global distributor of commodity and specialty chemicals), a Director of Teradata Corporation (data warehousing and technology solutions), and a member of the Advisory Board for Metalmark Capital LLC (private equity investment, 2005-present). Mr. Stavropoulos is an operating advisor to Clayton, Dubilier & Rice, LLC (private equity investment). In addition, Mr. Stavropoulos is a member of the University of Notre Dame Advisory Council for the College of Science, a Trustee of the Rollin L. Gerstacker Foundation, and a Director of Artis-Naples in Naples, Florida. Previously, Mr. Stavropoulos served as Trustee of certain Fidelity® funds (2001-2018) and as a Director of Chemical Financial Corporation (bank holding company, 1993-2012) and Tyco International, Ltd. (multinational manufacturing and services, 2007-2012).
Carol B. Tomé (1957)
Year of Election or Appointment: 2018
Member of the Advisory Board
Ms. Tomé also serves as Member of the Advisory Board of other Fidelity® funds. Ms. Tomé is Chief Financial Officer (2001-present) and Executive Vice President of Corporate Services (2007-present) of The Home Depot, Inc. (home improvement retailer) and a Director (2003-present) and Chair of the Audit Committee (2004-present) of United Parcel Service, Inc. (package delivery and supply chain management). Previously, Ms. Tomé served as Trustee of certain Fidelity® funds (2017), Senior Vice President of Finance and Accounting/Treasurer (2000-2007) and Vice President and Treasurer (1995-2000) of The Home Depot, Inc. and Chair of the Board (2010-2012), Vice Chair of the Board (2009 and 2013), and a Director (2008-2013) of the Federal Reserve Bank of Atlanta. Ms. Tomé is also a director or trustee of many community and professional organizations.
Michael E. Wiley (1950)
Year of Election or Appointment: 2018
Member of the Advisory Board
Mr. Wiley also serves as Trustee or Member of the Advisory Board of other Fidelity® funds. Mr. Wiley serves as a Director of Andeavor Corporation (independent oil refiner and marketer, 2005-present), a Director of Andeavor Logistics LP (natural resources logistics, 2015-present), and a Director of Bill Barrett Corporation (exploration and production, 2005-present). In addition, Mr. Wiley also serves as a Director of Post Oak Bank (privately-held bank, 2004-present). Previously, Mr. Wiley served as a Trustee of other Fidelity® funds (2008-2013), as a Director of Asia Pacific Exploration Consolidated (international oil and gas exploration and production, 2008-2013), as a member of the Board of Trustees of the University of Tulsa (2000-2006; 2007-2010), as a Senior Energy Advisor of Katzenbach Partners, LLC (consulting, 2006-2007), as an Advisory Director of Riverstone Holdings (private investment), Chairman, President, and CEO of Baker Hughes, Inc. (oilfield services, 2000-2004), and as Director of Spinnaker Exploration Company (exploration and production, 2001-2005).
Elizabeth Paige Baumann (1968)
Year of Election or Appointment: 2017
Anti-Money Laundering (AML) Officer
Ms. Baumann also serves as AML Officer of other funds. She is Chief AML Officer (2012-present) and Senior Vice President (2014-present) of FMR LLC (diversified financial services company) and is an employee of Fidelity Investments. Previously, Ms. Baumann served as AML Officer of the funds (2012-2016), and Vice President (2007-2014) and Deputy Anti-Money Laundering Officer (2007-2012) of FMR LLC.
Marc R. Bryant (1966)
Year of Election or Appointment: 2015
Secretary and Chief Legal Officer (CLO)
Mr. Bryant also serves as Secretary and CLO of other funds. Mr. Bryant serves as CLO, Secretary, and Senior Vice President of Fidelity Management & Research Company (investment adviser firm, 2015-present) and FMR Co., Inc. (investment adviser firm, 2015-present); Secretary of Fidelity SelectCo, LLC (investment adviser firm, 2015-present) and Fidelity Investments Money Management, Inc. (investment adviser firm, 2015-present); and CLO of Fidelity Management & Research (Hong Kong) Limited and FMR Investment Management (UK) Limited (investment adviser firms, 2015-present) and Fidelity Management & Research (Japan) Limited (investment adviser firm, 2016-present). He is Senior Vice President and Deputy General Counsel of FMR LLC (diversified financial services company). Previously, Mr. Bryant served as Secretary and CLO of Fidelity Rutland Square Trust II (2010-2014) and Assistant Secretary of Fidelity's Fixed Income and Asset Allocation Funds (2013-2015). Prior to joining Fidelity Investments, Mr. Bryant served as a Senior Vice President and the Head of Global Retail Legal for AllianceBernstein L.P. (2006-2010), and as the General Counsel for ProFund Advisors LLC (2001-2006).
John J. Burke III (1964)
Year of Election or Appointment: 2018
Chief Financial Officer
Mr. Burke also serves as Chief Financial Officer of other funds. Mr. Burke serves as Head of Investment Operations for Fidelity Fund and Investment Operations (2018-present) and is an employee of Fidelity Investments (1998-present). Previously Mr. Burke served as head of Asset Management Investment Operations (2012-2018).
William C. Coffey (1969)
Year of Election or Appointment: 2009
Assistant Secretary
Mr. Coffey also serves as Assistant Secretary of other funds. He is Senior Vice President and Deputy General Counsel of FMR LLC (diversified financial services company, 2010-present), and is an employee of Fidelity Investments. Previously, Mr. Coffey served as Vice President and Associate General Counsel of FMR LLC (2005-2009).
Timothy M. Cohen (1969)
Year of Election or Appointment: 2018
Vice President
Mr. Cohen also serves as Vice President of other funds. Mr. Cohen serves as Co-Head of Global Equity Research (2016-present), a Director of Fidelity Management & Research (Japan) Limited (investment adviser firm, 2016-present), and is an employee of Fidelity Investments. Previously, Mr. Cohen served as Chief Investment Officer - Equity and a Director of Fidelity Management & Research (U.K.) Inc. (investment adviser firm, 2013-2015) and as a Director of Fidelity Management & Research (Hong Kong) Limited (investment adviser firm, 2017).
Jonathan Davis (1968)
Year of Election or Appointment: 2010
Assistant Treasurer
Mr. Davis also serves as Assistant Treasurer of other funds. Mr. Davis serves as Assistant Treasurer of FMR Capital, Inc. (2017-present) and is an employee of Fidelity Investments. Previously, Mr. Davis served as Vice President and Associate General Counsel of FMR LLC (diversified financial services company, 2003-2010).
Adrien E. Deberghes (1967)
Year of Election or Appointment: 2016
Assistant Treasurer
Mr. Deberghes also serves as an officer of other funds. He serves as Assistant Treasurer of FMR Capital, Inc. (2017-present), Executive Vice President of Fidelity Investments Money Management, Inc. (FIMM) (investment adviser firm, 2016-present), and is an employee of Fidelity Investments (2008-present). Previously, Mr. Deberghes served as President and Treasurer of certain Fidelity® funds (2013-2018). Prior to joining Fidelity Investments, Mr. Deberghes was Senior Vice President of Mutual Fund Administration at State Street Corporation (2007-2008), Senior Director of Mutual Fund Administration at Investors Bank & Trust (2005-2007), and Director of Finance for Dunkin' Brands (2000-2005). Previously, Mr. Deberghes served in other fund officer roles.
Laura M. Del Prato (1964)
Year of Election or Appointment: 2018
Assistant Treasurer
Ms. Del Prato also serves as an officer of other funds. Ms. Del Prato is an employee of Fidelity Investments (2017-present). Prior to joining Fidelity Investments, Ms. Del Prato served as a Managing Director and Treasurer of the JPMorgan Mutual Funds (2014-2017). Prior to JPMorgan, Ms. Del Prato served as a partner at Cohen Fund Audit Services (accounting firm, 2012-2013) and KPMG LLP (accounting firm, 2004-2012).
Colm A. Hogan (1973)
Year of Election or Appointment: 2016
Deputy Treasurer
Mr. Hogan also serves as an officer of other funds. Mr. Hogan serves as Assistant Treasurer of FMR Capital, Inc. (2017-present) and is an employee of Fidelity Investments (2005-present). Previously, Mr. Hogan served as Assistant Treasurer of certain Fidelity® funds (2016-2018).
Pamela R. Holding (1964)
Year of Election or Appointment: 2018
Vice President
Ms. Holding also serves as a Vice President of other funds. Ms. Holding serves as Co-Head of Global Equity Research (2018-present) and is an employee of Fidelity Investments (2013-present).
Chris Maher (1972)
Year of Election or Appointment: 2013
Assistant Treasurer
Mr. Maher serves as Assistant Treasurer of other funds. Mr. Maher is Vice President of Valuation Oversight, serves as Assistant Treasurer of FMR Capital, Inc. (2017-present), and is an employee of Fidelity Investments. Previously, Mr. Maher served as Vice President of Asset Management Compliance (2013), Vice President of the Program Management Group of FMR (investment adviser firm, 2010-2013), and Vice President of Valuation Oversight (2008-2010).
Rieco E. Mello (1969)
Year of Election or Appointment: 2017
Assistant Treasurer
Mr. Mello also serves as Assistant Treasurer of other funds. Mr. Mello serves as Assistant Treasurer of FMR Capital, Inc. (2017-present) and is an employee of Fidelity Investments (1995-present).
Kenneth B. Robins (1969)
Year of Election or Appointment: 2016
Chief Compliance Officer
Mr. Robins also serves as an officer of other funds. Mr. Robins serves as Compliance Officer of Fidelity Management & Research Company and FMR Co., Inc. (investment adviser firms, 2016-present) and is an employee of Fidelity Investments (2004-present). Previously, Mr. Robins served as Executive Vice President of Fidelity Investments Money Management, Inc. (investment adviser firm, 2013-2016) and served in other fund officer roles.
Stacie M. Smith (1974)
Year of Election or Appointment: 2016
President and Treasurer
Ms. Smith also serves as an officer of other funds. Ms. Smith serves as Assistant Treasurer of FMR Capital, Inc. (2017-present), is an employee of Fidelity Investments (2009-present), and has served in other fund officer roles. Prior to joining Fidelity Investments, Ms. Smith served as Senior Audit Manager of Ernst & Young LLP (accounting firm, 1996-2009). Previously, Ms. Smith served as Assistant Treasurer (2013-2018) and Deputy Treasurer (2013-2016) of certain Fidelity® funds.
Marc L. Spector (1972)
Year of Election or Appointment: 2016
Assistant Treasurer
Mr. Spector also serves as an officer of other funds. Mr. Spector serves as Assistant Treasurer of FMR Capital, Inc. (2017-present) and is an employee of Fidelity Investments (2016-present). Prior to joining Fidelity Investments, Mr. Spector served as Director at the Siegfried Group (accounting firm, 2013-2016), and prior to Siegfried Group as audit senior manager at Deloitte & Touche (accounting firm, 2005-2013).
Renee Stagnone (1975)
Year of Election or Appointment: 2016
Assistant Treasurer
Ms. Stagnone also serves as an officer of other funds. Ms. Stagnone serves as Assistant Treasurer of FMR Capital, Inc. (2017-present) and is an employee of Fidelity Investments (1997-present). Previously, Ms. Stagnone served as Deputy Treasurer of certain Fidelity® funds (2013-2016).
Shareholder Expense Example
As a shareholder of the Fund, you incur two types of costs: (1) transaction costs, and (2) ongoing costs, including management fees and other Fund expenses. This Example is intended to help you understand your ongoing costs (in dollars) of investing in the Fund and to compare these costs with the ongoing costs of investing in other mutual funds.
The Example is based on an investment of $1,000 invested at the beginning of the period and held for the entire period (February 1, 2018 to July 31, 2018).
Actual Expenses
The first line of the accompanying table for each class of the Fund provides information about actual account values and actual expenses. You may use the information in this line, together with the amount you invested, to estimate the expenses that you paid over the period. Simply divide your account value by $1,000.00 (for example, an $8,600 account value divided by $1,000.00 = 8.6), then multiply the result by the number in the first line for a class of the Fund under the heading entitled "Expenses Paid During Period" to estimate the expenses you paid on your account during this period. A small balance maintenance fee of $12.00 that is charged once a year may apply for certain accounts with a value of less than $2,000. This fee is not included in the table below. If it was, the estimate of expenses you paid during the period would be higher, and your ending account value lower, by this amount. In addition, the Fund, as a shareholder in the underlying Fidelity Central Funds, will indirectly bear its pro-rata share of the fees and expenses incurred by the underlying Fidelity Central Funds. These fees and expenses are not included in the Fund's annualized expense ratio used to calculate the expense estimate in the table below.
Hypothetical Example for Comparison Purposes
The second line of the accompanying table for each class of the Fund provides information about hypothetical account values and hypothetical expenses based on a Class' actual expense ratio and an assumed rate of return of 5% per year before expenses, which is not the Class' actual return. The hypothetical account values and expenses may not be used to estimate the actual ending account balance or expenses you paid for the period. You may use this information to compare the ongoing costs of investing in the Fund and other funds. To do so, compare this 5% hypothetical example with the 5% hypothetical examples that appear in the shareholder reports of the other funds. A small balance maintenance fee of $12.00 that is charged once a year may apply for certain accounts with a value of less than $2,000. This fee is not included in the table below. If it was, the estimate of expenses you paid during the period would be higher, and your ending account value lower, by this amount. In addition, the Fund, as a shareholder in the underlying Fidelity Central Funds, will indirectly bear its pro-rata share of the fees and expenses incurred by the underlying Fidelity Central Funds. These fees and expenses are not included in the Fund's annualized expense ratio used to calculate the expense estimate in the table below.
Please note that the expenses shown in the table are meant to highlight your ongoing costs only and do not reflect any transaction costs. Therefore, the second line of the table is useful in comparing ongoing costs only, and will not help you determine the relative total costs of owning different funds.
| | Annualized Expense Ratio-A | Beginning
Account Value
February 1, 2018 | Ending
Account Value
July 31, 2018 | Expenses Paid
During Period-B
February 1, 2018
to July 31, 2018 |
| Leveraged Company Stock | .78% | | | |
| Actual | | $1,000.00 | $970.90 | $3.81 |
| Hypothetical-C | | $1,000.00 | $1,020.93 | $3.91 |
| Class K | .67% | | | |
| Actual | | $1,000.00 | $971.50 | $3.28 |
| Hypothetical-C | | $1,000.00 | $1,021.47 | $3.36 |
A Annualized expense ratio reflects expenses net of applicable fee waivers.
B Expenses are equal to each Class' annualized expense ratio, multiplied by the average account value over the period, multiplied by 181/365 (to reflect the one-half year period).
C 5% return per year before expenses
Distributions (Unaudited)
The Board of Trustees of Leveraged Company Stock voted to pay to shareholders of record at the opening of business on record date, the following distributions per share derived from capital gains realized from sales of portfolio securities:
| | Pay Date | Record Date | Capital Gains |
| Fidelity Leveraged Company Stock Fund | | | |
| Leveraged Company Stock | 09/17/18 | 09/14/18 | $3.738 |
| Class K | 09/17/18 | 09/14/18 | $3.760 |
|
The fund hereby designates as a capital gain dividend with respect to the taxable year ended July 31 2018, $ 389,354,534, or, if subsequently determined to be different, the net capital gain of such year.
Leveraged Company Stock designates 100% and 52%; Class K designates 86% and 47% of the dividends distributed in September and December, respectively during the fiscal year as qualifying for the dividends–received deduction for corporate shareholders.
Leveraged Company Stock designates 100% and 78% and Class K designates 94% and 71% of the dividends distributed in September and December, respectively during the fiscal year as amounts which may be taken into account as a dividend for purposes of the maximum rate under section 1(h)(11) of the Internal Revenue Code.
The fund will notify shareholders in January 2019 of amounts for use in preparing 2018 income tax returns.
Board Approval of Investment Advisory Contracts
Fidelity Leveraged Company Stock Fund
At its July 2018 meeting, the Board of Trustees, including the Independent Trustees (together, the Board), voted to continue the management contract with Fidelity Management & Research Company (FMR) and the sub-advisory agreements (together, the Advisory Contracts) for the fund for six months through January 31, 2019, in connection with the reunification of the Fidelity Equity High Income Funds Board, which oversees the fund, and the Sector Portfolios Board.
The Board considered that the approval of the fund's Advisory Contracts will not result in any changes in (i) the investment process or strategies employed in the management of the fund's assets; (ii) the fees and expenses paid by shareholders; (iii) the nature, extent or quality of services provided under the fund's Advisory Contracts; or (iv) the day-to-day management of the fund or the persons primarily responsible for such management. The Board concluded that the fund's Advisory Contracts are fair and reasonable, and that the fund's Advisory Contracts should be renewed, without modification, through January 31, 2019, with the understanding that the Board will consider the annual renewal for a full one year period in January 2019.
In connection with its consideration of future renewals of the fund's Advisory Contracts, the Board will consider: (i) the nature, extent and quality of services provided to the fund, including shareholder and administrative services and investment performance; (ii) the competitiveness of the management fee and total expenses for the fund; (iii) the costs of the services and profitability, including the revenues earned and the expenses incurred in conducting the business of developing, marketing, distributing, managing, administering, and servicing the fund and its shareholders, to the extent applicable, as well as potential fall-out benefits from Fidelity's non-fund businesses; and (iv) whether there have been economies of scale in respect of the Fidelity funds, whether the Fidelity funds (including the fund) have appropriately benefited from any such economies of scale, and whether there is the potential for realization of any further economies.
Based on its evaluation of all of the conclusions noted above, and after considering all factors it believed relevant, the Board ultimately concluded that the fund's management fee structure is fair and reasonable, and that the continuation of the fund's Advisory Contracts should be approved.
Corporate Headquarters
245 Summer St.
Boston, MA 02210
www.fidelity.com
LSF-ANN-0918
1.762413.117
Fidelity® Leveraged Company Stock Fund Class K
Annual Report July 31, 2018 |
|
Contents
To view a fund's proxy voting guidelines and proxy voting record for the 12-month period ended June 30, visit http://www.fidelity.com/proxyvotingresults or visit the Securities and Exchange Commission's (SEC) web site at http://www.sec.gov.
You may also call 1-800-835-5092 to request a free copy of the proxy voting guidelines.
Standard & Poor's, S&P and S&P 500 are registered service marks of The McGraw-Hill Companies, Inc. and have been licensed for use by Fidelity Distributors Corporation.
Other third-party marks appearing herein are the property of their respective owners.
All other marks appearing herein are registered or unregistered trademarks or service marks of FMR LLC or an affiliated company. © 2018 FMR LLC. All rights reserved.
This report and the financial statements contained herein are submitted for the general information of the shareholders of the Fund. This report is not authorized for distribution to prospective investors in the Fund unless preceded or accompanied by an effective prospectus.
A fund files its complete schedule of portfolio holdings with the SEC for the first and third quarters of each fiscal year on Form N-Q. Forms N-Q are available on the SEC’s web site at http://www.sec.gov. A fund's Forms N-Q may be reviewed and copied at the SEC’s Public Reference Room in Washington, DC. Information regarding the operation of the SEC's Public Reference Room may be obtained by calling 1-800-SEC-0330.
For a complete list of a fund's portfolio holdings, view the most recent holdings listing, semiannual report, or annual report on Fidelity's web site at http://www.fidelity.com, http://www.institutional.fidelity.com, or http://www.401k.com, as applicable.
NOT FDIC INSURED •MAY LOSE VALUE •NO BANK GUARANTEE
Neither the Fund nor Fidelity Distributors Corporation is a bank.
Performance: The Bottom Line
Average annual total return reflects the change in the value of an investment, assuming reinvestment of distributions from dividend income and capital gains (the profits earned upon the sale of securities that have grown in value, if any) and assuming a constant rate of performance each year. The hypothetical investment and the average annual total returns do not reflect the deduction of taxes that a shareholder would pay on fund distributions or the redemption of fund shares. During periods of reimbursement by Fidelity, a fund’s total return will be greater than it would be had the reimbursement not occurred. How a fund did yesterday is no guarantee of how it will do tomorrow.
Average Annual Total Returns
| For the periods ended July 31, 2018 | Past 1 year | Past 5 years | Past 10 years |
| Class K | 11.01% | 7.95% | 6.94% |
The initial offering of Class K shares took place on May 9, 2008. Returns prior to May 9, 2008 are those of Fidelity® Leveraged Company Stock Fund, the original class of the fund.
$10,000 Over 10 Years
Let's say hypothetically that $10,000 was invested in Fidelity® Leveraged Company Stock Fund - Class K on July 31, 2008.
The chart shows how the value of your investment would have changed, and also shows how the S&P 500® Index performed over the same period.
See above for additional information regarding the performance of Class K.

| Period Ending Values |
| $19,570 | Fidelity® Leveraged Company Stock Fund - Class K |
| $27,551 | S&P 500® Index |
Management's Discussion of Fund Performance
Market Recap: The U.S. equity bellwether S&P 500
® index gained 16.24% for the 12 months ending July 31, 2018, despite a resurgence in volatility that challenged the multiyear bull market. Stocks maintained their steady growth until a sharp reversal in February, as volatility spiked amid fear that rising inflation and the potential for the economy to overheat would prompt the U.S. Federal Reserve to pick up the pace of interest rate hikes. The index posted its first negative monthly result since October 2016, and then lost further ground in March on fear of a global trade war. The market stabilized in April and turned upward through mid-June, when escalating trade tension between the U.S. and China soured investor sentiment. The resulting uncertainty lingered into July, but strong corporate earnings helped the S&P 500 rise 3.72% that month to cap the period. For the full one-year period, growth handily topped value, while small-caps bested large-caps. By sector, information technology (+28%) led the way, boosted by strong earnings growth from several major index constituents. Consumer discretionary rose roughly 24%, driven by retailers (+49%). Energy (+20%) gained alongside higher oil prices. Laggards were telecommunication services (-2%), consumer staples (0%) and utilities (+3%), defensive groups that struggled amid rising interest rates and a general preference for risk. Real estate (+5%) fared a bit better but still lagged, as did financials, industrials, health care (each up 13%) and materials (+11%).
Comments from Portfolio Manager Mark Notkin: For the fiscal year, the fund's share classes gained about 11%, lagging the benchmark S&P 500
® and topping the 7.37% result of the Credit Suisse Leveraged Equity Index. We feel the latter index represents a better basis for comparison, given the fund’s mandate to primarily invest in the common stocks of leveraged companies. I am pleased with the fund’s performance through the end of May, but the final two months of this reporting period proved disappointing, with the fund widely lagging the S&P 500. For the full 12 months, the fund’s underperformance of the benchmark was primarily due to security selection in the consumer discretionary and information technology sectors. With my focus on leveraged companies, many constituents in the S&P 500 are screened out of my process, yet still may notably influence the fund’s performance versus the benchmark. For instance, largely avoiding e-commerce giant Amazon.com and software maker Microsoft were the fund’s largest relative detractors the past year. Conversely, the fund’s relative result benefited from overall industry positioning, especially underweightings in consumer staples, utilities and health care, all of which trailed the broader market. The fund’s top contributor was Eldorado Resorts, a regional gaming operator that has grown through strategic acquisitions focused on return on investment rather than just revenue growth.
The views expressed above reflect those of the portfolio manager(s) only through the end of the period as stated on the cover of this report and do not necessarily represent the views of Fidelity or any other person in the Fidelity organization. Any such views are subject to change at any time based upon market or other conditions and Fidelity disclaims any responsibility to update such views. These views may not be relied on as investment advice and, because investment decisions for a Fidelity fund are based on numerous factors, may not be relied on as an indication of trading intent on behalf of any Fidelity fund.
Investment Summary (Unaudited)
Top Ten Stocks as of July 31, 2018
| | % of fund's net assets |
| Alibaba Group Holding Ltd. sponsored ADR | 3.0 |
| Alphabet, Inc. Class A | 2.5 |
| T-Mobile U.S., Inc. | 2.5 |
| Facebook, Inc. Class A | 2.4 |
| Melco Crown Entertainment Ltd. sponsored ADR | 2.2 |
| Eldorado Resorts, Inc. | 2.2 |
| ON Semiconductor Corp. | 2.1 |
| Air Canada | 2.1 |
| Micron Technology, Inc. | 2.0 |
| Broadcom, Inc. | 2.0 |
| | 23.0 |
Top Five Market Sectors as of July 31, 2018
| | % of fund's net assets |
| Information Technology | 34.7 |
| Consumer Discretionary | 22.8 |
| Materials | 8.5 |
| Financials | 8.0 |
| Industrials | 7.1 |
Asset Allocation (% of fund's net assets)
| As of July 31, 2018* |
| | Stocks | 98.3% |
| | Convertible Securities | 0.6% |
| | Short-Term Investments and Net Other Assets (Liabilities) | 1.1% |

* Foreign investments - 18.1%
Schedule of Investments July 31, 2018
Showing Percentage of Net Assets
| Common Stocks - 98.3% | | | |
| | | Shares | Value (000s) |
| CONSUMER DISCRETIONARY - 22.8% | | | |
| Auto Components - 1.5% | | | |
| Lear Corp. | | 227,100 | $40,908 |
| Hotels, Restaurants & Leisure - 13.1% | | | |
| Boyd Gaming Corp. | | 1,367,800 | 51,087 |
| Eldorado Resorts, Inc. (a) | | 1,413,780 | 60,580 |
| Las Vegas Sands Corp. | | 245,200 | 17,630 |
| Melco Crown Entertainment Ltd. sponsored ADR | | 2,360,000 | 61,030 |
| Penn National Gaming, Inc. (a) | | 1,416,000 | 45,383 |
| Red Rock Resorts, Inc. | | 5,847 | 207 |
| Royal Caribbean Cruises Ltd. | | 214,400 | 24,176 |
| Scientific Games Corp. Class A (a) | | 532,500 | 25,587 |
| The Stars Group, Inc. (a) | | 530,200 | 18,186 |
| Wyndham Destinations, Inc. | | 289,100 | 13,333 |
| Wyndham Hotels & Resorts, Inc. | | 289,100 | 16,768 |
| Wynn Resorts Ltd. | | 205,400 | 34,257 |
| | | | 368,224 |
| Household Durables - 1.4% | | | |
| Lennar Corp.: | | | |
| Class A | | 417,740 | 21,835 |
| Class B | | 6,642 | 287 |
| Toll Brothers, Inc. | | 513,000 | 18,088 |
| | | | 40,210 |
| Internet & Direct Marketing Retail - 2.8% | | | |
| Amazon.com, Inc. (a) | | 16,100 | 28,617 |
| JD.com, Inc. sponsored ADR (a) | | 381,900 | 13,695 |
| The Booking Holdings, Inc. (a) | | 18,200 | 36,923 |
| | | | 79,235 |
| Media - 2.7% | | | |
| Gray Television, Inc. (a) | | 1,172,964 | 18,122 |
| Naspers Ltd.: | | | |
| Class N | | 135,500 | 33,362 |
| Class N sponsored ADR (b) | | 160,400 | 7,973 |
| Nexstar Broadcasting Group, Inc. Class A | | 195,498 | 14,555 |
| | | | 74,012 |
| Specialty Retail - 0.5% | | | |
| Ulta Beauty, Inc. (a) | | 60,000 | 14,663 |
| Textiles, Apparel & Luxury Goods - 0.8% | | | |
| adidas AG | | 97,168 | 21,492 |
|
| TOTAL CONSUMER DISCRETIONARY | | | 638,744 |
|
| CONSUMER STAPLES - 2.6% | | | |
| Beverages - 0.4% | | | |
| Constellation Brands, Inc. Class A (sub. vtg.) | | 60,200 | 12,656 |
| Food Products - 2.2% | | | |
| Darling International, Inc. (a) | | 1,932,283 | 38,820 |
| JBS SA | | 9,507,900 | 22,850 |
| | | | 61,670 |
|
| TOTAL CONSUMER STAPLES | | | 74,326 |
|
| ENERGY - 6.8% | | | |
| Energy Equipment & Services - 0.4% | | | |
| SAExploration Holdings, Inc. (a)(c) | | 419,175 | 545 |
| Weatherford International PLC (a)(b) | | 2,859,400 | 9,693 |
| | | | 10,238 |
| Oil, Gas & Consumable Fuels - 6.4% | | | |
| Cheniere Energy, Inc. (a) | | 319,640 | 20,297 |
| Concho Resources, Inc. (a) | | 86,688 | 12,643 |
| Diamondback Energy, Inc. | | 225,500 | 29,755 |
| EQT Corp. | | 306,506 | 15,227 |
| MEG Energy Corp. (a) | | 1,809,300 | 11,794 |
| Parsley Energy, Inc. Class A (a) | | 821,600 | 25,823 |
| Pioneer Natural Resources Co. | | 145,200 | 27,482 |
| QEP Resources, Inc. (a) | | 458,700 | 4,766 |
| Scorpio Tankers, Inc. | | 1,959,100 | 4,212 |
| Teekay Corp. (b) | | 894,737 | 6,236 |
| Whiting Petroleum Corp. (a) | | 430,473 | 21,373 |
| | | | 179,608 |
|
| TOTAL ENERGY | | | 189,846 |
|
| FINANCIALS - 8.0% | | | |
| Banks - 4.9% | | | |
| Bank of America Corp. | | 1,618,399 | 49,976 |
| Huntington Bancshares, Inc. | | 757,980 | 11,703 |
| JPMorgan Chase & Co. | | 442,900 | 50,911 |
| Regions Financial Corp. | | 607,780 | 11,311 |
| SunTrust Banks, Inc. | | 167,900 | 12,101 |
| | | | 136,002 |
| Capital Markets - 0.4% | | | |
| MSCI, Inc. | | 73,500 | 12,215 |
| Consumer Finance - 1.8% | | | |
| OneMain Holdings, Inc. (a) | | 1,547,200 | 51,444 |
| Diversified Financial Services - 0.9% | | | |
| GDS Holdings Ltd. ADR (a)(b) | | 1,173,700�� | 25,622 |
|
| TOTAL FINANCIALS | | | 225,283 |
|
| HEALTH CARE - 4.1% | | | |
| Health Care Providers & Services - 2.3% | | | |
| HCA Holdings, Inc. | | 146,500 | 18,200 |
| Humana, Inc. | | 99,700 | 31,324 |
| UnitedHealth Group, Inc. | | 60,300 | 15,269 |
| | | | 64,793 |
| Life Sciences Tools & Services - 1.0% | | | |
| Quintiles Transnational Holdings, Inc. (a) | | 234,700 | 28,619 |
| Pharmaceuticals - 0.8% | | | |
| Bausch Health Cos., Inc. (Canada) (a) | | 56,100 | 1,220 |
| Jazz Pharmaceuticals PLC (a) | | 114,300 | 19,783 |
| | | | 21,003 |
|
| TOTAL HEALTH CARE | | | 114,415 |
|
| INDUSTRIALS - 7.1% | | | |
| Air Freight & Logistics - 0.6% | | | |
| XPO Logistics, Inc. (a) | | 151,300 | 15,088 |
| Airlines - 2.6% | | | |
| Air Canada (a) | | 3,279,900 | 59,327 |
| Allegiant Travel Co. | | 104,146 | 12,872 |
| | | | 72,199 |
| Commercial Services & Supplies - 0.0% | | | |
| Novus Holdings Ltd. | | 46,866 | 14 |
| Machinery - 1.0% | | | |
| Allison Transmission Holdings, Inc. | | 617,900 | 29,041 |
| Marine - 0.0% | | | |
| Genco Shipping & Trading Ltd. (a) | | 831 | 12 |
| Trading Companies & Distributors - 2.9% | | | |
| HD Supply Holdings, Inc. (a) | | 1,016,300 | 44,697 |
| United Rentals, Inc. (a) | | 248,100 | 36,917 |
| | | | 81,614 |
|
| TOTAL INDUSTRIALS | | | 197,968 |
|
| INFORMATION TECHNOLOGY - 34.1% | | | |
| Electronic Equipment & Components - 1.5% | | | |
| CDW Corp. | | 245,300 | 20,627 |
| Control4 Corp. (a) | | 397,400 | 10,106 |
| TTM Technologies, Inc. (a) | | 589,200 | 10,229 |
| | | | 40,962 |
| Internet Software & Services - 7.9% | | | |
| Alibaba Group Holding Ltd. sponsored ADR (a) | | 451,700 | 84,573 |
| Alphabet, Inc. Class A (a) | | 56,700 | 69,583 |
| Facebook, Inc. Class A (a) | | 393,000 | 67,824 |
| | | | 221,980 |
| IT Services - 7.1% | | | |
| EPAM Systems, Inc. (a) | | 302,100 | 39,336 |
| Global Payments, Inc. | | 480,900 | 54,135 |
| MasterCard, Inc. Class A | | 152,400 | 30,175 |
| PayPal Holdings, Inc. (a) | | 453,600 | 37,259 |
| Visa, Inc. Class A | | 285,900 | 39,094 |
| | | | 199,999 |
| Semiconductors & Semiconductor Equipment - 9.9% | | | |
| Broadcom, Inc. | | 246,100 | 54,578 |
| Marvell Technology Group Ltd. | | 998,982 | 21,288 |
| Microchip Technology, Inc. | | 334,900 | 31,290 |
| Micron Technology, Inc. (a) | | 1,084,600 | 57,256 |
| NVIDIA Corp. | | 217,200 | 53,184 |
| ON Semiconductor Corp. (a) | | 2,713,000 | 59,822 |
| | | | 277,418 |
| Software - 7.7% | | | |
| Adobe Systems, Inc. (a) | | 215,600 | 52,753 |
| CDK Global, Inc. | | 215,100 | 13,433 |
| Electronic Arts, Inc. (a) | | 203,600 | 26,214 |
| Microsoft Corp. | | 369,400 | 39,186 |
| Salesforce.com, Inc. (a) | | 217,000 | 29,762 |
| SS&C Technologies Holdings, Inc. | | 581,900 | 30,881 |
| Take-Two Interactive Software, Inc. (a) | | 197,700 | 22,344 |
| | | | 214,573 |
|
| TOTAL INFORMATION TECHNOLOGY | | | 954,932 |
|
| MATERIALS - 8.5% | | | |
| Chemicals - 6.3% | | | |
| DowDuPont, Inc. | | 530,921 | 36,511 |
| Ingevity Corp. (a) | | 254,788 | 25,395 |
| LyondellBasell Industries NV Class A | | 236,755 | 26,230 |
| Platform Specialty Products Corp. (a) | | 2,635,400 | 32,574 |
| The Chemours Co. LLC | | 943,100 | 43,203 |
| Westlake Chemical Corp. | | 106,400 | 11,408 |
| | | | 175,321 |
| Containers & Packaging - 0.4% | | | |
| Crown Holdings, Inc. (a) | | 277,300 | 12,553 |
| Metals & Mining - 1.8% | | | |
| First Quantum Minerals Ltd. | | 2,129,900 | 33,221 |
| Freeport-McMoRan, Inc. | | 1,107,900 | 18,280 |
| | | | 51,501 |
|
| TOTAL MATERIALS | | | 239,375 |
|
| TELECOMMUNICATION SERVICES - 2.5% | | | |
| Wireless Telecommunication Services - 2.5% | | | |
| T-Mobile U.S., Inc. (a) | | 1,148,300 | 68,898 |
| UTILITIES - 1.8% | | | |
| Electric Utilities - 1.1% | | | |
| Vistra Energy Corp. (a) | | 1,364,665 | 30,841 |
| Independent Power and Renewable Electricity Producers - 0.7% | | | |
| NRG Energy, Inc. | | 659,500 | 20,886 |
|
| TOTAL UTILITIES | | | 51,727 |
|
| TOTAL COMMON STOCKS | | | |
| (Cost $2,205,120) | | | 2,755,514 |
|
| Convertible Preferred Stocks - 0.6% | | | |
| INFORMATION TECHNOLOGY - 0.6% | | | |
| Internet Software & Services - 0.6% | | | |
| Lyft, Inc. Series I (d)(e) | | | |
| (Cost $15,000) | | 316,764 | 15,000 |
| | | Principal Amount (000s) | Value (000s) |
|
| Nonconvertible Bonds - 0.0% | | | |
| ENERGY - 0.0% | | | |
| Oil, Gas & Consumable Fuels - 0.0% | | | |
| Jupiter Resources, Inc. 8.5% 10/1/22 (c) | | | |
| (Cost $701) | | 825 | 413 |
| | | Shares | Value (000s) |
|
| Money Market Funds - 2.7% | | | |
| Fidelity Cash Central Fund, 1.96% (f) | | 40,950,186 | 40,958 |
| Fidelity Securities Lending Cash Central Fund 1.97% (f)(g) | | 34,672,893 | 34,676 |
| TOTAL MONEY MARKET FUNDS | | | |
| (Cost $75,633) | | | 75,634 |
| TOTAL INVESTMENT IN SECURITIES - 101.6% | | | |
| (Cost $2,296,454) | | | 2,846,561 |
| NET OTHER ASSETS (LIABILITIES) - (1.6)% | | | (43,741) |
| NET ASSETS - 100% | | | $2,802,820 |
Legend
(a) Non-income producing
(b) Security or a portion of the security is on loan at period end.
(c) Security exempt from registration under Rule 144A of the Securities Act of 1933. These securities may be resold in transactions exempt from registration, normally to qualified institutional buyers. At the end of the period, the value of these securities amounted to $958,000 or 0.0% of net assets.
(d) Restricted securities - Investment in securities not registered under the Securities Act of 1933 (excluding 144A issues). At the end of the period, the value of restricted securities (excluding 144A issues) amounted to $15,000,000 or 0.5% of net assets.
(e) Level 3 security
(f) Affiliated fund that is generally available only to investment companies and other accounts managed by Fidelity Investments. The rate quoted is the annualized seven-day yield of the fund at period end. A complete unaudited listing of the fund's holdings as of its most recent quarter end is available upon request. In addition, each Fidelity Central Fund's financial statements, which are not covered by the Fund's Report of Independent Registered Public Accounting Firm, are available on the SEC's website or upon request.
(g) Investment made with cash collateral received from securities on loan.
Additional information on each restricted holding is as follows:
| Security | Acquisition Date | Acquisition Cost (000s) |
| Lyft, Inc. Series I | 6/27/18 | $15,000 |
Affiliated Central Funds
Information regarding fiscal year to date income earned by the Fund from investments in Fidelity Central Funds is as follows:
| Fund | Income earned |
| | (Amounts in thousands) |
| Fidelity Cash Central Fund | $673 |
| Fidelity Securities Lending Cash Central Fund | 726 |
| Total | $1,399 |
Amounts in the income column in the above table include any capital gain distributions from underlying funds, which are presented in the corresponding line-item in the Statement of Operations if applicable.
Investment Valuation
The following is a summary of the inputs used, as of July 31, 2018, involving the Fund's assets and liabilities carried at fair value. The inputs or methodology used for valuing securities may not be an indication of the risk associated with investing in those securities. For more information on valuation inputs, and their aggregation into the levels used below, please refer to the Investment Valuation section in the accompanying Notes to Financial Statements.
| | Valuation Inputs at Reporting Date: |
| Description | Total | Level 1 | Level 2 | Level 3 |
| (Amounts in thousands) | | | | |
| Investments in Securities: | | | | |
| Equities: | | | | |
| Consumer Discretionary | $638,744 | $638,744 | $-- | $-- |
| Consumer Staples | 74,326 | 74,326 | -- | -- |
| Energy | 189,846 | 189,846 | -- | -- |
| Financials | 225,283 | 225,283 | -- | -- |
| Health Care | 114,415 | 114,415 | -- | -- |
| Industrials | 197,968 | 197,968 | -- | -- |
| Information Technology | 969,932 | 954,932 | -- | 15,000 |
| Materials | 239,375 | 239,375 | -- | -- |
| Telecommunication Services | 68,898 | 68,898 | -- | -- |
| Utilities | 51,727 | 51,727 | -- | -- |
| Corporate Bonds | 413 | -- | 413 | -- |
| Money Market Funds | 75,634 | 75,634 | -- | -- |
| Total Investments in Securities: | $2,846,561 | $2,831,148 | $413 | $15,000 |
Other Information
Distribution of investments by country or territory of incorporation, as a percentage of Total Net Assets, is as follows (Unaudited):
| United States of America | 81.9% |
| Cayman Islands | 5.7% |
| Canada | 4.4% |
| South Africa | 1.5% |
| Ireland | 1.1% |
| Others (Individually Less Than 1%) | 5.4% |
| | 100.0% |
See accompanying notes which are an integral part of the financial statements.
Financial Statements
Statement of Assets and Liabilities
| Amounts in thousands (except per-share amounts) | | July 31, 2018 |
| Assets | | |
Investment in securities, at value (including securities loaned of $26,093) — See accompanying schedule:
Unaffiliated issuers (cost $2,220,821) | $2,770,927 | |
| Fidelity Central Funds (cost $75,633) | 75,634 | |
| Total Investment in Securities (cost $2,296,454) | | $2,846,561 |
| Cash | | 5,279 |
| Receivable for investments sold | | 10,412 |
| Receivable for fund shares sold | | 277 |
| Dividends receivable | | 263 |
| Interest receivable | | 23 |
| Distributions receivable from Fidelity Central Funds | | 76 |
| Prepaid expenses | | 7 |
| Other receivables | | 118 |
| Total assets | | 2,863,016 |
| Liabilities | | |
| Payable for investments purchased | $20,829 | |
| Payable for fund shares redeemed | 2,771 | |
| Accrued management fee | 1,412 | |
| Other affiliated payables | 398 | |
| Other payables and accrued expenses | 106 | |
| Collateral on securities loaned | 34,680 | |
| Total liabilities | | 60,196 |
| Net Assets | | $2,802,820 |
| Net Assets consist of: | | |
| Paid in capital | | $1,957,651 |
| Distributions in excess of net investment income | | (1,170) |
| Accumulated undistributed net realized gain (loss) on investments and foreign currency transactions | | 296,232 |
| Net unrealized appreciation (depreciation) on investments and assets and liabilities in foreign currencies | | 550,107 |
| Net Assets | | $2,802,820 |
| Leveraged Company Stock: | | |
| Net Asset Value, offering price and redemption price per share ($2,371,819 ÷ 69,131 shares) | | $34.31 |
| Class K: | | |
| Net Asset Value, offering price and redemption price per share ($431,001 ÷ 12,528 shares) | | $34.40 |
See accompanying notes which are an integral part of the financial statements.
Statement of Operations
| Amounts in thousands | | Year ended July 31, 2018 |
| Investment Income | | |
| Dividends | | $23,638 |
| Interest | | 91 |
| Income from Fidelity Central Funds | | 1,399 |
| Total income | | 25,128 |
| Expenses | | |
| Management fee | $17,773 | |
| Transfer agent fees | 4,081 | |
| Accounting and security lending fees | 893 | |
| Custodian fees and expenses | 54 | |
| Independent trustees' fees and expenses | 13 | |
| Registration fees | 46 | |
| Audit | 64 | |
| Legal | 15 | |
| Miscellaneous | 23 | |
| Total expenses before reductions | 22,962 | |
| Expense reductions | (403) | |
| Total expenses after reductions | | 22,559 |
| Net investment income (loss) | | 2,569 |
| Realized and Unrealized Gain (Loss) | | |
| Net realized gain (loss) on: | | |
| Investment securities: | | |
| Unaffiliated issuers | 417,891 | |
| Fidelity Central Funds | (2) | |
| Foreign currency transactions | 68 | |
| Total net realized gain (loss) | | 417,957 |
| Change in net unrealized appreciation (depreciation) on: | | |
| Investment securities: | | |
| Unaffiliated issuers | (99,612) | |
| Fidelity Central Funds | (4) | |
| Total change in net unrealized appreciation (depreciation) | | (99,616) |
| Net gain (loss) | | 318,341 |
| Net increase (decrease) in net assets resulting from operations | | $320,910 |
See accompanying notes which are an integral part of the financial statements.
Statement of Changes in Net Assets
| Amounts in thousands | Year ended July 31, 2018 | Year ended July 31, 2017 |
| Increase (Decrease) in Net Assets | | |
| Operations | | |
| Net investment income (loss) | $2,569 | $17,016 |
| Net realized gain (loss) | 417,957 | 1,032,712 |
| Change in net unrealized appreciation (depreciation) | (99,616) | (535,359) |
| Net increase (decrease) in net assets resulting from operations | 320,910 | 514,369 |
| Distributions to shareholders from net investment income | (6,187) | (31,094) |
| Distributions to shareholders from net realized gain | (529,539) | (719,647) |
| Total distributions | (535,726) | (750,741) |
| Share transactions - net increase (decrease) | (115,492) | (65,270) |
| Redemption fees | – | 27 |
| Total increase (decrease) in net assets | (330,308) | (301,615) |
| Net Assets | | |
| Beginning of period | 3,133,128 | 3,434,743 |
| End of period | $2,802,820 | $3,133,128 |
| Other Information | | |
| Undistributed net investment income end of period | $– | $3,302 |
| Distributions in excess of net investment income end of period | $(1,170) | $– |
See accompanying notes which are an integral part of the financial statements.
Financial Highlights
Fidelity Leveraged Company Stock Fund
| Years ended July 31, | 2018 | 2017 | 2016 | 2015 | 2014 |
| Selected Per–Share Data | | | | | |
| Net asset value, beginning of period | $37.25 | $40.68 | $46.90 | $45.82 | $39.44 |
| Income from Investment Operations | | | | | |
| Net investment income (loss)A | .02 | .19 | .41 | .41 | .34 |
| Net realized and unrealized gain (loss) | 3.42B | 5.53 | (3.77) | 1.01 | 6.31 |
| Total from investment operations | 3.44 | 5.72 | (3.36) | 1.42 | 6.65 |
| Distributions from net investment income | (.07) | (.37) | (.40) | (.34) | (.27) |
| Distributions from net realized gain | (6.32) | (8.78) | (2.46) | – | – |
| Total distributions | (6.38)C | (9.15) | (2.86) | (.34) | (.27) |
| Redemption fees added to paid in capitalA | – | –D | –D | –D | –D |
| Net asset value, end of period | $34.31 | $37.25 | $40.68 | $46.90 | $45.82 |
| Total ReturnE | 10.91%B | 17.45% | (7.23)% | 3.12% | 16.96% |
| Ratios to Average Net AssetsF,G | | | | | |
| Expenses before reductions | .78% | .80% | .80% | .79% | .79% |
| Expenses net of fee waivers, if any | .78% | .79% | .80% | .78% | .79% |
| Expenses net of all reductions | .77% | .78% | .80% | .78% | .79% |
| Net investment income (loss) | .07% | .51% | 1.03% | .87% | .81% |
| Supplemental Data | | | | | |
| Net assets, end of period (in millions) | $2,372 | $2,644 | $2,861 | $3,755 | $4,207 |
| Portfolio turnover rateH | 67% | 100% | 9% | 4% | 10% |
A Calculated based on average shares outstanding during the period.
B Amount includes a reimbursement from the investment adviser for an error which amounted to $.06 per share. Excluding this reimbursement, the total return would have been 10.73%.
C Total distributions of $6.38 per share is comprised of distributions from net investment income of $.066 and distributions from net realized gain of $6.318 per share.
D Amount represents less than $.005 per share.
E Total returns would have been lower if certain expenses had not been reduced during the applicable periods shown.
F Fees and expenses of any underlying Fidelity Central Funds are not included in the Fund's expense ratio. The Fund indirectly bears its proportionate share of the expenses of any underlying Fidelity Central Funds.
G Expense ratios reflect operating expenses of the class. Expenses before reductions do not reflect amounts reimbursed by the investment adviser or reductions from brokerage service arrangements or reductions from other expense offset arrangements and do not represent the amount paid by the class during periods when reimbursements or reductions occur. Expenses net of fee waivers reflect expenses after reimbursement by the investment adviser but prior to reductions from brokerage service arrangements or other expense offset arrangements. Expenses net of all reductions represent the net expenses paid by the class.
H Amount does not include the portfolio activity of any underlying Fidelity Central Funds.
See accompanying notes which are an integral part of the financial statements.
Fidelity Leveraged Company Stock Fund Class K
| Years ended July 31, | 2018 | 2017 | 2016 | 2015 | 2014 |
| Selected Per–Share Data | | | | | |
| Net asset value, beginning of period | $37.34 | $40.76 | $47.00 | $45.91 | $39.52 |
| Income from Investment Operations | | | | | |
| Net investment income (loss)A | .06 | .23 | .46 | .46 | .40 |
| Net realized and unrealized gain (loss) | 3.42B | 5.55 | (3.79) | 1.03 | 6.31 |
| Total from investment operations | 3.48 | 5.78 | (3.33) | 1.49 | 6.71 |
| Distributions from net investment income | (.11) | (.42) | (.45) | (.40) | (.32) |
| Distributions from net realized gain | (6.32) | (8.78) | (2.46) | – | – |
| Total distributions | (6.42)C | (9.20) | (2.91) | (.40) | (.32) |
| Redemption fees added to paid in capitalA | – | –D | –D | –D | –D |
| Net asset value, end of period | $34.40 | $37.34 | $40.76 | $47.00 | $45.91 |
| Total ReturnE | 11.01%B | 17.60% | (7.14)% | 3.26% | 17.10% |
| Ratios to Average Net AssetsF,G | | | | | |
| Expenses before reductions | .67% | .68% | .68% | .67% | .67% |
| Expenses net of fee waivers, if any | .67% | .68% | .68% | .67% | .67% |
| Expenses net of all reductions | .66% | .67% | .68% | .67% | .67% |
| Net investment income (loss) | .18% | .63% | 1.15% | .99% | .92% |
| Supplemental Data | | | | | |
| Net assets, end of period (in millions) | $431 | $489 | $573 | $991 | $1,173 |
| Portfolio turnover rateH | 67% | 100% | 9% | 4% | 10% |
A Calculated based on average shares outstanding during the period.
B Amount includes a reimbursement form the investment adviser for an error which amounted to $.06 per share. Excluding this reimbursement, the total return would have been 10.83%.
C Total distributions of $6.42 per share is comprised of distributions from net investment income of $.106 and distributions from net realized gain of $6.318 per share.
D Amount represents less than $.005 per share.
E Total returns would have been lower if certain expenses had not been reduced during the applicable periods shown.
F Fees and expenses of any underlying Fidelity Central Funds are not included in the Fund's expense ratio. The Fund indirectly bears its proportionate share of the expenses of any underlying Fidelity Central Funds.
G Expense ratios reflect operating expenses of the class. Expenses before reductions do not reflect amounts reimbursed by the investment adviser or reductions from brokerage service arrangements or reductions from other expense offset arrangements and do not represent the amount paid by the class during periods when reimbursements or reductions occur. Expenses net of fee waivers reflect expenses after reimbursement by the investment adviser but prior to reductions from brokerage service arrangements or other expense offset arrangements. Expenses net of all reductions represent the net expenses paid by the class.
H Amount does not include the portfolio activity of any underlying Fidelity Central Funds.
See accompanying notes which are an integral part of the financial statements.
Notes to Financial Statements
For the period ended July 31, 2018
(Amounts in thousands except percentages)
1. Organization.
Fidelity Leveraged Company Stock Fund (the Fund) is a fund of Fidelity Securities Fund (the Trust) and is authorized to issue an unlimited number of shares. The Trust is registered under the Investment Company Act of 1940, as amended (the 1940 Act), as an open-end management investment company organized as a Massachusetts business trust. The Fund offers Leveraged Company Stock and Class K shares, each of which has equal rights as to assets and voting privileges. Each class has exclusive voting rights with respect to matters that affect that class.
2. Investments in Fidelity Central Funds.
The Fund invests in Fidelity Central Funds, which are open-end investment companies generally available only to other investment companies and accounts managed by the investment adviser and its affiliates. The Fund's Schedule of Investments lists each of the Fidelity Central Funds held as of period end, if any, as an investment of the Fund, but does not include the underlying holdings of each Fidelity Central Fund. As an Investing Fund, the Fund indirectly bears its proportionate share of the expenses of the underlying Fidelity Central Funds.
The Money Market Central Funds seek preservation of capital and current income and are managed by Fidelity Investments Money Management, Inc. (FIMM), an affiliate of the investment adviser. Annualized expenses of the Money Market Central Funds as of their most recent shareholder report date are less than .005%.
A complete unaudited list of holdings for each Fidelity Central Fund is available upon request or at the Securities and Exchange Commission (the SEC) website at www.sec.gov. In addition, the financial statements of the Fidelity Central Funds, which are not covered by the Fund's Report of Independent Registered Public Accounting Firm, are available on the SEC website or upon request.
3. Significant Accounting Policies.
The Fund is an investment company and applies the accounting and reporting guidance of the Financial Accounting Standards Board (FASB) Accounting Standards Codification Topic 946 Financial Services – Investments Companies. The financial statements have been prepared in conformity with accounting principles generally accepted in the United States of America (GAAP), which require management to make certain estimates and assumptions at the date of the financial statements. Actual results could differ from those estimates. Subsequent events, if any, through the date that the financial statements were issued have been evaluated in the preparation of the financial statements. The following summarizes the significant accounting policies of the Fund:
Investment Valuation. Investments are valued as of 4:00 p.m. Eastern time on the last calendar day of the period. The Board of Trustees (the Board) has delegated the day to day responsibility for the valuation of the Fund's investments to the Fair Value Committee (the Committee) established by the Fund's investment adviser. In accordance with valuation policies and procedures approved by the Board, the Fund attempts to obtain prices from one or more third party pricing vendors or brokers to value its investments. When current market prices, quotations or currency exchange rates are not readily available or reliable, investments will be fair valued in good faith by the Committee, in accordance with procedures adopted by the Board. Factors used in determining fair value vary by investment type and may include market or investment specific events, changes in interest rates and credit quality. The frequency with which these procedures are used cannot be predicted and they may be utilized to a significant extent. The Committee oversees the Fund's valuation policies and procedures and reports to the Board on the Committee's activities and fair value determinations. The Board monitors the appropriateness of the procedures used in valuing the Fund's investments and ratifies the fair value determinations of the Committee.
The Fund categorizes the inputs to valuation techniques used to value its investments into a disclosure hierarchy consisting of three levels as shown below:
- Level 1 – quoted prices in active markets for identical investments
- Level 2 – other significant observable inputs (including quoted prices for similar investments, interest rates, prepayment speeds, etc.)
- Level 3 – unobservable inputs (including the Fund's own assumptions based on the best information available)
Valuation techniques used to value the Fund's investments by major category are as follows:
Equity securities, including restricted securities, for which market quotations are readily available, are valued at the last reported sale price or official closing price as reported by a third party pricing vendor on the primary market or exchange on which they are traded and are categorized as Level 1 in the hierarchy. In the event there were no sales during the day or closing prices are not available, securities are valued at the last quoted bid price or may be valued using the last available price and are generally categorized as Level 2 in the hierarchy. For foreign equity securities, when market or security specific events arise, comparisons to the valuation of American Depositary Receipts (ADRs), futures contracts, Exchange-Traded Funds (ETFs) and certain indexes as well as quoted prices for similar securities may be used and would be categorized as Level 2 in the hierarchy. Utilizing these techniques may result in transfers between Level 1 and Level 2. For equity securities, including restricted securities, where observable inputs are limited, assumptions about market activity and risk are used and these securities may be categorized as Level 3 in the hierarchy.
Debt securities, including restricted securities, are valued based on evaluated prices received from third party pricing vendors or from brokers who make markets in such securities. Corporate bonds are valued by pricing vendors who utilize matrix pricing which considers yield or price of bonds of comparable quality, coupon, maturity and type or by broker-supplied prices. When independent prices are unavailable or unreliable, debt securities may be valued utilizing pricing methodologies which consider similar factors that would be used by third party pricing vendors. Debt securities are generally categorized as Level 2 in the hierarchy but may be Level 3 depending on the circumstances.
Investments in open-end mutual funds, including the Fidelity Central Funds, are valued at their closing net asset value (NAV) each business day and are categorized as Level 1 in the hierarchy.
Changes in valuation techniques may result in transfers in or out of an assigned level within the disclosure hierarchy. The aggregate value of investments by input level as of July 31, 2018 is included at the end of the Fund's Schedule of Investments.
Foreign Currency. The Fund may use foreign currency contracts to facilitate transactions in foreign-denominated securities. Gains and losses from these transactions may arise from changes in the value of the foreign currency or if the counterparties do not perform under the contracts' terms.
Foreign-denominated assets, including investment securities, and liabilities are translated into U.S. dollars at the exchange rates at period end. Purchases and sales of investment securities, income and dividends received and expenses denominated in foreign currencies are translated into U.S. dollars at the exchange rate in effect on the transaction date.
The effects of exchange rate fluctuations on investments are included with the net realized and unrealized gain (loss) on investment securities. Other foreign currency transactions resulting in realized and unrealized gain (loss) are disclosed separately.
Investment Transactions and Income. For financial reporting purposes, the Fund's investment holdings and NAV include trades executed through the end of the last business day of the period. The NAV per share for processing shareholder transactions is calculated as of the close of business of the New York Stock Exchange (NYSE), normally 4:00 p.m. Eastern time and includes trades executed through the end of the prior business day. Gains and losses on securities sold are determined on the basis of identified cost and include proceeds received from litigation. Dividend income is recorded on the ex-dividend date, except for certain dividends from foreign securities where the ex-dividend date may have passed, which are recorded as soon as the Fund is informed of the ex-dividend date. Non-cash dividends included in dividend income, if any, are recorded at the fair market value of the securities received. Income and capital gain distributions from Fidelity Central Funds, if any, are recorded on the ex-dividend date. Certain distributions received by the Fund represent a return of capital or capital gain. The Fund determines the components of these distributions subsequent to the ex-dividend date, based upon receipt of tax filings or other correspondence relating to the underlying investment. These distributions are recorded as a reduction of cost of investments and/or as a realized gain. Interest income is accrued as earned and includes coupon interest and amortization of premium and accretion of discount on debt securities as applicable. Investment income is recorded net of foreign taxes withheld where recovery of such taxes is uncertain.
Class Allocations and Expenses. Investment income, realized and unrealized capital gains and losses, common expenses of the Fund, and certain fund-level expense reductions, if any, are allocated daily on a pro-rata basis to each class based on the relative net assets of each class to the total net assets of the Fund. Each class differs with respect to transfer agent fees incurred. Certain expense reductions may also differ by class. For the reporting period, the allocated portion of income and expenses to each class as a percent of its average net assets may vary due to the timing of recording these transactions in relation to fluctuating net assets of the classes. Expenses directly attributable to a fund are charged to that fund. Expenses attributable to more than one fund are allocated among the respective funds on the basis of relative net assets or other appropriate methods. Expense estimates are accrued in the period to which they relate and adjustments are made when actual amounts are known.
Income Tax Information and Distributions to Shareholders. Each year, the Fund intends to qualify as a regulated investment company under Subchapter M of the Internal Revenue Code, including distributing substantially all of its taxable income and realized gains. As a result, no provision for U.S. Federal income taxes is required. As of July 31, 2018, the Fund did not have any unrecognized tax benefits in the financial statements; nor is the Fund aware of any tax positions for which it is reasonably possible that the total amounts of unrecognized tax benefits will significantly change in the next twelve months. The Fund files a U.S. federal tax return, in addition to state and local tax returns as required. The Fund's federal income tax returns are subject to examination by the Internal Revenue Service (IRS) for a period of three fiscal years after they are filed. State and local tax returns may be subject to examination for an additional fiscal year depending on the jurisdiction. Foreign taxes are provided for based on the Fund's understanding of the tax rules and rates that exist in the foreign markets in which it invests.
Distributions are declared and recorded on the ex-dividend date. Income and capital gain distributions are declared separately for each class. Income and capital gain distributions are determined in accordance with income tax regulations, which may differ from GAAP. In addition, the Fund claimed a portion of the payment made to redeeming shareholders as a distribution for income tax purposes.
Capital accounts within the financial statements are adjusted for permanent book-tax differences. These adjustments have no impact on net assets or the results of operations. Capital accounts are not adjusted for temporary book-tax differences which will reverse in a subsequent period.
Book-tax differences are primarily due to foreign currency transactions, market discount, partnerships and losses deferred due to wash sales and excise tax regulations.
As of period end, the cost and unrealized appreciation (depreciation) in securities, and derivatives if applicable, for federal income tax purposes were as follows:
| Gross unrealized appreciation | $640,048 |
| Gross unrealized depreciation | (90,147) |
| Net unrealized appreciation (depreciation) | $549,901 |
| Tax Cost | $2,296,660 |
The tax-based components of distributable earnings as of period end were as follows:
| Undistributed ordinary income | $5,756 |
| Undistributed long-term capital gain | $290,712 |
| Net unrealized appreciation (depreciation) on securities and other investments | $549,901 |
The tax character of distributions paid was as follows:
| | July 31, 2018 | July 31, 2017 |
| Ordinary Income | $17,016 | $ 31,094 |
| Long-term Capital Gains | 518,710 | 719,647 |
| Total | $535,726 | $ 750,741 |
The Fund intends to elect to defer to its next fiscal year $1,199,814 of ordinary losses recognized during the period January 1, 2018 to July 31, 2018.
Restricted Securities. The Fund may invest in securities that are subject to legal or contractual restrictions on resale. These securities generally may be resold in transactions exempt from registration or to the public if the securities are registered. Disposal of these securities may involve time-consuming negotiations and expense, and prompt sale at an acceptable price may be difficult. Information regarding restricted securities is included at the end of the Fund's Schedule of Investments.
4. Purchases and Sales of Investments.
Purchases and sales of securities, other than short-term securities, aggregated $1,975,117 and $2,554,689, respectively.
5. Fees and Other Transactions with Affiliates.
Management Fee. Fidelity Management & Research Company (the investment adviser) and its affiliates provide the Fund with investment management related services for which the Fund pays a monthly management fee. The management fee is the sum of an individual fund fee rate that is based on an annual rate of .35% of the Fund's average net assets and an annualized group fee rate that averaged .24% during the period. The group fee rate is based upon the average net assets of all the mutual funds advised by the investment adviser, including any mutual funds previously advised by the investment adviser that are currently advised by Fidelity SelectCo, LLC, an affiliate of the investment adviser. The group fee rate decreases as assets under management increase and increases as assets under management decrease. For the reporting period, the total annual management fee rate was .59% of the Fund's average net assets.
Transfer Agent Fees. Fidelity Investments Institutional Operations Company, Inc., (FIIOC), an affiliate of the investment adviser, is the transfer, dividend disbursing and shareholder servicing agent for each class of the Fund. FIIOC receives account fees and asset-based fees that vary according to the account size and type of account of the shareholders of Leveraged Company Stock, except for Class K. FIIOC receives an asset-based fee of Class K's average net assets. FIIOC pays for typesetting, printing and mailing of shareholder reports, except proxy statements.
For the period, transfer agent fees for each class were as follows:
| | Amount | % of Class-Level Average Net Assets |
| Leveraged Company Stock | $3,867 | .15 |
| Class K | 214 | .05 |
| | $4,081 | |
Accounting and Security Lending Fees. Fidelity Service Company, Inc. (FSC), an affiliate of the investment adviser, maintains the Fund's accounting records. The accounting fee is based on the level of average net assets for each month. Under a separate contract, FSC administers the security lending program. The security lending fee is based on the number and duration of lending transactions. For the period, the fees were equivalent to an annual rate of .03%.
Brokerage Commissions. The Fund placed a portion of its portfolio transactions with brokerage firms which are affiliates of the investment adviser. Brokerage commissions are included in net realized gain (loss) and change in net unrealized appreciation (depreciation) in the Statement of Operations. The commissions paid to these affiliated firms were $49 for the period.
Interfund Trades. The Fund may purchase from or sell securities to other Fidelity Funds under procedures adopted by the Board. The procedures have been designed to ensure these interfund trades are executed in accordance with Rule 17a-7 of the 1940 Act. Interfund trades are included within the respective purchases and sales amounts shown in the Purchases and Sales of Investments note.
Other. During the period, the investment adviser reimbursed the Fund $5,279 for an error which is included in the Change in net unrealized appreciation (depreciation) on unaffiliated investment securities in the accompanying Statement of Operations.
6. Committed Line of Credit.
The Fund participates with other funds managed by the investment adviser or an affiliate in a $4.25 billion credit facility (the "line of credit") to be utilized for temporary or emergency purposes to fund shareholder redemptions or for other short-term liquidity purposes. The Fund has agreed to pay commitment fees on its pro-rata portion of the line of credit, which amounted to $9 and is reflected in Miscellaneous expenses on the Statement of Operations. During the period, the Fund did not borrow on this line of credit.
7. Security Lending.
The Fund lends portfolio securities through a lending agent from time to time in order to earn additional income. For equity securities, a lending agent is used and may loan securities to certain qualified borrowers, including Fidelity Capital Markets (FCM), a broker-dealer affiliated with the Fund. On the settlement date of the loan, the Fund receives collateral (in the form of U.S. Treasury obligations, letters of credit and/or cash) against the loaned securities and maintains collateral in an amount not less than 100% of the market value of the loaned securities during the period of the loan. The market value of the loaned securities is determined at the close of business of the Fund and any additional required collateral is delivered to the Fund on the next business day. The Fund or borrower may terminate the loan at any time, and if the borrower defaults on its obligation to return the securities loaned because of insolvency or other reasons, the Fund may apply collateral received from the borrower against the obligation. The Fund may experience delays and costs in recovering the securities loaned. Any cash collateral received is invested in the Fidelity Securities Lending Cash Central Fund. The value of loaned securities and cash collateral at period end are disclosed on the Fund's Statement of Assets and Liabilities. At period end, there were no security loans outstanding with FCM. Security lending income represents the income earned on investing cash collateral, less rebates paid to borrowers and any lending agent fees associated with the loan, plus any premium payments received for lending certain types of securities. Security lending income is presented in the Statement of Operations as a component of income from Fidelity Central Funds. Total security lending income during the period amounted to $726, including $2 from securities loaned to FCM.
8. Expense Reductions.
Commissions paid to certain brokers with whom the investment adviser, or its affiliates, places trades on behalf of the Fund include an amount in addition to trade execution, which may be rebated back to the Fund to offset certain expenses. This amount totaled $370 for the period. In addition, through arrangements with the Fund's custodian, credits realized as a result of certain uninvested cash balances were used to reduce the Fund's expenses. During the period, these credits reduced the Fund's custody expenses by $2.
In addition, during the period the investment adviser reimbursed and/or waived a portion of fund-level operating expenses in the amount of $31.
9. Distributions to Shareholders.
Distributions to shareholders of each class were as follows:
| | Year ended
July 31, 2018 | Year ended
July 31, 2017 |
| From net investment income | | |
| Leveraged Company Stock | $4,788 | $25,432 |
| Class K | 1,399 | 5,662 |
| Total | $6,187 | $31,094 |
| From net realized gain | | |
| Leveraged Company Stock | $447,843 | $601,482 |
| Class K | 81,696 | 118,165 |
| Total | $529,539 | $719,647 |
10. Share Transactions.
Share transactions for each class were as follows and may contain automatic conversions between classes or exchanges between affiliated funds:
| | Shares | Shares | Dollars | Dollars |
| | Year ended July 31, 2018 | Year ended July 31, 2017 | Year ended July 31, 2018 | Year ended July 31, 2017 |
| Leveraged Company Stock | | | | |
| Shares sold | 2,261 | 3,277 | $77,379 | $119,066 |
| Reinvestment of distributions | 13,261 | 17,338 | 427,578 | 589,414 |
| Shares redeemed | (17,365) | (19,987) | (594,962) | (729,496) |
| Net increase (decrease) | (1,843) | 628 | $(90,005) | $(21,016) |
| Class K | | | | |
| Shares sold | 989 | 1,480 | $34,063 | $53,751 |
| Reinvestment of distributions | 2,572 | 3,634 | 83,096 | 123,827 |
| Shares redeemed | (4,138) | (6,074) | (142,646) | (221,832) |
| Net increase (decrease) | (577) | (960) | $(25,487) | $(44,254) |
11. Other.
The Fund's organizational documents provide former and current trustees and officers with a limited indemnification against liabilities arising in connection with the performance of their duties to the Fund. In the normal course of business, the Fund may also enter into contracts that provide general indemnifications. The Fund's maximum exposure under these arrangements is unknown as this would be dependent on future claims that may be made against the Fund. The risk of material loss from such claims is considered remote.
Report of Independent Registered Public Accounting Firm
To the Board of Trustees of Fidelity Securities Fund and Shareholders of Fidelity Leveraged Company Stock Fund:
Opinion on the Financial Statements
We have audited the accompanying statement of assets and liabilities, including the schedule of investments, of Fidelity Leveraged Company Stock Fund (one of the funds constituting Fidelity Securities Fund, referred to hereafter as the "Fund") as of July 31, 2018, the related statement of operations for the year ended July 31, 2018, the statement of changes in net assets for each of the two years in the period ended July 31, 2018, including the related notes, and the financial highlights for each of the five years in the period ended July 31, 2018 (collectively referred to as the “financial statements”). In our opinion, the financial statements present fairly, in all material respects, the financial position of the Fund as of July 31, 2018, the results of its operations for the year then ended, the changes in its net assets for each of the two years in the period ended July 31, 2018 and the financial highlights for each of the five years in the period ended July 31, 2018 in conformity with accounting principles generally accepted in the United States of America.
Basis for Opinion
These financial statements are the responsibility of the Fund’s management. Our responsibility is to express an opinion on the Fund’s financial statements based on our audits. We are a public accounting firm registered with the Public Company Accounting Oversight Board (United States) (“PCAOB”) and are required to be independent with respect to the Fund in accordance with the U.S. federal securities laws and the applicable rules and regulations of the Securities and Exchange Commission and the PCAOB.
We conducted our audits of these financial statements in accordance with the standards of the PCAOB. Those standards require that we plan and perform the audit to obtain reasonable assurance about whether the financial statements are free of material misstatement, whether due to error or fraud.
Our audits included performing procedures to assess the risks of material misstatement of the financial statements, whether due to error or fraud, and performing procedures that respond to those risks. Such procedures included examining, on a test basis, evidence regarding the amounts and disclosures in the financial statements. Our audits also included evaluating the accounting principles used and significant estimates made by management, as well as evaluating the overall presentation of the financial statements. Our procedures included confirmation of securities owned as of July 31, 2018 by correspondence with the custodian and brokers; when replies were not received from brokers, we performed other auditing procedures. We believe that our audits provide a reasonable basis for our opinion.
PricewaterhouseCoopers LLP
Boston, Massachusetts
September 14, 2018
We have served as the auditor of one or more investment companies in the Fidelity group of funds since 1932.
Trustees and Officers
The Trustees, Members of the Advisory Board (if any), and officers of the trust and fund, as applicable, are listed below. The Board of Trustees governs the fund and is responsible for protecting the interests of shareholders. The Trustees are experienced executives who meet periodically throughout the year to oversee the fund's activities, review contractual arrangements with companies that provide services to the fund, oversee management of the risks associated with such activities and contractual arrangements, and review the fund's performance. Except for Jonathan Chiel, each of the Trustees oversees 286 funds. Mr. Chiel oversees 150 funds.
The Trustees hold office without limit in time except that (a) any Trustee may resign; (b) any Trustee may be removed by written instrument, signed by at least two-thirds of the number of Trustees prior to such removal; (c) any Trustee who requests to be retired or who has become incapacitated by illness or injury may be retired by written instrument signed by a majority of the other Trustees; and (d) any Trustee may be removed at any special meeting of shareholders by a two-thirds vote of the outstanding voting securities of the trust. Each Trustee who is not an interested person (as defined in the 1940 Act) of the trust and the fund is referred to herein as an Independent Trustee. Each Independent Trustee shall retire not later than the last day of the calendar year in which his or her 75th birthday occurs. The Independent Trustees may waive this mandatory retirement age policy with respect to individual Trustees. Officers and Advisory Board Members hold office without limit in time, except that any officer or Advisory Board Member may resign or may be removed by a vote of a majority of the Trustees at any regular meeting or any special meeting of the Trustees. Except as indicated, each individual has held the office shown or other offices in the same company for the past five years.
The fund’s Statement of Additional Information (SAI) includes more information about the Trustees. To request a free copy, call Fidelity at 1-800-835-5092.
Experience, Skills, Attributes, and Qualifications of the Trustees. The Governance and Nominating Committee has adopted a statement of policy that describes the experience, qualifications, attributes, and skills that are necessary and desirable for potential Independent Trustee candidates (Statement of Policy). The Board believes that each Trustee satisfied at the time he or she was initially elected or appointed a Trustee, and continues to satisfy, the standards contemplated by the Statement of Policy. The Governance and Nominating Committee also engages professional search firms to help identify potential Independent Trustee candidates who have the experience, qualifications, attributes, and skills consistent with the Statement of Policy. From time to time, additional criteria based on the composition and skills of the current Independent Trustees, as well as experience or skills that may be appropriate in light of future changes to board composition, business conditions, and regulatory or other developments, have also been considered by the professional search firms and the Governance and Nominating Committee. In addition, the Board takes into account the Trustees' commitment and participation in Board and committee meetings, as well as their leadership of standing and ad hoc committees throughout their tenure.
In determining that a particular Trustee was and continues to be qualified to serve as a Trustee, the Board has considered a variety of criteria, none of which, in isolation, was controlling. The Board believes that, collectively, the Trustees have balanced and diverse experience, qualifications, attributes, and skills, which allow the Board to operate effectively in governing the fund and protecting the interests of shareholders. Information about the specific experience, skills, attributes, and qualifications of each Trustee, which in each case led to the Board's conclusion that the Trustee should serve (or continue to serve) as a trustee of the fund, is provided below.
Board Structure and Oversight Function. James C. Curvey is an interested person and currently serves as Chairman. The Trustees have determined that an interested Chairman is appropriate and benefits shareholders because an interested Chairman has a personal and professional stake in the quality and continuity of services provided to the fund. Independent Trustees exercise their informed business judgment to appoint an individual of their choosing to serve as Chairman, regardless of whether the Trustee happens to be independent or a member of management. The Independent Trustees have determined that they can act independently and effectively without having an Independent Trustee serve as Chairman and that a key structural component for assuring that they are in a position to do so is for the Independent Trustees to constitute a substantial majority for the Board. The Independent Trustees also regularly meet in executive session. Ned C. Lautenbach serves as Chairman of the Independent Trustees and as such (i) acts as a liaison between the Independent Trustees and management with respect to matters important to the Independent Trustees and (ii) with management prepares agendas for Board meetings.
Fidelity® funds are overseen by different Boards of Trustees. The fund's Board oversees Fidelity's high income and certain equity funds, and other Boards oversee Fidelity's investment-grade bond, money market, asset allocation, and other equity funds. The asset allocation funds may invest in Fidelity® funds overseen by the fund's Board. The use of separate Boards, each with its own committee structure, allows the Trustees of each group of Fidelity® funds to focus on the unique issues of the funds they oversee, including common research, investment, and operational issues. On occasion, the separate Boards establish joint committees to address issues of overlapping consequences for the Fidelity® funds overseen by each Board.
The Trustees operate using a system of committees to facilitate the timely and efficient consideration of all matters of importance to the Trustees, the fund, and fund shareholders and to facilitate compliance with legal and regulatory requirements and oversight of the fund's activities and associated risks. The Board, acting through its committees, has charged FMR and its affiliates with (i) identifying events or circumstances the occurrence of which could have demonstrably adverse effects on the fund's business and/or reputation; (ii) implementing processes and controls to lessen the possibility that such events or circumstances occur or to mitigate the effects of such events or circumstances if they do occur; and (iii) creating and maintaining a system designed to evaluate continuously business and market conditions in order to facilitate the identification and implementation processes described in (i) and (ii) above. Because the day-to-day operations and activities of the fund are carried out by or through FMR, its affiliates, and other service providers, the fund's exposure to risks is mitigated but not eliminated by the processes overseen by the Trustees. While each of the Board's committees has responsibility for overseeing different aspects of the fund's activities, oversight is exercised primarily through the Operations, Audit, and Compliance Committees. In addition, the Independent Trustees have worked with Fidelity to enhance the Board's oversight of investment and financial risks, legal and regulatory risks, technology risks, and operational risks, including the development of additional risk reporting to the Board. Appropriate personnel, including but not limited to the fund's Chief Compliance Officer (CCO), FMR's internal auditor, the independent accountants, the fund's Treasurer and portfolio management personnel, make periodic reports to the Board's committees, as appropriate, including an annual review of Fidelity's risk management program for the Fidelity® funds. The responsibilities of each standing committee, including their oversight responsibilities, are described further under "Standing Committees of the Trustees."
Interested Trustees*:
Correspondence intended for a Trustee who is an interested person may be sent to Fidelity Investments, 245 Summer Street, Boston, Massachusetts 02210.
Name, Year of Birth; Principal Occupations and Other Relevant Experience+
Jonathan Chiel (1957)
Year of Election or Appointment: 2016
Trustee
Mr. Chiel also serves as Trustee of other Fidelity® funds. Mr. Chiel is Executive Vice President and General Counsel for FMR LLC (diversified financial services company, 2012-present). Previously, Mr. Chiel served as general counsel (2004-2012) and senior vice president and deputy general counsel (2000-2004) for John Hancock Financial Services; a partner with Choate, Hall & Stewart (1996-2000) (law firm); and an Assistant United States Attorney for the United States Attorney’s Office of the District of Massachusetts (1986-95), including Chief of the Criminal Division (1993-1995). Mr. Chiel is a director on the boards of the Boston Bar Foundation and the Maimonides School.
James C. Curvey (1935)
Year of Election or Appointment: 2007
Trustee
Chairman of the Board of Trustees
Mr. Curvey also serves as Trustee of other Fidelity® funds. Mr. Curvey is Vice Chairman (2007-present) and Director of FMR LLC (diversified financial services company). In addition, Mr. Curvey is an Overseer Emeritus for the Boston Symphony Orchestra, a Director of Artis-Naples, and a Trustee of Brewster Academy in Wolfeboro, New Hampshire. Previously, Mr. Curvey served as a Director of Fidelity Research & Analysis Co. (investment adviser firm, 2009-2018), Director of Fidelity Investments Money Management, Inc. (investment adviser firm, 2009-2014) and a Director of FMR and FMR Co., Inc. (investment adviser firms, 2007-2014).
Charles S. Morrison (1960)
Year of Election or Appointment: 2014
Trustee
Mr. Morrison also serves as Trustee of other funds. He serves as President of Fidelity SelectCo, LLC (investment adviser firm, 2017-present) and Fidelity Management & Research Company (FMR) (investment adviser firm, 2016-present), a Director of Fidelity Investments Money Management, Inc. (FIMM) (investment adviser firm, 2014-present), Director of Fidelity SelectCo, LLC (investment adviser firm, 2014-present), President, Asset Management (2014-present), and is an employee of Fidelity Investments. Previously, Mr. Morrison served as Vice President of Fidelity's Fixed Income and Asset Allocation Funds (2012-2014), President, Fixed Income (2011-2014), Vice President of Fidelity's Money Market Funds (2005-2009), President, Money Market Group Leader of FMR (investment adviser firm, 2009), and Senior Vice President, Money Market Group of FMR (2004-2009). Mr. Morrison also served as Vice President of Fidelity's Bond Funds (2002-2005), certain Balanced Funds (2002-2005), and certain Asset Allocation Funds (2002-2007), and as Senior Vice President (2002-2005) of Fidelity's Bond Division.
* Determined to be an “Interested Trustee” by virtue of, among other things, his or her affiliation with the trust or various entities under common control with FMR.
+ The information includes the Trustee's principal occupation during the last five years and other information relating to the experience, attributes, and skills relevant to the Trustee's qualifications to serve as a Trustee, which led to the conclusion that the Trustee should serve as a Trustee for the fund.
Independent Trustees:
Correspondence intended for an Independent Trustee may be sent to Fidelity Investments, P.O. Box 55235, Boston, Massachusetts 02205-5235.
Name, Year of Birth; Principal Occupations and Other Relevant Experience+
Dennis J. Dirks (1948)
Year of Election or Appointment: 2005
Trustee
Mr. Dirks also serves as Trustee of other Fidelity® funds. Prior to his retirement in May 2003, Mr. Dirks was Chief Operating Officer and a member of the Board of The Depository Trust & Clearing Corporation (DTCC). He also served as President, Chief Operating Officer, and Board member of The Depository Trust Company (DTC) and President and Board member of the National Securities Clearing Corporation (NSCC). In addition, Mr. Dirks served as Chief Executive Officer and Board member of the Government Securities Clearing Corporation, Chief Executive Officer and Board member of the Mortgage-Backed Securities Clearing Corporation, as a Trustee and a member of the Finance Committee of Manhattan College (2005-2008), as a Trustee and a member of the Finance Committee of AHRC of Nassau County (2006-2008), as a member of the Independent Directors Council (IDC) Governing Council (2010-2015), and as a member of the Board of Directors for The Brookville Center for Children’s Services, Inc. (2009-2017). Mr. Dirks is a member of the Finance Committee (2016-present), Board of Directors (2017-present) and Board of Trustees (2018-present) and is Treasurer (2018-present) of the Asolo Repertory Theatre.
Donald F. Donahue (1950)
Year of Election or Appointment: 2018
Trustee
Mr. Donahue also serves as a Trustee of other Fidelity® funds. Mr. Donahue is President and Chief Executive Officer of Miranda Partners, LLC (risk consulting for the financial services industry, 2012-present). Previously, Mr. Donahue served as a Member of the Advisory Board of certain Fidelity® funds (2015-2018) and Chief Executive Officer (2006-2012), Chief Operating Officer (2003-2006), and Managing Director, Customer Marketing and Development (1999-2003) of The Depository Trust & Clearing Corporation (financial markets infrastructure). Mr. Donahue serves as a Member (2007-present) and Co-Chairman (2016-present) of the Board of Directors of United Way of New York, Member of the Board of Directors of NYC Leadership Academy (2012-present) and Member of the Board of Advisors of Ripple Labs, Inc. (financial services, 2015-present). He also served as Chairman (2010-2012) and Member of the Board of Directors (2012-2013) of Omgeo, LLC (financial services), Treasurer of United Way of New York (2012-2016), and Member of the Board of Directors of XBRL US (financial services non-profit, 2009-2012) and the International Securities Services Association (2009-2012).
Alan J. Lacy (1953)
Year of Election or Appointment: 2008
Trustee
Mr. Lacy also serves as Trustee of other Fidelity® funds. Mr. Lacy serves as a Director of Bristol-Myers Squibb Company (global pharmaceuticals, 2008-present). He is a Trustee of the California Chapter of The Nature Conservancy (2015-present) and a Director of the Center for Advanced Study in the Behavioral Sciences at Stanford University (2015-present). In addition, Mr. Lacy served as Senior Adviser (2007-2014) of Oak Hill Capital Partners, L.P. (private equity) and also served as Chief Executive Officer (2005) and Vice Chairman (2005-2006) of Sears Holdings Corporation (retail) and Chief Executive Officer and Chairman of the Board of Sears, Roebuck and Co. (retail, 2000-2005). Previously, Mr. Lacy served as Chairman (2014-2017) and a member (2010-2017) of the Board of Directors of Dave & Buster’s Entertainment, Inc. (restaurant and entertainment complexes), as Chairman (2008-2011) and a member (2006-2015) of the Board of Trustees of the National Parks Conservation Association, and as a member of the Board of Directors for The Hillman Companies, Inc. (hardware wholesalers, 2010-2014), Earth Fare, Inc. (retail grocery, 2010-2014), and The Western Union Company (global money transfer, 2006-2011).
Ned C. Lautenbach (1944)
Year of Election or Appointment: 2000
Trustee
Chairman of the Independent Trustees
Mr. Lautenbach also serves as Trustee of other Fidelity® funds. Mr. Lautenbach currently serves as Vice Chair of the Board of Governors, State University System of Florida (2013-present) and is a member of the Council on Foreign Relations (1994-present). He is also a member and has most recently served as Chairman of the Board of Directors of Artis-Naples (2012-present). Previously, Mr. Lautenbach served as a member and then Lead Director of the Board of Directors of Eaton Corporation (diversified industrial, 1997-2016). He was also a Partner and Advisory Partner at Clayton, Dubilier & Rice, LLC (private equity investment, 1998-2010), as well as a Director of Sony Corporation (2006-2007). In addition, Mr. Lautenbach also had a 30-year career with IBM (technology company) during which time he served as Senior Vice President and a member of the Corporate Executive Committee (1968-1998).
Joseph Mauriello (1944)
Year of Election or Appointment: 2008
Trustee
Mr. Mauriello also serves as Trustee of other Fidelity® funds. Prior to his retirement in January 2006, Mr. Mauriello served in numerous senior management positions including Deputy Chairman and Chief Operating Officer (2004-2005), and Vice Chairman of Financial Services (2002-2004) of KPMG LLP US (professional services, 1965-2005). Mr. Mauriello currently serves as a member of the Board of Directors of XL Group plc. (global insurance and re-insurance, 2006-present) and the Independent Directors Council (IDC) Governing Council (2015-present). Previously, Mr. Mauriello served as a Director of the Hamilton Funds of the Bank of New York (2006-2007) and of Arcadia Resources Inc. (health care services and products, 2007-2012).
Cornelia M. Small (1944)
Year of Election or Appointment: 2005
Trustee
Ms. Small also serves as Trustee of other Fidelity® funds. Ms. Small is a member of the Board of Directors (2009-present) and Chair of the Investment Committee (2010-present) of the Teagle Foundation. Ms. Small also serves on the Investment Committee of the Berkshire Taconic Community Foundation (2008-present). Previously, Ms. Small served as Chairperson (2002-2008) and a member of the Investment Committee and Chairperson (2008-2012) and a member of the Board of Trustees of Smith College. In addition, Ms. Small served as Chief Investment Officer, Director of Global Equity Investments, and a member of the Board of Directors of Scudder, Stevens & Clark and Scudder Kemper Investments.
Garnett A. Smith (1947)
Year of Election or Appointment: 2018
Trustee
Mr. Smith also serves as Trustee of other Fidelity® funds. Prior to Mr. Smith's retirement, he served as Chairman and Chief Executive Officer of Inbrand Corp. (manufacturer of personal absorbent products, 1990-1997). He also served as President (1986-1990) of Inbrand Corp. Prior to his employment with Inbrand Corp., he was employed by a retail fabric chain and North Carolina National Bank. In addition, Mr. Smith served as a Member of the Advisory Board of certain Fidelity® funds (2012-2013) and as a board member of the Jackson Hole Land Trust (2009-2012).
David M. Thomas (1949)
Year of Election or Appointment: 2008
Trustee
Mr. Thomas also serves as Trustee of other Fidelity® funds. Mr. Thomas serves as Non-Executive Chairman of the Board of Directors of Fortune Brands Home and Security (home and security products, 2011-present), as a member of the Board of Directors (2004-present) and Presiding Director (2013-present) of Interpublic Group of Companies, Inc. (marketing communication), and as a member of the Board of Trustees of the University of Florida (2013-present). Previously, Mr. Thomas served as Executive Chairman (2005-2006) and Chairman and Chief Executive Officer (2000-2005) of IMS Health, Inc. (pharmaceutical and healthcare information solutions), and a Director of Fortune Brands, Inc. (consumer products, 2000-2011).
+ The information includes the Trustee's principal occupation during the last five years and other information relating to the experience, attributes, and skills relevant to the Trustee's qualifications to serve as a Trustee, which led to the conclusion that the Trustee should serve as a Trustee for the fund.
Advisory Board Members and Officers:
Correspondence intended for a Member of the Advisory Board (if any) may be sent to Fidelity Investments, P.O. Box 55235, Boston, Massachusetts 02205-5235. Correspondence intended for an officer or Peter S. Lynch may be sent to Fidelity Investments, 245 Summer Street, Boston, Massachusetts 02210. Officers appear below in alphabetical order.
Name, Year of Birth; Principal Occupation
Peter S. Lynch (1944)
Year of Election or Appointment: 2003
Member of the Advisory Board
Mr. Lynch also serves as Member of the Advisory Board of other Fidelity® funds. Mr. Lynch is Vice Chairman and a Director of FMR (investment adviser firm) and FMR Co., Inc. (investment adviser firm). In addition, Mr. Lynch serves as a Trustee of Boston College and as the Chairman of the Inner-City Scholarship Fund. Previously, Mr. Lynch served on the Special Olympics International Board of Directors (1997-2006).
William S. Stavropoulos (1939)
Year of Election or Appointment: 2018
Member of the Advisory Board
Mr. Stavropoulos also serves as Member of the Advisory Board of other Fidelity® funds. Mr. Stavropoulos serves as President and Founder of the Michigan Baseball Foundation, the Great Lakes Loons (2007-present). Mr. Stavropoulos is Chairman Emeritus of the Board of Directors of The Dow Chemical Company, where he previously served in numerous senior management positions, including President, CEO (1995-2000; 2002-2004), Chairman of the Executive Committee (2000-2006), and as a member of the Board of Directors (1990-2006). Currently, Mr. Stavropoulos is Chairman of the Board of Directors of Univar Inc. (global distributor of commodity and specialty chemicals), a Director of Teradata Corporation (data warehousing and technology solutions), and a member of the Advisory Board for Metalmark Capital LLC (private equity investment, 2005-present). Mr. Stavropoulos is an operating advisor to Clayton, Dubilier & Rice, LLC (private equity investment). In addition, Mr. Stavropoulos is a member of the University of Notre Dame Advisory Council for the College of Science, a Trustee of the Rollin L. Gerstacker Foundation, and a Director of Artis-Naples in Naples, Florida. Previously, Mr. Stavropoulos served as Trustee of certain Fidelity® funds (2001-2018) and as a Director of Chemical Financial Corporation (bank holding company, 1993-2012) and Tyco International, Ltd. (multinational manufacturing and services, 2007-2012).
Carol B. Tomé (1957)
Year of Election or Appointment: 2018
Member of the Advisory Board
Ms. Tomé also serves as Member of the Advisory Board of other Fidelity® funds. Ms. Tomé is Chief Financial Officer (2001-present) and Executive Vice President of Corporate Services (2007-present) of The Home Depot, Inc. (home improvement retailer) and a Director (2003-present) and Chair of the Audit Committee (2004-present) of United Parcel Service, Inc. (package delivery and supply chain management). Previously, Ms. Tomé served as Trustee of certain Fidelity® funds (2017), Senior Vice President of Finance and Accounting/Treasurer (2000-2007) and Vice President and Treasurer (1995-2000) of The Home Depot, Inc. and Chair of the Board (2010-2012), Vice Chair of the Board (2009 and 2013), and a Director (2008-2013) of the Federal Reserve Bank of Atlanta. Ms. Tomé is also a director or trustee of many community and professional organizations.
Michael E. Wiley (1950)
Year of Election or Appointment: 2018
Member of the Advisory Board
Mr. Wiley also serves as Trustee or Member of the Advisory Board of other Fidelity® funds. Mr. Wiley serves as a Director of Andeavor Corporation (independent oil refiner and marketer, 2005-present), a Director of Andeavor Logistics LP (natural resources logistics, 2015-present), and a Director of Bill Barrett Corporation (exploration and production, 2005-present). In addition, Mr. Wiley also serves as a Director of Post Oak Bank (privately-held bank, 2004-present). Previously, Mr. Wiley served as a Trustee of other Fidelity® funds (2008-2013), as a Director of Asia Pacific Exploration Consolidated (international oil and gas exploration and production, 2008-2013), as a member of the Board of Trustees of the University of Tulsa (2000-2006; 2007-2010), as a Senior Energy Advisor of Katzenbach Partners, LLC (consulting, 2006-2007), as an Advisory Director of Riverstone Holdings (private investment), Chairman, President, and CEO of Baker Hughes, Inc. (oilfield services, 2000-2004), and as Director of Spinnaker Exploration Company (exploration and production, 2001-2005).
Elizabeth Paige Baumann (1968)
Year of Election or Appointment: 2017
Anti-Money Laundering (AML) Officer
Ms. Baumann also serves as AML Officer of other funds. She is Chief AML Officer (2012-present) and Senior Vice President (2014-present) of FMR LLC (diversified financial services company) and is an employee of Fidelity Investments. Previously, Ms. Baumann served as AML Officer of the funds (2012-2016), and Vice President (2007-2014) and Deputy Anti-Money Laundering Officer (2007-2012) of FMR LLC.
Marc R. Bryant (1966)
Year of Election or Appointment: 2015
Secretary and Chief Legal Officer (CLO)
Mr. Bryant also serves as Secretary and CLO of other funds. Mr. Bryant serves as CLO, Secretary, and Senior Vice President of Fidelity Management & Research Company (investment adviser firm, 2015-present) and FMR Co., Inc. (investment adviser firm, 2015-present); Secretary of Fidelity SelectCo, LLC (investment adviser firm, 2015-present) and Fidelity Investments Money Management, Inc. (investment adviser firm, 2015-present); and CLO of Fidelity Management & Research (Hong Kong) Limited and FMR Investment Management (UK) Limited (investment adviser firms, 2015-present) and Fidelity Management & Research (Japan) Limited (investment adviser firm, 2016-present). He is Senior Vice President and Deputy General Counsel of FMR LLC (diversified financial services company). Previously, Mr. Bryant served as Secretary and CLO of Fidelity Rutland Square Trust II (2010-2014) and Assistant Secretary of Fidelity's Fixed Income and Asset Allocation Funds (2013-2015). Prior to joining Fidelity Investments, Mr. Bryant served as a Senior Vice President and the Head of Global Retail Legal for AllianceBernstein L.P. (2006-2010), and as the General Counsel for ProFund Advisors LLC (2001-2006).
John J. Burke III (1964)
Year of Election or Appointment: 2018
Chief Financial Officer
Mr. Burke also serves as Chief Financial Officer of other funds. Mr. Burke serves as Head of Investment Operations for Fidelity Fund and Investment Operations (2018-present) and is an employee of Fidelity Investments (1998-present). Previously Mr. Burke served as head of Asset Management Investment Operations (2012-2018).
William C. Coffey (1969)
Year of Election or Appointment: 2009
Assistant Secretary
Mr. Coffey also serves as Assistant Secretary of other funds. He is Senior Vice President and Deputy General Counsel of FMR LLC (diversified financial services company, 2010-present), and is an employee of Fidelity Investments. Previously, Mr. Coffey served as Vice President and Associate General Counsel of FMR LLC (2005-2009).
Timothy M. Cohen (1969)
Year of Election or Appointment: 2018
Vice President
Mr. Cohen also serves as Vice President of other funds. Mr. Cohen serves as Co-Head of Global Equity Research (2016-present), a Director of Fidelity Management & Research (Japan) Limited (investment adviser firm, 2016-present), and is an employee of Fidelity Investments. Previously, Mr. Cohen served as Chief Investment Officer - Equity and a Director of Fidelity Management & Research (U.K.) Inc. (investment adviser firm, 2013-2015) and as a Director of Fidelity Management & Research (Hong Kong) Limited (investment adviser firm, 2017).
Jonathan Davis (1968)
Year of Election or Appointment: 2010
Assistant Treasurer
Mr. Davis also serves as Assistant Treasurer of other funds. Mr. Davis serves as Assistant Treasurer of FMR Capital, Inc. (2017-present) and is an employee of Fidelity Investments. Previously, Mr. Davis served as Vice President and Associate General Counsel of FMR LLC (diversified financial services company, 2003-2010).
Adrien E. Deberghes (1967)
Year of Election or Appointment: 2016
Assistant Treasurer
Mr. Deberghes also serves as an officer of other funds. He serves as Assistant Treasurer of FMR Capital, Inc. (2017-present), Executive Vice President of Fidelity Investments Money Management, Inc. (FIMM) (investment adviser firm, 2016-present), and is an employee of Fidelity Investments (2008-present). Previously, Mr. Deberghes served as President and Treasurer of certain Fidelity® funds (2013-2018). Prior to joining Fidelity Investments, Mr. Deberghes was Senior Vice President of Mutual Fund Administration at State Street Corporation (2007-2008), Senior Director of Mutual Fund Administration at Investors Bank & Trust (2005-2007), and Director of Finance for Dunkin' Brands (2000-2005). Previously, Mr. Deberghes served in other fund officer roles.
Laura M. Del Prato (1964)
Year of Election or Appointment: 2018
Assistant Treasurer
Ms. Del Prato also serves as an officer of other funds. Ms. Del Prato is an employee of Fidelity Investments (2017-present). Prior to joining Fidelity Investments, Ms. Del Prato served as a Managing Director and Treasurer of the JPMorgan Mutual Funds (2014-2017). Prior to JPMorgan, Ms. Del Prato served as a partner at Cohen Fund Audit Services (accounting firm, 2012-2013) and KPMG LLP (accounting firm, 2004-2012).
Colm A. Hogan (1973)
Year of Election or Appointment: 2016
Deputy Treasurer
Mr. Hogan also serves as an officer of other funds. Mr. Hogan serves as Assistant Treasurer of FMR Capital, Inc. (2017-present) and is an employee of Fidelity Investments (2005-present). Previously, Mr. Hogan served as Assistant Treasurer of certain Fidelity® funds (2016-2018).
Pamela R. Holding (1964)
Year of Election or Appointment: 2018
Vice President
Ms. Holding also serves as a Vice President of other funds. Ms. Holding serves as Co-Head of Global Equity Research (2018-present) and is an employee of Fidelity Investments (2013-present).
Chris Maher (1972)
Year of Election or Appointment: 2013
Assistant Treasurer
Mr. Maher serves as Assistant Treasurer of other funds. Mr. Maher is Vice President of Valuation Oversight, serves as Assistant Treasurer of FMR Capital, Inc. (2017-present), and is an employee of Fidelity Investments. Previously, Mr. Maher served as Vice President of Asset Management Compliance (2013), Vice President of the Program Management Group of FMR (investment adviser firm, 2010-2013), and Vice President of Valuation Oversight (2008-2010).
Rieco E. Mello (1969)
Year of Election or Appointment: 2017
Assistant Treasurer
Mr. Mello also serves as Assistant Treasurer of other funds. Mr. Mello serves as Assistant Treasurer of FMR Capital, Inc. (2017-present) and is an employee of Fidelity Investments (1995-present).
Kenneth B. Robins (1969)
Year of Election or Appointment: 2016
Chief Compliance Officer
Mr. Robins also serves as an officer of other funds. Mr. Robins serves as Compliance Officer of Fidelity Management & Research Company and FMR Co., Inc. (investment adviser firms, 2016-present) and is an employee of Fidelity Investments (2004-present). Previously, Mr. Robins served as Executive Vice President of Fidelity Investments Money Management, Inc. (investment adviser firm, 2013-2016) and served in other fund officer roles.
Stacie M. Smith (1974)
Year of Election or Appointment: 2016
President and Treasurer
Ms. Smith also serves as an officer of other funds. Ms. Smith serves as Assistant Treasurer of FMR Capital, Inc. (2017-present), is an employee of Fidelity Investments (2009-present), and has served in other fund officer roles. Prior to joining Fidelity Investments, Ms. Smith served as Senior Audit Manager of Ernst & Young LLP (accounting firm, 1996-2009). Previously, Ms. Smith served as Assistant Treasurer (2013-2018) and Deputy Treasurer (2013-2016) of certain Fidelity® funds.
Marc L. Spector (1972)
Year of Election or Appointment: 2016
Assistant Treasurer
Mr. Spector also serves as an officer of other funds. Mr. Spector serves as Assistant Treasurer of FMR Capital, Inc. (2017-present) and is an employee of Fidelity Investments (2016-present). Prior to joining Fidelity Investments, Mr. Spector served as Director at the Siegfried Group (accounting firm, 2013-2016), and prior to Siegfried Group as audit senior manager at Deloitte & Touche (accounting firm, 2005-2013).
Renee Stagnone (1975)
Year of Election or Appointment: 2016
Assistant Treasurer
Ms. Stagnone also serves as an officer of other funds. Ms. Stagnone serves as Assistant Treasurer of FMR Capital, Inc. (2017-present) and is an employee of Fidelity Investments (1997-present). Previously, Ms. Stagnone served as Deputy Treasurer of certain Fidelity® funds (2013-2016).
Shareholder Expense Example
As a shareholder of the Fund, you incur two types of costs: (1) transaction costs, and (2) ongoing costs, including management fees and other Fund expenses. This Example is intended to help you understand your ongoing costs (in dollars) of investing in the Fund and to compare these costs with the ongoing costs of investing in other mutual funds.
The Example is based on an investment of $1,000 invested at the beginning of the period and held for the entire period (February 1, 2018 to July 31, 2018).
Actual Expenses
The first line of the accompanying table for each class of the Fund provides information about actual account values and actual expenses. You may use the information in this line, together with the amount you invested, to estimate the expenses that you paid over the period. Simply divide your account value by $1,000.00 (for example, an $8,600 account value divided by $1,000.00 = 8.6), then multiply the result by the number in the first line for a class of the Fund under the heading entitled "Expenses Paid During Period" to estimate the expenses you paid on your account during this period. A small balance maintenance fee of $12.00 that is charged once a year may apply for certain accounts with a value of less than $2,000. This fee is not included in the table below. If it was, the estimate of expenses you paid during the period would be higher, and your ending account value lower, by this amount. In addition, the Fund, as a shareholder in the underlying Fidelity Central Funds, will indirectly bear its pro-rata share of the fees and expenses incurred by the underlying Fidelity Central Funds. These fees and expenses are not included in the Fund's annualized expense ratio used to calculate the expense estimate in the table below.
Hypothetical Example for Comparison Purposes
The second line of the accompanying table for each class of the Fund provides information about hypothetical account values and hypothetical expenses based on a Class' actual expense ratio and an assumed rate of return of 5% per year before expenses, which is not the Class' actual return. The hypothetical account values and expenses may not be used to estimate the actual ending account balance or expenses you paid for the period. You may use this information to compare the ongoing costs of investing in the Fund and other funds. To do so, compare this 5% hypothetical example with the 5% hypothetical examples that appear in the shareholder reports of the other funds. A small balance maintenance fee of $12.00 that is charged once a year may apply for certain accounts with a value of less than $2,000. This fee is not included in the table below. If it was, the estimate of expenses you paid during the period would be higher, and your ending account value lower, by this amount. In addition, the Fund, as a shareholder in the underlying Fidelity Central Funds, will indirectly bear its pro-rata share of the fees and expenses incurred by the underlying Fidelity Central Funds. These fees and expenses are not included in the Fund's annualized expense ratio used to calculate the expense estimate in the table below.
Please note that the expenses shown in the table are meant to highlight your ongoing costs only and do not reflect any transaction costs. Therefore, the second line of the table is useful in comparing ongoing costs only, and will not help you determine the relative total costs of owning different funds.
| | Annualized Expense Ratio-A | Beginning
Account Value
February 1, 2018 | Ending
Account Value
July 31, 2018 | Expenses Paid
During Period-B
February 1, 2018
to July 31, 2018 |
| Leveraged Company Stock | .78% | | | |
| Actual | | $1,000.00 | $970.90 | $3.81 |
| Hypothetical-C | | $1,000.00 | $1,020.93 | $3.91 |
| Class K | .67% | | | |
| Actual | | $1,000.00 | $971.50 | $3.28 |
| Hypothetical-C | | $1,000.00 | $1,021.47 | $3.36 |
A Annualized expense ratio reflects expenses net of applicable fee waivers.
B Expenses are equal to each Class' annualized expense ratio, multiplied by the average account value over the period, multiplied by 181/365 (to reflect the one-half year period).
C 5% return per year before expenses
Distributions (Unaudited)
The Board of Trustees of Leveraged Company Stock voted to pay to shareholders of record at the opening of business on record date, the following distributions per share derived from capital gains realized from sales of portfolio securities:
| | Pay Date | Record Date | Capital Gains |
| Fidelity Leveraged Company Stock Fund | | | |
| Leveraged Company Stock | 09/17/18 | 09/14/18 | $3.738 |
| Class K | 09/17/18 | 09/14/18 | $3.760 |
|
The fund hereby designates as a capital gain dividend with respect to the taxable year ended July 31 2018, $ 389,354,534, or, if subsequently determined to be different, the net capital gain of such year.
Leveraged Company Stock designates 100% and 52%; Class K designates 86% and 47% of the dividends distributed in September and December, respectively during the fiscal year as qualifying for the dividends–received deduction for corporate shareholders.
Leveraged Company Stock designates 100% and 78% and Class K designates 94% and 71% of the dividends distributed in September and December, respectively during the fiscal year as amounts which may be taken into account as a dividend for purposes of the maximum rate under section 1(h)(11) of the Internal Revenue Code.
The fund will notify shareholders in January 2019 of amounts for use in preparing 2018 income tax returns.
Board Approval of Investment Advisory Contracts
Fidelity Leveraged Company Stock Fund
At its July 2018 meeting, the Board of Trustees, including the Independent Trustees (together, the Board), voted to continue the management contract with Fidelity Management & Research Company (FMR) and the sub-advisory agreements (together, the Advisory Contracts) for the fund for six months through January 31, 2019, in connection with the reunification of the Fidelity Equity High Income Funds Board, which oversees the fund, and the Sector Portfolios Board.
The Board considered that the approval of the fund's Advisory Contracts will not result in any changes in (i) the investment process or strategies employed in the management of the fund's assets; (ii) the fees and expenses paid by shareholders; (iii) the nature, extent or quality of services provided under the fund's Advisory Contracts; or (iv) the day-to-day management of the fund or the persons primarily responsible for such management. The Board concluded that the fund's Advisory Contracts are fair and reasonable, and that the fund's Advisory Contracts should be renewed, without modification, through January 31, 2019, with the understanding that the Board will consider the annual renewal for a full one year period in January 2019.
In connection with its consideration of future renewals of the fund's Advisory Contracts, the Board will consider: (i) the nature, extent and quality of services provided to the fund, including shareholder and administrative services and investment performance; (ii) the competitiveness of the management fee and total expenses for the fund; (iii) the costs of the services and profitability, including the revenues earned and the expenses incurred in conducting the business of developing, marketing, distributing, managing, administering, and servicing the fund and its shareholders, to the extent applicable, as well as potential fall-out benefits from Fidelity's non-fund businesses; and (iv) whether there have been economies of scale in respect of the Fidelity funds, whether the Fidelity funds (including the fund) have appropriately benefited from any such economies of scale, and whether there is the potential for realization of any further economies.
Based on its evaluation of all of the conclusions noted above, and after considering all factors it believed relevant, the Board ultimately concluded that the fund's management fee structure is fair and reasonable, and that the continuation of the fund's Advisory Contracts should be approved.
Corporate Headquarters
245 Summer St.
Boston, MA 02210
www.fidelity.com
LSF-K-ANN-0918
1.863382.109
Fidelity® Blue Chip Growth Fund
Annual Report July 31, 2018 |
|
Contents
To view a fund's proxy voting guidelines and proxy voting record for the 12-month period ended June 30, visit http://www.fidelity.com/proxyvotingresults or visit the Securities and Exchange Commission's (SEC) web site at http://www.sec.gov.
You may also call 1-800-544-8544 to request a free copy of the proxy voting guidelines.
Standard & Poor's, S&P and S&P 500 are registered service marks of The McGraw-Hill Companies, Inc. and have been licensed for use by Fidelity Distributors Corporation.
Other third-party marks appearing herein are the property of their respective owners.
All other marks appearing herein are registered or unregistered trademarks or service marks of FMR LLC or an affiliated company. © 2018 FMR LLC. All rights reserved.
This report and the financial statements contained herein are submitted for the general information of the shareholders of the Fund. This report is not authorized for distribution to prospective investors in the Fund unless preceded or accompanied by an effective prospectus.
A fund files its complete schedule of portfolio holdings with the SEC for the first and third quarters of each fiscal year on Form N-Q. Forms N-Q are available on the SEC’s web site at http://www.sec.gov. A fund's Forms N-Q may be reviewed and copied at the SEC’s Public Reference Room in Washington, DC. Information regarding the operation of the SEC's Public Reference Room may be obtained by calling 1-800-SEC-0330.
For a complete list of a fund's portfolio holdings, view the most recent holdings listing, semiannual report, or annual report on Fidelity's web site at http://www.fidelity.com, http://www.institutional.fidelity.com, or http://www.401k.com, as applicable.
NOT FDIC INSURED •MAY LOSE VALUE •NO BANK GUARANTEE
Neither the Fund nor Fidelity Distributors Corporation is a bank.
Performance: The Bottom Line
Average annual total return reflects the change in the value of an investment, assuming reinvestment of distributions from dividend income and capital gains (the profits earned upon the sale of securities that have grown in value, if any) and assuming a constant rate of performance each year. The hypothetical investment and the average annual total returns do not reflect the deduction of taxes that a shareholder would pay on fund distributions or the redemption of fund shares. During periods of reimbursement by Fidelity, a fund’s total return will be greater than it would be had the reimbursement not occurred. How a fund did yesterday is no guarantee of how it will do tomorrow.
Average Annual Total Returns
| For the periods ended July 31, 2018 | Past 1 year | Past 5 years | Past 10 years |
| Fidelity® Blue Chip Growth Fund | 25.21% | 17.09% | 13.92% |
$10,000 Over 10 Years
Let's say hypothetically that $10,000 was invested in Fidelity® Blue Chip Growth Fund, a class of the fund, on July 31, 2008.
The chart shows how the value of your investment would have changed, and also shows how the Russell 1000® Growth Index performed over the same period.

| Period Ending Values |
| $36,812 | Fidelity® Blue Chip Growth Fund |
| $32,088 | Russell 1000® Growth Index |
Management's Discussion of Fund Performance
Market Recap: The U.S. equity bellwether S&P 500
® index gained 16.24% for the 12 months ending July 31, 2018, despite a resurgence in volatility that challenged the multiyear bull market. Stocks maintained their steady growth until a sharp reversal in February, as volatility spiked amid fear that rising inflation and the potential for the economy to overheat would prompt the U.S. Federal Reserve to pick up the pace of interest rate hikes. The index posted its first negative monthly result since October 2016, and then lost further ground in March on fear of a global trade war. The market stabilized in April and turned upward through mid-June, when escalating trade tension between the U.S. and China soured investor sentiment. The resulting uncertainty lingered into July, but strong corporate earnings helped the S&P 500 rise 3.72% that month to cap the period. For the full one-year period, growth handily topped value, while small-caps bested large-caps. By sector, information technology (+28%) led the way, boosted by strong earnings growth from several major index constituents. Consumer discretionary rose roughly 24%, driven by retailers (+49%). Energy (+20%) gained alongside higher oil prices. Laggards were telecommunication services (-2%), consumer staples (0%) and utilities (+3%), defensive groups that struggled amid rising interest rates and a general preference for risk. Real estate (+5%) fared a bit better but still lagged, as did financials, industrials, health care (each up 13%) and materials (+11%).
Comments from Portfolio Manager Sonu Kalra: For the year, the fund's share classes rose about 25%, ahead of the 22.84% gain of the benchmark Russell 1000
® Growth Index. Choices in the consumer sectors of the market added the most relative value. It also helped to overweight strong-performing consumer discretionary and underweight weaker-performing consumer staples. Juul Labs, an out-of-index investment, contributed more than any other single position by far this period. The firm has emerged as a leader in the rapidly growing electronic cigarette market. Its disruptive technology is intended to offer smokers a potentially safer alternative to tar-burning cigarettes. JUUL's success in penetrating the U.S. market supported a higher estimate of fair value for this position. It is not publicly traded. Competition in this space is likely to increase. The firm and the industry face a number of social and public policy concerns. E-commerce giant Amazon.com was another significant contributor and also was the fund’s largest holding on July 31. Choices in information technology and health care hurt. An underweighting in software & services giant Microsoft detracted more than any other position. The company continued to execute very well this period, with its stock hitting a record high in July after the firm announced stellar quarterly results.
The views expressed above reflect those of the portfolio manager(s) only through the end of the period as stated on the cover of this report and do not necessarily represent the views of Fidelity or any other person in the Fidelity organization. Any such views are subject to change at any time based upon market or other conditions and Fidelity disclaims any responsibility to update such views. These views may not be relied on as investment advice and, because investment decisions for a Fidelity fund are based on numerous factors, may not be relied on as an indication of trading intent on behalf of any Fidelity fund.
Investment Summary (Unaudited)
Top Ten Stocks as of July 31, 2018
| | % of fund's net assets |
| Amazon.com, Inc. | 7.5 |
| Alphabet, Inc. Class A | 7.1 |
| Apple, Inc. | 6.2 |
| Facebook, Inc. Class A | 3.9 |
| Microsoft Corp. | 3.3 |
| NVIDIA Corp. | 2.9 |
| Salesforce.com, Inc. | 2.6 |
| Visa, Inc. Class A | 2.0 |
| Tesla, Inc. | 2.0 |
| Broadcom, Inc. | 1.9 |
| | 39.4 |
Top Five Market Sectors as of July 31, 2018
| | % of fund's net assets |
| Information Technology | 45.4 |
| Consumer Discretionary | 26.0 |
| Health Care | 9.9 |
| Industrials | 5.0 |
| Consumer Staples | 4.6 |
Asset Allocation (% of fund's net assets)
| As of July 31, 2018* |
| | Stocks | 96.1% |
| | Convertible Securities | 3.8% |
| | Short-Term Investments and Net Other Assets (Liabilities) | 0.1% |

* Foreign investments - 9.1%
Schedule of Investments July 31, 2018
Showing Percentage of Net Assets
| Common Stocks - 96.1% | | | |
| | | Shares | Value (000s) |
| CONSUMER DISCRETIONARY - 25.7% | | | |
| Auto Components - 0.1% | | | |
| Aptiv PLC | | 160,879 | $15,777 |
| Veoneer, Inc. (a)(b) | | 110,300 | 5,769 |
| | | | 21,546 |
| Automobiles - 2.0% | | | |
| Tesla, Inc. (a)(b) | | 1,795,391 | 535,278 |
| Diversified Consumer Services - 0.3% | | | |
| Chegg, Inc. (a) | | 396,279 | 10,977 |
| Grand Canyon Education, Inc. (a) | | 55,906 | 6,515 |
| New Oriental Education & Technology Group, Inc. sponsored ADR | | 597,079 | 51,373 |
| Weight Watchers International, Inc. (a) | | 253,056 | 22,656 |
| | | | 91,521 |
| Hotels, Restaurants & Leisure - 2.4% | | | |
| Accor SA | | 43,569 | 2,246 |
| Alsea S.A.B. de CV | | 1,342,500 | 4,631 |
| Caesars Entertainment Corp. (a) | | 2,192,500 | 24,775 |
| Chipotle Mexican Grill, Inc. (a) | | 217,793 | 94,448 |
| Eldorado Resorts, Inc. (a) | | 57,700 | 2,472 |
| Hilton Grand Vacations, Inc. (a) | | 596,239 | 20,624 |
| Hilton Worldwide Holdings, Inc. | | 326,746 | 25,702 |
| International Game Technology PLC | | 677,071 | 17,116 |
| Las Vegas Sands Corp. | | 425,839 | 30,618 |
| Marriott International, Inc. Class A | | 400,597 | 51,212 |
| McDonald's Corp. | | 746,494 | 117,603 |
| Melco Crown Entertainment Ltd. sponsored ADR | | 463,325 | 11,982 |
| Planet Fitness, Inc. (a) | | 648,500 | 30,817 |
| Restaurant Brands International, Inc. | | 470,582 | 30,022 |
| Royal Caribbean Cruises Ltd. | | 442,142 | 49,856 |
| Shake Shack, Inc. Class A (a)(b) | | 267,641 | 16,682 |
| U.S. Foods Holding Corp. (a) | | 1,133,293 | 38,317 |
| Vail Resorts, Inc. | | 42,507 | 11,769 |
| Wyndham Destinations, Inc. | | 368,104 | 16,977 |
| Wyndham Hotels & Resorts, Inc. | | 309,604 | 17,957 |
| Wynn Resorts Ltd. | | 25,503 | 4,253 |
| | | | 620,079 |
| Household Durables - 0.2% | | | |
| Forbo Holding AG (Reg.) | | 1,252 | 1,984 |
| iRobot Corp. (a) | | 34,200 | 2,710 |
| SodaStream International Ltd. (a) | | 581,417 | 50,758 |
| | | | 55,452 |
| Internet & Direct Marketing Retail - 10.3% | | | |
| Amazon.com, Inc. (a) | | 1,108,942 | 1,971,069 |
| JD.com, Inc. sponsored ADR (a) | | 3,387,149 | 121,463 |
| Netflix, Inc. (a) | | 1,087,132 | 366,853 |
| The Booking Holdings, Inc. (a) | | 113,764 | 230,795 |
| The Honest Co., Inc. (a)(c)(d) | | 150,143 | 1,727 |
| TripAdvisor, Inc. (a) | | 46,900 | 2,720 |
| Wayfair LLC Class A (a)(b) | | 256,182 | 27,878 |
| | | | 2,722,505 |
| Media - 0.7% | | | |
| China Literature Ltd. (a)(e) | | 2,033,127 | 17,005 |
| Grupo Televisa SA de CV (CPO) sponsored ADR | | 128,600 | 2,557 |
| The Walt Disney Co. | | 1,130,097 | 128,334 |
| WME Entertainment Parent, LLC Class A (a)(c)(d)(f) | | 9,739,286 | 24,348 |
| | | | 172,244 |
| Multiline Retail - 1.2% | | | |
| Avenue Supermarts Ltd. (a)(e) | | 135,551 | 3,277 |
| Dollar Tree, Inc. (a) | | 2,838,100 | 259,062 |
| Future Retail Ltd. | | 1,455,708 | 11,368 |
| Macy's, Inc. | | 584,142 | 23,208 |
| Ollie's Bargain Outlet Holdings, Inc. (a) | | 195,867 | 13,613 |
| V-Mart Retail Ltd. (a) | | 88,581 | 3,137 |
| | | | 313,665 |
| Specialty Retail - 4.5% | | | |
| At Home Group, Inc. (a) | | 145,800 | 5,288 |
| Burlington Stores, Inc. (a) | | 375,745 | 57,418 |
| Five Below, Inc. (a) | | 392,843 | 38,169 |
| Floor & Decor Holdings, Inc. Class A (a)(b) | | 399,484 | 19,075 |
| Home Depot, Inc. | | 2,404,628 | 474,962 |
| Inditex SA | | 475,336 | 15,577 |
| Lowe's Companies, Inc. | | 2,570,810 | 255,384 |
| Michaels Companies, Inc. (a) | | 279,400 | 5,703 |
| RH (a)(b) | | 772,328 | 104,928 |
| Ross Stores, Inc. | | 776,574 | 67,896 |
| TCNS Clothing Co. Ltd. (a) | | 417,395 | 4,020 |
| Tiffany & Co., Inc. | | 217,100 | 29,864 |
| TJX Companies, Inc. | | 817,443 | 79,505 |
| Ulta Beauty, Inc. (a) | | 60,251 | 14,725 |
| Urban Outfitters, Inc. (a) | | 314,367 | 13,958 |
| | | | 1,186,472 |
| Textiles, Apparel & Luxury Goods - 4.0% | | | |
| adidas AG | | 540,878 | 119,633 |
| Canada Goose Holdings, Inc. (a) | | 383,864 | 22,034 |
| Carbon Black, Inc. (b) | | 39,764 | 826 |
| Cibus Global Ltd. Series C (c)(d)(f) | | 3,045,600 | 6,396 |
| Crinetics Pharmaceuticals, Inc. (a) | | 121,600 | 2,993 |
| Despegar.com Corp. (b) | | 304,211 | 6,395 |
| Gildan Activewear, Inc. | | 96,000 | 2,473 |
| GreenSky, Inc. Class A | | 217,802 | 3,768 |
| Homology Medicines, Inc. (a)(b) | | 105,519 | 1,858 |
| Kering SA | | 318,242 | 169,694 |
| lululemon athletica, Inc. (a) | | 1,463,987 | 175,605 |
| LVMH Moet Hennessy - Louis Vuitton SA | | 97,927 | 34,126 |
| Michael Kors Holdings Ltd. (a) | | 879,733 | 58,705 |
| NIKE, Inc. Class B | | 1,810,041 | 139,210 |
| Pinduoduo, Inc. ADR (b) | | 891,159 | 20,131 |
| Prada SpA | | 7,312,900 | 34,799 |
| PVH Corp. | | 657,717 | 100,973 |
| Rubius Therapeutics, Inc. (a) | | 128,200 | 2,692 |
| Scholar Rock Holding Corp. | | 128,493 | 2,087 |
| Shenzhou International Group Holdings Ltd. | | 565,000 | 6,928 |
| Skechers U.S.A., Inc. Class A (sub. vtg.) (a) | | 1,800,588 | 49,912 |
| Tapestry, Inc. | | 814,643 | 38,386 |
| Tory Burch LLC (c)(d)(f) | | 293,611 | 21,075 |
| Under Armour, Inc. Class C (non-vtg.) (a)(b) | | 877,195 | 16,439 |
| VF Corp. | | 254,580 | 23,439 |
| | | | 1,060,577 |
|
| TOTAL CONSUMER DISCRETIONARY | | | 6,779,339 |
|
| CONSUMER STAPLES - 2.8% | | | |
| Beverages - 1.1% | | | |
| Constellation Brands, Inc. Class A (sub. vtg.) | | 419,703 | 88,234 |
| Diageo PLC | | 151,214 | 5,548 |
| Fever-Tree Drinks PLC | | 535,078 | 24,195 |
| Keurig Dr. Pepper, Inc. | | 1,014,611 | 24,361 |
| Monster Beverage Corp. (a) | | 1,906,533 | 114,430 |
| Pernod Ricard SA | | 14,524 | 2,343 |
| The Coca-Cola Co. | | 834,500 | 38,913 |
| | | | 298,024 |
| Food & Staples Retailing - 0.9% | | | |
| BJ's Wholesale Club Holdings, Inc. | | 1,149,400 | 28,494 |
| Costco Wholesale Corp. | | 812,852 | 177,779 |
| Performance Food Group Co. (a) | | 707,994 | 25,382 |
| | | | 231,655 |
| Food Products - 0.1% | | | |
| Blue Bottle Coffee, Inc. Class C (Escrow) (c)(d) | | 632,822 | 1,468 |
| Darling International, Inc. (a) | | 543,407 | 10,917 |
| Mondelez International, Inc. | | 66,200 | 2,872 |
| The Kraft Heinz Co. | | 204,722 | 12,335 |
| | | | 27,592 |
| Household Products - 0.1% | | | |
| Energizer Holdings, Inc. | | 339,200 | 21,600 |
| Personal Products - 0.6% | | | |
| Coty, Inc. Class A | | 2,555,422 | 34,268 |
| Estee Lauder Companies, Inc. Class A | | 358,377 | 48,359 |
| Herbalife Nutrition Ltd. (a) | | 909,251 | 46,945 |
| Kose Corp. | | 95,500 | 18,269 |
| | | | 147,841 |
| Tobacco - 0.0% | | | |
| JUUL Labs, Inc. (d) | | 6,625 | 1,110 |
| JUUL Labs, Inc. Class A (c)(d) | | 21,148 | 3,543 |
| | | | 4,653 |
|
| TOTAL CONSUMER STAPLES | | | 731,365 |
|
| ENERGY - 2.5% | | | |
| Oil, Gas & Consumable Fuels - 2.5% | | | |
| Anadarko Petroleum Corp. | | 1,232,689 | 90,171 |
| Andeavor | | 166,729 | 25,019 |
| BP PLC sponsored ADR | | 216,070 | 9,743 |
| Cenovus Energy, Inc. | | 482,813 | 4,844 |
| Continental Resources, Inc. (a) | | 1,427,203 | 91,155 |
| Delek U.S. Holdings, Inc. | | 647,108 | 34,504 |
| Diamondback Energy, Inc. | | 330,737 | 43,641 |
| EOG Resources, Inc. | | 406,907 | 52,467 |
| Extraction Oil & Gas, Inc. (a) | | 881,163 | 13,323 |
| Marathon Petroleum Corp. | | 228,256 | 18,450 |
| Petronet LNG Ltd. | | 655,750 | 2,195 |
| Phillips 66 Co. | | 22,180 | 2,736 |
| Pioneer Natural Resources Co. | | 311,693 | 58,994 |
| Reliance Industries Ltd. | | 3,649,638 | 63,226 |
| Valero Energy Corp. | | 443,945 | 52,541 |
| Whiting Petroleum Corp. (a) | | 1,823,860 | 90,555 |
| | | | 653,564 |
| FINANCIALS - 4.2% | | | |
| Banks - 2.0% | | | |
| Bank of America Corp. | | 6,523,942 | 201,459 |
| Citigroup, Inc. | | 1,442,890 | 103,729 |
| Coastal Financial Corp. of Washington (a) | | 41,300 | 671 |
| Cullen/Frost Bankers, Inc. | | 83,624 | 9,240 |
| HDFC Bank Ltd. sponsored ADR | | 448,135 | 46,310 |
| IndusInd Bank Ltd. | | 184,465 | 5,376 |
| JPMorgan Chase & Co. | | 1,394,843 | 160,337 |
| Kotak Mahindra Bank Ltd. | | 615,886 | 11,757 |
| | | | 538,879 |
| Capital Markets - 1.8% | | | |
| Apollo Global Management LLC Class A | | 237,879 | 8,445 |
| BlackRock, Inc. Class A | | 167,553 | 84,239 |
| Charles Schwab Corp. | | 1,413,044 | 72,150 |
| E*TRADE Financial Corp. (a) | | 361,010 | 21,592 |
| Edelweiss Financial Services Ltd. | | 1,204,598 | 5,445 |
| Fairfax India Holdings Corp. (a)(e) | | 844,362 | 13,594 |
| Goldman Sachs Group, Inc. | | 454,202 | 107,841 |
| HDFC Asset Management Co. Ltd. (a) | | 1,726 | 28 |
| Monex Group, Inc. (b) | | 773,300 | 3,845 |
| Morgan Stanley | | 1,175,025 | 59,409 |
| MSCI, Inc. | | 55,714 | 9,259 |
| TD Ameritrade Holding Corp. | | 1,266,682 | 72,391 |
| Virtu Financial, Inc. Class A | | 496,849 | 10,012 |
| | | | 468,250 |
| Consumer Finance - 0.0% | | | |
| American Express Co. | | 106,100 | 10,559 |
| Diversified Financial Services - 0.3% | | | |
| Allakos, Inc. (a)(b) | | 76,000 | 3,099 |
| Berkshire Hathaway, Inc. Class B (a) | | 307,641 | 60,873 |
| GDS Holdings Ltd. ADR (a) | | 86,649 | 1,892 |
| | | | 65,864 |
| Thrifts & Mortgage Finance - 0.1% | | | |
| Housing Development Finance Corp. Ltd. | | 697,722 | 20,331 |
|
| TOTAL FINANCIALS | | | 1,103,883 |
|
| HEALTH CARE - 9.7% | | | |
| Biotechnology - 4.5% | | | |
| AC Immune SA (a) | | 728,983 | 7,035 |
| ACADIA Pharmaceuticals, Inc. (a) | | 261,318 | 3,943 |
| Acceleron Pharma, Inc. (a) | | 80,528 | 3,508 |
| Agios Pharmaceuticals, Inc. (a) | | 300,295 | 25,948 |
| Aimmune Therapeutics, Inc. (a) | | 534,619 | 15,461 |
| Alexion Pharmaceuticals, Inc. (a) | | 1,753,170 | 233,101 |
| Alkermes PLC (a) | | 996,423 | 43,693 |
| Alnylam Pharmaceuticals, Inc. (a) | | 771,166 | 73,261 |
| Amgen, Inc. | | 27,300 | 5,366 |
| AnaptysBio, Inc. (a) | | 122,135 | 9,566 |
| Arena Pharmaceuticals, Inc. (a) | | 364,120 | 14,051 |
| Ascendis Pharma A/S sponsored ADR (a) | | 389,207 | 26,443 |
| BeiGene Ltd. ADR (a) | | 106,377 | 20,175 |
| Biogen, Inc. (a) | | 37,700 | 12,606 |
| bluebird bio, Inc. (a) | | 321,595 | 49,815 |
| Blueprint Medicines Corp. (a) | | 54,138 | 3,223 |
| Celgene Corp. (a) | | 218,042 | 19,643 |
| Cellectis SA sponsored ADR (a) | | 132,078 | 3,817 |
| Chimerix, Inc. (a) | | 74,847 | 335 |
| Coherus BioSciences, Inc. (a) | | 585,471 | 11,153 |
| CytomX Therapeutics, Inc. (a) | | 152,756 | 4,024 |
| CytomX Therapeutics, Inc. (a)(e) | | 378,621 | 9,973 |
| DBV Technologies SA sponsored ADR (a) | | 99,238 | 1,789 |
| Deciphera Pharmaceuticals, Inc. (a) | | 64,900 | 2,233 |
| Denali Therapeutics, Inc. (a)(b) | | 766,613 | 9,652 |
| Editas Medicine, Inc. (a) | | 548,423 | 16,310 |
| Epizyme, Inc. (a) | | 306,622 | 3,955 |
| Exelixis, Inc. (a) | | 1,380,283 | 28,572 |
| FibroGen, Inc. (a) | | 326,422 | 20,597 |
| GenSight Biologics SA (a)(b)(e) | | 588,530 | 1,480 |
| Global Blood Therapeutics, Inc. (a) | | 653,438 | 27,314 |
| Grifols SA ADR | | 101,501 | 2,109 |
| Heron Therapeutics, Inc. (a) | | 195,590 | 7,325 |
| ImmunoGen, Inc. (a) | | 226,300 | 2,105 |
| Insmed, Inc. (a) | | 143,238 | 3,562 |
| Intellia Therapeutics, Inc. (a)(b) | | 559,936 | 14,905 |
| Intercept Pharmaceuticals, Inc. (a) | | 263,212 | 23,989 |
| Ionis Pharmaceuticals, Inc. (a) | | 116,468 | 5,087 |
| Ironwood Pharmaceuticals, Inc. Class A (a) | | 983,161 | 18,955 |
| La Jolla Pharmaceutical Co. (a) | | 162,709 | 5,381 |
| Madrigal Pharmaceuticals, Inc. (a)(b) | | 8,300 | 2,133 |
| Momenta Pharmaceuticals, Inc. (a) | | 89,133 | 2,638 |
| Neurocrine Biosciences, Inc. (a) | | 581,190 | 58,404 |
| Portola Pharmaceuticals, Inc. (a) | | 352,141 | 12,607 |
| Radius Health, Inc. (a)(b) | | 78,159 | 1,876 |
| Regeneron Pharmaceuticals, Inc. (a) | | 354,321 | 130,394 |
| Replimune Group, Inc. (a) | | 178,900 | 2,682 |
| Sage Therapeutics, Inc. (a) | | 415,344 | 59,942 |
| Sarepta Therapeutics, Inc. (a) | | 306,692 | 35,650 |
| Seres Therapeutics, Inc. (a)(b) | | 45,336 | 343 |
| Trevena, Inc. (a) | | 957,837 | 1,475 |
| Ultragenyx Pharmaceutical, Inc. (a) | | 138,579 | 10,963 |
| Vertex Pharmaceuticals, Inc. (a) | | 267,704 | 46,862 |
| Xencor, Inc. (a) | | 420,035 | 15,634 |
| Zai Lab Ltd. ADR | | 169,165 | 3,708 |
| | | | 1,176,771 |
| Health Care Equipment & Supplies - 2.6% | | | |
| Align Technology, Inc. (a) | | 54,364 | 19,389 |
| Baxter International, Inc. | | 69,437 | 5,031 |
| Becton, Dickinson & Co. | | 201,287 | 50,396 |
| Boston Scientific Corp. (a) | | 6,827,906 | 229,486 |
| Danaher Corp. | | 451,697 | 46,335 |
| DexCom, Inc. (a) | | 155,771 | 14,818 |
| Edwards Lifesciences Corp. (a) | | 35,468 | 5,052 |
| Establishment Labs Holdings, Inc. (a) | | 259,559 | 6,754 |
| Fisher & Paykel Healthcare Corp. | | 255,860 | 2,581 |
| Hoya Corp. | | 38,000 | 2,277 |
| Insulet Corp. (a) | | 220,880 | 18,368 |
| Intuitive Surgical, Inc. (a) | | 436,699 | 221,926 |
| Invuity, Inc. (a)(b) | | 562,744 | 2,251 |
| iRhythm Technologies, Inc. (a) | | 536,612 | 40,541 |
| Novocure Ltd. (a) | | 151,142 | 5,139 |
| Penumbra, Inc. (a) | | 13,990 | 1,990 |
| Quanterix Corp. (a) | | 147,190 | 2,206 |
| Stryker Corp. | | 14,086 | 2,300 |
| | | | 676,840 |
| Health Care Providers & Services - 1.7% | | | |
| Humana, Inc. | | 612,647 | 192,481 |
| National Vision Holdings, Inc. | | 579,513 | 23,563 |
| Neuronetics, Inc. | | 57,100 | 1,425 |
| OptiNose, Inc. | | 605,274 | 12,317 |
| UnitedHealth Group, Inc. | | 919,357 | 232,800 |
| | | | 462,586 |
| Health Care Technology - 0.1% | | | |
| Evolent Health, Inc. (a) | | 306,307 | 6,187 |
| Teladoc, Inc. (a) | | 398,892 | 23,874 |
| | | | 30,061 |
| Life Sciences Tools & Services - 0.0% | | | |
| Illumina, Inc. (a) | | 9,100 | 2,952 |
| Pharmaceuticals - 0.8% | | | |
| Aclaris Therapeutics, Inc. (a) | | 157,406 | 2,698 |
| Akcea Therapeutics, Inc. (b) | | 807,182 | 25,523 |
| Allergan PLC | | 15,100 | 2,780 |
| AstraZeneca PLC sponsored ADR | | 354,163 | 13,858 |
| Bausch Health Cos., Inc. (Canada) (a) | | 460,688 | 10,015 |
| Bayer AG | | 20,951 | 2,332 |
| Castle Creek Pharmaceuticals, LLC Class A-2 unit (a)(c)(d)(f)(g) | | 29,758 | 15,176 |
| Chiasma, Inc. warrants 12/16/24 (a) | | 55,391 | 8 |
| Collegium Pharmaceutical, Inc. (a)(b) | | 92,783 | 1,788 |
| Dova Pharmaceuticals, Inc. (a)(b) | | 203,816 | 4,396 |
| Intersect ENT, Inc. (a) | | 108,536 | 3,511 |
| Jazz Pharmaceuticals PLC (a) | | 312,121 | 54,022 |
| Mylan NV (a) | | 68,700 | 2,563 |
| MyoKardia, Inc. (a) | | 84,265 | 4,837 |
| Nektar Therapeutics (a) | | 759,994 | 39,976 |
| The Medicines Company (a) | | 488,536 | 19,410 |
| Theravance Biopharma, Inc. (a) | | 56,967 | 1,364 |
| Zogenix, Inc. (a) | | 110,561 | 6,274 |
| | | | 210,531 |
|
| TOTAL HEALTH CARE | | | 2,559,741 |
|
| INDUSTRIALS - 4.9% | | | |
| Aerospace & Defense - 1.7% | | | |
| Bombardier, Inc. Class B (sub. vtg.) (a) | | 9,375,231 | 35,314 |
| Elbit Systems Ltd.(b) | | 50,511 | 6,077 |
| General Dynamics Corp. | | 168,666 | 33,693 |
| Northrop Grumman Corp. | | 363,006 | 109,080 |
| Raytheon Co. | | 322,426 | 63,850 |
| Space Exploration Technologies Corp.: | | | |
| Class A (a)(c)(d) | | 242,545 | 40,990 |
| Class C (c)(d) | | 2,783 | 470 |
| The Boeing Co. | | 385,039 | 137,189 |
| United Technologies Corp. | | 122,663 | 16,650 |
| | | | 443,313 |
| Air Freight & Logistics - 0.3% | | | |
| Expeditors International of Washington, Inc. | | 34,669 | 2,641 |
| XPO Logistics, Inc. (a) | | 651,048 | 64,923 |
| | | | 67,564 |
| Airlines - 0.8% | | | |
| Delta Air Lines, Inc. | | 1,378,326 | 75,009 |
| Southwest Airlines Co. | | 136,900 | 7,962 |
| Spirit Airlines, Inc. (a) | | 1,196,972 | 51,996 |
| United Continental Holdings, Inc. (a) | | 723,995 | 58,209 |
| Wizz Air Holdings PLC (a)(e) | | 248,315 | 11,297 |
| | | | 204,473 |
| Building Products - 0.1% | | | |
| Masco Corp. | | 532,267 | 21,466 |
| Commercial Services & Supplies - 0.1% | | | |
| Copart, Inc. (a) | | 114,715 | 6,583 |
| Evoqua Water Technologies Corp. (a) | | 343,940 | 7,340 |
| HomeServe PLC | | 948,557 | 12,600 |
| Tomra Systems ASA | | 472,100 | 9,758 |
| | | | 36,281 |
| Electrical Equipment - 0.3% | | | |
| AMETEK, Inc. | | 69,769 | 5,428 |
| Fortive Corp. | | 505,480 | 41,490 |
| Melrose Industries PLC | | 973,593 | 2,759 |
| Nidec Corp. | | 48,500 | 7,018 |
| Regal Beloit Corp. | | 368,504 | 31,673 |
| | | | 88,368 |
| Industrial Conglomerates - 0.6% | | | |
| General Electric Co. | | 5,008,609 | 68,267 |
| Honeywell International, Inc. | | 427,030 | 68,175 |
| ITT, Inc. | | 484,270 | 27,444 |
| | | | 163,886 |
| Machinery - 0.6% | | | |
| Aumann AG (e) | | 147,037 | 10,265 |
| Deere & Co. | | 465,847 | 67,450 |
| Eicher Motors Ltd. | | 14,288 | 5,802 |
| Minebea Mitsumi, Inc. | | 104,600 | 1,877 |
| Rational AG | | 15,141 | 10,375 |
| SMC Corp. | | 5,100 | 1,710 |
| WABCO Holdings, Inc. (a) | | 151,353 | 19,022 |
| Xylem, Inc. | | 438,923 | 33,604 |
| | | | 150,105 |
| Professional Services - 0.1% | | | |
| CoStar Group, Inc. (a) | | 6,300 | 2,620 |
| Equifax, Inc. | | 42,400 | 5,321 |
| IHS Markit Ltd. (a) | | 479,739 | 25,441 |
| Recruit Holdings Co. Ltd. | | 93,000 | 2,548 |
| | | | 35,930 |
| Road & Rail - 0.2% | | | |
| J.B. Hunt Transport Services, Inc. | | 196,575 | 23,569 |
| Knight-Swift Transportation Holdings, Inc. Class A | | 1,077,143 | 35,061 |
| | | | 58,630 |
| Trading Companies & Distributors - 0.1% | | | |
| HD Supply Holdings, Inc. (a) | | 302,100 | 13,286 |
| Wolseley PLC | | 29,978 | 2,365 |
| | | | 15,651 |
| Transportation Infrastructure - 0.0% | | | |
| Adani Ports & Special Economic Zone Ltd. | | 357,936 | 2,090 |
|
| TOTAL INDUSTRIALS | | | 1,287,757 |
|
| INFORMATION TECHNOLOGY - 44.0% | | | |
| Communications Equipment - 0.3% | | | |
| Arista Networks, Inc. (a) | | 146,992 | 37,590 |
| Lumentum Holdings, Inc. (a) | | 50,000 | 2,613 |
| NETGEAR, Inc. (a) | | 700,664 | 46,139 |
| | | | 86,342 |
| Electronic Equipment & Components - 0.2% | | | |
| Corning, Inc. | | 356,600 | 11,832 |
| Dell Technologies, Inc. (a) | | 301,079 | 27,856 |
| II-VI, Inc. (a) | | 119,400 | 4,680 |
| Jabil, Inc. | | 93,000 | 2,620 |
| | | | 46,988 |
| Internet Software & Services - 14.7% | | | |
| 2U, Inc. (a) | | 216,591 | 16,387 |
| Akamai Technologies, Inc. (a) | | 582,969 | 43,874 |
| Alibaba Group Holding Ltd. sponsored ADR (a) | | 1,205,688 | 225,741 |
| Alphabet, Inc.: | | | |
| Class A (a) | | 1,520,167 | 1,865,579 |
| Class C (a) | | 122,783 | 149,459 |
| ANGI Homeservices, Inc. Class A (a) | | 1,231,698 | 19,350 |
| Carbonite, Inc. (a) | | 71,500 | 2,452 |
| CarGurus, Inc. Class A (b) | | 573,035 | 24,841 |
| DocuSign, Inc. (b) | | 68,837 | 3,710 |
| Dropbox, Inc.: | | | |
| Class A (a)(b) | | 117,872 | 3,155 |
| Class B | | 669,209 | 17,019 |
| Facebook, Inc. Class A (a) | | 5,992,007 | 1,034,101 |
| GMO Internet, Inc. | | 445,000 | 9,436 |
| GoDaddy, Inc. (a) | | 471,862 | 34,738 |
| GrubHub, Inc. (a) | | 62,599 | 7,630 |
| HUYA, Inc. ADR (b) | | 258,565 | 8,326 |
| IAC/InterActiveCorp (a) | | 109,831 | 16,173 |
| Mercari, Inc. (a) | | 55,900 | 2,355 |
| Mimecast Ltd. (a) | | 63,980 | 2,298 |
| Momo, Inc. ADR (a) | | 425,151 | 17,440 |
| NetEase, Inc. ADR | | 112,900 | 29,128 |
| New Relic, Inc. (a) | | 86,260 | 8,428 |
| Nutanix, Inc. Class B (a)(e) | | 482,746 | 23,601 |
| Okta, Inc. (a) | | 94,752 | 4,704 |
| Pandora Media, Inc. (a) | | 328,801 | 2,216 |
| Shopify, Inc. Class A (a) | | 287,501 | 40,051 |
| Stamps.com, Inc. (a) | | 121,551 | 31,725 |
| Tencent Holdings Ltd. | | 3,197,200 | 145,519 |
| The Trade Desk, Inc. (a) | | 241,986 | 20,404 |
| Twilio, Inc. Class A (a) | | 107,121 | 6,201 |
| Twitter, Inc. (a) | | 119,600 | 3,812 |
| Wix.com Ltd. (a) | | 342,616 | 32,549 |
| Yandex NV Series A (a) | | 492,425 | 17,708 |
| YY, Inc. ADR (a) | | 150,200 | 14,003 |
| | | | 3,884,113 |
| IT Services - 4.9% | | | |
| Adyen BV (e) | | 41,069 | 26,240 |
| Alliance Data Systems Corp. | | 103,767 | 23,335 |
| Endava PLC ADR (a) | | 89,900 | 2,150 |
| FleetCor Technologies, Inc. (a) | | 107,058 | 23,232 |
| MasterCard, Inc. Class A | | 1,927,294 | 381,604 |
| Netcompany Group A/S | | 95,000 | 3,456 |
| PayPal Holdings, Inc. (a) | | 2,724,026 | 223,751 |
| Square, Inc. (a) | | 298,816 | 19,318 |
| Total System Services, Inc. | | 60,100 | 5,502 |
| Visa, Inc. Class A | | 3,938,093 | 538,495 |
| Wirecard AG | | 18,485 | 3,453 |
| Worldpay, Inc. (a) | | 489,737 | 40,251 |
| | | | 1,290,787 |
| Semiconductors & Semiconductor Equipment - 7.3% | | | |
| Acacia Communications, Inc. (a) | | 154,500 | 4,966 |
| Advanced Micro Devices, Inc. (a) | | 2,180,186 | 39,963 |
| Analog Devices, Inc. | | 321,339 | 30,894 |
| ASML Holding NV | | 37,300 | 7,982 |
| Broadcom, Inc. | | 2,271,429 | 503,735 |
| Inphi Corp. (a)(b) | | 682,618 | 21,462 |
| Intel Corp. | | 1,354,163 | 65,135 |
| Marvell Technology Group Ltd. | | 5,289,776 | 112,725 |
| Micron Technology, Inc. (a) | | 3,603,072 | 190,206 |
| Monolithic Power Systems, Inc. | | 172,510 | 22,889 |
| NVIDIA Corp. | | 3,101,549 | 759,445 |
| NXP Semiconductors NV (a) | | 368,677 | 35,150 |
| Qualcomm, Inc. | | 1,425,301 | 91,348 |
| Renesas Electronics Corp. (a) | | 3,820,800 | 34,034 |
| | | | 1,919,934 |
| Software - 10.4% | | | |
| Activision Blizzard, Inc. | | 4,866,428 | 357,293 |
| Adobe Systems, Inc. (a) | | 1,043,615 | 255,352 |
| Altair Engineering, Inc. Class A (a) | | 90,786 | 3,187 |
| Atom Tickets LLC (a)(c)(d)(f) | | 1,204,239 | 7,000 |
| Avalara, Inc. | | 35,032 | 1,343 |
| Black Knight, Inc. (a) | | 48,634 | 2,512 |
| Electronic Arts, Inc. (a) | | 903,415 | 116,315 |
| HubSpot, Inc. (a) | | 48,321 | 5,997 |
| Intuit, Inc. | | 218,169 | 44,559 |
| Microsoft Corp. | | 8,102,557 | 859,519 |
| Nintendo Co. Ltd. | | 89,300 | 30,200 |
| Paycom Software, Inc. (a)(b) | | 449,075 | 47,714 |
| Pluralsight, Inc. | | 269,355 | 6,252 |
| Proofpoint, Inc. (a) | | 161,672 | 18,439 |
| Red Hat, Inc. (a) | | 808,221 | 114,145 |
| RingCentral, Inc. (a) | | 198,275 | 14,623 |
| SailPoint Technologies Holding, Inc. (a) | | 288,298 | 6,945 |
| Salesforce.com, Inc. (a) | | 5,029,618 | 689,812 |
| SendGrid, Inc. (a) | | 403,600 | 10,304 |
| Smartsheet, Inc. (b) | | 55,450 | 1,192 |
| Snap, Inc. Class A (a)(b) | | 3,439,373 | 42,992 |
| Splunk, Inc. (a) | | 70,183 | 6,745 |
| Talend SA ADR (a) | | 159,523 | 9,436 |
| Tanium, Inc. Class B (a)(c)(d) | | 554,900 | 3,765 |
| Tenable Holdings, Inc. | | 46,700 | 1,396 |
| Workday, Inc. Class A (a) | | 413,489 | 51,281 |
| Zendesk, Inc. (a) | | 462,489 | 25,192 |
| Zscaler, Inc. (a)(b) | | 204,162 | 7,209 |
| | | | 2,740,719 |
| Technology Hardware, Storage & Peripherals - 6.2% | | | |
| Apple, Inc. | | 8,685,465 | 1,652,757 |
|
| TOTAL INFORMATION TECHNOLOGY | | | 11,621,640 |
|
| MATERIALS - 2.1% | | | |
| Chemicals - 2.1% | | | |
| Cabot Corp. | | 152,805 | 10,100 |
| CF Industries Holdings, Inc. | | 2,694,285 | 119,680 |
| DowDuPont, Inc. | | 849,708 | 58,434 |
| FMC Corp. | | 244,567 | 21,982 |
| LG Chemical Ltd. | | 18,286 | 6,158 |
| LyondellBasell Industries NV Class A | | 1,054,241 | 116,799 |
| Nutrien Ltd. | | 493,156 | 26,784 |
| Orion Engineered Carbons SA | | 255,924 | 8,394 |
| The Chemours Co. LLC | | 2,231,263 | 102,214 |
| The Mosaic Co. | | 906,279 | 27,288 |
| Tronox Ltd. Class A | | 1,325,866 | 24,462 |
| Westlake Chemical Corp. | | 195,437 | 20,955 |
| | | | 543,250 |
| Construction Materials - 0.0% | | | |
| Buzzi Unicem SpA | | 73,708 | 1,625 |
| Loma Negra Compania Industrial Argentina SA ADR (a) | | 343,940 | 3,866 |
| | | | 5,491 |
|
| TOTAL MATERIALS | | | 548,741 |
|
| REAL ESTATE - 0.1% | | | |
| Equity Real Estate Investment Trusts (REITs) - 0.1% | | | |
| Ant International Co. Ltd. (c)(d) | | 4,367,660 | 24,503 |
| Real Estate Management & Development - 0.0% | | | |
| Parsvnath Developers Ltd. (a) | | 16,043,447 | 2,836 |
|
| TOTAL REAL ESTATE | | | 27,339 |
|
| TELECOMMUNICATION SERVICES - 0.1% | | | |
| Wireless Telecommunication Services - 0.1% | | | |
| Boingo Wireless, Inc. (a) | | 244,300 | 5,646 |
| T-Mobile U.S., Inc. (a) | | 540,561 | 32,434 |
| | | | 38,080 |
| UTILITIES - 0.0% | | | |
| Gas Utilities - 0.0% | | | |
| China Resource Gas Group Ltd. | | 730,000 | 3,460 |
| ENN Energy Holdings Ltd. | | 323,000 | 3,286 |
| | | | 6,746 |
| TOTAL COMMON STOCKS | | | |
| (Cost $13,507,381) | | | 25,358,195 |
|
| Preferred Stocks - 3.8% | | | |
| Convertible Preferred Stocks - 3.8% | | | |
| CONSUMER DISCRETIONARY - 0.3% | | | |
| Hotels, Restaurants & Leisure - 0.1% | | | |
| MOD Super Fast Pizza Holdings LLC Series 3 Preferred (a)(c)(d)(f) | | 74,995 | 11,500 |
| Neutron Holdings, Inc. Series C (c)(d) | | 50,654,200 | 9,262 |
| Topgolf International, Inc. Series F (c)(d) | | 415,730 | 6,402 |
| | | | 27,164 |
| Internet & Direct Marketing Retail - 0.1% | | | |
| China Internet Plus Holdings Ltd. Series A-11 (a)(c)(d) | | 3,163,704 | 15,819 |
| The Honest Co., Inc.: | | | |
| Series C (a)(c)(d) | | 350,333 | 6,868 |
| Series D (a)(c)(d) | | 77,448 | 1,518 |
| Series E (c)(d) | | 551,397 | 10,810 |
| | | | 35,015 |
| Leisure Products - 0.1% | | | |
| Peloton Interactive, Inc. Series E (a)(c)(d) | | 335,429 | 19,375 |
| Textiles, Apparel & Luxury Goods - 0.0% | | | |
| Generation Bio Series B (c)(d) | | 460,500 | 4,212 |
| TOTAL CONSUMER DISCRETIONARY | | | 85,766 |
| CONSUMER STAPLES - 1.8% | | | |
| Food & Staples Retailing - 0.1% | | | |
| Roofoods Ltd. Series F (c)(d) | | 41,941 | 17,194 |
| Food Products - 0.0% | | | |
| Agbiome LLC Series C (c)(d) | | 1,091,300 | 6,912 |
| Tobacco - 1.7% | | | |
| JUUL Labs, Inc.: | | | |
| Series C (a)(c)(d) | | 2,613,078 | 437,769 |
| Series D (c)(d) | | 13,822 | 2,316 |
| Series E (c)(d) | | 14,959 | 2,506 |
| | | | 442,591 |
| TOTAL CONSUMER STAPLES | | | 466,697 |
| FINANCIALS - 0.0% | | | |
| Consumer Finance - 0.0% | | | |
| Oportun Finance Corp. Series H (a)(c)(d) | | 3,552,125 | 8,596 |
| HEALTH CARE - 0.2% | | | |
| Biotechnology - 0.1% | | | |
| 23andMe, Inc. Series F (c)(d) | | 800,982 | 13,897 |
| Axcella Health, Inc. Series C (a)(c)(d) | | 545,634 | 7,050 |
| Immunocore Ltd. Series A (a)(c)(d) | | 11,275 | 1,500 |
| | | | 22,447 |
| Health Care Providers & Services - 0.1% | | | |
| Mulberry Health, Inc. Series A8 (a)(c)(d) | | 2,728,716 | 19,469 |
| TOTAL HEALTH CARE | | | 41,916 |
| INDUSTRIALS - 0.1% | | | |
| Aerospace & Defense - 0.1% | | | |
| Space Exploration Technologies Corp.: | | | |
| Series G (a)(c)(d) | | 97,277 | 16,440 |
| Series H (c)(d) | | 25,767 | 4,355 |
| | | | 20,795 |
| Professional Services - 0.0% | | | |
| YourPeople, Inc. Series C (a)(c)(d) | | 692,196 | 3,579 |
| TOTAL INDUSTRIALS | | | 24,374 |
| INFORMATION TECHNOLOGY - 1.4% | | | |
| Internet Software & Services - 1.2% | | | |
| ContextLogic, Inc. Series G (c)(d) | | 133,922 | 21,646 |
| Jet.Com, Inc. Series B1 (Escrow) (a)(c)(d) | | 2,928,086 | 133 |
| Lyft, Inc.: | | | |
| Series H (c)(d) | | 719,567 | 34,074 |
| Series I (c)(d) | | 547,120 | 25,908 |
| Reddit, Inc. Series B (c)(d) | | 524,232 | 17,798 |
| Starry, Inc. Series C (c)(d) | | 5,833,836 | 5,379 |
| Uber Technologies, Inc.: | | | |
| Series D, 8.00% (a)(c)(d) | | 5,107,956 | 204,318 |
| Series E, 8.00% (a)(c)(d) | | 101,698 | 4,068 |
| | | | 313,324 |
| IT Services - 0.0% | | | |
| AppNexus, Inc. Series E (Escrow) (a)(c)(d) | | 646,522 | 12,995 |
| Software - 0.2% | | | |
| Bracket Computing, Inc. Series C (a)(c)(d) | | 1,207,761 | 2,162 |
| Cloudflare, Inc. Series D, 8.00% (a)(c)(d) | | 696,025 | 6,939 |
| Compass, Inc. Series E (c)(d) | | 53,263 | 3,594 |
| Dataminr, Inc. Series D (a)(c)(d) | | 277,250 | 5,517 |
| Delphix Corp. Series D (a)(c)(d) | | 675,445 | 4,917 |
| Malwarebytes Corp. Series B (a)(c)(d) | | 1,056,193 | 17,153 |
| Taboola.Com Ltd. Series E (a)(c)(d) | | 634,902 | 11,066 |
| | | | 51,348 |
| TOTAL INFORMATION TECHNOLOGY | | | 377,667 |
|
| TOTAL CONVERTIBLE PREFERRED STOCKS | | | 1,005,016 |
|
| Nonconvertible Preferred Stocks - 0.0% | | | |
| CONSUMER STAPLES - 0.0% | | | |
| Tobacco - 0.0% | | | |
| PAX Labs, Inc. Series A (c)(d) | | 2,555,833 | 3,706 |
| TOTAL PREFERRED STOCKS | | | |
| (Cost $408,047) | | | 1,008,722 |
|
| Money Market Funds - 2.3% | | | |
| Fidelity Cash Central Fund, 1.96% (h) | | 4,471,144 | 4,472 |
| Fidelity Securities Lending Cash Central Fund 1.97% (h)(i) | | 602,711,991 | 602,772 |
| TOTAL MONEY MARKET FUNDS | | | |
| (Cost $607,244) | | | 607,244 |
| TOTAL INVESTMENT IN SECURITIES - 102.2% | | | |
| (Cost $14,522,672) | | | 26,974,161 |
| NET OTHER ASSETS (LIABILITIES) - (2.2)% | | | (590,546) |
| NET ASSETS - 100% | | | $26,383,615 |
Legend
(a) Non-income producing
(b) Security or a portion of the security is on loan at period end.
(c) Restricted securities - Investment in securities not registered under the Securities Act of 1933 (excluding 144A issues). At the end of the period, the value of restricted securities (excluding 144A issues) amounted to $1,159,182,000 or 4.4% of net assets.
(d) Level 3 security
(e) Security exempt from registration under Rule 144A of the Securities Act of 1933. These securities may be resold in transactions exempt from registration, normally to qualified institutional buyers. At the end of the period, the value of these securities amounted to $116,732,000 or 0.4% of net assets.
(f) Investment is owned by a wholly-owned subsidiary (Subsidiary) that is treated as a corporation for U.S. tax purposes.
(g) Investment represents common shares and preferred shares.
(h) Affiliated fund that is generally available only to investment companies and other accounts managed by Fidelity Investments. The rate quoted is the annualized seven-day yield of the fund at period end. A complete unaudited listing of the fund's holdings as of its most recent quarter end is available upon request. In addition, each Fidelity Central Fund's financial statements, which are not covered by the Fund's Report of Independent Registered Public Accounting Firm, are available on the SEC's website or upon request.
(i) Investment made with cash collateral received from securities on loan.
Additional information on each restricted holding is as follows:
| Security | Acquisition Date | Acquisition Cost (000s) |
| 23andMe, Inc. Series F | 8/31/17 | $11,121 |
| Agbiome LLC Series C | 6/29/18 | $6,912 |
| Ant International Co. Ltd. | 5/16/18 | $24,503 |
| AppNexus, Inc. Series E | 8/1/14 | $12,951 |
| Atom Tickets LLC | 8/15/17 | $7,000 |
| Axcella Health, Inc. Series C | 1/30/15 | $5,500 |
| Blue Bottle Coffee, Inc. Class C (Escrow) | 10/30/17 | $1,455 |
| Bracket Computing, Inc. Series C | 9/9/15 | $9,500 |
| Castle Creek Pharmaceuticals, LLC Class A-2 unit | 9/29/16 | $9,820 |
| China Internet Plus Holdings Ltd. Series A-11 | 1/26/15 | $10,000 |
| Cibus Global Ltd. Series C | 2/16/18 | $6,396 |
| Cloudflare, Inc. Series D, 8.00% | 11/5/14 - 6/24/15 | $4,349 |
| Compass, Inc. Series E | 11/3/17 | $3,594 |
| ContextLogic, Inc. Series G | 10/24/17 | $18,017 |
| Dataminr, Inc. Series D | 3/6/15 | $3,535 |
| Delphix Corp. Series D | 7/10/15 | $6,079 |
| Generation Bio Series B | 2/21/18 | $4,212 |
| Immunocore Ltd. Series A | 7/27/15 | $2,122 |
| Jet.Com, Inc. Series B1 (Escrow) | 9/19/16 | $- |
| JUUL Labs, Inc. Class A | 12/20/17 - 7/6/18 | $3,621 |
| JUUL Labs, Inc. Series C | 5/22/15 - 7/6/18 | $15,390 |
| JUUL Labs, Inc. Series D | 6/25/18 - 7/6/18 | $1,665 |
| JUUL Labs, Inc. Series E | 12/20/17 - 7/6/18 | $2,561 |
| Lyft, Inc. Series H | 11/22/17 | $28,600 |
| Lyft, Inc. Series I | 6/27/18 | $25,908 |
| Malwarebytes Corp. Series B | 12/21/15 | $10,958 |
| MOD Super Fast Pizza Holdings LLC Series 3 Preferred | 11/3/16 - 12/14/17 | $10,293 |
| Mulberry Health, Inc. Series A8 | 1/20/16 | $18,432 |
| Neutron Holdings, Inc. Series C | 7/3/18 | $9,262 |
| Oportun Finance Corp. Series H | 2/6/15 | $10,114 |
| PAX Labs, Inc. Series A | 5/22/15 | $1,891 |
| Peloton Interactive, Inc. Series E | 3/31/17 | $7,266 |
| Reddit, Inc. Series B | 7/26/17 | $7,442 |
| Roofoods Ltd. Series F | 9/12/17 | $14,829 |
| Space Exploration Technologies Corp. Class A | 10/16/15 - 9/11/17 | $23,515 |
| Space Exploration Technologies Corp. Class C | 9/11/17 | $376 |
| Space Exploration Technologies Corp. Series G | 1/20/15 | $7,535 |
| Space Exploration Technologies Corp. Series H | 8/4/17 | $3,479 |
| Starry, Inc. Series C | 12/8/17 | $5,379 |
| Taboola.Com Ltd. Series E | 12/22/14 | $6,619 |
| Tanium, Inc. Class B | 4/21/17 | $2,755 |
| The Honest Co., Inc. | 8/21/14 | $4,062 |
| The Honest Co., Inc. Series C | 8/21/14 | $9,479 |
| The Honest Co., Inc. Series D | 8/3/15 | $3,544 |
| The Honest Co., Inc. Series E | 9/28/17 | $10,810 |
| Topgolf International, Inc. Series F | 11/10/17 | $5,751 |
| Tory Burch LLC | 5/14/15 | $20,890 |
| Uber Technologies, Inc. Series D, 8.00% | 6/6/14 | $79,240 |
| Uber Technologies, Inc. Series E, 8.00% | 12/5/14 | $3,388 |
| WME Entertainment Parent, LLC Class A | 4/13/16 - 8/16/16 | $19,025 |
| YourPeople, Inc. Series C | 5/1/15 | $10,314 |
Affiliated Central Funds
Information regarding fiscal year to date income earned by the Fund from investments in Fidelity Central Funds is as follows:
| Fund | Income earned |
| | (Amounts in thousands) |
| Fidelity Cash Central Fund | $264 |
| Fidelity Securities Lending Cash Central Fund | 7,875 |
| Total | $8,139 |
Amounts in the income column in the above table include any capital gain distributions from underlying funds, which are presented in the corresponding line-item in the Statement of Operations if applicable.
Other Affiliated Issuers
An affiliated company is a company in which the Fund has ownership of at least 5% of the voting securities. Fiscal year to date transactions with companies which are or were affiliates are as follows:
| Affiliate (Amounts in thousands) | Value, beginning of period | Purchases | Sales Proceeds(a) | Dividend Income | Realized Gain (loss) | Change in Unrealized appreciation (depreciation) | Value, end of period |
| RH | $82,844 | $-- | $28,912 | $-- | $1,361 | $49,635 | $-- |
| Total | $82,844 | $-- | $28,912 | $-- | $1,361 | $49,635 | $-- |
(a) Includes the value of securities delivered through in-kind transactions, if applicable.
Investment Valuation
The following is a summary of the inputs used, as of July 31, 2018, involving the Fund's assets and liabilities carried at fair value. The inputs or methodology used for valuing securities may not be an indication of the risk associated with investing in those securities. For more information on valuation inputs, and their aggregation into the levels used below, please refer to the Investment Valuation section in the accompanying Notes to Financial Statements.
| | Valuation Inputs at Reporting Date: |
| Description | Total | Level 1 | Level 2 | Level 3 |
| (Amounts in thousands) | | | | |
| Investments in Securities: | | | | |
| Equities: | | | | |
| Consumer Discretionary | $6,865,105 | $6,676,090 | $49,703 | $139,312 |
| Consumer Staples | 1,201,768 | 719,696 | 5,548 | 476,524 |
| Energy | 653,564 | 653,564 | -- | -- |
| Financials | 1,112,479 | 1,103,855 | 28 | 8,596 |
| Health Care | 2,601,657 | 2,542,225 | 2,340 | 57,092 |
| Industrials | 1,312,131 | 1,241,872 | 4,425 | 65,834 |
| Information Technology | 11,999,307 | 11,418,137 | 192,738 | 388,432 |
| Materials | 548,741 | 548,741 | -- | -- |
| Real Estate | 27,339 | 2,836 | -- | 24,503 |
| Telecommunication Services | 38,080 | 38,080 | -- | -- |
| Utilities | 6,746 | 6,746 | -- | -- |
| Money Market Funds | 607,244 | 607,244 | -- | -- |
| Total Investments in Securities: | $26,974,161 | $25,559,086 | $254,782 | $1,160,293 |
The following is a reconciliation of Investments in Securities for which Level 3 inputs were used in determining value:
| (Amounts in thousands) | |
| Investments in Securities: | |
| Equities - Consumer Staples | |
| Beginning Balance | $18,219 |
| Net Realized Gain (Loss) on Investment Securities | 8,252 |
| Net Unrealized Gain (Loss) on Investment Securities | 440,886 |
| Cost of Purchases | 39,986 |
| Proceeds of Sales | (30,819) |
| Amortization/Accretion | -- |
| Transfers into Level 3 | -- |
| Transfers out of Level 3 | -- |
| Ending Balance | $476,524 |
| The change in unrealized gain (loss) for the period attributable to Level 3 securities held at July 31, 2018 | $428,178 |
| Equities - Information Technology | |
| Beginning Balance | $338,669 |
| Net Realized Gain (Loss) on Investment Securities | 2,075 |
| Net Unrealized Gain (Loss) on Investment Securities | (27,736) |
| Cost of Purchases | 88,515 |
| Proceeds of Sales | (13,091) |
| Amortization/Accretion | -- |
| Transfers into Level 3 | -- |
| Transfers out of Level 3 | -- |
| Ending Balance | $388,432 |
| The change in unrealized gain (loss) for the period attributable to Level 3 securities held at July 31, 2018 | $(23,358) |
| Other Investments in Securities | |
| Beginning Balance | $190,936 |
| Net Realized Gain (Loss) on Investment Securities | (803) |
| Net Unrealized Gain (Loss) on Investment Securities | 31,023 |
| Cost of Purchases | 79,556 |
| Proceeds of Sales | (5,375) |
| Amortization/Accretion | -- |
| Transfers into Level 3 | -- |
| Transfers out of Level 3 | -- |
| Ending Balance | $295,337 |
| The change in unrealized gain (loss) for the period attributable to Level 3 securities held at July 31, 2018 | $31,327 |
The information used in the above reconciliations represents fiscal year to date activity for any Investments in Securities identified as using Level 3 inputs at either the beginning or the end of the current fiscal period and includes securities delivered through in-kind transactions. Transfers in or out of Level 3 represent the beginning value of any Security or Instrument where a change in the pricing level occurred from the beginning to the end of the period. The cost of purchases and the proceeds of sales may include securities received or delivered through corporate actions or exchanges. Realized and unrealized gains (losses) disclosed in the reconciliations are included in Net Gain (Loss) on the Fund's Statement of Operations.
See accompanying notes which are an integral part of the financial statements.
Financial Statements
Statement of Assets and Liabilities
| Amounts in thousands (except per-share amounts) | | July 31, 2018 |
| Assets | | |
Investment in securities, at value (including securities loaned of $602,176) — See accompanying schedule:
Unaffiliated issuers (cost $13,915,428) | $26,366,917 | |
| Fidelity Central Funds (cost $607,244) | 607,244 | |
| Total Investment in Securities (cost $14,522,672) | | $26,974,161 |
| Restricted cash | | 287 |
| Foreign currency held at value (cost $5,533) | | 5,533 |
| Receivable for investments sold | | 127,279 |
| Receivable for fund shares sold | | 19,618 |
| Dividends receivable | | 5,732 |
| Distributions receivable from Fidelity Central Funds | | 863 |
| Prepaid expenses | | 67 |
| Other receivables | | 1,521 |
| Total assets | | 27,135,061 |
| Liabilities | | |
| Payable to custodian bank | $10,008 | |
| Payable for investments purchased | 89,077 | |
| Payable for fund shares redeemed | 33,013 | |
| Accrued management fee | 12,469 | |
| Other affiliated payables | 2,800 | |
| Other payables and accrued expenses | 1,351 | |
| Collateral on securities loaned | 602,728 | |
| Total liabilities | | 751,446 |
| Net Assets | | $26,383,615 |
| Net Assets consist of: | | |
| Paid in capital | | $12,943,985 |
| Undistributed net investment income | | 19,407 |
| Accumulated undistributed net realized gain (loss) on investments and foreign currency transactions | | 968,682 |
| Net unrealized appreciation (depreciation) on investments and assets and liabilities in foreign currencies | | 12,451,541 |
| Net Assets | | $26,383,615 |
| Blue Chip Growth: | | |
| Net Asset Value, offering price and redemption price per share ($20,714,286 ÷ 207,653 shares) | | $99.75 |
| Class K: | | |
| Net Asset Value, offering price and redemption price per share ($5,669,329 ÷ 56,738 shares) | | $99.92 |
See accompanying notes which are an integral part of the financial statements.
Statement of Operations
| Amounts in thousands | | Year ended July 31, 2018 |
| Investment Income | | |
| Dividends | | $167,575 |
| Special dividends | | 24,686 |
| Interest | | 674 |
| Income from Fidelity Central Funds | | 8,139 |
| Total income | | 201,074 |
| Expenses | | |
| Management fee | | |
| Basic fee | $129,901 | |
| Performance adjustment | 5,649 | |
| Transfer agent fees | 29,077 | |
| Accounting and security lending fees | 1,945 | |
| Custodian fees and expenses | 451 | |
| Independent trustees' fees and expenses | 84 | |
| Appreciation in deferred trustee compensation account | 1 | |
| Registration fees | 402 | |
| Audit | 226 | |
| Legal | 59 | |
| Interest | 49 | |
| Miscellaneous | 167 | |
| Total expenses before reductions | 168,011 | |
| Expense reductions | (1,178) | |
| Total expenses after reductions | | 166,833 |
| Net investment income (loss) | | 34,241 |
| Realized and Unrealized Gain (Loss) | | |
| Net realized gain (loss) on: | | |
| Investment securities: | | |
| Unaffiliated issuers | 2,450,318 | |
| Fidelity Central Funds | 56 | |
| Other affiliated issuers | 1,361 | |
| Foreign currency transactions | 187 | |
| Total net realized gain (loss) | | 2,451,922 |
| Change in net unrealized appreciation (depreciation) on: | | |
| Investment securities: | | |
| Unaffiliated issuers | 2,781,037 | |
| Fidelity Central Funds | (15) | |
| Other affiliated issuers | 49,635 | |
| Assets and liabilities in foreign currencies | (1) | |
| Total change in net unrealized appreciation (depreciation) | | 2,830,656 |
| Net gain (loss) | | 5,282,578 |
| Net increase (decrease) in net assets resulting from operations | | $5,316,819 |
See accompanying notes which are an integral part of the financial statements.
Statement of Changes in Net Assets
| Amounts in thousands | Year ended July 31, 2018 | Year ended July 31, 2017 |
| Increase (Decrease) in Net Assets | | |
| Operations | | |
| Net investment income (loss) | $34,241 | $36,123 |
| Net realized gain (loss) | 2,451,922 | 1,207,375 |
| Change in net unrealized appreciation (depreciation) | 2,830,656 | 3,208,986 |
| Net increase (decrease) in net assets resulting from operations | 5,316,819 | 4,452,484 |
| Distributions to shareholders from net investment income | (24,826) | (49,380) |
| Distributions to shareholders from net realized gain | (955,924) | (700,248) |
| Total distributions | (980,750) | (749,628) |
| Share transactions - net increase (decrease) | (610,765) | (433,489) |
| Total increase (decrease) in net assets | 3,725,304 | 3,269,367 |
| Net Assets | | |
| Beginning of period | 22,658,311 | 19,388,944 |
| End of period | $26,383,615 | $22,658,311 |
| Other Information | | |
| Undistributed net investment income end of period | $19,407 | $14,169 |
See accompanying notes which are an integral part of the financial statements.
Financial Highlights
Fidelity Blue Chip Growth Fund
| Years ended July 31, | 2018 | 2017 | 2016 | 2015 | 2014 |
| Selected Per–Share Data | | | | | |
| Net asset value, beginning of period | $83.20 | $69.52 | $75.25 | $66.72 | $59.65 |
| Income from Investment Operations | | | | | |
| Net investment income (loss)A | .11B | .11 | .09 | .05 | .15 |
| Net realized and unrealized gain (loss) | 20.20 | 16.30 | (2.16) | 12.56 | 11.63 |
| Total from investment operations | 20.31 | 16.41 | (2.07) | 12.61 | 11.78 |
| Distributions from net investment income | (.08) | (.15) | (.03) | (.09) | (.24) |
| Distributions from net realized gain | (3.68) | (2.58) | (3.63) | (3.99) | (4.47) |
| Total distributions | (3.76) | (2.73) | (3.66) | (4.08) | (4.71) |
| Net asset value, end of period | $99.75 | $83.20 | $69.52 | $75.25 | $66.72 |
| Total ReturnC | 25.21% | 24.48% | (2.59)% | 19.72% | 21.07% |
| Ratios to Average Net AssetsD,E | | | | | |
| Expenses before reductions | .72% | .70% | .82% | .89% | .80% |
| Expenses net of fee waivers, if any | .72% | .70% | .82% | .89% | .80% |
| Expenses net of all reductions | .72% | .69% | .82% | .88% | .80% |
| Net investment income (loss) | .12%B | .15% | .13% | .07% | .23% |
| Supplemental Data | | | | | |
| Net assets, end of period (in millions) | $20,714 | $16,993 | $14,230 | $15,346 | $11,970 |
| Portfolio turnover rateF | 41%G | 43%G | 50%G | 51%G | 57%G |
A Calculated based on average shares outstanding during the period.
B Net investment income per share reflects a large, non-recurring dividend which amounted to $.09 per share. Excluding this non-recurring dividend, the ratio of net investment income (loss) to average net assets would have been .02%.
C Total returns would have been lower if certain expenses had not been reduced during the applicable periods shown.
D Fees and expenses of any underlying Fidelity Central Funds are not included in the Fund's expense ratio. The Fund indirectly bears its proportionate share of the expenses of any underlying Fidelity Central Funds.
E Expense ratios reflect operating expenses of the class. Expenses before reductions do not reflect amounts reimbursed by the investment adviser or reductions from brokerage service arrangements or reductions from other expense offset arrangements and do not represent the amount paid by the class during periods when reimbursements or reductions occur. Expenses net of fee waivers reflect expenses after reimbursement by the investment adviser but prior to reductions from brokerage service arrangements or other expense offset arrangements. Expenses net of all reductions represent the net expenses paid by the class.
F Amount does not include the portfolio activity of any underlying Fidelity Central Funds.
G Portfolio turnover rate excludes securities received or delivered in-kind.
See accompanying notes which are an integral part of the financial statements.
Fidelity Blue Chip Growth Fund Class K
| Years ended July 31, | 2018 | 2017 | 2016 | 2015 | 2014 |
| Selected Per–Share Data | | | | | |
| Net asset value, beginning of period | $83.34 | $69.67 | $75.36 | $66.82 | $59.74 |
| Income from Investment Operations | | | | | |
| Net investment income (loss)A | .20B | .19 | .16 | .13 | .23 |
| Net realized and unrealized gain (loss) | 20.22 | 16.32 | (2.15) | 12.57 | 11.64 |
| Total from investment operations | 20.42 | 16.51 | (1.99) | 12.70 | 11.87 |
| Distributions from net investment income | (.16) | (.27) | (.07) | (.17) | (.33) |
| Distributions from net realized gain | (3.68) | (2.58) | (3.63) | (3.99) | (4.47) |
| Total distributions | (3.84) | (2.84)C | (3.70) | (4.16) | (4.79)D |
| Net asset value, end of period | $99.92 | $83.34 | $69.67 | $75.36 | $66.82 |
| Total ReturnE | 25.33% | 24.63% | (2.47)% | 19.84% | 21.23% |
| Ratios to Average Net AssetsF,G | | | | | |
| Expenses before reductions | .62% | .59% | .70% | .78% | .68% |
| Expenses net of fee waivers, if any | .62% | .59% | .70% | .77% | .68% |
| Expenses net of all reductions | .62% | .58% | .70% | .77% | .67% |
| Net investment income (loss) | .22%B | .26% | .25% | .19% | .36% |
| Supplemental Data | | | | | |
| Net assets, end of period (in millions) | $5,669 | $5,665 | $5,158 | $5,898 | $4,612 |
| Portfolio turnover rateH | 41%I | 43%I | 50%I | 51%I | 57%I |
A Calculated based on average shares outstanding during the period.
B Net investment income per share reflects a large, non-recurring dividend which amounted to $.09 per share. Excluding this non-recurring dividend, the ratio of net investment income (loss) to average net assets would have been .12%.
C Total distributions of $2.84 per share is comprised of distributions from net investment income of $.267 and distributions from net realized gain of $2.576 per share.
D Total distributions of $4.79 per share is comprised of distributions from net investment income of $.325 and distributions from net realized gain of $4.466 per share.
E Total returns would have been lower if certain expenses had not been reduced during the applicable periods shown.
F Fees and expenses of any underlying Fidelity Central Funds are not included in the Fund's expense ratio. The Fund indirectly bears its proportionate share of the expenses of any underlying Fidelity Central Funds.
G Expense ratios reflect operating expenses of the class. Expenses before reductions do not reflect amounts reimbursed by the investment adviser or reductions from brokerage service arrangements or reductions from other expense offset arrangements and do not represent the amount paid by the class during periods when reimbursements or reductions occur. Expenses net of fee waivers reflect expenses after reimbursement by the investment adviser but prior to reductions from brokerage service arrangements or other expense offset arrangements. Expenses net of all reductions represent the net expenses paid by the class.
H Amount does not include the portfolio activity of any underlying Fidelity Central Funds.
I Portfolio turnover rate excludes securities received or delivered in-kind.
See accompanying notes which are an integral part of the financial statements.
Notes to Financial Statements
For the period ended July 31, 2018
(Amounts in thousands except percentages)
1. Organization.
Fidelity Blue Chip Growth Fund (the Fund) is a fund of Fidelity Securities Fund (the Trust) and is authorized to issue an unlimited number of shares. The Trust is registered under the Investment Company Act of 1940, as amended (the 1940 Act), as an open-end management investment company organized as a Massachusetts business trust. The Fund offers Blue Chip Growth and Class K shares, each of which has equal rights as to assets and voting privileges. Each class has exclusive voting rights with respect to matters that affect that class.
2. Investments in Fidelity Central Funds.
The Fund invests in Fidelity Central Funds, which are open-end investment companies generally available only to other investment companies and accounts managed by the investment adviser and its affiliates. The Fund's Schedule of Investments lists each of the Fidelity Central Funds held as of period end, if any, as an investment of the Fund, but does not include the underlying holdings of each Fidelity Central Fund. As an Investing Fund, the Fund indirectly bears its proportionate share of the expenses of the underlying Fidelity Central Funds.
The Money Market Central Funds seek preservation of capital and current income and are managed by Fidelity Investments Money Management, Inc. (FIMM), an affiliate of the investment adviser. Annualized expenses of the Money Market Central Funds as of their most recent shareholder report date are less than .005%.
A complete unaudited list of holdings for each Fidelity Central Fund is available upon request or at the Securities and Exchange Commission (the SEC) website at www.sec.gov. In addition, the financial statements of the Fidelity Central Funds, which are not covered by the Fund's Report of Independent Registered Public Accounting Firm, are available on the SEC website or upon request.
3. Significant Accounting Policies.
The Fund is an investment company and applies the accounting and reporting guidance of the Financial Accounting Standards Board (FASB) Accounting Standards Codification Topic 946 Financial Services – Investments Companies. The financial statements have been prepared in conformity with accounting principles generally accepted in the United States of America (GAAP), which require management to make certain estimates and assumptions at the date of the financial statements. Actual results could differ from those estimates. Subsequent events, if any, through the date that the financial statements were issued have been evaluated in the preparation of the financial statements. The following summarizes the significant accounting policies of the Fund:
Investment Valuation. Investments are valued as of 4:00 p.m. Eastern time on the last calendar day of the period. The Board of Trustees (the Board) has delegated the day to day responsibility for the valuation of the Fund's investments to the Fair Value Committee (the Committee) established by the Fund's investment adviser. In accordance with valuation policies and procedures approved by the Board, the Fund attempts to obtain prices from one or more third party pricing vendors or brokers to value its investments. When current market prices, quotations or currency exchange rates are not readily available or reliable, investments will be fair valued in good faith by the Committee, in accordance with procedures adopted by the Board. Factors used in determining fair value vary by investment type and may include market or investment specific events. The frequency with which these procedures are used cannot be predicted and they may be utilized to a significant extent. The Committee oversees the Fund's valuation policies and procedures and reports to the Board on the Committee's activities and fair value determinations. The Board monitors the appropriateness of the procedures used in valuing the Fund's investments and ratifies the fair value determinations of the Committee.
The Fund categorizes the inputs to valuation techniques used to value its investments into a disclosure hierarchy consisting of three levels as shown below:
- Level 1 – quoted prices in active markets for identical investments
- Level 2 – other significant observable inputs (including quoted prices for similar investments, interest rates, prepayment speeds, etc.)
- Level 3 – unobservable inputs (including the Fund's own assumptions based on the best information available)
Valuation techniques used to value the Fund's investments by major category are as follows:
Equity securities, including restricted securities, for which market quotations are readily available, are valued at the last reported sale price or official closing price as reported by a third party pricing vendor on the primary market or exchange on which they are traded and are categorized as Level 1 in the hierarchy. In the event there were no sales during the day or closing prices are not available, securities are valued at the last quoted bid price or may be valued using the last available price and are generally categorized as Level 2 in the hierarchy. For foreign equity securities, when market or security specific events arise, comparisons to the valuation of American Depositary Receipts (ADRs), futures contracts, Exchange-Traded Funds (ETFs) and certain indexes as well as quoted prices for similar securities may be used and would be categorized as Level 2 in the hierarchy. Utilizing these techniques may result in transfers between Level 1 and Level 2. For equity securities, including restricted securities, where observable inputs are limited, assumptions about market activity and risk are used and these securities may be categorized as Level 3 in the hierarchy. Equity securities, including restricted securities, for which observable inputs are not available are valued using alternate valuation approaches, including the market approach and the income approach and are categorized as Level 3 in the hierarchy. The market approach generally consists of using comparable market transactions while the income approach generally consists of using the net present value of estimated future cash flows, adjusted as appropriate for liquidity, credit, market and/or other risk factors.
Investments in open-end mutual funds, including the Fidelity Central Funds, are valued at their closing net asset value (NAV) each business day and are categorized as Level 1 in the hierarchy.
The following provides information on Level 3 securities held by the Fund that were valued at period end based on unobservable inputs. These amounts exclude valuations provided by a broker.
| Asset Type | Fair Value | Valuation Technique(s) | Unobservable Input | Amount or Range/Weighted Average | Impact to Valuation from an Increase in Input(a) |
| Equities | $1,160,293 | Market comparable | Enterprise value/Sales multiple (EV/S) | 1.2 - 12.2 / 4.9 | Increase |
| | | | Transaction price | $9.15 - $330.00 / $190.32 | Increase |
| | | | Enterprise value/EBITDA multiple (EV/EBITDA) | 12.4 | Increase |
| | | | Enterprise value/Gross profit multiple (EV/GP) | 4.3 | Increase |
| | | | Discount rate | 7.5% - 73.0% / 44.6% | Decrease |
| | | | Price/Earnings multiple (P/E) | 15.1 | Increase |
| | | | Conversion ratio | 3.0 | Increase |
| | | | Discount for lack of marketability | 10.0% - 25.0% / 13.5% | Decrease |
| | | | Premium rate | 7.5% - 76.0% / 35.7% | Increase |
| | | | Proxy premium | 28.2% - 54.5% / 46.2% | Increase |
| | | | Liquidity preference | $14.90 | Increase |
| | | Market approach | Transaction price | $0.18 - $179.25 / $108.93 | Increase |
| | | | Tender price | $143.40 | Increase |
| | | Book value | Book value multiple | 1 | Increase |
| | | | Discount rate | 70.0% | Decrease |
| | | Recovery value | Recovery value | 0.0% - 2.3% / 2.1% | Increase |
(a) Represents the expected directional change in the fair value of the Level 3 investments that would result from an increase in the corresponding input. A decrease to the unobservable input would have the opposite effect. Significant changes in these inputs could result in significantly higher or lower fair value measurements.
Changes in valuation techniques may result in transfers in or out of an assigned level within the disclosure hierarchy. The aggregate value of investments by input level as of July 31, 2018, as well as a roll forward of Level 3 investments, is included at the end of the Fund's Schedule of Investments.
Foreign Currency. The Fund may use foreign currency contracts to facilitate transactions in foreign-denominated securities. Gains and losses from these transactions may arise from changes in the value of the foreign currency or if the counterparties do not perform under the contracts' terms.
Foreign-denominated assets, including investment securities, and liabilities are translated into U.S. dollars at the exchange rates at period end. Purchases and sales of investment securities, income and dividends received and expenses denominated in foreign currencies are translated into U.S. dollars at the exchange rate in effect on the transaction date.
The effects of exchange rate fluctuations on investments are included with the net realized and unrealized gain (loss) on investment securities. Other foreign currency transactions resulting in realized and unrealized gain (loss) are disclosed separately.
Investment Transactions and Income. For financial reporting purposes, the Fund's investment holdings and NAV include trades executed through the end of the last business day of the period. The NAV per share for processing shareholder transactions is calculated as of the close of business of the New York Stock Exchange (NYSE), normally 4:00 p.m. Eastern time and includes trades executed through the end of the prior business day. Gains and losses on securities sold are determined on the basis of identified cost and include proceeds received from litigation. Dividend income is recorded on the ex-dividend date, except for certain dividends from foreign securities where the ex-dividend date may have passed, which are recorded as soon as the Fund is informed of the ex-dividend date. Non-cash dividends included in dividend income, if any, are recorded at the fair market value of the securities received. Income and capital gain distributions from Fidelity Central Funds, if any, are recorded on the ex-dividend date. Certain distributions received by the Fund represent a return of capital or capital gain. The Fund determines the components of these distributions subsequent to the ex-dividend date, based upon receipt of tax filings or other correspondence relating to the underlying investment. These distributions are recorded as a reduction of cost of investments and/or as a realized gain. Large, non-recurring dividends recognized by the Fund are presented separately on the Statement of Operations as "Special Dividends" and the impact of these dividends is presented in the Financial Highlights. Interest income is accrued as earned and includes coupon interest and amortization of premium and accretion of discount on debt securities as applicable. Investment income is recorded net of foreign taxes withheld where recovery of such taxes is uncertain.
Class Allocations and Expenses. Investment income, realized and unrealized capital gains and losses, common expenses of the Fund, and certain fund-level expense reductions, if any, are allocated daily on a pro-rata basis to each class based on the relative net assets of each class to the total net assets of the Fund. Each class differs with respect to transfer agent fees incurred. Certain expense reductions may also differ by class. For the reporting period, the allocated portion of income and expenses to each class as a percent of its average net assets may vary due to the timing of recording these transactions in relation to fluctuating net assets of the classes. Expenses directly attributable to a fund are charged to that fund. Expenses attributable to more than one fund are allocated among the respective funds on the basis of relative net assets or other appropriate methods. Expense estimates are accrued in the period to which they relate and adjustments are made when actual amounts are known.
Deferred Trustee Compensation. Under a Deferred Compensation Plan (the Plan), certain independent Trustees have elected to defer receipt of a portion of their annual compensation. Deferred amounts are invested in a cross-section of Fidelity funds, are marked-to-market and remain in the Fund until distributed in accordance with the Plan. The investment of deferred amounts and the offsetting payable to the Trustees of $1,092 are included in the accompanying Statement of Assets and Liabilities in other receivables and other payables and accrued expenses, respectively.
Income Tax Information and Distributions to Shareholders. Each year, the Fund intends to qualify as a regulated investment company under Subchapter M of the Internal Revenue Code, including distributing substantially all of its taxable income and realized gains. As a result, no provision for U.S. Federal income taxes is required. As of July 31, 2018, the Fund did not have any unrecognized tax benefits in the financial statements; nor is the Fund aware of any tax positions for which it is reasonably possible that the total amounts of unrecognized tax benefits will significantly change in the next twelve months. The Fund files a U.S. federal tax return, in addition to state and local tax returns as required. The Fund's federal income tax returns are subject to examination by the Internal Revenue Service (IRS) for a period of three fiscal years after they are filed. State and local tax returns may be subject to examination for an additional fiscal year depending on the jurisdiction. Foreign taxes are provided for based on the Fund's understanding of the tax rules and rates that exist in the foreign markets in which it invests.
Distributions are declared and recorded on the ex-dividend date. Income and capital gain distributions are declared separately for each class. Income and capital gain distributions are determined in accordance with income tax regulations, which may differ from GAAP. In addition, the Fund claimed a portion of the payment made to redeeming shareholders as a distribution for income tax purposes.
Capital accounts within the financial statements are adjusted for permanent book-tax differences. These adjustments have no impact on net assets or the results of operations. Capital accounts are not adjusted for temporary book-tax differences which will reverse in a subsequent period.
Book-tax differences are primarily due to foreign currency transactions, passive foreign investment companies (PFIC), redemptions in kind, partnerships, deferred trustees compensation and losses deferred due to wash sales.
As of period end, the cost and unrealized appreciation (depreciation) in securities, and derivatives if applicable, for federal income tax purposes were as follows:
| Gross unrealized appreciation | $12,858,733 |
| Gross unrealized depreciation | (437,922) |
| Net unrealized appreciation (depreciation) | $12,420,811 |
| Tax Cost | $14,553,350 |
The tax-based components of distributable earnings as of period end were as follows:
| Undistributed ordinary income | $20,554 |
| Undistributed long-term capital gain | $999,359 |
| Net unrealized appreciation (depreciation) on securities and other investments | $12,420,807 |
The tax character of distributions paid was as follows:
| | July 31, 2018 | July 31, 2017 |
| Ordinary Income | $24,826 | $ 61,835 |
| Long-term Capital Gains | 955,924 | 687,793 |
| Total | $980,750 | $ 749,628 |
Restricted Securities. The Fund may invest in securities that are subject to legal or contractual restrictions on resale. These securities generally may be resold in transactions exempt from registration or to the public if the securities are registered. Disposal of these securities may involve time-consuming negotiations and expense, and prompt sale at an acceptable price may be difficult. Information regarding restricted securities is included at the end of the Fund's Schedule of Investments.
Consolidated Subsidiary. The Fund invests in certain investments through a wholly-owned subsidiary ("Subsidiary"), which may be subject to federal and state taxes upon disposition.
As of period end, the Fund held an investment of $85,782 in these Subsidiaries, representing .33% of the Fund's net assets. The financial statements have been consolidated and include accounts of the Fund and each Subsidiary. Accordingly, all inter-company transactions and balances have been eliminated.
Any cash held by the Subsidiaries is restricted as to its use and is presented as Restricted cash in the Statement of Assets and Liabilities.
4. Purchases and Sales of Investments.
Purchases and sales of securities, other than short-term securities and in-kind transactions, aggregated $9,853,162 and $10,027,597, respectively.
Redemptions In-Kind. During the period, 15,023 shares of the Fund held by unaffiliated entities were redeemed in-kind for investments and cash, with a value of $1,335,342. The net realized gain of $811,963 on investments delivered through the in-kind redemptions is included in the accompanying Statement of Operations. The amount of the redemptions is included in share transactions activity shown in the accompanying Statement of Changes in Net Assets as well as the Notes to Financial Statements. The Fund recognized no gain or loss for federal income tax purposes.
Prior Fiscal Year Redemptions In-Kind. During the prior period, 1,133 shares of the Fund held by an unaffiliated entity were redeemed in-kind for investments and cash with a value of $94,035. The Fund had a net realized gain of $55,844 on investments delivered through in-kind redemptions. The amount of the in-kind redemptions is included in share transactions in the accompanying Statement of Changes in Net Assets as well as the Notes to Financial Statements. The Fund recognized no gain or loss for federal income tax purposes.
5. Fees and Other Transactions with Affiliates.
Management Fee. Fidelity Management & Research Company (the investment adviser) and its affiliates provide the Fund with investment management related services for which the Fund pays a monthly management fee. The management fee is the sum of an individual fund fee rate that is based on an annual rate of .30% of the Fund's average net assets and an annualized group fee rate that averaged .24% during the period. The group fee rate is based upon the average net assets of all the mutual funds advised by the investment adviser, including any mutual funds previously advised by the investment adviser that are currently advised by Fidelity SelectCo, LLC, an affiliate of the investment adviser. The group fee rate decreases as assets under management increase and increases as assets under management decrease. In addition, the management fee is subject to a performance adjustment (up to a maximum of +/- .20% of the Fund's average net assets over a 36 month performance period). The upward or downward adjustment to the management fee is based on the relative investment performance of Blue Chip Growth as compared to its benchmark index, the Russell 1000 Growth Index, over the same 36 month performance period. For the reporting period, the total annual management fee rate, including the performance adjustment, was .56% of the Fund's average net assets. The performance adjustment included in the management fee rate may be higher or lower than the maximum performance adjustment rate due to the difference between the average net assets for the reporting and performance periods.
Transfer Agent Fees. Fidelity Investments Institutional Operations Company, Inc., (FIIOC), an affiliate of the investment adviser, is the transfer, dividend disbursing and shareholder servicing agent for each class of the Fund. FIIOC receives account fees and asset-based fees that vary according to the account size and type of account of the shareholders of Blue Chip Growth, except for Class K. FIIOC receives an asset-based fee of Class K's average net assets. FIIOC pays for typesetting, printing and mailing of shareholder reports, except proxy statements.
For the period, transfer agent fees for each class were as follows:
| | Amount | % of Class-Level Average Net Assets |
| Blue Chip Growth | $26,551 | .14 |
| Class K | 2,526 | .05 |
| | $29,077 | |
Accounting and Security Lending Fees. Fidelity Service Company, Inc. (FSC), an affiliate of the investment adviser, maintains the Fund's accounting records. The accounting fee is based on the level of average net assets for each month. Under a separate contract, FSC administers the security lending program. The security lending fee is based on the number and duration of lending transactions. For the period, the fees were equivalent to an annual rate of .01%.
Brokerage Commissions. The Fund placed a portion of its portfolio transactions with brokerage firms which are affiliates of the investment adviser. Brokerage commissions are included in net realized gain (loss) and change in net unrealized appreciation (depreciation) in the Statement of Operations. The commissions paid to these affiliated firms were $171 for the period.
Interfund Lending Program. Pursuant to an Exemptive Order issued by the SEC, the Fund, along with other registered investment companies having management contracts with Fidelity Management & Research Company (FMR) or other affiliated entities of FMR, may participate in an interfund lending program. This program provides an alternative credit facility allowing the funds to borrow from, or lend money to, other participating affiliated funds. At period end, there were no interfund loans outstanding. The Fund's activity in this program during the period for which loans were outstanding was as follows:
| Borrower or Lender | Average Loan Balance | Weighted Average Interest Rate | Interest Expense |
| Borrower | $19,267 | 1.52% | $49 |
Interfund Trades. The Fund may purchase from or sell securities to other Fidelity Funds under procedures adopted by the Board. The procedures have been designed to ensure these interfund trades are executed in accordance with Rule 17a-7 of the 1940 Act. Interfund trades are included within the respective purchases and sales amounts shown in the Purchases and Sales of Investments note.
Prior Fiscal Year Redemptions In-Kind. During the prior period, 2,142 shares of the Fund held by an affiliated entity were redeemed in-kind for investments and cash with a value of $179,817. The Fund had a net realized gain of $107,301 on investments delivered through in-kind redemptions. The amount of the in-kind redemptions is included in share transactions in the accompanying Statement of Changes in Net Assets as well as the Notes to Financial Statements. The Fund recognized no gain or loss for federal income tax purposes.
6. Committed Line of Credit.
The Fund participates with other funds managed by the investment adviser or an affiliate in a $4.25 billion credit facility (the "line of credit") to be utilized for temporary or emergency purposes to fund shareholder redemptions or for other short-term liquidity purposes. The Fund has agreed to pay commitment fees on its pro-rata portion of the line of credit, which amounted to $66 and is reflected in Miscellaneous expenses on the Statement of Operations. During the period, the Fund did not borrow on this line of credit.
7. Security Lending.
The Fund lends portfolio securities through a lending agent from time to time in order to earn additional income. For equity securities, a lending agent is used and may loan securities to certain qualified borrowers, including Fidelity Capital Markets (FCM), a broker-dealer affiliated with the Fund. On the settlement date of the loan, the Fund receives collateral (in the form of U.S. Treasury obligations, letters of credit and/or cash) against the loaned securities and maintains collateral in an amount not less than 100% of the market value of the loaned securities during the period of the loan. The market value of the loaned securities is determined at the close of business of the Fund and any additional required collateral is delivered to the Fund on the next business day. The Fund or borrower may terminate the loan at any time, and if the borrower defaults on its obligation to return the securities loaned because of insolvency or other reasons, the Fund may apply collateral received from the borrower against the obligation. The Fund may experience delays and costs in recovering the securities loaned. Any cash collateral received is invested in the Fidelity Securities Lending Cash Central Fund. The value of loaned securities and cash collateral at period end are disclosed on the Fund's Statement of Assets and Liabilities. The value of securities loaned to FCM at period end was $2,878. Security lending income represents the income earned on investing cash collateral, less rebates paid to borrowers and any lending agent fees associated with the loan, plus any premium payments received for lending certain types of securities. Security lending income is presented in the Statement of Operations as a component of income from Fidelity Central Funds. Total security lending income during the period amounted to $7,875, including $382 from securities loaned to FCM.
8. Expense Reductions.
Commissions paid to certain brokers with whom the investment adviser, or its affiliates, places trades on behalf of the Fund include an amount in addition to trade execution, which may be rebated back to the Fund to offset certain expenses. This amount totaled $937 for the period. In addition, through arrangements with the Fund's custodian, credits realized as a result of certain uninvested cash balances were used to reduce the Fund's expenses. During the period, these credits reduced the Fund's expenses by $9.
In addition, during the period the investment adviser reimbursed and/or waived a portion of fund-level operating expenses in the amount of $232.
9. Distributions to Shareholders.
Distributions to shareholders of each class were as follows:
| | Year ended
July 31, 2018 | Year ended
July 31, 2017 |
| From net investment income | | |
| Blue Chip Growth | $14,640 | $30,042 |
| Class K | 10,186 | 19,338 |
| Total | $24,826 | $49,380 |
| From net realized gain | | |
| Blue Chip Growth | $722,426 | $514,584 |
| Class K | 233,498 | 185,664 |
| Total | $955,924 | $700,248 |
10. Share Transactions.
Share transactions for each class were as follows and may contain automatic conversions between classes or exchanges between affiliated funds:
| | Shares | Shares | Dollars | Dollars |
| | Year ended July 31, 2018 | Year ended July 31, 2017 | Year ended July 31, 2018 | Year ended July 31, 2017 |
| Blue Chip Growth | | | | |
| Shares sold | 40,439 | 32,630 | $3,709,387 | $2,453,411 |
| Reinvestment of distributions | 8,154 | 7,584 | 698,554 | 519,650 |
| Shares redeemed | (45,177) | (40,666) | (4,036,931) | (2,950,825) |
| Net increase (decrease) | 3,416 | (452) | $371,010 | $22,236 |
| Class K | | | | |
| Shares sold | 14,932 | 13,260 | $1,373,508 | $986,030 |
| Reinvestment of distributions | 2,843 | 2,988 | 243,684 | 205,002 |
| Shares redeemed | (29,012)(a) | (22,314)(b) | (2,598,967)(a) | (1,646,757)(b) |
| Net increase (decrease) | (11,237) | (6,066) | $(981,775) | $(455,725) |
(a) Amount includes in-kind redemptions (see the Redemptions In-Kind note for additional details).
(b) Amount includes in-kind redemptions (see the Prior Fiscal Year Redemptions In-Kind note for additional details).
11. Other.
The Fund's organizational documents provide former and current trustees and officers with a limited indemnification against liabilities arising in connection with the performance of their duties to the Fund. In the normal course of business, the Fund may also enter into contracts that provide general indemnifications. The Fund's maximum exposure under these arrangements is unknown as this would be dependent on future claims that may be made against the Fund. The risk of material loss from such claims is considered remote.
Report of Independent Registered Public Accounting Firm
To the Trustees of Fidelity Securities Fund and Shareholders of Fidelity Blue Chip Growth Fund:
Opinion on the Financial Statements and Financial Highlights
We have audited the accompanying statement of assets and liabilities of Fidelity Blue Chip Growth Fund (the "Fund"), a fund of Fidelity Securities Fund, including the schedule of investments, as of July 31, 2018, and the related statement of operations for the year then ended, the statement of changes in net assets for each of the two years in the period then ended, the financial highlights for each of the five years in the period then ended, and the related notes. In our opinion, the financial statements and financial highlights present fairly, in all material respects, the financial position of the Fund as of July 31, 2018, and the results of its operations for the year then ended, the changes in its net assets for each of the two years in the period then ended, and the financial highlights for each of the five years in the period then ended, in conformity with accounting principles generally accepted in the United States of America.
Basis for Opinion
These financial statements and financial highlights are the responsibility of the Fund's management. Our responsibility is to express an opinion on the Fund's financial statements and financial highlights based on our audits. We are a public accounting firm registered with the Public Company Accounting Oversight Board (United States) (PCAOB) and are required to be independent with respect to the Fund in accordance with the U.S. federal securities laws and the applicable rules and regulations of the Securities and Exchange Commission and the PCAOB.
We conducted our audits in accordance with the standards of the PCAOB. Those standards require that we plan and perform the audit to obtain reasonable assurance about whether the financial statements and financial highlights are free of material misstatement, whether due to error or fraud. The Fund is not required to have, nor were we engaged to perform, an audit of its internal control over financial reporting. As part of our audits we are required to obtain an understanding of internal control over financial reporting but not for the purpose of expressing an opinion on the effectiveness of the Fund’s internal control over financial reporting. Accordingly, we express no such opinion.
Our audits included performing procedures to assess the risks of material misstatement of the financial statements and financial highlights, whether due to error or fraud, and performing procedures that respond to those risks. Such procedures included examining, on a test basis, evidence regarding the amounts and disclosures in the financial statements and financial highlights. Our audits also included evaluating the accounting principles used and significant estimates made by management, as well as evaluating the overall presentation of the financial statements and financial highlights. Our procedures included confirmation of securities owned as of July 31, 2018, by correspondence with the custodians and brokers; when replies were not received from brokers, we performed other auditing procedures. We believe that our audits provide a reasonable basis for our opinion.
/s/ Deloitte & Touche LLP
Boston, Massachusetts
September 17, 2018
We have served as the auditor of one or more of the Fidelity investment companies since 1999.
Trustees and Officers
The Trustees, Members of the Advisory Board (if any), and officers of the trust and fund, as applicable, are listed below. The Board of Trustees governs the fund and is responsible for protecting the interests of shareholders. The Trustees are experienced executives who meet periodically throughout the year to oversee the fund's activities, review contractual arrangements with companies that provide services to the fund, oversee management of the risks associated with such activities and contractual arrangements, and review the fund's performance. Except for Jonathan Chiel, each of the Trustees oversees 286 funds. Mr. Chiel oversees 150 funds.
The Trustees hold office without limit in time except that (a) any Trustee may resign; (b) any Trustee may be removed by written instrument, signed by at least two-thirds of the number of Trustees prior to such removal; (c) any Trustee who requests to be retired or who has become incapacitated by illness or injury may be retired by written instrument signed by a majority of the other Trustees; and (d) any Trustee may be removed at any special meeting of shareholders by a two-thirds vote of the outstanding voting securities of the trust. Each Trustee who is not an interested person (as defined in the 1940 Act) of the trust and the fund is referred to herein as an Independent Trustee. Each Independent Trustee shall retire not later than the last day of the calendar year in which his or her 75th birthday occurs. The Independent Trustees may waive this mandatory retirement age policy with respect to individual Trustees. Officers and Advisory Board Members hold office without limit in time, except that any officer or Advisory Board Member may resign or may be removed by a vote of a majority of the Trustees at any regular meeting or any special meeting of the Trustees. Except as indicated, each individual has held the office shown or other offices in the same company for the past five years.
The fund’s Statement of Additional Information (SAI) includes more information about the Trustees. To request a free copy, call Fidelity at 1-800-544-8544.
Experience, Skills, Attributes, and Qualifications of the Trustees. The Governance and Nominating Committee has adopted a statement of policy that describes the experience, qualifications, attributes, and skills that are necessary and desirable for potential Independent Trustee candidates (Statement of Policy). The Board believes that each Trustee satisfied at the time he or she was initially elected or appointed a Trustee, and continues to satisfy, the standards contemplated by the Statement of Policy. The Governance and Nominating Committee also engages professional search firms to help identify potential Independent Trustee candidates who have the experience, qualifications, attributes, and skills consistent with the Statement of Policy. From time to time, additional criteria based on the composition and skills of the current Independent Trustees, as well as experience or skills that may be appropriate in light of future changes to board composition, business conditions, and regulatory or other developments, have also been considered by the professional search firms and the Governance and Nominating Committee. In addition, the Board takes into account the Trustees' commitment and participation in Board and committee meetings, as well as their leadership of standing and ad hoc committees throughout their tenure.
In determining that a particular Trustee was and continues to be qualified to serve as a Trustee, the Board has considered a variety of criteria, none of which, in isolation, was controlling. The Board believes that, collectively, the Trustees have balanced and diverse experience, qualifications, attributes, and skills, which allow the Board to operate effectively in governing the fund and protecting the interests of shareholders. Information about the specific experience, skills, attributes, and qualifications of each Trustee, which in each case led to the Board's conclusion that the Trustee should serve (or continue to serve) as a trustee of the fund, is provided below.
Board Structure and Oversight Function. James C. Curvey is an interested person and currently serves as Chairman. The Trustees have determined that an interested Chairman is appropriate and benefits shareholders because an interested Chairman has a personal and professional stake in the quality and continuity of services provided to the fund. Independent Trustees exercise their informed business judgment to appoint an individual of their choosing to serve as Chairman, regardless of whether the Trustee happens to be independent or a member of management. The Independent Trustees have determined that they can act independently and effectively without having an Independent Trustee serve as Chairman and that a key structural component for assuring that they are in a position to do so is for the Independent Trustees to constitute a substantial majority for the Board. The Independent Trustees also regularly meet in executive session. Ned C. Lautenbach serves as Chairman of the Independent Trustees and as such (i) acts as a liaison between the Independent Trustees and management with respect to matters important to the Independent Trustees and (ii) with management prepares agendas for Board meetings.
Fidelity® funds are overseen by different Boards of Trustees. The fund's Board oversees Fidelity's high income and certain equity funds, and other Boards oversee Fidelity's investment-grade bond, money market, asset allocation, and other equity funds. The asset allocation funds may invest in Fidelity® funds overseen by the fund's Board. The use of separate Boards, each with its own committee structure, allows the Trustees of each group of Fidelity® funds to focus on the unique issues of the funds they oversee, including common research, investment, and operational issues. On occasion, the separate Boards establish joint committees to address issues of overlapping consequences for the Fidelity® funds overseen by each Board.
The Trustees operate using a system of committees to facilitate the timely and efficient consideration of all matters of importance to the Trustees, the fund, and fund shareholders and to facilitate compliance with legal and regulatory requirements and oversight of the fund's activities and associated risks. The Board, acting through its committees, has charged FMR and its affiliates with (i) identifying events or circumstances the occurrence of which could have demonstrably adverse effects on the fund's business and/or reputation; (ii) implementing processes and controls to lessen the possibility that such events or circumstances occur or to mitigate the effects of such events or circumstances if they do occur; and (iii) creating and maintaining a system designed to evaluate continuously business and market conditions in order to facilitate the identification and implementation processes described in (i) and (ii) above. Because the day-to-day operations and activities of the fund are carried out by or through FMR, its affiliates, and other service providers, the fund's exposure to risks is mitigated but not eliminated by the processes overseen by the Trustees. While each of the Board's committees has responsibility for overseeing different aspects of the fund's activities, oversight is exercised primarily through the Operations, Audit, and Compliance Committees. In addition, the Independent Trustees have worked with Fidelity to enhance the Board's oversight of investment and financial risks, legal and regulatory risks, technology risks, and operational risks, including the development of additional risk reporting to the Board. Appropriate personnel, including but not limited to the fund's Chief Compliance Officer (CCO), FMR's internal auditor, the independent accountants, the fund's Treasurer and portfolio management personnel, make periodic reports to the Board's committees, as appropriate, including an annual review of Fidelity's risk management program for the Fidelity® funds. The responsibilities of each standing committee, including their oversight responsibilities, are described further under "Standing Committees of the Trustees."
Interested Trustees*:
Correspondence intended for a Trustee who is an interested person may be sent to Fidelity Investments, 245 Summer Street, Boston, Massachusetts 02210.
Name, Year of Birth; Principal Occupations and Other Relevant Experience+
Jonathan Chiel (1957)
Year of Election or Appointment: 2016
Trustee
Mr. Chiel also serves as Trustee of other Fidelity® funds. Mr. Chiel is Executive Vice President and General Counsel for FMR LLC (diversified financial services company, 2012-present). Previously, Mr. Chiel served as general counsel (2004-2012) and senior vice president and deputy general counsel (2000-2004) for John Hancock Financial Services; a partner with Choate, Hall & Stewart (1996-2000) (law firm); and an Assistant United States Attorney for the United States Attorney’s Office of the District of Massachusetts (1986-95), including Chief of the Criminal Division (1993-1995). Mr. Chiel is a director on the boards of the Boston Bar Foundation and the Maimonides School.
James C. Curvey (1935)
Year of Election or Appointment: 2007
Trustee
Chairman of the Board of Trustees
Mr. Curvey also serves as Trustee of other Fidelity® funds. Mr. Curvey is Vice Chairman (2007-present) and Director of FMR LLC (diversified financial services company). In addition, Mr. Curvey is an Overseer Emeritus for the Boston Symphony Orchestra, a Director of Artis-Naples, and a Trustee of Brewster Academy in Wolfeboro, New Hampshire. Previously, Mr. Curvey served as a Director of Fidelity Research & Analysis Co. (investment adviser firm, 2009-2018), Director of Fidelity Investments Money Management, Inc. (investment adviser firm, 2009-2014) and a Director of FMR and FMR Co., Inc. (investment adviser firms, 2007-2014).
Charles S. Morrison (1960)
Year of Election or Appointment: 2014
Trustee
Mr. Morrison also serves as Trustee of other funds. He serves as President of Fidelity SelectCo, LLC (investment adviser firm, 2017-present) and Fidelity Management & Research Company (FMR) (investment adviser firm, 2016-present), a Director of Fidelity Investments Money Management, Inc. (FIMM) (investment adviser firm, 2014-present), Director of Fidelity SelectCo, LLC (investment adviser firm, 2014-present), President, Asset Management (2014-present), and is an employee of Fidelity Investments. Previously, Mr. Morrison served as Vice President of Fidelity's Fixed Income and Asset Allocation Funds (2012-2014), President, Fixed Income (2011-2014), Vice President of Fidelity's Money Market Funds (2005-2009), President, Money Market Group Leader of FMR (investment adviser firm, 2009), and Senior Vice President, Money Market Group of FMR (2004-2009). Mr. Morrison also served as Vice President of Fidelity's Bond Funds (2002-2005), certain Balanced Funds (2002-2005), and certain Asset Allocation Funds (2002-2007), and as Senior Vice President (2002-2005) of Fidelity's Bond Division.
* Determined to be an “Interested Trustee” by virtue of, among other things, his or her affiliation with the trust or various entities under common control with FMR.
+ The information includes the Trustee's principal occupation during the last five years and other information relating to the experience, attributes, and skills relevant to the Trustee's qualifications to serve as a Trustee, which led to the conclusion that the Trustee should serve as a Trustee for the fund.
Independent Trustees:
Correspondence intended for an Independent Trustee may be sent to Fidelity Investments, P.O. Box 55235, Boston, Massachusetts 02205-5235.
Name, Year of Birth; Principal Occupations and Other Relevant Experience+
Dennis J. Dirks (1948)
Year of Election or Appointment: 2005
Trustee
Mr. Dirks also serves as Trustee of other Fidelity® funds. Prior to his retirement in May 2003, Mr. Dirks was Chief Operating Officer and a member of the Board of The Depository Trust & Clearing Corporation (DTCC). He also served as President, Chief Operating Officer, and Board member of The Depository Trust Company (DTC) and President and Board member of the National Securities Clearing Corporation (NSCC). In addition, Mr. Dirks served as Chief Executive Officer and Board member of the Government Securities Clearing Corporation, Chief Executive Officer and Board member of the Mortgage-Backed Securities Clearing Corporation, as a Trustee and a member of the Finance Committee of Manhattan College (2005-2008), as a Trustee and a member of the Finance Committee of AHRC of Nassau County (2006-2008), as a member of the Independent Directors Council (IDC) Governing Council (2010-2015), and as a member of the Board of Directors for The Brookville Center for Children’s Services, Inc. (2009-2017). Mr. Dirks is a member of the Finance Committee (2016-present), Board of Directors (2017-present) and Board of Trustees (2018-present) and is Treasurer (2018-present) of the Asolo Repertory Theatre.
Donald F. Donahue (1950)
Year of Election or Appointment: 2018
Trustee
Mr. Donahue also serves as a Trustee of other Fidelity® funds. Mr. Donahue is President and Chief Executive Officer of Miranda Partners, LLC (risk consulting for the financial services industry, 2012-present). Previously, Mr. Donahue served as a Member of the Advisory Board of certain Fidelity® funds (2015-2018) and Chief Executive Officer (2006-2012), Chief Operating Officer (2003-2006), and Managing Director, Customer Marketing and Development (1999-2003) of The Depository Trust & Clearing Corporation (financial markets infrastructure). Mr. Donahue serves as a Member (2007-present) and Co-Chairman (2016-present) of the Board of Directors of United Way of New York, Member of the Board of Directors of NYC Leadership Academy (2012-present) and Member of the Board of Advisors of Ripple Labs, Inc. (financial services, 2015-present). He also served as Chairman (2010-2012) and Member of the Board of Directors (2012-2013) of Omgeo, LLC (financial services), Treasurer of United Way of New York (2012-2016), and Member of the Board of Directors of XBRL US (financial services non-profit, 2009-2012) and the International Securities Services Association (2009-2012).
Alan J. Lacy (1953)
Year of Election or Appointment: 2008
Trustee
Mr. Lacy also serves as Trustee of other Fidelity® funds. Mr. Lacy serves as a Director of Bristol-Myers Squibb Company (global pharmaceuticals, 2008-present). He is a Trustee of the California Chapter of The Nature Conservancy (2015-present) and a Director of the Center for Advanced Study in the Behavioral Sciences at Stanford University (2015-present). In addition, Mr. Lacy served as Senior Adviser (2007-2014) of Oak Hill Capital Partners, L.P. (private equity) and also served as Chief Executive Officer (2005) and Vice Chairman (2005-2006) of Sears Holdings Corporation (retail) and Chief Executive Officer and Chairman of the Board of Sears, Roebuck and Co. (retail, 2000-2005). Previously, Mr. Lacy served as Chairman (2014-2017) and a member (2010-2017) of the Board of Directors of Dave & Buster’s Entertainment, Inc. (restaurant and entertainment complexes), as Chairman (2008-2011) and a member (2006-2015) of the Board of Trustees of the National Parks Conservation Association, and as a member of the Board of Directors for The Hillman Companies, Inc. (hardware wholesalers, 2010-2014), Earth Fare, Inc. (retail grocery, 2010-2014), and The Western Union Company (global money transfer, 2006-2011).
Ned C. Lautenbach (1944)
Year of Election or Appointment: 2000
Trustee
Chairman of the Independent Trustees
Mr. Lautenbach also serves as Trustee of other Fidelity® funds. Mr. Lautenbach currently serves as Vice Chair of the Board of Governors, State University System of Florida (2013-present) and is a member of the Council on Foreign Relations (1994-present). He is also a member and has most recently served as Chairman of the Board of Directors of Artis-Naples (2012-present). Previously, Mr. Lautenbach served as a member and then Lead Director of the Board of Directors of Eaton Corporation (diversified industrial, 1997-2016). He was also a Partner and Advisory Partner at Clayton, Dubilier & Rice, LLC (private equity investment, 1998-2010), as well as a Director of Sony Corporation (2006-2007). In addition, Mr. Lautenbach also had a 30-year career with IBM (technology company) during which time he served as Senior Vice President and a member of the Corporate Executive Committee (1968-1998).
Joseph Mauriello (1944)
Year of Election or Appointment: 2008
Trustee
Mr. Mauriello also serves as Trustee of other Fidelity® funds. Prior to his retirement in January 2006, Mr. Mauriello served in numerous senior management positions including Deputy Chairman and Chief Operating Officer (2004-2005), and Vice Chairman of Financial Services (2002-2004) of KPMG LLP US (professional services, 1965-2005). Mr. Mauriello currently serves as a member of the Board of Directors of XL Group plc. (global insurance and re-insurance, 2006-present) and the Independent Directors Council (IDC) Governing Council (2015-present). Previously, Mr. Mauriello served as a Director of the Hamilton Funds of the Bank of New York (2006-2007) and of Arcadia Resources Inc. (health care services and products, 2007-2012).
Cornelia M. Small (1944)
Year of Election or Appointment: 2005
Trustee
Ms. Small also serves as Trustee of other Fidelity® funds. Ms. Small is a member of the Board of Directors (2009-present) and Chair of the Investment Committee (2010-present) of the Teagle Foundation. Ms. Small also serves on the Investment Committee of the Berkshire Taconic Community Foundation (2008-present). Previously, Ms. Small served as Chairperson (2002-2008) and a member of the Investment Committee and Chairperson (2008-2012) and a member of the Board of Trustees of Smith College. In addition, Ms. Small served as Chief Investment Officer, Director of Global Equity Investments, and a member of the Board of Directors of Scudder, Stevens & Clark and Scudder Kemper Investments.
Garnett A. Smith (1947)
Year of Election or Appointment: 2018
Trustee
Mr. Smith also serves as Trustee of other Fidelity® funds. Prior to Mr. Smith's retirement, he served as Chairman and Chief Executive Officer of Inbrand Corp. (manufacturer of personal absorbent products, 1990-1997). He also served as President (1986-1990) of Inbrand Corp. Prior to his employment with Inbrand Corp., he was employed by a retail fabric chain and North Carolina National Bank. In addition, Mr. Smith served as a Member of the Advisory Board of certain Fidelity® funds (2012-2013) and as a board member of the Jackson Hole Land Trust (2009-2012).
David M. Thomas (1949)
Year of Election or Appointment: 2008
Trustee
Mr. Thomas also serves as Trustee of other Fidelity® funds. Mr. Thomas serves as Non-Executive Chairman of the Board of Directors of Fortune Brands Home and Security (home and security products, 2011-present), as a member of the Board of Directors (2004-present) and Presiding Director (2013-present) of Interpublic Group of Companies, Inc. (marketing communication), and as a member of the Board of Trustees of the University of Florida (2013-present). Previously, Mr. Thomas served as Executive Chairman (2005-2006) and Chairman and Chief Executive Officer (2000-2005) of IMS Health, Inc. (pharmaceutical and healthcare information solutions), and a Director of Fortune Brands, Inc. (consumer products, 2000-2011).
+ The information includes the Trustee's principal occupation during the last five years and other information relating to the experience, attributes, and skills relevant to the Trustee's qualifications to serve as a Trustee, which led to the conclusion that the Trustee should serve as a Trustee for the fund.
Advisory Board Members and Officers:
Correspondence intended for a Member of the Advisory Board (if any) may be sent to Fidelity Investments, P.O. Box 55235, Boston, Massachusetts 02205-5235. Correspondence intended for an officer or Peter S. Lynch may be sent to Fidelity Investments, 245 Summer Street, Boston, Massachusetts 02210. Officers appear below in alphabetical order.
Name, Year of Birth; Principal Occupation
Peter S. Lynch (1944)
Year of Election or Appointment: 2003
Member of the Advisory Board
Mr. Lynch also serves as Member of the Advisory Board of other Fidelity® funds. Mr. Lynch is Vice Chairman and a Director of FMR (investment adviser firm) and FMR Co., Inc. (investment adviser firm). In addition, Mr. Lynch serves as a Trustee of Boston College and as the Chairman of the Inner-City Scholarship Fund. Previously, Mr. Lynch served on the Special Olympics International Board of Directors (1997-2006).
William S. Stavropoulos (1939)
Year of Election or Appointment: 2018
Member of the Advisory Board
Mr. Stavropoulos also serves as Member of the Advisory Board of other Fidelity® funds. Mr. Stavropoulos serves as President and Founder of the Michigan Baseball Foundation, the Great Lakes Loons (2007-present). Mr. Stavropoulos is Chairman Emeritus of the Board of Directors of The Dow Chemical Company, where he previously served in numerous senior management positions, including President, CEO (1995-2000; 2002-2004), Chairman of the Executive Committee (2000-2006), and as a member of the Board of Directors (1990-2006). Currently, Mr. Stavropoulos is Chairman of the Board of Directors of Univar Inc. (global distributor of commodity and specialty chemicals), a Director of Teradata Corporation (data warehousing and technology solutions), and a member of the Advisory Board for Metalmark Capital LLC (private equity investment, 2005-present). Mr. Stavropoulos is an operating advisor to Clayton, Dubilier & Rice, LLC (private equity investment). In addition, Mr. Stavropoulos is a member of the University of Notre Dame Advisory Council for the College of Science, a Trustee of the Rollin L. Gerstacker Foundation, and a Director of Artis-Naples in Naples, Florida. Previously, Mr. Stavropoulos served as Trustee of certain Fidelity® funds (2001-2018) and as a Director of Chemical Financial Corporation (bank holding company, 1993-2012) and Tyco International, Ltd. (multinational manufacturing and services, 2007-2012).
Carol B. Tomé (1957)
Year of Election or Appointment: 2018
Member of the Advisory Board
Ms. Tomé also serves as Member of the Advisory Board of other Fidelity® funds. Ms. Tomé is Chief Financial Officer (2001-present) and Executive Vice President of Corporate Services (2007-present) of The Home Depot, Inc. (home improvement retailer) and a Director (2003-present) and Chair of the Audit Committee (2004-present) of United Parcel Service, Inc. (package delivery and supply chain management). Previously, Ms. Tomé served as Trustee of certain Fidelity® funds (2017), Senior Vice President of Finance and Accounting/Treasurer (2000-2007) and Vice President and Treasurer (1995-2000) of The Home Depot, Inc. and Chair of the Board (2010-2012), Vice Chair of the Board (2009 and 2013), and a Director (2008-2013) of the Federal Reserve Bank of Atlanta. Ms. Tomé is also a director or trustee of many community and professional organizations.
Michael E. Wiley (1950)
Year of Election or Appointment: 2018
Member of the Advisory Board
Mr. Wiley also serves as Trustee or Member of the Advisory Board of other Fidelity® funds. Mr. Wiley serves as a Director of Andeavor Corporation (independent oil refiner and marketer, 2005-present), a Director of Andeavor Logistics LP (natural resources logistics, 2015-present), and a Director of Bill Barrett Corporation (exploration and production, 2005-present). In addition, Mr. Wiley also serves as a Director of Post Oak Bank (privately-held bank, 2004-present). Previously, Mr. Wiley served as a Trustee of other Fidelity® funds (2008-2013), as a Director of Asia Pacific Exploration Consolidated (international oil and gas exploration and production, 2008-2013), as a member of the Board of Trustees of the University of Tulsa (2000-2006; 2007-2010), as a Senior Energy Advisor of Katzenbach Partners, LLC (consulting, 2006-2007), as an Advisory Director of Riverstone Holdings (private investment), Chairman, President, and CEO of Baker Hughes, Inc. (oilfield services, 2000-2004), and as Director of Spinnaker Exploration Company (exploration and production, 2001-2005).
Elizabeth Paige Baumann (1968)
Year of Election or Appointment: 2017
Anti-Money Laundering (AML) Officer
Ms. Baumann also serves as AML Officer of other funds. She is Chief AML Officer (2012-present) and Senior Vice President (2014-present) of FMR LLC (diversified financial services company) and is an employee of Fidelity Investments. Previously, Ms. Baumann served as AML Officer of the funds (2012-2016), and Vice President (2007-2014) and Deputy Anti-Money Laundering Officer (2007-2012) of FMR LLC.
Marc R. Bryant (1966)
Year of Election or Appointment: 2015
Secretary and Chief Legal Officer (CLO)
Mr. Bryant also serves as Secretary and CLO of other funds. Mr. Bryant serves as CLO, Secretary, and Senior Vice President of Fidelity Management & Research Company (investment adviser firm, 2015-present) and FMR Co., Inc. (investment adviser firm, 2015-present); Secretary of Fidelity SelectCo, LLC (investment adviser firm, 2015-present) and Fidelity Investments Money Management, Inc. (investment adviser firm, 2015-present); and CLO of Fidelity Management & Research (Hong Kong) Limited and FMR Investment Management (UK) Limited (investment adviser firms, 2015-present) and Fidelity Management & Research (Japan) Limited (investment adviser firm, 2016-present). He is Senior Vice President and Deputy General Counsel of FMR LLC (diversified financial services company). Previously, Mr. Bryant served as Secretary and CLO of Fidelity Rutland Square Trust II (2010-2014) and Assistant Secretary of Fidelity's Fixed Income and Asset Allocation Funds (2013-2015). Prior to joining Fidelity Investments, Mr. Bryant served as a Senior Vice President and the Head of Global Retail Legal for AllianceBernstein L.P. (2006-2010), and as the General Counsel for ProFund Advisors LLC (2001-2006).
John J. Burke III (1964)
Year of Election or Appointment: 2018
Chief Financial Officer
Mr. Burke also serves as Chief Financial Officer of other funds. Mr. Burke serves as Head of Investment Operations for Fidelity Fund and Investment Operations (2018-present) and is an employee of Fidelity Investments (1998-present). Previously Mr. Burke served as head of Asset Management Investment Operations (2012-2018).
William C. Coffey (1969)
Year of Election or Appointment: 2009
Assistant Secretary
Mr. Coffey also serves as Assistant Secretary of other funds. He is Senior Vice President and Deputy General Counsel of FMR LLC (diversified financial services company, 2010-present), and is an employee of Fidelity Investments. Previously, Mr. Coffey served as Vice President and Associate General Counsel of FMR LLC (2005-2009).
Timothy M. Cohen (1969)
Year of Election or Appointment: 2018
Vice President
Mr. Cohen also serves as Vice President of other funds. Mr. Cohen serves as Co-Head of Global Equity Research (2016-present), a Director of Fidelity Management & Research (Japan) Limited (investment adviser firm, 2016-present), and is an employee of Fidelity Investments. Previously, Mr. Cohen served as Chief Investment Officer - Equity and a Director of Fidelity Management & Research (U.K.) Inc. (investment adviser firm, 2013-2015) and as a Director of Fidelity Management & Research (Hong Kong) Limited (investment adviser firm, 2017).
Jonathan Davis (1968)
Year of Election or Appointment: 2010
Assistant Treasurer
Mr. Davis also serves as Assistant Treasurer of other funds. Mr. Davis serves as Assistant Treasurer of FMR Capital, Inc. (2017-present) and is an employee of Fidelity Investments. Previously, Mr. Davis served as Vice President and Associate General Counsel of FMR LLC (diversified financial services company, 2003-2010).
Adrien E. Deberghes (1967)
Year of Election or Appointment: 2016
Assistant Treasurer
Mr. Deberghes also serves as an officer of other funds. He serves as Assistant Treasurer of FMR Capital, Inc. (2017-present), Executive Vice President of Fidelity Investments Money Management, Inc. (FIMM) (investment adviser firm, 2016-present), and is an employee of Fidelity Investments (2008-present). Previously, Mr. Deberghes served as President and Treasurer of certain Fidelity® funds (2013-2018). Prior to joining Fidelity Investments, Mr. Deberghes was Senior Vice President of Mutual Fund Administration at State Street Corporation (2007-2008), Senior Director of Mutual Fund Administration at Investors Bank & Trust (2005-2007), and Director of Finance for Dunkin' Brands (2000-2005). Previously, Mr. Deberghes served in other fund officer roles.
Laura M. Del Prato (1964)
Year of Election or Appointment: 2018
Assistant Treasurer
Ms. Del Prato also serves as an officer of other funds. Ms. Del Prato is an employee of Fidelity Investments (2017-present). Prior to joining Fidelity Investments, Ms. Del Prato served as a Managing Director and Treasurer of the JPMorgan Mutual Funds (2014-2017). Prior to JPMorgan, Ms. Del Prato served as a partner at Cohen Fund Audit Services (accounting firm, 2012-2013) and KPMG LLP (accounting firm, 2004-2012).
Colm A. Hogan (1973)
Year of Election or Appointment: 2016
Deputy Treasurer
Mr. Hogan also serves as an officer of other funds. Mr. Hogan serves as Assistant Treasurer of FMR Capital, Inc. (2017-present) and is an employee of Fidelity Investments (2005-present). Previously, Mr. Hogan served as Assistant Treasurer of certain Fidelity® funds (2016-2018).
Pamela R. Holding (1964)
Year of Election or Appointment: 2018
Vice President
Ms. Holding also serves as a Vice President of other funds. Ms. Holding serves as Co-Head of Global Equity Research (2018-present) and is an employee of Fidelity Investments (2013-present).
Chris Maher (1972)
Year of Election or Appointment: 2013
Assistant Treasurer
Mr. Maher serves as Assistant Treasurer of other funds. Mr. Maher is Vice President of Valuation Oversight, serves as Assistant Treasurer of FMR Capital, Inc. (2017-present), and is an employee of Fidelity Investments. Previously, Mr. Maher served as Vice President of Asset Management Compliance (2013), Vice President of the Program Management Group of FMR (investment adviser firm, 2010-2013), and Vice President of Valuation Oversight (2008-2010).
Rieco E. Mello (1969)
Year of Election or Appointment: 2017
Assistant Treasurer
Mr. Mello also serves as Assistant Treasurer of other funds. Mr. Mello serves as Assistant Treasurer of FMR Capital, Inc. (2017-present) and is an employee of Fidelity Investments (1995-present).
Kenneth B. Robins (1969)
Year of Election or Appointment: 2016
Chief Compliance Officer
Mr. Robins also serves as an officer of other funds. Mr. Robins serves as Compliance Officer of Fidelity Management & Research Company and FMR Co., Inc. (investment adviser firms, 2016-present) and is an employee of Fidelity Investments (2004-present). Previously, Mr. Robins served as Executive Vice President of Fidelity Investments Money Management, Inc. (investment adviser firm, 2013-2016) and served in other fund officer roles.
Stacie M. Smith (1974)
Year of Election or Appointment: 2016
President and Treasurer
Ms. Smith also serves as an officer of other funds. Ms. Smith serves as Assistant Treasurer of FMR Capital, Inc. (2017-present), is an employee of Fidelity Investments (2009-present), and has served in other fund officer roles. Prior to joining Fidelity Investments, Ms. Smith served as Senior Audit Manager of Ernst & Young LLP (accounting firm, 1996-2009). Previously, Ms. Smith served as Assistant Treasurer (2013-2018) and Deputy Treasurer (2013-2016) of certain Fidelity® funds.
Marc L. Spector (1972)
Year of Election or Appointment: 2016
Assistant Treasurer
Mr. Spector also serves as an officer of other funds. Mr. Spector serves as Assistant Treasurer of FMR Capital, Inc. (2017-present) and is an employee of Fidelity Investments (2016-present). Prior to joining Fidelity Investments, Mr. Spector served as Director at the Siegfried Group (accounting firm, 2013-2016), and prior to Siegfried Group as audit senior manager at Deloitte & Touche (accounting firm, 2005-2013).
Renee Stagnone (1975)
Year of Election or Appointment: 2016
Assistant Treasurer
Ms. Stagnone also serves as an officer of other funds. Ms. Stagnone serves as Assistant Treasurer of FMR Capital, Inc. (2017-present) and is an employee of Fidelity Investments (1997-present). Previously, Ms. Stagnone served as Deputy Treasurer of certain Fidelity® funds (2013-2016).
Shareholder Expense Example
As a shareholder of the Fund, you incur two types of costs: (1) transaction costs and (2) ongoing costs, including management fees and other Fund expenses. This Example is intended to help you understand your ongoing costs (in dollars) of investing in the Fund and to compare these costs with the ongoing costs of investing in other mutual funds.
The Example is based on an investment of $1,000 invested at the beginning of the period and held for the entire period (February 1, 2018 to July 31, 2018).
Actual Expenses
The first line of the accompanying table for each class of the Fund provides information about actual account values and actual expenses. You may use the information in this line, together with the amount you invested, to estimate the expenses that you paid over the period. Simply divide your account value by $1,000.00 (for example, an $8,600 account value divided by $1,000.00 = 8.6), then multiply the result by the number in the first line for a class of the Fund under the heading entitled "Expenses Paid During Period" to estimate the expenses you paid on your account during this period. A small balance maintenance fee of $12.00 that is charged once a year may apply for certain accounts with a value of less than $2,000. This fee is not included in the table below. If it was, the estimate of expenses you paid during the period would be higher, and your ending account value lower, by this amount. In addition, the Fund, as a shareholder in the underlying Fidelity Central Funds, will indirectly bear its pro-rata share of the fees and expenses incurred by the underlying Fidelity Central Funds. These fees and expenses are not included in the Fund's annualized expense ratio used to calculate the expense estimate in the table below.
Hypothetical Example for Comparison Purposes
The second line of the accompanying table for each class of the Fund provides information about hypothetical account values and hypothetical expenses based on a Class' actual expense ratio and an assumed rate of return of 5% per year before expenses, which is not the Class' actual return. The hypothetical account values and expenses may not be used to estimate the actual ending account balance or expenses you paid for the period. You may use this information to compare the ongoing costs of investing in the Fund and other funds. To do so, compare this 5% hypothetical example with the 5% hypothetical examples that appear in the shareholder reports of the other funds. A small balance maintenance fee of $12.00 that is charged once a year may apply for certain accounts with a value of less than $2,000. This fee is not included in the table below. If it was, the estimate of expenses you paid during the period would be higher, and your ending account value lower, by this amount. In addition, the Fund, as a shareholder in the underlying Fidelity Central Funds, will indirectly bear its pro-rata share of the fees and expenses incurred by the underlying Fidelity Central Funds. These fees and expenses are not included in the Fund's annualized expense ratio used to calculate the expense estimate in the table below.
Please note that the expenses shown in the table are meant to highlight your ongoing costs only and do not reflect any transaction costs. Therefore, the second line of the table is useful in comparing ongoing costs only, and will not help you determine the relative total costs of owning different funds.
| | Annualized Expense Ratio-A | Beginning
Account Value
February 1, 2018 | Ending
Account Value
July 31, 2018 | Expenses Paid
During Period-B
February 1, 2018
to July 31, 2018 |
| Blue Chip Growth | .73% | | | |
| Actual | | $1,000.00 | $1,046.90 | $3.70 |
| Hypothetical-C | | $1,000.00 | $1,021.17 | $3.66 |
| Class K | .64% | | | |
| Actual | | $1,000.00 | $1,047.50 | $3.25 |
| Hypothetical-C | | $1,000.00 | $1,021.62 | $3.21 |
A Annualized expense ratio reflects expenses net of applicable fee waivers.
B Expenses are equal to each Class' annualized expense ratio, multiplied by the average account value over the period, multiplied by 181/365 (to reflect the one-half year period).
C 5% return per year before expenses
Distributions (Unaudited)
The Board of Trustees of Fidelity Blue Chip Growth Fund voted to pay to shareholders of record at the opening of business on record date, the following distributions per share derived from capital gains realized from sales of portfolio securities, and dividends derived from net investment income:
| | Pay Date | Record Date | Dividends | Capital Gains |
| Fidelity Blue Chip Growth Fund | | | | |
| Blue Chip Growth | 09/17/18 | 09/14/18 | $0.069 | $3.758 |
| Class K | 09/17/18 | 09/14/18 | $0.120 | $3.758 |
|
The fund hereby designates as a capital gain dividend with respect to the taxable year ended July 31 2018, $1,594,041,568, or, if subsequently determined to be different, the net capital gain of such year.
Blue Chip Growth and Class K designate 100% of the dividends distributed during the fiscal year as qualifying for the dividends–received deduction for corporate shareholders.
Blue Chip Growth and Class K designate 100% of dividends distributed during the fiscal year as amounts which may be taken into account as a dividend for purposes of the maximum rate under section 1(h)(11) of the Internal Revenue Code.
The fund will notify shareholders in January 2019 of amounts for use in preparing 2018 income tax returns.
Board Approval of Investment Advisory Contracts
Fidelity Blue Chip Growth Fund
At its July 2018 meeting, the Board of Trustees, including the Independent Trustees (together, the Board), voted to continue the management contract with Fidelity Management & Research Company (FMR) and the sub-advisory agreements (together, the Advisory Contracts) for the fund for six months through January 31, 2019, in connection with the reunification of the Fidelity Equity High Income Funds Board, which oversees the fund, and the Sector Portfolios Board.
The Board considered that the approval of the fund's Advisory Contracts will not result in any changes in (i) the investment process or strategies employed in the management of the fund's assets; (ii) the fees and expenses paid by shareholders; (iii) the nature, extent or quality of services provided under the fund's Advisory Contracts; or (iv) the day-to-day management of the fund or the persons primarily responsible for such management. The Board concluded that the fund's Advisory Contracts are fair and reasonable, and that the fund's Advisory Contracts should be renewed, without modification, through January 31, 2019, with the understanding that the Board will consider the annual renewal for a full one year period in January 2019.
In connection with its consideration of future renewals of the fund's Advisory Contracts, the Board will consider: (i) the nature, extent and quality of services provided to the fund, including shareholder and administrative services and investment performance; (ii) the competitiveness of the management fee and total expenses for the fund; (iii) the costs of the services and profitability, including the revenues earned and the expenses incurred in conducting the business of developing, marketing, distributing, managing, administering, and servicing the fund and its shareholders, to the extent applicable, as well as potential fall-out benefits from Fidelity's non-fund businesses; and (iv) whether there have been economies of scale in respect of the Fidelity funds, whether the Fidelity funds (including the fund) have appropriately benefited from any such economies of scale, and whether there is the potential for realization of any further economies.
Based on its evaluation of all of the conclusions noted above, and after considering all factors it believed relevant, the Board ultimately concluded that the fund's management fee structure is fair and reasonable, and that the continuation of the fund's Advisory Contracts should be approved.
Corporate Headquarters
245 Summer St.
Boston, MA 02210
www.fidelity.com
BCF-ANN-0918
1.536058.121
Fidelity® Blue Chip Growth Fund Class K
Annual Report July 31, 2018 |
|
Contents
To view a fund's proxy voting guidelines and proxy voting record for the 12-month period ended June 30, visit http://www.fidelity.com/proxyvotingresults or visit the Securities and Exchange Commission's (SEC) web site at http://www.sec.gov.
You may also call 1-800-835-5092 to request a free copy of the proxy voting guidelines.
Standard & Poor's, S&P and S&P 500 are registered service marks of The McGraw-Hill Companies, Inc. and have been licensed for use by Fidelity Distributors Corporation.
Other third-party marks appearing herein are the property of their respective owners.
All other marks appearing herein are registered or unregistered trademarks or service marks of FMR LLC or an affiliated company. © 2018 FMR LLC. All rights reserved.
This report and the financial statements contained herein are submitted for the general information of the shareholders of the Fund. This report is not authorized for distribution to prospective investors in the Fund unless preceded or accompanied by an effective prospectus.
A fund files its complete schedule of portfolio holdings with the SEC for the first and third quarters of each fiscal year on Form N-Q. Forms N-Q are available on the SEC’s web site at http://www.sec.gov. A fund's Forms N-Q may be reviewed and copied at the SEC’s Public Reference Room in Washington, DC. Information regarding the operation of the SEC's Public Reference Room may be obtained by calling 1-800-SEC-0330.
For a complete list of a fund's portfolio holdings, view the most recent holdings listing, semiannual report, or annual report on Fidelity's web site at http://www.fidelity.com, http://www.institutional.fidelity.com, or http://www.401k.com, as applicable.
NOT FDIC INSURED •MAY LOSE VALUE •NO BANK GUARANTEE
Neither the Fund nor Fidelity Distributors Corporation is a bank.
Performance: The Bottom Line
Average annual total return reflects the change in the value of an investment, assuming reinvestment of distributions from dividend income and capital gains (the profits earned upon the sale of securities that have grown in value, if any) and assuming a constant rate of performance each year. The hypothetical investment and the average annual total returns do not reflect the deduction of taxes that a shareholder would pay on fund distributions or the redemption of fund shares. During periods of reimbursement by Fidelity, a fund’s total return will be greater than it would be had the reimbursement not occurred. How a fund did yesterday is no guarantee of how it will do tomorrow.
Average Annual Total Returns
| For the periods ended July 31, 2018 | Past 1 year | Past 5 years | Past 10 years |
| Class K | 25.33% | 17.22% | 14.09% |
$10,000 Over 10 Years
Let's say hypothetically that $10,000 was invested in Fidelity® Blue Chip Growth Fund - Class K on July 31, 2008.
The chart shows how the value of your investment would have changed, and also shows how the Russell 1000® Growth Index performed over the same period.
| Period Ending Values |
| $37,365 | Fidelity® Blue Chip Growth Fund - Class K |
| $32,088 | Russell 1000® Growth Index |
Management's Discussion of Fund Performance
Market Recap: The U.S. equity bellwether S&P 500
® index gained 16.24% for the 12 months ending July 31, 2018, despite a resurgence in volatility that challenged the multiyear bull market. Stocks maintained their steady growth until a sharp reversal in February, as volatility spiked amid fear that rising inflation and the potential for the economy to overheat would prompt the U.S. Federal Reserve to pick up the pace of interest rate hikes. The index posted its first negative monthly result since October 2016, and then lost further ground in March on fear of a global trade war. The market stabilized in April and turned upward through mid-June, when escalating trade tension between the U.S. and China soured investor sentiment. The resulting uncertainty lingered into July, but strong corporate earnings helped the S&P 500 rise 3.72% that month to cap the period. For the full one-year period, growth handily topped value, while small-caps bested large-caps. By sector, information technology (+28%) led the way, boosted by strong earnings growth from several major index constituents. Consumer discretionary rose roughly 24%, driven by retailers (+49%). Energy (+20%) gained alongside higher oil prices. Laggards were telecommunication services (-2%), consumer staples (0%) and utilities (+3%), defensive groups that struggled amid rising interest rates and a general preference for risk. Real estate (+5%) fared a bit better but still lagged, as did financials, industrials, health care (each up 13%) and materials (+11%).
Comments from Portfolio Manager Sonu Kalra: For the year, the fund's share classes rose about 25%, ahead of the 22.84% gain of the benchmark Russell 1000
® Growth Index. Choices in the consumer sectors of the market added the most relative value. It also helped to overweight strong-performing consumer discretionary and underweight weaker-performing consumer staples. Juul Labs, an out-of-index investment, contributed more than any other single position by far this period. The firm has emerged as a leader in the rapidly growing electronic cigarette market. Its disruptive technology is intended to offer smokers a potentially safer alternative to tar-burning cigarettes. JUUL's success in penetrating the U.S. market supported a higher estimate of fair value for this position. It is not publicly traded. Competition in this space is likely to increase. The firm and the industry face a number of social and public policy concerns. E-commerce giant Amazon.com was another significant contributor and also was the fund’s largest holding on July 31. Choices in information technology and health care hurt. An underweighting in software & services giant Microsoft detracted more than any other position. The company continued to execute very well this period, with its stock hitting a record high in July after the firm announced stellar quarterly results.
The views expressed above reflect those of the portfolio manager(s) only through the end of the period as stated on the cover of this report and do not necessarily represent the views of Fidelity or any other person in the Fidelity organization. Any such views are subject to change at any time based upon market or other conditions and Fidelity disclaims any responsibility to update such views. These views may not be relied on as investment advice and, because investment decisions for a Fidelity fund are based on numerous factors, may not be relied on as an indication of trading intent on behalf of any Fidelity fund.
Investment Summary (Unaudited)
Top Ten Stocks as of July 31, 2018
| | % of fund's net assets |
| Amazon.com, Inc. | 7.5 |
| Alphabet, Inc. Class A | 7.1 |
| Apple, Inc. | 6.2 |
| Facebook, Inc. Class A | 3.9 |
| Microsoft Corp. | 3.3 |
| NVIDIA Corp. | 2.9 |
| Salesforce.com, Inc. | 2.6 |
| Visa, Inc. Class A | 2.0 |
| Tesla, Inc. | 2.0 |
| Broadcom, Inc. | 1.9 |
| | 39.4 |
Top Five Market Sectors as of July 31, 2018
| | % of fund's net assets |
| Information Technology | 45.4 |
| Consumer Discretionary | 26.0 |
| Health Care | 9.9 |
| Industrials | 5.0 |
| Consumer Staples | 4.6 |
Asset Allocation (% of fund's net assets)
| As of July 31, 2018* |
| | Stocks | 96.1% |
| | Convertible Securities | 3.8% |
| | Short-Term Investments and Net Other Assets (Liabilities) | 0.1% |

* Foreign investments - 9.1%
Schedule of Investments July 31, 2018
Showing Percentage of Net Assets
| Common Stocks - 96.1% | | | |
| | | Shares | Value (000s) |
| CONSUMER DISCRETIONARY - 25.7% | | | |
| Auto Components - 0.1% | | | |
| Aptiv PLC | | 160,879 | $15,777 |
| Veoneer, Inc. (a)(b) | | 110,300 | 5,769 |
| | | | 21,546 |
| Automobiles - 2.0% | | | |
| Tesla, Inc. (a)(b) | | 1,795,391 | 535,278 |
| Diversified Consumer Services - 0.3% | | | |
| Chegg, Inc. (a) | | 396,279 | 10,977 |
| Grand Canyon Education, Inc. (a) | | 55,906 | 6,515 |
| New Oriental Education & Technology Group, Inc. sponsored ADR | | 597,079 | 51,373 |
| Weight Watchers International, Inc. (a) | | 253,056 | 22,656 |
| | | | 91,521 |
| Hotels, Restaurants & Leisure - 2.4% | | | |
| Accor SA | | 43,569 | 2,246 |
| Alsea S.A.B. de CV | | 1,342,500 | 4,631 |
| Caesars Entertainment Corp. (a) | | 2,192,500 | 24,775 |
| Chipotle Mexican Grill, Inc. (a) | | 217,793 | 94,448 |
| Eldorado Resorts, Inc. (a) | | 57,700 | 2,472 |
| Hilton Grand Vacations, Inc. (a) | | 596,239 | 20,624 |
| Hilton Worldwide Holdings, Inc. | | 326,746 | 25,702 |
| International Game Technology PLC | | 677,071 | 17,116 |
| Las Vegas Sands Corp. | | 425,839 | 30,618 |
| Marriott International, Inc. Class A | | 400,597 | 51,212 |
| McDonald's Corp. | | 746,494 | 117,603 |
| Melco Crown Entertainment Ltd. sponsored ADR | | 463,325 | 11,982 |
| Planet Fitness, Inc. (a) | | 648,500 | 30,817 |
| Restaurant Brands International, Inc. | | 470,582 | 30,022 |
| Royal Caribbean Cruises Ltd. | | 442,142 | 49,856 |
| Shake Shack, Inc. Class A (a)(b) | | 267,641 | 16,682 |
| U.S. Foods Holding Corp. (a) | | 1,133,293 | 38,317 |
| Vail Resorts, Inc. | | 42,507 | 11,769 |
| Wyndham Destinations, Inc. | | 368,104 | 16,977 |
| Wyndham Hotels & Resorts, Inc. | | 309,604 | 17,957 |
| Wynn Resorts Ltd. | | 25,503 | 4,253 |
| | | | 620,079 |
| Household Durables - 0.2% | | | |
| Forbo Holding AG (Reg.) | | 1,252 | 1,984 |
| iRobot Corp. (a) | | 34,200 | 2,710 |
| SodaStream International Ltd. (a) | | 581,417 | 50,758 |
| | | | 55,452 |
| Internet & Direct Marketing Retail - 10.3% | | | |
| Amazon.com, Inc. (a) | | 1,108,942 | 1,971,069 |
| JD.com, Inc. sponsored ADR (a) | | 3,387,149 | 121,463 |
| Netflix, Inc. (a) | | 1,087,132 | 366,853 |
| The Booking Holdings, Inc. (a) | | 113,764 | 230,795 |
| The Honest Co., Inc. (a)(c)(d) | | 150,143 | 1,727 |
| TripAdvisor, Inc. (a) | | 46,900 | 2,720 |
| Wayfair LLC Class A (a)(b) | | 256,182 | 27,878 |
| | | | 2,722,505 |
| Media - 0.7% | | | |
| China Literature Ltd. (a)(e) | | 2,033,127 | 17,005 |
| Grupo Televisa SA de CV (CPO) sponsored ADR | | 128,600 | 2,557 |
| The Walt Disney Co. | | 1,130,097 | 128,334 |
| WME Entertainment Parent, LLC Class A (a)(c)(d)(f) | | 9,739,286 | 24,348 |
| | | | 172,244 |
| Multiline Retail - 1.2% | | | |
| Avenue Supermarts Ltd. (a)(e) | | 135,551 | 3,277 |
| Dollar Tree, Inc. (a) | | 2,838,100 | 259,062 |
| Future Retail Ltd. | | 1,455,708 | 11,368 |
| Macy's, Inc. | | 584,142 | 23,208 |
| Ollie's Bargain Outlet Holdings, Inc. (a) | | 195,867 | 13,613 |
| V-Mart Retail Ltd. (a) | | 88,581 | 3,137 |
| | | | 313,665 |
| Specialty Retail - 4.5% | | | |
| At Home Group, Inc. (a) | | 145,800 | 5,288 |
| Burlington Stores, Inc. (a) | | 375,745 | 57,418 |
| Five Below, Inc. (a) | | 392,843 | 38,169 |
| Floor & Decor Holdings, Inc. Class A (a)(b) | | 399,484 | 19,075 |
| Home Depot, Inc. | | 2,404,628 | 474,962 |
| Inditex SA | | 475,336 | 15,577 |
| Lowe's Companies, Inc. | | 2,570,810 | 255,384 |
| Michaels Companies, Inc. (a) | | 279,400 | 5,703 |
| RH (a)(b) | | 772,328 | 104,928 |
| Ross Stores, Inc. | | 776,574 | 67,896 |
| TCNS Clothing Co. Ltd. (a) | | 417,395 | 4,020 |
| Tiffany & Co., Inc. | | 217,100 | 29,864 |
| TJX Companies, Inc. | | 817,443 | 79,505 |
| Ulta Beauty, Inc. (a) | | 60,251 | 14,725 |
| Urban Outfitters, Inc. (a) | | 314,367 | 13,958 |
| | | | 1,186,472 |
| Textiles, Apparel & Luxury Goods - 4.0% | | | |
| adidas AG | | 540,878 | 119,633 |
| Canada Goose Holdings, Inc. (a) | | 383,864 | 22,034 |
| Carbon Black, Inc. (b) | | 39,764 | 826 |
| Cibus Global Ltd. Series C (c)(d)(f) | | 3,045,600 | 6,396 |
| Crinetics Pharmaceuticals, Inc. (a) | | 121,600 | 2,993 |
| Despegar.com Corp. (b) | | 304,211 | 6,395 |
| Gildan Activewear, Inc. | | 96,000 | 2,473 |
| GreenSky, Inc. Class A | | 217,802 | 3,768 |
| Homology Medicines, Inc. (a)(b) | | 105,519 | 1,858 |
| Kering SA | | 318,242 | 169,694 |
| lululemon athletica, Inc. (a) | | 1,463,987 | 175,605 |
| LVMH Moet Hennessy - Louis Vuitton SA | | 97,927 | 34,126 |
| Michael Kors Holdings Ltd. (a) | | 879,733 | 58,705 |
| NIKE, Inc. Class B | | 1,810,041 | 139,210 |
| Pinduoduo, Inc. ADR (b) | | 891,159 | 20,131 |
| Prada SpA | | 7,312,900 | 34,799 |
| PVH Corp. | | 657,717 | 100,973 |
| Rubius Therapeutics, Inc. (a) | | 128,200 | 2,692 |
| Scholar Rock Holding Corp. | | 128,493 | 2,087 |
| Shenzhou International Group Holdings Ltd. | | 565,000 | 6,928 |
| Skechers U.S.A., Inc. Class A (sub. vtg.) (a) | | 1,800,588 | 49,912 |
| Tapestry, Inc. | | 814,643 | 38,386 |
| Tory Burch LLC (c)(d)(f) | | 293,611 | 21,075 |
| Under Armour, Inc. Class C (non-vtg.) (a)(b) | | 877,195 | 16,439 |
| VF Corp. | | 254,580 | 23,439 |
| | | | 1,060,577 |
|
| TOTAL CONSUMER DISCRETIONARY | | | 6,779,339 |
|
| CONSUMER STAPLES - 2.8% | | | |
| Beverages - 1.1% | | | |
| Constellation Brands, Inc. Class A (sub. vtg.) | | 419,703 | 88,234 |
| Diageo PLC | | 151,214 | 5,548 |
| Fever-Tree Drinks PLC | | 535,078 | 24,195 |
| Keurig Dr. Pepper, Inc. | | 1,014,611 | 24,361 |
| Monster Beverage Corp. (a) | | 1,906,533 | 114,430 |
| Pernod Ricard SA | | 14,524 | 2,343 |
| The Coca-Cola Co. | | 834,500 | 38,913 |
| | | | 298,024 |
| Food & Staples Retailing - 0.9% | | | |
| BJ's Wholesale Club Holdings, Inc. | | 1,149,400 | 28,494 |
| Costco Wholesale Corp. | | 812,852 | 177,779 |
| Performance Food Group Co. (a) | | 707,994 | 25,382 |
| | | | 231,655 |
| Food Products - 0.1% | | | |
| Blue Bottle Coffee, Inc. Class C (Escrow) (c)(d) | | 632,822 | 1,468 |
| Darling International, Inc. (a) | | 543,407 | 10,917 |
| Mondelez International, Inc. | | 66,200 | 2,872 |
| The Kraft Heinz Co. | | 204,722 | 12,335 |
| | | | 27,592 |
| Household Products - 0.1% | | | |
| Energizer Holdings, Inc. | | 339,200 | 21,600 |
| Personal Products - 0.6% | | | |
| Coty, Inc. Class A | | 2,555,422 | 34,268 |
| Estee Lauder Companies, Inc. Class A | | 358,377 | 48,359 |
| Herbalife Nutrition Ltd. (a) | | 909,251 | 46,945 |
| Kose Corp. | | 95,500 | 18,269 |
| | | | 147,841 |
| Tobacco - 0.0% | | | |
| JUUL Labs, Inc. (d) | | 6,625 | 1,110 |
| JUUL Labs, Inc. Class A (c)(d) | | 21,148 | 3,543 |
| | | | 4,653 |
|
| TOTAL CONSUMER STAPLES | | | 731,365 |
|
| ENERGY - 2.5% | | | |
| Oil, Gas & Consumable Fuels - 2.5% | | | |
| Anadarko Petroleum Corp. | | 1,232,689 | 90,171 |
| Andeavor | | 166,729 | 25,019 |
| BP PLC sponsored ADR | | 216,070 | 9,743 |
| Cenovus Energy, Inc. | | 482,813 | 4,844 |
| Continental Resources, Inc. (a) | | 1,427,203 | 91,155 |
| Delek U.S. Holdings, Inc. | | 647,108 | 34,504 |
| Diamondback Energy, Inc. | | 330,737 | 43,641 |
| EOG Resources, Inc. | | 406,907 | 52,467 |
| Extraction Oil & Gas, Inc. (a) | | 881,163 | 13,323 |
| Marathon Petroleum Corp. | | 228,256 | 18,450 |
| Petronet LNG Ltd. | | 655,750 | 2,195 |
| Phillips 66 Co. | | 22,180 | 2,736 |
| Pioneer Natural Resources Co. | | 311,693 | 58,994 |
| Reliance Industries Ltd. | | 3,649,638 | 63,226 |
| Valero Energy Corp. | | 443,945 | 52,541 |
| Whiting Petroleum Corp. (a) | | 1,823,860 | 90,555 |
| | | | 653,564 |
| FINANCIALS - 4.2% | | | |
| Banks - 2.0% | | | |
| Bank of America Corp. | | 6,523,942 | 201,459 |
| Citigroup, Inc. | | 1,442,890 | 103,729 |
| Coastal Financial Corp. of Washington (a) | | 41,300 | 671 |
| Cullen/Frost Bankers, Inc. | | 83,624 | 9,240 |
| HDFC Bank Ltd. sponsored ADR | | 448,135 | 46,310 |
| IndusInd Bank Ltd. | | 184,465 | 5,376 |
| JPMorgan Chase & Co. | | 1,394,843 | 160,337 |
| Kotak Mahindra Bank Ltd. | | 615,886 | 11,757 |
| | | | 538,879 |
| Capital Markets - 1.8% | | | |
| Apollo Global Management LLC Class A | | 237,879 | 8,445 |
| BlackRock, Inc. Class A | | 167,553 | 84,239 |
| Charles Schwab Corp. | | 1,413,044 | 72,150 |
| E*TRADE Financial Corp. (a) | | 361,010 | 21,592 |
| Edelweiss Financial Services Ltd. | | 1,204,598 | 5,445 |
| Fairfax India Holdings Corp. (a)(e) | | 844,362 | 13,594 |
| Goldman Sachs Group, Inc. | | 454,202 | 107,841 |
| HDFC Asset Management Co. Ltd. (a) | | 1,726 | 28 |
| Monex Group, Inc. (b) | | 773,300 | 3,845 |
| Morgan Stanley | | 1,175,025 | 59,409 |
| MSCI, Inc. | | 55,714 | 9,259 |
| TD Ameritrade Holding Corp. | | 1,266,682 | 72,391 |
| Virtu Financial, Inc. Class A | | 496,849 | 10,012 |
| | | | 468,250 |
| Consumer Finance - 0.0% | | | |
| American Express Co. | | 106,100 | 10,559 |
| Diversified Financial Services - 0.3% | | | |
| Allakos, Inc. (a)(b) | | 76,000 | 3,099 |
| Berkshire Hathaway, Inc. Class B (a) | | 307,641 | 60,873 |
| GDS Holdings Ltd. ADR (a) | | 86,649 | 1,892 |
| | | | 65,864 |
| Thrifts & Mortgage Finance - 0.1% | | | |
| Housing Development Finance Corp. Ltd. | | 697,722 | 20,331 |
|
| TOTAL FINANCIALS | | | 1,103,883 |
|
| HEALTH CARE - 9.7% | | | |
| Biotechnology - 4.5% | | | |
| AC Immune SA (a) | | 728,983 | 7,035 |
| ACADIA Pharmaceuticals, Inc. (a) | | 261,318 | 3,943 |
| Acceleron Pharma, Inc. (a) | | 80,528 | 3,508 |
| Agios Pharmaceuticals, Inc. (a) | | 300,295 | 25,948 |
| Aimmune Therapeutics, Inc. (a) | | 534,619 | 15,461 |
| Alexion Pharmaceuticals, Inc. (a) | | 1,753,170 | 233,101 |
| Alkermes PLC (a) | | 996,423 | 43,693 |
| Alnylam Pharmaceuticals, Inc. (a) | | 771,166 | 73,261 |
| Amgen, Inc. | | 27,300 | 5,366 |
| AnaptysBio, Inc. (a) | | 122,135 | 9,566 |
| Arena Pharmaceuticals, Inc. (a) | | 364,120 | 14,051 |
| Ascendis Pharma A/S sponsored ADR (a) | | 389,207 | 26,443 |
| BeiGene Ltd. ADR (a) | | 106,377 | 20,175 |
| Biogen, Inc. (a) | | 37,700 | 12,606 |
| bluebird bio, Inc. (a) | | 321,595 | 49,815 |
| Blueprint Medicines Corp. (a) | | 54,138 | 3,223 |
| Celgene Corp. (a) | | 218,042 | 19,643 |
| Cellectis SA sponsored ADR (a) | | 132,078 | 3,817 |
| Chimerix, Inc. (a) | | 74,847 | 335 |
| Coherus BioSciences, Inc. (a) | | 585,471 | 11,153 |
| CytomX Therapeutics, Inc. (a) | | 152,756 | 4,024 |
| CytomX Therapeutics, Inc. (a)(e) | | 378,621 | 9,973 |
| DBV Technologies SA sponsored ADR (a) | | 99,238 | 1,789 |
| Deciphera Pharmaceuticals, Inc. (a) | | 64,900 | 2,233 |
| Denali Therapeutics, Inc. (a)(b) | | 766,613 | 9,652 |
| Editas Medicine, Inc. (a) | | 548,423 | 16,310 |
| Epizyme, Inc. (a) | | 306,622 | 3,955 |
| Exelixis, Inc. (a) | | 1,380,283 | 28,572 |
| FibroGen, Inc. (a) | | 326,422 | 20,597 |
| GenSight Biologics SA (a)(b)(e) | | 588,530 | 1,480 |
| Global Blood Therapeutics, Inc. (a) | | 653,438 | 27,314 |
| Grifols SA ADR | | 101,501 | 2,109 |
| Heron Therapeutics, Inc. (a) | | 195,590 | 7,325 |
| ImmunoGen, Inc. (a) | | 226,300 | 2,105 |
| Insmed, Inc. (a) | | 143,238 | 3,562 |
| Intellia Therapeutics, Inc. (a)(b) | | 559,936 | 14,905 |
| Intercept Pharmaceuticals, Inc. (a) | | 263,212 | 23,989 |
| Ionis Pharmaceuticals, Inc. (a) | | 116,468 | 5,087 |
| Ironwood Pharmaceuticals, Inc. Class A (a) | | 983,161 | 18,955 |
| La Jolla Pharmaceutical Co. (a) | | 162,709 | 5,381 |
| Madrigal Pharmaceuticals, Inc. (a)(b) | | 8,300 | 2,133 |
| Momenta Pharmaceuticals, Inc. (a) | | 89,133 | 2,638 |
| Neurocrine Biosciences, Inc. (a) | | 581,190 | 58,404 |
| Portola Pharmaceuticals, Inc. (a) | | 352,141 | 12,607 |
| Radius Health, Inc. (a)(b) | | 78,159 | 1,876 |
| Regeneron Pharmaceuticals, Inc. (a) | | 354,321 | 130,394 |
| Replimune Group, Inc. (a) | | 178,900 | 2,682 |
| Sage Therapeutics, Inc. (a) | | 415,344 | 59,942 |
| Sarepta Therapeutics, Inc. (a) | | 306,692 | 35,650 |
| Seres Therapeutics, Inc. (a)(b) | | 45,336 | 343 |
| Trevena, Inc. (a) | | 957,837 | 1,475 |
| Ultragenyx Pharmaceutical, Inc. (a) | | 138,579 | 10,963 |
| Vertex Pharmaceuticals, Inc. (a) | | 267,704 | 46,862 |
| Xencor, Inc. (a) | | 420,035 | 15,634 |
| Zai Lab Ltd. ADR | | 169,165 | 3,708 |
| | | | 1,176,771 |
| Health Care Equipment & Supplies - 2.6% | | | |
| Align Technology, Inc. (a) | | 54,364 | 19,389 |
| Baxter International, Inc. | | 69,437 | 5,031 |
| Becton, Dickinson & Co. | | 201,287 | 50,396 |
| Boston Scientific Corp. (a) | | 6,827,906 | 229,486 |
| Danaher Corp. | | 451,697 | 46,335 |
| DexCom, Inc. (a) | | 155,771 | 14,818 |
| Edwards Lifesciences Corp. (a) | | 35,468 | 5,052 |
| Establishment Labs Holdings, Inc. (a) | | 259,559 | 6,754 |
| Fisher & Paykel Healthcare Corp. | | 255,860 | 2,581 |
| Hoya Corp. | | 38,000 | 2,277 |
| Insulet Corp. (a) | | 220,880 | 18,368 |
| Intuitive Surgical, Inc. (a) | | 436,699 | 221,926 |
| Invuity, Inc. (a)(b) | | 562,744 | 2,251 |
| iRhythm Technologies, Inc. (a) | | 536,612 | 40,541 |
| Novocure Ltd. (a) | | 151,142 | 5,139 |
| Penumbra, Inc. (a) | | 13,990 | 1,990 |
| Quanterix Corp. (a) | | 147,190 | 2,206 |
| Stryker Corp. | | 14,086 | 2,300 |
| | | | 676,840 |
| Health Care Providers & Services - 1.7% | | | |
| Humana, Inc. | | 612,647 | 192,481 |
| National Vision Holdings, Inc. | | 579,513 | 23,563 |
| Neuronetics, Inc. | | 57,100 | 1,425 |
| OptiNose, Inc. | | 605,274 | 12,317 |
| UnitedHealth Group, Inc. | | 919,357 | 232,800 |
| | | | 462,586 |
| Health Care Technology - 0.1% | | | |
| Evolent Health, Inc. (a) | | 306,307 | 6,187 |
| Teladoc, Inc. (a) | | 398,892 | 23,874 |
| | | | 30,061 |
| Life Sciences Tools & Services - 0.0% | | | |
| Illumina, Inc. (a) | | 9,100 | 2,952 |
| Pharmaceuticals - 0.8% | | | |
| Aclaris Therapeutics, Inc. (a) | | 157,406 | 2,698 |
| Akcea Therapeutics, Inc. (b) | | 807,182 | 25,523 |
| Allergan PLC | | 15,100 | 2,780 |
| AstraZeneca PLC sponsored ADR | | 354,163 | 13,858 |
| Bausch Health Cos., Inc. (Canada) (a) | | 460,688 | 10,015 |
| Bayer AG | | 20,951 | 2,332 |
| Castle Creek Pharmaceuticals, LLC Class A-2 unit (a)(c)(d)(f)(g) | | 29,758 | 15,176 |
| Chiasma, Inc. warrants 12/16/24 (a) | | 55,391 | 8 |
| Collegium Pharmaceutical, Inc. (a)(b) | | 92,783 | 1,788 |
| Dova Pharmaceuticals, Inc. (a)(b) | | 203,816 | 4,396 |
| Intersect ENT, Inc. (a) | | 108,536 | 3,511 |
| Jazz Pharmaceuticals PLC (a) | | 312,121 | 54,022 |
| Mylan NV (a) | | 68,700 | 2,563 |
| MyoKardia, Inc. (a) | | 84,265 | 4,837 |
| Nektar Therapeutics (a) | | 759,994 | 39,976 |
| The Medicines Company (a) | | 488,536 | 19,410 |
| Theravance Biopharma, Inc. (a) | | 56,967 | 1,364 |
| Zogenix, Inc. (a) | | 110,561 | 6,274 |
| | | | 210,531 |
|
| TOTAL HEALTH CARE | | | 2,559,741 |
|
| INDUSTRIALS - 4.9% | | | |
| Aerospace & Defense - 1.7% | | | |
| Bombardier, Inc. Class B (sub. vtg.) (a) | | 9,375,231 | 35,314 |
| Elbit Systems Ltd.(b) | | 50,511 | 6,077 |
| General Dynamics Corp. | | 168,666 | 33,693 |
| Northrop Grumman Corp. | | 363,006 | 109,080 |
| Raytheon Co. | | 322,426 | 63,850 |
| Space Exploration Technologies Corp.: | | | |
| Class A (a)(c)(d) | | 242,545 | 40,990 |
| Class C (c)(d) | | 2,783 | 470 |
| The Boeing Co. | | 385,039 | 137,189 |
| United Technologies Corp. | | 122,663 | 16,650 |
| | | | 443,313 |
| Air Freight & Logistics - 0.3% | | | |
| Expeditors International of Washington, Inc. | | 34,669 | 2,641 |
| XPO Logistics, Inc. (a) | | 651,048 | 64,923 |
| | | | 67,564 |
| Airlines - 0.8% | | | |
| Delta Air Lines, Inc. | | 1,378,326 | 75,009 |
| Southwest Airlines Co. | | 136,900 | 7,962 |
| Spirit Airlines, Inc. (a) | | 1,196,972 | 51,996 |
| United Continental Holdings, Inc. (a) | | 723,995 | 58,209 |
| Wizz Air Holdings PLC (a)(e) | | 248,315 | 11,297 |
| | | | 204,473 |
| Building Products - 0.1% | | | |
| Masco Corp. | | 532,267 | 21,466 |
| Commercial Services & Supplies - 0.1% | | | |
| Copart, Inc. (a) | | 114,715 | 6,583 |
| Evoqua Water Technologies Corp. (a) | | 343,940 | 7,340 |
| HomeServe PLC | | 948,557 | 12,600 |
| Tomra Systems ASA | | 472,100 | 9,758 |
| | | | 36,281 |
| Electrical Equipment - 0.3% | | | |
| AMETEK, Inc. | | 69,769 | 5,428 |
| Fortive Corp. | | 505,480 | 41,490 |
| Melrose Industries PLC | | 973,593 | 2,759 |
| Nidec Corp. | | 48,500 | 7,018 |
| Regal Beloit Corp. | | 368,504 | 31,673 |
| | | | 88,368 |
| Industrial Conglomerates - 0.6% | | | |
| General Electric Co. | | 5,008,609 | 68,267 |
| Honeywell International, Inc. | | 427,030 | 68,175 |
| ITT, Inc. | | 484,270 | 27,444 |
| | | | 163,886 |
| Machinery - 0.6% | | | |
| Aumann AG (e) | | 147,037 | 10,265 |
| Deere & Co. | | 465,847 | 67,450 |
| Eicher Motors Ltd. | | 14,288 | 5,802 |
| Minebea Mitsumi, Inc. | | 104,600 | 1,877 |
| Rational AG | | 15,141 | 10,375 |
| SMC Corp. | | 5,100 | 1,710 |
| WABCO Holdings, Inc. (a) | | 151,353 | 19,022 |
| Xylem, Inc. | | 438,923 | 33,604 |
| | | | 150,105 |
| Professional Services - 0.1% | | | |
| CoStar Group, Inc. (a) | | 6,300 | 2,620 |
| Equifax, Inc. | | 42,400 | 5,321 |
| IHS Markit Ltd. (a) | | 479,739 | 25,441 |
| Recruit Holdings Co. Ltd. | | 93,000 | 2,548 |
| | | | 35,930 |
| Road & Rail - 0.2% | | | |
| J.B. Hunt Transport Services, Inc. | | 196,575 | 23,569 |
| Knight-Swift Transportation Holdings, Inc. Class A | | 1,077,143 | 35,061 |
| | | | 58,630 |
| Trading Companies & Distributors - 0.1% | | | |
| HD Supply Holdings, Inc. (a) | | 302,100 | 13,286 |
| Wolseley PLC | | 29,978 | 2,365 |
| | | | 15,651 |
| Transportation Infrastructure - 0.0% | | | |
| Adani Ports & Special Economic Zone Ltd. | | 357,936 | 2,090 |
|
| TOTAL INDUSTRIALS | | | 1,287,757 |
|
| INFORMATION TECHNOLOGY - 44.0% | | | |
| Communications Equipment - 0.3% | | | |
| Arista Networks, Inc. (a) | | 146,992 | 37,590 |
| Lumentum Holdings, Inc. (a) | | 50,000 | 2,613 |
| NETGEAR, Inc. (a) | | 700,664 | 46,139 |
| | | | 86,342 |
| Electronic Equipment & Components - 0.2% | | | |
| Corning, Inc. | | 356,600 | 11,832 |
| Dell Technologies, Inc. (a) | | 301,079 | 27,856 |
| II-VI, Inc. (a) | | 119,400 | 4,680 |
| Jabil, Inc. | | 93,000 | 2,620 |
| | | | 46,988 |
| Internet Software & Services - 14.7% | | | |
| 2U, Inc. (a) | | 216,591 | 16,387 |
| Akamai Technologies, Inc. (a) | | 582,969 | 43,874 |
| Alibaba Group Holding Ltd. sponsored ADR (a) | | 1,205,688 | 225,741 |
| Alphabet, Inc.: | | | |
| Class A (a) | | 1,520,167 | 1,865,579 |
| Class C (a) | | 122,783 | 149,459 |
| ANGI Homeservices, Inc. Class A (a) | | 1,231,698 | 19,350 |
| Carbonite, Inc. (a) | | 71,500 | 2,452 |
| CarGurus, Inc. Class A (b) | | 573,035 | 24,841 |
| DocuSign, Inc. (b) | | 68,837 | 3,710 |
| Dropbox, Inc.: | | | |
| Class A (a)(b) | | 117,872 | 3,155 |
| Class B | | 669,209 | 17,019 |
| Facebook, Inc. Class A (a) | | 5,992,007 | 1,034,101 |
| GMO Internet, Inc. | | 445,000 | 9,436 |
| GoDaddy, Inc. (a) | | 471,862 | 34,738 |
| GrubHub, Inc. (a) | | 62,599 | 7,630 |
| HUYA, Inc. ADR (b) | | 258,565 | 8,326 |
| IAC/InterActiveCorp (a) | | 109,831 | 16,173 |
| Mercari, Inc. (a) | | 55,900 | 2,355 |
| Mimecast Ltd. (a) | | 63,980 | 2,298 |
| Momo, Inc. ADR (a) | | 425,151 | 17,440 |
| NetEase, Inc. ADR | | 112,900 | 29,128 |
| New Relic, Inc. (a) | | 86,260 | 8,428 |
| Nutanix, Inc. Class B (a)(e) | | 482,746 | 23,601 |
| Okta, Inc. (a) | | 94,752 | 4,704 |
| Pandora Media, Inc. (a) | | 328,801 | 2,216 |
| Shopify, Inc. Class A (a) | | 287,501 | 40,051 |
| Stamps.com, Inc. (a) | | 121,551 | 31,725 |
| Tencent Holdings Ltd. | | 3,197,200 | 145,519 |
| The Trade Desk, Inc. (a) | | 241,986 | 20,404 |
| Twilio, Inc. Class A (a) | | 107,121 | 6,201 |
| Twitter, Inc. (a) | | 119,600 | 3,812 |
| Wix.com Ltd. (a) | | 342,616 | 32,549 |
| Yandex NV Series A (a) | | 492,425 | 17,708 |
| YY, Inc. ADR (a) | | 150,200 | 14,003 |
| | | | 3,884,113 |
| IT Services - 4.9% | | | |
| Adyen BV (e) | | 41,069 | 26,240 |
| Alliance Data Systems Corp. | | 103,767 | 23,335 |
| Endava PLC ADR (a) | | 89,900 | 2,150 |
| FleetCor Technologies, Inc. (a) | | 107,058 | 23,232 |
| MasterCard, Inc. Class A | | 1,927,294 | 381,604 |
| Netcompany Group A/S | | 95,000 | 3,456 |
| PayPal Holdings, Inc. (a) | | 2,724,026 | 223,751 |
| Square, Inc. (a) | | 298,816 | 19,318 |
| Total System Services, Inc. | | 60,100 | 5,502 |
| Visa, Inc. Class A | | 3,938,093 | 538,495 |
| Wirecard AG | | 18,485 | 3,453 |
| Worldpay, Inc. (a) | | 489,737 | 40,251 |
| | | | 1,290,787 |
| Semiconductors & Semiconductor Equipment - 7.3% | | | |
| Acacia Communications, Inc. (a) | | 154,500 | 4,966 |
| Advanced Micro Devices, Inc. (a) | | 2,180,186 | 39,963 |
| Analog Devices, Inc. | | 321,339 | 30,894 |
| ASML Holding NV | | 37,300 | 7,982 |
| Broadcom, Inc. | | 2,271,429 | 503,735 |
| Inphi Corp. (a)(b) | | 682,618 | 21,462 |
| Intel Corp. | | 1,354,163 | 65,135 |
| Marvell Technology Group Ltd. | | 5,289,776 | 112,725 |
| Micron Technology, Inc. (a) | | 3,603,072 | 190,206 |
| Monolithic Power Systems, Inc. | | 172,510 | 22,889 |
| NVIDIA Corp. | | 3,101,549 | 759,445 |
| NXP Semiconductors NV (a) | | 368,677 | 35,150 |
| Qualcomm, Inc. | | 1,425,301 | 91,348 |
| Renesas Electronics Corp. (a) | | 3,820,800 | 34,034 |
| | | | 1,919,934 |
| Software - 10.4% | | | |
| Activision Blizzard, Inc. | | 4,866,428 | 357,293 |
| Adobe Systems, Inc. (a) | | 1,043,615 | 255,352 |
| Altair Engineering, Inc. Class A (a) | | 90,786 | 3,187 |
| Atom Tickets LLC (a)(c)(d)(f) | | 1,204,239 | 7,000 |
| Avalara, Inc. | | 35,032 | 1,343 |
| Black Knight, Inc. (a) | | 48,634 | 2,512 |
| Electronic Arts, Inc. (a) | | 903,415 | 116,315 |
| HubSpot, Inc. (a) | | 48,321 | 5,997 |
| Intuit, Inc. | | 218,169 | 44,559 |
| Microsoft Corp. | | 8,102,557 | 859,519 |
| Nintendo Co. Ltd. | | 89,300 | 30,200 |
| Paycom Software, Inc. (a)(b) | | 449,075 | 47,714 |
| Pluralsight, Inc. | | 269,355 | 6,252 |
| Proofpoint, Inc. (a) | | 161,672 | 18,439 |
| Red Hat, Inc. (a) | | 808,221 | 114,145 |
| RingCentral, Inc. (a) | | 198,275 | 14,623 |
| SailPoint Technologies Holding, Inc. (a) | | 288,298 | 6,945 |
| Salesforce.com, Inc. (a) | | 5,029,618 | 689,812 |
| SendGrid, Inc. (a) | | 403,600 | 10,304 |
| Smartsheet, Inc. (b) | | 55,450 | 1,192 |
| Snap, Inc. Class A (a)(b) | | 3,439,373 | 42,992 |
| Splunk, Inc. (a) | | 70,183 | 6,745 |
| Talend SA ADR (a) | | 159,523 | 9,436 |
| Tanium, Inc. Class B (a)(c)(d) | | 554,900 | 3,765 |
| Tenable Holdings, Inc. | | 46,700 | 1,396 |
| Workday, Inc. Class A (a) | | 413,489 | 51,281 |
| Zendesk, Inc. (a) | | 462,489 | 25,192 |
| Zscaler, Inc. (a)(b) | | 204,162 | 7,209 |
| | | | 2,740,719 |
| Technology Hardware, Storage & Peripherals - 6.2% | | | |
| Apple, Inc. | | 8,685,465 | 1,652,757 |
|
| TOTAL INFORMATION TECHNOLOGY | | | 11,621,640 |
|
| MATERIALS - 2.1% | | | |
| Chemicals - 2.1% | | | |
| Cabot Corp. | | 152,805 | 10,100 |
| CF Industries Holdings, Inc. | | 2,694,285 | 119,680 |
| DowDuPont, Inc. | | 849,708 | 58,434 |
| FMC Corp. | | 244,567 | 21,982 |
| LG Chemical Ltd. | | 18,286 | 6,158 |
| LyondellBasell Industries NV Class A | | 1,054,241 | 116,799 |
| Nutrien Ltd. | | 493,156 | 26,784 |
| Orion Engineered Carbons SA | | 255,924 | 8,394 |
| The Chemours Co. LLC | | 2,231,263 | 102,214 |
| The Mosaic Co. | | 906,279 | 27,288 |
| Tronox Ltd. Class A | | 1,325,866 | 24,462 |
| Westlake Chemical Corp. | | 195,437 | 20,955 |
| | | | 543,250 |
| Construction Materials - 0.0% | | | |
| Buzzi Unicem SpA | | 73,708 | 1,625 |
| Loma Negra Compania Industrial Argentina SA ADR (a) | | 343,940 | 3,866 |
| | | | 5,491 |
|
| TOTAL MATERIALS | | | 548,741 |
|
| REAL ESTATE - 0.1% | | | |
| Equity Real Estate Investment Trusts (REITs) - 0.1% | | | |
| Ant International Co. Ltd. (c)(d) | | 4,367,660 | 24,503 |
| Real Estate Management & Development - 0.0% | | | |
| Parsvnath Developers Ltd. (a) | | 16,043,447 | 2,836 |
|
| TOTAL REAL ESTATE | | | 27,339 |
|
| TELECOMMUNICATION SERVICES - 0.1% | | | |
| Wireless Telecommunication Services - 0.1% | | | |
| Boingo Wireless, Inc. (a) | | 244,300 | 5,646 |
| T-Mobile U.S., Inc. (a) | | 540,561 | 32,434 |
| | | | 38,080 |
| UTILITIES - 0.0% | | | |
| Gas Utilities - 0.0% | | | |
| China Resource Gas Group Ltd. | | 730,000 | 3,460 |
| ENN Energy Holdings Ltd. | | 323,000 | 3,286 |
| | | | 6,746 |
| TOTAL COMMON STOCKS | | | |
| (Cost $13,507,381) | | | 25,358,195 |
|
| Preferred Stocks - 3.8% | | | |
| Convertible Preferred Stocks - 3.8% | | | |
| CONSUMER DISCRETIONARY - 0.3% | | | |
| Hotels, Restaurants & Leisure - 0.1% | | | |
| MOD Super Fast Pizza Holdings LLC Series 3 Preferred (a)(c)(d)(f) | | 74,995 | 11,500 |
| Neutron Holdings, Inc. Series C (c)(d) | | 50,654,200 | 9,262 |
| Topgolf International, Inc. Series F (c)(d) | | 415,730 | 6,402 |
| | | | 27,164 |
| Internet & Direct Marketing Retail - 0.1% | | | |
| China Internet Plus Holdings Ltd. Series A-11 (a)(c)(d) | | 3,163,704 | 15,819 |
| The Honest Co., Inc.: | | | |
| Series C (a)(c)(d) | | 350,333 | 6,868 |
| Series D (a)(c)(d) | | 77,448 | 1,518 |
| Series E (c)(d) | | 551,397 | 10,810 |
| | | | 35,015 |
| Leisure Products - 0.1% | | | |
| Peloton Interactive, Inc. Series E (a)(c)(d) | | 335,429 | 19,375 |
| Textiles, Apparel & Luxury Goods - 0.0% | | | |
| Generation Bio Series B (c)(d) | | 460,500 | 4,212 |
| TOTAL CONSUMER DISCRETIONARY | | | 85,766 |
| CONSUMER STAPLES - 1.8% | | | |
| Food & Staples Retailing - 0.1% | | | |
| Roofoods Ltd. Series F (c)(d) | | 41,941 | 17,194 |
| Food Products - 0.0% | | | |
| Agbiome LLC Series C (c)(d) | | 1,091,300 | 6,912 |
| Tobacco - 1.7% | | | |
| JUUL Labs, Inc.: | | | |
| Series C (a)(c)(d) | | 2,613,078 | 437,769 |
| Series D (c)(d) | | 13,822 | 2,316 |
| Series E (c)(d) | | 14,959 | 2,506 |
| | | | 442,591 |
| TOTAL CONSUMER STAPLES | | | 466,697 |
| FINANCIALS - 0.0% | | | |
| Consumer Finance - 0.0% | | | |
| Oportun Finance Corp. Series H (a)(c)(d) | | 3,552,125 | 8,596 |
| HEALTH CARE - 0.2% | | | |
| Biotechnology - 0.1% | | | |
| 23andMe, Inc. Series F (c)(d) | | 800,982 | 13,897 |
| Axcella Health, Inc. Series C (a)(c)(d) | | 545,634 | 7,050 |
| Immunocore Ltd. Series A (a)(c)(d) | | 11,275 | 1,500 |
| | | | 22,447 |
| Health Care Providers & Services - 0.1% | | | |
| Mulberry Health, Inc. Series A8 (a)(c)(d) | | 2,728,716 | 19,469 |
| TOTAL HEALTH CARE | | | 41,916 |
| INDUSTRIALS - 0.1% | | | |
| Aerospace & Defense - 0.1% | | | |
| Space Exploration Technologies Corp.: | | | |
| Series G (a)(c)(d) | | 97,277 | 16,440 |
| Series H (c)(d) | | 25,767 | 4,355 |
| | | | 20,795 |
| Professional Services - 0.0% | | | |
| YourPeople, Inc. Series C (a)(c)(d) | | 692,196 | 3,579 |
| TOTAL INDUSTRIALS | | | 24,374 |
| INFORMATION TECHNOLOGY - 1.4% | | | |
| Internet Software & Services - 1.2% | | | |
| ContextLogic, Inc. Series G (c)(d) | | 133,922 | 21,646 |
| Jet.Com, Inc. Series B1 (Escrow) (a)(c)(d) | | 2,928,086 | 133 |
| Lyft, Inc.: | | | |
| Series H (c)(d) | | 719,567 | 34,074 |
| Series I (c)(d) | | 547,120 | 25,908 |
| Reddit, Inc. Series B (c)(d) | | 524,232 | 17,798 |
| Starry, Inc. Series C (c)(d) | | 5,833,836 | 5,379 |
| Uber Technologies, Inc.: | | | |
| Series D, 8.00% (a)(c)(d) | | 5,107,956 | 204,318 |
| Series E, 8.00% (a)(c)(d) | | 101,698 | 4,068 |
| | | | 313,324 |
| IT Services - 0.0% | | | |
| AppNexus, Inc. Series E (Escrow) (a)(c)(d) | | 646,522 | 12,995 |
| Software - 0.2% | | | |
| Bracket Computing, Inc. Series C (a)(c)(d) | | 1,207,761 | 2,162 |
| Cloudflare, Inc. Series D, 8.00% (a)(c)(d) | | 696,025 | 6,939 |
| Compass, Inc. Series E (c)(d) | | 53,263 | 3,594 |
| Dataminr, Inc. Series D (a)(c)(d) | | 277,250 | 5,517 |
| Delphix Corp. Series D (a)(c)(d) | | 675,445 | 4,917 |
| Malwarebytes Corp. Series B (a)(c)(d) | | 1,056,193 | 17,153 |
| Taboola.Com Ltd. Series E (a)(c)(d) | | 634,902 | 11,066 |
| | | | 51,348 |
| TOTAL INFORMATION TECHNOLOGY | | | 377,667 |
|
| TOTAL CONVERTIBLE PREFERRED STOCKS | | | 1,005,016 |
|
| Nonconvertible Preferred Stocks - 0.0% | | | |
| CONSUMER STAPLES - 0.0% | | | |
| Tobacco - 0.0% | | | |
| PAX Labs, Inc. Series A (c)(d) | | 2,555,833 | 3,706 |
| TOTAL PREFERRED STOCKS | | | |
| (Cost $408,047) | | | 1,008,722 |
|
| Money Market Funds - 2.3% | | | |
| Fidelity Cash Central Fund, 1.96% (h) | | 4,471,144 | 4,472 |
| Fidelity Securities Lending Cash Central Fund 1.97% (h)(i) | | 602,711,991 | 602,772 |
| TOTAL MONEY MARKET FUNDS | | | |
| (Cost $607,244) | | | 607,244 |
| TOTAL INVESTMENT IN SECURITIES - 102.2% | | | |
| (Cost $14,522,672) | | | 26,974,161 |
| NET OTHER ASSETS (LIABILITIES) - (2.2)% | | | (590,546) |
| NET ASSETS - 100% | | | $26,383,615 |
Legend
(a) Non-income producing
(b) Security or a portion of the security is on loan at period end.
(c) Restricted securities - Investment in securities not registered under the Securities Act of 1933 (excluding 144A issues). At the end of the period, the value of restricted securities (excluding 144A issues) amounted to $1,159,182,000 or 4.4% of net assets.
(d) Level 3 security
(e) Security exempt from registration under Rule 144A of the Securities Act of 1933. These securities may be resold in transactions exempt from registration, normally to qualified institutional buyers. At the end of the period, the value of these securities amounted to $116,732,000 or 0.4% of net assets.
(f) Investment is owned by a wholly-owned subsidiary (Subsidiary) that is treated as a corporation for U.S. tax purposes.
(g) Investment represents common shares and preferred shares.
(h) Affiliated fund that is generally available only to investment companies and other accounts managed by Fidelity Investments. The rate quoted is the annualized seven-day yield of the fund at period end. A complete unaudited listing of the fund's holdings as of its most recent quarter end is available upon request. In addition, each Fidelity Central Fund's financial statements, which are not covered by the Fund's Report of Independent Registered Public Accounting Firm, are available on the SEC's website or upon request.
(i) Investment made with cash collateral received from securities on loan.
Additional information on each restricted holding is as follows:
| Security | Acquisition Date | Acquisition Cost (000s) |
| 23andMe, Inc. Series F | 8/31/17 | $11,121 |
| Agbiome LLC Series C | 6/29/18 | $6,912 |
| Ant International Co. Ltd. | 5/16/18 | $24,503 |
| AppNexus, Inc. Series E | 8/1/14 | $12,951 |
| Atom Tickets LLC | 8/15/17 | $7,000 |
| Axcella Health, Inc. Series C | 1/30/15 | $5,500 |
| Blue Bottle Coffee, Inc. Class C (Escrow) | 10/30/17 | $1,455 |
| Bracket Computing, Inc. Series C | 9/9/15 | $9,500 |
| Castle Creek Pharmaceuticals, LLC Class A-2 unit | 9/29/16 | $9,820 |
| China Internet Plus Holdings Ltd. Series A-11 | 1/26/15 | $10,000 |
| Cibus Global Ltd. Series C | 2/16/18 | $6,396 |
| Cloudflare, Inc. Series D, 8.00% | 11/5/14 - 6/24/15 | $4,349 |
| Compass, Inc. Series E | 11/3/17 | $3,594 |
| ContextLogic, Inc. Series G | 10/24/17 | $18,017 |
| Dataminr, Inc. Series D | 3/6/15 | $3,535 |
| Delphix Corp. Series D | 7/10/15 | $6,079 |
| Generation Bio Series B | 2/21/18 | $4,212 |
| Immunocore Ltd. Series A | 7/27/15 | $2,122 |
| Jet.Com, Inc. Series B1 (Escrow) | 9/19/16 | $- |
| JUUL Labs, Inc. Class A | 12/20/17 - 7/6/18 | $3,621 |
| JUUL Labs, Inc. Series C | 5/22/15 - 7/6/18 | $15,390 |
| JUUL Labs, Inc. Series D | 6/25/18 - 7/6/18 | $1,665 |
| JUUL Labs, Inc. Series E | 12/20/17 - 7/6/18 | $2,561 |
| Lyft, Inc. Series H | 11/22/17 | $28,600 |
| Lyft, Inc. Series I | 6/27/18 | $25,908 |
| Malwarebytes Corp. Series B | 12/21/15 | $10,958 |
| MOD Super Fast Pizza Holdings LLC Series 3 Preferred | 11/3/16 - 12/14/17 | $10,293 |
| Mulberry Health, Inc. Series A8 | 1/20/16 | $18,432 |
| Neutron Holdings, Inc. Series C | 7/3/18 | $9,262 |
| Oportun Finance Corp. Series H | 2/6/15 | $10,114 |
| PAX Labs, Inc. Series A | 5/22/15 | $1,891 |
| Peloton Interactive, Inc. Series E | 3/31/17 | $7,266 |
| Reddit, Inc. Series B | 7/26/17 | $7,442 |
| Roofoods Ltd. Series F | 9/12/17 | $14,829 |
| Space Exploration Technologies Corp. Class A | 10/16/15 - 9/11/17 | $23,515 |
| Space Exploration Technologies Corp. Class C | 9/11/17 | $376 |
| Space Exploration Technologies Corp. Series G | 1/20/15 | $7,535 |
| Space Exploration Technologies Corp. Series H | 8/4/17 | $3,479 |
| Starry, Inc. Series C | 12/8/17 | $5,379 |
| Taboola.Com Ltd. Series E | 12/22/14 | $6,619 |
| Tanium, Inc. Class B | 4/21/17 | $2,755 |
| The Honest Co., Inc. | 8/21/14 | $4,062 |
| The Honest Co., Inc. Series C | 8/21/14 | $9,479 |
| The Honest Co., Inc. Series D | 8/3/15 | $3,544 |
| The Honest Co., Inc. Series E | 9/28/17 | $10,810 |
| Topgolf International, Inc. Series F | 11/10/17 | $5,751 |
| Tory Burch LLC | 5/14/15 | $20,890 |
| Uber Technologies, Inc. Series D, 8.00% | 6/6/14 | $79,240 |
| Uber Technologies, Inc. Series E, 8.00% | 12/5/14 | $3,388 |
| WME Entertainment Parent, LLC Class A | 4/13/16 - 8/16/16 | $19,025 |
| YourPeople, Inc. Series C | 5/1/15 | $10,314 |
Affiliated Central Funds
Information regarding fiscal year to date income earned by the Fund from investments in Fidelity Central Funds is as follows:
| Fund | Income earned |
| | (Amounts in thousands) |
| Fidelity Cash Central Fund | $264 |
| Fidelity Securities Lending Cash Central Fund | 7,875 |
| Total | $8,139 |
Amounts in the income column in the above table include any capital gain distributions from underlying funds, which are presented in the corresponding line-item in the Statement of Operations if applicable.
Other Affiliated Issuers
An affiliated company is a company in which the Fund has ownership of at least 5% of the voting securities. Fiscal year to date transactions with companies which are or were affiliates are as follows:
| Affiliate (Amounts in thousands) | Value, beginning of period | Purchases | Sales Proceeds(a) | Dividend Income | Realized Gain (loss) | Change in Unrealized appreciation (depreciation) | Value, end of period |
| RH | $82,844 | $-- | $28,912 | $-- | $1,361 | $49,635 | $-- |
| Total | $82,844 | $-- | $28,912 | $-- | $1,361 | $49,635 | $-- |
(a) Includes the value of securities delivered through in-kind transactions, if applicable.
Investment Valuation
The following is a summary of the inputs used, as of July 31, 2018, involving the Fund's assets and liabilities carried at fair value. The inputs or methodology used for valuing securities may not be an indication of the risk associated with investing in those securities. For more information on valuation inputs, and their aggregation into the levels used below, please refer to the Investment Valuation section in the accompanying Notes to Financial Statements.
| | Valuation Inputs at Reporting Date: |
| Description | Total | Level 1 | Level 2 | Level 3 |
| (Amounts in thousands) | | | | |
| Investments in Securities: | | | | |
| Equities: | | | | |
| Consumer Discretionary | $6,865,105 | $6,676,090 | $49,703 | $139,312 |
| Consumer Staples | 1,201,768 | 719,696 | 5,548 | 476,524 |
| Energy | 653,564 | 653,564 | -- | -- |
| Financials | 1,112,479 | 1,103,855 | 28 | 8,596 |
| Health Care | 2,601,657 | 2,542,225 | 2,340 | 57,092 |
| Industrials | 1,312,131 | 1,241,872 | 4,425 | 65,834 |
| Information Technology | 11,999,307 | 11,418,137 | 192,738 | 388,432 |
| Materials | 548,741 | 548,741 | -- | -- |
| Real Estate | 27,339 | 2,836 | -- | 24,503 |
| Telecommunication Services | 38,080 | 38,080 | -- | -- |
| Utilities | 6,746 | 6,746 | -- | -- |
| Money Market Funds | 607,244 | 607,244 | -- | -- |
| Total Investments in Securities: | $26,974,161 | $25,559,086 | $254,782 | $1,160,293 |
The following is a reconciliation of Investments in Securities for which Level 3 inputs were used in determining value:
| (Amounts in thousands) | |
| Investments in Securities: | |
| Equities - Consumer Staples | |
| Beginning Balance | $18,219 |
| Net Realized Gain (Loss) on Investment Securities | 8,252 |
| Net Unrealized Gain (Loss) on Investment Securities | 440,886 |
| Cost of Purchases | 39,986 |
| Proceeds of Sales | (30,819) |
| Amortization/Accretion | -- |
| Transfers into Level 3 | -- |
| Transfers out of Level 3 | -- |
| Ending Balance | $476,524 |
| The change in unrealized gain (loss) for the period attributable to Level 3 securities held at July 31, 2018 | $428,178 |
| Equities - Information Technology | |
| Beginning Balance | $338,669 |
| Net Realized Gain (Loss) on Investment Securities | 2,075 |
| Net Unrealized Gain (Loss) on Investment Securities | (27,736) |
| Cost of Purchases | 88,515 |
| Proceeds of Sales | (13,091) |
| Amortization/Accretion | -- |
| Transfers into Level 3 | -- |
| Transfers out of Level 3 | -- |
| Ending Balance | $388,432 |
| The change in unrealized gain (loss) for the period attributable to Level 3 securities held at July 31, 2018 | $(23,358) |
| Other Investments in Securities | |
| Beginning Balance | $190,936 |
| Net Realized Gain (Loss) on Investment Securities | (803) |
| Net Unrealized Gain (Loss) on Investment Securities | 31,023 |
| Cost of Purchases | 79,556 |
| Proceeds of Sales | (5,375) |
| Amortization/Accretion | -- |
| Transfers into Level 3 | -- |
| Transfers out of Level 3 | -- |
| Ending Balance | $295,337 |
| The change in unrealized gain (loss) for the period attributable to Level 3 securities held at July 31, 2018 | $31,327 |
The information used in the above reconciliations represents fiscal year to date activity for any Investments in Securities identified as using Level 3 inputs at either the beginning or the end of the current fiscal period and includes securities delivered through in-kind transactions. Transfers in or out of Level 3 represent the beginning value of any Security or Instrument where a change in the pricing level occurred from the beginning to the end of the period. The cost of purchases and the proceeds of sales may include securities received or delivered through corporate actions or exchanges. Realized and unrealized gains (losses) disclosed in the reconciliations are included in Net Gain (Loss) on the Fund's Statement of Operations.
See accompanying notes which are an integral part of the financial statements.
Financial Statements
Statement of Assets and Liabilities
| Amounts in thousands (except per-share amounts) | | July 31, 2018 |
| Assets | | |
Investment in securities, at value (including securities loaned of $602,176) — See accompanying schedule:
Unaffiliated issuers (cost $13,915,428) | $26,366,917 | |
| Fidelity Central Funds (cost $607,244) | 607,244 | |
| Total Investment in Securities (cost $14,522,672) | | $26,974,161 |
| Restricted cash | | 287 |
| Foreign currency held at value (cost $5,533) | | 5,533 |
| Receivable for investments sold | | 127,279 |
| Receivable for fund shares sold | | 19,618 |
| Dividends receivable | | 5,732 |
| Distributions receivable from Fidelity Central Funds | | 863 |
| Prepaid expenses | | 67 |
| Other receivables | | 1,521 |
| Total assets | | 27,135,061 |
| Liabilities | | |
| Payable to custodian bank | $10,008 | |
| Payable for investments purchased | 89,077 | |
| Payable for fund shares redeemed | 33,013 | |
| Accrued management fee | 12,469 | |
| Other affiliated payables | 2,800 | |
| Other payables and accrued expenses | 1,351 | |
| Collateral on securities loaned | 602,728 | |
| Total liabilities | | 751,446 |
| Net Assets | | $26,383,615 |
| Net Assets consist of: | | |
| Paid in capital | | $12,943,985 |
| Undistributed net investment income | | 19,407 |
| Accumulated undistributed net realized gain (loss) on investments and foreign currency transactions | | 968,682 |
| Net unrealized appreciation (depreciation) on investments and assets and liabilities in foreign currencies | | 12,451,541 |
| Net Assets | | $26,383,615 |
| Blue Chip Growth: | | |
| Net Asset Value, offering price and redemption price per share ($20,714,286 ÷ 207,653 shares) | | $99.75 |
| Class K: | | |
| Net Asset Value, offering price and redemption price per share ($5,669,329 ÷ 56,738 shares) | | $99.92 |
See accompanying notes which are an integral part of the financial statements.
Statement of Operations
| Amounts in thousands | | Year ended July 31, 2018 |
| Investment Income | | |
| Dividends | | $167,575 |
| Special dividends | | 24,686 |
| Interest | | 674 |
| Income from Fidelity Central Funds | | 8,139 |
| Total income | | 201,074 |
| Expenses | | |
| Management fee | | |
| Basic fee | $129,901 | |
| Performance adjustment | 5,649 | |
| Transfer agent fees | 29,077 | |
| Accounting and security lending fees | 1,945 | |
| Custodian fees and expenses | 451 | |
| Independent trustees' fees and expenses | 84 | |
| Appreciation in deferred trustee compensation account | 1 | |
| Registration fees | 402 | |
| Audit | 226 | |
| Legal | 59 | |
| Interest | 49 | |
| Miscellaneous | 167 | |
| Total expenses before reductions | 168,011 | |
| Expense reductions | (1,178) | |
| Total expenses after reductions | | 166,833 |
| Net investment income (loss) | | 34,241 |
| Realized and Unrealized Gain (Loss) | | |
| Net realized gain (loss) on: | | |
| Investment securities: | | |
| Unaffiliated issuers | 2,450,318 | |
| Fidelity Central Funds | 56 | |
| Other affiliated issuers | 1,361 | |
| Foreign currency transactions | 187 | |
| Total net realized gain (loss) | | 2,451,922 |
| Change in net unrealized appreciation (depreciation) on: | | |
| Investment securities: | | |
| Unaffiliated issuers | 2,781,037 | |
| Fidelity Central Funds | (15) | |
| Other affiliated issuers | 49,635 | |
| Assets and liabilities in foreign currencies | (1) | |
| Total change in net unrealized appreciation (depreciation) | | 2,830,656 |
| Net gain (loss) | | 5,282,578 |
| Net increase (decrease) in net assets resulting from operations | | $5,316,819 |
See accompanying notes which are an integral part of the financial statements.
Statement of Changes in Net Assets
| Amounts in thousands | Year ended July 31, 2018 | Year ended July 31, 2017 |
| Increase (Decrease) in Net Assets | | |
| Operations | | |
| Net investment income (loss) | $34,241 | $36,123 |
| Net realized gain (loss) | 2,451,922 | 1,207,375 |
| Change in net unrealized appreciation (depreciation) | 2,830,656 | 3,208,986 |
| Net increase (decrease) in net assets resulting from operations | 5,316,819 | 4,452,484 |
| Distributions to shareholders from net investment income | (24,826) | (49,380) |
| Distributions to shareholders from net realized gain | (955,924) | (700,248) |
| Total distributions | (980,750) | (749,628) |
| Share transactions - net increase (decrease) | (610,765) | (433,489) |
| Total increase (decrease) in net assets | 3,725,304 | 3,269,367 |
| Net Assets | | |
| Beginning of period | 22,658,311 | 19,388,944 |
| End of period | $26,383,615 | $22,658,311 |
| Other Information | | |
| Undistributed net investment income end of period | $19,407 | $14,169 |
See accompanying notes which are an integral part of the financial statements.
Financial Highlights
Fidelity Blue Chip Growth Fund
| Years ended July 31, | 2018 | 2017 | 2016 | 2015 | 2014 |
| Selected Per–Share Data | | | | | |
| Net asset value, beginning of period | $83.20 | $69.52 | $75.25 | $66.72 | $59.65 |
| Income from Investment Operations | | | | | |
| Net investment income (loss)A | .11B | .11 | .09 | .05 | .15 |
| Net realized and unrealized gain (loss) | 20.20 | 16.30 | (2.16) | 12.56 | 11.63 |
| Total from investment operations | 20.31 | 16.41 | (2.07) | 12.61 | 11.78 |
| Distributions from net investment income | (.08) | (.15) | (.03) | (.09) | (.24) |
| Distributions from net realized gain | (3.68) | (2.58) | (3.63) | (3.99) | (4.47) |
| Total distributions | (3.76) | (2.73) | (3.66) | (4.08) | (4.71) |
| Net asset value, end of period | $99.75 | $83.20 | $69.52 | $75.25 | $66.72 |
| Total ReturnC | 25.21% | 24.48% | (2.59)% | 19.72% | 21.07% |
| Ratios to Average Net AssetsD,E | | | | | |
| Expenses before reductions | .72% | .70% | .82% | .89% | .80% |
| Expenses net of fee waivers, if any | .72% | .70% | .82% | .89% | .80% |
| Expenses net of all reductions | .72% | .69% | .82% | .88% | .80% |
| Net investment income (loss) | .12%B | .15% | .13% | .07% | .23% |
| Supplemental Data | | | | | |
| Net assets, end of period (in millions) | $20,714 | $16,993 | $14,230 | $15,346 | $11,970 |
| Portfolio turnover rateF | 41%G | 43%G | 50%G | 51%G | 57%G |
A Calculated based on average shares outstanding during the period.
B Net investment income per share reflects a large, non-recurring dividend which amounted to $.09 per share. Excluding this non-recurring dividend, the ratio of net investment income (loss) to average net assets would have been .02%.
C Total returns would have been lower if certain expenses had not been reduced during the applicable periods shown.
D Fees and expenses of any underlying Fidelity Central Funds are not included in the Fund's expense ratio. The Fund indirectly bears its proportionate share of the expenses of any underlying Fidelity Central Funds.
E Expense ratios reflect operating expenses of the class. Expenses before reductions do not reflect amounts reimbursed by the investment adviser or reductions from brokerage service arrangements or reductions from other expense offset arrangements and do not represent the amount paid by the class during periods when reimbursements or reductions occur. Expenses net of fee waivers reflect expenses after reimbursement by the investment adviser but prior to reductions from brokerage service arrangements or other expense offset arrangements. Expenses net of all reductions represent the net expenses paid by the class.
F Amount does not include the portfolio activity of any underlying Fidelity Central Funds.
G Portfolio turnover rate excludes securities received or delivered in-kind.
See accompanying notes which are an integral part of the financial statements.
Fidelity Blue Chip Growth Fund Class K
| Years ended July 31, | 2018 | 2017 | 2016 | 2015 | 2014 |
| Selected Per–Share Data | | | | | |
| Net asset value, beginning of period | $83.34 | $69.67 | $75.36 | $66.82 | $59.74 |
| Income from Investment Operations | | | | | |
| Net investment income (loss)A | .20B | .19 | .16 | .13 | .23 |
| Net realized and unrealized gain (loss) | 20.22 | 16.32 | (2.15) | 12.57 | 11.64 |
| Total from investment operations | 20.42 | 16.51 | (1.99) | 12.70 | 11.87 |
| Distributions from net investment income | (.16) | (.27) | (.07) | (.17) | (.33) |
| Distributions from net realized gain | (3.68) | (2.58) | (3.63) | (3.99) | (4.47) |
| Total distributions | (3.84) | (2.84)C | (3.70) | (4.16) | (4.79)D |
| Net asset value, end of period | $99.92 | $83.34 | $69.67 | $75.36 | $66.82 |
| Total ReturnE | 25.33% | 24.63% | (2.47)% | 19.84% | 21.23% |
| Ratios to Average Net AssetsF,G | | | | | |
| Expenses before reductions | .62% | .59% | .70% | .78% | .68% |
| Expenses net of fee waivers, if any | .62% | .59% | .70% | .77% | .68% |
| Expenses net of all reductions | .62% | .58% | .70% | .77% | .67% |
| Net investment income (loss) | .22%B | .26% | .25% | .19% | .36% |
| Supplemental Data | | | | | |
| Net assets, end of period (in millions) | $5,669 | $5,665 | $5,158 | $5,898 | $4,612 |
| Portfolio turnover rateH | 41%I | 43%I | 50%I | 51%I | 57%I |
A Calculated based on average shares outstanding during the period.
B Net investment income per share reflects a large, non-recurring dividend which amounted to $.09 per share. Excluding this non-recurring dividend, the ratio of net investment income (loss) to average net assets would have been .12%.
C Total distributions of $2.84 per share is comprised of distributions from net investment income of $.267 and distributions from net realized gain of $2.576 per share.
D Total distributions of $4.79 per share is comprised of distributions from net investment income of $.325 and distributions from net realized gain of $4.466 per share.
E Total returns would have been lower if certain expenses had not been reduced during the applicable periods shown.
F Fees and expenses of any underlying Fidelity Central Funds are not included in the Fund's expense ratio. The Fund indirectly bears its proportionate share of the expenses of any underlying Fidelity Central Funds.
G Expense ratios reflect operating expenses of the class. Expenses before reductions do not reflect amounts reimbursed by the investment adviser or reductions from brokerage service arrangements or reductions from other expense offset arrangements and do not represent the amount paid by the class during periods when reimbursements or reductions occur. Expenses net of fee waivers reflect expenses after reimbursement by the investment adviser but prior to reductions from brokerage service arrangements or other expense offset arrangements. Expenses net of all reductions represent the net expenses paid by the class.
H Amount does not include the portfolio activity of any underlying Fidelity Central Funds.
I Portfolio turnover rate excludes securities received or delivered in-kind.
See accompanying notes which are an integral part of the financial statements.
Notes to Financial Statements
For the period ended July 31, 2018
(Amounts in thousands except percentages)
1. Organization.
Fidelity Blue Chip Growth Fund (the Fund) is a fund of Fidelity Securities Fund (the Trust) and is authorized to issue an unlimited number of shares. The Trust is registered under the Investment Company Act of 1940, as amended (the 1940 Act), as an open-end management investment company organized as a Massachusetts business trust. The Fund offers Blue Chip Growth and Class K shares, each of which has equal rights as to assets and voting privileges. Each class has exclusive voting rights with respect to matters that affect that class.
2. Investments in Fidelity Central Funds.
The Fund invests in Fidelity Central Funds, which are open-end investment companies generally available only to other investment companies and accounts managed by the investment adviser and its affiliates. The Fund's Schedule of Investments lists each of the Fidelity Central Funds held as of period end, if any, as an investment of the Fund, but does not include the underlying holdings of each Fidelity Central Fund. As an Investing Fund, the Fund indirectly bears its proportionate share of the expenses of the underlying Fidelity Central Funds.
The Money Market Central Funds seek preservation of capital and current income and are managed by Fidelity Investments Money Management, Inc. (FIMM), an affiliate of the investment adviser. Annualized expenses of the Money Market Central Funds as of their most recent shareholder report date are less than .005%.
A complete unaudited list of holdings for each Fidelity Central Fund is available upon request or at the Securities and Exchange Commission (the SEC) website at www.sec.gov. In addition, the financial statements of the Fidelity Central Funds, which are not covered by the Fund's Report of Independent Registered Public Accounting Firm, are available on the SEC website or upon request.
3. Significant Accounting Policies.
The Fund is an investment company and applies the accounting and reporting guidance of the Financial Accounting Standards Board (FASB) Accounting Standards Codification Topic 946 Financial Services – Investments Companies. The financial statements have been prepared in conformity with accounting principles generally accepted in the United States of America (GAAP), which require management to make certain estimates and assumptions at the date of the financial statements. Actual results could differ from those estimates. Subsequent events, if any, through the date that the financial statements were issued have been evaluated in the preparation of the financial statements. The following summarizes the significant accounting policies of the Fund:
Investment Valuation. Investments are valued as of 4:00 p.m. Eastern time on the last calendar day of the period. The Board of Trustees (the Board) has delegated the day to day responsibility for the valuation of the Fund's investments to the Fair Value Committee (the Committee) established by the Fund's investment adviser. In accordance with valuation policies and procedures approved by the Board, the Fund attempts to obtain prices from one or more third party pricing vendors or brokers to value its investments. When current market prices, quotations or currency exchange rates are not readily available or reliable, investments will be fair valued in good faith by the Committee, in accordance with procedures adopted by the Board. Factors used in determining fair value vary by investment type and may include market or investment specific events. The frequency with which these procedures are used cannot be predicted and they may be utilized to a significant extent. The Committee oversees the Fund's valuation policies and procedures and reports to the Board on the Committee's activities and fair value determinations. The Board monitors the appropriateness of the procedures used in valuing the Fund's investments and ratifies the fair value determinations of the Committee.
The Fund categorizes the inputs to valuation techniques used to value its investments into a disclosure hierarchy consisting of three levels as shown below:
- Level 1 – quoted prices in active markets for identical investments
- Level 2 – other significant observable inputs (including quoted prices for similar investments, interest rates, prepayment speeds, etc.)
- Level 3 – unobservable inputs (including the Fund's own assumptions based on the best information available)
Valuation techniques used to value the Fund's investments by major category are as follows:
Equity securities, including restricted securities, for which market quotations are readily available, are valued at the last reported sale price or official closing price as reported by a third party pricing vendor on the primary market or exchange on which they are traded and are categorized as Level 1 in the hierarchy. In the event there were no sales during the day or closing prices are not available, securities are valued at the last quoted bid price or may be valued using the last available price and are generally categorized as Level 2 in the hierarchy. For foreign equity securities, when market or security specific events arise, comparisons to the valuation of American Depositary Receipts (ADRs), futures contracts, Exchange-Traded Funds (ETFs) and certain indexes as well as quoted prices for similar securities may be used and would be categorized as Level 2 in the hierarchy. Utilizing these techniques may result in transfers between Level 1 and Level 2. For equity securities, including restricted securities, where observable inputs are limited, assumptions about market activity and risk are used and these securities may be categorized as Level 3 in the hierarchy. Equity securities, including restricted securities, for which observable inputs are not available are valued using alternate valuation approaches, including the market approach and the income approach and are categorized as Level 3 in the hierarchy. The market approach generally consists of using comparable market transactions while the income approach generally consists of using the net present value of estimated future cash flows, adjusted as appropriate for liquidity, credit, market and/or other risk factors.
Investments in open-end mutual funds, including the Fidelity Central Funds, are valued at their closing net asset value (NAV) each business day and are categorized as Level 1 in the hierarchy.
The following provides information on Level 3 securities held by the Fund that were valued at period end based on unobservable inputs. These amounts exclude valuations provided by a broker.
| Asset Type | Fair Value | Valuation Technique(s) | Unobservable Input | Amount or Range/Weighted Average | Impact to Valuation from an Increase in Input(a) |
| Equities | $1,160,293 | Market comparable | Enterprise value/Sales multiple (EV/S) | 1.2 - 12.2 / 4.9 | Increase |
| | | | Transaction price | $9.15 - $330.00 / $190.32 | Increase |
| | | | Enterprise value/EBITDA multiple (EV/EBITDA) | 12.4 | Increase |
| | | | Enterprise value/Gross profit multiple (EV/GP) | 4.3 | Increase |
| | | | Discount rate | 7.5% - 73.0% / 44.6% | Decrease |
| | | | Price/Earnings multiple (P/E) | 15.1 | Increase |
| | | | Conversion ratio | 3.0 | Increase |
| | | | Discount for lack of marketability | 10.0% - 25.0% / 13.5% | Decrease |
| | | | Premium rate | 7.5% - 76.0% / 35.7% | Increase |
| | | | Proxy premium | 28.2% - 54.5% / 46.2% | Increase |
| | | | Liquidity preference | $14.90 | Increase |
| | | Market approach | Transaction price | $0.18 - $179.25 / $108.93 | Increase |
| | | | Tender price | $143.40 | Increase |
| | | Book value | Book value multiple | 1 | Increase |
| | | | Discount rate | 70.0% | Decrease |
| | | Recovery value | Recovery value | 0.0% - 2.3% / 2.1% | Increase |
(a) Represents the expected directional change in the fair value of the Level 3 investments that would result from an increase in the corresponding input. A decrease to the unobservable input would have the opposite effect. Significant changes in these inputs could result in significantly higher or lower fair value measurements.
Changes in valuation techniques may result in transfers in or out of an assigned level within the disclosure hierarchy. The aggregate value of investments by input level as of July 31, 2018, as well as a roll forward of Level 3 investments, is included at the end of the Fund's Schedule of Investments.
Foreign Currency. The Fund may use foreign currency contracts to facilitate transactions in foreign-denominated securities. Gains and losses from these transactions may arise from changes in the value of the foreign currency or if the counterparties do not perform under the contracts' terms.
Foreign-denominated assets, including investment securities, and liabilities are translated into U.S. dollars at the exchange rates at period end. Purchases and sales of investment securities, income and dividends received and expenses denominated in foreign currencies are translated into U.S. dollars at the exchange rate in effect on the transaction date.
The effects of exchange rate fluctuations on investments are included with the net realized and unrealized gain (loss) on investment securities. Other foreign currency transactions resulting in realized and unrealized gain (loss) are disclosed separately.
Investment Transactions and Income. For financial reporting purposes, the Fund's investment holdings and NAV include trades executed through the end of the last business day of the period. The NAV per share for processing shareholder transactions is calculated as of the close of business of the New York Stock Exchange (NYSE), normally 4:00 p.m. Eastern time and includes trades executed through the end of the prior business day. Gains and losses on securities sold are determined on the basis of identified cost and include proceeds received from litigation. Dividend income is recorded on the ex-dividend date, except for certain dividends from foreign securities where the ex-dividend date may have passed, which are recorded as soon as the Fund is informed of the ex-dividend date. Non-cash dividends included in dividend income, if any, are recorded at the fair market value of the securities received. Income and capital gain distributions from Fidelity Central Funds, if any, are recorded on the ex-dividend date. Certain distributions received by the Fund represent a return of capital or capital gain. The Fund determines the components of these distributions subsequent to the ex-dividend date, based upon receipt of tax filings or other correspondence relating to the underlying investment. These distributions are recorded as a reduction of cost of investments and/or as a realized gain. Large, non-recurring dividends recognized by the Fund are presented separately on the Statement of Operations as "Special Dividends" and the impact of these dividends is presented in the Financial Highlights. Interest income is accrued as earned and includes coupon interest and amortization of premium and accretion of discount on debt securities as applicable. Investment income is recorded net of foreign taxes withheld where recovery of such taxes is uncertain.
Class Allocations and Expenses. Investment income, realized and unrealized capital gains and losses, common expenses of the Fund, and certain fund-level expense reductions, if any, are allocated daily on a pro-rata basis to each class based on the relative net assets of each class to the total net assets of the Fund. Each class differs with respect to transfer agent fees incurred. Certain expense reductions may also differ by class. For the reporting period, the allocated portion of income and expenses to each class as a percent of its average net assets may vary due to the timing of recording these transactions in relation to fluctuating net assets of the classes. Expenses directly attributable to a fund are charged to that fund. Expenses attributable to more than one fund are allocated among the respective funds on the basis of relative net assets or other appropriate methods. Expense estimates are accrued in the period to which they relate and adjustments are made when actual amounts are known.
Deferred Trustee Compensation. Under a Deferred Compensation Plan (the Plan), certain independent Trustees have elected to defer receipt of a portion of their annual compensation. Deferred amounts are invested in a cross-section of Fidelity funds, are marked-to-market and remain in the Fund until distributed in accordance with the Plan. The investment of deferred amounts and the offsetting payable to the Trustees of $1,092 are included in the accompanying Statement of Assets and Liabilities in other receivables and other payables and accrued expenses, respectively.
Income Tax Information and Distributions to Shareholders. Each year, the Fund intends to qualify as a regulated investment company under Subchapter M of the Internal Revenue Code, including distributing substantially all of its taxable income and realized gains. As a result, no provision for U.S. Federal income taxes is required. As of July 31, 2018, the Fund did not have any unrecognized tax benefits in the financial statements; nor is the Fund aware of any tax positions for which it is reasonably possible that the total amounts of unrecognized tax benefits will significantly change in the next twelve months. The Fund files a U.S. federal tax return, in addition to state and local tax returns as required. The Fund's federal income tax returns are subject to examination by the Internal Revenue Service (IRS) for a period of three fiscal years after they are filed. State and local tax returns may be subject to examination for an additional fiscal year depending on the jurisdiction. Foreign taxes are provided for based on the Fund's understanding of the tax rules and rates that exist in the foreign markets in which it invests.
Distributions are declared and recorded on the ex-dividend date. Income and capital gain distributions are declared separately for each class. Income and capital gain distributions are determined in accordance with income tax regulations, which may differ from GAAP. In addition, the Fund claimed a portion of the payment made to redeeming shareholders as a distribution for income tax purposes.
Capital accounts within the financial statements are adjusted for permanent book-tax differences. These adjustments have no impact on net assets or the results of operations. Capital accounts are not adjusted for temporary book-tax differences which will reverse in a subsequent period.
Book-tax differences are primarily due to foreign currency transactions, passive foreign investment companies (PFIC), redemptions in kind, partnerships, deferred trustees compensation and losses deferred due to wash sales.
As of period end, the cost and unrealized appreciation (depreciation) in securities, and derivatives if applicable, for federal income tax purposes were as follows:
| Gross unrealized appreciation | $12,858,733 |
| Gross unrealized depreciation | (437,922) |
| Net unrealized appreciation (depreciation) | $12,420,811 |
| Tax Cost | $14,553,350 |
The tax-based components of distributable earnings as of period end were as follows:
| Undistributed ordinary income | $20,554 |
| Undistributed long-term capital gain | $999,359 |
| Net unrealized appreciation (depreciation) on securities and other investments | $12,420,807 |
The tax character of distributions paid was as follows:
| | July 31, 2018 | July 31, 2017 |
| Ordinary Income | $24,826 | $ 61,835 |
| Long-term Capital Gains | 955,924 | 687,793 |
| Total | $980,750 | $ 749,628 |
Restricted Securities. The Fund may invest in securities that are subject to legal or contractual restrictions on resale. These securities generally may be resold in transactions exempt from registration or to the public if the securities are registered. Disposal of these securities may involve time-consuming negotiations and expense, and prompt sale at an acceptable price may be difficult. Information regarding restricted securities is included at the end of the Fund's Schedule of Investments.
Consolidated Subsidiary. The Fund invests in certain investments through a wholly-owned subsidiary ("Subsidiary"), which may be subject to federal and state taxes upon disposition.
As of period end, the Fund held an investment of $85,782 in these Subsidiaries, representing .33% of the Fund's net assets. The financial statements have been consolidated and include accounts of the Fund and each Subsidiary. Accordingly, all inter-company transactions and balances have been eliminated.
Any cash held by the Subsidiaries is restricted as to its use and is presented as Restricted cash in the Statement of Assets and Liabilities.
4. Purchases and Sales of Investments.
Purchases and sales of securities, other than short-term securities and in-kind transactions, aggregated $9,853,162 and $10,027,597, respectively.
Redemptions In-Kind. During the period, 15,023 shares of the Fund held by unaffiliated entities were redeemed in-kind for investments and cash, with a value of $1,335,342. The net realized gain of $811,963 on investments delivered through the in-kind redemptions is included in the accompanying Statement of Operations. The amount of the redemptions is included in share transactions activity shown in the accompanying Statement of Changes in Net Assets as well as the Notes to Financial Statements. The Fund recognized no gain or loss for federal income tax purposes.
Prior Fiscal Year Redemptions In-Kind. During the prior period, 1,133 shares of the Fund held by an unaffiliated entity were redeemed in-kind for investments and cash with a value of $94,035. The Fund had a net realized gain of $55,844 on investments delivered through in-kind redemptions. The amount of the in-kind redemptions is included in share transactions in the accompanying Statement of Changes in Net Assets as well as the Notes to Financial Statements. The Fund recognized no gain or loss for federal income tax purposes.
5. Fees and Other Transactions with Affiliates.
Management Fee. Fidelity Management & Research Company (the investment adviser) and its affiliates provide the Fund with investment management related services for which the Fund pays a monthly management fee. The management fee is the sum of an individual fund fee rate that is based on an annual rate of .30% of the Fund's average net assets and an annualized group fee rate that averaged .24% during the period. The group fee rate is based upon the average net assets of all the mutual funds advised by the investment adviser, including any mutual funds previously advised by the investment adviser that are currently advised by Fidelity SelectCo, LLC, an affiliate of the investment adviser. The group fee rate decreases as assets under management increase and increases as assets under management decrease. In addition, the management fee is subject to a performance adjustment (up to a maximum of +/- .20% of the Fund's average net assets over a 36 month performance period). The upward or downward adjustment to the management fee is based on the relative investment performance of Blue Chip Growth as compared to its benchmark index, the Russell 1000 Growth Index, over the same 36 month performance period. For the reporting period, the total annual management fee rate, including the performance adjustment, was .56% of the Fund's average net assets. The performance adjustment included in the management fee rate may be higher or lower than the maximum performance adjustment rate due to the difference between the average net assets for the reporting and performance periods.
Transfer Agent Fees. Fidelity Investments Institutional Operations Company, Inc., (FIIOC), an affiliate of the investment adviser, is the transfer, dividend disbursing and shareholder servicing agent for each class of the Fund. FIIOC receives account fees and asset-based fees that vary according to the account size and type of account of the shareholders of Blue Chip Growth, except for Class K. FIIOC receives an asset-based fee of Class K's average net assets. FIIOC pays for typesetting, printing and mailing of shareholder reports, except proxy statements.
For the period, transfer agent fees for each class were as follows:
| | Amount | % of Class-Level Average Net Assets |
| Blue Chip Growth | $26,551 | .14 |
| Class K | 2,526 | .05 |
| | $29,077 | |
Accounting and Security Lending Fees. Fidelity Service Company, Inc. (FSC), an affiliate of the investment adviser, maintains the Fund's accounting records. The accounting fee is based on the level of average net assets for each month. Under a separate contract, FSC administers the security lending program. The security lending fee is based on the number and duration of lending transactions. For the period, the fees were equivalent to an annual rate of .01%.
Brokerage Commissions. The Fund placed a portion of its portfolio transactions with brokerage firms which are affiliates of the investment adviser. Brokerage commissions are included in net realized gain (loss) and change in net unrealized appreciation (depreciation) in the Statement of Operations. The commissions paid to these affiliated firms were $171 for the period.
Interfund Lending Program. Pursuant to an Exemptive Order issued by the SEC, the Fund, along with other registered investment companies having management contracts with Fidelity Management & Research Company (FMR) or other affiliated entities of FMR, may participate in an interfund lending program. This program provides an alternative credit facility allowing the funds to borrow from, or lend money to, other participating affiliated funds. At period end, there were no interfund loans outstanding. The Fund's activity in this program during the period for which loans were outstanding was as follows:
| Borrower or Lender | Average Loan Balance | Weighted Average Interest Rate | Interest Expense |
| Borrower | $19,267 | 1.52% | $49 |
Interfund Trades. The Fund may purchase from or sell securities to other Fidelity Funds under procedures adopted by the Board. The procedures have been designed to ensure these interfund trades are executed in accordance with Rule 17a-7 of the 1940 Act. Interfund trades are included within the respective purchases and sales amounts shown in the Purchases and Sales of Investments note.
Prior Fiscal Year Redemptions In-Kind. During the prior period, 2,142 shares of the Fund held by an affiliated entity were redeemed in-kind for investments and cash with a value of $179,817. The Fund had a net realized gain of $107,301 on investments delivered through in-kind redemptions. The amount of the in-kind redemptions is included in share transactions in the accompanying Statement of Changes in Net Assets as well as the Notes to Financial Statements. The Fund recognized no gain or loss for federal income tax purposes.
6. Committed Line of Credit.
The Fund participates with other funds managed by the investment adviser or an affiliate in a $4.25 billion credit facility (the "line of credit") to be utilized for temporary or emergency purposes to fund shareholder redemptions or for other short-term liquidity purposes. The Fund has agreed to pay commitment fees on its pro-rata portion of the line of credit, which amounted to $66 and is reflected in Miscellaneous expenses on the Statement of Operations. During the period, the Fund did not borrow on this line of credit.
7. Security Lending.
The Fund lends portfolio securities through a lending agent from time to time in order to earn additional income. For equity securities, a lending agent is used and may loan securities to certain qualified borrowers, including Fidelity Capital Markets (FCM), a broker-dealer affiliated with the Fund. On the settlement date of the loan, the Fund receives collateral (in the form of U.S. Treasury obligations, letters of credit and/or cash) against the loaned securities and maintains collateral in an amount not less than 100% of the market value of the loaned securities during the period of the loan. The market value of the loaned securities is determined at the close of business of the Fund and any additional required collateral is delivered to the Fund on the next business day. The Fund or borrower may terminate the loan at any time, and if the borrower defaults on its obligation to return the securities loaned because of insolvency or other reasons, the Fund may apply collateral received from the borrower against the obligation. The Fund may experience delays and costs in recovering the securities loaned. Any cash collateral received is invested in the Fidelity Securities Lending Cash Central Fund. The value of loaned securities and cash collateral at period end are disclosed on the Fund's Statement of Assets and Liabilities. The value of securities loaned to FCM at period end was $2,878. Security lending income represents the income earned on investing cash collateral, less rebates paid to borrowers and any lending agent fees associated with the loan, plus any premium payments received for lending certain types of securities. Security lending income is presented in the Statement of Operations as a component of income from Fidelity Central Funds. Total security lending income during the period amounted to $7,875, including $382 from securities loaned to FCM.
8. Expense Reductions.
Commissions paid to certain brokers with whom the investment adviser, or its affiliates, places trades on behalf of the Fund include an amount in addition to trade execution, which may be rebated back to the Fund to offset certain expenses. This amount totaled $937 for the period. In addition, through arrangements with the Fund's custodian, credits realized as a result of certain uninvested cash balances were used to reduce the Fund's expenses. During the period, these credits reduced the Fund's expenses by $9.
In addition, during the period the investment adviser reimbursed and/or waived a portion of fund-level operating expenses in the amount of $232.
9. Distributions to Shareholders.
Distributions to shareholders of each class were as follows:
| | Year ended
July 31, 2018 | Year ended
July 31, 2017 |
| From net investment income | | |
| Blue Chip Growth | $14,640 | $30,042 |
| Class K | 10,186 | 19,338 |
| Total | $24,826 | $49,380 |
| From net realized gain | | |
| Blue Chip Growth | $722,426 | $514,584 |
| Class K | 233,498 | 185,664 |
| Total | $955,924 | $700,248 |
10. Share Transactions.
Share transactions for each class were as follows and may contain automatic conversions between classes or exchanges between affiliated funds:
| | Shares | Shares | Dollars | Dollars |
| | Year ended July 31, 2018 | Year ended July 31, 2017 | Year ended July 31, 2018 | Year ended July 31, 2017 |
| Blue Chip Growth | | | | |
| Shares sold | 40,439 | 32,630 | $3,709,387 | $2,453,411 |
| Reinvestment of distributions | 8,154 | 7,584 | 698,554 | 519,650 |
| Shares redeemed | (45,177) | (40,666) | (4,036,931) | (2,950,825) |
| Net increase (decrease) | 3,416 | (452) | $371,010 | $22,236 |
| Class K | | | | |
| Shares sold | 14,932 | 13,260 | $1,373,508 | $986,030 |
| Reinvestment of distributions | 2,843 | 2,988 | 243,684 | 205,002 |
| Shares redeemed | (29,012)(a) | (22,314)(b) | (2,598,967)(a) | (1,646,757)(b) |
| Net increase (decrease) | (11,237) | (6,066) | $(981,775) | $(455,725) |
(a) Amount includes in-kind redemptions (see the Redemptions In-Kind note for additional details).
(b) Amount includes in-kind redemptions (see the Prior Fiscal Year Redemptions In-Kind note for additional details).
11. Other.
The Fund's organizational documents provide former and current trustees and officers with a limited indemnification against liabilities arising in connection with the performance of their duties to the Fund. In the normal course of business, the Fund may also enter into contracts that provide general indemnifications. The Fund's maximum exposure under these arrangements is unknown as this would be dependent on future claims that may be made against the Fund. The risk of material loss from such claims is considered remote.
Report of Independent Registered Public Accounting Firm
To the Trustees of Fidelity Securities Fund and Shareholders of Fidelity Blue Chip Growth Fund:
Opinion on the Financial Statements and Financial Highlights
We have audited the accompanying statement of assets and liabilities of Fidelity Blue Chip Growth Fund (the "Fund"), a fund of Fidelity Securities Fund, including the schedule of investments, as of July 31, 2018, and the related statement of operations for the year then ended, the statement of changes in net assets for each of the two years in the period then ended, the financial highlights for each of the five years in the period then ended, and the related notes. In our opinion, the financial statements and financial highlights present fairly, in all material respects, the financial position of the Fund as of July 31, 2018, and the results of its operations for the year then ended, the changes in its net assets for each of the two years in the period then ended, and the financial highlights for each of the five years in the period then ended, in conformity with accounting principles generally accepted in the United States of America.
Basis for Opinion
These financial statements and financial highlights are the responsibility of the Fund's management. Our responsibility is to express an opinion on the Fund's financial statements and financial highlights based on our audits. We are a public accounting firm registered with the Public Company Accounting Oversight Board (United States) (PCAOB) and are required to be independent with respect to the Fund in accordance with the U.S. federal securities laws and the applicable rules and regulations of the Securities and Exchange Commission and the PCAOB.
We conducted our audits in accordance with the standards of the PCAOB. Those standards require that we plan and perform the audit to obtain reasonable assurance about whether the financial statements and financial highlights are free of material misstatement, whether due to error or fraud. The Fund is not required to have, nor were we engaged to perform, an audit of its internal control over financial reporting. As part of our audits we are required to obtain an understanding of internal control over financial reporting but not for the purpose of expressing an opinion on the effectiveness of the Fund’s internal control over financial reporting. Accordingly, we express no such opinion.
Our audits included performing procedures to assess the risks of material misstatement of the financial statements and financial highlights, whether due to error or fraud, and performing procedures that respond to those risks. Such procedures included examining, on a test basis, evidence regarding the amounts and disclosures in the financial statements and financial highlights. Our audits also included evaluating the accounting principles used and significant estimates made by management, as well as evaluating the overall presentation of the financial statements and financial highlights. Our procedures included confirmation of securities owned as of July 31, 2018, by correspondence with the custodians and brokers; when replies were not received from brokers, we performed other auditing procedures. We believe that our audits provide a reasonable basis for our opinion.
/s/ Deloitte & Touche LLP
Boston, Massachusetts
September 17, 2018
We have served as the auditor of one or more of the Fidelity investment companies since 1999.
Trustees and Officers
The Trustees, Members of the Advisory Board (if any), and officers of the trust and fund, as applicable, are listed below. The Board of Trustees governs the fund and is responsible for protecting the interests of shareholders. The Trustees are experienced executives who meet periodically throughout the year to oversee the fund's activities, review contractual arrangements with companies that provide services to the fund, oversee management of the risks associated with such activities and contractual arrangements, and review the fund's performance. Except for Jonathan Chiel, each of the Trustees oversees 286 funds. Mr. Chiel oversees 150 funds.
The Trustees hold office without limit in time except that (a) any Trustee may resign; (b) any Trustee may be removed by written instrument, signed by at least two-thirds of the number of Trustees prior to such removal; (c) any Trustee who requests to be retired or who has become incapacitated by illness or injury may be retired by written instrument signed by a majority of the other Trustees; and (d) any Trustee may be removed at any special meeting of shareholders by a two-thirds vote of the outstanding voting securities of the trust. Each Trustee who is not an interested person (as defined in the 1940 Act) of the trust and the fund is referred to herein as an Independent Trustee. Each Independent Trustee shall retire not later than the last day of the calendar year in which his or her 75th birthday occurs. The Independent Trustees may waive this mandatory retirement age policy with respect to individual Trustees. Officers and Advisory Board Members hold office without limit in time, except that any officer or Advisory Board Member may resign or may be removed by a vote of a majority of the Trustees at any regular meeting or any special meeting of the Trustees. Except as indicated, each individual has held the office shown or other offices in the same company for the past five years.
The fund’s Statement of Additional Information (SAI) includes more information about the Trustees. To request a free copy, call Fidelity at 1-800-835-5092.
Experience, Skills, Attributes, and Qualifications of the Trustees. The Governance and Nominating Committee has adopted a statement of policy that describes the experience, qualifications, attributes, and skills that are necessary and desirable for potential Independent Trustee candidates (Statement of Policy). The Board believes that each Trustee satisfied at the time he or she was initially elected or appointed a Trustee, and continues to satisfy, the standards contemplated by the Statement of Policy. The Governance and Nominating Committee also engages professional search firms to help identify potential Independent Trustee candidates who have the experience, qualifications, attributes, and skills consistent with the Statement of Policy. From time to time, additional criteria based on the composition and skills of the current Independent Trustees, as well as experience or skills that may be appropriate in light of future changes to board composition, business conditions, and regulatory or other developments, have also been considered by the professional search firms and the Governance and Nominating Committee. In addition, the Board takes into account the Trustees' commitment and participation in Board and committee meetings, as well as their leadership of standing and ad hoc committees throughout their tenure.
In determining that a particular Trustee was and continues to be qualified to serve as a Trustee, the Board has considered a variety of criteria, none of which, in isolation, was controlling. The Board believes that, collectively, the Trustees have balanced and diverse experience, qualifications, attributes, and skills, which allow the Board to operate effectively in governing the fund and protecting the interests of shareholders. Information about the specific experience, skills, attributes, and qualifications of each Trustee, which in each case led to the Board's conclusion that the Trustee should serve (or continue to serve) as a trustee of the fund, is provided below.
Board Structure and Oversight Function. James C. Curvey is an interested person and currently serves as Chairman. The Trustees have determined that an interested Chairman is appropriate and benefits shareholders because an interested Chairman has a personal and professional stake in the quality and continuity of services provided to the fund. Independent Trustees exercise their informed business judgment to appoint an individual of their choosing to serve as Chairman, regardless of whether the Trustee happens to be independent or a member of management. The Independent Trustees have determined that they can act independently and effectively without having an Independent Trustee serve as Chairman and that a key structural component for assuring that they are in a position to do so is for the Independent Trustees to constitute a substantial majority for the Board. The Independent Trustees also regularly meet in executive session. Ned C. Lautenbach serves as Chairman of the Independent Trustees and as such (i) acts as a liaison between the Independent Trustees and management with respect to matters important to the Independent Trustees and (ii) with management prepares agendas for Board meetings.
Fidelity® funds are overseen by different Boards of Trustees. The fund's Board oversees Fidelity's high income and certain equity funds, and other Boards oversee Fidelity's investment-grade bond, money market, asset allocation, and other equity funds. The asset allocation funds may invest in Fidelity® funds overseen by the fund's Board. The use of separate Boards, each with its own committee structure, allows the Trustees of each group of Fidelity® funds to focus on the unique issues of the funds they oversee, including common research, investment, and operational issues. On occasion, the separate Boards establish joint committees to address issues of overlapping consequences for the Fidelity® funds overseen by each Board.
The Trustees operate using a system of committees to facilitate the timely and efficient consideration of all matters of importance to the Trustees, the fund, and fund shareholders and to facilitate compliance with legal and regulatory requirements and oversight of the fund's activities and associated risks. The Board, acting through its committees, has charged FMR and its affiliates with (i) identifying events or circumstances the occurrence of which could have demonstrably adverse effects on the fund's business and/or reputation; (ii) implementing processes and controls to lessen the possibility that such events or circumstances occur or to mitigate the effects of such events or circumstances if they do occur; and (iii) creating and maintaining a system designed to evaluate continuously business and market conditions in order to facilitate the identification and implementation processes described in (i) and (ii) above. Because the day-to-day operations and activities of the fund are carried out by or through FMR, its affiliates, and other service providers, the fund's exposure to risks is mitigated but not eliminated by the processes overseen by the Trustees. While each of the Board's committees has responsibility for overseeing different aspects of the fund's activities, oversight is exercised primarily through the Operations, Audit, and Compliance Committees. In addition, the Independent Trustees have worked with Fidelity to enhance the Board's oversight of investment and financial risks, legal and regulatory risks, technology risks, and operational risks, including the development of additional risk reporting to the Board. Appropriate personnel, including but not limited to the fund's Chief Compliance Officer (CCO), FMR's internal auditor, the independent accountants, the fund's Treasurer and portfolio management personnel, make periodic reports to the Board's committees, as appropriate, including an annual review of Fidelity's risk management program for the Fidelity® funds. The responsibilities of each standing committee, including their oversight responsibilities, are described further under "Standing Committees of the Trustees."
Interested Trustees*:
Correspondence intended for a Trustee who is an interested person may be sent to Fidelity Investments, 245 Summer Street, Boston, Massachusetts 02210.
Name, Year of Birth; Principal Occupations and Other Relevant Experience+
Jonathan Chiel (1957)
Year of Election or Appointment: 2016
Trustee
Mr. Chiel also serves as Trustee of other Fidelity® funds. Mr. Chiel is Executive Vice President and General Counsel for FMR LLC (diversified financial services company, 2012-present). Previously, Mr. Chiel served as general counsel (2004-2012) and senior vice president and deputy general counsel (2000-2004) for John Hancock Financial Services; a partner with Choate, Hall & Stewart (1996-2000) (law firm); and an Assistant United States Attorney for the United States Attorney’s Office of the District of Massachusetts (1986-95), including Chief of the Criminal Division (1993-1995). Mr. Chiel is a director on the boards of the Boston Bar Foundation and the Maimonides School.
James C. Curvey (1935)
Year of Election or Appointment: 2007
Trustee
Chairman of the Board of Trustees
Mr. Curvey also serves as Trustee of other Fidelity® funds. Mr. Curvey is Vice Chairman (2007-present) and Director of FMR LLC (diversified financial services company). In addition, Mr. Curvey is an Overseer Emeritus for the Boston Symphony Orchestra, a Director of Artis-Naples, and a Trustee of Brewster Academy in Wolfeboro, New Hampshire. Previously, Mr. Curvey served as a Director of Fidelity Research & Analysis Co. (investment adviser firm, 2009-2018), Director of Fidelity Investments Money Management, Inc. (investment adviser firm, 2009-2014) and a Director of FMR and FMR Co., Inc. (investment adviser firms, 2007-2014).
Charles S. Morrison (1960)
Year of Election or Appointment: 2014
Trustee
Mr. Morrison also serves as Trustee of other funds. He serves as President of Fidelity SelectCo, LLC (investment adviser firm, 2017-present) and Fidelity Management & Research Company (FMR) (investment adviser firm, 2016-present), a Director of Fidelity Investments Money Management, Inc. (FIMM) (investment adviser firm, 2014-present), Director of Fidelity SelectCo, LLC (investment adviser firm, 2014-present), President, Asset Management (2014-present), and is an employee of Fidelity Investments. Previously, Mr. Morrison served as Vice President of Fidelity's Fixed Income and Asset Allocation Funds (2012-2014), President, Fixed Income (2011-2014), Vice President of Fidelity's Money Market Funds (2005-2009), President, Money Market Group Leader of FMR (investment adviser firm, 2009), and Senior Vice President, Money Market Group of FMR (2004-2009). Mr. Morrison also served as Vice President of Fidelity's Bond Funds (2002-2005), certain Balanced Funds (2002-2005), and certain Asset Allocation Funds (2002-2007), and as Senior Vice President (2002-2005) of Fidelity's Bond Division.
* Determined to be an “Interested Trustee” by virtue of, among other things, his or her affiliation with the trust or various entities under common control with FMR.
+ The information includes the Trustee's principal occupation during the last five years and other information relating to the experience, attributes, and skills relevant to the Trustee's qualifications to serve as a Trustee, which led to the conclusion that the Trustee should serve as a Trustee for the fund.
Independent Trustees:
Correspondence intended for an Independent Trustee may be sent to Fidelity Investments, P.O. Box 55235, Boston, Massachusetts 02205-5235.
Name, Year of Birth; Principal Occupations and Other Relevant Experience+
Dennis J. Dirks (1948)
Year of Election or Appointment: 2005
Trustee
Mr. Dirks also serves as Trustee of other Fidelity® funds. Prior to his retirement in May 2003, Mr. Dirks was Chief Operating Officer and a member of the Board of The Depository Trust & Clearing Corporation (DTCC). He also served as President, Chief Operating Officer, and Board member of The Depository Trust Company (DTC) and President and Board member of the National Securities Clearing Corporation (NSCC). In addition, Mr. Dirks served as Chief Executive Officer and Board member of the Government Securities Clearing Corporation, Chief Executive Officer and Board member of the Mortgage-Backed Securities Clearing Corporation, as a Trustee and a member of the Finance Committee of Manhattan College (2005-2008), as a Trustee and a member of the Finance Committee of AHRC of Nassau County (2006-2008), as a member of the Independent Directors Council (IDC) Governing Council (2010-2015), and as a member of the Board of Directors for The Brookville Center for Children’s Services, Inc. (2009-2017). Mr. Dirks is a member of the Finance Committee (2016-present), Board of Directors (2017-present) and Board of Trustees (2018-present) and is Treasurer (2018-present) of the Asolo Repertory Theatre.
Donald F. Donahue (1950)
Year of Election or Appointment: 2018
Trustee
Mr. Donahue also serves as a Trustee of other Fidelity® funds. Mr. Donahue is President and Chief Executive Officer of Miranda Partners, LLC (risk consulting for the financial services industry, 2012-present). Previously, Mr. Donahue served as a Member of the Advisory Board of certain Fidelity® funds (2015-2018) and Chief Executive Officer (2006-2012), Chief Operating Officer (2003-2006), and Managing Director, Customer Marketing and Development (1999-2003) of The Depository Trust & Clearing Corporation (financial markets infrastructure). Mr. Donahue serves as a Member (2007-present) and Co-Chairman (2016-present) of the Board of Directors of United Way of New York, Member of the Board of Directors of NYC Leadership Academy (2012-present) and Member of the Board of Advisors of Ripple Labs, Inc. (financial services, 2015-present). He also served as Chairman (2010-2012) and Member of the Board of Directors (2012-2013) of Omgeo, LLC (financial services), Treasurer of United Way of New York (2012-2016), and Member of the Board of Directors of XBRL US (financial services non-profit, 2009-2012) and the International Securities Services Association (2009-2012).
Alan J. Lacy (1953)
Year of Election or Appointment: 2008
Trustee
Mr. Lacy also serves as Trustee of other Fidelity® funds. Mr. Lacy serves as a Director of Bristol-Myers Squibb Company (global pharmaceuticals, 2008-present). He is a Trustee of the California Chapter of The Nature Conservancy (2015-present) and a Director of the Center for Advanced Study in the Behavioral Sciences at Stanford University (2015-present). In addition, Mr. Lacy served as Senior Adviser (2007-2014) of Oak Hill Capital Partners, L.P. (private equity) and also served as Chief Executive Officer (2005) and Vice Chairman (2005-2006) of Sears Holdings Corporation (retail) and Chief Executive Officer and Chairman of the Board of Sears, Roebuck and Co. (retail, 2000-2005). Previously, Mr. Lacy served as Chairman (2014-2017) and a member (2010-2017) of the Board of Directors of Dave & Buster’s Entertainment, Inc. (restaurant and entertainment complexes), as Chairman (2008-2011) and a member (2006-2015) of the Board of Trustees of the National Parks Conservation Association, and as a member of the Board of Directors for The Hillman Companies, Inc. (hardware wholesalers, 2010-2014), Earth Fare, Inc. (retail grocery, 2010-2014), and The Western Union Company (global money transfer, 2006-2011).
Ned C. Lautenbach (1944)
Year of Election or Appointment: 2000
Trustee
Chairman of the Independent Trustees
Mr. Lautenbach also serves as Trustee of other Fidelity® funds. Mr. Lautenbach currently serves as Vice Chair of the Board of Governors, State University System of Florida (2013-present) and is a member of the Council on Foreign Relations (1994-present). He is also a member and has most recently served as Chairman of the Board of Directors of Artis-Naples (2012-present). Previously, Mr. Lautenbach served as a member and then Lead Director of the Board of Directors of Eaton Corporation (diversified industrial, 1997-2016). He was also a Partner and Advisory Partner at Clayton, Dubilier & Rice, LLC (private equity investment, 1998-2010), as well as a Director of Sony Corporation (2006-2007). In addition, Mr. Lautenbach also had a 30-year career with IBM (technology company) during which time he served as Senior Vice President and a member of the Corporate Executive Committee (1968-1998).
Joseph Mauriello (1944)
Year of Election or Appointment: 2008
Trustee
Mr. Mauriello also serves as Trustee of other Fidelity® funds. Prior to his retirement in January 2006, Mr. Mauriello served in numerous senior management positions including Deputy Chairman and Chief Operating Officer (2004-2005), and Vice Chairman of Financial Services (2002-2004) of KPMG LLP US (professional services, 1965-2005). Mr. Mauriello currently serves as a member of the Board of Directors of XL Group plc. (global insurance and re-insurance, 2006-present) and the Independent Directors Council (IDC) Governing Council (2015-present). Previously, Mr. Mauriello served as a Director of the Hamilton Funds of the Bank of New York (2006-2007) and of Arcadia Resources Inc. (health care services and products, 2007-2012).
Cornelia M. Small (1944)
Year of Election or Appointment: 2005
Trustee
Ms. Small also serves as Trustee of other Fidelity® funds. Ms. Small is a member of the Board of Directors (2009-present) and Chair of the Investment Committee (2010-present) of the Teagle Foundation. Ms. Small also serves on the Investment Committee of the Berkshire Taconic Community Foundation (2008-present). Previously, Ms. Small served as Chairperson (2002-2008) and a member of the Investment Committee and Chairperson (2008-2012) and a member of the Board of Trustees of Smith College. In addition, Ms. Small served as Chief Investment Officer, Director of Global Equity Investments, and a member of the Board of Directors of Scudder, Stevens & Clark and Scudder Kemper Investments.
Garnett A. Smith (1947)
Year of Election or Appointment: 2018
Trustee
Mr. Smith also serves as Trustee of other Fidelity® funds. Prior to Mr. Smith's retirement, he served as Chairman and Chief Executive Officer of Inbrand Corp. (manufacturer of personal absorbent products, 1990-1997). He also served as President (1986-1990) of Inbrand Corp. Prior to his employment with Inbrand Corp., he was employed by a retail fabric chain and North Carolina National Bank. In addition, Mr. Smith served as a Member of the Advisory Board of certain Fidelity® funds (2012-2013) and as a board member of the Jackson Hole Land Trust (2009-2012).
David M. Thomas (1949)
Year of Election or Appointment: 2008
Trustee
Mr. Thomas also serves as Trustee of other Fidelity® funds. Mr. Thomas serves as Non-Executive Chairman of the Board of Directors of Fortune Brands Home and Security (home and security products, 2011-present), as a member of the Board of Directors (2004-present) and Presiding Director (2013-present) of Interpublic Group of Companies, Inc. (marketing communication), and as a member of the Board of Trustees of the University of Florida (2013-present). Previously, Mr. Thomas served as Executive Chairman (2005-2006) and Chairman and Chief Executive Officer (2000-2005) of IMS Health, Inc. (pharmaceutical and healthcare information solutions), and a Director of Fortune Brands, Inc. (consumer products, 2000-2011).
+ The information includes the Trustee's principal occupation during the last five years and other information relating to the experience, attributes, and skills relevant to the Trustee's qualifications to serve as a Trustee, which led to the conclusion that the Trustee should serve as a Trustee for the fund.
Advisory Board Members and Officers:
Correspondence intended for a Member of the Advisory Board (if any) may be sent to Fidelity Investments, P.O. Box 55235, Boston, Massachusetts 02205-5235. Correspondence intended for an officer or Peter S. Lynch may be sent to Fidelity Investments, 245 Summer Street, Boston, Massachusetts 02210. Officers appear below in alphabetical order.
Name, Year of Birth; Principal Occupation
Peter S. Lynch (1944)
Year of Election or Appointment: 2003
Member of the Advisory Board
Mr. Lynch also serves as Member of the Advisory Board of other Fidelity® funds. Mr. Lynch is Vice Chairman and a Director of FMR (investment adviser firm) and FMR Co., Inc. (investment adviser firm). In addition, Mr. Lynch serves as a Trustee of Boston College and as the Chairman of the Inner-City Scholarship Fund. Previously, Mr. Lynch served on the Special Olympics International Board of Directors (1997-2006).
William S. Stavropoulos (1939)
Year of Election or Appointment: 2018
Member of the Advisory Board
Mr. Stavropoulos also serves as Member of the Advisory Board of other Fidelity® funds. Mr. Stavropoulos serves as President and Founder of the Michigan Baseball Foundation, the Great Lakes Loons (2007-present). Mr. Stavropoulos is Chairman Emeritus of the Board of Directors of The Dow Chemical Company, where he previously served in numerous senior management positions, including President, CEO (1995-2000; 2002-2004), Chairman of the Executive Committee (2000-2006), and as a member of the Board of Directors (1990-2006). Currently, Mr. Stavropoulos is Chairman of the Board of Directors of Univar Inc. (global distributor of commodity and specialty chemicals), a Director of Teradata Corporation (data warehousing and technology solutions), and a member of the Advisory Board for Metalmark Capital LLC (private equity investment, 2005-present). Mr. Stavropoulos is an operating advisor to Clayton, Dubilier & Rice, LLC (private equity investment). In addition, Mr. Stavropoulos is a member of the University of Notre Dame Advisory Council for the College of Science, a Trustee of the Rollin L. Gerstacker Foundation, and a Director of Artis-Naples in Naples, Florida. Previously, Mr. Stavropoulos served as Trustee of certain Fidelity® funds (2001-2018) and as a Director of Chemical Financial Corporation (bank holding company, 1993-2012) and Tyco International, Ltd. (multinational manufacturing and services, 2007-2012).
Carol B. Tomé (1957)
Year of Election or Appointment: 2018
Member of the Advisory Board
Ms. Tomé also serves as Member of the Advisory Board of other Fidelity® funds. Ms. Tomé is Chief Financial Officer (2001-present) and Executive Vice President of Corporate Services (2007-present) of The Home Depot, Inc. (home improvement retailer) and a Director (2003-present) and Chair of the Audit Committee (2004-present) of United Parcel Service, Inc. (package delivery and supply chain management). Previously, Ms. Tomé served as Trustee of certain Fidelity® funds (2017), Senior Vice President of Finance and Accounting/Treasurer (2000-2007) and Vice President and Treasurer (1995-2000) of The Home Depot, Inc. and Chair of the Board (2010-2012), Vice Chair of the Board (2009 and 2013), and a Director (2008-2013) of the Federal Reserve Bank of Atlanta. Ms. Tomé is also a director or trustee of many community and professional organizations.
Michael E. Wiley (1950)
Year of Election or Appointment: 2018
Member of the Advisory Board
Mr. Wiley also serves as Trustee or Member of the Advisory Board of other Fidelity® funds. Mr. Wiley serves as a Director of Andeavor Corporation (independent oil refiner and marketer, 2005-present), a Director of Andeavor Logistics LP (natural resources logistics, 2015-present), and a Director of Bill Barrett Corporation (exploration and production, 2005-present). In addition, Mr. Wiley also serves as a Director of Post Oak Bank (privately-held bank, 2004-present). Previously, Mr. Wiley served as a Trustee of other Fidelity® funds (2008-2013), as a Director of Asia Pacific Exploration Consolidated (international oil and gas exploration and production, 2008-2013), as a member of the Board of Trustees of the University of Tulsa (2000-2006; 2007-2010), as a Senior Energy Advisor of Katzenbach Partners, LLC (consulting, 2006-2007), as an Advisory Director of Riverstone Holdings (private investment), Chairman, President, and CEO of Baker Hughes, Inc. (oilfield services, 2000-2004), and as Director of Spinnaker Exploration Company (exploration and production, 2001-2005).
Elizabeth Paige Baumann (1968)
Year of Election or Appointment: 2017
Anti-Money Laundering (AML) Officer
Ms. Baumann also serves as AML Officer of other funds. She is Chief AML Officer (2012-present) and Senior Vice President (2014-present) of FMR LLC (diversified financial services company) and is an employee of Fidelity Investments. Previously, Ms. Baumann served as AML Officer of the funds (2012-2016), and Vice President (2007-2014) and Deputy Anti-Money Laundering Officer (2007-2012) of FMR LLC.
Marc R. Bryant (1966)
Year of Election or Appointment: 2015
Secretary and Chief Legal Officer (CLO)
Mr. Bryant also serves as Secretary and CLO of other funds. Mr. Bryant serves as CLO, Secretary, and Senior Vice President of Fidelity Management & Research Company (investment adviser firm, 2015-present) and FMR Co., Inc. (investment adviser firm, 2015-present); Secretary of Fidelity SelectCo, LLC (investment adviser firm, 2015-present) and Fidelity Investments Money Management, Inc. (investment adviser firm, 2015-present); and CLO of Fidelity Management & Research (Hong Kong) Limited and FMR Investment Management (UK) Limited (investment adviser firms, 2015-present) and Fidelity Management & Research (Japan) Limited (investment adviser firm, 2016-present). He is Senior Vice President and Deputy General Counsel of FMR LLC (diversified financial services company). Previously, Mr. Bryant served as Secretary and CLO of Fidelity Rutland Square Trust II (2010-2014) and Assistant Secretary of Fidelity's Fixed Income and Asset Allocation Funds (2013-2015). Prior to joining Fidelity Investments, Mr. Bryant served as a Senior Vice President and the Head of Global Retail Legal for AllianceBernstein L.P. (2006-2010), and as the General Counsel for ProFund Advisors LLC (2001-2006).
John J. Burke III (1964)
Year of Election or Appointment: 2018
Chief Financial Officer
Mr. Burke also serves as Chief Financial Officer of other funds. Mr. Burke serves as Head of Investment Operations for Fidelity Fund and Investment Operations (2018-present) and is an employee of Fidelity Investments (1998-present). Previously Mr. Burke served as head of Asset Management Investment Operations (2012-2018).
William C. Coffey (1969)
Year of Election or Appointment: 2009
Assistant Secretary
Mr. Coffey also serves as Assistant Secretary of other funds. He is Senior Vice President and Deputy General Counsel of FMR LLC (diversified financial services company, 2010-present), and is an employee of Fidelity Investments. Previously, Mr. Coffey served as Vice President and Associate General Counsel of FMR LLC (2005-2009).
Timothy M. Cohen (1969)
Year of Election or Appointment: 2018
Vice President
Mr. Cohen also serves as Vice President of other funds. Mr. Cohen serves as Co-Head of Global Equity Research (2016-present), a Director of Fidelity Management & Research (Japan) Limited (investment adviser firm, 2016-present), and is an employee of Fidelity Investments. Previously, Mr. Cohen served as Chief Investment Officer - Equity and a Director of Fidelity Management & Research (U.K.) Inc. (investment adviser firm, 2013-2015) and as a Director of Fidelity Management & Research (Hong Kong) Limited (investment adviser firm, 2017).
Jonathan Davis (1968)
Year of Election or Appointment: 2010
Assistant Treasurer
Mr. Davis also serves as Assistant Treasurer of other funds. Mr. Davis serves as Assistant Treasurer of FMR Capital, Inc. (2017-present) and is an employee of Fidelity Investments. Previously, Mr. Davis served as Vice President and Associate General Counsel of FMR LLC (diversified financial services company, 2003-2010).
Adrien E. Deberghes (1967)
Year of Election or Appointment: 2016
Assistant Treasurer
Mr. Deberghes also serves as an officer of other funds. He serves as Assistant Treasurer of FMR Capital, Inc. (2017-present), Executive Vice President of Fidelity Investments Money Management, Inc. (FIMM) (investment adviser firm, 2016-present), and is an employee of Fidelity Investments (2008-present). Previously, Mr. Deberghes served as President and Treasurer of certain Fidelity® funds (2013-2018). Prior to joining Fidelity Investments, Mr. Deberghes was Senior Vice President of Mutual Fund Administration at State Street Corporation (2007-2008), Senior Director of Mutual Fund Administration at Investors Bank & Trust (2005-2007), and Director of Finance for Dunkin' Brands (2000-2005). Previously, Mr. Deberghes served in other fund officer roles.
Laura M. Del Prato (1964)
Year of Election or Appointment: 2018
Assistant Treasurer
Ms. Del Prato also serves as an officer of other funds. Ms. Del Prato is an employee of Fidelity Investments (2017-present). Prior to joining Fidelity Investments, Ms. Del Prato served as a Managing Director and Treasurer of the JPMorgan Mutual Funds (2014-2017). Prior to JPMorgan, Ms. Del Prato served as a partner at Cohen Fund Audit Services (accounting firm, 2012-2013) and KPMG LLP (accounting firm, 2004-2012).
Colm A. Hogan (1973)
Year of Election or Appointment: 2016
Deputy Treasurer
Mr. Hogan also serves as an officer of other funds. Mr. Hogan serves as Assistant Treasurer of FMR Capital, Inc. (2017-present) and is an employee of Fidelity Investments (2005-present). Previously, Mr. Hogan served as Assistant Treasurer of certain Fidelity® funds (2016-2018).
Pamela R. Holding (1964)
Year of Election or Appointment: 2018
Vice President
Ms. Holding also serves as a Vice President of other funds. Ms. Holding serves as Co-Head of Global Equity Research (2018-present) and is an employee of Fidelity Investments (2013-present).
Chris Maher (1972)
Year of Election or Appointment: 2013
Assistant Treasurer
Mr. Maher serves as Assistant Treasurer of other funds. Mr. Maher is Vice President of Valuation Oversight, serves as Assistant Treasurer of FMR Capital, Inc. (2017-present), and is an employee of Fidelity Investments. Previously, Mr. Maher served as Vice President of Asset Management Compliance (2013), Vice President of the Program Management Group of FMR (investment adviser firm, 2010-2013), and Vice President of Valuation Oversight (2008-2010).
Rieco E. Mello (1969)
Year of Election or Appointment: 2017
Assistant Treasurer
Mr. Mello also serves as Assistant Treasurer of other funds. Mr. Mello serves as Assistant Treasurer of FMR Capital, Inc. (2017-present) and is an employee of Fidelity Investments (1995-present).
Kenneth B. Robins (1969)
Year of Election or Appointment: 2016
Chief Compliance Officer
Mr. Robins also serves as an officer of other funds. Mr. Robins serves as Compliance Officer of Fidelity Management & Research Company and FMR Co., Inc. (investment adviser firms, 2016-present) and is an employee of Fidelity Investments (2004-present). Previously, Mr. Robins served as Executive Vice President of Fidelity Investments Money Management, Inc. (investment adviser firm, 2013-2016) and served in other fund officer roles.
Stacie M. Smith (1974)
Year of Election or Appointment: 2016
President and Treasurer
Ms. Smith also serves as an officer of other funds. Ms. Smith serves as Assistant Treasurer of FMR Capital, Inc. (2017-present), is an employee of Fidelity Investments (2009-present), and has served in other fund officer roles. Prior to joining Fidelity Investments, Ms. Smith served as Senior Audit Manager of Ernst & Young LLP (accounting firm, 1996-2009). Previously, Ms. Smith served as Assistant Treasurer (2013-2018) and Deputy Treasurer (2013-2016) of certain Fidelity® funds.
Marc L. Spector (1972)
Year of Election or Appointment: 2016
Assistant Treasurer
Mr. Spector also serves as an officer of other funds. Mr. Spector serves as Assistant Treasurer of FMR Capital, Inc. (2017-present) and is an employee of Fidelity Investments (2016-present). Prior to joining Fidelity Investments, Mr. Spector served as Director at the Siegfried Group (accounting firm, 2013-2016), and prior to Siegfried Group as audit senior manager at Deloitte & Touche (accounting firm, 2005-2013).
Renee Stagnone (1975)
Year of Election or Appointment: 2016
Assistant Treasurer
Ms. Stagnone also serves as an officer of other funds. Ms. Stagnone serves as Assistant Treasurer of FMR Capital, Inc. (2017-present) and is an employee of Fidelity Investments (1997-present). Previously, Ms. Stagnone served as Deputy Treasurer of certain Fidelity® funds (2013-2016).
Shareholder Expense Example
As a shareholder of the Fund, you incur two types of costs: (1) transaction costs and (2) ongoing costs, including management fees and other Fund expenses. This Example is intended to help you understand your ongoing costs (in dollars) of investing in the Fund and to compare these costs with the ongoing costs of investing in other mutual funds.
The Example is based on an investment of $1,000 invested at the beginning of the period and held for the entire period (February 1, 2018 to July 31, 2018).
Actual Expenses
The first line of the accompanying table for each class of the Fund provides information about actual account values and actual expenses. You may use the information in this line, together with the amount you invested, to estimate the expenses that you paid over the period. Simply divide your account value by $1,000.00 (for example, an $8,600 account value divided by $1,000.00 = 8.6), then multiply the result by the number in the first line for a class of the Fund under the heading entitled "Expenses Paid During Period" to estimate the expenses you paid on your account during this period. A small balance maintenance fee of $12.00 that is charged once a year may apply for certain accounts with a value of less than $2,000. This fee is not included in the table below. If it was, the estimate of expenses you paid during the period would be higher, and your ending account value lower, by this amount. In addition, the Fund, as a shareholder in the underlying Fidelity Central Funds, will indirectly bear its pro-rata share of the fees and expenses incurred by the underlying Fidelity Central Funds. These fees and expenses are not included in the Fund's annualized expense ratio used to calculate the expense estimate in the table below.
Hypothetical Example for Comparison Purposes
The second line of the accompanying table for each class of the Fund provides information about hypothetical account values and hypothetical expenses based on a Class' actual expense ratio and an assumed rate of return of 5% per year before expenses, which is not the Class' actual return. The hypothetical account values and expenses may not be used to estimate the actual ending account balance or expenses you paid for the period. You may use this information to compare the ongoing costs of investing in the Fund and other funds. To do so, compare this 5% hypothetical example with the 5% hypothetical examples that appear in the shareholder reports of the other funds. A small balance maintenance fee of $12.00 that is charged once a year may apply for certain accounts with a value of less than $2,000. This fee is not included in the table below. If it was, the estimate of expenses you paid during the period would be higher, and your ending account value lower, by this amount. In addition, the Fund, as a shareholder in the underlying Fidelity Central Funds, will indirectly bear its pro-rata share of the fees and expenses incurred by the underlying Fidelity Central Funds. These fees and expenses are not included in the Fund's annualized expense ratio used to calculate the expense estimate in the table below.
Please note that the expenses shown in the table are meant to highlight your ongoing costs only and do not reflect any transaction costs. Therefore, the second line of the table is useful in comparing ongoing costs only, and will not help you determine the relative total costs of owning different funds.
| | Annualized Expense Ratio-A | Beginning
Account Value
February 1, 2018 | Ending
Account Value
July 31, 2018 | Expenses Paid
During Period-B
February 1, 2018
to July 31, 2018 |
| Blue Chip Growth | .73% | | | |
| Actual | | $1,000.00 | $1,046.90 | $3.70 |
| Hypothetical-C | | $1,000.00 | $1,021.17 | $3.66 |
| Class K | .64% | | | |
| Actual | | $1,000.00 | $1,047.50 | $3.25 |
| Hypothetical-C | | $1,000.00 | $1,021.62 | $3.21 |
A Annualized expense ratio reflects expenses net of applicable fee waivers.
B Expenses are equal to each Class' annualized expense ratio, multiplied by the average account value over the period, multiplied by 181/365 (to reflect the one-half year period).
C 5% return per year before expenses
Distributions (Unaudited)
The Board of Trustees of Fidelity Blue Chip Growth Fund voted to pay to shareholders of record at the opening of business on record date, the following distributions per share derived from capital gains realized from sales of portfolio securities, and dividends derived from net investment income:
| | Pay Date | Record Date | Dividends | Capital Gains |
| Fidelity Blue Chip Growth Fund | | | | |
| Blue Chip Growth | 09/17/18 | 09/14/18 | $0.069 | $3.758 |
| Class K | 09/17/18 | 09/14/18 | $0.120 | $3.758 |
|
The fund hereby designates as a capital gain dividend with respect to the taxable year ended July 31 2018, $1,594,041,568, or, if subsequently determined to be different, the net capital gain of such year.
Blue Chip Growth and Class K designate 100% of the dividends distributed during the fiscal year as qualifying for the dividends–received deduction for corporate shareholders.
Blue Chip Growth and Class K designate 100% of dividends distributed during the fiscal year as amounts which may be taken into account as a dividend for purposes of the maximum rate under section 1(h)(11) of the Internal Revenue Code.
The fund will notify shareholders in January 2019 of amounts for use in preparing 2018 income tax returns.
Board Approval of Investment Advisory Contracts
Fidelity Blue Chip Growth Fund
At its July 2018 meeting, the Board of Trustees, including the Independent Trustees (together, the Board), voted to continue the management contract with Fidelity Management & Research Company (FMR) and the sub-advisory agreements (together, the Advisory Contracts) for the fund for six months through January 31, 2019, in connection with the reunification of the Fidelity Equity High Income Funds Board, which oversees the fund, and the Sector Portfolios Board.
The Board considered that the approval of the fund's Advisory Contracts will not result in any changes in (i) the investment process or strategies employed in the management of the fund's assets; (ii) the fees and expenses paid by shareholders; (iii) the nature, extent or quality of services provided under the fund's Advisory Contracts; or (iv) the day-to-day management of the fund or the persons primarily responsible for such management. The Board concluded that the fund's Advisory Contracts are fair and reasonable, and that the fund's Advisory Contracts should be renewed, without modification, through January 31, 2019, with the understanding that the Board will consider the annual renewal for a full one year period in January 2019.
In connection with its consideration of future renewals of the fund's Advisory Contracts, the Board will consider: (i) the nature, extent and quality of services provided to the fund, including shareholder and administrative services and investment performance; (ii) the competitiveness of the management fee and total expenses for the fund; (iii) the costs of the services and profitability, including the revenues earned and the expenses incurred in conducting the business of developing, marketing, distributing, managing, administering, and servicing the fund and its shareholders, to the extent applicable, as well as potential fall-out benefits from Fidelity's non-fund businesses; and (iv) whether there have been economies of scale in respect of the Fidelity funds, whether the Fidelity funds (including the fund) have appropriately benefited from any such economies of scale, and whether there is the potential for realization of any further economies.
Based on its evaluation of all of the conclusions noted above, and after considering all factors it believed relevant, the Board ultimately concluded that the fund's management fee structure is fair and reasonable, and that the continuation of the fund's Advisory Contracts should be approved.
Corporate Headquarters
245 Summer St.
Boston, MA 02210
www.fidelity.com
BCF-K-ANN-0918
1.863113.109
Fidelity® Dividend Growth Fund
Annual Report July 31, 2018 |
|
Contents
To view a fund's proxy voting guidelines and proxy voting record for the 12-month period ended June 30, visit http://www.fidelity.com/proxyvotingresults or visit the Securities and Exchange Commission's (SEC) web site at http://www.sec.gov.
You may also call 1-800-544-8544 to request a free copy of the proxy voting guidelines.
Standard & Poor's, S&P and S&P 500 are registered service marks of The McGraw-Hill Companies, Inc. and have been licensed for use by Fidelity Distributors Corporation.
Other third-party marks appearing herein are the property of their respective owners.
All other marks appearing herein are registered or unregistered trademarks or service marks of FMR LLC or an affiliated company. © 2018 FMR LLC. All rights reserved.
This report and the financial statements contained herein are submitted for the general information of the shareholders of the Fund. This report is not authorized for distribution to prospective investors in the Fund unless preceded or accompanied by an effective prospectus.
A fund files its complete schedule of portfolio holdings with the SEC for the first and third quarters of each fiscal year on Form N-Q. Forms N-Q are available on the SEC’s web site at http://www.sec.gov. A fund's Forms N-Q may be reviewed and copied at the SEC’s Public Reference Room in Washington, DC. Information regarding the operation of the SEC's Public Reference Room may be obtained by calling 1-800-SEC-0330.
For a complete list of a fund's portfolio holdings, view the most recent holdings listing, semiannual report, or annual report on Fidelity's web site at http://www.fidelity.com, http://www.institutional.fidelity.com, or http://www.401k.com, as applicable.
NOT FDIC INSURED •MAY LOSE VALUE •NO BANK GUARANTEE
Neither the Fund nor Fidelity Distributors Corporation is a bank.
Performance: The Bottom Line
Average annual total return reflects the change in the value of an investment, assuming reinvestment of distributions from dividend income and capital gains (the profits earned upon the sale of securities that have grown in value, if any) and assuming a constant rate of performance each year. The hypothetical investment and the average annual total returns do not reflect the deduction of taxes that a shareholder would pay on fund distributions or the redemption of fund shares. During periods of reimbursement by Fidelity, a fund’s total return will be greater than it would be had the reimbursement not occurred. How a fund did yesterday is no guarantee of how it will do tomorrow.
Average Annual Total Returns
| For the periods ended July 31, 2018 | Past 1 year | Past 5 years | Past 10 years |
| Fidelity® Dividend Growth Fund | 13.60% | 10.59% | 9.88% |
$10,000 Over 10 Years
Let's say hypothetically that $10,000 was invested in Fidelity® Dividend Growth Fund, a class of the fund, on July 31, 2008.
The chart shows how the value of your investment would have changed, and also shows how the S&P 500® Index performed over the same period.
See above for additional information regarding the performance of Fidelity® Dividend Growth Fund.

| Period Ending Values |
| $25,648 | Fidelity® Dividend Growth Fund |
| $27,551 | S&P 500® Index |
Management's Discussion of Fund Performance
Market Recap: The U.S. equity bellwether S&P 500
® index gained 16.24% for the 12 months ending July 31, 2018, despite a resurgence in volatility that challenged the multiyear bull market. Stocks maintained their steady growth until a sharp reversal in February, as volatility spiked amid fear that rising inflation and the potential for the economy to overheat would prompt the U.S. Federal Reserve to pick up the pace of interest rate hikes. The index posted its first negative monthly result since October 2016, and then lost further ground in March on fear of a global trade war. The market stabilized in April and turned upward through mid-June, when escalating trade tension between the U.S. and China soured investor sentiment. The resulting uncertainty lingered into July, but strong corporate earnings helped the S&P 500 rise 3.72% that month to cap the period. For the full one-year period, growth handily topped value, while small-caps bested large-caps. By sector, information technology (+28%) led the way, boosted by strong earnings growth from several major index constituents. Consumer discretionary rose roughly 24%, driven by retailers (+49%). Energy (+20%) gained alongside higher oil prices. Laggards were telecommunication services (-2%), consumer staples (0%) and utilities (+3%), defensive groups that struggled amid rising interest rates and a general preference for risk. Real estate (+5%) fared a bit better but still lagged, as did financials, industrials, health care (each up 13%) and materials (+11%).
Comments from Portfolio Manager Gordon Scott: For the fiscal year, the fund’s share classes gained roughly 14%, lagging the benchmark S&P 500
®. Versus the benchmark, stock picking in the consumer discretionary sector – especially in the retailing segment – detracted most. A sizable underweighting in information technology, the benchmark’s top-performing sector, also hurt our relative result, as did my choices in health care. Several of the fund’s largest relative detractors were strong-performing benchmark names we either didn’t own or underweighted, mostly because they did not meet my valuation criteria and did not pay a dividend or otherwise return capital to shareholders. These included two retailing stocks, Amazon.com – the fund’s largest relative detractor by a wide margin – and video-streaming service provider Netflix. Google parent Alphabet also was in this group. Overweighting tobacco stock Altria Group and the shares of integrated drug distributor Cardinal Health also worked against us. I established positions in both of these stocks in August. Conversely, stock selection in consumer staples and materials added value versus the benchmark this period, as did an underweighting in utilities. Cigarette maker Philip Morris International – which I bought in May – was the fund’s top relative contributor. I’ll also mention media and entertainment holding Twenty-First Century Fox and railroad Union Pacific. Twenty-First Century Fox was not held at period end.
The views expressed above reflect those of the portfolio manager(s) only through the end of the period as stated on the cover of this report and do not necessarily represent the views of Fidelity or any other person in the Fidelity organization. Any such views are subject to change at any time based upon market or other conditions and Fidelity disclaims any responsibility to update such views. These views may not be relied on as investment advice and, because investment decisions for a Fidelity fund are based on numerous factors, may not be relied on as an indication of trading intent on behalf of any Fidelity fund.
Note to Shareholders: On January 1, 2018, Gordon Scott became sole Portfolio Manager of the fund, after having served as Co-Manager alongside Ramona Persaud since April 2017.
Investment Summary (Unaudited)
Top Ten Stocks as of July 31, 2018
| | % of fund's net assets |
| Comcast Corp. Class A | 3.9 |
| Exxon Mobil Corp. | 3.7 |
| Apple, Inc. | 3.3 |
| Altria Group, Inc. | 3.2 |
| Berkshire Hathaway, Inc. Class B | 3.0 |
| Chevron Corp. | 2.9 |
| JPMorgan Chase & Co. | 2.6 |
| Verizon Communications, Inc. | 2.3 |
| Bank of America Corp. | 2.1 |
| Wells Fargo & Co. | 2.0 |
| | 29.0 |
Top Five Market Sectors as of July 31, 2018
| | % of fund's net assets |
| Financials | 16.7 |
| Consumer Discretionary | 15.1 |
| Industrials | 14.7 |
| Health Care | 12.5 |
| Information Technology | 12.1 |
Asset Allocation (% of fund's net assets)
| As of July 31, 2018* |
| | Stocks | 96.9% |
| | Short-Term Investments and Net Other Assets (Liabilities) | 3.1% |

* Foreign investments - 5.6%
Schedule of Investments July 31, 2018
Showing Percentage of Net Assets
| Common Stocks - 96.9% | | | |
| | | Shares | Value (000s) |
| CONSUMER DISCRETIONARY - 15.1% | | | |
| Auto Components - 1.9% | | | |
| BorgWarner, Inc. | | 756,400 | $34,810 |
| Delphi Technologies PLC | | 144,366 | 6,521 |
| Gentex Corp. | | 2,165,900 | 50,249 |
| Lear Corp. | | 205,000 | 36,927 |
| Tenneco, Inc. | | 291,500 | 13,438 |
| | | | 141,945 |
| Automobiles - 1.2% | | | |
| General Motors Co. | | 1,816,700 | 68,871 |
| Thor Industries, Inc. | | 167,300 | 15,868 |
| | | | 84,739 |
| Distributors - 0.2% | | | |
| LKQ Corp. (a) | | 418,000 | 14,011 |
| Diversified Consumer Services - 0.5% | | | |
| H&R Block, Inc. | | 1,320,000 | 33,211 |
| Household Durables - 1.3% | | | |
| D.R. Horton, Inc. | | 640,300 | 27,981 |
| Lennar Corp.: | | | |
| Class A | | 704,800 | 36,840 |
| Class B | | 13,702 | 592 |
| NVR, Inc. (a) | | 4,700 | 12,969 |
| Tupperware Brands Corp. | | 416,900 | 15,304 |
| | | | 93,686 |
| Internet & Direct Marketing Retail - 0.4% | | | |
| Liberty Interactive Corp. QVC Group Series A (a) | | 1,434,000 | 30,530 |
| Leisure Products - 0.1% | | | |
| Brunswick Corp. | | 106,700 | 6,861 |
| Media - 8.5% | | | |
| AMC Networks, Inc. Class A (a) | | 317,600 | 19,148 |
| CBS Corp. Class B | | 284,500 | 14,985 |
| Charter Communications, Inc. Class A (a) | | 92,300 | 28,113 |
| Cinemark Holdings, Inc. | | 756,900 | 27,188 |
| Comcast Corp. Class A | | 7,932,392 | 283,819 |
| Discovery Communications, Inc. Class A (a)(b) | | 897,500 | 23,856 |
| GCI Liberty, Inc. (a) | | 571,138 | 27,477 |
| Interpublic Group of Companies, Inc. | | 2,559,400 | 57,714 |
| Liberty Broadband Corp. Class A (a) | | 285,934 | 22,686 |
| Liberty Global PLC Class A (a) | | 1,349,200 | 38,088 |
| Liberty Media Corp.: | | | |
| Liberty Media Class A (a) | | 608,759 | 20,400 |
| Liberty SiriusXM Series A (a) | | 466,000 | 21,967 |
| Omnicom Group, Inc. | | 415,800 | 28,620 |
| Viacom, Inc. Class B (non-vtg.) | | 249,500 | 7,248 |
| | | | 621,309 |
| Multiline Retail - 0.3% | | | |
| Dollar General Corp. | | 218,900 | 21,485 |
| Specialty Retail - 0.3% | | | |
| Gap, Inc. | | 232,900 | 7,027 |
| TJX Companies, Inc. | | 122,300 | 11,895 |
| | | | 18,922 |
| Textiles, Apparel & Luxury Goods - 0.4% | | | |
| Hanesbrands, Inc. | | 1,410,400 | 31,396 |
|
| TOTAL CONSUMER DISCRETIONARY | | | 1,098,095 |
|
| CONSUMER STAPLES - 9.3% | | | |
| Beverages - 0.1% | | | |
| PepsiCo, Inc. | | 48,800 | 5,612 |
| Food & Staples Retailing - 0.6% | | | |
| Walgreens Boots Alliance, Inc. | | 650,000 | 43,953 |
| Food Products - 2.7% | | | |
| ConAgra Foods, Inc. | | 630,400 | 23,142 |
| General Mills, Inc. | | 646,300 | 29,769 |
| Ingredion, Inc. | | 97,300 | 9,856 |
| The Hershey Co. | | 347,400 | 34,118 |
| The J.M. Smucker Co. | | 114,300 | 12,701 |
| The Kraft Heinz Co. | | 1,177,600 | 70,950 |
| Tyson Foods, Inc. Class A | | 221,200 | 12,752 |
| | | | 193,288 |
| Household Products - 2.1% | | | |
| Kimberly-Clark Corp. | | 588,300 | 66,984 |
| Procter & Gamble Co. | | 85,400 | 6,907 |
| Spectrum Brands Holdings, Inc. | | 864,300 | 75,514 |
| | | | 149,405 |
| Personal Products - 0.1% | | | |
| Edgewell Personal Care Co. (a) | | 195,000 | 10,503 |
| Tobacco - 3.7% | | | |
| Altria Group, Inc. | | 4,033,600 | 236,692 |
| British American Tobacco PLC (United Kingdom) | | 215,960 | 11,872 |
| Philip Morris International, Inc. | | 256,300 | 22,119 |
| | | | 270,683 |
|
| TOTAL CONSUMER STAPLES | | | 673,444 |
|
| ENERGY - 8.4% | | | |
| Oil, Gas & Consumable Fuels - 8.4% | | | |
| BP PLC sponsored ADR | | 1,124,200 | 50,690 |
| Chevron Corp. | | 1,652,100 | 208,611 |
| Exxon Mobil Corp. | | 3,292,797 | 268,396 |
| Suncor Energy, Inc. | | 926,300 | 39,007 |
| Total SA sponsored ADR | | 656,271 | 42,822 |
| | | | 609,526 |
| FINANCIALS - 16.7% | | | |
| Banks - 7.8% | | | |
| Bank of America Corp. | | 4,950,417 | 152,869 |
| Citigroup, Inc. | | 906,500 | 65,168 |
| JPMorgan Chase & Co. | | 1,653,435 | 190,062 |
| Signature Bank | | 125,700 | 13,791 |
| Wells Fargo & Co. | | 2,546,593 | 145,894 |
| | | | 567,784 |
| Capital Markets - 0.2% | | | |
| Diamond Hill Investment Group, Inc. | | 34,938 | 6,699 |
| KKR & Co. LP | | 265,000 | 7,256 |
| | | | 13,955 |
| Consumer Finance - 0.7% | | | |
| American Express Co. | | 492,400 | 49,004 |
| Imperial Holdings, Inc. warrants 4/11/19 (a) | | 48,012 | 0 |
| | | | 49,004 |
| Diversified Financial Services - 3.0% | | | |
| Berkshire Hathaway, Inc. Class B (a) | | 1,095,100 | 216,687 |
| Insurance - 5.0% | | | |
| Allstate Corp. | | 500,000 | 47,560 |
| American International Group, Inc. | | 653,700 | 36,091 |
| Chubb Ltd. | | 674,900 | 94,297 |
| MetLife, Inc. | | 1,461,000 | 66,826 |
| The Travelers Companies, Inc. | | 838,100 | 109,070 |
| Torchmark Corp. | | 136,900 | 12,057 |
| | | | 365,901 |
|
| TOTAL FINANCIALS | | | 1,213,331 |
|
| HEALTH CARE - 12.5% | | | |
| Biotechnology - 2.5% | | | |
| Amgen, Inc. | | 584,210 | 114,826 |
| Gilead Sciences, Inc. | | 790,800 | 61,548 |
| United Therapeutics Corp. (a) | | 63,500 | 7,805 |
| | | | 184,179 |
| Health Care Providers & Services - 7.4% | | | |
| AmerisourceBergen Corp. | | 441,900 | 36,161 |
| Anthem, Inc. | | 401,800 | 101,655 |
| Cardinal Health, Inc. | | 896,900 | 44,800 |
| Cigna Corp. | | 258,100 | 46,308 |
| CVS Health Corp. | | 1,329,400 | 86,225 |
| DaVita HealthCare Partners, Inc. (a) | | 354,000 | 24,879 |
| Express Scripts Holding Co. (a) | | 94,000 | 7,469 |
| HCA Holdings, Inc. | | 243,800 | 30,287 |
| McKesson Corp. | | 218,800 | 27,481 |
| Patterson Companies, Inc. (b) | | 934,400 | 22,911 |
| Quest Diagnostics, Inc. | | 406,400 | 43,777 |
| UnitedHealth Group, Inc. | | 112,500 | 28,487 |
| Universal Health Services, Inc. Class B | | 317,300 | 38,742 |
| | | | 539,182 |
| Pharmaceuticals - 2.6% | | | |
| GlaxoSmithKline PLC | | 863,046 | 17,926 |
| Johnson & Johnson | | 446,143 | 59,123 |
| Pfizer, Inc. | | 2,751,900 | 109,883 |
| | | | 186,932 |
|
| TOTAL HEALTH CARE | | | 910,293 |
|
| INDUSTRIALS - 14.7% | | | |
| Aerospace & Defense - 1.0% | | | |
| Rockwell Collins, Inc. | | 48,600 | 6,755 |
| United Technologies Corp. | | 472,900 | 64,191 |
| | | | 70,946 |
| Air Freight & Logistics - 1.4% | | | |
| United Parcel Service, Inc. Class B | | 822,200 | 98,574 |
| Airlines - 1.7% | | | |
| American Airlines Group, Inc. | | 766,300 | 30,300 |
| Delta Air Lines, Inc. | | 1,054,500 | 57,386 |
| Southwest Airlines Co. | | 600,100 | 34,902 |
| | | | 122,588 |
| Building Products - 0.2% | | | |
| Johnson Controls International PLC | | 408,100 | 15,308 |
| Commercial Services & Supplies - 0.7% | | | |
| Deluxe Corp. | | 610,800 | 35,994 |
| Stericycle, Inc. (a) | | 189,411 | 13,232 |
| | | | 49,226 |
| Electrical Equipment - 0.9% | | | |
| Acuity Brands, Inc. | | 265,800 | 36,954 |
| EnerSys | | 132,200 | 10,850 |
| Regal Beloit Corp. | | 215,791 | 18,547 |
| | | | 66,351 |
| Industrial Conglomerates - 1.5% | | | |
| General Electric Co. | | 6,731,400 | 91,749 |
| ITT, Inc. | | 266,000 | 15,074 |
| | | | 106,823 |
| Machinery - 3.5% | | | |
| Allison Transmission Holdings, Inc. | | 376,002 | 17,672 |
| Crane Co. | | 363,500 | 32,922 |
| Cummins, Inc. | | 402,200 | 57,438 |
| Oshkosh Corp. | | 342,100 | 25,743 |
| PACCAR, Inc. | | 1,022,500 | 67,199 |
| Snap-On, Inc. | | 322,700 | 54,727 |
| | | | 255,701 |
| Professional Services - 0.6% | | | |
| Dun & Bradstreet Corp. | | 188,800 | 23,768 |
| Manpower, Inc. | | 245,900 | 22,933 |
| | | | 46,701 |
| Road & Rail - 3.2% | | | |
| Knight-Swift Transportation Holdings, Inc. Class A | | 620,800 | 20,207 |
| Norfolk Southern Corp. | | 464,300 | 78,467 |
| Union Pacific Corp. | | 903,900 | 135,486 |
| | | | 234,160 |
|
| TOTAL INDUSTRIALS | | | 1,066,378 |
|
| INFORMATION TECHNOLOGY - 12.1% | | | |
| Communications Equipment - 1.7% | | | |
| Cisco Systems, Inc. | | 2,142,986 | 90,627 |
| InterDigital, Inc. | | 41,900 | 3,455 |
| Juniper Networks, Inc. | | 1,044,200 | 27,504 |
| | | | 121,586 |
| Electronic Equipment & Components - 0.7% | | | |
| Avnet, Inc. | | 132,500 | 5,810 |
| Dell Technologies, Inc. (a) | | 303,300 | 28,061 |
| Jabil, Inc. | | 212,200 | 5,978 |
| Tech Data Corp. (a) | | 150,800 | 12,578 |
| | | | 52,427 |
| IT Services - 1.4% | | | |
| DXC Technology Co. | | 349,500 | 29,617 |
| IBM Corp. | | 389,100 | 56,392 |
| Perspecta, Inc. | | 145,600 | 3,160 |
| The Western Union Co. | | 568,600 | 11,463 |
| | | | 100,632 |
| Semiconductors & Semiconductor Equipment - 1.5% | | | |
| Analog Devices, Inc. | | 77,000 | 7,403 |
| Applied Materials, Inc. | | 156,700 | 7,620 |
| Intel Corp. | | 981,700 | 47,220 |
| KLA-Tencor Corp. | | 69,200 | 8,125 |
| Qualcomm, Inc. | | 630,983 | 40,440 |
| | | | 110,808 |
| Software - 1.8% | | | |
| Micro Focus International PLC | | 781,200 | 12,747 |
| Oracle Corp. | | 2,494,200 | 118,923 |
| | | | 131,670 |
| Technology Hardware, Storage & Peripherals - 5.0% | | | |
| Apple, Inc. | | 1,273,418 | 242,319 |
| Hewlett Packard Enterprise Co. | | 2,143,000 | 33,088 |
| HP, Inc. | | 2,424,000 | 55,946 |
| NCR Corp. (a) | | 230,200 | 6,427 |
| Xerox Corp. | | 1,027,600 | 26,687 |
| | | | 364,467 |
|
| TOTAL INFORMATION TECHNOLOGY | | | 881,590 |
|
| MATERIALS - 4.3% | | | |
| Chemicals - 3.2% | | | |
| DowDuPont, Inc. | | 1,180,700 | 81,197 |
| Huntsman Corp. | | 779,200 | 26,127 |
| LyondellBasell Industries NV Class A | | 667,500 | 73,952 |
| PPG Industries, Inc. | | 242,600 | 26,846 |
| The Chemours Co. LLC | | 481,000 | 22,035 |
| | | | 230,157 |
| Metals & Mining - 1.1% | | | |
| Freeport-McMoRan, Inc. | | 912,400 | 15,055 |
| Nucor Corp. | | 529,400 | 35,433 |
| Steel Dynamics, Inc. | | 653,700 | 30,783 |
| | | | 81,271 |
|
| TOTAL MATERIALS | | | 311,428 |
|
| TELECOMMUNICATION SERVICES - 2.3% | | | |
| Diversified Telecommunication Services - 2.3% | | | |
| Verizon Communications, Inc. | | 3,191,600 | 164,814 |
| UTILITIES - 1.5% | | | |
| Electric Utilities - 1.1% | | | |
| Exelon Corp. | | 845,900 | 35,951 |
| PPL Corp. | | 1,664,400 | 47,885 |
| | | | 83,836 |
| Independent Power and Renewable Electricity Producers - 0.4% | | | |
| The AES Corp. | | 2,177,700 | 29,094 |
|
| TOTAL UTILITIES | | | 112,930 |
|
| TOTAL COMMON STOCKS | | | |
| (Cost $6,330,341) | | | 7,041,829 |
|
| Money Market Funds - 3.4% | | | |
| Fidelity Cash Central Fund, 1.96% (c) | | 225,439,359 | 225,484 |
| Fidelity Securities Lending Cash Central Fund 1.97% (c)(d) | | 19,770,654 | 19,773 |
| TOTAL MONEY MARKET FUNDS | | | |
| (Cost $245,253) | | | 245,257 |
| TOTAL INVESTMENT IN SECURITIES - 100.3% | | | |
| (Cost $6,575,594) | | | 7,287,086 |
| NET OTHER ASSETS (LIABILITIES) - (0.3)% | | | (20,275) |
| NET ASSETS - 100% | | | $7,266,811 |
Values shown as $0 in the Schedule of Investments may reflect amounts less than $500.
Legend
(a) Non-income producing
(b) Security or a portion of the security is on loan at period end.
(c) Affiliated fund that is generally available only to investment companies and other accounts managed by Fidelity Investments. The rate quoted is the annualized seven-day yield of the fund at period end. A complete unaudited listing of the fund's holdings as of its most recent quarter end is available upon request. In addition, each Fidelity Central Fund's financial statements, which are not covered by the Fund's Report of Independent Registered Public Accounting Firm, are available on the SEC's website or upon request.
(d) Investment made with cash collateral received from securities on loan.
Affiliated Central Funds
Information regarding fiscal year to date income earned by the Fund from investments in Fidelity Central Funds is as follows:
| Fund | Income earned |
| | (Amounts in thousands) |
| Fidelity Cash Central Fund | $4,684 |
| Fidelity Securities Lending Cash Central Fund | 193 |
| Total | $4,877 |
Amounts in the income column in the above table include any capital gain distributions from underlying funds, which are presented in the corresponding line-item in the Statement of Operations if applicable.
Investment Valuation
The following is a summary of the inputs used, as of July 31, 2018, involving the Fund's assets and liabilities carried at fair value. The inputs or methodology used for valuing securities may not be an indication of the risk associated with investing in those securities. For more information on valuation inputs, and their aggregation into the levels used below, please refer to the Investment Valuation section in the accompanying Notes to Financial Statements.
| | Valuation Inputs at Reporting Date: |
| Description | Total | Level 1 | Level 2 | Level 3 |
| (Amounts in thousands) | | | | |
| Investments in Securities: | | | | |
| Equities: | | | | |
| Consumer Discretionary | $1,098,095 | $1,098,095 | $-- | $-- |
| Consumer Staples | 673,444 | 661,572 | 11,872 | -- |
| Energy | 609,526 | 609,526 | -- | -- |
| Financials | 1,213,331 | 1,213,331 | -- | -- |
| Health Care | 910,293 | 892,367 | 17,926 | -- |
| Industrials | 1,066,378 | 1,066,378 | -- | -- |
| Information Technology | 881,590 | 868,843 | 12,747 | -- |
| Materials | 311,428 | 311,428 | -- | -- |
| Telecommunication Services | 164,814 | 164,814 | -- | -- |
| Utilities | 112,930 | 112,930 | -- | -- |
| Money Market Funds | 245,257 | 245,257 | -- | -- |
| Total Investments in Securities: | $7,287,086 | $7,244,541 | $42,545 | $-- |
See accompanying notes which are an integral part of the financial statements.
Financial Statements
Statement of Assets and Liabilities
| Amounts in thousands (except per-share amounts) | | July 31, 2018 |
| Assets | | |
Investment in securities, at value (including securities loaned of $19,633) — See accompanying schedule:
Unaffiliated issuers (cost $6,330,341) | $7,041,829 | |
| Fidelity Central Funds (cost $245,253) | 245,257 | |
| Total Investment in Securities (cost $6,575,594) | | $7,287,086 |
| Cash | | 130 |
| Receivable for investments sold | | 14,606 |
| Receivable for fund shares sold | | 1,607 |
| Dividends receivable | | 5,616 |
| Distributions receivable from Fidelity Central Funds | | 297 |
| Prepaid expenses | | 18 |
| Other receivables | | 2,027 |
| Total assets | | 7,311,387 |
| Liabilities | | |
| Payable for investments purchased | $17,559 | |
| Payable for fund shares redeemed | 3,650 | |
| Accrued management fee | 1,971 | |
| Other affiliated payables | 886 | |
| Other payables and accrued expenses | 738 | |
| Collateral on securities loaned | 19,772 | |
| Total liabilities | | 44,576 |
| Net Assets | | $7,266,811 |
| Net Assets consist of: | | |
| Paid in capital | | $5,489,947 |
| Undistributed net investment income | | 69,283 |
| Accumulated undistributed net realized gain (loss) on investments and foreign currency transactions | | 996,083 |
| Net unrealized appreciation (depreciation) on investments and assets and liabilities in foreign currencies | | 711,498 |
| Net Assets | | $7,266,811 |
| Dividend Growth: | | |
| Net Asset Value, offering price and redemption price per share ($6,054,907 ÷ 179,218.6 shares) | | $33.79 |
| Class K: | | |
| Net Asset Value, offering price and redemption price per share ($1,211,904 ÷ 35,895.8 shares) | | $33.76 |
See accompanying notes which are an integral part of the financial statements.
Statement of Operations
| Amounts in thousands | | Year ended July 31, 2018 |
| Investment Income | | |
| Dividends | | $172,552 |
| Interest | | 1,030 |
| Income from Fidelity Central Funds | | 4,877 |
| Total income | | 178,459 |
| Expenses | | |
| Management fee | | |
| Basic fee | $39,632 | |
| Performance adjustment | (15,217) | |
| Transfer agent fees | 9,666 | |
| Accounting and security lending fees | 1,182 | |
| Custodian fees and expenses | 98 | |
| Independent trustees' fees and expenses | 31 | |
| Registration fees | 61 | |
| Audit | 75 | |
| Legal | 21 | |
| Miscellaneous | 56 | |
| Total expenses before reductions | 35,605 | |
| Expense reductions | (704) | |
| Total expenses after reductions | | 34,901 |
| Net investment income (loss) | | 143,558 |
| Realized and Unrealized Gain (Loss) | | |
| Net realized gain (loss) on: | | |
| Investment securities: | | |
| Unaffiliated issuers | 1,791,216 | |
| Fidelity Central Funds | 31 | |
| Foreign currency transactions | 240 | |
| Total net realized gain (loss) | | 1,791,487 |
| Change in net unrealized appreciation (depreciation) on: | | |
| Investment securities: | | |
| Unaffiliated issuers | (993,673) | |
| Fidelity Central Funds | (31) | |
| Assets and liabilities in foreign currencies | (16) | |
| Total change in net unrealized appreciation (depreciation) | | (993,720) |
| Net gain (loss) | | 797,767 |
| Net increase (decrease) in net assets resulting from operations | | $941,325 |
See accompanying notes which are an integral part of the financial statements.
Statement of Changes in Net Assets
| Amounts in thousands | Year ended July 31, 2018 | Year ended July 31, 2017 |
| Increase (Decrease) in Net Assets | | |
| Operations | | |
| Net investment income (loss) | $143,558 | $120,267 |
| Net realized gain (loss) | 1,791,487 | 505,117 |
| Change in net unrealized appreciation (depreciation) | (993,720) | 287,960 |
| Net increase (decrease) in net assets resulting from operations | 941,325 | 913,344 |
| Distributions to shareholders from net investment income | (127,264) | (120,213) |
| Distributions to shareholders from net realized gain | (1,053,472) | – |
| Total distributions | (1,180,736) | (120,213) |
| Share transactions - net increase (decrease) | 76,969 | (903,170) |
| Total increase (decrease) in net assets | (162,442) | (110,039) |
| Net Assets | | |
| Beginning of period | 7,429,253 | 7,539,292 |
| End of period | $7,266,811 | $7,429,253 |
| Other Information | | |
| Undistributed net investment income end of period | $69,283 | $62,206 |
See accompanying notes which are an integral part of the financial statements.
Financial Highlights
Fidelity Dividend Growth Fund
| Years ended July 31, | 2018 | 2017 | 2016 | 2015 | 2014 |
| Selected Per–Share Data | | | | | |
| Net asset value, beginning of period | $35.06 | $31.51 | $34.46 | $37.27 | $35.33 |
| Income from Investment Operations | | | | | |
| Net investment income (loss)A | .65 | .53 | .48 | .49 | .56 |
| Net realized and unrealized gain (loss) | 3.72 | 3.53 | (.61)B | 2.71 | 4.98 |
| Total from investment operations | 4.37 | 4.06 | (.13) | 3.20 | 5.54 |
| Distributions from net investment income | (.60) | (.51) | (.47) | (.51) | (.37) |
| Distributions from net realized gain | (5.04) | – | (2.36) | (5.49) | (3.23) |
| Total distributions | (5.64) | (.51) | (2.82)C | (6.01)D | (3.60) |
| Net asset value, end of period | $33.79 | $35.06 | $31.51 | $34.46 | $37.27 |
| Total ReturnE | 13.60% | 13.06% | .26%B | 9.54% | 17.30% |
| Ratios to Average Net AssetsF,G | | | | | |
| Expenses before reductions | .50% | .52% | .62% | .69% | .56% |
| Expenses net of fee waivers, if any | .50% | .52% | .61% | .68% | .56% |
| Expenses net of all reductions | .49% | .52% | .61% | .68% | .56% |
| Net investment income (loss) | 1.94% | 1.60% | 1.59% | 1.43% | 1.58% |
| Supplemental Data | | | | | |
| Net assets, end of period (in millions) | $6,055 | $5,952 | $5,849 | $6,474 | $6,481 |
| Portfolio turnover rateH | 115% | 43% | 30% | 64% | 99% |
A Calculated based on average shares outstanding during the period.
B Net realized and unrealized gain (loss) per share reflects proceeds received from litigation which amounted to $.01 per share. Excluding these litigation proceeds, the total return would have been .22%.
C Total distributions of $2.82 per share is comprised of distributions from net investment income of $.465 and distributions from net realized gain of $2.358 per share.
D Total distributions of $6.01 per share is comprised of distributions from net investment income of $.512 and distributions from net realized gain of $5.493 per share.
E Total returns would have been lower if certain expenses had not been reduced during the applicable periods shown.
F Fees and expenses of any underlying Fidelity Central Funds are not included in the Fund's expense ratio. The Fund indirectly bears its proportionate share of the expenses of any underlying Fidelity Central Funds.
G Expense ratios reflect operating expenses of the class. Expenses before reductions do not reflect amounts reimbursed by the investment adviser or reductions from brokerage service arrangements or reductions from other expense offset arrangements and do not represent the amount paid by the class during periods when reimbursements or reductions occur. Expenses net of fee waivers reflect expenses after reimbursement by the investment adviser but prior to reductions from brokerage service arrangements or other expense offset arrangements. Expenses net of all reductions represent the net expenses paid by the class.
H Amount does not include the portfolio activity of any underlying Fidelity Central Funds.
See accompanying notes which are an integral part of the financial statements.
Fidelity Dividend Growth Fund Class K
| Years ended July 31, | 2018 | 2017 | 2016 | 2015 | 2014 |
| Selected Per–Share Data | | | | | |
| Net asset value, beginning of period | $35.04 | $31.50 | $34.45 | $37.27 | $35.34 |
| Income from Investment Operations | | | | | |
| Net investment income (loss)A | .69 | .56 | .52 | .53 | .60 |
| Net realized and unrealized gain (loss) | 3.71 | 3.53 | (.61)B | 2.70 | 4.97 |
| Total from investment operations | 4.40 | 4.09 | (.09) | 3.23 | 5.57 |
| Distributions from net investment income | (.64) | (.55) | (.50) | (.56) | (.42) |
| Distributions from net realized gain | (5.04) | – | (2.36) | (5.49) | (3.23) |
| Total distributions | (5.68) | (.55) | (2.86) | (6.05) | (3.64)C |
| Net asset value, end of period | $33.76 | $35.04 | $31.50 | $34.45 | $37.27 |
| Total ReturnD | 13.70% | 13.16% | .39%B | 9.65% | 17.44% |
| Ratios to Average Net AssetsE,F | | | | | |
| Expenses before reductions | .40% | .41% | .50% | .57% | .44% |
| Expenses net of fee waivers, if any | .40% | .41% | .50% | .57% | .43% |
| Expenses net of all reductions | .39% | .41% | .49% | .57% | .43% |
| Net investment income (loss) | 2.05% | 1.71% | 1.71% | 1.54% | 1.70% |
| Supplemental Data | | | | | |
| Net assets, end of period (in millions) | $1,212 | $1,477 | $1,691 | $1,942 | $2,057 |
| Portfolio turnover rateG | 115% | 43% | 30% | 64% | 99% |
A Calculated based on average shares outstanding during the period.
B Net realized and unrealized gain (loss) per share reflects proceeds received from litigation which amounted to $.01 per share. Excluding these litigation proceeds, the total return would have been .35%.
C Total distributions of $3.64 per share is comprised of distributions from net investment income of $.419 and distributions from net realized gain of $3.225 per share.
D Total returns would have been lower if certain expenses had not been reduced during the applicable periods shown.
E Fees and expenses of any underlying Fidelity Central Funds are not included in the Fund's expense ratio. The Fund indirectly bears its proportionate share of the expenses of any underlying Fidelity Central Funds.
F Expense ratios reflect operating expenses of the class. Expenses before reductions do not reflect amounts reimbursed by the investment adviser or reductions from brokerage service arrangements or reductions from other expense offset arrangements and do not represent the amount paid by the class during periods when reimbursements or reductions occur. Expenses net of fee waivers reflect expenses after reimbursement by the investment adviser but prior to reductions from brokerage service arrangements or other expense offset arrangements. Expenses net of all reductions represent the net expenses paid by the class.
G Amount does not include the portfolio activity of any underlying Fidelity Central Funds.
See accompanying notes which are an integral part of the financial statements.
Notes to Financial Statements
For the period ended July 31, 2018
(Amounts in thousands except percentages)
1. Organization.
Fidelity Dividend Growth Fund (the Fund) is a fund of Fidelity Securities Fund (the Trust) and is authorized to issue an unlimited number of shares. The Trust is registered under the Investment Company Act of 1940, as amended (the 1940 Act), as an open-end management investment company organized as a Massachusetts business trust. The Fund offers Dividend Growth and Class K shares, each of which has equal rights as to assets and voting privileges. Each class has exclusive voting rights with respect to matters that affect that class.
2. Investments in Fidelity Central Funds.
The Fund invests in Fidelity Central Funds, which are open-end investment companies generally available only to other investment companies and accounts managed by the investment adviser and its affiliates. The Fund's Schedule of Investments lists each of the Fidelity Central Funds held as of period end, if any, as an investment of the Fund, but does not include the underlying holdings of each Fidelity Central Fund. As an Investing Fund, the Fund indirectly bears its proportionate share of the expenses of the underlying Fidelity Central Funds.
The Money Market Central Funds seek preservation of capital and current income and are managed by Fidelity Investments Money Management, Inc. (FIMM), an affiliate of the investment adviser. Annualized expenses of the Money Market Central Funds as of their most recent shareholder report date are less than .005%.
A complete unaudited list of holdings for each Fidelity Central Fund is available upon request or at the Securities and Exchange Commission (the SEC) website at www.sec.gov. In addition, the financial statements of the Fidelity Central Funds, which are not covered by the Fund's Report of Independent Registered Public Accounting Firm, are available on the SEC website or upon request.
3. Significant Accounting Policies.
The Fund is an investment company and applies the accounting and reporting guidance of the Financial Accounting Standards Board (FASB) Accounting Standards Codification Topic 946 Financial Services – Investments Companies. The financial statements have been prepared in conformity with accounting principles generally accepted in the United States of America (GAAP), which require management to make certain estimates and assumptions at the date of the financial statements. Actual results could differ from those estimates. Subsequent events, if any, through the date that the financial statements were issued have been evaluated in the preparation of the financial statements. The following summarizes the significant accounting policies of the Fund:
Investment Valuation. Investments are valued as of 4:00 p.m. Eastern time on the last calendar day of the period. The Board of Trustees (the Board) has delegated the day to day responsibility for the valuation of the Fund's investments to the Fair Value Committee (the Committee) established by the Fund's investment adviser. In accordance with valuation policies and procedures approved by the Board, the Fund attempts to obtain prices from one or more third party pricing vendors or brokers to value its investments. When current market prices, quotations or currency exchange rates are not readily available or reliable, investments will be fair valued in good faith by the Committee, in accordance with procedures adopted by the Board. Factors used in determining fair value vary by investment type and may include market or investment specific events. The frequency with which these procedures are used cannot be predicted and they may be utilized to a significant extent. The Committee oversees the Fund's valuation policies and procedures and reports to the Board on the Committee's activities and fair value determinations. The Board monitors the appropriateness of the procedures used in valuing the Fund's investments and ratifies the fair value determinations of the Committee.
The Fund categorizes the inputs to valuation techniques used to value its investments into a disclosure hierarchy consisting of three levels as shown below:
- Level 1 – quoted prices in active markets for identical investments
- Level 2 – other significant observable inputs (including quoted prices for similar investments, interest rates, prepayment speeds, etc.)
- Level 3 – unobservable inputs (including the Fund's own assumptions based on the best information available)
Valuation techniques used to value the Fund's investments by major category are as follows:
Equity securities, including restricted securities, for which market quotations are readily available, are valued at the last reported sale price or official closing price as reported by a third party pricing vendor on the primary market or exchange on which they are traded and are categorized as Level 1 in the hierarchy. In the event there were no sales during the day or closing prices are not available, securities are valued at the last quoted bid price or may be valued using the last available price and are generally categorized as Level 2 in the hierarchy. For foreign equity securities, when market or security specific events arise, comparisons to the valuation of American Depositary Receipts (ADRs), futures contracts, Exchange-Traded Funds (ETFs) and certain indexes as well as quoted prices for similar securities may be used and would be categorized as Level 2 in the hierarchy. Utilizing these techniques may result in transfers between Level 1 and Level 2. For equity securities, including restricted securities, where observable inputs are limited, assumptions about market activity and risk are used and these securities may be categorized as Level 3 in the hierarchy.
Investments in open-end mutual funds, including the Fidelity Central Funds, are valued at their closing net asset value (NAV) each business day and are categorized as Level 1 in the hierarchy.
Changes in valuation techniques may result in transfers in or out of an assigned level within the disclosure hierarchy. The aggregate value of investments by input level as of July 31, 2018 is included at the end of the Fund's Schedule of Investments.
Foreign Currency. The Fund may use foreign currency contracts to facilitate transactions in foreign-denominated securities. Gains and losses from these transactions may arise from changes in the value of the foreign currency or if the counterparties do not perform under the contracts' terms.
Foreign-denominated assets, including investment securities, and liabilities are translated into U.S. dollars at the exchange rates at period end. Purchases and sales of investment securities, income and dividends received and expenses denominated in foreign currencies are translated into U.S. dollars at the exchange rate in effect on the transaction date.
The effects of exchange rate fluctuations on investments are included with the net realized and unrealized gain (loss) on investment securities. Other foreign currency transactions resulting in realized and unrealized gain (loss) are disclosed separately.
Investment Transactions and Income. For financial reporting purposes, the Fund's investment holdings and NAV include trades executed through the end of the last business day of the period. The NAV per share for processing shareholder transactions is calculated as of the close of business of the New York Stock Exchange (NYSE), normally 4:00 p.m. Eastern time and includes trades executed through the end of the prior business day. Gains and losses on securities sold are determined on the basis of identified cost and include proceeds received from litigation. Dividend income is recorded on the ex-dividend date, except for certain dividends from foreign securities where the ex-dividend date may have passed, which are recorded as soon as the Fund is informed of the ex-dividend date. Non-cash dividends included in dividend income, if any, are recorded at the fair market value of the securities received. Income and capital gain distributions from Fidelity Central Funds, if any, are recorded on the ex-dividend date. Certain distributions received by the Fund represent a return of capital or capital gain. The Fund determines the components of these distributions subsequent to the ex-dividend date, based upon receipt of tax filings or other correspondence relating to the underlying investment. These distributions are recorded as a reduction of cost of investments and/or as a realized gain. Interest income is accrued as earned and includes coupon interest and amortization of premium and accretion of discount on debt securities as applicable. Paid in Kind (PIK) income is recorded at the fair market value of the securities received. Investment income is recorded net of foreign taxes withheld where recovery of such taxes is uncertain.
Class Allocations and Expenses. Investment income, realized and unrealized capital gains and losses, common expenses of the Fund, and certain fund-level expense reductions, if any, are allocated daily on a pro-rata basis to each class based on the relative net assets of each class to the total net assets of the Fund. Each class differs with respect to transfer agent fees incurred. Certain expense reductions may also differ by class. For the reporting period, the allocated portion of income and expenses to each class as a percent of its average net assets may vary due to the timing of recording these transactions in relation to fluctuating net assets of the classes. Expenses directly attributable to a fund are charged to that fund. Expenses attributable to more than one fund are allocated among the respective funds on the basis of relative net assets or other appropriate methods. Expense estimates are accrued in the period to which they relate and adjustments are made when actual amounts are known.
Deferred Trustee Compensation. Under a Deferred Compensation Plan (the Plan), certain independent Trustees have elected to defer receipt of a portion of their annual compensation. Deferred amounts are invested in a cross-section of Fidelity funds, are marked-to-market and remain in the Fund until distributed in accordance with the Plan. The investment of deferred amounts and the offsetting payable to the Trustees of $639 are included in the accompanying Statement of Assets and Liabilities in other receivables and other payables and accrued expenses, respectively.
Income Tax Information and Distributions to Shareholders. Each year, the Fund intends to qualify as a regulated investment company under Subchapter M of the Internal Revenue Code, including distributing substantially all of its taxable income and realized gains. As a result, no provision for U.S. Federal income taxes is required. As of July 31, 2018, the Fund did not have any unrecognized tax benefits in the financial statements; nor is the Fund aware of any tax positions for which it is reasonably possible that the total amounts of unrecognized tax benefits will significantly change in the next twelve months. The Fund files a U.S. federal tax return, in addition to state and local tax returns as required. The Fund's federal income tax returns are subject to examination by the Internal Revenue Service (IRS) for a period of three fiscal years after they are filed. State and local tax returns may be subject to examination for an additional fiscal year depending on the jurisdiction. Foreign taxes are provided for based on the Fund's understanding of the tax rules and rates that exist in the foreign markets in which it invests.
Distributions are declared and recorded on the ex-dividend date. Income and capital gain distributions are declared separately for each class. Income and capital gain distributions are determined in accordance with income tax regulations, which may differ from GAAP. In addition, the Fund claimed a portion of the payment made to redeeming shareholders as a distribution for income tax purposes.
Capital accounts within the financial statements are adjusted for permanent book-tax differences. These adjustments have no impact on net assets or the results of operations. Capital accounts are not adjusted for temporary book-tax differences which will reverse in a subsequent period.
Book-tax differences are primarily due to foreign currency transactions, partnerships, passive foreign investment companies (PFIC), deferred trustees compensation and losses deferred due to wash sales.
As of period end, the cost and unrealized appreciation (depreciation) in securities, and derivatives if applicable, for federal income tax purposes were as follows:
| Gross unrealized appreciation | $892,061 |
| Gross unrealized depreciation | (190,819) |
| Net unrealized appreciation (depreciation) | $701,242 |
| Tax Cost | $6,585,844 |
The tax-based components of distributable earnings as of period end were as follows:
| Undistributed ordinary income | $272,014 |
| Undistributed long-term capital gain | $804,241 |
| Net unrealized appreciation (depreciation) on securities and other investments | $701,248 |
The tax character of distributions paid was as follows:
| | July 31, 2018 | July 31, 2017 |
| Ordinary Income | $133,779 | $ 120,213 |
| Long-term Capital Gains | 1,046,957 | – |
| Total | $1,180,736 | $ 120,213 |
4. Purchases and Sales of Investments.
Purchases and sales of securities, other than short-term securities, aggregated $8,010,558 and $8,925,137, respectively.
5. Fees and Other Transactions with Affiliates.
Management Fee. Fidelity Management & Research Company (the investment adviser) and its affiliates provide the Fund with investment management related services for which the Fund pays a monthly management fee. The management fee is the sum of an individual fund fee rate that is based on an annual rate of .30% of the Fund's average net assets and an annualized group fee rate that averaged .24% during the period. The group fee rate is based upon the average net assets of all the mutual funds advised by the investment adviser, including any mutual funds previously advised by the investment adviser that are currently advised by Fidelity SelectCo, LLC, an affiliate of the investment adviser. The group fee rate decreases as assets under management increase and increases as assets under management decrease. In addition, the management fee is subject to a performance adjustment (up to a maximum of +/- .20% of the Fund's average net assets over a 36 month performance period). The upward or downward adjustment to the management fee is based on the relative investment performance of Dividend Growth as compared to its benchmark index, the S&P 500 Index, over the same 36 month performance period. For the reporting period, the total annual management fee rate, including the performance adjustment, was .33% of the Fund's average net assets. The performance adjustment included in the management fee rate may be higher or lower than the maximum performance adjustment rate due to the difference between the average net assets for the reporting and performance periods.
Transfer Agent Fees. Fidelity Investments Institutional Operations Company, Inc., (FIIOC), an affiliate of the investment adviser, is the transfer, dividend disbursing and shareholder servicing agent for each class of the Fund. FIIOC receives account fees and asset-based fees that vary according to the account size and type of account of the shareholders of Dividend Growth, except for Class K. FIIOC receives an asset-based fee of Class K's average net assets. FIIOC pays for typesetting, printing and mailing of shareholder reports, except proxy statements.
For the period, transfer agent fees for each class were as follows:
| | Amount | % of Class-Level Average Net Assets |
| Dividend Growth | $9,080 | .15 |
| Class K | 586 | .05 |
| | $9,666 | |
Accounting and Security Lending Fees. Fidelity Service Company, Inc. (FSC), an affiliate of the investment adviser, maintains the Fund's accounting records. The accounting fee is based on the level of average net assets for each month. Under a separate contract, FSC administers the security lending program. The security lending fee is based on the number and duration of lending transactions. For the period, the fees were equivalent to an annual rate of .02%.
Brokerage Commissions. The Fund placed a portion of its portfolio transactions with brokerage firms which are affiliates of the investment adviser. Brokerage commissions are included in net realized gain (loss) and change in net unrealized appreciation (depreciation) in the Statement of Operations. The commissions paid to these affiliated firms were $217 for the period.
Interfund Trades. The Fund may purchase from or sell securities to other Fidelity Funds under procedures adopted by the Board. The procedures have been designed to ensure these interfund trades are executed in accordance with Rule 17a-7 of the 1940 Act. Interfund trades are included within the respective purchases and sales amounts shown in the Purchases and Sales of Investments note.
6. Committed Line of Credit.
The Fund participates with other funds managed by the investment adviser or an affiliate in a $4.25 billion credit facility (the "line of credit") to be utilized for temporary or emergency purposes to fund shareholder redemptions or for other short-term liquidity purposes. The Fund has agreed to pay commitment fees on its pro-rata portion of the line of credit, which amounted to $21 and is reflected in Miscellaneous expenses on the Statement of Operations. During the period, the Fund did not borrow on this line of credit.
7. Security Lending.
The Fund lends portfolio securities through a lending agent from time to time in order to earn additional income. For equity securities, a lending agent is used and may loan securities to certain qualified borrowers, including Fidelity Capital Markets (FCM), a broker-dealer affiliated with the Fund. On the settlement date of the loan, the Fund receives collateral (in the form of U.S. Treasury obligations, letters of credit and/or cash) against the loaned securities and maintains collateral in an amount not less than 100% of the market value of the loaned securities during the period of the loan. The market value of the loaned securities is determined at the close of business of the Fund and any additional required collateral is delivered to the Fund on the next business day. The Fund or borrower may terminate the loan at any time, and if the borrower defaults on its obligation to return the securities loaned because of insolvency or other reasons, the Fund may apply collateral received from the borrower against the obligation. The Fund may experience delays and costs in recovering the securities loaned. Any cash collateral received is invested in the Fidelity Securities Lending Cash Central Fund. The value of loaned securities and cash collateral at period end are disclosed on the Fund's Statement of Assets and Liabilities. The value of securities loaned to FCM at period end was $4,928. Security lending income represents the income earned on investing cash collateral, less rebates paid to borrowers and any lending agent fees associated with the loan, plus any premium payments received for lending certain types of securities. Security lending income is presented in the Statement of Operations as a component of income from Fidelity Central Funds. Total security lending income during the period amounted to $193, including $1 from securities loaned to FCM.
8. Expense Reductions.
Commissions paid to certain brokers with whom the investment adviser, or its affiliates, places trades on behalf of the Fund include an amount in addition to trade execution, which may be rebated back to the Fund to offset certain expenses. This amount totaled $626 for the period. In addition, through arrangements with the Fund's custodian, credits realized as a result of certain uninvested cash balances were used to reduce the Fund's expenses. During the period, these credits reduced the Fund's custody expenses by $3.
In addition, during the period the investment adviser reimbursed and/or waived a portion of fund-level operating expenses in the amount of $75.
9. Distributions to Shareholders.
Distributions to shareholders of each class were as follows:
| | Year ended
July 31, 2018 | Year ended
July 31, 2017 |
| From net investment income | | |
| Dividend Growth | $102,569 | $92,313 |
| Class K | 24,695 | 27,900 |
| Total | $127,264 | $120,213 |
| From net realized gain | | |
| Dividend Growth | $860,821 | $– |
| Class K | 192,651 | – |
| Total | $1,053,472 | $– |
10. Share Transactions.
Share transactions for each class were as follows and may contain automatic conversions between classes or exchanges between affiliated funds:
| | Shares | Shares | Dollars | Dollars |
| | Year ended July 31, 2018 | Year ended July 31, 2017 | Year ended July 31, 2018 | Year ended July 31, 2017 |
| Dividend Growth | | | | |
| Shares sold | 6,817 | 6,358 | $228,121 | $209,135 |
| Reinvestment of distributions | 28,012 | 2,777 | 919,157 | 88,012 |
| Shares redeemed | (25,386) | (24,948) | (851,332) | (819,066) |
| Net increase (decrease) | 9,443 | (15,813) | $295,946 | $(521,919) |
| Class K | | | | |
| Shares sold | 6,726 | 6,119 | $224,545 | $201,106 |
| Reinvestment of distributions | 6,626 | 882 | 217,347 | 27,900 |
| Shares redeemed | (19,611) | (18,521) | (660,869) | (610,257) |
| Net increase (decrease) | (6,259) | (11,520) | $(218,977) | $(381,251) |
11. Other.
The Fund's organizational documents provide former and current trustees and officers with a limited indemnification against liabilities arising in connection with the performance of their duties to the Fund. In the normal course of business, the Fund may also enter into contracts that provide general indemnifications. The Fund's maximum exposure under these arrangements is unknown as this would be dependent on future claims that may be made against the Fund. The risk of material loss from such claims is considered remote.
Report of Independent Registered Public Accounting Firm
To the Board of Trustees of Fidelity Securities Fund and Shareholders of Fidelity Dividend Growth Fund:
Opinion on the Financial Statements
We have audited the accompanying statement of assets and liabilities, including the schedule of investments, of Fidelity Dividend Growth Fund (one of the funds constituting Fidelity Securities Fund, referred to hereafter as the "Fund") as of July 31, 2018, the related statement of operations for the year ended July 31, 2018, the statement of changes in net assets for each of the two years in the period ended July 31, 2018, including the related notes, and the financial highlights for each of the five years in the period ended July 31, 2018 (collectively referred to as the “financial statements”). In our opinion, the financial statements present fairly, in all material respects, the financial position of the Fund as of July 31, 2018, the results of its operations for the year then ended, the changes in its net assets for each of the two years in the period ended July 31, 2018 and the financial highlights for each of the five years in the period ended July 31, 2018 in conformity with accounting principles generally accepted in the United States of America.
Basis for Opinion
These financial statements are the responsibility of the Fund’s management. Our responsibility is to express an opinion on the Fund’s financial statements based on our audits. We are a public accounting firm registered with the Public Company Accounting Oversight Board (United States) (“PCAOB”) and are required to be independent with respect to the Fund in accordance with the U.S. federal securities laws and the applicable rules and regulations of the Securities and Exchange Commission and the PCAOB.
We conducted our audits of these financial statements in accordance with the standards of the PCAOB. Those standards require that we plan and perform the audit to obtain reasonable assurance about whether the financial statements are free of material misstatement, whether due to error or fraud.
Our audits included performing procedures to assess the risks of material misstatement of the financial statements, whether due to error or fraud, and performing procedures that respond to those risks. Such procedures included examining, on a test basis, evidence regarding the amounts and disclosures in the financial statements. Our audits also included evaluating the accounting principles used and significant estimates made by management, as well as evaluating the overall presentation of the financial statements. Our procedures included confirmation of securities owned as of July 31, 2018 by correspondence with the custodian and brokers, when replies were not received from brokers, we performed other auditing procedures. We believe that our audits provide a reasonable basis for our opinion.
PricewaterhouseCoopers LLP
Boston, Massachusetts
September 14, 2018
We have served as the auditor of one or more investment companies in the Fidelity group of funds since 1932.
Trustees and Officers
The Trustees, Members of the Advisory Board (if any), and officers of the trust and fund, as applicable, are listed below. The Board of Trustees governs the fund and is responsible for protecting the interests of shareholders. The Trustees are experienced executives who meet periodically throughout the year to oversee the fund's activities, review contractual arrangements with companies that provide services to the fund, oversee management of the risks associated with such activities and contractual arrangements, and review the fund's performance. Except for Jonathan Chiel, each of the Trustees oversees 286 funds. Mr. Chiel oversees 150 funds.
The Trustees hold office without limit in time except that (a) any Trustee may resign; (b) any Trustee may be removed by written instrument, signed by at least two-thirds of the number of Trustees prior to such removal; (c) any Trustee who requests to be retired or who has become incapacitated by illness or injury may be retired by written instrument signed by a majority of the other Trustees; and (d) any Trustee may be removed at any special meeting of shareholders by a two-thirds vote of the outstanding voting securities of the trust. Each Trustee who is not an interested person (as defined in the 1940 Act) of the trust and the fund is referred to herein as an Independent Trustee. Each Independent Trustee shall retire not later than the last day of the calendar year in which his or her 75th birthday occurs. The Independent Trustees may waive this mandatory retirement age policy with respect to individual Trustees. Officers and Advisory Board Members hold office without limit in time, except that any officer or Advisory Board Member may resign or may be removed by a vote of a majority of the Trustees at any regular meeting or any special meeting of the Trustees. Except as indicated, each individual has held the office shown or other offices in the same company for the past five years.
The fund’s Statement of Additional Information (SAI) includes more information about the Trustees. To request a free copy, call Fidelity at 1-800-544-8544.
Experience, Skills, Attributes, and Qualifications of the Trustees. The Governance and Nominating Committee has adopted a statement of policy that describes the experience, qualifications, attributes, and skills that are necessary and desirable for potential Independent Trustee candidates (Statement of Policy). The Board believes that each Trustee satisfied at the time he or she was initially elected or appointed a Trustee, and continues to satisfy, the standards contemplated by the Statement of Policy. The Governance and Nominating Committee also engages professional search firms to help identify potential Independent Trustee candidates who have the experience, qualifications, attributes, and skills consistent with the Statement of Policy. From time to time, additional criteria based on the composition and skills of the current Independent Trustees, as well as experience or skills that may be appropriate in light of future changes to board composition, business conditions, and regulatory or other developments, have also been considered by the professional search firms and the Governance and Nominating Committee. In addition, the Board takes into account the Trustees' commitment and participation in Board and committee meetings, as well as their leadership of standing and ad hoc committees throughout their tenure.
In determining that a particular Trustee was and continues to be qualified to serve as a Trustee, the Board has considered a variety of criteria, none of which, in isolation, was controlling. The Board believes that, collectively, the Trustees have balanced and diverse experience, qualifications, attributes, and skills, which allow the Board to operate effectively in governing the fund and protecting the interests of shareholders. Information about the specific experience, skills, attributes, and qualifications of each Trustee, which in each case led to the Board's conclusion that the Trustee should serve (or continue to serve) as a trustee of the fund, is provided below.
Board Structure and Oversight Function. James C. Curvey is an interested person and currently serves as Chairman. The Trustees have determined that an interested Chairman is appropriate and benefits shareholders because an interested Chairman has a personal and professional stake in the quality and continuity of services provided to the fund. Independent Trustees exercise their informed business judgment to appoint an individual of their choosing to serve as Chairman, regardless of whether the Trustee happens to be independent or a member of management. The Independent Trustees have determined that they can act independently and effectively without having an Independent Trustee serve as Chairman and that a key structural component for assuring that they are in a position to do so is for the Independent Trustees to constitute a substantial majority for the Board. The Independent Trustees also regularly meet in executive session. Ned C. Lautenbach serves as Chairman of the Independent Trustees and as such (i) acts as a liaison between the Independent Trustees and management with respect to matters important to the Independent Trustees and (ii) with management prepares agendas for Board meetings.
Fidelity® funds are overseen by different Boards of Trustees. The fund's Board oversees Fidelity's high income and certain equity funds, and other Boards oversee Fidelity's investment-grade bond, money market, asset allocation, and other equity funds. The asset allocation funds may invest in Fidelity® funds overseen by the fund's Board. The use of separate Boards, each with its own committee structure, allows the Trustees of each group of Fidelity® funds to focus on the unique issues of the funds they oversee, including common research, investment, and operational issues. On occasion, the separate Boards establish joint committees to address issues of overlapping consequences for the Fidelity® funds overseen by each Board.
The Trustees operate using a system of committees to facilitate the timely and efficient consideration of all matters of importance to the Trustees, the fund, and fund shareholders and to facilitate compliance with legal and regulatory requirements and oversight of the fund's activities and associated risks. The Board, acting through its committees, has charged FMR and its affiliates with (i) identifying events or circumstances the occurrence of which could have demonstrably adverse effects on the fund's business and/or reputation; (ii) implementing processes and controls to lessen the possibility that such events or circumstances occur or to mitigate the effects of such events or circumstances if they do occur; and (iii) creating and maintaining a system designed to evaluate continuously business and market conditions in order to facilitate the identification and implementation processes described in (i) and (ii) above. Because the day-to-day operations and activities of the fund are carried out by or through FMR, its affiliates, and other service providers, the fund's exposure to risks is mitigated but not eliminated by the processes overseen by the Trustees. While each of the Board's committees has responsibility for overseeing different aspects of the fund's activities, oversight is exercised primarily through the Operations, Audit, and Compliance Committees. In addition, the Independent Trustees have worked with Fidelity to enhance the Board's oversight of investment and financial risks, legal and regulatory risks, technology risks, and operational risks, including the development of additional risk reporting to the Board. Appropriate personnel, including but not limited to the fund's Chief Compliance Officer (CCO), FMR's internal auditor, the independent accountants, the fund's Treasurer and portfolio management personnel, make periodic reports to the Board's committees, as appropriate, including an annual review of Fidelity's risk management program for the Fidelity® funds. The responsibilities of each standing committee, including their oversight responsibilities, are described further under "Standing Committees of the Trustees."
Interested Trustees*:
Correspondence intended for a Trustee who is an interested person may be sent to Fidelity Investments, 245 Summer Street, Boston, Massachusetts 02210.
Name, Year of Birth; Principal Occupations and Other Relevant Experience+
Jonathan Chiel (1957)
Year of Election or Appointment: 2016
Trustee
Mr. Chiel also serves as Trustee of other Fidelity® funds. Mr. Chiel is Executive Vice President and General Counsel for FMR LLC (diversified financial services company, 2012-present). Previously, Mr. Chiel served as general counsel (2004-2012) and senior vice president and deputy general counsel (2000-2004) for John Hancock Financial Services; a partner with Choate, Hall & Stewart (1996-2000) (law firm); and an Assistant United States Attorney for the United States Attorney’s Office of the District of Massachusetts (1986-95), including Chief of the Criminal Division (1993-1995). Mr. Chiel is a director on the boards of the Boston Bar Foundation and the Maimonides School.
James C. Curvey (1935)
Year of Election or Appointment: 2007
Trustee
Chairman of the Board of Trustees
Mr. Curvey also serves as Trustee of other Fidelity® funds. Mr. Curvey is Vice Chairman (2007-present) and Director of FMR LLC (diversified financial services company). In addition, Mr. Curvey is an Overseer Emeritus for the Boston Symphony Orchestra, a Director of Artis-Naples, and a Trustee of Brewster Academy in Wolfeboro, New Hampshire. Previously, Mr. Curvey served as a Director of Fidelity Research & Analysis Co. (investment adviser firm, 2009-2018), Director of Fidelity Investments Money Management, Inc. (investment adviser firm, 2009-2014) and a Director of FMR and FMR Co., Inc. (investment adviser firms, 2007-2014).
Charles S. Morrison (1960)
Year of Election or Appointment: 2014
Trustee
Mr. Morrison also serves as Trustee of other funds. He serves as President of Fidelity SelectCo, LLC (investment adviser firm, 2017-present) and Fidelity Management & Research Company (FMR) (investment adviser firm, 2016-present), a Director of Fidelity Investments Money Management, Inc. (FIMM) (investment adviser firm, 2014-present), Director of Fidelity SelectCo, LLC (investment adviser firm, 2014-present), President, Asset Management (2014-present), and is an employee of Fidelity Investments. Previously, Mr. Morrison served as Vice President of Fidelity's Fixed Income and Asset Allocation Funds (2012-2014), President, Fixed Income (2011-2014), Vice President of Fidelity's Money Market Funds (2005-2009), President, Money Market Group Leader of FMR (investment adviser firm, 2009), and Senior Vice President, Money Market Group of FMR (2004-2009). Mr. Morrison also served as Vice President of Fidelity's Bond Funds (2002-2005), certain Balanced Funds (2002-2005), and certain Asset Allocation Funds (2002-2007), and as Senior Vice President (2002-2005) of Fidelity's Bond Division.
* Determined to be an “Interested Trustee” by virtue of, among other things, his or her affiliation with the trust or various entities under common control with FMR.
+ The information includes the Trustee's principal occupation during the last five years and other information relating to the experience, attributes, and skills relevant to the Trustee's qualifications to serve as a Trustee, which led to the conclusion that the Trustee should serve as a Trustee for the fund.
Independent Trustees:
Correspondence intended for an Independent Trustee may be sent to Fidelity Investments, P.O. Box 55235, Boston, Massachusetts 02205-5235.
Name, Year of Birth; Principal Occupations and Other Relevant Experience+
Dennis J. Dirks (1948)
Year of Election or Appointment: 2005
Trustee
Mr. Dirks also serves as Trustee of other Fidelity® funds. Prior to his retirement in May 2003, Mr. Dirks was Chief Operating Officer and a member of the Board of The Depository Trust & Clearing Corporation (DTCC). He also served as President, Chief Operating Officer, and Board member of The Depository Trust Company (DTC) and President and Board member of the National Securities Clearing Corporation (NSCC). In addition, Mr. Dirks served as Chief Executive Officer and Board member of the Government Securities Clearing Corporation, Chief Executive Officer and Board member of the Mortgage-Backed Securities Clearing Corporation, as a Trustee and a member of the Finance Committee of Manhattan College (2005-2008), as a Trustee and a member of the Finance Committee of AHRC of Nassau County (2006-2008), as a member of the Independent Directors Council (IDC) Governing Council (2010-2015), and as a member of the Board of Directors for The Brookville Center for Children’s Services, Inc. (2009-2017). Mr. Dirks is a member of the Finance Committee (2016-present), Board of Directors (2017-present) and Board of Trustees (2018-present) and is Treasurer (2018-present) of the Asolo Repertory Theatre.
Donald F. Donahue (1950)
Year of Election or Appointment: 2018
Trustee
Mr. Donahue also serves as a Trustee of other Fidelity® funds. Mr. Donahue is President and Chief Executive Officer of Miranda Partners, LLC (risk consulting for the financial services industry, 2012-present). Previously, Mr. Donahue served as a Member of the Advisory Board of certain Fidelity® funds (2015-2018) and Chief Executive Officer (2006-2012), Chief Operating Officer (2003-2006), and Managing Director, Customer Marketing and Development (1999-2003) of The Depository Trust & Clearing Corporation (financial markets infrastructure). Mr. Donahue serves as a Member (2007-present) and Co-Chairman (2016-present) of the Board of Directors of United Way of New York, Member of the Board of Directors of NYC Leadership Academy (2012-present) and Member of the Board of Advisors of Ripple Labs, Inc. (financial services, 2015-present). He also served as Chairman (2010-2012) and Member of the Board of Directors (2012-2013) of Omgeo, LLC (financial services), Treasurer of United Way of New York (2012-2016), and Member of the Board of Directors of XBRL US (financial services non-profit, 2009-2012) and the International Securities Services Association (2009-2012).
Alan J. Lacy (1953)
Year of Election or Appointment: 2008
Trustee
Mr. Lacy also serves as Trustee of other Fidelity® funds. Mr. Lacy serves as a Director of Bristol-Myers Squibb Company (global pharmaceuticals, 2008-present). He is a Trustee of the California Chapter of The Nature Conservancy (2015-present) and a Director of the Center for Advanced Study in the Behavioral Sciences at Stanford University (2015-present). In addition, Mr. Lacy served as Senior Adviser (2007-2014) of Oak Hill Capital Partners, L.P. (private equity) and also served as Chief Executive Officer (2005) and Vice Chairman (2005-2006) of Sears Holdings Corporation (retail) and Chief Executive Officer and Chairman of the Board of Sears, Roebuck and Co. (retail, 2000-2005). Previously, Mr. Lacy served as Chairman (2014-2017) and a member (2010-2017) of the Board of Directors of Dave & Buster’s Entertainment, Inc. (restaurant and entertainment complexes), as Chairman (2008-2011) and a member (2006-2015) of the Board of Trustees of the National Parks Conservation Association, and as a member of the Board of Directors for The Hillman Companies, Inc. (hardware wholesalers, 2010-2014), Earth Fare, Inc. (retail grocery, 2010-2014), and The Western Union Company (global money transfer, 2006-2011).
Ned C. Lautenbach (1944)
Year of Election or Appointment: 2000
Trustee
Chairman of the Independent Trustees
Mr. Lautenbach also serves as Trustee of other Fidelity® funds. Mr. Lautenbach currently serves as Vice Chair of the Board of Governors, State University System of Florida (2013-present) and is a member of the Council on Foreign Relations (1994-present). He is also a member and has most recently served as Chairman of the Board of Directors of Artis-Naples (2012-present). Previously, Mr. Lautenbach served as a member and then Lead Director of the Board of Directors of Eaton Corporation (diversified industrial, 1997-2016). He was also a Partner and Advisory Partner at Clayton, Dubilier & Rice, LLC (private equity investment, 1998-2010), as well as a Director of Sony Corporation (2006-2007). In addition, Mr. Lautenbach also had a 30-year career with IBM (technology company) during which time he served as Senior Vice President and a member of the Corporate Executive Committee (1968-1998).
Joseph Mauriello (1944)
Year of Election or Appointment: 2008
Trustee
Mr. Mauriello also serves as Trustee of other Fidelity® funds. Prior to his retirement in January 2006, Mr. Mauriello served in numerous senior management positions including Deputy Chairman and Chief Operating Officer (2004-2005), and Vice Chairman of Financial Services (2002-2004) of KPMG LLP US (professional services, 1965-2005). Mr. Mauriello currently serves as a member of the Board of Directors of XL Group plc. (global insurance and re-insurance, 2006-present) and the Independent Directors Council (IDC) Governing Council (2015-present). Previously, Mr. Mauriello served as a Director of the Hamilton Funds of the Bank of New York (2006-2007) and of Arcadia Resources Inc. (health care services and products, 2007-2012).
Cornelia M. Small (1944)
Year of Election or Appointment: 2005
Trustee
Ms. Small also serves as Trustee of other Fidelity® funds. Ms. Small is a member of the Board of Directors (2009-present) and Chair of the Investment Committee (2010-present) of the Teagle Foundation. Ms. Small also serves on the Investment Committee of the Berkshire Taconic Community Foundation (2008-present). Previously, Ms. Small served as Chairperson (2002-2008) and a member of the Investment Committee and Chairperson (2008-2012) and a member of the Board of Trustees of Smith College. In addition, Ms. Small served as Chief Investment Officer, Director of Global Equity Investments, and a member of the Board of Directors of Scudder, Stevens & Clark and Scudder Kemper Investments.
Garnett A. Smith (1947)
Year of Election or Appointment: 2018
Trustee
Mr. Smith also serves as Trustee of other Fidelity® funds. Prior to Mr. Smith's retirement, he served as Chairman and Chief Executive Officer of Inbrand Corp. (manufacturer of personal absorbent products, 1990-1997). He also served as President (1986-1990) of Inbrand Corp. Prior to his employment with Inbrand Corp., he was employed by a retail fabric chain and North Carolina National Bank. In addition, Mr. Smith served as a Member of the Advisory Board of certain Fidelity® funds (2012-2013) and as a board member of the Jackson Hole Land Trust (2009-2012).
David M. Thomas (1949)
Year of Election or Appointment: 2008
Trustee
Mr. Thomas also serves as Trustee of other Fidelity® funds. Mr. Thomas serves as Non-Executive Chairman of the Board of Directors of Fortune Brands Home and Security (home and security products, 2011-present), as a member of the Board of Directors (2004-present) and Presiding Director (2013-present) of Interpublic Group of Companies, Inc. (marketing communication), and as a member of the Board of Trustees of the University of Florida (2013-present). Previously, Mr. Thomas served as Executive Chairman (2005-2006) and Chairman and Chief Executive Officer (2000-2005) of IMS Health, Inc. (pharmaceutical and healthcare information solutions), and a Director of Fortune Brands, Inc. (consumer products, 2000-2011).
+ The information includes the Trustee's principal occupation during the last five years and other information relating to the experience, attributes, and skills relevant to the Trustee's qualifications to serve as a Trustee, which led to the conclusion that the Trustee should serve as a Trustee for the fund.
Advisory Board Members and Officers:
Correspondence intended for a Member of the Advisory Board (if any) may be sent to Fidelity Investments, P.O. Box 55235, Boston, Massachusetts 02205-5235. Correspondence intended for an officer or Peter S. Lynch may be sent to Fidelity Investments, 245 Summer Street, Boston, Massachusetts 02210. Officers appear below in alphabetical order.
Name, Year of Birth; Principal Occupation
Peter S. Lynch (1944)
Year of Election or Appointment: 2003
Member of the Advisory Board
Mr. Lynch also serves as Member of the Advisory Board of other Fidelity® funds. Mr. Lynch is Vice Chairman and a Director of FMR (investment adviser firm) and FMR Co., Inc. (investment adviser firm). In addition, Mr. Lynch serves as a Trustee of Boston College and as the Chairman of the Inner-City Scholarship Fund. Previously, Mr. Lynch served on the Special Olympics International Board of Directors (1997-2006).
William S. Stavropoulos (1939)
Year of Election or Appointment: 2018
Member of the Advisory Board
Mr. Stavropoulos also serves as Member of the Advisory Board of other Fidelity® funds. Mr. Stavropoulos serves as President and Founder of the Michigan Baseball Foundation, the Great Lakes Loons (2007-present). Mr. Stavropoulos is Chairman Emeritus of the Board of Directors of The Dow Chemical Company, where he previously served in numerous senior management positions, including President, CEO (1995-2000; 2002-2004), Chairman of the Executive Committee (2000-2006), and as a member of the Board of Directors (1990-2006). Currently, Mr. Stavropoulos is Chairman of the Board of Directors of Univar Inc. (global distributor of commodity and specialty chemicals), a Director of Teradata Corporation (data warehousing and technology solutions), and a member of the Advisory Board for Metalmark Capital LLC (private equity investment, 2005-present). Mr. Stavropoulos is an operating advisor to Clayton, Dubilier & Rice, LLC (private equity investment). In addition, Mr. Stavropoulos is a member of the University of Notre Dame Advisory Council for the College of Science, a Trustee of the Rollin L. Gerstacker Foundation, and a Director of Artis-Naples in Naples, Florida. Previously, Mr. Stavropoulos served as Trustee of certain Fidelity® funds (2001-2018) and as a Director of Chemical Financial Corporation (bank holding company, 1993-2012) and Tyco International, Ltd. (multinational manufacturing and services, 2007-2012).
Carol B. Tomé (1957)
Year of Election or Appointment: 2018
Member of the Advisory Board
Ms. Tomé also serves as Member of the Advisory Board of other Fidelity® funds. Ms. Tomé is Chief Financial Officer (2001-present) and Executive Vice President of Corporate Services (2007-present) of The Home Depot, Inc. (home improvement retailer) and a Director (2003-present) and Chair of the Audit Committee (2004-present) of United Parcel Service, Inc. (package delivery and supply chain management). Previously, Ms. Tomé served as Trustee of certain Fidelity® funds (2017), Senior Vice President of Finance and Accounting/Treasurer (2000-2007) and Vice President and Treasurer (1995-2000) of The Home Depot, Inc. and Chair of the Board (2010-2012), Vice Chair of the Board (2009 and 2013), and a Director (2008-2013) of the Federal Reserve Bank of Atlanta. Ms. Tomé is also a director or trustee of many community and professional organizations.
Michael E. Wiley (1950)
Year of Election or Appointment: 2018
Member of the Advisory Board
Mr. Wiley also serves as Trustee or Member of the Advisory Board of other Fidelity® funds. Mr. Wiley serves as a Director of Andeavor Corporation (independent oil refiner and marketer, 2005-present), a Director of Andeavor Logistics LP (natural resources logistics, 2015-present), and a Director of Bill Barrett Corporation (exploration and production, 2005-present). In addition, Mr. Wiley also serves as a Director of Post Oak Bank (privately-held bank, 2004-present). Previously, Mr. Wiley served as a Trustee of other Fidelity® funds (2008-2013), as a Director of Asia Pacific Exploration Consolidated (international oil and gas exploration and production, 2008-2013), as a member of the Board of Trustees of the University of Tulsa (2000-2006; 2007-2010), as a Senior Energy Advisor of Katzenbach Partners, LLC (consulting, 2006-2007), as an Advisory Director of Riverstone Holdings (private investment), Chairman, President, and CEO of Baker Hughes, Inc. (oilfield services, 2000-2004), and as Director of Spinnaker Exploration Company (exploration and production, 2001-2005).
Elizabeth Paige Baumann (1968)
Year of Election or Appointment: 2017
Anti-Money Laundering (AML) Officer
Ms. Baumann also serves as AML Officer of other funds. She is Chief AML Officer (2012-present) and Senior Vice President (2014-present) of FMR LLC (diversified financial services company) and is an employee of Fidelity Investments. Previously, Ms. Baumann served as AML Officer of the funds (2012-2016), and Vice President (2007-2014) and Deputy Anti-Money Laundering Officer (2007-2012) of FMR LLC.
Marc R. Bryant (1966)
Year of Election or Appointment: 2015
Secretary and Chief Legal Officer (CLO)
Mr. Bryant also serves as Secretary and CLO of other funds. Mr. Bryant serves as CLO, Secretary, and Senior Vice President of Fidelity Management & Research Company (investment adviser firm, 2015-present) and FMR Co., Inc. (investment adviser firm, 2015-present); Secretary of Fidelity SelectCo, LLC (investment adviser firm, 2015-present) and Fidelity Investments Money Management, Inc. (investment adviser firm, 2015-present); and CLO of Fidelity Management & Research (Hong Kong) Limited and FMR Investment Management (UK) Limited (investment adviser firms, 2015-present) and Fidelity Management & Research (Japan) Limited (investment adviser firm, 2016-present). He is Senior Vice President and Deputy General Counsel of FMR LLC (diversified financial services company). Previously, Mr. Bryant served as Secretary and CLO of Fidelity Rutland Square Trust II (2010-2014) and Assistant Secretary of Fidelity's Fixed Income and Asset Allocation Funds (2013-2015). Prior to joining Fidelity Investments, Mr. Bryant served as a Senior Vice President and the Head of Global Retail Legal for AllianceBernstein L.P. (2006-2010), and as the General Counsel for ProFund Advisors LLC (2001-2006).
John J. Burke III (1964)
Year of Election or Appointment: 2018
Chief Financial Officer
Mr. Burke also serves as Chief Financial Officer of other funds. Mr. Burke serves as Head of Investment Operations for Fidelity Fund and Investment Operations (2018-present) and is an employee of Fidelity Investments (1998-present). Previously Mr. Burke served as head of Asset Management Investment Operations (2012-2018).
William C. Coffey (1969)
Year of Election or Appointment: 2009
Assistant Secretary
Mr. Coffey also serves as Assistant Secretary of other funds. He is Senior Vice President and Deputy General Counsel of FMR LLC (diversified financial services company, 2010-present), and is an employee of Fidelity Investments. Previously, Mr. Coffey served as Vice President and Associate General Counsel of FMR LLC (2005-2009).
Timothy M. Cohen (1969)
Year of Election or Appointment: 2018
Vice President
Mr. Cohen also serves as Vice President of other funds. Mr. Cohen serves as Co-Head of Global Equity Research (2016-present), a Director of Fidelity Management & Research (Japan) Limited (investment adviser firm, 2016-present), and is an employee of Fidelity Investments. Previously, Mr. Cohen served as Chief Investment Officer - Equity and a Director of Fidelity Management & Research (U.K.) Inc. (investment adviser firm, 2013-2015) and as a Director of Fidelity Management & Research (Hong Kong) Limited (investment adviser firm, 2017).
Jonathan Davis (1968)
Year of Election or Appointment: 2010
Assistant Treasurer
Mr. Davis also serves as Assistant Treasurer of other funds. Mr. Davis serves as Assistant Treasurer of FMR Capital, Inc. (2017-present) and is an employee of Fidelity Investments. Previously, Mr. Davis served as Vice President and Associate General Counsel of FMR LLC (diversified financial services company, 2003-2010).
Adrien E. Deberghes (1967)
Year of Election or Appointment: 2016
Assistant Treasurer
Mr. Deberghes also serves as an officer of other funds. He serves as Assistant Treasurer of FMR Capital, Inc. (2017-present), Executive Vice President of Fidelity Investments Money Management, Inc. (FIMM) (investment adviser firm, 2016-present), and is an employee of Fidelity Investments (2008-present). Previously, Mr. Deberghes served as President and Treasurer of certain Fidelity® funds (2013-2018). Prior to joining Fidelity Investments, Mr. Deberghes was Senior Vice President of Mutual Fund Administration at State Street Corporation (2007-2008), Senior Director of Mutual Fund Administration at Investors Bank & Trust (2005-2007), and Director of Finance for Dunkin' Brands (2000-2005). Previously, Mr. Deberghes served in other fund officer roles.
Laura M. Del Prato (1964)
Year of Election or Appointment: 2018
Assistant Treasurer
Ms. Del Prato also serves as an officer of other funds. Ms. Del Prato is an employee of Fidelity Investments (2017-present). Prior to joining Fidelity Investments, Ms. Del Prato served as a Managing Director and Treasurer of the JPMorgan Mutual Funds (2014-2017). Prior to JPMorgan, Ms. Del Prato served as a partner at Cohen Fund Audit Services (accounting firm, 2012-2013) and KPMG LLP (accounting firm, 2004-2012).
Colm A. Hogan (1973)
Year of Election or Appointment: 2016
Deputy Treasurer
Mr. Hogan also serves as an officer of other funds. Mr. Hogan serves as Assistant Treasurer of FMR Capital, Inc. (2017-present) and is an employee of Fidelity Investments (2005-present). Previously, Mr. Hogan served as Assistant Treasurer of certain Fidelity® funds (2016-2018).
Pamela R. Holding (1964)
Year of Election or Appointment: 2018
Vice President
Ms. Holding also serves as a Vice President of other funds. Ms. Holding serves as Co-Head of Global Equity Research (2018-present) and is an employee of Fidelity Investments (2013-present).
Chris Maher (1972)
Year of Election or Appointment: 2013
Assistant Treasurer
Mr. Maher serves as Assistant Treasurer of other funds. Mr. Maher is Vice President of Valuation Oversight, serves as Assistant Treasurer of FMR Capital, Inc. (2017-present), and is an employee of Fidelity Investments. Previously, Mr. Maher served as Vice President of Asset Management Compliance (2013), Vice President of the Program Management Group of FMR (investment adviser firm, 2010-2013), and Vice President of Valuation Oversight (2008-2010).
Rieco E. Mello (1969)
Year of Election or Appointment: 2017
Assistant Treasurer
Mr. Mello also serves as Assistant Treasurer of other funds. Mr. Mello serves as Assistant Treasurer of FMR Capital, Inc. (2017-present) and is an employee of Fidelity Investments (1995-present).
Kenneth B. Robins (1969)
Year of Election or Appointment: 2016
Chief Compliance Officer
Mr. Robins also serves as an officer of other funds. Mr. Robins serves as Compliance Officer of Fidelity Management & Research Company and FMR Co., Inc. (investment adviser firms, 2016-present) and is an employee of Fidelity Investments (2004-present). Previously, Mr. Robins served as Executive Vice President of Fidelity Investments Money Management, Inc. (investment adviser firm, 2013-2016) and served in other fund officer roles.
Stacie M. Smith (1974)
Year of Election or Appointment: 2016
President and Treasurer
Ms. Smith also serves as an officer of other funds. Ms. Smith serves as Assistant Treasurer of FMR Capital, Inc. (2017-present), is an employee of Fidelity Investments (2009-present), and has served in other fund officer roles. Prior to joining Fidelity Investments, Ms. Smith served as Senior Audit Manager of Ernst & Young LLP (accounting firm, 1996-2009). Previously, Ms. Smith served as Assistant Treasurer (2013-2018) and Deputy Treasurer (2013-2016) of certain Fidelity® funds.
Marc L. Spector (1972)
Year of Election or Appointment: 2016
Assistant Treasurer
Mr. Spector also serves as an officer of other funds. Mr. Spector serves as Assistant Treasurer of FMR Capital, Inc. (2017-present) and is an employee of Fidelity Investments (2016-present). Prior to joining Fidelity Investments, Mr. Spector served as Director at the Siegfried Group (accounting firm, 2013-2016), and prior to Siegfried Group as audit senior manager at Deloitte & Touche (accounting firm, 2005-2013).
Renee Stagnone (1975)
Year of Election or Appointment: 2016
Assistant Treasurer
Ms. Stagnone also serves as an officer of other funds. Ms. Stagnone serves as Assistant Treasurer of FMR Capital, Inc. (2017-present) and is an employee of Fidelity Investments (1997-present). Previously, Ms. Stagnone served as Deputy Treasurer of certain Fidelity® funds (2013-2016).
Shareholder Expense Example
As a shareholder of the Fund, you incur two types of costs: (1) transaction costs and (2) ongoing costs, including management fees and other Fund expenses. This Example is intended to help you understand your ongoing costs (in dollars) of investing in the Fund and to compare these costs with the ongoing costs of investing in other mutual funds.
The Example is based on an investment of $1,000 invested at the beginning of the period and held for the entire period (February 1, 2018 to July 31, 2018).
Actual Expenses
The first line of the accompanying table for each class of the Fund provides information about actual account values and actual expenses. You may use the information in this line, together with the amount you invested, to estimate the expenses that you paid over the period. Simply divide your account value by $1,000.00 (for example, an $8,600 account value divided by $1,000.00 = 8.6), then multiply the result by the number in the first line for a class of the Fund under the heading entitled "Expenses Paid During Period" to estimate the expenses you paid on your account during this period. A small balance maintenance fee of $12.00 that is charged once a year may apply for certain accounts with a value of less than $2,000. This fee is not included in the table below. If it was, the estimate of expenses you paid during the period would be higher, and your ending account value lower, by this amount. In addition, the Fund, as a shareholder in the underlying Fidelity Central Funds, will indirectly bear its pro-rata share of the fees and expenses incurred by the underlying Fidelity Central Funds. These fees and expenses are not included in the Fund's annualized expense ratio used to calculate the expense estimate in the table below.
Hypothetical Example for Comparison Purposes
The second line of the accompanying table for each class of the Fund provides information about hypothetical account values and hypothetical expenses based on a Class' actual expense ratio and an assumed rate of return of 5% per year before expenses, which is not the Class' actual return. The hypothetical account values and expenses may not be used to estimate the actual ending account balance or expenses you paid for the period. You may use this information to compare the ongoing costs of investing in the Fund and other funds. To do so, compare this 5% hypothetical example with the 5% hypothetical examples that appear in the shareholder reports of the other funds. A small balance maintenance fee of $12.00 that is charged once a year may apply for certain accounts with a value of less than $2,000. This fee is not included in the table below. If it was, the estimate of expenses you paid during the period would be higher, and your ending account value lower, by this amount. In addition, the Fund, as a shareholder in the underlying Fidelity Central Funds, will indirectly bear its pro-rata share of the fees and expenses incurred by the underlying Fidelity Central Funds. These fees and expenses are not included in the Fund's annualized expense ratio used to calculate the expense estimate in the table below.
Please note that the expenses shown in the table are meant to highlight your ongoing costs only and do not reflect any transaction costs. Therefore, the second line of the table is useful in comparing ongoing costs only, and will not help you determine the relative total costs of owning different funds.
| | Annualized Expense Ratio-A | Beginning
Account Value
February 1, 2018 | Ending
Account Value
July 31, 2018 | Expenses Paid
During Period-B
February 1, 2018
to July 31, 2018 |
| Dividend Growth | .50% | | | |
| Actual | | $1,000.00 | $982.30 | $2.46 |
| Hypothetical-C | | $1,000.00 | $1,022.32 | $2.51 |
| Class K | .40% | | | |
| Actual | | $1,000.00 | $982.80 | $1.97 |
| Hypothetical-C | | $1,000.00 | $1,022.81 | $2.01 |
A Annualized expense ratio reflects expenses net of applicable fee waivers.
B Expenses are equal to each Class' annualized expense ratio, multiplied by the average account value over the period, multiplied by 181/365 (to reflect the one-half year period).
C 5% return per year before expenses
Distributions (Unaudited)
The Board of Trustees of Fidelity Dividend Growth Fund voted to pay to shareholders of record at the opening of business on record date, the following distributions per share derived from capital gains realized from sales of portfolio securities, and dividends derived from net investment income:
| | Pay Date | Record Date | Dividends | Capital Gains |
| Fidelity Dividend Growth Fund | | | | |
| Dividend Growth | 09/17/2018 | 09/14/2018 | $0.327 | $4.751 |
| Class K | 09/17/2018 | 09/14/2018 | $0.347 | $4.751 |
|
The fund hereby designates as a capital gain dividend with respect to the taxable year ended July 31,2018 $1,484,302,279 , or, if subsequently determined to be different, the net capital gain of such year.
Dividend Growth designates 100% and 90% and Class K designates 100% and 87% of the dividends distributed in September and December, respectively during the fiscal year as qualifying for the dividends-received deduction for corporate shareholders.
Dividend Growth and Class K designate 100% of the dividends distributed in September and December, respectively during the fiscal year as amounts which may be taken into account as a dividend for the purposes of the maximum rate under section 1(h)(11) of the Internal Revenue Code.
The fund will notify shareholders in January 2019 of amounts for use in preparing 2018 income tax returns.
Board Approval of Investment Advisory Contracts
Fidelity Dividend Growth Fund
At its July 2018 meeting, the Board of Trustees, including the Independent Trustees (together, the Board), voted to continue the management contract with Fidelity Management & Research Company (FMR) and the sub-advisory agreements (together, the Advisory Contracts) for the fund for six months through January 31, 2019, in connection with the reunification of the Fidelity Equity High Income Funds Board, which oversees the fund, and the Sector Portfolios Board.
The Board considered that the approval of the fund's Advisory Contracts will not result in any changes in (i) the investment process or strategies employed in the management of the fund's assets; (ii) the fees and expenses paid by shareholders; (iii) the nature, extent or quality of services provided under the fund's Advisory Contracts; or (iv) the day-to-day management of the fund or the persons primarily responsible for such management. The Board concluded that the fund's Advisory Contracts are fair and reasonable, and that the fund's Advisory Contracts should be renewed, without modification, through January 31, 2019, with the understanding that the Board will consider the annual renewal for a full one year period in January 2019.
In connection with its consideration of future renewals of the fund's Advisory Contracts, the Board will consider: (i) the nature, extent and quality of services provided to the fund, including shareholder and administrative services and investment performance; (ii) the competitiveness of the management fee and total expenses for the fund; (iii) the costs of the services and profitability, including the revenues earned and the expenses incurred in conducting the business of developing, marketing, distributing, managing, administering, and servicing the fund and its shareholders, to the extent applicable, as well as potential fall-out benefits from Fidelity's non-fund businesses; and (iv) whether there have been economies of scale in respect of the Fidelity funds, whether the Fidelity funds (including the fund) have appropriately benefited from any such economies of scale, and whether there is the potential for realization of any further economies.
Based on its evaluation of all of the conclusions noted above, and after considering all factors it believed relevant, the Board ultimately concluded that the fund's management fee structure is fair and reasonable, and that the continuation of the fund's Advisory Contracts should be approved.
Corporate Headquarters
245 Summer St.
Boston, MA 02210
www.fidelity.com
DGF-ANN-0918
1.536090.121
Fidelity® Dividend Growth Fund Class K
Annual Report July 31, 2018 |
|
Contents
To view a fund's proxy voting guidelines and proxy voting record for the 12-month period ended June 30, visit http://www.fidelity.com/proxyvotingresults or visit the Securities and Exchange Commission's (SEC) web site at http://www.sec.gov.
You may also call 1-800-835-5092 to request a free copy of the proxy voting guidelines.
Standard & Poor's, S&P and S&P 500 are registered service marks of The McGraw-Hill Companies, Inc. and have been licensed for use by Fidelity Distributors Corporation.
Other third-party marks appearing herein are the property of their respective owners.
All other marks appearing herein are registered or unregistered trademarks or service marks of FMR LLC or an affiliated company. © 2018 FMR LLC. All rights reserved.
This report and the financial statements contained herein are submitted for the general information of the shareholders of the Fund. This report is not authorized for distribution to prospective investors in the Fund unless preceded or accompanied by an effective prospectus.
A fund files its complete schedule of portfolio holdings with the SEC for the first and third quarters of each fiscal year on Form N-Q. Forms N-Q are available on the SEC’s web site at http://www.sec.gov. A fund's Forms N-Q may be reviewed and copied at the SEC’s Public Reference Room in Washington, DC. Information regarding the operation of the SEC's Public Reference Room may be obtained by calling 1-800-SEC-0330.
For a complete list of a fund's portfolio holdings, view the most recent holdings listing, semiannual report, or annual report on Fidelity's web site at http://www.fidelity.com, http://www.institutional.fidelity.com, or http://www.401k.com, as applicable.
NOT FDIC INSURED •MAY LOSE VALUE •NO BANK GUARANTEE
Neither the Fund nor Fidelity Distributors Corporation is a bank.
Performance: The Bottom Line
Average annual total return reflects the change in the value of an investment, assuming reinvestment of distributions from dividend income and capital gains (the profits earned upon the sale of securities that have grown in value, if any) and assuming a constant rate of performance each year. The hypothetical investment and the average annual total returns do not reflect the deduction of taxes that a shareholder would pay on fund distributions or the redemption of fund shares. During periods of reimbursement by Fidelity, a fund’s total return will be greater than it would be had the reimbursement not occurred. How a fund did yesterday is no guarantee of how it will do tomorrow.
Average Annual Total Returns
| For the periods ended July 31, 2018 | Past 1 year | Past 5 years | Past 10 years |
| Class K | 13.70% | 10.71% | 10.04% |
The initial offering of Class K shares took place on May 9, 2008. Returns prior to May 9, 2008 are those of Fidelity® Dividend Growth Fund, the original class of the fund.
$10,000 Over 10 Years
Let's say hypothetically that $10,000 was invested in Fidelity® Dividend Growth Fund - Class K on July 31, 2008.
The chart shows how the value of your investment would have changed, and also shows how the S&P 500® Index performed over the same period.
See above for additional information regarding the performance of Class K.
| Period Ending Values |
| $26,026 | Fidelity® Dividend Growth Fund - Class K |
| $27,551 | S&P 500® Index |
Management's Discussion of Fund Performance
Market Recap: The U.S. equity bellwether S&P 500
® index gained 16.24% for the 12 months ending July 31, 2018, despite a resurgence in volatility that challenged the multiyear bull market. Stocks maintained their steady growth until a sharp reversal in February, as volatility spiked amid fear that rising inflation and the potential for the economy to overheat would prompt the U.S. Federal Reserve to pick up the pace of interest rate hikes. The index posted its first negative monthly result since October 2016, and then lost further ground in March on fear of a global trade war. The market stabilized in April and turned upward through mid-June, when escalating trade tension between the U.S. and China soured investor sentiment. The resulting uncertainty lingered into July, but strong corporate earnings helped the S&P 500 rise 3.72% that month to cap the period. For the full one-year period, growth handily topped value, while small-caps bested large-caps. By sector, information technology (+28%) led the way, boosted by strong earnings growth from several major index constituents. Consumer discretionary rose roughly 24%, driven by retailers (+49%). Energy (+20%) gained alongside higher oil prices. Laggards were telecommunication services (-2%), consumer staples (0%) and utilities (+3%), defensive groups that struggled amid rising interest rates and a general preference for risk. Real estate (+5%) fared a bit better but still lagged, as did financials, industrials, health care (each up 13%) and materials (+11%).
Comments from Portfolio Manager Gordon Scott: For the fiscal year, the fund’s share classes gained roughly 14%, lagging the benchmark S&P 500
®. Versus the benchmark, stock picking in the consumer discretionary sector – especially in the retailing segment – detracted most. A sizable underweighting in information technology, the benchmark’s top-performing sector, also hurt our relative result, as did my choices in health care. Several of the fund’s largest relative detractors were strong-performing benchmark names we either didn’t own or underweighted, mostly because they did not meet my valuation criteria and did not pay a dividend or otherwise return capital to shareholders. These included two retailing stocks, Amazon.com – the fund’s largest relative detractor by a wide margin – and video-streaming service provider Netflix. Google parent Alphabet also was in this group. Overweighting tobacco stock Altria Group and the shares of integrated drug distributor Cardinal Health also worked against us. I established positions in both of these stocks in August. Conversely, stock selection in consumer staples and materials added value versus the benchmark this period, as did an underweighting in utilities. Cigarette maker Philip Morris International – which I bought in May – was the fund’s top relative contributor. I’ll also mention media and entertainment holding Twenty-First Century Fox and railroad Union Pacific. Twenty-First Century Fox was not held at period end.
The views expressed above reflect those of the portfolio manager(s) only through the end of the period as stated on the cover of this report and do not necessarily represent the views of Fidelity or any other person in the Fidelity organization. Any such views are subject to change at any time based upon market or other conditions and Fidelity disclaims any responsibility to update such views. These views may not be relied on as investment advice and, because investment decisions for a Fidelity fund are based on numerous factors, may not be relied on as an indication of trading intent on behalf of any Fidelity fund.
Note to Shareholders: On January 1, 2018, Gordon Scott became sole Portfolio Manager of the fund, after having served as Co-Manager alongside Ramona Persaud since April 2017.
Investment Summary (Unaudited)
Top Ten Stocks as of July 31, 2018
| | % of fund's net assets |
| Comcast Corp. Class A | 3.9 |
| Exxon Mobil Corp. | 3.7 |
| Apple, Inc. | 3.3 |
| Altria Group, Inc. | 3.2 |
| Berkshire Hathaway, Inc. Class B | 3.0 |
| Chevron Corp. | 2.9 |
| JPMorgan Chase & Co. | 2.6 |
| Verizon Communications, Inc. | 2.3 |
| Bank of America Corp. | 2.1 |
| Wells Fargo & Co. | 2.0 |
| | 29.0 |
Top Five Market Sectors as of July 31, 2018
| | % of fund's net assets |
| Financials | 16.7 |
| Consumer Discretionary | 15.1 |
| Industrials | 14.7 |
| Health Care | 12.5 |
| Information Technology | 12.1 |
Asset Allocation (% of fund's net assets)
| As of July 31, 2018* |
| | Stocks | 96.9% |
| | Short-Term Investments and Net Other Assets (Liabilities) | 3.1% |

* Foreign investments - 5.6%
Schedule of Investments July 31, 2018
Showing Percentage of Net Assets
| Common Stocks - 96.9% | | | |
| | | Shares | Value (000s) |
| CONSUMER DISCRETIONARY - 15.1% | | | |
| Auto Components - 1.9% | | | |
| BorgWarner, Inc. | | 756,400 | $34,810 |
| Delphi Technologies PLC | | 144,366 | 6,521 |
| Gentex Corp. | | 2,165,900 | 50,249 |
| Lear Corp. | | 205,000 | 36,927 |
| Tenneco, Inc. | | 291,500 | 13,438 |
| | | | 141,945 |
| Automobiles - 1.2% | | | |
| General Motors Co. | | 1,816,700 | 68,871 |
| Thor Industries, Inc. | | 167,300 | 15,868 |
| | | | 84,739 |
| Distributors - 0.2% | | | |
| LKQ Corp. (a) | | 418,000 | 14,011 |
| Diversified Consumer Services - 0.5% | | | |
| H&R Block, Inc. | | 1,320,000 | 33,211 |
| Household Durables - 1.3% | | | |
| D.R. Horton, Inc. | | 640,300 | 27,981 |
| Lennar Corp.: | | | |
| Class A | | 704,800 | 36,840 |
| Class B | | 13,702 | 592 |
| NVR, Inc. (a) | | 4,700 | 12,969 |
| Tupperware Brands Corp. | | 416,900 | 15,304 |
| | | | 93,686 |
| Internet & Direct Marketing Retail - 0.4% | | | |
| Liberty Interactive Corp. QVC Group Series A (a) | | 1,434,000 | 30,530 |
| Leisure Products - 0.1% | | | |
| Brunswick Corp. | | 106,700 | 6,861 |
| Media - 8.5% | | | |
| AMC Networks, Inc. Class A (a) | | 317,600 | 19,148 |
| CBS Corp. Class B | | 284,500 | 14,985 |
| Charter Communications, Inc. Class A (a) | | 92,300 | 28,113 |
| Cinemark Holdings, Inc. | | 756,900 | 27,188 |
| Comcast Corp. Class A | | 7,932,392 | 283,819 |
| Discovery Communications, Inc. Class A (a)(b) | | 897,500 | 23,856 |
| GCI Liberty, Inc. (a) | | 571,138 | 27,477 |
| Interpublic Group of Companies, Inc. | | 2,559,400 | 57,714 |
| Liberty Broadband Corp. Class A (a) | | 285,934 | 22,686 |
| Liberty Global PLC Class A (a) | | 1,349,200 | 38,088 |
| Liberty Media Corp.: | | | |
| Liberty Media Class A (a) | | 608,759 | 20,400 |
| Liberty SiriusXM Series A (a) | | 466,000 | 21,967 |
| Omnicom Group, Inc. | | 415,800 | 28,620 |
| Viacom, Inc. Class B (non-vtg.) | | 249,500 | 7,248 |
| | | | 621,309 |
| Multiline Retail - 0.3% | | | |
| Dollar General Corp. | | 218,900 | 21,485 |
| Specialty Retail - 0.3% | | | |
| Gap, Inc. | | 232,900 | 7,027 |
| TJX Companies, Inc. | | 122,300 | 11,895 |
| | | | 18,922 |
| Textiles, Apparel & Luxury Goods - 0.4% | | | |
| Hanesbrands, Inc. | | 1,410,400 | 31,396 |
|
| TOTAL CONSUMER DISCRETIONARY | | | 1,098,095 |
|
| CONSUMER STAPLES - 9.3% | | | |
| Beverages - 0.1% | | | |
| PepsiCo, Inc. | | 48,800 | 5,612 |
| Food & Staples Retailing - 0.6% | | | |
| Walgreens Boots Alliance, Inc. | | 650,000 | 43,953 |
| Food Products - 2.7% | | | |
| ConAgra Foods, Inc. | | 630,400 | 23,142 |
| General Mills, Inc. | | 646,300 | 29,769 |
| Ingredion, Inc. | | 97,300 | 9,856 |
| The Hershey Co. | | 347,400 | 34,118 |
| The J.M. Smucker Co. | | 114,300 | 12,701 |
| The Kraft Heinz Co. | | 1,177,600 | 70,950 |
| Tyson Foods, Inc. Class A | | 221,200 | 12,752 |
| | | | 193,288 |
| Household Products - 2.1% | | | |
| Kimberly-Clark Corp. | | 588,300 | 66,984 |
| Procter & Gamble Co. | | 85,400 | 6,907 |
| Spectrum Brands Holdings, Inc. | | 864,300 | 75,514 |
| | | | 149,405 |
| Personal Products - 0.1% | | | |
| Edgewell Personal Care Co. (a) | | 195,000 | 10,503 |
| Tobacco - 3.7% | | | |
| Altria Group, Inc. | | 4,033,600 | 236,692 |
| British American Tobacco PLC (United Kingdom) | | 215,960 | 11,872 |
| Philip Morris International, Inc. | | 256,300 | 22,119 |
| | | | 270,683 |
|
| TOTAL CONSUMER STAPLES | | | 673,444 |
|
| ENERGY - 8.4% | | | |
| Oil, Gas & Consumable Fuels - 8.4% | | | |
| BP PLC sponsored ADR | | 1,124,200 | 50,690 |
| Chevron Corp. | | 1,652,100 | 208,611 |
| Exxon Mobil Corp. | | 3,292,797 | 268,396 |
| Suncor Energy, Inc. | | 926,300 | 39,007 |
| Total SA sponsored ADR | | 656,271 | 42,822 |
| | | | 609,526 |
| FINANCIALS - 16.7% | | | |
| Banks - 7.8% | | | |
| Bank of America Corp. | | 4,950,417 | 152,869 |
| Citigroup, Inc. | | 906,500 | 65,168 |
| JPMorgan Chase & Co. | | 1,653,435 | 190,062 |
| Signature Bank | | 125,700 | 13,791 |
| Wells Fargo & Co. | | 2,546,593 | 145,894 |
| | | | 567,784 |
| Capital Markets - 0.2% | | | |
| Diamond Hill Investment Group, Inc. | | 34,938 | 6,699 |
| KKR & Co. LP | | 265,000 | 7,256 |
| | | | 13,955 |
| Consumer Finance - 0.7% | | | |
| American Express Co. | | 492,400 | 49,004 |
| Imperial Holdings, Inc. warrants 4/11/19 (a) | | 48,012 | 0 |
| | | | 49,004 |
| Diversified Financial Services - 3.0% | | | |
| Berkshire Hathaway, Inc. Class B (a) | | 1,095,100 | 216,687 |
| Insurance - 5.0% | | | |
| Allstate Corp. | | 500,000 | 47,560 |
| American International Group, Inc. | | 653,700 | 36,091 |
| Chubb Ltd. | | 674,900 | 94,297 |
| MetLife, Inc. | | 1,461,000 | 66,826 |
| The Travelers Companies, Inc. | | 838,100 | 109,070 |
| Torchmark Corp. | | 136,900 | 12,057 |
| | | | 365,901 |
|
| TOTAL FINANCIALS | | | 1,213,331 |
|
| HEALTH CARE - 12.5% | | | |
| Biotechnology - 2.5% | | | |
| Amgen, Inc. | | 584,210 | 114,826 |
| Gilead Sciences, Inc. | | 790,800 | 61,548 |
| United Therapeutics Corp. (a) | | 63,500 | 7,805 |
| | | | 184,179 |
| Health Care Providers & Services - 7.4% | | | |
| AmerisourceBergen Corp. | | 441,900 | 36,161 |
| Anthem, Inc. | | 401,800 | 101,655 |
| Cardinal Health, Inc. | | 896,900 | 44,800 |
| Cigna Corp. | | 258,100 | 46,308 |
| CVS Health Corp. | | 1,329,400 | 86,225 |
| DaVita HealthCare Partners, Inc. (a) | | 354,000 | 24,879 |
| Express Scripts Holding Co. (a) | | 94,000 | 7,469 |
| HCA Holdings, Inc. | | 243,800 | 30,287 |
| McKesson Corp. | | 218,800 | 27,481 |
| Patterson Companies, Inc. (b) | | 934,400 | 22,911 |
| Quest Diagnostics, Inc. | | 406,400 | 43,777 |
| UnitedHealth Group, Inc. | | 112,500 | 28,487 |
| Universal Health Services, Inc. Class B | | 317,300 | 38,742 |
| | | | 539,182 |
| Pharmaceuticals - 2.6% | | | |
| GlaxoSmithKline PLC | | 863,046 | 17,926 |
| Johnson & Johnson | | 446,143 | 59,123 |
| Pfizer, Inc. | | 2,751,900 | 109,883 |
| | | | 186,932 |
|
| TOTAL HEALTH CARE | | | 910,293 |
|
| INDUSTRIALS - 14.7% | | | |
| Aerospace & Defense - 1.0% | | | |
| Rockwell Collins, Inc. | | 48,600 | 6,755 |
| United Technologies Corp. | | 472,900 | 64,191 |
| | | | 70,946 |
| Air Freight & Logistics - 1.4% | | | |
| United Parcel Service, Inc. Class B | | 822,200 | 98,574 |
| Airlines - 1.7% | | | |
| American Airlines Group, Inc. | | 766,300 | 30,300 |
| Delta Air Lines, Inc. | | 1,054,500 | 57,386 |
| Southwest Airlines Co. | | 600,100 | 34,902 |
| | | | 122,588 |
| Building Products - 0.2% | | | |
| Johnson Controls International PLC | | 408,100 | 15,308 |
| Commercial Services & Supplies - 0.7% | | | |
| Deluxe Corp. | | 610,800 | 35,994 |
| Stericycle, Inc. (a) | | 189,411 | 13,232 |
| | | | 49,226 |
| Electrical Equipment - 0.9% | | | |
| Acuity Brands, Inc. | | 265,800 | 36,954 |
| EnerSys | | 132,200 | 10,850 |
| Regal Beloit Corp. | | 215,791 | 18,547 |
| | | | 66,351 |
| Industrial Conglomerates - 1.5% | | | |
| General Electric Co. | | 6,731,400 | 91,749 |
| ITT, Inc. | | 266,000 | 15,074 |
| | | | 106,823 |
| Machinery - 3.5% | | | |
| Allison Transmission Holdings, Inc. | | 376,002 | 17,672 |
| Crane Co. | | 363,500 | 32,922 |
| Cummins, Inc. | | 402,200 | 57,438 |
| Oshkosh Corp. | | 342,100 | 25,743 |
| PACCAR, Inc. | | 1,022,500 | 67,199 |
| Snap-On, Inc. | | 322,700 | 54,727 |
| | | | 255,701 |
| Professional Services - 0.6% | | | |
| Dun & Bradstreet Corp. | | 188,800 | 23,768 |
| Manpower, Inc. | | 245,900 | 22,933 |
| | | | 46,701 |
| Road & Rail - 3.2% | | | |
| Knight-Swift Transportation Holdings, Inc. Class A | | 620,800 | 20,207 |
| Norfolk Southern Corp. | | 464,300 | 78,467 |
| Union Pacific Corp. | | 903,900 | 135,486 |
| | | | 234,160 |
|
| TOTAL INDUSTRIALS | | | 1,066,378 |
|
| INFORMATION TECHNOLOGY - 12.1% | | | |
| Communications Equipment - 1.7% | | | |
| Cisco Systems, Inc. | | 2,142,986 | 90,627 |
| InterDigital, Inc. | | 41,900 | 3,455 |
| Juniper Networks, Inc. | | 1,044,200 | 27,504 |
| | | | 121,586 |
| Electronic Equipment & Components - 0.7% | | | |
| Avnet, Inc. | | 132,500 | 5,810 |
| Dell Technologies, Inc. (a) | | 303,300 | 28,061 |
| Jabil, Inc. | | 212,200 | 5,978 |
| Tech Data Corp. (a) | | 150,800 | 12,578 |
| | | | 52,427 |
| IT Services - 1.4% | | | |
| DXC Technology Co. | | 349,500 | 29,617 |
| IBM Corp. | | 389,100 | 56,392 |
| Perspecta, Inc. | | 145,600 | 3,160 |
| The Western Union Co. | | 568,600 | 11,463 |
| | | | 100,632 |
| Semiconductors & Semiconductor Equipment - 1.5% | | | |
| Analog Devices, Inc. | | 77,000 | 7,403 |
| Applied Materials, Inc. | | 156,700 | 7,620 |
| Intel Corp. | | 981,700 | 47,220 |
| KLA-Tencor Corp. | | 69,200 | 8,125 |
| Qualcomm, Inc. | | 630,983 | 40,440 |
| | | | 110,808 |
| Software - 1.8% | | | |
| Micro Focus International PLC | | 781,200 | 12,747 |
| Oracle Corp. | | 2,494,200 | 118,923 |
| | | | 131,670 |
| Technology Hardware, Storage & Peripherals - 5.0% | | | |
| Apple, Inc. | | 1,273,418 | 242,319 |
| Hewlett Packard Enterprise Co. | | 2,143,000 | 33,088 |
| HP, Inc. | | 2,424,000 | 55,946 |
| NCR Corp. (a) | | 230,200 | 6,427 |
| Xerox Corp. | | 1,027,600 | 26,687 |
| | | | 364,467 |
|
| TOTAL INFORMATION TECHNOLOGY | | | 881,590 |
|
| MATERIALS - 4.3% | | | |
| Chemicals - 3.2% | | | |
| DowDuPont, Inc. | | 1,180,700 | 81,197 |
| Huntsman Corp. | | 779,200 | 26,127 |
| LyondellBasell Industries NV Class A | | 667,500 | 73,952 |
| PPG Industries, Inc. | | 242,600 | 26,846 |
| The Chemours Co. LLC | | 481,000 | 22,035 |
| | | | 230,157 |
| Metals & Mining - 1.1% | | | |
| Freeport-McMoRan, Inc. | | 912,400 | 15,055 |
| Nucor Corp. | | 529,400 | 35,433 |
| Steel Dynamics, Inc. | | 653,700 | 30,783 |
| | | | 81,271 |
|
| TOTAL MATERIALS | | | 311,428 |
|
| TELECOMMUNICATION SERVICES - 2.3% | | | |
| Diversified Telecommunication Services - 2.3% | | | |
| Verizon Communications, Inc. | | 3,191,600 | 164,814 |
| UTILITIES - 1.5% | | | |
| Electric Utilities - 1.1% | | | |
| Exelon Corp. | | 845,900 | 35,951 |
| PPL Corp. | | 1,664,400 | 47,885 |
| | | | 83,836 |
| Independent Power and Renewable Electricity Producers - 0.4% | | | |
| The AES Corp. | | 2,177,700 | 29,094 |
|
| TOTAL UTILITIES | | | 112,930 |
|
| TOTAL COMMON STOCKS | | | |
| (Cost $6,330,341) | | | 7,041,829 |
|
| Money Market Funds - 3.4% | | | |
| Fidelity Cash Central Fund, 1.96% (c) | | 225,439,359 | 225,484 |
| Fidelity Securities Lending Cash Central Fund 1.97% (c)(d) | | 19,770,654 | 19,773 |
| TOTAL MONEY MARKET FUNDS | | | |
| (Cost $245,253) | | | 245,257 |
| TOTAL INVESTMENT IN SECURITIES - 100.3% | | | |
| (Cost $6,575,594) | | | 7,287,086 |
| NET OTHER ASSETS (LIABILITIES) - (0.3)% | | | (20,275) |
| NET ASSETS - 100% | | | $7,266,811 |
Values shown as $0 in the Schedule of Investments may reflect amounts less than $500.
Legend
(a) Non-income producing
(b) Security or a portion of the security is on loan at period end.
(c) Affiliated fund that is generally available only to investment companies and other accounts managed by Fidelity Investments. The rate quoted is the annualized seven-day yield of the fund at period end. A complete unaudited listing of the fund's holdings as of its most recent quarter end is available upon request. In addition, each Fidelity Central Fund's financial statements, which are not covered by the Fund's Report of Independent Registered Public Accounting Firm, are available on the SEC's website or upon request.
(d) Investment made with cash collateral received from securities on loan.
Affiliated Central Funds
Information regarding fiscal year to date income earned by the Fund from investments in Fidelity Central Funds is as follows:
| Fund | Income earned |
| | (Amounts in thousands) |
| Fidelity Cash Central Fund | $4,684 |
| Fidelity Securities Lending Cash Central Fund | 193 |
| Total | $4,877 |
Amounts in the income column in the above table include any capital gain distributions from underlying funds, which are presented in the corresponding line-item in the Statement of Operations if applicable.
Investment Valuation
The following is a summary of the inputs used, as of July 31, 2018, involving the Fund's assets and liabilities carried at fair value. The inputs or methodology used for valuing securities may not be an indication of the risk associated with investing in those securities. For more information on valuation inputs, and their aggregation into the levels used below, please refer to the Investment Valuation section in the accompanying Notes to Financial Statements.
| | Valuation Inputs at Reporting Date: |
| Description | Total | Level 1 | Level 2 | Level 3 |
| (Amounts in thousands) | | | | |
| Investments in Securities: | | | | |
| Equities: | | | | |
| Consumer Discretionary | $1,098,095 | $1,098,095 | $-- | $-- |
| Consumer Staples | 673,444 | 661,572 | 11,872 | -- |
| Energy | 609,526 | 609,526 | -- | -- |
| Financials | 1,213,331 | 1,213,331 | -- | -- |
| Health Care | 910,293 | 892,367 | 17,926 | -- |
| Industrials | 1,066,378 | 1,066,378 | -- | -- |
| Information Technology | 881,590 | 868,843 | 12,747 | -- |
| Materials | 311,428 | 311,428 | -- | -- |
| Telecommunication Services | 164,814 | 164,814 | -- | -- |
| Utilities | 112,930 | 112,930 | -- | -- |
| Money Market Funds | 245,257 | 245,257 | -- | -- |
| Total Investments in Securities: | $7,287,086 | $7,244,541 | $42,545 | $-- |
See accompanying notes which are an integral part of the financial statements.
Financial Statements
Statement of Assets and Liabilities
| Amounts in thousands (except per-share amounts) | | July 31, 2018 |
| Assets | | |
Investment in securities, at value (including securities loaned of $19,633) — See accompanying schedule:
Unaffiliated issuers (cost $6,330,341) | $7,041,829 | |
| Fidelity Central Funds (cost $245,253) | 245,257 | |
| Total Investment in Securities (cost $6,575,594) | | $7,287,086 |
| Cash | | 130 |
| Receivable for investments sold | | 14,606 |
| Receivable for fund shares sold | | 1,607 |
| Dividends receivable | | 5,616 |
| Distributions receivable from Fidelity Central Funds | | 297 |
| Prepaid expenses | | 18 |
| Other receivables | | 2,027 |
| Total assets | | 7,311,387 |
| Liabilities | | |
| Payable for investments purchased | $17,559 | |
| Payable for fund shares redeemed | 3,650 | |
| Accrued management fee | 1,971 | |
| Other affiliated payables | 886 | |
| Other payables and accrued expenses | 738 | |
| Collateral on securities loaned | 19,772 | |
| Total liabilities | | 44,576 |
| Net Assets | | $7,266,811 |
| Net Assets consist of: | | |
| Paid in capital | | $5,489,947 |
| Undistributed net investment income | | 69,283 |
| Accumulated undistributed net realized gain (loss) on investments and foreign currency transactions | | 996,083 |
| Net unrealized appreciation (depreciation) on investments and assets and liabilities in foreign currencies | | 711,498 |
| Net Assets | | $7,266,811 |
| Dividend Growth: | | |
| Net Asset Value, offering price and redemption price per share ($6,054,907 ÷ 179,218.6 shares) | | $33.79 |
| Class K: | | |
| Net Asset Value, offering price and redemption price per share ($1,211,904 ÷ 35,895.8 shares) | | $33.76 |
See accompanying notes which are an integral part of the financial statements.
Statement of Operations
| Amounts in thousands | | Year ended July 31, 2018 |
| Investment Income | | |
| Dividends | | $172,552 |
| Interest | | 1,030 |
| Income from Fidelity Central Funds | | 4,877 |
| Total income | | 178,459 |
| Expenses | | |
| Management fee | | |
| Basic fee | $39,632 | |
| Performance adjustment | (15,217) | |
| Transfer agent fees | 9,666 | |
| Accounting and security lending fees | 1,182 | |
| Custodian fees and expenses | 98 | |
| Independent trustees' fees and expenses | 31 | |
| Registration fees | 61 | |
| Audit | 75 | |
| Legal | 21 | |
| Miscellaneous | 56 | |
| Total expenses before reductions | 35,605 | |
| Expense reductions | (704) | |
| Total expenses after reductions | | 34,901 |
| Net investment income (loss) | | 143,558 |
| Realized and Unrealized Gain (Loss) | | |
| Net realized gain (loss) on: | | |
| Investment securities: | | |
| Unaffiliated issuers | 1,791,216 | |
| Fidelity Central Funds | 31 | |
| Foreign currency transactions | 240 | |
| Total net realized gain (loss) | | 1,791,487 |
| Change in net unrealized appreciation (depreciation) on: | | |
| Investment securities: | | |
| Unaffiliated issuers | (993,673) | |
| Fidelity Central Funds | (31) | |
| Assets and liabilities in foreign currencies | (16) | |
| Total change in net unrealized appreciation (depreciation) | | (993,720) |
| Net gain (loss) | | 797,767 |
| Net increase (decrease) in net assets resulting from operations | | $941,325 |
See accompanying notes which are an integral part of the financial statements.
Statement of Changes in Net Assets
| Amounts in thousands | Year ended July 31, 2018 | Year ended July 31, 2017 |
| Increase (Decrease) in Net Assets | | |
| Operations | | |
| Net investment income (loss) | $143,558 | $120,267 |
| Net realized gain (loss) | 1,791,487 | 505,117 |
| Change in net unrealized appreciation (depreciation) | (993,720) | 287,960 |
| Net increase (decrease) in net assets resulting from operations | 941,325 | 913,344 |
| Distributions to shareholders from net investment income | (127,264) | (120,213) |
| Distributions to shareholders from net realized gain | (1,053,472) | – |
| Total distributions | (1,180,736) | (120,213) |
| Share transactions - net increase (decrease) | 76,969 | (903,170) |
| Total increase (decrease) in net assets | (162,442) | (110,039) |
| Net Assets | | |
| Beginning of period | 7,429,253 | 7,539,292 |
| End of period | $7,266,811 | $7,429,253 |
| Other Information | | |
| Undistributed net investment income end of period | $69,283 | $62,206 |
See accompanying notes which are an integral part of the financial statements.
Financial Highlights
Fidelity Dividend Growth Fund
| Years ended July 31, | 2018 | 2017 | 2016 | 2015 | 2014 |
| Selected Per–Share Data | | | | | |
| Net asset value, beginning of period | $35.06 | $31.51 | $34.46 | $37.27 | $35.33 |
| Income from Investment Operations | | | | | |
| Net investment income (loss)A | .65 | .53 | .48 | .49 | .56 |
| Net realized and unrealized gain (loss) | 3.72 | 3.53 | (.61)B | 2.71 | 4.98 |
| Total from investment operations | 4.37 | 4.06 | (.13) | 3.20 | 5.54 |
| Distributions from net investment income | (.60) | (.51) | (.47) | (.51) | (.37) |
| Distributions from net realized gain | (5.04) | – | (2.36) | (5.49) | (3.23) |
| Total distributions | (5.64) | (.51) | (2.82)C | (6.01)D | (3.60) |
| Net asset value, end of period | $33.79 | $35.06 | $31.51 | $34.46 | $37.27 |
| Total ReturnE | 13.60% | 13.06% | .26%B | 9.54% | 17.30% |
| Ratios to Average Net AssetsF,G | | | | | |
| Expenses before reductions | .50% | .52% | .62% | .69% | .56% |
| Expenses net of fee waivers, if any | .50% | .52% | .61% | .68% | .56% |
| Expenses net of all reductions | .49% | .52% | .61% | .68% | .56% |
| Net investment income (loss) | 1.94% | 1.60% | 1.59% | 1.43% | 1.58% |
| Supplemental Data | | | | | |
| Net assets, end of period (in millions) | $6,055 | $5,952 | $5,849 | $6,474 | $6,481 |
| Portfolio turnover rateH | 115% | 43% | 30% | 64% | 99% |
A Calculated based on average shares outstanding during the period.
B Net realized and unrealized gain (loss) per share reflects proceeds received from litigation which amounted to $.01 per share. Excluding these litigation proceeds, the total return would have been .22%.
C Total distributions of $2.82 per share is comprised of distributions from net investment income of $.465 and distributions from net realized gain of $2.358 per share.
D Total distributions of $6.01 per share is comprised of distributions from net investment income of $.512 and distributions from net realized gain of $5.493 per share.
E Total returns would have been lower if certain expenses had not been reduced during the applicable periods shown.
F Fees and expenses of any underlying Fidelity Central Funds are not included in the Fund's expense ratio. The Fund indirectly bears its proportionate share of the expenses of any underlying Fidelity Central Funds.
G Expense ratios reflect operating expenses of the class. Expenses before reductions do not reflect amounts reimbursed by the investment adviser or reductions from brokerage service arrangements or reductions from other expense offset arrangements and do not represent the amount paid by the class during periods when reimbursements or reductions occur. Expenses net of fee waivers reflect expenses after reimbursement by the investment adviser but prior to reductions from brokerage service arrangements or other expense offset arrangements. Expenses net of all reductions represent the net expenses paid by the class.
H Amount does not include the portfolio activity of any underlying Fidelity Central Funds.
See accompanying notes which are an integral part of the financial statements.
Fidelity Dividend Growth Fund Class K
| Years ended July 31, | 2018 | 2017 | 2016 | 2015 | 2014 |
| Selected Per–Share Data | | | | | |
| Net asset value, beginning of period | $35.04 | $31.50 | $34.45 | $37.27 | $35.34 |
| Income from Investment Operations | | | | | |
| Net investment income (loss)A | .69 | .56 | .52 | .53 | .60 |
| Net realized and unrealized gain (loss) | 3.71 | 3.53 | (.61)B | 2.70 | 4.97 |
| Total from investment operations | 4.40 | 4.09 | (.09) | 3.23 | 5.57 |
| Distributions from net investment income | (.64) | (.55) | (.50) | (.56) | (.42) |
| Distributions from net realized gain | (5.04) | – | (2.36) | (5.49) | (3.23) |
| Total distributions | (5.68) | (.55) | (2.86) | (6.05) | (3.64)C |
| Net asset value, end of period | $33.76 | $35.04 | $31.50 | $34.45 | $37.27 |
| Total ReturnD | 13.70% | 13.16% | .39%B | 9.65% | 17.44% |
| Ratios to Average Net AssetsE,F | | | | | |
| Expenses before reductions | .40% | .41% | .50% | .57% | .44% |
| Expenses net of fee waivers, if any | .40% | .41% | .50% | .57% | .43% |
| Expenses net of all reductions | .39% | .41% | .49% | .57% | .43% |
| Net investment income (loss) | 2.05% | 1.71% | 1.71% | 1.54% | 1.70% |
| Supplemental Data | | | | | |
| Net assets, end of period (in millions) | $1,212 | $1,477 | $1,691 | $1,942 | $2,057 |
| Portfolio turnover rateG | 115% | 43% | 30% | 64% | 99% |
A Calculated based on average shares outstanding during the period.
B Net realized and unrealized gain (loss) per share reflects proceeds received from litigation which amounted to $.01 per share. Excluding these litigation proceeds, the total return would have been .35%.
C Total distributions of $3.64 per share is comprised of distributions from net investment income of $.419 and distributions from net realized gain of $3.225 per share.
D Total returns would have been lower if certain expenses had not been reduced during the applicable periods shown.
E Fees and expenses of any underlying Fidelity Central Funds are not included in the Fund's expense ratio. The Fund indirectly bears its proportionate share of the expenses of any underlying Fidelity Central Funds.
F Expense ratios reflect operating expenses of the class. Expenses before reductions do not reflect amounts reimbursed by the investment adviser or reductions from brokerage service arrangements or reductions from other expense offset arrangements and do not represent the amount paid by the class during periods when reimbursements or reductions occur. Expenses net of fee waivers reflect expenses after reimbursement by the investment adviser but prior to reductions from brokerage service arrangements or other expense offset arrangements. Expenses net of all reductions represent the net expenses paid by the class.
G Amount does not include the portfolio activity of any underlying Fidelity Central Funds.
See accompanying notes which are an integral part of the financial statements.
Notes to Financial Statements
For the period ended July 31, 2018
(Amounts in thousands except percentages)
1. Organization.
Fidelity Dividend Growth Fund (the Fund) is a fund of Fidelity Securities Fund (the Trust) and is authorized to issue an unlimited number of shares. The Trust is registered under the Investment Company Act of 1940, as amended (the 1940 Act), as an open-end management investment company organized as a Massachusetts business trust. The Fund offers Dividend Growth and Class K shares, each of which has equal rights as to assets and voting privileges. Each class has exclusive voting rights with respect to matters that affect that class.
2. Investments in Fidelity Central Funds.
The Fund invests in Fidelity Central Funds, which are open-end investment companies generally available only to other investment companies and accounts managed by the investment adviser and its affiliates. The Fund's Schedule of Investments lists each of the Fidelity Central Funds held as of period end, if any, as an investment of the Fund, but does not include the underlying holdings of each Fidelity Central Fund. As an Investing Fund, the Fund indirectly bears its proportionate share of the expenses of the underlying Fidelity Central Funds.
The Money Market Central Funds seek preservation of capital and current income and are managed by Fidelity Investments Money Management, Inc. (FIMM), an affiliate of the investment adviser. Annualized expenses of the Money Market Central Funds as of their most recent shareholder report date are less than .005%.
A complete unaudited list of holdings for each Fidelity Central Fund is available upon request or at the Securities and Exchange Commission (the SEC) website at www.sec.gov. In addition, the financial statements of the Fidelity Central Funds, which are not covered by the Fund's Report of Independent Registered Public Accounting Firm, are available on the SEC website or upon request.
3. Significant Accounting Policies.
The Fund is an investment company and applies the accounting and reporting guidance of the Financial Accounting Standards Board (FASB) Accounting Standards Codification Topic 946 Financial Services – Investments Companies. The financial statements have been prepared in conformity with accounting principles generally accepted in the United States of America (GAAP), which require management to make certain estimates and assumptions at the date of the financial statements. Actual results could differ from those estimates. Subsequent events, if any, through the date that the financial statements were issued have been evaluated in the preparation of the financial statements. The following summarizes the significant accounting policies of the Fund:
Investment Valuation. Investments are valued as of 4:00 p.m. Eastern time on the last calendar day of the period. The Board of Trustees (the Board) has delegated the day to day responsibility for the valuation of the Fund's investments to the Fair Value Committee (the Committee) established by the Fund's investment adviser. In accordance with valuation policies and procedures approved by the Board, the Fund attempts to obtain prices from one or more third party pricing vendors or brokers to value its investments. When current market prices, quotations or currency exchange rates are not readily available or reliable, investments will be fair valued in good faith by the Committee, in accordance with procedures adopted by the Board. Factors used in determining fair value vary by investment type and may include market or investment specific events. The frequency with which these procedures are used cannot be predicted and they may be utilized to a significant extent. The Committee oversees the Fund's valuation policies and procedures and reports to the Board on the Committee's activities and fair value determinations. The Board monitors the appropriateness of the procedures used in valuing the Fund's investments and ratifies the fair value determinations of the Committee.
The Fund categorizes the inputs to valuation techniques used to value its investments into a disclosure hierarchy consisting of three levels as shown below:
- Level 1 – quoted prices in active markets for identical investments
- Level 2 – other significant observable inputs (including quoted prices for similar investments, interest rates, prepayment speeds, etc.)
- Level 3 – unobservable inputs (including the Fund's own assumptions based on the best information available)
Valuation techniques used to value the Fund's investments by major category are as follows:
Equity securities, including restricted securities, for which market quotations are readily available, are valued at the last reported sale price or official closing price as reported by a third party pricing vendor on the primary market or exchange on which they are traded and are categorized as Level 1 in the hierarchy. In the event there were no sales during the day or closing prices are not available, securities are valued at the last quoted bid price or may be valued using the last available price and are generally categorized as Level 2 in the hierarchy. For foreign equity securities, when market or security specific events arise, comparisons to the valuation of American Depositary Receipts (ADRs), futures contracts, Exchange-Traded Funds (ETFs) and certain indexes as well as quoted prices for similar securities may be used and would be categorized as Level 2 in the hierarchy. Utilizing these techniques may result in transfers between Level 1 and Level 2. For equity securities, including restricted securities, where observable inputs are limited, assumptions about market activity and risk are used and these securities may be categorized as Level 3 in the hierarchy.
Investments in open-end mutual funds, including the Fidelity Central Funds, are valued at their closing net asset value (NAV) each business day and are categorized as Level 1 in the hierarchy.
Changes in valuation techniques may result in transfers in or out of an assigned level within the disclosure hierarchy. The aggregate value of investments by input level as of July 31, 2018 is included at the end of the Fund's Schedule of Investments.
Foreign Currency. The Fund may use foreign currency contracts to facilitate transactions in foreign-denominated securities. Gains and losses from these transactions may arise from changes in the value of the foreign currency or if the counterparties do not perform under the contracts' terms.
Foreign-denominated assets, including investment securities, and liabilities are translated into U.S. dollars at the exchange rates at period end. Purchases and sales of investment securities, income and dividends received and expenses denominated in foreign currencies are translated into U.S. dollars at the exchange rate in effect on the transaction date.
The effects of exchange rate fluctuations on investments are included with the net realized and unrealized gain (loss) on investment securities. Other foreign currency transactions resulting in realized and unrealized gain (loss) are disclosed separately.
Investment Transactions and Income. For financial reporting purposes, the Fund's investment holdings and NAV include trades executed through the end of the last business day of the period. The NAV per share for processing shareholder transactions is calculated as of the close of business of the New York Stock Exchange (NYSE), normally 4:00 p.m. Eastern time and includes trades executed through the end of the prior business day. Gains and losses on securities sold are determined on the basis of identified cost and include proceeds received from litigation. Dividend income is recorded on the ex-dividend date, except for certain dividends from foreign securities where the ex-dividend date may have passed, which are recorded as soon as the Fund is informed of the ex-dividend date. Non-cash dividends included in dividend income, if any, are recorded at the fair market value of the securities received. Income and capital gain distributions from Fidelity Central Funds, if any, are recorded on the ex-dividend date. Certain distributions received by the Fund represent a return of capital or capital gain. The Fund determines the components of these distributions subsequent to the ex-dividend date, based upon receipt of tax filings or other correspondence relating to the underlying investment. These distributions are recorded as a reduction of cost of investments and/or as a realized gain. Interest income is accrued as earned and includes coupon interest and amortization of premium and accretion of discount on debt securities as applicable. Paid in Kind (PIK) income is recorded at the fair market value of the securities received. Investment income is recorded net of foreign taxes withheld where recovery of such taxes is uncertain.
Class Allocations and Expenses. Investment income, realized and unrealized capital gains and losses, common expenses of the Fund, and certain fund-level expense reductions, if any, are allocated daily on a pro-rata basis to each class based on the relative net assets of each class to the total net assets of the Fund. Each class differs with respect to transfer agent fees incurred. Certain expense reductions may also differ by class. For the reporting period, the allocated portion of income and expenses to each class as a percent of its average net assets may vary due to the timing of recording these transactions in relation to fluctuating net assets of the classes. Expenses directly attributable to a fund are charged to that fund. Expenses attributable to more than one fund are allocated among the respective funds on the basis of relative net assets or other appropriate methods. Expense estimates are accrued in the period to which they relate and adjustments are made when actual amounts are known.
Deferred Trustee Compensation. Under a Deferred Compensation Plan (the Plan), certain independent Trustees have elected to defer receipt of a portion of their annual compensation. Deferred amounts are invested in a cross-section of Fidelity funds, are marked-to-market and remain in the Fund until distributed in accordance with the Plan. The investment of deferred amounts and the offsetting payable to the Trustees of $639 are included in the accompanying Statement of Assets and Liabilities in other receivables and other payables and accrued expenses, respectively.
Income Tax Information and Distributions to Shareholders. Each year, the Fund intends to qualify as a regulated investment company under Subchapter M of the Internal Revenue Code, including distributing substantially all of its taxable income and realized gains. As a result, no provision for U.S. Federal income taxes is required. As of July 31, 2018, the Fund did not have any unrecognized tax benefits in the financial statements; nor is the Fund aware of any tax positions for which it is reasonably possible that the total amounts of unrecognized tax benefits will significantly change in the next twelve months. The Fund files a U.S. federal tax return, in addition to state and local tax returns as required. The Fund's federal income tax returns are subject to examination by the Internal Revenue Service (IRS) for a period of three fiscal years after they are filed. State and local tax returns may be subject to examination for an additional fiscal year depending on the jurisdiction. Foreign taxes are provided for based on the Fund's understanding of the tax rules and rates that exist in the foreign markets in which it invests.
Distributions are declared and recorded on the ex-dividend date. Income and capital gain distributions are declared separately for each class. Income and capital gain distributions are determined in accordance with income tax regulations, which may differ from GAAP. In addition, the Fund claimed a portion of the payment made to redeeming shareholders as a distribution for income tax purposes.
Capital accounts within the financial statements are adjusted for permanent book-tax differences. These adjustments have no impact on net assets or the results of operations. Capital accounts are not adjusted for temporary book-tax differences which will reverse in a subsequent period.
Book-tax differences are primarily due to foreign currency transactions, partnerships, passive foreign investment companies (PFIC), deferred trustees compensation and losses deferred due to wash sales.
As of period end, the cost and unrealized appreciation (depreciation) in securities, and derivatives if applicable, for federal income tax purposes were as follows:
| Gross unrealized appreciation | $892,061 |
| Gross unrealized depreciation | (190,819) |
| Net unrealized appreciation (depreciation) | $701,242 |
| Tax Cost | $6,585,844 |
The tax-based components of distributable earnings as of period end were as follows:
| Undistributed ordinary income | $272,014 |
| Undistributed long-term capital gain | $804,241 |
| Net unrealized appreciation (depreciation) on securities and other investments | $701,248 |
The tax character of distributions paid was as follows:
| | July 31, 2018 | July 31, 2017 |
| Ordinary Income | $133,779 | $ 120,213 |
| Long-term Capital Gains | 1,046,957 | – |
| Total | $1,180,736 | $ 120,213 |
4. Purchases and Sales of Investments.
Purchases and sales of securities, other than short-term securities, aggregated $8,010,558 and $8,925,137, respectively.
5. Fees and Other Transactions with Affiliates.
Management Fee. Fidelity Management & Research Company (the investment adviser) and its affiliates provide the Fund with investment management related services for which the Fund pays a monthly management fee. The management fee is the sum of an individual fund fee rate that is based on an annual rate of .30% of the Fund's average net assets and an annualized group fee rate that averaged .24% during the period. The group fee rate is based upon the average net assets of all the mutual funds advised by the investment adviser, including any mutual funds previously advised by the investment adviser that are currently advised by Fidelity SelectCo, LLC, an affiliate of the investment adviser. The group fee rate decreases as assets under management increase and increases as assets under management decrease. In addition, the management fee is subject to a performance adjustment (up to a maximum of +/- .20% of the Fund's average net assets over a 36 month performance period). The upward or downward adjustment to the management fee is based on the relative investment performance of Dividend Growth as compared to its benchmark index, the S&P 500 Index, over the same 36 month performance period. For the reporting period, the total annual management fee rate, including the performance adjustment, was .33% of the Fund's average net assets. The performance adjustment included in the management fee rate may be higher or lower than the maximum performance adjustment rate due to the difference between the average net assets for the reporting and performance periods.
Transfer Agent Fees. Fidelity Investments Institutional Operations Company, Inc., (FIIOC), an affiliate of the investment adviser, is the transfer, dividend disbursing and shareholder servicing agent for each class of the Fund. FIIOC receives account fees and asset-based fees that vary according to the account size and type of account of the shareholders of Dividend Growth, except for Class K. FIIOC receives an asset-based fee of Class K's average net assets. FIIOC pays for typesetting, printing and mailing of shareholder reports, except proxy statements.
For the period, transfer agent fees for each class were as follows:
| | Amount | % of Class-Level Average Net Assets |
| Dividend Growth | $9,080 | .15 |
| Class K | 586 | .05 |
| | $9,666 | |
Accounting and Security Lending Fees. Fidelity Service Company, Inc. (FSC), an affiliate of the investment adviser, maintains the Fund's accounting records. The accounting fee is based on the level of average net assets for each month. Under a separate contract, FSC administers the security lending program. The security lending fee is based on the number and duration of lending transactions. For the period, the fees were equivalent to an annual rate of .02%.
Brokerage Commissions. The Fund placed a portion of its portfolio transactions with brokerage firms which are affiliates of the investment adviser. Brokerage commissions are included in net realized gain (loss) and change in net unrealized appreciation (depreciation) in the Statement of Operations. The commissions paid to these affiliated firms were $217 for the period.
Interfund Trades. The Fund may purchase from or sell securities to other Fidelity Funds under procedures adopted by the Board. The procedures have been designed to ensure these interfund trades are executed in accordance with Rule 17a-7 of the 1940 Act. Interfund trades are included within the respective purchases and sales amounts shown in the Purchases and Sales of Investments note.
6. Committed Line of Credit.
The Fund participates with other funds managed by the investment adviser or an affiliate in a $4.25 billion credit facility (the "line of credit") to be utilized for temporary or emergency purposes to fund shareholder redemptions or for other short-term liquidity purposes. The Fund has agreed to pay commitment fees on its pro-rata portion of the line of credit, which amounted to $21 and is reflected in Miscellaneous expenses on the Statement of Operations. During the period, the Fund did not borrow on this line of credit.
7. Security Lending.
The Fund lends portfolio securities through a lending agent from time to time in order to earn additional income. For equity securities, a lending agent is used and may loan securities to certain qualified borrowers, including Fidelity Capital Markets (FCM), a broker-dealer affiliated with the Fund. On the settlement date of the loan, the Fund receives collateral (in the form of U.S. Treasury obligations, letters of credit and/or cash) against the loaned securities and maintains collateral in an amount not less than 100% of the market value of the loaned securities during the period of the loan. The market value of the loaned securities is determined at the close of business of the Fund and any additional required collateral is delivered to the Fund on the next business day. The Fund or borrower may terminate the loan at any time, and if the borrower defaults on its obligation to return the securities loaned because of insolvency or other reasons, the Fund may apply collateral received from the borrower against the obligation. The Fund may experience delays and costs in recovering the securities loaned. Any cash collateral received is invested in the Fidelity Securities Lending Cash Central Fund. The value of loaned securities and cash collateral at period end are disclosed on the Fund's Statement of Assets and Liabilities. The value of securities loaned to FCM at period end was $4,928. Security lending income represents the income earned on investing cash collateral, less rebates paid to borrowers and any lending agent fees associated with the loan, plus any premium payments received for lending certain types of securities. Security lending income is presented in the Statement of Operations as a component of income from Fidelity Central Funds. Total security lending income during the period amounted to $193, including $1 from securities loaned to FCM.
8. Expense Reductions.
Commissions paid to certain brokers with whom the investment adviser, or its affiliates, places trades on behalf of the Fund include an amount in addition to trade execution, which may be rebated back to the Fund to offset certain expenses. This amount totaled $626 for the period. In addition, through arrangements with the Fund's custodian, credits realized as a result of certain uninvested cash balances were used to reduce the Fund's expenses. During the period, these credits reduced the Fund's custody expenses by $3.
In addition, during the period the investment adviser reimbursed and/or waived a portion of fund-level operating expenses in the amount of $75.
9. Distributions to Shareholders.
Distributions to shareholders of each class were as follows:
| | Year ended
July 31, 2018 | Year ended
July 31, 2017 |
| From net investment income | | |
| Dividend Growth | $102,569 | $92,313 |
| Class K | 24,695 | 27,900 |
| Total | $127,264 | $120,213 |
| From net realized gain | | |
| Dividend Growth | $860,821 | $– |
| Class K | 192,651 | – |
| Total | $1,053,472 | $– |
10. Share Transactions.
Share transactions for each class were as follows and may contain automatic conversions between classes or exchanges between affiliated funds:
| | Shares | Shares | Dollars | Dollars |
| | Year ended July 31, 2018 | Year ended July 31, 2017 | Year ended July 31, 2018 | Year ended July 31, 2017 |
| Dividend Growth | | | | |
| Shares sold | 6,817 | 6,358 | $228,121 | $209,135 |
| Reinvestment of distributions | 28,012 | 2,777 | 919,157 | 88,012 |
| Shares redeemed | (25,386) | (24,948) | (851,332) | (819,066) |
| Net increase (decrease) | 9,443 | (15,813) | $295,946 | $(521,919) |
| Class K | | | | |
| Shares sold | 6,726 | 6,119 | $224,545 | $201,106 |
| Reinvestment of distributions | 6,626 | 882 | 217,347 | 27,900 |
| Shares redeemed | (19,611) | (18,521) | (660,869) | (610,257) |
| Net increase (decrease) | (6,259) | (11,520) | $(218,977) | $(381,251) |
11. Other.
The Fund's organizational documents provide former and current trustees and officers with a limited indemnification against liabilities arising in connection with the performance of their duties to the Fund. In the normal course of business, the Fund may also enter into contracts that provide general indemnifications. The Fund's maximum exposure under these arrangements is unknown as this would be dependent on future claims that may be made against the Fund. The risk of material loss from such claims is considered remote.
Report of Independent Registered Public Accounting Firm
To the Board of Trustees of Fidelity Securities Fund and Shareholders of Fidelity Dividend Growth Fund:
Opinion on the Financial Statements
We have audited the accompanying statement of assets and liabilities, including the schedule of investments, of Fidelity Dividend Growth Fund (one of the funds constituting Fidelity Securities Fund, referred to hereafter as the "Fund") as of July 31, 2018, the related statement of operations for the year ended July 31, 2018, the statement of changes in net assets for each of the two years in the period ended July 31, 2018, including the related notes, and the financial highlights for each of the five years in the period ended July 31, 2018 (collectively referred to as the “financial statements”). In our opinion, the financial statements present fairly, in all material respects, the financial position of the Fund as of July 31, 2018, the results of its operations for the year then ended, the changes in its net assets for each of the two years in the period ended July 31, 2018 and the financial highlights for each of the five years in the period ended July 31, 2018 in conformity with accounting principles generally accepted in the United States of America.
Basis for Opinion
These financial statements are the responsibility of the Fund’s management. Our responsibility is to express an opinion on the Fund’s financial statements based on our audits. We are a public accounting firm registered with the Public Company Accounting Oversight Board (United States) (“PCAOB”) and are required to be independent with respect to the Fund in accordance with the U.S. federal securities laws and the applicable rules and regulations of the Securities and Exchange Commission and the PCAOB.
We conducted our audits of these financial statements in accordance with the standards of the PCAOB. Those standards require that we plan and perform the audit to obtain reasonable assurance about whether the financial statements are free of material misstatement, whether due to error or fraud.
Our audits included performing procedures to assess the risks of material misstatement of the financial statements, whether due to error or fraud, and performing procedures that respond to those risks. Such procedures included examining, on a test basis, evidence regarding the amounts and disclosures in the financial statements. Our audits also included evaluating the accounting principles used and significant estimates made by management, as well as evaluating the overall presentation of the financial statements. Our procedures included confirmation of securities owned as of July 31, 2018 by correspondence with the custodian and brokers, when replies were not received from brokers, we performed other auditing procedures. We believe that our audits provide a reasonable basis for our opinion.
PricewaterhouseCoopers LLP
Boston, Massachusetts
September 14, 2018
We have served as the auditor of one or more investment companies in the Fidelity group of funds since 1932.
Trustees and Officers
The Trustees, Members of the Advisory Board (if any), and officers of the trust and fund, as applicable, are listed below. The Board of Trustees governs the fund and is responsible for protecting the interests of shareholders. The Trustees are experienced executives who meet periodically throughout the year to oversee the fund's activities, review contractual arrangements with companies that provide services to the fund, oversee management of the risks associated with such activities and contractual arrangements, and review the fund's performance. Except for Jonathan Chiel, each of the Trustees oversees 286 funds. Mr. Chiel oversees 150 funds.
The Trustees hold office without limit in time except that (a) any Trustee may resign; (b) any Trustee may be removed by written instrument, signed by at least two-thirds of the number of Trustees prior to such removal; (c) any Trustee who requests to be retired or who has become incapacitated by illness or injury may be retired by written instrument signed by a majority of the other Trustees; and (d) any Trustee may be removed at any special meeting of shareholders by a two-thirds vote of the outstanding voting securities of the trust. Each Trustee who is not an interested person (as defined in the 1940 Act) of the trust and the fund is referred to herein as an Independent Trustee. Each Independent Trustee shall retire not later than the last day of the calendar year in which his or her 75th birthday occurs. The Independent Trustees may waive this mandatory retirement age policy with respect to individual Trustees. Officers and Advisory Board Members hold office without limit in time, except that any officer or Advisory Board Member may resign or may be removed by a vote of a majority of the Trustees at any regular meeting or any special meeting of the Trustees. Except as indicated, each individual has held the office shown or other offices in the same company for the past five years.
The fund’s Statement of Additional Information (SAI) includes more information about the Trustees. To request a free copy, call Fidelity at 1-800-835-5092.
Experience, Skills, Attributes, and Qualifications of the Trustees. The Governance and Nominating Committee has adopted a statement of policy that describes the experience, qualifications, attributes, and skills that are necessary and desirable for potential Independent Trustee candidates (Statement of Policy). The Board believes that each Trustee satisfied at the time he or she was initially elected or appointed a Trustee, and continues to satisfy, the standards contemplated by the Statement of Policy. The Governance and Nominating Committee also engages professional search firms to help identify potential Independent Trustee candidates who have the experience, qualifications, attributes, and skills consistent with the Statement of Policy. From time to time, additional criteria based on the composition and skills of the current Independent Trustees, as well as experience or skills that may be appropriate in light of future changes to board composition, business conditions, and regulatory or other developments, have also been considered by the professional search firms and the Governance and Nominating Committee. In addition, the Board takes into account the Trustees' commitment and participation in Board and committee meetings, as well as their leadership of standing and ad hoc committees throughout their tenure.
In determining that a particular Trustee was and continues to be qualified to serve as a Trustee, the Board has considered a variety of criteria, none of which, in isolation, was controlling. The Board believes that, collectively, the Trustees have balanced and diverse experience, qualifications, attributes, and skills, which allow the Board to operate effectively in governing the fund and protecting the interests of shareholders. Information about the specific experience, skills, attributes, and qualifications of each Trustee, which in each case led to the Board's conclusion that the Trustee should serve (or continue to serve) as a trustee of the fund, is provided below.
Board Structure and Oversight Function. James C. Curvey is an interested person and currently serves as Chairman. The Trustees have determined that an interested Chairman is appropriate and benefits shareholders because an interested Chairman has a personal and professional stake in the quality and continuity of services provided to the fund. Independent Trustees exercise their informed business judgment to appoint an individual of their choosing to serve as Chairman, regardless of whether the Trustee happens to be independent or a member of management. The Independent Trustees have determined that they can act independently and effectively without having an Independent Trustee serve as Chairman and that a key structural component for assuring that they are in a position to do so is for the Independent Trustees to constitute a substantial majority for the Board. The Independent Trustees also regularly meet in executive session. Ned C. Lautenbach serves as Chairman of the Independent Trustees and as such (i) acts as a liaison between the Independent Trustees and management with respect to matters important to the Independent Trustees and (ii) with management prepares agendas for Board meetings.
Fidelity® funds are overseen by different Boards of Trustees. The fund's Board oversees Fidelity's high income and certain equity funds, and other Boards oversee Fidelity's investment-grade bond, money market, asset allocation, and other equity funds. The asset allocation funds may invest in Fidelity® funds overseen by the fund's Board. The use of separate Boards, each with its own committee structure, allows the Trustees of each group of Fidelity® funds to focus on the unique issues of the funds they oversee, including common research, investment, and operational issues. On occasion, the separate Boards establish joint committees to address issues of overlapping consequences for the Fidelity® funds overseen by each Board.
The Trustees operate using a system of committees to facilitate the timely and efficient consideration of all matters of importance to the Trustees, the fund, and fund shareholders and to facilitate compliance with legal and regulatory requirements and oversight of the fund's activities and associated risks. The Board, acting through its committees, has charged FMR and its affiliates with (i) identifying events or circumstances the occurrence of which could have demonstrably adverse effects on the fund's business and/or reputation; (ii) implementing processes and controls to lessen the possibility that such events or circumstances occur or to mitigate the effects of such events or circumstances if they do occur; and (iii) creating and maintaining a system designed to evaluate continuously business and market conditions in order to facilitate the identification and implementation processes described in (i) and (ii) above. Because the day-to-day operations and activities of the fund are carried out by or through FMR, its affiliates, and other service providers, the fund's exposure to risks is mitigated but not eliminated by the processes overseen by the Trustees. While each of the Board's committees has responsibility for overseeing different aspects of the fund's activities, oversight is exercised primarily through the Operations, Audit, and Compliance Committees. In addition, the Independent Trustees have worked with Fidelity to enhance the Board's oversight of investment and financial risks, legal and regulatory risks, technology risks, and operational risks, including the development of additional risk reporting to the Board. Appropriate personnel, including but not limited to the fund's Chief Compliance Officer (CCO), FMR's internal auditor, the independent accountants, the fund's Treasurer and portfolio management personnel, make periodic reports to the Board's committees, as appropriate, including an annual review of Fidelity's risk management program for the Fidelity® funds. The responsibilities of each standing committee, including their oversight responsibilities, are described further under "Standing Committees of the Trustees."
Interested Trustees*:
Correspondence intended for a Trustee who is an interested person may be sent to Fidelity Investments, 245 Summer Street, Boston, Massachusetts 02210.
Name, Year of Birth; Principal Occupations and Other Relevant Experience+
Jonathan Chiel (1957)
Year of Election or Appointment: 2016
Trustee
Mr. Chiel also serves as Trustee of other Fidelity® funds. Mr. Chiel is Executive Vice President and General Counsel for FMR LLC (diversified financial services company, 2012-present). Previously, Mr. Chiel served as general counsel (2004-2012) and senior vice president and deputy general counsel (2000-2004) for John Hancock Financial Services; a partner with Choate, Hall & Stewart (1996-2000) (law firm); and an Assistant United States Attorney for the United States Attorney’s Office of the District of Massachusetts (1986-95), including Chief of the Criminal Division (1993-1995). Mr. Chiel is a director on the boards of the Boston Bar Foundation and the Maimonides School.
James C. Curvey (1935)
Year of Election or Appointment: 2007
Trustee
Chairman of the Board of Trustees
Mr. Curvey also serves as Trustee of other Fidelity® funds. Mr. Curvey is Vice Chairman (2007-present) and Director of FMR LLC (diversified financial services company). In addition, Mr. Curvey is an Overseer Emeritus for the Boston Symphony Orchestra, a Director of Artis-Naples, and a Trustee of Brewster Academy in Wolfeboro, New Hampshire. Previously, Mr. Curvey served as a Director of Fidelity Research & Analysis Co. (investment adviser firm, 2009-2018), Director of Fidelity Investments Money Management, Inc. (investment adviser firm, 2009-2014) and a Director of FMR and FMR Co., Inc. (investment adviser firms, 2007-2014).
Charles S. Morrison (1960)
Year of Election or Appointment: 2014
Trustee
Mr. Morrison also serves as Trustee of other funds. He serves as President of Fidelity SelectCo, LLC (investment adviser firm, 2017-present) and Fidelity Management & Research Company (FMR) (investment adviser firm, 2016-present), a Director of Fidelity Investments Money Management, Inc. (FIMM) (investment adviser firm, 2014-present), Director of Fidelity SelectCo, LLC (investment adviser firm, 2014-present), President, Asset Management (2014-present), and is an employee of Fidelity Investments. Previously, Mr. Morrison served as Vice President of Fidelity's Fixed Income and Asset Allocation Funds (2012-2014), President, Fixed Income (2011-2014), Vice President of Fidelity's Money Market Funds (2005-2009), President, Money Market Group Leader of FMR (investment adviser firm, 2009), and Senior Vice President, Money Market Group of FMR (2004-2009). Mr. Morrison also served as Vice President of Fidelity's Bond Funds (2002-2005), certain Balanced Funds (2002-2005), and certain Asset Allocation Funds (2002-2007), and as Senior Vice President (2002-2005) of Fidelity's Bond Division.
* Determined to be an “Interested Trustee” by virtue of, among other things, his or her affiliation with the trust or various entities under common control with FMR.
+ The information includes the Trustee's principal occupation during the last five years and other information relating to the experience, attributes, and skills relevant to the Trustee's qualifications to serve as a Trustee, which led to the conclusion that the Trustee should serve as a Trustee for the fund.
Independent Trustees:
Correspondence intended for an Independent Trustee may be sent to Fidelity Investments, P.O. Box 55235, Boston, Massachusetts 02205-5235.
Name, Year of Birth; Principal Occupations and Other Relevant Experience+
Dennis J. Dirks (1948)
Year of Election or Appointment: 2005
Trustee
Mr. Dirks also serves as Trustee of other Fidelity® funds. Prior to his retirement in May 2003, Mr. Dirks was Chief Operating Officer and a member of the Board of The Depository Trust & Clearing Corporation (DTCC). He also served as President, Chief Operating Officer, and Board member of The Depository Trust Company (DTC) and President and Board member of the National Securities Clearing Corporation (NSCC). In addition, Mr. Dirks served as Chief Executive Officer and Board member of the Government Securities Clearing Corporation, Chief Executive Officer and Board member of the Mortgage-Backed Securities Clearing Corporation, as a Trustee and a member of the Finance Committee of Manhattan College (2005-2008), as a Trustee and a member of the Finance Committee of AHRC of Nassau County (2006-2008), as a member of the Independent Directors Council (IDC) Governing Council (2010-2015), and as a member of the Board of Directors for The Brookville Center for Children’s Services, Inc. (2009-2017). Mr. Dirks is a member of the Finance Committee (2016-present), Board of Directors (2017-present) and Board of Trustees (2018-present) and is Treasurer (2018-present) of the Asolo Repertory Theatre.
Donald F. Donahue (1950)
Year of Election or Appointment: 2018
Trustee
Mr. Donahue also serves as a Trustee of other Fidelity® funds. Mr. Donahue is President and Chief Executive Officer of Miranda Partners, LLC (risk consulting for the financial services industry, 2012-present). Previously, Mr. Donahue served as a Member of the Advisory Board of certain Fidelity® funds (2015-2018) and Chief Executive Officer (2006-2012), Chief Operating Officer (2003-2006), and Managing Director, Customer Marketing and Development (1999-2003) of The Depository Trust & Clearing Corporation (financial markets infrastructure). Mr. Donahue serves as a Member (2007-present) and Co-Chairman (2016-present) of the Board of Directors of United Way of New York, Member of the Board of Directors of NYC Leadership Academy (2012-present) and Member of the Board of Advisors of Ripple Labs, Inc. (financial services, 2015-present). He also served as Chairman (2010-2012) and Member of the Board of Directors (2012-2013) of Omgeo, LLC (financial services), Treasurer of United Way of New York (2012-2016), and Member of the Board of Directors of XBRL US (financial services non-profit, 2009-2012) and the International Securities Services Association (2009-2012).
Alan J. Lacy (1953)
Year of Election or Appointment: 2008
Trustee
Mr. Lacy also serves as Trustee of other Fidelity® funds. Mr. Lacy serves as a Director of Bristol-Myers Squibb Company (global pharmaceuticals, 2008-present). He is a Trustee of the California Chapter of The Nature Conservancy (2015-present) and a Director of the Center for Advanced Study in the Behavioral Sciences at Stanford University (2015-present). In addition, Mr. Lacy served as Senior Adviser (2007-2014) of Oak Hill Capital Partners, L.P. (private equity) and also served as Chief Executive Officer (2005) and Vice Chairman (2005-2006) of Sears Holdings Corporation (retail) and Chief Executive Officer and Chairman of the Board of Sears, Roebuck and Co. (retail, 2000-2005). Previously, Mr. Lacy served as Chairman (2014-2017) and a member (2010-2017) of the Board of Directors of Dave & Buster’s Entertainment, Inc. (restaurant and entertainment complexes), as Chairman (2008-2011) and a member (2006-2015) of the Board of Trustees of the National Parks Conservation Association, and as a member of the Board of Directors for The Hillman Companies, Inc. (hardware wholesalers, 2010-2014), Earth Fare, Inc. (retail grocery, 2010-2014), and The Western Union Company (global money transfer, 2006-2011).
Ned C. Lautenbach (1944)
Year of Election or Appointment: 2000
Trustee
Chairman of the Independent Trustees
Mr. Lautenbach also serves as Trustee of other Fidelity® funds. Mr. Lautenbach currently serves as Vice Chair of the Board of Governors, State University System of Florida (2013-present) and is a member of the Council on Foreign Relations (1994-present). He is also a member and has most recently served as Chairman of the Board of Directors of Artis-Naples (2012-present). Previously, Mr. Lautenbach served as a member and then Lead Director of the Board of Directors of Eaton Corporation (diversified industrial, 1997-2016). He was also a Partner and Advisory Partner at Clayton, Dubilier & Rice, LLC (private equity investment, 1998-2010), as well as a Director of Sony Corporation (2006-2007). In addition, Mr. Lautenbach also had a 30-year career with IBM (technology company) during which time he served as Senior Vice President and a member of the Corporate Executive Committee (1968-1998).
Joseph Mauriello (1944)
Year of Election or Appointment: 2008
Trustee
Mr. Mauriello also serves as Trustee of other Fidelity® funds. Prior to his retirement in January 2006, Mr. Mauriello served in numerous senior management positions including Deputy Chairman and Chief Operating Officer (2004-2005), and Vice Chairman of Financial Services (2002-2004) of KPMG LLP US (professional services, 1965-2005). Mr. Mauriello currently serves as a member of the Board of Directors of XL Group plc. (global insurance and re-insurance, 2006-present) and the Independent Directors Council (IDC) Governing Council (2015-present). Previously, Mr. Mauriello served as a Director of the Hamilton Funds of the Bank of New York (2006-2007) and of Arcadia Resources Inc. (health care services and products, 2007-2012).
Cornelia M. Small (1944)
Year of Election or Appointment: 2005
Trustee
Ms. Small also serves as Trustee of other Fidelity® funds. Ms. Small is a member of the Board of Directors (2009-present) and Chair of the Investment Committee (2010-present) of the Teagle Foundation. Ms. Small also serves on the Investment Committee of the Berkshire Taconic Community Foundation (2008-present). Previously, Ms. Small served as Chairperson (2002-2008) and a member of the Investment Committee and Chairperson (2008-2012) and a member of the Board of Trustees of Smith College. In addition, Ms. Small served as Chief Investment Officer, Director of Global Equity Investments, and a member of the Board of Directors of Scudder, Stevens & Clark and Scudder Kemper Investments.
Garnett A. Smith (1947)
Year of Election or Appointment: 2018
Trustee
Mr. Smith also serves as Trustee of other Fidelity® funds. Prior to Mr. Smith's retirement, he served as Chairman and Chief Executive Officer of Inbrand Corp. (manufacturer of personal absorbent products, 1990-1997). He also served as President (1986-1990) of Inbrand Corp. Prior to his employment with Inbrand Corp., he was employed by a retail fabric chain and North Carolina National Bank. In addition, Mr. Smith served as a Member of the Advisory Board of certain Fidelity® funds (2012-2013) and as a board member of the Jackson Hole Land Trust (2009-2012).
David M. Thomas (1949)
Year of Election or Appointment: 2008
Trustee
Mr. Thomas also serves as Trustee of other Fidelity® funds. Mr. Thomas serves as Non-Executive Chairman of the Board of Directors of Fortune Brands Home and Security (home and security products, 2011-present), as a member of the Board of Directors (2004-present) and Presiding Director (2013-present) of Interpublic Group of Companies, Inc. (marketing communication), and as a member of the Board of Trustees of the University of Florida (2013-present). Previously, Mr. Thomas served as Executive Chairman (2005-2006) and Chairman and Chief Executive Officer (2000-2005) of IMS Health, Inc. (pharmaceutical and healthcare information solutions), and a Director of Fortune Brands, Inc. (consumer products, 2000-2011).
+ The information includes the Trustee's principal occupation during the last five years and other information relating to the experience, attributes, and skills relevant to the Trustee's qualifications to serve as a Trustee, which led to the conclusion that the Trustee should serve as a Trustee for the fund.
Advisory Board Members and Officers:
Correspondence intended for a Member of the Advisory Board (if any) may be sent to Fidelity Investments, P.O. Box 55235, Boston, Massachusetts 02205-5235. Correspondence intended for an officer or Peter S. Lynch may be sent to Fidelity Investments, 245 Summer Street, Boston, Massachusetts 02210. Officers appear below in alphabetical order.
Name, Year of Birth; Principal Occupation
Peter S. Lynch (1944)
Year of Election or Appointment: 2003
Member of the Advisory Board
Mr. Lynch also serves as Member of the Advisory Board of other Fidelity® funds. Mr. Lynch is Vice Chairman and a Director of FMR (investment adviser firm) and FMR Co., Inc. (investment adviser firm). In addition, Mr. Lynch serves as a Trustee of Boston College and as the Chairman of the Inner-City Scholarship Fund. Previously, Mr. Lynch served on the Special Olympics International Board of Directors (1997-2006).
William S. Stavropoulos (1939)
Year of Election or Appointment: 2018
Member of the Advisory Board
Mr. Stavropoulos also serves as Member of the Advisory Board of other Fidelity® funds. Mr. Stavropoulos serves as President and Founder of the Michigan Baseball Foundation, the Great Lakes Loons (2007-present). Mr. Stavropoulos is Chairman Emeritus of the Board of Directors of The Dow Chemical Company, where he previously served in numerous senior management positions, including President, CEO (1995-2000; 2002-2004), Chairman of the Executive Committee (2000-2006), and as a member of the Board of Directors (1990-2006). Currently, Mr. Stavropoulos is Chairman of the Board of Directors of Univar Inc. (global distributor of commodity and specialty chemicals), a Director of Teradata Corporation (data warehousing and technology solutions), and a member of the Advisory Board for Metalmark Capital LLC (private equity investment, 2005-present). Mr. Stavropoulos is an operating advisor to Clayton, Dubilier & Rice, LLC (private equity investment). In addition, Mr. Stavropoulos is a member of the University of Notre Dame Advisory Council for the College of Science, a Trustee of the Rollin L. Gerstacker Foundation, and a Director of Artis-Naples in Naples, Florida. Previously, Mr. Stavropoulos served as Trustee of certain Fidelity® funds (2001-2018) and as a Director of Chemical Financial Corporation (bank holding company, 1993-2012) and Tyco International, Ltd. (multinational manufacturing and services, 2007-2012).
Carol B. Tomé (1957)
Year of Election or Appointment: 2018
Member of the Advisory Board
Ms. Tomé also serves as Member of the Advisory Board of other Fidelity® funds. Ms. Tomé is Chief Financial Officer (2001-present) and Executive Vice President of Corporate Services (2007-present) of The Home Depot, Inc. (home improvement retailer) and a Director (2003-present) and Chair of the Audit Committee (2004-present) of United Parcel Service, Inc. (package delivery and supply chain management). Previously, Ms. Tomé served as Trustee of certain Fidelity® funds (2017), Senior Vice President of Finance and Accounting/Treasurer (2000-2007) and Vice President and Treasurer (1995-2000) of The Home Depot, Inc. and Chair of the Board (2010-2012), Vice Chair of the Board (2009 and 2013), and a Director (2008-2013) of the Federal Reserve Bank of Atlanta. Ms. Tomé is also a director or trustee of many community and professional organizations.
Michael E. Wiley (1950)
Year of Election or Appointment: 2018
Member of the Advisory Board
Mr. Wiley also serves as Trustee or Member of the Advisory Board of other Fidelity® funds. Mr. Wiley serves as a Director of Andeavor Corporation (independent oil refiner and marketer, 2005-present), a Director of Andeavor Logistics LP (natural resources logistics, 2015-present), and a Director of Bill Barrett Corporation (exploration and production, 2005-present). In addition, Mr. Wiley also serves as a Director of Post Oak Bank (privately-held bank, 2004-present). Previously, Mr. Wiley served as a Trustee of other Fidelity® funds (2008-2013), as a Director of Asia Pacific Exploration Consolidated (international oil and gas exploration and production, 2008-2013), as a member of the Board of Trustees of the University of Tulsa (2000-2006; 2007-2010), as a Senior Energy Advisor of Katzenbach Partners, LLC (consulting, 2006-2007), as an Advisory Director of Riverstone Holdings (private investment), Chairman, President, and CEO of Baker Hughes, Inc. (oilfield services, 2000-2004), and as Director of Spinnaker Exploration Company (exploration and production, 2001-2005).
Elizabeth Paige Baumann (1968)
Year of Election or Appointment: 2017
Anti-Money Laundering (AML) Officer
Ms. Baumann also serves as AML Officer of other funds. She is Chief AML Officer (2012-present) and Senior Vice President (2014-present) of FMR LLC (diversified financial services company) and is an employee of Fidelity Investments. Previously, Ms. Baumann served as AML Officer of the funds (2012-2016), and Vice President (2007-2014) and Deputy Anti-Money Laundering Officer (2007-2012) of FMR LLC.
Marc R. Bryant (1966)
Year of Election or Appointment: 2015
Secretary and Chief Legal Officer (CLO)
Mr. Bryant also serves as Secretary and CLO of other funds. Mr. Bryant serves as CLO, Secretary, and Senior Vice President of Fidelity Management & Research Company (investment adviser firm, 2015-present) and FMR Co., Inc. (investment adviser firm, 2015-present); Secretary of Fidelity SelectCo, LLC (investment adviser firm, 2015-present) and Fidelity Investments Money Management, Inc. (investment adviser firm, 2015-present); and CLO of Fidelity Management & Research (Hong Kong) Limited and FMR Investment Management (UK) Limited (investment adviser firms, 2015-present) and Fidelity Management & Research (Japan) Limited (investment adviser firm, 2016-present). He is Senior Vice President and Deputy General Counsel of FMR LLC (diversified financial services company). Previously, Mr. Bryant served as Secretary and CLO of Fidelity Rutland Square Trust II (2010-2014) and Assistant Secretary of Fidelity's Fixed Income and Asset Allocation Funds (2013-2015). Prior to joining Fidelity Investments, Mr. Bryant served as a Senior Vice President and the Head of Global Retail Legal for AllianceBernstein L.P. (2006-2010), and as the General Counsel for ProFund Advisors LLC (2001-2006).
John J. Burke III (1964)
Year of Election or Appointment: 2018
Chief Financial Officer
Mr. Burke also serves as Chief Financial Officer of other funds. Mr. Burke serves as Head of Investment Operations for Fidelity Fund and Investment Operations (2018-present) and is an employee of Fidelity Investments (1998-present). Previously Mr. Burke served as head of Asset Management Investment Operations (2012-2018).
William C. Coffey (1969)
Year of Election or Appointment: 2009
Assistant Secretary
Mr. Coffey also serves as Assistant Secretary of other funds. He is Senior Vice President and Deputy General Counsel of FMR LLC (diversified financial services company, 2010-present), and is an employee of Fidelity Investments. Previously, Mr. Coffey served as Vice President and Associate General Counsel of FMR LLC (2005-2009).
Timothy M. Cohen (1969)
Year of Election or Appointment: 2018
Vice President
Mr. Cohen also serves as Vice President of other funds. Mr. Cohen serves as Co-Head of Global Equity Research (2016-present), a Director of Fidelity Management & Research (Japan) Limited (investment adviser firm, 2016-present), and is an employee of Fidelity Investments. Previously, Mr. Cohen served as Chief Investment Officer - Equity and a Director of Fidelity Management & Research (U.K.) Inc. (investment adviser firm, 2013-2015) and as a Director of Fidelity Management & Research (Hong Kong) Limited (investment adviser firm, 2017).
Jonathan Davis (1968)
Year of Election or Appointment: 2010
Assistant Treasurer
Mr. Davis also serves as Assistant Treasurer of other funds. Mr. Davis serves as Assistant Treasurer of FMR Capital, Inc. (2017-present) and is an employee of Fidelity Investments. Previously, Mr. Davis served as Vice President and Associate General Counsel of FMR LLC (diversified financial services company, 2003-2010).
Adrien E. Deberghes (1967)
Year of Election or Appointment: 2016
Assistant Treasurer
Mr. Deberghes also serves as an officer of other funds. He serves as Assistant Treasurer of FMR Capital, Inc. (2017-present), Executive Vice President of Fidelity Investments Money Management, Inc. (FIMM) (investment adviser firm, 2016-present), and is an employee of Fidelity Investments (2008-present). Previously, Mr. Deberghes served as President and Treasurer of certain Fidelity® funds (2013-2018). Prior to joining Fidelity Investments, Mr. Deberghes was Senior Vice President of Mutual Fund Administration at State Street Corporation (2007-2008), Senior Director of Mutual Fund Administration at Investors Bank & Trust (2005-2007), and Director of Finance for Dunkin' Brands (2000-2005). Previously, Mr. Deberghes served in other fund officer roles.
Laura M. Del Prato (1964)
Year of Election or Appointment: 2018
Assistant Treasurer
Ms. Del Prato also serves as an officer of other funds. Ms. Del Prato is an employee of Fidelity Investments (2017-present). Prior to joining Fidelity Investments, Ms. Del Prato served as a Managing Director and Treasurer of the JPMorgan Mutual Funds (2014-2017). Prior to JPMorgan, Ms. Del Prato served as a partner at Cohen Fund Audit Services (accounting firm, 2012-2013) and KPMG LLP (accounting firm, 2004-2012).
Colm A. Hogan (1973)
Year of Election or Appointment: 2016
Deputy Treasurer
Mr. Hogan also serves as an officer of other funds. Mr. Hogan serves as Assistant Treasurer of FMR Capital, Inc. (2017-present) and is an employee of Fidelity Investments (2005-present). Previously, Mr. Hogan served as Assistant Treasurer of certain Fidelity® funds (2016-2018).
Pamela R. Holding (1964)
Year of Election or Appointment: 2018
Vice President
Ms. Holding also serves as a Vice President of other funds. Ms. Holding serves as Co-Head of Global Equity Research (2018-present) and is an employee of Fidelity Investments (2013-present).
Chris Maher (1972)
Year of Election or Appointment: 2013
Assistant Treasurer
Mr. Maher serves as Assistant Treasurer of other funds. Mr. Maher is Vice President of Valuation Oversight, serves as Assistant Treasurer of FMR Capital, Inc. (2017-present), and is an employee of Fidelity Investments. Previously, Mr. Maher served as Vice President of Asset Management Compliance (2013), Vice President of the Program Management Group of FMR (investment adviser firm, 2010-2013), and Vice President of Valuation Oversight (2008-2010).
Rieco E. Mello (1969)
Year of Election or Appointment: 2017
Assistant Treasurer
Mr. Mello also serves as Assistant Treasurer of other funds. Mr. Mello serves as Assistant Treasurer of FMR Capital, Inc. (2017-present) and is an employee of Fidelity Investments (1995-present).
Kenneth B. Robins (1969)
Year of Election or Appointment: 2016
Chief Compliance Officer
Mr. Robins also serves as an officer of other funds. Mr. Robins serves as Compliance Officer of Fidelity Management & Research Company and FMR Co., Inc. (investment adviser firms, 2016-present) and is an employee of Fidelity Investments (2004-present). Previously, Mr. Robins served as Executive Vice President of Fidelity Investments Money Management, Inc. (investment adviser firm, 2013-2016) and served in other fund officer roles.
Stacie M. Smith (1974)
Year of Election or Appointment: 2016
President and Treasurer
Ms. Smith also serves as an officer of other funds. Ms. Smith serves as Assistant Treasurer of FMR Capital, Inc. (2017-present), is an employee of Fidelity Investments (2009-present), and has served in other fund officer roles. Prior to joining Fidelity Investments, Ms. Smith served as Senior Audit Manager of Ernst & Young LLP (accounting firm, 1996-2009). Previously, Ms. Smith served as Assistant Treasurer (2013-2018) and Deputy Treasurer (2013-2016) of certain Fidelity® funds.
Marc L. Spector (1972)
Year of Election or Appointment: 2016
Assistant Treasurer
Mr. Spector also serves as an officer of other funds. Mr. Spector serves as Assistant Treasurer of FMR Capital, Inc. (2017-present) and is an employee of Fidelity Investments (2016-present). Prior to joining Fidelity Investments, Mr. Spector served as Director at the Siegfried Group (accounting firm, 2013-2016), and prior to Siegfried Group as audit senior manager at Deloitte & Touche (accounting firm, 2005-2013).
Renee Stagnone (1975)
Year of Election or Appointment: 2016
Assistant Treasurer
Ms. Stagnone also serves as an officer of other funds. Ms. Stagnone serves as Assistant Treasurer of FMR Capital, Inc. (2017-present) and is an employee of Fidelity Investments (1997-present). Previously, Ms. Stagnone served as Deputy Treasurer of certain Fidelity® funds (2013-2016).
Shareholder Expense Example
As a shareholder of the Fund, you incur two types of costs: (1) transaction costs and (2) ongoing costs, including management fees and other Fund expenses. This Example is intended to help you understand your ongoing costs (in dollars) of investing in the Fund and to compare these costs with the ongoing costs of investing in other mutual funds.
The Example is based on an investment of $1,000 invested at the beginning of the period and held for the entire period (February 1, 2018 to July 31, 2018).
Actual Expenses
The first line of the accompanying table for each class of the Fund provides information about actual account values and actual expenses. You may use the information in this line, together with the amount you invested, to estimate the expenses that you paid over the period. Simply divide your account value by $1,000.00 (for example, an $8,600 account value divided by $1,000.00 = 8.6), then multiply the result by the number in the first line for a class of the Fund under the heading entitled "Expenses Paid During Period" to estimate the expenses you paid on your account during this period. A small balance maintenance fee of $12.00 that is charged once a year may apply for certain accounts with a value of less than $2,000. This fee is not included in the table below. If it was, the estimate of expenses you paid during the period would be higher, and your ending account value lower, by this amount. In addition, the Fund, as a shareholder in the underlying Fidelity Central Funds, will indirectly bear its pro-rata share of the fees and expenses incurred by the underlying Fidelity Central Funds. These fees and expenses are not included in the Fund's annualized expense ratio used to calculate the expense estimate in the table below.
Hypothetical Example for Comparison Purposes
The second line of the accompanying table for each class of the Fund provides information about hypothetical account values and hypothetical expenses based on a Class' actual expense ratio and an assumed rate of return of 5% per year before expenses, which is not the Class' actual return. The hypothetical account values and expenses may not be used to estimate the actual ending account balance or expenses you paid for the period. You may use this information to compare the ongoing costs of investing in the Fund and other funds. To do so, compare this 5% hypothetical example with the 5% hypothetical examples that appear in the shareholder reports of the other funds. A small balance maintenance fee of $12.00 that is charged once a year may apply for certain accounts with a value of less than $2,000. This fee is not included in the table below. If it was, the estimate of expenses you paid during the period would be higher, and your ending account value lower, by this amount. In addition, the Fund, as a shareholder in the underlying Fidelity Central Funds, will indirectly bear its pro-rata share of the fees and expenses incurred by the underlying Fidelity Central Funds. These fees and expenses are not included in the Fund's annualized expense ratio used to calculate the expense estimate in the table below.
Please note that the expenses shown in the table are meant to highlight your ongoing costs only and do not reflect any transaction costs. Therefore, the second line of the table is useful in comparing ongoing costs only, and will not help you determine the relative total costs of owning different funds.
| | Annualized Expense Ratio-A | Beginning
Account Value
February 1, 2018 | Ending
Account Value
July 31, 2018 | Expenses Paid
During Period-B
February 1, 2018
to July 31, 2018 |
| Dividend Growth | .50% | | | |
| Actual | | $1,000.00 | $982.30 | $2.46 |
| Hypothetical-C | | $1,000.00 | $1,022.32 | $2.51 |
| Class K | .40% | | | |
| Actual | | $1,000.00 | $982.80 | $1.97 |
| Hypothetical-C | | $1,000.00 | $1,022.81 | $2.01 |
A Annualized expense ratio reflects expenses net of applicable fee waivers.
B Expenses are equal to each Class' annualized expense ratio, multiplied by the average account value over the period, multiplied by 181/365 (to reflect the one-half year period).
C 5% return per year before expenses
Distributions (Unaudited)
The Board of Trustees of Fidelity Dividend Growth Fund voted to pay to shareholders of record at the opening of business on record date, the following distributions per share derived from capital gains realized from sales of portfolio securities, and dividends derived from net investment income:
| | Pay Date | Record Date | Dividends | Capital Gains |
| Fidelity Dividend Growth Fund | | | | |
| Dividend Growth | 09/17/2018 | 09/14/2018 | $0.327 | $4.751 |
| Class K | 09/17/2018 | 09/14/2018 | $0.347 | $4.751 |
|
The fund hereby designates as a capital gain dividend with respect to the taxable year ended July 31,2018 $1,484,302,279 , or, if subsequently determined to be different, the net capital gain of such year.
Dividend Growth designates 100% and 90% and Class K designates 100% and 87% of the dividends distributed in September and December, respectively during the fiscal year as qualifying for the dividends-received deduction for corporate shareholders.
Dividend Growth and Class K designate 100% of the dividends distributed in September and December, respectively during the fiscal year as amounts which may be taken into account as a dividend for the purposes of the maximum rate under section 1(h)(11) of the Internal Revenue Code.
The fund will notify shareholders in January 2019 of amounts for use in preparing 2018 income tax returns.
Board Approval of Investment Advisory Contracts
Fidelity Dividend Growth Fund
At its July 2018 meeting, the Board of Trustees, including the Independent Trustees (together, the Board), voted to continue the management contract with Fidelity Management & Research Company (FMR) and the sub-advisory agreements (together, the Advisory Contracts) for the fund for six months through January 31, 2019, in connection with the reunification of the Fidelity Equity High Income Funds Board, which oversees the fund, and the Sector Portfolios Board.
The Board considered that the approval of the fund's Advisory Contracts will not result in any changes in (i) the investment process or strategies employed in the management of the fund's assets; (ii) the fees and expenses paid by shareholders; (iii) the nature, extent or quality of services provided under the fund's Advisory Contracts; or (iv) the day-to-day management of the fund or the persons primarily responsible for such management. The Board concluded that the fund's Advisory Contracts are fair and reasonable, and that the fund's Advisory Contracts should be renewed, without modification, through January 31, 2019, with the understanding that the Board will consider the annual renewal for a full one year period in January 2019.
In connection with its consideration of future renewals of the fund's Advisory Contracts, the Board will consider: (i) the nature, extent and quality of services provided to the fund, including shareholder and administrative services and investment performance; (ii) the competitiveness of the management fee and total expenses for the fund; (iii) the costs of the services and profitability, including the revenues earned and the expenses incurred in conducting the business of developing, marketing, distributing, managing, administering, and servicing the fund and its shareholders, to the extent applicable, as well as potential fall-out benefits from Fidelity's non-fund businesses; and (iv) whether there have been economies of scale in respect of the Fidelity funds, whether the Fidelity funds (including the fund) have appropriately benefited from any such economies of scale, and whether there is the potential for realization of any further economies.
Based on its evaluation of all of the conclusions noted above, and after considering all factors it believed relevant, the Board ultimately concluded that the fund's management fee structure is fair and reasonable, and that the continuation of the fund's Advisory Contracts should be approved.
Corporate Headquarters
245 Summer St.
Boston, MA 02210
www.fidelity.com
DGF-K-ANN-0918
1.863065.109
Fidelity® Blue Chip Value Fund
Annual Report July 31, 2018 |
|
Contents
To view a fund's proxy voting guidelines and proxy voting record for the 12-month period ended June 30, visit http://www.fidelity.com/proxyvotingresults or visit the Securities and Exchange Commission's (SEC) web site at http://www.sec.gov.
You may also call 1-800-544-8544 to request a free copy of the proxy voting guidelines.
Standard & Poor's, S&P and S&P 500 are registered service marks of The McGraw-Hill Companies, Inc. and have been licensed for use by Fidelity Distributors Corporation.
Other third-party marks appearing herein are the property of their respective owners.
All other marks appearing herein are registered or unregistered trademarks or service marks of FMR LLC or an affiliated company. © 2018 FMR LLC. All rights reserved.
This report and the financial statements contained herein are submitted for the general information of the shareholders of the Fund. This report is not authorized for distribution to prospective investors in the Fund unless preceded or accompanied by an effective prospectus.
A fund files its complete schedule of portfolio holdings with the SEC for the first and third quarters of each fiscal year on Form N-Q. Forms N-Q are available on the SEC’s web site at http://www.sec.gov. A fund's Forms N-Q may be reviewed and copied at the SEC’s Public Reference Room in Washington, DC. Information regarding the operation of the SEC's Public Reference Room may be obtained by calling 1-800-SEC-0330.
For a complete list of a fund's portfolio holdings, view the most recent holdings listing, semiannual report, or annual report on Fidelity's web site at http://www.fidelity.com, http://www.institutional.fidelity.com, or http://www.401k.com, as applicable.
NOT FDIC INSURED •MAY LOSE VALUE •NO BANK GUARANTEE
Neither the Fund nor Fidelity Distributors Corporation is a bank.
Performance: The Bottom Line
Average annual total return reflects the change in the value of an investment, assuming reinvestment of distributions from dividend income and capital gains (the profits earned upon the sale of securities that have grown in value, if any) and assuming a constant rate of performance each year. The hypothetical investment and the average annual total returns do not reflect the deduction of taxes that a shareholder would pay on fund distributions or the redemption of fund shares. During periods of reimbursement by Fidelity, a fund’s total return will be greater than it would be had the reimbursement not occurred. How a fund did yesterday is no guarantee of how it will do tomorrow.
Average Annual Total Returns
| For the periods ended July 31, 2018 | Past 1 year | Past 5 years | Past 10 years |
| Fidelity® Blue Chip Value Fund | 6.79% | 9.70% | 6.66% |
$10,000 Over 10 Years
Let's say hypothetically that $10,000 was invested in Fidelity® Blue Chip Value Fund on July 31, 2008.
The chart shows how the value of your investment would have changed, and also shows how the Russell 1000® Value Index performed over the same period.
| Period Ending Values |
| $19,054 | Fidelity® Blue Chip Value Fund |
| $23,573 | Russell 1000® Value Index |
Management's Discussion of Fund Performance
Market Recap: The U.S. equity bellwether S&P 500
® index gained 16.24% for the 12 months ending July 31, 2018, despite a resurgence in volatility that challenged the multiyear bull market. Stocks maintained their steady growth until a sharp reversal in February, as volatility spiked amid fear that rising inflation and the potential for the economy to overheat would prompt the U.S. Federal Reserve to pick up the pace of interest rate hikes. The index posted its first negative monthly result since October 2016, and then lost further ground in March on fear of a global trade war. The market stabilized in April and turned upward through mid-June, when escalating trade tension between the U.S. and China soured investor sentiment. The resulting uncertainty lingered into July, but strong corporate earnings helped the S&P 500 rise 3.72% that month to cap the period. For the full one-year period, growth handily topped value, while small-caps bested large-caps. By sector, information technology (+28%) led the way, boosted by strong earnings growth from several major index constituents. Consumer discretionary rose roughly 24%, driven by retailers (+49%). Energy (+20%) gained alongside higher oil prices. Laggards were telecommunication services (-2%), consumer staples (0%) and utilities (+3%), defensive groups that struggled amid rising interest rates and a general preference for risk. Real estate (+5%) fared a bit better but still lagged, as did financials, industrials, health care (each up 13%) and materials (+11%).
Comments from Portfolio Manager Sean Gavin: For the fiscal year, the fund gained 6.79%, trailing the 9.54% result of the benchmark Russell 1000
® Value Index. The fund's underperformance of the benchmark was due to ineffective security selection, coupled with an unfavorable market backdrop for my style of investing. Security selection in the health care, energy and financials sectors were the largest relative detractors. Conversely, sector allocation – which derives from my bottom-up, stock-by-stock investment approach – helped the fund’s relative result, with an underweighting in the weak telecommunication services group contributing most. My picks in consumer discretionary and consumer staples also provided a notable boost. On an individual basis, the biggest impact by far came from a non-benchmark equity position in Israeli drug maker Teva Pharmaceutical Industries, which returned roughly -46% for the fund before I sold the position last fall. Over time, I concluded the company's challenges were too deep-rooted to justify further investment. Other detractors from the health care sector included drug store operator and pharmacy benefit management company CVS Health and drugmaker Allergan. Elsewhere, information-analytics company Nielsen Holdings also detracted. On the positive side, the biggest individual relative contributor stemmed from my decision to not hold benchmark component General Electric, which struggled amid numerous business challenges. It helped to overweight media company Twenty-First Century Fox, which was poised to be acquired by Disney. Both Fox and Disney were meaningful holdings in the fund at period end. Also contributing was CBRE Group, a provider of real estate services.
The views expressed above reflect those of the portfolio manager(s) only through the end of the period as stated on the cover of this report and do not necessarily represent the views of Fidelity or any other person in the Fidelity organization. Any such views are subject to change at any time based upon market or other conditions and Fidelity disclaims any responsibility to update such views. These views may not be relied on as investment advice and, because investment decisions for a Fidelity fund are based on numerous factors, may not be relied on as an indication of trading intent on behalf of any Fidelity fund.
Investment Summary (Unaudited)
Top Ten Stocks as of July 31, 2018
| | % of fund's net assets |
| Wells Fargo & Co. | 4.7 |
| CVS Health Corp. | 4.2 |
| Cigna Corp. | 4.2 |
| Comcast Corp. Class A | 4.1 |
| Berkshire Hathaway, Inc. Class B | 3.7 |
| Exxon Mobil Corp. | 3.6 |
| U.S. Bancorp | 3.2 |
| Twenty-First Century Fox, Inc. Class A | 2.8 |
| The Walt Disney Co. | 2.7 |
| United Technologies Corp. | 2.6 |
| | 35.8 |
Top Five Market Sectors as of July 31, 2018
| | % of fund's net assets |
| Financials | 22.9 |
| Health Care | 16.2 |
| Consumer Discretionary | 13.8 |
| Energy | 12.1 |
| Information Technology | 8.0 |
Asset Allocation (% of fund's net assets)
| As of July 31, 2018* |
| | Stocks and Equity Futures | 97.7% |
| | Short-Term Investments and Net Other Assets (Liabilities) | 2.3% |

* Foreign investments - 24.3%
Schedule of Investments July 31, 2018
Showing Percentage of Net Assets
| Common Stocks - 88.4% | | | |
| | | Shares | Value |
| CONSUMER DISCRETIONARY - 13.8% | | | |
| Media - 12.0% | | | |
| Comcast Corp. Class A | | 447,100 | $15,997,238 |
| Interpublic Group of Companies, Inc. | | 263,600 | 5,944,180 |
| Lions Gate Entertainment Corp. Class B | | 163,377 | 3,736,432 |
| The Walt Disney Co. | | 93,900 | 10,663,284 |
| Twenty-First Century Fox, Inc. Class A | | 244,500 | 11,002,500 |
| | | | 47,343,634 |
| Textiles, Apparel & Luxury Goods - 1.8% | | | |
| PVH Corp. | | 46,500 | 7,138,680 |
|
| TOTAL CONSUMER DISCRETIONARY | | | 54,482,314 |
|
| CONSUMER STAPLES - 7.8% | | | |
| Beverages - 2.1% | | | |
| C&C Group PLC | | 2,004,512 | 8,063,278 |
| Food Products - 3.1% | | | |
| Kellogg Co. | | 68,800 | 4,886,864 |
| The J.M. Smucker Co. | | 65,700 | 7,300,584 |
| | | | 12,187,448 |
| Tobacco - 2.6% | | | |
| British American Tobacco PLC sponsored ADR | | 187,300 | 10,260,294 |
|
| TOTAL CONSUMER STAPLES | | | 30,511,020 |
|
| ENERGY - 12.1% | | | |
| Energy Equipment & Services - 1.8% | | | |
| Baker Hughes, a GE Co. Class A | | 202,800 | 7,012,824 |
| Oil, Gas & Consumable Fuels - 10.3% | | | |
| Exxon Mobil Corp. | | 175,700 | 14,321,307 |
| GasLog Partners LP | | 246,300 | 6,194,445 |
| Golar LNG Partners LP | | 485,900 | 7,973,619 |
| Teekay Corp. (a) | | 151,500 | 1,055,955 |
| Teekay LNG Partners LP | | 433,300 | 6,932,800 |
| Teekay Offshore Partners LP | | 1,554,200 | 3,947,668 |
| | | | 40,425,794 |
|
| TOTAL ENERGY | | | 47,438,618 |
|
| FINANCIALS - 22.9% | | | |
| Banks - 7.9% | | | |
| U.S. Bancorp | | 236,197 | 12,520,803 |
| Wells Fargo & Co. | | 326,298 | 18,693,612 |
| | | | 31,214,415 |
| Capital Markets - 1.5% | | | |
| Goldman Sachs Group, Inc. | | 24,900 | 5,912,007 |
| Consumer Finance - 1.9% | | | |
| Discover Financial Services | | 105,700 | 7,548,037 |
| Diversified Financial Services - 3.7% | | | |
| Berkshire Hathaway, Inc. Class B (b) | | 74,100 | 14,662,167 |
| Insurance - 7.9% | | | |
| Allstate Corp. | | 21,400 | 2,035,568 |
| Chubb Ltd. | | 66,600 | 9,305,352 |
| Prudential PLC | | 426,798 | 10,069,675 |
| The Travelers Companies, Inc. | | 72,800 | 9,474,192 |
| | | | 30,884,787 |
|
| TOTAL FINANCIALS | | | 90,221,413 |
|
| HEALTH CARE - 16.2% | | | |
| Biotechnology - 1.8% | | | |
| Dyax Corp. rights 12/31/19 (b)(c) | | 236,600 | 847,028 |
| Shire PLC sponsored ADR | | 37,068 | 6,324,171 |
| | | | 7,171,199 |
| Health Care Providers & Services - 11.1% | | | |
| Anthem, Inc. | | 41,100 | 10,398,300 |
| Cigna Corp. | | 92,400 | 16,578,408 |
| CVS Health Corp. | | 257,300 | 16,688,478 |
| | | | 43,665,186 |
| Pharmaceuticals - 3.3% | | | |
| Allergan PLC | | 34,300 | 6,314,287 |
| Bayer AG | | 58,042 | 6,461,652 |
| | | | 12,775,939 |
|
| TOTAL HEALTH CARE | | | 63,612,324 |
|
| INDUSTRIALS - 3.2% | | | |
| Aerospace & Defense - 2.6% | | | |
| United Technologies Corp. | | 76,800 | 10,424,832 |
| Professional Services - 0.6% | | | |
| Nielsen Holdings PLC | | 92,100 | 2,169,876 |
|
| TOTAL INDUSTRIALS | | | 12,594,708 |
|
| INFORMATION TECHNOLOGY - 8.0% | | | |
| Communications Equipment - 1.8% | | | |
| Cisco Systems, Inc. | | 170,000 | 7,189,300 |
| Internet Software & Services - 1.9% | | | |
| Alphabet, Inc. Class A (b) | | 6,000 | 7,363,320 |
| IT Services - 3.2% | | | |
| Cognizant Technology Solutions Corp. Class A | | 90,700 | 7,392,050 |
| The Western Union Co. | | 254,500 | 5,130,720 |
| | | | 12,522,770 |
| Technology Hardware, Storage & Peripherals - 1.1% | | | |
| Apple, Inc. | | 23,700 | 4,509,873 |
|
| TOTAL INFORMATION TECHNOLOGY | | | 31,585,263 |
|
| MATERIALS - 1.5% | | | |
| Chemicals - 1.5% | | | |
| LyondellBasell Industries NV Class A | | 51,800 | 5,738,922 |
| REAL ESTATE - 1.1% | | | |
| Real Estate Management & Development - 1.1% | | | |
| CBRE Group, Inc. (b) | | 90,000 | 4,482,000 |
| TELECOMMUNICATION SERVICES - 1.3% | | | |
| Diversified Telecommunication Services - 1.3% | | | |
| AT&T, Inc. | | 159,507 | 5,099,439 |
| UTILITIES - 0.5% | | | |
| Electric Utilities - 0.5% | | | |
| Exelon Corp. | | 47,800 | 2,031,500 |
| TOTAL COMMON STOCKS | | | |
| (Cost $329,137,935) | | | 347,797,521 |
|
| Money Market Funds - 9.8% | | | |
| Fidelity Cash Central Fund, 1.96% (d) | | 37,688,486 | 37,696,024 |
| Fidelity Securities Lending Cash Central Fund 1.97% (d)(e) | | 1,084,770 | 1,084,879 |
| TOTAL MONEY MARKET FUNDS | | | |
| (Cost $38,781,095) | | | 38,780,903 |
| TOTAL INVESTMENT IN SECURITIES - 98.2% | | | |
| (Cost $367,919,030) | | | 386,578,424 |
| NET OTHER ASSETS (LIABILITIES) - 1.8% | | | 6,925,068 |
| NET ASSETS - 100% | | | $393,503,492 |
| Futures Contracts | | | | | |
| | Number of contracts | Expiration Date | Notional Amount | Value | Unrealized Appreciation/(Depreciation) |
| Purchased | | | | | |
| Equity Index Contracts | | | | | |
| CME E-mini Russell 1000 Value Index Contracts (United States) | 592 | Sept. 2018 | $36,461,280 | $239,033 | $239,033 |
The notional amount of futures purchased as a percentage of Net Assets is 9.3%
Legend
(a) Security or a portion of the security is on loan at period end.
(b) Non-income producing
(c) Level 3 security
(d) Affiliated fund that is generally available only to investment companies and other accounts managed by Fidelity Investments. The rate quoted is the annualized seven-day yield of the fund at period end. A complete unaudited listing of the fund's holdings as of its most recent quarter end is available upon request. In addition, each Fidelity Central Fund's financial statements, which are not covered by the Fund's Report of Independent Registered Public Accounting Firm, are available on the SEC's website or upon request.
(e) Investment made with cash collateral received from securities on loan.
Affiliated Central Funds
Information regarding fiscal year to date income earned by the Fund from investments in Fidelity Central Funds is as follows:
| Fund | Income earned |
| Fidelity Cash Central Fund | $179,705 |
| Fidelity Securities Lending Cash Central Fund | 387,727 |
| Total | $567,432 |
Amounts in the income column in the above table include any capital gain distributions from underlying funds, which are presented in the corresponding line-item in the Statement of Operations if applicable.
Investment Valuation
The following is a summary of the inputs used, as of July 31, 2018, involving the Fund's assets and liabilities carried at fair value. The inputs or methodology used for valuing securities may not be an indication of the risk associated with investing in those securities. For more information on valuation inputs, and their aggregation into the levels used below, please refer to the Investment Valuation section in the accompanying Notes to Financial Statements.
| | Valuation Inputs at Reporting Date: |
| Description | Total | Level 1 | Level 2 | Level 3 |
| Investments in Securities: | | | | |
| Equities: | | | | |
| Consumer Discretionary | $54,482,314 | $54,482,314 | $-- | $-- |
| Consumer Staples | 30,511,020 | 30,511,020 | -- | -- |
| Energy | 47,438,618 | 47,438,618 | -- | -- |
| Financials | 90,221,413 | 80,151,738 | 10,069,675 | -- |
| Health Care | 63,612,324 | 56,303,644 | 6,461,652 | 847,028 |
| Industrials | 12,594,708 | 12,594,708 | -- | -- |
| Information Technology | 31,585,263 | 31,585,263 | -- | -- |
| Materials | 5,738,922 | 5,738,922 | -- | -- |
| Real Estate | 4,482,000 | 4,482,000 | -- | -- |
| Telecommunication Services | 5,099,439 | 5,099,439 | -- | -- |
| Utilities | 2,031,500 | 2,031,500 | -- | -- |
| Money Market Funds | 38,780,903 | 38,780,903 | -- | -- |
| Total Investments in Securities: | $386,578,424 | $369,200,069 | $16,531,327 | $847,028 |
| Derivative Instruments: | | | | |
| Assets | | | | |
| Futures Contracts | $239,033 | $239,033 | $-- | $-- |
| Total Assets | $239,033 | $239,033 | $-- | $-- |
| Total Derivative Instruments: | $239,033 | $239,033 | $-- | $-- |
The following is a summary of transfers between Level 1 and Level 2 for the period ended July 31, 2018. Transfers are assumed to have occurred at the beginning of the period, and are primarily attributable to the valuation techniques used for foreign equity securities, as discussed in the accompanying Notes to Financial Statements:
| Transfers | Total |
| Level 1 to Level 2 | $6,088,520 |
| Level 2 to Level 1 | $0 |
Value of Derivative Instruments
The following table is a summary of the Fund's value of derivative instruments by primary risk exposure as of July 31, 2018. For additional information on derivative instruments, please refer to the Derivative Instruments section in the accompanying Notes to Financial Statements.
| Primary Risk Exposure / Derivative Type | Value |
| | Asset | Liability |
| Equity Risk(a) | | |
| Futures Contracts | $239,033 | $0 |
| Total Equity Risk | 239,033 | 0 |
| Total Value of Derivatives | $239,033 | $0 |
(a) Reflects gross cumulative appreciation (depreciation) on futures contracts as presented in the Schedule of Investments. In the Statement of Assets and Liabilities, the period end daily variation margin is included in receivable or payable for daily variation margin on futures contracts, and the net cumulative appreciation (depreciation) is included in net unrealized appreciation (depreciation).
Other Information
Distribution of investments by country or territory of incorporation, as a percentage of Total Net Assets, is as follows (Unaudited):
| United States of America | 75.7% |
| Marshall Islands | 6.7% |
| United Kingdom | 5.8% |
| Ireland | 3.7% |
| Switzerland | 2.4% |
| Germany | 1.7% |
| Bailiwick of Jersey | 1.6% |
| Netherlands | 1.5% |
| Others (Individually Less Than 1%) | 0.9% |
| | 100.0% |
See accompanying notes which are an integral part of the financial statements.
Financial Statements
Statement of Assets and Liabilities
| | | July 31, 2018 |
| Assets | | |
Investment in securities, at value (including securities loaned of $1,042,189) — See accompanying schedule:
Unaffiliated issuers (cost $329,137,935) | $347,797,521 | |
| Fidelity Central Funds (cost $38,781,095) | 38,780,903 | |
| Total Investment in Securities (cost $367,919,030) | | $386,578,424 |
| Segregated cash with brokers for derivative instruments | | 1,166,400 |
| Receivable for investments sold | | 42,618,741 |
| Receivable for fund shares sold | | 145,908 |
| Dividends receivable | | 368,004 |
| Distributions receivable from Fidelity Central Funds | | 23,406 |
| Receivable for daily variation margin on futures contracts | | 108,347 |
| Prepaid expenses | | 977 |
| Other receivables | | 6,007 |
| Total assets | | 431,016,214 |
| Liabilities | | |
| Payable for investments purchased | $35,754,733 | |
| Payable for fund shares redeemed | 431,238 | |
| Accrued management fee | 116,789 | |
| Other affiliated payables | 73,019 | |
| Other payables and accrued expenses | 52,887 | |
| Collateral on securities loaned | 1,084,056 | |
| Total liabilities | | 37,512,722 |
| Net Assets | | $393,503,492 |
| Net Assets consist of: | | |
| Paid in capital | | $373,678,405 |
| Undistributed net investment income | | 1,761,720 |
| Accumulated undistributed net realized gain (loss) on investments and foreign currency transactions | | (835,110) |
| Net unrealized appreciation (depreciation) on investments and assets and liabilities in foreign currencies | | 18,898,477 |
| Net Assets, for 19,778,009 shares outstanding | | $393,503,492 |
| Net Asset Value, offering price and redemption price per share ($393,503,492 ÷ 19,778,009 shares) | | $19.90 |
See accompanying notes which are an integral part of the financial statements.
Statement of Operations
| | | Year ended July 31, 2018 |
| Investment Income | | |
| Dividends | | $7,539,663 |
| Income from Fidelity Central Funds | | 567,432 |
| Total income | | 8,107,095 |
| Expenses | | |
| Management fee | | |
| Basic fee | $2,153,071 | |
| Performance adjustment | (358,963) | |
| Transfer agent fees | 740,118 | |
| Accounting and security lending fees | 156,221 | |
| Custodian fees and expenses | 8,111 | |
| Independent trustees' fees and expenses | 1,710 | |
| Registration fees | 29,064 | |
| Audit | 62,455 | |
| Legal | 3,223 | |
| Miscellaneous | 2,773 | |
| Total expenses before reductions | 2,797,783 | |
| Expense reductions | (11,309) | |
| Total expenses after reductions | | 2,786,474 |
| Net investment income (loss) | | 5,320,621 |
| Realized and Unrealized Gain (Loss) | | |
| Net realized gain (loss) on: | | |
| Investment securities: | | |
| Unaffiliated issuers | 54,664,981 | |
| Fidelity Central Funds | 822 | |
| Foreign currency transactions | (5,294) | |
| Futures contracts | 62,744 | |
| Total net realized gain (loss) | | 54,723,253 |
| Change in net unrealized appreciation (depreciation) on: | | |
| Investment securities: | | |
| Unaffiliated issuers | (34,971,346) | |
| Fidelity Central Funds | (3) | |
| Assets and liabilities in foreign currencies | 53 | |
| Futures contracts | 239,033 | |
| Total change in net unrealized appreciation (depreciation) | | (34,732,263) |
| Net gain (loss) | | 19,990,990 |
| Net increase (decrease) in net assets resulting from operations | | $25,311,611 |
See accompanying notes which are an integral part of the financial statements.
Statement of Changes in Net Assets
| | Year ended July 31, 2018 | Year ended July 31, 2017 |
| Increase (Decrease) in Net Assets | | |
| Operations | | |
| Net investment income (loss) | $5,320,621 | $4,330,903 |
| Net realized gain (loss) | 54,723,253 | 20,725,978 |
| Change in net unrealized appreciation (depreciation) | (34,732,263) | 41,416,367 |
| Net increase (decrease) in net assets resulting from operations | 25,311,611 | 66,473,248 |
| Distributions to shareholders from net investment income | (4,465,976) | (4,486,672) |
| Distributions to shareholders from net realized gain | (81,343) | – |
| Total distributions | (4,547,319) | (4,486,672) |
| Share transactions | | |
| Proceeds from sales of shares | 65,621,638 | 70,221,494 |
| Reinvestment of distributions | 4,381,389 | 4,351,879 |
| Cost of shares redeemed | (109,494,133) | (181,506,778) |
| Net increase (decrease) in net assets resulting from share transactions | (39,491,106) | (106,933,405) |
| Total increase (decrease) in net assets | (18,726,814) | (44,946,829) |
| Net Assets | | |
| Beginning of period | 412,230,306 | 457,177,135 |
| End of period | $393,503,492 | $412,230,306 |
| Other Information | | |
| Undistributed net investment income end of period | $1,761,720 | $2,095,365 |
| Shares | | |
| Sold | 3,406,839 | 3,956,093 |
| Issued in reinvestment of distributions | 233,439 | 258,721 |
| Redeemed | (5,729,568) | (10,583,646) |
| Net increase (decrease) | (2,089,290) | (6,368,832) |
See accompanying notes which are an integral part of the financial statements.
Financial Highlights
Fidelity Blue Chip Value Fund
| | | | | | |
| Years ended July 31, | 2018 | 2017 | 2016 | 2015 | 2014 |
| Selected Per–Share Data | | | | | |
| Net asset value, beginning of period | $18.85 | $16.19 | $16.88 | $15.22 | $13.32 |
| Income from Investment Operations | | | | | |
| Net investment income (loss)A | .26 | .18 | .19 | .35B | .18 |
| Net realized and unrealized gain (loss) | 1.01 | 2.66 | (.59) | 1.54 | 1.81 |
| Total from investment operations | 1.27 | 2.84 | (.40) | 1.89 | 1.99 |
| Distributions from net investment income | (.21) | (.18) | (.28) | (.23) | (.09) |
| Distributions from net realized gain | –C | – | (.01) | – | – |
| Total distributions | (.22)D | (.18) | (.29) | (.23) | (.09) |
| Net asset value, end of period | $19.90 | $18.85 | $16.19 | $16.88 | $15.22 |
| Total ReturnE | 6.79% | 17.68% | (2.31)% | 12.52% | 14.99% |
| Ratios to Average Net AssetsF,G | | | | | |
| Expenses before reductions | .70% | .79% | .88% | .82% | .66% |
| Expenses net of fee waivers, if any | .70% | .79% | .88% | .82% | .66% |
| Expenses net of all reductions | .70% | .78% | .88% | .82% | .66% |
| Net investment income (loss) | 1.34% | 1.04% | 1.23% | 2.15%B | 1.28% |
| Supplemental Data | | | | | |
| Net assets, end of period (000 omitted) | $393,503 | $412,230 | $457,177 | $410,968 | $329,826 |
| Portfolio turnover rateH | 45% | 32% | 54% | 138% | 102%I |
A Calculated based on average shares outstanding during the period.
B Net investment income per share reflects a large, non-recurring dividend which amounted to $.13 per share. Excluding this non-recurring dividend, the ratio of net investment income (loss) to average net assets would have been 1.35%.
C Amount represents less than $.005 per share.
D Total distributions of $.22 per share is comprised of distributions from net investment income of $.213 and distributions from net realized gain of $.004 per share.
E Total returns would have been lower if certain expenses had not been reduced during the applicable periods shown.
F Fees and expenses of any underlying Fidelity Central Funds are not included in the Fund's expense ratio. The Fund indirectly bears its proportionate share of the expenses of any underlying Fidelity Central Funds.
G Expense ratios reflect operating expenses of the Fund. Expenses before reductions do not reflect amounts reimbursed by the investment adviser or reductions from brokerage service arrangements or reductions from other expense offset arrangements and do not represent the amount paid by the Fund during periods when reimbursements or reductions occur. Expenses net of fee waivers reflect expenses after reimbursement by the investment adviser but prior to reductions from brokerage service arrangements or other expense offset arrangements. Expenses net of all reductions represent the net expenses paid by the Fund.
H Amount does not include the portfolio activity of any underlying Fidelity Central Funds.
I Portfolio turnover rate excludes securities received or delivered in-kind.
See accompanying notes which are an integral part of the financial statements.
Notes to Financial Statements
For the period ended July 31, 2018
1. Organization.
Fidelity Blue Chip Value Fund (the Fund) is a fund of Fidelity Securities Fund (the Trust) and is authorized to issue an unlimited number of shares. Share transactions on the Statement of Changes in Net Assets may contain exchanges between affiliated funds. The Trust is registered under the Investment Company Act of 1940, as amended (the 1940 Act), as an open-end management investment company organized as a Massachusetts business trust.
2. Investments in Fidelity Central Funds.
The Fund invests in Fidelity Central Funds, which are open-end investment companies generally available only to other investment companies and accounts managed by the investment adviser and its affiliates. The Fund's Schedule of Investments lists each of the Fidelity Central Funds held as of period end, if any, as an investment of the Fund, but does not include the underlying holdings of each Fidelity Central Fund. As an Investing Fund, the Fund indirectly bears its proportionate share of the expenses of the underlying Fidelity Central Funds.
The Money Market Central Funds seek preservation of capital and current income and are managed by Fidelity Investments Money Management, Inc. (FIMM), an affiliate of the investment adviser. Annualized expenses of the Money Market Central Funds as of their most recent shareholder report date are less than .005%.
A complete unaudited list of holdings for each Fidelity Central Fund is available upon request or at the Securities and Exchange Commission (the SEC) website at www.sec.gov. In addition, the financial statements of the Fidelity Central Funds, which are not covered by the Fund's Report of Independent Registered Public Accounting Firm, are available on the SEC website or upon request.
3. Significant Accounting Policies.
The Fund is an investment company and applies the accounting and reporting guidance of the Financial Accounting Standards Board (FASB) Accounting Standards Codification Topic 946 Financial Services – Investments Companies. The financial statements have been prepared in conformity with accounting principles generally accepted in the United States of America (GAAP), which require management to make certain estimates and assumptions at the date of the financial statements. Actual results could differ from those estimates. Subsequent events, if any, through the date that the financial statements were issued have been evaluated in the preparation of the financial statements. The following summarizes the significant accounting policies of the Fund:
Investment Valuation. Investments are valued as of 4:00 p.m. Eastern time on the last calendar day of the period. The Board of Trustees (the Board) has delegated the day to day responsibility for the valuation of the Fund's investments to the Fair Value Committee (the Committee) established by the Fund's investment adviser. In accordance with valuation policies and procedures approved by the Board, the Fund attempts to obtain prices from one or more third party pricing vendors or brokers to value its investments. When current market prices, quotations or currency exchange rates are not readily available or reliable, investments will be fair valued in good faith by the Committee, in accordance with procedures adopted by the Board. Factors used in determining fair value vary by investment type and may include market or investment specific events. The frequency with which these procedures are used cannot be predicted and they may be utilized to a significant extent. The Committee oversees the Fund's valuation policies and procedures and reports to the Board on the Committee's activities and fair value determinations. The Board monitors the appropriateness of the procedures used in valuing the Fund's investments and ratifies the fair value determinations of the Committee.
The Fund categorizes the inputs to valuation techniques used to value its investments into a disclosure hierarchy consisting of three levels as shown below:
- Level 1 – quoted prices in active markets for identical investments
- Level 2 – other significant observable inputs (including quoted prices for similar investments, interest rates, prepayment speeds, etc.)
- Level 3 – unobservable inputs (including the Fund's own assumptions based on the best information available)
Valuation techniques used to value the Fund's investments by major category are as follows:
Equity securities, including restricted securities, for which market quotations are readily available, are valued at the last reported sale price or official closing price as reported by a third party pricing vendor on the primary market or exchange on which they are traded and are categorized as Level 1 in the hierarchy. In the event there were no sales during the day or closing prices are not available, securities are valued at the last quoted bid price or may be valued using the last available price and are generally categorized as Level 2 in the hierarchy. For foreign equity securities, when market or security specific events arise, comparisons to the valuation of American Depositary Receipts (ADRs), futures contracts, Exchange-Traded Funds (ETFs) and certain indexes as well as quoted prices for similar securities may be used and would be categorized as Level 2 in the hierarchy. Utilizing these techniques may result in transfers between Level 1 and Level 2. For equity securities, including restricted securities, where observable inputs are limited, assumptions about market activity and risk are used and these securities may be categorized as Level 3 in the hierarchy.
Futures contracts are valued at the settlement price established each day by the board of trade or exchange on which they are traded and are categorized as Level 1 in the hierarchy. Investments in open-end mutual funds, including the Fidelity Central Funds, are valued at their closing net asset value (NAV) each business day and are categorized as Level 1 in the hierarchy.
Changes in valuation techniques may result in transfers in or out of an assigned level within the disclosure hierarchy. The aggregate value of investments by input level as of July 31, 2018 including information on transfers between Levels 1 and 2, is included at the end of the Fund's Schedule of Investments.
Foreign Currency. The Fund may use foreign currency contracts to facilitate transactions in foreign-denominated securities. Gains and losses from these transactions may arise from changes in the value of the foreign currency or if the counterparties do not perform under the contracts' terms.
Foreign-denominated assets, including investment securities, and liabilities are translated into U.S. dollars at the exchange rates at period end. Purchases and sales of investment securities, income and dividends received and expenses denominated in foreign currencies are translated into U.S. dollars at the exchange rate in effect on the transaction date.
The effects of exchange rate fluctuations on investments are included with the net realized and unrealized gain (loss) on investment securities. Other foreign currency transactions resulting in realized and unrealized gain (loss) are disclosed separately.
Investment Transactions and Income. For financial reporting purposes, the Fund's investment holdings and NAV include trades executed through the end of the last business day of the period. The NAV per share for processing shareholder transactions is calculated as of the close of business of the New York Stock Exchange (NYSE), normally 4:00 p.m. Eastern time and includes trades executed through the end of the prior business day. Gains and losses on securities sold are determined on the basis of identified cost and include proceeds received from litigation. Dividend income is recorded on the ex-dividend date, except for certain dividends from foreign securities where the ex-dividend date may have passed, which are recorded as soon as the Fund is informed of the ex-dividend date. Non-cash dividends included in dividend income, if any, are recorded at the fair market value of the securities received. Income and capital gain distributions from Fidelity Central Funds, if any, are recorded on the ex-dividend date. Certain distributions received by the Fund represent a return of capital or capital gain. The Fund determines the components of these distributions subsequent to the ex-dividend date, based upon receipt of tax filings or other correspondence relating to the underlying investment. These distributions are recorded as a reduction of cost of investments and/or as a realized gain. Investment income is recorded net of foreign taxes withheld where recovery of such taxes is uncertain.
Expenses. Expenses directly attributable to a fund are charged to that fund. Expenses attributable to more than one fund are allocated among the respective funds on the basis of relative net assets or other appropriate methods. Expense estimates are accrued in the period to which they relate and adjustments are made when actual amounts are known.
Income Tax Information and Distributions to Shareholders. Each year, the Fund intends to qualify as a regulated investment company under Subchapter M of the Internal Revenue Code, including distributing substantially all of its taxable income and realized gains. As a result, no provision for U.S. Federal income taxes is required. As of July 31, 2018, the Fund did not have any unrecognized tax benefits in the financial statements; nor is the Fund aware of any tax positions for which it is reasonably possible that the total amounts of unrecognized tax benefits will significantly change in the next twelve months. The Fund files a U.S. federal tax return, in addition to state and local tax returns as required. The Fund's federal income tax returns are subject to examination by the Internal Revenue Service (IRS) for a period of three fiscal years after they are filed. State and local tax returns may be subject to examination for an additional fiscal year depending on the jurisdiction. Foreign taxes are provided for based on the Fund's understanding of the tax rules and rates that exist in the foreign markets in which it invests.
Distributions are declared and recorded on the ex-dividend date. Income and capital gain distributions are determined in accordance with income tax regulations, which may differ from GAAP. In addition, the Fund claimed a portion of the payment made to redeeming shareholders as a distribution for income tax purposes.
Capital accounts within the financial statements are adjusted for permanent book-tax differences. These adjustments have no impact on net assets or the results of operations. Capital accounts are not adjusted for temporary book-tax differences which will reverse in a subsequent period.
Book-tax differences are primarily due to futures contracts, foreign currency transactions, passive foreign investment companies (PFIC), partnerships, capital loss carryforwards and losses deferred due to wash sales.
As of period end, the cost and unrealized appreciation (depreciation) in securities, and derivatives if applicable, for federal income tax purposes were as follows:
| Gross unrealized appreciation | $33,462,151 |
| Gross unrealized depreciation | (17,091,565) |
| Net unrealized appreciation (depreciation) | $16,370,586 |
| Tax Cost | $370,207,838 |
The tax-based components of distributable earnings as of period end were as follows:
| Undistributed ordinary income | $2,202,719 |
| Undistributed long-term capital gain | $1,692,731 |
| Net unrealized appreciation (depreciation) on securities and other investments | $15,929,637 |
The tax character of distributions paid was as follows:
| | July 31, 2018 | July 31, 2017 |
| Ordinary Income | $4,547,319 | $ 4,486,672 |
4. Derivative Instruments.
Risk Exposures and the Use of Derivative Instruments. The Fund's investment objective allows the Fund to enter into various types of derivative contracts, including futures contracts. Derivatives are investments whose value is primarily derived from underlying assets, indices or reference rates and may be transacted on an exchange or over-the-counter (OTC). Derivatives may involve a future commitment to buy or sell a specified asset based on specified terms, to exchange future cash flows at periodic intervals based on a notional principal amount, or for one party to make one or more payments upon the occurrence of specified events in exchange for periodic payments from the other party.
The Fund primarily used derivatives to increase returns and to manage exposure to certain risks as defined below. The success of any strategy involving derivatives depends on analysis of numerous economic factors, and if the strategies for investment do not work as intended, the Fund may not achieve its objectives.
The Fund's use of derivatives increased or decreased its exposure to the following risk:
| Equity Risk | Equity risk relates to the fluctuations in the value of financial instruments as a result of changes in market prices (other than those arising from interest rate risk or foreign exchange risk), whether caused by factors specific to an individual investment, its issuer, or all factors affecting all instruments traded in a market or market segment.
|
The Fund is also exposed to additional risks from investing in derivatives, such as liquidity risk and counterparty credit risk. Liquidity risk is the risk that the Fund will be unable to close out the derivative in the open market in a timely manner. Counterparty credit risk is the risk that the counterparty will not be able to fulfill its obligation to the Fund. Counterparty credit risk related to exchange-traded futures contracts may be mitigated by the protection provided by the exchange on which they trade.
Investing in derivatives may involve greater risks than investing in the underlying assets directly and, to varying degrees, may involve risk of loss in excess of any initial investment and collateral received and amounts recognized in the Statement of Assets and Liabilities. In addition, there may be the risk that the change in value of the derivative contract does not correspond to the change in value of the underlying instrument.
Futures Contracts. A futures contract is an agreement between two parties to buy or sell a specified underlying instrument for a fixed price at a specified future date. The Fund used futures contracts to manage its exposure to the stock market.
Upon entering into a futures contract, a fund is required to deposit either cash or securities (initial margin) with a clearing broker in an amount equal to a certain percentage of the face value of the contract. Futures contracts are marked-to-market daily and subsequent daily payments (variation margin) are made or received by a fund depending on the daily fluctuations in the value of the futures contracts and are recorded as unrealized appreciation or (depreciation). This receivable and/or payable, if any, is included in daily variation margin on futures contracts in the Statement of Assets and Liabilities. Realized gain or (loss) is recorded upon the expiration or closing of a futures contract. The net realized gain (loss) and change in net unrealized appreciation (depreciation) on futures contracts during the period is presented in the Statement of Operations.
Any open futures contracts at period end are presented in the Schedule of Investments under the caption "Futures Contracts". The notional amount at value reflects each contract's exposure to the underlying instrument or index at period end and is representative of volume of activity during the period. Cash deposited to meet initial margin requirements is presented as segregated cash with brokers for derivative instruments in the Statement of Assets and Liabilities.
5. Purchases and Sales of Investments.
Purchases and sales of securities, other than short-term securities, aggregated $174,028,278 and $251,873,821, respectively.
6. Fees and Other Transactions with Affiliates.
Management Fee. Fidelity Management & Research Company (the investment adviser) and its affiliates provide the Fund with investment management related services for which the Fund pays a monthly management fee. The management fee is the sum of an individual fund fee rate that is based on an annual rate of .30% of the Fund's average net assets and an annualized group fee rate that averaged .24% during the period. The group fee rate is based upon the average net assets of all the mutual funds advised by the investment adviser, including any mutual funds previously advised by the investment adviser that are currently advised by Fidelity SelectCo, LLC, an affiliate of the investment adviser. The group fee rate decreases as assets under management increase and increases as assets under management decrease. In addition, the management fee is subject to a performance adjustment (up to a maximum of +/- .20% of the Fund's average net assets over a 36 month performance period). The upward or downward adjustment to the management fee is based on the Fund's relative investment performance as compared to its benchmark index, the Russell 1000 Value Index, over the same 36 month performance period. For the reporting period, the total annual management fee rate, including the performance adjustment, was .45% of the Fund's average net assets. The performance adjustment included in the management fee rate may be higher or lower than the maximum performance adjustment rate due to the difference between the average net assets for the reporting and performance periods.
Transfer Agent Fees. Fidelity Investments Institutional Operations Company, Inc. (FIIOC), an affiliate of the investment adviser, is the Fund's transfer, dividend disbursing and shareholder servicing agent. FIIOC receives account fees and asset-based fees that vary according to account size and type of account. FIIOC pays for typesetting, printing and mailing of shareholder reports, except proxy statements. For the period, the transfer agent fees were equivalent to an annual rate of .19% of average net assets.
Accounting and Security Lending Fees. Fidelity Service Company, Inc. (FSC), an affiliate of the investment adviser, maintains the Fund's accounting records. The accounting fee is based on the level of average net assets for each month. Under a separate contract, FSC administers the security lending program. The security lending fee is based on the number and duration of lending transactions. For the period, the fees were equivalent to an annual rate of .04%.
Brokerage Commissions. The Fund placed a portion of its portfolio transactions with brokerage firms which are affiliates of the investment adviser. Brokerage commissions are included in net realized gain (loss) and change in net unrealized appreciation (depreciation) in the Statement of Operations. The commissions paid to these affiliated firms were $2,449 for the period.
Interfund Trades. The Fund may purchase from or sell securities to other Fidelity Funds under procedures adopted by the Board. The procedures have been designed to ensure these interfund trades are executed in accordance with Rule 17a-7 of the 1940 Act. Interfund trades are included within the respective purchases and sales amounts shown in the Purchases and Sales of Investments note.
7. Committed Line of Credit.
The Fund participates with other funds managed by the investment adviser or an affiliate in a $4.25 billion credit facility (the "line of credit") to be utilized for temporary or emergency purposes to fund shareholder redemptions or for other short-term liquidity purposes. The Fund has agreed to pay commitment fees on its pro-rata portion of the line of credit, which amounted to $1,136 and is reflected in Miscellaneous expenses on the Statement of Operations. During the period, the Fund did not borrow on this line of credit.
8. Security Lending.
The Fund lends portfolio securities through a lending agent from time to time in order to earn additional income. For equity securities, a lending agent is used and may loan securities to certain qualified borrowers, including Fidelity Capital Markets (FCM), a broker-dealer affiliated with the Fund. On the settlement date of the loan, the Fund receives collateral (in the form of U.S. Treasury obligations, letters of credit and/or cash) against the loaned securities and maintains collateral in an amount not less than 100% of the market value of the loaned securities during the period of the loan. The market value of the loaned securities is determined at the close of business of the Fund and any additional required collateral is delivered to the Fund on the next business day. The Fund or borrower may terminate the loan at any time, and if the borrower defaults on its obligation to return the securities loaned because of insolvency or other reasons, the Fund may apply collateral received from the borrower against the obligation. The Fund may experience delays and costs in recovering the securities loaned. Any cash collateral received is invested in the Fidelity Securities Lending Cash Central Fund. The value of loaned securities and cash collateral at period end are disclosed on the Fund's Statement of Assets and Liabilities. At period end, there were no security loans outstanding with FCM. Security lending income represents the income earned on investing cash collateral, less rebates paid to borrowers and any lending agent fees associated with the loan, plus any premium payments received for lending certain types of securities. Security lending income is presented in the Statement of Operations as a component of income from Fidelity Central Funds. Total security lending income during the period amounted to $387,727, including $2 from securities loaned to FCM.
9. Expense Reductions.
Commissions paid to certain brokers with whom the investment adviser, or its affiliates, places trades on behalf of the Fund include an amount in addition to trade execution, which may be rebated back to the Fund to offset certain expenses. This amount totaled $6,995 for the period. In addition, through arrangements with the Fund's custodian, credits realized as a result of certain uninvested cash balances were used to reduce the Fund's expenses. During the period, these credits reduced the Fund's expenses by $334.
In addition, during the period the investment adviser reimbursed and/or waived a portion of operating expenses in the amount of $3,980.
10. Other.
The Fund's organizational documents provide former and current trustees and officers with a limited indemnification against liabilities arising in connection with the performance of their duties to the Fund. In the normal course of business, the Fund may also enter into contracts that provide general indemnifications. The Fund's maximum exposure under these arrangements is unknown as this would be dependent on future claims that may be made against the Fund. The risk of material loss from such claims is considered remote.
Report of Independent Registered Public Accounting Firm
To the Board of Trustees of Fidelity Securities Fund and Shareholders of Fidelity Blue Chip Value Fund:
Opinion on the Financial Statements
We have audited the accompanying statement of assets and liabilities, including the schedule of investments, of Fidelity Blue Chip Value Fund (one of the funds constituting Fidelity Securities Fund, referred to hereafter as the "Fund") as of July 31, 2018, the related statement of operations for the year ended July 31, 2018, the statement of changes in net assets for each of the two years in the period ended July 31, 2018, including the related notes, and the financial highlights for each of the five years in the period ended July 31, 2018 (collectively referred to as the “financial statements”). In our opinion, the financial statements present fairly, in all material respects, the financial position of the Fund as of July 31, 2018, the results of its operations for the year then ended, the changes in its net assets for each of the two years in the period ended July 31, 2018 and the financial highlights for each of the five years in the period ended July 31, 2018 in conformity with accounting principles generally accepted in the United States of America.
Basis for Opinion
These financial statements are the responsibility of the Fund’s management. Our responsibility is to express an opinion on the Fund’s financial statements based on our audits. We are a public accounting firm registered with the Public Company Accounting Oversight Board (United States) (“PCAOB”) and are required to be independent with respect to the Fund in accordance with the U.S. federal securities laws and the applicable rules and regulations of the Securities and Exchange Commission and the PCAOB.
We conducted our audits of these financial statements in accordance with the standards of the PCAOB. Those standards require that we plan and perform the audit to obtain reasonable assurance about whether the financial statements are free of material misstatement, whether due to error or fraud.
Our audits included performing procedures to assess the risks of material misstatement of the financial statements, whether due to error or fraud, and performing procedures that respond to those risks. Such procedures included examining, on a test basis, evidence regarding the amounts and disclosures in the financial statements. Our audits also included evaluating the accounting principles used and significant estimates made by management, as well as evaluating the overall presentation of the financial statements. Our procedures included confirmation of securities owned as of July 31, 2018 by correspondence with the custodian and brokers; when replies were not received from brokers, we performed other auditing procedures. We believe that our audits provide a reasonable basis for our opinion.
PricewaterhouseCoopers LLP
Boston, Massachusetts
September 12, 2018
We have served as the auditor of one or more investment companies in the Fidelity group of funds since 1932.
Trustees and Officers
The Trustees, Members of the Advisory Board (if any), and officers of the trust and fund, as applicable, are listed below. The Board of Trustees governs the fund and is responsible for protecting the interests of shareholders. The Trustees are experienced executives who meet periodically throughout the year to oversee the fund's activities, review contractual arrangements with companies that provide services to the fund, oversee management of the risks associated with such activities and contractual arrangements, and review the fund's performance. Except for Jonathan Chiel, each of the Trustees oversees 286 funds. Mr. Chiel oversees 150 funds.
The Trustees hold office without limit in time except that (a) any Trustee may resign; (b) any Trustee may be removed by written instrument, signed by at least two-thirds of the number of Trustees prior to such removal; (c) any Trustee who requests to be retired or who has become incapacitated by illness or injury may be retired by written instrument signed by a majority of the other Trustees; and (d) any Trustee may be removed at any special meeting of shareholders by a two-thirds vote of the outstanding voting securities of the trust. Each Trustee who is not an interested person (as defined in the 1940 Act) of the trust and the fund is referred to herein as an Independent Trustee. Each Independent Trustee shall retire not later than the last day of the calendar year in which his or her 75th birthday occurs. The Independent Trustees may waive this mandatory retirement age policy with respect to individual Trustees. Officers and Advisory Board Members hold office without limit in time, except that any officer or Advisory Board Member may resign or may be removed by a vote of a majority of the Trustees at any regular meeting or any special meeting of the Trustees. Except as indicated, each individual has held the office shown or other offices in the same company for the past five years.
The fund’s Statement of Additional Information (SAI) includes more information about the Trustees. To request a free copy, call Fidelity at 1-800-544-8544.
Experience, Skills, Attributes, and Qualifications of the Trustees. The Governance and Nominating Committee has adopted a statement of policy that describes the experience, qualifications, attributes, and skills that are necessary and desirable for potential Independent Trustee candidates (Statement of Policy). The Board believes that each Trustee satisfied at the time he or she was initially elected or appointed a Trustee, and continues to satisfy, the standards contemplated by the Statement of Policy. The Governance and Nominating Committee also engages professional search firms to help identify potential Independent Trustee candidates who have the experience, qualifications, attributes, and skills consistent with the Statement of Policy. From time to time, additional criteria based on the composition and skills of the current Independent Trustees, as well as experience or skills that may be appropriate in light of future changes to board composition, business conditions, and regulatory or other developments, have also been considered by the professional search firms and the Governance and Nominating Committee. In addition, the Board takes into account the Trustees' commitment and participation in Board and committee meetings, as well as their leadership of standing and ad hoc committees throughout their tenure.
In determining that a particular Trustee was and continues to be qualified to serve as a Trustee, the Board has considered a variety of criteria, none of which, in isolation, was controlling. The Board believes that, collectively, the Trustees have balanced and diverse experience, qualifications, attributes, and skills, which allow the Board to operate effectively in governing the fund and protecting the interests of shareholders. Information about the specific experience, skills, attributes, and qualifications of each Trustee, which in each case led to the Board's conclusion that the Trustee should serve (or continue to serve) as a trustee of the fund, is provided below.
Board Structure and Oversight Function. James C. Curvey is an interested person and currently serves as Chairman. The Trustees have determined that an interested Chairman is appropriate and benefits shareholders because an interested Chairman has a personal and professional stake in the quality and continuity of services provided to the fund. Independent Trustees exercise their informed business judgment to appoint an individual of their choosing to serve as Chairman, regardless of whether the Trustee happens to be independent or a member of management. The Independent Trustees have determined that they can act independently and effectively without having an Independent Trustee serve as Chairman and that a key structural component for assuring that they are in a position to do so is for the Independent Trustees to constitute a substantial majority for the Board. The Independent Trustees also regularly meet in executive session. Ned C. Lautenbach serves as Chairman of the Independent Trustees and as such (i) acts as a liaison between the Independent Trustees and management with respect to matters important to the Independent Trustees and (ii) with management prepares agendas for Board meetings.
Fidelity® funds are overseen by different Boards of Trustees. The fund's Board oversees Fidelity's high income and certain equity funds, and other Boards oversee Fidelity's investment-grade bond, money market, asset allocation, and other equity funds. The asset allocation funds may invest in Fidelity® funds overseen by the fund's Board. The use of separate Boards, each with its own committee structure, allows the Trustees of each group of Fidelity® funds to focus on the unique issues of the funds they oversee, including common research, investment, and operational issues. On occasion, the separate Boards establish joint committees to address issues of overlapping consequences for the Fidelity® funds overseen by each Board.
The Trustees operate using a system of committees to facilitate the timely and efficient consideration of all matters of importance to the Trustees, the fund, and fund shareholders and to facilitate compliance with legal and regulatory requirements and oversight of the fund's activities and associated risks. The Board, acting through its committees, has charged FMR and its affiliates with (i) identifying events or circumstances the occurrence of which could have demonstrably adverse effects on the fund's business and/or reputation; (ii) implementing processes and controls to lessen the possibility that such events or circumstances occur or to mitigate the effects of such events or circumstances if they do occur; and (iii) creating and maintaining a system designed to evaluate continuously business and market conditions in order to facilitate the identification and implementation processes described in (i) and (ii) above. Because the day-to-day operations and activities of the fund are carried out by or through FMR, its affiliates, and other service providers, the fund's exposure to risks is mitigated but not eliminated by the processes overseen by the Trustees. While each of the Board's committees has responsibility for overseeing different aspects of the fund's activities, oversight is exercised primarily through the Operations, Audit, and Compliance Committees. In addition, the Independent Trustees have worked with Fidelity to enhance the Board's oversight of investment and financial risks, legal and regulatory risks, technology risks, and operational risks, including the development of additional risk reporting to the Board. Appropriate personnel, including but not limited to the fund's Chief Compliance Officer (CCO), FMR's internal auditor, the independent accountants, the fund's Treasurer and portfolio management personnel, make periodic reports to the Board's committees, as appropriate, including an annual review of Fidelity's risk management program for the Fidelity® funds. The responsibilities of each standing committee, including their oversight responsibilities, are described further under "Standing Committees of the Trustees."
Interested Trustees*:
Correspondence intended for a Trustee who is an interested person may be sent to Fidelity Investments, 245 Summer Street, Boston, Massachusetts 02210.
Name, Year of Birth; Principal Occupations and Other Relevant Experience+
Jonathan Chiel (1957)
Year of Election or Appointment: 2016
Trustee
Mr. Chiel also serves as Trustee of other Fidelity® funds. Mr. Chiel is Executive Vice President and General Counsel for FMR LLC (diversified financial services company, 2012-present). Previously, Mr. Chiel served as general counsel (2004-2012) and senior vice president and deputy general counsel (2000-2004) for John Hancock Financial Services; a partner with Choate, Hall & Stewart (1996-2000) (law firm); and an Assistant United States Attorney for the United States Attorney’s Office of the District of Massachusetts (1986-95), including Chief of the Criminal Division (1993-1995). Mr. Chiel is a director on the boards of the Boston Bar Foundation and the Maimonides School.
James C. Curvey (1935)
Year of Election or Appointment: 2007
Trustee
Chairman of the Board of Trustees
Mr. Curvey also serves as Trustee of other Fidelity® funds. Mr. Curvey is Vice Chairman (2007-present) and Director of FMR LLC (diversified financial services company). In addition, Mr. Curvey is an Overseer Emeritus for the Boston Symphony Orchestra, a Director of Artis-Naples, and a Trustee of Brewster Academy in Wolfeboro, New Hampshire. Previously, Mr. Curvey served as a Director of Fidelity Research & Analysis Co. (investment adviser firm, 2009-2018), Director of Fidelity Investments Money Management, Inc. (investment adviser firm, 2009-2014) and a Director of FMR and FMR Co., Inc. (investment adviser firms, 2007-2014).
Charles S. Morrison (1960)
Year of Election or Appointment: 2014
Trustee
Mr. Morrison also serves as Trustee of other funds. He serves as President of Fidelity SelectCo, LLC (investment adviser firm, 2017-present) and Fidelity Management & Research Company (FMR) (investment adviser firm, 2016-present), a Director of Fidelity Investments Money Management, Inc. (FIMM) (investment adviser firm, 2014-present), Director of Fidelity SelectCo, LLC (investment adviser firm, 2014-present), President, Asset Management (2014-present), and is an employee of Fidelity Investments. Previously, Mr. Morrison served as Vice President of Fidelity's Fixed Income and Asset Allocation Funds (2012-2014), President, Fixed Income (2011-2014), Vice President of Fidelity's Money Market Funds (2005-2009), President, Money Market Group Leader of FMR (investment adviser firm, 2009), and Senior Vice President, Money Market Group of FMR (2004-2009). Mr. Morrison also served as Vice President of Fidelity's Bond Funds (2002-2005), certain Balanced Funds (2002-2005), and certain Asset Allocation Funds (2002-2007), and as Senior Vice President (2002-2005) of Fidelity's Bond Division.
* Determined to be an “Interested Trustee” by virtue of, among other things, his or her affiliation with the trust or various entities under common control with FMR.
+ The information includes the Trustee's principal occupation during the last five years and other information relating to the experience, attributes, and skills relevant to the Trustee's qualifications to serve as a Trustee, which led to the conclusion that the Trustee should serve as a Trustee for the fund.
Independent Trustees:
Correspondence intended for an Independent Trustee may be sent to Fidelity Investments, P.O. Box 55235, Boston, Massachusetts 02205-5235.
Name, Year of Birth; Principal Occupations and Other Relevant Experience+
Dennis J. Dirks (1948)
Year of Election or Appointment: 2005
Trustee
Mr. Dirks also serves as Trustee of other Fidelity® funds. Prior to his retirement in May 2003, Mr. Dirks was Chief Operating Officer and a member of the Board of The Depository Trust & Clearing Corporation (DTCC). He also served as President, Chief Operating Officer, and Board member of The Depository Trust Company (DTC) and President and Board member of the National Securities Clearing Corporation (NSCC). In addition, Mr. Dirks served as Chief Executive Officer and Board member of the Government Securities Clearing Corporation, Chief Executive Officer and Board member of the Mortgage-Backed Securities Clearing Corporation, as a Trustee and a member of the Finance Committee of Manhattan College (2005-2008), as a Trustee and a member of the Finance Committee of AHRC of Nassau County (2006-2008), as a member of the Independent Directors Council (IDC) Governing Council (2010-2015), and as a member of the Board of Directors for The Brookville Center for Children’s Services, Inc. (2009-2017). Mr. Dirks is a member of the Finance Committee (2016-present), Board of Directors (2017-present) and Board of Trustees (2018-present) and is Treasurer (2018-present) of the Asolo Repertory Theatre.
Donald F. Donahue (1950)
Year of Election or Appointment: 2018
Trustee
Mr. Donahue also serves as a Trustee of other Fidelity® funds. Mr. Donahue is President and Chief Executive Officer of Miranda Partners, LLC (risk consulting for the financial services industry, 2012-present). Previously, Mr. Donahue served as a Member of the Advisory Board of certain Fidelity® funds (2015-2018) and Chief Executive Officer (2006-2012), Chief Operating Officer (2003-2006), and Managing Director, Customer Marketing and Development (1999-2003) of The Depository Trust & Clearing Corporation (financial markets infrastructure). Mr. Donahue serves as a Member (2007-present) and Co-Chairman (2016-present) of the Board of Directors of United Way of New York, Member of the Board of Directors of NYC Leadership Academy (2012-present) and Member of the Board of Advisors of Ripple Labs, Inc. (financial services, 2015-present). He also served as Chairman (2010-2012) and Member of the Board of Directors (2012-2013) of Omgeo, LLC (financial services), Treasurer of United Way of New York (2012-2016), and Member of the Board of Directors of XBRL US (financial services non-profit, 2009-2012) and the International Securities Services Association (2009-2012).
Alan J. Lacy (1953)
Year of Election or Appointment: 2008
Trustee
Mr. Lacy also serves as Trustee of other Fidelity® funds. Mr. Lacy serves as a Director of Bristol-Myers Squibb Company (global pharmaceuticals, 2008-present). He is a Trustee of the California Chapter of The Nature Conservancy (2015-present) and a Director of the Center for Advanced Study in the Behavioral Sciences at Stanford University (2015-present). In addition, Mr. Lacy served as Senior Adviser (2007-2014) of Oak Hill Capital Partners, L.P. (private equity) and also served as Chief Executive Officer (2005) and Vice Chairman (2005-2006) of Sears Holdings Corporation (retail) and Chief Executive Officer and Chairman of the Board of Sears, Roebuck and Co. (retail, 2000-2005). Previously, Mr. Lacy served as Chairman (2014-2017) and a member (2010-2017) of the Board of Directors of Dave & Buster’s Entertainment, Inc. (restaurant and entertainment complexes), as Chairman (2008-2011) and a member (2006-2015) of the Board of Trustees of the National Parks Conservation Association, and as a member of the Board of Directors for The Hillman Companies, Inc. (hardware wholesalers, 2010-2014), Earth Fare, Inc. (retail grocery, 2010-2014), and The Western Union Company (global money transfer, 2006-2011).
Ned C. Lautenbach (1944)
Year of Election or Appointment: 2000
Trustee
Chairman of the Independent Trustees
Mr. Lautenbach also serves as Trustee of other Fidelity® funds. Mr. Lautenbach currently serves as Vice Chair of the Board of Governors, State University System of Florida (2013-present) and is a member of the Council on Foreign Relations (1994-present). He is also a member and has most recently served as Chairman of the Board of Directors of Artis-Naples (2012-present). Previously, Mr. Lautenbach served as a member and then Lead Director of the Board of Directors of Eaton Corporation (diversified industrial, 1997-2016). He was also a Partner and Advisory Partner at Clayton, Dubilier & Rice, LLC (private equity investment, 1998-2010), as well as a Director of Sony Corporation (2006-2007). In addition, Mr. Lautenbach also had a 30-year career with IBM (technology company) during which time he served as Senior Vice President and a member of the Corporate Executive Committee (1968-1998).
Joseph Mauriello (1944)
Year of Election or Appointment: 2008
Trustee
Mr. Mauriello also serves as Trustee of other Fidelity® funds. Prior to his retirement in January 2006, Mr. Mauriello served in numerous senior management positions including Deputy Chairman and Chief Operating Officer (2004-2005), and Vice Chairman of Financial Services (2002-2004) of KPMG LLP US (professional services, 1965-2005). Mr. Mauriello currently serves as a member of the Board of Directors of XL Group plc. (global insurance and re-insurance, 2006-present) and the Independent Directors Council (IDC) Governing Council (2015-present). Previously, Mr. Mauriello served as a Director of the Hamilton Funds of the Bank of New York (2006-2007) and of Arcadia Resources Inc. (health care services and products, 2007-2012).
Cornelia M. Small (1944)
Year of Election or Appointment: 2005
Trustee
Ms. Small also serves as Trustee of other Fidelity® funds. Ms. Small is a member of the Board of Directors (2009-present) and Chair of the Investment Committee (2010-present) of the Teagle Foundation. Ms. Small also serves on the Investment Committee of the Berkshire Taconic Community Foundation (2008-present). Previously, Ms. Small served as Chairperson (2002-2008) and a member of the Investment Committee and Chairperson (2008-2012) and a member of the Board of Trustees of Smith College. In addition, Ms. Small served as Chief Investment Officer, Director of Global Equity Investments, and a member of the Board of Directors of Scudder, Stevens & Clark and Scudder Kemper Investments.
Garnett A. Smith (1947)
Year of Election or Appointment: 2018
Trustee
Mr. Smith also serves as Trustee of other Fidelity® funds. Prior to Mr. Smith's retirement, he served as Chairman and Chief Executive Officer of Inbrand Corp. (manufacturer of personal absorbent products, 1990-1997). He also served as President (1986-1990) of Inbrand Corp. Prior to his employment with Inbrand Corp., he was employed by a retail fabric chain and North Carolina National Bank. In addition, Mr. Smith served as a Member of the Advisory Board of certain Fidelity® funds (2012-2013) and as a board member of the Jackson Hole Land Trust (2009-2012).
David M. Thomas (1949)
Year of Election or Appointment: 2008
Trustee
Mr. Thomas also serves as Trustee of other Fidelity® funds. Mr. Thomas serves as Non-Executive Chairman of the Board of Directors of Fortune Brands Home and Security (home and security products, 2011-present), as a member of the Board of Directors (2004-present) and Presiding Director (2013-present) of Interpublic Group of Companies, Inc. (marketing communication), and as a member of the Board of Trustees of the University of Florida (2013-present). Previously, Mr. Thomas served as Executive Chairman (2005-2006) and Chairman and Chief Executive Officer (2000-2005) of IMS Health, Inc. (pharmaceutical and healthcare information solutions), and a Director of Fortune Brands, Inc. (consumer products, 2000-2011).
+ The information includes the Trustee's principal occupation during the last five years and other information relating to the experience, attributes, and skills relevant to the Trustee's qualifications to serve as a Trustee, which led to the conclusion that the Trustee should serve as a Trustee for the fund.
Advisory Board Members and Officers:
Correspondence intended for a Member of the Advisory Board (if any) may be sent to Fidelity Investments, P.O. Box 55235, Boston, Massachusetts 02205-5235. Correspondence intended for an officer or Peter S. Lynch may be sent to Fidelity Investments, 245 Summer Street, Boston, Massachusetts 02210. Officers appear below in alphabetical order.
Name, Year of Birth; Principal Occupation
Peter S. Lynch (1944)
Year of Election or Appointment: 2003
Member of the Advisory Board
Mr. Lynch also serves as Member of the Advisory Board of other Fidelity® funds. Mr. Lynch is Vice Chairman and a Director of FMR (investment adviser firm) and FMR Co., Inc. (investment adviser firm). In addition, Mr. Lynch serves as a Trustee of Boston College and as the Chairman of the Inner-City Scholarship Fund. Previously, Mr. Lynch served on the Special Olympics International Board of Directors (1997-2006).
William S. Stavropoulos (1939)
Year of Election or Appointment: 2018
Member of the Advisory Board
Mr. Stavropoulos also serves as Member of the Advisory Board of other Fidelity® funds. Mr. Stavropoulos serves as President and Founder of the Michigan Baseball Foundation, the Great Lakes Loons (2007-present). Mr. Stavropoulos is Chairman Emeritus of the Board of Directors of The Dow Chemical Company, where he previously served in numerous senior management positions, including President, CEO (1995-2000; 2002-2004), Chairman of the Executive Committee (2000-2006), and as a member of the Board of Directors (1990-2006). Currently, Mr. Stavropoulos is Chairman of the Board of Directors of Univar Inc. (global distributor of commodity and specialty chemicals), a Director of Teradata Corporation (data warehousing and technology solutions), and a member of the Advisory Board for Metalmark Capital LLC (private equity investment, 2005-present). Mr. Stavropoulos is an operating advisor to Clayton, Dubilier & Rice, LLC (private equity investment). In addition, Mr. Stavropoulos is a member of the University of Notre Dame Advisory Council for the College of Science, a Trustee of the Rollin L. Gerstacker Foundation, and a Director of Artis-Naples in Naples, Florida. Previously, Mr. Stavropoulos served as Trustee of certain Fidelity® funds (2001-2018) and as a Director of Chemical Financial Corporation (bank holding company, 1993-2012) and Tyco International, Ltd. (multinational manufacturing and services, 2007-2012).
Carol B. Tomé (1957)
Year of Election or Appointment: 2018
Member of the Advisory Board
Ms. Tomé also serves as Member of the Advisory Board of other Fidelity® funds. Ms. Tomé is Chief Financial Officer (2001-present) and Executive Vice President of Corporate Services (2007-present) of The Home Depot, Inc. (home improvement retailer) and a Director (2003-present) and Chair of the Audit Committee (2004-present) of United Parcel Service, Inc. (package delivery and supply chain management). Previously, Ms. Tomé served as Trustee of certain Fidelity® funds (2017), Senior Vice President of Finance and Accounting/Treasurer (2000-2007) and Vice President and Treasurer (1995-2000) of The Home Depot, Inc. and Chair of the Board (2010-2012), Vice Chair of the Board (2009 and 2013), and a Director (2008-2013) of the Federal Reserve Bank of Atlanta. Ms. Tomé is also a director or trustee of many community and professional organizations.
Michael E. Wiley (1950)
Year of Election or Appointment: 2018
Member of the Advisory Board
Mr. Wiley also serves as Trustee or Member of the Advisory Board of other Fidelity® funds. Mr. Wiley serves as a Director of Andeavor Corporation (independent oil refiner and marketer, 2005-present), a Director of Andeavor Logistics LP (natural resources logistics, 2015-present), and a Director of Bill Barrett Corporation (exploration and production, 2005-present). In addition, Mr. Wiley also serves as a Director of Post Oak Bank (privately-held bank, 2004-present). Previously, Mr. Wiley served as a Trustee of other Fidelity® funds (2008-2013), as a Director of Asia Pacific Exploration Consolidated (international oil and gas exploration and production, 2008-2013), as a member of the Board of Trustees of the University of Tulsa (2000-2006; 2007-2010), as a Senior Energy Advisor of Katzenbach Partners, LLC (consulting, 2006-2007), as an Advisory Director of Riverstone Holdings (private investment), Chairman, President, and CEO of Baker Hughes, Inc. (oilfield services, 2000-2004), and as Director of Spinnaker Exploration Company (exploration and production, 2001-2005).
Elizabeth Paige Baumann (1968)
Year of Election or Appointment: 2017
Anti-Money Laundering (AML) Officer
Ms. Baumann also serves as AML Officer of other funds. She is Chief AML Officer (2012-present) and Senior Vice President (2014-present) of FMR LLC (diversified financial services company) and is an employee of Fidelity Investments. Previously, Ms. Baumann served as AML Officer of the funds (2012-2016), and Vice President (2007-2014) and Deputy Anti-Money Laundering Officer (2007-2012) of FMR LLC.
Marc R. Bryant (1966)
Year of Election or Appointment: 2015
Secretary and Chief Legal Officer (CLO)
Mr. Bryant also serves as Secretary and CLO of other funds. Mr. Bryant serves as CLO, Secretary, and Senior Vice President of Fidelity Management & Research Company (investment adviser firm, 2015-present) and FMR Co., Inc. (investment adviser firm, 2015-present); Secretary of Fidelity SelectCo, LLC (investment adviser firm, 2015-present) and Fidelity Investments Money Management, Inc. (investment adviser firm, 2015-present); and CLO of Fidelity Management & Research (Hong Kong) Limited and FMR Investment Management (UK) Limited (investment adviser firms, 2015-present) and Fidelity Management & Research (Japan) Limited (investment adviser firm, 2016-present). He is Senior Vice President and Deputy General Counsel of FMR LLC (diversified financial services company). Previously, Mr. Bryant served as Secretary and CLO of Fidelity Rutland Square Trust II (2010-2014) and Assistant Secretary of Fidelity's Fixed Income and Asset Allocation Funds (2013-2015). Prior to joining Fidelity Investments, Mr. Bryant served as a Senior Vice President and the Head of Global Retail Legal for AllianceBernstein L.P. (2006-2010), and as the General Counsel for ProFund Advisors LLC (2001-2006).
John J. Burke III (1964)
Year of Election or Appointment: 2018
Chief Financial Officer
Mr. Burke also serves as Chief Financial Officer of other funds. Mr. Burke serves as Head of Investment Operations for Fidelity Fund and Investment Operations (2018-present) and is an employee of Fidelity Investments (1998-present). Previously Mr. Burke served as head of Asset Management Investment Operations (2012-2018).
William C. Coffey (1969)
Year of Election or Appointment: 2009
Assistant Secretary
Mr. Coffey also serves as Assistant Secretary of other funds. He is Senior Vice President and Deputy General Counsel of FMR LLC (diversified financial services company, 2010-present), and is an employee of Fidelity Investments. Previously, Mr. Coffey served as Vice President and Associate General Counsel of FMR LLC (2005-2009).
Timothy M. Cohen (1969)
Year of Election or Appointment: 2018
Vice President
Mr. Cohen also serves as Vice President of other funds. Mr. Cohen serves as Co-Head of Global Equity Research (2016-present), a Director of Fidelity Management & Research (Japan) Limited (investment adviser firm, 2016-present), and is an employee of Fidelity Investments. Previously, Mr. Cohen served as Chief Investment Officer - Equity and a Director of Fidelity Management & Research (U.K.) Inc. (investment adviser firm, 2013-2015) and as a Director of Fidelity Management & Research (Hong Kong) Limited (investment adviser firm, 2017).
Jonathan Davis (1968)
Year of Election or Appointment: 2010
Assistant Treasurer
Mr. Davis also serves as Assistant Treasurer of other funds. Mr. Davis serves as Assistant Treasurer of FMR Capital, Inc. (2017-present) and is an employee of Fidelity Investments. Previously, Mr. Davis served as Vice President and Associate General Counsel of FMR LLC (diversified financial services company, 2003-2010).
Adrien E. Deberghes (1967)
Year of Election or Appointment: 2016
Assistant Treasurer
Mr. Deberghes also serves as an officer of other funds. He serves as Assistant Treasurer of FMR Capital, Inc. (2017-present), Executive Vice President of Fidelity Investments Money Management, Inc. (FIMM) (investment adviser firm, 2016-present), and is an employee of Fidelity Investments (2008-present). Previously, Mr. Deberghes served as President and Treasurer of certain Fidelity® funds (2013-2018). Prior to joining Fidelity Investments, Mr. Deberghes was Senior Vice President of Mutual Fund Administration at State Street Corporation (2007-2008), Senior Director of Mutual Fund Administration at Investors Bank & Trust (2005-2007), and Director of Finance for Dunkin' Brands (2000-2005). Previously, Mr. Deberghes served in other fund officer roles.
Laura M. Del Prato (1964)
Year of Election or Appointment: 2018
Assistant Treasurer
Ms. Del Prato also serves as an officer of other funds. Ms. Del Prato is an employee of Fidelity Investments (2017-present). Prior to joining Fidelity Investments, Ms. Del Prato served as a Managing Director and Treasurer of the JPMorgan Mutual Funds (2014-2017). Prior to JPMorgan, Ms. Del Prato served as a partner at Cohen Fund Audit Services (accounting firm, 2012-2013) and KPMG LLP (accounting firm, 2004-2012).
Colm A. Hogan (1973)
Year of Election or Appointment: 2016
Deputy Treasurer
Mr. Hogan also serves as an officer of other funds. Mr. Hogan serves as Assistant Treasurer of FMR Capital, Inc. (2017-present) and is an employee of Fidelity Investments (2005-present). Previously, Mr. Hogan served as Assistant Treasurer of certain Fidelity® funds (2016-2018).
Pamela R. Holding (1964)
Year of Election or Appointment: 2018
Vice President
Ms. Holding also serves as a Vice President of other funds. Ms. Holding serves as Co-Head of Global Equity Research (2018-present) and is an employee of Fidelity Investments (2013-present).
Chris Maher (1972)
Year of Election or Appointment: 2013
Assistant Treasurer
Mr. Maher serves as Assistant Treasurer of other funds. Mr. Maher is Vice President of Valuation Oversight, serves as Assistant Treasurer of FMR Capital, Inc. (2017-present), and is an employee of Fidelity Investments. Previously, Mr. Maher served as Vice President of Asset Management Compliance (2013), Vice President of the Program Management Group of FMR (investment adviser firm, 2010-2013), and Vice President of Valuation Oversight (2008-2010).
Rieco E. Mello (1969)
Year of Election or Appointment: 2017
Assistant Treasurer
Mr. Mello also serves as Assistant Treasurer of other funds. Mr. Mello serves as Assistant Treasurer of FMR Capital, Inc. (2017-present) and is an employee of Fidelity Investments (1995-present).
Kenneth B. Robins (1969)
Year of Election or Appointment: 2016
Chief Compliance Officer
Mr. Robins also serves as an officer of other funds. Mr. Robins serves as Compliance Officer of Fidelity Management & Research Company and FMR Co., Inc. (investment adviser firms, 2016-present) and is an employee of Fidelity Investments (2004-present). Previously, Mr. Robins served as Executive Vice President of Fidelity Investments Money Management, Inc. (investment adviser firm, 2013-2016) and served in other fund officer roles.
Stacie M. Smith (1974)
Year of Election or Appointment: 2016
President and Treasurer
Ms. Smith also serves as an officer of other funds. Ms. Smith serves as Assistant Treasurer of FMR Capital, Inc. (2017-present), is an employee of Fidelity Investments (2009-present), and has served in other fund officer roles. Prior to joining Fidelity Investments, Ms. Smith served as Senior Audit Manager of Ernst & Young LLP (accounting firm, 1996-2009). Previously, Ms. Smith served as Assistant Treasurer (2013-2018) and Deputy Treasurer (2013-2016) of certain Fidelity® funds.
Marc L. Spector (1972)
Year of Election or Appointment: 2016
Assistant Treasurer
Mr. Spector also serves as an officer of other funds. Mr. Spector serves as Assistant Treasurer of FMR Capital, Inc. (2017-present) and is an employee of Fidelity Investments (2016-present). Prior to joining Fidelity Investments, Mr. Spector served as Director at the Siegfried Group (accounting firm, 2013-2016), and prior to Siegfried Group as audit senior manager at Deloitte & Touche (accounting firm, 2005-2013).
Renee Stagnone (1975)
Year of Election or Appointment: 2016
Assistant Treasurer
Ms. Stagnone also serves as an officer of other funds. Ms. Stagnone serves as Assistant Treasurer of FMR Capital, Inc. (2017-present) and is an employee of Fidelity Investments (1997-present). Previously, Ms. Stagnone served as Deputy Treasurer of certain Fidelity® funds (2013-2016).
Shareholder Expense Example
As a shareholder of the Fund, you incur two types of costs: (1) transaction costs, and (2) ongoing costs, including management fees and other Fund expenses. This Example is intended to help you understand your ongoing costs (in dollars) of investing in the Fund and to compare these costs with the ongoing costs of investing in other mutual funds.
The Example is based on an investment of $1,000 invested at the beginning of the period and held for the entire period (February 1, 2018 to July 31, 2018).
Actual Expenses
The first line of the accompanying table provides information about actual account values and actual expenses. You may use the information in this line, together with the amount you invested, to estimate the expenses that you paid over the period. Simply divide your account value by $1,000.00 (for example, an $8,600 account value divided by $1,000.00 = 8.6), then multiply the result by the number in the first line under the heading entitled "Expenses Paid During Period" to estimate the expenses you paid on your account during this period. A small balance maintenance fee of $12.00 that is charged once a year may apply for certain accounts with a value of less than $2,000. This fee is not included in the table below. If it was, the estimate of expenses you paid during the period would be higher, and your ending account value lower, by this amount. In addition, the Fund, as a shareholder in the underlying Fidelity Central Funds, will indirectly bear its pro-rata share of the fees and expenses incurred by the underlying Fidelity Central Funds. These fees and expenses are not included in the Fund's annualized expense ratio used to calculate the expense estimate in the table below.
Hypothetical Example for Comparison Purposes
The second line of the accompanying table provides information about hypothetical account values and hypothetical expenses based on the Fund's actual expense ratio and an assumed rate of return of 5% per year before expenses, which is not the Fund's actual return. The hypothetical account values and expenses may not be used to estimate the actual ending account balance or expenses you paid for the period. You may use this information to compare the ongoing costs of investing in the Fund and other funds. To do so, compare this 5% hypothetical example with the 5% hypothetical examples that appear in the shareholder reports of the other funds. A small balance maintenance fee of $12.00 that is charged once a year may apply for certain accounts with a value of less than $2,000. This fee is not included in the table below. If it was, the estimate of expenses you paid during the period would be higher, and your ending account value lower, by this amount. In addition, the Fund, as a shareholder in the underlying Fidelity Central Funds, will indirectly bear its pro-rata share of the fees and expenses incurred by the underlying Fidelity Central Funds. These fees and expenses are not included in the Fund's annualized expense ratio used to calculate the expense estimate in the table below.
Please note that the expenses shown in the table are meant to highlight your ongoing costs only and do not reflect any transaction costs. Therefore, the second line of the table is useful in comparing ongoing costs only, and will not help you determine the relative total costs of owning different funds.
| | Annualized Expense Ratio-A | Beginning
Account Value
February 1, 2018 | Ending
Account Value
July 31, 2018 | Expenses Paid
During Period-B
February 1, 2018
to July 31, 2018 |
| Actual | .64% | $1,000.00 | $969.80 | $3.13 |
| Hypothetical-C | | $1,000.00 | $1,021.62 | $3.21 |
A Annualized expense ratio reflects expenses net of applicable fee waivers.
B Expenses are equal to the Fund's annualized expense ratio, multiplied by the average account value over the period, multiplied by 181/365 (to reflect the one-half year period).
C 5% return per year before expenses
Distributions (Unaudited)
The Board of Trustees of Fidelity Blue Chip Value Fund voted to pay on September 10, 2018, to shareholders of record at the opening of business on September 7, 2018, a distribution of $0.087 per share derived from capital gains realized from sales of portfolio securities and a dividend of $0.113 per share from net investment income.
The fund hereby designates as a capital gain dividend with respect to the taxable year ended July 31, 2018, $2,045,990, or, if subsequently determined to be different, the net capital gain of such year.
The fund designates 100% and 91% of the dividends distributed in September and December, respectively during the fiscal year as qualifying for the dividends–received deduction for corporate shareholders.
The fund designates 100% of the dividends distributed in September and December, during the fiscal year as amounts which may be taken into account as a dividend for the purposes of the maximum rate under section 1(h)(11) of the Internal Revenue Code.
The fund will notify shareholders in January 2019 of amounts for use in preparing 2018 income tax returns.
Board Approval of Investment Advisory Contracts
Fidelity Blue Chip Value Fund
At its July 2018 meeting, the Board of Trustees, including the Independent Trustees (together, the Board), voted to continue the management contract with Fidelity Management & Research Company (FMR) and the sub-advisory agreements (together, the Advisory Contracts) for the fund for six months through January 31, 2019, in connection with the reunification of the Fidelity Equity High Income Funds Board, which oversees the fund, and the Sector Portfolios Board.
The Board considered that the approval of the fund's Advisory Contracts will not result in any changes in (i) the investment process or strategies employed in the management of the fund's assets; (ii) the fees and expenses paid by shareholders; (iii) the nature, extent or quality of services provided under the fund's Advisory Contracts; or (iv) the day-to-day management of the fund or the persons primarily responsible for such management. The Board concluded that the fund's Advisory Contracts are fair and reasonable, and that the fund's Advisory Contracts should be renewed, without modification, through January 31, 2019, with the understanding that the Board will consider the annual renewal for a full one year period in January 2019.
In connection with its consideration of future renewals of the fund's Advisory Contracts, the Board will consider: (i) the nature, extent and quality of services provided to the fund, including shareholder and administrative services and investment performance; (ii) the competitiveness of the management fee and total expenses for the fund; (iii) the costs of the services and profitability, including the revenues earned and the expenses incurred in conducting the business of developing, marketing, distributing, managing, administering, and servicing the fund and its shareholders, to the extent applicable, as well as potential fall-out benefits from Fidelity's non-fund businesses; and (iv) whether there have been economies of scale in respect of the Fidelity funds, whether the Fidelity funds (including the fund) have appropriately benefited from any such economies of scale, and whether there is the potential for realization of any further economies.
Based on its evaluation of all of the conclusions noted above, and after considering all factors it believed relevant, the Board ultimately concluded that the fund's management fee structure is fair and reasonable, and that the continuation of the fund's Advisory Contracts should be approved.
Corporate Headquarters
245 Summer St.
Boston, MA 02210
www.fidelity.com
BCV-ANN-0918
1.788861.115
Fidelity Advisor® Small Cap Growth Fund - Class A, Class M, Class C, Class I and Class Z
Annual Report July 31, 2018 Class A, Class M, Class C, Class I and Class Z are classes of Fidelity® Small Cap Growth Fund |
|
Contents
To view a fund's proxy voting guidelines and proxy voting record for the 12-month period ended June 30, visit http://www.fidelity.com/proxyvotingresults or visit the Securities and Exchange Commission's (SEC) web site at http://www.sec.gov.
You may also call 1-877-208-0098 to request a free copy of the proxy voting guidelines.
Standard & Poor's, S&P and S&P 500 are registered service marks of The McGraw-Hill Companies, Inc. and have been licensed for use by Fidelity Distributors Corporation.
Other third-party marks appearing herein are the property of their respective owners.
All other marks appearing herein are registered or unregistered trademarks or service marks of FMR LLC or an affiliated company. © 2018 FMR LLC. All rights reserved.
This report and the financial statements contained herein are submitted for the general information of the shareholders of the Fund. This report is not authorized for distribution to prospective investors in the Fund unless preceded or accompanied by an effective prospectus.
A fund files its complete schedule of portfolio holdings with the SEC for the first and third quarters of each fiscal year on Form N-Q. Forms N-Q are available on the SEC’s web site at http://www.sec.gov. A fund's Forms N-Q may be reviewed and copied at the SEC’s Public Reference Room in Washington, DC. Information regarding the operation of the SEC's Public Reference Room may be obtained by calling 1-800-SEC-0330.
For a complete list of a fund's portfolio holdings, view the most recent holdings listing, semiannual report, or annual report on Fidelity's web site at http://www.fidelity.com, http://www.institutional.fidelity.com, or http://www.401k.com, as applicable.
NOT FDIC INSURED •MAY LOSE VALUE •NO BANK GUARANTEE
Neither the Fund nor Fidelity Distributors Corporation is a bank.
Performance: The Bottom Line
Average annual total return reflects the change in the value of an investment, assuming reinvestment of distributions from dividend income and capital gains (the profits earned upon the sale of securities that have grown in value, if any) and assuming a constant rate of performance each year. The hypothetical investment and the average annual total returns do not reflect the deduction of taxes that a shareholder would pay on fund distributions or the redemption of fund shares. During periods of reimbursement by Fidelity, a fund’s total return will be greater than it would be had the reimbursement not occurred. How a fund did yesterday is no guarantee of how it will do tomorrow.
Average Annual Total Returns
| For the periods ended July 31, 2018 | Past 1 year | Past 5 years | Past 10 years |
| Class A (incl. 5.75% sales charge) | 21.08% | 13.96% | 12.07% |
| Class M (incl. 3.50% sales charge) | 23.66% | 14.18% | 12.04% |
| Class C (incl. contingent deferred sales charge) | 26.51% | 14.41% | 11.88% |
| Class I | 28.78% | 15.64% | 13.07% |
| Class Z | 29.02% | 15.69% | 13.10% |
Class C shares' contingent deferred sales charges included in the past one year, past five years and past ten years total return figures are 1%, 0% and 0%, respectively.
The initial offering of Class Z shares took place on February 1, 2017. Returns prior to February 1, 2017, are those of Class I.
$10,000 Over 10 Years
Let's say hypothetically that $10,000 was invested in Fidelity Advisor® Small Cap Growth Fund - Class A on July 31, 2008, and the current 5.75% sales charge was paid.
The chart shows how the value of your investment would have changed, and also shows how the Russell 2000® Growth Index performed over the same period.
| Period Ending Values |
| $31,263 | Fidelity Advisor® Small Cap Growth Fund - Class A |
| $28,845 | Russell 2000® Growth Index |
Management's Discussion of Fund Performance
Market Recap: The U.S. equity bellwether S&P 500
® index gained 16.24% for the 12 months ending July 31, 2018, despite a resurgence in volatility that challenged the multiyear bull market. Stocks maintained their steady growth until a sharp reversal in February, as volatility spiked amid fear that rising inflation and the potential for the economy to overheat would prompt the U.S. Federal Reserve to pick up the pace of interest rate hikes. The index posted its first negative monthly result since October 2016, and then lost further ground in March on fear of a global trade war. The market stabilized in April and turned upward through mid-June, when escalating trade tension between the U.S. and China soured investor sentiment. The resulting uncertainty lingered into July, but strong corporate earnings helped the S&P 500 rise 3.72% that month to cap the period. For the full one-year period, growth handily topped value, while small-caps bested large-caps. By sector, information technology (+28%) led the way, boosted by strong earnings growth from several major index constituents. Consumer discretionary rose roughly 24%, driven by retailers (+49%). Energy (+20%) gained alongside higher oil prices. Laggards were telecommunication services (-2%), consumer staples (0%) and utilities (+3%), defensive groups that struggled amid rising interest rates and a general preference for risk. Real estate (+5%) fared a bit better but still lagged, as did financials, industrials, health care (each up 13%) and materials (+11%).
Comments from Portfolio Manager Patrick Venanzi: For the year, the fund's share classes (excluding sales charges, if applicable) advanced about 29%, comfortably outpacing the 22.91% gain of the benchmark Russell 2000
® Growth Index. Stock picking in information technology’s software & services segment was by far the biggest driver of the fund’s outperformance versus the benchmark. The top individual contributors were Stamps.com and 2U. Shares of internet-based shipping-services provider Stamps gained 76% on the back of consecutive quarters of stellar financial results. Meanwhile, shares of 2U – our largest holding, on average – returned about 69%, as the firm continued to grow its portfolio of online graduate programs and strengthened its competitive position. Picks in consumer discretionary and industrials also helped. Conversely, choices in the health care equipment & services industry hurt, including Medicaid-related managed-care firm Magellan Health, the fund’s largest detractor. Shares of Magellan plunged in late April on disappointing financial results. The company also lowered its full-year earnings guidance. A position in health care payment management firm Cotiviti also fared poorly due to slowing growth, and the position was sold from the fund during the period.
The views expressed above reflect those of the portfolio manager(s) only through the end of the period as stated on the cover of this report and do not necessarily represent the views of Fidelity or any other person in the Fidelity organization. Any such views are subject to change at any time based upon market or other conditions and Fidelity disclaims any responsibility to update such views. These views may not be relied on as investment advice and, because investment decisions for a Fidelity fund are based on numerous factors, may not be relied on as an indication of trading intent on behalf of any Fidelity fund.
Notes to Shareholders: Following a three-month leave of absence, Pat Venanzi returned to Fidelity on August 30, 2018, and resumed his day-to-day responsibilities as Portfolio Manager. In his stead, Jennifer Fo Cardillo and Slava Kruzement-Prykhodko served as interim managers of the fund. Jennifer and Slava came off the fund on August 31, 2018, leaving Patrick as sole manager. The fund closed to new accounts on February 2, 2018.
Investment Summary (Unaudited)
Top Ten Stocks as of July 31, 2018
| | % of fund's net assets |
| CarGurus, Inc. Class A | 2.5 |
| Stamps.com, Inc. | 1.8 |
| 2U, Inc. | 1.6 |
| Weight Watchers International, Inc. | 1.5 |
| Asgn, Inc. | 1.4 |
| Generac Holdings, Inc. | 1.4 |
| Insulet Corp. | 1.3 |
| Vail Resorts, Inc. | 1.2 |
| Cavco Industries, Inc. | 1.2 |
| Copart, Inc. | 1.1 |
| | 15.0 |
Top Five Market Sectors as of July 31, 2018
| | % of fund's net assets�� |
| Health Care | 23.5 |
| Information Technology | 22.5 |
| Industrials | 18.6 |
| Consumer Discretionary | 15.6 |
| Financials | 5.9 |
Asset Allocation (% of fund's net assets)
| As of July 31, 2018* |
| | Stocks/ETFs | 97.4% |
| | Convertible Securities | 0.5% |
| | Short-Term Investments and Net Other Assets (Liabilities) | 2.1% |

* Foreign investments – 7.7%
Schedule of Investments July 31, 2018
Showing Percentage of Net Assets
| Common Stocks - 95.3% | | | |
| | | Shares | Value |
| CONSUMER DISCRETIONARY - 15.6% | | | |
| Auto Components - 0.7% | | | |
| Gentex Corp. | | 1,412,000 | $32,758,400 |
| Diversified Consumer Services - 3.1% | | | |
| Bright Horizons Family Solutions, Inc. (a) | | 300,838 | 32,186,658 |
| Grand Canyon Education, Inc. (a) | | 344,876 | 40,188,400 |
| Weight Watchers International, Inc. (a) | | 779,481 | 69,786,934 |
| | | | 142,161,992 |
| Hotels, Restaurants & Leisure - 5.2% | | | |
| Boyd Gaming Corp. | | 597,471 | 22,315,542 |
| Cedar Fair LP (depositary unit) | | 498,204 | 28,467,377 |
| Hilton Grand Vacations, Inc. (a) | | 752,176 | 26,017,768 |
| Marriott Vacations Worldwide Corp. | | 130,230 | 15,511,695 |
| Planet Fitness, Inc. (a) | | 971,500 | 46,165,680 |
| Texas Roadhouse, Inc. Class A | | 368,464 | 23,154,278 |
| U.S. Foods Holding Corp. (a) | | 692,843 | 23,425,022 |
| Vail Resorts, Inc. | | 202,204 | 55,984,221 |
| | | | 241,041,583 |
| Household Durables - 3.1% | | | |
| Cavco Industries, Inc. (a) | | 253,948 | 53,951,253 |
| LGI Homes, Inc. (a)(b) | | 408,903 | 21,136,196 |
| SodaStream International Ltd. (a) | | 344,139 | 30,043,335 |
| Taylor Morrison Home Corp. (a) | | 920,442 | 17,976,232 |
| TopBuild Corp. (a) | | 281,501 | 20,909,894 |
| | | | 144,016,910 |
| Internet & Direct Marketing Retail - 0.4% | | | |
| Gaia, Inc. Class A (a) | | 1,067,310 | 19,425,042 |
| Multiline Retail - 0.5% | | | |
| Ollie's Bargain Outlet Holdings, Inc. (a) | | 306,843 | 21,325,589 |
| Specialty Retail - 1.7% | | | |
| Five Below, Inc. (a) | | 478,200 | 46,461,912 |
| The Children's Place Retail Stores, Inc. | | 242,587 | 29,813,942 |
| | | | 76,275,854 |
| Textiles, Apparel & Luxury Goods - 0.9% | | | |
| Cadence Bancorp | | 986,500 | 26,862,395 |
| Columbia Sportswear Co. | | 183,013 | 15,918,471 |
| | | | 42,780,866 |
|
| TOTAL CONSUMER DISCRETIONARY | | | 719,786,236 |
|
| CONSUMER STAPLES - 2.5% | | | |
| Food & Staples Retailing - 0.7% | | | |
| Performance Food Group Co. (a) | | 896,429 | 32,136,980 |
| Food Products - 1.1% | | | |
| Nomad Foods Ltd. (a) | | 1,218,451 | 23,150,569 |
| Post Holdings, Inc. (a) | | 305,568 | 26,449,966 |
| | | | 49,600,535 |
| Household Products - 0.7% | | | |
| Central Garden & Pet Co. (a) | | 429,384 | 18,536,507 |
| Central Garden & Pet Co. Class A (non-vtg.) (a) | | 417,960 | 16,768,555 |
| | | | 35,305,062 |
|
| TOTAL CONSUMER STAPLES | | | 117,042,577 |
|
| ENERGY - 1.6% | | | |
| Energy Equipment & Services - 0.3% | | | |
| NCS Multistage Holdings, Inc. (a) | | 988,987 | 15,685,334 |
| Oil, Gas & Consumable Fuels - 1.3% | | | |
| Delek U.S. Holdings, Inc. | | 531,475 | 28,338,247 |
| Extraction Oil & Gas, Inc. (a) | | 1,009,773 | 15,267,768 |
| Whiting Petroleum Corp. (a) | | 287,100 | 14,254,515 |
| | | | 57,860,530 |
|
| TOTAL ENERGY | | | 73,545,864 |
|
| FINANCIALS - 5.9% | | | |
| Banks - 0.8% | | | |
| First Citizen Bancshares, Inc. | | 88,016 | 35,806,669 |
| Capital Markets - 3.8% | | | |
| Apollo Global Management LLC Class A | | 1,084,602 | 38,503,371 |
| Hamilton Lane, Inc. Class A | | 506,100 | 24,783,717 |
| Lazard Ltd. Class A | | 368,996 | 20,036,483 |
| LPL Financial | | 354,400 | 23,493,176 |
| Morningstar, Inc. | | 167,200 | 22,070,400 |
| MSCI, Inc. | | 184,881 | 30,725,373 |
| Virtu Financial, Inc. Class A | | 868,800 | 17,506,320 |
| | | | 177,118,840 |
| Consumer Finance - 0.6% | | | |
| Green Dot Corp. Class A (a) | | 366,600 | 29,078,712 |
| Insurance - 0.7% | | | |
| Enstar Group Ltd. (a) | | 146,657 | 31,707,243 |
|
| TOTAL FINANCIALS | | | 273,711,464 |
|
| HEALTH CARE - 23.5% | | | |
| Biotechnology - 8.1% | | | |
| Abeona Therapeutics, Inc. (a) | | 714,781 | 10,328,585 |
| Acceleron Pharma, Inc. (a) | | 368,412 | 16,048,027 |
| Acorda Therapeutics, Inc. (a) | | 345,137 | 8,611,168 |
| Alder Biopharmaceuticals, Inc. (a)(b) | | 775,154 | 14,689,168 |
| AnaptysBio, Inc. (a) | | 257,425 | 20,161,526 |
| Arena Pharmaceuticals, Inc. (a) | | 277,086 | 10,692,749 |
| Argenx SE ADR (a) | | 199,451 | 18,100,178 |
| Ascendis Pharma A/S sponsored ADR (a) | | 391,274 | 26,583,156 |
| Atara Biotherapeutics, Inc. (a) | | 319,514 | 11,997,751 |
| Audentes Therapeutics, Inc. (a) | | 537,121 | 20,222,606 |
| Blueprint Medicines Corp. (a) | | 333,215 | 19,839,621 |
| Dyax Corp. rights 12/31/19 (a)(c) | | 380,400 | 1,361,832 |
| FibroGen, Inc. (a) | | 537,358 | 33,907,290 |
| Five Prime Therapeutics, Inc. (a) | | 229,619 | 3,421,323 |
| Global Blood Therapeutics, Inc. (a) | | 434,757 | 18,172,843 |
| Heron Therapeutics, Inc. (a) | | 360,357 | 13,495,370 |
| Ligand Pharmaceuticals, Inc. Class B (a) | | 98,229 | 21,446,338 |
| Loxo Oncology, Inc. (a) | | 177,630 | 29,769,012 |
| Mirati Therapeutics, Inc. (a)(b) | | 491,855 | 30,199,897 |
| Sarepta Therapeutics, Inc. (a) | | 246,920 | 28,701,981 |
| Spark Therapeutics, Inc. (a) | | 184,100 | 14,124,152 |
| TESARO, Inc. (a) | | 80,975 | 2,820,359 |
| | | | 374,694,932 |
| Health Care Equipment & Supplies - 8.0% | | | |
| Cantel Medical Corp. | | 202,432 | 18,767,471 |
| CONMED Corp. | | 256,700 | 18,995,800 |
| Globus Medical, Inc. (a) | | 827,900 | 42,620,292 |
| Hill-Rom Holdings, Inc. | | 338,100 | 31,849,020 |
| ICU Medical, Inc. (a) | | 102,738 | 29,465,258 |
| Insulet Corp. (a) | | 708,124 | 58,887,592 |
| Integer Holdings Corp. (a) | | 219,200 | 15,661,840 |
| Integra LifeSciences Holdings Corp. (a) | | 689,723 | 42,990,435 |
| iRhythm Technologies, Inc. (a) | | 446,476 | 33,731,262 |
| Masimo Corp. (a) | | 455,000 | 45,236,100 |
| Novocure Ltd. (a) | | 647,529 | 22,015,986 |
| Quanterix Corp. (a)(b) | | 770,447 | 11,549,001 |
| | | | 371,770,057 |
| Health Care Providers & Services - 3.5% | | | |
| Chemed Corp. | | 102,500 | 32,393,075 |
| G1 Therapeutics, Inc. (a)(b) | | 526,672 | 27,044,607 |
| Magellan Health Services, Inc. (a) | | 526,469 | 38,300,620 |
| Molina Healthcare, Inc. (a) | | 409,738 | 42,649,628 |
| Tivity Health, Inc. (a) | | 607,998 | 20,489,533 |
| | | | 160,877,463 |
| Health Care Technology - 0.8% | | | |
| HTG Molecular Diagnostics (a) | | 815,910 | 2,382,457 |
| Teladoc, Inc. (a) | | 592,900 | 35,485,065 |
| | | | 37,867,522 |
| Life Sciences Tools & Services - 1.3% | | | |
| ICON PLC (a) | | 327,865 | 45,625,693 |
| Morphosys AG (a) | | 93,900 | 12,341,741 |
| | | | 57,967,434 |
| Pharmaceuticals - 1.8% | | | |
| Aclaris Therapeutics, Inc. (a) | | 565,525 | 9,693,099 |
| Aerie Pharmaceuticals, Inc. (a) | | 313,018 | 21,144,366 |
| Akcea Therapeutics, Inc. (b) | | 280,194 | 8,859,734 |
| Nektar Therapeutics (a) | | 417,732 | 21,972,703 |
| SCYNEXIS, Inc. warrants 6/21/21 (a) | | 168,750 | 44,625 |
| The Medicines Company (a) | | 343,026 | 13,628,423 |
| Theravance Biopharma, Inc. (a) | | 292,739 | 7,011,099 |
| | | | 82,354,049 |
|
| TOTAL HEALTH CARE | | | 1,085,531,457 |
|
| INDUSTRIALS - 18.6% | | | |
| Aerospace & Defense - 2.7% | | | |
| BWX Technologies, Inc. | | 598,127 | 39,332,832 |
| HEICO Corp. Class A | | 667,966 | 43,250,799 |
| Teledyne Technologies, Inc. (a) | | 196,104 | 43,029,140 |
| | | | 125,612,771 |
| Air Freight & Logistics - 0.6% | | | |
| Atlas Air Worldwide Holdings, Inc. (a) | | 411,693 | 27,604,016 |
| Airlines - 1.0% | | | |
| SkyWest, Inc. | | 793,724 | 47,544,068 |
| Commercial Services & Supplies - 1.5% | | | |
| Copart, Inc. (a) | | 927,412 | 53,224,175 |
| Viad Corp. | | 289,260 | 16,603,524 |
| | | | 69,827,699 |
| Construction & Engineering - 1.9% | | | |
| Dycom Industries, Inc. (a) | | 437,328 | 38,992,164 |
| Jacobs Engineering Group, Inc. | | 748,114 | 50,594,950 |
| | | | 89,587,114 |
| Electrical Equipment - 1.4% | | | |
| Generac Holdings, Inc. (a) | | 1,199,192 | 64,456,570 |
| Industrial Conglomerates - 1.0% | | | |
| ITT, Inc. | | 826,808 | 46,855,209 |
| Machinery - 3.2% | | | |
| AGCO Corp. | | 339,998 | 21,426,674 |
| Allison Transmission Holdings, Inc. | | 617,361 | 29,015,967 |
| Gardner Denver Holdings, Inc. (a) | | 799,500 | 22,873,695 |
| John Bean Technologies Corp. | | 136,859 | 15,136,605 |
| Milacron Holdings Corp. (a) | | 1,129,647 | 23,553,140 |
| Oshkosh Corp. | | 236,341 | 17,784,660 |
| WABCO Holdings, Inc. (a) | | 145,015 | 18,225,485 |
| | | | 148,016,226 |
| Professional Services - 4.3% | | | |
| Asgn, Inc. (a) | | 724,371 | 65,410,701 |
| Exponent, Inc. | | 834,149 | 40,789,886 |
| FTI Consulting, Inc. (a) | | 625,897 | 49,420,827 |
| Insperity, Inc. | | 441,207 | 41,958,786 |
| | | | 197,580,200 |
| Trading Companies & Distributors - 1.0% | | | |
| SiteOne Landscape Supply, Inc. (a) | | 265,285 | 23,652,811 |
| Univar, Inc. (a) | | 724,560 | 19,918,154 |
| | | | 43,570,965 |
|
| TOTAL INDUSTRIALS | | | 860,654,838 |
|
| INFORMATION TECHNOLOGY - 22.0% | | | |
| Electronic Equipment & Components - 0.9% | | | |
| Dolby Laboratories, Inc. Class A | | 312,997 | 20,172,657 |
| Novanta, Inc. (a) | | 348,559 | 21,732,654 |
| | | | 41,905,311 |
| Internet Software & Services - 11.2% | | | |
| 2U, Inc. (a) | | 970,130 | 73,400,036 |
| ANGI Homeservices, Inc. Class A (a)(b) | | 1,553,077 | 24,398,840 |
| BlackLine, Inc. (a) | | 380,696 | 16,255,719 |
| CarGurus, Inc. Class A (b) | | 2,714,400 | 117,669,234 |
| Five9, Inc. (a) | | 880,930 | 28,101,667 |
| GoDaddy, Inc. (a) | | 609,429 | 44,866,163 |
| Instructure, Inc. (a) | | 413,648 | 16,008,178 |
| MINDBODY, Inc. (a) | | 791,228 | 29,552,366 |
| New Relic, Inc. (a) | | 237,446 | 23,198,474 |
| Okta, Inc. (a) | | 270,720 | 13,441,248 |
| ShotSpotter, Inc. (a)(b) | | 425,493 | 18,155,786 |
| Stamps.com, Inc. (a) | | 309,475 | 80,772,975 |
| The Trade Desk, Inc. (a) | | 390,400 | 32,918,528 |
| | | | 518,739,214 |
| IT Services - 2.4% | | | |
| EPAM Systems, Inc. (a) | | 332,300 | 43,268,783 |
| Genpact Ltd. | | 662,539 | 20,127,935 |
| Interxion Holding N.V. (a) | | 266,223 | 17,272,548 |
| Leidos Holdings, Inc. | | 430,181 | 29,432,984 |
| | | | 110,102,250 |
| Semiconductors & Semiconductor Equipment - 1.1% | | | |
| Entegris, Inc. | | 1,394,885 | 49,030,208 |
| Software - 6.4% | | | |
| 8x8, Inc. (a) | | 994,920 | 19,848,654 |
| Black Knight, Inc. (a) | | 436,980 | 22,570,017 |
| Cardlytics, Inc. (a)(d) | | 1,699,744 | 31,989,182 |
| Everbridge, Inc. (a) | | 793,564 | 35,694,509 |
| HubSpot, Inc. (a) | | 268,507 | 33,321,719 |
| Pluralsight, Inc. (b) | | 1,584,045 | 36,765,684 |
| PROS Holdings, Inc. (a) | | 666,476 | 24,752,919 |
| RealPage, Inc. (a) | | 541,900 | 29,858,690 |
| Talend SA ADR (a) | | 387,952 | 22,947,361 |
| Zendesk, Inc. (a) | | 484,714 | 26,402,372 |
| Zscaler, Inc. (a)(b) | | 297,481 | 10,504,054 |
| | | | 294,655,161 |
|
| TOTAL INFORMATION TECHNOLOGY | | | 1,014,432,144 |
|
| MATERIALS - 4.5% | | | |
| Chemicals - 1.7% | | | |
| Orion Engineered Carbons SA | | 1,107,433 | 36,323,802 |
| The Chemours Co. LLC | | 898,672 | 41,168,164 |
| | | | 77,491,966 |
| Construction Materials - 1.3% | | | |
| Eagle Materials, Inc. | | 331,483 | 32,932,836 |
| Summit Materials, Inc. | | 1,013,652 | 25,442,665 |
| | | | 58,375,501 |
| Containers & Packaging - 1.1% | | | |
| Aptargroup, Inc. | | 244,500 | 25,044,135 |
| Avery Dennison Corp. | | 244,514 | 28,040,866 |
| | | | 53,085,001 |
| Paper & Forest Products - 0.4% | | | |
| Neenah, Inc. | | 185,987 | 16,329,659 |
| Quintis Ltd. (a)(b)(c) | | 11,211,435 | 83 |
| | | | 16,329,742 |
|
| TOTAL MATERIALS | | | 205,282,210 |
|
| REAL ESTATE - 1.1% | | | |
| Equity Real Estate Investment Trusts (REITs) - 1.1% | | | |
| Rexford Industrial Realty, Inc. | | 553,591 | 16,962,028 |
| Store Capital Corp. | | 595,549 | 16,347,820 |
| Terreno Realty Corp. | | 496,046 | 18,309,058 |
| | | | 51,618,906 |
| TOTAL COMMON STOCKS | | | |
| (Cost $3,473,322,233) | | | 4,401,605,696 |
|
| Convertible Preferred Stocks - 0.5% | | | |
| INFORMATION TECHNOLOGY - 0.5% | | | |
| Software - 0.5% | | | |
| Compass, Inc. Series E (c)(e) | | | |
| (Cost $23,873,990) | | 353,803 | 23,873,990 |
|
| Investment Companies - 2.1% | | | |
| iShares Russell 2000 Growth Index ETF (b) | | | |
| (Cost $94,361,861) | | 452,400 | 93,895,620 |
|
| Money Market Funds - 5.8% | | | |
| Fidelity Cash Central Fund, 1.96% (f) | | 88,577,592 | 88,595,307 |
| Fidelity Securities Lending Cash Central Fund 1.97% (f)(g) | | 179,710,408 | 179,728,379 |
| TOTAL MONEY MARKET FUNDS | | | |
| (Cost $268,323,686) | | | 268,323,686 |
| TOTAL INVESTMENT IN SECURITIES - 103.7% | | | |
| (Cost $3,859,881,770) | | | 4,787,698,992 |
| NET OTHER ASSETS (LIABILITIES) - (3.7)% | | | (168,810,820) |
| NET ASSETS - 100% | | | $4,618,888,172 |
Security Type Abbreviations
ETF – Exchange-Traded Fund
Legend
(a) Non-income producing
(b) Security or a portion of the security is on loan at period end.
(c) Level 3 security
(d) Affiliated company
(e) Restricted securities - Investment in securities not registered under the Securities Act of 1933 (excluding 144A issues). At the end of the period, the value of restricted securities (excluding 144A issues) amounted to $23,873,990 or 0.5% of net assets.
(f) Affiliated fund that is generally available only to investment companies and other accounts managed by Fidelity Investments. The rate quoted is the annualized seven-day yield of the fund at period end. A complete unaudited listing of the fund's holdings as of its most recent quarter end is available upon request. In addition, each Fidelity Central Fund's financial statements, which are not covered by the Fund's Report of Independent Registered Public Accounting Firm, are available on the SEC's website or upon request.
(g) Investment made with cash collateral received from securities on loan.
Additional information on each restricted holding is as follows:
| Security | Acquisition Date | Acquisition Cost |
| Compass, Inc. Series E | 11/3/17 | $23,873,990 |
Affiliated Central Funds
Information regarding fiscal year to date income earned by the Fund from investments in Fidelity Central Funds is as follows:
| Fund | Income earned |
| Fidelity Cash Central Fund | $933,064 |
| Fidelity Securities Lending Cash Central Fund | 3,685,850 |
| Total | $4,618,914 |
Amounts in the income column in the above table include any capital gain distributions from underlying funds, which are presented in the corresponding line-item in the Statement of Operations if applicable.
Other Affiliated Issuers
An affiliated company is a company in which the Fund has ownership of at least 5% of the voting securities. Fiscal year to date transactions with companies which are or were affiliates are as follows:
| Affiliate | Value, beginning of period | Purchases | Sales Proceeds(a) | Dividend Income | Realized Gain (loss) | Change in Unrealized appreciation (depreciation) | Value, end of period |
| Cardlytics, Inc. | $-- | $25,242,697 | $647,277 | $-- | $155,297 | $7,238,465 | $31,989,182 |
| Total | $-- | $25,242,697 | $647,277 | $-- | $155,297 | $7,238,465 | $31,989,182 |
(a) Includes the value of securities delivered through in-kind transactions, if applicable.
Investment Valuation
The following is a summary of the inputs used, as of July 31, 2018, involving the Fund's assets and liabilities carried at fair value. The inputs or methodology used for valuing securities may not be an indication of the risk associated with investing in those securities. For more information on valuation inputs, and their aggregation into the levels used below, please refer to the Investment Valuation section in the accompanying Notes to Financial Statements.
| | Valuation Inputs at Reporting Date: |
| Description | Total | Level 1 | Level 2 | Level 3 |
| Investments in Securities: | | | | |
| Equities: | | | | |
| Consumer Discretionary | $719,786,236 | $719,786,236 | $-- | $-- |
| Consumer Staples | 117,042,577 | 117,042,577 | -- | -- |
| Energy | 73,545,864 | 73,545,864 | -- | -- |
| Financials | 273,711,464 | 273,711,464 | -- | -- |
| Health Care | 1,085,531,457 | 1,084,125,000 | 44,625 | 1,361,832 |
| Industrials | 860,654,838 | 860,654,838 | -- | -- |
| Information Technology | 1,038,306,134 | 1,014,432,144 | -- | 23,873,990 |
| Materials | 205,282,210 | 205,282,127 | -- | 83 |
| Real Estate | 51,618,906 | 51,618,906 | -- | -- |
| Investment Companies | 93,895,620 | 93,895,620 | -- | -- |
| Money Market Funds | 268,323,686 | 268,323,686 | -- | -- |
| Total Investments in Securities: | $4,787,698,992 | $4,762,418,462 | $44,625 | $25,235,905 |
See accompanying notes which are an integral part of the financial statements.
Financial Statements
Statement of Assets and Liabilities
| | | July 31, 2018 |
| Assets | | |
Investment in securities, at value (including securities loaned of $178,777,758) — See accompanying schedule:
Unaffiliated issuers (cost $3,566,807,367) | $4,487,386,124 | |
| Fidelity Central Funds (cost $268,323,686) | 268,323,686 | |
| Other affiliated issuers (cost $24,750,717) | 31,989,182 | |
| Total Investment in Securities (cost $3,859,881,770) | | $4,787,698,992 |
| Receivable for investments sold | | 25,948,269 |
| Receivable for fund shares sold | | 4,531,582 |
| Dividends receivable | | 181,449 |
| Distributions receivable from Fidelity Central Funds | | 262,788 |
| Prepaid expenses | | 11,955 |
| Other receivables | | 143,672 |
| Total assets | | 4,818,778,707 |
| Liabilities | | |
| Payable for investments purchased | $8,230,284 | |
| Payable for fund shares redeemed | 7,749,728 | |
| Accrued management fee | 3,150,455 | |
| Distribution and service plan fees payable | 220,321 | |
| Other affiliated payables | 745,795 | |
| Other payables and accrued expenses | 71,284 | |
| Collateral on securities loaned | 179,722,668 | |
| Total liabilities | | 199,890,535 |
| Net Assets | | $4,618,888,172 |
| Net Assets consist of: | | |
| Paid in capital | | $3,274,697,768 |
| Accumulated net investment loss | | (3,938,472) |
| Accumulated undistributed net realized gain (loss) on investments and foreign currency transactions | | 420,311,752 |
| Net unrealized appreciation (depreciation) on investments and assets and liabilities in foreign currencies | | 927,817,124 |
| Net Assets | | $4,618,888,172 |
| Calculation of Maximum Offering Price | | |
| Class A: | | |
| Net Asset Value and redemption price per share ($315,894,425 ÷ 11,508,691 shares) | | $27.45 |
| Maximum offering price per share (100/94.25 of $27.45) | | $29.12 |
| Class M: | | |
| Net Asset Value and redemption price per share ($82,566,988 ÷ 3,105,495 shares) | | $26.59 |
| Maximum offering price per share (100/96.50 of $26.59) | | $27.55 |
| Class C: | | |
| Net Asset Value and offering price per share ($139,375,333 ÷ 5,674,635 shares)(a) | | $24.56 |
| Small Cap Growth: | | |
| Net Asset Value, offering price and redemption price per share ($3,269,547,883 ÷ 114,366,821 shares) | | $28.59 |
| Class I: | | |
| Net Asset Value, offering price and redemption price per share ($678,575,785 ÷ 23,674,264 shares) | | $28.66 |
| Class Z: | | |
| Net Asset Value, offering price and redemption price per share ($132,927,758÷ 4,630,205 shares) | | $28.71 |
(a) Redemption price per share is equal to net asset value less any applicable contingent deferred sales charge.
See accompanying notes which are an integral part of the financial statements.
Statement of Operations
| | | Year ended July 31, 2018 |
| Investment Income | | |
| Dividends | | $17,633,467 |
| Income from Fidelity Central Funds (including $3,685,850 from security lending) | | 4,618,914 |
| Total income | | 22,252,381 |
| Expenses | | |
| Management fee | | |
| Basic fee | $27,512,839 | |
| Performance adjustment | 4,686,065 | |
| Transfer agent fees | 7,094,239 | |
| Distribution and service plan fees | 2,301,170 | |
| Accounting and security lending fees | 1,069,595 | |
| Custodian fees and expenses | 61,901 | |
| Independent trustees' fees and expenses | 16,573 | |
| Registration fees | 237,982 | |
| Audit | 65,516 | |
| Legal | 14,089 | |
| Interest | 5,356 | |
| Miscellaneous | 25,535 | |
| Total expenses before reductions | 43,090,860 | |
| Expense reductions | (418,966) | |
| Total expenses after reductions | | 42,671,894 |
| Net investment income (loss) | | (20,419,513) |
| Realized and Unrealized Gain (Loss) | | |
| Net realized gain (loss) on: | | |
| Investment securities: | | |
| Unaffiliated issuers | 566,033,143 | |
| Fidelity Central Funds | 13,111 | |
| Other affiliated issuers | 155,297 | |
| Foreign currency transactions | 4,937 | |
| Total net realized gain (loss) | | 566,206,488 |
| Change in net unrealized appreciation (depreciation) on: | | |
| Investment securities: | | |
| Unaffiliated issuers | 425,734,577 | |
| Fidelity Central Funds | (9,738) | |
| Other affiliated issuers | 7,238,465 | |
| Assets and liabilities in foreign currencies | (9) | |
| Total change in net unrealized appreciation (depreciation) | | 432,963,295 |
| Net gain (loss) | | 999,169,783 |
| Net increase (decrease) in net assets resulting from operations | | $978,750,270 |
See accompanying notes which are an integral part of the financial statements.
Statement of Changes in Net Assets
| | Year ended July 31, 2018 | Year ended July 31, 2017 |
| Increase (Decrease) in Net Assets | | |
| Operations | | |
| Net investment income (loss) | $(20,419,513) | $(11,864,179) |
| Net realized gain (loss) | 566,206,488 | 284,698,299 |
| Change in net unrealized appreciation (depreciation) | 432,963,295 | 228,635,188 |
| Net increase (decrease) in net assets resulting from operations | 978,750,270 | 501,469,308 |
| Distributions to shareholders from net realized gain | (236,662,615) | (17,131,591) |
| Share transactions - net increase (decrease) | 745,727,718 | 597,965,658 |
| Redemption fees | 224,642 | 418,601 |
| Total increase (decrease) in net assets | 1,488,040,015 | 1,082,721,976 |
| Net Assets | | |
| Beginning of period | 3,130,848,157 | 2,048,126,181 |
| End of period | $4,618,888,172 | $3,130,848,157 |
| Other Information | | |
| Accumulated net investment loss end of period | $(3,938,472) | $(1,470,898) |
See accompanying notes which are an integral part of the financial statements.
Financial Highlights
Fidelity Small Cap Growth Fund Class A
| Years ended July 31, | 2018 | 2017 | 2016 | 2015 | 2014 |
| Selected Per–Share Data | | | | | |
| Net asset value, beginning of period | $22.99 | $19.17 | $20.55 | $17.99 | $19.66 |
| Income from Investment Operations | | | | | |
| Net investment income (loss)A | (.18) | (.14) | (.10) | (.13) | (.12) |
| Net realized and unrealized gain (loss) | 6.32 | 4.12 | (.51) | 4.23 | 1.69 |
| Total from investment operations | 6.14 | 3.98 | (.61) | 4.10 | 1.57 |
| Distributions from net investment income | – | – | – | – | – |
| Distributions from net realized gain | (1.68) | (.16) | (.78) | (1.54) | (3.24) |
| Total distributions | (1.68) | (.16) | (.78) | (1.54) | (3.24) |
| Redemption fees added to paid in capitalA | –B | –B | .01 | –B | –B |
| Net asset value, end of period | $27.45 | $22.99 | $19.17 | $20.55 | $17.99 |
| Total ReturnC,D | 28.47% | 20.90% | (2.85)% | 24.46% | 8.58% |
| Ratios to Average Net AssetsE,F | | | | | |
| Expenses before reductions | 1.31% | 1.35% | 1.37% | 1.21% | 1.22% |
| Expenses net of fee waivers, if any | 1.31% | 1.35% | 1.37% | 1.21% | 1.22% |
| Expenses net of all reductions | 1.30% | 1.34% | 1.36% | 1.20% | 1.22% |
| Net investment income (loss) | (.74)% | (.66)% | (.58)% | (.67)% | (.62)% |
| Supplemental Data | | | | | |
| Net assets, end of period (000 omitted) | $315,894 | $218,905 | $176,988 | $123,370 | $88,822 |
| Portfolio turnover rateG | 106%H | 140%H | 143% | 156% | 148%H |
A Calculated based on average shares outstanding during the period.
B Amount represents less than $.005 per share.
C Total returns would have been lower if certain expenses had not been reduced during the applicable periods shown.
D Total returns do not include the effect of the sales charges.
E Fees and expenses of any underlying Fidelity Central Funds are not included in the Fund's expense ratio. The Fund indirectly bears its proportionate share of the expenses of any underlying Fidelity Central Funds.
F Expense ratios reflect operating expenses of the class. Expenses before reductions do not reflect amounts reimbursed by the investment adviser or reductions from brokerage service arrangements or reductions from other expense offset arrangements and do not represent the amount paid by the class during periods when reimbursements or reductions occur. Expenses net of fee waivers reflect expenses after reimbursement by the investment adviser but prior to reductions from brokerage service arrangements or other expense offset arrangements. Expenses net of all reductions represent the net expenses paid by the class.
G Amount does not include the portfolio activity of any underlying Fidelity Central Funds.
H Portfolio turnover rate excludes securities received or delivered in-kind.
See accompanying notes which are an integral part of the financial statements.
Fidelity Small Cap Growth Fund Class M
| Years ended July 31, | 2018 | 2017 | 2016 | 2015 | 2014 |
| Selected Per–Share Data | | | | | |
| Net asset value, beginning of period | $22.35 | $18.69 | $20.08 | $17.66 | $19.38 |
| Income from Investment Operations | | | | | |
| Net investment income (loss)A | (.24) | (.19) | (.15) | (.17) | (.16) |
| Net realized and unrealized gain (loss) | 6.13 | 4.01 | (.50) | 4.13 | 1.66 |
| Total from investment operations | 5.89 | 3.82 | (.65) | 3.96 | 1.50 |
| Distributions from net investment income | – | – | – | – | – |
| Distributions from net realized gain | (1.65) | (.16) | (.75) | (1.54) | (3.22) |
| Total distributions | (1.65) | (.16) | (.75) | (1.54) | (3.22) |
| Redemption fees added to paid in capitalA | –B | –B | .01 | –B | –B |
| Net asset value, end of period | $26.59 | $22.35 | $18.69 | $20.08 | $17.66 |
| Total ReturnC,D | 28.15% | 20.57% | (3.14)% | 24.10% | 8.30% |
| Ratios to Average Net AssetsE,F | | | | | |
| Expenses before reductions | 1.58% | 1.62% | 1.66% | 1.49% | 1.50% |
| Expenses net of fee waivers, if any | 1.58% | 1.62% | 1.66% | 1.48% | 1.50% |
| Expenses net of all reductions | 1.57% | 1.61% | 1.64% | 1.47% | 1.49% |
| Net investment income (loss) | (1.01)% | (.94)% | (.87)% | (.95)% | (.90)% |
| Supplemental Data | | | | | |
| Net assets, end of period (000 omitted) | $82,567 | $64,034 | $53,447 | $52,667 | $42,586 |
| Portfolio turnover rateG | 106%H | 140%H | 143% | 156% | 148%H |
A Calculated based on average shares outstanding during the period.
B Amount represents less than $.005 per share.
C Total returns would have been lower if certain expenses had not been reduced during the applicable periods shown.
D Total returns do not include the effect of the sales charges.
E Fees and expenses of any underlying Fidelity Central Funds are not included in the Fund's expense ratio. The Fund indirectly bears its proportionate share of the expenses of any underlying Fidelity Central Funds.
F Expense ratios reflect operating expenses of the class. Expenses before reductions do not reflect amounts reimbursed by the investment adviser or reductions from brokerage service arrangements or reductions from other expense offset arrangements and do not represent the amount paid by the class during periods when reimbursements or reductions occur. Expenses net of fee waivers reflect expenses after reimbursement by the investment adviser but prior to reductions from brokerage service arrangements or other expense offset arrangements. Expenses net of all reductions represent the net expenses paid by the class.
G Amount does not include the portfolio activity of any underlying Fidelity Central Funds.
H Portfolio turnover rate excludes securities received or delivered in-kind.
See accompanying notes which are an integral part of the financial statements.
Fidelity Small Cap Growth Fund Class C
| Years ended July 31, | 2018 | 2017 | 2016 | 2015 | 2014 |
| Selected Per–Share Data | | | | | |
| Net asset value, beginning of period | $20.83 | $17.52 | $18.90 | $16.78 | $18.62 |
| Income from Investment Operations | | | | | |
| Net investment income (loss)A | (.34) | (.27) | (.22) | (.25) | (.25) |
| Net realized and unrealized gain (loss) | 5.69 | 3.74 | (.48) | 3.91 | 1.59 |
| Total from investment operations | 5.35 | 3.47 | (.70) | 3.66 | 1.34 |
| Distributions from net investment income | – | – | – | – | – |
| Distributions from net realized gain | (1.62) | (.16) | (.69) | (1.54) | (3.18) |
| Total distributions | (1.62) | (.16) | (.69) | (1.54) | (3.18) |
| Redemption fees added to paid in capitalA | –B | –B | .01 | –B | –B |
| Net asset value, end of period | $24.56 | $20.83 | $17.52 | $18.90 | $16.78 |
| Total ReturnC,D | 27.51% | 19.95% | (3.64)% | 23.53% | 7.70% |
| Ratios to Average Net AssetsE,F | | | | | |
| Expenses before reductions | 2.07% | 2.11% | 2.16% | 2.00% | 2.01% |
| Expenses net of fee waivers, if any | 2.07% | 2.11% | 2.16% | 2.00% | 2.00% |
| Expenses net of all reductions | 2.06% | 2.10% | 2.14% | 1.99% | 2.00% |
| Net investment income (loss) | (1.50)% | (1.43)% | (1.37)% | (1.46)% | (1.41)% |
| Supplemental Data | | | | | |
| Net assets, end of period (000 omitted) | $139,375 | $102,669 | $73,731 | $55,671 | $42,215 |
| Portfolio turnover rateG | 106%H | 140%H | 143% | 156% | 148%H |
A Calculated based on average shares outstanding during the period.
B Amount represents less than $.005 per share.
C Total returns would have been lower if certain expenses had not been reduced during the applicable periods shown.
D Total returns do not include the effect of the contingent deferred sales charge.
E Fees and expenses of any underlying Fidelity Central Funds are not included in the Fund's expense ratio. The Fund indirectly bears its proportionate share of the expenses of any underlying Fidelity Central Funds.
F Expense ratios reflect operating expenses of the class. Expenses before reductions do not reflect amounts reimbursed by the investment adviser or reductions from brokerage service arrangements or reductions from other expense offset arrangements and do not represent the amount paid by the class during periods when reimbursements or reductions occur. Expenses net of fee waivers reflect expenses after reimbursement by the investment adviser but prior to reductions from brokerage service arrangements or other expense offset arrangements. Expenses net of all reductions represent the net expenses paid by the class.
G Amount does not include the portfolio activity of any underlying Fidelity Central Funds.
H Portfolio turnover rate excludes securities received or delivered in-kind.
See accompanying notes which are an integral part of the financial statements.
Fidelity Small Cap Growth Fund
| Years ended July 31, | 2018 | 2017 | 2016 | 2015 | 2014 |
| Selected Per–Share Data | | | | | |
| Net asset value, beginning of period | $23.84 | $19.82 | $21.20 | $18.45 | $20.07 |
| Income from Investment Operations | | | | | |
| Net investment income (loss)A | (.12) | (.09) | (.06) | (.07) | (.06) |
| Net realized and unrealized gain (loss) | 6.57 | 4.27 | (.52) | 4.36 | 1.71 |
| Total from investment operations | 6.45 | 4.18 | (.58) | 4.29 | 1.65 |
| Distributions from net investment income | – | – | – | – | – |
| Distributions from net realized gain | (1.70) | (.16) | (.81) | (1.54) | (3.27) |
| Total distributions | (1.70) | (.16) | (.81) | (1.54) | (3.27) |
| Redemption fees added to paid in capitalA | –B | –B | .01 | –B | –B |
| Net asset value, end of period | $28.59 | $23.84 | $19.82 | $21.20 | $18.45 |
| Total ReturnC | 28.81% | 21.22% | (2.63)% | 24.91% | 8.87% |
| Ratios to Average Net AssetsD,E | | | | | |
| Expenses before reductions | 1.02% | 1.08% | 1.12% | .91% | .91% |
| Expenses net of fee waivers, if any | 1.02% | 1.08% | 1.12% | .91% | .90% |
| Expenses net of all reductions | 1.01% | 1.07% | 1.11% | .90% | .90% |
| Net investment income (loss) | (.45)% | (.40)% | (.33)% | (.37)% | (.31)% |
| Supplemental Data | | | | | |
| Net assets, end of period (000 omitted) | $3,269,548 | $2,336,762 | $1,580,264 | $1,345,684 | $1,069,105 |
| Portfolio turnover rateF | 106%G | 140%G | 143% | 156% | 148%G |
A Calculated based on average shares outstanding during the period.
B Amount represents less than $.005 per share.
C Total returns would have been lower if certain expenses had not been reduced during the applicable periods shown.
D Fees and expenses of any underlying Fidelity Central Funds are not included in the Fund's expense ratio. The Fund indirectly bears its proportionate share of the expenses of any underlying Fidelity Central Funds.
E Expense ratios reflect operating expenses of the class. Expenses before reductions do not reflect amounts reimbursed by the investment adviser or reductions from brokerage service arrangements or reductions from other expense offset arrangements and do not represent the amount paid by the class during periods when reimbursements or reductions occur. Expenses net of fee waivers reflect expenses after reimbursement by the investment adviser but prior to reductions from brokerage service arrangements or other expense offset arrangements. Expenses net of all reductions represent the net expenses paid by the class.
F Amount does not include the portfolio activity of any underlying Fidelity Central Funds.
G Portfolio turnover rate excludes securities received or delivered in-kind.
See accompanying notes which are an integral part of the financial statements.
Fidelity Small Cap Growth Fund Class I
| Years ended July 31, | 2018 | 2017 | 2016 | 2015 | 2014 |
| Selected Per–Share Data | | | | | |
| Net asset value, beginning of period | $23.90 | $19.86 | $21.24 | $18.49 | $20.10 |
| Income from Investment Operations | | | | | |
| Net investment income (loss)A | (.12) | (.08) | (.05) | (.07) | (.06) |
| Net realized and unrealized gain (loss) | 6.58 | 4.28 | (.53) | 4.36 | 1.72 |
| Total from investment operations | 6.46 | 4.20 | (.58) | 4.29 | 1.66 |
| Distributions from net investment income | – | – | – | – | – |
| Distributions from net realized gain | (1.70) | (.16) | (.81) | (1.54) | (3.27) |
| Total distributions | (1.70) | (.16) | (.81) | (1.54) | (3.27) |
| Redemption fees added to paid in capitalA | –B | –B | .01 | –B | –B |
| Net asset value, end of period | $28.66 | $23.90 | $19.86 | $21.24 | $18.49 |
| Total ReturnC | 28.78% | 21.28% | (2.62)% | 24.85% | 8.89% |
| Ratios to Average Net AssetsD,E | | | | | |
| Expenses before reductions | 1.03% | 1.06% | 1.09% | .93% | .92% |
| Expenses net of fee waivers, if any | 1.03% | 1.06% | 1.09% | .93% | .92% |
| Expenses net of all reductions | 1.02% | 1.05% | 1.07% | .91% | .92% |
| Net investment income (loss) | (.46)% | (.38)% | (.30)% | (.39)% | (.32)% |
| Supplemental Data | | | | | |
| Net assets, end of period (000 omitted) | $678,576 | $390,032 | $163,696 | $97,897 | $51,607 |
| Portfolio turnover rateF | 106%G | 140%G | 143% | 156% | 148%G |
A Calculated based on average shares outstanding during the period.
B Amount represents less than $.005 per share.
C Total returns would have been lower if certain expenses had not been reduced during the applicable periods shown.
D Fees and expenses of any underlying Fidelity Central Funds are not included in the Fund's expense ratio. The Fund indirectly bears its proportionate share of the expenses of any underlying Fidelity Central Funds.
E Expense ratios reflect operating expenses of the class. Expenses before reductions do not reflect amounts reimbursed by the investment adviser or reductions from brokerage service arrangements or reductions from other expense offset arrangements and do not represent the amount paid by the class during periods when reimbursements or reductions occur. Expenses net of fee waivers reflect expenses after reimbursement by the investment adviser but prior to reductions from brokerage service arrangements or other expense offset arrangements. Expenses net of all reductions represent the net expenses paid by the class.
F Amount does not include the portfolio activity of any underlying Fidelity Central Funds.
G Portfolio turnover rate excludes securities received or delivered in-kind.
See accompanying notes which are an integral part of the financial statements.
Fidelity Small Cap Growth Fund Class Z
| Years ended July 31, | 2018 | 2017 A |
| Selected Per–Share Data | | |
| Net asset value, beginning of period | $23.91 | $21.39 |
| Income from Investment Operations | | |
| Net investment income (loss)B | (.09) | (.05) |
| Net realized and unrealized gain (loss) | 6.61 | 2.57 |
| Total from investment operations | 6.52 | 2.52 |
| Distributions from net investment income | – | – |
| Distributions from net realized gain | (1.72) | – |
| Total distributions | (1.72) | – |
| Redemption fees added to paid in capitalB,C | – | – |
| Net asset value, end of period | $28.71 | $23.91 |
| Total ReturnD,E | 29.02% | 11.78% |
| Ratios to Average Net AssetsF,G | | |
| Expenses before reductions | .89% | .90%H |
| Expenses net of fee waivers, if any | .89% | .90%H |
| Expenses net of all reductions | .88% | .89%H |
| Net investment income (loss) | (.32)% | (.44)%H |
| Supplemental Data | | |
| Net assets, end of period (000 omitted) | $132,928 | $18,447 |
| Portfolio turnover rateI | 106%J | 140%J |
A For the period February 1, 2017 (commencement of sale of shares) to July 31, 2017.
B Calculated based on average shares outstanding during the period.
C Amount represents less than $.005 per share.
D Total returns for periods of less than one year are not annualized.
E Total returns would have been lower if certain expenses had not been reduced during the applicable periods shown.
F Fees and expenses of any underlying Fidelity Central Funds are not included in the Fund's expense ratio. The Fund indirectly bears its proportionate share of the expenses of any underlying Fidelity Central Funds.
G Expense ratios reflect operating expenses of the class. Expenses before reductions do not reflect amounts reimbursed by the investment adviser or reductions from brokerage service arrangements or reductions from other expense offset arrangements and do not represent the amount paid by the class during periods when reimbursements or reductions occur. Expense ratios before reductions for start-up periods may not be representative of longer-term operating periods. Expenses net of fee waivers reflect expenses after reimbursement by the investment adviser but prior to reductions from brokerage service arrangements or other expense offset arrangements. Expenses net of all reductions represent the net expenses paid by the class.
H Annualized
I Amount does not include the portfolio activity of any underlying Fidelity Central Funds.
J Portfolio turnover rate excludes securities received or delivered in-kind.
See accompanying notes which are an integral part of the financial statements.
Notes to Financial Statements
For the period ended July 31, 2018
1. Organization.
Fidelity Small Cap Growth Fund (the Fund) is a fund of Fidelity Securities Fund (the Trust) and is authorized to issue an unlimited number of shares. The Trust is registered under the Investment Company Act of 1940, as amended (the 1940 Act), as an open-end management investment company organized as a Massachusetts business trust. The Fund offers Class A, Class M, Class C, Small Cap Growth, Class I and Class Z shares, each of which has equal rights as to assets and voting privileges. Effective the close of business on February 2, 2018, the Fund was closed to new accounts with certain exceptions. Each class has exclusive voting rights with respect to matters that affect that class.
2. Investments in Fidelity Central Funds.
The Fund invests in Fidelity Central Funds, which are open-end investment companies generally available only to other investment companies and accounts managed by the investment adviser and its affiliates. The Fund's Schedule of Investments lists each of the Fidelity Central Funds held as of period end, if any, as an investment of the Fund, but does not include the underlying holdings of each Fidelity Central Fund. As an Investing Fund, the Fund indirectly bears its proportionate share of the expenses of the underlying Fidelity Central Funds.
The Money Market Central Funds seek preservation of capital and current income and are managed by Fidelity Investments Money Management, Inc. (FIMM), an affiliate of the investment adviser. Annualized expenses of the Money Market Central Funds as of their most recent shareholder report date are less than .005%.
A complete unaudited list of holdings for each Fidelity Central Fund is available upon request or at the Securities and Exchange Commission (the SEC) website at www.sec.gov. In addition, the financial statements of the Fidelity Central Funds, which are not covered by the Fund's Report of Independent Registered Public Accounting Firm, are available on the SEC website or upon request.
3. Significant Accounting Policies.
The Fund is an investment company and applies the accounting and reporting guidance of the Financial Accounting Standards Board (FASB) Accounting Standards Codification Topic 946 Financial Services – Investments Companies. The financial statements have been prepared in conformity with accounting principles generally accepted in the United States of America (GAAP), which require management to make certain estimates and assumptions at the date of the financial statements. Actual results could differ from those estimates. Subsequent events, if any, through the date that the financial statements were issued have been evaluated in the preparation of the financial statements. The following summarizes the significant accounting policies of the Fund:
Investment Valuation. Investments are valued as of 4:00 p.m. Eastern time on the last calendar day of the period. The Board of Trustees (the Board) has delegated the day to day responsibility for the valuation of the Fund's investments to the Fair Value Committee (the Committee) established by the Fund's investment adviser. In accordance with valuation policies and procedures approved by the Board, the Fund attempts to obtain prices from one or more third party pricing vendors or brokers to value its investments. When current market prices, quotations or currency exchange rates are not readily available or reliable, investments will be fair valued in good faith by the Committee, in accordance with procedures adopted by the Board. Factors used in determining fair value vary by investment type and may include market or investment specific events. The frequency with which these procedures are used cannot be predicted and they may be utilized to a significant extent. The Committee oversees the Fund's valuation policies and procedures and reports to the Board on the Committee's activities and fair value determinations. The Board monitors the appropriateness of the procedures used in valuing the Fund's investments and ratifies the fair value determinations of the Committee.
The Fund categorizes the inputs to valuation techniques used to value its investments into a disclosure hierarchy consisting of three levels as shown below:
- Level 1 – quoted prices in active markets for identical investments
- Level 2 – other significant observable inputs (including quoted prices for similar investments, interest rates, prepayment speeds, etc.)
- Level 3 – unobservable inputs (including the Fund's own assumptions based on the best information available)
Valuation techniques used to value the Fund's investments by major category are as follows:
Equity securities, including restricted securities, for which market quotations are readily available, are valued at the last reported sale price or official closing price as reported by a third party pricing vendor on the primary market or exchange on which they are traded and are categorized as Level 1 in the hierarchy. In the event there were no sales during the day or closing prices are not available, securities are valued at the last quoted bid price or may be valued using the last available price and are generally categorized as Level 2 in the hierarchy. For foreign equity securities, when market or security specific events arise, comparisons to the valuation of American Depositary Receipts (ADRs), futures contracts, Exchange-Traded Funds (ETFs) and certain indexes as well as quoted prices for similar securities may be used and would be categorized as Level 2 in the hierarchy. Utilizing these techniques may result in transfers between Level 1 and Level 2. For equity securities, including restricted securities, where observable inputs are limited, assumptions about market activity and risk are used and these securities may be categorized as Level 3 in the hierarchy.
ETFs are valued at their last sale price or official closing price as reported by a third party pricing vendor on the primary market or exchange on which they are traded and are categorized as Level 1 in the hierarchy. In the event there were no sales during the day but the exchange reports a closing bid level, ETFs are valued at the closing bid and would be categorized as Level 1 in the hierarchy. In the event there was no closing bid, ETFs may be valued by another method that the Board believes reflects fair value in accordance with the Board's fair value pricing policies and may be categorized as Level 2 in the hierarchy.
Investments in open-end mutual funds, including the Fidelity Central Funds, are valued at their closing net asset value (NAV) each business day and are categorized as Level 1 in the hierarchy.
Changes in valuation techniques may result in transfers in or out of an assigned level within the disclosure hierarchy. The aggregate value of investments by input level as of July 31, 2018 is included at the end of the Fund's Schedule of Investments.
Foreign Currency. The Fund may use foreign currency contracts to facilitate transactions in foreign-denominated securities. Gains and losses from these transactions may arise from changes in the value of the foreign currency or if the counterparties do not perform under the contracts' terms.
Foreign-denominated assets, including investment securities, and liabilities are translated into U.S. dollars at the exchange rates at period end. Purchases and sales of investment securities, income and dividends received and expenses denominated in foreign currencies are translated into U.S. dollars at the exchange rate in effect on the transaction date.
The effects of exchange rate fluctuations on investments are included with the net realized and unrealized gain (loss) on investment securities. Other foreign currency transactions resulting in realized and unrealized gain (loss) are disclosed separately.
Investment Transactions and Income. For financial reporting purposes, the Fund's investment holdings and NAV include trades executed through the end of the last business day of the period. The NAV per share for processing shareholder transactions is calculated as of the close of business of the New York Stock Exchange (NYSE), normally 4:00 p.m. Eastern time and includes trades executed through the end of the prior business day. Gains and losses on securities sold are determined on the basis of identified cost and include proceeds received from litigation. Dividend income is recorded on the ex-dividend date, except for certain dividends from foreign securities where the ex-dividend date may have passed, which are recorded as soon as the Fund is informed of the ex-dividend date. Non-cash dividends included in dividend income, if any, are recorded at the fair market value of the securities received. Income and capital gain distributions from Fidelity Central Funds, if any, are recorded on the ex-dividend date. Certain distributions received by the Fund represent a return of capital or capital gain. The Fund determines the components of these distributions subsequent to the ex-dividend date, based upon receipt of tax filings or other correspondence relating to the underlying investment. These distributions are recorded as a reduction of cost of investments and/or as a realized gain. Investment income is recorded net of foreign taxes withheld where recovery of such taxes is uncertain.
Class Allocations and Expenses. Investment income, realized and unrealized capital gains and losses, common expenses of the Fund, and certain fund-level expense reductions, if any, are allocated daily on a pro-rata basis to each class based on the relative net assets of each class to the total net assets of the Fund. Each class differs with respect to transfer agent and distribution and service plan fees incurred. Certain expense reductions may also differ by class. For the reporting period, the allocated portion of income and expenses to each class as a percent of its average net assets may vary due to the timing of recording these transactions in relation to fluctuating net assets of the classes. Expenses directly attributable to a fund are charged to that fund. Expenses attributable to more than one fund are allocated among the respective funds on the basis of relative net assets or other appropriate methods. Expense estimates are accrued in the period to which they relate and adjustments are made when actual amounts are known.
Income Tax Information and Distributions to Shareholders. Each year, the Fund intends to qualify as a regulated investment company under Subchapter M of the Internal Revenue Code, including distributing substantially all of its taxable income and realized gains. As a result, no provision for U.S. Federal income taxes is required. As of July 31, 2018, the Fund did not have any unrecognized tax benefits in the financial statements; nor is the Fund aware of any tax positions for which it is reasonably possible that the total amounts of unrecognized tax benefits will significantly change in the next twelve months. The Fund files a U.S. federal tax return, in addition to state and local tax returns as required. The Fund's federal income tax returns are subject to examination by the Internal Revenue Service (IRS) for a period of three fiscal years after they are filed. State and local tax returns may be subject to examination for an additional fiscal year depending on the jurisdiction. Foreign taxes are provided for based on the Fund's understanding of the tax rules and rates that exist in the foreign markets in which it invests.
Distributions are declared and recorded on the ex-dividend date. Income and capital gain distributions are declared separately for each class. Income and capital gain distributions are determined in accordance with income tax regulations, which may differ from GAAP. In addition, the Fund claimed a portion of the payment made to redeeming shareholders as a distribution for income tax purposes.
Capital accounts within the financial statements are adjusted for permanent book-tax differences. These adjustments have no impact on net assets or the results of operations. Capital accounts are not adjusted for temporary book-tax differences which will reverse in a subsequent period.
Book-tax differences are primarily due to foreign currency transactions, redemptions in kind, partnerships, net operating losses and losses deferred due to wash sales.
As of period end, the cost and unrealized appreciation (depreciation) in securities, and derivatives if applicable, for federal income tax purposes were as follows:
| Gross unrealized appreciation | $1,032,044,061 |
| Gross unrealized depreciation | (111,085,933) |
| Net unrealized appreciation (depreciation) | $920,958,128 |
| Tax Cost | $3,866,740,864 |
The tax-based components of distributable earnings as of period end were as follows:
| Undistributed ordinary income | $178,562,080 |
| Undistributed long-term capital gain | $248,608,767 |
| Net unrealized appreciation (depreciation) on securities and other investments | $917,019,558 |
The tax character of distributions paid was as follows:
| | July 31, 2018 | July 31, 2017 |
| Ordinary Income | $18,559,818 | $ - |
| Long-term Capital Gains | 218,102,797 | 17,131,591 |
| Total | $236,662,615 | $ 17,131,591 |
Short-Term Trading (Redemption) Fees. Shares held by investors in the Fund less than 90 days may have been subject to a redemption fee equal to 1.50% of the NAV of shares redeemed. All redemption fees, which reduce the proceeds of the shareholder redemption, are retained by the Fund and accounted for as an addition to paid in capital. In November 2017, the Board of Trustees approved the elimination of these redemption fees effective December 18, 2017.
Restricted Securities. The Fund may invest in securities that are subject to legal or contractual restrictions on resale. These securities generally may be resold in transactions exempt from registration or to the public if the securities are registered. Disposal of these securities may involve time-consuming negotiations and expense, and prompt sale at an acceptable price may be difficult. Information regarding restricted securities is included at the end of the Fund's Schedule of Investments.
4. Purchases and Sales of Investments.
Purchases and sales of securities, other than short-term securities and in-kind transactions, aggregated $4,636,714,186 and $4,111,567,021, respectively.
Redemptions In-Kind. During the period, 3,806,167 shares of the Fund held by unaffiliated entities were redeemed in-kind for investments and cash, with a value of $99,242,171. The net realized gain of $30,767,545 on investments delivered through the in-kind redemptions is included in the accompanying Statement of Operations. The amount of the redemptions is included in share transactions activity shown in the accompanying Statement of Changes in Net Assets as well as the Notes to Financial Statements. The Fund recognized no gain or loss for federal income tax purposes.
5. Fees and Other Transactions with Affiliates.
Management Fee. Fidelity Management & Research Company (the investment adviser) and its affiliates provide the Fund with investment management related services for which the Fund pays a monthly management fee. The management fee is the sum of an individual fund fee rate that is based on an annual rate of .45% of the Fund's average net assets and an annualized group fee rate that averaged .24% during the period. The group fee rate is based upon the average net assets of all the mutual funds advised by the investment adviser, including any mutual funds previously advised by the investment adviser that are currently advised by Fidelity SelectCo, LLC, an affiliate of the investment adviser. The group fee rate decreases as assets under management increase and increases as assets under management decrease. In addition, the management fee is subject to a performance adjustment (up to a maximum of +/- .20% of the Fund's average net assets over a 36 month performance period). The upward or downward adjustment to the management fee is based on the relative investment performance of Small Cap Growth as compared to its benchmark index, the Russell 2000 Growth Index, over the same 36 month performance period. For the reporting period, the total annual management fee rate, including the performance adjustment, was .81% of the Fund's average net assets. The performance adjustment included in the management fee rate may be higher or lower than the maximum performance adjustment rate due to the difference between the average net assets for the reporting and performance periods.
Distribution and Service Plan Fees. In accordance with Rule 12b-1 of the 1940 Act, the Fund has adopted separate Distribution and Service Plans for each class of shares. Certain classes pay Fidelity Distributors Corporation (FDC), an affiliate of the investment adviser, separate Distribution and Service Fees, each of which is based on an annual percentage of each class' average net assets. In addition, FDC may pay financial intermediaries for selling shares of the Fund and providing shareholder support services. For the period, the Distribution and Service Fee rates, total fees and amounts retained by FDC were as follows:
| | Distribution Fee | Service Fee | Total Fees | Retained by FDC |
| Class A | -% | .25% | $686,800 | $73,556 |
| Class M | .25% | .25% | 372,350 | 4,398 |
| Class C | .75% | .25% | 1,242,020 | 297,505 |
| | | | $2,301,170 | $375,459 |
Sales Load. FDC may receive a front-end sales charge of up to 5.75% for selling Class A shares and 3.50% for selling Class M shares, some of which is paid to financial intermediaries for selling shares of the Fund. Depending on the holding period, FDC may receive contingent deferred sales charges levied on Class A, Class M and Class C redemptions. The deferred sales charges are 1.00% for Class C shares, 1.00% for certain purchases of Class A shares and .25% for certain purchases of Class M shares.
For the period, sales charge amounts retained by FDC were as follows:
| | Retained by FDC |
| Class A | $116,202 |
| Class M | 10,533 |
| Class C(a) | 12,259 |
| | $138,994 |
(a) When Class C shares are initially sold, FDC pays commissions from its own resources to financial intermediaries through which the sales are made.
Transfer Agent Fees. Fidelity Investments Institutional Operations Company, Inc., (FIIOC), an affiliate of the investment adviser, is the transfer, dividend disbursing and shareholder servicing agent for each class of the Fund. FIIOC receives account fees and asset-based fees that vary according to the account size and type of account of the shareholders of the respective classes of the Fund except for Class Z. FIIOC receives an asset-based fee of Class Z's average net assets. FIIOC pays for typesetting, printing and mailing of shareholder reports, except proxy statements.
For the period, transfer agent fees for each class were as follows:
| | Amount | % of Class-Level Average Net Assets |
| Class A | $574,677 | .21 |
| Class M | 169,941 | .23 |
| Class C | 270,078 | .22 |
| Small Cap Growth | 4,981,645 | .17 |
| Class I | 1,063,279 | .19 |
| Class Z | 34,619 | .05 |
| | $7,094,239 | |
Accounting and Security Lending Fees. Fidelity Service Company, Inc. (FSC), an affiliate of the investment adviser, maintains the Fund's accounting records. The accounting fee is based on the level of average net assets for each month. Under a separate contract, FSC administers the security lending program. The security lending fee is based on the number and duration of lending transactions. For the period, the fees were equivalent to an annual rate of .03%.
Brokerage Commissions. The Fund placed a portion of its portfolio transactions with brokerage firms which are affiliates of the investment adviser. Brokerage commissions are included in net realized gain (loss) and change in net unrealized appreciation (depreciation) in the Statement of Operations. The commissions paid to these affiliated firms were $178,977 for the period.
Interfund Lending Program. Pursuant to an Exemptive Order issued by the SEC, the Fund, along with other registered investment companies having management contracts with Fidelity Management & Research Company (FMR) or other affiliated entities of FMR, may participate in an interfund lending program. This program provides an alternative credit facility allowing the funds to borrow from, or lend money to, other participating affiliated funds. At period end, there were no interfund loans outstanding. The Fund's activity in this program during the period for which loans were outstanding was as follows:
| Borrower or Lender | Average Loan Balance | Weighted Average Interest Rate | Interest Expense |
| Borrower | $16,932,143 | 1.63% | $5,356 |
Interfund Trades. The Fund may purchase from or sell securities to other Fidelity Funds under procedures adopted by the Board. The procedures have been designed to ensure these interfund trades are executed in accordance with Rule 17a-7 of the 1940 Act. Interfund trades are included within the respective purchases and sales amounts shown in the Purchases and Sales of Investments note.
Prior Fiscal Year Redemptions In-Kind. During the prior period, 3,120,161 shares of the Fund held by an affiliated entity were redeemed in kind for investments and cash with a value of $74,384,639. The Fund had a net realized gain of $18,817,235 on investments delivered through in-kind redemptions. The amount of in-kind redemptions is included in share transactions in the accompanying Statement of Changes in Net Assets as well as the Notes to Financial Statements. The Fund recognized no gain or loss for federal income tax purposes.
Other. During the period, the investment adviser reimbursed the Fund for certain losses in the amount of $1,426.
6. Committed Line of Credit.
The Fund participates with other funds managed by the investment adviser or an affiliate in a $4.25 billion credit facility (the "line of credit") to be utilized for temporary or emergency purposes to fund shareholder redemptions or for other short-term liquidity purposes. The Fund has agreed to pay commitment fees on its pro-rata portion of the line of credit, which amounted to $10,750 and is reflected in Miscellaneous expenses on the Statement of Operations. During the period, the Fund did not borrow on this line of credit.
7. Security Lending.
The Fund lends portfolio securities through a lending agent from time to time in order to earn additional income. For equity securities, a lending agent is used and may loan securities to certain qualified borrowers, including Fidelity Capital Markets (FCM), a broker-dealer affiliated with the Fund. On the settlement date of the loan, the Fund receives collateral (in the form of U.S. Treasury obligations, letters of credit and/or cash) against the loaned securities and maintains collateral in an amount not less than 100% of the market value of the loaned securities during the period of the loan. The market value of the loaned securities is determined at the close of business of the Fund and any additional required collateral is delivered to the Fund on the next business day. The Fund or borrower may terminate the loan at any time, and if the borrower defaults on its obligation to return the securities loaned because of insolvency or other reasons, the Fund may apply collateral received from the borrower against the obligation. The Fund may experience delays and costs in recovering the securities loaned. Any cash collateral received is invested in the Fidelity Securities Lending Cash Central Fund. The value of loaned securities and cash collateral at period end are disclosed on the Fund's Statement of Assets and Liabilities. The value of securities loaned to FCM at period end was $7,727,847. Security lending income represents the income earned on investing cash collateral, less rebates paid to borrowers and any lending agent fees associated with the loan, plus any premium payments received for lending certain types of securities. Security lending income is presented in the Statement of Operations as a component of income from Fidelity Central Funds and includes $355,119 from securities loaned to FCM.
8. Expense Reductions.
Commissions paid to certain brokers with whom the investment adviser, or its affiliates, places trades on behalf of the Fund include an amount in addition to trade execution, which may be rebated back to the Fund to offset certain expenses. This amount totaled $380,256 for the period. In addition, through arrangements with the Fund's custodian, credits realized as a result of certain uninvested cash balances were used to reduce the Fund's expenses. During the period, these credits reduced the Fund's custody expenses by $882.
In addition, during the period the investment adviser reimbursed and/or waived a portion of fund-level operating expenses in the amount of $37,828.
9. Distributions to Shareholders.
Distributions to shareholders of each class were as follows:
| | Year ended
July 31, 2018 | Year ended
July 31, 2017 |
| From net realized gain | | |
| Class A | $16,634,776 | $1,450,853 |
| Class M | 4,795,381 | 443,203 |
| Class C | 8,085,052 | 670,953 |
| Small Cap Growth | 173,515,943 | 13,079,834 |
| Class I | 31,458,120 | 1,486,748 |
| Class Z | 2,173,343 | – |
| Total | $236,662,615 | $17,131,591 |
10. Share Transactions.
Share transactions for each class were as follows and may contain automatic conversions between classes or exchanges between affiliated funds:
| | Shares | Shares | Dollars | Dollars |
| | Year ended July 31, 2018 | Year ended July 31, 2017(a) | Year ended July 31, 2018 | Year ended July 31, 2017(a) |
| Class A | | | | |
| Shares sold | 3,599,713 | 5,020,720 | $88,330,995 | $104,451,830 |
| Reinvestment of distributions | 737,094 | 72,980 | 16,518,361 | 1,418,726 |
| Shares redeemed | (2,350,141) | (4,804,338) | (58,390,054) | (100,455,311) |
| Net increase (decrease) | 1,986,666 | 289,362 | $46,459,302 | $5,415,245 |
| Class M | | | | |
| Shares sold | 577,387 | 722,906 | $13,785,910 | $14,585,563 |
| Reinvestment of distributions | 219,933 | 23,093 | 4,778,389 | 437,379 |
| Shares redeemed | (556,511) | (740,353) | (13,344,376) | (14,879,815) |
| Net increase (decrease) | 240,809 | 5,646 | $5,219,923 | $143,127 |
| Class C | | | | |
| Shares sold | 1,485,229 | 1,684,413 | $32,475,020 | $31,979,652 |
| Reinvestment of distributions | 394,045 | 36,440 | 7,927,935 | 645,354 |
| Shares redeemed | (1,132,670) | (1,001,342) | (25,169,389) | (18,971,580) |
| Net increase (decrease) | 746,604 | 719,511 | $15,233,566 | $13,653,426 |
| Small Cap Growth | | | | |
| Shares sold | 40,826,489 | 46,489,671 | $1,050,416,894 | $1,008,614,407 |
| Reinvestment of distributions | 7,124,344 | 624,373 | 166,042,374 | 12,562,394 |
| Shares redeemed | (31,622,132)(b) | (28,815,440)(c) | (815,066,882)(b) | (638,181,914)(c) |
| Net increase (decrease) | 16,328,701 | 18,298,604 | $401,392,386 | $382,994,887 |
| Class I | | | | |
| Shares sold | 14,717,864 | 11,204,169 | $373,830,212 | $245,745,969 |
| Reinvestment of distributions | 1,279,506 | 68,251 | 29,928,913 | 1,376,613 |
| Shares redeemed | (8,645,418) | (3,191,470) | (225,106,522) | (69,277,095) |
| Net increase (decrease) | 7,351,952 | 8,080,950 | $178,652,603 | $177,845,487 |
| Class Z | | | | |
| Shares sold | 4,877,377 | 782,917 | $125,972,662 | $18,185,267 |
| Reinvestment of distributions | 72,161 | – | 1,697,869 | – |
| Shares redeemed | (1,090,733) | (11,517) | (28,900,593) | (271,781) |
| Net increase (decrease) | 3,858,805 | 771,400 | $98,769,938 | $17,913,486 |
(a) Share transactions for Class Z are for the period February 1, 2017 (commencement of sale of shares) to July 31, 2018.
(b) Amount includes in-kind redemptions (see the Redemptions In-Kind note for additional details).
(c) Amount includes in-kind redemptions (see the Prior Fiscal Year Redemptions In-Kind note for additional details).
11. Other.
The Fund's organizational documents provide former and current trustees and officers with a limited indemnification against liabilities arising in connection with the performance of their duties to the Fund. In the normal course of business, the Fund may also enter into contracts that provide general indemnifications. The Fund's maximum exposure under these arrangements is unknown as this would be dependent on future claims that may be made against the Fund. The risk of material loss from such claims is considered remote.
Report of Independent Registered Public Accounting Firm
To the Board of Trustees of Fidelity Securities Fund and Shareholders of Fidelity Small Cap Growth Fund:
Opinion on the Financial Statements
We have audited the accompanying statement of assets and liabilities, including the schedule of investments, of Fidelity Small Cap Growth Fund (one of the funds constituting Fidelity Securities Fund, referred to hereafter as the "Fund") as of July 31, 2018, the related statement of operations for the year ended July 31, 2018, the statement of changes in net assets for each of the two years in the period ended July 31, 2018, including the related notes, and the financial highlights for each of the periods indicated therein (collectively referred to as the “financial statements”). In our opinion, the financial statements present fairly, in all material respects, the financial position of the Fund as of July 31, 2018, the results of its operations for the year then ended, the changes in its net assets for each of the two years in the period ended July 31, 2018 and the financial highlights for the periods indicated therein in conformity with accounting principles generally accepted in the United States of America.
Basis for Opinion
These financial statements are the responsibility of the Fund’s management. Our responsibility is to express an opinion on the Fund’s financial statements based on our audits. We are a public accounting firm registered with the Public Company Accounting Oversight Board (United States) (“PCAOB”) and are required to be independent with respect to the Fund in accordance with the U.S. federal securities laws and the applicable rules and regulations of the Securities and Exchange Commission and the PCAOB.
We conducted our audits of these financial statements in accordance with the standards of the PCAOB. Those standards require that we plan and perform the audit to obtain reasonable assurance about whether the financial statements are free of material misstatement, whether due to error or fraud.
Our audits included performing procedures to assess the risks of material misstatement of the financial statements, whether due to error or fraud, and performing procedures that respond to those risks. Such procedures included examining, on a test basis, evidence regarding the amounts and disclosures in the financial statements. Our audits also included evaluating the accounting principles used and significant estimates made by management, as well as evaluating the overall presentation of the financial statements. Our procedures included confirmation of securities owned as of July 31, 2018 by correspondence with the custodian and brokers; when replies were not received from brokers, we performed other auditing procedures. We believe that our audits provide a reasonable basis for our opinion.
PricewaterhouseCoopers LLP
Boston, Massachusetts
September 14, 2018
We have served as the auditor of one or more investment companies in the Fidelity group of funds since 1932.
Trustees and Officers
The Trustees, Members of the Advisory Board (if any), and officers of the trust and fund, as applicable, are listed below. The Board of Trustees governs the fund and is responsible for protecting the interests of shareholders. The Trustees are experienced executives who meet periodically throughout the year to oversee the fund's activities, review contractual arrangements with companies that provide services to the fund, oversee management of the risks associated with such activities and contractual arrangements, and review the fund's performance. Except for Jonathan Chiel, each of the Trustees oversees 286 funds. Mr. Chiel oversees 150 funds.
The Trustees hold office without limit in time except that (a) any Trustee may resign; (b) any Trustee may be removed by written instrument, signed by at least two-thirds of the number of Trustees prior to such removal; (c) any Trustee who requests to be retired or who has become incapacitated by illness or injury may be retired by written instrument signed by a majority of the other Trustees; and (d) any Trustee may be removed at any special meeting of shareholders by a two-thirds vote of the outstanding voting securities of the trust. Each Trustee who is not an interested person (as defined in the 1940 Act) of the trust and the fund is referred to herein as an Independent Trustee. Each Independent Trustee shall retire not later than the last day of the calendar year in which his or her 75th birthday occurs. The Independent Trustees may waive this mandatory retirement age policy with respect to individual Trustees. Officers and Advisory Board Members hold office without limit in time, except that any officer or Advisory Board Member may resign or may be removed by a vote of a majority of the Trustees at any regular meeting or any special meeting of the Trustees. Except as indicated, each individual has held the office shown or other offices in the same company for the past five years.
The fund’s Statement of Additional Information (SAI) includes more information about the Trustees. To request a free copy, call Fidelity at 1-877-208-0098.
Experience, Skills, Attributes, and Qualifications of the Trustees. The Governance and Nominating Committee has adopted a statement of policy that describes the experience, qualifications, attributes, and skills that are necessary and desirable for potential Independent Trustee candidates (Statement of Policy). The Board believes that each Trustee satisfied at the time he or she was initially elected or appointed a Trustee, and continues to satisfy, the standards contemplated by the Statement of Policy. The Governance and Nominating Committee also engages professional search firms to help identify potential Independent Trustee candidates who have the experience, qualifications, attributes, and skills consistent with the Statement of Policy. From time to time, additional criteria based on the composition and skills of the current Independent Trustees, as well as experience or skills that may be appropriate in light of future changes to board composition, business conditions, and regulatory or other developments, have also been considered by the professional search firms and the Governance and Nominating Committee. In addition, the Board takes into account the Trustees' commitment and participation in Board and committee meetings, as well as their leadership of standing and ad hoc committees throughout their tenure.
In determining that a particular Trustee was and continues to be qualified to serve as a Trustee, the Board has considered a variety of criteria, none of which, in isolation, was controlling. The Board believes that, collectively, the Trustees have balanced and diverse experience, qualifications, attributes, and skills, which allow the Board to operate effectively in governing the fund and protecting the interests of shareholders. Information about the specific experience, skills, attributes, and qualifications of each Trustee, which in each case led to the Board's conclusion that the Trustee should serve (or continue to serve) as a trustee of the fund, is provided below.
Board Structure and Oversight Function. James C. Curvey is an interested person and currently serves as Chairman. The Trustees have determined that an interested Chairman is appropriate and benefits shareholders because an interested Chairman has a personal and professional stake in the quality and continuity of services provided to the fund. Independent Trustees exercise their informed business judgment to appoint an individual of their choosing to serve as Chairman, regardless of whether the Trustee happens to be independent or a member of management. The Independent Trustees have determined that they can act independently and effectively without having an Independent Trustee serve as Chairman and that a key structural component for assuring that they are in a position to do so is for the Independent Trustees to constitute a substantial majority for the Board. The Independent Trustees also regularly meet in executive session. Ned C. Lautenbach serves as Chairman of the Independent Trustees and as such (i) acts as a liaison between the Independent Trustees and management with respect to matters important to the Independent Trustees and (ii) with management prepares agendas for Board meetings.
Fidelity® funds are overseen by different Boards of Trustees. The fund's Board oversees Fidelity's high income and certain equity funds, and other Boards oversee Fidelity's investment-grade bond, money market, asset allocation, and other equity funds. The asset allocation funds may invest in Fidelity® funds overseen by the fund's Board. The use of separate Boards, each with its own committee structure, allows the Trustees of each group of Fidelity® funds to focus on the unique issues of the funds they oversee, including common research, investment, and operational issues. On occasion, the separate Boards establish joint committees to address issues of overlapping consequences for the Fidelity® funds overseen by each Board.
The Trustees operate using a system of committees to facilitate the timely and efficient consideration of all matters of importance to the Trustees, the fund, and fund shareholders and to facilitate compliance with legal and regulatory requirements and oversight of the fund's activities and associated risks. The Board, acting through its committees, has charged FMR and its affiliates with (i) identifying events or circumstances the occurrence of which could have demonstrably adverse effects on the fund's business and/or reputation; (ii) implementing processes and controls to lessen the possibility that such events or circumstances occur or to mitigate the effects of such events or circumstances if they do occur; and (iii) creating and maintaining a system designed to evaluate continuously business and market conditions in order to facilitate the identification and implementation processes described in (i) and (ii) above. Because the day-to-day operations and activities of the fund are carried out by or through FMR, its affiliates, and other service providers, the fund's exposure to risks is mitigated but not eliminated by the processes overseen by the Trustees. While each of the Board's committees has responsibility for overseeing different aspects of the fund's activities, oversight is exercised primarily through the Operations, Audit, and Compliance Committees. In addition, the Independent Trustees have worked with Fidelity to enhance the Board's oversight of investment and financial risks, legal and regulatory risks, technology risks, and operational risks, including the development of additional risk reporting to the Board. Appropriate personnel, including but not limited to the fund's Chief Compliance Officer (CCO), FMR's internal auditor, the independent accountants, the fund's Treasurer and portfolio management personnel, make periodic reports to the Board's committees, as appropriate, including an annual review of Fidelity's risk management program for the Fidelity® funds. The responsibilities of each standing committee, including their oversight responsibilities, are described further under "Standing Committees of the Trustees."
Interested Trustees*:
Correspondence intended for a Trustee who is an interested person may be sent to Fidelity Investments, 245 Summer Street, Boston, Massachusetts 02210.
Name, Year of Birth; Principal Occupations and Other Relevant Experience+
Jonathan Chiel (1957)
Year of Election or Appointment: 2016
Trustee
Mr. Chiel also serves as Trustee of other Fidelity® funds. Mr. Chiel is Executive Vice President and General Counsel for FMR LLC (diversified financial services company, 2012-present). Previously, Mr. Chiel served as general counsel (2004-2012) and senior vice president and deputy general counsel (2000-2004) for John Hancock Financial Services; a partner with Choate, Hall & Stewart (1996-2000) (law firm); and an Assistant United States Attorney for the United States Attorney’s Office of the District of Massachusetts (1986-95), including Chief of the Criminal Division (1993-1995). Mr. Chiel is a director on the boards of the Boston Bar Foundation and the Maimonides School.
James C. Curvey (1935)
Year of Election or Appointment: 2007
Trustee
Chairman of the Board of Trustees
Mr. Curvey also serves as Trustee of other Fidelity® funds. Mr. Curvey is Vice Chairman (2007-present) and Director of FMR LLC (diversified financial services company). In addition, Mr. Curvey is an Overseer Emeritus for the Boston Symphony Orchestra, a Director of Artis-Naples, and a Trustee of Brewster Academy in Wolfeboro, New Hampshire. Previously, Mr. Curvey served as a Director of Fidelity Research & Analysis Co. (investment adviser firm, 2009-2018), Director of Fidelity Investments Money Management, Inc. (investment adviser firm, 2009-2014) and a Director of FMR and FMR Co., Inc. (investment adviser firms, 2007-2014).
Charles S. Morrison (1960)
Year of Election or Appointment: 2014
Trustee
Mr. Morrison also serves as Trustee of other funds. He serves as President of Fidelity SelectCo, LLC (investment adviser firm, 2017-present) and Fidelity Management & Research Company (FMR) (investment adviser firm, 2016-present), a Director of Fidelity Investments Money Management, Inc. (FIMM) (investment adviser firm, 2014-present), Director of Fidelity SelectCo, LLC (investment adviser firm, 2014-present), President, Asset Management (2014-present), and is an employee of Fidelity Investments. Previously, Mr. Morrison served as Vice President of Fidelity's Fixed Income and Asset Allocation Funds (2012-2014), President, Fixed Income (2011-2014), Vice President of Fidelity's Money Market Funds (2005-2009), President, Money Market Group Leader of FMR (investment adviser firm, 2009), and Senior Vice President, Money Market Group of FMR (2004-2009). Mr. Morrison also served as Vice President of Fidelity's Bond Funds (2002-2005), certain Balanced Funds (2002-2005), and certain Asset Allocation Funds (2002-2007), and as Senior Vice President (2002-2005) of Fidelity's Bond Division.
* Determined to be an “Interested Trustee” by virtue of, among other things, his or her affiliation with the trust or various entities under common control with FMR.
+ The information includes the Trustee's principal occupation during the last five years and other information relating to the experience, attributes, and skills relevant to the Trustee's qualifications to serve as a Trustee, which led to the conclusion that the Trustee should serve as a Trustee for the fund.
Independent Trustees:
Correspondence intended for an Independent Trustee may be sent to Fidelity Investments, P.O. Box 55235, Boston, Massachusetts 02205-5235.
Name, Year of Birth; Principal Occupations and Other Relevant Experience+
Dennis J. Dirks (1948)
Year of Election or Appointment: 2005
Trustee
Mr. Dirks also serves as Trustee of other Fidelity® funds. Prior to his retirement in May 2003, Mr. Dirks was Chief Operating Officer and a member of the Board of The Depository Trust & Clearing Corporation (DTCC). He also served as President, Chief Operating Officer, and Board member of The Depository Trust Company (DTC) and President and Board member of the National Securities Clearing Corporation (NSCC). In addition, Mr. Dirks served as Chief Executive Officer and Board member of the Government Securities Clearing Corporation, Chief Executive Officer and Board member of the Mortgage-Backed Securities Clearing Corporation, as a Trustee and a member of the Finance Committee of Manhattan College (2005-2008), as a Trustee and a member of the Finance Committee of AHRC of Nassau County (2006-2008), as a member of the Independent Directors Council (IDC) Governing Council (2010-2015), and as a member of the Board of Directors for The Brookville Center for Children’s Services, Inc. (2009-2017). Mr. Dirks is a member of the Finance Committee (2016-present), Board of Directors (2017-present) and Board of Trustees (2018-present) and is Treasurer (2018-present) of the Asolo Repertory Theatre.
Donald F. Donahue (1950)
Year of Election or Appointment: 2018
Trustee
Mr. Donahue also serves as a Trustee of other Fidelity® funds. Mr. Donahue is President and Chief Executive Officer of Miranda Partners, LLC (risk consulting for the financial services industry, 2012-present). Previously, Mr. Donahue served as a Member of the Advisory Board of certain Fidelity® funds (2015-2018) and Chief Executive Officer (2006-2012), Chief Operating Officer (2003-2006), and Managing Director, Customer Marketing and Development (1999-2003) of The Depository Trust & Clearing Corporation (financial markets infrastructure). Mr. Donahue serves as a Member (2007-present) and Co-Chairman (2016-present) of the Board of Directors of United Way of New York, Member of the Board of Directors of NYC Leadership Academy (2012-present) and Member of the Board of Advisors of Ripple Labs, Inc. (financial services, 2015-present). He also served as Chairman (2010-2012) and Member of the Board of Directors (2012-2013) of Omgeo, LLC (financial services), Treasurer of United Way of New York (2012-2016), and Member of the Board of Directors of XBRL US (financial services non-profit, 2009-2012) and the International Securities Services Association (2009-2012).
Alan J. Lacy (1953)
Year of Election or Appointment: 2008
Trustee
Mr. Lacy also serves as Trustee of other Fidelity® funds. Mr. Lacy serves as a Director of Bristol-Myers Squibb Company (global pharmaceuticals, 2008-present). He is a Trustee of the California Chapter of The Nature Conservancy (2015-present) and a Director of the Center for Advanced Study in the Behavioral Sciences at Stanford University (2015-present). In addition, Mr. Lacy served as Senior Adviser (2007-2014) of Oak Hill Capital Partners, L.P. (private equity) and also served as Chief Executive Officer (2005) and Vice Chairman (2005-2006) of Sears Holdings Corporation (retail) and Chief Executive Officer and Chairman of the Board of Sears, Roebuck and Co. (retail, 2000-2005). Previously, Mr. Lacy served as Chairman (2014-2017) and a member (2010-2017) of the Board of Directors of Dave & Buster’s Entertainment, Inc. (restaurant and entertainment complexes), as Chairman (2008-2011) and a member (2006-2015) of the Board of Trustees of the National Parks Conservation Association, and as a member of the Board of Directors for The Hillman Companies, Inc. (hardware wholesalers, 2010-2014), Earth Fare, Inc. (retail grocery, 2010-2014), and The Western Union Company (global money transfer, 2006-2011).
Ned C. Lautenbach (1944)
Year of Election or Appointment: 2000
Trustee
Chairman of the Independent Trustees
Mr. Lautenbach also serves as Trustee of other Fidelity® funds. Mr. Lautenbach currently serves as Vice Chair of the Board of Governors, State University System of Florida (2013-present) and is a member of the Council on Foreign Relations (1994-present). He is also a member and has most recently served as Chairman of the Board of Directors of Artis-Naples (2012-present). Previously, Mr. Lautenbach served as a member and then Lead Director of the Board of Directors of Eaton Corporation (diversified industrial, 1997-2016). He was also a Partner and Advisory Partner at Clayton, Dubilier & Rice, LLC (private equity investment, 1998-2010), as well as a Director of Sony Corporation (2006-2007). In addition, Mr. Lautenbach also had a 30-year career with IBM (technology company) during which time he served as Senior Vice President and a member of the Corporate Executive Committee (1968-1998).
Joseph Mauriello (1944)
Year of Election or Appointment: 2008
Trustee
Mr. Mauriello also serves as Trustee of other Fidelity® funds. Prior to his retirement in January 2006, Mr. Mauriello served in numerous senior management positions including Deputy Chairman and Chief Operating Officer (2004-2005), and Vice Chairman of Financial Services (2002-2004) of KPMG LLP US (professional services, 1965-2005). Mr. Mauriello currently serves as a member of the Board of Directors of XL Group plc. (global insurance and re-insurance, 2006-present) and the Independent Directors Council (IDC) Governing Council (2015-present). Previously, Mr. Mauriello served as a Director of the Hamilton Funds of the Bank of New York (2006-2007) and of Arcadia Resources Inc. (health care services and products, 2007-2012).
Cornelia M. Small (1944)
Year of Election or Appointment: 2005
Trustee
Ms. Small also serves as Trustee of other Fidelity® funds. Ms. Small is a member of the Board of Directors (2009-present) and Chair of the Investment Committee (2010-present) of the Teagle Foundation. Ms. Small also serves on the Investment Committee of the Berkshire Taconic Community Foundation (2008-present). Previously, Ms. Small served as Chairperson (2002-2008) and a member of the Investment Committee and Chairperson (2008-2012) and a member of the Board of Trustees of Smith College. In addition, Ms. Small served as Chief Investment Officer, Director of Global Equity Investments, and a member of the Board of Directors of Scudder, Stevens & Clark and Scudder Kemper Investments.
Garnett A. Smith (1947)
Year of Election or Appointment: 2018
Trustee
Mr. Smith also serves as Trustee of other Fidelity® funds. Prior to Mr. Smith's retirement, he served as Chairman and Chief Executive Officer of Inbrand Corp. (manufacturer of personal absorbent products, 1990-1997). He also served as President (1986-1990) of Inbrand Corp. Prior to his employment with Inbrand Corp., he was employed by a retail fabric chain and North Carolina National Bank. In addition, Mr. Smith served as a Member of the Advisory Board of certain Fidelity® funds (2012-2013) and as a board member of the Jackson Hole Land Trust (2009-2012).
David M. Thomas (1949)
Year of Election or Appointment: 2008
Trustee
Mr. Thomas also serves as Trustee of other Fidelity® funds. Mr. Thomas serves as Non-Executive Chairman of the Board of Directors of Fortune Brands Home and Security (home and security products, 2011-present), as a member of the Board of Directors (2004-present) and Presiding Director (2013-present) of Interpublic Group of Companies, Inc. (marketing communication), and as a member of the Board of Trustees of the University of Florida (2013-present). Previously, Mr. Thomas served as Executive Chairman (2005-2006) and Chairman and Chief Executive Officer (2000-2005) of IMS Health, Inc. (pharmaceutical and healthcare information solutions), and a Director of Fortune Brands, Inc. (consumer products, 2000-2011).
+ The information includes the Trustee's principal occupation during the last five years and other information relating to the experience, attributes, and skills relevant to the Trustee's qualifications to serve as a Trustee, which led to the conclusion that the Trustee should serve as a Trustee for the fund.
Advisory Board Members and Officers:
Correspondence intended for a Member of the Advisory Board (if any) may be sent to Fidelity Investments, P.O. Box 55235, Boston, Massachusetts 02205-5235. Correspondence intended for an officer or Peter S. Lynch may be sent to Fidelity Investments, 245 Summer Street, Boston, Massachusetts 02210. Officers appear below in alphabetical order.
Name, Year of Birth; Principal Occupation
Peter S. Lynch (1944)
Year of Election or Appointment: 2003
Member of the Advisory Board
Mr. Lynch also serves as Member of the Advisory Board of other Fidelity® funds. Mr. Lynch is Vice Chairman and a Director of FMR (investment adviser firm) and FMR Co., Inc. (investment adviser firm). In addition, Mr. Lynch serves as a Trustee of Boston College and as the Chairman of the Inner-City Scholarship Fund. Previously, Mr. Lynch served on the Special Olympics International Board of Directors (1997-2006).
William S. Stavropoulos (1939)
Year of Election or Appointment: 2018
Member of the Advisory Board
Mr. Stavropoulos also serves as Member of the Advisory Board of other Fidelity® funds. Mr. Stavropoulos serves as President and Founder of the Michigan Baseball Foundation, the Great Lakes Loons (2007-present). Mr. Stavropoulos is Chairman Emeritus of the Board of Directors of The Dow Chemical Company, where he previously served in numerous senior management positions, including President, CEO (1995-2000; 2002-2004), Chairman of the Executive Committee (2000-2006), and as a member of the Board of Directors (1990-2006). Currently, Mr. Stavropoulos is Chairman of the Board of Directors of Univar Inc. (global distributor of commodity and specialty chemicals), a Director of Teradata Corporation (data warehousing and technology solutions), and a member of the Advisory Board for Metalmark Capital LLC (private equity investment, 2005-present). Mr. Stavropoulos is an operating advisor to Clayton, Dubilier & Rice, LLC (private equity investment). In addition, Mr. Stavropoulos is a member of the University of Notre Dame Advisory Council for the College of Science, a Trustee of the Rollin L. Gerstacker Foundation, and a Director of Artis-Naples in Naples, Florida. Previously, Mr. Stavropoulos served as Trustee of certain Fidelity® funds (2001-2018) and as a Director of Chemical Financial Corporation (bank holding company, 1993-2012) and Tyco International, Ltd. (multinational manufacturing and services, 2007-2012).
Carol B. Tomé (1957)
Year of Election or Appointment: 2018
Member of the Advisory Board
Ms. Tomé also serves as Member of the Advisory Board of other Fidelity® funds. Ms. Tomé is Chief Financial Officer (2001-present) and Executive Vice President of Corporate Services (2007-present) of The Home Depot, Inc. (home improvement retailer) and a Director (2003-present) and Chair of the Audit Committee (2004-present) of United Parcel Service, Inc. (package delivery and supply chain management). Previously, Ms. Tomé served as Trustee of certain Fidelity® funds (2017), Senior Vice President of Finance and Accounting/Treasurer (2000-2007) and Vice President and Treasurer (1995-2000) of The Home Depot, Inc. and Chair of the Board (2010-2012), Vice Chair of the Board (2009 and 2013), and a Director (2008-2013) of the Federal Reserve Bank of Atlanta. Ms. Tomé is also a director or trustee of many community and professional organizations.
Michael E. Wiley (1950)
Year of Election or Appointment: 2018
Member of the Advisory Board
Mr. Wiley also serves as Trustee or Member of the Advisory Board of other Fidelity® funds. Mr. Wiley serves as a Director of Andeavor Corporation (independent oil refiner and marketer, 2005-present), a Director of Andeavor Logistics LP (natural resources logistics, 2015-present), and a Director of Bill Barrett Corporation (exploration and production, 2005-present). In addition, Mr. Wiley also serves as a Director of Post Oak Bank (privately-held bank, 2004-present). Previously, Mr. Wiley served as a Trustee of other Fidelity® funds (2008-2013), as a Director of Asia Pacific Exploration Consolidated (international oil and gas exploration and production, 2008-2013), as a member of the Board of Trustees of the University of Tulsa (2000-2006; 2007-2010), as a Senior Energy Advisor of Katzenbach Partners, LLC (consulting, 2006-2007), as an Advisory Director of Riverstone Holdings (private investment), Chairman, President, and CEO of Baker Hughes, Inc. (oilfield services, 2000-2004), and as Director of Spinnaker Exploration Company (exploration and production, 2001-2005).
Elizabeth Paige Baumann (1968)
Year of Election or Appointment: 2017
Anti-Money Laundering (AML) Officer
Ms. Baumann also serves as AML Officer of other funds. She is Chief AML Officer (2012-present) and Senior Vice President (2014-present) of FMR LLC (diversified financial services company) and is an employee of Fidelity Investments. Previously, Ms. Baumann served as AML Officer of the funds (2012-2016), and Vice President (2007-2014) and Deputy Anti-Money Laundering Officer (2007-2012) of FMR LLC.
Marc R. Bryant (1966)
Year of Election or Appointment: 2015
Secretary and Chief Legal Officer (CLO)
Mr. Bryant also serves as Secretary and CLO of other funds. Mr. Bryant serves as CLO, Secretary, and Senior Vice President of Fidelity Management & Research Company (investment adviser firm, 2015-present) and FMR Co., Inc. (investment adviser firm, 2015-present); Secretary of Fidelity SelectCo, LLC (investment adviser firm, 2015-present) and Fidelity Investments Money Management, Inc. (investment adviser firm, 2015-present); and CLO of Fidelity Management & Research (Hong Kong) Limited and FMR Investment Management (UK) Limited (investment adviser firms, 2015-present) and Fidelity Management & Research (Japan) Limited (investment adviser firm, 2016-present). He is Senior Vice President and Deputy General Counsel of FMR LLC (diversified financial services company). Previously, Mr. Bryant served as Secretary and CLO of Fidelity Rutland Square Trust II (2010-2014) and Assistant Secretary of Fidelity's Fixed Income and Asset Allocation Funds (2013-2015). Prior to joining Fidelity Investments, Mr. Bryant served as a Senior Vice President and the Head of Global Retail Legal for AllianceBernstein L.P. (2006-2010), and as the General Counsel for ProFund Advisors LLC (2001-2006).
John J. Burke III (1964)
Year of Election or Appointment: 2018
Chief Financial Officer
Mr. Burke also serves as Chief Financial Officer of other funds. Mr. Burke serves as Head of Investment Operations for Fidelity Fund and Investment Operations (2018-present) and is an employee of Fidelity Investments (1998-present). Previously Mr. Burke served as head of Asset Management Investment Operations (2012-2018).
William C. Coffey (1969)
Year of Election or Appointment: 2009
Assistant Secretary
Mr. Coffey also serves as Assistant Secretary of other funds. He is Senior Vice President and Deputy General Counsel of FMR LLC (diversified financial services company, 2010-present), and is an employee of Fidelity Investments. Previously, Mr. Coffey served as Vice President and Associate General Counsel of FMR LLC (2005-2009).
Timothy M. Cohen (1969)
Year of Election or Appointment: 2018
Vice President
Mr. Cohen also serves as Vice President of other funds. Mr. Cohen serves as Co-Head of Global Equity Research (2016-present), a Director of Fidelity Management & Research (Japan) Limited (investment adviser firm, 2016-present), and is an employee of Fidelity Investments. Previously, Mr. Cohen served as Chief Investment Officer - Equity and a Director of Fidelity Management & Research (U.K.) Inc. (investment adviser firm, 2013-2015) and as a Director of Fidelity Management & Research (Hong Kong) Limited (investment adviser firm, 2017).
Jonathan Davis (1968)
Year of Election or Appointment: 2010
Assistant Treasurer
Mr. Davis also serves as Assistant Treasurer of other funds. Mr. Davis serves as Assistant Treasurer of FMR Capital, Inc. (2017-present) and is an employee of Fidelity Investments. Previously, Mr. Davis served as Vice President and Associate General Counsel of FMR LLC (diversified financial services company, 2003-2010).
Adrien E. Deberghes (1967)
Year of Election or Appointment: 2016
Assistant Treasurer
Mr. Deberghes also serves as an officer of other funds. He serves as Assistant Treasurer of FMR Capital, Inc. (2017-present), Executive Vice President of Fidelity Investments Money Management, Inc. (FIMM) (investment adviser firm, 2016-present), and is an employee of Fidelity Investments (2008-present). Previously, Mr. Deberghes served as President and Treasurer of certain Fidelity® funds (2013-2018). Prior to joining Fidelity Investments, Mr. Deberghes was Senior Vice President of Mutual Fund Administration at State Street Corporation (2007-2008), Senior Director of Mutual Fund Administration at Investors Bank & Trust (2005-2007), and Director of Finance for Dunkin' Brands (2000-2005). Previously, Mr. Deberghes served in other fund officer roles.
Laura M. Del Prato (1964)
Year of Election or Appointment: 2018
Assistant Treasurer
Ms. Del Prato also serves as an officer of other funds. Ms. Del Prato is an employee of Fidelity Investments (2017-present). Prior to joining Fidelity Investments, Ms. Del Prato served as a Managing Director and Treasurer of the JPMorgan Mutual Funds (2014-2017). Prior to JPMorgan, Ms. Del Prato served as a partner at Cohen Fund Audit Services (accounting firm, 2012-2013) and KPMG LLP (accounting firm, 2004-2012).
Colm A. Hogan (1973)
Year of Election or Appointment: 2016
Deputy Treasurer
Mr. Hogan also serves as an officer of other funds. Mr. Hogan serves as Assistant Treasurer of FMR Capital, Inc. (2017-present) and is an employee of Fidelity Investments (2005-present). Previously, Mr. Hogan served as Assistant Treasurer of certain Fidelity® funds (2016-2018).
Pamela R. Holding (1964)
Year of Election or Appointment: 2018
Vice President
Ms. Holding also serves as a Vice President of other funds. Ms. Holding serves as Co-Head of Global Equity Research (2018-present) and is an employee of Fidelity Investments (2013-present).
Chris Maher (1972)
Year of Election or Appointment: 2013
Assistant Treasurer
Mr. Maher serves as Assistant Treasurer of other funds. Mr. Maher is Vice President of Valuation Oversight, serves as Assistant Treasurer of FMR Capital, Inc. (2017-present), and is an employee of Fidelity Investments. Previously, Mr. Maher served as Vice President of Asset Management Compliance (2013), Vice President of the Program Management Group of FMR (investment adviser firm, 2010-2013), and Vice President of Valuation Oversight (2008-2010).
Rieco E. Mello (1969)
Year of Election or Appointment: 2017
Assistant Treasurer
Mr. Mello also serves as Assistant Treasurer of other funds. Mr. Mello serves as Assistant Treasurer of FMR Capital, Inc. (2017-present) and is an employee of Fidelity Investments (1995-present).
Kenneth B. Robins (1969)
Year of Election or Appointment: 2016
Chief Compliance Officer
Mr. Robins also serves as an officer of other funds. Mr. Robins serves as Compliance Officer of Fidelity Management & Research Company and FMR Co., Inc. (investment adviser firms, 2016-present) and is an employee of Fidelity Investments (2004-present). Previously, Mr. Robins served as Executive Vice President of Fidelity Investments Money Management, Inc. (investment adviser firm, 2013-2016) and served in other fund officer roles.
Stacie M. Smith (1974)
Year of Election or Appointment: 2016
President and Treasurer
Ms. Smith also serves as an officer of other funds. Ms. Smith serves as Assistant Treasurer of FMR Capital, Inc. (2017-present), is an employee of Fidelity Investments (2009-present), and has served in other fund officer roles. Prior to joining Fidelity Investments, Ms. Smith served as Senior Audit Manager of Ernst & Young LLP (accounting firm, 1996-2009). Previously, Ms. Smith served as Assistant Treasurer (2013-2018) and Deputy Treasurer (2013-2016) of certain Fidelity® funds.
Marc L. Spector (1972)
Year of Election or Appointment: 2016
Assistant Treasurer
Mr. Spector also serves as an officer of other funds. Mr. Spector serves as Assistant Treasurer of FMR Capital, Inc. (2017-present) and is an employee of Fidelity Investments (2016-present). Prior to joining Fidelity Investments, Mr. Spector served as Director at the Siegfried Group (accounting firm, 2013-2016), and prior to Siegfried Group as audit senior manager at Deloitte & Touche (accounting firm, 2005-2013).
Renee Stagnone (1975)
Year of Election or Appointment: 2016
Assistant Treasurer
Ms. Stagnone also serves as an officer of other funds. Ms. Stagnone serves as Assistant Treasurer of FMR Capital, Inc. (2017-present) and is an employee of Fidelity Investments (1997-present). Previously, Ms. Stagnone served as Deputy Treasurer of certain Fidelity® funds (2013-2016).
Shareholder Expense Example
As a shareholder of the Fund, you incur two types of costs: (1) transaction costs, including sales charges (loads) on purchase payments or redemption proceeds and (2) ongoing costs, including management fees, distribution and/or service (12b-1) fees and other Fund expenses. This Example is intended to help you understand your ongoing costs (in dollars) of investing in the Fund and to compare these costs with the ongoing costs of investing in other mutual funds.
The Example is based on an investment of $1,000 invested at the beginning of the period and held for the entire period (February 1, 2018 to July 31, 2018).
Actual Expenses
The first line of the accompanying table for each class of the Fund provides information about actual account values and actual expenses. You may use the information in this line, together with the amount you invested, to estimate the expenses that you paid over the period. Simply divide your account value by $1,000.00 (for example, an $8,600 account value divided by $1,000.00 = 8.6), then multiply the result by the number in the first line for a class of the Fund under the heading entitled "Expenses Paid During Period" to estimate the expenses you paid on your account during this period. A small balance maintenance fee of $12.00 that is charged once a year may apply for certain accounts with a value of less than $2,000. This fee is not included in the table below. If it was, the estimate of expenses you paid during the period would be higher, and your ending account value lower, by this amount. In addition, the Fund, as a shareholder in the underlying Fidelity Central Funds, will indirectly bear its pro-rata share of the fees and expenses incurred by the underlying Fidelity Central Funds. These fees and expenses are not included in the Fund's annualized expense ratio used to calculate the expense estimate in the table below.
Hypothetical Example for Comparison Purposes
The second line of the accompanying table for each class of the Fund provides information about hypothetical account values and hypothetical expenses based on a Class' actual expense ratio and an assumed rate of return of 5% per year before expenses, which is not the Class' actual return. The hypothetical account values and expenses may not be used to estimate the actual ending account balance or expenses you paid for the period. You may use this information to compare the ongoing costs of investing in the Fund and other funds. To do so, compare this 5% hypothetical example with the 5% hypothetical examples that appear in the shareholder reports of the other funds. A small balance maintenance fee of $12.00 that is charged once a year may apply for certain accounts with a value of less than $2,000. This fee is not included in the table below. If it was, the estimate of expenses you paid during the period would be higher, and your ending account value lower, by this amount. In addition, the Fund, as a shareholder in the underlying Fidelity Central Funds, will indirectly bear its pro-rata share of the fees and expenses incurred by the underlying Fidelity Central Funds. These fees and expenses are not included in the Fund's annualized expense ratio used to calculate the expense estimate in the table below.
Please note that the expenses shown in the table are meant to highlight your ongoing costs only and do not reflect any transaction costs. Therefore, the second line of the table is useful in comparing ongoing costs only, and will not help you determine the relative total costs of owning different funds. In addition, if these transactional costs were included, your costs would have been higher.
| | Annualized Expense Ratio-A | Beginning
Account Value
February 1, 2018 | Ending
Account Value
July 31, 2018 | Expenses Paid
During Period-B
February 1, 2018
to July 31, 2018 |
| Class A | 1.29% | | | |
| Actual | | $1,000.00 | $1,091.50 | $6.69 |
| Hypothetical-C | | $1,000.00 | $1,018.40 | $6.46 |
| Class M | 1.56% | | | |
| Actual | | $1,000.00 | $1,090.20 | $8.08 |
| Hypothetical-C | | $1,000.00 | $1,017.06 | $7.80 |
| Class C | 2.05% | | | |
| Actual | | $1,000.00 | $1,087.20 | $10.61 |
| Hypothetical-C | | $1,000.00 | $1,014.63 | $10.24 |
| Small Cap Growth | 1.01% | | | |
| Actual | | $1,000.00 | $1,092.90 | $5.24 |
| Hypothetical-C | | $1,000.00 | $1,019.79 | $5.06 |
| Class I | 1.02% | | | |
| Actual | | $1,000.00 | $1,092.60 | $5.29 |
| Hypothetical-C | | $1,000.00 | $1,019.74 | $5.11 |
| Class Z | .88% | | | |
| Actual | | $1,000.00 | $1,093.70 | $4.57 |
| Hypothetical-C | | $1,000.00 | $1,020.43 | $4.41 |
A Annualized expense ratio reflects expenses net of applicable fee waivers.
B Expenses are equal to each Class' annualized expense ratio, multiplied by the average account value over the period, multiplied by 181/365 (to reflect the one-half year period).
C 5% return per year before expenses
Distributions (Unaudited)
The Board of Trustees of Fidelity Small Cap Growth Fund voted to pay to shareholders of record at the opening of business on record date, the following distributions per share derived from capital gains realized from sales of portfolio securities:
| | Pay Date | Record Date | Capital Gains |
| Fidelity Small Cap Growth Fund | | | |
| Class A | 09/17/18 | 09/14/18 | $2.578 |
| Class M | 09/17/18 | 09/14/18 | $2.538 |
| Class C | 09/17/18 | 09/14/18 | $2.474 |
| Small Cap Growth | 09/17/18 | 09/14/18 | $2.621 |
| Class I | 09/17/18 | 09/14/18 | $2.618 |
| Class Z | 09/17/18 | 09/14/18 | $2.641 |
|
The fund hereby designates as a capital gain dividend with respect to the taxable year ended July 31, 2018, $294,774,478, or, if subsequently determined to be different, the net capital gain of such year.
Class A designates 39%, Class M designates 51%, Class C designates 95%, Small Cap Growth designates 31%, Class I designates 31%, and Class Z designates 28%, of the dividends distributed in December during the fiscal year as qualifying for the dividends–received deduction for corporate shareholders.
Class A designates 35%, Class M designates 45%, Class C designates 84%, Small Cap Growth designates 28%, Class I designates 28%, and Class Z designates 25%, of the dividends distributed in December during the fiscal year as amounts which may be taken into account as a dividend for purposes of the maximum rate under section 1(h)(11) of the Internal Revenue Code.
The fund will notify shareholders in January 2019 of amounts for use in preparing 2018 income tax returns.
Board Approval of Investment Advisory Contracts
Fidelity Small Cap Growth Fund
At its July 2018 meeting, the Board of Trustees, including the Independent Trustees (together, the Board), voted to continue the management contract with Fidelity Management & Research Company (FMR) and the sub-advisory agreements (together, the Advisory Contracts) for the fund for six months through January 31, 2019, in connection with the reunification of the Fidelity Equity High Income Funds Board, which oversees the fund, and the Sector Portfolios Board.
The Board considered that the approval of the fund's Advisory Contracts will not result in any changes in (i) the investment process or strategies employed in the management of the fund's assets; (ii) the fees and expenses paid by shareholders; (iii) the nature, extent or quality of services provided under the fund's Advisory Contracts; or (iv) the day-to-day management of the fund or the persons primarily responsible for such management. The Board concluded that the fund's Advisory Contracts are fair and reasonable, and that the fund's Advisory Contracts should be renewed, without modification, through January 31, 2019, with the understanding that the Board will consider the annual renewal for a full one year period in January 2019.
In connection with its consideration of future renewals of the fund's Advisory Contracts, the Board will consider: (i) the nature, extent and quality of services provided to the fund, including shareholder and administrative services and investment performance; (ii) the competitiveness of the management fee and total expenses for the fund; (iii) the costs of the services and profitability, including the revenues earned and the expenses incurred in conducting the business of developing, marketing, distributing, managing, administering, and servicing the fund and its shareholders, to the extent applicable, as well as potential fall-out benefits from Fidelity's non-fund businesses; and (iv) whether there have been economies of scale in respect of the Fidelity funds, whether the Fidelity funds (including the fund) have appropriately benefited from any such economies of scale, and whether there is the potential for realization of any further economies.
Based on its evaluation of all of the conclusions noted above, and after considering all factors it believed relevant, the Board ultimately concluded that the fund's management fee structure is fair and reasonable, and that the continuation of the fund's Advisory Contracts should be approved.
ASCP-ANN-0918
1.803714.113
Fidelity® Small Cap Growth Fund
Annual Report July 31, 2018 |
|
Contents
To view a fund's proxy voting guidelines and proxy voting record for the 12-month period ended June 30, visit http://www.fidelity.com/proxyvotingresults or visit the Securities and Exchange Commission's (SEC) web site at http://www.sec.gov.
You may also call 1-800-544-8544 to request a free copy of the proxy voting guidelines.
Standard & Poor's, S&P and S&P 500 are registered service marks of The McGraw-Hill Companies, Inc. and have been licensed for use by Fidelity Distributors Corporation.
Other third-party marks appearing herein are the property of their respective owners.
All other marks appearing herein are registered or unregistered trademarks or service marks of FMR LLC or an affiliated company. © 2018 FMR LLC. All rights reserved.
This report and the financial statements contained herein are submitted for the general information of the shareholders of the Fund. This report is not authorized for distribution to prospective investors in the Fund unless preceded or accompanied by an effective prospectus.
A fund files its complete schedule of portfolio holdings with the SEC for the first and third quarters of each fiscal year on Form N-Q. Forms N-Q are available on the SEC’s web site at http://www.sec.gov. A fund's Forms N-Q may be reviewed and copied at the SEC’s Public Reference Room in Washington, DC. Information regarding the operation of the SEC's Public Reference Room may be obtained by calling 1-800-SEC-0330.
For a complete list of a fund's portfolio holdings, view the most recent holdings listing, semiannual report, or annual report on Fidelity's web site at http://www.fidelity.com, http://www.institutional.fidelity.com, or http://www.401k.com, as applicable.
NOT FDIC INSURED •MAY LOSE VALUE •NO BANK GUARANTEE
Neither the Fund nor Fidelity Distributors Corporation is a bank.
Performance: The Bottom Line
Average annual total return reflects the change in the value of an investment, assuming reinvestment of distributions from dividend income and capital gains (the profits earned upon the sale of securities that have grown in value, if any) and assuming a constant rate of performance each year. The hypothetical investment and the average annual total returns do not reflect the deduction of taxes that a shareholder would pay on fund distributions or the redemption of fund shares. During periods of reimbursement by Fidelity, a fund’s total return will be greater than it would be had the reimbursement not occurred. How a fund did yesterday is no guarantee of how it will do tomorrow.
Average Annual Total Returns
| For the periods ended July 31, 2018 | Past 1 year | Past 5 years | Past 10 years |
| Fidelity® Small Cap Growth Fund | 28.81% | 15.64% | 13.06% |
$10,000 Over 10 Years
Let's say hypothetically that $10,000 was invested in Fidelity® Small Cap Growth Fund, a class of the fund, on July 31, 2008.
The chart shows how the value of your investment would have changed, and also shows how the Russell 2000® Growth Index performed over the same period.
| Period Ending Values |
| $34,138 | Fidelity® Small Cap Growth Fund |
| $28,845 | Russell 2000® Growth Index |
Management's Discussion of Fund Performance
Market Recap: The U.S. equity bellwether S&P 500
® index gained 16.24% for the 12 months ending July 31, 2018, despite a resurgence in volatility that challenged the multiyear bull market. Stocks maintained their steady growth until a sharp reversal in February, as volatility spiked amid fear that rising inflation and the potential for the economy to overheat would prompt the U.S. Federal Reserve to pick up the pace of interest rate hikes. The index posted its first negative monthly result since October 2016, and then lost further ground in March on fear of a global trade war. The market stabilized in April and turned upward through mid-June, when escalating trade tension between the U.S. and China soured investor sentiment. The resulting uncertainty lingered into July, but strong corporate earnings helped the S&P 500 rise 3.72% that month to cap the period. For the full one-year period, growth handily topped value, while small-caps bested large-caps. By sector, information technology (+28%) led the way, boosted by strong earnings growth from several major index constituents. Consumer discretionary rose roughly 24%, driven by retailers (+49%). Energy (+20%) gained alongside higher oil prices. Laggards were telecommunication services (-2%), consumer staples (0%) and utilities (+3%), defensive groups that struggled amid rising interest rates and a general preference for risk. Real estate (+5%) fared a bit better but still lagged, as did financials, industrials, health care (each up 13%) and materials (+11%).
Comments from Portfolio Manager Patrick Venanzi: For the year, the fund's share classes (excluding sales charges, if applicable) advanced about 29%, comfortably outpacing the 22.91% gain of the benchmark Russell 2000
® Growth Index. Stock picking in information technology’s software & services segment was by far the biggest driver of the fund’s outperformance versus the benchmark. The top individual contributors were Stamps.com and 2U. Shares of internet-based shipping-services provider Stamps gained 76% on the back of consecutive quarters of stellar financial results. Meanwhile, shares of 2U – our largest holding, on average – returned about 69%, as the firm continued to grow its portfolio of online graduate programs and strengthened its competitive position. Picks in consumer discretionary and industrials also helped. Conversely, choices in the health care equipment & services industry hurt, including Medicaid-related managed-care firm Magellan Health, the fund’s largest detractor. Shares of Magellan plunged in late April on disappointing financial results. The company also lowered its full-year earnings guidance. A position in health care payment management firm Cotiviti also fared poorly due to slowing growth, and the position was sold from the fund during the period.
The views expressed above reflect those of the portfolio manager(s) only through the end of the period as stated on the cover of this report and do not necessarily represent the views of Fidelity or any other person in the Fidelity organization. Any such views are subject to change at any time based upon market or other conditions and Fidelity disclaims any responsibility to update such views. These views may not be relied on as investment advice and, because investment decisions for a Fidelity fund are based on numerous factors, may not be relied on as an indication of trading intent on behalf of any Fidelity fund.
Notes to Shareholders: Following a three-month leave of absence, Pat Venanzi returned to Fidelity on August 30, 2018, and resumed his day-to-day responsibilities as Portfolio Manager. In his stead, Jennifer Fo Cardillo and Slava Kruzement-Prykhodko served as interim managers of the fund. Jennifer and Slava came off the fund on August 31, 2018, leaving Patrick as sole manager. The fund closed to new accounts on February 2, 2018.
Investment Summary (Unaudited)
Top Ten Stocks as of July 31, 2018
| | % of fund's net assets |
| CarGurus, Inc. Class A | 2.5 |
| Stamps.com, Inc. | 1.8 |
| 2U, Inc. | 1.6 |
| Weight Watchers International, Inc. | 1.5 |
| Asgn, Inc. | 1.4 |
| Generac Holdings, Inc. | 1.4 |
| Insulet Corp. | 1.3 |
| Vail Resorts, Inc. | 1.2 |
| Cavco Industries, Inc. | 1.2 |
| Copart, Inc. | 1.1 |
| | 15.0 |
Top Five Market Sectors as of July 31, 2018
| | % of fund's net assets |
| Health Care | 23.5 |
| Information Technology | 22.5 |
| Industrials | 18.6 |
| Consumer Discretionary | 15.6 |
| Financials | 5.9 |
Asset Allocation (% of fund's net assets)
| As of July 31, 2018* |
| | Stocks/ETFs | 97.4% |
| | Convertible Securities | 0.5% |
| | Short-Term Investments and Net Other Assets (Liabilities) | 2.1% |

* Foreign investments – 7.7%
Schedule of Investments July 31, 2018
Showing Percentage of Net Assets
| Common Stocks - 95.3% | | | |
| | | Shares | Value |
| CONSUMER DISCRETIONARY - 15.6% | | | |
| Auto Components - 0.7% | | | |
| Gentex Corp. | | 1,412,000 | $32,758,400 |
| Diversified Consumer Services - 3.1% | | | |
| Bright Horizons Family Solutions, Inc. (a) | | 300,838 | 32,186,658 |
| Grand Canyon Education, Inc. (a) | | 344,876 | 40,188,400 |
| Weight Watchers International, Inc. (a) | | 779,481 | 69,786,934 |
| | | | 142,161,992 |
| Hotels, Restaurants & Leisure - 5.2% | | | |
| Boyd Gaming Corp. | | 597,471 | 22,315,542 |
| Cedar Fair LP (depositary unit) | | 498,204 | 28,467,377 |
| Hilton Grand Vacations, Inc. (a) | | 752,176 | 26,017,768 |
| Marriott Vacations Worldwide Corp. | | 130,230 | 15,511,695 |
| Planet Fitness, Inc. (a) | | 971,500 | 46,165,680 |
| Texas Roadhouse, Inc. Class A | | 368,464 | 23,154,278 |
| U.S. Foods Holding Corp. (a) | | 692,843 | 23,425,022 |
| Vail Resorts, Inc. | | 202,204 | 55,984,221 |
| | | | 241,041,583 |
| Household Durables - 3.1% | | | |
| Cavco Industries, Inc. (a) | | 253,948 | 53,951,253 |
| LGI Homes, Inc. (a)(b) | | 408,903 | 21,136,196 |
| SodaStream International Ltd. (a) | | 344,139 | 30,043,335 |
| Taylor Morrison Home Corp. (a) | | 920,442 | 17,976,232 |
| TopBuild Corp. (a) | | 281,501 | 20,909,894 |
| | | | 144,016,910 |
| Internet & Direct Marketing Retail - 0.4% | | | |
| Gaia, Inc. Class A (a) | | 1,067,310 | 19,425,042 |
| Multiline Retail - 0.5% | | | |
| Ollie's Bargain Outlet Holdings, Inc. (a) | | 306,843 | 21,325,589 |
| Specialty Retail - 1.7% | | | |
| Five Below, Inc. (a) | | 478,200 | 46,461,912 |
| The Children's Place Retail Stores, Inc. | | 242,587 | 29,813,942 |
| | | | 76,275,854 |
| Textiles, Apparel & Luxury Goods - 0.9% | | | |
| Cadence Bancorp | | 986,500 | 26,862,395 |
| Columbia Sportswear Co. | | 183,013 | 15,918,471 |
| | | | 42,780,866 |
|
| TOTAL CONSUMER DISCRETIONARY | | | 719,786,236 |
|
| CONSUMER STAPLES - 2.5% | | | |
| Food & Staples Retailing - 0.7% | | | |
| Performance Food Group Co. (a) | | 896,429 | 32,136,980 |
| Food Products - 1.1% | | | |
| Nomad Foods Ltd. (a) | | 1,218,451 | 23,150,569 |
| Post Holdings, Inc. (a) | | 305,568 | 26,449,966 |
| | | | 49,600,535 |
| Household Products - 0.7% | | | |
| Central Garden & Pet Co. (a) | | 429,384 | 18,536,507 |
| Central Garden & Pet Co. Class A (non-vtg.) (a) | | 417,960 | 16,768,555 |
| | | | 35,305,062 |
|
| TOTAL CONSUMER STAPLES | | | 117,042,577 |
|
| ENERGY - 1.6% | | | |
| Energy Equipment & Services - 0.3% | | | |
| NCS Multistage Holdings, Inc. (a) | | 988,987 | 15,685,334 |
| Oil, Gas & Consumable Fuels - 1.3% | | | |
| Delek U.S. Holdings, Inc. | | 531,475 | 28,338,247 |
| Extraction Oil & Gas, Inc. (a) | | 1,009,773 | 15,267,768 |
| Whiting Petroleum Corp. (a) | | 287,100 | 14,254,515 |
| | | | 57,860,530 |
|
| TOTAL ENERGY | | | 73,545,864 |
|
| FINANCIALS - 5.9% | | | |
| Banks - 0.8% | | | |
| First Citizen Bancshares, Inc. | | 88,016 | 35,806,669 |
| Capital Markets - 3.8% | | | |
| Apollo Global Management LLC Class A | | 1,084,602 | 38,503,371 |
| Hamilton Lane, Inc. Class A | | 506,100 | 24,783,717 |
| Lazard Ltd. Class A | | 368,996 | 20,036,483 |
| LPL Financial | | 354,400 | 23,493,176 |
| Morningstar, Inc. | | 167,200 | 22,070,400 |
| MSCI, Inc. | | 184,881 | 30,725,373 |
| Virtu Financial, Inc. Class A | | 868,800 | 17,506,320 |
| | | | 177,118,840 |
| Consumer Finance - 0.6% | | | |
| Green Dot Corp. Class A (a) | | 366,600 | 29,078,712 |
| Insurance - 0.7% | | | |
| Enstar Group Ltd. (a) | | 146,657 | 31,707,243 |
|
| TOTAL FINANCIALS | | | 273,711,464 |
|
| HEALTH CARE - 23.5% | | | |
| Biotechnology - 8.1% | | | |
| Abeona Therapeutics, Inc. (a) | | 714,781 | 10,328,585 |
| Acceleron Pharma, Inc. (a) | | 368,412 | 16,048,027 |
| Acorda Therapeutics, Inc. (a) | | 345,137 | 8,611,168 |
| Alder Biopharmaceuticals, Inc. (a)(b) | | 775,154 | 14,689,168 |
| AnaptysBio, Inc. (a) | | 257,425 | 20,161,526 |
| Arena Pharmaceuticals, Inc. (a) | | 277,086 | 10,692,749 |
| Argenx SE ADR (a) | | 199,451 | 18,100,178 |
| Ascendis Pharma A/S sponsored ADR (a) | | 391,274 | 26,583,156 |
| Atara Biotherapeutics, Inc. (a) | | 319,514 | 11,997,751 |
| Audentes Therapeutics, Inc. (a) | | 537,121 | 20,222,606 |
| Blueprint Medicines Corp. (a) | | 333,215 | 19,839,621 |
| Dyax Corp. rights 12/31/19 (a)(c) | | 380,400 | 1,361,832 |
| FibroGen, Inc. (a) | | 537,358 | 33,907,290 |
| Five Prime Therapeutics, Inc. (a) | | 229,619 | 3,421,323 |
| Global Blood Therapeutics, Inc. (a) | | 434,757 | 18,172,843 |
| Heron Therapeutics, Inc. (a) | | 360,357 | 13,495,370 |
| Ligand Pharmaceuticals, Inc. Class B (a) | | 98,229 | 21,446,338 |
| Loxo Oncology, Inc. (a) | | 177,630 | 29,769,012 |
| Mirati Therapeutics, Inc. (a)(b) | | 491,855 | 30,199,897 |
| Sarepta Therapeutics, Inc. (a) | | 246,920 | 28,701,981 |
| Spark Therapeutics, Inc. (a) | | 184,100 | 14,124,152 |
| TESARO, Inc. (a) | | 80,975 | 2,820,359 |
| | | | 374,694,932 |
| Health Care Equipment & Supplies - 8.0% | | | |
| Cantel Medical Corp. | | 202,432 | 18,767,471 |
| CONMED Corp. | | 256,700 | 18,995,800 |
| Globus Medical, Inc. (a) | | 827,900 | 42,620,292 |
| Hill-Rom Holdings, Inc. | | 338,100 | 31,849,020 |
| ICU Medical, Inc. (a) | | 102,738 | 29,465,258 |
| Insulet Corp. (a) | | 708,124 | 58,887,592 |
| Integer Holdings Corp. (a) | | 219,200 | 15,661,840 |
| Integra LifeSciences Holdings Corp. (a) | | 689,723 | 42,990,435 |
| iRhythm Technologies, Inc. (a) | | 446,476 | 33,731,262 |
| Masimo Corp. (a) | | 455,000 | 45,236,100 |
| Novocure Ltd. (a) | | 647,529 | 22,015,986 |
| Quanterix Corp. (a)(b) | | 770,447 | 11,549,001 |
| | | | 371,770,057 |
| Health Care Providers & Services - 3.5% | | | |
| Chemed Corp. | | 102,500 | 32,393,075 |
| G1 Therapeutics, Inc. (a)(b) | | 526,672 | 27,044,607 |
| Magellan Health Services, Inc. (a) | | 526,469 | 38,300,620 |
| Molina Healthcare, Inc. (a) | | 409,738 | 42,649,628 |
| Tivity Health, Inc. (a) | | 607,998 | 20,489,533 |
| | | | 160,877,463 |
| Health Care Technology - 0.8% | | | |
| HTG Molecular Diagnostics (a) | | 815,910 | 2,382,457 |
| Teladoc, Inc. (a) | | 592,900 | 35,485,065 |
| | | | 37,867,522 |
| Life Sciences Tools & Services - 1.3% | | | |
| ICON PLC (a) | | 327,865 | 45,625,693 |
| Morphosys AG (a) | | 93,900 | 12,341,741 |
| | | | 57,967,434 |
| Pharmaceuticals - 1.8% | | | |
| Aclaris Therapeutics, Inc. (a) | | 565,525 | 9,693,099 |
| Aerie Pharmaceuticals, Inc. (a) | | 313,018 | 21,144,366 |
| Akcea Therapeutics, Inc. (b) | | 280,194 | 8,859,734 |
| Nektar Therapeutics (a) | | 417,732 | 21,972,703 |
| SCYNEXIS, Inc. warrants 6/21/21 (a) | | 168,750 | 44,625 |
| The Medicines Company (a) | | 343,026 | 13,628,423 |
| Theravance Biopharma, Inc. (a) | | 292,739 | 7,011,099 |
| | | | 82,354,049 |
|
| TOTAL HEALTH CARE | | | 1,085,531,457 |
|
| INDUSTRIALS - 18.6% | | | |
| Aerospace & Defense - 2.7% | | | |
| BWX Technologies, Inc. | | 598,127 | 39,332,832 |
| HEICO Corp. Class A | | 667,966 | 43,250,799 |
| Teledyne Technologies, Inc. (a) | | 196,104 | 43,029,140 |
| | | | 125,612,771 |
| Air Freight & Logistics - 0.6% | | | |
| Atlas Air Worldwide Holdings, Inc. (a) | | 411,693 | 27,604,016 |
| Airlines - 1.0% | | | |
| SkyWest, Inc. | | 793,724 | 47,544,068 |
| Commercial Services & Supplies - 1.5% | | | |
| Copart, Inc. (a) | | 927,412 | 53,224,175 |
| Viad Corp. | | 289,260 | 16,603,524 |
| | | | 69,827,699 |
| Construction & Engineering - 1.9% | | | |
| Dycom Industries, Inc. (a) | | 437,328 | 38,992,164 |
| Jacobs Engineering Group, Inc. | | 748,114 | 50,594,950 |
| | | | 89,587,114 |
| Electrical Equipment - 1.4% | | | |
| Generac Holdings, Inc. (a) | | 1,199,192 | 64,456,570 |
| Industrial Conglomerates - 1.0% | | | |
| ITT, Inc. | | 826,808 | 46,855,209 |
| Machinery - 3.2% | | | |
| AGCO Corp. | | 339,998 | 21,426,674 |
| Allison Transmission Holdings, Inc. | | 617,361 | 29,015,967 |
| Gardner Denver Holdings, Inc. (a) | | 799,500 | 22,873,695 |
| John Bean Technologies Corp. | | 136,859 | 15,136,605 |
| Milacron Holdings Corp. (a) | | 1,129,647 | 23,553,140 |
| Oshkosh Corp. | | 236,341 | 17,784,660 |
| WABCO Holdings, Inc. (a) | | 145,015 | 18,225,485 |
| | | | 148,016,226 |
| Professional Services - 4.3% | | | |
| Asgn, Inc. (a) | | 724,371 | 65,410,701 |
| Exponent, Inc. | | 834,149 | 40,789,886 |
| FTI Consulting, Inc. (a) | | 625,897 | 49,420,827 |
| Insperity, Inc. | | 441,207 | 41,958,786 |
| | | | 197,580,200 |
| Trading Companies & Distributors - 1.0% | | | |
| SiteOne Landscape Supply, Inc. (a) | | 265,285 | 23,652,811 |
| Univar, Inc. (a) | | 724,560 | 19,918,154 |
| | | | 43,570,965 |
|
| TOTAL INDUSTRIALS | | | 860,654,838 |
|
| INFORMATION TECHNOLOGY - 22.0% | | | |
| Electronic Equipment & Components - 0.9% | | | |
| Dolby Laboratories, Inc. Class A | | 312,997 | 20,172,657 |
| Novanta, Inc. (a) | | 348,559 | 21,732,654 |
| | | | 41,905,311 |
| Internet Software & Services - 11.2% | | | |
| 2U, Inc. (a) | | 970,130 | 73,400,036 |
| ANGI Homeservices, Inc. Class A (a)(b) | | 1,553,077 | 24,398,840 |
| BlackLine, Inc. (a) | | 380,696 | 16,255,719 |
| CarGurus, Inc. Class A (b) | | 2,714,400 | 117,669,234 |
| Five9, Inc. (a) | | 880,930 | 28,101,667 |
| GoDaddy, Inc. (a) | | 609,429 | 44,866,163 |
| Instructure, Inc. (a) | | 413,648 | 16,008,178 |
| MINDBODY, Inc. (a) | | 791,228 | 29,552,366 |
| New Relic, Inc. (a) | | 237,446 | 23,198,474 |
| Okta, Inc. (a) | | 270,720 | 13,441,248 |
| ShotSpotter, Inc. (a)(b) | | 425,493 | 18,155,786 |
| Stamps.com, Inc. (a) | | 309,475 | 80,772,975 |
| The Trade Desk, Inc. (a) | | 390,400 | 32,918,528 |
| | | | 518,739,214 |
| IT Services - 2.4% | | | |
| EPAM Systems, Inc. (a) | | 332,300 | 43,268,783 |
| Genpact Ltd. | | 662,539 | 20,127,935 |
| Interxion Holding N.V. (a) | | 266,223 | 17,272,548 |
| Leidos Holdings, Inc. | | 430,181 | 29,432,984 |
| | | | 110,102,250 |
| Semiconductors & Semiconductor Equipment - 1.1% | | | |
| Entegris, Inc. | | 1,394,885 | 49,030,208 |
| Software - 6.4% | | | |
| 8x8, Inc. (a) | | 994,920 | 19,848,654 |
| Black Knight, Inc. (a) | | 436,980 | 22,570,017 |
| Cardlytics, Inc. (a)(d) | | 1,699,744 | 31,989,182 |
| Everbridge, Inc. (a) | | 793,564 | 35,694,509 |
| HubSpot, Inc. (a) | | 268,507 | 33,321,719 |
| Pluralsight, Inc. (b) | | 1,584,045 | 36,765,684 |
| PROS Holdings, Inc. (a) | | 666,476 | 24,752,919 |
| RealPage, Inc. (a) | | 541,900 | 29,858,690 |
| Talend SA ADR (a) | | 387,952 | 22,947,361 |
| Zendesk, Inc. (a) | | 484,714 | 26,402,372 |
| Zscaler, Inc. (a)(b) | | 297,481 | 10,504,054 |
| | | | 294,655,161 |
|
| TOTAL INFORMATION TECHNOLOGY | | | 1,014,432,144 |
|
| MATERIALS - 4.5% | | | |
| Chemicals - 1.7% | | | |
| Orion Engineered Carbons SA | | 1,107,433 | 36,323,802 |
| The Chemours Co. LLC | | 898,672 | 41,168,164 |
| | | | 77,491,966 |
| Construction Materials - 1.3% | | | |
| Eagle Materials, Inc. | | 331,483 | 32,932,836 |
| Summit Materials, Inc. | | 1,013,652 | 25,442,665 |
| | | | 58,375,501 |
| Containers & Packaging - 1.1% | | | |
| Aptargroup, Inc. | | 244,500 | 25,044,135 |
| Avery Dennison Corp. | | 244,514 | 28,040,866 |
| | | | 53,085,001 |
| Paper & Forest Products - 0.4% | | | |
| Neenah, Inc. | | 185,987 | 16,329,659 |
| Quintis Ltd. (a)(b)(c) | | 11,211,435 | 83 |
| | | | 16,329,742 |
|
| TOTAL MATERIALS | | | 205,282,210 |
|
| REAL ESTATE - 1.1% | | | |
| Equity Real Estate Investment Trusts (REITs) - 1.1% | | | |
| Rexford Industrial Realty, Inc. | | 553,591 | 16,962,028 |
| Store Capital Corp. | | 595,549 | 16,347,820 |
| Terreno Realty Corp. | | 496,046 | 18,309,058 |
| | | | 51,618,906 |
| TOTAL COMMON STOCKS | | | |
| (Cost $3,473,322,233) | | | 4,401,605,696 |
|
| Convertible Preferred Stocks - 0.5% | | | |
| INFORMATION TECHNOLOGY - 0.5% | | | |
| Software - 0.5% | | | |
| Compass, Inc. Series E (c)(e) | | | |
| (Cost $23,873,990) | | 353,803 | 23,873,990 |
|
| Investment Companies - 2.1% | | | |
| iShares Russell 2000 Growth Index ETF (b) | | | |
| (Cost $94,361,861) | | 452,400 | 93,895,620 |
|
| Money Market Funds - 5.8% | | | |
| Fidelity Cash Central Fund, 1.96% (f) | | 88,577,592 | 88,595,307 |
| Fidelity Securities Lending Cash Central Fund 1.97% (f)(g) | | 179,710,408 | 179,728,379 |
| TOTAL MONEY MARKET FUNDS | | | |
| (Cost $268,323,686) | | | 268,323,686 |
| TOTAL INVESTMENT IN SECURITIES - 103.7% | | | |
| (Cost $3,859,881,770) | | | 4,787,698,992 |
| NET OTHER ASSETS (LIABILITIES) - (3.7)% | | | (168,810,820) |
| NET ASSETS - 100% | | | $4,618,888,172 |
Security Type Abbreviations
ETF – Exchange-Traded Fund
Legend
(a) Non-income producing
(b) Security or a portion of the security is on loan at period end.
(c) Level 3 security
(d) Affiliated company
(e) Restricted securities - Investment in securities not registered under the Securities Act of 1933 (excluding 144A issues). At the end of the period, the value of restricted securities (excluding 144A issues) amounted to $23,873,990 or 0.5% of net assets.
(f) Affiliated fund that is generally available only to investment companies and other accounts managed by Fidelity Investments. The rate quoted is the annualized seven-day yield of the fund at period end. A complete unaudited listing of the fund's holdings as of its most recent quarter end is available upon request. In addition, each Fidelity Central Fund's financial statements, which are not covered by the Fund's Report of Independent Registered Public Accounting Firm, are available on the SEC's website or upon request.
(g) Investment made with cash collateral received from securities on loan.
Additional information on each restricted holding is as follows:
| Security | Acquisition Date | Acquisition Cost |
| Compass, Inc. Series E | 11/3/17 | $23,873,990 |
Affiliated Central Funds
Information regarding fiscal year to date income earned by the Fund from investments in Fidelity Central Funds is as follows:
| Fund | Income earned |
| Fidelity Cash Central Fund | $933,064 |
| Fidelity Securities Lending Cash Central Fund | 3,685,850 |
| Total | $4,618,914 |
Amounts in the income column in the above table include any capital gain distributions from underlying funds, which are presented in the corresponding line-item in the Statement of Operations if applicable.
Other Affiliated Issuers
An affiliated company is a company in which the Fund has ownership of at least 5% of the voting securities. Fiscal year to date transactions with companies which are or were affiliates are as follows:
| Affiliate | Value, beginning of period | Purchases | Sales Proceeds(a) | Dividend Income | Realized Gain (loss) | Change in Unrealized appreciation (depreciation) | Value, end of period |
| Cardlytics, Inc. | $-- | $25,242,697 | $647,277 | $-- | $155,297 | $7,238,465 | $31,989,182 |
| Total | $-- | $25,242,697 | $647,277 | $-- | $155,297 | $7,238,465 | $31,989,182 |
(a) Includes the value of securities delivered through in-kind transactions, if applicable.
Investment Valuation
The following is a summary of the inputs used, as of July 31, 2018, involving the Fund's assets and liabilities carried at fair value. The inputs or methodology used for valuing securities may not be an indication of the risk associated with investing in those securities. For more information on valuation inputs, and their aggregation into the levels used below, please refer to the Investment Valuation section in the accompanying Notes to Financial Statements.
| | Valuation Inputs at Reporting Date: |
| Description | Total | Level 1 | Level 2 | Level 3 |
| Investments in Securities: | | | | |
| Equities: | | | | |
| Consumer Discretionary | $719,786,236 | $719,786,236 | $-- | $-- |
| Consumer Staples | 117,042,577 | 117,042,577 | -- | -- |
| Energy | 73,545,864 | 73,545,864 | -- | -- |
| Financials | 273,711,464 | 273,711,464 | -- | -- |
| Health Care | 1,085,531,457 | 1,084,125,000 | 44,625 | 1,361,832 |
| Industrials | 860,654,838 | 860,654,838 | -- | -- |
| Information Technology | 1,038,306,134 | 1,014,432,144 | -- | 23,873,990 |
| Materials | 205,282,210 | 205,282,127 | -- | 83 |
| Real Estate | 51,618,906 | 51,618,906 | -- | -- |
| Investment Companies | 93,895,620 | 93,895,620 | -- | -- |
| Money Market Funds | 268,323,686 | 268,323,686 | -- | -- |
| Total Investments in Securities: | $4,787,698,992 | $4,762,418,462 | $44,625 | $25,235,905 |
See accompanying notes which are an integral part of the financial statements.
Financial Statements
Statement of Assets and Liabilities
| | | July 31, 2018 |
| Assets | | |
Investment in securities, at value (including securities loaned of $178,777,758) — See accompanying schedule:
Unaffiliated issuers (cost $3,566,807,367) | $4,487,386,124 | |
| Fidelity Central Funds (cost $268,323,686) | 268,323,686 | |
| Other affiliated issuers (cost $24,750,717) | 31,989,182 | |
| Total Investment in Securities (cost $3,859,881,770) | | $4,787,698,992 |
| Receivable for investments sold | | 25,948,269 |
| Receivable for fund shares sold | | 4,531,582 |
| Dividends receivable | | 181,449 |
| Distributions receivable from Fidelity Central Funds | | 262,788 |
| Prepaid expenses | | 11,955 |
| Other receivables | | 143,672 |
| Total assets | | 4,818,778,707 |
| Liabilities | | |
| Payable for investments purchased | $8,230,284 | |
| Payable for fund shares redeemed | 7,749,728 | |
| Accrued management fee | 3,150,455 | |
| Distribution and service plan fees payable | 220,321 | |
| Other affiliated payables | 745,795 | |
| Other payables and accrued expenses | 71,284 | |
| Collateral on securities loaned | 179,722,668 | |
| Total liabilities | | 199,890,535 |
| Net Assets | | $4,618,888,172 |
| Net Assets consist of: | | |
| Paid in capital | | $3,274,697,768 |
| Accumulated net investment loss | | (3,938,472) |
| Accumulated undistributed net realized gain (loss) on investments and foreign currency transactions | | 420,311,752 |
| Net unrealized appreciation (depreciation) on investments and assets and liabilities in foreign currencies | | 927,817,124 |
| Net Assets | | $4,618,888,172 |
| Calculation of Maximum Offering Price | | |
| Class A: | | |
| Net Asset Value and redemption price per share ($315,894,425 ÷ 11,508,691 shares) | | $27.45 |
| Maximum offering price per share (100/94.25 of $27.45) | | $29.12 |
| Class M: | | |
| Net Asset Value and redemption price per share ($82,566,988 ÷ 3,105,495 shares) | | $26.59 |
| Maximum offering price per share (100/96.50 of $26.59) | | $27.55 |
| Class C: | | |
| Net Asset Value and offering price per share ($139,375,333 ÷ 5,674,635 shares)(a) | | $24.56 |
| Small Cap Growth: | | |
| Net Asset Value, offering price and redemption price per share ($3,269,547,883 ÷ 114,366,821 shares) | | $28.59 |
| Class I: | | |
| Net Asset Value, offering price and redemption price per share ($678,575,785 ÷ 23,674,264 shares) | | $28.66 |
| Class Z: | | |
| Net Asset Value, offering price and redemption price per share ($132,927,758÷ 4,630,205 shares) | | $28.71 |
(a) Redemption price per share is equal to net asset value less any applicable contingent deferred sales charge.
See accompanying notes which are an integral part of the financial statements.
Statement of Operations
| | | Year ended July 31, 2018 |
| Investment Income | | |
| Dividends | | $17,633,467 |
| Income from Fidelity Central Funds (including $3,685,850 from security lending) | | 4,618,914 |
| Total income | | 22,252,381 |
| Expenses | | |
| Management fee | | |
| Basic fee | $27,512,839 | |
| Performance adjustment | 4,686,065 | |
| Transfer agent fees | 7,094,239 | |
| Distribution and service plan fees | 2,301,170 | |
| Accounting and security lending fees | 1,069,595 | |
| Custodian fees and expenses | 61,901 | |
| Independent trustees' fees and expenses | 16,573 | |
| Registration fees | 237,982 | |
| Audit | 65,516 | |
| Legal | 14,089 | |
| Interest | 5,356 | |
| Miscellaneous | 25,535 | |
| Total expenses before reductions | 43,090,860 | |
| Expense reductions | (418,966) | |
| Total expenses after reductions | | 42,671,894 |
| Net investment income (loss) | | (20,419,513) |
| Realized and Unrealized Gain (Loss) | | |
| Net realized gain (loss) on: | | |
| Investment securities: | | |
| Unaffiliated issuers | 566,033,143 | |
| Fidelity Central Funds | 13,111 | |
| Other affiliated issuers | 155,297 | |
| Foreign currency transactions | 4,937 | |
| Total net realized gain (loss) | | 566,206,488 |
| Change in net unrealized appreciation (depreciation) on: | | |
| Investment securities: | | |
| Unaffiliated issuers | 425,734,577 | |
| Fidelity Central Funds | (9,738) | |
| Other affiliated issuers | 7,238,465 | |
| Assets and liabilities in foreign currencies | (9) | |
| Total change in net unrealized appreciation (depreciation) | | 432,963,295 |
| Net gain (loss) | | 999,169,783 |
| Net increase (decrease) in net assets resulting from operations | | $978,750,270 |
See accompanying notes which are an integral part of the financial statements.
Statement of Changes in Net Assets
| | Year ended July 31, 2018 | Year ended July 31, 2017 |
| Increase (Decrease) in Net Assets | | |
| Operations | | |
| Net investment income (loss) | $(20,419,513) | $(11,864,179) |
| Net realized gain (loss) | 566,206,488 | 284,698,299 |
| Change in net unrealized appreciation (depreciation) | 432,963,295 | 228,635,188 |
| Net increase (decrease) in net assets resulting from operations | 978,750,270 | 501,469,308 |
| Distributions to shareholders from net realized gain | (236,662,615) | (17,131,591) |
| Share transactions - net increase (decrease) | 745,727,718 | 597,965,658 |
| Redemption fees | 224,642 | 418,601 |
| Total increase (decrease) in net assets | 1,488,040,015 | 1,082,721,976 |
| Net Assets | | |
| Beginning of period | 3,130,848,157 | 2,048,126,181 |
| End of period | $4,618,888,172 | $3,130,848,157 |
| Other Information | | |
| Accumulated net investment loss end of period | $(3,938,472) | $(1,470,898) |
See accompanying notes which are an integral part of the financial statements.
Financial Highlights
Fidelity Small Cap Growth Fund Class A
| Years ended July 31, | 2018 | 2017 | 2016 | 2015 | 2014 |
| Selected Per–Share Data | | | | | |
| Net asset value, beginning of period | $22.99 | $19.17 | $20.55 | $17.99 | $19.66 |
| Income from Investment Operations | | | | | |
| Net investment income (loss)A | (.18) | (.14) | (.10) | (.13) | (.12) |
| Net realized and unrealized gain (loss) | 6.32 | 4.12 | (.51) | 4.23 | 1.69 |
| Total from investment operations | 6.14 | 3.98 | (.61) | 4.10 | 1.57 |
| Distributions from net investment income | – | – | – | – | – |
| Distributions from net realized gain | (1.68) | (.16) | (.78) | (1.54) | (3.24) |
| Total distributions | (1.68) | (.16) | (.78) | (1.54) | (3.24) |
| Redemption fees added to paid in capitalA | –B | –B | .01 | –B | –B |
| Net asset value, end of period | $27.45 | $22.99 | $19.17 | $20.55 | $17.99 |
| Total ReturnC,D | 28.47% | 20.90% | (2.85)% | 24.46% | 8.58% |
| Ratios to Average Net AssetsE,F | | | | | |
| Expenses before reductions | 1.31% | 1.35% | 1.37% | 1.21% | 1.22% |
| Expenses net of fee waivers, if any | 1.31% | 1.35% | 1.37% | 1.21% | 1.22% |
| Expenses net of all reductions | 1.30% | 1.34% | 1.36% | 1.20% | 1.22% |
| Net investment income (loss) | (.74)% | (.66)% | (.58)% | (.67)% | (.62)% |
| Supplemental Data | | | | | |
| Net assets, end of period (000 omitted) | $315,894 | $218,905 | $176,988 | $123,370 | $88,822 |
| Portfolio turnover rateG | 106%H | 140%H | 143% | 156% | 148%H |
A Calculated based on average shares outstanding during the period.
B Amount represents less than $.005 per share.
C Total returns would have been lower if certain expenses had not been reduced during the applicable periods shown.
D Total returns do not include the effect of the sales charges.
E Fees and expenses of any underlying Fidelity Central Funds are not included in the Fund's expense ratio. The Fund indirectly bears its proportionate share of the expenses of any underlying Fidelity Central Funds.
F Expense ratios reflect operating expenses of the class. Expenses before reductions do not reflect amounts reimbursed by the investment adviser or reductions from brokerage service arrangements or reductions from other expense offset arrangements and do not represent the amount paid by the class during periods when reimbursements or reductions occur. Expenses net of fee waivers reflect expenses after reimbursement by the investment adviser but prior to reductions from brokerage service arrangements or other expense offset arrangements. Expenses net of all reductions represent the net expenses paid by the class.
G Amount does not include the portfolio activity of any underlying Fidelity Central Funds.
H Portfolio turnover rate excludes securities received or delivered in-kind.
See accompanying notes which are an integral part of the financial statements.
Fidelity Small Cap Growth Fund Class M
| Years ended July 31, | 2018 | 2017 | 2016 | 2015 | 2014 |
| Selected Per–Share Data | | | | | |
| Net asset value, beginning of period | $22.35 | $18.69 | $20.08 | $17.66 | $19.38 |
| Income from Investment Operations | | | | | |
| Net investment income (loss)A | (.24) | (.19) | (.15) | (.17) | (.16) |
| Net realized and unrealized gain (loss) | 6.13 | 4.01 | (.50) | 4.13 | 1.66 |
| Total from investment operations | 5.89 | 3.82 | (.65) | 3.96 | 1.50 |
| Distributions from net investment income | – | – | – | – | – |
| Distributions from net realized gain | (1.65) | (.16) | (.75) | (1.54) | (3.22) |
| Total distributions | (1.65) | (.16) | (.75) | (1.54) | (3.22) |
| Redemption fees added to paid in capitalA | –B | –B | .01 | –B | –B |
| Net asset value, end of period | $26.59 | $22.35 | $18.69 | $20.08 | $17.66 |
| Total ReturnC,D | 28.15% | 20.57% | (3.14)% | 24.10% | 8.30% |
| Ratios to Average Net AssetsE,F | | | | | |
| Expenses before reductions | 1.58% | 1.62% | 1.66% | 1.49% | 1.50% |
| Expenses net of fee waivers, if any | 1.58% | 1.62% | 1.66% | 1.48% | 1.50% |
| Expenses net of all reductions | 1.57% | 1.61% | 1.64% | 1.47% | 1.49% |
| Net investment income (loss) | (1.01)% | (.94)% | (.87)% | (.95)% | (.90)% |
| Supplemental Data | | | | | |
| Net assets, end of period (000 omitted) | $82,567 | $64,034 | $53,447 | $52,667 | $42,586 |
| Portfolio turnover rateG | 106%H | 140%H | 143% | 156% | 148%H |
A Calculated based on average shares outstanding during the period.
B Amount represents less than $.005 per share.
C Total returns would have been lower if certain expenses had not been reduced during the applicable periods shown.
D Total returns do not include the effect of the sales charges.
E Fees and expenses of any underlying Fidelity Central Funds are not included in the Fund's expense ratio. The Fund indirectly bears its proportionate share of the expenses of any underlying Fidelity Central Funds.
F Expense ratios reflect operating expenses of the class. Expenses before reductions do not reflect amounts reimbursed by the investment adviser or reductions from brokerage service arrangements or reductions from other expense offset arrangements and do not represent the amount paid by the class during periods when reimbursements or reductions occur. Expenses net of fee waivers reflect expenses after reimbursement by the investment adviser but prior to reductions from brokerage service arrangements or other expense offset arrangements. Expenses net of all reductions represent the net expenses paid by the class.
G Amount does not include the portfolio activity of any underlying Fidelity Central Funds.
H Portfolio turnover rate excludes securities received or delivered in-kind.
See accompanying notes which are an integral part of the financial statements.
Fidelity Small Cap Growth Fund Class C
| Years ended July 31, | 2018 | 2017 | 2016 | 2015 | 2014 |
| Selected Per–Share Data | | | | | |
| Net asset value, beginning of period | $20.83 | $17.52 | $18.90 | $16.78 | $18.62 |
| Income from Investment Operations | | | | | |
| Net investment income (loss)A | (.34) | (.27) | (.22) | (.25) | (.25) |
| Net realized and unrealized gain (loss) | 5.69 | 3.74 | (.48) | 3.91 | 1.59 |
| Total from investment operations | 5.35 | 3.47 | (.70) | 3.66 | 1.34 |
| Distributions from net investment income | – | – | – | – | – |
| Distributions from net realized gain | (1.62) | (.16) | (.69) | (1.54) | (3.18) |
| Total distributions | (1.62) | (.16) | (.69) | (1.54) | (3.18) |
| Redemption fees added to paid in capitalA | –B | –B | .01 | –B | –B |
| Net asset value, end of period | $24.56 | $20.83 | $17.52 | $18.90 | $16.78 |
| Total ReturnC,D | 27.51% | 19.95% | (3.64)% | 23.53% | 7.70% |
| Ratios to Average Net AssetsE,F | | | | | |
| Expenses before reductions | 2.07% | 2.11% | 2.16% | 2.00% | 2.01% |
| Expenses net of fee waivers, if any | 2.07% | 2.11% | 2.16% | 2.00% | 2.00% |
| Expenses net of all reductions | 2.06% | 2.10% | 2.14% | 1.99% | 2.00% |
| Net investment income (loss) | (1.50)% | (1.43)% | (1.37)% | (1.46)% | (1.41)% |
| Supplemental Data | | | | | |
| Net assets, end of period (000 omitted) | $139,375 | $102,669 | $73,731 | $55,671 | $42,215 |
| Portfolio turnover rateG | 106%H | 140%H | 143% | 156% | 148%H |
A Calculated based on average shares outstanding during the period.
B Amount represents less than $.005 per share.
C Total returns would have been lower if certain expenses had not been reduced during the applicable periods shown.
D Total returns do not include the effect of the contingent deferred sales charge.
E Fees and expenses of any underlying Fidelity Central Funds are not included in the Fund's expense ratio. The Fund indirectly bears its proportionate share of the expenses of any underlying Fidelity Central Funds.
F Expense ratios reflect operating expenses of the class. Expenses before reductions do not reflect amounts reimbursed by the investment adviser or reductions from brokerage service arrangements or reductions from other expense offset arrangements and do not represent the amount paid by the class during periods when reimbursements or reductions occur. Expenses net of fee waivers reflect expenses after reimbursement by the investment adviser but prior to reductions from brokerage service arrangements or other expense offset arrangements. Expenses net of all reductions represent the net expenses paid by the class.
G Amount does not include the portfolio activity of any underlying Fidelity Central Funds.
H Portfolio turnover rate excludes securities received or delivered in-kind.
See accompanying notes which are an integral part of the financial statements.
Fidelity Small Cap Growth Fund
| Years ended July 31, | 2018 | 2017 | 2016 | 2015 | 2014 |
| Selected Per–Share Data | | | | | |
| Net asset value, beginning of period | $23.84 | $19.82 | $21.20 | $18.45 | $20.07 |
| Income from Investment Operations | | | | | |
| Net investment income (loss)A | (.12) | (.09) | (.06) | (.07) | (.06) |
| Net realized and unrealized gain (loss) | 6.57 | 4.27 | (.52) | 4.36 | 1.71 |
| Total from investment operations | 6.45 | 4.18 | (.58) | 4.29 | 1.65 |
| Distributions from net investment income | – | – | – | – | – |
| Distributions from net realized gain | (1.70) | (.16) | (.81) | (1.54) | (3.27) |
| Total distributions | (1.70) | (.16) | (.81) | (1.54) | (3.27) |
| Redemption fees added to paid in capitalA | –B | –B | .01 | –B | –B |
| Net asset value, end of period | $28.59 | $23.84 | $19.82 | $21.20 | $18.45 |
| Total ReturnC | 28.81% | 21.22% | (2.63)% | 24.91% | 8.87% |
| Ratios to Average Net AssetsD,E | | | | | |
| Expenses before reductions | 1.02% | 1.08% | 1.12% | .91% | .91% |
| Expenses net of fee waivers, if any | 1.02% | 1.08% | 1.12% | .91% | .90% |
| Expenses net of all reductions | 1.01% | 1.07% | 1.11% | .90% | .90% |
| Net investment income (loss) | (.45)% | (.40)% | (.33)% | (.37)% | (.31)% |
| Supplemental Data | | | | | |
| Net assets, end of period (000 omitted) | $3,269,548 | $2,336,762 | $1,580,264 | $1,345,684 | $1,069,105 |
| Portfolio turnover rateF | 106%G | 140%G | 143% | 156% | 148%G |
A Calculated based on average shares outstanding during the period.
B Amount represents less than $.005 per share.
C Total returns would have been lower if certain expenses had not been reduced during the applicable periods shown.
D Fees and expenses of any underlying Fidelity Central Funds are not included in the Fund's expense ratio. The Fund indirectly bears its proportionate share of the expenses of any underlying Fidelity Central Funds.
E Expense ratios reflect operating expenses of the class. Expenses before reductions do not reflect amounts reimbursed by the investment adviser or reductions from brokerage service arrangements or reductions from other expense offset arrangements and do not represent the amount paid by the class during periods when reimbursements or reductions occur. Expenses net of fee waivers reflect expenses after reimbursement by the investment adviser but prior to reductions from brokerage service arrangements or other expense offset arrangements. Expenses net of all reductions represent the net expenses paid by the class.
F Amount does not include the portfolio activity of any underlying Fidelity Central Funds.
G Portfolio turnover rate excludes securities received or delivered in-kind.
See accompanying notes which are an integral part of the financial statements.
Fidelity Small Cap Growth Fund Class I
| Years ended July 31, | 2018 | 2017 | 2016 | 2015 | 2014 |
| Selected Per–Share Data | | | | | |
| Net asset value, beginning of period | $23.90 | $19.86 | $21.24 | $18.49 | $20.10 |
| Income from Investment Operations | | | | | |
| Net investment income (loss)A | (.12) | (.08) | (.05) | (.07) | (.06) |
| Net realized and unrealized gain (loss) | 6.58 | 4.28 | (.53) | 4.36 | 1.72 |
| Total from investment operations | 6.46 | 4.20 | (.58) | 4.29 | 1.66 |
| Distributions from net investment income | – | – | – | – | – |
| Distributions from net realized gain | (1.70) | (.16) | (.81) | (1.54) | (3.27) |
| Total distributions | (1.70) | (.16) | (.81) | (1.54) | (3.27) |
| Redemption fees added to paid in capitalA | –B | –B | .01 | –B | –B |
| Net asset value, end of period | $28.66 | $23.90 | $19.86 | $21.24 | $18.49 |
| Total ReturnC | 28.78% | 21.28% | (2.62)% | 24.85% | 8.89% |
| Ratios to Average Net AssetsD,E | | | | | |
| Expenses before reductions | 1.03% | 1.06% | 1.09% | .93% | .92% |
| Expenses net of fee waivers, if any | 1.03% | 1.06% | 1.09% | .93% | .92% |
| Expenses net of all reductions | 1.02% | 1.05% | 1.07% | .91% | .92% |
| Net investment income (loss) | (.46)% | (.38)% | (.30)% | (.39)% | (.32)% |
| Supplemental Data | | | | | |
| Net assets, end of period (000 omitted) | $678,576 | $390,032 | $163,696 | $97,897 | $51,607 |
| Portfolio turnover rateF | 106%G | 140%G | 143% | 156% | 148%G |
A Calculated based on average shares outstanding during the period.
B Amount represents less than $.005 per share.
C Total returns would have been lower if certain expenses had not been reduced during the applicable periods shown.
D Fees and expenses of any underlying Fidelity Central Funds are not included in the Fund's expense ratio. The Fund indirectly bears its proportionate share of the expenses of any underlying Fidelity Central Funds.
E Expense ratios reflect operating expenses of the class. Expenses before reductions do not reflect amounts reimbursed by the investment adviser or reductions from brokerage service arrangements or reductions from other expense offset arrangements and do not represent the amount paid by the class during periods when reimbursements or reductions occur. Expenses net of fee waivers reflect expenses after reimbursement by the investment adviser but prior to reductions from brokerage service arrangements or other expense offset arrangements. Expenses net of all reductions represent the net expenses paid by the class.
F Amount does not include the portfolio activity of any underlying Fidelity Central Funds.
G Portfolio turnover rate excludes securities received or delivered in-kind.
See accompanying notes which are an integral part of the financial statements.
Fidelity Small Cap Growth Fund Class Z
| Years ended July 31, | 2018 | 2017 A |
| Selected Per–Share Data | | |
| Net asset value, beginning of period | $23.91 | $21.39 |
| Income from Investment Operations | | |
| Net investment income (loss)B | (.09) | (.05) |
| Net realized and unrealized gain (loss) | 6.61 | 2.57 |
| Total from investment operations | 6.52 | 2.52 |
| Distributions from net investment income | – | – |
| Distributions from net realized gain | (1.72) | – |
| Total distributions | (1.72) | – |
| Redemption fees added to paid in capitalB,C | – | – |
| Net asset value, end of period | $28.71 | $23.91 |
| Total ReturnD,E | 29.02% | 11.78% |
| Ratios to Average Net AssetsF,G | | |
| Expenses before reductions | .89% | .90%H |
| Expenses net of fee waivers, if any | .89% | .90%H |
| Expenses net of all reductions | .88% | .89%H |
| Net investment income (loss) | (.32)% | (.44)%H |
| Supplemental Data | | |
| Net assets, end of period (000 omitted) | $132,928 | $18,447 |
| Portfolio turnover rateI | 106%J | 140%J |
A For the period February 1, 2017 (commencement of sale of shares) to July 31, 2017.
B Calculated based on average shares outstanding during the period.
C Amount represents less than $.005 per share.
D Total returns for periods of less than one year are not annualized.
E Total returns would have been lower if certain expenses had not been reduced during the applicable periods shown.
F Fees and expenses of any underlying Fidelity Central Funds are not included in the Fund's expense ratio. The Fund indirectly bears its proportionate share of the expenses of any underlying Fidelity Central Funds.
G Expense ratios reflect operating expenses of the class. Expenses before reductions do not reflect amounts reimbursed by the investment adviser or reductions from brokerage service arrangements or reductions from other expense offset arrangements and do not represent the amount paid by the class during periods when reimbursements or reductions occur. Expense ratios before reductions for start-up periods may not be representative of longer-term operating periods. Expenses net of fee waivers reflect expenses after reimbursement by the investment adviser but prior to reductions from brokerage service arrangements or other expense offset arrangements. Expenses net of all reductions represent the net expenses paid by the class.
H Annualized
I Amount does not include the portfolio activity of any underlying Fidelity Central Funds.
J Portfolio turnover rate excludes securities received or delivered in-kind.
See accompanying notes which are an integral part of the financial statements.
Notes to Financial Statements
For the period ended July 31, 2018
1. Organization.
Fidelity Small Cap Growth Fund (the Fund) is a fund of Fidelity Securities Fund (the Trust) and is authorized to issue an unlimited number of shares. The Trust is registered under the Investment Company Act of 1940, as amended (the 1940 Act), as an open-end management investment company organized as a Massachusetts business trust. The Fund offers Class A, Class M, Class C, Small Cap Growth, Class I and Class Z shares, each of which has equal rights as to assets and voting privileges. Effective the close of business on February 2, 2018, the Fund was closed to new accounts with certain exceptions. Each class has exclusive voting rights with respect to matters that affect that class.
2. Investments in Fidelity Central Funds.
The Fund invests in Fidelity Central Funds, which are open-end investment companies generally available only to other investment companies and accounts managed by the investment adviser and its affiliates. The Fund's Schedule of Investments lists each of the Fidelity Central Funds held as of period end, if any, as an investment of the Fund, but does not include the underlying holdings of each Fidelity Central Fund. As an Investing Fund, the Fund indirectly bears its proportionate share of the expenses of the underlying Fidelity Central Funds.
The Money Market Central Funds seek preservation of capital and current income and are managed by Fidelity Investments Money Management, Inc. (FIMM), an affiliate of the investment adviser. Annualized expenses of the Money Market Central Funds as of their most recent shareholder report date are less than .005%.
A complete unaudited list of holdings for each Fidelity Central Fund is available upon request or at the Securities and Exchange Commission (the SEC) website at www.sec.gov. In addition, the financial statements of the Fidelity Central Funds, which are not covered by the Fund's Report of Independent Registered Public Accounting Firm, are available on the SEC website or upon request.
3. Significant Accounting Policies.
The Fund is an investment company and applies the accounting and reporting guidance of the Financial Accounting Standards Board (FASB) Accounting Standards Codification Topic 946 Financial Services – Investments Companies. The financial statements have been prepared in conformity with accounting principles generally accepted in the United States of America (GAAP), which require management to make certain estimates and assumptions at the date of the financial statements. Actual results could differ from those estimates. Subsequent events, if any, through the date that the financial statements were issued have been evaluated in the preparation of the financial statements. The following summarizes the significant accounting policies of the Fund:
Investment Valuation. Investments are valued as of 4:00 p.m. Eastern time on the last calendar day of the period. The Board of Trustees (the Board) has delegated the day to day responsibility for the valuation of the Fund's investments to the Fair Value Committee (the Committee) established by the Fund's investment adviser. In accordance with valuation policies and procedures approved by the Board, the Fund attempts to obtain prices from one or more third party pricing vendors or brokers to value its investments. When current market prices, quotations or currency exchange rates are not readily available or reliable, investments will be fair valued in good faith by the Committee, in accordance with procedures adopted by the Board. Factors used in determining fair value vary by investment type and may include market or investment specific events. The frequency with which these procedures are used cannot be predicted and they may be utilized to a significant extent. The Committee oversees the Fund's valuation policies and procedures and reports to the Board on the Committee's activities and fair value determinations. The Board monitors the appropriateness of the procedures used in valuing the Fund's investments and ratifies the fair value determinations of the Committee.
The Fund categorizes the inputs to valuation techniques used to value its investments into a disclosure hierarchy consisting of three levels as shown below:
- Level 1 – quoted prices in active markets for identical investments
- Level 2 – other significant observable inputs (including quoted prices for similar investments, interest rates, prepayment speeds, etc.)
- Level 3 – unobservable inputs (including the Fund's own assumptions based on the best information available)
Valuation techniques used to value the Fund's investments by major category are as follows:
Equity securities, including restricted securities, for which market quotations are readily available, are valued at the last reported sale price or official closing price as reported by a third party pricing vendor on the primary market or exchange on which they are traded and are categorized as Level 1 in the hierarchy. In the event there were no sales during the day or closing prices are not available, securities are valued at the last quoted bid price or may be valued using the last available price and are generally categorized as Level 2 in the hierarchy. For foreign equity securities, when market or security specific events arise, comparisons to the valuation of American Depositary Receipts (ADRs), futures contracts, Exchange-Traded Funds (ETFs) and certain indexes as well as quoted prices for similar securities may be used and would be categorized as Level 2 in the hierarchy. Utilizing these techniques may result in transfers between Level 1 and Level 2. For equity securities, including restricted securities, where observable inputs are limited, assumptions about market activity and risk are used and these securities may be categorized as Level 3 in the hierarchy.
ETFs are valued at their last sale price or official closing price as reported by a third party pricing vendor on the primary market or exchange on which they are traded and are categorized as Level 1 in the hierarchy. In the event there were no sales during the day but the exchange reports a closing bid level, ETFs are valued at the closing bid and would be categorized as Level 1 in the hierarchy. In the event there was no closing bid, ETFs may be valued by another method that the Board believes reflects fair value in accordance with the Board's fair value pricing policies and may be categorized as Level 2 in the hierarchy.
Investments in open-end mutual funds, including the Fidelity Central Funds, are valued at their closing net asset value (NAV) each business day and are categorized as Level 1 in the hierarchy.
Changes in valuation techniques may result in transfers in or out of an assigned level within the disclosure hierarchy. The aggregate value of investments by input level as of July 31, 2018 is included at the end of the Fund's Schedule of Investments.
Foreign Currency. The Fund may use foreign currency contracts to facilitate transactions in foreign-denominated securities. Gains and losses from these transactions may arise from changes in the value of the foreign currency or if the counterparties do not perform under the contracts' terms.
Foreign-denominated assets, including investment securities, and liabilities are translated into U.S. dollars at the exchange rates at period end. Purchases and sales of investment securities, income and dividends received and expenses denominated in foreign currencies are translated into U.S. dollars at the exchange rate in effect on the transaction date.
The effects of exchange rate fluctuations on investments are included with the net realized and unrealized gain (loss) on investment securities. Other foreign currency transactions resulting in realized and unrealized gain (loss) are disclosed separately.
Investment Transactions and Income. For financial reporting purposes, the Fund's investment holdings and NAV include trades executed through the end of the last business day of the period. The NAV per share for processing shareholder transactions is calculated as of the close of business of the New York Stock Exchange (NYSE), normally 4:00 p.m. Eastern time and includes trades executed through the end of the prior business day. Gains and losses on securities sold are determined on the basis of identified cost and include proceeds received from litigation. Dividend income is recorded on the ex-dividend date, except for certain dividends from foreign securities where the ex-dividend date may have passed, which are recorded as soon as the Fund is informed of the ex-dividend date. Non-cash dividends included in dividend income, if any, are recorded at the fair market value of the securities received. Income and capital gain distributions from Fidelity Central Funds, if any, are recorded on the ex-dividend date. Certain distributions received by the Fund represent a return of capital or capital gain. The Fund determines the components of these distributions subsequent to the ex-dividend date, based upon receipt of tax filings or other correspondence relating to the underlying investment. These distributions are recorded as a reduction of cost of investments and/or as a realized gain. Investment income is recorded net of foreign taxes withheld where recovery of such taxes is uncertain.
Class Allocations and Expenses. Investment income, realized and unrealized capital gains and losses, common expenses of the Fund, and certain fund-level expense reductions, if any, are allocated daily on a pro-rata basis to each class based on the relative net assets of each class to the total net assets of the Fund. Each class differs with respect to transfer agent and distribution and service plan fees incurred. Certain expense reductions may also differ by class. For the reporting period, the allocated portion of income and expenses to each class as a percent of its average net assets may vary due to the timing of recording these transactions in relation to fluctuating net assets of the classes. Expenses directly attributable to a fund are charged to that fund. Expenses attributable to more than one fund are allocated among the respective funds on the basis of relative net assets or other appropriate methods. Expense estimates are accrued in the period to which they relate and adjustments are made when actual amounts are known.
Income Tax Information and Distributions to Shareholders. Each year, the Fund intends to qualify as a regulated investment company under Subchapter M of the Internal Revenue Code, including distributing substantially all of its taxable income and realized gains. As a result, no provision for U.S. Federal income taxes is required. As of July 31, 2018, the Fund did not have any unrecognized tax benefits in the financial statements; nor is the Fund aware of any tax positions for which it is reasonably possible that the total amounts of unrecognized tax benefits will significantly change in the next twelve months. The Fund files a U.S. federal tax return, in addition to state and local tax returns as required. The Fund's federal income tax returns are subject to examination by the Internal Revenue Service (IRS) for a period of three fiscal years after they are filed. State and local tax returns may be subject to examination for an additional fiscal year depending on the jurisdiction. Foreign taxes are provided for based on the Fund's understanding of the tax rules and rates that exist in the foreign markets in which it invests.
Distributions are declared and recorded on the ex-dividend date. Income and capital gain distributions are declared separately for each class. Income and capital gain distributions are determined in accordance with income tax regulations, which may differ from GAAP. In addition, the Fund claimed a portion of the payment made to redeeming shareholders as a distribution for income tax purposes.
Capital accounts within the financial statements are adjusted for permanent book-tax differences. These adjustments have no impact on net assets or the results of operations. Capital accounts are not adjusted for temporary book-tax differences which will reverse in a subsequent period.
Book-tax differences are primarily due to foreign currency transactions, redemptions in kind, partnerships, net operating losses and losses deferred due to wash sales.
As of period end, the cost and unrealized appreciation (depreciation) in securities, and derivatives if applicable, for federal income tax purposes were as follows:
| Gross unrealized appreciation | $1,032,044,061 |
| Gross unrealized depreciation | (111,085,933) |
| Net unrealized appreciation (depreciation) | $920,958,128 |
| Tax Cost | $3,866,740,864 |
The tax-based components of distributable earnings as of period end were as follows:
| Undistributed ordinary income | $178,562,080 |
| Undistributed long-term capital gain | $248,608,767 |
| Net unrealized appreciation (depreciation) on securities and other investments | $917,019,558 |
The tax character of distributions paid was as follows:
| | July 31, 2018 | July 31, 2017 |
| Ordinary Income | $18,559,818 | $ - |
| Long-term Capital Gains | 218,102,797 | 17,131,591 |
| Total | $236,662,615 | $ 17,131,591 |
Short-Term Trading (Redemption) Fees. Shares held by investors in the Fund less than 90 days may have been subject to a redemption fee equal to 1.50% of the NAV of shares redeemed. All redemption fees, which reduce the proceeds of the shareholder redemption, are retained by the Fund and accounted for as an addition to paid in capital. In November 2017, the Board of Trustees approved the elimination of these redemption fees effective December 18, 2017.
Restricted Securities. The Fund may invest in securities that are subject to legal or contractual restrictions on resale. These securities generally may be resold in transactions exempt from registration or to the public if the securities are registered. Disposal of these securities may involve time-consuming negotiations and expense, and prompt sale at an acceptable price may be difficult. Information regarding restricted securities is included at the end of the Fund's Schedule of Investments.
4. Purchases and Sales of Investments.
Purchases and sales of securities, other than short-term securities and in-kind transactions, aggregated $4,636,714,186 and $4,111,567,021, respectively.
Redemptions In-Kind. During the period, 3,806,167 shares of the Fund held by unaffiliated entities were redeemed in-kind for investments and cash, with a value of $99,242,171. The net realized gain of $30,767,545 on investments delivered through the in-kind redemptions is included in the accompanying Statement of Operations. The amount of the redemptions is included in share transactions activity shown in the accompanying Statement of Changes in Net Assets as well as the Notes to Financial Statements. The Fund recognized no gain or loss for federal income tax purposes.
5. Fees and Other Transactions with Affiliates.
Management Fee. Fidelity Management & Research Company (the investment adviser) and its affiliates provide the Fund with investment management related services for which the Fund pays a monthly management fee. The management fee is the sum of an individual fund fee rate that is based on an annual rate of .45% of the Fund's average net assets and an annualized group fee rate that averaged .24% during the period. The group fee rate is based upon the average net assets of all the mutual funds advised by the investment adviser, including any mutual funds previously advised by the investment adviser that are currently advised by Fidelity SelectCo, LLC, an affiliate of the investment adviser. The group fee rate decreases as assets under management increase and increases as assets under management decrease. In addition, the management fee is subject to a performance adjustment (up to a maximum of +/- .20% of the Fund's average net assets over a 36 month performance period). The upward or downward adjustment to the management fee is based on the relative investment performance of Small Cap Growth as compared to its benchmark index, the Russell 2000 Growth Index, over the same 36 month performance period. For the reporting period, the total annual management fee rate, including the performance adjustment, was .81% of the Fund's average net assets. The performance adjustment included in the management fee rate may be higher or lower than the maximum performance adjustment rate due to the difference between the average net assets for the reporting and performance periods.
Distribution and Service Plan Fees. In accordance with Rule 12b-1 of the 1940 Act, the Fund has adopted separate Distribution and Service Plans for each class of shares. Certain classes pay Fidelity Distributors Corporation (FDC), an affiliate of the investment adviser, separate Distribution and Service Fees, each of which is based on an annual percentage of each class' average net assets. In addition, FDC may pay financial intermediaries for selling shares of the Fund and providing shareholder support services. For the period, the Distribution and Service Fee rates, total fees and amounts retained by FDC were as follows:
| | Distribution Fee | Service Fee | Total Fees | Retained by FDC |
| Class A | -% | .25% | $686,800 | $73,556 |
| Class M | .25% | .25% | 372,350 | 4,398 |
| Class C | .75% | .25% | 1,242,020 | 297,505 |
| | | | $2,301,170 | $375,459 |
Sales Load. FDC may receive a front-end sales charge of up to 5.75% for selling Class A shares and 3.50% for selling Class M shares, some of which is paid to financial intermediaries for selling shares of the Fund. Depending on the holding period, FDC may receive contingent deferred sales charges levied on Class A, Class M and Class C redemptions. The deferred sales charges are 1.00% for Class C shares, 1.00% for certain purchases of Class A shares and .25% for certain purchases of Class M shares.
For the period, sales charge amounts retained by FDC were as follows:
| | Retained by FDC |
| Class A | $116,202 |
| Class M | 10,533 |
| Class C(a) | 12,259 |
| | $138,994 |
(a) When Class C shares are initially sold, FDC pays commissions from its own resources to financial intermediaries through which the sales are made.
Transfer Agent Fees. Fidelity Investments Institutional Operations Company, Inc., (FIIOC), an affiliate of the investment adviser, is the transfer, dividend disbursing and shareholder servicing agent for each class of the Fund. FIIOC receives account fees and asset-based fees that vary according to the account size and type of account of the shareholders of the respective classes of the Fund except for Class Z. FIIOC receives an asset-based fee of Class Z's average net assets. FIIOC pays for typesetting, printing and mailing of shareholder reports, except proxy statements.
For the period, transfer agent fees for each class were as follows:
| | Amount | % of Class-Level Average Net Assets |
| Class A | $574,677 | .21 |
| Class M | 169,941 | .23 |
| Class C | 270,078 | .22 |
| Small Cap Growth | 4,981,645 | .17 |
| Class I | 1,063,279 | .19 |
| Class Z | 34,619 | .05 |
| | $7,094,239 | |
Accounting and Security Lending Fees. Fidelity Service Company, Inc. (FSC), an affiliate of the investment adviser, maintains the Fund's accounting records. The accounting fee is based on the level of average net assets for each month. Under a separate contract, FSC administers the security lending program. The security lending fee is based on the number and duration of lending transactions. For the period, the fees were equivalent to an annual rate of .03%.
Brokerage Commissions. The Fund placed a portion of its portfolio transactions with brokerage firms which are affiliates of the investment adviser. Brokerage commissions are included in net realized gain (loss) and change in net unrealized appreciation (depreciation) in the Statement of Operations. The commissions paid to these affiliated firms were $178,977 for the period.
Interfund Lending Program. Pursuant to an Exemptive Order issued by the SEC, the Fund, along with other registered investment companies having management contracts with Fidelity Management & Research Company (FMR) or other affiliated entities of FMR, may participate in an interfund lending program. This program provides an alternative credit facility allowing the funds to borrow from, or lend money to, other participating affiliated funds. At period end, there were no interfund loans outstanding. The Fund's activity in this program during the period for which loans were outstanding was as follows:
| Borrower or Lender | Average Loan Balance | Weighted Average Interest Rate | Interest Expense |
| Borrower | $16,932,143 | 1.63% | $5,356 |
Interfund Trades. The Fund may purchase from or sell securities to other Fidelity Funds under procedures adopted by the Board. The procedures have been designed to ensure these interfund trades are executed in accordance with Rule 17a-7 of the 1940 Act. Interfund trades are included within the respective purchases and sales amounts shown in the Purchases and Sales of Investments note.
Prior Fiscal Year Redemptions In-Kind. During the prior period, 3,120,161 shares of the Fund held by an affiliated entity were redeemed in kind for investments and cash with a value of $74,384,639. The Fund had a net realized gain of $18,817,235 on investments delivered through in-kind redemptions. The amount of in-kind redemptions is included in share transactions in the accompanying Statement of Changes in Net Assets as well as the Notes to Financial Statements. The Fund recognized no gain or loss for federal income tax purposes.
Other. During the period, the investment adviser reimbursed the Fund for certain losses in the amount of $1,426.
6. Committed Line of Credit.
The Fund participates with other funds managed by the investment adviser or an affiliate in a $4.25 billion credit facility (the "line of credit") to be utilized for temporary or emergency purposes to fund shareholder redemptions or for other short-term liquidity purposes. The Fund has agreed to pay commitment fees on its pro-rata portion of the line of credit, which amounted to $10,750 and is reflected in Miscellaneous expenses on the Statement of Operations. During the period, the Fund did not borrow on this line of credit.
7. Security Lending.
The Fund lends portfolio securities through a lending agent from time to time in order to earn additional income. For equity securities, a lending agent is used and may loan securities to certain qualified borrowers, including Fidelity Capital Markets (FCM), a broker-dealer affiliated with the Fund. On the settlement date of the loan, the Fund receives collateral (in the form of U.S. Treasury obligations, letters of credit and/or cash) against the loaned securities and maintains collateral in an amount not less than 100% of the market value of the loaned securities during the period of the loan. The market value of the loaned securities is determined at the close of business of the Fund and any additional required collateral is delivered to the Fund on the next business day. The Fund or borrower may terminate the loan at any time, and if the borrower defaults on its obligation to return the securities loaned because of insolvency or other reasons, the Fund may apply collateral received from the borrower against the obligation. The Fund may experience delays and costs in recovering the securities loaned. Any cash collateral received is invested in the Fidelity Securities Lending Cash Central Fund. The value of loaned securities and cash collateral at period end are disclosed on the Fund's Statement of Assets and Liabilities. The value of securities loaned to FCM at period end was $7,727,847. Security lending income represents the income earned on investing cash collateral, less rebates paid to borrowers and any lending agent fees associated with the loan, plus any premium payments received for lending certain types of securities. Security lending income is presented in the Statement of Operations as a component of income from Fidelity Central Funds and includes $355,119 from securities loaned to FCM.
8. Expense Reductions.
Commissions paid to certain brokers with whom the investment adviser, or its affiliates, places trades on behalf of the Fund include an amount in addition to trade execution, which may be rebated back to the Fund to offset certain expenses. This amount totaled $380,256 for the period. In addition, through arrangements with the Fund's custodian, credits realized as a result of certain uninvested cash balances were used to reduce the Fund's expenses. During the period, these credits reduced the Fund's custody expenses by $882.
In addition, during the period the investment adviser reimbursed and/or waived a portion of fund-level operating expenses in the amount of $37,828.
9. Distributions to Shareholders.
Distributions to shareholders of each class were as follows:
| | Year ended
July 31, 2018 | Year ended
July 31, 2017 |
| From net realized gain | | |
| Class A | $16,634,776 | $1,450,853 |
| Class M | 4,795,381 | 443,203 |
| Class C | 8,085,052 | 670,953 |
| Small Cap Growth | 173,515,943 | 13,079,834 |
| Class I | 31,458,120 | 1,486,748 |
| Class Z | 2,173,343 | – |
| Total | $236,662,615 | $17,131,591 |
10. Share Transactions.
Share transactions for each class were as follows and may contain automatic conversions between classes or exchanges between affiliated funds:
| | Shares | Shares | Dollars | Dollars |
| | Year ended July 31, 2018 | Year ended July 31, 2017(a) | Year ended July 31, 2018 | Year ended July 31, 2017(a) |
| Class A | | | | |
| Shares sold | 3,599,713 | 5,020,720 | $88,330,995 | $104,451,830 |
| Reinvestment of distributions | 737,094 | 72,980 | 16,518,361 | 1,418,726 |
| Shares redeemed | (2,350,141) | (4,804,338) | (58,390,054) | (100,455,311) |
| Net increase (decrease) | 1,986,666 | 289,362 | $46,459,302 | $5,415,245 |
| Class M | | | | |
| Shares sold | 577,387 | 722,906 | $13,785,910 | $14,585,563 |
| Reinvestment of distributions | 219,933 | 23,093 | 4,778,389 | 437,379 |
| Shares redeemed | (556,511) | (740,353) | (13,344,376) | (14,879,815) |
| Net increase (decrease) | 240,809 | 5,646 | $5,219,923 | $143,127 |
| Class C | | | | |
| Shares sold | 1,485,229 | 1,684,413 | $32,475,020 | $31,979,652 |
| Reinvestment of distributions | 394,045 | 36,440 | 7,927,935 | 645,354 |
| Shares redeemed | (1,132,670) | (1,001,342) | (25,169,389) | (18,971,580) |
| Net increase (decrease) | 746,604 | 719,511 | $15,233,566 | $13,653,426 |
| Small Cap Growth | | | | |
| Shares sold | 40,826,489 | 46,489,671 | $1,050,416,894 | $1,008,614,407 |
| Reinvestment of distributions | 7,124,344 | 624,373 | 166,042,374 | 12,562,394 |
| Shares redeemed | (31,622,132)(b) | (28,815,440)(c) | (815,066,882)(b) | (638,181,914)(c) |
| Net increase (decrease) | 16,328,701 | 18,298,604 | $401,392,386 | $382,994,887 |
| Class I | | | | |
| Shares sold | 14,717,864 | 11,204,169 | $373,830,212 | $245,745,969 |
| Reinvestment of distributions | 1,279,506 | 68,251 | 29,928,913 | 1,376,613 |
| Shares redeemed | (8,645,418) | (3,191,470) | (225,106,522) | (69,277,095) |
| Net increase (decrease) | 7,351,952 | 8,080,950 | $178,652,603 | $177,845,487 |
| Class Z | | | | |
| Shares sold | 4,877,377 | 782,917 | $125,972,662 | $18,185,267 |
| Reinvestment of distributions | 72,161 | – | 1,697,869 | – |
| Shares redeemed | (1,090,733) | (11,517) | (28,900,593) | (271,781) |
| Net increase (decrease) | 3,858,805 | 771,400 | $98,769,938 | $17,913,486 |
(a) Share transactions for Class Z are for the period February 1, 2017 (commencement of sale of shares) to July 31, 2018.
(b) Amount includes in-kind redemptions (see the Redemptions In-Kind note for additional details).
(c) Amount includes in-kind redemptions (see the Prior Fiscal Year Redemptions In-Kind note for additional details).
11. Other.
The Fund's organizational documents provide former and current trustees and officers with a limited indemnification against liabilities arising in connection with the performance of their duties to the Fund. In the normal course of business, the Fund may also enter into contracts that provide general indemnifications. The Fund's maximum exposure under these arrangements is unknown as this would be dependent on future claims that may be made against the Fund. The risk of material loss from such claims is considered remote.
Report of Independent Registered Public Accounting Firm
To the Board of Trustees of Fidelity Securities Fund and Shareholders of Fidelity Small Cap Growth Fund:
Opinion on the Financial Statements
We have audited the accompanying statement of assets and liabilities, including the schedule of investments, of Fidelity Small Cap Growth Fund (one of the funds constituting Fidelity Securities Fund, referred to hereafter as the "Fund") as of July 31, 2018, the related statement of operations for the year ended July 31, 2018, the statement of changes in net assets for each of the two years in the period ended July 31, 2018, including the related notes, and the financial highlights for each of the periods indicated therein (collectively referred to as the “financial statements”). In our opinion, the financial statements present fairly, in all material respects, the financial position of the Fund as of July 31, 2018, the results of its operations for the year then ended, the changes in its net assets for each of the two years in the period ended July 31, 2018 and the financial highlights for the periods indicated therein in conformity with accounting principles generally accepted in the United States of America.
Basis for Opinion
These financial statements are the responsibility of the Fund’s management. Our responsibility is to express an opinion on the Fund’s financial statements based on our audits. We are a public accounting firm registered with the Public Company Accounting Oversight Board (United States) (“PCAOB”) and are required to be independent with respect to the Fund in accordance with the U.S. federal securities laws and the applicable rules and regulations of the Securities and Exchange Commission and the PCAOB.
We conducted our audits of these financial statements in accordance with the standards of the PCAOB. Those standards require that we plan and perform the audit to obtain reasonable assurance about whether the financial statements are free of material misstatement, whether due to error or fraud.
Our audits included performing procedures to assess the risks of material misstatement of the financial statements, whether due to error or fraud, and performing procedures that respond to those risks. Such procedures included examining, on a test basis, evidence regarding the amounts and disclosures in the financial statements. Our audits also included evaluating the accounting principles used and significant estimates made by management, as well as evaluating the overall presentation of the financial statements. Our procedures included confirmation of securities owned as of July 31, 2018 by correspondence with the custodian and brokers; when replies were not received from brokers, we performed other auditing procedures. We believe that our audits provide a reasonable basis for our opinion.
PricewaterhouseCoopers LLP
Boston, Massachusetts
September 14, 2018
We have served as the auditor of one or more investment companies in the Fidelity group of funds since 1932.
Trustees and Officers
The Trustees, Members of the Advisory Board (if any), and officers of the trust and fund, as applicable, are listed below. The Board of Trustees governs the fund and is responsible for protecting the interests of shareholders. The Trustees are experienced executives who meet periodically throughout the year to oversee the fund's activities, review contractual arrangements with companies that provide services to the fund, oversee management of the risks associated with such activities and contractual arrangements, and review the fund's performance. Except for Jonathan Chiel, each of the Trustees oversees 286 funds. Mr. Chiel oversees 150 funds.
The Trustees hold office without limit in time except that (a) any Trustee may resign; (b) any Trustee may be removed by written instrument, signed by at least two-thirds of the number of Trustees prior to such removal; (c) any Trustee who requests to be retired or who has become incapacitated by illness or injury may be retired by written instrument signed by a majority of the other Trustees; and (d) any Trustee may be removed at any special meeting of shareholders by a two-thirds vote of the outstanding voting securities of the trust. Each Trustee who is not an interested person (as defined in the 1940 Act) of the trust and the fund is referred to herein as an Independent Trustee. Each Independent Trustee shall retire not later than the last day of the calendar year in which his or her 75th birthday occurs. The Independent Trustees may waive this mandatory retirement age policy with respect to individual Trustees. Officers and Advisory Board Members hold office without limit in time, except that any officer or Advisory Board Member may resign or may be removed by a vote of a majority of the Trustees at any regular meeting or any special meeting of the Trustees. Except as indicated, each individual has held the office shown or other offices in the same company for the past five years.
The fund’s Statement of Additional Information (SAI) includes more information about the Trustees. To request a free copy, call Fidelity at 1-800-544-8544.
Experience, Skills, Attributes, and Qualifications of the Trustees. The Governance and Nominating Committee has adopted a statement of policy that describes the experience, qualifications, attributes, and skills that are necessary and desirable for potential Independent Trustee candidates (Statement of Policy). The Board believes that each Trustee satisfied at the time he or she was initially elected or appointed a Trustee, and continues to satisfy, the standards contemplated by the Statement of Policy. The Governance and Nominating Committee also engages professional search firms to help identify potential Independent Trustee candidates who have the experience, qualifications, attributes, and skills consistent with the Statement of Policy. From time to time, additional criteria based on the composition and skills of the current Independent Trustees, as well as experience or skills that may be appropriate in light of future changes to board composition, business conditions, and regulatory or other developments, have also been considered by the professional search firms and the Governance and Nominating Committee. In addition, the Board takes into account the Trustees' commitment and participation in Board and committee meetings, as well as their leadership of standing and ad hoc committees throughout their tenure.
In determining that a particular Trustee was and continues to be qualified to serve as a Trustee, the Board has considered a variety of criteria, none of which, in isolation, was controlling. The Board believes that, collectively, the Trustees have balanced and diverse experience, qualifications, attributes, and skills, which allow the Board to operate effectively in governing the fund and protecting the interests of shareholders. Information about the specific experience, skills, attributes, and qualifications of each Trustee, which in each case led to the Board's conclusion that the Trustee should serve (or continue to serve) as a trustee of the fund, is provided below.
Board Structure and Oversight Function. James C. Curvey is an interested person and currently serves as Chairman. The Trustees have determined that an interested Chairman is appropriate and benefits shareholders because an interested Chairman has a personal and professional stake in the quality and continuity of services provided to the fund. Independent Trustees exercise their informed business judgment to appoint an individual of their choosing to serve as Chairman, regardless of whether the Trustee happens to be independent or a member of management. The Independent Trustees have determined that they can act independently and effectively without having an Independent Trustee serve as Chairman and that a key structural component for assuring that they are in a position to do so is for the Independent Trustees to constitute a substantial majority for the Board. The Independent Trustees also regularly meet in executive session. Ned C. Lautenbach serves as Chairman of the Independent Trustees and as such (i) acts as a liaison between the Independent Trustees and management with respect to matters important to the Independent Trustees and (ii) with management prepares agendas for Board meetings.
Fidelity® funds are overseen by different Boards of Trustees. The fund's Board oversees Fidelity's high income and certain equity funds, and other Boards oversee Fidelity's investment-grade bond, money market, asset allocation, and other equity funds. The asset allocation funds may invest in Fidelity® funds overseen by the fund's Board. The use of separate Boards, each with its own committee structure, allows the Trustees of each group of Fidelity® funds to focus on the unique issues of the funds they oversee, including common research, investment, and operational issues. On occasion, the separate Boards establish joint committees to address issues of overlapping consequences for the Fidelity® funds overseen by each Board.
The Trustees operate using a system of committees to facilitate the timely and efficient consideration of all matters of importance to the Trustees, the fund, and fund shareholders and to facilitate compliance with legal and regulatory requirements and oversight of the fund's activities and associated risks. The Board, acting through its committees, has charged FMR and its affiliates with (i) identifying events or circumstances the occurrence of which could have demonstrably adverse effects on the fund's business and/or reputation; (ii) implementing processes and controls to lessen the possibility that such events or circumstances occur or to mitigate the effects of such events or circumstances if they do occur; and (iii) creating and maintaining a system designed to evaluate continuously business and market conditions in order to facilitate the identification and implementation processes described in (i) and (ii) above. Because the day-to-day operations and activities of the fund are carried out by or through FMR, its affiliates, and other service providers, the fund's exposure to risks is mitigated but not eliminated by the processes overseen by the Trustees. While each of the Board's committees has responsibility for overseeing different aspects of the fund's activities, oversight is exercised primarily through the Operations, Audit, and Compliance Committees. In addition, the Independent Trustees have worked with Fidelity to enhance the Board's oversight of investment and financial risks, legal and regulatory risks, technology risks, and operational risks, including the development of additional risk reporting to the Board. Appropriate personnel, including but not limited to the fund's Chief Compliance Officer (CCO), FMR's internal auditor, the independent accountants, the fund's Treasurer and portfolio management personnel, make periodic reports to the Board's committees, as appropriate, including an annual review of Fidelity's risk management program for the Fidelity® funds. The responsibilities of each standing committee, including their oversight responsibilities, are described further under "Standing Committees of the Trustees."
Interested Trustees*:
Correspondence intended for a Trustee who is an interested person may be sent to Fidelity Investments, 245 Summer Street, Boston, Massachusetts 02210.
Name, Year of Birth; Principal Occupations and Other Relevant Experience+
Jonathan Chiel (1957)
Year of Election or Appointment: 2016
Trustee
Mr. Chiel also serves as Trustee of other Fidelity® funds. Mr. Chiel is Executive Vice President and General Counsel for FMR LLC (diversified financial services company, 2012-present). Previously, Mr. Chiel served as general counsel (2004-2012) and senior vice president and deputy general counsel (2000-2004) for John Hancock Financial Services; a partner with Choate, Hall & Stewart (1996-2000) (law firm); and an Assistant United States Attorney for the United States Attorney’s Office of the District of Massachusetts (1986-95), including Chief of the Criminal Division (1993-1995). Mr. Chiel is a director on the boards of the Boston Bar Foundation and the Maimonides School.
James C. Curvey (1935)
Year of Election or Appointment: 2007
Trustee
Chairman of the Board of Trustees
Mr. Curvey also serves as Trustee of other Fidelity® funds. Mr. Curvey is Vice Chairman (2007-present) and Director of FMR LLC (diversified financial services company). In addition, Mr. Curvey is an Overseer Emeritus for the Boston Symphony Orchestra, a Director of Artis-Naples, and a Trustee of Brewster Academy in Wolfeboro, New Hampshire. Previously, Mr. Curvey served as a Director of Fidelity Research & Analysis Co. (investment adviser firm, 2009-2018), Director of Fidelity Investments Money Management, Inc. (investment adviser firm, 2009-2014) and a Director of FMR and FMR Co., Inc. (investment adviser firms, 2007-2014).
Charles S. Morrison (1960)
Year of Election or Appointment: 2014
Trustee
Mr. Morrison also serves as Trustee of other funds. He serves as President of Fidelity SelectCo, LLC (investment adviser firm, 2017-present) and Fidelity Management & Research Company (FMR) (investment adviser firm, 2016-present), a Director of Fidelity Investments Money Management, Inc. (FIMM) (investment adviser firm, 2014-present), Director of Fidelity SelectCo, LLC (investment adviser firm, 2014-present), President, Asset Management (2014-present), and is an employee of Fidelity Investments. Previously, Mr. Morrison served as Vice President of Fidelity's Fixed Income and Asset Allocation Funds (2012-2014), President, Fixed Income (2011-2014), Vice President of Fidelity's Money Market Funds (2005-2009), President, Money Market Group Leader of FMR (investment adviser firm, 2009), and Senior Vice President, Money Market Group of FMR (2004-2009). Mr. Morrison also served as Vice President of Fidelity's Bond Funds (2002-2005), certain Balanced Funds (2002-2005), and certain Asset Allocation Funds (2002-2007), and as Senior Vice President (2002-2005) of Fidelity's Bond Division.
* Determined to be an “Interested Trustee” by virtue of, among other things, his or her affiliation with the trust or various entities under common control with FMR.
+ The information includes the Trustee's principal occupation during the last five years and other information relating to the experience, attributes, and skills relevant to the Trustee's qualifications to serve as a Trustee, which led to the conclusion that the Trustee should serve as a Trustee for the fund.
Independent Trustees:
Correspondence intended for an Independent Trustee may be sent to Fidelity Investments, P.O. Box 55235, Boston, Massachusetts 02205-5235.
Name, Year of Birth; Principal Occupations and Other Relevant Experience+
Dennis J. Dirks (1948)
Year of Election or Appointment: 2005
Trustee
Mr. Dirks also serves as Trustee of other Fidelity® funds. Prior to his retirement in May 2003, Mr. Dirks was Chief Operating Officer and a member of the Board of The Depository Trust & Clearing Corporation (DTCC). He also served as President, Chief Operating Officer, and Board member of The Depository Trust Company (DTC) and President and Board member of the National Securities Clearing Corporation (NSCC). In addition, Mr. Dirks served as Chief Executive Officer and Board member of the Government Securities Clearing Corporation, Chief Executive Officer and Board member of the Mortgage-Backed Securities Clearing Corporation, as a Trustee and a member of the Finance Committee of Manhattan College (2005-2008), as a Trustee and a member of the Finance Committee of AHRC of Nassau County (2006-2008), as a member of the Independent Directors Council (IDC) Governing Council (2010-2015), and as a member of the Board of Directors for The Brookville Center for Children’s Services, Inc. (2009-2017). Mr. Dirks is a member of the Finance Committee (2016-present), Board of Directors (2017-present) and Board of Trustees (2018-present) and is Treasurer (2018-present) of the Asolo Repertory Theatre.
Donald F. Donahue (1950)
Year of Election or Appointment: 2018
Trustee
Mr. Donahue also serves as a Trustee of other Fidelity® funds. Mr. Donahue is President and Chief Executive Officer of Miranda Partners, LLC (risk consulting for the financial services industry, 2012-present). Previously, Mr. Donahue served as a Member of the Advisory Board of certain Fidelity® funds (2015-2018) and Chief Executive Officer (2006-2012), Chief Operating Officer (2003-2006), and Managing Director, Customer Marketing and Development (1999-2003) of The Depository Trust & Clearing Corporation (financial markets infrastructure). Mr. Donahue serves as a Member (2007-present) and Co-Chairman (2016-present) of the Board of Directors of United Way of New York, Member of the Board of Directors of NYC Leadership Academy (2012-present) and Member of the Board of Advisors of Ripple Labs, Inc. (financial services, 2015-present). He also served as Chairman (2010-2012) and Member of the Board of Directors (2012-2013) of Omgeo, LLC (financial services), Treasurer of United Way of New York (2012-2016), and Member of the Board of Directors of XBRL US (financial services non-profit, 2009-2012) and the International Securities Services Association (2009-2012).
Alan J. Lacy (1953)
Year of Election or Appointment: 2008
Trustee
Mr. Lacy also serves as Trustee of other Fidelity® funds. Mr. Lacy serves as a Director of Bristol-Myers Squibb Company (global pharmaceuticals, 2008-present). He is a Trustee of the California Chapter of The Nature Conservancy (2015-present) and a Director of the Center for Advanced Study in the Behavioral Sciences at Stanford University (2015-present). In addition, Mr. Lacy served as Senior Adviser (2007-2014) of Oak Hill Capital Partners, L.P. (private equity) and also served as Chief Executive Officer (2005) and Vice Chairman (2005-2006) of Sears Holdings Corporation (retail) and Chief Executive Officer and Chairman of the Board of Sears, Roebuck and Co. (retail, 2000-2005). Previously, Mr. Lacy served as Chairman (2014-2017) and a member (2010-2017) of the Board of Directors of Dave & Buster’s Entertainment, Inc. (restaurant and entertainment complexes), as Chairman (2008-2011) and a member (2006-2015) of the Board of Trustees of the National Parks Conservation Association, and as a member of the Board of Directors for The Hillman Companies, Inc. (hardware wholesalers, 2010-2014), Earth Fare, Inc. (retail grocery, 2010-2014), and The Western Union Company (global money transfer, 2006-2011).
Ned C. Lautenbach (1944)
Year of Election or Appointment: 2000
Trustee
Chairman of the Independent Trustees
Mr. Lautenbach also serves as Trustee of other Fidelity® funds. Mr. Lautenbach currently serves as Vice Chair of the Board of Governors, State University System of Florida (2013-present) and is a member of the Council on Foreign Relations (1994-present). He is also a member and has most recently served as Chairman of the Board of Directors of Artis-Naples (2012-present). Previously, Mr. Lautenbach served as a member and then Lead Director of the Board of Directors of Eaton Corporation (diversified industrial, 1997-2016). He was also a Partner and Advisory Partner at Clayton, Dubilier & Rice, LLC (private equity investment, 1998-2010), as well as a Director of Sony Corporation (2006-2007). In addition, Mr. Lautenbach also had a 30-year career with IBM (technology company) during which time he served as Senior Vice President and a member of the Corporate Executive Committee (1968-1998).
Joseph Mauriello (1944)
Year of Election or Appointment: 2008
Trustee
Mr. Mauriello also serves as Trustee of other Fidelity® funds. Prior to his retirement in January 2006, Mr. Mauriello served in numerous senior management positions including Deputy Chairman and Chief Operating Officer (2004-2005), and Vice Chairman of Financial Services (2002-2004) of KPMG LLP US (professional services, 1965-2005). Mr. Mauriello currently serves as a member of the Board of Directors of XL Group plc. (global insurance and re-insurance, 2006-present) and the Independent Directors Council (IDC) Governing Council (2015-present). Previously, Mr. Mauriello served as a Director of the Hamilton Funds of the Bank of New York (2006-2007) and of Arcadia Resources Inc. (health care services and products, 2007-2012).
Cornelia M. Small (1944)
Year of Election or Appointment: 2005
Trustee
Ms. Small also serves as Trustee of other Fidelity® funds. Ms. Small is a member of the Board of Directors (2009-present) and Chair of the Investment Committee (2010-present) of the Teagle Foundation. Ms. Small also serves on the Investment Committee of the Berkshire Taconic Community Foundation (2008-present). Previously, Ms. Small served as Chairperson (2002-2008) and a member of the Investment Committee and Chairperson (2008-2012) and a member of the Board of Trustees of Smith College. In addition, Ms. Small served as Chief Investment Officer, Director of Global Equity Investments, and a member of the Board of Directors of Scudder, Stevens & Clark and Scudder Kemper Investments.
Garnett A. Smith (1947)
Year of Election or Appointment: 2018
Trustee
Mr. Smith also serves as Trustee of other Fidelity® funds. Prior to Mr. Smith's retirement, he served as Chairman and Chief Executive Officer of Inbrand Corp. (manufacturer of personal absorbent products, 1990-1997). He also served as President (1986-1990) of Inbrand Corp. Prior to his employment with Inbrand Corp., he was employed by a retail fabric chain and North Carolina National Bank. In addition, Mr. Smith served as a Member of the Advisory Board of certain Fidelity® funds (2012-2013) and as a board member of the Jackson Hole Land Trust (2009-2012).
David M. Thomas (1949)
Year of Election or Appointment: 2008
Trustee
Mr. Thomas also serves as Trustee of other Fidelity® funds. Mr. Thomas serves as Non-Executive Chairman of the Board of Directors of Fortune Brands Home and Security (home and security products, 2011-present), as a member of the Board of Directors (2004-present) and Presiding Director (2013-present) of Interpublic Group of Companies, Inc. (marketing communication), and as a member of the Board of Trustees of the University of Florida (2013-present). Previously, Mr. Thomas served as Executive Chairman (2005-2006) and Chairman and Chief Executive Officer (2000-2005) of IMS Health, Inc. (pharmaceutical and healthcare information solutions), and a Director of Fortune Brands, Inc. (consumer products, 2000-2011).
+ The information includes the Trustee's principal occupation during the last five years and other information relating to the experience, attributes, and skills relevant to the Trustee's qualifications to serve as a Trustee, which led to the conclusion that the Trustee should serve as a Trustee for the fund.
Advisory Board Members and Officers:
Correspondence intended for a Member of the Advisory Board (if any) may be sent to Fidelity Investments, P.O. Box 55235, Boston, Massachusetts 02205-5235. Correspondence intended for an officer or Peter S. Lynch may be sent to Fidelity Investments, 245 Summer Street, Boston, Massachusetts 02210. Officers appear below in alphabetical order.
Name, Year of Birth; Principal Occupation
Peter S. Lynch (1944)
Year of Election or Appointment: 2003
Member of the Advisory Board
Mr. Lynch also serves as Member of the Advisory Board of other Fidelity® funds. Mr. Lynch is Vice Chairman and a Director of FMR (investment adviser firm) and FMR Co., Inc. (investment adviser firm). In addition, Mr. Lynch serves as a Trustee of Boston College and as the Chairman of the Inner-City Scholarship Fund. Previously, Mr. Lynch served on the Special Olympics International Board of Directors (1997-2006).
William S. Stavropoulos (1939)
Year of Election or Appointment: 2018
Member of the Advisory Board
Mr. Stavropoulos also serves as Member of the Advisory Board of other Fidelity® funds. Mr. Stavropoulos serves as President and Founder of the Michigan Baseball Foundation, the Great Lakes Loons (2007-present). Mr. Stavropoulos is Chairman Emeritus of the Board of Directors of The Dow Chemical Company, where he previously served in numerous senior management positions, including President, CEO (1995-2000; 2002-2004), Chairman of the Executive Committee (2000-2006), and as a member of the Board of Directors (1990-2006). Currently, Mr. Stavropoulos is Chairman of the Board of Directors of Univar Inc. (global distributor of commodity and specialty chemicals), a Director of Teradata Corporation (data warehousing and technology solutions), and a member of the Advisory Board for Metalmark Capital LLC (private equity investment, 2005-present). Mr. Stavropoulos is an operating advisor to Clayton, Dubilier & Rice, LLC (private equity investment). In addition, Mr. Stavropoulos is a member of the University of Notre Dame Advisory Council for the College of Science, a Trustee of the Rollin L. Gerstacker Foundation, and a Director of Artis-Naples in Naples, Florida. Previously, Mr. Stavropoulos served as Trustee of certain Fidelity® funds (2001-2018) and as a Director of Chemical Financial Corporation (bank holding company, 1993-2012) and Tyco International, Ltd. (multinational manufacturing and services, 2007-2012).
Carol B. Tomé (1957)
Year of Election or Appointment: 2018
Member of the Advisory Board
Ms. Tomé also serves as Member of the Advisory Board of other Fidelity® funds. Ms. Tomé is Chief Financial Officer (2001-present) and Executive Vice President of Corporate Services (2007-present) of The Home Depot, Inc. (home improvement retailer) and a Director (2003-present) and Chair of the Audit Committee (2004-present) of United Parcel Service, Inc. (package delivery and supply chain management). Previously, Ms. Tomé served as Trustee of certain Fidelity® funds (2017), Senior Vice President of Finance and Accounting/Treasurer (2000-2007) and Vice President and Treasurer (1995-2000) of The Home Depot, Inc. and Chair of the Board (2010-2012), Vice Chair of the Board (2009 and 2013), and a Director (2008-2013) of the Federal Reserve Bank of Atlanta. Ms. Tomé is also a director or trustee of many community and professional organizations.
Michael E. Wiley (1950)
Year of Election or Appointment: 2018
Member of the Advisory Board
Mr. Wiley also serves as Trustee or Member of the Advisory Board of other Fidelity® funds. Mr. Wiley serves as a Director of Andeavor Corporation (independent oil refiner and marketer, 2005-present), a Director of Andeavor Logistics LP (natural resources logistics, 2015-present), and a Director of Bill Barrett Corporation (exploration and production, 2005-present). In addition, Mr. Wiley also serves as a Director of Post Oak Bank (privately-held bank, 2004-present). Previously, Mr. Wiley served as a Trustee of other Fidelity® funds (2008-2013), as a Director of Asia Pacific Exploration Consolidated (international oil and gas exploration and production, 2008-2013), as a member of the Board of Trustees of the University of Tulsa (2000-2006; 2007-2010), as a Senior Energy Advisor of Katzenbach Partners, LLC (consulting, 2006-2007), as an Advisory Director of Riverstone Holdings (private investment), Chairman, President, and CEO of Baker Hughes, Inc. (oilfield services, 2000-2004), and as Director of Spinnaker Exploration Company (exploration and production, 2001-2005).
Elizabeth Paige Baumann (1968)
Year of Election or Appointment: 2017
Anti-Money Laundering (AML) Officer
Ms. Baumann also serves as AML Officer of other funds. She is Chief AML Officer (2012-present) and Senior Vice President (2014-present) of FMR LLC (diversified financial services company) and is an employee of Fidelity Investments. Previously, Ms. Baumann served as AML Officer of the funds (2012-2016), and Vice President (2007-2014) and Deputy Anti-Money Laundering Officer (2007-2012) of FMR LLC.
Marc R. Bryant (1966)
Year of Election or Appointment: 2015
Secretary and Chief Legal Officer (CLO)
Mr. Bryant also serves as Secretary and CLO of other funds. Mr. Bryant serves as CLO, Secretary, and Senior Vice President of Fidelity Management & Research Company (investment adviser firm, 2015-present) and FMR Co., Inc. (investment adviser firm, 2015-present); Secretary of Fidelity SelectCo, LLC (investment adviser firm, 2015-present) and Fidelity Investments Money Management, Inc. (investment adviser firm, 2015-present); and CLO of Fidelity Management & Research (Hong Kong) Limited and FMR Investment Management (UK) Limited (investment adviser firms, 2015-present) and Fidelity Management & Research (Japan) Limited (investment adviser firm, 2016-present). He is Senior Vice President and Deputy General Counsel of FMR LLC (diversified financial services company). Previously, Mr. Bryant served as Secretary and CLO of Fidelity Rutland Square Trust II (2010-2014) and Assistant Secretary of Fidelity's Fixed Income and Asset Allocation Funds (2013-2015). Prior to joining Fidelity Investments, Mr. Bryant served as a Senior Vice President and the Head of Global Retail Legal for AllianceBernstein L.P. (2006-2010), and as the General Counsel for ProFund Advisors LLC (2001-2006).
John J. Burke III (1964)
Year of Election or Appointment: 2018
Chief Financial Officer
Mr. Burke also serves as Chief Financial Officer of other funds. Mr. Burke serves as Head of Investment Operations for Fidelity Fund and Investment Operations (2018-present) and is an employee of Fidelity Investments (1998-present). Previously Mr. Burke served as head of Asset Management Investment Operations (2012-2018).
William C. Coffey (1969)
Year of Election or Appointment: 2009
Assistant Secretary
Mr. Coffey also serves as Assistant Secretary of other funds. He is Senior Vice President and Deputy General Counsel of FMR LLC (diversified financial services company, 2010-present), and is an employee of Fidelity Investments. Previously, Mr. Coffey served as Vice President and Associate General Counsel of FMR LLC (2005-2009).
Timothy M. Cohen (1969)
Year of Election or Appointment: 2018
Vice President
Mr. Cohen also serves as Vice President of other funds. Mr. Cohen serves as Co-Head of Global Equity Research (2016-present), a Director of Fidelity Management & Research (Japan) Limited (investment adviser firm, 2016-present), and is an employee of Fidelity Investments. Previously, Mr. Cohen served as Chief Investment Officer - Equity and a Director of Fidelity Management & Research (U.K.) Inc. (investment adviser firm, 2013-2015) and as a Director of Fidelity Management & Research (Hong Kong) Limited (investment adviser firm, 2017).
Jonathan Davis (1968)
Year of Election or Appointment: 2010
Assistant Treasurer
Mr. Davis also serves as Assistant Treasurer of other funds. Mr. Davis serves as Assistant Treasurer of FMR Capital, Inc. (2017-present) and is an employee of Fidelity Investments. Previously, Mr. Davis served as Vice President and Associate General Counsel of FMR LLC (diversified financial services company, 2003-2010).
Adrien E. Deberghes (1967)
Year of Election or Appointment: 2016
Assistant Treasurer
Mr. Deberghes also serves as an officer of other funds. He serves as Assistant Treasurer of FMR Capital, Inc. (2017-present), Executive Vice President of Fidelity Investments Money Management, Inc. (FIMM) (investment adviser firm, 2016-present), and is an employee of Fidelity Investments (2008-present). Previously, Mr. Deberghes served as President and Treasurer of certain Fidelity® funds (2013-2018). Prior to joining Fidelity Investments, Mr. Deberghes was Senior Vice President of Mutual Fund Administration at State Street Corporation (2007-2008), Senior Director of Mutual Fund Administration at Investors Bank & Trust (2005-2007), and Director of Finance for Dunkin' Brands (2000-2005). Previously, Mr. Deberghes served in other fund officer roles.
Laura M. Del Prato (1964)
Year of Election or Appointment: 2018
Assistant Treasurer
Ms. Del Prato also serves as an officer of other funds. Ms. Del Prato is an employee of Fidelity Investments (2017-present). Prior to joining Fidelity Investments, Ms. Del Prato served as a Managing Director and Treasurer of the JPMorgan Mutual Funds (2014-2017). Prior to JPMorgan, Ms. Del Prato served as a partner at Cohen Fund Audit Services (accounting firm, 2012-2013) and KPMG LLP (accounting firm, 2004-2012).
Colm A. Hogan (1973)
Year of Election or Appointment: 2016
Deputy Treasurer
Mr. Hogan also serves as an officer of other funds. Mr. Hogan serves as Assistant Treasurer of FMR Capital, Inc. (2017-present) and is an employee of Fidelity Investments (2005-present). Previously, Mr. Hogan served as Assistant Treasurer of certain Fidelity® funds (2016-2018).
Pamela R. Holding (1964)
Year of Election or Appointment: 2018
Vice President
Ms. Holding also serves as a Vice President of other funds. Ms. Holding serves as Co-Head of Global Equity Research (2018-present) and is an employee of Fidelity Investments (2013-present).
Chris Maher (1972)
Year of Election or Appointment: 2013
Assistant Treasurer
Mr. Maher serves as Assistant Treasurer of other funds. Mr. Maher is Vice President of Valuation Oversight, serves as Assistant Treasurer of FMR Capital, Inc. (2017-present), and is an employee of Fidelity Investments. Previously, Mr. Maher served as Vice President of Asset Management Compliance (2013), Vice President of the Program Management Group of FMR (investment adviser firm, 2010-2013), and Vice President of Valuation Oversight (2008-2010).
Rieco E. Mello (1969)
Year of Election or Appointment: 2017
Assistant Treasurer
Mr. Mello also serves as Assistant Treasurer of other funds. Mr. Mello serves as Assistant Treasurer of FMR Capital, Inc. (2017-present) and is an employee of Fidelity Investments (1995-present).
Kenneth B. Robins (1969)
Year of Election or Appointment: 2016
Chief Compliance Officer
Mr. Robins also serves as an officer of other funds. Mr. Robins serves as Compliance Officer of Fidelity Management & Research Company and FMR Co., Inc. (investment adviser firms, 2016-present) and is an employee of Fidelity Investments (2004-present). Previously, Mr. Robins served as Executive Vice President of Fidelity Investments Money Management, Inc. (investment adviser firm, 2013-2016) and served in other fund officer roles.
Stacie M. Smith (1974)
Year of Election or Appointment: 2016
President and Treasurer
Ms. Smith also serves as an officer of other funds. Ms. Smith serves as Assistant Treasurer of FMR Capital, Inc. (2017-present), is an employee of Fidelity Investments (2009-present), and has served in other fund officer roles. Prior to joining Fidelity Investments, Ms. Smith served as Senior Audit Manager of Ernst & Young LLP (accounting firm, 1996-2009). Previously, Ms. Smith served as Assistant Treasurer (2013-2018) and Deputy Treasurer (2013-2016) of certain Fidelity® funds.
Marc L. Spector (1972)
Year of Election or Appointment: 2016
Assistant Treasurer
Mr. Spector also serves as an officer of other funds. Mr. Spector serves as Assistant Treasurer of FMR Capital, Inc. (2017-present) and is an employee of Fidelity Investments (2016-present). Prior to joining Fidelity Investments, Mr. Spector served as Director at the Siegfried Group (accounting firm, 2013-2016), and prior to Siegfried Group as audit senior manager at Deloitte & Touche (accounting firm, 2005-2013).
Renee Stagnone (1975)
Year of Election or Appointment: 2016
Assistant Treasurer
Ms. Stagnone also serves as an officer of other funds. Ms. Stagnone serves as Assistant Treasurer of FMR Capital, Inc. (2017-present) and is an employee of Fidelity Investments (1997-present). Previously, Ms. Stagnone served as Deputy Treasurer of certain Fidelity® funds (2013-2016).
Shareholder Expense Example
As a shareholder of the Fund, you incur two types of costs: (1) transaction costs, including sales charges (loads) on purchase payments or redemption proceeds and (2) ongoing costs, including management fees, distribution and/or service (12b-1) fees and other Fund expenses. This Example is intended to help you understand your ongoing costs (in dollars) of investing in the Fund and to compare these costs with the ongoing costs of investing in other mutual funds.
The Example is based on an investment of $1,000 invested at the beginning of the period and held for the entire period (February 1, 2018 to July 31, 2018).
Actual Expenses
The first line of the accompanying table for each class of the Fund provides information about actual account values and actual expenses. You may use the information in this line, together with the amount you invested, to estimate the expenses that you paid over the period. Simply divide your account value by $1,000.00 (for example, an $8,600 account value divided by $1,000.00 = 8.6), then multiply the result by the number in the first line for a class of the Fund under the heading entitled "Expenses Paid During Period" to estimate the expenses you paid on your account during this period. A small balance maintenance fee of $12.00 that is charged once a year may apply for certain accounts with a value of less than $2,000. This fee is not included in the table below. If it was, the estimate of expenses you paid during the period would be higher, and your ending account value lower, by this amount. In addition, the Fund, as a shareholder in the underlying Fidelity Central Funds, will indirectly bear its pro-rata share of the fees and expenses incurred by the underlying Fidelity Central Funds. These fees and expenses are not included in the Fund's annualized expense ratio used to calculate the expense estimate in the table below.
Hypothetical Example for Comparison Purposes
The second line of the accompanying table for each class of the Fund provides information about hypothetical account values and hypothetical expenses based on a Class' actual expense ratio and an assumed rate of return of 5% per year before expenses, which is not the Class' actual return. The hypothetical account values and expenses may not be used to estimate the actual ending account balance or expenses you paid for the period. You may use this information to compare the ongoing costs of investing in the Fund and other funds. To do so, compare this 5% hypothetical example with the 5% hypothetical examples that appear in the shareholder reports of the other funds. A small balance maintenance fee of $12.00 that is charged once a year may apply for certain accounts with a value of less than $2,000. This fee is not included in the table below. If it was, the estimate of expenses you paid during the period would be higher, and your ending account value lower, by this amount. In addition, the Fund, as a shareholder in the underlying Fidelity Central Funds, will indirectly bear its pro-rata share of the fees and expenses incurred by the underlying Fidelity Central Funds. These fees and expenses are not included in the Fund's annualized expense ratio used to calculate the expense estimate in the table below.
Please note that the expenses shown in the table are meant to highlight your ongoing costs only and do not reflect any transaction costs. Therefore, the second line of the table is useful in comparing ongoing costs only, and will not help you determine the relative total costs of owning different funds. In addition, if these transactional costs were included, your costs would have been higher.
| | Annualized Expense Ratio-A | Beginning
Account Value
February 1, 2018 | Ending
Account Value
July 31, 2018 | Expenses Paid
During Period-B
February 1, 2018
to July 31, 2018 |
| Class A | 1.29% | | | |
| Actual | | $1,000.00 | $1,091.50 | $6.69 |
| Hypothetical-C | | $1,000.00 | $1,018.40 | $6.46 |
| Class M | 1.56% | | | |
| Actual | | $1,000.00 | $1,090.20 | $8.08 |
| Hypothetical-C | | $1,000.00 | $1,017.06 | $7.80 |
| Class C | 2.05% | | | |
| Actual | | $1,000.00 | $1,087.20 | $10.61 |
| Hypothetical-C | | $1,000.00 | $1,014.63 | $10.24 |
| Small Cap Growth | 1.01% | | | |
| Actual | | $1,000.00 | $1,092.90 | $5.24 |
| Hypothetical-C | | $1,000.00 | $1,019.79 | $5.06 |
| Class I | 1.02% | | | |
| Actual | | $1,000.00 | $1,092.60 | $5.29 |
| Hypothetical-C | | $1,000.00 | $1,019.74 | $5.11 |
| Class Z | .88% | | | |
| Actual | | $1,000.00 | $1,093.70 | $4.57 |
| Hypothetical-C | | $1,000.00 | $1,020.43 | $4.41 |
A Annualized expense ratio reflects expenses net of applicable fee waivers.
B Expenses are equal to each Class' annualized expense ratio, multiplied by the average account value over the period, multiplied by 181/365 (to reflect the one-half year period).
C 5% return per year before expenses
Distributions (Unaudited)
The Board of Trustees of Fidelity Small Cap Growth Fund voted to pay to shareholders of record at the opening of business on record date, the following distributions per share derived from capital gains realized from sales of portfolio securities:
| | Pay Date | Record Date | Capital Gains |
| Fidelity Small Cap Growth Fund | | | |
| Class A | 09/17/18 | 09/14/18 | $2.578 |
| Class M | 09/17/18 | 09/14/18 | $2.538 |
| Class C | 09/17/18 | 09/14/18 | $2.474 |
| Small Cap Growth | 09/17/18 | 09/14/18 | $2.621 |
| Class I | 09/17/18 | 09/14/18 | $2.618 |
| Class Z | 09/17/18 | 09/14/18 | $2.641 |
|
The fund hereby designates as a capital gain dividend with respect to the taxable year ended July 31, 2018, $294,774,478, or, if subsequently determined to be different, the net capital gain of such year.
Class A designates 39%, Class M designates 51%, Class C designates 95%, Small Cap Growth designates 31%, Class I designates 31%, and Class Z designates 28%, of the dividends distributed in December during the fiscal year as qualifying for the dividends–received deduction for corporate shareholders.
Class A designates 35%, Class M designates 45%, Class C designates 84%, Small Cap Growth designates 28%, Class I designates 28%, and Class Z designates 25%, of the dividends distributed in December during the fiscal year as amounts which may be taken into account as a dividend for purposes of the maximum rate under section 1(h)(11) of the Internal Revenue Code.
The fund will notify shareholders in January 2019 of amounts for use in preparing 2018 income tax returns.
Board Approval of Investment Advisory Contracts
Fidelity Small Cap Growth Fund
At its July 2018 meeting, the Board of Trustees, including the Independent Trustees (together, the Board), voted to continue the management contract with Fidelity Management & Research Company (FMR) and the sub-advisory agreements (together, the Advisory Contracts) for the fund for six months through January 31, 2019, in connection with the reunification of the Fidelity Equity High Income Funds Board, which oversees the fund, and the Sector Portfolios Board.
The Board considered that the approval of the fund's Advisory Contracts will not result in any changes in (i) the investment process or strategies employed in the management of the fund's assets; (ii) the fees and expenses paid by shareholders; (iii) the nature, extent or quality of services provided under the fund's Advisory Contracts; or (iv) the day-to-day management of the fund or the persons primarily responsible for such management. The Board concluded that the fund's Advisory Contracts are fair and reasonable, and that the fund's Advisory Contracts should be renewed, without modification, through January 31, 2019, with the understanding that the Board will consider the annual renewal for a full one year period in January 2019.
In connection with its consideration of future renewals of the fund's Advisory Contracts, the Board will consider: (i) the nature, extent and quality of services provided to the fund, including shareholder and administrative services and investment performance; (ii) the competitiveness of the management fee and total expenses for the fund; (iii) the costs of the services and profitability, including the revenues earned and the expenses incurred in conducting the business of developing, marketing, distributing, managing, administering, and servicing the fund and its shareholders, to the extent applicable, as well as potential fall-out benefits from Fidelity's non-fund businesses; and (iv) whether there have been economies of scale in respect of the Fidelity funds, whether the Fidelity funds (including the fund) have appropriately benefited from any such economies of scale, and whether there is the potential for realization of any further economies.
Based on its evaluation of all of the conclusions noted above, and after considering all factors it believed relevant, the Board ultimately concluded that the fund's management fee structure is fair and reasonable, and that the continuation of the fund's Advisory Contracts should be approved.
Corporate Headquarters
245 Summer St.
Boston, MA 02210
www.fidelity.com
SCP-ANN-0918
1.803695.113
Fidelity Advisor® Small Cap Value Fund - Class A, Class M, Class C and Class I
Annual Report July 31, 2018 Class A, Class M, Class C and Class I are classes of Fidelity® Small Cap Value Fund |
|
Contents
To view a fund's proxy voting guidelines and proxy voting record for the 12-month period ended June 30, visit http://www.fidelity.com/proxyvotingresults or visit the Securities and Exchange Commission's (SEC) web site at http://www.sec.gov.
You may also call 1-877-208-0098 to request a free copy of the proxy voting guidelines.
Standard & Poor's, S&P and S&P 500 are registered service marks of The McGraw-Hill Companies, Inc. and have been licensed for use by Fidelity Distributors Corporation.
Other third-party marks appearing herein are the property of their respective owners.
All other marks appearing herein are registered or unregistered trademarks or service marks of FMR LLC or an affiliated company. © 2018 FMR LLC. All rights reserved.
This report and the financial statements contained herein are submitted for the general information of the shareholders of the Fund. This report is not authorized for distribution to prospective investors in the Fund unless preceded or accompanied by an effective prospectus.
A fund files its complete schedule of portfolio holdings with the SEC for the first and third quarters of each fiscal year on Form N-Q. Forms N-Q are available on the SEC’s web site at http://www.sec.gov. A fund's Forms N-Q may be reviewed and copied at the SEC’s Public Reference Room in Washington, DC. Information regarding the operation of the SEC's Public Reference Room may be obtained by calling 1-800-SEC-0330.
For a complete list of a fund's portfolio holdings, view the most recent holdings listing, semiannual report, or annual report on Fidelity's web site at http://www.fidelity.com, http://www.institutional.fidelity.com, or http://www.401k.com, as applicable.
NOT FDIC INSURED •MAY LOSE VALUE •NO BANK GUARANTEE
Neither the Fund nor Fidelity Distributors Corporation is a bank.
Performance: The Bottom Line
Average annual total return reflects the change in the value of an investment, assuming reinvestment of distributions from dividend income and capital gains (the profits earned upon the sale of securities that have grown in value, if any) and assuming a constant rate of performance each year. The hypothetical investment and the average annual total returns do not reflect the deduction of taxes that a shareholder would pay on fund distributions or the redemption of fund shares. During periods of reimbursement by Fidelity, a fund’s total return will be greater than it would be had the reimbursement not occurred. How a fund did yesterday is no guarantee of how it will do tomorrow.
Average Annual Total Returns
| For the periods ended July 31, 2018 | Past 1 year | Past 5 years | Past 10 years |
| Class A (incl. 5.75% sales charge) | 4.29% | 8.25% | 11.18% |
| Class M (incl. 3.50% sales charge) | 6.52% | 8.49% | 11.18% |
| Class C (incl. contingent deferred sales charge) | 8.84% | 8.70% | 11.00% |
| Class I | 10.93% | 9.82% | 12.15% |
Class C shares' contingent deferred sales charges included in the past one year, past five years and past ten years total return figures are 1%, 0% and 0%, respectively.
$10,000 Over 10 Years
Let's say hypothetically that $10,000 was invested in Fidelity Advisor® Small Cap Value Fund - Class A on July 31, 2008, and the current 5.75% sales charge was paid.
The chart shows how the value of your investment would have changed, and also shows how the Russell 2000® Value Index performed over the same period.
| Period Ending Values |
| $28,860 | Fidelity Advisor® Small Cap Value Fund - Class A |
| $24,836 | Russell 2000® Value Index |
Management's Discussion of Fund Performance
Market Recap: The U.S. equity bellwether S&P 500
® index gained 16.24% for the 12 months ending July 31, 2018, despite a resurgence in volatility that challenged the multiyear bull market. Stocks maintained their steady growth until a sharp reversal in February, as volatility spiked amid fear that rising inflation and the potential for the economy to overheat would prompt the U.S. Federal Reserve to pick up the pace of interest rate hikes. The index posted its first negative monthly result since October 2016, and then lost further ground in March on fear of a global trade war. The market stabilized in April and turned upward through mid-June, when escalating trade tension between the U.S. and China soured investor sentiment. The resulting uncertainty lingered into July, but strong corporate earnings helped the S&P 500 rise 3.72% that month to cap the period. For the full one-year period, growth handily topped value, while small-caps bested large-caps. By sector, information technology (+28%) led the way, boosted by strong earnings growth from several major index constituents. Consumer discretionary rose roughly 24%, driven by retailers (+49%). Energy (+20%) gained alongside higher oil prices. Laggards were telecommunication services (-2%), consumer staples (0%) and utilities (+3%), defensive groups that struggled amid rising interest rates and a general preference for risk. Real estate (+5%) fared a bit better but still lagged, as did financials, industrials, health care (each up 13%) and materials (+11%).
Comments from Lead Portfolio Manager Clint Lawrence: For the fiscal year, the fund's share classes gained roughly 10% to 11%, trailing the 14.37% result of the benchmark Russell 2000
® Value Index. Relative to the index, the fund was most hampered by disappointing stock picking in several categories, especially financials, industrials, information technology and materials. Security selection in consumer discretionary and utilities added value, however, and in the lagging real estate sector, a combination of good stock picks and a beneficial underweighting contributed. On an individual basis, the biggest detractor was ProAssurance, a provider of medical malpractice insurance. Shares of the company fell after it forecasted rising insurance claims, consistent with industry trends. We sold the fund's stake in July. Another detractor was Tech Data, an IT distributor struggling amid pricing pressure. Cedar Fair, an operator of amusement parks, also detracted, as rising interest rates made this high-dividend stock less appealing. In contrast, a notable contributor was Cimpress, a Netherlands-based custom printing company that experienced expanding profit margins. We sold our stake due to the company's increased valuation. Another contributor was CalAtlantic Group, an out-of-benchmark homebuilder sold in February. Our biggest individual contributor was LivaNova, a medical-device manufacturer. During the period, LivaNova shares benefited from strength in the company's neuromodulation business.
The views expressed above reflect those of the portfolio manager(s) only through the end of the period as stated on the cover of this report and do not necessarily represent the views of Fidelity or any other person in the Fidelity organization. Any such views are subject to change at any time based upon market or other conditions and Fidelity disclaims any responsibility to update such views. These views may not be relied on as investment advice and, because investment decisions for a Fidelity fund are based on numerous factors, may not be relied on as an indication of trading intent on behalf of any Fidelity fund.
Note to shareholders: On December 30, 2017, Clint Lawrence assumed lead portfolio management responsibilities for the fund alongside Co-Manager Derek Janssen.
Investment Summary (Unaudited)
Top Ten Stocks as of July 31, 2018
| | % of fund's net assets |
| Store Capital Corp. | 2.8 |
| Moog, Inc. Class A | 2.7 |
| Regal Beloit Corp. | 2.6 |
| First Citizen Bancshares, Inc. | 2.6 |
| LINN Energy, Inc. | 2.6 |
| Beneficial Bancorp, Inc. | 2.5 |
| Enstar Group Ltd. | 2.4 |
| Rexford Industrial Realty, Inc. | 2.4 |
| IDACORP, Inc. | 2.4 |
| ShawCor Ltd. Class A | 2.4 |
| | 25.4 |
Top Five Market Sectors as of July 31, 2018
| | % of fund's net assets |
| Financials | 26.7 |
| Consumer Discretionary | 13.6 |
| Industrials | 12.9 |
| Real Estate | 11.3 |
| Information Technology | 8.7 |
Asset Allocation (% of fund's net assets)
| As of July 31, 2018* |
| | Stocks | 98.0% |
| | Bonds | 0.4% |
| | Short-Term Investments and Net Other Assets (Liabilities) | 1.6% |

* Foreign investments – 21.5%
Schedule of Investments July 31, 2018
Showing Percentage of Net Assets
| Common Stocks - 98.0% | | | |
| | | Shares | Value |
| CONSUMER DISCRETIONARY - 13.6% | | | |
| Auto Components - 2.2% | | | |
| Standard Motor Products, Inc. (a) | | 1,270,000 | $61,899,800 |
| Diversified Consumer Services - 0.7% | | | |
| Grand Canyon Education, Inc. (b) | | 176,800 | 20,602,504 |
| Hotels, Restaurants & Leisure - 3.0% | | | |
| Bluegreen Vacations Corp. (c) | | 1,382,600 | 35,546,646 |
| Cedar Fair LP (depositary unit) | | 847,116 | 48,404,208 |
| | | | 83,950,854 |
| Household Durables - 1.1% | | | |
| LGI Homes, Inc. (b)(c) | | 201,833 | 10,432,748 |
| Taylor Morrison Home Corp. (b) | | 1,005,400 | 19,635,462 |
| | | | 30,068,210 |
| Specialty Retail - 4.3% | | | |
| Aaron's, Inc. Class A | | 1,211,200 | 52,457,072 |
| Sally Beauty Holdings, Inc. (b)(c) | | 1,918,500 | 31,636,065 |
| Signet Jewelers Ltd. (c) | | 605,000 | 34,932,700 |
| | | | 119,025,837 |
| Textiles, Apparel & Luxury Goods - 2.3% | | | |
| Cadence Bancorp | | 1,101,600 | 29,996,568 |
| G-III Apparel Group Ltd. (b) | | 751,950 | 34,364,115 |
| | | | 64,360,683 |
|
| TOTAL CONSUMER DISCRETIONARY | | | 379,907,888 |
|
| CONSUMER STAPLES - 3.9% | | | |
| Food & Staples Retailing - 1.0% | | | |
| Bj's Wholesale Club Holdings, Inc. | | 1,170,000 | 29,004,300 |
| Food Products - 2.3% | | | |
| Nomad Foods Ltd. (b) | | 3,308,800 | 62,867,200 |
| Tobacco - 0.6% | | | |
| Universal Corp. | | 229,100 | 15,830,810 |
|
| TOTAL CONSUMER STAPLES | | | 107,702,310 |
|
| ENERGY - 7.9% | | | |
| Energy Equipment & Services - 3.9% | | | |
| Oil States International, Inc. (b) | | 1,221,900 | 42,644,310 |
| ShawCor Ltd. Class A | | 3,200,400 | 65,196,295 |
| | | | 107,840,605 |
| Oil, Gas & Consumable Fuels - 4.0% | | | |
| CVR Refining, LP | | 610,813 | 13,926,536 |
| Denbury Resources, Inc. (b) | | 2,154,800 | 9,718,148 |
| LINN Energy, Inc. (b) | | 1,729,100 | 71,930,560 |
| Whiting Petroleum Corp. (b) | | 336,300 | 16,697,295 |
| | | | 112,272,539 |
|
| TOTAL ENERGY | | | 220,113,144 |
|
| FINANCIALS - 26.7% | | | |
| Banks - 14.5% | | | |
| Associated Banc-Corp. | | 467,500 | 12,622,500 |
| Banner Corp. | | 143,400 | 9,029,898 |
| BOK Financial Corp. | | 250,600 | 24,390,898 |
| Cullen/Frost Bankers, Inc. | | 417,400 | 46,118,526 |
| CVB Financial Corp. | | 2,035,700 | 48,693,944 |
| Equity Bancshares, Inc. (b) | | 589,700 | 23,882,850 |
| First Citizen Bancshares, Inc. | | 178,324 | 72,545,770 |
| Heartland Financial U.S.A., Inc. | | 624,650 | 36,698,188 |
| Hilltop Holdings, Inc. | | 1,512,800 | 31,466,240 |
| Popular, Inc. | | 1,165,100 | 57,823,913 |
| Trico Bancshares | | 367,458 | 14,264,720 |
| UMB Financial Corp. | | 381,000 | 27,390,090 |
| | | | 404,927,537 |
| Capital Markets - 1.3% | | | |
| Cowen Group, Inc. Class A (b)(c) | | 158,482 | 2,488,167 |
| OM Asset Management Ltd. | | 2,417,901 | 34,455,089 |
| | | | 36,943,256 |
| Diversified Financial Services - 0.5% | | | |
| Donnelley Financial Solutions, Inc. (b) | | 650,799 | 13,536,619 |
| Insurance - 7.3% | | | |
| Argo Group International Holdings, Ltd. | | 929,975 | 58,169,936 |
| Axis Capital Holdings Ltd. | | 387,400 | 21,911,344 |
| Enstar Group Ltd. (b) | | 316,500 | 68,427,300 |
| First American Financial Corp. | | 590,675 | 33,077,800 |
| Primerica, Inc. | | 189,900 | 21,800,520 |
| | | | 203,386,900 |
| Thrifts & Mortgage Finance - 3.1% | | | |
| Beneficial Bancorp, Inc. (a) | | 4,345,800 | 70,619,250 |
| Washington Federal, Inc. | | 470,200 | 15,775,210 |
| | | | 86,394,460 |
|
| TOTAL FINANCIALS | | | 745,188,772 |
|
| HEALTH CARE - 5.1% | | | |
| Health Care Equipment & Supplies - 2.2% | | | |
| LivaNova PLC (b) | | 568,651 | 62,625,535 |
| Health Care Technology - 1.0% | | | |
| Cegedim SA (b) | | 701,397 | 27,065,893 |
| Pharmaceuticals - 1.9% | | | |
| Prestige Brands Holdings, Inc. (b) | | 1,449,400 | 51,787,062 |
|
| TOTAL HEALTH CARE | | | 141,478,490 |
|
| INDUSTRIALS - 12.5% | | | |
| Aerospace & Defense - 2.7% | | | |
| Moog, Inc. Class A | | 1,024,400 | 76,840,244 |
| Airlines - 0.3% | | | |
| Allegiant Travel Co. | | 74,600 | 9,220,560 |
| Electrical Equipment - 3.3% | | | |
| Melrose Industries PLC | | 6,512,499 | 18,455,090 |
| Regal Beloit Corp. | | 859,168 | 73,845,490 |
| | | | 92,300,580 |
| Machinery - 1.6% | | | |
| Apergy Corp. (b) | | 506,500 | 20,766,500 |
| Mueller Industries, Inc. | | 707,500 | 23,425,325 |
| | | | 44,191,825 |
| Professional Services - 1.8% | | | |
| CBIZ, Inc. (b) | | 2,335,800 | 51,387,600 |
| Road & Rail - 1.8% | | | |
| Genesee & Wyoming, Inc. Class A (b) | | 573,900 | 49,355,400 |
| Trading Companies & Distributors - 1.0% | | | |
| Applied Industrial Technologies, Inc. | | 250,100 | 18,669,965 |
| WESCO International, Inc. (b) | | 135,800 | 8,283,800 |
| | | | 26,953,765 |
|
| TOTAL INDUSTRIALS | | | 350,249,974 |
|
| INFORMATION TECHNOLOGY - 8.7% | | | |
| Electronic Equipment & Components - 3.0% | | | |
| SYNNEX Corp. | | 251,984 | 24,308,896 |
| Tech Data Corp. (b) | | 363,800 | 30,344,558 |
| TTM Technologies, Inc. (b) | | 1,690,314 | 29,343,851 |
| | | | 83,997,305 |
| Internet Software & Services - 2.0% | | | |
| j2 Global, Inc. | | 655,800 | 55,638,072 |
| IT Services - 3.7% | | | |
| EVERTEC, Inc. | | 2,627,700 | 61,225,410 |
| Hackett Group, Inc. | | 247,558 | 4,463,471 |
| Presidio, Inc. (b) | | 721,178 | 10,067,645 |
| Science Applications International Corp. | | 314,400 | 26,525,928 |
| | | | 102,282,454 |
| Technology Hardware, Storage & Peripherals - 0.0% | | | |
| Super Micro Computer, Inc. (b) | | 51,342 | 1,134,658 |
|
| TOTAL INFORMATION TECHNOLOGY | | | 243,052,489 |
|
| MATERIALS - 3.6% | | | |
| Chemicals - 0.8% | | | |
| Orion Engineered Carbons SA | | 708,979 | 23,254,511 |
| Containers & Packaging - 2.3% | | | |
| Silgan Holdings, Inc. | | 2,338,500 | 64,332,135 |
| Metals & Mining - 0.5% | | | |
| Compass Minerals International, Inc. (c) | | 194,300 | 13,183,255 |
|
| TOTAL MATERIALS | | | 100,769,901 |
|
| REAL ESTATE - 11.3% | | | |
| Equity Real Estate Investment Trusts (REITs) - 11.3% | | | |
| CareTrust (REIT), Inc. | | 3,396,400 | 57,433,124 |
| Clipper Realty, Inc. | | 98,389 | 1,046,859 |
| Corporate Office Properties Trust (SBI) | | 992,300 | 29,511,002 |
| Equity Commonwealth (b) | | 1,834,700 | 59,150,728 |
| Four Corners Property Trust, Inc. | | 934,100 | 23,259,090 |
| Rexford Industrial Realty, Inc. | | 2,189,500 | 67,086,280 |
| Store Capital Corp. | | 2,809,500 | 77,120,775 |
| | | | 314,607,858 |
| UTILITIES - 4.7% | | | |
| Electric Utilities - 4.2% | | | |
| El Paso Electric Co. | | 812,200 | 50,600,060 |
| IDACORP, Inc. | | 702,700 | 66,222,448 |
| | | | 116,822,508 |
| Independent Power and Renewable Electricity Producers - 0.5% | | | |
| NRG Yield, Inc. Class C | | 723,320 | 13,453,752 |
|
| TOTAL UTILITIES | | | 130,276,260 |
|
| TOTAL COMMON STOCKS | | | |
| (Cost $2,252,502,104) | | | 2,733,347,086 |
| | | Principal Amount | Value |
|
| Nonconvertible Bonds - 0.4% | | | |
| INDUSTRIALS - 0.4% | | | |
| Machinery - 0.4% | | | |
Mueller Industries, Inc. 6% 3/1/27
(Cost $10,499,000) | | 10,499,000 | 10,262,773 |
| | | Shares | Value |
|
| Money Market Funds - 3.0% | | | |
| Fidelity Cash Central Fund, 1.96% (d) | | 46,335,882 | 46,345,149 |
| Fidelity Securities Lending Cash Central Fund 1.97% (d)(e) | | 38,497,133 | 38,500,983 |
| TOTAL MONEY MARKET FUNDS | | | |
| (Cost $84,846,244) | | | 84,846,132 |
| TOTAL INVESTMENT IN SECURITIES - 101.4% | | | |
| (Cost $2,347,847,348) | | | 2,828,455,991 |
| NET OTHER ASSETS (LIABILITIES) - (1.4)% | | | (40,112,347) |
| NET ASSETS - 100% | | | $2,788,343,644 |
Legend
(a) Affiliated company
(b) Non-income producing
(c) Security or a portion of the security is on loan at period end.
(d) Affiliated fund that is generally available only to investment companies and other accounts managed by Fidelity Investments. The rate quoted is the annualized seven-day yield of the fund at period end. A complete unaudited listing of the fund's holdings as of its most recent quarter end is available upon request. In addition, each Fidelity Central Fund's financial statements, which are not covered by the Fund's Report of Independent Registered Public Accounting Firm, are available on the SEC's website or upon request.
(e) Investment made with cash collateral received from securities on loan.
Affiliated Central Funds
Information regarding fiscal year to date income earned by the Fund from investments in Fidelity Central Funds is as follows:
| Fund | Income earned |
| Fidelity Cash Central Fund | $682,995 |
| Fidelity Securities Lending Cash Central Fund | 458,479 |
| Total | $1,141,474 |
Amounts in the income column in the above table include any capital gain distributions from underlying funds, which are presented in the corresponding line-item in the Statement of Operations if applicable.
Other Affiliated Issuers
An affiliated company is a company in which the Fund has ownership of at least 5% of the voting securities. Fiscal year to date transactions with companies which are or were affiliates are as follows:
| Affiliate | Value, beginning of period | Purchases | Sales Proceeds | Dividend Income | Realized Gain (loss) | Change in Unrealized appreciation (depreciation) | Value, end of period |
| Beneficial Bancorp, Inc. | $-- | $69,914,018 | $-- | $738,184 | $-- | $705,232 | $70,619,250 |
| Civitas Solutions, Inc. | 44,625,000 | -- | 40,943,841 | -- | (1,146,537) | (2,534,622) | -- |
| Standard Motor Products, Inc. | 35,910,864 | 26,966,297 | -- | 723,057 | -- | (977,361) | 61,899,800 |
| Total | $80,535,864 | $96,880,315 | $40,943,841 | $1,461,241 | $(1,146,537) | $(2,806,751) | $132,519,050 |
Investment Valuation
The following is a summary of the inputs used, as of July 31, 2018, involving the Fund's assets and liabilities carried at fair value. The inputs or methodology used for valuing securities may not be an indication of the risk associated with investing in those securities. For more information on valuation inputs, and their aggregation into the levels used below, please refer to the Investment Valuation section in the accompanying Notes to Financial Statements.
| | Valuation Inputs at Reporting Date: |
| Description | Total | Level 1 | Level 2 | Level 3 |
| Investments in Securities: | | | | |
| Equities: | | | | |
| Consumer Discretionary | $379,907,888 | $379,907,888 | $-- | $-- |
| Consumer Staples | 107,702,310 | 107,702,310 | -- | -- |
| Energy | 220,113,144 | 220,113,144 | -- | -- |
| Financials | 745,188,772 | 745,188,772 | -- | -- |
| Health Care | 141,478,490 | 141,478,490 | -- | -- |
| Industrials | 350,249,974 | 350,249,974 | -- | -- |
| Information Technology | 243,052,489 | 243,052,489 | -- | -- |
| Materials | 100,769,901 | 100,769,901 | -- | -- |
| Real Estate | 314,607,858 | 314,607,858 | -- | -- |
| Utilities | 130,276,260 | 130,276,260 | -- | -- |
| Corporate Bonds | 10,262,773 | -- | 10,262,773 | -- |
| Money Market Funds | 84,846,132 | 84,846,132 | -- | -- |
| Total Investments in Securities: | $2,828,455,991 | $2,818,193,218 | $10,262,773 | $-- |
Other Information
Distribution of investments by country or territory of incorporation, as a percentage of Total Net Assets, is as follows (Unaudited):
| United States of America | 78.5% |
| Bermuda | 6.6% |
| Puerto Rico | 4.3% |
| United Kingdom | 4.1% |
| Canada | 2.4% |
| British Virgin Islands | 2.3% |
| France | 1.0% |
| Others (Individually Less Than 1%) | 0.8% |
| | 100.0% |
See accompanying notes which are an integral part of the financial statements.
Financial Statements
Statement of Assets and Liabilities
| | | July 31, 2018 |
| Assets | | |
Investment in securities, at value (including securities loaned of $37,650,404) — See accompanying schedule:
Unaffiliated issuers (cost $2,138,897,979) | $2,611,090,809 | |
| Fidelity Central Funds (cost $84,846,244) | 84,846,132 | |
| Other affiliated issuers (cost $124,103,125) | 132,519,050 | |
| Total Investment in Securities (cost $2,347,847,348) | | $2,828,455,991 |
| Receivable for investments sold | | 57,056,749 |
| Receivable for fund shares sold | | 1,616,058 |
| Dividends receivable | | 637,820 |
| Interest receivable | | 262,475 |
| Distributions receivable from Fidelity Central Funds | | 67,651 |
| Prepaid expenses | | 7,405 |
| Other receivables | | 76,802 |
| Total assets | | 2,888,180,951 |
| Liabilities | | |
| Payable to custodian bank | $1,494,617 | |
| Payable for investments purchased | 53,046,906 | |
| Payable for fund shares redeemed | 5,018,339 | |
| Accrued management fee | 1,097,063 | |
| Distribution and service plan fees payable | 100,561 | |
| Other affiliated payables | 523,228 | |
| Other payables and accrued expenses | 74,193 | |
| Collateral on securities loaned | 38,482,400 | |
| Total liabilities | | 99,837,307 |
| Net Assets | | $2,788,343,644 |
| Net Assets consist of: | | |
| Paid in capital | | $1,834,379,796 |
| Undistributed net investment income | | 4,125,965 |
| Accumulated undistributed net realized gain (loss) on investments and foreign currency transactions | | 469,229,240 |
| Net unrealized appreciation (depreciation) on investments | | 480,608,643 |
| Net Assets | | $2,788,343,644 |
| Calculation of Maximum Offering Price | | |
| Class A: | | |
| Net Asset Value and redemption price per share ($162,572,170 ÷ 7,997,534 shares) | | $20.33 |
| Maximum offering price per share (100/94.25 of $20.33) | | $21.57 |
| Class M: | | |
| Net Asset Value and redemption price per share ($69,379,710 ÷ 3,497,276 shares) | | $19.84 |
| Maximum offering price per share (100/96.50 of $19.84) | | $20.56 |
| Class C: | | |
| Net Asset Value and offering price per share ($44,395,738 ÷ 2,400,215 shares)(a) | | $18.50 |
| Small Cap Value: | | |
| Net Asset Value, offering price and redemption price per share ($2,052,664,450 ÷ 99,092,320 shares) | | $20.71 |
| Class I: | | |
| Net Asset Value, offering price and redemption price per share ($459,331,576 ÷ 22,168,783 shares) | | $20.72 |
(a) Redemption price per share is equal to net asset value less any applicable contingent deferred sales charge.
See accompanying notes which are an integral part of the financial statements.
Statement of Operations
| | | Year ended July 31, 2018 |
| Investment Income | | |
| Dividends (including $1,461,241 earned from other affiliated issuers) | | $46,582,478 |
| Special dividends | | 6,923,500 |
| Interest | | 629,940 |
| Income from Fidelity Central Funds | | 1,141,474 |
| Total income | | 55,277,392 |
| Expenses | | |
| Management fee | | |
| Basic fee | $22,998,390 | |
| Performance adjustment | (83,004) | |
| Transfer agent fees | 6,157,978 | |
| Distribution and service plan fees | 1,284,677 | |
| Accounting and security lending fees | 988,624 | |
| Custodian fees and expenses | 52,735 | |
| Independent trustees' fees and expenses | 14,438 | |
| Registration fees | 104,929 | |
| Audit | 62,558 | |
| Legal | 8,838 | |
| Interest | 13,248 | |
| Miscellaneous | 25,214 | |
| Total expenses before reductions | 31,628,625 | |
| Expense reductions | (207,165) | |
| Total expenses after reductions | | 31,421,460 |
| Net investment income (loss) | | 23,855,932 |
| Realized and Unrealized Gain (Loss) | | |
| Net realized gain (loss) on: | | |
| Investment securities: | | |
| Unaffiliated issuers | 581,735,533 | |
| Fidelity Central Funds | 7,948 | |
| Other affiliated issuers | (1,146,537) | |
| Foreign currency transactions | (119,455) | |
| Total net realized gain (loss) | | 580,477,489 |
| Change in net unrealized appreciation (depreciation) on: | | |
| Investment securities: | | |
| Unaffiliated issuers | (253,169,688) | |
| Fidelity Central Funds | (4,220) | |
| Other affiliated issuers | (2,806,751) | |
| Assets and liabilities in foreign currencies | (14) | |
| Total change in net unrealized appreciation (depreciation) | | (255,980,673) |
| Net gain (loss) | | 324,496,816 |
| Net increase (decrease) in net assets resulting from operations | | $348,352,748 |
See accompanying notes which are an integral part of the financial statements.
Statement of Changes in Net Assets
| | Year ended July 31, 2018 | Year ended July 31, 2017 |
| Increase (Decrease) in Net Assets | | |
| Operations | | |
| Net investment income (loss) | $23,855,932 | $44,455,877 |
| Net realized gain (loss) | 580,477,489 | 78,723,874 |
| Change in net unrealized appreciation (depreciation) | (255,980,673) | 334,723,173 |
| Net increase (decrease) in net assets resulting from operations | 348,352,748 | 457,902,924 |
| Distributions to shareholders from net investment income | (37,440,500) | (25,276,323) |
| Distributions to shareholders from net realized gain | (91,159,109) | (209,689,485) |
| Total distributions | (128,599,609) | (234,965,808) |
| Share transactions - net increase (decrease) | (851,457,506) | (12,022,135) |
| Redemption fees | 89,036 | 469,836 |
| Total increase (decrease) in net assets | (631,615,331) | 211,384,817 |
| Net Assets | | |
| Beginning of period | 3,419,958,975 | 3,208,574,158 |
| End of period | $2,788,343,644 | $3,419,958,975 |
| Other Information | | |
| Undistributed net investment income end of period | $4,125,965 | $22,996,598 |
See accompanying notes which are an integral part of the financial statements.
Financial Highlights
Fidelity Small Cap Value Fund Class A
| Years ended July 31, | 2018 | 2017 | 2016 | 2015 | 2014 |
| Selected Per–Share Data | | | | | |
| Net asset value, beginning of period | $19.05 | $17.92 | $19.14 | $19.29 | $19.96 |
| Income from Investment Operations | | | | | |
| Net investment income (loss)A | .10B | .20C | .07 | .10D | .03 |
| Net realized and unrealized gain (loss) | 1.87 | 2.23 | .56 | 2.01 | 1.24 |
| Total from investment operations | 1.97 | 2.43 | .63 | 2.11 | 1.27 |
| Distributions from net investment income | (.17) | (.10) | (.11) | (.02) | (.01) |
| Distributions from net realized gain | (.52) | (1.20) | (1.75) | (2.25) | (1.93) |
| Total distributions | (.69) | (1.30) | (1.85)E | (2.26)F | (1.94) |
| Redemption fees added to paid in capitalA,G | – | – | – | – | – |
| Net asset value, end of period | $20.33 | $19.05 | $17.92 | $19.14 | $19.29 |
| Total ReturnH,I | 10.65% | 14.61% | 4.07% | 11.86% | 6.83% |
| Ratios to Average Net AssetsJ,K | | | | | |
| Expenses before reductions | 1.18% | 1.24% | 1.41% | 1.42% | 1.36% |
| Expenses net of fee waivers, if any | 1.17% | 1.24% | 1.41% | 1.39% | 1.35% |
| Expenses net of all reductions | 1.17% | 1.24% | 1.41% | 1.39% | 1.34% |
| Net investment income (loss) | .49%B | 1.10%C | .43% | .52%D | .13% |
| Supplemental Data | | | | | |
| Net assets, end of period (000 omitted) | $162,572 | $184,306 | $218,364 | $235,844 | $258,183 |
| Portfolio turnover rateL | 55% | 26% | 33% | 34% | 26%M |
A Calculated based on average shares outstanding during the period.
B Net investment income per share reflects a large, non-recurring dividend which amounted to $.04 per share. Excluding this non-recurring dividend, the ratio of net investment income (loss) to average net assets would have been .29%.
C Net investment income per share reflects a large, non-recurring dividend which amounted to $.09 per share. Excluding this non-recurring dividend, the ratio of net investment income (loss) to average net assets would have been .61%.
D Net investment income per share reflects a large, non-recurring dividend which amounted to $.05 per share. Excluding this non-recurring dividend, the ratio of net investment income (loss) to average net assets would have been .26%.
E Total distributions of $1.85 per share is comprised of distributions from net investment income of $.105 and distributions from net realized gain of $1.747 per share.
F Total distributions of $2.26 per share is comprised of distributions from net investment income of $.016 and distributions from net realized gain of $2.248 per share.
G Amount represents less than $.005 per share.
H Total returns would have been lower if certain expenses had not been reduced during the applicable periods shown.
I Total returns do not include the effect of the sales charges.
J Fees and expenses of any underlying Fidelity Central Funds are not included in the Fund's expense ratio. The Fund indirectly bears its proportionate share of the expenses of any underlying Fidelity Central Funds.
K Expense ratios reflect operating expenses of the class. Expenses before reductions do not reflect amounts reimbursed by the investment adviser or reductions from brokerage service arrangements or reductions from other expense offset arrangements and do not represent the amount paid by the class during periods when reimbursements or reductions occur. Expenses net of fee waivers reflect expenses after reimbursement by the investment adviser but prior to reductions from brokerage service arrangements or other expense offset arrangements. Expenses net of all reductions represent the net expenses paid by the class.
L Amount does not include the portfolio activity of any underlying Fidelity Central Funds.
M Portfolio turnover rate excludes securities received or delivered in-kind.
See accompanying notes which are an integral part of the financial statements.
Fidelity Small Cap Value Fund Class M
| Years ended July 31, | 2018 | 2017 | 2016 | 2015 | 2014 |
| Selected Per–Share Data | | | | | |
| Net asset value, beginning of period | $18.61 | $17.54 | $18.78 | $18.98 | $19.70 |
| Income from Investment Operations | | | | | |
| Net investment income (loss)A | .05B | .15C | .03 | .05D | (.02) |
| Net realized and unrealized gain (loss) | 1.82 | 2.18 | .54 | 1.98 | 1.23 |
| Total from investment operations | 1.87 | 2.33 | .57 | 2.03 | 1.21 |
| Distributions from net investment income | (.13) | (.07) | (.06) | – | – |
| Distributions from net realized gain | (.52) | (1.20) | (1.75) | (2.23) | (1.93) |
| Total distributions | (.64)E | (1.26)F | (1.81) | (2.23) | (1.93) |
| Redemption fees added to paid in capitalA,G | – | – | – | – | – |
| Net asset value, end of period | $19.84 | $18.61 | $17.54 | $18.78 | $18.98 |
| Total ReturnH,I | 10.39% | 14.35% | 3.76% | 11.58% | 6.58% |
| Ratios to Average Net AssetsJ,K | | | | | |
| Expenses before reductions | 1.42% | 1.49% | 1.66% | 1.67% | 1.61% |
| Expenses net of fee waivers, if any | 1.42% | 1.49% | 1.66% | 1.64% | 1.59% |
| Expenses net of all reductions | 1.41% | 1.49% | 1.65% | 1.63% | 1.59% |
| Net investment income (loss) | .25%B | .86%C | .19% | .27%D | (.11)% |
| Supplemental Data | | | | | |
| Net assets, end of period (000 omitted) | $69,380 | $78,852 | $82,337 | $91,716 | $100,975 |
| Portfolio turnover rateL | 55% | 26% | 33% | 34% | 26%M |
A Calculated based on average shares outstanding during the period.
B Net investment income per share reflects a large, non-recurring dividend which amounted to $.04 per share. Excluding this non-recurring dividend, the ratio of net investment income (loss) to average net assets would have been .04%.
C Net investment income per share reflects a large, non-recurring dividend which amounted to $.09 per share. Excluding this non-recurring dividend, the ratio of net investment income (loss) to average net assets would have been .36%.
D Net investment income per share reflects a large, non-recurring dividend which amounted to $.05 per share. Excluding this non-recurring dividend, the ratio of net investment income (loss) to average net assets would have been .01%.
E Total distributions of $.64 per share is comprised of distributions from net investment income of $.125 and distributions from net realized gain of $.519 per share.
F Total distributions of $1.26 per share is comprised of distributions from net investment income of $.067 and distributions from net realized gain of $1.195 per share.
G Amount represents less than $.005 per share.
H Total returns would have been lower if certain expenses had not been reduced during the applicable periods shown.
I Total returns do not include the effect of the sales charges.
J Fees and expenses of any underlying Fidelity Central Funds are not included in the Fund's expense ratio. The Fund indirectly bears its proportionate share of the expenses of any underlying Fidelity Central Funds.
K Expense ratios reflect operating expenses of the class. Expenses before reductions do not reflect amounts reimbursed by the investment adviser or reductions from brokerage service arrangements or reductions from other expense offset arrangements and do not represent the amount paid by the class during periods when reimbursements or reductions occur. Expenses net of fee waivers reflect expenses after reimbursement by the investment adviser but prior to reductions from brokerage service arrangements or other expense offset arrangements. Expenses net of all reductions represent the net expenses paid by the class.
L Amount does not include the portfolio activity of any underlying Fidelity Central Funds.
M Portfolio turnover rate excludes securities received or delivered in-kind.
See accompanying notes which are an integral part of the financial statements.
Fidelity Small Cap Value Fund Class C
| Years ended July 31, | 2018 | 2017 | 2016 | 2015 | 2014 |
| Selected Per–Share Data | | | | | |
| Net asset value, beginning of period | $17.39 | $16.52 | $17.82 | $18.19 | $19.06 |
| Income from Investment Operations | | | | | |
| Net investment income (loss)A | (.05)B | .06C | (.05) | (.04)D | (.12) |
| Net realized and unrealized gain (loss) | 1.71 | 2.04 | .50 | 1.90 | 1.18 |
| Total from investment operations | 1.66 | 2.10 | .45 | 1.86 | 1.06 |
| Distributions from net investment income | (.03) | (.04) | – | – | – |
| Distributions from net realized gain | (.52) | (1.20) | (1.75) | (2.23) | (1.93) |
| Total distributions | (.55) | (1.23)E | (1.75) | (2.23) | (1.93) |
| Redemption fees added to paid in capitalA,F | – | – | – | – | – |
| Net asset value, end of period | $18.50 | $17.39 | $16.52 | $17.82 | $18.19 |
| Total ReturnG,H | 9.84% | 13.79% | 3.20% | 11.05% | 5.97% |
| Ratios to Average Net AssetsI,J | | | | | |
| Expenses before reductions | 1.93% | 2.00% | 2.18% | 2.19% | 2.12% |
| Expenses net of fee waivers, if any | 1.93% | 2.00% | 2.17% | 2.16% | 2.11% |
| Expenses net of all reductions | 1.92% | 2.00% | 2.17% | 2.15% | 2.10% |
| Net investment income (loss) | (.26)%B | .35%C | (.33)% | (.25)%D | (.63)% |
| Supplemental Data | | | | | |
| Net assets, end of period (000 omitted) | $44,396 | $52,227 | $57,231 | $64,928 | $70,541 |
| Portfolio turnover rateK | 55% | 26% | 33% | 34% | 26%L |
A Calculated based on average shares outstanding during the period.
B Net investment income per share reflects a large, non-recurring dividend which amounted to $.04 per share. Excluding this non-recurring dividend, the ratio of net investment income (loss) to average net assets would have been (.47) %.
C Net investment income per share reflects a large, non-recurring dividend which amounted to $.08 per share. Excluding this non-recurring dividend, the ratio of net investment income (loss) to average net assets would have been (.15) %.
D Net investment income per share reflects a large, non-recurring dividend which amounted to $.05 per share. Excluding this non-recurring dividend, the ratio of net investment income (loss) to average net assets would have been (.51) %.
E Total distributions of $1.23 per share is comprised of distributions from net investment income of $.036 and distributions from net realized gain of $1.195 per share.
F Amount represents less than $.005 per share.
G Total returns would have been lower if certain expenses had not been reduced during the applicable periods shown.
H Total returns do not include the effect of the contingent deferred sales charge.
I Fees and expenses of any underlying Fidelity Central Funds are not included in the Fund's expense ratio. The Fund indirectly bears its proportionate share of the expenses of any underlying Fidelity Central Funds.
J Expense ratios reflect operating expenses of the class. Expenses before reductions do not reflect amounts reimbursed by the investment adviser or reductions from brokerage service arrangements or reductions from other expense offset arrangements and do not represent the amount paid by the class during periods when reimbursements or reductions occur. Expenses net of fee waivers reflect expenses after reimbursement by the investment adviser but prior to reductions from brokerage service arrangements or other expense offset arrangements. Expenses net of all reductions represent the net expenses paid by the class.
K Amount does not include the portfolio activity of any underlying Fidelity Central Funds.
L Portfolio turnover rate excludes securities received or delivered in-kind.
See accompanying notes which are an integral part of the financial statements.
Fidelity Small Cap Value Fund
| Years ended July 31, | 2018 | 2017 | 2016 | 2015 | 2014 |
| Selected Per–Share Data | | | | | |
| Net asset value, beginning of period | $19.41 | $18.22 | $19.45 | $19.57 | $20.22 |
| Income from Investment Operations | | | | | |
| Net investment income (loss)A | .15B | .25C | .12 | .15D | .08 |
| Net realized and unrealized gain (loss) | 1.89 | 2.28 | .55 | 2.05 | 1.26 |
| Total from investment operations | 2.04 | 2.53 | .67 | 2.20 | 1.34 |
| Distributions from net investment income | (.22) | (.15) | (.15) | (.07) | (.06) |
| Distributions from net realized gain | (.52) | (1.20) | (1.75) | (2.25) | (1.93) |
| Total distributions | (.74) | (1.34)E | (1.90) | (2.32) | (1.99) |
| Redemption fees added to paid in capitalA,F | – | – | – | – | – |
| Net asset value, end of period | $20.71 | $19.41 | $18.22 | $19.45 | $19.57 |
| Total ReturnG | 10.88% | 14.99% | 4.23% | 12.18% | 7.12% |
| Ratios to Average Net AssetsH,I | | | | | |
| Expenses before reductions | .91% | .99% | 1.18% | 1.15% | 1.08% |
| Expenses net of fee waivers, if any | .91% | .99% | 1.18% | 1.12% | 1.06% |
| Expenses net of all reductions | .91% | .99% | 1.17% | 1.12% | 1.06% |
| Net investment income (loss) | .76%B | 1.36%C | .67% | .78%D | .41% |
| Supplemental Data | | | | | |
| Net assets, end of period (000 omitted) | $2,052,664 | $2,637,843 | $2,460,714 | $2,036,157 | $2,060,546 |
| Portfolio turnover rateJ | 55% | 26% | 33% | 34% | 26%K |
A Calculated based on average shares outstanding during the period.
B Net investment income per share reflects a large, non-recurring dividend which amounted to $.04 per share. Excluding this non-recurring dividend, the ratio of net investment income (loss) to average net assets would have been .55%.
C Net investment income per share reflects a large, non-recurring dividend which amounted to $.09 per share. Excluding this non-recurring dividend, the ratio of net investment income (loss) to average net assets would have been .86%.
D Net investment income per share reflects a large, non-recurring dividend which amounted to $.05 per share. Excluding this non-recurring dividend, the ratio of net investment income (loss) to average net assets would have been .53%.
E Total distributions of $1.34 per share is comprised of distributions from net investment income of $.145 and distributions from net realized gain of $1.195 per share.
F Amount represents less than $.005 per share.
G Total returns would have been lower if certain expenses had not been reduced during the applicable periods shown.
H Fees and expenses of any underlying Fidelity Central Funds are not included in the Fund's expense ratio. The Fund indirectly bears its proportionate share of the expenses of any underlying Fidelity Central Funds.
I Expense ratios reflect operating expenses of the class. Expenses before reductions do not reflect amounts reimbursed by the investment adviser or reductions from brokerage service arrangements or reductions from other expense offset arrangements and do not represent the amount paid by the class during periods when reimbursements or reductions occur. Expenses net of fee waivers reflect expenses after reimbursement by the investment adviser but prior to reductions from brokerage service arrangements or other expense offset arrangements. Expenses net of all reductions represent the net expenses paid by the class.
J Amount does not include the portfolio activity of any underlying Fidelity Central Funds.
K Portfolio turnover rate excludes securities received or delivered in-kind.
See accompanying notes which are an integral part of the financial statements.
Fidelity Small Cap Value Fund Class I
| Years ended July 31, | 2018 | 2017 | 2016 | 2015 | 2014 |
| Selected Per–Share Data | | | | | |
| Net asset value, beginning of period | $19.41 | $18.23 | $19.45 | $19.57 | $20.23 |
| Income from Investment Operations | | | | | |
| Net investment income (loss)A | .15B | .25C | .12 | .15D | .08 |
| Net realized and unrealized gain (loss) | 1.90 | 2.28 | .56 | 2.05 | 1.25 |
| Total from investment operations | 2.05 | 2.53 | .68 | 2.20 | 1.33 |
| Distributions from net investment income | (.22) | (.15) | (.16) | (.07) | (.06) |
| Distributions from net realized gain | (.52) | (1.20) | (1.75) | (2.25) | (1.93) |
| Total distributions | (.74) | (1.35) | (1.90)E | (2.32) | (1.99) |
| Redemption fees added to paid in capitalA,F | – | – | – | – | – |
| Net asset value, end of period | $20.72 | $19.41 | $18.23 | $19.45 | $19.57 |
| Total ReturnG | 10.93% | 14.96% | 4.31% | 12.17% | 7.08% |
| Ratios to Average Net AssetsH,I | | | | | |
| Expenses before reductions | .91% | .98% | 1.14% | 1.15% | 1.09% |
| Expenses net of fee waivers, if any | .91% | .97% | 1.14% | 1.12% | 1.07% |
| Expenses net of all reductions | .90% | .97% | 1.14% | 1.12% | 1.07% |
| Net investment income (loss) | .76%B | 1.37%C | .70% | .79%D | .40% |
| Supplemental Data | | | | | |
| Net assets, end of period (000 omitted) | $459,332 | $466,730 | $389,928 | $376,817 | $342,500 |
| Portfolio turnover rateJ | 55% | 26% | 33% | 34% | 26%K |
A Calculated based on average shares outstanding during the period.
B Net investment income per share reflects a large, non-recurring dividend which amounted to $.04 per share. Excluding this non-recurring dividend, the ratio of net investment income (loss) to average net assets would have been .55%.
C Net investment income per share reflects a large, non-recurring dividend which amounted to $.09 per share. Excluding this non-recurring dividend, the ratio of net investment income (loss) to average net assets would have been .88%.
D Net investment income per share reflects a large, non-recurring dividend which amounted to $.05 per share. Excluding this non-recurring dividend, the ratio of net investment income (loss) to average net assets would have been .53%.
E Total distributions of $1.90 per share is comprised of distributions from net investment income of $.157 and distributions from net realized gain of $1.747 per share.
F Amount represents less than $.005 per share.
G Total returns would have been lower if certain expenses had not been reduced during the applicable periods shown.
H Fees and expenses of any underlying Fidelity Central Funds are not included in the Fund's expense ratio. The Fund indirectly bears its proportionate share of the expenses of any underlying Fidelity Central Funds.
I Expense ratios reflect operating expenses of the class. Expenses before reductions do not reflect amounts reimbursed by the investment adviser or reductions from brokerage service arrangements or reductions from other expense offset arrangements and do not represent the amount paid by the class during periods when reimbursements or reductions occur. Expenses net of fee waivers reflect expenses after reimbursement by the investment adviser but prior to reductions from brokerage service arrangements or other expense offset arrangements. Expenses net of all reductions represent the net expenses paid by the class.
J Amount does not include the portfolio activity of any underlying Fidelity Central Funds.
K Portfolio turnover rate excludes securities received or delivered in-kind.
See accompanying notes which are an integral part of the financial statements.
Notes to Financial Statements
For the period ended July 31, 2018
1. Organization.
Fidelity Small Cap Value Fund (the Fund) is a fund of Fidelity Securities Fund (the Trust) and is authorized to issue an unlimited number of shares. The Trust is registered under the Investment Company Act of 1940, as amended (the 1940 Act), as an open-end management investment company organized as a Massachusetts business trust. The Fund offers Class A, Class M, Class C, Small Cap Value and Class I shares, each of which has equal rights as to assets and voting privileges. The Fund is closed to new accounts with certain exceptions. Each class has exclusive voting rights with respect to matters that affect that class.
2. Investments in Fidelity Central Funds.
The Fund invests in Fidelity Central Funds, which are open-end investment companies generally available only to other investment companies and accounts managed by the investment adviser and its affiliates. The Fund's Schedule of Investments lists each of the Fidelity Central Funds held as of period end, if any, as an investment of the Fund, but does not include the underlying holdings of each Fidelity Central Fund. As an Investing Fund, the Fund indirectly bears its proportionate share of the expenses of the underlying Fidelity Central Funds.
The Money Market Central Funds seek preservation of capital and current income and are managed by Fidelity Investments Money Management, Inc. (FIMM), an affiliate of the investment adviser. Annualized expenses of the Money Market Central Funds as of their most recent shareholder report date are less than .005%.
A complete unaudited list of holdings for each Fidelity Central Fund is available upon request or at the Securities and Exchange Commission (the SEC) website at www.sec.gov. In addition, the financial statements of the Fidelity Central Funds, which are not covered by the Fund's Report of Independent Registered Public Accounting Firm, are available on the SEC website or upon request.
3. Significant Accounting Policies.
The Fund is an investment company and applies the accounting and reporting guidance of the Financial Accounting Standards Board (FASB) Accounting Standards Codification Topic 946 Financial Services – Investments Companies. The financial statements have been prepared in conformity with accounting principles generally accepted in the United States of America (GAAP), which require management to make certain estimates and assumptions at the date of the financial statements. Actual results could differ from those estimates. Subsequent events, if any, through the date that the financial statements were issued have been evaluated in the preparation of the financial statements. The following summarizes the significant accounting policies of the Fund:
Investment Valuation. Investments are valued as of 4:00 p.m. Eastern time on the last calendar day of the period. The Board of Trustees (the Board) has delegated the day to day responsibility for the valuation of the Fund's investments to the Fair Value Committee (the Committee) established by the Fund's investment adviser. In accordance with valuation policies and procedures approved by the Board, the Fund attempts to obtain prices from one or more third party pricing vendors or brokers to value its investments. When current market prices, quotations or currency exchange rates are not readily available or reliable, investments will be fair valued in good faith by the Committee, in accordance with procedures adopted by the Board. Factors used in determining fair value vary by investment type and may include market or investment specific events, changes in interest rates and credit quality. The frequency with which these procedures are used cannot be predicted and they may be utilized to a significant extent. The Committee oversees the Fund's valuation policies and procedures and reports to the Board on the Committee's activities and fair value determinations. The Board monitors the appropriateness of the procedures used in valuing the Fund's investments and ratifies the fair value determinations of the Committee.
The Fund categorizes the inputs to valuation techniques used to value its investments into a disclosure hierarchy consisting of three levels as shown below:
- Level 1 – quoted prices in active markets for identical investments
- Level 2 – other significant observable inputs (including quoted prices for similar investments, interest rates, prepayment speeds, etc.)
- Level 3 – unobservable inputs (including the Fund's own assumptions based on the best information available)
Valuation techniques used to value the Fund's investments by major category are as follows:
Equity securities, including restricted securities, for which market quotations are readily available, are valued at the last reported sale price or official closing price as reported by a third party pricing vendor on the primary market or exchange on which they are traded and are categorized as Level 1 in the hierarchy. In the event there were no sales during the day or closing prices are not available, securities are valued at the last quoted bid price or may be valued using the last available price and are generally categorized as Level 2 in the hierarchy. For foreign equity securities, when market or security specific events arise, comparisons to the valuation of American Depositary Receipts (ADRs), futures contracts, Exchange-Traded Funds (ETFs) and certain indexes as well as quoted prices for similar securities may be used and would be categorized as Level 2 in the hierarchy. Utilizing these techniques may result in transfers between Level 1 and Level 2. For equity securities, including restricted securities, where observable inputs are limited, assumptions about market activity and risk are used and these securities may be categorized as Level 3 in the hierarchy.
Debt securities, including restricted securities, are valued based on evaluated prices received from third party pricing vendors or from brokers who make markets in such securities. Corporate bonds are valued by pricing vendors who utilize matrix pricing which considers yield or price of bonds of comparable quality, coupon, maturity and type or by broker-supplied prices. When independent prices are unavailable or unreliable, debt securities may be valued utilizing pricing methodologies which consider similar factors that would be used by third party pricing vendors. Debt securities are generally categorized as Level 2 in the hierarchy but may be Level 3 depending on the circumstances.
Investments in open-end mutual funds, including the Fidelity Central Funds, are valued at their closing net asset value (NAV) each business day and are categorized as Level 1 in the hierarchy.
Changes in valuation techniques may result in transfers in or out of an assigned level within the disclosure hierarchy. The aggregate value of investments by input level as of July 31, 2018 is included at the end of the Fund's Schedule of Investments.
Foreign Currency. The Fund may use foreign currency contracts to facilitate transactions in foreign-denominated securities. Gains and losses from these transactions may arise from changes in the value of the foreign currency or if the counterparties do not perform under the contracts' terms.
Foreign-denominated assets, including investment securities, and liabilities are translated into U.S. dollars at the exchange rates at period end. Purchases and sales of investment securities, income and dividends received and expenses denominated in foreign currencies are translated into U.S. dollars at the exchange rate in effect on the transaction date.
The effects of exchange rate fluctuations on investments are included with the net realized and unrealized gain (loss) on investment securities. Other foreign currency transactions resulting in realized and unrealized gain (loss) are disclosed separately.
Investment Transactions and Income. For financial reporting purposes, the Fund's investment holdings and NAV include trades executed through the end of the last business day of the period. The NAV per share for processing shareholder transactions is calculated as of the close of business of the New York Stock Exchange (NYSE), normally 4:00 p.m. Eastern time and includes trades executed through the end of the prior business day. Gains and losses on securities sold are determined on the basis of identified cost and include proceeds received from litigation. Dividend income is recorded on the ex-dividend date, except for certain dividends from foreign securities where the ex-dividend date may have passed, which are recorded as soon as the Fund is informed of the ex-dividend date. Non-cash dividends included in dividend income, if any, are recorded at the fair market value of the securities received. Income and capital gain distributions from Fidelity Central Funds, if any, are recorded on the ex-dividend date. Certain distributions received by the Fund represent a return of capital or capital gain. The Fund determines the components of these distributions subsequent to the ex-dividend date, based upon receipt of tax filings or other correspondence relating to the underlying investment. These distributions are recorded as a reduction of cost of investments and/or as a realized gain. Large, non-recurring dividends recognized by the Fund are presented separately on the Statement of Operations as "Special Dividends" and the impact of these dividends is presented in the Financial Highlights. Interest income is accrued as earned and includes coupon interest and amortization of premium and accretion of discount on debt securities as applicable. Investment income is recorded net of foreign taxes withheld where recovery of such taxes is uncertain.
Class Allocations and Expenses. Investment income, realized and unrealized capital gains and losses, common expenses of the Fund, and certain fund-level expense reductions, if any, are allocated daily on a pro-rata basis to each class based on the relative net assets of each class to the total net assets of the Fund. Each class differs with respect to transfer agent and distribution and service plan fees incurred. Certain expense reductions may also differ by class. For the reporting period, the allocated portion of income and expenses to each class as a percent of its average net assets may vary due to the timing of recording these transactions in relation to fluctuating net assets of the classes. Expenses directly attributable to a fund are charged to that fund. Expenses attributable to more than one fund are allocated among the respective funds on the basis of relative net assets or other appropriate methods. Expense estimates are accrued in the period to which they relate and adjustments are made when actual amounts are known.
Income Tax Information and Distributions to Shareholders. Each year, the Fund intends to qualify as a regulated investment company under Subchapter M of the Internal Revenue Code, including distributing substantially all of its taxable income and realized gains. As a result, no provision for U.S. Federal income taxes is required. As of July 31, 2018, the Fund did not have any unrecognized tax benefits in the financial statements; nor is the Fund aware of any tax positions for which it is reasonably possible that the total amounts of unrecognized tax benefits will significantly change in the next twelve months. The Fund files a U.S. federal tax return, in addition to state and local tax returns as required. The Fund's federal income tax returns are subject to examination by the Internal Revenue Service (IRS) for a period of three fiscal years after they are filed. State and local tax returns may be subject to examination for an additional fiscal year depending on the jurisdiction. Foreign taxes are provided for based on the Fund's understanding of the tax rules and rates that exist in the foreign markets in which it invests.
Distributions are declared and recorded on the ex-dividend date. Income and capital gain distributions are declared separately for each class. Income and capital gain distributions are determined in accordance with income tax regulations, which may differ from GAAP. In addition, the Fund claimed a portion of the payment made to redeeming shareholders as a distribution for income tax purposes.
Capital accounts within the financial statements are adjusted for permanent book-tax differences. These adjustments have no impact on net assets or the results of operations. Capital accounts are not adjusted for temporary book-tax differences which will reverse in a subsequent period.
Book-tax differences are primarily due to foreign currency transactions, passive foreign investment companies (PFIC), partnerships and losses deferred due to wash sales.
As of period end, the cost and unrealized appreciation (depreciation) in securities, and derivatives if applicable, for federal income tax purposes were as follows:
| Gross unrealized appreciation | $545,370,597 |
| Gross unrealized depreciation | (62,320,291) |
| Net unrealized appreciation (depreciation) | $483,050,306 |
| Tax Cost | $2,345,405,685 |
The tax-based components of distributable earnings as of period end were as follows:
| Undistributed ordinary income | $7,390,220 |
| Undistributed long-term capital gain | $466,787,577 |
| Net unrealized appreciation (depreciation) on securities and other investments | $479,786,051 |
The tax character of distributions paid was as follows:
| | July 31, 2018 | July 31, 2017 |
| Ordinary Income | $39,181,764 | $ 25,276,323 |
| Long-term Capital Gains | 89,417,845 | 209,689,485 |
| Total | $128,599,609 | $ 234,965,808 |
Short-Term Trading (Redemption) Fees. Shares held by investors in the Fund less than 90 days may have been subject to a redemption fee equal to 1.50% of the NAV of shares redeemed. All redemption fees, which reduce the proceeds of the shareholder redemption, are retained by the Fund and accounted for as an addition to paid in capital. In November 2017, the Board of Trustees approved the elimination of these redemption fees effective December 18, 2017.
4. Purchases and Sales of Investments.
Purchases and sales of securities, other than short-term securities, aggregated $1,789,692,654 and $2,726,418,003, respectively.
5. Fees and Other Transactions with Affiliates.
Management Fee. Fidelity Management & Research Company (the investment adviser) and its affiliates provide the Fund with investment management related services for which the Fund pays a monthly management fee. The management fee is the sum of an individual fund fee rate that is based on an annual rate of .45% of the Fund's average net assets and an annualized group fee rate that averaged .24% during the period. The group fee rate is based upon the average net assets of all the mutual funds advised by the investment adviser, including any mutual funds previously advised by the investment adviser that are currently advised by Fidelity SelectCo, LLC, an affiliate of the investment adviser. The group fee rate decreases as assets under management increase and increases as assets under management decrease. In addition, the management fee is subject to a performance adjustment (up to a maximum of +/- .20% of the Fund's average net assets over a 36 month performance period). The upward or downward adjustment to the management fee is based on the relative investment performance of Small Cap Value as compared to its benchmark index, the Russell 2000 Value Index, over the same 36 month performance period. For the reporting period, the total annual management fee rate, including the performance adjustment, was .69% of the Fund's average net assets. The performance adjustment included in the management fee rate may be higher or lower than the maximum performance adjustment rate due to the difference between the average net assets for the reporting and performance periods.
Distribution and Service Plan Fees. In accordance with Rule 12b-1 of the 1940 Act, the Fund has adopted separate Distribution and Service Plans for each class of shares. Certain classes pay Fidelity Distributors Corporation (FDC), an affiliate of the investment adviser, separate Distribution and Service Fees, each of which is based on an annual percentage of each class' average net assets. In addition, FDC may pay financial intermediaries for selling shares of the Fund and providing shareholder support services. For the period, the Distribution and Service Fee rates, total fees and amounts retained by FDC were as follows:
| | Distribution Fee | Service Fee | Total Fees | Retained by FDC |
| Class A | -% | .25% | $429,673 | $1,174 |
| Class M | .25% | .25% | 374,032 | 872 |
| Class C | .75% | .25% | 480,972 | – |
| | | | $1,284,677 | $2,046 |
Sales Load. FDC may receive a front-end sales charge of up to 5.75% for selling Class A shares and 3.50% for selling Class M shares, some of which is paid to financial intermediaries for selling shares of the Fund. Depending on the holding period, FDC may receive contingent deferred sales charges levied on Class A, Class M and Class C redemptions. The deferred sales charges are 1.00% for Class C shares, 1.00% for certain purchases of Class A shares and .25% for certain purchases of Class M shares.
For the period, sales charge amounts retained by FDC were as follows:
| | Retained by FDC |
| Class A | $3,637 |
| Class M | 1,647 |
| Class C(a) | 620 |
| | $5,904 |
(a) When Class C shares are initially sold, FDC pays commissions from its own resources to financial intermediaries through which the sales are made.
Transfer Agent Fees. Fidelity Investments Institutional Operations Company, Inc., (FIIOC), an affiliate of the investment adviser, is the transfer, dividend disbursing and shareholder servicing agent for each class of the Fund. FIIOC receives account fees and asset-based fees that vary according to the account size and type of account of the shareholders of the respective classes of the Fund. FIIOC pays for typesetting, printing and mailing of shareholder reports, except proxy statements.
For the period, transfer agent fees for each class were as follows:
| | Amount | % of Class-Level Average Net Assets |
| Class A | $340,327 | .20 |
| Class M | 144,109 | .19 |
| Class C | 98,065 | .20 |
| Small Cap Value | 4,731,660 | .18 |
| Class I | 843,817 | .18 |
| | $6,157,978 | |
Accounting and Security Lending Fees. Fidelity Service Company, Inc. (FSC), an affiliate of the investment adviser, maintains the Fund's accounting records. The accounting fee is based on the level of average net assets for each month. Under a separate contract, FSC administers the security lending program. The security lending fee is based on the number and duration of lending transactions. For the period, the fees were equivalent to an annual rate of .03%.
Brokerage Commissions. The Fund placed a portion of its portfolio transactions with brokerage firms which are affiliates of the investment adviser. Brokerage commissions are included in net realized gain (loss) and change in net unrealized appreciation (depreciation) in the Statement of Operations. The commissions paid to these affiliated firms were $55,485 for the period.
Interfund Lending Program. Pursuant to an Exemptive Order issued by the SEC, the Fund, along with other registered investment companies having management contracts with Fidelity Management & Research Company (FMR) or other affiliated entities of FMR, may participate in an interfund lending program. This program provides an alternative credit facility allowing the funds to borrow from, or lend money to, other participating affiliated funds. At period end, there were no interfund loans outstanding. The Fund's activity in this program during the period for which loans were outstanding was as follows:
| Borrower or Lender | Average Loan Balance | Weighted Average Interest Rate | Interest Expense |
| Borrower | $19,342,615 | 1.90% | $13,248 |
Interfund Trades. The Fund may purchase from or sell securities to other Fidelity Funds under procedures adopted by the Board. The procedures have been designed to ensure these interfund trades are executed in accordance with Rule 17a-7 of the 1940 Act. Interfund trades are included within the respective purchases and sales amounts shown in the Purchases and Sales of Investments note.
6. Committed Line of Credit.
The Fund participates with other funds managed by the investment adviser or an affiliate in a $4.25 billion credit facility (the "line of credit") to be utilized for temporary or emergency purposes to fund shareholder redemptions or for other short-term liquidity purposes. The Fund has agreed to pay commitment fees on its pro-rata portion of the line of credit, which amounted to $9,648 and is reflected in Miscellaneous expenses on the Statement of Operations. During the period, the Fund did not borrow on this line of credit.
7. Security Lending.
The Fund lends portfolio securities through a lending agent from time to time in order to earn additional income. For equity securities, a lending agent is used and may loan securities to certain qualified borrowers, including Fidelity Capital Markets (FCM), a broker-dealer affiliated with the Fund. On the settlement date of the loan, the Fund receives collateral (in the form of U.S. Treasury obligations, letters of credit and/or cash) against the loaned securities and maintains collateral in an amount not less than 100% of the market value of the loaned securities during the period of the loan. The market value of the loaned securities is determined at the close of business of the Fund and any additional required collateral is delivered to the Fund on the next business day. The Fund or borrower may terminate the loan at any time, and if the borrower defaults on its obligation to return the securities loaned because of insolvency or other reasons, the Fund may apply collateral received from the borrower against the obligation. The Fund may experience delays and costs in recovering the securities loaned. Any cash collateral received is invested in the Fidelity Securities Lending Cash Central Fund. The value of loaned securities and cash collateral at period end are disclosed on the Fund's Statement of Assets and Liabilities. Security lending income represents the income earned on investing cash collateral, less rebates paid to borrowers and any lending agent fees associated with the loan, plus any premium payments received for lending certain types of securities. Security lending income is presented in the Statement of Operations as a component of income from Fidelity Central Funds. Total security lending income during the period amounted to $458,479. During the period, there were no securities loaned to FCM.
8. Expense Reductions.
Commissions paid to certain brokers with whom the investment adviser, or its affiliates, places trades on behalf of the Fund include an amount in addition to trade execution, which may be rebated back to the Fund to offset certain expenses. This amount totaled $171,568 for the period. In addition, through arrangements with the Fund's custodian, credits realized as a result of certain uninvested cash balances were used to reduce the Fund's expenses. During the period, these credits reduced the Fund's custody expenses by $179.
In addition, during the period the investment adviser reimbursed and/or waived a portion of fund-level operating expenses in the amount of $35,418.
9. Distributions to Shareholders.
Distributions to shareholders of each class were as follows:
| | Year ended
July 31, 2018 | Year ended
July 31, 2017 |
| From net investment income | | |
| Class A | $1,524,304 | $1,211,951 |
| Class M | 515,970 | 315,712 |
| Class C | 97,347 | 123,016 |
| Small Cap Value | 30,080,300 | 20,285,848 |
| Class I | 5,222,579 | 3,339,796 |
| Total | $37,440,500 | $25,276,323 |
| From net realized gain | | |
| Class A | $4,758,907 | $14,206,153 |
| Class M | 2,138,544 | 5,563,443 |
| Class C | 1,473,571 | 4,084,634 |
| Small Cap Value | 70,617,875 | 160,012,743 |
| Class I | 12,170,212 | 25,822,512 |
| Total | $91,159,109 | $209,689,485 |
10. Share Transactions.
Share transactions for each class were as follows and may contain automatic conversions between classes or exchanges between affiliated funds:
| | Shares | Shares | Dollars | Dollars |
| | Year ended July 31, 2018 | Year ended July 31, 2017 | Year ended July 31, 2018 | Year ended July 31, 2017 |
| Class A | | | | |
| Shares sold | 787,560 | 1,506,738 | $15,530,971 | $27,403,663 |
| Reinvestment of distributions | 330,015 | 903,681 | 6,184,396 | 15,154,493 |
| Shares redeemed | (2,794,205) | (4,924,614) | (54,717,368) | (89,702,542) |
| Net increase (decrease) | (1,676,630) | (2,514,195) | $(33,002,001) | $(47,144,386) |
| Class M | | | | |
| Shares sold | 258,708 | 678,291 | $4,991,221 | $12,111,422 |
| Reinvestment of distributions | 144,050 | 354,357 | 2,638,888 | 5,809,028 |
| Shares redeemed | (1,141,985) | (1,490,409) | (22,088,950) | (26,553,974) |
| Net increase (decrease) | (739,227) | (457,761) | $(14,458,841) | $(8,633,524) |
| Class C | | | | |
| Shares sold | 65,629 | 191,618 | $1,177,591 | $3,203,223 |
| Reinvestment of distributions | 85,987 | 251,057 | 1,473,685 | 3,851,053 |
| Shares redeemed | (754,141) | (903,381) | (13,467,588) | (15,005,685) |
| Net increase (decrease) | (602,525) | (460,706) | $(10,816,312) | $(7,951,409) |
| Small Cap Value | | | | |
| Shares sold | 33,774,572 | 31,283,294 | $673,371,571 | $582,054,205 |
| Reinvestment of distributions | 4,774,555 | 10,073,160 | 90,647,491 | 172,025,201 |
| Shares redeemed | (75,386,466) | (40,448,579) | (1,518,420,951) | (750,552,096) |
| Net increase (decrease) | (36,837,339) | 907,875 | $(754,401,889) | $3,527,310 |
| Class I | | | | |
| Shares sold | 4,588,604 | 6,859,852 | $91,876,636 | $128,013,262 |
| Reinvestment of distributions | 785,425 | 1,477,352 | 14,952,991 | 25,225,719 |
| Shares redeemed | (7,249,457) | (5,680,327) | (145,608,090) | (105,059,107) |
| Net increase (decrease) | (1,875,428) | 2,656,877 | $(38,778,463) | $48,179,874 |
11. Other.
The Fund's organizational documents provide former and current trustees and officers with a limited indemnification against liabilities arising in connection with the performance of their duties to the Fund. In the normal course of business, the Fund may also enter into contracts that provide general indemnifications. The Fund's maximum exposure under these arrangements is unknown as this would be dependent on future claims that may be made against the Fund. The risk of material loss from such claims is considered remote.
Report of Independent Registered Public Accounting Firm
To the Board of Trustees of Fidelity Securities Fund and Shareholders of Fidelity Small Cap Value Fund:
Opinion on the Financial Statements
We have audited the accompanying statement of assets and liabilities, including the schedule of investments, of Fidelity Small Cap Value Fund (one of the funds constituting Fidelity Securities Fund, referred to hereafter as the "Fund") as of July 31, 2018, the related statement of operations for the year ended July 31, 2018, the statement of changes in net assets for each of the two years in the period ended July 31, 2018, including the related notes, and the financial highlights for each of the five years in the period ended July 31, 2018 (collectively referred to as the “financial statements”). In our opinion, the financial statements present fairly, in all material respects, the financial position of the Fund as of July 31, 2018, the results of its operations for the year then ended, the changes in its net assets for each of the two years in the period ended July 31, 2018 and the financial highlights for each of the five years in the period ended July 31, 2018 in conformity with accounting principles generally accepted in the United States of America.
Basis for Opinion
These financial statements are the responsibility of the Fund’s management. Our responsibility is to express an opinion on the Fund’s financial statements based on our audits. We are a public accounting firm registered with the Public Company Accounting Oversight Board (United States) (“PCAOB”) and are required to be independent with respect to the Fund in accordance with the U.S. federal securities laws and the applicable rules and regulations of the Securities and Exchange Commission and the PCAOB.
We conducted our audits of these financial statements in accordance with the standards of the PCAOB. Those standards require that we plan and perform the audit to obtain reasonable assurance about whether the financial statements are free of material misstatement, whether due to error or fraud.
Our audits included performing procedures to assess the risks of material misstatement of the financial statements, whether due to error or fraud, and performing procedures that respond to those risks. Such procedures included examining, on a test basis, evidence regarding the amounts and disclosures in the financial statements. Our audits also included evaluating the accounting principles used and significant estimates made by management, as well as evaluating the overall presentation of the financial statements. Our procedures included confirmation of securities owned as of July 31, 2018 by correspondence with the custodian and brokers; when replies were not received from brokers, we performed other auditing procedures. We believe that our audits provide a reasonable basis for our opinion.
PricewaterhouseCoopers LLP
Boston, Massachusetts
September 13, 2018
We have served as the auditor of one or more investment companies in the Fidelity group of funds since 1932.
Trustees and Officers
The Trustees, Members of the Advisory Board (if any), and officers of the trust and fund, as applicable, are listed below. The Board of Trustees governs the fund and is responsible for protecting the interests of shareholders. The Trustees are experienced executives who meet periodically throughout the year to oversee the fund's activities, review contractual arrangements with companies that provide services to the fund, oversee management of the risks associated with such activities and contractual arrangements, and review the fund's performance. Except for Jonathan Chiel, each of the Trustees oversees 286 funds. Mr. Chiel oversees 150 funds.
The Trustees hold office without limit in time except that (a) any Trustee may resign; (b) any Trustee may be removed by written instrument, signed by at least two-thirds of the number of Trustees prior to such removal; (c) any Trustee who requests to be retired or who has become incapacitated by illness or injury may be retired by written instrument signed by a majority of the other Trustees; and (d) any Trustee may be removed at any special meeting of shareholders by a two-thirds vote of the outstanding voting securities of the trust. Each Trustee who is not an interested person (as defined in the 1940 Act) of the trust and the fund is referred to herein as an Independent Trustee. Each Independent Trustee shall retire not later than the last day of the calendar year in which his or her 75th birthday occurs. The Independent Trustees may waive this mandatory retirement age policy with respect to individual Trustees. Officers and Advisory Board Members hold office without limit in time, except that any officer or Advisory Board Member may resign or may be removed by a vote of a majority of the Trustees at any regular meeting or any special meeting of the Trustees. Except as indicated, each individual has held the office shown or other offices in the same company for the past five years.
The fund’s Statement of Additional Information (SAI) includes more information about the Trustees. To request a free copy, call Fidelity at 1-877-208-0098.
Experience, Skills, Attributes, and Qualifications of the Trustees. The Governance and Nominating Committee has adopted a statement of policy that describes the experience, qualifications, attributes, and skills that are necessary and desirable for potential Independent Trustee candidates (Statement of Policy). The Board believes that each Trustee satisfied at the time he or she was initially elected or appointed a Trustee, and continues to satisfy, the standards contemplated by the Statement of Policy. The Governance and Nominating Committee also engages professional search firms to help identify potential Independent Trustee candidates who have the experience, qualifications, attributes, and skills consistent with the Statement of Policy. From time to time, additional criteria based on the composition and skills of the current Independent Trustees, as well as experience or skills that may be appropriate in light of future changes to board composition, business conditions, and regulatory or other developments, have also been considered by the professional search firms and the Governance and Nominating Committee. In addition, the Board takes into account the Trustees' commitment and participation in Board and committee meetings, as well as their leadership of standing and ad hoc committees throughout their tenure.
In determining that a particular Trustee was and continues to be qualified to serve as a Trustee, the Board has considered a variety of criteria, none of which, in isolation, was controlling. The Board believes that, collectively, the Trustees have balanced and diverse experience, qualifications, attributes, and skills, which allow the Board to operate effectively in governing the fund and protecting the interests of shareholders. Information about the specific experience, skills, attributes, and qualifications of each Trustee, which in each case led to the Board's conclusion that the Trustee should serve (or continue to serve) as a trustee of the fund, is provided below.
Board Structure and Oversight Function. James C. Curvey is an interested person and currently serves as Chairman. The Trustees have determined that an interested Chairman is appropriate and benefits shareholders because an interested Chairman has a personal and professional stake in the quality and continuity of services provided to the fund. Independent Trustees exercise their informed business judgment to appoint an individual of their choosing to serve as Chairman, regardless of whether the Trustee happens to be independent or a member of management. The Independent Trustees have determined that they can act independently and effectively without having an Independent Trustee serve as Chairman and that a key structural component for assuring that they are in a position to do so is for the Independent Trustees to constitute a substantial majority for the Board. The Independent Trustees also regularly meet in executive session. Ned C. Lautenbach serves as Chairman of the Independent Trustees and as such (i) acts as a liaison between the Independent Trustees and management with respect to matters important to the Independent Trustees and (ii) with management prepares agendas for Board meetings.
Fidelity® funds are overseen by different Boards of Trustees. The fund's Board oversees Fidelity's high income and certain equity funds, and other Boards oversee Fidelity's investment-grade bond, money market, asset allocation, and other equity funds. The asset allocation funds may invest in Fidelity® funds overseen by the fund's Board. The use of separate Boards, each with its own committee structure, allows the Trustees of each group of Fidelity® funds to focus on the unique issues of the funds they oversee, including common research, investment, and operational issues. On occasion, the separate Boards establish joint committees to address issues of overlapping consequences for the Fidelity® funds overseen by each Board.
The Trustees operate using a system of committees to facilitate the timely and efficient consideration of all matters of importance to the Trustees, the fund, and fund shareholders and to facilitate compliance with legal and regulatory requirements and oversight of the fund's activities and associated risks. The Board, acting through its committees, has charged FMR and its affiliates with (i) identifying events or circumstances the occurrence of which could have demonstrably adverse effects on the fund's business and/or reputation; (ii) implementing processes and controls to lessen the possibility that such events or circumstances occur or to mitigate the effects of such events or circumstances if they do occur; and (iii) creating and maintaining a system designed to evaluate continuously business and market conditions in order to facilitate the identification and implementation processes described in (i) and (ii) above. Because the day-to-day operations and activities of the fund are carried out by or through FMR, its affiliates, and other service providers, the fund's exposure to risks is mitigated but not eliminated by the processes overseen by the Trustees. While each of the Board's committees has responsibility for overseeing different aspects of the fund's activities, oversight is exercised primarily through the Operations, Audit, and Compliance Committees. In addition, the Independent Trustees have worked with Fidelity to enhance the Board's oversight of investment and financial risks, legal and regulatory risks, technology risks, and operational risks, including the development of additional risk reporting to the Board. Appropriate personnel, including but not limited to the fund's Chief Compliance Officer (CCO), FMR's internal auditor, the independent accountants, the fund's Treasurer and portfolio management personnel, make periodic reports to the Board's committees, as appropriate, including an annual review of Fidelity's risk management program for the Fidelity® funds. The responsibilities of each standing committee, including their oversight responsibilities, are described further under "Standing Committees of the Trustees."
Interested Trustees*:
Correspondence intended for a Trustee who is an interested person may be sent to Fidelity Investments, 245 Summer Street, Boston, Massachusetts 02210.
Name, Year of Birth; Principal Occupations and Other Relevant Experience+
Jonathan Chiel (1957)
Year of Election or Appointment: 2016
Trustee
Mr. Chiel also serves as Trustee of other Fidelity® funds. Mr. Chiel is Executive Vice President and General Counsel for FMR LLC (diversified financial services company, 2012-present). Previously, Mr. Chiel served as general counsel (2004-2012) and senior vice president and deputy general counsel (2000-2004) for John Hancock Financial Services; a partner with Choate, Hall & Stewart (1996-2000) (law firm); and an Assistant United States Attorney for the United States Attorney’s Office of the District of Massachusetts (1986-95), including Chief of the Criminal Division (1993-1995). Mr. Chiel is a director on the boards of the Boston Bar Foundation and the Maimonides School.
James C. Curvey (1935)
Year of Election or Appointment: 2007
Trustee
Chairman of the Board of Trustees
Mr. Curvey also serves as Trustee of other Fidelity® funds. Mr. Curvey is Vice Chairman (2007-present) and Director of FMR LLC (diversified financial services company). In addition, Mr. Curvey is an Overseer Emeritus for the Boston Symphony Orchestra, a Director of Artis-Naples, and a Trustee of Brewster Academy in Wolfeboro, New Hampshire. Previously, Mr. Curvey served as a Director of Fidelity Research & Analysis Co. (investment adviser firm, 2009-2018), Director of Fidelity Investments Money Management, Inc. (investment adviser firm, 2009-2014) and a Director of FMR and FMR Co., Inc. (investment adviser firms, 2007-2014).
Charles S. Morrison (1960)
Year of Election or Appointment: 2014
Trustee
Mr. Morrison also serves as Trustee of other funds. He serves as President of Fidelity SelectCo, LLC (investment adviser firm, 2017-present) and Fidelity Management & Research Company (FMR) (investment adviser firm, 2016-present), a Director of Fidelity Investments Money Management, Inc. (FIMM) (investment adviser firm, 2014-present), Director of Fidelity SelectCo, LLC (investment adviser firm, 2014-present), President, Asset Management (2014-present), and is an employee of Fidelity Investments. Previously, Mr. Morrison served as Vice President of Fidelity's Fixed Income and Asset Allocation Funds (2012-2014), President, Fixed Income (2011-2014), Vice President of Fidelity's Money Market Funds (2005-2009), President, Money Market Group Leader of FMR (investment adviser firm, 2009), and Senior Vice President, Money Market Group of FMR (2004-2009). Mr. Morrison also served as Vice President of Fidelity's Bond Funds (2002-2005), certain Balanced Funds (2002-2005), and certain Asset Allocation Funds (2002-2007), and as Senior Vice President (2002-2005) of Fidelity's Bond Division.
* Determined to be an “Interested Trustee” by virtue of, among other things, his or her affiliation with the trust or various entities under common control with FMR.
+ The information includes the Trustee's principal occupation during the last five years and other information relating to the experience, attributes, and skills relevant to the Trustee's qualifications to serve as a Trustee, which led to the conclusion that the Trustee should serve as a Trustee for the fund.
Independent Trustees:
Correspondence intended for an Independent Trustee may be sent to Fidelity Investments, P.O. Box 55235, Boston, Massachusetts 02205-5235.
Name, Year of Birth; Principal Occupations and Other Relevant Experience+
Dennis J. Dirks (1948)
Year of Election or Appointment: 2005
Trustee
Mr. Dirks also serves as Trustee of other Fidelity® funds. Prior to his retirement in May 2003, Mr. Dirks was Chief Operating Officer and a member of the Board of The Depository Trust & Clearing Corporation (DTCC). He also served as President, Chief Operating Officer, and Board member of The Depository Trust Company (DTC) and President and Board member of the National Securities Clearing Corporation (NSCC). In addition, Mr. Dirks served as Chief Executive Officer and Board member of the Government Securities Clearing Corporation, Chief Executive Officer and Board member of the Mortgage-Backed Securities Clearing Corporation, as a Trustee and a member of the Finance Committee of Manhattan College (2005-2008), as a Trustee and a member of the Finance Committee of AHRC of Nassau County (2006-2008), as a member of the Independent Directors Council (IDC) Governing Council (2010-2015), and as a member of the Board of Directors for The Brookville Center for Children’s Services, Inc. (2009-2017). Mr. Dirks is a member of the Finance Committee (2016-present), Board of Directors (2017-present) and Board of Trustees (2018-present) and is Treasurer (2018-present) of the Asolo Repertory Theatre.
Donald F. Donahue (1950)
Year of Election or Appointment: 2018
Trustee
Mr. Donahue also serves as a Trustee of other Fidelity® funds. Mr. Donahue is President and Chief Executive Officer of Miranda Partners, LLC (risk consulting for the financial services industry, 2012-present). Previously, Mr. Donahue served as a Member of the Advisory Board of certain Fidelity® funds (2015-2018) and Chief Executive Officer (2006-2012), Chief Operating Officer (2003-2006), and Managing Director, Customer Marketing and Development (1999-2003) of The Depository Trust & Clearing Corporation (financial markets infrastructure). Mr. Donahue serves as a Member (2007-present) and Co-Chairman (2016-present) of the Board of Directors of United Way of New York, Member of the Board of Directors of NYC Leadership Academy (2012-present) and Member of the Board of Advisors of Ripple Labs, Inc. (financial services, 2015-present). He also served as Chairman (2010-2012) and Member of the Board of Directors (2012-2013) of Omgeo, LLC (financial services), Treasurer of United Way of New York (2012-2016), and Member of the Board of Directors of XBRL US (financial services non-profit, 2009-2012) and the International Securities Services Association (2009-2012).
Alan J. Lacy (1953)
Year of Election or Appointment: 2008
Trustee
Mr. Lacy also serves as Trustee of other Fidelity® funds. Mr. Lacy serves as a Director of Bristol-Myers Squibb Company (global pharmaceuticals, 2008-present). He is a Trustee of the California Chapter of The Nature Conservancy (2015-present) and a Director of the Center for Advanced Study in the Behavioral Sciences at Stanford University (2015-present). In addition, Mr. Lacy served as Senior Adviser (2007-2014) of Oak Hill Capital Partners, L.P. (private equity) and also served as Chief Executive Officer (2005) and Vice Chairman (2005-2006) of Sears Holdings Corporation (retail) and Chief Executive Officer and Chairman of the Board of Sears, Roebuck and Co. (retail, 2000-2005). Previously, Mr. Lacy served as Chairman (2014-2017) and a member (2010-2017) of the Board of Directors of Dave & Buster’s Entertainment, Inc. (restaurant and entertainment complexes), as Chairman (2008-2011) and a member (2006-2015) of the Board of Trustees of the National Parks Conservation Association, and as a member of the Board of Directors for The Hillman Companies, Inc. (hardware wholesalers, 2010-2014), Earth Fare, Inc. (retail grocery, 2010-2014), and The Western Union Company (global money transfer, 2006-2011).
Ned C. Lautenbach (1944)
Year of Election or Appointment: 2000
Trustee
Chairman of the Independent Trustees
Mr. Lautenbach also serves as Trustee of other Fidelity® funds. Mr. Lautenbach currently serves as Vice Chair of the Board of Governors, State University System of Florida (2013-present) and is a member of the Council on Foreign Relations (1994-present). He is also a member and has most recently served as Chairman of the Board of Directors of Artis-Naples (2012-present). Previously, Mr. Lautenbach served as a member and then Lead Director of the Board of Directors of Eaton Corporation (diversified industrial, 1997-2016). He was also a Partner and Advisory Partner at Clayton, Dubilier & Rice, LLC (private equity investment, 1998-2010), as well as a Director of Sony Corporation (2006-2007). In addition, Mr. Lautenbach also had a 30-year career with IBM (technology company) during which time he served as Senior Vice President and a member of the Corporate Executive Committee (1968-1998).
Joseph Mauriello (1944)
Year of Election or Appointment: 2008
Trustee
Mr. Mauriello also serves as Trustee of other Fidelity® funds. Prior to his retirement in January 2006, Mr. Mauriello served in numerous senior management positions including Deputy Chairman and Chief Operating Officer (2004-2005), and Vice Chairman of Financial Services (2002-2004) of KPMG LLP US (professional services, 1965-2005). Mr. Mauriello currently serves as a member of the Board of Directors of XL Group plc. (global insurance and re-insurance, 2006-present) and the Independent Directors Council (IDC) Governing Council (2015-present). Previously, Mr. Mauriello served as a Director of the Hamilton Funds of the Bank of New York (2006-2007) and of Arcadia Resources Inc. (health care services and products, 2007-2012).
Cornelia M. Small (1944)
Year of Election or Appointment: 2005
Trustee
Ms. Small also serves as Trustee of other Fidelity® funds. Ms. Small is a member of the Board of Directors (2009-present) and Chair of the Investment Committee (2010-present) of the Teagle Foundation. Ms. Small also serves on the Investment Committee of the Berkshire Taconic Community Foundation (2008-present). Previously, Ms. Small served as Chairperson (2002-2008) and a member of the Investment Committee and Chairperson (2008-2012) and a member of the Board of Trustees of Smith College. In addition, Ms. Small served as Chief Investment Officer, Director of Global Equity Investments, and a member of the Board of Directors of Scudder, Stevens & Clark and Scudder Kemper Investments.
Garnett A. Smith (1947)
Year of Election or Appointment: 2018
Trustee
Mr. Smith also serves as Trustee of other Fidelity® funds. Prior to Mr. Smith's retirement, he served as Chairman and Chief Executive Officer of Inbrand Corp. (manufacturer of personal absorbent products, 1990-1997). He also served as President (1986-1990) of Inbrand Corp. Prior to his employment with Inbrand Corp., he was employed by a retail fabric chain and North Carolina National Bank. In addition, Mr. Smith served as a Member of the Advisory Board of certain Fidelity® funds (2012-2013) and as a board member of the Jackson Hole Land Trust (2009-2012).
David M. Thomas (1949)
Year of Election or Appointment: 2008
Trustee
Mr. Thomas also serves as Trustee of other Fidelity® funds. Mr. Thomas serves as Non-Executive Chairman of the Board of Directors of Fortune Brands Home and Security (home and security products, 2011-present), as a member of the Board of Directors (2004-present) and Presiding Director (2013-present) of Interpublic Group of Companies, Inc. (marketing communication), and as a member of the Board of Trustees of the University of Florida (2013-present). Previously, Mr. Thomas served as Executive Chairman (2005-2006) and Chairman and Chief Executive Officer (2000-2005) of IMS Health, Inc. (pharmaceutical and healthcare information solutions), and a Director of Fortune Brands, Inc. (consumer products, 2000-2011).
+ The information includes the Trustee's principal occupation during the last five years and other information relating to the experience, attributes, and skills relevant to the Trustee's qualifications to serve as a Trustee, which led to the conclusion that the Trustee should serve as a Trustee for the fund.
Advisory Board Members and Officers:
Correspondence intended for a Member of the Advisory Board (if any) may be sent to Fidelity Investments, P.O. Box 55235, Boston, Massachusetts 02205-5235. Correspondence intended for an officer or Peter S. Lynch may be sent to Fidelity Investments, 245 Summer Street, Boston, Massachusetts 02210. Officers appear below in alphabetical order.
Name, Year of Birth; Principal Occupation
Peter S. Lynch (1944)
Year of Election or Appointment: 2003
Member of the Advisory Board
Mr. Lynch also serves as Member of the Advisory Board of other Fidelity® funds. Mr. Lynch is Vice Chairman and a Director of FMR (investment adviser firm) and FMR Co., Inc. (investment adviser firm). In addition, Mr. Lynch serves as a Trustee of Boston College and as the Chairman of the Inner-City Scholarship Fund. Previously, Mr. Lynch served on the Special Olympics International Board of Directors (1997-2006).
William S. Stavropoulos (1939)
Year of Election or Appointment: 2018
Member of the Advisory Board
Mr. Stavropoulos also serves as Member of the Advisory Board of other Fidelity® funds. Mr. Stavropoulos serves as President and Founder of the Michigan Baseball Foundation, the Great Lakes Loons (2007-present). Mr. Stavropoulos is Chairman Emeritus of the Board of Directors of The Dow Chemical Company, where he previously served in numerous senior management positions, including President, CEO (1995-2000; 2002-2004), Chairman of the Executive Committee (2000-2006), and as a member of the Board of Directors (1990-2006). Currently, Mr. Stavropoulos is Chairman of the Board of Directors of Univar Inc. (global distributor of commodity and specialty chemicals), a Director of Teradata Corporation (data warehousing and technology solutions), and a member of the Advisory Board for Metalmark Capital LLC (private equity investment, 2005-present). Mr. Stavropoulos is an operating advisor to Clayton, Dubilier & Rice, LLC (private equity investment). In addition, Mr. Stavropoulos is a member of the University of Notre Dame Advisory Council for the College of Science, a Trustee of the Rollin L. Gerstacker Foundation, and a Director of Artis-Naples in Naples, Florida. Previously, Mr. Stavropoulos served as Trustee of certain Fidelity® funds (2001-2018) and as a Director of Chemical Financial Corporation (bank holding company, 1993-2012) and Tyco International, Ltd. (multinational manufacturing and services, 2007-2012).
Carol B. Tomé (1957)
Year of Election or Appointment: 2018
Member of the Advisory Board
Ms. Tomé also serves as Member of the Advisory Board of other Fidelity® funds. Ms. Tomé is Chief Financial Officer (2001-present) and Executive Vice President of Corporate Services (2007-present) of The Home Depot, Inc. (home improvement retailer) and a Director (2003-present) and Chair of the Audit Committee (2004-present) of United Parcel Service, Inc. (package delivery and supply chain management). Previously, Ms. Tomé served as Trustee of certain Fidelity® funds (2017), Senior Vice President of Finance and Accounting/Treasurer (2000-2007) and Vice President and Treasurer (1995-2000) of The Home Depot, Inc. and Chair of the Board (2010-2012), Vice Chair of the Board (2009 and 2013), and a Director (2008-2013) of the Federal Reserve Bank of Atlanta. Ms. Tomé is also a director or trustee of many community and professional organizations.
Michael E. Wiley (1950)
Year of Election or Appointment: 2018
Member of the Advisory Board
Mr. Wiley also serves as Trustee or Member of the Advisory Board of other Fidelity® funds. Mr. Wiley serves as a Director of Andeavor Corporation (independent oil refiner and marketer, 2005-present), a Director of Andeavor Logistics LP (natural resources logistics, 2015-present), and a Director of Bill Barrett Corporation (exploration and production, 2005-present). In addition, Mr. Wiley also serves as a Director of Post Oak Bank (privately-held bank, 2004-present). Previously, Mr. Wiley served as a Trustee of other Fidelity® funds (2008-2013), as a Director of Asia Pacific Exploration Consolidated (international oil and gas exploration and production, 2008-2013), as a member of the Board of Trustees of the University of Tulsa (2000-2006; 2007-2010), as a Senior Energy Advisor of Katzenbach Partners, LLC (consulting, 2006-2007), as an Advisory Director of Riverstone Holdings (private investment), Chairman, President, and CEO of Baker Hughes, Inc. (oilfield services, 2000-2004), and as Director of Spinnaker Exploration Company (exploration and production, 2001-2005).
Elizabeth Paige Baumann (1968)
Year of Election or Appointment: 2017
Anti-Money Laundering (AML) Officer
Ms. Baumann also serves as AML Officer of other funds. She is Chief AML Officer (2012-present) and Senior Vice President (2014-present) of FMR LLC (diversified financial services company) and is an employee of Fidelity Investments. Previously, Ms. Baumann served as AML Officer of the funds (2012-2016), and Vice President (2007-2014) and Deputy Anti-Money Laundering Officer (2007-2012) of FMR LLC.
Marc R. Bryant (1966)
Year of Election or Appointment: 2015
Secretary and Chief Legal Officer (CLO)
Mr. Bryant also serves as Secretary and CLO of other funds. Mr. Bryant serves as CLO, Secretary, and Senior Vice President of Fidelity Management & Research Company (investment adviser firm, 2015-present) and FMR Co., Inc. (investment adviser firm, 2015-present); Secretary of Fidelity SelectCo, LLC (investment adviser firm, 2015-present) and Fidelity Investments Money Management, Inc. (investment adviser firm, 2015-present); and CLO of Fidelity Management & Research (Hong Kong) Limited and FMR Investment Management (UK) Limited (investment adviser firms, 2015-present) and Fidelity Management & Research (Japan) Limited (investment adviser firm, 2016-present). He is Senior Vice President and Deputy General Counsel of FMR LLC (diversified financial services company). Previously, Mr. Bryant served as Secretary and CLO of Fidelity Rutland Square Trust II (2010-2014) and Assistant Secretary of Fidelity's Fixed Income and Asset Allocation Funds (2013-2015). Prior to joining Fidelity Investments, Mr. Bryant served as a Senior Vice President and the Head of Global Retail Legal for AllianceBernstein L.P. (2006-2010), and as the General Counsel for ProFund Advisors LLC (2001-2006).
John J. Burke III (1964)
Year of Election or Appointment: 2018
Chief Financial Officer
Mr. Burke also serves as Chief Financial Officer of other funds. Mr. Burke serves as Head of Investment Operations for Fidelity Fund and Investment Operations (2018-present) and is an employee of Fidelity Investments (1998-present). Previously Mr. Burke served as head of Asset Management Investment Operations (2012-2018).
William C. Coffey (1969)
Year of Election or Appointment: 2009
Assistant Secretary
Mr. Coffey also serves as Assistant Secretary of other funds. He is Senior Vice President and Deputy General Counsel of FMR LLC (diversified financial services company, 2010-present), and is an employee of Fidelity Investments. Previously, Mr. Coffey served as Vice President and Associate General Counsel of FMR LLC (2005-2009).
Timothy M. Cohen (1969)
Year of Election or Appointment: 2018
Vice President
Mr. Cohen also serves as Vice President of other funds. Mr. Cohen serves as Co-Head of Global Equity Research (2016-present), a Director of Fidelity Management & Research (Japan) Limited (investment adviser firm, 2016-present), and is an employee of Fidelity Investments. Previously, Mr. Cohen served as Chief Investment Officer - Equity and a Director of Fidelity Management & Research (U.K.) Inc. (investment adviser firm, 2013-2015) and as a Director of Fidelity Management & Research (Hong Kong) Limited (investment adviser firm, 2017).
Jonathan Davis (1968)
Year of Election or Appointment: 2010
Assistant Treasurer
Mr. Davis also serves as Assistant Treasurer of other funds. Mr. Davis serves as Assistant Treasurer of FMR Capital, Inc. (2017-present) and is an employee of Fidelity Investments. Previously, Mr. Davis served as Vice President and Associate General Counsel of FMR LLC (diversified financial services company, 2003-2010).
Adrien E. Deberghes (1967)
Year of Election or Appointment: 2016
Assistant Treasurer
Mr. Deberghes also serves as an officer of other funds. He serves as Assistant Treasurer of FMR Capital, Inc. (2017-present), Executive Vice President of Fidelity Investments Money Management, Inc. (FIMM) (investment adviser firm, 2016-present), and is an employee of Fidelity Investments (2008-present). Previously, Mr. Deberghes served as President and Treasurer of certain Fidelity® funds (2013-2018). Prior to joining Fidelity Investments, Mr. Deberghes was Senior Vice President of Mutual Fund Administration at State Street Corporation (2007-2008), Senior Director of Mutual Fund Administration at Investors Bank & Trust (2005-2007), and Director of Finance for Dunkin' Brands (2000-2005). Previously, Mr. Deberghes served in other fund officer roles.
Laura M. Del Prato (1964)
Year of Election or Appointment: 2018
Assistant Treasurer
Ms. Del Prato also serves as an officer of other funds. Ms. Del Prato is an employee of Fidelity Investments (2017-present). Prior to joining Fidelity Investments, Ms. Del Prato served as a Managing Director and Treasurer of the JPMorgan Mutual Funds (2014-2017). Prior to JPMorgan, Ms. Del Prato served as a partner at Cohen Fund Audit Services (accounting firm, 2012-2013) and KPMG LLP (accounting firm, 2004-2012).
Colm A. Hogan (1973)
Year of Election or Appointment: 2016
Deputy Treasurer
Mr. Hogan also serves as an officer of other funds. Mr. Hogan serves as Assistant Treasurer of FMR Capital, Inc. (2017-present) and is an employee of Fidelity Investments (2005-present). Previously, Mr. Hogan served as Assistant Treasurer of certain Fidelity® funds (2016-2018).
Pamela R. Holding (1964)
Year of Election or Appointment: 2018
Vice President
Ms. Holding also serves as a Vice President of other funds. Ms. Holding serves as Co-Head of Global Equity Research (2018-present) and is an employee of Fidelity Investments (2013-present).
Chris Maher (1972)
Year of Election or Appointment: 2013
Assistant Treasurer
Mr. Maher serves as Assistant Treasurer of other funds. Mr. Maher is Vice President of Valuation Oversight, serves as Assistant Treasurer of FMR Capital, Inc. (2017-present), and is an employee of Fidelity Investments. Previously, Mr. Maher served as Vice President of Asset Management Compliance (2013), Vice President of the Program Management Group of FMR (investment adviser firm, 2010-2013), and Vice President of Valuation Oversight (2008-2010).
Rieco E. Mello (1969)
Year of Election or Appointment: 2017
Assistant Treasurer
Mr. Mello also serves as Assistant Treasurer of other funds. Mr. Mello serves as Assistant Treasurer of FMR Capital, Inc. (2017-present) and is an employee of Fidelity Investments (1995-present).
Kenneth B. Robins (1969)
Year of Election or Appointment: 2016
Chief Compliance Officer
Mr. Robins also serves as an officer of other funds. Mr. Robins serves as Compliance Officer of Fidelity Management & Research Company and FMR Co., Inc. (investment adviser firms, 2016-present) and is an employee of Fidelity Investments (2004-present). Previously, Mr. Robins served as Executive Vice President of Fidelity Investments Money Management, Inc. (investment adviser firm, 2013-2016) and served in other fund officer roles.
Stacie M. Smith (1974)
Year of Election or Appointment: 2016
President and Treasurer
Ms. Smith also serves as an officer of other funds. Ms. Smith serves as Assistant Treasurer of FMR Capital, Inc. (2017-present), is an employee of Fidelity Investments (2009-present), and has served in other fund officer roles. Prior to joining Fidelity Investments, Ms. Smith served as Senior Audit Manager of Ernst & Young LLP (accounting firm, 1996-2009). Previously, Ms. Smith served as Assistant Treasurer (2013-2018) and Deputy Treasurer (2013-2016) of certain Fidelity® funds.
Marc L. Spector (1972)
Year of Election or Appointment: 2016
Assistant Treasurer
Mr. Spector also serves as an officer of other funds. Mr. Spector serves as Assistant Treasurer of FMR Capital, Inc. (2017-present) and is an employee of Fidelity Investments (2016-present). Prior to joining Fidelity Investments, Mr. Spector served as Director at the Siegfried Group (accounting firm, 2013-2016), and prior to Siegfried Group as audit senior manager at Deloitte & Touche (accounting firm, 2005-2013).
Renee Stagnone (1975)
Year of Election or Appointment: 2016
Assistant Treasurer
Ms. Stagnone also serves as an officer of other funds. Ms. Stagnone serves as Assistant Treasurer of FMR Capital, Inc. (2017-present) and is an employee of Fidelity Investments (1997-present). Previously, Ms. Stagnone served as Deputy Treasurer of certain Fidelity® funds (2013-2016).
Shareholder Expense Example
As a shareholder of the Fund, you incur two types of costs: (1) transaction costs, including sales charges (loads) on purchase payments or redemption proceeds and (2) ongoing costs, including management fees, distribution and/or service (12b-1) fees and other Fund expenses. This Example is intended to help you understand your ongoing costs (in dollars) of investing in the Fund and to compare these costs with the ongoing costs of investing in other mutual funds.
The Example is based on an investment of $1,000 invested at the beginning of the period and held for the entire period (February 1, 2018 to July 31, 2018).
Actual Expenses
The first line of the accompanying table for each class of the Fund provides information about actual account values and actual expenses. You may use the information in this line, together with the amount you invested, to estimate the expenses that you paid over the period. Simply divide your account value by $1,000.00 (for example, an $8,600 account value divided by $1,000.00 = 8.6), then multiply the result by the number in the first line for a class of the Fund under the heading entitled "Expenses Paid During Period" to estimate the expenses you paid on your account during this period. A small balance maintenance fee of $12.00 that is charged once a year may apply for certain accounts with a value of less than $2,000. This fee is not included in the table below. If it was, the estimate of expenses you paid during the period would be higher, and your ending account value lower, by this amount. In addition, the Fund, as a shareholder in the underlying Fidelity Central Funds, will indirectly bear its pro-rata share of the fees and expenses incurred by the underlying Fidelity Central Funds. These fees and expenses are not included in the Fund's annualized expense ratio used to calculate the expense estimate in the table below.
Hypothetical Example for Comparison Purposes
The second line of the accompanying table for each class of the Fund provides information about hypothetical account values and hypothetical expenses based on a Class' actual expense ratio and an assumed rate of return of 5% per year before expenses, which is not the Class' actual return. The hypothetical account values and expenses may not be used to estimate the actual ending account balance or expenses you paid for the period. You may use this information to compare the ongoing costs of investing in the Fund and other funds. To do so, compare this 5% hypothetical example with the 5% hypothetical examples that appear in the shareholder reports of the other funds. A small balance maintenance fee of $12.00 that is charged once a year may apply for certain accounts with a value of less than $2,000. This fee is not included in the table below. If it was, the estimate of expenses you paid during the period would be higher, and your ending account value lower, by this amount. In addition, the Fund, as a shareholder in the underlying Fidelity Central Funds, will indirectly bear its pro-rata share of the fees and expenses incurred by the underlying Fidelity Central Funds. These fees and expenses are not included in the Fund's annualized expense ratio used to calculate the expense estimate in the table below.
Please note that the expenses shown in the table are meant to highlight your ongoing costs only and do not reflect any transaction costs. Therefore, the second line of the table is useful in comparing ongoing costs only, and will not help you determine the relative total costs of owning different funds. In addition, if these transactional costs were included, your costs would have been higher.
| | Annualized Expense Ratio-A | Beginning
Account Value
February 1, 2018 | Ending
Account Value
July 31, 2018 | Expenses Paid
During Period-B
February 1, 2018
to July 31, 2018 |
| Class A | 1.13% | | | |
| Actual | | $1,000.00 | $1,003.00 | $5.61 |
| Hypothetical-C | | $1,000.00 | $1,019.19 | $5.66 |
| Class M | 1.37% | | | |
| Actual | | $1,000.00 | $1,002.00 | $6.80 |
| Hypothetical-C | | $1,000.00 | $1,018.00 | $6.85 |
| Class C | 1.89% | | | |
| Actual | | $1,000.00 | $999.50 | $9.37 |
| Hypothetical-C | | $1,000.00 | $1,015.42 | $9.44 |
| Small Cap Value | .87% | | | |
| Actual | | $1,000.00 | $1,003.90 | $4.32 |
| Hypothetical-C | | $1,000.00 | $1,020.48 | $4.36 |
| Class I | .87% | | | |
| Actual | | $1,000.00 | $1,004.40 | $4.32 |
| Hypothetical-C | | $1,000.00 | $1,020.48 | $4.36 |
A Annualized expense ratio reflects expenses net of applicable fee waivers.
B Expenses are equal to each Class' annualized expense ratio, multiplied by the average account value over the period, multiplied by 181/365 (to reflect the one-half year period).
C 5% return per year before expenses
Distributions (Unaudited)
The Board of Trustees of Fidelity Small Cap Value Fund voted to pay to shareholders of record at the opening of business on record date, the following distributions per share derived from capital gains realized from sales of portfolio securities, and dividends derived from net investment income:
| | Pay Date | Record Date | Dividends | Capital Gains |
| Fidelity Small Cap Value Fund | | | | |
| Class A | 09/10/2018 | 09/07/2018 | $0.036 | $3.692 |
| Class M | 09/10/2018 | 09/07/2018 | $0.007 | $3.692 |
| Class C | 09/10/2018 | 09/07/2018 | $0.000 | $3.692 |
| Small Cap Value | 09/10/2018 | 09/07/2018 | $0.064 | $3.692 |
| Class I | 09/10/2018 | 09/07/2018 | $0.067 | $3.692 |
|
The fund hereby designates as a capital gain dividend with respect to the taxable year ended July 31 2018, $575,720,361, or, if subsequently determined to be different, the net capital gain of such year.
Class A, Class M, Class C, Small Cap Value and Class I designate 100% of the dividends distributed in September and December during the fiscal year as qualifying for the dividends–received deduction for corporate shareholders.
Class A, Class M, Class C, Small Cap Value and Class I designate 100% of the dividends distributed during the fiscal year as amounts which may be taken into account as a dividend for purposes of the maximum rate under section 1(h)(11) of the Internal Revenue Code.
The fund will notify shareholders in January 2019 of amounts for use in preparing 2018 income tax returns.
Board Approval of Investment Advisory Contracts
Fidelity Small Cap Value Fund
At its July 2018 meeting, the Board of Trustees, including the Independent Trustees (together, the Board), voted to continue the management contract with Fidelity Management & Research Company (FMR) and the sub-advisory agreements (together, the Advisory Contracts) for the fund for six months through January 31, 2019, in connection with the reunification of the Fidelity Equity High Income Funds Board, which oversees the fund, and the Sector Portfolios Board.
The Board considered that the approval of the fund's Advisory Contracts will not result in any changes in (i) the investment process or strategies employed in the management of the fund's assets; (ii) the fees and expenses paid by shareholders; (iii) the nature, extent or quality of services provided under the fund's Advisory Contracts; or (iv) the day-to-day management of the fund or the persons primarily responsible for such management. The Board concluded that the fund's Advisory Contracts are fair and reasonable, and that the fund's Advisory Contracts should be renewed, without modification, through January 31, 2019, with the understanding that the Board will consider the annual renewal for a full one year period in January 2019.
In connection with its consideration of future renewals of the fund's Advisory Contracts, the Board will consider: (i) the nature, extent and quality of services provided to the fund, including shareholder and administrative services and investment performance; (ii) the competitiveness of the management fee and total expenses for the fund; (iii) the costs of the services and profitability, including the revenues earned and the expenses incurred in conducting the business of developing, marketing, distributing, managing, administering, and servicing the fund and its shareholders, to the extent applicable, as well as potential fall-out benefits from Fidelity's non-fund businesses; and (iv) whether there have been economies of scale in respect of the Fidelity funds, whether the Fidelity funds (including the fund) have appropriately benefited from any such economies of scale, and whether there is the potential for realization of any further economies.
Based on its evaluation of all of the conclusions noted above, and after considering all factors it believed relevant, the Board ultimately concluded that the fund's management fee structure is fair and reasonable, and that the continuation of the fund's Advisory Contracts should be approved.
ASCV-ANN-0918
1.803734.113
Fidelity® Small Cap Value Fund
Annual Report July 31, 2018 |
|
Contents
To view a fund's proxy voting guidelines and proxy voting record for the 12-month period ended June 30, visit http://www.fidelity.com/proxyvotingresults or visit the Securities and Exchange Commission's (SEC) web site at http://www.sec.gov.
You may also call 1-800-544-8544 to request a free copy of the proxy voting guidelines.
Standard & Poor's, S&P and S&P 500 are registered service marks of The McGraw-Hill Companies, Inc. and have been licensed for use by Fidelity Distributors Corporation.
Other third-party marks appearing herein are the property of their respective owners.
All other marks appearing herein are registered or unregistered trademarks or service marks of FMR LLC or an affiliated company. © 2018 FMR LLC. All rights reserved.
This report and the financial statements contained herein are submitted for the general information of the shareholders of the Fund. This report is not authorized for distribution to prospective investors in the Fund unless preceded or accompanied by an effective prospectus.
A fund files its complete schedule of portfolio holdings with the SEC for the first and third quarters of each fiscal year on Form N-Q. Forms N-Q are available on the SEC’s web site at http://www.sec.gov. A fund's Forms N-Q may be reviewed and copied at the SEC’s Public Reference Room in Washington, DC. Information regarding the operation of the SEC's Public Reference Room may be obtained by calling 1-800-SEC-0330.
For a complete list of a fund's portfolio holdings, view the most recent holdings listing, semiannual report, or annual report on Fidelity's web site at http://www.fidelity.com, http://www.institutional.fidelity.com, or http://www.401k.com, as applicable.
NOT FDIC INSURED •MAY LOSE VALUE •NO BANK GUARANTEE
Neither the Fund nor Fidelity Distributors Corporation is a bank.
Performance: The Bottom Line
Average annual total return reflects the change in the value of an investment, assuming reinvestment of distributions from dividend income and capital gains (the profits earned upon the sale of securities that have grown in value, if any) and assuming a constant rate of performance each year. The hypothetical investment and the average annual total returns do not reflect the deduction of taxes that a shareholder would pay on fund distributions or the redemption of fund shares. During periods of reimbursement by Fidelity, a fund’s total return will be greater than it would be had the reimbursement not occurred. How a fund did yesterday is no guarantee of how it will do tomorrow.
Average Annual Total Returns
| For the periods ended July 31, 2018 | Past 1 year | Past 5 years | Past 10 years |
| Fidelity® Small Cap Value Fund | 10.88% | 9.81% | 12.13% |
$10,000 Over 10 Years
Let's say hypothetically that $10,000 was invested in Fidelity® Small Cap Value Fund, a class of the fund, on July 31, 2008.
The chart shows how the value of your investment would have changed, and also shows how the Russell 2000® Value Index performed over the same period.
| Period Ending Values |
| $31,418 | Fidelity® Small Cap Value Fund |
| $24,836 | Russell 2000® Value Index |
Management's Discussion of Fund Performance
Market Recap: The U.S. equity bellwether S&P 500
® index gained 16.24% for the 12 months ending July 31, 2018, despite a resurgence in volatility that challenged the multiyear bull market. Stocks maintained their steady growth until a sharp reversal in February, as volatility spiked amid fear that rising inflation and the potential for the economy to overheat would prompt the U.S. Federal Reserve to pick up the pace of interest rate hikes. The index posted its first negative monthly result since October 2016, and then lost further ground in March on fear of a global trade war. The market stabilized in April and turned upward through mid-June, when escalating trade tension between the U.S. and China soured investor sentiment. The resulting uncertainty lingered into July, but strong corporate earnings helped the S&P 500 rise 3.72% that month to cap the period. For the full one-year period, growth handily topped value, while small-caps bested large-caps. By sector, information technology (+28%) led the way, boosted by strong earnings growth from several major index constituents. Consumer discretionary rose roughly 24%, driven by retailers (+49%). Energy (+20%) gained alongside higher oil prices. Laggards were telecommunication services (-2%), consumer staples (0%) and utilities (+3%), defensive groups that struggled amid rising interest rates and a general preference for risk. Real estate (+5%) fared a bit better but still lagged, as did financials, industrials, health care (each up 13%) and materials (+11%).
Comments from Lead Portfolio Manager Clint Lawrence: For the fiscal year, the fund's share classes gained roughly 10% to 11%, trailing the 14.37% result of the benchmark Russell 2000
® Value Index. Relative to the index, the fund was most hampered by disappointing stock picking in several categories, especially financials, industrials, information technology and materials. Security selection in consumer discretionary and utilities added value, however, and in the lagging real estate sector, a combination of good stock picks and a beneficial underweighting contributed. On an individual basis, the biggest detractor was ProAssurance, a provider of medical malpractice insurance. Shares of the company fell after it forecasted rising insurance claims, consistent with industry trends. We sold the fund's stake in July. Another detractor was Tech Data, an IT distributor struggling amid pricing pressure. Cedar Fair, an operator of amusement parks, also detracted, as rising interest rates made this high-dividend stock less appealing. In contrast, a notable contributor was Cimpress, a Netherlands-based custom printing company that experienced expanding profit margins. We sold our stake due to the company's increased valuation. Another contributor was CalAtlantic Group, an out-of-benchmark homebuilder sold in February. Our biggest individual contributor was LivaNova, a medical-device manufacturer. During the period, LivaNova shares benefited from strength in the company's neuromodulation business.
The views expressed above reflect those of the portfolio manager(s) only through the end of the period as stated on the cover of this report and do not necessarily represent the views of Fidelity or any other person in the Fidelity organization. Any such views are subject to change at any time based upon market or other conditions and Fidelity disclaims any responsibility to update such views. These views may not be relied on as investment advice and, because investment decisions for a Fidelity fund are based on numerous factors, may not be relied on as an indication of trading intent on behalf of any Fidelity fund.
Note to shareholders: On December 30, 2017, Clint Lawrence assumed lead portfolio management responsibilities for the fund alongside Co-Manager Derek Janssen.
Investment Summary (Unaudited)
Top Ten Stocks as of July 31, 2018
| | % of fund's net assets |
| Store Capital Corp. | 2.8 |
| Moog, Inc. Class A | 2.7 |
| Regal Beloit Corp. | 2.6 |
| First Citizen Bancshares, Inc. | 2.6 |
| LINN Energy, Inc. | 2.6 |
| Beneficial Bancorp, Inc. | 2.5 |
| Enstar Group Ltd. | 2.4 |
| Rexford Industrial Realty, Inc. | 2.4 |
| IDACORP, Inc. | 2.4 |
| ShawCor Ltd. Class A | 2.4 |
| | 25.4 |
Top Five Market Sectors as of July 31, 2018
| | % of fund's net assets |
| Financials | 26.7 |
| Consumer Discretionary | 13.6 |
| Industrials | 12.9 |
| Real Estate | 11.3 |
| Information Technology | 8.7 |
Asset Allocation (% of fund's net assets)
| As of July 31, 2018* |
| | Stocks | 98.0% |
| | Bonds | 0.4% |
| | Short-Term Investments and Net Other Assets (Liabilities) | 1.6% |

* Foreign investments – 21.5%
Schedule of Investments July 31, 2018
Showing Percentage of Net Assets
| Common Stocks - 98.0% | | | |
| | | Shares | Value |
| CONSUMER DISCRETIONARY - 13.6% | | | |
| Auto Components - 2.2% | | | |
| Standard Motor Products, Inc. (a) | | 1,270,000 | $61,899,800 |
| Diversified Consumer Services - 0.7% | | | |
| Grand Canyon Education, Inc. (b) | | 176,800 | 20,602,504 |
| Hotels, Restaurants & Leisure - 3.0% | | | |
| Bluegreen Vacations Corp. (c) | | 1,382,600 | 35,546,646 |
| Cedar Fair LP (depositary unit) | | 847,116 | 48,404,208 |
| | | | 83,950,854 |
| Household Durables - 1.1% | | | |
| LGI Homes, Inc. (b)(c) | | 201,833 | 10,432,748 |
| Taylor Morrison Home Corp. (b) | | 1,005,400 | 19,635,462 |
| | | | 30,068,210 |
| Specialty Retail - 4.3% | | | |
| Aaron's, Inc. Class A | | 1,211,200 | 52,457,072 |
| Sally Beauty Holdings, Inc. (b)(c) | | 1,918,500 | 31,636,065 |
| Signet Jewelers Ltd. (c) | | 605,000 | 34,932,700 |
| | | | 119,025,837 |
| Textiles, Apparel & Luxury Goods - 2.3% | | | |
| Cadence Bancorp | | 1,101,600 | 29,996,568 |
| G-III Apparel Group Ltd. (b) | | 751,950 | 34,364,115 |
| | | | 64,360,683 |
|
| TOTAL CONSUMER DISCRETIONARY | | | 379,907,888 |
|
| CONSUMER STAPLES - 3.9% | | | |
| Food & Staples Retailing - 1.0% | | | |
| Bj's Wholesale Club Holdings, Inc. | | 1,170,000 | 29,004,300 |
| Food Products - 2.3% | | | |
| Nomad Foods Ltd. (b) | | 3,308,800 | 62,867,200 |
| Tobacco - 0.6% | | | |
| Universal Corp. | | 229,100 | 15,830,810 |
|
| TOTAL CONSUMER STAPLES | | | 107,702,310 |
|
| ENERGY - 7.9% | | | |
| Energy Equipment & Services - 3.9% | | | |
| Oil States International, Inc. (b) | | 1,221,900 | 42,644,310 |
| ShawCor Ltd. Class A | | 3,200,400 | 65,196,295 |
| | | | 107,840,605 |
| Oil, Gas & Consumable Fuels - 4.0% | | | |
| CVR Refining, LP | | 610,813 | 13,926,536 |
| Denbury Resources, Inc. (b) | | 2,154,800 | 9,718,148 |
| LINN Energy, Inc. (b) | | 1,729,100 | 71,930,560 |
| Whiting Petroleum Corp. (b) | | 336,300 | 16,697,295 |
| | | | 112,272,539 |
|
| TOTAL ENERGY | | | 220,113,144 |
|
| FINANCIALS - 26.7% | | | |
| Banks - 14.5% | | | |
| Associated Banc-Corp. | | 467,500 | 12,622,500 |
| Banner Corp. | | 143,400 | 9,029,898 |
| BOK Financial Corp. | | 250,600 | 24,390,898 |
| Cullen/Frost Bankers, Inc. | | 417,400 | 46,118,526 |
| CVB Financial Corp. | | 2,035,700 | 48,693,944 |
| Equity Bancshares, Inc. (b) | | 589,700 | 23,882,850 |
| First Citizen Bancshares, Inc. | | 178,324 | 72,545,770 |
| Heartland Financial U.S.A., Inc. | | 624,650 | 36,698,188 |
| Hilltop Holdings, Inc. | | 1,512,800 | 31,466,240 |
| Popular, Inc. | | 1,165,100 | 57,823,913 |
| Trico Bancshares | | 367,458 | 14,264,720 |
| UMB Financial Corp. | | 381,000 | 27,390,090 |
| | | | 404,927,537 |
| Capital Markets - 1.3% | | | |
| Cowen Group, Inc. Class A (b)(c) | | 158,482 | 2,488,167 |
| OM Asset Management Ltd. | | 2,417,901 | 34,455,089 |
| | | | 36,943,256 |
| Diversified Financial Services - 0.5% | | | |
| Donnelley Financial Solutions, Inc. (b) | | 650,799 | 13,536,619 |
| Insurance - 7.3% | | | |
| Argo Group International Holdings, Ltd. | | 929,975 | 58,169,936 |
| Axis Capital Holdings Ltd. | | 387,400 | 21,911,344 |
| Enstar Group Ltd. (b) | | 316,500 | 68,427,300 |
| First American Financial Corp. | | 590,675 | 33,077,800 |
| Primerica, Inc. | | 189,900 | 21,800,520 |
| | | | 203,386,900 |
| Thrifts & Mortgage Finance - 3.1% | | | |
| Beneficial Bancorp, Inc. (a) | | 4,345,800 | 70,619,250 |
| Washington Federal, Inc. | | 470,200 | 15,775,210 |
| | | | 86,394,460 |
|
| TOTAL FINANCIALS | | | 745,188,772 |
|
| HEALTH CARE - 5.1% | | | |
| Health Care Equipment & Supplies - 2.2% | | | |
| LivaNova PLC (b) | | 568,651 | 62,625,535 |
| Health Care Technology - 1.0% | | | |
| Cegedim SA (b) | | 701,397 | 27,065,893 |
| Pharmaceuticals - 1.9% | | | |
| Prestige Brands Holdings, Inc. (b) | | 1,449,400 | 51,787,062 |
|
| TOTAL HEALTH CARE | | | 141,478,490 |
|
| INDUSTRIALS - 12.5% | | | |
| Aerospace & Defense - 2.7% | | | |
| Moog, Inc. Class A | | 1,024,400 | 76,840,244 |
| Airlines - 0.3% | | | |
| Allegiant Travel Co. | | 74,600 | 9,220,560 |
| Electrical Equipment - 3.3% | | | |
| Melrose Industries PLC | | 6,512,499 | 18,455,090 |
| Regal Beloit Corp. | | 859,168 | 73,845,490 |
| | | | 92,300,580 |
| Machinery - 1.6% | | | |
| Apergy Corp. (b) | | 506,500 | 20,766,500 |
| Mueller Industries, Inc. | | 707,500 | 23,425,325 |
| | | | 44,191,825 |
| Professional Services - 1.8% | | | |
| CBIZ, Inc. (b) | | 2,335,800 | 51,387,600 |
| Road & Rail - 1.8% | | | |
| Genesee & Wyoming, Inc. Class A (b) | | 573,900 | 49,355,400 |
| Trading Companies & Distributors - 1.0% | | | |
| Applied Industrial Technologies, Inc. | | 250,100 | 18,669,965 |
| WESCO International, Inc. (b) | | 135,800 | 8,283,800 |
| | | | 26,953,765 |
|
| TOTAL INDUSTRIALS | | | 350,249,974 |
|
| INFORMATION TECHNOLOGY - 8.7% | | | |
| Electronic Equipment & Components - 3.0% | | | |
| SYNNEX Corp. | | 251,984 | 24,308,896 |
| Tech Data Corp. (b) | | 363,800 | 30,344,558 |
| TTM Technologies, Inc. (b) | | 1,690,314 | 29,343,851 |
| | | | 83,997,305 |
| Internet Software & Services - 2.0% | | | |
| j2 Global, Inc. | | 655,800 | 55,638,072 |
| IT Services - 3.7% | | | |
| EVERTEC, Inc. | | 2,627,700 | 61,225,410 |
| Hackett Group, Inc. | | 247,558 | 4,463,471 |
| Presidio, Inc. (b) | | 721,178 | 10,067,645 |
| Science Applications International Corp. | | 314,400 | 26,525,928 |
| | | | 102,282,454 |
| Technology Hardware, Storage & Peripherals - 0.0% | | | |
| Super Micro Computer, Inc. (b) | | 51,342 | 1,134,658 |
|
| TOTAL INFORMATION TECHNOLOGY | | | 243,052,489 |
|
| MATERIALS - 3.6% | | | |
| Chemicals - 0.8% | | | |
| Orion Engineered Carbons SA | | 708,979 | 23,254,511 |
| Containers & Packaging - 2.3% | | | |
| Silgan Holdings, Inc. | | 2,338,500 | 64,332,135 |
| Metals & Mining - 0.5% | | | |
| Compass Minerals International, Inc. (c) | | 194,300 | 13,183,255 |
|
| TOTAL MATERIALS | | | 100,769,901 |
|
| REAL ESTATE - 11.3% | | | |
| Equity Real Estate Investment Trusts (REITs) - 11.3% | | | |
| CareTrust (REIT), Inc. | | 3,396,400 | 57,433,124 |
| Clipper Realty, Inc. | | 98,389 | 1,046,859 |
| Corporate Office Properties Trust (SBI) | | 992,300 | 29,511,002 |
| Equity Commonwealth (b) | | 1,834,700 | 59,150,728 |
| Four Corners Property Trust, Inc. | | 934,100 | 23,259,090 |
| Rexford Industrial Realty, Inc. | | 2,189,500 | 67,086,280 |
| Store Capital Corp. | | 2,809,500 | 77,120,775 |
| | | | 314,607,858 |
| UTILITIES - 4.7% | | | |
| Electric Utilities - 4.2% | | | |
| El Paso Electric Co. | | 812,200 | 50,600,060 |
| IDACORP, Inc. | | 702,700 | 66,222,448 |
| | | | 116,822,508 |
| Independent Power and Renewable Electricity Producers - 0.5% | | | |
| NRG Yield, Inc. Class C | | 723,320 | 13,453,752 |
|
| TOTAL UTILITIES | | | 130,276,260 |
|
| TOTAL COMMON STOCKS | | | |
| (Cost $2,252,502,104) | | | 2,733,347,086 |
| | | Principal Amount | Value |
|
| Nonconvertible Bonds - 0.4% | | | |
| INDUSTRIALS - 0.4% | | | |
| Machinery - 0.4% | | | |
Mueller Industries, Inc. 6% 3/1/27
(Cost $10,499,000) | | 10,499,000 | 10,262,773 |
| | | Shares | Value |
|
| Money Market Funds - 3.0% | | | |
| Fidelity Cash Central Fund, 1.96% (d) | | 46,335,882 | 46,345,149 |
| Fidelity Securities Lending Cash Central Fund 1.97% (d)(e) | | 38,497,133 | 38,500,983 |
| TOTAL MONEY MARKET FUNDS | | | |
| (Cost $84,846,244) | | | 84,846,132 |
| TOTAL INVESTMENT IN SECURITIES - 101.4% | | | |
| (Cost $2,347,847,348) | | | 2,828,455,991 |
| NET OTHER ASSETS (LIABILITIES) - (1.4)% | | | (40,112,347) |
| NET ASSETS - 100% | | | $2,788,343,644 |
Legend
(a) Affiliated company
(b) Non-income producing
(c) Security or a portion of the security is on loan at period end.
(d) Affiliated fund that is generally available only to investment companies and other accounts managed by Fidelity Investments. The rate quoted is the annualized seven-day yield of the fund at period end. A complete unaudited listing of the fund's holdings as of its most recent quarter end is available upon request. In addition, each Fidelity Central Fund's financial statements, which are not covered by the Fund's Report of Independent Registered Public Accounting Firm, are available on the SEC's website or upon request.
(e) Investment made with cash collateral received from securities on loan.
Affiliated Central Funds
Information regarding fiscal year to date income earned by the Fund from investments in Fidelity Central Funds is as follows:
| Fund | Income earned |
| Fidelity Cash Central Fund | $682,995 |
| Fidelity Securities Lending Cash Central Fund | 458,479 |
| Total | $1,141,474 |
Amounts in the income column in the above table include any capital gain distributions from underlying funds, which are presented in the corresponding line-item in the Statement of Operations if applicable.
Other Affiliated Issuers
An affiliated company is a company in which the Fund has ownership of at least 5% of the voting securities. Fiscal year to date transactions with companies which are or were affiliates are as follows:
| Affiliate | Value, beginning of period | Purchases | Sales Proceeds | Dividend Income | Realized Gain (loss) | Change in Unrealized appreciation (depreciation) | Value, end of period |
| Beneficial Bancorp, Inc. | $-- | $69,914,018 | $-- | $738,184 | $-- | $705,232 | $70,619,250 |
| Civitas Solutions, Inc. | 44,625,000 | -- | 40,943,841 | -- | (1,146,537) | (2,534,622) | -- |
| Standard Motor Products, Inc. | 35,910,864 | 26,966,297 | -- | 723,057 | -- | (977,361) | 61,899,800 |
| Total | $80,535,864 | $96,880,315 | $40,943,841 | $1,461,241 | $(1,146,537) | $(2,806,751) | $132,519,050 |
Investment Valuation
The following is a summary of the inputs used, as of July 31, 2018, involving the Fund's assets and liabilities carried at fair value. The inputs or methodology used for valuing securities may not be an indication of the risk associated with investing in those securities. For more information on valuation inputs, and their aggregation into the levels used below, please refer to the Investment Valuation section in the accompanying Notes to Financial Statements.
| | Valuation Inputs at Reporting Date: |
| Description | Total | Level 1 | Level 2 | Level 3 |
| Investments in Securities: | | | | |
| Equities: | | | | |
| Consumer Discretionary | $379,907,888 | $379,907,888 | $-- | $-- |
| Consumer Staples | 107,702,310 | 107,702,310 | -- | -- |
| Energy | 220,113,144 | 220,113,144 | -- | -- |
| Financials | 745,188,772 | 745,188,772 | -- | -- |
| Health Care | 141,478,490 | 141,478,490 | -- | -- |
| Industrials | 350,249,974 | 350,249,974 | -- | -- |
| Information Technology | 243,052,489 | 243,052,489 | -- | -- |
| Materials | 100,769,901 | 100,769,901 | -- | -- |
| Real Estate | 314,607,858 | 314,607,858 | -- | -- |
| Utilities | 130,276,260 | 130,276,260 | -- | -- |
| Corporate Bonds | 10,262,773 | -- | 10,262,773 | -- |
| Money Market Funds | 84,846,132 | 84,846,132 | -- | -- |
| Total Investments in Securities: | $2,828,455,991 | $2,818,193,218 | $10,262,773 | $-- |
Other Information
Distribution of investments by country or territory of incorporation, as a percentage of Total Net Assets, is as follows (Unaudited):
| United States of America | 78.5% |
| Bermuda | 6.6% |
| Puerto Rico | 4.3% |
| United Kingdom | 4.1% |
| Canada | 2.4% |
| British Virgin Islands | 2.3% |
| France | 1.0% |
| Others (Individually Less Than 1%) | 0.8% |
| | 100.0% |
See accompanying notes which are an integral part of the financial statements.
Financial Statements
Statement of Assets and Liabilities
| | | July 31, 2018 |
| Assets | | |
Investment in securities, at value (including securities loaned of $37,650,404) — See accompanying schedule:
Unaffiliated issuers (cost $2,138,897,979) | $2,611,090,809 | |
| Fidelity Central Funds (cost $84,846,244) | 84,846,132 | |
| Other affiliated issuers (cost $124,103,125) | 132,519,050 | |
| Total Investment in Securities (cost $2,347,847,348) | | $2,828,455,991 |
| Receivable for investments sold | | 57,056,749 |
| Receivable for fund shares sold | | 1,616,058 |
| Dividends receivable | | 637,820 |
| Interest receivable | | 262,475 |
| Distributions receivable from Fidelity Central Funds | | 67,651 |
| Prepaid expenses | | 7,405 |
| Other receivables | | 76,802 |
| Total assets | | 2,888,180,951 |
| Liabilities | | |
| Payable to custodian bank | $1,494,617 | |
| Payable for investments purchased | 53,046,906 | |
| Payable for fund shares redeemed | 5,018,339 | |
| Accrued management fee | 1,097,063 | |
| Distribution and service plan fees payable | 100,561 | |
| Other affiliated payables | 523,228 | |
| Other payables and accrued expenses | 74,193 | |
| Collateral on securities loaned | 38,482,400 | |
| Total liabilities | | 99,837,307 |
| Net Assets | | $2,788,343,644 |
| Net Assets consist of: | | |
| Paid in capital | | $1,834,379,796 |
| Undistributed net investment income | | 4,125,965 |
| Accumulated undistributed net realized gain (loss) on investments and foreign currency transactions | | 469,229,240 |
| Net unrealized appreciation (depreciation) on investments | | 480,608,643 |
| Net Assets | | $2,788,343,644 |
| Calculation of Maximum Offering Price | | |
| Class A: | | |
| Net Asset Value and redemption price per share ($162,572,170 ÷ 7,997,534 shares) | | $20.33 |
| Maximum offering price per share (100/94.25 of $20.33) | | $21.57 |
| Class M: | | |
| Net Asset Value and redemption price per share ($69,379,710 ÷ 3,497,276 shares) | | $19.84 |
| Maximum offering price per share (100/96.50 of $19.84) | | $20.56 |
| Class C: | | |
| Net Asset Value and offering price per share ($44,395,738 ÷ 2,400,215 shares)(a) | | $18.50 |
| Small Cap Value: | | |
| Net Asset Value, offering price and redemption price per share ($2,052,664,450 ÷ 99,092,320 shares) | | $20.71 |
| Class I: | | |
| Net Asset Value, offering price and redemption price per share ($459,331,576 ÷ 22,168,783 shares) | | $20.72 |
(a) Redemption price per share is equal to net asset value less any applicable contingent deferred sales charge.
See accompanying notes which are an integral part of the financial statements.
Statement of Operations
| | | Year ended July 31, 2018 |
| Investment Income | | |
| Dividends (including $1,461,241 earned from other affiliated issuers) | | $46,582,478 |
| Special dividends | | 6,923,500 |
| Interest | | 629,940 |
| Income from Fidelity Central Funds | | 1,141,474 |
| Total income | | 55,277,392 |
| Expenses | | |
| Management fee | | |
| Basic fee | $22,998,390 | |
| Performance adjustment | (83,004) | |
| Transfer agent fees | 6,157,978 | |
| Distribution and service plan fees | 1,284,677 | |
| Accounting and security lending fees | 988,624 | |
| Custodian fees and expenses | 52,735 | |
| Independent trustees' fees and expenses | 14,438 | |
| Registration fees | 104,929 | |
| Audit | 62,558 | |
| Legal | 8,838 | |
| Interest | 13,248 | |
| Miscellaneous | 25,214 | |
| Total expenses before reductions | 31,628,625 | |
| Expense reductions | (207,165) | |
| Total expenses after reductions | | 31,421,460 |
| Net investment income (loss) | | 23,855,932 |
| Realized and Unrealized Gain (Loss) | | |
| Net realized gain (loss) on: | | |
| Investment securities: | | |
| Unaffiliated issuers | 581,735,533 | |
| Fidelity Central Funds | 7,948 | |
| Other affiliated issuers | (1,146,537) | |
| Foreign currency transactions | (119,455) | |
| Total net realized gain (loss) | | 580,477,489 |
| Change in net unrealized appreciation (depreciation) on: | | |
| Investment securities: | | |
| Unaffiliated issuers | (253,169,688) | |
| Fidelity Central Funds | (4,220) | |
| Other affiliated issuers | (2,806,751) | |
| Assets and liabilities in foreign currencies | (14) | |
| Total change in net unrealized appreciation (depreciation) | | (255,980,673) |
| Net gain (loss) | | 324,496,816 |
| Net increase (decrease) in net assets resulting from operations | | $348,352,748 |
See accompanying notes which are an integral part of the financial statements.
Statement of Changes in Net Assets
| | Year ended July 31, 2018 | Year ended July 31, 2017 |
| Increase (Decrease) in Net Assets | | |
| Operations | | |
| Net investment income (loss) | $23,855,932 | $44,455,877 |
| Net realized gain (loss) | 580,477,489 | 78,723,874 |
| Change in net unrealized appreciation (depreciation) | (255,980,673) | 334,723,173 |
| Net increase (decrease) in net assets resulting from operations | 348,352,748 | 457,902,924 |
| Distributions to shareholders from net investment income | (37,440,500) | (25,276,323) |
| Distributions to shareholders from net realized gain | (91,159,109) | (209,689,485) |
| Total distributions | (128,599,609) | (234,965,808) |
| Share transactions - net increase (decrease) | (851,457,506) | (12,022,135) |
| Redemption fees | 89,036 | 469,836 |
| Total increase (decrease) in net assets | (631,615,331) | 211,384,817 |
| Net Assets | | |
| Beginning of period | 3,419,958,975 | 3,208,574,158 |
| End of period | $2,788,343,644 | $3,419,958,975 |
| Other Information | | |
| Undistributed net investment income end of period | $4,125,965 | $22,996,598 |
See accompanying notes which are an integral part of the financial statements.
Financial Highlights
Fidelity Small Cap Value Fund Class A
| Years ended July 31, | 2018 | 2017 | 2016 | 2015 | 2014 |
| Selected Per–Share Data | | | | | |
| Net asset value, beginning of period | $19.05 | $17.92 | $19.14 | $19.29 | $19.96 |
| Income from Investment Operations | | | | | |
| Net investment income (loss)A | .10B | .20C | .07 | .10D | .03 |
| Net realized and unrealized gain (loss) | 1.87 | 2.23 | .56 | 2.01 | 1.24 |
| Total from investment operations | 1.97 | 2.43 | .63 | 2.11 | 1.27 |
| Distributions from net investment income | (.17) | (.10) | (.11) | (.02) | (.01) |
| Distributions from net realized gain | (.52) | (1.20) | (1.75) | (2.25) | (1.93) |
| Total distributions | (.69) | (1.30) | (1.85)E | (2.26)F | (1.94) |
| Redemption fees added to paid in capitalA,G | – | – | – | – | – |
| Net asset value, end of period | $20.33 | $19.05 | $17.92 | $19.14 | $19.29 |
| Total ReturnH,I | 10.65% | 14.61% | 4.07% | 11.86% | 6.83% |
| Ratios to Average Net AssetsJ,K | | | | | |
| Expenses before reductions | 1.18% | 1.24% | 1.41% | 1.42% | 1.36% |
| Expenses net of fee waivers, if any | 1.17% | 1.24% | 1.41% | 1.39% | 1.35% |
| Expenses net of all reductions | 1.17% | 1.24% | 1.41% | 1.39% | 1.34% |
| Net investment income (loss) | .49%B | 1.10%C | .43% | .52%D | .13% |
| Supplemental Data | | | | | |
| Net assets, end of period (000 omitted) | $162,572 | $184,306 | $218,364 | $235,844 | $258,183 |
| Portfolio turnover rateL | 55% | 26% | 33% | 34% | 26%M |
A Calculated based on average shares outstanding during the period.
B Net investment income per share reflects a large, non-recurring dividend which amounted to $.04 per share. Excluding this non-recurring dividend, the ratio of net investment income (loss) to average net assets would have been .29%.
C Net investment income per share reflects a large, non-recurring dividend which amounted to $.09 per share. Excluding this non-recurring dividend, the ratio of net investment income (loss) to average net assets would have been .61%.
D Net investment income per share reflects a large, non-recurring dividend which amounted to $.05 per share. Excluding this non-recurring dividend, the ratio of net investment income (loss) to average net assets would have been .26%.
E Total distributions of $1.85 per share is comprised of distributions from net investment income of $.105 and distributions from net realized gain of $1.747 per share.
F Total distributions of $2.26 per share is comprised of distributions from net investment income of $.016 and distributions from net realized gain of $2.248 per share.
G Amount represents less than $.005 per share.
H Total returns would have been lower if certain expenses had not been reduced during the applicable periods shown.
I Total returns do not include the effect of the sales charges.
J Fees and expenses of any underlying Fidelity Central Funds are not included in the Fund's expense ratio. The Fund indirectly bears its proportionate share of the expenses of any underlying Fidelity Central Funds.
K Expense ratios reflect operating expenses of the class. Expenses before reductions do not reflect amounts reimbursed by the investment adviser or reductions from brokerage service arrangements or reductions from other expense offset arrangements and do not represent the amount paid by the class during periods when reimbursements or reductions occur. Expenses net of fee waivers reflect expenses after reimbursement by the investment adviser but prior to reductions from brokerage service arrangements or other expense offset arrangements. Expenses net of all reductions represent the net expenses paid by the class.
L Amount does not include the portfolio activity of any underlying Fidelity Central Funds.
M Portfolio turnover rate excludes securities received or delivered in-kind.
See accompanying notes which are an integral part of the financial statements.
Fidelity Small Cap Value Fund Class M
| Years ended July 31, | 2018 | 2017 | 2016 | 2015 | 2014 |
| Selected Per–Share Data | | | | | |
| Net asset value, beginning of period | $18.61 | $17.54 | $18.78 | $18.98 | $19.70 |
| Income from Investment Operations | | | | | |
| Net investment income (loss)A | .05B | .15C | .03 | .05D | (.02) |
| Net realized and unrealized gain (loss) | 1.82 | 2.18 | .54 | 1.98 | 1.23 |
| Total from investment operations | 1.87 | 2.33 | .57 | 2.03 | 1.21 |
| Distributions from net investment income | (.13) | (.07) | (.06) | – | – |
| Distributions from net realized gain | (.52) | (1.20) | (1.75) | (2.23) | (1.93) |
| Total distributions | (.64)E | (1.26)F | (1.81) | (2.23) | (1.93) |
| Redemption fees added to paid in capitalA,G | – | – | – | – | – |
| Net asset value, end of period | $19.84 | $18.61 | $17.54 | $18.78 | $18.98 |
| Total ReturnH,I | 10.39% | 14.35% | 3.76% | 11.58% | 6.58% |
| Ratios to Average Net AssetsJ,K | | | | | |
| Expenses before reductions | 1.42% | 1.49% | 1.66% | 1.67% | 1.61% |
| Expenses net of fee waivers, if any | 1.42% | 1.49% | 1.66% | 1.64% | 1.59% |
| Expenses net of all reductions | 1.41% | 1.49% | 1.65% | 1.63% | 1.59% |
| Net investment income (loss) | .25%B | .86%C | .19% | .27%D | (.11)% |
| Supplemental Data | | | | | |
| Net assets, end of period (000 omitted) | $69,380 | $78,852 | $82,337 | $91,716 | $100,975 |
| Portfolio turnover rateL | 55% | 26% | 33% | 34% | 26%M |
A Calculated based on average shares outstanding during the period.
B Net investment income per share reflects a large, non-recurring dividend which amounted to $.04 per share. Excluding this non-recurring dividend, the ratio of net investment income (loss) to average net assets would have been .04%.
C Net investment income per share reflects a large, non-recurring dividend which amounted to $.09 per share. Excluding this non-recurring dividend, the ratio of net investment income (loss) to average net assets would have been .36%.
D Net investment income per share reflects a large, non-recurring dividend which amounted to $.05 per share. Excluding this non-recurring dividend, the ratio of net investment income (loss) to average net assets would have been .01%.
E Total distributions of $.64 per share is comprised of distributions from net investment income of $.125 and distributions from net realized gain of $.519 per share.
F Total distributions of $1.26 per share is comprised of distributions from net investment income of $.067 and distributions from net realized gain of $1.195 per share.
G Amount represents less than $.005 per share.
H Total returns would have been lower if certain expenses had not been reduced during the applicable periods shown.
I Total returns do not include the effect of the sales charges.
J Fees and expenses of any underlying Fidelity Central Funds are not included in the Fund's expense ratio. The Fund indirectly bears its proportionate share of the expenses of any underlying Fidelity Central Funds.
K Expense ratios reflect operating expenses of the class. Expenses before reductions do not reflect amounts reimbursed by the investment adviser or reductions from brokerage service arrangements or reductions from other expense offset arrangements and do not represent the amount paid by the class during periods when reimbursements or reductions occur. Expenses net of fee waivers reflect expenses after reimbursement by the investment adviser but prior to reductions from brokerage service arrangements or other expense offset arrangements. Expenses net of all reductions represent the net expenses paid by the class.
L Amount does not include the portfolio activity of any underlying Fidelity Central Funds.
M Portfolio turnover rate excludes securities received or delivered in-kind.
See accompanying notes which are an integral part of the financial statements.
Fidelity Small Cap Value Fund Class C
| Years ended July 31, | 2018 | 2017 | 2016 | 2015 | 2014 |
| Selected Per–Share Data | | | | | |
| Net asset value, beginning of period | $17.39 | $16.52 | $17.82 | $18.19 | $19.06 |
| Income from Investment Operations | | | | | |
| Net investment income (loss)A | (.05)B | .06C | (.05) | (.04)D | (.12) |
| Net realized and unrealized gain (loss) | 1.71 | 2.04 | .50 | 1.90 | 1.18 |
| Total from investment operations | 1.66 | 2.10 | .45 | 1.86 | 1.06 |
| Distributions from net investment income | (.03) | (.04) | – | – | – |
| Distributions from net realized gain | (.52) | (1.20) | (1.75) | (2.23) | (1.93) |
| Total distributions | (.55) | (1.23)E | (1.75) | (2.23) | (1.93) |
| Redemption fees added to paid in capitalA,F | – | – | – | – | – |
| Net asset value, end of period | $18.50 | $17.39 | $16.52 | $17.82 | $18.19 |
| Total ReturnG,H | 9.84% | 13.79% | 3.20% | 11.05% | 5.97% |
| Ratios to Average Net AssetsI,J | | | | | |
| Expenses before reductions | 1.93% | 2.00% | 2.18% | 2.19% | 2.12% |
| Expenses net of fee waivers, if any | 1.93% | 2.00% | 2.17% | 2.16% | 2.11% |
| Expenses net of all reductions | 1.92% | 2.00% | 2.17% | 2.15% | 2.10% |
| Net investment income (loss) | (.26)%B | .35%C | (.33)% | (.25)%D | (.63)% |
| Supplemental Data | | | | | |
| Net assets, end of period (000 omitted) | $44,396 | $52,227 | $57,231 | $64,928 | $70,541 |
| Portfolio turnover rateK | 55% | 26% | 33% | 34% | 26%L |
A Calculated based on average shares outstanding during the period.
B Net investment income per share reflects a large, non-recurring dividend which amounted to $.04 per share. Excluding this non-recurring dividend, the ratio of net investment income (loss) to average net assets would have been (.47) %.
C Net investment income per share reflects a large, non-recurring dividend which amounted to $.08 per share. Excluding this non-recurring dividend, the ratio of net investment income (loss) to average net assets would have been (.15) %.
D Net investment income per share reflects a large, non-recurring dividend which amounted to $.05 per share. Excluding this non-recurring dividend, the ratio of net investment income (loss) to average net assets would have been (.51) %.
E Total distributions of $1.23 per share is comprised of distributions from net investment income of $.036 and distributions from net realized gain of $1.195 per share.
F Amount represents less than $.005 per share.
G Total returns would have been lower if certain expenses had not been reduced during the applicable periods shown.
H Total returns do not include the effect of the contingent deferred sales charge.
I Fees and expenses of any underlying Fidelity Central Funds are not included in the Fund's expense ratio. The Fund indirectly bears its proportionate share of the expenses of any underlying Fidelity Central Funds.
J Expense ratios reflect operating expenses of the class. Expenses before reductions do not reflect amounts reimbursed by the investment adviser or reductions from brokerage service arrangements or reductions from other expense offset arrangements and do not represent the amount paid by the class during periods when reimbursements or reductions occur. Expenses net of fee waivers reflect expenses after reimbursement by the investment adviser but prior to reductions from brokerage service arrangements or other expense offset arrangements. Expenses net of all reductions represent the net expenses paid by the class.
K Amount does not include the portfolio activity of any underlying Fidelity Central Funds.
L Portfolio turnover rate excludes securities received or delivered in-kind.
See accompanying notes which are an integral part of the financial statements.
Fidelity Small Cap Value Fund
| Years ended July 31, | 2018 | 2017 | 2016 | 2015 | 2014 |
| Selected Per–Share Data | | | | | |
| Net asset value, beginning of period | $19.41 | $18.22 | $19.45 | $19.57 | $20.22 |
| Income from Investment Operations | | | | | |
| Net investment income (loss)A | .15B | .25C | .12 | .15D | .08 |
| Net realized and unrealized gain (loss) | 1.89 | 2.28 | .55 | 2.05 | 1.26 |
| Total from investment operations | 2.04 | 2.53 | .67 | 2.20 | 1.34 |
| Distributions from net investment income | (.22) | (.15) | (.15) | (.07) | (.06) |
| Distributions from net realized gain | (.52) | (1.20) | (1.75) | (2.25) | (1.93) |
| Total distributions | (.74) | (1.34)E | (1.90) | (2.32) | (1.99) |
| Redemption fees added to paid in capitalA,F | – | – | – | – | – |
| Net asset value, end of period | $20.71 | $19.41 | $18.22 | $19.45 | $19.57 |
| Total ReturnG | 10.88% | 14.99% | 4.23% | 12.18% | 7.12% |
| Ratios to Average Net AssetsH,I | | | | | |
| Expenses before reductions | .91% | .99% | 1.18% | 1.15% | 1.08% |
| Expenses net of fee waivers, if any | .91% | .99% | 1.18% | 1.12% | 1.06% |
| Expenses net of all reductions | .91% | .99% | 1.17% | 1.12% | 1.06% |
| Net investment income (loss) | .76%B | 1.36%C | .67% | .78%D | .41% |
| Supplemental Data | | | | | |
| Net assets, end of period (000 omitted) | $2,052,664 | $2,637,843 | $2,460,714 | $2,036,157 | $2,060,546 |
| Portfolio turnover rateJ | 55% | 26% | 33% | 34% | 26%K |
A Calculated based on average shares outstanding during the period.
B Net investment income per share reflects a large, non-recurring dividend which amounted to $.04 per share. Excluding this non-recurring dividend, the ratio of net investment income (loss) to average net assets would have been .55%.
C Net investment income per share reflects a large, non-recurring dividend which amounted to $.09 per share. Excluding this non-recurring dividend, the ratio of net investment income (loss) to average net assets would have been .86%.
D Net investment income per share reflects a large, non-recurring dividend which amounted to $.05 per share. Excluding this non-recurring dividend, the ratio of net investment income (loss) to average net assets would have been .53%.
E Total distributions of $1.34 per share is comprised of distributions from net investment income of $.145 and distributions from net realized gain of $1.195 per share.
F Amount represents less than $.005 per share.
G Total returns would have been lower if certain expenses had not been reduced during the applicable periods shown.
H Fees and expenses of any underlying Fidelity Central Funds are not included in the Fund's expense ratio. The Fund indirectly bears its proportionate share of the expenses of any underlying Fidelity Central Funds.
I Expense ratios reflect operating expenses of the class. Expenses before reductions do not reflect amounts reimbursed by the investment adviser or reductions from brokerage service arrangements or reductions from other expense offset arrangements and do not represent the amount paid by the class during periods when reimbursements or reductions occur. Expenses net of fee waivers reflect expenses after reimbursement by the investment adviser but prior to reductions from brokerage service arrangements or other expense offset arrangements. Expenses net of all reductions represent the net expenses paid by the class.
J Amount does not include the portfolio activity of any underlying Fidelity Central Funds.
K Portfolio turnover rate excludes securities received or delivered in-kind.
See accompanying notes which are an integral part of the financial statements.
Fidelity Small Cap Value Fund Class I
| Years ended July 31, | 2018 | 2017 | 2016 | 2015 | 2014 |
| Selected Per–Share Data | | | | | |
| Net asset value, beginning of period | $19.41 | $18.23 | $19.45 | $19.57 | $20.23 |
| Income from Investment Operations | | | | | |
| Net investment income (loss)A | .15B | .25C | .12 | .15D | .08 |
| Net realized and unrealized gain (loss) | 1.90 | 2.28 | .56 | 2.05 | 1.25 |
| Total from investment operations | 2.05 | 2.53 | .68 | 2.20 | 1.33 |
| Distributions from net investment income | (.22) | (.15) | (.16) | (.07) | (.06) |
| Distributions from net realized gain | (.52) | (1.20) | (1.75) | (2.25) | (1.93) |
| Total distributions | (.74) | (1.35) | (1.90)E | (2.32) | (1.99) |
| Redemption fees added to paid in capitalA,F | – | – | – | – | – |
| Net asset value, end of period | $20.72 | $19.41 | $18.23 | $19.45 | $19.57 |
| Total ReturnG | 10.93% | 14.96% | 4.31% | 12.17% | 7.08% |
| Ratios to Average Net AssetsH,I | | | | | |
| Expenses before reductions | .91% | .98% | 1.14% | 1.15% | 1.09% |
| Expenses net of fee waivers, if any | .91% | .97% | 1.14% | 1.12% | 1.07% |
| Expenses net of all reductions | .90% | .97% | 1.14% | 1.12% | 1.07% |
| Net investment income (loss) | .76%B | 1.37%C | .70% | .79%D | .40% |
| Supplemental Data | | | | | |
| Net assets, end of period (000 omitted) | $459,332 | $466,730 | $389,928 | $376,817 | $342,500 |
| Portfolio turnover rateJ | 55% | 26% | 33% | 34% | 26%K |
A Calculated based on average shares outstanding during the period.
B Net investment income per share reflects a large, non-recurring dividend which amounted to $.04 per share. Excluding this non-recurring dividend, the ratio of net investment income (loss) to average net assets would have been .55%.
C Net investment income per share reflects a large, non-recurring dividend which amounted to $.09 per share. Excluding this non-recurring dividend, the ratio of net investment income (loss) to average net assets would have been .88%.
D Net investment income per share reflects a large, non-recurring dividend which amounted to $.05 per share. Excluding this non-recurring dividend, the ratio of net investment income (loss) to average net assets would have been .53%.
E Total distributions of $1.90 per share is comprised of distributions from net investment income of $.157 and distributions from net realized gain of $1.747 per share.
F Amount represents less than $.005 per share.
G Total returns would have been lower if certain expenses had not been reduced during the applicable periods shown.
H Fees and expenses of any underlying Fidelity Central Funds are not included in the Fund's expense ratio. The Fund indirectly bears its proportionate share of the expenses of any underlying Fidelity Central Funds.
I Expense ratios reflect operating expenses of the class. Expenses before reductions do not reflect amounts reimbursed by the investment adviser or reductions from brokerage service arrangements or reductions from other expense offset arrangements and do not represent the amount paid by the class during periods when reimbursements or reductions occur. Expenses net of fee waivers reflect expenses after reimbursement by the investment adviser but prior to reductions from brokerage service arrangements or other expense offset arrangements. Expenses net of all reductions represent the net expenses paid by the class.
J Amount does not include the portfolio activity of any underlying Fidelity Central Funds.
K Portfolio turnover rate excludes securities received or delivered in-kind.
See accompanying notes which are an integral part of the financial statements.
Notes to Financial Statements
For the period ended July 31, 2018
1. Organization.
Fidelity Small Cap Value Fund (the Fund) is a fund of Fidelity Securities Fund (the Trust) and is authorized to issue an unlimited number of shares. The Trust is registered under the Investment Company Act of 1940, as amended (the 1940 Act), as an open-end management investment company organized as a Massachusetts business trust. The Fund offers Class A, Class M, Class C, Small Cap Value and Class I shares, each of which has equal rights as to assets and voting privileges. The Fund is closed to new accounts with certain exceptions. Each class has exclusive voting rights with respect to matters that affect that class.
2. Investments in Fidelity Central Funds.
The Fund invests in Fidelity Central Funds, which are open-end investment companies generally available only to other investment companies and accounts managed by the investment adviser and its affiliates. The Fund's Schedule of Investments lists each of the Fidelity Central Funds held as of period end, if any, as an investment of the Fund, but does not include the underlying holdings of each Fidelity Central Fund. As an Investing Fund, the Fund indirectly bears its proportionate share of the expenses of the underlying Fidelity Central Funds.
The Money Market Central Funds seek preservation of capital and current income and are managed by Fidelity Investments Money Management, Inc. (FIMM), an affiliate of the investment adviser. Annualized expenses of the Money Market Central Funds as of their most recent shareholder report date are less than .005%.
A complete unaudited list of holdings for each Fidelity Central Fund is available upon request or at the Securities and Exchange Commission (the SEC) website at www.sec.gov. In addition, the financial statements of the Fidelity Central Funds, which are not covered by the Fund's Report of Independent Registered Public Accounting Firm, are available on the SEC website or upon request.
3. Significant Accounting Policies.
The Fund is an investment company and applies the accounting and reporting guidance of the Financial Accounting Standards Board (FASB) Accounting Standards Codification Topic 946 Financial Services – Investments Companies. The financial statements have been prepared in conformity with accounting principles generally accepted in the United States of America (GAAP), which require management to make certain estimates and assumptions at the date of the financial statements. Actual results could differ from those estimates. Subsequent events, if any, through the date that the financial statements were issued have been evaluated in the preparation of the financial statements. The following summarizes the significant accounting policies of the Fund:
Investment Valuation. Investments are valued as of 4:00 p.m. Eastern time on the last calendar day of the period. The Board of Trustees (the Board) has delegated the day to day responsibility for the valuation of the Fund's investments to the Fair Value Committee (the Committee) established by the Fund's investment adviser. In accordance with valuation policies and procedures approved by the Board, the Fund attempts to obtain prices from one or more third party pricing vendors or brokers to value its investments. When current market prices, quotations or currency exchange rates are not readily available or reliable, investments will be fair valued in good faith by the Committee, in accordance with procedures adopted by the Board. Factors used in determining fair value vary by investment type and may include market or investment specific events, changes in interest rates and credit quality. The frequency with which these procedures are used cannot be predicted and they may be utilized to a significant extent. The Committee oversees the Fund's valuation policies and procedures and reports to the Board on the Committee's activities and fair value determinations. The Board monitors the appropriateness of the procedures used in valuing the Fund's investments and ratifies the fair value determinations of the Committee.
The Fund categorizes the inputs to valuation techniques used to value its investments into a disclosure hierarchy consisting of three levels as shown below:
- Level 1 – quoted prices in active markets for identical investments
- Level 2 – other significant observable inputs (including quoted prices for similar investments, interest rates, prepayment speeds, etc.)
- Level 3 – unobservable inputs (including the Fund's own assumptions based on the best information available)
Valuation techniques used to value the Fund's investments by major category are as follows:
Equity securities, including restricted securities, for which market quotations are readily available, are valued at the last reported sale price or official closing price as reported by a third party pricing vendor on the primary market or exchange on which they are traded and are categorized as Level 1 in the hierarchy. In the event there were no sales during the day or closing prices are not available, securities are valued at the last quoted bid price or may be valued using the last available price and are generally categorized as Level 2 in the hierarchy. For foreign equity securities, when market or security specific events arise, comparisons to the valuation of American Depositary Receipts (ADRs), futures contracts, Exchange-Traded Funds (ETFs) and certain indexes as well as quoted prices for similar securities may be used and would be categorized as Level 2 in the hierarchy. Utilizing these techniques may result in transfers between Level 1 and Level 2. For equity securities, including restricted securities, where observable inputs are limited, assumptions about market activity and risk are used and these securities may be categorized as Level 3 in the hierarchy.
Debt securities, including restricted securities, are valued based on evaluated prices received from third party pricing vendors or from brokers who make markets in such securities. Corporate bonds are valued by pricing vendors who utilize matrix pricing which considers yield or price of bonds of comparable quality, coupon, maturity and type or by broker-supplied prices. When independent prices are unavailable or unreliable, debt securities may be valued utilizing pricing methodologies which consider similar factors that would be used by third party pricing vendors. Debt securities are generally categorized as Level 2 in the hierarchy but may be Level 3 depending on the circumstances.
Investments in open-end mutual funds, including the Fidelity Central Funds, are valued at their closing net asset value (NAV) each business day and are categorized as Level 1 in the hierarchy.
Changes in valuation techniques may result in transfers in or out of an assigned level within the disclosure hierarchy. The aggregate value of investments by input level as of July 31, 2018 is included at the end of the Fund's Schedule of Investments.
Foreign Currency. The Fund may use foreign currency contracts to facilitate transactions in foreign-denominated securities. Gains and losses from these transactions may arise from changes in the value of the foreign currency or if the counterparties do not perform under the contracts' terms.
Foreign-denominated assets, including investment securities, and liabilities are translated into U.S. dollars at the exchange rates at period end. Purchases and sales of investment securities, income and dividends received and expenses denominated in foreign currencies are translated into U.S. dollars at the exchange rate in effect on the transaction date.
The effects of exchange rate fluctuations on investments are included with the net realized and unrealized gain (loss) on investment securities. Other foreign currency transactions resulting in realized and unrealized gain (loss) are disclosed separately.
Investment Transactions and Income. For financial reporting purposes, the Fund's investment holdings and NAV include trades executed through the end of the last business day of the period. The NAV per share for processing shareholder transactions is calculated as of the close of business of the New York Stock Exchange (NYSE), normally 4:00 p.m. Eastern time and includes trades executed through the end of the prior business day. Gains and losses on securities sold are determined on the basis of identified cost and include proceeds received from litigation. Dividend income is recorded on the ex-dividend date, except for certain dividends from foreign securities where the ex-dividend date may have passed, which are recorded as soon as the Fund is informed of the ex-dividend date. Non-cash dividends included in dividend income, if any, are recorded at the fair market value of the securities received. Income and capital gain distributions from Fidelity Central Funds, if any, are recorded on the ex-dividend date. Certain distributions received by the Fund represent a return of capital or capital gain. The Fund determines the components of these distributions subsequent to the ex-dividend date, based upon receipt of tax filings or other correspondence relating to the underlying investment. These distributions are recorded as a reduction of cost of investments and/or as a realized gain. Large, non-recurring dividends recognized by the Fund are presented separately on the Statement of Operations as "Special Dividends" and the impact of these dividends is presented in the Financial Highlights. Interest income is accrued as earned and includes coupon interest and amortization of premium and accretion of discount on debt securities as applicable. Investment income is recorded net of foreign taxes withheld where recovery of such taxes is uncertain.
Class Allocations and Expenses. Investment income, realized and unrealized capital gains and losses, common expenses of the Fund, and certain fund-level expense reductions, if any, are allocated daily on a pro-rata basis to each class based on the relative net assets of each class to the total net assets of the Fund. Each class differs with respect to transfer agent and distribution and service plan fees incurred. Certain expense reductions may also differ by class. For the reporting period, the allocated portion of income and expenses to each class as a percent of its average net assets may vary due to the timing of recording these transactions in relation to fluctuating net assets of the classes. Expenses directly attributable to a fund are charged to that fund. Expenses attributable to more than one fund are allocated among the respective funds on the basis of relative net assets or other appropriate methods. Expense estimates are accrued in the period to which they relate and adjustments are made when actual amounts are known.
Income Tax Information and Distributions to Shareholders. Each year, the Fund intends to qualify as a regulated investment company under Subchapter M of the Internal Revenue Code, including distributing substantially all of its taxable income and realized gains. As a result, no provision for U.S. Federal income taxes is required. As of July 31, 2018, the Fund did not have any unrecognized tax benefits in the financial statements; nor is the Fund aware of any tax positions for which it is reasonably possible that the total amounts of unrecognized tax benefits will significantly change in the next twelve months. The Fund files a U.S. federal tax return, in addition to state and local tax returns as required. The Fund's federal income tax returns are subject to examination by the Internal Revenue Service (IRS) for a period of three fiscal years after they are filed. State and local tax returns may be subject to examination for an additional fiscal year depending on the jurisdiction. Foreign taxes are provided for based on the Fund's understanding of the tax rules and rates that exist in the foreign markets in which it invests.
Distributions are declared and recorded on the ex-dividend date. Income and capital gain distributions are declared separately for each class. Income and capital gain distributions are determined in accordance with income tax regulations, which may differ from GAAP. In addition, the Fund claimed a portion of the payment made to redeeming shareholders as a distribution for income tax purposes.
Capital accounts within the financial statements are adjusted for permanent book-tax differences. These adjustments have no impact on net assets or the results of operations. Capital accounts are not adjusted for temporary book-tax differences which will reverse in a subsequent period.
Book-tax differences are primarily due to foreign currency transactions, passive foreign investment companies (PFIC), partnerships and losses deferred due to wash sales.
As of period end, the cost and unrealized appreciation (depreciation) in securities, and derivatives if applicable, for federal income tax purposes were as follows:
| Gross unrealized appreciation | $545,370,597 |
| Gross unrealized depreciation | (62,320,291) |
| Net unrealized appreciation (depreciation) | $483,050,306 |
| Tax Cost | $2,345,405,685 |
The tax-based components of distributable earnings as of period end were as follows:
| Undistributed ordinary income | $7,390,220 |
| Undistributed long-term capital gain | $466,787,577 |
| Net unrealized appreciation (depreciation) on securities and other investments | $479,786,051 |
The tax character of distributions paid was as follows:
| | July 31, 2018 | July 31, 2017 |
| Ordinary Income | $39,181,764 | $ 25,276,323 |
| Long-term Capital Gains | 89,417,845 | 209,689,485 |
| Total | $128,599,609 | $ 234,965,808 |
Short-Term Trading (Redemption) Fees. Shares held by investors in the Fund less than 90 days may have been subject to a redemption fee equal to 1.50% of the NAV of shares redeemed. All redemption fees, which reduce the proceeds of the shareholder redemption, are retained by the Fund and accounted for as an addition to paid in capital. In November 2017, the Board of Trustees approved the elimination of these redemption fees effective December 18, 2017.
4. Purchases and Sales of Investments.
Purchases and sales of securities, other than short-term securities, aggregated $1,789,692,654 and $2,726,418,003, respectively.
5. Fees and Other Transactions with Affiliates.
Management Fee. Fidelity Management & Research Company (the investment adviser) and its affiliates provide the Fund with investment management related services for which the Fund pays a monthly management fee. The management fee is the sum of an individual fund fee rate that is based on an annual rate of .45% of the Fund's average net assets and an annualized group fee rate that averaged .24% during the period. The group fee rate is based upon the average net assets of all the mutual funds advised by the investment adviser, including any mutual funds previously advised by the investment adviser that are currently advised by Fidelity SelectCo, LLC, an affiliate of the investment adviser. The group fee rate decreases as assets under management increase and increases as assets under management decrease. In addition, the management fee is subject to a performance adjustment (up to a maximum of +/- .20% of the Fund's average net assets over a 36 month performance period). The upward or downward adjustment to the management fee is based on the relative investment performance of Small Cap Value as compared to its benchmark index, the Russell 2000 Value Index, over the same 36 month performance period. For the reporting period, the total annual management fee rate, including the performance adjustment, was .69% of the Fund's average net assets. The performance adjustment included in the management fee rate may be higher or lower than the maximum performance adjustment rate due to the difference between the average net assets for the reporting and performance periods.
Distribution and Service Plan Fees. In accordance with Rule 12b-1 of the 1940 Act, the Fund has adopted separate Distribution and Service Plans for each class of shares. Certain classes pay Fidelity Distributors Corporation (FDC), an affiliate of the investment adviser, separate Distribution and Service Fees, each of which is based on an annual percentage of each class' average net assets. In addition, FDC may pay financial intermediaries for selling shares of the Fund and providing shareholder support services. For the period, the Distribution and Service Fee rates, total fees and amounts retained by FDC were as follows:
| | Distribution Fee | Service Fee | Total Fees | Retained by FDC |
| Class A | -% | .25% | $429,673 | $1,174 |
| Class M | .25% | .25% | 374,032 | 872 |
| Class C | .75% | .25% | 480,972 | – |
| | | | $1,284,677 | $2,046 |
Sales Load. FDC may receive a front-end sales charge of up to 5.75% for selling Class A shares and 3.50% for selling Class M shares, some of which is paid to financial intermediaries for selling shares of the Fund. Depending on the holding period, FDC may receive contingent deferred sales charges levied on Class A, Class M and Class C redemptions. The deferred sales charges are 1.00% for Class C shares, 1.00% for certain purchases of Class A shares and .25% for certain purchases of Class M shares.
For the period, sales charge amounts retained by FDC were as follows:
| | Retained by FDC |
| Class A | $3,637 |
| Class M | 1,647 |
| Class C(a) | 620 |
| | $5,904 |
(a) When Class C shares are initially sold, FDC pays commissions from its own resources to financial intermediaries through which the sales are made.
Transfer Agent Fees. Fidelity Investments Institutional Operations Company, Inc., (FIIOC), an affiliate of the investment adviser, is the transfer, dividend disbursing and shareholder servicing agent for each class of the Fund. FIIOC receives account fees and asset-based fees that vary according to the account size and type of account of the shareholders of the respective classes of the Fund. FIIOC pays for typesetting, printing and mailing of shareholder reports, except proxy statements.
For the period, transfer agent fees for each class were as follows:
| | Amount | % of Class-Level Average Net Assets |
| Class A | $340,327 | .20 |
| Class M | 144,109 | .19 |
| Class C | 98,065 | .20 |
| Small Cap Value | 4,731,660 | .18 |
| Class I | 843,817 | .18 |
| | $6,157,978 | |
Accounting and Security Lending Fees. Fidelity Service Company, Inc. (FSC), an affiliate of the investment adviser, maintains the Fund's accounting records. The accounting fee is based on the level of average net assets for each month. Under a separate contract, FSC administers the security lending program. The security lending fee is based on the number and duration of lending transactions. For the period, the fees were equivalent to an annual rate of .03%.
Brokerage Commissions. The Fund placed a portion of its portfolio transactions with brokerage firms which are affiliates of the investment adviser. Brokerage commissions are included in net realized gain (loss) and change in net unrealized appreciation (depreciation) in the Statement of Operations. The commissions paid to these affiliated firms were $55,485 for the period.
Interfund Lending Program. Pursuant to an Exemptive Order issued by the SEC, the Fund, along with other registered investment companies having management contracts with Fidelity Management & Research Company (FMR) or other affiliated entities of FMR, may participate in an interfund lending program. This program provides an alternative credit facility allowing the funds to borrow from, or lend money to, other participating affiliated funds. At period end, there were no interfund loans outstanding. The Fund's activity in this program during the period for which loans were outstanding was as follows:
| Borrower or Lender | Average Loan Balance | Weighted Average Interest Rate | Interest Expense |
| Borrower | $19,342,615 | 1.90% | $13,248 |
Interfund Trades. The Fund may purchase from or sell securities to other Fidelity Funds under procedures adopted by the Board. The procedures have been designed to ensure these interfund trades are executed in accordance with Rule 17a-7 of the 1940 Act. Interfund trades are included within the respective purchases and sales amounts shown in the Purchases and Sales of Investments note.
6. Committed Line of Credit.
The Fund participates with other funds managed by the investment adviser or an affiliate in a $4.25 billion credit facility (the "line of credit") to be utilized for temporary or emergency purposes to fund shareholder redemptions or for other short-term liquidity purposes. The Fund has agreed to pay commitment fees on its pro-rata portion of the line of credit, which amounted to $9,648 and is reflected in Miscellaneous expenses on the Statement of Operations. During the period, the Fund did not borrow on this line of credit.
7. Security Lending.
The Fund lends portfolio securities through a lending agent from time to time in order to earn additional income. For equity securities, a lending agent is used and may loan securities to certain qualified borrowers, including Fidelity Capital Markets (FCM), a broker-dealer affiliated with the Fund. On the settlement date of the loan, the Fund receives collateral (in the form of U.S. Treasury obligations, letters of credit and/or cash) against the loaned securities and maintains collateral in an amount not less than 100% of the market value of the loaned securities during the period of the loan. The market value of the loaned securities is determined at the close of business of the Fund and any additional required collateral is delivered to the Fund on the next business day. The Fund or borrower may terminate the loan at any time, and if the borrower defaults on its obligation to return the securities loaned because of insolvency or other reasons, the Fund may apply collateral received from the borrower against the obligation. The Fund may experience delays and costs in recovering the securities loaned. Any cash collateral received is invested in the Fidelity Securities Lending Cash Central Fund. The value of loaned securities and cash collateral at period end are disclosed on the Fund's Statement of Assets and Liabilities. Security lending income represents the income earned on investing cash collateral, less rebates paid to borrowers and any lending agent fees associated with the loan, plus any premium payments received for lending certain types of securities. Security lending income is presented in the Statement of Operations as a component of income from Fidelity Central Funds. Total security lending income during the period amounted to $458,479. During the period, there were no securities loaned to FCM.
8. Expense Reductions.
Commissions paid to certain brokers with whom the investment adviser, or its affiliates, places trades on behalf of the Fund include an amount in addition to trade execution, which may be rebated back to the Fund to offset certain expenses. This amount totaled $171,568 for the period. In addition, through arrangements with the Fund's custodian, credits realized as a result of certain uninvested cash balances were used to reduce the Fund's expenses. During the period, these credits reduced the Fund's custody expenses by $179.
In addition, during the period the investment adviser reimbursed and/or waived a portion of fund-level operating expenses in the amount of $35,418.
9. Distributions to Shareholders.
Distributions to shareholders of each class were as follows:
| | Year ended
July 31, 2018 | Year ended
July 31, 2017 |
| From net investment income | | |
| Class A | $1,524,304 | $1,211,951 |
| Class M | 515,970 | 315,712 |
| Class C | 97,347 | 123,016 |
| Small Cap Value | 30,080,300 | 20,285,848 |
| Class I | 5,222,579 | 3,339,796 |
| Total | $37,440,500 | $25,276,323 |
| From net realized gain | | |
| Class A | $4,758,907 | $14,206,153 |
| Class M | 2,138,544 | 5,563,443 |
| Class C | 1,473,571 | 4,084,634 |
| Small Cap Value | 70,617,875 | 160,012,743 |
| Class I | 12,170,212 | 25,822,512 |
| Total | $91,159,109 | $209,689,485 |
10. Share Transactions.
Share transactions for each class were as follows and may contain automatic conversions between classes or exchanges between affiliated funds:
| | Shares | Shares | Dollars | Dollars |
| | Year ended July 31, 2018 | Year ended July 31, 2017 | Year ended July 31, 2018 | Year ended July 31, 2017 |
| Class A | | | | |
| Shares sold | 787,560 | 1,506,738 | $15,530,971 | $27,403,663 |
| Reinvestment of distributions | 330,015 | 903,681 | 6,184,396 | 15,154,493 |
| Shares redeemed | (2,794,205) | (4,924,614) | (54,717,368) | (89,702,542) |
| Net increase (decrease) | (1,676,630) | (2,514,195) | $(33,002,001) | $(47,144,386) |
| Class M | | | | |
| Shares sold | 258,708 | 678,291 | $4,991,221 | $12,111,422 |
| Reinvestment of distributions | 144,050 | 354,357 | 2,638,888 | 5,809,028 |
| Shares redeemed | (1,141,985) | (1,490,409) | (22,088,950) | (26,553,974) |
| Net increase (decrease) | (739,227) | (457,761) | $(14,458,841) | $(8,633,524) |
| Class C | | | | |
| Shares sold | 65,629 | 191,618 | $1,177,591 | $3,203,223 |
| Reinvestment of distributions | 85,987 | 251,057 | 1,473,685 | 3,851,053 |
| Shares redeemed | (754,141) | (903,381) | (13,467,588) | (15,005,685) |
| Net increase (decrease) | (602,525) | (460,706) | $(10,816,312) | $(7,951,409) |
| Small Cap Value | | | | |
| Shares sold | 33,774,572 | 31,283,294 | $673,371,571 | $582,054,205 |
| Reinvestment of distributions | 4,774,555 | 10,073,160 | 90,647,491 | 172,025,201 |
| Shares redeemed | (75,386,466) | (40,448,579) | (1,518,420,951) | (750,552,096) |
| Net increase (decrease) | (36,837,339) | 907,875 | $(754,401,889) | $3,527,310 |
| Class I | | | | |
| Shares sold | 4,588,604 | 6,859,852 | $91,876,636 | $128,013,262 |
| Reinvestment of distributions | 785,425 | 1,477,352 | 14,952,991 | 25,225,719 |
| Shares redeemed | (7,249,457) | (5,680,327) | (145,608,090) | (105,059,107) |
| Net increase (decrease) | (1,875,428) | 2,656,877 | $(38,778,463) | $48,179,874 |
11. Other.
The Fund's organizational documents provide former and current trustees and officers with a limited indemnification against liabilities arising in connection with the performance of their duties to the Fund. In the normal course of business, the Fund may also enter into contracts that provide general indemnifications. The Fund's maximum exposure under these arrangements is unknown as this would be dependent on future claims that may be made against the Fund. The risk of material loss from such claims is considered remote.
Report of Independent Registered Public Accounting Firm
To the Board of Trustees of Fidelity Securities Fund and Shareholders of Fidelity Small Cap Value Fund:
Opinion on the Financial Statements
We have audited the accompanying statement of assets and liabilities, including the schedule of investments, of Fidelity Small Cap Value Fund (one of the funds constituting Fidelity Securities Fund, referred to hereafter as the "Fund") as of July 31, 2018, the related statement of operations for the year ended July 31, 2018, the statement of changes in net assets for each of the two years in the period ended July 31, 2018, including the related notes, and the financial highlights for each of the five years in the period ended July 31, 2018 (collectively referred to as the “financial statements”). In our opinion, the financial statements present fairly, in all material respects, the financial position of the Fund as of July 31, 2018, the results of its operations for the year then ended, the changes in its net assets for each of the two years in the period ended July 31, 2018 and the financial highlights for each of the five years in the period ended July 31, 2018 in conformity with accounting principles generally accepted in the United States of America.
Basis for Opinion
These financial statements are the responsibility of the Fund’s management. Our responsibility is to express an opinion on the Fund’s financial statements based on our audits. We are a public accounting firm registered with the Public Company Accounting Oversight Board (United States) (“PCAOB”) and are required to be independent with respect to the Fund in accordance with the U.S. federal securities laws and the applicable rules and regulations of the Securities and Exchange Commission and the PCAOB.
We conducted our audits of these financial statements in accordance with the standards of the PCAOB. Those standards require that we plan and perform the audit to obtain reasonable assurance about whether the financial statements are free of material misstatement, whether due to error or fraud.
Our audits included performing procedures to assess the risks of material misstatement of the financial statements, whether due to error or fraud, and performing procedures that respond to those risks. Such procedures included examining, on a test basis, evidence regarding the amounts and disclosures in the financial statements. Our audits also included evaluating the accounting principles used and significant estimates made by management, as well as evaluating the overall presentation of the financial statements. Our procedures included confirmation of securities owned as of July 31, 2018 by correspondence with the custodian and brokers; when replies were not received from brokers, we performed other auditing procedures. We believe that our audits provide a reasonable basis for our opinion.
PricewaterhouseCoopers LLP
Boston, Massachusetts
September 13, 2018
We have served as the auditor of one or more investment companies in the Fidelity group of funds since 1932.
Trustees and Officers
The Trustees, Members of the Advisory Board (if any), and officers of the trust and fund, as applicable, are listed below. The Board of Trustees governs the fund and is responsible for protecting the interests of shareholders. The Trustees are experienced executives who meet periodically throughout the year to oversee the fund's activities, review contractual arrangements with companies that provide services to the fund, oversee management of the risks associated with such activities and contractual arrangements, and review the fund's performance. Except for Jonathan Chiel, each of the Trustees oversees 286 funds. Mr. Chiel oversees 150 funds.
The Trustees hold office without limit in time except that (a) any Trustee may resign; (b) any Trustee may be removed by written instrument, signed by at least two-thirds of the number of Trustees prior to such removal; (c) any Trustee who requests to be retired or who has become incapacitated by illness or injury may be retired by written instrument signed by a majority of the other Trustees; and (d) any Trustee may be removed at any special meeting of shareholders by a two-thirds vote of the outstanding voting securities of the trust. Each Trustee who is not an interested person (as defined in the 1940 Act) of the trust and the fund is referred to herein as an Independent Trustee. Each Independent Trustee shall retire not later than the last day of the calendar year in which his or her 75th birthday occurs. The Independent Trustees may waive this mandatory retirement age policy with respect to individual Trustees. Officers and Advisory Board Members hold office without limit in time, except that any officer or Advisory Board Member may resign or may be removed by a vote of a majority of the Trustees at any regular meeting or any special meeting of the Trustees. Except as indicated, each individual has held the office shown or other offices in the same company for the past five years.
The fund’s Statement of Additional Information (SAI) includes more information about the Trustees. To request a free copy, call Fidelity at 1-800-544-8544.
Experience, Skills, Attributes, and Qualifications of the Trustees. The Governance and Nominating Committee has adopted a statement of policy that describes the experience, qualifications, attributes, and skills that are necessary and desirable for potential Independent Trustee candidates (Statement of Policy). The Board believes that each Trustee satisfied at the time he or she was initially elected or appointed a Trustee, and continues to satisfy, the standards contemplated by the Statement of Policy. The Governance and Nominating Committee also engages professional search firms to help identify potential Independent Trustee candidates who have the experience, qualifications, attributes, and skills consistent with the Statement of Policy. From time to time, additional criteria based on the composition and skills of the current Independent Trustees, as well as experience or skills that may be appropriate in light of future changes to board composition, business conditions, and regulatory or other developments, have also been considered by the professional search firms and the Governance and Nominating Committee. In addition, the Board takes into account the Trustees' commitment and participation in Board and committee meetings, as well as their leadership of standing and ad hoc committees throughout their tenure.
In determining that a particular Trustee was and continues to be qualified to serve as a Trustee, the Board has considered a variety of criteria, none of which, in isolation, was controlling. The Board believes that, collectively, the Trustees have balanced and diverse experience, qualifications, attributes, and skills, which allow the Board to operate effectively in governing the fund and protecting the interests of shareholders. Information about the specific experience, skills, attributes, and qualifications of each Trustee, which in each case led to the Board's conclusion that the Trustee should serve (or continue to serve) as a trustee of the fund, is provided below.
Board Structure and Oversight Function. James C. Curvey is an interested person and currently serves as Chairman. The Trustees have determined that an interested Chairman is appropriate and benefits shareholders because an interested Chairman has a personal and professional stake in the quality and continuity of services provided to the fund. Independent Trustees exercise their informed business judgment to appoint an individual of their choosing to serve as Chairman, regardless of whether the Trustee happens to be independent or a member of management. The Independent Trustees have determined that they can act independently and effectively without having an Independent Trustee serve as Chairman and that a key structural component for assuring that they are in a position to do so is for the Independent Trustees to constitute a substantial majority for the Board. The Independent Trustees also regularly meet in executive session. Ned C. Lautenbach serves as Chairman of the Independent Trustees and as such (i) acts as a liaison between the Independent Trustees and management with respect to matters important to the Independent Trustees and (ii) with management prepares agendas for Board meetings.
Fidelity® funds are overseen by different Boards of Trustees. The fund's Board oversees Fidelity's high income and certain equity funds, and other Boards oversee Fidelity's investment-grade bond, money market, asset allocation, and other equity funds. The asset allocation funds may invest in Fidelity® funds overseen by the fund's Board. The use of separate Boards, each with its own committee structure, allows the Trustees of each group of Fidelity® funds to focus on the unique issues of the funds they oversee, including common research, investment, and operational issues. On occasion, the separate Boards establish joint committees to address issues of overlapping consequences for the Fidelity® funds overseen by each Board.
The Trustees operate using a system of committees to facilitate the timely and efficient consideration of all matters of importance to the Trustees, the fund, and fund shareholders and to facilitate compliance with legal and regulatory requirements and oversight of the fund's activities and associated risks. The Board, acting through its committees, has charged FMR and its affiliates with (i) identifying events or circumstances the occurrence of which could have demonstrably adverse effects on the fund's business and/or reputation; (ii) implementing processes and controls to lessen the possibility that such events or circumstances occur or to mitigate the effects of such events or circumstances if they do occur; and (iii) creating and maintaining a system designed to evaluate continuously business and market conditions in order to facilitate the identification and implementation processes described in (i) and (ii) above. Because the day-to-day operations and activities of the fund are carried out by or through FMR, its affiliates, and other service providers, the fund's exposure to risks is mitigated but not eliminated by the processes overseen by the Trustees. While each of the Board's committees has responsibility for overseeing different aspects of the fund's activities, oversight is exercised primarily through the Operations, Audit, and Compliance Committees. In addition, the Independent Trustees have worked with Fidelity to enhance the Board's oversight of investment and financial risks, legal and regulatory risks, technology risks, and operational risks, including the development of additional risk reporting to the Board. Appropriate personnel, including but not limited to the fund's Chief Compliance Officer (CCO), FMR's internal auditor, the independent accountants, the fund's Treasurer and portfolio management personnel, make periodic reports to the Board's committees, as appropriate, including an annual review of Fidelity's risk management program for the Fidelity® funds. The responsibilities of each standing committee, including their oversight responsibilities, are described further under "Standing Committees of the Trustees."
Interested Trustees*:
Correspondence intended for a Trustee who is an interested person may be sent to Fidelity Investments, 245 Summer Street, Boston, Massachusetts 02210.
Name, Year of Birth; Principal Occupations and Other Relevant Experience+
Jonathan Chiel (1957)
Year of Election or Appointment: 2016
Trustee
Mr. Chiel also serves as Trustee of other Fidelity® funds. Mr. Chiel is Executive Vice President and General Counsel for FMR LLC (diversified financial services company, 2012-present). Previously, Mr. Chiel served as general counsel (2004-2012) and senior vice president and deputy general counsel (2000-2004) for John Hancock Financial Services; a partner with Choate, Hall & Stewart (1996-2000) (law firm); and an Assistant United States Attorney for the United States Attorney’s Office of the District of Massachusetts (1986-95), including Chief of the Criminal Division (1993-1995). Mr. Chiel is a director on the boards of the Boston Bar Foundation and the Maimonides School.
James C. Curvey (1935)
Year of Election or Appointment: 2007
Trustee
Chairman of the Board of Trustees
Mr. Curvey also serves as Trustee of other Fidelity® funds. Mr. Curvey is Vice Chairman (2007-present) and Director of FMR LLC (diversified financial services company). In addition, Mr. Curvey is an Overseer Emeritus for the Boston Symphony Orchestra, a Director of Artis-Naples, and a Trustee of Brewster Academy in Wolfeboro, New Hampshire. Previously, Mr. Curvey served as a Director of Fidelity Research & Analysis Co. (investment adviser firm, 2009-2018), Director of Fidelity Investments Money Management, Inc. (investment adviser firm, 2009-2014) and a Director of FMR and FMR Co., Inc. (investment adviser firms, 2007-2014).
Charles S. Morrison (1960)
Year of Election or Appointment: 2014
Trustee
Mr. Morrison also serves as Trustee of other funds. He serves as President of Fidelity SelectCo, LLC (investment adviser firm, 2017-present) and Fidelity Management & Research Company (FMR) (investment adviser firm, 2016-present), a Director of Fidelity Investments Money Management, Inc. (FIMM) (investment adviser firm, 2014-present), Director of Fidelity SelectCo, LLC (investment adviser firm, 2014-present), President, Asset Management (2014-present), and is an employee of Fidelity Investments. Previously, Mr. Morrison served as Vice President of Fidelity's Fixed Income and Asset Allocation Funds (2012-2014), President, Fixed Income (2011-2014), Vice President of Fidelity's Money Market Funds (2005-2009), President, Money Market Group Leader of FMR (investment adviser firm, 2009), and Senior Vice President, Money Market Group of FMR (2004-2009). Mr. Morrison also served as Vice President of Fidelity's Bond Funds (2002-2005), certain Balanced Funds (2002-2005), and certain Asset Allocation Funds (2002-2007), and as Senior Vice President (2002-2005) of Fidelity's Bond Division.
* Determined to be an “Interested Trustee” by virtue of, among other things, his or her affiliation with the trust or various entities under common control with FMR.
+ The information includes the Trustee's principal occupation during the last five years and other information relating to the experience, attributes, and skills relevant to the Trustee's qualifications to serve as a Trustee, which led to the conclusion that the Trustee should serve as a Trustee for the fund.
Independent Trustees:
Correspondence intended for an Independent Trustee may be sent to Fidelity Investments, P.O. Box 55235, Boston, Massachusetts 02205-5235.
Name, Year of Birth; Principal Occupations and Other Relevant Experience+
Dennis J. Dirks (1948)
Year of Election or Appointment: 2005
Trustee
Mr. Dirks also serves as Trustee of other Fidelity® funds. Prior to his retirement in May 2003, Mr. Dirks was Chief Operating Officer and a member of the Board of The Depository Trust & Clearing Corporation (DTCC). He also served as President, Chief Operating Officer, and Board member of The Depository Trust Company (DTC) and President and Board member of the National Securities Clearing Corporation (NSCC). In addition, Mr. Dirks served as Chief Executive Officer and Board member of the Government Securities Clearing Corporation, Chief Executive Officer and Board member of the Mortgage-Backed Securities Clearing Corporation, as a Trustee and a member of the Finance Committee of Manhattan College (2005-2008), as a Trustee and a member of the Finance Committee of AHRC of Nassau County (2006-2008), as a member of the Independent Directors Council (IDC) Governing Council (2010-2015), and as a member of the Board of Directors for The Brookville Center for Children’s Services, Inc. (2009-2017). Mr. Dirks is a member of the Finance Committee (2016-present), Board of Directors (2017-present) and Board of Trustees (2018-present) and is Treasurer (2018-present) of the Asolo Repertory Theatre.
Donald F. Donahue (1950)
Year of Election or Appointment: 2018
Trustee
Mr. Donahue also serves as a Trustee of other Fidelity® funds. Mr. Donahue is President and Chief Executive Officer of Miranda Partners, LLC (risk consulting for the financial services industry, 2012-present). Previously, Mr. Donahue served as a Member of the Advisory Board of certain Fidelity® funds (2015-2018) and Chief Executive Officer (2006-2012), Chief Operating Officer (2003-2006), and Managing Director, Customer Marketing and Development (1999-2003) of The Depository Trust & Clearing Corporation (financial markets infrastructure). Mr. Donahue serves as a Member (2007-present) and Co-Chairman (2016-present) of the Board of Directors of United Way of New York, Member of the Board of Directors of NYC Leadership Academy (2012-present) and Member of the Board of Advisors of Ripple Labs, Inc. (financial services, 2015-present). He also served as Chairman (2010-2012) and Member of the Board of Directors (2012-2013) of Omgeo, LLC (financial services), Treasurer of United Way of New York (2012-2016), and Member of the Board of Directors of XBRL US (financial services non-profit, 2009-2012) and the International Securities Services Association (2009-2012).
Alan J. Lacy (1953)
Year of Election or Appointment: 2008
Trustee
Mr. Lacy also serves as Trustee of other Fidelity® funds. Mr. Lacy serves as a Director of Bristol-Myers Squibb Company (global pharmaceuticals, 2008-present). He is a Trustee of the California Chapter of The Nature Conservancy (2015-present) and a Director of the Center for Advanced Study in the Behavioral Sciences at Stanford University (2015-present). In addition, Mr. Lacy served as Senior Adviser (2007-2014) of Oak Hill Capital Partners, L.P. (private equity) and also served as Chief Executive Officer (2005) and Vice Chairman (2005-2006) of Sears Holdings Corporation (retail) and Chief Executive Officer and Chairman of the Board of Sears, Roebuck and Co. (retail, 2000-2005). Previously, Mr. Lacy served as Chairman (2014-2017) and a member (2010-2017) of the Board of Directors of Dave & Buster’s Entertainment, Inc. (restaurant and entertainment complexes), as Chairman (2008-2011) and a member (2006-2015) of the Board of Trustees of the National Parks Conservation Association, and as a member of the Board of Directors for The Hillman Companies, Inc. (hardware wholesalers, 2010-2014), Earth Fare, Inc. (retail grocery, 2010-2014), and The Western Union Company (global money transfer, 2006-2011).
Ned C. Lautenbach (1944)
Year of Election or Appointment: 2000
Trustee
Chairman of the Independent Trustees
Mr. Lautenbach also serves as Trustee of other Fidelity® funds. Mr. Lautenbach currently serves as Vice Chair of the Board of Governors, State University System of Florida (2013-present) and is a member of the Council on Foreign Relations (1994-present). He is also a member and has most recently served as Chairman of the Board of Directors of Artis-Naples (2012-present). Previously, Mr. Lautenbach served as a member and then Lead Director of the Board of Directors of Eaton Corporation (diversified industrial, 1997-2016). He was also a Partner and Advisory Partner at Clayton, Dubilier & Rice, LLC (private equity investment, 1998-2010), as well as a Director of Sony Corporation (2006-2007). In addition, Mr. Lautenbach also had a 30-year career with IBM (technology company) during which time he served as Senior Vice President and a member of the Corporate Executive Committee (1968-1998).
Joseph Mauriello (1944)
Year of Election or Appointment: 2008
Trustee
Mr. Mauriello also serves as Trustee of other Fidelity® funds. Prior to his retirement in January 2006, Mr. Mauriello served in numerous senior management positions including Deputy Chairman and Chief Operating Officer (2004-2005), and Vice Chairman of Financial Services (2002-2004) of KPMG LLP US (professional services, 1965-2005). Mr. Mauriello currently serves as a member of the Board of Directors of XL Group plc. (global insurance and re-insurance, 2006-present) and the Independent Directors Council (IDC) Governing Council (2015-present). Previously, Mr. Mauriello served as a Director of the Hamilton Funds of the Bank of New York (2006-2007) and of Arcadia Resources Inc. (health care services and products, 2007-2012).
Cornelia M. Small (1944)
Year of Election or Appointment: 2005
Trustee
Ms. Small also serves as Trustee of other Fidelity® funds. Ms. Small is a member of the Board of Directors (2009-present) and Chair of the Investment Committee (2010-present) of the Teagle Foundation. Ms. Small also serves on the Investment Committee of the Berkshire Taconic Community Foundation (2008-present). Previously, Ms. Small served as Chairperson (2002-2008) and a member of the Investment Committee and Chairperson (2008-2012) and a member of the Board of Trustees of Smith College. In addition, Ms. Small served as Chief Investment Officer, Director of Global Equity Investments, and a member of the Board of Directors of Scudder, Stevens & Clark and Scudder Kemper Investments.
Garnett A. Smith (1947)
Year of Election or Appointment: 2018
Trustee
Mr. Smith also serves as Trustee of other Fidelity® funds. Prior to Mr. Smith's retirement, he served as Chairman and Chief Executive Officer of Inbrand Corp. (manufacturer of personal absorbent products, 1990-1997). He also served as President (1986-1990) of Inbrand Corp. Prior to his employment with Inbrand Corp., he was employed by a retail fabric chain and North Carolina National Bank. In addition, Mr. Smith served as a Member of the Advisory Board of certain Fidelity® funds (2012-2013) and as a board member of the Jackson Hole Land Trust (2009-2012).
David M. Thomas (1949)
Year of Election or Appointment: 2008
Trustee
Mr. Thomas also serves as Trustee of other Fidelity® funds. Mr. Thomas serves as Non-Executive Chairman of the Board of Directors of Fortune Brands Home and Security (home and security products, 2011-present), as a member of the Board of Directors (2004-present) and Presiding Director (2013-present) of Interpublic Group of Companies, Inc. (marketing communication), and as a member of the Board of Trustees of the University of Florida (2013-present). Previously, Mr. Thomas served as Executive Chairman (2005-2006) and Chairman and Chief Executive Officer (2000-2005) of IMS Health, Inc. (pharmaceutical and healthcare information solutions), and a Director of Fortune Brands, Inc. (consumer products, 2000-2011).
+ The information includes the Trustee's principal occupation during the last five years and other information relating to the experience, attributes, and skills relevant to the Trustee's qualifications to serve as a Trustee, which led to the conclusion that the Trustee should serve as a Trustee for the fund.
Advisory Board Members and Officers:
Correspondence intended for a Member of the Advisory Board (if any) may be sent to Fidelity Investments, P.O. Box 55235, Boston, Massachusetts 02205-5235. Correspondence intended for an officer or Peter S. Lynch may be sent to Fidelity Investments, 245 Summer Street, Boston, Massachusetts 02210. Officers appear below in alphabetical order.
Name, Year of Birth; Principal Occupation
Peter S. Lynch (1944)
Year of Election or Appointment: 2003
Member of the Advisory Board
Mr. Lynch also serves as Member of the Advisory Board of other Fidelity® funds. Mr. Lynch is Vice Chairman and a Director of FMR (investment adviser firm) and FMR Co., Inc. (investment adviser firm). In addition, Mr. Lynch serves as a Trustee of Boston College and as the Chairman of the Inner-City Scholarship Fund. Previously, Mr. Lynch served on the Special Olympics International Board of Directors (1997-2006).
William S. Stavropoulos (1939)
Year of Election or Appointment: 2018
Member of the Advisory Board
Mr. Stavropoulos also serves as Member of the Advisory Board of other Fidelity® funds. Mr. Stavropoulos serves as President and Founder of the Michigan Baseball Foundation, the Great Lakes Loons (2007-present). Mr. Stavropoulos is Chairman Emeritus of the Board of Directors of The Dow Chemical Company, where he previously served in numerous senior management positions, including President, CEO (1995-2000; 2002-2004), Chairman of the Executive Committee (2000-2006), and as a member of the Board of Directors (1990-2006). Currently, Mr. Stavropoulos is Chairman of the Board of Directors of Univar Inc. (global distributor of commodity and specialty chemicals), a Director of Teradata Corporation (data warehousing and technology solutions), and a member of the Advisory Board for Metalmark Capital LLC (private equity investment, 2005-present). Mr. Stavropoulos is an operating advisor to Clayton, Dubilier & Rice, LLC (private equity investment). In addition, Mr. Stavropoulos is a member of the University of Notre Dame Advisory Council for the College of Science, a Trustee of the Rollin L. Gerstacker Foundation, and a Director of Artis-Naples in Naples, Florida. Previously, Mr. Stavropoulos served as Trustee of certain Fidelity® funds (2001-2018) and as a Director of Chemical Financial Corporation (bank holding company, 1993-2012) and Tyco International, Ltd. (multinational manufacturing and services, 2007-2012).
Carol B. Tomé (1957)
Year of Election or Appointment: 2018
Member of the Advisory Board
Ms. Tomé also serves as Member of the Advisory Board of other Fidelity® funds. Ms. Tomé is Chief Financial Officer (2001-present) and Executive Vice President of Corporate Services (2007-present) of The Home Depot, Inc. (home improvement retailer) and a Director (2003-present) and Chair of the Audit Committee (2004-present) of United Parcel Service, Inc. (package delivery and supply chain management). Previously, Ms. Tomé served as Trustee of certain Fidelity® funds (2017), Senior Vice President of Finance and Accounting/Treasurer (2000-2007) and Vice President and Treasurer (1995-2000) of The Home Depot, Inc. and Chair of the Board (2010-2012), Vice Chair of the Board (2009 and 2013), and a Director (2008-2013) of the Federal Reserve Bank of Atlanta. Ms. Tomé is also a director or trustee of many community and professional organizations.
Michael E. Wiley (1950)
Year of Election or Appointment: 2018
Member of the Advisory Board
Mr. Wiley also serves as Trustee or Member of the Advisory Board of other Fidelity® funds. Mr. Wiley serves as a Director of Andeavor Corporation (independent oil refiner and marketer, 2005-present), a Director of Andeavor Logistics LP (natural resources logistics, 2015-present), and a Director of Bill Barrett Corporation (exploration and production, 2005-present). In addition, Mr. Wiley also serves as a Director of Post Oak Bank (privately-held bank, 2004-present). Previously, Mr. Wiley served as a Trustee of other Fidelity® funds (2008-2013), as a Director of Asia Pacific Exploration Consolidated (international oil and gas exploration and production, 2008-2013), as a member of the Board of Trustees of the University of Tulsa (2000-2006; 2007-2010), as a Senior Energy Advisor of Katzenbach Partners, LLC (consulting, 2006-2007), as an Advisory Director of Riverstone Holdings (private investment), Chairman, President, and CEO of Baker Hughes, Inc. (oilfield services, 2000-2004), and as Director of Spinnaker Exploration Company (exploration and production, 2001-2005).
Elizabeth Paige Baumann (1968)
Year of Election or Appointment: 2017
Anti-Money Laundering (AML) Officer
Ms. Baumann also serves as AML Officer of other funds. She is Chief AML Officer (2012-present) and Senior Vice President (2014-present) of FMR LLC (diversified financial services company) and is an employee of Fidelity Investments. Previously, Ms. Baumann served as AML Officer of the funds (2012-2016), and Vice President (2007-2014) and Deputy Anti-Money Laundering Officer (2007-2012) of FMR LLC.
Marc R. Bryant (1966)
Year of Election or Appointment: 2015
Secretary and Chief Legal Officer (CLO)
Mr. Bryant also serves as Secretary and CLO of other funds. Mr. Bryant serves as CLO, Secretary, and Senior Vice President of Fidelity Management & Research Company (investment adviser firm, 2015-present) and FMR Co., Inc. (investment adviser firm, 2015-present); Secretary of Fidelity SelectCo, LLC (investment adviser firm, 2015-present) and Fidelity Investments Money Management, Inc. (investment adviser firm, 2015-present); and CLO of Fidelity Management & Research (Hong Kong) Limited and FMR Investment Management (UK) Limited (investment adviser firms, 2015-present) and Fidelity Management & Research (Japan) Limited (investment adviser firm, 2016-present). He is Senior Vice President and Deputy General Counsel of FMR LLC (diversified financial services company). Previously, Mr. Bryant served as Secretary and CLO of Fidelity Rutland Square Trust II (2010-2014) and Assistant Secretary of Fidelity's Fixed Income and Asset Allocation Funds (2013-2015). Prior to joining Fidelity Investments, Mr. Bryant served as a Senior Vice President and the Head of Global Retail Legal for AllianceBernstein L.P. (2006-2010), and as the General Counsel for ProFund Advisors LLC (2001-2006).
John J. Burke III (1964)
Year of Election or Appointment: 2018
Chief Financial Officer
Mr. Burke also serves as Chief Financial Officer of other funds. Mr. Burke serves as Head of Investment Operations for Fidelity Fund and Investment Operations (2018-present) and is an employee of Fidelity Investments (1998-present). Previously Mr. Burke served as head of Asset Management Investment Operations (2012-2018).
William C. Coffey (1969)
Year of Election or Appointment: 2009
Assistant Secretary
Mr. Coffey also serves as Assistant Secretary of other funds. He is Senior Vice President and Deputy General Counsel of FMR LLC (diversified financial services company, 2010-present), and is an employee of Fidelity Investments. Previously, Mr. Coffey served as Vice President and Associate General Counsel of FMR LLC (2005-2009).
Timothy M. Cohen (1969)
Year of Election or Appointment: 2018
Vice President
Mr. Cohen also serves as Vice President of other funds. Mr. Cohen serves as Co-Head of Global Equity Research (2016-present), a Director of Fidelity Management & Research (Japan) Limited (investment adviser firm, 2016-present), and is an employee of Fidelity Investments. Previously, Mr. Cohen served as Chief Investment Officer - Equity and a Director of Fidelity Management & Research (U.K.) Inc. (investment adviser firm, 2013-2015) and as a Director of Fidelity Management & Research (Hong Kong) Limited (investment adviser firm, 2017).
Jonathan Davis (1968)
Year of Election or Appointment: 2010
Assistant Treasurer
Mr. Davis also serves as Assistant Treasurer of other funds. Mr. Davis serves as Assistant Treasurer of FMR Capital, Inc. (2017-present) and is an employee of Fidelity Investments. Previously, Mr. Davis served as Vice President and Associate General Counsel of FMR LLC (diversified financial services company, 2003-2010).
Adrien E. Deberghes (1967)
Year of Election or Appointment: 2016
Assistant Treasurer
Mr. Deberghes also serves as an officer of other funds. He serves as Assistant Treasurer of FMR Capital, Inc. (2017-present), Executive Vice President of Fidelity Investments Money Management, Inc. (FIMM) (investment adviser firm, 2016-present), and is an employee of Fidelity Investments (2008-present). Previously, Mr. Deberghes served as President and Treasurer of certain Fidelity® funds (2013-2018). Prior to joining Fidelity Investments, Mr. Deberghes was Senior Vice President of Mutual Fund Administration at State Street Corporation (2007-2008), Senior Director of Mutual Fund Administration at Investors Bank & Trust (2005-2007), and Director of Finance for Dunkin' Brands (2000-2005). Previously, Mr. Deberghes served in other fund officer roles.
Laura M. Del Prato (1964)
Year of Election or Appointment: 2018
Assistant Treasurer
Ms. Del Prato also serves as an officer of other funds. Ms. Del Prato is an employee of Fidelity Investments (2017-present). Prior to joining Fidelity Investments, Ms. Del Prato served as a Managing Director and Treasurer of the JPMorgan Mutual Funds (2014-2017). Prior to JPMorgan, Ms. Del Prato served as a partner at Cohen Fund Audit Services (accounting firm, 2012-2013) and KPMG LLP (accounting firm, 2004-2012).
Colm A. Hogan (1973)
Year of Election or Appointment: 2016
Deputy Treasurer
Mr. Hogan also serves as an officer of other funds. Mr. Hogan serves as Assistant Treasurer of FMR Capital, Inc. (2017-present) and is an employee of Fidelity Investments (2005-present). Previously, Mr. Hogan served as Assistant Treasurer of certain Fidelity® funds (2016-2018).
Pamela R. Holding (1964)
Year of Election or Appointment: 2018
Vice President
Ms. Holding also serves as a Vice President of other funds. Ms. Holding serves as Co-Head of Global Equity Research (2018-present) and is an employee of Fidelity Investments (2013-present).
Chris Maher (1972)
Year of Election or Appointment: 2013
Assistant Treasurer
Mr. Maher serves as Assistant Treasurer of other funds. Mr. Maher is Vice President of Valuation Oversight, serves as Assistant Treasurer of FMR Capital, Inc. (2017-present), and is an employee of Fidelity Investments. Previously, Mr. Maher served as Vice President of Asset Management Compliance (2013), Vice President of the Program Management Group of FMR (investment adviser firm, 2010-2013), and Vice President of Valuation Oversight (2008-2010).
Rieco E. Mello (1969)
Year of Election or Appointment: 2017
Assistant Treasurer
Mr. Mello also serves as Assistant Treasurer of other funds. Mr. Mello serves as Assistant Treasurer of FMR Capital, Inc. (2017-present) and is an employee of Fidelity Investments (1995-present).
Kenneth B. Robins (1969)
Year of Election or Appointment: 2016
Chief Compliance Officer
Mr. Robins also serves as an officer of other funds. Mr. Robins serves as Compliance Officer of Fidelity Management & Research Company and FMR Co., Inc. (investment adviser firms, 2016-present) and is an employee of Fidelity Investments (2004-present). Previously, Mr. Robins served as Executive Vice President of Fidelity Investments Money Management, Inc. (investment adviser firm, 2013-2016) and served in other fund officer roles.
Stacie M. Smith (1974)
Year of Election or Appointment: 2016
President and Treasurer
Ms. Smith also serves as an officer of other funds. Ms. Smith serves as Assistant Treasurer of FMR Capital, Inc. (2017-present), is an employee of Fidelity Investments (2009-present), and has served in other fund officer roles. Prior to joining Fidelity Investments, Ms. Smith served as Senior Audit Manager of Ernst & Young LLP (accounting firm, 1996-2009). Previously, Ms. Smith served as Assistant Treasurer (2013-2018) and Deputy Treasurer (2013-2016) of certain Fidelity® funds.
Marc L. Spector (1972)
Year of Election or Appointment: 2016
Assistant Treasurer
Mr. Spector also serves as an officer of other funds. Mr. Spector serves as Assistant Treasurer of FMR Capital, Inc. (2017-present) and is an employee of Fidelity Investments (2016-present). Prior to joining Fidelity Investments, Mr. Spector served as Director at the Siegfried Group (accounting firm, 2013-2016), and prior to Siegfried Group as audit senior manager at Deloitte & Touche (accounting firm, 2005-2013).
Renee Stagnone (1975)
Year of Election or Appointment: 2016
Assistant Treasurer
Ms. Stagnone also serves as an officer of other funds. Ms. Stagnone serves as Assistant Treasurer of FMR Capital, Inc. (2017-present) and is an employee of Fidelity Investments (1997-present). Previously, Ms. Stagnone served as Deputy Treasurer of certain Fidelity® funds (2013-2016).
Shareholder Expense Example
As a shareholder of the Fund, you incur two types of costs: (1) transaction costs, including sales charges (loads) on purchase payments or redemption proceeds and (2) ongoing costs, including management fees, distribution and/or service (12b-1) fees and other Fund expenses. This Example is intended to help you understand your ongoing costs (in dollars) of investing in the Fund and to compare these costs with the ongoing costs of investing in other mutual funds.
The Example is based on an investment of $1,000 invested at the beginning of the period and held for the entire period (February 1, 2018 to July 31, 2018).
Actual Expenses
The first line of the accompanying table for each class of the Fund provides information about actual account values and actual expenses. You may use the information in this line, together with the amount you invested, to estimate the expenses that you paid over the period. Simply divide your account value by $1,000.00 (for example, an $8,600 account value divided by $1,000.00 = 8.6), then multiply the result by the number in the first line for a class of the Fund under the heading entitled "Expenses Paid During Period" to estimate the expenses you paid on your account during this period. A small balance maintenance fee of $12.00 that is charged once a year may apply for certain accounts with a value of less than $2,000. This fee is not included in the table below. If it was, the estimate of expenses you paid during the period would be higher, and your ending account value lower, by this amount. In addition, the Fund, as a shareholder in the underlying Fidelity Central Funds, will indirectly bear its pro-rata share of the fees and expenses incurred by the underlying Fidelity Central Funds. These fees and expenses are not included in the Fund's annualized expense ratio used to calculate the expense estimate in the table below.
Hypothetical Example for Comparison Purposes
The second line of the accompanying table for each class of the Fund provides information about hypothetical account values and hypothetical expenses based on a Class' actual expense ratio and an assumed rate of return of 5% per year before expenses, which is not the Class' actual return. The hypothetical account values and expenses may not be used to estimate the actual ending account balance or expenses you paid for the period. You may use this information to compare the ongoing costs of investing in the Fund and other funds. To do so, compare this 5% hypothetical example with the 5% hypothetical examples that appear in the shareholder reports of the other funds. A small balance maintenance fee of $12.00 that is charged once a year may apply for certain accounts with a value of less than $2,000. This fee is not included in the table below. If it was, the estimate of expenses you paid during the period would be higher, and your ending account value lower, by this amount. In addition, the Fund, as a shareholder in the underlying Fidelity Central Funds, will indirectly bear its pro-rata share of the fees and expenses incurred by the underlying Fidelity Central Funds. These fees and expenses are not included in the Fund's annualized expense ratio used to calculate the expense estimate in the table below.
Please note that the expenses shown in the table are meant to highlight your ongoing costs only and do not reflect any transaction costs. Therefore, the second line of the table is useful in comparing ongoing costs only, and will not help you determine the relative total costs of owning different funds. In addition, if these transactional costs were included, your costs would have been higher.
| | Annualized Expense Ratio-A | Beginning
Account Value
February 1, 2018 | Ending
Account Value
July 31, 2018 | Expenses Paid
During Period-B
February 1, 2018
to July 31, 2018 |
| Class A | 1.13% | | | |
| Actual | | $1,000.00 | $1,003.00 | $5.61 |
| Hypothetical-C | | $1,000.00 | $1,019.19 | $5.66 |
| Class M | 1.37% | | | |
| Actual | | $1,000.00 | $1,002.00 | $6.80 |
| Hypothetical-C | | $1,000.00 | $1,018.00 | $6.85 |
| Class C | 1.89% | | | |
| Actual | | $1,000.00 | $999.50 | $9.37 |
| Hypothetical-C | | $1,000.00 | $1,015.42 | $9.44 |
| Small Cap Value | .87% | | | |
| Actual | | $1,000.00 | $1,003.90 | $4.32 |
| Hypothetical-C | | $1,000.00 | $1,020.48 | $4.36 |
| Class I | .87% | | | |
| Actual | | $1,000.00 | $1,004.40 | $4.32 |
| Hypothetical-C | | $1,000.00 | $1,020.48 | $4.36 |
A Annualized expense ratio reflects expenses net of applicable fee waivers.
B Expenses are equal to each Class' annualized expense ratio, multiplied by the average account value over the period, multiplied by 181/365 (to reflect the one-half year period).
C 5% return per year before expenses
Distributions (Unaudited)
The Board of Trustees of Fidelity Small Cap Value Fund voted to pay to shareholders of record at the opening of business on record date, the following distributions per share derived from capital gains realized from sales of portfolio securities, and dividends derived from net investment income:
| | Pay Date | Record Date | Dividends | Capital Gains |
| Fidelity Small Cap Value Fund | | | | |
| Class A | 09/10/2018 | 09/07/2018 | $0.036 | $3.692 |
| Class M | 09/10/2018 | 09/07/2018 | $0.007 | $3.692 |
| Class C | 09/10/2018 | 09/07/2018 | $0.000 | $3.692 |
| Small Cap Value | 09/10/2018 | 09/07/2018 | $0.064 | $3.692 |
| Class I | 09/10/2018 | 09/07/2018 | $0.067 | $3.692 |
|
The fund hereby designates as a capital gain dividend with respect to the taxable year ended July 31 2018, $575,720,361, or, if subsequently determined to be different, the net capital gain of such year.
Class A, Class M, Class C, Small Cap Value and Class I designate 100% of the dividends distributed in September and December during the fiscal year as qualifying for the dividends–received deduction for corporate shareholders.
Class A, Class M, Class C, Small Cap Value and Class I designate 100% of the dividends distributed during the fiscal year as amounts which may be taken into account as a dividend for purposes of the maximum rate under section 1(h)(11) of the Internal Revenue Code.
The fund will notify shareholders in January 2019 of amounts for use in preparing 2018 income tax returns.
Board Approval of Investment Advisory Contracts
Fidelity Small Cap Value Fund
At its July 2018 meeting, the Board of Trustees, including the Independent Trustees (together, the Board), voted to continue the management contract with Fidelity Management & Research Company (FMR) and the sub-advisory agreements (together, the Advisory Contracts) for the fund for six months through January 31, 2019, in connection with the reunification of the Fidelity Equity High Income Funds Board, which oversees the fund, and the Sector Portfolios Board.
The Board considered that the approval of the fund's Advisory Contracts will not result in any changes in (i) the investment process or strategies employed in the management of the fund's assets; (ii) the fees and expenses paid by shareholders; (iii) the nature, extent or quality of services provided under the fund's Advisory Contracts; or (iv) the day-to-day management of the fund or the persons primarily responsible for such management. The Board concluded that the fund's Advisory Contracts are fair and reasonable, and that the fund's Advisory Contracts should be renewed, without modification, through January 31, 2019, with the understanding that the Board will consider the annual renewal for a full one year period in January 2019.
In connection with its consideration of future renewals of the fund's Advisory Contracts, the Board will consider: (i) the nature, extent and quality of services provided to the fund, including shareholder and administrative services and investment performance; (ii) the competitiveness of the management fee and total expenses for the fund; (iii) the costs of the services and profitability, including the revenues earned and the expenses incurred in conducting the business of developing, marketing, distributing, managing, administering, and servicing the fund and its shareholders, to the extent applicable, as well as potential fall-out benefits from Fidelity's non-fund businesses; and (iv) whether there have been economies of scale in respect of the Fidelity funds, whether the Fidelity funds (including the fund) have appropriately benefited from any such economies of scale, and whether there is the potential for realization of any further economies.
Based on its evaluation of all of the conclusions noted above, and after considering all factors it believed relevant, the Board ultimately concluded that the fund's management fee structure is fair and reasonable, and that the continuation of the fund's Advisory Contracts should be approved.
Corporate Headquarters
245 Summer St.
Boston, MA 02210
www.fidelity.com
SCV-ANN-0918
1.803706.113
Fidelity® Series Small Cap Opportunities Fund
Annual Report July 31, 2018 |
|
Contents
To view a fund's proxy voting guidelines and proxy voting record for the 12-month period ended June 30, visit http://www.fidelity.com/proxyvotingresults or visit the Securities and Exchange Commission's (SEC) web site at http://www.sec.gov.
You may also call 1-800-544-8544 to request a free copy of the proxy voting guidelines.
Standard & Poor's, S&P and S&P 500 are registered service marks of The McGraw-Hill Companies, Inc. and have been licensed for use by Fidelity Distributors Corporation.
Other third-party marks appearing herein are the property of their respective owners.
All other marks appearing herein are registered or unregistered trademarks or service marks of FMR LLC or an affiliated company. © 2018 FMR LLC. All rights reserved.
This report and the financial statements contained herein are submitted for the general information of the shareholders of the Fund. This report is not authorized for distribution to prospective investors in the Fund unless preceded or accompanied by an effective prospectus.
A fund files its complete schedule of portfolio holdings with the SEC for the first and third quarters of each fiscal year on Form N-Q. Forms N-Q are available on the SEC’s web site at http://www.sec.gov. A fund's Forms N-Q may be reviewed and copied at the SEC’s Public Reference Room in Washington, DC. Information regarding the operation of the SEC's Public Reference Room may be obtained by calling 1-800-SEC-0330.
For a complete list of a fund's portfolio holdings, view the most recent holdings listing, semiannual report, or annual report on Fidelity's web site at http://www.fidelity.com, http://www.institutional.fidelity.com, or http://www.401k.com, as applicable.
NOT FDIC INSURED •MAY LOSE VALUE •NO BANK GUARANTEE
Neither the Fund nor Fidelity Distributors Corporation is a bank.
Performance: The Bottom Line
Average annual total return reflects the change in the value of an investment, assuming reinvestment of distributions from dividend income and capital gains (the profits earned upon the sale of securities that have grown in value, if any) and assuming a constant rate of performance each year. The hypothetical investment and the average annual total returns do not reflect the deduction of taxes that a shareholder would pay on fund distributions or the redemption of fund shares. During periods of reimbursement by Fidelity, a fund’s total return will be greater than it would be had the reimbursement not occurred. How a fund did yesterday is no guarantee of how it will do tomorrow.
Average Annual Total Returns
| For the periods ended July 31, 2018 | Past 1 year | Past 5 years | Past 10 years |
| Fidelity® Series Small Cap Opportunities Fund | 19.84% | 9.79% | 11.34% |
$10,000 Over 10 Years
Let's say hypothetically that $10,000 was invested in Fidelity® Series Small Cap Opportunities Fund on July 31, 2008.
The chart shows how the value of your investment would have changed, and also shows how the Russell 2000® Index performed over the same period.
| Period Ending Values |
| $29,272 | Fidelity® Series Small Cap Opportunities Fund |
| $26,870 | Russell 2000® Index |
Management's Discussion of Fund Performance
Market Recap: The U.S. equity bellwether S&P 500
® index gained 16.24% for the 12 months ending July 31, 2018, despite a resurgence in volatility that challenged the multiyear bull market. Stocks maintained their steady growth until a sharp reversal in February, as volatility spiked amid fear that rising inflation and the potential for the economy to overheat would prompt the U.S. Federal Reserve to pick up the pace of interest rate hikes. The index posted its first negative monthly result since October 2016, and then lost further ground in March on fear of a global trade war. The market stabilized in April and turned upward through mid-June, when escalating trade tension between the U.S. and China soured investor sentiment. The resulting uncertainty lingered into July, but strong corporate earnings helped the S&P 500 rise 3.72% that month to cap the period. For the full one-year period, growth handily topped value, while small-caps bested large-caps. By sector, information technology (+28%) led the way, boosted by strong earnings growth from several major index constituents. Consumer discretionary rose roughly 24%, driven by retailers (+49%). Energy (+20%) gained alongside higher oil prices. Laggards were telecommunication services (-2%), consumer staples (0%) and utilities (+3%), defensive groups that struggled amid rising interest rates and a general preference for risk. Real estate (+5%) fared a bit better but still lagged, as did financials, industrials, health care (each up 13%) and materials (+11%).
Comments from Lead Portfolio Manager Morgen Peck: For the fiscal year, the fund gained 19.84%, topping the 18.73% result of the benchmark Russell 2000
® index. In a strong up market for small-caps, stock selection drove the fund's outperformance, notably in the information technology sector, where stocks in the semiconductors & semiconductor equipment industry led the way. However, two of the fund's top three relative contributors - drug makers AnaptysBio, GI Therapeutics and out-of-index Ascendis Pharma - came from the pharmaceuticals, biotechnology & life sciences group within the health care sector. Shares of AnaptysBio, the fund's top contributor, gained 284% for the fund, and was especially strong at the end of July on optimism about the company's new eczema drug, which is currently in phase 2 clinical trials. Elsewhere, our position in RingCentral, a cloud-based communications and collaborative software solutions provider, also contributed, as the company continued gaining market share. Our holdings in RingCentral gained about 113% this period. Conversely, stock selection in the health care equipment & services segment detracted. Here, untimely ownership of Cotiviti Holdings and Magellan Health weighed on our relative result, as holdings in both stocks returned about -22% each. We exited our position in Cotiviti during the period. The fund's biggest individual relative detractor was an out-of-index position in Tesaro (-72%), in part due to weaker-than-expected quarterly financial results.
The views expressed above reflect those of the portfolio manager(s) only through the end of the period as stated on the cover of this report and do not necessarily represent the views of Fidelity or any other person in the Fidelity organization. Any such views are subject to change at any time based upon market or other conditions and Fidelity disclaims any responsibility to update such views. These views may not be relied on as investment advice and, because investment decisions for a Fidelity fund are based on numerous factors, may not be relied on as an indication of trading intent on behalf of any Fidelity fund.
Note to Shareholders: Jennifer Fo Cardillo served as interim Co-Manager while Patrick Venanzi was on a leave of absence from June through August 2018. Also, on July 31, 2018, Morgen Peck assumed lead management responsibilities for the fund, succeeding Rich Thompson.
Investment Summary (Unaudited)
Top Ten Stocks as of July 31, 2018
| | % of fund's net assets |
| Delek U.S. Holdings, Inc. | 1.1 |
| Primerica, Inc. | 1.1 |
| Terreno Realty Corp. | 1.0 |
| Four Corners Property Trust, Inc. | 1.0 |
| Rexford Industrial Realty, Inc. | 1.0 |
| Store Capital Corp. | 1.0 |
| EMCOR Group, Inc. | 1.0 |
| Comfort Systems U.S.A., Inc. | 0.9 |
| WSFS Financial Corp. | 0.9 |
| WPX Energy, Inc. | 0.9 |
| | 9.9 |
Top Five Market Sectors as of July 31, 2018
| | % of fund's net assets |
| Financials | 18.4 |
| Information Technology | 15.3 |
| Industrials | 15.1 |
| Health Care | 14.5 |
| Consumer Discretionary | 13.4 |
Asset Allocation (% of fund's net assets)
| As of July 31, 2018* |
| | Stocks | 99.1% |
| | Short-Term Investments and Net Other Assets (Liabilities) | 0.9% |

* Foreign investments - 7.8%
Schedule of Investments July 31, 2018
Showing Percentage of Net Assets
| Common Stocks - 99.1% | | | |
| | | Shares | Value |
| CONSUMER DISCRETIONARY - 13.4% | | | |
| Auto Components - 0.9% | | | |
| Fox Factory Holding Corp. (a) | | 672,400 | $33,418,280 |
| Standard Motor Products, Inc. | | 484,834 | 23,630,809 |
| | | | 57,049,089 |
| Diversified Consumer Services - 0.4% | | | |
| Weight Watchers International, Inc. (a) | | 284,907 | 25,507,724 |
| Hotels, Restaurants & Leisure - 2.5% | | | |
| Bluegreen Vacations Corp. (b) | | 1,129,270 | 29,033,532 |
| Eldorado Resorts, Inc. (a) | | 763,900 | 32,733,115 |
| Marriott Vacations Worldwide Corp. | | 339,000 | 40,378,290 |
| PlayAGS, Inc. (a) | | 516,800 | 14,754,640 |
| Texas Roadhouse, Inc. Class A | | 569,400 | 35,781,096 |
| | | | 152,680,673 |
| Household Durables - 2.2% | | | |
| Cavco Industries, Inc. (a) | | 182,919 | 38,861,142 |
| SodaStream International Ltd. (a) | | 190,100 | 16,595,730 |
| Taylor Morrison Home Corp. (a) | | 813,800 | 15,893,514 |
| TopBuild Corp. (a) | | 475,400 | 35,312,712 |
| TRI Pointe Homes, Inc. (a) | | 1,701,133 | 24,105,055 |
| | | | 130,768,153 |
| Leisure Products - 0.9% | | | |
| Brunswick Corp. | | 474,600 | 30,516,780 |
| Johnson Outdoors, Inc. Class A | | 308,451 | 25,006,123 |
| | | | 55,522,903 |
| Media - 1.0% | | | |
| Cinemark Holdings, Inc. | | 637,400 | 22,895,408 |
| The New York Times Co. Class A | | 1,381,400 | 34,258,720 |
| | | | 57,154,128 |
| Multiline Retail - 0.5% | | | |
| Ollie's Bargain Outlet Holdings, Inc. (a) | | 465,500 | 32,352,250 |
| Specialty Retail - 2.4% | | | |
| Burlington Stores, Inc. (a) | | 217,500 | 33,236,175 |
| Monro, Inc. | | 421,381 | 28,422,148 |
| Murphy U.S.A., Inc. (a) | | 304,955 | 24,164,634 |
| The Children's Place Retail Stores, Inc. | | 280,473 | 34,470,132 |
| Williams-Sonoma, Inc. (b) | | 364,100 | 21,296,209 |
| | | | 141,589,298 |
| Textiles, Apparel & Luxury Goods - 2.6% | | | |
| Crinetics Pharmaceuticals, Inc. (a) | | 241,063 | 5,932,560 |
| Deckers Outdoor Corp. (a) | | 371,800 | 41,950,194 |
| Emerald Expositions Events, Inc. | | 482,091 | 9,304,356 |
| Kezar Life Sciences, Inc. (b)(c) | | 1,044,100 | 17,029,271 |
| Steven Madden Ltd. | | 780,139 | 42,166,513 |
| Wolverine World Wide, Inc. | | 1,054,752 | 37,317,126 |
| | | | 153,700,020 |
|
| TOTAL CONSUMER DISCRETIONARY | | | 806,324,238 |
|
| CONSUMER STAPLES - 2.9% | | | |
| Beverages - 0.3% | | | |
| Cott Corp. | | 1,013,400 | 16,204,266 |
| Food & Staples Retailing - 1.1% | | | |
| BJ's Wholesale Club Holdings, Inc. | | 1,082,190 | 26,827,490 |
| Casey's General Stores, Inc. | | 130,700 | 14,295,966 |
| Performance Food Group Co. (a) | | 758,925 | 27,207,461 |
| | | | 68,330,917 |
| Food Products - 0.8% | | | |
| Ingredion, Inc. | | 128,300 | 12,996,790 |
| J&J Snack Foods Corp. | | 122,558 | 17,766,008 |
| Lamb Weston Holdings, Inc. | | 222,700 | 15,649,129 |
| | | | 46,411,927 |
| Household Products - 0.4% | | | |
| Central Garden & Pet Co. (a) | | 490,900 | 21,192,153 |
| Personal Products - 0.3% | | | |
| Inter Parfums, Inc. | | 351,100 | 21,136,220 |
|
| TOTAL CONSUMER STAPLES | | | 173,275,483 |
|
| ENERGY - 4.9% | | | |
| Energy Equipment & Services - 1.4% | | | |
| Liberty Oilfield Services, Inc. Class A (b) | | 654,823 | 12,834,531 |
| Nabors Industries Ltd. | | 5,059,200 | 30,254,016 |
| Rowan Companies PLC (a) | | 2,083,210 | 30,164,881 |
| Total Energy Services, Inc. | | 1,491,277 | 12,610,253 |
| | | | 85,863,681 |
| Oil, Gas & Consumable Fuels - 3.5% | | | |
| Delek U.S. Holdings, Inc. | | 1,249,800 | 66,639,328 |
| Diamondback Energy, Inc. | | 130,793 | 17,258,136 |
| PDC Energy, Inc. (a) | | 784,277 | 49,393,765 |
| Viper Energy Partners LP | | 786,685 | 25,158,186 |
| WPX Energy, Inc. (a) | | 2,766,510 | 51,927,393 |
| | | | 210,376,808 |
|
| TOTAL ENERGY | | | 296,240,489 |
|
| FINANCIALS - 18.4% | | | |
| Banks - 10.3% | | | |
| Associated Banc-Corp. | | 1,700,312 | 45,908,424 |
| BancFirst Corp. | | 765,186 | 47,518,051 |
| Banner Corp. | | 588,371 | 37,049,722 |
| Boston Private Financial Holdings, Inc. | | 1,623,259 | 23,374,930 |
| City Holding Co. | | 526,900 | 42,404,912 |
| Cullen/Frost Bankers, Inc. | | 385,800 | 42,627,042 |
| CVB Financial Corp. | | 1,198,550 | 28,669,316 |
| First Hawaiian, Inc. | | 1,299,600 | 36,726,696 |
| First Merchants Corp. | | 842,770 | 39,778,744 |
| Heartland Financial U.S.A., Inc. | | 750,400 | 44,086,000 |
| Independent Bank Corp., Massachusetts | | 491,579 | 43,455,584 |
| Old National Bancorp, Indiana | | 1,640,578 | 31,909,242 |
| Preferred Bank, Los Angeles | | 463,500 | 28,848,240 |
| Trico Bancshares | | 1,059,069 | 41,113,059 |
| WesBanco, Inc. | | 834,600 | 40,786,902 |
| Wintrust Financial Corp. | | 466,200 | 40,899,726 |
| | | | 615,156,590 |
| Capital Markets - 2.8% | | | |
| Hamilton Lane, Inc. Class A | | 823,300 | 40,317,001 |
| Houlihan Lokey | | 627,100 | 30,828,236 |
| Morningstar, Inc. | | 268,738 | 35,473,416 |
| OM Asset Management Ltd. | | 834,133 | 11,886,395 |
| PJT Partners, Inc. | | 818,866 | 49,303,922 |
| | | | 167,808,970 |
| Diversified Financial Services - 0.2% | | | |
| Allakos, Inc. (a) | | 331,245 | 13,504,859 |
| Insurance - 2.6% | | | |
| Employers Holdings, Inc. | | 975,070 | 45,292,002 |
| First American Financial Corp. | | 781,100 | 43,741,600 |
| Primerica, Inc. | | 563,730 | 64,716,204 |
| | | | 153,749,806 |
| Thrifts & Mortgage Finance - 2.5% | | | |
| Beneficial Bancorp, Inc. | | 1,480,540 | 24,058,775 |
| Meridian Bancorp, Inc. Maryland | | 2,051,844 | 37,548,745 |
| Washington Federal, Inc. | | 1,145,485 | 38,431,022 |
| WSFS Financial Corp. | | 926,205 | 52,515,824 |
| | | | 152,554,366 |
|
| TOTAL FINANCIALS | | | 1,102,774,591 |
|
| HEALTH CARE - 14.5% | | | |
| Biotechnology - 7.4% | | | |
| Abeona Therapeutics, Inc. (a)(b) | | 826,215 | 11,938,807 |
| ACADIA Pharmaceuticals, Inc. (a) | | 357,561 | 5,395,595 |
| Acorda Therapeutics, Inc. (a) | | 947,371 | 23,636,906 |
| Agios Pharmaceuticals, Inc. (a) | | 249,145 | 21,528,619 |
| AnaptysBio, Inc. (a) | | 221,900 | 17,379,208 |
| Argenx SE ADR (a) | | 206,700 | 18,758,025 |
| Ascendis Pharma A/S sponsored ADR (a) | | 324,348 | 22,036,203 |
| Atara Biotherapeutics, Inc. (a) | | 410,497 | 15,414,162 |
| Audentes Therapeutics, Inc. (a) | | 427,280 | 16,087,092 |
| bluebird bio, Inc. (a) | | 116,656 | 18,070,014 |
| Cellectis SA sponsored ADR (a) | | 501,895 | 14,504,766 |
| CytomX Therapeutics, Inc. (a) | | 294,000 | 7,743,960 |
| CytomX Therapeutics, Inc. (a)(d) | | 105,499 | 2,778,844 |
| FibroGen, Inc. (a) | | 436,200 | 27,524,220 |
| Heron Therapeutics, Inc. (a) | | 632,800 | 23,698,360 |
| Insmed, Inc. (a) | | 874,182 | 21,740,906 |
| Intercept Pharmaceuticals, Inc. (a) | | 169,698 | 15,466,276 |
| Ionis Pharmaceuticals, Inc. (a) | | 277,572 | 12,124,345 |
| La Jolla Pharmaceutical Co. (a) | | 668,700 | 22,113,909 |
| Mirati Therapeutics, Inc. (a) | | 440,000 | 27,016,000 |
| Neurocrine Biosciences, Inc. (a) | | 248,482 | 24,969,956 |
| Protagonist Therapeutics, Inc. (a) | | 592,700 | 4,101,484 |
| Sage Therapeutics, Inc. (a) | | 107,175 | 15,467,496 |
| Sarepta Therapeutics, Inc. (a) | | 137,500 | 15,983,000 |
| Sienna Biopharmaceuticals, Inc. (b) | | 120,919 | 1,830,714 |
| Spark Therapeutics, Inc. (a) | | 318,300 | 24,419,976 |
| TESARO, Inc. (a) | | 261,700 | 9,115,011 |
| | | | 440,843,854 |
| Health Care Equipment & Supplies - 2.8% | | | |
| Cantel Medical Corp. | | 164,200 | 15,222,982 |
| Integra LifeSciences Holdings Corp. (a) | | 527,736 | 32,893,785 |
| iRhythm Technologies, Inc. (a) | | 497,300 | 37,571,015 |
| Masimo Corp. (a) | | 321,900 | 32,003,298 |
| Nanosonics Ltd. (a) | | 6,343,204 | 14,892,080 |
| Steris PLC | | 299,900 | 34,329,553 |
| | | | 166,912,713 |
| Health Care Providers & Services - 2.3% | | | |
| G1 Therapeutics, Inc. (a) | | 570,300 | 29,284,905 |
| Magellan Health Services, Inc. (a) | | 483,390 | 35,166,623 |
| Molina Healthcare, Inc. (a) | | 394,800 | 41,094,732 |
| National Vision Holdings, Inc. | | 298,400 | 12,132,944 |
| NMC Health PLC | | 445,800 | 22,211,717 |
| | | | 139,890,921 |
| Health Care Technology - 0.4% | | | |
| Veeva Systems, Inc. Class A (a) | | 265,500 | 20,079,765 |
| Life Sciences Tools & Services - 0.7% | | | |
| ICON PLC (a) | | 307,000 | 42,722,120 |
| Pharmaceuticals - 0.9% | | | |
| MyoKardia, Inc. (a) | | 186,216 | 10,688,798 |
| Nektar Therapeutics (a) | | 355,100 | 18,678,260 |
| Theravance Biopharma, Inc. (a)(b) | | 610,572 | 14,623,199 |
| Xeris Pharmaceuticals, Inc. | | 659,400 | 12,001,080 |
| | | | 55,991,337 |
|
| TOTAL HEALTH CARE | | | 866,440,710 |
|
| INDUSTRIALS - 15.1% | | | |
| Aerospace & Defense - 1.4% | | | |
| Moog, Inc. Class A | | 551,260 | 41,350,013 |
| Teledyne Technologies, Inc. (a) | | 196,140 | 43,037,039 |
| | | | 84,387,052 |
| Air Freight & Logistics - 0.5% | | | |
| Air Transport Services Group, Inc. (a) | | 1,355,030 | 30,528,826 |
| Airlines - 0.4% | | | |
| JetBlue Airways Corp. (a) | | 1,286,720 | 23,160,960 |
| Building Products - 1.2% | | | |
| Allegion PLC | | 299,990 | 24,461,185 |
| Simpson Manufacturing Co. Ltd. | | 669,180 | 48,823,373 |
| | | | 73,284,558 |
| Commercial Services & Supplies - 1.5% | | | |
| Deluxe Corp. | | 552,840 | 32,578,861 |
| Interface, Inc. | | 1,678,920 | 37,607,808 |
| Tomra Systems ASA | | 939,327 | 19,416,125 |
| | | | 89,602,794 |
| Construction & Engineering - 2.9% | | | |
| Comfort Systems U.S.A., Inc. | | 1,013,460 | 56,297,703 |
| EMCOR Group, Inc. | | 746,820 | 57,467,799 |
| Jacobs Engineering Group, Inc. | | 378,380 | 25,589,839 |
| Valmont Industries, Inc. | | 240,240 | 33,549,516 |
| | | | 172,904,857 |
| Industrial Conglomerates - 0.8% | | | |
| ITT, Inc. | | 879,760 | 49,855,999 |
| Machinery - 2.3% | | | |
| AGCO Corp. | | 328,740 | 20,717,195 |
| John Bean Technologies Corp. | | 400,100 | 44,251,060 |
| SPX Flow, Inc. (a) | | 814,709 | 38,714,972 |
| Standex International Corp. | | 320,330 | 33,202,205 |
| | | | 136,885,432 |
| Road & Rail - 0.6% | | | |
| Landstar System, Inc. | | 312,150 | 34,695,473 |
| Trading Companies & Distributors - 3.5% | | | |
| Kaman Corp. | | 752,430 | 49,825,915 |
| MRC Global, Inc. (a) | | 1,898,620 | 43,003,743 |
| SiteOne Landscape Supply, Inc. (a) | | 538,720 | 48,032,275 |
| Titan Machinery, Inc. (a) | | 689,941 | 10,445,707 |
| Watsco, Inc. | | 189,230 | 32,644,067 |
| WESCO International, Inc. (a) | | 474,760 | 28,960,360 |
| | | | 212,912,067 |
|
| TOTAL INDUSTRIALS | | | 908,218,018 |
|
| INFORMATION TECHNOLOGY - 15.3% | | | |
| Communications Equipment - 0.5% | | | |
| InterDigital, Inc. | | 352,467 | 29,060,904 |
| Electronic Equipment & Components - 2.2% | | | |
| CTS Corp. | | 831,876 | 29,032,472 |
| ePlus, Inc. (a) | | 337,732 | 33,317,262 |
| Plexus Corp. (a) | | 594,396 | 35,319,010 |
| TTM Technologies, Inc. (a) | | 1,915,085 | 33,245,876 |
| | | | 130,914,620 |
| Internet Software & Services - 4.2% | | | |
| BlackLine, Inc. (a) | | 676,138 | 28,871,093 |
| Carbonite, Inc. (a) | | 829,200 | 28,441,560 |
| Five9, Inc. (a) | | 923,400 | 29,456,460 |
| j2 Global, Inc. | | 369,703 | 31,365,603 |
| LivePerson, Inc. (a) | | 1,397,200 | 32,415,040 |
| New Relic, Inc. (a) | | 368,600 | 36,012,220 |
| SPS Commerce, Inc. (a) | | 441,600 | 37,884,864 |
| Wix.com Ltd. (a) | | 276,368 | 26,254,960 |
| | | | 250,701,800 |
| IT Services - 3.4% | | | |
| Amdocs Ltd. | | 266,200 | 17,989,796 |
| Conduent, Inc. (a) | | 946,119 | 16,992,297 |
| EPAM Systems, Inc. (a) | | 254,148 | 33,092,611 |
| ExlService Holdings, Inc. (a) | | 598,942 | 35,720,901 |
| Maximus, Inc. | | 468,101 | 30,337,626 |
| Science Applications International Corp. | | 521,999 | 44,041,056 |
| WNS Holdings Ltd. sponsored ADR (a) | | 601,484 | 29,268,211 |
| | | | 207,442,498 |
| Semiconductors & Semiconductor Equipment - 3.1% | | | |
| Diodes, Inc. (a) | | 852,865 | 31,692,463 |
| Entegris, Inc. | | 1,321,191 | 46,439,864 |
| Integrated Device Technology, Inc. (a) | | 1,252,100 | 43,109,803 |
| Nanometrics, Inc. (a) | | 718,547 | 27,060,480 |
| Semtech Corp. (a) | | 789,300 | 37,452,285 |
| | | | 185,754,895 |
| Software - 1.9% | | | |
| Everbridge, Inc. (a) | | 616,500 | 27,730,170 |
| Paycom Software, Inc. (a) | | 166,793 | 17,721,756 |
| RealPage, Inc. (a) | | 477,091 | 26,287,714 |
| RingCentral, Inc. (a) | | 572,651 | 42,233,011 |
| | | | 113,972,651 |
|
| TOTAL INFORMATION TECHNOLOGY | | | 917,847,368 |
|
| MATERIALS - 4.5% | | | |
| Chemicals - 2.9% | | | |
| Chase Corp. | | 307,387 | 37,962,295 |
| Ingevity Corp. (a) | | 336,000 | 33,489,120 |
| Innospec, Inc. | | 558,600 | 45,218,670 |
| Olin Corp. | | 721,300 | 21,285,563 |
| Trinseo SA | | 338,300 | 25,271,010 |
| Tronox Ltd. Class A | | 597,200 | 11,018,340 |
| | | | 174,244,998 |
| Containers & Packaging - 0.8% | | | |
| Owens-Illinois, Inc. (a) | | 976,200 | 18,235,416 |
| Sonoco Products Co. | | 563,900 | 31,476,898 |
| | | | 49,712,314 |
| Metals & Mining - 0.8% | | | |
| B2Gold Corp. (a) | | 5,508,100 | 13,718,910 |
| Steel Dynamics, Inc. | | 678,100 | 31,931,729 |
| | | | 45,650,639 |
|
| TOTAL MATERIALS | | | 269,607,951 |
|
| REAL ESTATE - 7.0% | | | |
| Equity Real Estate Investment Trusts (REITs) - 7.0% | | | |
| Americold Realty Trust | | 2,058,000 | 44,267,580 |
| CoreSite Realty Corp. | | 460,626 | 51,636,175 |
| Corporate Office Properties Trust (SBI) | | 1,594,100 | 47,408,534 |
| Equity Lifestyle Properties, Inc. | | 474,579 | 43,181,943 |
| Four Corners Property Trust, Inc. | | 2,331,254 | 58,048,225 |
| Rexford Industrial Realty, Inc. | | 1,884,500 | 57,741,080 |
| Store Capital Corp. | | 2,102,903 | 57,724,687 |
| Terreno Realty Corp. | | 1,681,600 | 62,067,856 |
| | | | 422,076,080 |
| UTILITIES - 3.1% | | | |
| Electric Utilities - 1.8% | | | |
| El Paso Electric Co. | | 521,780 | 32,506,894 |
| Hawaiian Electric Industries, Inc. | | 308,700 | 10,856,979 |
| IDACORP, Inc. | | 328,100 | 30,920,144 |
| Portland General Electric Co. | | 318,432 | 14,444,076 |
| Vistra Energy Corp. (a) | | 800,800 | 18,098,080 |
| | | | 106,826,173 |
| Gas Utilities - 1.3% | | | |
| Atmos Energy Corp. | | 163,286 | 15,001,085 |
| China Resource Gas Group Ltd. | | 2,854,300 | 13,527,747 |
| Southwest Gas Holdings, Inc. | | 298,500 | 23,342,700 |
| Spire, Inc. | | 334,608 | 23,957,933 |
| | | | 75,829,465 |
| Multi-Utilities - 0.0% | | | |
| Avista Corp. | | 45,900 | 2,321,622 |
|
| TOTAL UTILITIES | | | 184,977,260 |
|
| TOTAL COMMON STOCKS | | | |
| (Cost $4,627,776,305) | | | 5,947,782,188 |
| | | Principal Amount | Value |
|
| U.S. Treasury Obligations - 0.1% | | | |
| U.S. Treasury Bills, yield at date of purchase 1.88% to 1.99% 9/20/18 to 11/1/18 | | | |
| (Cost $4,439,971) | | 4,460,000 | 4,439,874 |
| | | Shares | Value |
|
| Money Market Funds - 2.9% | | | |
| Fidelity Cash Central Fund, 1.96% (e) | | 137,585,957 | $137,613,474 |
| Fidelity Securities Lending Cash Central Fund 1.97% (e)(f) | | 36,364,188 | 36,367,824 |
| TOTAL MONEY MARKET FUNDS | | | |
| (Cost $173,981,096) | | | 173,981,298 |
| TOTAL INVESTMENT IN SECURITIES - 102.1% | | | |
| (Cost $4,806,197,372) | | | 6,126,203,360 |
| NET OTHER ASSETS (LIABILITIES) - (2.1)% | | | (128,872,891) |
| NET ASSETS - 100% | | | $5,997,330,469 |
Legend
(a) Non-income producing
(b) Security or a portion of the security is on loan at period end.
(c) Affiliated company
(d) Security exempt from registration under Rule 144A of the Securities Act of 1933. These securities may be resold in transactions exempt from registration, normally to qualified institutional buyers. At the end of the period, the value of these securities amounted to $2,778,844 or 0.0% of net assets.
(e) Affiliated fund that is generally available only to investment companies and other accounts managed by Fidelity Investments. The rate quoted is the annualized seven-day yield of the fund at period end. A complete unaudited listing of the fund's holdings as of its most recent quarter end is available upon request. In addition, each Fidelity Central Fund's financial statements, which are not covered by the Fund's Report of Independent Registered Public Accounting Firm, are available on the SEC's website or upon request.
(f) Investment made with cash collateral received from securities on loan.
Affiliated Central Funds
Information regarding fiscal year to date income earned by the Fund from investments in Fidelity Central Funds is as follows:
| Fund | Income earned |
| Fidelity Cash Central Fund | $2,032,699 |
| Fidelity Securities Lending Cash Central Fund | 359,568 |
| Total | $2,392,267 |
Amounts in the income column in the above table include any capital gain distributions from underlying funds, which are presented in the corresponding line-item in the Statement of Operations if applicable.
Other Affiliated Issuers
An affiliated company is a company in which the Fund has ownership of at least 5% of the voting securities. Fiscal year to date transactions with companies which are or were affiliates are as follows:
| Affiliate | Value, beginning of period | Purchases | Sales Proceeds | Dividend Income | Realized Gain (loss) | Change in Unrealized appreciation (depreciation) | Value, end of period |
| Genocea Biosciences, Inc. | $10,048,028 | $882,133 | $2,775,211 | $-- | $(13,180,335) | $5,025,385 | $-- |
| Kezar Life Sciences, Inc. | -- | 16,692,363 | -- | -- | -- | 336,908 | 17,029,271 |
| Titan Machinery, Inc. | 28,873,357 | 1,041,263 | 18,394,085 | -- | 260,030 | (1,334,858) | -- |
| Trico Bancshares | -- | 51,657,777 | 9,083,463 | 544,622 | (644,724) | (816,531) | -- |
| Total | $38,921,385 | $70,273,536 | $30,252,759 | $544,622 | $(13,565,029) | $3,210,904 | $17,029,271 |
Investment Valuation
The following is a summary of the inputs used, as of July 31, 2018, involving the Fund's assets and liabilities carried at fair value. The inputs or methodology used for valuing securities may not be an indication of the risk associated with investing in those securities. For more information on valuation inputs, and their aggregation into the levels used below, please refer to the Investment Valuation section in the accompanying Notes to Financial Statements.
| | Valuation Inputs at Reporting Date: |
| Description | Total | Level 1 | Level 2 | Level 3 |
| Investments in Securities: | | | | |
| Equities: | | | | |
| Consumer Discretionary | $806,324,238 | $806,324,238 | $-- | $-- |
| Consumer Staples | 173,275,483 | 173,275,483 | -- | -- |
| Energy | 296,240,489 | 296,240,489 | -- | -- |
| Financials | 1,102,774,591 | 1,102,774,591 | -- | -- |
| Health Care | 866,440,710 | 866,440,710 | -- | -- |
| Industrials | 908,218,018 | 908,218,018 | -- | -- |
| Information Technology | 917,847,368 | 917,847,368 | -- | -- |
| Materials | 269,607,951 | 269,607,951 | -- | -- |
| Real Estate | 422,076,080 | 422,076,080 | -- | -- |
| Utilities | 184,977,260 | 184,977,260 | -- | -- |
| U.S. Government and Government Agency Obligations | 4,439,874 | -- | 4,439,874 | -- |
| Money Market Funds | 173,981,298 | 173,981,298 | -- | -- |
| Total Investments in Securities: | $6,126,203,360 | $6,121,763,486 | $4,439,874 | $-- |
See accompanying notes which are an integral part of the financial statements.
Financial Statements
Statement of Assets and Liabilities
| | | July 31, 2018 |
| Assets | | |
Investment in securities, at value (including securities loaned of $36,231,534) — See accompanying schedule:
Unaffiliated issuers (cost $4,615,523,913) | $5,935,192,791 | |
| Fidelity Central Funds (cost $173,981,096) | 173,981,298 | |
| Other affiliated issuers (cost $16,692,363) | 17,029,271 | |
| Total Investment in Securities (cost $4,806,197,372) | | $6,126,203,360 |
| Receivable for investments sold | | 61,410,659 |
| Receivable for fund shares sold | | 58,163 |
| Dividends receivable | | 1,199,538 |
| Distributions receivable from Fidelity Central Funds | | 166,310 |
| Receivable for daily variation margin on futures contracts | | 1,100,612 |
| Other receivables | | 112,479 |
| Total assets | | 6,190,251,121 |
| Liabilities | | |
| Payable to custodian bank | $1,061,833 | |
| Payable for investments purchased | 1,072,977 | |
| Payable for fund shares redeemed | 154,377,440 | |
| Other payables and accrued expenses | 48,486 | |
| Collateral on securities loaned | 36,359,916 | |
| Total liabilities | | 192,920,652 |
| Net Assets | | $5,997,330,469 |
| Net Assets consist of: | | |
| Paid in capital | | $4,212,931,782 |
| Undistributed net investment income | | 27,232,215 |
| Accumulated undistributed net realized gain (loss) on investments and foreign currency transactions | | 437,150,558 |
| Net unrealized appreciation (depreciation) on investments and assets and liabilities in foreign currencies | | 1,320,015,914 |
| Net Assets | | $5,997,330,469 |
| Series Small Cap Opportunities: | | |
| Net Asset Value, offering price and redemption price per share ($5,997,330,469 ÷ 387,931,130 shares) | | $15.46 |
See accompanying notes which are an integral part of the financial statements.
Statement of Operations
| | | Year ended July 31, 2018 |
| Investment Income | | |
| Dividends (including $544,622 earned from other affiliated issuers) | | $61,492,433 |
| Interest | | 26,073 |
| Income from Fidelity Central Funds | | 2,392,267 |
| Total income | | 63,910,773 |
| Expenses | | |
| Custodian fees and expenses | $106,389 | |
| Independent trustees' fees and expenses | 24,598 | |
| Interest | 1,456 | |
| Commitment fees | 16,129 | |
| Total expenses | | 148,572 |
| Net investment income (loss) | | 63,762,201 |
| Realized and Unrealized Gain (Loss) | | |
| Net realized gain (loss) on: | | |
| Investment securities: | | |
| Unaffiliated issuers | 616,212,420 | |
| Fidelity Central Funds | 2,639 | |
| Other affiliated issuers | (13,565,029) | |
| Foreign currency transactions | 50,241 | |
| Futures contracts | 2,093,608 | |
| Total net realized gain (loss) | | 604,793,879 |
| Change in net unrealized appreciation (depreciation) on: | | |
| Investment securities: | | |
| Unaffiliated issuers | 381,256,390 | |
| Fidelity Central Funds | (1,146) | |
| Other affiliated issuers | 3,210,904 | |
| Assets and liabilities in foreign currencies | (10,605) | |
| Futures contracts | 208,424 | |
| Total change in net unrealized appreciation (depreciation) | | 384,663,967 |
| Net gain (loss) | | 989,457,846 |
| Net increase (decrease) in net assets resulting from operations | | $1,053,220,047 |
See accompanying notes which are an integral part of the financial statements.
Statement of Changes in Net Assets
| | Year ended July 31, 2018 | Year ended July 31, 2017 |
| Increase (Decrease) in Net Assets | | |
| Operations | | |
| Net investment income (loss) | $63,762,201 | $26,872,072 |
| Net realized gain (loss) | 604,793,879 | 491,017,804 |
| Change in net unrealized appreciation (depreciation) | 384,663,967 | 109,661,042 |
| Net increase (decrease) in net assets resulting from operations | 1,053,220,047 | 627,550,918 |
| Distributions to shareholders from net investment income | (45,798,335) | (30,906,540) |
| Distributions to shareholders from net realized gain | (554,772,271) | (11,331,615) |
| Total distributions | (600,570,606) | (42,238,155) |
| Share transactions - net increase (decrease) | 86,531,896 | (483,035,407) |
| Total increase (decrease) in net assets | 539,181,337 | 102,277,356 |
| Net Assets | | |
| Beginning of period | 5,458,149,132 | 5,355,871,776 |
| End of period | $5,997,330,469 | $5,458,149,132 |
| Other Information | | |
| Undistributed net investment income end of period | $27,232,215 | $8,542,787 |
See accompanying notes which are an integral part of the financial statements.
Financial Highlights
Fidelity Series Small Cap Opportunities Fund
| Years ended July 31, | 2018 | 2017 | 2016 | 2015 | 2014 |
| Selected Per–Share Data | | | | | |
| Net asset value, beginning of period | $14.42 | $12.94 | $13.83 | $12.96 | $13.55 |
| Income from Investment Operations | | | | | |
| Net investment income (loss)A | .16 | .06 | .06 | .05 | .02 |
| Net realized and unrealized gain (loss) | 2.44 | 1.52 | (.22) | 1.53 | .77 |
| Total from investment operations | 2.60 | 1.58 | (.16) | 1.58 | .79 |
| Distributions from net investment income | (.12) | (.07) | (.05) | (.04) | –B |
| Distributions from net realized gain | (1.45) | (.03) | (.68) | (.66) | (1.38) |
| Total distributions | (1.56)C | (.10) | (.73) | (.71)D | (1.38) |
| Net asset value, end of period | $15.46 | $14.42 | $12.94 | $13.83 | $12.96 |
| Total ReturnE | 19.84% | 12.22% | (.94)% | 12.66% | 6.29% |
| Ratios to Average Net AssetsF,G | | | | | |
| Expenses before reductions | - %H | .66% | .85% | .77% | .82% |
| Expenses net of fee waivers, if any | - %H | .66% | .85% | .76% | .82% |
| Expenses net of all reductions | - %H | .65% | .84% | .76% | .82% |
| Net investment income (loss) | 1.10% | .42% | .46% | .41% | .19% |
| Supplemental Data | | | | | |
| Net assets, end of period (000 omitted) | $5,997,330 | $2,509,347 | $2,433,489 | $2,647,013 | $2,425,973 |
| Portfolio turnover rateI | 68% | 58% | 58% | 59% | 90%J |
A Calculated based on average shares outstanding during the period.
B Amount represents less than $.005 per share.
C Total distributions of $1.56 per share is comprised of distributions from net investment income of $.117 and distributions from net realized gain of $1.447 per share.
D Total distributions of $.71 per share is comprised of distributions from net investment income of $.042 and distributions from net realized gain of $.664 per share.
E Total returns would have been lower if certain expenses had not been reduced during the applicable periods shown.
F Fees and expenses of any underlying Fidelity Central Funds are not included in the Fund's expense ratio. The Fund indirectly bears its proportionate share of the expenses of any underlying Fidelity Central Funds.
G Expense ratios reflect operating expenses of the class. Expenses before reductions do not reflect amounts reimbursed by the investment adviser or reductions from brokerage service arrangements or reductions from other expense offset arrangements and do not represent the amount paid by the class during periods when reimbursements or reductions occur. Expenses net of fee waivers reflect expenses after reimbursement by the investment adviser but prior to reductions from brokerage service arrangements or other expense offset arrangements. Expenses net of all reductions represent the net expenses paid by the class.
H Amount represents less than .005%.
I Amount does not include the portfolio activity of any underlying Fidelity Central Funds.
J Portfolio turnover rate excludes securities received or delivered in-kind.
See accompanying notes which are an integral part of the financial statements.
Notes to Financial Statements
For the period ended July 31, 2018
1. Organization.
Fidelity Series Small Cap Opportunities Fund (the Fund) is a fund of Fidelity Securities Fund (the Trust) and is authorized to issue an unlimited number of shares. Shares of the Fund are only available for purchase by mutual funds for which FMR or an affiliate serves as an investment manager and FMR investment professionals. The Trust is registered under the Investment Company Act of 1940, as amended (the 1940 Act), as an open-end management investment company organized as a Massachusetts business trust. Effective August 28, 2017, the Fund no longer offered Class F, and all outstanding shares of Class F were exchanged for shares of Series Small Cap Opportunities.
2. Investments in Fidelity Central Funds.
The Fund invests in Fidelity Central Funds, which are open-end investment companies generally available only to other investment companies and accounts managed by the investment adviser and its affiliates. The Fund's Schedule of Investments lists each of the Fidelity Central Funds held as of period end, if any, as an investment of the Fund, but does not include the underlying holdings of each Fidelity Central Fund. As an Investing Fund, the Fund indirectly bears its proportionate share of the expenses of the underlying Fidelity Central Funds.
The Money Market Central Funds seek preservation of capital and current income and are managed by Fidelity Investments Money Management, Inc. (FIMM), an affiliate of the investment adviser. Annualized expenses of the Money Market Central Funds as of their most recent shareholder report date are less than .005%.
A complete unaudited list of holdings for each Fidelity Central Fund is available upon request or at the Securities and Exchange Commission (the SEC) website at www.sec.gov. In addition, the financial statements of the Fidelity Central Funds, which are not covered by the Fund's Report of Independent Registered Public Accounting Firm, are available on the SEC website or upon request.
3. Significant Accounting Policies.
The Fund is an investment company and applies the accounting and reporting guidance of the Financial Accounting Standards Board (FASB) Accounting Standards Codification Topic 946 Financial Services – Investments Companies. The financial statements have been prepared in conformity with accounting principles generally accepted in the United States of America (GAAP), which require management to make certain estimates and assumptions at the date of the financial statements. Actual results could differ from those estimates. Subsequent events, if any, through the date that the financial statements were issued have been evaluated in the preparation of the financial statements. The following summarizes the significant accounting policies of the Fund:
Investment Valuation. Investments are valued as of 4:00 p.m. Eastern time on the last calendar day of the period. The Board of Trustees (the Board) has delegated the day to day responsibility for the valuation of the Fund's investments to the Fair Value Committee (the Committee) established by the Fund's investment adviser. In accordance with valuation policies and procedures approved by the Board, the Fund attempts to obtain prices from one or more third party pricing vendors or brokers to value its investments. When current market prices, quotations or currency exchange rates are not readily available or reliable, investments will be fair valued in good faith by the Committee, in accordance with procedures adopted by the Board. Factors used in determining fair value vary by investment type and may include market or investment specific events, changes in interest rates and credit quality. The frequency with which these procedures are used cannot be predicted and they may be utilized to a significant extent. The Committee oversees the Fund's valuation policies and procedures and reports to the Board on the Committee's activities and fair value determinations. The Board monitors the appropriateness of the procedures used in valuing the Fund's investments and ratifies the fair value determinations of the Committee.
The Fund categorizes the inputs to valuation techniques used to value its investments into a disclosure hierarchy consisting of three levels as shown below:
- Level 1 – quoted prices in active markets for identical investments
- Level 2 – other significant observable inputs (including quoted prices for similar investments, interest rates, prepayment speeds, etc.)
- Level 3 – unobservable inputs (including the Fund's own assumptions based on the best information available)
Valuation techniques used to value the Fund's investments by major category are as follows:
Equity securities, including restricted securities, for which market quotations are readily available, are valued at the last reported sale price or official closing price as reported by a third party pricing vendor on the primary market or exchange on which they are traded and are categorized as Level 1 in the hierarchy. In the event there were no sales during the day or closing prices are not available, securities are valued at the last quoted bid price or may be valued using the last available price and are generally categorized as Level 2 in the hierarchy. For foreign equity securities, when market or security specific events arise, comparisons to the valuation of American Depositary Receipts (ADRs), futures contracts, Exchange-Traded Funds (ETFs) and certain indexes as well as quoted prices for similar securities may be used and would be categorized as Level 2 in the hierarchy. Utilizing these techniques may result in transfers between Level 1 and Level 2. For equity securities, including restricted securities, where observable inputs are limited, assumptions about market activity and risk are used and these securities may be categorized as Level 3 in the hierarchy.
Debt securities, including restricted securities, are valued based on evaluated prices received from third party pricing vendors or from brokers who make markets in such securities. U.S. government and government agency obligations are valued by pricing vendors who utilize matrix pricing which considers yield or price of bonds of comparable quality, coupon, maturity and type or by broker-supplied prices. When independent prices are unavailable or unreliable, debt securities may be valued utilizing pricing methodologies which consider similar factors that would be used by third party pricing vendors. Debt securities are generally categorized as Level 2 in the hierarchy but may be Level 3 depending on the circumstances.
Investments in open-end mutual funds, including the Fidelity Central Funds, are valued at their closing net asset value (NAV) each business day and are categorized as Level 1 in the hierarchy.
Changes in valuation techniques may result in transfers in or out of an assigned level within the disclosure hierarchy. The aggregate value of investments by input level as of July 31, 2018 is included at the end of the Fund's Schedule of Investments.
Foreign Currency. The Fund may use foreign currency contracts to facilitate transactions in foreign-denominated securities. Gains and losses from these transactions may arise from changes in the value of the foreign currency or if the counterparties do not perform under the contracts' terms.
Foreign-denominated assets, including investment securities, and liabilities are translated into U.S. dollars at the exchange rates at period end. Purchases and sales of investment securities, income and dividends received and expenses denominated in foreign currencies are translated into U.S. dollars at the exchange rate in effect on the transaction date.
The effects of exchange rate fluctuations on investments are included with the net realized and unrealized gain (loss) on investment securities. Other foreign currency transactions resulting in realized and unrealized gain (loss) are disclosed separately.
Investment Transactions and Income. For financial reporting purposes, the Fund's investment holdings and NAV include trades executed through the end of the last business day of the period. The NAV per share for processing shareholder transactions is calculated as of the close of business of the New York Stock Exchange (NYSE), normally 4:00 p.m. Eastern time and includes trades executed through the end of the prior business day. Gains and losses on securities sold are determined on the basis of identified cost and include proceeds received from litigation. Dividend income is recorded on the ex-dividend date, except for certain dividends from foreign securities where the ex-dividend date may have passed, which are recorded as soon as the Fund is informed of the ex-dividend date. Non-cash dividends included in dividend income, if any, are recorded at the fair market value of the securities received. Income and capital gain distributions from Fidelity Central Funds, if any, are recorded on the ex-dividend date. Certain distributions received by the Fund represent a return of capital or capital gain. The Fund determines the components of these distributions subsequent to the ex-dividend date, based upon receipt of tax filings or other correspondence relating to the underlying investment. These distributions are recorded as a reduction of cost of investments and/or as a realized gain. Interest income is accrued as earned and includes coupon interest and amortization of premium and accretion of discount on debt securities as applicable. Investment income is recorded net of foreign taxes withheld where recovery of such taxes is uncertain.
Class Allocations and Expenses. Investment income, realized and unrealized capital gains and losses, common expenses of the Fund, and certain fund-level expense reductions, if any, are allocated daily on a pro-rata basis to each class based on the relative net assets of each class to the total net assets of the Fund. Each class differs with respect to fees incurred. Certain expense reductions may also differ by class. For the reporting period, the allocated portion of income and expenses to each class as a percent of its average net assets may vary due to the timing of recording these transactions in relation to fluctuating net assets of the classes. Expenses directly attributable to a fund are charged to that fund. Expenses attributable to more than one fund are allocated among the respective funds on the basis of relative net assets or other appropriate methods. Expense estimates are accrued in the period to which they relate and adjustments are made when actual amounts are known.
Income Tax Information and Distributions to Shareholders. Each year, the Fund intends to qualify as a regulated investment company under Subchapter M of the Internal Revenue Code, including distributing substantially all of its taxable income and realized gains. As a result, no provision for U.S. Federal income taxes is required. As of July 31, 2018, the Fund did not have any unrecognized tax benefits in the financial statements; nor is the Fund aware of any tax positions for which it is reasonably possible that the total amounts of unrecognized tax benefits will significantly change in the next twelve months. The Fund files a U.S. federal tax return, in addition to state and local tax returns as required. The Fund's federal income tax returns are subject to examination by the Internal Revenue Service (IRS) for a period of three fiscal years after they are filed. State and local tax returns may be subject to examination for an additional fiscal year depending on the jurisdiction. Foreign taxes are provided for based on the Fund's understanding of the tax rules and rates that exist in the foreign markets in which it invests.
Distributions are declared and recorded on the ex-dividend date. Income and capital gain distributions are declared separately for each class. Income and capital gain distributions are determined in accordance with income tax regulations, which may differ from GAAP.
Capital accounts within the financial statements are adjusted for permanent book-tax differences. These adjustments have no impact on net assets or the results of operations. Capital accounts are not adjusted for temporary book-tax differences which will reverse in a subsequent period.
Book-tax differences are primarily due to futures contracts, foreign currency transactions, market discount, partnerships and losses deferred due to wash sales and excise tax regulations.
As of period end, the cost and unrealized appreciation (depreciation) in securities, and derivatives if applicable, for federal income tax purposes were as follows:
| Gross unrealized appreciation | $1,439,882,603 |
| Gross unrealized depreciation | (125,461,836) |
| Net unrealized appreciation (depreciation) | $1,314,420,767 |
| Tax Cost | $4,811,782,593 |
The tax-based components of distributable earnings as of period end were as follows:
| Undistributed ordinary income | $130,403,822 |
| Undistributed long-term capital gain | $339,564,173 |
| Net unrealized appreciation (depreciation) on securities and other investments | $1,314,430,693 |
The tax character of distributions paid was as follows:
| | July 31, 2018 | July 31, 2017 |
| Ordinary Income | $45,798,335 | $ 30,906,540 |
| Long-term Capital Gains | 554,772,271 | 11,331,615 |
| Total | $600,570,606 | $ 42,238,155 |
Restricted Securities. The Fund may invest in securities that are subject to legal or contractual restrictions on resale. These securities generally may be resold in transactions exempt from registration or to the public if the securities are registered. Disposal of these securities may involve time-consuming negotiations and expense, and prompt sale at an acceptable price may be difficult. Information regarding restricted securities is included at the end of the Fund's Schedule of Investments.
4. Derivative Instruments.
Risk Exposures and the Use of Derivative Instruments. The Fund's investment objective allows the Fund to enter into various types of derivative contracts, including futures contracts. Derivatives are investments whose value is primarily derived from underlying assets, indices or reference rates and may be transacted on an exchange or over-the-counter (OTC). Derivatives may involve a future commitment to buy or sell a specified asset based on specified terms, to exchange future cash flows at periodic intervals based on a notional principal amount, or for one party to make one or more payments upon the occurrence of specified events in exchange for periodic payments from the other party.
The Fund used derivatives to increase returns and to manage exposure to certain risks as defined below. The success of any strategy involving derivatives depends on analysis of numerous economic factors, and if the strategies for investment do not work as intended, the Fund may not achieve its objectives.
The Fund's use of derivatives increased or decreased its exposure to the following risk:
| Equity Risk | Equity risk relates to the fluctuations in the value of financial instruments as a result of changes in market prices (other than those arising from interest rate risk or foreign exchange risk), whether caused by factors specific to an individual investment, its issuer, or all factors affecting all instruments traded in a market or market segment.
|
The Fund is also exposed to additional risks from investing in derivatives, such as liquidity risk and counterparty credit risk. Liquidity risk is the risk that the Fund will be unable to close out the derivative in the open market in a timely manner. Counterparty credit risk is the risk that the counterparty will not be able to fulfill its obligation to the Fund. Counterparty credit risk related to exchange-traded futures contracts may be mitigated by the protection provided by the exchange on which they trade.
Investing in derivatives may involve greater risks than investing in the underlying assets directly and, to varying degrees, may involve risk of loss in excess of any initial investment and collateral received and amounts recognized in the Statement of Assets and Liabilities. In addition, there may be the risk that the change in value of the derivative contract does not correspond to the change in value of the underlying instrument.
Futures Contracts. A futures contract is an agreement between two parties to buy or sell a specified underlying instrument for a fixed price at a specified future date. The Fund used futures contracts to manage its exposure to the stock market.
Upon entering into a futures contract, a fund is required to deposit either cash or securities (initial margin) with a clearing broker in an amount equal to a certain percentage of the face value of the contract. Futures contracts are marked-to-market daily and subsequent daily payments (variation margin) are made or received by a fund depending on the daily fluctuations in the value of the futures contracts and are recorded as unrealized appreciation or (depreciation). This receivable and/or payable, if any, is included in daily variation margin on futures contracts in the Statement of Assets and Liabilities. Realized gain or (loss) is recorded upon the expiration or closing of a futures contract. The net realized gain (loss) and change in net unrealized appreciation (depreciation) on futures contracts during the period is presented in the Statement of Operations.
Any open futures contracts at period end are presented in the Schedule of Investments under the caption "Futures Contracts". The notional amount at value reflects each contract's exposure to the underlying instrument or index at period end.
5. Purchases and Sales of Investments.
Purchases and sales of securities, other than short-term securities, aggregated $3,800,012,426 and $4,097,634,500, respectively.
6. Fees and Other Transactions with Affiliates.
Management Fee. Fidelity Management & Research Company (the investment adviser) and its affiliates provide the Fund with investment management related services for which the Fund does not pay a management fee. Under the management contract, the investment adviser or an affiliate pays all ordinary operating expenses of the Fund, except custody fees, fees and expenses of the independent Trustees, and certain miscellaneous expenses such as proxy and shareholder meeting expenses.
Brokerage Commissions. The Fund placed a portion of its portfolio transactions with brokerage firms which are affiliates of the investment adviser. Brokerage commissions are included in net realized gain (loss) and change in net unrealized appreciation (depreciation) in the Statement of Operations. The commissions paid to these affiliated firms were $197,728 for the period.
Interfund Lending Program. Pursuant to an Exemptive Order issued by the SEC, the Fund, along with other registered investment companies having management contracts with Fidelity Management & Research Company (FMR) or other affiliated entities of FMR, may participate in an interfund lending program. This program provides an alternative credit facility allowing the funds to borrow from, or lend money to, other participating affiliated funds. At period end, there were no interfund loans outstanding. The Fund's activity in this program during the period for which loans were outstanding was as follows:
| Borrower or Lender | Average Loan Balance | Weighted Average Interest Rate | Interest Expense |
| Borrower | $23,768,000 | 2.21% | $1,456 |
Interfund Trades. The Fund may purchase from or sell securities to other Fidelity Funds under procedures adopted by the Board. The procedures have been designed to ensure these interfund trades are executed in accordance with Rule 17a-7 of the 1940 Act. Interfund trades are included within the respective purchases and sales amounts shown in the Purchases and Sales of Investments note.
Other. During the period, the investment adviser reimbursed the Fund for certain losses in the amount of $24,460.
7. Committed Line of Credit.
The Fund participates with other funds managed by the investment adviser or an affiliate in a $4.25 billion credit facility (the "line of credit") to be utilized for temporary or emergency purposes to fund shareholder redemptions or for other short-term liquidity purposes. The Fund has agreed to pay commitment fees on its pro-rata portion of the line of credit, which amounted to $16,129 and is reflected in Commitment fees on the Statement of Operations. During the period, the Fund did not borrow on this line of credit.
8. Security Lending.
The Fund lends portfolio securities through a lending agent from time to time in order to earn additional income. For equity securities, a lending agent is used and may loan securities to certain qualified borrowers, including Fidelity Capital Markets (FCM), a broker-dealer affiliated with the Fund. On the settlement date of the loan, the Fund receives collateral (in the form of U.S. Treasury obligations, letters of credit and/or cash) against the loaned securities and maintains collateral in an amount not less than 100% of the market value of the loaned securities during the period of the loan. The market value of the loaned securities is determined at the close of business of the Fund and any additional required collateral is delivered to the Fund on the next business day. The Fund or borrower may terminate the loan at any time, and if the borrower defaults on its obligation to return the securities loaned because of insolvency or other reasons, the Fund may apply collateral received from the borrower against the obligation. The Fund may experience delays and costs in recovering the securities loaned. Any cash collateral received is invested in the Fidelity Securities Lending Cash Central Fund. The value of loaned securities and cash collateral at period end are disclosed on the Fund's Statement of Assets and Liabilities. The value of securities loaned to FCM at period end was $452,686. Security lending income represents the income earned on investing cash collateral, less rebates paid to borrowers and any lending agent fees associated with the loan, plus any premium payments received for lending certain types of securities. Security lending income is presented in the Statement of Operations as a component of income from Fidelity Central Funds. Total security lending income during the period amounted to $359,568, including $11,530 from securities loaned to FCM.
9. Distributions to Shareholders.
Distributions to shareholders of each class were as follows:
| | Year ended
July 31, 2018 | Year ended
July 31, 2017 |
| From net investment income | | |
| Series Small Cap Opportunities | $45,798,335 | $11,794,933 |
| Class F | – | 19,111,607 |
| Total | $45,798,335 | $30,906,540 |
| From net realized gain | | |
| Series Small Cap Opportunities | $554,772,271 | $5,126,926 |
| Class F | – | 6,204,689 |
| Total | $554,772,271 | $11,331,615 |
10. Share Transactions.
Transactions for each class of shares were as follows:
| | Shares | Shares | Dollars | Dollars |
| | Year ended July 31, 2018 | Year ended July 31, 2017 | Year ended July 31, 2018 | Year ended July 31, 2017 |
| Series Small Cap Opportunities | | | | |
| Shares sold | 239,100,798 | 21,828,308 | $3,373,951,145 | $305,846,494 |
| Reinvestment of distributions | 44,122,337 | 1,235,622 | 600,570,606 | 16,921,859 |
| Shares redeemed | (69,346,858) | (37,107,686) | (1,011,412,547) | (511,729,842) |
| Net increase (decrease) | 213,876,277 | (14,043,756) | $2,963,109,204 | $(188,961,489) |
| Class F | | | | |
| Shares sold | 1,009,181 | 26,592,990 | $14,321,228 | $372,355,351 |
| Reinvestment of distributions | – | 1,845,956 | – | 25,316,296 |
| Shares redeemed | (204,251,733) | (49,600,408) | (2,890,898,536) | (691,745,565) |
| Net increase (decrease) | (203,242,552) | (21,161,462) | $(2,876,577,308) | $(294,073,918) |
11. Other.
The Fund's organizational documents provide former and current trustees and officers with a limited indemnification against liabilities arising in connection with the performance of their duties to the Fund. In the normal course of business, the Fund may also enter into contracts that provide general indemnifications. The Fund's maximum exposure under these arrangements is unknown as this would be dependent on future claims that may be made against the Fund. The risk of material loss from such claims is considered remote.
At the end of the period, mutual funds managed by the investment adviser or its affiliates were the owners of record of all of the outstanding shares of the Fund.
Report of Independent Registered Public Accounting Firm
To the Trustees of Fidelity Securities Fund and Shareholders of Fidelity Series Small Cap Opportunities Fund:
Opinion on the Financial Statements and Financial Highlights
We have audited the accompanying statement of assets and liabilities of Fidelity Series Small Cap Opportunities Fund (the "Fund"), a fund of Fidelity Securities Fund, including the schedule of investments, as of July 31, 2018, and the related statement of operations for the year then ended, the statement of changes in net assets for each of the two years in the period then ended, the financial highlights for each of the five years in the period then ended, and the related notes. In our opinion, the financial statements and financial highlights present fairly, in all material respects, the financial position of the Fund as of July 31, 2018, and the results of its operations for the year then ended, the changes in its net assets for each of the two years in the period then ended, and the financial highlights for each of the five years in the period then ended, in conformity with accounting principles generally accepted in the United States of America.
Basis for Opinion
These financial statements and financial highlights are the responsibility of the Fund's management. Our responsibility is to express an opinion on the Fund's financial statements and financial highlights based on our audits. We are a public accounting firm registered with the Public Company Accounting Oversight Board (United States) (PCAOB) and are required to be independent with respect to the Fund in accordance with the U.S. federal securities laws and the applicable rules and regulations of the Securities and Exchange Commission and the PCAOB.
We conducted our audits in accordance with the standards of the PCAOB. Those standards require that we plan and perform the audit to obtain reasonable assurance about whether the financial statements and financial highlights are free of material misstatement, whether due to error or fraud. The Fund is not required to have, nor were we engaged to perform, an audit of its internal control over financial reporting. As part of our audits we are required to obtain an understanding of internal control over financial reporting but not for the purpose of expressing an opinion on the effectiveness of the Fund’s internal control over financial reporting. Accordingly, we express no such opinion.
Our audits included performing procedures to assess the risks of material misstatement of the financial statements and financial highlights, whether due to error or fraud, and performing procedures that respond to those risks. Such procedures included examining, on a test basis, evidence regarding the amounts and disclosures in the financial statements and financial highlights. Our audits also included evaluating the accounting principles used and significant estimates made by management, as well as evaluating the overall presentation of the financial statements and financial highlights. Our procedures included confirmation of securities owned as of July 31, 2018, by correspondence with the custodians and brokers; when replies were not received from brokers, we performed other auditing procedures. We believe that our audits provide a reasonable basis for our opinion.
/s/ Deloitte & Touche LLP
Boston, Massachusetts
September 17, 2018
We have served as the auditor of one or more of the Fidelity investment companies since 1999.
Trustees and Officers
The Trustees, Members of the Advisory Board (if any), and officers of the trust and fund, as applicable, are listed below. The Board of Trustees governs the fund and is responsible for protecting the interests of shareholders. The Trustees are experienced executives who meet periodically throughout the year to oversee the fund's activities, review contractual arrangements with companies that provide services to the fund, oversee management of the risks associated with such activities and contractual arrangements, and review the fund's performance. Except for Jonathan Chiel, each of the Trustees oversees 286 funds. Mr. Chiel oversees 150 funds.
The Trustees hold office without limit in time except that (a) any Trustee may resign; (b) any Trustee may be removed by written instrument, signed by at least two-thirds of the number of Trustees prior to such removal; (c) any Trustee who requests to be retired or who has become incapacitated by illness or injury may be retired by written instrument signed by a majority of the other Trustees; and (d) any Trustee may be removed at any special meeting of shareholders by a two-thirds vote of the outstanding voting securities of the trust. Each Trustee who is not an interested person (as defined in the 1940 Act) of the trust and the fund is referred to herein as an Independent Trustee. Each Independent Trustee shall retire not later than the last day of the calendar year in which his or her 75th birthday occurs. The Independent Trustees may waive this mandatory retirement age policy with respect to individual Trustees. Officers and Advisory Board Members hold office without limit in time, except that any officer or Advisory Board Member may resign or may be removed by a vote of a majority of the Trustees at any regular meeting or any special meeting of the Trustees. Except as indicated, each individual has held the office shown or other offices in the same company for the past five years.
The fund’s Statement of Additional Information (SAI) includes more information about the Trustees. To request a free copy, call Fidelity at 1-800-544-8544.
Experience, Skills, Attributes, and Qualifications of the Trustees. The Governance and Nominating Committee has adopted a statement of policy that describes the experience, qualifications, attributes, and skills that are necessary and desirable for potential Independent Trustee candidates (Statement of Policy). The Board believes that each Trustee satisfied at the time he or she was initially elected or appointed a Trustee, and continues to satisfy, the standards contemplated by the Statement of Policy. The Governance and Nominating Committee also engages professional search firms to help identify potential Independent Trustee candidates who have the experience, qualifications, attributes, and skills consistent with the Statement of Policy. From time to time, additional criteria based on the composition and skills of the current Independent Trustees, as well as experience or skills that may be appropriate in light of future changes to board composition, business conditions, and regulatory or other developments, have also been considered by the professional search firms and the Governance and Nominating Committee. In addition, the Board takes into account the Trustees' commitment and participation in Board and committee meetings, as well as their leadership of standing and ad hoc committees throughout their tenure.
In determining that a particular Trustee was and continues to be qualified to serve as a Trustee, the Board has considered a variety of criteria, none of which, in isolation, was controlling. The Board believes that, collectively, the Trustees have balanced and diverse experience, qualifications, attributes, and skills, which allow the Board to operate effectively in governing the fund and protecting the interests of shareholders. Information about the specific experience, skills, attributes, and qualifications of each Trustee, which in each case led to the Board's conclusion that the Trustee should serve (or continue to serve) as a trustee of the fund, is provided below.
Board Structure and Oversight Function. James C. Curvey is an interested person and currently serves as Chairman. The Trustees have determined that an interested Chairman is appropriate and benefits shareholders because an interested Chairman has a personal and professional stake in the quality and continuity of services provided to the fund. Independent Trustees exercise their informed business judgment to appoint an individual of their choosing to serve as Chairman, regardless of whether the Trustee happens to be independent or a member of management. The Independent Trustees have determined that they can act independently and effectively without having an Independent Trustee serve as Chairman and that a key structural component for assuring that they are in a position to do so is for the Independent Trustees to constitute a substantial majority for the Board. The Independent Trustees also regularly meet in executive session. Ned C. Lautenbach serves as Chairman of the Independent Trustees and as such (i) acts as a liaison between the Independent Trustees and management with respect to matters important to the Independent Trustees and (ii) with management prepares agendas for Board meetings.
Fidelity® funds are overseen by different Boards of Trustees. The fund's Board oversees Fidelity's high income and certain equity funds, and other Boards oversee Fidelity's investment-grade bond, money market, asset allocation, and other equity funds. The asset allocation funds may invest in Fidelity® funds overseen by the fund's Board. The use of separate Boards, each with its own committee structure, allows the Trustees of each group of Fidelity® funds to focus on the unique issues of the funds they oversee, including common research, investment, and operational issues. On occasion, the separate Boards establish joint committees to address issues of overlapping consequences for the Fidelity® funds overseen by each Board.
The Trustees operate using a system of committees to facilitate the timely and efficient consideration of all matters of importance to the Trustees, the fund, and fund shareholders and to facilitate compliance with legal and regulatory requirements and oversight of the fund's activities and associated risks. The Board, acting through its committees, has charged FMR and its affiliates with (i) identifying events or circumstances the occurrence of which could have demonstrably adverse effects on the fund's business and/or reputation; (ii) implementing processes and controls to lessen the possibility that such events or circumstances occur or to mitigate the effects of such events or circumstances if they do occur; and (iii) creating and maintaining a system designed to evaluate continuously business and market conditions in order to facilitate the identification and implementation processes described in (i) and (ii) above. Because the day-to-day operations and activities of the fund are carried out by or through FMR, its affiliates, and other service providers, the fund's exposure to risks is mitigated but not eliminated by the processes overseen by the Trustees. While each of the Board's committees has responsibility for overseeing different aspects of the fund's activities, oversight is exercised primarily through the Operations, Audit, and Compliance Committees. In addition, the Independent Trustees have worked with Fidelity to enhance the Board's oversight of investment and financial risks, legal and regulatory risks, technology risks, and operational risks, including the development of additional risk reporting to the Board. Appropriate personnel, including but not limited to the fund's Chief Compliance Officer (CCO), FMR's internal auditor, the independent accountants, the fund's Treasurer and portfolio management personnel, make periodic reports to the Board's committees, as appropriate, including an annual review of Fidelity's risk management program for the Fidelity® funds. The responsibilities of each standing committee, including their oversight responsibilities, are described further under "Standing Committees of the Trustees."
Interested Trustees*:
Correspondence intended for a Trustee who is an interested person may be sent to Fidelity Investments, 245 Summer Street, Boston, Massachusetts 02210.
Name, Year of Birth; Principal Occupations and Other Relevant Experience+
Jonathan Chiel (1957)
Year of Election or Appointment: 2016
Trustee
Mr. Chiel also serves as Trustee of other Fidelity® funds. Mr. Chiel is Executive Vice President and General Counsel for FMR LLC (diversified financial services company, 2012-present). Previously, Mr. Chiel served as general counsel (2004-2012) and senior vice president and deputy general counsel (2000-2004) for John Hancock Financial Services; a partner with Choate, Hall & Stewart (1996-2000) (law firm); and an Assistant United States Attorney for the United States Attorney’s Office of the District of Massachusetts (1986-95), including Chief of the Criminal Division (1993-1995). Mr. Chiel is a director on the boards of the Boston Bar Foundation and the Maimonides School.
James C. Curvey (1935)
Year of Election or Appointment: 2007
Trustee
Chairman of the Board of Trustees
Mr. Curvey also serves as Trustee of other Fidelity® funds. Mr. Curvey is Vice Chairman (2007-present) and Director of FMR LLC (diversified financial services company). In addition, Mr. Curvey is an Overseer Emeritus for the Boston Symphony Orchestra, a Director of Artis-Naples, and a Trustee of Brewster Academy in Wolfeboro, New Hampshire. Previously, Mr. Curvey served as a Director of Fidelity Research & Analysis Co. (investment adviser firm, 2009-2018), Director of Fidelity Investments Money Management, Inc. (investment adviser firm, 2009-2014) and a Director of FMR and FMR Co., Inc. (investment adviser firms, 2007-2014).
Charles S. Morrison (1960)
Year of Election or Appointment: 2014
Trustee
Mr. Morrison also serves as Trustee of other funds. He serves as President of Fidelity SelectCo, LLC (investment adviser firm, 2017-present) and Fidelity Management & Research Company (FMR) (investment adviser firm, 2016-present), a Director of Fidelity Investments Money Management, Inc. (FIMM) (investment adviser firm, 2014-present), Director of Fidelity SelectCo, LLC (investment adviser firm, 2014-present), President, Asset Management (2014-present), and is an employee of Fidelity Investments. Previously, Mr. Morrison served as Vice President of Fidelity's Fixed Income and Asset Allocation Funds (2012-2014), President, Fixed Income (2011-2014), Vice President of Fidelity's Money Market Funds (2005-2009), President, Money Market Group Leader of FMR (investment adviser firm, 2009), and Senior Vice President, Money Market Group of FMR (2004-2009). Mr. Morrison also served as Vice President of Fidelity's Bond Funds (2002-2005), certain Balanced Funds (2002-2005), and certain Asset Allocation Funds (2002-2007), and as Senior Vice President (2002-2005) of Fidelity's Bond Division.
* Determined to be an “Interested Trustee” by virtue of, among other things, his or her affiliation with the trust or various entities under common control with FMR.
+ The information includes the Trustee's principal occupation during the last five years and other information relating to the experience, attributes, and skills relevant to the Trustee's qualifications to serve as a Trustee, which led to the conclusion that the Trustee should serve as a Trustee for the fund.
Independent Trustees:
Correspondence intended for an Independent Trustee may be sent to Fidelity Investments, P.O. Box 55235, Boston, Massachusetts 02205-5235.
Name, Year of Birth; Principal Occupations and Other Relevant Experience+
Dennis J. Dirks (1948)
Year of Election or Appointment: 2005
Trustee
Mr. Dirks also serves as Trustee of other Fidelity® funds. Prior to his retirement in May 2003, Mr. Dirks was Chief Operating Officer and a member of the Board of The Depository Trust & Clearing Corporation (DTCC). He also served as President, Chief Operating Officer, and Board member of The Depository Trust Company (DTC) and President and Board member of the National Securities Clearing Corporation (NSCC). In addition, Mr. Dirks served as Chief Executive Officer and Board member of the Government Securities Clearing Corporation, Chief Executive Officer and Board member of the Mortgage-Backed Securities Clearing Corporation, as a Trustee and a member of the Finance Committee of Manhattan College (2005-2008), as a Trustee and a member of the Finance Committee of AHRC of Nassau County (2006-2008), as a member of the Independent Directors Council (IDC) Governing Council (2010-2015), and as a member of the Board of Directors for The Brookville Center for Children’s Services, Inc. (2009-2017). Mr. Dirks is a member of the Finance Committee (2016-present), Board of Directors (2017-present) and Board of Trustees (2018-present) and is Treasurer (2018-present) of the Asolo Repertory Theatre.
Donald F. Donahue (1950)
Year of Election or Appointment: 2018
Trustee
Mr. Donahue also serves as a Trustee of other Fidelity® funds. Mr. Donahue is President and Chief Executive Officer of Miranda Partners, LLC (risk consulting for the financial services industry, 2012-present). Previously, Mr. Donahue served as a Member of the Advisory Board of certain Fidelity® funds (2015-2018) and Chief Executive Officer (2006-2012), Chief Operating Officer (2003-2006), and Managing Director, Customer Marketing and Development (1999-2003) of The Depository Trust & Clearing Corporation (financial markets infrastructure). Mr. Donahue serves as a Member (2007-present) and Co-Chairman (2016-present) of the Board of Directors of United Way of New York, Member of the Board of Directors of NYC Leadership Academy (2012-present) and Member of the Board of Advisors of Ripple Labs, Inc. (financial services, 2015-present). He also served as Chairman (2010-2012) and Member of the Board of Directors (2012-2013) of Omgeo, LLC (financial services), Treasurer of United Way of New York (2012-2016), and Member of the Board of Directors of XBRL US (financial services non-profit, 2009-2012) and the International Securities Services Association (2009-2012).
Alan J. Lacy (1953)
Year of Election or Appointment: 2008
Trustee
Mr. Lacy also serves as Trustee of other Fidelity® funds. Mr. Lacy serves as a Director of Bristol-Myers Squibb Company (global pharmaceuticals, 2008-present). He is a Trustee of the California Chapter of The Nature Conservancy (2015-present) and a Director of the Center for Advanced Study in the Behavioral Sciences at Stanford University (2015-present). In addition, Mr. Lacy served as Senior Adviser (2007-2014) of Oak Hill Capital Partners, L.P. (private equity) and also served as Chief Executive Officer (2005) and Vice Chairman (2005-2006) of Sears Holdings Corporation (retail) and Chief Executive Officer and Chairman of the Board of Sears, Roebuck and Co. (retail, 2000-2005). Previously, Mr. Lacy served as Chairman (2014-2017) and a member (2010-2017) of the Board of Directors of Dave & Buster’s Entertainment, Inc. (restaurant and entertainment complexes), as Chairman (2008-2011) and a member (2006-2015) of the Board of Trustees of the National Parks Conservation Association, and as a member of the Board of Directors for The Hillman Companies, Inc. (hardware wholesalers, 2010-2014), Earth Fare, Inc. (retail grocery, 2010-2014), and The Western Union Company (global money transfer, 2006-2011).
Ned C. Lautenbach (1944)
Year of Election or Appointment: 2000
Trustee
Chairman of the Independent Trustees
Mr. Lautenbach also serves as Trustee of other Fidelity® funds. Mr. Lautenbach currently serves as Vice Chair of the Board of Governors, State University System of Florida (2013-present) and is a member of the Council on Foreign Relations (1994-present). He is also a member and has most recently served as Chairman of the Board of Directors of Artis-Naples (2012-present). Previously, Mr. Lautenbach served as a member and then Lead Director of the Board of Directors of Eaton Corporation (diversified industrial, 1997-2016). He was also a Partner and Advisory Partner at Clayton, Dubilier & Rice, LLC (private equity investment, 1998-2010), as well as a Director of Sony Corporation (2006-2007). In addition, Mr. Lautenbach also had a 30-year career with IBM (technology company) during which time he served as Senior Vice President and a member of the Corporate Executive Committee (1968-1998).
Joseph Mauriello (1944)
Year of Election or Appointment: 2008
Trustee
Mr. Mauriello also serves as Trustee of other Fidelity® funds. Prior to his retirement in January 2006, Mr. Mauriello served in numerous senior management positions including Deputy Chairman and Chief Operating Officer (2004-2005), and Vice Chairman of Financial Services (2002-2004) of KPMG LLP US (professional services, 1965-2005). Mr. Mauriello currently serves as a member of the Board of Directors of XL Group plc. (global insurance and re-insurance, 2006-present) and the Independent Directors Council (IDC) Governing Council (2015-present). Previously, Mr. Mauriello served as a Director of the Hamilton Funds of the Bank of New York (2006-2007) and of Arcadia Resources Inc. (health care services and products, 2007-2012).
Cornelia M. Small (1944)
Year of Election or Appointment: 2005
Trustee
Ms. Small also serves as Trustee of other Fidelity® funds. Ms. Small is a member of the Board of Directors (2009-present) and Chair of the Investment Committee (2010-present) of the Teagle Foundation. Ms. Small also serves on the Investment Committee of the Berkshire Taconic Community Foundation (2008-present). Previously, Ms. Small served as Chairperson (2002-2008) and a member of the Investment Committee and Chairperson (2008-2012) and a member of the Board of Trustees of Smith College. In addition, Ms. Small served as Chief Investment Officer, Director of Global Equity Investments, and a member of the Board of Directors of Scudder, Stevens & Clark and Scudder Kemper Investments.
Garnett A. Smith (1947)
Year of Election or Appointment: 2018
Trustee
Mr. Smith also serves as Trustee of other Fidelity® funds. Prior to Mr. Smith's retirement, he served as Chairman and Chief Executive Officer of Inbrand Corp. (manufacturer of personal absorbent products, 1990-1997). He also served as President (1986-1990) of Inbrand Corp. Prior to his employment with Inbrand Corp., he was employed by a retail fabric chain and North Carolina National Bank. In addition, Mr. Smith served as a Member of the Advisory Board of certain Fidelity® funds (2012-2013) and as a board member of the Jackson Hole Land Trust (2009-2012).
David M. Thomas (1949)
Year of Election or Appointment: 2008
Trustee
Mr. Thomas also serves as Trustee of other Fidelity® funds. Mr. Thomas serves as Non-Executive Chairman of the Board of Directors of Fortune Brands Home and Security (home and security products, 2011-present), as a member of the Board of Directors (2004-present) and Presiding Director (2013-present) of Interpublic Group of Companies, Inc. (marketing communication), and as a member of the Board of Trustees of the University of Florida (2013-present). Previously, Mr. Thomas served as Executive Chairman (2005-2006) and Chairman and Chief Executive Officer (2000-2005) of IMS Health, Inc. (pharmaceutical and healthcare information solutions), and a Director of Fortune Brands, Inc. (consumer products, 2000-2011).
+ The information includes the Trustee's principal occupation during the last five years and other information relating to the experience, attributes, and skills relevant to the Trustee's qualifications to serve as a Trustee, which led to the conclusion that the Trustee should serve as a Trustee for the fund.
Advisory Board Members and Officers:
Correspondence intended for a Member of the Advisory Board (if any) may be sent to Fidelity Investments, P.O. Box 55235, Boston, Massachusetts 02205-5235. Correspondence intended for an officer or Peter S. Lynch may be sent to Fidelity Investments, 245 Summer Street, Boston, Massachusetts 02210. Officers appear below in alphabetical order.
Name, Year of Birth; Principal Occupation
Peter S. Lynch (1944)
Year of Election or Appointment: 2003
Member of the Advisory Board
Mr. Lynch also serves as Member of the Advisory Board of other Fidelity® funds. Mr. Lynch is Vice Chairman and a Director of FMR (investment adviser firm) and FMR Co., Inc. (investment adviser firm). In addition, Mr. Lynch serves as a Trustee of Boston College and as the Chairman of the Inner-City Scholarship Fund. Previously, Mr. Lynch served on the Special Olympics International Board of Directors (1997-2006).
William S. Stavropoulos (1939)
Year of Election or Appointment: 2018
Member of the Advisory Board
Mr. Stavropoulos also serves as Member of the Advisory Board of other Fidelity® funds. Mr. Stavropoulos serves as President and Founder of the Michigan Baseball Foundation, the Great Lakes Loons (2007-present). Mr. Stavropoulos is Chairman Emeritus of the Board of Directors of The Dow Chemical Company, where he previously served in numerous senior management positions, including President, CEO (1995-2000; 2002-2004), Chairman of the Executive Committee (2000-2006), and as a member of the Board of Directors (1990-2006). Currently, Mr. Stavropoulos is Chairman of the Board of Directors of Univar Inc. (global distributor of commodity and specialty chemicals), a Director of Teradata Corporation (data warehousing and technology solutions), and a member of the Advisory Board for Metalmark Capital LLC (private equity investment, 2005-present). Mr. Stavropoulos is an operating advisor to Clayton, Dubilier & Rice, LLC (private equity investment). In addition, Mr. Stavropoulos is a member of the University of Notre Dame Advisory Council for the College of Science, a Trustee of the Rollin L. Gerstacker Foundation, and a Director of Artis-Naples in Naples, Florida. Previously, Mr. Stavropoulos served as Trustee of certain Fidelity® funds (2001-2018) and as a Director of Chemical Financial Corporation (bank holding company, 1993-2012) and Tyco International, Ltd. (multinational manufacturing and services, 2007-2012).
Carol B. Tomé (1957)
Year of Election or Appointment: 2018
Member of the Advisory Board
Ms. Tomé also serves as Member of the Advisory Board of other Fidelity® funds. Ms. Tomé is Chief Financial Officer (2001-present) and Executive Vice President of Corporate Services (2007-present) of The Home Depot, Inc. (home improvement retailer) and a Director (2003-present) and Chair of the Audit Committee (2004-present) of United Parcel Service, Inc. (package delivery and supply chain management). Previously, Ms. Tomé served as Trustee of certain Fidelity® funds (2017), Senior Vice President of Finance and Accounting/Treasurer (2000-2007) and Vice President and Treasurer (1995-2000) of The Home Depot, Inc. and Chair of the Board (2010-2012), Vice Chair of the Board (2009 and 2013), and a Director (2008-2013) of the Federal Reserve Bank of Atlanta. Ms. Tomé is also a director or trustee of many community and professional organizations.
Michael E. Wiley (1950)
Year of Election or Appointment: 2018
Member of the Advisory Board
Mr. Wiley also serves as Trustee or Member of the Advisory Board of other Fidelity® funds. Mr. Wiley serves as a Director of Andeavor Corporation (independent oil refiner and marketer, 2005-present), a Director of Andeavor Logistics LP (natural resources logistics, 2015-present), and a Director of Bill Barrett Corporation (exploration and production, 2005-present). In addition, Mr. Wiley also serves as a Director of Post Oak Bank (privately-held bank, 2004-present). Previously, Mr. Wiley served as a Trustee of other Fidelity® funds (2008-2013), as a Director of Asia Pacific Exploration Consolidated (international oil and gas exploration and production, 2008-2013), as a member of the Board of Trustees of the University of Tulsa (2000-2006; 2007-2010), as a Senior Energy Advisor of Katzenbach Partners, LLC (consulting, 2006-2007), as an Advisory Director of Riverstone Holdings (private investment), Chairman, President, and CEO of Baker Hughes, Inc. (oilfield services, 2000-2004), and as Director of Spinnaker Exploration Company (exploration and production, 2001-2005).
Elizabeth Paige Baumann (1968)
Year of Election or Appointment: 2017
Anti-Money Laundering (AML) Officer
Ms. Baumann also serves as AML Officer of other funds. She is Chief AML Officer (2012-present) and Senior Vice President (2014-present) of FMR LLC (diversified financial services company) and is an employee of Fidelity Investments. Previously, Ms. Baumann served as AML Officer of the funds (2012-2016), and Vice President (2007-2014) and Deputy Anti-Money Laundering Officer (2007-2012) of FMR LLC.
Marc R. Bryant (1966)
Year of Election or Appointment: 2015
Secretary and Chief Legal Officer (CLO)
Mr. Bryant also serves as Secretary and CLO of other funds. Mr. Bryant serves as CLO, Secretary, and Senior Vice President of Fidelity Management & Research Company (investment adviser firm, 2015-present) and FMR Co., Inc. (investment adviser firm, 2015-present); Secretary of Fidelity SelectCo, LLC (investment adviser firm, 2015-present) and Fidelity Investments Money Management, Inc. (investment adviser firm, 2015-present); and CLO of Fidelity Management & Research (Hong Kong) Limited and FMR Investment Management (UK) Limited (investment adviser firms, 2015-present) and Fidelity Management & Research (Japan) Limited (investment adviser firm, 2016-present). He is Senior Vice President and Deputy General Counsel of FMR LLC (diversified financial services company). Previously, Mr. Bryant served as Secretary and CLO of Fidelity Rutland Square Trust II (2010-2014) and Assistant Secretary of Fidelity's Fixed Income and Asset Allocation Funds (2013-2015). Prior to joining Fidelity Investments, Mr. Bryant served as a Senior Vice President and the Head of Global Retail Legal for AllianceBernstein L.P. (2006-2010), and as the General Counsel for ProFund Advisors LLC (2001-2006).
John J. Burke III (1964)
Year of Election or Appointment: 2018
Chief Financial Officer
Mr. Burke also serves as Chief Financial Officer of other funds. Mr. Burke serves as Head of Investment Operations for Fidelity Fund and Investment Operations (2018-present) and is an employee of Fidelity Investments (1998-present). Previously Mr. Burke served as head of Asset Management Investment Operations (2012-2018).
William C. Coffey (1969)
Year of Election or Appointment: 2009
Assistant Secretary
Mr. Coffey also serves as Assistant Secretary of other funds. He is Senior Vice President and Deputy General Counsel of FMR LLC (diversified financial services company, 2010-present), and is an employee of Fidelity Investments. Previously, Mr. Coffey served as Vice President and Associate General Counsel of FMR LLC (2005-2009).
Timothy M. Cohen (1969)
Year of Election or Appointment: 2018
Vice President
Mr. Cohen also serves as Vice President of other funds. Mr. Cohen serves as Co-Head of Global Equity Research (2016-present), a Director of Fidelity Management & Research (Japan) Limited (investment adviser firm, 2016-present), and is an employee of Fidelity Investments. Previously, Mr. Cohen served as Chief Investment Officer - Equity and a Director of Fidelity Management & Research (U.K.) Inc. (investment adviser firm, 2013-2015) and as a Director of Fidelity Management & Research (Hong Kong) Limited (investment adviser firm, 2017).
Jonathan Davis (1968)
Year of Election or Appointment: 2010
Assistant Treasurer
Mr. Davis also serves as Assistant Treasurer of other funds. Mr. Davis serves as Assistant Treasurer of FMR Capital, Inc. (2017-present) and is an employee of Fidelity Investments. Previously, Mr. Davis served as Vice President and Associate General Counsel of FMR LLC (diversified financial services company, 2003-2010).
Adrien E. Deberghes (1967)
Year of Election or Appointment: 2016
Assistant Treasurer
Mr. Deberghes also serves as an officer of other funds. He serves as Assistant Treasurer of FMR Capital, Inc. (2017-present), Executive Vice President of Fidelity Investments Money Management, Inc. (FIMM) (investment adviser firm, 2016-present), and is an employee of Fidelity Investments (2008-present). Previously, Mr. Deberghes served as President and Treasurer of certain Fidelity® funds (2013-2018). Prior to joining Fidelity Investments, Mr. Deberghes was Senior Vice President of Mutual Fund Administration at State Street Corporation (2007-2008), Senior Director of Mutual Fund Administration at Investors Bank & Trust (2005-2007), and Director of Finance for Dunkin' Brands (2000-2005). Previously, Mr. Deberghes served in other fund officer roles.
Laura M. Del Prato (1964)
Year of Election or Appointment: 2018
Assistant Treasurer
Ms. Del Prato also serves as an officer of other funds. Ms. Del Prato is an employee of Fidelity Investments (2017-present). Prior to joining Fidelity Investments, Ms. Del Prato served as a Managing Director and Treasurer of the JPMorgan Mutual Funds (2014-2017). Prior to JPMorgan, Ms. Del Prato served as a partner at Cohen Fund Audit Services (accounting firm, 2012-2013) and KPMG LLP (accounting firm, 2004-2012).
Colm A. Hogan (1973)
Year of Election or Appointment: 2016
Deputy Treasurer
Mr. Hogan also serves as an officer of other funds. Mr. Hogan serves as Assistant Treasurer of FMR Capital, Inc. (2017-present) and is an employee of Fidelity Investments (2005-present). Previously, Mr. Hogan served as Assistant Treasurer of certain Fidelity® funds (2016-2018).
Pamela R. Holding (1964)
Year of Election or Appointment: 2018
Vice President
Ms. Holding also serves as a Vice President of other funds. Ms. Holding serves as Co-Head of Global Equity Research (2018-present) and is an employee of Fidelity Investments (2013-present).
Chris Maher (1972)
Year of Election or Appointment: 2013
Assistant Treasurer
Mr. Maher serves as Assistant Treasurer of other funds. Mr. Maher is Vice President of Valuation Oversight, serves as Assistant Treasurer of FMR Capital, Inc. (2017-present), and is an employee of Fidelity Investments. Previously, Mr. Maher served as Vice President of Asset Management Compliance (2013), Vice President of the Program Management Group of FMR (investment adviser firm, 2010-2013), and Vice President of Valuation Oversight (2008-2010).
Rieco E. Mello (1969)
Year of Election or Appointment: 2017
Assistant Treasurer
Mr. Mello also serves as Assistant Treasurer of other funds. Mr. Mello serves as Assistant Treasurer of FMR Capital, Inc. (2017-present) and is an employee of Fidelity Investments (1995-present).
Kenneth B. Robins (1969)
Year of Election or Appointment: 2016
Chief Compliance Officer
Mr. Robins also serves as an officer of other funds. Mr. Robins serves as Compliance Officer of Fidelity Management & Research Company and FMR Co., Inc. (investment adviser firms, 2016-present) and is an employee of Fidelity Investments (2004-present). Previously, Mr. Robins served as Executive Vice President of Fidelity Investments Money Management, Inc. (investment adviser firm, 2013-2016) and served in other fund officer roles.
Stacie M. Smith (1974)
Year of Election or Appointment: 2016
President and Treasurer
Ms. Smith also serves as an officer of other funds. Ms. Smith serves as Assistant Treasurer of FMR Capital, Inc. (2017-present), is an employee of Fidelity Investments (2009-present), and has served in other fund officer roles. Prior to joining Fidelity Investments, Ms. Smith served as Senior Audit Manager of Ernst & Young LLP (accounting firm, 1996-2009). Previously, Ms. Smith served as Assistant Treasurer (2013-2018) and Deputy Treasurer (2013-2016) of certain Fidelity® funds.
Marc L. Spector (1972)
Year of Election or Appointment: 2016
Assistant Treasurer
Mr. Spector also serves as an officer of other funds. Mr. Spector serves as Assistant Treasurer of FMR Capital, Inc. (2017-present) and is an employee of Fidelity Investments (2016-present). Prior to joining Fidelity Investments, Mr. Spector served as Director at the Siegfried Group (accounting firm, 2013-2016), and prior to Siegfried Group as audit senior manager at Deloitte & Touche (accounting firm, 2005-2013).
Renee Stagnone (1975)
Year of Election or Appointment: 2016
Assistant Treasurer
Ms. Stagnone also serves as an officer of other funds. Ms. Stagnone serves as Assistant Treasurer of FMR Capital, Inc. (2017-present) and is an employee of Fidelity Investments (1997-present). Previously, Ms. Stagnone served as Deputy Treasurer of certain Fidelity® funds (2013-2016).
Shareholder Expense Example
As a shareholder of the Fund, you incur two types of costs: (1) transaction costs and (2) ongoing costs, including other Fund expenses. This Example is intended to help you understand your ongoing costs (in dollars) of investing in the Fund and to compare these costs with the ongoing costs of investing in other mutual funds.
The Example is based on an investment of $1,000 invested at the beginning of the period and held for the entire period (February 1, 2018 to July 31, 2018).
Actual Expenses
The first line of the accompanying table provides information about actual account values and actual expenses. You may use the information in this line, together with the amount you invested, to estimate the expenses that you paid over the period. Simply divide your account value by $1,000.00 (for example, an $8,600 account value divided by $1,000.00 = 8.6), then multiply the result by the number in the first line under the heading entitled "Expenses Paid During Period" to estimate the expenses you paid on your account during this period. In addition, the Fund, as a shareholder in the underlying Fidelity Central Funds, will indirectly bear its pro-rata share of the fees and expenses incurred by the underlying Fidelity Central Funds. These fees and expenses are not included in the Fund's annualized expense ratio used to calculate the expense estimate in the table below.
Hypothetical Example for Comparison Purposes
The second line of the accompanying table provides information about hypothetical account values and hypothetical expenses based on the Fund's actual expense ratio and an assumed rate of return of 5% per year before expenses, which is not the Fund's actual return. The hypothetical account values and expenses may not be used to estimate the actual ending account balance or expenses you paid for the period. You may use this information to compare the ongoing costs of investing in the Fund and other funds. To do so, compare this 5% hypothetical example with the 5% hypothetical examples that appear in the shareholder reports of the other funds. In addition, the Fund, as a shareholder in the underlying Fidelity Central Funds, will indirectly bear its pro-rata share of the fees and expenses incurred by the underlying Fidelity Central Funds. These fees and expenses are not included in the Fund's annualized expense ratio used to calculate the expense estimate in the table below.
Please note that the expenses shown in the table are meant to highlight your ongoing costs only and do not reflect any transaction costs. Therefore, the second line of the table is useful in comparing ongoing costs only, and will not help you determine the relative total costs of owning different funds.
| | Annualized Expense Ratio-A | Beginning
Account Value
February 1, 2018 | Ending
Account Value
July 31, 2018 | Expenses Paid
During Period-B
February 1, 2018
to July 31, 2018 |
| Series Small Cap Opportunities | - %-C | | | |
| Actual | | $1,000.00 | $1,066.90 | $--D |
| Hypothetical-E | | $1,000.00 | $1,024.79 | $--D |
A Annualized expense ratio reflects expenses net of applicable fee waivers.
B Expenses are equal to the Fund's annualized expense ratio, multiplied by the average account value over the period, multiplied by 181/365 (to reflect the one-half year period).
C Amount represents less than .005%.
D Amount represents less than $.005.
E 5% return per year before expenses
Distributions (Unaudited)
The Board of Trustees of Fidelity Series Small Cap Opportunities Fund voted to pay on September 17, 2018, to shareholders of record at the opening of business on September 14, 2018, a distribution of $1.156 per share derived from capital gains realized from sales of portfolio securities and a dividend of $0.072 per share from net investment income.
The fund hereby designates as a capital gain dividend with respect to the taxable year ended July 31, 2018, $ 500,836,983, or, if subsequently determined to be different, the net capital gain of such year.
The fund designates 100% and 74% of the dividends distributed in September and December, respectively during the fiscal year as qualifying for the dividends–received deduction for corporate shareholders.
The fund designates 100% and 82% of the dividends distributed in September and December, respectively during the fiscal year as amounts which may be taken into account as a dividend for the purposes of the maximum rate under section 1(h)(11) of the Internal Revenue Code.
The fund will notify shareholders in January 2019 of amounts for use in preparing 2018 income tax returns.
Board Approval of Investment Advisory Contracts
Fidelity Series Small Cap Opportunities Fund
At its July 2018 meeting, the Board of Trustees, including the Independent Trustees (together, the Board), voted to continue the management contract with Fidelity Management & Research Company (FMR) and the sub-advisory agreements (together, the Advisory Contracts) for the fund for six months through January 31, 2019, in connection with the reunification of the Fidelity Equity High Income Funds Board, which oversees the fund, and the Sector Portfolios Board.
The Board considered that the approval of the fund's Advisory Contracts will not result in any changes in (i) the investment process or strategies employed in the management of the fund's assets; (ii) the fees and expenses paid by shareholders, including the expense cap arrangement currently in place for the fund; (iii) the nature, extent or quality of services provided under the fund's Advisory Contracts; or (iv) the day-to-day management of the fund or the persons primarily responsible for such management. The Board concluded that the fund's Advisory Contracts are fair and reasonable, and that the fund's Advisory Contracts should be renewed, without modification, through January 31, 2019, with the understanding that the Board will consider the annual renewal for a full one year period in January 2019.
In connection with its consideration of future renewals of the fund's Advisory Contracts, the Board will consider: (i) the nature, extent and quality of services provided to the fund, including shareholder and administrative services and investment performance; (ii) the competitiveness of the management fee and total expenses for the fund; (iii) the costs of the services and profitability, including the revenues earned and the expenses incurred in conducting the business of developing, marketing, distributing, managing, administering, and servicing the fund and its shareholders, to the extent applicable, as well as potential fall-out benefits from Fidelity's non-fund businesses; and (iv) whether there have been economies of scale in respect of the Fidelity funds, whether the Fidelity funds (including the fund) have appropriately benefited from any such economies of scale, and whether there is the potential for realization of any further economies.
Based on its evaluation of all of the conclusions noted above, and after considering all factors it believed relevant, the Board ultimately concluded that the fund's management fee structure is fair and reasonable, and that the continuation of the fund's Advisory Contracts should be approved.
Corporate Headquarters
245 Summer St.
Boston, MA 02210
www.fidelity.com
SMO-ANN-0918
1.839807.111
Fidelity Advisor® Real Estate Income Fund - Class A, Class M, Class C and Class I
Annual Report July 31, 2018 Class A, Class M, Class C and Class I are classes of Fidelity® Real Estate Income Fund |
|
Contents
To view a fund's proxy voting guidelines and proxy voting record for the 12-month period ended June 30, visit http://www.fidelity.com/proxyvotingresults or visit the Securities and Exchange Commission's (SEC) web site at http://www.sec.gov.
You may also call 1-877-208-0098 to request a free copy of the proxy voting guidelines.
Standard & Poor's, S&P and S&P 500 are registered service marks of The McGraw-Hill Companies, Inc. and have been licensed for use by Fidelity Distributors Corporation.
Other third-party marks appearing herein are the property of their respective owners.
All other marks appearing herein are registered or unregistered trademarks or service marks of FMR LLC or an affiliated company. © 2018 FMR LLC. All rights reserved.
This report and the financial statements contained herein are submitted for the general information of the shareholders of the Fund. This report is not authorized for distribution to prospective investors in the Fund unless preceded or accompanied by an effective prospectus.
A fund files its complete schedule of portfolio holdings with the SEC for the first and third quarters of each fiscal year on Form N-Q. Forms N-Q are available on the SEC’s web site at http://www.sec.gov. A fund's Forms N-Q may be reviewed and copied at the SEC’s Public Reference Room in Washington, DC. Information regarding the operation of the SEC's Public Reference Room may be obtained by calling 1-800-SEC-0330.
For a complete list of a fund's portfolio holdings, view the most recent holdings listing, semiannual report, or annual report on Fidelity's web site at http://www.fidelity.com, http://www.institutional.fidelity.com, or http://www.401k.com, as applicable.
NOT FDIC INSURED •MAY LOSE VALUE •NO BANK GUARANTEE
Neither the Fund nor Fidelity Distributors Corporation is a bank.
Performance: The Bottom Line
Average annual total return reflects the change in the value of an investment, assuming reinvestment of distributions from dividend income and capital gains (the profits earned upon the sale of securities that have grown in value, if any) and assuming a constant rate of performance each year. The hypothetical investment and the average annual total returns do not reflect the deduction of taxes that a shareholder would pay on fund distributions or the redemption of fund shares. During periods of reimbursement by Fidelity, a fund’s total return will be greater than it would be had the reimbursement not occurred. How a fund did yesterday is no guarantee of how it will do tomorrow.
Average Annual Total Returns
| For the periods ended July 31, 2018 | Past 1 year | Past 5 years | Past 10 years |
| Class A (incl. 4.00% sales charge) | (1.96)% | 5.42% | 8.01% |
| Class M (incl. 4.00% sales charge) | (1.98)% | 5.39% | 7.99% |
| Class C (incl. contingent deferred sales charge) | 0.34% | 5.48% | 7.78% |
| Class I | 2.41% | 6.57% | 8.69% |
Class A shares bear a 0.25% 12b-1 fee. The initial offering of Class A shares took place on April 14, 2010. Returns prior to April 14, 2010, are those of Fidelity® Real Estate Income Fund, the original class of the fund, which has no 12b-1 fee. Had Class A's 12b-1 fee been reflected, returns prior to April 14, 2010, would have been lower.
Class M shares bear a 0.25% 12b-1 fee. The initial offering of Class M shares took place on April 14, 2010. Returns prior to April 14, 2010, are those of Fidelity® Real Estate Income Fund, the original class of the fund, which has no 12b-1 fee. Had Class M's 12b-1 fee been reflected, returns prior to April 14, 2010, would have been lower.
Class C shares bear a 1.00% 12b-1 fee. The initial offering of Class C shares took place on April 14, 2010. Returns prior to April 14, 2010, are those of Fidelity® Real Estate Income Fund, the original class of the fund, which has no 12b-1 fee. Had Class C's 12b-1 fee been reflected, returns prior to April 14, 2010, would have been lower.
Class C shares' contingent deferred sales charges included in the past one year, past five years and past ten years total return figures are 1%, 0% and 0%, respectively.
The initial offering of Class I shares took place on April 14, 2010. Returns prior to April 14, 2010 are those of Fidelity® Real Estate Income Fund, the original class of the fund.
$10,000 Over 10 Years
Let's say hypothetically that $10,000 was invested in Fidelity Advisor® Real Estate Income Fund - Class A on July 31, 2008, and the current 4.00% sales charge was paid.
The chart shows how the value of your investment would have changed, and also shows how the S&P 500® Index performed over the same period.
See previous page for additional information regarding the performance of Class A.

| Period Ending Values |
| $21,618 | Fidelity Advisor® Real Estate Income Fund - Class A |
| $27,551 | S&P 500® Index |
Management's Discussion of Fund Performance
Market Recap: For the 12 months ending July 31, 2018, commercial real estate continued to benefit from a generally solid fundamental backdrop, with gently rising cash flows due to increasing rents and stable-to-rising occupancy rates. Certain markets, however, saw a modest pick-up in new supply, which slowed rental-income growth. For real estate investment trust (REIT) common stocks, it was an up-and-down period. U.S. REITs corrected sharply in late 2017 and the first two months of 2018 before enjoying a strong upward trend through the end of July. Higher interest rates also posed a headwind for U.S. REITs, as income-seeking investors perceived a correlation between the two. Against this backdrop, REIT common stocks, as measured by the FTSE
® NAREIT
® All REITs Index, gained 4.35%. In comparison, the S&P 500
® index, a measure of the broad U.S. stock market, rose 16.24%. Meanwhile, higher interest rates slowed more rate-sensitive asset types, such as real estate preferred stocks and bonds. The past 12 months, real estate preferreds gained 1.76%, as measured by the MSCI REIT Preferred Index, while the ICE BofAML
® US Real Estate Index – a market-capitalization-weighted measure of investment-grade corporate debt in the domestic real estate sector – returned -0.39%. In aggregate, real estate bonds continued to benefit from issuers’ strong credit quality, even as higher rates weighed on the securities’ prices.
Comments from Portfolio Manager Mark Snyderman: For the fiscal year, the fund's share classes (excluding sales charges, if applicable) returned roughly 1% to 2%, with all but one outpacing the 1.49% return of the Fidelity Real Estate Income Composite Index. The Composite index℠ is a 40/40/20 blend of the MSCI REIT Preferred Index, the ICE BofAML
® US Real Estate Index and FTSE
® NAREIT
® All REITs Index. I was mildly disappointed with the fund's performance, given my goal of generating a long-term annualized return in the mid-to-upper-single digits. On the positive side, however, I'm pleased with how the fund's real estate bond and preferred stocks did, given rising interest rates. Our portfolio of commercial mortgage-backed securities (CMBS) gained 5%, while our high-yield real estate bonds rose 4% and our investment-grade debt had a roughly flat result – all outperforming the ICE BofAML real estate bond index. Meanwhile, our preferred stock portfolio gained 5%, outperforming the MSCI preferred stock index. I was happy with the performance of these asset classes because of my regular focus on managing the fund's interest rate risk. In contrast, several of our common stock holdings underperformed this period, led by a poor-performing position in Colony NorthStar that, in hindsight, was a mistake because the company's businesses haven't been as strong as I expected. Overall, our common stock portfolio produced a slightly positive return, compared with a 4.35% increase for the FTSE NAREIT index.
The views expressed above reflect those of the portfolio manager(s) only through the end of the period as stated on the cover of this report and do not necessarily represent the views of Fidelity or any other person in the Fidelity organization. Any such views are subject to change at any time based upon market or other conditions and Fidelity disclaims any responsibility to update such views. These views may not be relied on as investment advice and, because investment decisions for a Fidelity fund are based on numerous factors, may not be relied on as an indication of trading intent on behalf of any Fidelity fund.
Investment Summary (Unaudited)
Top Five Stocks as of July 31, 2018
| | % of fund's net assets |
| Equity Lifestyle Properties, Inc. | 2.9 |
| Apartment Investment & Management Co. Class A | 2.4 |
| Acadia Realty Trust (SBI) | 2.2 |
| Ventas, Inc. | 2.1 |
| MFA Financial, Inc. | 2.0 |
| | 11.6 |
Top 5 Bonds as of July 31, 2018
| | % of fund's net assets |
| Senior Housing Properties Trust 4.75% 5/1/24 | 0.9 |
| RWT Holdings, Inc. 5.625% 11/15/19 | 0.7 |
| PennyMac Corp. 5.375% 5/1/20 | 0.7 |
| Kennedy-Wilson, Inc. 5.875% 4/1/24 | 0.7 |
| GS Mortgage Securities Trust Series 2016-REMZ Class MZB, 7.727% 2/10/21 | 0.6 |
| | 3.6 |
Top Five REIT Sectors as of July 31, 2018
| | % of fund's net assets |
| REITs - Mortgage | 16.5 |
| REITs - Health Care | 8.3 |
| REITs - Apartments | 7.4 |
| REITs - Diversified | 6.6 |
| REITs - Shopping Centers | 4.0 |
Asset Allocation (% of fund's net assets)
| As of July 31, 2018* |
| | Common Stocks | 31.9% |
| | Preferred Stocks | 17.1% |
| | Bonds | 33.6% |
| | Convertible Securities | 6.0% |
| | Other Investments | 4.6% |
| | Short-Term Investments and Net Other Assets (Liabilities) | 6.8% |

* Foreign investments - 2.0%
Schedule of Investments July 31, 2018
Showing Percentage of Net Assets
| Common Stocks - 31.9% | | | |
| | | Shares | Value |
| CONSUMER DISCRETIONARY - 0.5% | | | |
| Hotels, Restaurants & Leisure - 0.5% | | | |
| Wyndham Destinations, Inc. | | 271,200 | $12,507,744 |
| Wyndham Hotels & Resorts, Inc. | | 191,100 | 11,083,800 |
| | | | 23,591,544 |
| FINANCIALS - 5.0% | | | |
| Capital Markets - 1.1% | | | |
| Brookfield Asset Management, Inc. Class A | | 674,100 | 28,443,978 |
| Ellington Financial LLC (a) | | 1,635,484 | 26,952,776 |
| | | | 55,396,754 |
| Insurance - 0.1% | | | |
| FNF Group | | 188,500 | 7,634,250 |
| Mortgage Real Estate Investment Trusts - 3.8% | | | |
| Anworth Mortgage Asset Corp. | | 371,436 | 1,872,037 |
| Chimera Investment Corp. | | 1,383,600 | 26,426,760 |
| Dynex Capital, Inc. | | 1,315,663 | 8,749,159 |
| Ellington Residential Mortgage REIT (b) | | 350,300 | 3,923,360 |
| Great Ajax Corp. (a) | | 1,577,762 | 21,094,678 |
| Hunt Companies Finance Trust I (b) | | 547,901 | 1,835,468 |
| Invesco Mortgage Capital, Inc. | | 1,130,349 | 18,752,490 |
| MFA Financial, Inc. | | 12,785,422 | 102,922,647 |
| New Residential Investment Corp. | | 154,000 | 2,755,060 |
| Redwood Trust, Inc. | | 647,900 | 10,891,199 |
| | | | 199,222,858 |
|
| TOTAL FINANCIALS | | | 262,253,862 |
|
| REAL ESTATE - 26.4% | | | |
| Equity Real Estate Investment Trusts (REITs) - 25.9% | | | |
| Acadia Realty Trust (SBI) (a) | | 4,365,249 | 118,210,943 |
| American Homes 4 Rent Class A | | 948,722 | 21,004,705 |
| American Tower Corp. | | 654,300 | 96,993,432 |
| Apartment Investment & Management Co. Class A | | 2,927,796 | 124,870,499 |
| AvalonBay Communities, Inc. | | 192,200 | 33,990,570 |
| Boardwalk (REIT) (b) | | 256,500 | 9,022,900 |
| Brixmor Property Group, Inc. | | 308,200 | 5,452,058 |
| Cedar Realty Trust, Inc. | | 299,963 | 1,427,824 |
| Colony NorthStar, Inc. | | 8,369,748 | 51,557,648 |
| Crown Castle International Corp. | | 133,100 | 14,751,473 |
| DDR Corp. | | 1,379,550 | 18,899,835 |
| Equinix, Inc. | | 151,600 | 66,594,848 |
| Equity Lifestyle Properties, Inc. | | 1,671,802 | 152,117,257 |
| Equity Residential (SBI) | | 895,203 | 58,573,132 |
| Extra Space Storage, Inc. | | 88,800 | 8,344,536 |
| Gramercy Property Trust | | 632,447 | 17,322,723 |
| Healthcare Realty Trust, Inc. | | 431,300 | 12,813,923 |
| Healthcare Trust of America, Inc. | | 1,158,860 | 31,660,055 |
| Lexington Corporate Properties Trust | | 4,316,674 | 37,943,564 |
| Mid-America Apartment Communities, Inc. | | 847,806 | 85,441,889 |
| Omega Healthcare Investors, Inc. (b) | | 1,021,123 | 30,317,142 |
| Public Storage | | 168,491 | 36,702,395 |
| Rexford Industrial Realty, Inc. | | 307,400 | 9,418,736 |
| Sabra Health Care REIT, Inc. | | 2,698,275 | 58,309,723 |
| Safety Income and Growth, Inc. | | 393,600 | 7,006,080 |
| Senior Housing Properties Trust (SBI) | | 2,539,000 | 45,295,760 |
| Spirit MTA REIT | | 120,120 | 1,199,999 |
| Spirit Realty Capital, Inc. | | 1,201,200 | 10,054,044 |
| Store Capital Corp. | | 1,007,100 | 27,644,895 |
| Terreno Realty Corp. | | 503,628 | 18,588,909 |
| Ventas, Inc. | | 1,940,686 | 109,415,877 |
| VEREIT, Inc. | | 2,775,234 | 21,175,035 |
| Welltower, Inc. | | 343,974 | 21,532,772 |
| | | | 1,363,655,181 |
| Real Estate Management & Development - 0.5% | | | |
| Colony NorthStar Credit Real Estate, Inc. (b) | | 963,071 | 20,474,889 |
| Retail Value, Inc. (c) | | 137,955 | 4,558,033 |
| | | | 25,032,922 |
|
| TOTAL REAL ESTATE | | | 1,388,688,103 |
|
| TOTAL COMMON STOCKS | | | |
| (Cost $1,442,302,243) | | | 1,674,533,509 |
|
| Preferred Stocks - 18.6% | | | |
| Convertible Preferred Stocks - 1.5% | | | |
| FINANCIALS - 0.3% | | | |
| Mortgage Real Estate Investment Trusts - 0.3% | | | |
| Great Ajax Corp. 7.25% | | 281,000 | 6,982,400 |
| Sutherland Asset Management Corp. 7.00% | | 404,700 | 10,643,610 |
| | | | 17,626,010 |
| REAL ESTATE - 1.2% | | | |
| Equity Real Estate Investment Trusts (REITs) - 1.1% | | | |
| Alexandria Real Estate Equities, Inc. Series D, 7.00% | | 136,759 | 4,778,305 |
| Braemar Hotels & Resorts, Inc. 5.50% | | 95,791 | 1,829,608 |
| Equity Commonwealth 6.50% | | 31,237 | 810,319 |
| iStar Financial, Inc. Series J, 4.50% | | 213,773 | 10,047,630 |
| Lexington Corporate Properties Trust Series C, 6.50% | | 468,142 | 22,933,808 |
| QTS Realty Trust, Inc. 6.50% (c) | | 42,000 | 4,444,440 |
| RLJ Lodging Trust Series A, 1.95% | | 31,935 | 841,487 |
| Wheeler REIT, Inc. 8.75% | | 516,748 | 10,267,783 |
| | | | 55,953,380 |
| Real Estate Management & Development - 0.1% | | | |
| Landmark Infrastructure Partners LP 7.012% | | 191,800 | 4,420,990 |
| TOTAL REAL ESTATE | | | 60,374,370 |
|
| TOTAL CONVERTIBLE PREFERRED STOCKS | | | 78,000,380 |
|
| Nonconvertible Preferred Stocks - 17.1% | | | |
| ENERGY - 0.0% | | | |
| Oil, Gas & Consumable Fuels - 0.0% | | | |
| Global Partners LP 9.75% | | 120,000 | 3,000,000 |
| FINANCIALS - 8.0% | | | |
| Capital Markets - 0.1% | | | |
| Arlington Asset Investment Corp. 6.625% | | 182,517 | 4,451,097 |
| Mortgage Real Estate Investment Trusts - 7.8% | | | |
| AG Mortgage Investment Trust, Inc.: | | | |
| 8.00% | | 618,287 | 15,716,856 |
| 8.25% | | 38,935 | 1,001,408 |
| AGNC Investment Corp.: | | | |
| Series B, 7.75% | | 427,100 | 11,028,576 |
| Series C, 7.00% | | 361,900 | 9,379,109 |
| American Capital Mortgage Investment Corp. Series A, 8.125% | | 248,636 | 6,399,741 |
| Annaly Capital Management, Inc.: | | | |
| Series C, 7.625% | | 190,417 | 4,857,271 |
| Series D, 7.50% | | 621,976 | 15,816,850 |
| Series F, 6.95% | | 1,250,552 | 31,857,312 |
| Series G, 6.50% | | 720,300 | 17,481,681 |
| Anworth Mortgage Asset Corp. Series A, 8.625% | | 238,275 | 6,397,350 |
| Apollo Commercial Real Estate Finance, Inc. Series C, 8.00% | | 485,559 | 12,418,171 |
| Arbor Realty Trust, Inc.: | | | |
| Series A, 8.25% | | 189,089 | 4,906,860 |
| Series B, 7.75% | | 240,000 | 6,153,600 |
| Series C, 8.50% | | 100,000 | 2,642,000 |
| Armour Residential REIT, Inc. Series B, 7.875% | | 153,654 | 3,844,638 |
| Capstead Mortgage Corp. Series E, 7.50% | | 202,984 | 5,105,048 |
| Cherry Hill Mortgage Investment Corp. Series A, 8.20% | | 246,500 | 6,285,750 |
| Chimera Investment Corp.: | | | |
| Series A, 8.00% | | 204,800 | 5,267,456 |
| Series B, 8.00% | | 1,259,804 | 32,878,995 |
| CYS Investments, Inc.: | | | |
| Series A, 7.75% | | 118,428 | 2,965,437 |
| Series B, 7.50% | | 496,667 | 12,268,172 |
| Dynex Capital, Inc.: | | | |
| Series A, 8.50% | | 362,932 | 9,247,507 |
| Series B, 7.625% | | 252,120 | 6,214,758 |
| Exantas Capital Corp. 8.625% | | 168,316 | 4,285,309 |
| Hunt Companies Finance Trust I Series A, 8.75% | | 86,727 | 2,187,255 |
| Invesco Mortgage Capital, Inc.: | | | |
| 7.50% | | 1,244,215 | 31,105,375 |
| Series A, 7.75% | | 123,342 | 3,102,051 |
| Series B, 7.75% | | 856,479 | 22,299,630 |
| MFA Financial, Inc.: | | | |
| 8.00% | | 538,930 | 13,845,112 |
| Series B, 7.50% | | 616,232 | 15,597,448 |
| New York Mortgage Trust, Inc.: | | | |
| Series B, 7.75% | | 284,267 | 6,869,312 |
| Series C, 7.875% | | 280,725 | 6,830,039 |
| Series D, 8.00% | | 313,300 | 7,475,338 |
| PennyMac Mortgage Investment Trust: | | | |
| 8.125% | | 335,500 | 8,461,276 |
| Series B, 8.00% | | 593,631 | 14,977,310 |
| Two Harbors Investment Corp.: | | | |
| Series A, 8.125% | | 450,000 | 12,094,335 |
| Series B, 7.625% | | 618,504 | 15,808,962 |
| Series C, 7.25% | | 509,288 | 12,548,143 |
| Wells Fargo Real Estate Investment Corp. Series A, 6.375% | | 137,600 | 3,605,120 |
| | | | 411,226,561 |
| Real Estate Management & Development - 0.1% | | | |
| Brookfield Properties Corp. Series EE, 5.10% | | 264,300 | 5,122,038 |
| TOTAL FINANCIALS | | | 420,799,696 |
| REAL ESTATE - 9.0% | | | |
| Equity Real Estate Investment Trusts (REITs) - 8.9% | | | |
| American Homes 4 Rent: | | | |
| Series D, 6.50% | | 280,000 | 7,336,000 |
| Series E, 6.35% | | 210,000 | 5,451,621 |
| Series F, 5.875% | | 250,809 | 6,270,225 |
| Series G, 5.875% | | 202,000 | 4,995,460 |
| Ashford Hospitality Trust, Inc.: | | | |
| Series D, 8.45% | | 11,770 | 305,369 |
| Series F, 7.375% | | 268,000 | 6,463,946 |
| Series G, 7.375% | | 120,000 | 2,910,000 |
| Series H, 7.50% | | 168,800 | 4,137,474 |
| Series I, 7.50% | | 168,900 | 4,099,693 |
| Bluerock Residential Growth (REIT), Inc.: | | | |
| Series A, 8.25% | | 486,775 | 12,465,334 |
| Series C, 7.625% | | 146,969 | 3,624,285 |
| Series D, 7.125% | | 170,000 | 3,891,300 |
| Cedar Realty Trust, Inc.: | | | |
| Series B, 7.25% | | 97,922 | 2,446,092 |
| Series C, 6.50% | | 294,900 | 6,859,374 |
| City Office REIT, Inc. Series A, 6.625% | | 180,500 | 4,458,350 |
| Colony NorthStar, Inc.: | | | |
| Series B, 8.25% | | 207,861 | 5,352,421 |
| Series E, 8.75% | | 486,229 | 12,787,823 |
| Series G, 7.50% | | 195,730 | 4,728,837 |
| Series H, 7.125% | | 705,944 | 16,653,219 |
| Series I, 7.15% | | 797,130 | 18,597,043 |
| Series J, 7.15% | | 918,648 | 21,404,498 |
| DDR Corp.: | | | |
| Series J, 6.50% | | 340,721 | 8,463,510 |
| Series K, 6.25% | | 228,888 | 5,548,245 |
| Digital Realty Trust, Inc.: | | | |
| Series C, 6.625% | | 84,000 | 2,232,720 |
| Series G, 5.875% | | 40,444 | 1,022,020 |
| Series H, 7.375% | | 50,000 | 1,301,400 |
| Farmland Partners, Inc. Series B, 6.00% | | 630,200 | 14,614,338 |
| General Growth Properties, Inc. Series A, 6.375% | | 190,963 | 4,690,051 |
| Gladstone Commercial Corp. Series D, 7.00% | | 538,800 | 13,672,050 |
| Gladstone Land Corp. Series A, 6.375% | | 64,000 | 1,630,080 |
| Global Medical REIT, Inc. Series A, 7.50% | | 135,100 | 3,353,858 |
| Global Net Lease, Inc. Series A, 7.25% | | 509,800 | 12,903,446 |
| Government Properties Income Trust 5.875% | | 202,500 | 5,100,975 |
| Hersha Hospitality Trust: | | | |
| Series C, 6.875% | | 50,000 | 1,219,500 |
| Series D, 6.50% | | 200,000 | 4,624,000 |
| Investors Real Estate Trust Series C, 6.625% | | 320,900 | 7,947,506 |
| iStar Financial, Inc.: | | | |
| Series D, 8.00% | | 188,329 | 4,802,390 |
| Series G, 7.65% | | 222,721 | 5,576,934 |
| Series I, 7.50% | | 161,269 | 3,972,055 |
| Jernigan Capital, Inc. Series B, 7.00% | | 84,284 | 2,037,363 |
| LaSalle Hotel Properties: | | | |
| Series I, 6.375% | | 354,698 | 8,849,715 |
| Series J, 6.30% | | 240,000 | 6,048,000 |
| Monmouth Real Estate Investment Corp. Series C, 6.125% | | 225,900 | 5,512,773 |
| National Retail Properties, Inc. Series E, 5.70% | | 301,404 | 7,607,738 |
| National Storage Affiliates Trust Series A, 6.00% | | 67,600 | 1,688,648 |
| Pebblebrook Hotel Trust: | | | |
| Series C, 6.50% | | 204,321 | 5,142,514 |
| Series D, 6.375% | | 350,000 | 8,725,500 |
| Pennsylvania (REIT): | | | |
| Series B, 7.375% | | 100,510 | 2,466,515 |
| Series C, 7.20% | | 51,000 | 1,199,520 |
| Series D, 6.875% | | 151,800 | 3,427,644 |
| Plymouth Industrial REIT, Inc. Series A, 7.50% | | 169,400 | 4,217,891 |
| Prologis, Inc. Series Q, 8.54% | | 94,446 | 6,058,711 |
| Public Storage: | | | |
| Series F, 5.15% | | 173,400 | 4,303,788 |
| Series Y, 6.375% | | 102,224 | 2,641,468 |
| QTS Realty Trust, Inc. Series A, 7.125% | | 30,000 | 766,200 |
| RAIT Financial Trust: | | | |
| 7.125% | | 336,786 | 7,682,089 |
| 7.625% | | 224,590 | 4,395,226 |
| Rexford Industrial Realty, Inc.: | | | |
| Series A, 5.875% | | 135,000 | 3,324,038 |
| Series B, 5.875% | | 79,500 | 1,955,700 |
| Saul Centers, Inc.: | | | |
| Series C, 6.875% | | 183,479 | 4,586,975 |
| Series D, 6.125% | | 83,700 | 1,966,950 |
| Sotherly Hotels, Inc.: | | | |
| Series B, 8.00% | | 68,000 | 1,721,080 |
| Series C, 7.875% | | 108,200 | 2,708,571 |
| Spirit Realty Capital, Inc. Series A, 6.00% | | 95,200 | 2,239,409 |
| Stag Industrial, Inc. Series C, 6.875% | | 83,000 | 2,186,793 |
| Summit Hotel Properties, Inc.: | | | |
| Series D, 6.45% | | 210,000 | 5,105,100 |
| Series E, 6.25% | | 190,000 | 4,489,700 |
| Sunstone Hotel Investors, Inc.: | | | |
| Series E, 6.95% | | 42,000 | 1,094,310 |
| Series F, 6.45% | | 84,000 | 2,125,200 |
| Taubman Centers, Inc. Series K, 6.25% | | 157,322 | 3,925,184 |
| UMH Properties, Inc.: | | | |
| Series B, 8.00% | | 319,604 | 8,629,308 |
| Series C, 6.75% | | 341,140 | 8,825,292 |
| Series D, 6.375% | | 93,800 | 2,248,395 |
| Urstadt Biddle Properties, Inc.: | | | |
| Series G, 6.75% | | 160,000 | 4,016,000 |
| Series H, 6.25% | | 284,500 | 7,077,194 |
| VEREIT, Inc. Series F, 6.70% | | 1,959,376 | 49,885,713 |
| Washington Prime Group, Inc.: | | | |
| Series H, 7.50% | | 198,527 | 4,635,605 |
| Series I, 6.875% | | 298,115 | 6,278,302 |
| | | | 469,709,564 |
| Real Estate Management & Development - 0.1% | | | |
| Landmark Infrastructure Partners LP Series B, 7.90% | | 117,700 | 2,846,928 |
| TOTAL REAL ESTATE | | | 472,556,492 |
| UTILITIES - 0.1% | | | |
| Electric Utilities - 0.1% | | | |
| Brookfield Infrastructure Partners LP Series 5, 5.35% | | 169,300 | 3,364,266 |
|
| TOTAL NONCONVERTIBLE PREFERRED STOCKS | | | 899,720,454 |
|
| TOTAL PREFERRED STOCKS | | | |
| (Cost $960,623,563) | | | 977,720,834 |
| | | Principal Amount | Value |
|
| Corporate Bonds - 19.0% | | | |
| Convertible Bonds - 4.5% | | | |
| CONSUMER DISCRETIONARY - 0.1% | | | |
| Textiles, Apparel & Luxury Goods - 0.1% | | | |
| KKR Real Estate Finance Trust, Inc. 6.125% 5/15/23 unit (d) | | 8,100,000 | 8,104,050 |
| FINANCIALS - 4.4% | | | |
| Diversified Financial Services - 0.1% | | | |
| Granite Point Mortgage Trust, Inc. 5.625% 12/1/22 (d) | | 6,770,000 | 6,912,231 |
| Mortgage Real Estate Investment Trusts - 4.3% | | | |
| Arbor Realty Trust, Inc.: | | | |
| 5.25% 7/1/21 (d) | | 5,100,000 | 5,206,131 |
| 5.25% 7/1/21 (d) | | 6,710,000 | 6,589,904 |
| Blackstone Mortgage Trust, Inc.: | | | |
| 4.375% 5/5/22 | | 16,780,000 | 16,542,009 |
| 4.75% 3/15/23 | | 3,900,000 | 3,810,983 |
| Colony Financial, Inc.: | | | |
| 3.875% 1/15/21 | | 19,280,000 | 18,248,520 |
| 5% 4/15/23 | | 26,083,000 | 24,713,643 |
| Exantas Capital Corp.: | | | |
| 4.5% 8/15/22 | | 5,050,000 | 5,122,629 |
| 6% 12/1/18 | | 6,100,000 | 6,245,180 |
| 8% 1/15/20 | | 13,890,000 | 14,385,317 |
| PennyMac Corp. 5.375% 5/1/20 | | 35,606,000 | 35,609,454 |
| Redwood Trust, Inc. 5.625% 7/15/24 | | 11,710,000 | 11,527,020 |
| RWT Holdings, Inc. 5.625% 11/15/19 | | 36,880,000 | 37,292,134 |
| Starwood Property Trust, Inc. 4.375% 4/1/23 | | 11,080,000 | 11,119,412 |
| Two Harbors Investment Corp. 6.25% 1/15/22 | | 4,380,000 | 4,506,600 |
| Western Asset Mortgage Capital Corp. 6.75% 10/1/22 | | 21,100,000 | 21,745,386 |
| | | | 222,664,322 |
| TOTAL FINANCIALS | | | 229,576,553 |
|
| TOTAL CONVERTIBLE BONDS | | | 237,680,603 |
|
| Nonconvertible Bonds - 14.5% | | | |
| CONSUMER DISCRETIONARY - 3.4% | | | |
| Hotels, Restaurants & Leisure - 0.3% | | | |
| ESH Hospitality, Inc. 5.25% 5/1/25 (d) | | 8,040,000 | 7,798,800 |
| FelCor Lodging LP 6% 6/1/25 | | 2,025,000 | 2,070,563 |
| Times Square Hotel Trust 8.528% 8/1/26 (d) | | 6,483,409 | 7,478,827 |
| | | | 17,348,190 |
| Household Durables - 3.1% | | | |
| Ashton Woods U.S.A. LLC/Ashton Woods Finance Co.: | | | |
| 6.75% 8/1/25 (d) | | 14,772,000 | 13,830,285 |
| 6.875% 2/15/21 (d) | | 15,709,000 | 15,787,545 |
| Beazer Homes U.S.A., Inc.: | | | |
| 5.875% 10/15/27 | | 7,605,000 | 6,616,350 |
| 6.75% 3/15/25 | | 5,850,000 | 5,499,000 |
| 8.75% 3/15/22 | | 7,540,000 | 8,007,857 |
| Brookfield Residential Properties, Inc./Brookfield Residential U.S. Corp. 6.125% 7/1/22 (d) | | 5,495,000 | 5,522,475 |
| Brookfield Residential Properties, Inc.: | | | |
| 6.375% 5/15/25 (d) | | 5,580,000 | 5,552,100 |
| 6.5% 12/15/20 (d) | | 12,085,000 | 12,217,935 |
| KB Home 8% 3/15/20 | | 8,465,000 | 8,994,063 |
| LGI Homes, Inc. 6.875% 7/15/26 (d) | | 4,245,000 | 4,245,000 |
| M/I Homes, Inc.: | | | |
| 5.625% 8/1/25 | | 7,965,000 | 7,469,577 |
| 6.75% 1/15/21 | | 3,803,000 | 3,902,829 |
| Meritage Homes Corp.: | | | |
| 5.125% 6/6/27 | | 5,035,000 | 4,619,613 |
| 6% 6/1/25 | | 4,000,000 | 4,027,560 |
| 7% 4/1/22 | | 7,525,000 | 8,089,375 |
| 7.15% 4/15/20 | | 7,060,000 | 7,377,700 |
| New Home Co. LLC 7.25% 4/1/22 | | 9,200,000 | 9,436,072 |
| Taylor Morrison Communities, Inc./Monarch Communities, Inc. 5.875% 4/15/23 (d) | | 4,100,000 | 4,088,520 |
| TRI Pointe Homes, Inc.: | | | |
| 5.25% 6/1/27 | | 5,045,000 | 4,628,788 |
| 5.875% 6/15/24 | | 7,890,000 | 7,830,825 |
| William Lyon Homes, Inc.: | | | |
| 5.875% 1/31/25 | | 6,135,000 | 5,798,557 |
| 7% 8/15/22 | | 8,180,000 | 8,333,375 |
| | | | 161,875,401 |
| Media - 0.0% | | | |
| CBS Outdoor Americas Capital LLC/CBS Outdoor Americas Capital Corp. 5.625% 2/15/24 | | 1,300,000 | 1,311,037 |
| TOTAL CONSUMER DISCRETIONARY | | | 180,534,628 |
| CONSUMER STAPLES - 0.8% | | | |
| Food & Staples Retailing - 0.8% | | | |
| Ahold Lease U.S.A., Inc. 7.82% 1/2/20 | | 87,104 | 88,700 |
| Albertsons Companies LLC/Safeway, Inc./New Albertson's, Inc./Albertson's LLC: | | | |
| 5.75% 3/15/25 | | 17,225,000 | 15,469,428 |
| 6.625% 6/15/24 | | 10,760,000 | 10,302,700 |
| Albertsons, Inc. 8.7% 5/1/30 | | 5,080,000 | 4,394,200 |
| C&S Group Enterprises LLC 5.375% 7/15/22 (d) | | 9,705,000 | 9,620,081 |
| Cumberland Farms, Inc. 6.75% 5/1/25 (d) | | 2,075,000 | 2,087,969 |
| | | | 41,963,078 |
| FINANCIALS - 0.6% | | | |
| Diversified Financial Services - 0.6% | | | |
| Brixmor Operating Partnership LP: | | | |
| 3.65% 6/15/24 | | 6,000,000 | 5,774,001 |
| 3.85% 2/1/25 | | 8,384,000 | 8,086,364 |
| Five Point Operation Co. LP 7.875% 11/15/25 (d) | | 11,025,000 | 11,190,375 |
| Icahn Enterprises LP/Icahn Enterprises Finance Corp.: | | | |
| 5.875% 2/1/22 | | 3,680,000 | 3,703,000 |
| 6.25% 2/1/22 | | 1,695,000 | 1,727,832 |
| | | | 30,481,572 |
| Mortgage Real Estate Investment Trusts - 0.0% | | | |
| Starwood Property Trust, Inc. 4.75% 3/15/25 (d) | | 4,235,000 | 4,182,063 |
| TOTAL FINANCIALS | | | 34,663,635 |
| HEALTH CARE - 0.5% | | | |
| Health Care Providers & Services - 0.5% | | | |
| QCP SNF West (REIT) LLC 8.125% 11/1/23 (d) | | 6,245,000 | 6,791,438 |
| Sabra Health Care LP/Sabra Capital Corp.: | | | |
| 5.375% 6/1/23 | | 5,675,000 | 5,689,188 |
| 5.5% 2/1/21 | | 12,305,000 | 12,474,194 |
| | | | 24,954,820 |
| INDUSTRIALS - 0.2% | | | |
| Building Products - 0.2% | | | |
| Shea Homes Ltd. Partnership/Corp. 6.125% 4/1/25 (d) | | 8,900,000 | 8,811,000 |
| INFORMATION TECHNOLOGY - 0.1% | | | |
| Internet Software & Services - 0.1% | | | |
| CyrusOne LP/CyrusOne Finance Corp. 5% 3/15/24 | | 3,610,000 | 3,623,538 |
| REAL ESTATE - 8.9% | | | |
| Equity Real Estate Investment Trusts (REITs) - 6.5% | | | |
| ARC Properties Operating Partnership LP 4.6% 2/6/24 | | 10,480,000 | 10,493,058 |
| Care Capital Properties LP 5.125% 8/15/26 | | 20,493,000 | 19,668,970 |
| CBL & Associates LP: | | | |
| 4.6% 10/15/24 | | 26,758,000 | 22,297,602 |
| 5.25% 12/1/23 | | 11,500,000 | 10,175,564 |
| 5.95% 12/15/26 | | 10,434,000 | 8,992,511 |
| CTR Partnership LP/CareTrust Capital Corp. 5.25% 6/1/25 | | 7,577,000 | 7,368,633 |
| DDR Corp.: | | | |
| 3.625% 2/1/25 | | 5,551,000 | 5,263,863 |
| 4.625% 7/15/22 | | 2,096,000 | 2,145,959 |
| Equinix, Inc. 5.375% 5/15/27 | | 6,620,000 | 6,669,650 |
| HCP, Inc.: | | | |
| 4% 6/1/25 | | 1,000,000 | 977,198 |
| 4.25% 11/15/23 | | 1,707,000 | 1,712,959 |
| Healthcare Realty Trust, Inc. 3.75% 4/15/23 | | 966,000 | 946,203 |
| Healthcare Trust of America Holdings LP 3.75% 7/1/27 | | 8,395,000 | 7,928,594 |
| Hospitality Properties Trust 5% 8/15/22 | | 3,177,000 | 3,271,045 |
| iStar Financial, Inc.: | | �� | |
| 4.625% 9/15/20 | | 6,755,000 | 6,695,894 |
| 5% 7/1/19 | | 15,659,000 | 15,672,702 |
| 5.25% 9/15/22 | | 4,220,000 | 4,114,500 |
| 6% 4/1/22 | | 8,375,000 | 8,364,531 |
| Lexington Corporate Properties Trust 4.4% 6/15/24 | | 2,180,000 | 2,143,624 |
| MPT Operating Partnership LP/MPT Finance Corp.: | | | |
| 5% 10/15/27 | | 6,145,000 | 5,945,288 |
| 5.25% 8/1/26 | | 7,700,000 | 7,584,500 |
| 6.375% 3/1/24 | | 4,000,000 | 4,200,000 |
| National Retail Properties, Inc. 3.5% 10/15/27 | | 3,421,000 | 3,198,440 |
| Omega Healthcare Investors, Inc.: | | | |
| 4.375% 8/1/23 | | 3,303,000 | 3,278,308 |
| 4.5% 4/1/27 | | 2,462,000 | 2,347,920 |
| 4.75% 1/15/28 | | 12,204,000 | 11,793,667 |
| 4.95% 4/1/24 | | 2,898,000 | 2,930,549 |
| Regency Centers LP 3.6% 2/1/27 | | 2,558,000 | 2,430,722 |
| SBA Communications Corp. 4% 10/1/22 | | 5,535,000 | 5,356,884 |
| Select Income REIT: | | | |
| 4.15% 2/1/22 | | 11,170,000 | 11,087,305 |
| 4.25% 5/15/24 | | 5,030,000 | 4,812,343 |
| 4.5% 2/1/25 | | 21,294,000 | 20,611,565 |
| Senior Housing Properties Trust: | | | |
| 3.25% 5/1/19 | | 7,382,000 | 7,385,737 |
| 4.75% 5/1/24 | | 44,895,000 | 44,739,280 |
| 4.75% 2/15/28 | | 1,000,000 | 971,357 |
| 6.75% 4/15/20 | | 13,624,000 | 14,074,623 |
| 6.75% 12/15/21 | | 8,000,000 | 8,541,651 |
| VEREIT Operating Partnership LP 4.875% 6/1/26 | | 10,945,000 | 10,958,318 |
| WP Carey, Inc.: | | | |
| 4% 2/1/25 | | 6,985,000 | 6,763,592 |
| 4.25% 10/1/26 | | 7,242,000 | 7,062,213 |
| 4.6% 4/1/24 | | 11,323,000 | 11,423,339 |
| | | | 342,400,661 |
| Real Estate Management & Development - 2.4% | | | |
| Greystar Real Estate Partners 5.75% 12/1/25 (d) | | 7,625,000 | 7,396,250 |
| Howard Hughes Corp. 5.375% 3/15/25 (d) | | 26,067,000 | 25,513,076 |
| Kennedy-Wilson, Inc.: | | | |
| 5.875% 4/1/24 | | 34,760,000 | 33,891,000 |
| 5.875% 4/1/24 (d) | | 7,755,000 | 7,561,125 |
| Mattamy Group Corp.: | | | |
| 6.5% 10/1/25 (d) | | 11,595,000 | 11,305,125 |
| 6.875% 12/15/23 (d) | | 5,425,000 | 5,513,156 |
| Mid-America Apartments LP: | | | |
| 3.75% 6/15/24 | | 1,663,000 | 1,633,352 |
| 4.3% 10/15/23 | | 2,203,000 | 2,234,978 |
| Taylor Morrison Communities, Inc./Monarch Communities, Inc.: | | | |
| 5.25% 4/15/21 (d) | | 2,803,000 | 2,800,281 |
| 5.625% 3/1/24 (d) | | 7,045,000 | 6,853,376 |
| Washington Prime Group LP 5.95% 8/15/24 | | 21,080,000 | 20,819,049 |
| | | | 125,520,768 |
| TOTAL REAL ESTATE | | | 467,921,429 |
|
| TOTAL NONCONVERTIBLE BONDS | | | 762,472,128 |
|
| TOTAL CORPORATE BONDS | | | |
| (Cost $1,005,994,748) | | | 1,000,152,731 |
|
| Asset-Backed Securities - 2.5% | | | |
| American Homes 4 Rent: | | | |
| Series 2014-SFR2 Class E, 6.231% 10/17/36 (d) | | 3,000,000 | 3,281,031 |
| Series 2014-SFR3 Class E, 6.418% 12/17/36 (d) | | 9,025,000 | 9,984,533 |
| Series 2015-SFR1: | | | |
| Class E, 5.639% 4/17/52 (d) | | 1,999,310 | 2,119,998 |
| Class F, 5.885% 4/17/52 (d) | | 2,000,000 | 2,119,182 |
| Series 2015-SFR2: | | | |
| Class E, 6.07% 10/17/45 (d) | | 8,259,000 | 8,975,475 |
| Class XS, 0% 10/17/45 (d)(e)(f) | | 4,750,211 | 48 |
| Capital Trust RE CDO Ltd. Series 2005-1A Class D, 1 month U.S. LIBOR + 1.500% 3.5863% 3/20/50 (d)(e)(g)(h) | | 2,250,000 | 225 |
| Colony Starwood Homes Series 2016-2A Class F, 1 month U.S. LIBOR + 4.150% 6.2233% 12/17/33 (d)(e)(h) | | 1,500,000 | 1,548,534 |
| Conseco Finance Securitizations Corp. Series 2002-2 Class M2, 9.163% 3/1/33 | | 446,354 | 410,043 |
| Deutsche Financial Capital Securitization LLC Series 1997-I Class M, 7.275% 9/15/27 | | 2,078,169 | 2,118,456 |
| Green Tree Financial Corp.: | | | |
| Series 1996-4 Class M1, 7.75% 6/15/27 (e) | | 931,832 | 947,017 |
| Series 1997-3 Class M1, 7.53% 3/15/28 | | 6,165,103 | 6,154,087 |
| Home Partners of America Credit Trust Series 2017-1 Class F, 1 month U.S. LIBOR + 3.539% 5.6241% 7/17/34 (d)(e)(h) | | 6,318,500 | 6,360,901 |
| Home Partners of America Trust: | | | |
| Series 2016-2 Class F, 1 month U.S. LIBOR + 4.700% 6.7851% 10/17/33 (d)(e)(h) | | 3,393,000 | 3,424,427 |
| Series 2018-1 Class F, 1 month U.S. LIBOR + 2.350% 4.284% 7/17/37 (d)(e)(h) | | 3,896,000 | 3,901,418 |
| Invitation Homes Trust: | | | |
| Series 2017-SFR2 Class F, 1 month U.S. LIBOR + 3.000% 5.0851% 12/17/36 (d)(e)(h) | | 8,442,000 | 8,551,846 |
| Series 2018-SFR2 Class F, 1 month U.S. LIBOR + 2.250% 4.3216% 6/17/37 (d)(e)(h) | | 3,000,000 | 2,999,990 |
| Lehman ABS Manufactured Housing Contract Trust Series 2001-B Class M2, 7.17% 4/15/40 | | 762,408 | 535,439 |
| Merit Securities Corp. Series 13 Class M1, 7.9296% 12/28/33 (e) | | 1,854,289 | 1,908,208 |
| Progress Residential Trust: | | | |
| Series 2015-SFR3 Class F, 6.643% 11/12/32 (d) | | 2,940,000 | 3,048,054 |
| Series 2016-SFR1 Class F, 1 month U.S. LIBOR + 5.000% 7.0851% 9/17/33 (d)(e)(h) | | 8,459,000 | 8,494,659 |
| Series 2017-SFR1 Class F, 5.35% 8/17/34 (d) | | 3,073,000 | 3,122,910 |
| Series 2017-SFR2 Class F, 1 month U.S. LIBOR + 2.750% 4.836% 12/17/34 (d)(h) | | 2,568,000 | 2,567,541 |
| Series 2018-SFR2 Class F, 4.953% 8/17/35 (d) | | 3,402,000 | 3,398,811 |
| Starwood Waypoint Homes Trust Series 2017-1: | | | |
| Class E, 1 month U.S. LIBOR + 2.600% 4.6851% 1/17/35 (d)(e)(h) | | 5,906,000 | 5,941,647 |
| Class F, 1 month U.S. LIBOR + 3.400% 5.4851% 1/17/35 (d)(e)(h) | | 12,671,000 | 12,771,164 |
| Taberna Preferred Funding III Ltd. Series 2005-3A Class D, 3 month U.S. LIBOR + 2.650% 5.0131% 2/5/36 (d)(e)(g)(h) | | 4,358,340 | 327 |
| Tricon American Homes: | | | |
| Series 2017-SFR1 Class F, 5.151% 9/17/34 (d) | | 8,442,000 | 8,510,503 |
| Series 2017-SFR2 Class F, 5.104% 1/17/36 (d) | | 3,785,000 | 3,810,892 |
| Series 2018-SFR1 Class F, 4.96% 5/17/37 (d) | | 1,000,000 | 993,129 |
| Tricon American Homes Trust Series 2016-SFR1 Class F, 5.769% 11/17/33 (d) | | 2,544,000 | 2,607,930 |
| VB-S1 Issuer LLC: | | | |
| Series 2016-1A Class F, 6.901% 6/15/46 (d) | | 7,797,000 | 8,031,237 |
| Series 2018-1A Class F, 5.25% 2/15/48 (d) | | 1,354,000 | 1,353,573 |
| Wrightwood Capital Real Estate CDO Ltd. Series 2005-1A Class F, 3 month U.S. LIBOR + 1.950% 4.2813% 11/21/40 (d)(e)(h) | | 250,000 | 221,250 |
| TOTAL ASSET-BACKED SECURITIES | | | |
| (Cost $131,836,734) | | | 130,214,485 |
|
| Collateralized Mortgage Obligations - 0.2% | | | |
| Private Sponsor - 0.2% | | | |
| FREMF Mortgage Trust: | | | |
| Series 2010-K6 Class B, 5.5422% 12/25/46 (d)(e) | | 4,500,000 | 4,623,571 |
| Series 2010-K7 Class B, 5.6858% 4/25/20 (d)(e) | | 3,200,000 | 3,306,267 |
| RESI Finance LP/RESI Finance DE Corp. floater Series 2003-B Class B9, 1 month U.S. LIBOR + 11.950% 14.0363% 6/10/35 (d)(e)(h) | | 48,825 | 26,390 |
| RESIX Finance Ltd. floater: | | | |
| Series 2004-A Class B7, 1 month U.S. LIBOR + 4.250% 6.2962% 2/10/36 (d)(e)(g)(h) | | 14,817 | 200 |
| Series 2004-B Class B7, 1 month U.S. LIBOR + 4.000% 6.0464% 2/10/36 (d)(e)(g)(h) | | 8,789 | 63 |
|
| TOTAL PRIVATE SPONSOR | | | 7,956,491 |
|
| U.S. Government Agency - 0.0% | | | |
| Fannie Mae REMIC Trust: | | | |
| Series 2002-W1 subordinate REMIC pass thru certificates, Class 3B3, 3.7726% 2/25/42 (d)(e) | | 50,668 | 17,566 |
| Series 2003-W10 subordinate REMIC pass thru certificates, Class 2B3, 3.7153% 6/25/43 (d)(e) | | 86,035 | 40,557 |
|
| TOTAL U.S. GOVERNMENT AGENCY | | | 58,123 |
|
| TOTAL COLLATERALIZED MORTGAGE OBLIGATIONS | | | |
| (Cost $7,773,206) | | | 8,014,614 |
|
| Commercial Mortgage Securities - 16.4% | | | |
| Americold LLC Trust Series 2010-ARTA Class D, 7.443% 1/14/29 (d) | | 2,000,000 | 2,131,094 |
| BANK: | | | |
| Series 2017-BNK4 Class D, 3.357% 5/15/50 (d) | | 3,349,000 | 2,717,581 |
| Series 2018-BN12 Class D, 3% 5/15/61 (d) | | 1,701,000 | 1,303,366 |
| Barclays Commercial Mortgage Securities LLC Series 2015-STP: | | | |
| Class E, 4.4272% 9/10/28 (d)(e) | | 8,413,000 | 8,073,498 |
| Class F, 4.4272% 9/10/28 (d)(e) | | 4,074,000 | 3,746,545 |
| BX Trust Series 2017-IMC Class F, 1 month U.S. LIBOR + 4.250% 6.3233% 10/15/32 (d)(e)(h) | | 12,691,000 | 12,754,432 |
| CCRESG Commercial Mortgage Trust Series 2016-HEAT: | | | |
| Class E, 5.6712% 4/10/29 (d)(e) | | 4,536,000 | 4,548,728 |
| Class F, 5.6712% 4/10/29 (d)(e) | | 9,710,000 | 9,331,325 |
| CD Mortgage Trust Series 2017-CD3 Class D, 3.25% 2/10/50 (d) | | 3,391,000 | 2,813,410 |
| CGBAM Commercial Mortgage Trust Series 2015-SMRT Class F, 3.9121% 4/10/28 (d)(e) | | 9,911,000 | 9,808,275 |
| CGMS Commercial Mortgage Trust Series 2017-MDRB: | | | |
| Class D, 1 month U.S. LIBOR + 3.250% 5.3233% 7/15/30 (d)(e)(h) | | 5,000,000 | 4,989,318 |
| Class E, 1 month U.S. LIBOR + 3.872% 5.9431% 7/15/30 (d)(e)(h) | | 6,741,000 | 6,696,477 |
| Citigroup Commercial Mortgage Trust: | | | |
| Series 2013-GC15 Class D, 5.2749% 9/10/46 (d)(e) | | 5,254,000 | 5,167,173 |
| Series 2015-SHP2 Class E, 1 month U.S. LIBOR + 4.350% 6.4233% 7/15/27 (d)(e)(h) | | 2,933,000 | 2,951,082 |
| Series 2016-C3 Class D, 3% 11/15/49 (d) | | 7,089,000 | 5,446,837 |
| Series 2016-SMPL Class E, 4.509% 9/10/31 (d) | | 1,701,000 | 1,699,031 |
| COMM Mortgage Trust: | | | |
| sequential payer Series 2013-LC6 Class E, 3.5% 1/10/46 (d) | | 7,300,000 | 5,730,414 |
| Series 2012-CR1: | | | |
| Class C, 5.4983% 5/15/45 (e) | | 1,000,000 | 1,029,279 |
| Class D, 5.4983% 5/15/45 (d)(e) | | 5,550,000 | 5,543,487 |
| Class G, 2.462% 5/15/45 (d) | | 6,346,000 | 4,607,247 |
| Series 2012-CR5 Class D, 4.4638% 12/10/45 (d)(e) | | 2,000,000 | 1,923,350 |
| Series 2012-LC4: | | | |
| Class C, 5.7774% 12/10/44 (e) | | 2,000,000 | 1,986,373 |
| Class D, 5.7774% 12/10/44 (d)(e) | | 11,675,000 | 10,616,585 |
| Series 2013-CCRE6 Class E, 4.2031% 3/10/46 (d)(e) | | 882,000 | 715,281 |
| Series 2013-CR10 Class D, 4.9497% 8/10/46 (d)(e) | | 4,544,000 | 4,019,089 |
| Series 2013-CR12 Class D, 5.2474% 10/10/46 (d)(e) | | 4,500,000 | 3,868,104 |
| Series 2013-CR6 Class F, 4.2031% 3/10/46 (d)(e) | | 8,038,000 | 5,345,809 |
| Series 2013-CR9 Class D, 4.404% 7/10/45 (d)(e) | | 1,404,000 | 1,208,436 |
| Series 2013-LC6 Class D, 4.4414% 1/10/46 (d)(e) | | 8,301,000 | 7,890,164 |
| Series 2014-CR17: | | | |
| Class D, 4.9615% 5/10/47 (d)(e) | | 2,500,000 | 2,233,265 |
| Class E, 4.9615% 5/10/47 (d)(e) | | 3,098,000 | 2,487,488 |
| Series 2014-UBS2 Class D, 5.0145% 3/10/47 (d)(e) | | 3,713,000 | 3,170,809 |
| Series 2016-CD1 Class D, 2.9043% 8/10/49 (d)(e) | | 9,452,000 | 7,622,109 |
| Series 2017-CD4 Class D, 3.3% 5/10/50 (d) | | 2,800,000 | 2,304,489 |
| COMM Trust Series 2017-COR2 Class D, 3% 9/10/50 (d) | | 2,800,000 | 2,299,327 |
| Commercial Mortgage Trust pass-thru certificates Series 2012-CR2: | | | |
| Class D, 4.9926% 8/15/45 (d)(e) | | 4,500,000 | 4,419,294 |
| Class E, 4.9926% 8/15/45 (d)(e) | | 8,000,000 | 7,648,614 |
| Core Industrial Trust: | | | |
| Series 2015-TEXW Class F, 3.977% 2/10/34 (d)(e) | | 10,945,000 | 10,505,523 |
| Series 2015-WEST Class F, 4.3677% 2/10/37 (d)(e) | | 12,745,000 | 12,202,615 |
| CSAIL Commercial Mortgage Trust: | | | |
| Series 2017-C8 Class D, 4.47% 6/15/50 (d) | | 4,346,000 | 3,808,395 |
| Series 2017-CX10 Class UESD, 4.3778% 10/15/32 (d)(e) | | 5,076,000 | 4,892,543 |
| Series 2017-CX9 Class D, 4.2977% 9/15/50 (d)(e) | | 2,568,000 | 2,131,844 |
| CSMC Trust Series 2016-MFF Class F, 1 month U.S. LIBOR + 7.250% 9.3216% 11/15/33 (d)(e)(h) | | 6,300,000 | 6,358,788 |
| DBCCRE Mortgage Trust Series 2014-ARCP: | | | |
| Class D, 4.9345% 1/10/34 (d)(e) | | 1,000,000 | 978,837 |
| Class E, 5.099% 1/10/34 (d)(e) | | 10,853,000 | 10,336,724 |
| DBUBS Mortgage Trust: | | | |
| Series 2011-LC1A: | | | |
| Class E, 5.8842% 11/10/46 (d)(e) | | 14,031,000 | 14,484,420 |
| Class G, 4.652% 11/10/46 (d) | | 12,360,000 | 11,118,209 |
| Series 2011-LC3A Class D, 5.5154% 8/10/44 (d)(e) | | 3,945,000 | 4,053,618 |
| Freddie Mac: | | | |
| pass-thru certificates: | | | |
| Series K011 Class X3, 2.577% 12/25/43 (e)(f) | | 12,206,096 | 699,192 |
| Series K012 Class X3, 2.3288% 1/25/41 (e)(f) | | 20,724,835 | 1,052,146 |
| Series K013 Class X3, 2.814% 1/25/43 (e)(f) | | 14,360,000 | 941,832 |
| Series KAIV Class X2, 3.6147% 6/25/41 (e)(f) | | 7,430,000 | 684,506 |
| GAHR Commercial Mortgage Trust Series 2015-NRF: | | | |
| Class EFX, 3.4949% 12/15/34 (d)(e) | | 4,364,000 | 4,316,555 |
| Class FFX, 3.4949% 12/15/34 (d)(e) | | 14,402,000 | 14,177,987 |
| Class GFX, 3.4949% 12/15/34 (d)(e) | | 24,194,000 | 23,692,671 |
| GPMT Ltd. floater Series 2018-FL1 Class D, 1 month U.S. LIBOR + 2.950% 5.0379% 11/21/35 (d)(e)(h) | | 2,500,000 | 2,499,995 |
| GS Mortgage Securities Corp. II Series 2010-C1 Class D, 6.1964% 8/10/43 (d)(e) | | 1,966,000 | 1,990,880 |
| GS Mortgage Securities Trust: | | | |
| floater Series 2018-RIVR Class G, 1 month U.S. LIBOR + 2.600% 4.7% 7/15/35 (d)(e)(h) | | 3,808,000 | 3,766,463 |
| Series 2010-C2 Class D, 5.3547% 12/10/43 (d)(e) | | 3,000,000 | 3,046,714 |
| Series 2011-GC5: | | | |
| Class C, 5.5644% 8/10/44 (d)(e) | | 9,000,000 | 9,302,556 |
| Class D, 5.5644% 8/10/44 (d)(e) | | 7,000,000 | 6,823,282 |
| Class E, 5.5644% 8/10/44 (d)(e) | | 8,230,000 | 6,791,859 |
| Class F, 4.5% 8/10/44 (d) | | 7,986,000 | 4,341,613 |
| Series 2012-GC6: | | | |
| Class C, 5.8403% 1/10/45 (d)(e) | | 3,600,000 | 3,741,774 |
| Class D, 5.8403% 1/10/45 (d)(e) | | 4,165,000 | 3,975,119 |
| Class E, 5% 1/10/45 (d)(e) | | 4,516,000 | 3,888,303 |
| Series 2012-GCJ7: | | | |
| Class C, 5.8874% 5/10/45 (e) | | 6,500,000 | 6,686,046 |
| Class D, 5.8874% 5/10/45 (d)(e) | | 10,192,000 | 9,751,872 |
| Class E, 5% 5/10/45 (d) | | 6,920,000 | 4,785,586 |
| Series 2012-GCJ9 Class D, 4.9058% 11/10/45 (d)(e) | | 5,565,000 | 5,302,307 |
| Series 2013-GC14 Class D, 4.9229% 8/10/46 (d)(e) | | 1,680,000 | 1,601,750 |
| Series 2013-GC16: | | | |
| Class D, 5.503% 11/10/46 (d)(e) | | 3,750,000 | 3,696,472 |
| Class F, 3.5% 11/10/46 (d) | | 7,303,000 | 5,314,975 |
| Series 2016-GS3 Class D, 2.62% 10/10/49 (d) | | 3,398,000 | 2,662,728 |
| Series 2016-REMZ Class MZB, 7.727% 2/10/21 (d) | | 29,826,000 | 30,565,145 |
| Series 2016-RENT: | | | |
| Class E, 4.2022% 2/10/29 (d)(e) | | 2,509,000 | 2,466,667 |
| Class F, 4.2022% 2/10/29 (d)(e) | | 15,890,000 | 15,530,473 |
| Hilton U.S.A. Trust: | | | |
| Series 2016-HHV Class F, 4.3333% 11/5/38 (d)(e) | | 8,440,000 | 7,550,911 |
| Series 2016-SFP Class F, 6.1552% 11/5/35 (d) | | 8,457,000 | 8,564,017 |
| IMT Trust Series 2017-APTS: | | | |
| Class EFX, 3.6132% 6/15/34 (d)(e) | | 9,317,000 | 8,580,033 |
| Class FFL, 1 month U.S. LIBOR + 2.850% 4.9216% 6/15/34 (d)(e)(h) | | 3,909,000 | 3,917,450 |
| Independence Plaza Trust Series 2018-INDP Class E, 5.06% 7/10/35 (d) | | 2,896,000 | 2,901,105 |
| Invitation Homes Trust floater Series 2018-SFR3 Class F, 1 month U.S. LIBOR + 2.250% 4.25% 7/17/37 (d)(e)(h) | | 8,405,000 | 8,404,971 |
| JP Morgan Chase Commercial Mortgage Securities Trust floater Series 2018-LAQ Class E, 1 month U.S. LIBOR + 3.000% 5% 6/15/32 (d)(e)(h) | | 1,680,000 | 1,689,447 |
| JPMBB Commercial Mortgage Securities Trust: | | | |
| Series 2014-C23 Class UH5, 4.7094% 9/15/47 (d) | | 8,738,000 | 7,508,100 |
| Series 2014-C26 Class D, 4.0667% 1/15/48 (d)(e) | | 3,398,000 | 2,973,637 |
| JPMCC Commercial Mortgage Securities Trust Series 2016-JP4 Class D, 3.5957% 12/15/49 (d)(e) | | 10,241,000 | 8,555,864 |
| JPMDB Commercial Mortgage Securities Trust: | | | |
| Series 2016-C4 Class D, 3.2227% 12/15/49 (d)(e) | | 7,388,000 | 6,007,713 |
| Series 2018-C8 Class D, 3.2458% 6/15/51 (d)(e) | | 1,698,000 | 1,330,875 |
| JPMorgan Chase Commercial Mortgage Securities Corp.: | | | |
| Series 2003-C1 Class F, 5.6578% 1/12/37 (d)(e) | | 659,056 | 674,098 |
| Series 2010-CNTR Class XB, 1.1366% 8/5/32 (d)(f) | | 32,655,000 | 492,271 |
| Series 2012-CBX: | | | |
| Class C, 5.2137% 6/15/45 (e) | | 4,530,000 | 4,572,249 |
| Class E, 5.2137% 6/15/45 (d)(e) | | 4,635,000 | 4,222,035 |
| Class F, 4% 6/15/45 (d) | | 8,192,000 | 6,242,423 |
| Class G 4% 6/15/45 (d) | | 4,044,000 | 2,142,599 |
| JPMorgan Chase Commercial Mortgage Securities Trust: | | | |
| Series 2011-C3: | | | |
| Class E, 5.8653% 2/15/46 (d)(e) | | 11,147,000 | 10,920,238 |
| Class G, 4.409% 2/15/46 (d)(e) | | 4,671,000 | 3,785,054 |
| Class H, 4.409% 2/15/46 (d)(e) | | 7,077,000 | 5,175,875 |
| Series 2011-C4 Class F, 3.873% 7/15/46 (d) | | 1,400,000 | 1,367,592 |
| Series 2013-LC11: | | | |
| Class C, 3.9582% 4/15/46 (e) | | 848,000 | 828,033 |
| Class D, 4.2985% 4/15/46 (e) | | 7,672,000 | 6,642,135 |
| Class E, 3.25% 4/15/46 (d)(e) | | 472,000 | 340,787 |
| Class F, 3.25% 4/15/46 (d)(e) | | 2,518,000 | 1,519,306 |
| Series 2014-DSTY Class E, 3.9314% 6/10/27 (d)(e) | | 2,752,000 | 2,037,174 |
| Series 2015-UES Class F, 3.7417% 9/5/32 (d)(e) | | 5,432,000 | 5,309,378 |
| Series 2018-AON Class F, 4.6132% 7/5/31 (d) | | 5,096,000 | 4,983,996 |
| JPMorgan Commercial Mortgage Finance Corp. Series 1999-C8 Class H, 6% 7/15/31 (d) | | 105,503 | 98,957 |
| LSTAR Commercial Mortgage Trust Series 2014-2: | | | |
| Class D, 5.2247% 1/20/41 (d)(e) | | 3,000,000 | 2,981,752 |
| Class E, 5.2247% 1/20/41 (d)(e) | | 4,800,000 | 4,429,080 |
| Merrill Lynch Mortgage Trust Series 2006-C1 Class AJ, 5.7803% 5/12/39 (e) | | 2,172,254 | 2,192,630 |
| Morgan Stanley BAML Trust: | | | |
| Series 2012-C5 Class E, 4.8428% 8/15/45 (d)(e) | | 3,889,000 | 3,849,392 |
| Series 2012-C6 Class D, 4.7268% 11/15/45 (d)(e) | | 2,000,000 | 2,004,870 |
| Series 2013-C12 Class D, 4.9239% 10/15/46 (d)(e) | | 7,164,000 | 6,764,894 |
| Series 2013-C13: | | | |
| Class D, 5.0515% 11/15/46 (d)(e) | | 5,277,000 | 5,195,457 |
| Class E, 5.0515% 11/15/46 (d)(e) | | 3,379,000 | 2,972,356 |
| Series 2013-C7: | | | |
| Class D, 4.3877% 2/15/46 (d)(e) | | 5,650,000 | 5,155,482 |
| Class E, 4.3877% 2/15/46 (d)(e) | | 1,000,000 | 787,697 |
| Series 2013-C9: | | | |
| Class C, 4.1797% 5/15/46 (e) | | 3,339,000 | 3,240,792 |
| Class D, 4.2677% 5/15/46 (d)(e) | | 5,137,000 | 4,790,548 |
| Series 2016-C30 Class D, 3% 9/15/49 (d) | | 5,408,000 | 4,073,461 |
| Series 2016-C31 Class D, 3% 11/15/49 (d)(e) | | 1,500,000 | 1,123,088 |
| Series 2016-C32 Class D, 3.396% 12/15/49 (d) | | 5,929,000 | 4,809,764 |
| Morgan Stanley Capital I Trust: | | | |
| sequential payer Series 2012-C4 Class E, 5.6009% 3/15/45 (d)(e) | | 3,640,000 | 3,143,140 |
| Series 1997-RR Class F, 7.51% 4/30/39 (d)(e) | | 203,915 | 202,246 |
| Series 1998-CF1 Class G, 7.35% 7/15/32 (d) | | 426,754 | 364,537 |
| Series 2011-C2: | | | |
| Class D, 5.6659% 6/15/44 (d)(e) | | 5,387,000 | 5,286,864 |
| Class E, 5.6659% 6/15/44 (d)(e) | | 12,150,000 | 11,437,180 |
| Class F, 5.6659% 6/15/44 (d)(e) | | 4,440,000 | 3,921,037 |
| Class XB, 0.6118% 6/15/44 (d)(e)(f) | | 63,708,222 | 887,729 |
| Series 2011-C3: | | | |
| Class D, 5.3267% 7/15/49 (d)(e) | | 7,400,000 | 7,610,321 |
| Class E, 5.3267% 7/15/49 (d)(e) | | 1,353,000 | 1,351,994 |
| Class F, 5.3267% 7/15/49 (d)(e) | | 5,688,050 | 5,470,668 |
| Class G, 5.3267% 7/15/49 (d)(e) | | 3,902,000 | 3,394,485 |
| Series 2012-C4 Class D, 5.6009% 3/15/45 (d)(e) | | 6,310,000 | 5,988,239 |
| Series 2015-MS1 Class D, 4.1647% 5/15/48 (d)(e) | | 10,956,000 | 9,285,176 |
| Series 2015-UBS8 Class D, 3.18% 12/15/48 (d) | | 5,013,000 | 4,207,027 |
| Series 2016-BNK2 Class C, 3% 11/15/49 (d) | | 3,000,000 | 2,366,947 |
| Motel 6 Trust floater: | | | |
| Series 2017-M6MZ, Class M, 1 month U.S. LIBOR + 6.927% 8.9998% 8/15/19 (d)(e)(h) | | 7,805,403 | 7,881,905 |
| Series 2017-MTL6, Class F, 1 month U.S. LIBOR + 4.250% 6.3233% 8/15/34 (d)(e)(h) | | 13,370,859 | 13,454,466 |
| MSCG Trust Series 2016-SNR: | | | |
| Class D, 6.55% 11/15/34 (d) | | 10,105,650 | 9,990,340 |
| Class E, 6.8087% 11/15/34 (d) | | 9,659,400 | 9,167,279 |
| MSJP Commercial Securities Mortgage Trust Series 2015-HAUL Class E, 5.0127% 9/5/47 (d)(e) | | 1,500,000 | 1,365,749 |
| Natixis Commercial Mortgage Securities Trust floater Series 2018-FL1: | | | |
| Class WAN1, 1 month U.S. LIBOR + 2.750% 4.669% 6/15/35 (d)(e)(h) | | 1,743,000 | 1,744,659 |
| Class WAN2, 1 month U.S. LIBOR + 3.750% 5.669% 6/15/35 (d)(e)(h) | | 651,000 | 651,608 |
| Providence Place Group Ltd. Partnership Series 2000-C1 Class A2, 7.75% 7/20/28 (d) | | 4,155,513 | 5,074,713 |
| Starwood Retail Property Trust Series 2014-STAR Class D, 1 month U.S. LIBOR + 3.250% 5.3216% 11/15/27 (d)(e)(h) | | 2,500,000 | 2,414,291 |
| TIAA Seasoned Commercial Mortgage Trust sequential payer Series 2007-C4 Class AJ, 5.4771% 8/15/39 (e) | | 127,811 | 128,167 |
| UBS Commercial Mortgage Trust Series 2012-C1: | | | |
| Class D, 5.7289% 5/10/45 (d)(e) | | 3,235,000 | 3,194,669 |
| Class E, 5% 5/10/45 (d)(e) | | 6,339,000 | 5,437,240 |
| Class F, 5% 5/10/45 (d)(e) | | 2,221,350 | 1,573,841 |
| UBS-Citigroup Commercial Mortgage Trust Series 2011-C1 Class B, 6.2524% 1/10/45 (d)(e) | | 3,000,000 | 3,200,818 |
| Wells Fargo Commercial Mortgage Trust: | | | |
| Series 2012-LC5: | | | |
| Class D, 4.9229% 10/15/45 (d)(e) | | 12,964,000 | 12,823,915 |
| Class E, 4.9229% 10/15/45 (d)(e) | | 7,588,000 | 7,030,863 |
| Series 2016-BNK1 Class D, 3% 8/15/49 (d) | | 6,979,000 | 5,588,751 |
| Series 2016-C35 Class D, 3.142% 7/15/48 (d) | | 18,542,000 | 13,688,648 |
| Series 2016-NXS6 Class D, 3.059% 11/15/49 (d) | | 5,094,000 | 3,688,778 |
| Series 2017-C38 Class D, 3% 7/15/50 (d)(e) | | 4,373,000 | 3,399,805 |
| WF-RBS Commercial Mortgage Trust: | | | |
| sequential payer Series 2011-C4I Class G, 5% 6/15/44 (d) | | 4,000,000 | 2,271,404 |
| Series 2011-C3: | | | |
| Class C, 5.335% 3/15/44 (d) | | 4,900,000 | 4,857,307 |
| Class D, 5.8471% 3/15/44 (d)(e) | | 1,000,000 | 832,909 |
| Class E, 5% 3/15/44 (d) | | 3,000,000 | 1,429,645 |
| Series 2011-C5: | | | |
| Class E, 5.8594% 11/15/44 (d)(e) | | 3,807,000 | 3,795,970 |
| Class F, 5.25% 11/15/44 (d)(e) | | 3,000,000 | 2,617,457 |
| Class G, 5.25% 11/15/44 (d)(e) | | 2,000,000 | 1,641,122 |
| Series 2012-C7: | | | |
| Class D, 4.9788% 6/15/45 (d)(e) | | 2,380,000 | 2,120,560 |
| Class F, 4.5% 6/15/45 (d) | | 2,000,000 | 1,262,701 |
| Series 2012-C8 Class E, 5.0557% 8/15/45 (d)(e) | | 2,922,500 | 2,791,267 |
| Series 2013-C11: | | | |
| Class D, 4.4135% 3/15/45 (d)(e) | | 5,830,000 | 5,485,770 |
| Class E, 4.4135% 3/15/45 (d)(e) | | 4,780,000 | 3,783,205 |
| Series 2013-C13 Class D, 4.276% 5/15/45 (d)(e) | | 4,000,000 | 3,692,710 |
| Series 2013-C16 Class D, 5.1949% 9/15/46 (d)(e) | | 3,728,000 | 3,460,949 |
| Series 2013-UBS1 Class D, 4.7694% 3/15/46 (d)(e) | | 4,589,000 | 4,217,662 |
| WFCG Commercial Mortgage Trust floater Series 2015-BXRP: | | | |
| Class F, 1 month U.S. LIBOR + 3.720% 5.7936% 11/15/29 (d)(e)(h) | | 5,152,378 | 5,142,334 |
| Class G, 1 month U.S. LIBOR + 3.020% 5.0933% 11/15/29 (d)(e)(h) | | 8,859,793 | 8,733,180 |
| WP Glimcher Mall Trust Series 2015-WPG: | | | |
| Class PR1, 3.6332% 6/5/35 (d)(e) | | 6,725,000 | 5,187,157 |
| Class PR2, 3.6332% 6/5/35 (d)(e) | | 2,541,000 | 1,823,660 |
| TOTAL COMMERCIAL MORTGAGE SECURITIES | | | |
| (Cost $848,373,988) | | | 861,090,819 |
|
| Bank Loan Obligations - 4.6% | | | |
| CONSUMER DISCRETIONARY - 0.8% | | | |
| Hotels, Restaurants & Leisure - 0.6% | | | |
| Caesars Resort Collection LLC Tranche B 1LN, term loan 3 month U.S. LIBOR + 2.750% 4.8268% 12/22/24 (e)(h) | | 3,363,100 | 3,375,174 |
| ESH Hospitality, Inc. Tranche B, term loan 3 month U.S. LIBOR + 2.000% 4.0768% 8/30/23 (e)(h) | | 12,679,085 | 12,657,911 |
| LTF Merger Sub, Inc. Tranche B, term loan 3 month U.S. LIBOR + 2.750% 5.0572% 6/10/22 (e)(h) | | 2,543,593 | 2,544,305 |
| Playa Resorts Holding BV Tranche B, term loan 3 month U.S. LIBOR + 2.750% 4.83% 4/27/24 (e)(h) | | 6,300,756 | 6,239,324 |
| Wyndham Destinations, Inc. Tranche B, term loan 3 month U.S. LIBOR + 2.250% 4.3268% 5/31/25 (e)(h) | | 2,545,000 | 2,547,392 |
| Wyndham Hotels & Resorts, Inc. Tranche B, term loan 3 month U.S. LIBOR + 1.750% 3.8268% 5/30/25 (e)(h) | | 1,000,000 | 1,002,190 |
| | | | 28,366,296 |
| Multiline Retail - 0.2% | | | |
| JC Penney Corp., Inc. Tranche B, term loan 3 month U.S. LIBOR + 4.250% 6.5694% 6/23/23 (e)(h) | | 12,360,601 | 11,925,384 |
|
| TOTAL CONSUMER DISCRETIONARY | | | 40,291,680 |
|
| CONSUMER STAPLES - 0.5% | | | |
| Food & Staples Retailing - 0.5% | | | |
| Albertson's LLC Tranche B, term loan: | | | |
| 3 month U.S. LIBOR + 3.000% 5.3194% 6/22/23 (e)(h) | | 17,149,253 | 17,034,868 |
| 3 month U.S. LIBOR + 3.000% 5.337% 12/21/22 (e)(h) | | 11,499,606 | 11,449,353 |
| | | | 28,484,221 |
| ENERGY - 0.6% | | | |
| Energy Equipment & Services - 0.1% | | | |
| Kestrel Acquisition LLC Tranche B, term loan 3 month U.S. LIBOR + 4.250% 6.33% 6/1/25 (e)(h) | | 4,500,000 | 4,532,355 |
| Oil, Gas & Consumable Fuels - 0.5% | | | |
| Moxie Patriot LLC Tranche B, term loan 3 month U.S. LIBOR + 5.750% 8.0844% 12/19/20 (e)(h) | | 22,071,682 | 21,830,218 |
| TPF II Power LLC Tranche B, term loan 3 month U.S. LIBOR + 3.750% 5.8435% 10/2/23 (e)(h) | | 3,373,841 | 3,387,539 |
| | | | 25,217,757 |
|
| TOTAL ENERGY | | | 29,750,112 |
|
| FINANCIALS - 0.5% | | | |
| Diversified Financial Services - 0.2% | | | |
| Veritas-B Junior Mezz C LLC 10.4875% 2/6/21 (e)(g) | | 9,171,000 | 9,665,317 |
| Real Estate Management & Development - 0.3% | | | |
| DTZ U.S. Borrower LLC Tranche B 1LN, term loan 3 month U.S. LIBOR + 3.250% 5.5735% 11/4/21 (e)(h) | | 13,815,584 | 13,818,762 |
| Thrifts & Mortgage Finance - 0.0% | | | |
| Ocwen Loan Servicing LLC Tranche B, term loan 3 month U.S. LIBOR + 5.000% 7.0785% 12/5/20 (e)(h) | | 3,296,009 | 3,306,985 |
|
| TOTAL FINANCIALS | | | 26,791,064 |
|
| HEALTH CARE - 0.1% | | | |
| Health Care Providers & Services - 0.1% | | | |
| Community Health Systems, Inc. Tranche H, term loan 3 month U.S. LIBOR + 3.250% 5.5572% 1/27/21 (e)(h) | | 5,995,082 | 5,884,353 |
| INDUSTRIALS - 0.0% | | | |
| Commercial Services & Supplies - 0.0% | | | |
| Lineage Logistics Holdings, LLC. Tranche B, term loan 3 month U.S. LIBOR + 3.000% 5.0768% 2/27/25 (e)(h) | | 2,044,875 | 2,034,651 |
| INFORMATION TECHNOLOGY - 0.1% | | | |
| Electronic Equipment & Components - 0.1% | | | |
| Compass Power Generation LLC Tranche B, term loan 3 month U.S. LIBOR + 3.750% 5.8435% 12/20/24 (e)(h) | | 3,363,495 | 3,380,312 |
| REAL ESTATE - 1.2% | | | |
| Equity Real Estate Investment Trusts (REITs) - 0.6% | | | |
| Invitation Homes Operating Par Tranche B, term loan 3 month U.S. LIBOR + 1.800% 3.8785% 2/6/22 (e)(g)(h) | | 15,000,000 | 14,625,000 |
| iStar Financial, Inc. Tranche B 1LN, term loan 3 month U.S. LIBOR + 2.750% 4.8418% 6/28/23 (e)(h) | | 12,605,000 | 12,605,000 |
| The GEO Group, Inc. Tranche B 1LN, term loan 3 month U.S. LIBOR + 2.000% 4.1% 3/23/24 (e)(h) | | 2,992,424 | 2,979,347 |
| | | | 30,209,347 |
| Real Estate Management & Development - 0.6% | | | |
| Capital Automotive LP Tranche B 1LN, term loan 3 month U.S. LIBOR + 2.500% 4.58% 3/24/24 (e)(h) | | 3,096,374 | 3,092,503 |
| Realogy Group LLC Tranche B, term loan 3 month U.S. LIBOR + 2.250% 4.3165% 2/8/25 (e)(h) | | 4,000,000 | 4,002,520 |
| Simply Storage Management LLC 8.2375% 9/6/21 (e)(g) | | 16,974,000 | 17,038,501 |
| VICI Properties, LLC Tranche B 1LN, term loan 3 month U.S. LIBOR + 2.000% 4.081% 12/22/24 (e)(h) | | 5,955,000 | 5,959,645 |
| | | | 30,093,169 |
|
| TOTAL REAL ESTATE | | | 60,302,516 |
|
| TELECOMMUNICATION SERVICES - 0.2% | | | |
| Wireless Telecommunication Services - 0.2% | | | |
| SBA Senior Finance II, LLC Tranche B, term loan 3 month U.S. LIBOR + 2.000% 4.08% 4/11/25 (e)(h) | | 11,960,000 | 11,927,110 |
| UTILITIES - 0.6% | | | |
| Electric Utilities - 0.2% | | | |
| Lightstone Holdco LLC: | | | |
| Tranche B 1LN, term loan 3 month U.S. LIBOR + 3.750% 5.8268% 1/30/24 (e)(h) | | 8,900,897 | 8,931,071 |
| Tranche C 1LN, term loan 3 month U.S. LIBOR + 3.750% 5.8268% 1/30/24 (e)(h) | | 569,885 | 571,817 |
| Southeast Powergen LLC Tranche B, term loan 3 month U.S. LIBOR + 3.500% 5.58% 12/2/21 (e)(h) | | 2,491,846 | 2,304,957 |
| | | | 11,807,845 |
| Independent Power and Renewable Electricity Producers - 0.4% | | | |
| APLP Holdings LP Tranche B, term loan 3 month U.S. LIBOR + 3.000% 5.0768% 4/13/23 (e)(h) | | 8,316,308 | 8,330,862 |
| MRP Generation Holdings LLC Tranche B, term loan 3 month U.S. LIBOR + 7.000% 9.3344% 10/18/22 (e)(h) | | 14,483,552 | 13,759,374 |
| | | | 22,090,236 |
|
| TOTAL UTILITIES | | | 33,898,081 |
|
| TOTAL BANK LOAN OBLIGATIONS | | | |
| (Cost $242,530,833) | | | 242,744,100 |
|
| Preferred Securities - 0.0% | | | |
| FINANCIALS - 0.0% | | | |
| Diversified Financial Services - 0.0% | | | |
| Crest Dartmouth Street 2003 1 Ltd. Series 2003-1A Class PS, 6/28/38 (d)(g) | | 1,220,000 | 122 |
| Thrifts & Mortgage Finance - 0.0% | | | |
| Crest Clarendon Street 2002-1 Ltd. Series 2002-1A Class PS, 12/28/35 (d)(g) | | 500,000 | 45,000 |
| TOTAL PREFERRED SECURITIES | | | |
| (Cost $1,297,768) | | | 45,122 |
| | | Shares | Value |
|
| Money Market Funds - 6.9% | | | |
| Fidelity Cash Central Fund, 1.96% (i) | | 348,302,152 | 348,371,812 |
| Fidelity Securities Lending Cash Central Fund 1.97% (i)(j) | | 15,606,547 | 15,608,108 |
| TOTAL MONEY MARKET FUNDS | | | |
| (Cost $363,924,251) | | | 363,979,920 |
| TOTAL INVESTMENT IN SECURITIES - 100.1% | | | |
| (Cost $5,004,657,334) | | | 5,258,496,134 |
| NET OTHER ASSETS (LIABILITIES) - (0.1)% | | | (4,484,413) |
| NET ASSETS - 100% | | | $5,254,011,721 |
Legend
(a) Affiliated company
(b) Security or a portion of the security is on loan at period end.
(c) Non-income producing
(d) Security exempt from registration under Rule 144A of the Securities Act of 1933. These securities may be resold in transactions exempt from registration, normally to qualified institutional buyers. At the end of the period, the value of these securities amounted to $1,169,567,528 or 22.3% of net assets.
(e) Coupon rates for floating and adjustable rate securities reflect the rates in effect at period end.
(f) Security represents right to receive monthly interest payments on an underlying pool of mortgages or assets. Principal shown is the outstanding par amount of the pool as of the end of the period.
(g) Level 3 security
(h) Coupon is indexed to a floating interest rate which may be multiplied by a specified factor and/or subject to caps or floors.
(i) Affiliated fund that is generally available only to investment companies and other accounts managed by Fidelity Investments. The rate quoted is the annualized seven-day yield of the fund at period end. A complete unaudited listing of the fund's holdings as of its most recent quarter end is available upon request. In addition, each Fidelity Central Fund's financial statements, which are not covered by the Fund's Report of Independent Registered Public Accounting Firm, are available on the SEC's website or upon request.
(j) Investment made with cash collateral received from securities on loan.
Affiliated Central Funds
Information regarding fiscal year to date income earned by the Fund from investments in Fidelity Central Funds is as follows:
| Fund | Income earned |
| Fidelity Cash Central Fund | $4,957,774 |
| Fidelity Securities Lending Cash Central Fund | 358,945 |
| Total | $5,316,719 |
Amounts in the income column in the above table include any capital gain distributions from underlying funds, which are presented in the corresponding line-item in the Statement of Operations if applicable.
Other Affiliated Issuers
An affiliated company is a company in which the Fund has ownership of at least 5% of the voting securities. Fiscal year to date transactions with companies which are or were affiliates are as follows:
| Affiliate | Value, beginning of period | Purchases | Sales Proceeds | Dividend Income | Realized Gain (loss) | Change in Unrealized appreciation (depreciation) | Value, end of period |
| Acadia Realty Trust (SBI) | $124,832,133 | $3,899,390 | $-- | $3,554,765 | $1,009,405 | $(10,519,634) | $118,210,943 |
| Ellington Financial LLC | 25,147,846 | 1,105,555 | -- | 2,662,777 | -- | 699,375 | 26,952,776 |
| Great Ajax Corp. | 21,962,447 | -- | -- | 25,302 | 1,633,352 | (435,890) | 21,094,678 |
| Great Ajax Corp. 7.25% | 4,545,000 | 2,506,142 | -- | 326,250 | -- | (68,742) | -- |
| Total | $176,487,426 | $7,511,087 | $-- | $6,569,094 | $2,642,757 | $(10,324,891) | $166,258,397 |
Investment Valuation
The following is a summary of the inputs used, as of July 31, 2018, involving the Fund's assets and liabilities carried at fair value. The inputs or methodology used for valuing securities may not be an indication of the risk associated with investing in those securities. For more information on valuation inputs, and their aggregation into the levels used below, please refer to the Investment Valuation section in the accompanying Notes to Financial Statements.
| | Valuation Inputs at Reporting Date: |
| Description | Total | Level 1 | Level 2 | Level 3 |
| Investments in Securities: | | | | |
| Equities: | | | | |
| Consumer Discretionary | $23,591,544 | $23,591,544 | $-- | $-- |
| Energy | 3,000,000 | -- | 3,000,000 | -- |
| Financials | 700,679,568 | 683,053,558 | 17,626,010 | -- |
| Real Estate | 1,921,618,965 | 1,861,244,595 | 60,374,370 | -- |
| Utilities | 3,364,266 | 3,364,266 | -- | -- |
| Corporate Bonds | 1,000,152,731 | -- | 1,000,152,731 | -- |
| Asset-Backed Securities | 130,214,485 | -- | 130,213,933 | 552 |
| Collateralized Mortgage Obligations | 8,014,614 | -- | 8,014,351 | 263 |
| Commercial Mortgage Securities | 861,090,819 | -- | 861,090,819 | -- |
| Bank Loan Obligations | 242,744,100 | -- | 201,415,282 | 41,328,818 |
| Preferred Securities | 45,122 | -- | -- | 45,122 |
| Money Market Funds | 363,979,920 | 363,979,920 | -- | -- |
| Total Investments in Securities: | $5,258,496,134 | $2,935,233,883 | $2,281,887,496 | $41,374,755 |
The following is a reconciliation of Investments in Securities for which Level 3 inputs were used in determining value:
| Investments in Securities: | |
| Bank Loan Obligations | |
| Beginning Balance | $53,726,431 |
| Net Realized Gain (Loss) on Investment Securities | 109,454 |
| Net Unrealized Gain (Loss) on Investment Securities | 465,888 |
| Cost of Purchases | 9,689,437 |
| Proceeds of Sales | (22,789,931) |
| Amortization/Accretion | 127,539 |
| Transfers into Level 3 | -- |
| Transfers out of Level 3 | -- |
| Ending Balance | $41,328,818 |
| The change in unrealized gain (loss) for the period attributable to Level 3 securities held at July 31, 2018 | $410,229 |
| Other Investments in Securities | |
| Beginning Balance | $1,906,920 |
| Net Realized Gain (Loss) on Investment Securities | 71,923 |
| Net Unrealized Gain (Loss) on Investment Securities | 17,893 |
| Cost of Purchases | 92,444 |
| Proceeds of Sales | (315,466) |
| Amortization/Accretion | (107,556) |
| Transfers into Level 3 | -- |
| Transfers out of Level 3 | (1,620,221) |
| Ending Balance | $45,937 |
| The change in unrealized gain (loss) for the period attributable to Level 3 securities held at July 31, 2018 | $(42,355) |
The information used in the above reconciliations represents fiscal year to date activity for any Investments in Securities identified as using Level 3 inputs at either the beginning or the end of the current fiscal period. Transfers in or out of Level 3 represent the beginning value of any Security or Instrument where a change in the pricing level occurred from the beginning to the end of the period. The cost of purchases and the proceeds of sales may include securities received or delivered through corporate actions or exchanges. Realized and unrealized gains (losses) disclosed in the reconciliations are included in Net Gain (Loss) on the Fund's Statement of Operations.
Other Information
The composition of credit quality ratings as a percentage of Total Net Assets is as follows (Unaudited):
| U.S. Government and U.S. Government Agency Obligations | 0.1% |
| AAA,AA,A | 1.1% |
| BBB | 8.9% |
| BB | 9.0% |
| B | 11.0% |
| CCC,CC,C | 0.7% |
| Not Rated | 11.9% |
| Equities | 50.5% |
| Short-Term Investments and Net Other Assets | 6.8% |
| | 100.0% |
We have used ratings from Moody's Investors Service, Inc. Where Moody's® ratings are not available, we have used S&P® ratings. All ratings are as of the date indicated and do not reflect subsequent changes.
See accompanying notes which are an integral part of the financial statements.
Financial Statements
Statement of Assets and Liabilities
| | | July 31, 2018 |
| Assets | | |
Investment in securities, at value (including securities loaned of $15,352,489) — See accompanying schedule:
Unaffiliated issuers (cost $4,482,338,085) | $4,728,257,817 | |
| Fidelity Central Funds (cost $363,924,251) | 363,979,920 | |
| Other affiliated issuers (cost $158,394,998) | 166,258,397 | |
| Total Investment in Securities (cost $5,004,657,334) | | $5,258,496,134 |
| Cash | | 2,723,693 |
| Receivable for investments sold | | 9,759,741 |
| Receivable for fund shares sold | | 5,499,311 |
| Dividends receivable | | 2,984,420 |
| Interest receivable | | 21,332,181 |
| Distributions receivable from Fidelity Central Funds | | 673,709 |
| Prepaid expenses | | 13,049 |
| Other receivables | | 33,443 |
| Total assets | | 5,301,515,681 |
| Liabilities | | |
| Payable for investments purchased | $23,454,574 | |
| Payable for fund shares redeemed | 4,826,374 | |
| Accrued management fee | 2,357,401 | |
| Distribution and service plan fees payable | 264,351 | |
| Other affiliated payables | 885,931 | |
| Other payables and accrued expenses | 109,701 | |
| Collateral on securities loaned | 15,605,628 | |
| Total liabilities | | 47,503,960 |
| Net Assets | | $5,254,011,721 |
| Net Assets consist of: | | |
| Paid in capital | | $4,874,648,138 |
| Undistributed net investment income | | 38,805,646 |
| Accumulated undistributed net realized gain (loss) on investments and foreign currency transactions | | 86,719,050 |
| Net unrealized appreciation (depreciation) on investments and assets and liabilities in foreign currencies | | 253,838,887 |
| Net Assets | | $5,254,011,721 |
| Calculation of Maximum Offering Price | | |
| Class A: | | |
| Net Asset Value and redemption price per share ($297,722,001 ÷ 24,839,866 shares) | | $11.99 |
| Maximum offering price per share (100/96.00 of $11.99) | | $12.49 |
| Class M: | | |
| Net Asset Value and redemption price per share ($55,175,226 ÷ 4,601,531 shares) | | $11.99 |
| Maximum offering price per share (100/96.00 of $11.99) | | $12.49 |
| Class C: | | |
| Net Asset Value and offering price per share ($227,457,520 ÷ 19,190,796 shares)(a) | | $11.85 |
| Real Estate Income: | | |
| Net Asset Value, offering price and redemption price per share ($2,531,397,034 ÷ 210,087,983 shares) | | $12.05 |
| Class I: | | |
| Net Asset Value, offering price and redemption price per share ($2,142,259,940 ÷ 178,398,890 shares) | | $12.01 |
(a) Redemption price per share is equal to net asset value less any applicable contingent deferred sales charge.
See accompanying notes which are an integral part of the financial statements.
Statement of Operations
| | | Year ended July 31, 2018 |
| Investment Income | | |
| Dividends (including $6,569,094 earned from other affiliated issuers) | | $124,505,966 |
| Interest | | 131,846,468 |
| Income from Fidelity Central Funds | | 5,316,719 |
| Total income | | 261,669,153 |
| Expenses | | |
| Management fee | $28,363,995 | |
| Transfer agent fees | 9,335,255 | |
| Distribution and service plan fees | 3,528,520 | |
| Accounting and security lending fees | 1,383,124 | |
| Custodian fees and expenses | 60,495 | |
| Independent trustees' fees and expenses | 22,388 | |
| Registration fees | 208,238 | |
| Audit | 113,871 | |
| Legal | 12,655 | |
| Miscellaneous | 38,308 | |
| Total expenses before reductions | 43,066,849 | |
| Expense reductions | (161,892) | |
| Total expenses after reductions | | 42,904,957 |
| Net investment income (loss) | | 218,764,196 |
| Realized and Unrealized Gain (Loss) | | |
| Net realized gain (loss) on: | | |
| Investment securities: | | |
| Unaffiliated issuers | 111,573,397 | |
| Fidelity Central Funds | 7,996 | |
| Other affiliated issuers | 2,642,757 | |
| Foreign currency transactions | (6,711) | |
| Total net realized gain (loss) | | 114,217,439 |
| Change in net unrealized appreciation (depreciation) on: | | |
| Investment securities: | | |
| Unaffiliated issuers | (212,759,316) | |
| Fidelity Central Funds | (4,580) | |
| Other affiliated issuers | (10,324,891) | |
| Assets and liabilities in foreign currencies | (108) | |
| Total change in net unrealized appreciation (depreciation) | | (223,088,895) |
| Net gain (loss) | | (108,871,456) |
| Net increase (decrease) in net assets resulting from operations | | $109,892,740 |
See accompanying notes which are an integral part of the financial statements.
Statement of Changes in Net Assets
| | Year ended July 31, 2018 | Year ended July 31, 2017 |
| Increase (Decrease) in Net Assets | | |
| Operations | | |
| Net investment income (loss) | $218,764,196 | $210,270,861 |
| Net realized gain (loss) | 114,217,439 | 36,915,809 |
| Change in net unrealized appreciation (depreciation) | (223,088,895) | 22,370,918 |
| Net increase (decrease) in net assets resulting from operations | 109,892,740 | 269,557,588 |
| Distributions to shareholders from net investment income | (209,651,623) | (202,922,557) |
| Distributions to shareholders from net realized gain | (58,110,159) | (32,383,930) |
| Total distributions | (267,761,782) | (235,306,487) |
| Share transactions - net increase (decrease) | 122,424,204 | 397,445,047 |
| Redemption fees | 106,734 | 449,735 |
| Total increase (decrease) in net assets | (35,338,104) | 432,145,883 |
| Net Assets | | |
| Beginning of period | 5,289,349,825 | 4,857,203,942 |
| End of period | $5,254,011,721 | $5,289,349,825 |
| Other Information | | |
| Undistributed net investment income end of period | $38,805,646 | $40,995,155 |
See accompanying notes which are an integral part of the financial statements.
Financial Highlights
Fidelity Real Estate Income Fund Class A
| Years ended July 31, | 2018 | 2017 | 2016 | 2015 | 2014 |
| Selected Per–Share Data | | | | | |
| Net asset value, beginning of period | $12.32 | $12.25 | $11.66 | $11.86 | $11.67 |
| Income from Investment Operations | | | | | |
| Net investment income (loss)A | .47 | .49 | .49 | .52 | .49 |
| Net realized and unrealized gain (loss) | (.22) | .14 | .73 | .02 | .44 |
| Total from investment operations | .25 | .63 | 1.22 | .54 | .93 |
| Distributions from net investment income | (.45) | (.48) | (.48) | (.52) | (.50) |
| Distributions from net realized gain | (.13) | (.08) | (.14) | (.21) | (.24) |
| Total distributions | (.58) | (.56) | (.63)B | (.74)C | (.74) |
| Redemption fees added to paid in capitalA,D | – | – | – | – | – |
| Net asset value, end of period | $11.99 | $12.32 | $12.25 | $11.66 | $11.86 |
| Total ReturnE,F | 2.13% | 5.37% | 11.01% | 4.65% | 8.49% |
| Ratios to Average Net AssetsG,H | | | | | |
| Expenses before reductions | 1.02% | 1.03% | 1.03% | 1.04% | 1.06% |
| Expenses net of fee waivers, if any | 1.02% | 1.03% | 1.03% | 1.03% | 1.05% |
| Expenses net of all reductions | 1.01% | 1.02% | 1.03% | 1.03% | 1.05% |
| Net investment income (loss) | 3.98% | 4.08% | 4.29% | 4.40% | 4.28% |
| Supplemental Data | | | | | |
| Net assets, end of period (000 omitted) | $297,722 | $355,400 | $548,649 | $495,462 | $442,271 |
| Portfolio turnover rateI | 27% | 22% | 26% | 19% | 29% |
A Calculated based on average shares outstanding during the period.
B Total distributions of $.63 per share is comprised of distributions from net investment income of $.483 and distributions from net realized gain of $.142 per share.
C Total distributions of $.74 per share is comprised of distributions from net investment income of $.523 and distributions from net realized gain of $.212 per share.
D Amount represents less than $.005 per share.
E Total returns would have been lower if certain expenses had not been reduced during the applicable periods shown.
F Total returns do not include the effect of the sales charges.
G Fees and expenses of any underlying Fidelity Central Funds are not included in the Fund's expense ratio. The Fund indirectly bears its proportionate share of the expenses of any underlying Fidelity Central Funds.
H Expense ratios reflect operating expenses of the class. Expenses before reductions do not reflect amounts reimbursed by the investment adviser or reductions from brokerage service arrangements or reductions from other expense offset arrangements and do not represent the amount paid by the class during periods when reimbursements or reductions occur. Expenses net of fee waivers reflect expenses after reimbursement by the investment adviser but prior to reductions from brokerage service arrangements or other expense offset arrangements. Expenses net of all reductions represent the net expenses paid by the class.
I Amount does not include the portfolio activity of any underlying Fidelity Central Funds.
See accompanying notes which are an integral part of the financial statements.
Fidelity Real Estate Income Fund Class M
| Years ended July 31, | 2018 | 2017 | 2016 | 2015 | 2014 |
| Selected Per–Share Data | | | | | |
| Net asset value, beginning of period | $12.32 | $12.26 | $11.66 | $11.86 | $11.67 |
| Income from Investment Operations | | | | | |
| Net investment income (loss)A | .47 | .49 | .49 | .51 | .49 |
| Net realized and unrealized gain (loss) | (.22) | .13 | .73 | .02 | .43 |
| Total from investment operations | .25 | .62 | 1.22 | .53 | .92 |
| Distributions from net investment income | (.45) | (.48) | (.48) | (.52) | (.50) |
| Distributions from net realized gain | (.13) | (.08) | (.14) | (.21) | (.24) |
| Total distributions | (.58) | (.56) | (.62) | (.73) | (.73)B |
| Redemption fees added to paid in capitalA,C | – | – | – | – | – |
| Net asset value, end of period | $11.99 | $12.32 | $12.26 | $11.66 | $11.86 |
| Total ReturnD,E | 2.10% | 5.26% | 11.06% | 4.62% | 8.44% |
| Ratios to Average Net AssetsF,G | | | | | |
| Expenses before reductions | 1.04% | 1.06% | 1.07% | 1.06% | 1.08% |
| Expenses net of fee waivers, if any | 1.04% | 1.06% | 1.07% | 1.06% | 1.08% |
| Expenses net of all reductions | 1.04% | 1.05% | 1.06% | 1.06% | 1.07% |
| Net investment income (loss) | 3.95% | 4.05% | 4.26% | 4.37% | 4.26% |
| Supplemental Data | | | | | |
| Net assets, end of period (000 omitted) | $55,175 | $64,158 | $59,788 | $55,424 | $48,164 |
| Portfolio turnover rateH | 27% | 22% | 26% | 19% | 29% |
A Calculated based on average shares outstanding during the period.
B Total distributions of $.73 per share is comprised of distributions from net investment income of $.496 and distributions from net realized gain of $.236 per share.
C Amount represents less than $.005 per share.
D Total returns would have been lower if certain expenses had not been reduced during the applicable periods shown.
E Total returns do not include the effect of the sales charges.
F Fees and expenses of any underlying Fidelity Central Funds are not included in the Fund's expense ratio. The Fund indirectly bears its proportionate share of the expenses of any underlying Fidelity Central Funds.
G Expense ratios reflect operating expenses of the class. Expenses before reductions do not reflect amounts reimbursed by the investment adviser or reductions from brokerage service arrangements or reductions from other expense offset arrangements and do not represent the amount paid by the class during periods when reimbursements or reductions occur. Expenses net of fee waivers reflect expenses after reimbursement by the investment adviser but prior to reductions from brokerage service arrangements or other expense offset arrangements. Expenses net of all reductions represent the net expenses paid by the class.
H Amount does not include the portfolio activity of any underlying Fidelity Central Funds.
See accompanying notes which are an integral part of the financial statements.
Fidelity Real Estate Income Fund Class C
| Years ended July 31, | 2018 | 2017 | 2016 | 2015 | 2014 |
| Selected Per–Share Data | | | | | |
| Net asset value, beginning of period | $12.20 | $12.14 | $11.55 | $11.77 | $11.59 |
| Income from Investment Operations | | | | | |
| Net investment income (loss)A | .38 | .40 | .40 | .43 | .40 |
| Net realized and unrealized gain (loss) | (.22) | .13 | .73 | .01 | .43 |
| Total from investment operations | .16 | .53 | 1.13 | .44 | .83 |
| Distributions from net investment income | (.37) | (.39) | (.40) | (.45) | (.42) |
| Distributions from net realized gain | (.13) | (.08) | (.14) | (.21) | (.24) |
| Total distributions | (.51)B | (.47) | (.54) | (.66) | (.65)C |
| Redemption fees added to paid in capitalA,D | – | – | – | – | – |
| Net asset value, end of period | $11.85 | $12.20 | $12.14 | $11.55 | $11.77 |
| Total ReturnE,F | 1.31% | 4.54% | 10.29% | 3.82% | 7.66% |
| Ratios to Average Net AssetsG,H | | | | | |
| Expenses before reductions | 1.76% | 1.78% | 1.79% | 1.79% | 1.79% |
| Expenses net of fee waivers, if any | 1.76% | 1.78% | 1.78% | 1.78% | 1.79% |
| Expenses net of all reductions | 1.76% | 1.78% | 1.78% | 1.78% | 1.79% |
| Net investment income (loss) | 3.23% | 3.32% | 3.54% | 3.65% | 3.54% |
| Supplemental Data | | | | | |
| Net assets, end of period (000 omitted) | $227,458 | $287,598 | $289,430 | $291,387 | $246,306 |
| Portfolio turnover rateI | 27% | 22% | 26% | 19% | 29% |
A Calculated based on average shares outstanding during the period.
B Total distributions of $.51 per share is comprised of distributions from net investment income of $.373 and distributions from net realized gain of $.132 per share.
C Total distributions of $.65 per share is comprised of distributions from net investment income of $.417 and distributions from net realized gain of $.236 per share.
D Amount represents less than $.005 per share.
E Total returns would have been lower if certain expenses had not been reduced during the applicable periods shown.
F Total returns do not include the effect of the contingent deferred sales charge.
G Fees and expenses of any underlying Fidelity Central Funds are not included in the Fund's expense ratio. The Fund indirectly bears its proportionate share of the expenses of any underlying Fidelity Central Funds.
H Expense ratios reflect operating expenses of the class. Expenses before reductions do not reflect amounts reimbursed by the investment adviser or reductions from brokerage service arrangements or reductions from other expense offset arrangements and do not represent the amount paid by the class during periods when reimbursements or reductions occur. Expenses net of fee waivers reflect expenses after reimbursement by the investment adviser but prior to reductions from brokerage service arrangements or other expense offset arrangements. Expenses net of all reductions represent the net expenses paid by the class.
I Amount does not include the portfolio activity of any underlying Fidelity Central Funds.
See accompanying notes which are an integral part of the financial statements.
Fidelity Real Estate Income Fund
| Years ended July 31, | 2018 | 2017 | 2016 | 2015 | 2014 |
| Selected Per–Share Data | | | | | |
| Net asset value, beginning of period | $12.38 | $12.31 | $11.71 | $11.91 | $11.71 |
| Income from Investment Operations | | | | | |
| Net investment income (loss)A | .51 | .52 | .52 | .54 | .52 |
| Net realized and unrealized gain (loss) | (.22) | .14 | .73 | .02 | .44 |
| Total from investment operations | .29 | .66 | 1.25 | .56 | .96 |
| Distributions from net investment income | (.48) | (.51) | (.51) | (.55) | (.53) |
| Distributions from net realized gain | (.13) | (.08) | (.14) | (.21) | (.24) |
| Total distributions | (.62)B | (.59) | (.65) | (.76) | (.76)C |
| Redemption fees added to paid in capitalA,D | – | – | – | – | – |
| Net asset value, end of period | $12.05 | $12.38 | $12.31 | $11.71 | $11.91 |
| Total ReturnE | 2.40% | 5.60% | 11.29% | 4.84% | 8.78% |
| Ratios to Average Net AssetsF,G | | | | | |
| Expenses before reductions | .75% | .78% | .82% | .83% | .83% |
| Expenses net of fee waivers, if any | .75% | .78% | .81% | .82% | .83% |
| Expenses net of all reductions | .75% | .77% | .81% | .82% | .83% |
| Net investment income (loss) | 4.24% | 4.33% | 4.51% | 4.61% | 4.50% |
| Supplemental Data | | | | | |
| Net assets, end of period (000 omitted) | $2,531,397 | $2,630,901 | $2,719,387 | $2,561,268 | $2,627,382 |
| Portfolio turnover rateH | 27% | 22% | 26% | 19% | 29% |
A Calculated based on average shares outstanding during the period.
B Total distributions of $.62 per share is comprised of distributions from net investment income of $.484 and distributions from net realized gain of $.132 per share.
C Total distributions of $.76 per share is comprised of distributions from net investment income of $.525 and distributions from net realized gain of $.236 per share.
D Amount represents less than $.005 per share.
E Total returns would have been lower if certain expenses had not been reduced during the applicable periods shown.
F Fees and expenses of any underlying Fidelity Central Funds are not included in the Fund's expense ratio. The Fund indirectly bears its proportionate share of the expenses of any underlying Fidelity Central Funds.
G Expense ratios reflect operating expenses of the class. Expenses before reductions do not reflect amounts reimbursed by the investment adviser or reductions from brokerage service arrangements or reductions from other expense offset arrangements and do not represent the amount paid by the class during periods when reimbursements or reductions occur. Expenses net of fee waivers reflect expenses after reimbursement by the investment adviser but prior to reductions from brokerage service arrangements or other expense offset arrangements. Expenses net of all reductions represent the net expenses paid by the class.
H Amount does not include the portfolio activity of any underlying Fidelity Central Funds.
See accompanying notes which are an integral part of the financial statements.
Fidelity Real Estate Income Fund Class I
| Years ended July 31, | 2018 | 2017 | 2016 | 2015 | 2014 |
| Selected Per–Share Data | | | | | |
| Net asset value, beginning of period | $12.34 | $12.27 | $11.68 | $11.88 | $11.69 |
| Income from Investment Operations | | | | | |
| Net investment income (loss)A | .51 | .52 | .52 | .55 | .52 |
| Net realized and unrealized gain (loss) | (.22) | .14 | .73 | .02 | .44 |
| Total from investment operations | .29 | .66 | 1.25 | .57 | .96 |
| Distributions from net investment income | (.49) | (.51) | (.52) | (.55) | (.53) |
| Distributions from net realized gain | (.13) | (.08) | (.14) | (.21) | (.24) |
| Total distributions | (.62) | (.59) | (.66) | (.77)B | (.77) |
| Redemption fees added to paid in capitalA,C | – | – | – | – | – |
| Net asset value, end of period | $12.01 | $12.34 | $12.27 | $11.68 | $11.88 |
| Total ReturnD | 2.41% | 5.66% | 11.30% | 4.92% | 8.76% |
| Ratios to Average Net AssetsE,F | | | | | |
| Expenses before reductions | .75% | .76% | .77% | .77% | .78% |
| Expenses net of fee waivers, if any | .75% | .76% | .77% | .77% | .78% |
| Expenses net of all reductions | .75% | .76% | .76% | .77% | .78% |
| Net investment income (loss) | 4.25% | 4.34% | 4.56% | 4.66% | 4.55% |
| Supplemental Data | | | | | |
| Net assets, end of period (000 omitted) | $2,142,260 | $1,951,293 | $1,239,950 | $913,475 | $809,854 |
| Portfolio turnover rateG | 27% | 22% | 26% | 19% | 29% |
A Calculated based on average shares outstanding during the period.
B Total distributions of $.77 per share is comprised of distributions from net investment income of $.554 and distributions from net realized gain of $.212 per share.
C Amount represents less than $.005 per share.
D Total returns would have been lower if certain expenses had not been reduced during the applicable periods shown.
E Fees and expenses of any underlying Fidelity Central Funds are not included in the Fund's expense ratio. The Fund indirectly bears its proportionate share of the expenses of any underlying Fidelity Central Funds.
F Expense ratios reflect operating expenses of the class. Expenses before reductions do not reflect amounts reimbursed by the investment adviser or reductions from brokerage service arrangements or reductions from other expense offset arrangements and do not represent the amount paid by the class during periods when reimbursements or reductions occur. Expenses net of fee waivers reflect expenses after reimbursement by the investment adviser but prior to reductions from brokerage service arrangements or other expense offset arrangements. Expenses net of all reductions represent the net expenses paid by the class.
G Amount does not include the portfolio activity of any underlying Fidelity Central Funds.
See accompanying notes which are an integral part of the financial statements.
Notes to Financial Statements
For the period ended July 31, 2018
1. Organization.
Fidelity Real Estate Income Fund (the Fund) is a fund of Fidelity Securities Fund (the Trust) and is authorized to issue an unlimited number of shares. The Trust is registered under the Investment Company Act of 1940, as amended (the 1940 Act), as an open-end management investment company organized as a Massachusetts business trust. The Fund offers Class A, Class M, Class C, Real Estate Income and Class I shares, each of which has equal rights as to assets and voting privileges. Each class has exclusive voting rights with respect to matters that affect that class.
2. Investments in Fidelity Central Funds.
The Fund invests in Fidelity Central Funds, which are open-end investment companies generally available only to other investment companies and accounts managed by the investment adviser and its affiliates. The Fund's Schedule of Investments lists each of the Fidelity Central Funds held as of period end, if any, as an investment of the Fund, but does not include the underlying holdings of each Fidelity Central Fund. As an Investing Fund, the Fund indirectly bears its proportionate share of the expenses of the underlying Fidelity Central Funds.
The Money Market Central Funds seek preservation of capital and current income and are managed by Fidelity Investments Money Management, Inc. (FIMM), an affiliate of the investment adviser. Annualized expenses of the Money Market Central Funds as of their most recent shareholder report date are less than .005%.
A complete unaudited list of holdings for each Fidelity Central Fund is available upon request or at the Securities and Exchange Commission (the SEC) website at www.sec.gov. In addition, the financial statements of the Fidelity Central Funds, which are not covered by the Fund's Report of Independent Registered Public Accounting Firm, are available on the SEC website or upon request.
3. Significant Accounting Policies.
The Fund is an investment company and applies the accounting and reporting guidance of the Financial Accounting Standards Board (FASB) Accounting Standards Codification Topic 946 Financial Services – Investments Companies. The financial statements have been prepared in conformity with accounting principles generally accepted in the United States of America (GAAP), which require management to make certain estimates and assumptions at the date of the financial statements. Actual results could differ from those estimates. Subsequent events, if any, through the date that the financial statements were issued have been evaluated in the preparation of the financial statements. The following summarizes the significant accounting policies of the Fund:
Investment Valuation. Investments are valued as of 4:00 p.m. Eastern time on the last calendar day of the period. The Board of Trustees (the Board) has delegated the day to day responsibility for the valuation of the Fund's investments to the Fair Value Committee (the Committee) established by the Fund's investment adviser. In accordance with valuation policies and procedures approved by the Board, the Fund attempts to obtain prices from one or more third party pricing vendors or brokers to value its investments. When current market prices, quotations or currency exchange rates are not readily available or reliable, investments will be fair valued in good faith by the Committee, in accordance with procedures adopted by the Board. Factors used in determining fair value vary by investment type and may include market or investment specific events, changes in interest rates and credit quality. The frequency with which these procedures are used cannot be predicted and they may be utilized to a significant extent. The Committee oversees the Fund's valuation policies and procedures and reports to the Board on the Committee's activities and fair value determinations. The Board monitors the appropriateness of the procedures used in valuing the Fund's investments and ratifies the fair value determinations of the Committee.
The Fund categorizes the inputs to valuation techniques used to value its investments into a disclosure hierarchy consisting of three levels as shown below:
- Level 1 – quoted prices in active markets for identical investments
- Level 2 – other significant observable inputs (including quoted prices for similar investments, interest rates, prepayment speeds, etc.)
- Level 3 – unobservable inputs (including the Fund's own assumptions based on the best information available)
Valuation techniques used to value the Fund's investments by major category are as follows:
Equity securities, including restricted securities, for which market quotations are readily available, are valued at the last reported sale price or official closing price as reported by a third party pricing vendor on the primary market or exchange on which they are traded and are categorized as Level 1 in the hierarchy. In the event there were no sales during the day or closing prices are not available, securities are valued at the last quoted bid price or may be valued using the last available price and are generally categorized as Level 2 in the hierarchy. For foreign equity securities, when market or security specific events arise, comparisons to the valuation of American Depositary Receipts (ADRs), futures contracts, Exchange-Traded Funds (ETFs) and certain indexes as well as quoted prices for similar securities may be used and would be categorized as Level 2 in the hierarchy. Utilizing these techniques may result in transfers between Level 1 and Level 2. For equity securities, including restricted securities, where observable inputs are limited, assumptions about market activity and risk are used and these securities may be categorized as Level 3 in the hierarchy.
Debt securities, including restricted securities, are valued based on evaluated prices received from third party pricing vendors or from brokers who make markets in such securities. Corporate bonds, bank loan obligations and preferred securities are valued by pricing vendors who utilize matrix pricing which considers yield or price of bonds of comparable quality, coupon, maturity and type or by broker-supplied prices. Asset backed securities, collateralized mortgage obligations and commercial mortgage securities are valued by pricing vendors who utilize matrix pricing which considers prepayment speed assumptions, attributes of the collateral, yield or price of bonds of comparable quality, coupon, maturity and type or by broker-supplied prices. When independent prices are unavailable or unreliable, debt securities may be valued utilizing pricing methodologies which consider similar factors that would be used by third party pricing vendors. Debt securities are generally categorized as Level 2 in the hierarchy but may be Level 3 depending on the circumstances.
Investments in open-end mutual funds, including the Fidelity Central Funds, are valued at their closing net asset value (NAV) each business day and are categorized as Level 1 in the hierarchy.
Changes in valuation techniques may result in transfers in or out of an assigned level within the disclosure hierarchy. The aggregate value of investments by input level as of July 31, 2018, as well as a roll forward of Level 3 investments, is included at the end of the Fund's Schedule of Investments.
Foreign Currency. The Fund may use foreign currency contracts to facilitate transactions in foreign-denominated securities. Gains and losses from these transactions may arise from changes in the value of the foreign currency or if the counterparties do not perform under the contracts' terms.
Foreign-denominated assets, including investment securities, and liabilities are translated into U.S. dollars at the exchange rates at period end. Purchases and sales of investment securities, income and dividends received and expenses denominated in foreign currencies are translated into U.S. dollars at the exchange rate in effect on the transaction date.
The effects of exchange rate fluctuations on investments are included with the net realized and unrealized gain (loss) on investment securities. Other foreign currency transactions resulting in realized and unrealized gain (loss) are disclosed separately.
Investment Transactions and Income. For financial reporting purposes, the Fund's investment holdings and NAV include trades executed through the end of the last business day of the period. The NAV per share for processing shareholder transactions is calculated as of the close of business of the New York Stock Exchange (NYSE), normally 4:00 p.m. Eastern time and includes trades executed through the end of the prior business day. Gains and losses on securities sold are determined on the basis of identified cost and include proceeds received from litigation. Dividend income is recorded on the ex-dividend date, except for certain dividends from foreign securities where the ex-dividend date may have passed, which are recorded as soon as the Fund is informed of the ex-dividend date. Non-cash dividends included in dividend income, if any, are recorded at the fair market value of the securities received. Income and capital gain distributions from Fidelity Central Funds, if any, are recorded on the ex-dividend date. Certain distributions received by the Fund represent a return of capital or capital gain. The Fund determines the components of these distributions subsequent to the ex-dividend date, based upon receipt of tax filings or other correspondence relating to the underlying investment. These distributions are recorded as a reduction of cost of investments and/or as a realized gain. Interest income is accrued as earned and includes coupon interest and amortization of premium and accretion of discount on debt securities as applicable. For certain lower credit quality securitized assets that have contractual cash flows (for example, asset backed securities, collateralized mortgage obligations and commercial mortgage-backed securities), changes in estimated cash flows are periodically evaluated and the estimated yield is adjusted on a prospective basis, resulting in increases or decreases to Interest Income in the accompanying Statement of Operations. Investment income is recorded net of foreign taxes withheld where recovery of such taxes is uncertain. Debt obligations may be placed on non-accrual status and related interest income may be reduced by ceasing current accruals and writing off interest receivables when the collection of all or a portion of interest has become doubtful based on consistently applied procedures. A debt obligation is removed from non-accrual status when the issuer resumes interest payments or when collectability of interest is reasonably assured.
Class Allocations and Expenses. Investment income, realized and unrealized capital gains and losses, common expenses of the Fund, and certain fund-level expense reductions, if any, are allocated daily on a pro-rata basis to each class based on the relative net assets of each class to the total net assets of the Fund. Each class differs with respect to transfer agent and distribution and service plan fees incurred. Certain expense reductions may also differ by class. For the reporting period, the allocated portion of income and expenses to each class as a percent of its average net assets may vary due to the timing of recording these transactions in relation to fluctuating net assets of the classes. Expenses directly attributable to a fund are charged to that fund. Expenses attributable to more than one fund are allocated among the respective funds on the basis of relative net assets or other appropriate methods. Expense estimates are accrued in the period to which they relate and adjustments are made when actual amounts are known.
Income Tax Information and Distributions to Shareholders. Each year, the Fund intends to qualify as a regulated investment company under Subchapter M of the Internal Revenue Code, including distributing substantially all of its taxable income and realized gains. As a result, no provision for U.S. Federal income taxes is required. As of July 31, 2018, the Fund did not have any unrecognized tax benefits in the financial statements; nor is the Fund aware of any tax positions for which it is reasonably possible that the total amounts of unrecognized tax benefits will significantly change in the next twelve months. The Fund files a U.S. federal tax return, in addition to state and local tax returns as required. The Fund's federal income tax returns are subject to examination by the Internal Revenue Service (IRS) for a period of three fiscal years after they are filed. State and local tax returns may be subject to examination for an additional fiscal year depending on the jurisdiction. Foreign taxes are provided for based on the Fund's understanding of the tax rules and rates that exist in the foreign markets in which it invests.
Distributions are declared and recorded on the ex-dividend date. Income and capital gain distributions are declared separately for each class. Income and capital gain distributions are determined in accordance with income tax regulations, which may differ from GAAP. In addition, the Fund claimed a portion of the payment made to redeeming shareholders as a distribution for income tax purposes.
Capital accounts within the financial statements are adjusted for permanent book-tax differences. These adjustments have no impact on net assets or the results of operations. Capital accounts are not adjusted for temporary book-tax differences which will reverse in a subsequent period.
Book-tax differences are primarily due to the short-term gain distributions from the Underlying Funds, foreign currency transactions, passive foreign investment companies (PFIC), market discount, equity-debt classifications, certain conversion ratio adjustments, partnerships and losses deferred due to wash sales.
As of period end, the cost and unrealized appreciation (depreciation) in securities, and derivatives if applicable, for federal income tax purposes were as follows:
| Gross unrealized appreciation | $394,714,519 |
| Gross unrealized depreciation | (148,256,973) |
| Net unrealized appreciation (depreciation) | $246,457,546 |
| Tax Cost | $5,012,038,588 |
The tax-based components of distributable earnings as of period end were as follows:
| Undistributed ordinary income | $50,371,649 |
| Undistributed long-term capital gain | $82,869,359 |
| Net unrealized appreciation (depreciation) on securities and other investments | $246,457,633 |
The tax character of distributions paid was as follows:
| | July 31, 2018 | July 31, 2017 |
| Ordinary Income | $218,315,072 | $ 202,922,557 |
| Long-term Capital Gains | 49,446,710 | 32,383,930 |
| Total | $267,761,782 | $ 235,306,487 |
Short-Term Trading (Redemption) Fees. Shares held by investors in the Funds less than 90 days may be subject to a redemption fee equal to .75% of the NAV of shares redeemed. All redemption fees, which reduce the proceeds of the shareholder redemption, are retained by the Funds and accounted for as an addition to paid in capital. In November 2017, the Board of Trustees approved the elimination of these redemption fees effective December 18, 2017.
Restricted Securities. The Fund may invest in securities that are subject to legal or contractual restrictions on resale. These securities generally may be resold in transactions exempt from registration or to the public if the securities are registered. Disposal of these securities may involve time-consuming negotiations and expense, and prompt sale at an acceptable price may be difficult. Information regarding restricted securities is included at the end of the Fund's Schedule of Investments.
Loans and Other Direct Debt Instruments. The Fund invests in direct debt instruments which are interests in amounts owed to lenders by corporate or other borrowers. These instruments may be in the form of loans, trade claims or other receivables and may include standby financing commitments such as revolving credit facilities that obligate the Fund to supply additional cash to the borrower on demand. Loans may be acquired through assignment or participation. The Fund did not have any unfunded loan commitments, which are contractual obligations for future funding, at period end.
New Accounting Pronouncement. In March 2017, the Financial Accounting Standards Board (FASB) issued an Accounting Standards Update (ASU), ASU 2017-08, which amends the amortization period for certain callable debt securities that are held at a premium. The amendment requires the premium to be amortized to the earliest call date. The amendments do not require an accounting change for securities held at a discount. The ASU is effective for annual periods beginning after December 15, 2018. Management is currently evaluating the potential impact of these changes to the financial statements.
4. Purchases and Sales of Investments.
Purchases and sales of securities, other than short-term securities and U.S. government securities, aggregated $1,404,991,466 and $1,324,928,996, respectively.
5. Fees and Other Transactions with Affiliates.
Management Fee. Fidelity Management & Research Company (the investment adviser) and its affiliates provide the Fund with investment management related services for which the Fund pays a monthly management fee. The management fee is the sum of an individual fund fee rate that is based on an annual rate of .30% of the Fund's average net assets and an annualized group fee rate that averaged .24% during the period. The group fee rate is based upon the average net assets of all the mutual funds advised by the investment adviser, including any mutual funds previously advised by the investment adviser that are currently advised by Fidelity SelectCo, LLC, an affiliate of the investment adviser. The group fee rate decreases as assets under management increase and increases as assets under management decrease. For the reporting period, the total annual management fee rate was .54% of the Fund's average net assets.
Distribution and Service Plan Fees. In accordance with Rule 12b-1 of the 1940 Act, the Fund has adopted separate Distribution and Service Plans for each class of shares. Certain classes pay Fidelity Distributors Corporation (FDC), an affiliate of the investment adviser, separate Distribution and Service Fees, each of which is based on an annual percentage of each class' average net assets. In addition, FDC may pay financial intermediaries for selling shares of the Fund and providing shareholder support services. For the period, the Distribution and Service Fee rates, total fees and amounts retained by FDC were as follows:
| | Distribution Fee | Service Fee | Total Fees | Retained by FDC |
| Class A | -% | .25% | $805,400 | $– |
| Class M | -% | .25% | 148,351 | – |
| Class C | .75% | .25% | 2,574,769 | 291,290 |
| | | | $3,528,520 | $291,290 |
Sales Load. FDC may receive a front-end sales charge of up to 4.00% for selling Class A shares and Class M shares, some of which is paid to financial intermediaries for selling shares of the Fund. Depending on the holding period, FDC may receive contingent deferred sales charges levied on Class A, Class M and Class C redemptions. The deferred sales charges are 1.00% for Class C shares, 1.00% for certain purchases of Class A shares and .25% for certain purchases of Class M shares.
For the period, sales charge amounts retained by FDC were as follows:
| | Retained by FDC |
| Class A | $24,653 |
| Class M | 5,798 |
| Class C(a) | 28,402 |
| | $58,853 |
(a) When Class C shares are initially sold, FDC pays commissions from its own resources to financial intermediaries through which the sales are made.
Transfer Agent Fees. Fidelity Investments Institutional Operations Company, Inc., (FIIOC), an affiliate of the investment adviser, is the transfer, dividend disbursing and shareholder servicing agent for each class of the Fund. FIIOC receives account fees and asset-based fees that vary according to the account size and type of account of the shareholders of the respective classes of the Fund. FIIOC pays for typesetting, printing and mailing of shareholder reports, except proxy statements.
For the period, transfer agent fees for each class were as follows:
| | Amount | % of Class-Level Average Net Assets |
| Class A | $616,548 | .19 |
| Class M | 128,988 | .22 |
| Class C | 481,597 | .19 |
| Real Estate Income | 4,538,696 | .18 |
| Class I | 3,569,426 | .17 |
| | $9,335,255 | |
Accounting and Security Lending Fees. Fidelity Service Company, Inc. (FSC), an affiliate of the investment adviser, maintains the Fund's accounting records. The accounting fee is based on the level of average net assets for each month. Under a separate contract, FSC administers the security lending program. The security lending fee is based on the number and duration of lending transactions. For the period, the fees were equivalent to an annual rate of .03%.
Brokerage Commissions. The Fund placed a portion of its portfolio transactions with brokerage firms which are affiliates of the investment adviser. Brokerage commissions are included in net realized gain (loss) and change in net unrealized appreciation (depreciation) in the Statement of Operations. The commissions paid to these affiliated firms were $9,162 for the period.
Interfund Trades. The Fund may purchase from or sell securities to other Fidelity Funds under procedures adopted by the Board. The procedures have been designed to ensure these interfund trades are executed in accordance with Rule 17a-7 of the 1940 Act. Interfund trades are included within the respective purchases and sales amounts shown in the Purchases and Sales of Investments note.
6. Committed Line of Credit.
The Fund participates with other funds managed by the investment adviser or an affiliate in a $4.25 billion credit facility (the "line of credit") to be utilized for temporary or emergency purposes to fund shareholder redemptions or for other short-term liquidity purposes. The Fund has agreed to pay commitment fees on its pro-rata portion of the line of credit, which amounted to $14,837 and is reflected in Miscellaneous expenses on the Statement of Operations. During the period, the Fund did not borrow on this line of credit.
7. Security Lending.
The Fund lends portfolio securities through a lending agent from time to time in order to earn additional income. For equity securities, a lending agent is used and may loan securities to certain qualified borrowers, including Fidelity Capital Markets (FCM), a broker-dealer affiliated with the Fund. On the settlement date of the loan, the Fund receives collateral (in the form of U.S. Treasury obligations, letters of credit and/or cash) against the loaned securities and maintains collateral in an amount not less than 100% of the market value of the loaned securities during the period of the loan. The market value of the loaned securities is determined at the close of business of the Fund and any additional required collateral is delivered to the Fund on the next business day. The Fund or borrower may terminate the loan at any time, and if the borrower defaults on its obligation to return the securities loaned because of insolvency or other reasons, the Fund may apply collateral received from the borrower against the obligation. The Fund may experience delays and costs in recovering the securities loaned. Any cash collateral received is invested in the Fidelity Securities Lending Cash Central Fund. The value of loaned securities and cash collateral at period end are disclosed on the Fund's Statement of Assets and Liabilities. The value of securities loaned to FCM at period end was $1,115,251. Security lending income represents the income earned on investing cash collateral, less rebates paid to borrowers and any lending agent fees associated with the loan, plus any premium payments received for lending certain types of securities. Security lending income is presented in the Statement of Operations as a component of income from Fidelity Central Funds. Total security lending income during the period amounted to $358,945, including $25,992 from securities loaned to FCM.
8. Expense Reductions.
Commissions paid to certain brokers with whom the investment adviser, or its affiliates, places trades on behalf of the Fund include an amount in addition to trade execution, which may be rebated back to the Fund to offset certain expenses. This amount totaled $86,638 for the period. Through arrangements with the Fund's custodian, credits realized as a result of certain uninvested cash balances were used to reduce the Fund's expenses. During the period, these credits reduced the Fund's custody expenses by $20,756.
In addition, during the period the investment adviser reimbursed and/or waived a portion of fund-level operating expenses in the amount of $54,498.
9. Distributions to Shareholders.
Distributions to shareholders of each class were as follows:
| | Year ended
July 31, 2018 | Year ended
July 31, 2017 |
| From net investment income | | |
| Class A | $12,349,133 | $19,398,648 |
| Class M | 2,255,950 | 2,428,967 |
| Class C | 8,342,624 | 9,371,104 |
| Real Estate Income | 103,116,422 | 109,435,619 |
| Class I | 83,587,494 | 62,288,219 |
| Total | $209,651,623 | $202,922,557 |
| From net realized gain | | |
| Class A | $3,718,313 | $3,567,509 |
| Class M | 680,353 | 398,948 |
| Class C | 3,070,508 | 1,939,550 |
| Real Estate Income | 28,258,214 | 17,827,432 |
| Class I | 22,382,771 | 8,650,491 |
| Total | $58,110,159 | $32,383,930 |
10. Share Transactions.
Share transactions for each class were as follows and may contain automatic conversions between classes or exchanges between affiliated funds:
| | Shares | Shares | Dollars | Dollars |
| | Year ended July 31, 2018 | Year ended July 31, 2017 | Year ended July 31, 2018 | Year ended July 31, 2017 |
| Class A | | | | |
| Shares sold | 6,036,517 | 12,839,240 | $71,765,863 | $153,895,562 |
| Reinvestment of distributions | 1,301,260 | 1,848,521 | 15,605,254 | 21,908,312 |
| Shares redeemed | (11,347,678) | (30,631,418) | (134,310,067) | (367,310,909) |
| Net increase (decrease) | (4,009,901) | (15,943,657) | $(46,938,950) | $(191,507,035) |
| Class M | | | | |
| Shares sold | 733,876 | 1,228,326 | $8,765,829 | $14,708,870 |
| Reinvestment of distributions | 238,619 | 221,980 | 2,863,295 | 2,637,477 |
| Shares redeemed | (1,576,898) | (1,122,766) | (18,688,302) | (13,419,214) |
| Net increase (decrease) | (604,403) | 327,540 | $(7,059,178) | $3,927,133 |
| Class C | | | | |
| Shares sold | 2,391,083 | 5,359,653 | $28,308,215 | $63,747,841 |
| Reinvestment of distributions | 897,945 | 858,380 | 10,683,017 | 10,109,093 |
| Shares redeemed | (7,673,573) | (6,493,102) | (89,721,727) | (77,061,823) |
| Net increase (decrease) | (4,384,545) | (275,069) | $(50,730,495) | $(3,204,889) |
| Real Estate Income | | | | |
| Shares sold | 43,494,857 | 47,554,214 | $518,900,815 | $573,422,929 |
| Reinvestment of distributions | 9,523,043 | 9,324,516 | 114,640,546 | 111,248,966 |
| Shares redeemed | (55,394,813) | (65,327,473) | (656,921,503) | (784,201,096) |
| Net increase (decrease) | (2,376,913) | (8,448,743) | $(23,380,142) | $(99,529,201) |
| Class I | | | | |
| Shares sold | 81,604,369 | 91,593,798 | $971,878,458 | $1,102,392,455 |
| Reinvestment of distributions | 7,132,431 | 4,455,256 | 85,529,395 | 53,081,868 |
| Shares redeemed | (68,424,382) | (38,982,165) | (806,874,884) | (467,715,284) |
| Net increase (decrease) | 20,312,418 | 57,066,889 | $250,532,969 | $687,759,039 |
11. Other.
The Fund's organizational documents provide former and current trustees and officers with a limited indemnification against liabilities arising in connection with the performance of their duties to the Fund. In the normal course of business, the Fund may also enter into contracts that provide general indemnifications. The Fund's maximum exposure under these arrangements is unknown as this would be dependent on future claims that may be made against the Fund. The risk of material loss from such claims is considered remote.
Report of Independent Registered Public Accounting Firm
To the Trustees of Fidelity Securities Fund and Shareholders of Fidelity Real Estate Income Fund:
Opinion on the Financial Statements and Financial Highlights
We have audited the accompanying statement of assets and liabilities of Fidelity Real Estate Income Fund (the "Fund"), a fund of Fidelity Securities Fund, including the schedule of investments, as of July 31, 2018, and the related statement of operations for the year then ended, the statement of changes in net assets for each of the two years in the period then ended, the financial highlights for each of the five years in the period then ended, and the related notes. In our opinion, the financial statements and financial highlights present fairly, in all material respects, the financial position of the Fund as of July 31, 2018, and the results of its operations for the year then ended, the changes in its net assets for each of the two years in the period then ended, and the financial highlights for each of the five years in the period then ended, in conformity with accounting principles generally accepted in the United States of America.
Basis for Opinion
These financial statements and financial highlights are the responsibility of the Fund's management. Our responsibility is to express an opinion on the Fund's financial statements and financial highlights based on our audits. We are a public accounting firm registered with the Public Company Accounting Oversight Board (United States) (PCAOB) and are required to be independent with respect to the Fund in accordance with the U.S. federal securities laws and the applicable rules and regulations of the Securities and Exchange Commission and the PCAOB.
We conducted our audits in accordance with the standards of the PCAOB. Those standards require that we plan and perform the audit to obtain reasonable assurance about whether the financial statements and financial highlights are free of material misstatement, whether due to error or fraud. The Fund is not required to have, nor were we engaged to perform, an audit of its internal control over financial reporting. As part of our audits we are required to obtain an understanding of internal control over financial reporting but not for the purpose of expressing an opinion on the effectiveness of the Fund’s internal control over financial reporting. Accordingly, we express no such opinion.
Our audits included performing procedures to assess the risks of material misstatement of the financial statements and financial highlights, whether due to error or fraud, and performing procedures that respond to those risks. Such procedures included examining, on a test basis, evidence regarding the amounts and disclosures in the financial statements and financial highlights. Our audits also included evaluating the accounting principles used and significant estimates made by management, as well as evaluating the overall presentation of the financial statements and financial highlights. Our procedures included confirmation of securities owned as of July 31, 2018, by correspondence with the custodians and brokers; when replies were not received from brokers, we performed other auditing procedures. We believe that our audits provide a reasonable basis for our opinion.
/s/ Deloitte & Touche LLP
Boston, Massachusetts
September 18, 2018
We have served as the auditor of one or more of the Fidelity investment companies since 1999.
Trustees and Officers
The Trustees, Members of the Advisory Board (if any), and officers of the trust and fund, as applicable, are listed below. The Board of Trustees governs the fund and is responsible for protecting the interests of shareholders. The Trustees are experienced executives who meet periodically throughout the year to oversee the fund's activities, review contractual arrangements with companies that provide services to the fund, oversee management of the risks associated with such activities and contractual arrangements, and review the fund's performance. Except for Jonathan Chiel, each of the Trustees oversees 286 funds. Mr. Chiel oversees 150 funds.
The Trustees hold office without limit in time except that (a) any Trustee may resign; (b) any Trustee may be removed by written instrument, signed by at least two-thirds of the number of Trustees prior to such removal; (c) any Trustee who requests to be retired or who has become incapacitated by illness or injury may be retired by written instrument signed by a majority of the other Trustees; and (d) any Trustee may be removed at any special meeting of shareholders by a two-thirds vote of the outstanding voting securities of the trust. Each Trustee who is not an interested person (as defined in the 1940 Act) of the trust and the fund is referred to herein as an Independent Trustee. Each Independent Trustee shall retire not later than the last day of the calendar year in which his or her 75th birthday occurs. The Independent Trustees may waive this mandatory retirement age policy with respect to individual Trustees. Officers and Advisory Board Members hold office without limit in time, except that any officer or Advisory Board Member may resign or may be removed by a vote of a majority of the Trustees at any regular meeting or any special meeting of the Trustees. Except as indicated, each individual has held the office shown or other offices in the same company for the past five years.
The fund’s Statement of Additional Information (SAI) includes more information about the Trustees. To request a free copy, call Fidelity at 1-877-208-0098.
Experience, Skills, Attributes, and Qualifications of the Trustees. The Governance and Nominating Committee has adopted a statement of policy that describes the experience, qualifications, attributes, and skills that are necessary and desirable for potential Independent Trustee candidates (Statement of Policy). The Board believes that each Trustee satisfied at the time he or she was initially elected or appointed a Trustee, and continues to satisfy, the standards contemplated by the Statement of Policy. The Governance and Nominating Committee also engages professional search firms to help identify potential Independent Trustee candidates who have the experience, qualifications, attributes, and skills consistent with the Statement of Policy. From time to time, additional criteria based on the composition and skills of the current Independent Trustees, as well as experience or skills that may be appropriate in light of future changes to board composition, business conditions, and regulatory or other developments, have also been considered by the professional search firms and the Governance and Nominating Committee. In addition, the Board takes into account the Trustees' commitment and participation in Board and committee meetings, as well as their leadership of standing and ad hoc committees throughout their tenure.
In determining that a particular Trustee was and continues to be qualified to serve as a Trustee, the Board has considered a variety of criteria, none of which, in isolation, was controlling. The Board believes that, collectively, the Trustees have balanced and diverse experience, qualifications, attributes, and skills, which allow the Board to operate effectively in governing the fund and protecting the interests of shareholders. Information about the specific experience, skills, attributes, and qualifications of each Trustee, which in each case led to the Board's conclusion that the Trustee should serve (or continue to serve) as a trustee of the fund, is provided below.
Board Structure and Oversight Function. James C. Curvey is an interested person and currently serves as Chairman. The Trustees have determined that an interested Chairman is appropriate and benefits shareholders because an interested Chairman has a personal and professional stake in the quality and continuity of services provided to the fund. Independent Trustees exercise their informed business judgment to appoint an individual of their choosing to serve as Chairman, regardless of whether the Trustee happens to be independent or a member of management. The Independent Trustees have determined that they can act independently and effectively without having an Independent Trustee serve as Chairman and that a key structural component for assuring that they are in a position to do so is for the Independent Trustees to constitute a substantial majority for the Board. The Independent Trustees also regularly meet in executive session. Ned C. Lautenbach serves as Chairman of the Independent Trustees and as such (i) acts as a liaison between the Independent Trustees and management with respect to matters important to the Independent Trustees and (ii) with management prepares agendas for Board meetings.
Fidelity® funds are overseen by different Boards of Trustees. The fund's Board oversees Fidelity's high income and certain equity funds, and other Boards oversee Fidelity's investment-grade bond, money market, asset allocation, and other equity funds. The asset allocation funds may invest in Fidelity® funds overseen by the fund's Board. The use of separate Boards, each with its own committee structure, allows the Trustees of each group of Fidelity® funds to focus on the unique issues of the funds they oversee, including common research, investment, and operational issues. On occasion, the separate Boards establish joint committees to address issues of overlapping consequences for the Fidelity® funds overseen by each Board.
The Trustees operate using a system of committees to facilitate the timely and efficient consideration of all matters of importance to the Trustees, the fund, and fund shareholders and to facilitate compliance with legal and regulatory requirements and oversight of the fund's activities and associated risks. The Board, acting through its committees, has charged FMR and its affiliates with (i) identifying events or circumstances the occurrence of which could have demonstrably adverse effects on the fund's business and/or reputation; (ii) implementing processes and controls to lessen the possibility that such events or circumstances occur or to mitigate the effects of such events or circumstances if they do occur; and (iii) creating and maintaining a system designed to evaluate continuously business and market conditions in order to facilitate the identification and implementation processes described in (i) and (ii) above. Because the day-to-day operations and activities of the fund are carried out by or through FMR, its affiliates, and other service providers, the fund's exposure to risks is mitigated but not eliminated by the processes overseen by the Trustees. While each of the Board's committees has responsibility for overseeing different aspects of the fund's activities, oversight is exercised primarily through the Operations, Audit, and Compliance Committees. In addition, the Independent Trustees have worked with Fidelity to enhance the Board's oversight of investment and financial risks, legal and regulatory risks, technology risks, and operational risks, including the development of additional risk reporting to the Board. Appropriate personnel, including but not limited to the fund's Chief Compliance Officer (CCO), FMR's internal auditor, the independent accountants, the fund's Treasurer and portfolio management personnel, make periodic reports to the Board's committees, as appropriate, including an annual review of Fidelity's risk management program for the Fidelity® funds. The responsibilities of each standing committee, including their oversight responsibilities, are described further under "Standing Committees of the Trustees."
Interested Trustees*:
Correspondence intended for a Trustee who is an interested person may be sent to Fidelity Investments, 245 Summer Street, Boston, Massachusetts 02210.
Name, Year of Birth; Principal Occupations and Other Relevant Experience+
Jonathan Chiel (1957)
Year of Election or Appointment: 2016
Trustee
Mr. Chiel also serves as Trustee of other Fidelity® funds. Mr. Chiel is Executive Vice President and General Counsel for FMR LLC (diversified financial services company, 2012-present). Previously, Mr. Chiel served as general counsel (2004-2012) and senior vice president and deputy general counsel (2000-2004) for John Hancock Financial Services; a partner with Choate, Hall & Stewart (1996-2000) (law firm); and an Assistant United States Attorney for the United States Attorney’s Office of the District of Massachusetts (1986-95), including Chief of the Criminal Division (1993-1995). Mr. Chiel is a director on the boards of the Boston Bar Foundation and the Maimonides School.
James C. Curvey (1935)
Year of Election or Appointment: 2007
Trustee
Chairman of the Board of Trustees
Mr. Curvey also serves as Trustee of other Fidelity® funds. Mr. Curvey is Vice Chairman (2007-present) and Director of FMR LLC (diversified financial services company). In addition, Mr. Curvey is an Overseer Emeritus for the Boston Symphony Orchestra, a Director of Artis-Naples, and a Trustee of Brewster Academy in Wolfeboro, New Hampshire. Previously, Mr. Curvey served as a Director of Fidelity Research & Analysis Co. (investment adviser firm, 2009-2018), Director of Fidelity Investments Money Management, Inc. (investment adviser firm, 2009-2014) and a Director of FMR and FMR Co., Inc. (investment adviser firms, 2007-2014).
Charles S. Morrison (1960)
Year of Election or Appointment: 2014
Trustee
Mr. Morrison also serves as Trustee of other funds. He serves as President of Fidelity SelectCo, LLC (investment adviser firm, 2017-present) and Fidelity Management & Research Company (FMR) (investment adviser firm, 2016-present), a Director of Fidelity Investments Money Management, Inc. (FIMM) (investment adviser firm, 2014-present), Director of Fidelity SelectCo, LLC (investment adviser firm, 2014-present), President, Asset Management (2014-present), and is an employee of Fidelity Investments. Previously, Mr. Morrison served as Vice President of Fidelity's Fixed Income and Asset Allocation Funds (2012-2014), President, Fixed Income (2011-2014), Vice President of Fidelity's Money Market Funds (2005-2009), President, Money Market Group Leader of FMR (investment adviser firm, 2009), and Senior Vice President, Money Market Group of FMR (2004-2009). Mr. Morrison also served as Vice President of Fidelity's Bond Funds (2002-2005), certain Balanced Funds (2002-2005), and certain Asset Allocation Funds (2002-2007), and as Senior Vice President (2002-2005) of Fidelity's Bond Division.
* Determined to be an “Interested Trustee” by virtue of, among other things, his or her affiliation with the trust or various entities under common control with FMR.
+ The information includes the Trustee's principal occupation during the last five years and other information relating to the experience, attributes, and skills relevant to the Trustee's qualifications to serve as a Trustee, which led to the conclusion that the Trustee should serve as a Trustee for the fund.
Independent Trustees:
Correspondence intended for an Independent Trustee may be sent to Fidelity Investments, P.O. Box 55235, Boston, Massachusetts 02205-5235.
Name, Year of Birth; Principal Occupations and Other Relevant Experience+
Dennis J. Dirks (1948)
Year of Election or Appointment: 2005
Trustee
Mr. Dirks also serves as Trustee of other Fidelity® funds. Prior to his retirement in May 2003, Mr. Dirks was Chief Operating Officer and a member of the Board of The Depository Trust & Clearing Corporation (DTCC). He also served as President, Chief Operating Officer, and Board member of The Depository Trust Company (DTC) and President and Board member of the National Securities Clearing Corporation (NSCC). In addition, Mr. Dirks served as Chief Executive Officer and Board member of the Government Securities Clearing Corporation, Chief Executive Officer and Board member of the Mortgage-Backed Securities Clearing Corporation, as a Trustee and a member of the Finance Committee of Manhattan College (2005-2008), as a Trustee and a member of the Finance Committee of AHRC of Nassau County (2006-2008), as a member of the Independent Directors Council (IDC) Governing Council (2010-2015), and as a member of the Board of Directors for The Brookville Center for Children’s Services, Inc. (2009-2017). Mr. Dirks is a member of the Finance Committee (2016-present), Board of Directors (2017-present) and Board of Trustees (2018-present) and is Treasurer (2018-present) of the Asolo Repertory Theatre.
Donald F. Donahue (1950)
Year of Election or Appointment: 2018
Trustee
Mr. Donahue also serves as a Trustee of other Fidelity® funds. Mr. Donahue is President and Chief Executive Officer of Miranda Partners, LLC (risk consulting for the financial services industry, 2012-present). Previously, Mr. Donahue served as a Member of the Advisory Board of certain Fidelity® funds (2015-2018) and Chief Executive Officer (2006-2012), Chief Operating Officer (2003-2006), and Managing Director, Customer Marketing and Development (1999-2003) of The Depository Trust & Clearing Corporation (financial markets infrastructure). Mr. Donahue serves as a Member (2007-present) and Co-Chairman (2016-present) of the Board of Directors of United Way of New York, Member of the Board of Directors of NYC Leadership Academy (2012-present) and Member of the Board of Advisors of Ripple Labs, Inc. (financial services, 2015-present). He also served as Chairman (2010-2012) and Member of the Board of Directors (2012-2013) of Omgeo, LLC (financial services), Treasurer of United Way of New York (2012-2016), and Member of the Board of Directors of XBRL US (financial services non-profit, 2009-2012) and the International Securities Services Association (2009-2012).
Alan J. Lacy (1953)
Year of Election or Appointment: 2008
Trustee
Mr. Lacy also serves as Trustee of other Fidelity® funds. Mr. Lacy serves as a Director of Bristol-Myers Squibb Company (global pharmaceuticals, 2008-present). He is a Trustee of the California Chapter of The Nature Conservancy (2015-present) and a Director of the Center for Advanced Study in the Behavioral Sciences at Stanford University (2015-present). In addition, Mr. Lacy served as Senior Adviser (2007-2014) of Oak Hill Capital Partners, L.P. (private equity) and also served as Chief Executive Officer (2005) and Vice Chairman (2005-2006) of Sears Holdings Corporation (retail) and Chief Executive Officer and Chairman of the Board of Sears, Roebuck and Co. (retail, 2000-2005). Previously, Mr. Lacy served as Chairman (2014-2017) and a member (2010-2017) of the Board of Directors of Dave & Buster’s Entertainment, Inc. (restaurant and entertainment complexes), as Chairman (2008-2011) and a member (2006-2015) of the Board of Trustees of the National Parks Conservation Association, and as a member of the Board of Directors for The Hillman Companies, Inc. (hardware wholesalers, 2010-2014), Earth Fare, Inc. (retail grocery, 2010-2014), and The Western Union Company (global money transfer, 2006-2011).
Ned C. Lautenbach (1944)
Year of Election or Appointment: 2000
Trustee
Chairman of the Independent Trustees
Mr. Lautenbach also serves as Trustee of other Fidelity® funds. Mr. Lautenbach currently serves as Vice Chair of the Board of Governors, State University System of Florida (2013-present) and is a member of the Council on Foreign Relations (1994-present). He is also a member and has most recently served as Chairman of the Board of Directors of Artis-Naples (2012-present). Previously, Mr. Lautenbach served as a member and then Lead Director of the Board of Directors of Eaton Corporation (diversified industrial, 1997-2016). He was also a Partner and Advisory Partner at Clayton, Dubilier & Rice, LLC (private equity investment, 1998-2010), as well as a Director of Sony Corporation (2006-2007). In addition, Mr. Lautenbach also had a 30-year career with IBM (technology company) during which time he served as Senior Vice President and a member of the Corporate Executive Committee (1968-1998).
Joseph Mauriello (1944)
Year of Election or Appointment: 2008
Trustee
Mr. Mauriello also serves as Trustee of other Fidelity® funds. Prior to his retirement in January 2006, Mr. Mauriello served in numerous senior management positions including Deputy Chairman and Chief Operating Officer (2004-2005), and Vice Chairman of Financial Services (2002-2004) of KPMG LLP US (professional services, 1965-2005). Mr. Mauriello currently serves as a member of the Board of Directors of XL Group plc. (global insurance and re-insurance, 2006-present) and the Independent Directors Council (IDC) Governing Council (2015-present). Previously, Mr. Mauriello served as a Director of the Hamilton Funds of the Bank of New York (2006-2007) and of Arcadia Resources Inc. (health care services and products, 2007-2012).
Cornelia M. Small (1944)
Year of Election or Appointment: 2005
Trustee
Ms. Small also serves as Trustee of other Fidelity® funds. Ms. Small is a member of the Board of Directors (2009-present) and Chair of the Investment Committee (2010-present) of the Teagle Foundation. Ms. Small also serves on the Investment Committee of the Berkshire Taconic Community Foundation (2008-present). Previously, Ms. Small served as Chairperson (2002-2008) and a member of the Investment Committee and Chairperson (2008-2012) and a member of the Board of Trustees of Smith College. In addition, Ms. Small served as Chief Investment Officer, Director of Global Equity Investments, and a member of the Board of Directors of Scudder, Stevens & Clark and Scudder Kemper Investments.
Garnett A. Smith (1947)
Year of Election or Appointment: 2018
Trustee
Mr. Smith also serves as Trustee of other Fidelity® funds. Prior to Mr. Smith's retirement, he served as Chairman and Chief Executive Officer of Inbrand Corp. (manufacturer of personal absorbent products, 1990-1997). He also served as President (1986-1990) of Inbrand Corp. Prior to his employment with Inbrand Corp., he was employed by a retail fabric chain and North Carolina National Bank. In addition, Mr. Smith served as a Member of the Advisory Board of certain Fidelity® funds (2012-2013) and as a board member of the Jackson Hole Land Trust (2009-2012).
David M. Thomas (1949)
Year of Election or Appointment: 2008
Trustee
Mr. Thomas also serves as Trustee of other Fidelity® funds. Mr. Thomas serves as Non-Executive Chairman of the Board of Directors of Fortune Brands Home and Security (home and security products, 2011-present), as a member of the Board of Directors (2004-present) and Presiding Director (2013-present) of Interpublic Group of Companies, Inc. (marketing communication), and as a member of the Board of Trustees of the University of Florida (2013-present). Previously, Mr. Thomas served as Executive Chairman (2005-2006) and Chairman and Chief Executive Officer (2000-2005) of IMS Health, Inc. (pharmaceutical and healthcare information solutions), and a Director of Fortune Brands, Inc. (consumer products, 2000-2011).
+ The information includes the Trustee's principal occupation during the last five years and other information relating to the experience, attributes, and skills relevant to the Trustee's qualifications to serve as a Trustee, which led to the conclusion that the Trustee should serve as a Trustee for the fund.
Advisory Board Members and Officers:
Correspondence intended for a Member of the Advisory Board (if any) may be sent to Fidelity Investments, P.O. Box 55235, Boston, Massachusetts 02205-5235. Correspondence intended for an officer or Peter S. Lynch may be sent to Fidelity Investments, 245 Summer Street, Boston, Massachusetts 02210. Officers appear below in alphabetical order.
Name, Year of Birth; Principal Occupation
Peter S. Lynch (1944)
Year of Election or Appointment: 2003
Member of the Advisory Board
Mr. Lynch also serves as Member of the Advisory Board of other Fidelity® funds. Mr. Lynch is Vice Chairman and a Director of FMR (investment adviser firm) and FMR Co., Inc. (investment adviser firm). In addition, Mr. Lynch serves as a Trustee of Boston College and as the Chairman of the Inner-City Scholarship Fund. Previously, Mr. Lynch served on the Special Olympics International Board of Directors (1997-2006).
William S. Stavropoulos (1939)
Year of Election or Appointment: 2018
Member of the Advisory Board
Mr. Stavropoulos also serves as Member of the Advisory Board of other Fidelity® funds. Mr. Stavropoulos serves as President and Founder of the Michigan Baseball Foundation, the Great Lakes Loons (2007-present). Mr. Stavropoulos is Chairman Emeritus of the Board of Directors of The Dow Chemical Company, where he previously served in numerous senior management positions, including President, CEO (1995-2000; 2002-2004), Chairman of the Executive Committee (2000-2006), and as a member of the Board of Directors (1990-2006). Currently, Mr. Stavropoulos is Chairman of the Board of Directors of Univar Inc. (global distributor of commodity and specialty chemicals), a Director of Teradata Corporation (data warehousing and technology solutions), and a member of the Advisory Board for Metalmark Capital LLC (private equity investment, 2005-present). Mr. Stavropoulos is an operating advisor to Clayton, Dubilier & Rice, LLC (private equity investment). In addition, Mr. Stavropoulos is a member of the University of Notre Dame Advisory Council for the College of Science, a Trustee of the Rollin L. Gerstacker Foundation, and a Director of Artis-Naples in Naples, Florida. Previously, Mr. Stavropoulos served as Trustee of certain Fidelity® funds (2001-2018) and as a Director of Chemical Financial Corporation (bank holding company, 1993-2012) and Tyco International, Ltd. (multinational manufacturing and services, 2007-2012).
Carol B. Tomé (1957)
Year of Election or Appointment: 2018
Member of the Advisory Board
Ms. Tomé also serves as Member of the Advisory Board of other Fidelity® funds. Ms. Tomé is Chief Financial Officer (2001-present) and Executive Vice President of Corporate Services (2007-present) of The Home Depot, Inc. (home improvement retailer) and a Director (2003-present) and Chair of the Audit Committee (2004-present) of United Parcel Service, Inc. (package delivery and supply chain management). Previously, Ms. Tomé served as Trustee of certain Fidelity® funds (2017), Senior Vice President of Finance and Accounting/Treasurer (2000-2007) and Vice President and Treasurer (1995-2000) of The Home Depot, Inc. and Chair of the Board (2010-2012), Vice Chair of the Board (2009 and 2013), and a Director (2008-2013) of the Federal Reserve Bank of Atlanta. Ms. Tomé is also a director or trustee of many community and professional organizations.
Michael E. Wiley (1950)
Year of Election or Appointment: 2018
Member of the Advisory Board
Mr. Wiley also serves as Trustee or Member of the Advisory Board of other Fidelity® funds. Mr. Wiley serves as a Director of Andeavor Corporation (independent oil refiner and marketer, 2005-present), a Director of Andeavor Logistics LP (natural resources logistics, 2015-present), and a Director of Bill Barrett Corporation (exploration and production, 2005-present). In addition, Mr. Wiley also serves as a Director of Post Oak Bank (privately-held bank, 2004-present). Previously, Mr. Wiley served as a Trustee of other Fidelity® funds (2008-2013), as a Director of Asia Pacific Exploration Consolidated (international oil and gas exploration and production, 2008-2013), as a member of the Board of Trustees of the University of Tulsa (2000-2006; 2007-2010), as a Senior Energy Advisor of Katzenbach Partners, LLC (consulting, 2006-2007), as an Advisory Director of Riverstone Holdings (private investment), Chairman, President, and CEO of Baker Hughes, Inc. (oilfield services, 2000-2004), and as Director of Spinnaker Exploration Company (exploration and production, 2001-2005).
Elizabeth Paige Baumann (1968)
Year of Election or Appointment: 2017
Anti-Money Laundering (AML) Officer
Ms. Baumann also serves as AML Officer of other funds. She is Chief AML Officer (2012-present) and Senior Vice President (2014-present) of FMR LLC (diversified financial services company) and is an employee of Fidelity Investments. Previously, Ms. Baumann served as AML Officer of the funds (2012-2016), and Vice President (2007-2014) and Deputy Anti-Money Laundering Officer (2007-2012) of FMR LLC.
Marc R. Bryant (1966)
Year of Election or Appointment: 2015
Secretary and Chief Legal Officer (CLO)
Mr. Bryant also serves as Secretary and CLO of other funds. Mr. Bryant serves as CLO, Secretary, and Senior Vice President of Fidelity Management & Research Company (investment adviser firm, 2015-present) and FMR Co., Inc. (investment adviser firm, 2015-present); Secretary of Fidelity SelectCo, LLC (investment adviser firm, 2015-present) and Fidelity Investments Money Management, Inc. (investment adviser firm, 2015-present); and CLO of Fidelity Management & Research (Hong Kong) Limited and FMR Investment Management (UK) Limited (investment adviser firms, 2015-present) and Fidelity Management & Research (Japan) Limited (investment adviser firm, 2016-present). He is Senior Vice President and Deputy General Counsel of FMR LLC (diversified financial services company). Previously, Mr. Bryant served as Secretary and CLO of Fidelity Rutland Square Trust II (2010-2014) and Assistant Secretary of Fidelity's Fixed Income and Asset Allocation Funds (2013-2015). Prior to joining Fidelity Investments, Mr. Bryant served as a Senior Vice President and the Head of Global Retail Legal for AllianceBernstein L.P. (2006-2010), and as the General Counsel for ProFund Advisors LLC (2001-2006).
John J. Burke III (1964)
Year of Election or Appointment: 2018
Chief Financial Officer
Mr. Burke also serves as Chief Financial Officer of other funds. Mr. Burke serves as Head of Investment Operations for Fidelity Fund and Investment Operations (2018-present) and is an employee of Fidelity Investments (1998-present). Previously Mr. Burke served as head of Asset Management Investment Operations (2012-2018).
William C. Coffey (1969)
Year of Election or Appointment: 2009
Assistant Secretary
Mr. Coffey also serves as Assistant Secretary of other funds. He is Senior Vice President and Deputy General Counsel of FMR LLC (diversified financial services company, 2010-present), and is an employee of Fidelity Investments. Previously, Mr. Coffey served as Vice President and Associate General Counsel of FMR LLC (2005-2009).
Timothy M. Cohen (1969)
Year of Election or Appointment: 2018
Vice President
Mr. Cohen also serves as Vice President of other funds. Mr. Cohen serves as Co-Head of Global Equity Research (2016-present), a Director of Fidelity Management & Research (Japan) Limited (investment adviser firm, 2016-present), and is an employee of Fidelity Investments. Previously, Mr. Cohen served as Chief Investment Officer - Equity and a Director of Fidelity Management & Research (U.K.) Inc. (investment adviser firm, 2013-2015) and as a Director of Fidelity Management & Research (Hong Kong) Limited (investment adviser firm, 2017).
Jonathan Davis (1968)
Year of Election or Appointment: 2010
Assistant Treasurer
Mr. Davis also serves as Assistant Treasurer of other funds. Mr. Davis serves as Assistant Treasurer of FMR Capital, Inc. (2017-present) and is an employee of Fidelity Investments. Previously, Mr. Davis served as Vice President and Associate General Counsel of FMR LLC (diversified financial services company, 2003-2010).
Adrien E. Deberghes (1967)
Year of Election or Appointment: 2016
Assistant Treasurer
Mr. Deberghes also serves as an officer of other funds. He serves as Assistant Treasurer of FMR Capital, Inc. (2017-present), Executive Vice President of Fidelity Investments Money Management, Inc. (FIMM) (investment adviser firm, 2016-present), and is an employee of Fidelity Investments (2008-present). Previously, Mr. Deberghes served as President and Treasurer of certain Fidelity® funds (2013-2018). Prior to joining Fidelity Investments, Mr. Deberghes was Senior Vice President of Mutual Fund Administration at State Street Corporation (2007-2008), Senior Director of Mutual Fund Administration at Investors Bank & Trust (2005-2007), and Director of Finance for Dunkin' Brands (2000-2005). Previously, Mr. Deberghes served in other fund officer roles.
Laura M. Del Prato (1964)
Year of Election or Appointment: 2018
Assistant Treasurer
Ms. Del Prato also serves as an officer of other funds. Ms. Del Prato is an employee of Fidelity Investments (2017-present). Prior to joining Fidelity Investments, Ms. Del Prato served as a Managing Director and Treasurer of the JPMorgan Mutual Funds (2014-2017). Prior to JPMorgan, Ms. Del Prato served as a partner at Cohen Fund Audit Services (accounting firm, 2012-2013) and KPMG LLP (accounting firm, 2004-2012).
Colm A. Hogan (1973)
Year of Election or Appointment: 2016
Deputy Treasurer
Mr. Hogan also serves as an officer of other funds. Mr. Hogan serves as Assistant Treasurer of FMR Capital, Inc. (2017-present) and is an employee of Fidelity Investments (2005-present). Previously, Mr. Hogan served as Assistant Treasurer of certain Fidelity® funds (2016-2018).
Pamela R. Holding (1964)
Year of Election or Appointment: 2018
Vice President
Ms. Holding also serves as a Vice President of other funds. Ms. Holding serves as Co-Head of Global Equity Research (2018-present) and is an employee of Fidelity Investments (2013-present).
Chris Maher (1972)
Year of Election or Appointment: 2013
Assistant Treasurer
Mr. Maher serves as Assistant Treasurer of other funds. Mr. Maher is Vice President of Valuation Oversight, serves as Assistant Treasurer of FMR Capital, Inc. (2017-present), and is an employee of Fidelity Investments. Previously, Mr. Maher served as Vice President of Asset Management Compliance (2013), Vice President of the Program Management Group of FMR (investment adviser firm, 2010-2013), and Vice President of Valuation Oversight (2008-2010).
Rieco E. Mello (1969)
Year of Election or Appointment: 2017
Assistant Treasurer
Mr. Mello also serves as Assistant Treasurer of other funds. Mr. Mello serves as Assistant Treasurer of FMR Capital, Inc. (2017-present) and is an employee of Fidelity Investments (1995-present).
Kenneth B. Robins (1969)
Year of Election or Appointment: 2016
Chief Compliance Officer
Mr. Robins also serves as an officer of other funds. Mr. Robins serves as Compliance Officer of Fidelity Management & Research Company and FMR Co., Inc. (investment adviser firms, 2016-present) and is an employee of Fidelity Investments (2004-present). Previously, Mr. Robins served as Executive Vice President of Fidelity Investments Money Management, Inc. (investment adviser firm, 2013-2016) and served in other fund officer roles.
Stacie M. Smith (1974)
Year of Election or Appointment: 2016
President and Treasurer
Ms. Smith also serves as an officer of other funds. Ms. Smith serves as Assistant Treasurer of FMR Capital, Inc. (2017-present), is an employee of Fidelity Investments (2009-present), and has served in other fund officer roles. Prior to joining Fidelity Investments, Ms. Smith served as Senior Audit Manager of Ernst & Young LLP (accounting firm, 1996-2009). Previously, Ms. Smith served as Assistant Treasurer (2013-2018) and Deputy Treasurer (2013-2016) of certain Fidelity® funds.
Marc L. Spector (1972)
Year of Election or Appointment: 2016
Assistant Treasurer
Mr. Spector also serves as an officer of other funds. Mr. Spector serves as Assistant Treasurer of FMR Capital, Inc. (2017-present) and is an employee of Fidelity Investments (2016-present). Prior to joining Fidelity Investments, Mr. Spector served as Director at the Siegfried Group (accounting firm, 2013-2016), and prior to Siegfried Group as audit senior manager at Deloitte & Touche (accounting firm, 2005-2013).
Renee Stagnone (1975)
Year of Election or Appointment: 2016
Assistant Treasurer
Ms. Stagnone also serves as an officer of other funds. Ms. Stagnone serves as Assistant Treasurer of FMR Capital, Inc. (2017-present) and is an employee of Fidelity Investments (1997-present). Previously, Ms. Stagnone served as Deputy Treasurer of certain Fidelity® funds (2013-2016).
Shareholder Expense Example
As a shareholder of the Fund, you incur two types of costs: (1) transaction costs, including sales charges (loads) on purchase payments or redemption proceeds, and (2) ongoing costs, including management fees, distribution and/or service (12b-1) fees and other Fund expenses. This Example is intended to help you understand your ongoing costs (in dollars) of investing in the Fund and to compare these costs with the ongoing costs of investing in other mutual funds.
The Example is based on an investment of $1,000 invested at the beginning of the period and held for the entire period (February 1, 2018 to July 31, 2018).
Actual Expenses
The first line of the accompanying table for each class of the Fund provides information about actual account values and actual expenses. You may use the information in this line, together with the amount you invested, to estimate the expenses that you paid over the period. Simply divide your account value by $1,000.00 (for example, an $8,600 account value divided by $1,000.00 = 8.6), then multiply the result by the number in the first line for a class of the Fund under the heading entitled "Expenses Paid During Period" to estimate the expenses you paid on your account during this period. A small balance maintenance fee of $12.00 that is charged once a year may apply for certain accounts with a value of less than $2,000. This fee is not included in the table below. If it was, the estimate of expenses you paid during the period would be higher, and your ending account value lower, by this amount. In addition, the Fund, as a shareholder in the underlying Fidelity Central Funds, will indirectly bear its pro-rata share of the fees and expenses incurred by the underlying Fidelity Central Funds. These fees and expenses are not included in the Fund's annualized expense ratio used to calculate the expense estimate in the table below.
Hypothetical Example for Comparison Purposes
The second line of the accompanying table for each class of the Fund provides information about hypothetical account values and hypothetical expenses based on a Class' actual expense ratio and an assumed rate of return of 5% per year before expenses, which is not the Class' actual return. The hypothetical account values and expenses may not be used to estimate the actual ending account balance or expenses you paid for the period. You may use this information to compare the ongoing costs of investing in the Fund and other funds. To do so, compare this 5% hypothetical example with the 5% hypothetical examples that appear in the shareholder reports of the other funds. A small balance maintenance fee of $12.00 that is charged once a year may apply for certain accounts with a value of less than $2,000. This fee is not included in the table below. If it was, the estimate of expenses you paid during the period would be higher, and your ending account value lower, by this amount. In addition, the Fund, as a shareholder in the underlying Fidelity Central Funds, will indirectly bear its pro-rata share of the fees and expenses incurred by the underlying Fidelity Central Funds. These fees and expenses are not included in the Fund's annualized expense ratio used to calculate the expense estimate in the table below.
Please note that the expenses shown in the table are meant to highlight your ongoing costs only and do not reflect any transaction costs. Therefore, the second line of the table is useful in comparing ongoing costs only, and will not help you determine the relative total costs of owning different funds. In addition, if these transactional costs were included, your costs would have been higher.
| | Annualized Expense Ratio-A | Beginning
Account Value
February 1, 2018 | Ending
Account Value
July 31, 2018 | Expenses Paid
During Period-B
February 1, 2018
to July 31, 2018 |
| Class A | 1.02% | | | |
| Actual | | $1,000.00 | $1,037.50 | $5.15 |
| Hypothetical-C | | $1,000.00 | $1,019.74 | $5.11 |
| Class M | 1.04% | | | |
| Actual | | $1,000.00 | $1,036.50 | $5.25 |
| Hypothetical-C | | $1,000.00 | $1,019.64 | $5.21 |
| Class C | 1.76% | | | |
| Actual | | $1,000.00 | $1,033.10 | $8.87 |
| Hypothetical-C | | $1,000.00 | $1,016.07 | $8.80 |
| Real Estate Income | .75% | | | |
| Actual | | $1,000.00 | $1,038.50 | $3.79 |
| Hypothetical-C | | $1,000.00 | $1,021.08 | $3.76 |
| Class I | .75% | | | |
| Actual | | $1,000.00 | $1,038.60 | $3.79 |
| Hypothetical-C | | $1,000.00 | $1,021.08 | $3.76 |
A Annualized expense ratio reflects expenses net of applicable fee waivers.
B Expenses are equal to each Class' annualized expense ratio, multiplied by the average account value over the period, multiplied by 181/365 (to reflect the one-half year period).
C 5% return per year before expenses
Distributions (Unaudited)
The Board of Trustees of Fidelity Real Estate Income Fund voted to pay to shareholders of record at the opening of business on record date, the following distributions per share derived from capital gains realized from sales of portfolio securities, and dividends derived from net investment income:
| | Pay Date | Record Date | Dividends | Capital Gains |
| Fidelity Real Estate Income Fund | | | | |
| Class A | 09/10/18 | 09/07/18 | $0.132 | $0.191 |
| Class M | 09/10/18 | 09/07/18 | $0.131 | $0.191 |
| Class C | 09/10/18 | 09/07/18 | $0.108 | $0.191 |
| Fidelity Real Estate Income | 09/10/18 | 09/07/18 | $0.140 | $0.191 |
| Class I | 09/10/18 | 09/07/18 | $0.141 | $0.191 |
The fund hereby designates as a capital gain dividend with respect to the taxable year ended July 31, 2018, $108,134,418, or, if subsequently determined to be different, the net capital gain of such year.
A total of 0.37% of the dividends distributed during the fiscal year was derived from interest on U.S. Government securities which is generally exempt from state income tax.
The fund designates $54,447,650 of distributions paid during the period January 1, 2018 to July 31, 2018 as qualifying to be taxed as interest-related dividends for nonresident alien shareholders.
The fund will notify shareholders in January 2019 of amounts for use in preparing 2018 income tax returns.
Board Approval of Investment Advisory Contracts and Management Fees
Fidelity Real Estate Income Fund
At its July 2018 meeting, the Board of Trustees, including the Independent Trustees (together, the Board), voted to continue the management contract with Fidelity Management & Research Company (FMR) and the sub-advisory agreements (together, the Advisory Contracts) for the fund for six months through January 31, 2019, in connection with the reunification of the Fidelity Equity High Income Funds Board, which oversees the fund, and the Sector Portfolios Board.
The Board considered that the approval of the fund's Advisory Contracts will not result in any changes in (i) the investment process or strategies employed in the management of the fund's assets; (ii) the fees and expenses paid by shareholders; (iii) the nature, extent or quality of services provided under the fund's Advisory Contracts; or (iv) the day-to-day management of the fund or the persons primarily responsible for such management. The Board concluded that the fund's Advisory Contracts are fair and reasonable, and that the fund's Advisory Contracts should be renewed, without modification, through January 31, 2019, with the understanding that the Board will consider the annual renewal for a full one year period in January 2019.
In connection with its consideration of future renewals of the fund's Advisory Contracts, the Board will consider: (i) the nature, extent and quality of services provided to the fund, including shareholder and administrative services and investment performance; (ii) the competitiveness of the management fee and total expenses for the fund; (iii) the costs of the services and profitability, including the revenues earned and the expenses incurred in conducting the business of developing, marketing, distributing, managing, administering, and servicing the fund and its shareholders, to the extent applicable, as well as potential fall-out benefits from Fidelity's non-fund businesses; and (iv) whether there have been economies of scale in respect of the Fidelity funds, whether the Fidelity funds (including the fund) have appropriately benefited from any such economies of scale, and whether there is the potential for realization of any further economies.
Based on its evaluation of all of the conclusions noted above, and after considering all factors it believed relevant, the Board ultimately concluded that the fund's management fee structure is fair and reasonable, and that the continuation of the fund's Advisory Contracts should be approved.
REIA-ANN-0918
1.907549.108
Fidelity® Real Estate Income Fund
Annual Report July 31, 2018 |
|
Contents
To view a fund's proxy voting guidelines and proxy voting record for the 12-month period ended June 30, visit http://www.fidelity.com/proxyvotingresults or visit the Securities and Exchange Commission's (SEC) web site at http://www.sec.gov.
You may also call 1-800-544-8544 to request a free copy of the proxy voting guidelines.
Standard & Poor's, S&P and S&P 500 are registered service marks of The McGraw-Hill Companies, Inc. and have been licensed for use by Fidelity Distributors Corporation.
Other third-party marks appearing herein are the property of their respective owners.
All other marks appearing herein are registered or unregistered trademarks or service marks of FMR LLC or an affiliated company. © 2018 FMR LLC. All rights reserved.
This report and the financial statements contained herein are submitted for the general information of the shareholders of the Fund. This report is not authorized for distribution to prospective investors in the Fund unless preceded or accompanied by an effective prospectus.
A fund files its complete schedule of portfolio holdings with the SEC for the first and third quarters of each fiscal year on Form N-Q. Forms N-Q are available on the SEC’s web site at http://www.sec.gov. A fund's Forms N-Q may be reviewed and copied at the SEC’s Public Reference Room in Washington, DC. Information regarding the operation of the SEC's Public Reference Room may be obtained by calling 1-800-SEC-0330.
For a complete list of a fund's portfolio holdings, view the most recent holdings listing, semiannual report, or annual report on Fidelity's web site at http://www.fidelity.com, http://www.institutional.fidelity.com, or http://www.401k.com, as applicable.
NOT FDIC INSURED •MAY LOSE VALUE •NO BANK GUARANTEE
Neither the Fund nor Fidelity Distributors Corporation is a bank.
Performance: The Bottom Line
Average annual total return reflects the change in the value of an investment, assuming reinvestment of distributions from dividend income and capital gains (the profits earned upon the sale of securities that have grown in value, if any) and assuming a constant rate of performance each year. The hypothetical investment and the average annual total returns do not reflect the deduction of taxes that a shareholder would pay on fund distributions or the redemption of fund shares. During periods of reimbursement by Fidelity, a fund’s total return will be greater than it would be had the reimbursement not occurred. How a fund did yesterday is no guarantee of how it will do tomorrow.
Average Annual Total Returns
| For the periods ended July 31, 2018 | Past 1 year | Past 5 years | Past 10 years |
| Fidelity® Real Estate Income Fund | 2.40% | 6.54% | 8.66% |
$10,000 Over 10 Years
Let's say hypothetically that $10,000 was invested in Fidelity® Real Estate Income Fund, a class of the fund, on July 31, 2008.
The chart shows how the value of your investment would have changed, and also shows how the S&P 500® Index performed over the same period.
| Period Ending Values |
| $22,942 | Fidelity® Real Estate Income Fund |
| $27,551 | S&P 500® Index |
Management's Discussion of Fund Performance
Market Recap: For the 12 months ending July 31, 2018, commercial real estate continued to benefit from a generally solid fundamental backdrop, with gently rising cash flows due to increasing rents and stable-to-rising occupancy rates. Certain markets, however, saw a modest pick-up in new supply, which slowed rental-income growth. For real estate investment trust (REIT) common stocks, it was an up-and-down period. U.S. REITs corrected sharply in late 2017 and the first two months of 2018 before enjoying a strong upward trend through the end of July. Higher interest rates also posed a headwind for U.S. REITs, as income-seeking investors perceived a correlation between the two. Against this backdrop, REIT common stocks, as measured by the FTSE
® NAREIT
® All REITs Index, gained 4.35%. In comparison, the S&P 500
® index, a measure of the broad U.S. stock market, rose 16.24%. Meanwhile, higher interest rates slowed more rate-sensitive asset types, such as real estate preferred stocks and bonds. The past 12 months, real estate preferreds gained 1.76%, as measured by the MSCI REIT Preferred Index, while the ICE BofAML
® US Real Estate Index – a market-capitalization-weighted measure of investment-grade corporate debt in the domestic real estate sector – returned -0.39%. In aggregate, real estate bonds continued to benefit from issuers’ strong credit quality, even as higher rates weighed on the securities’ prices.
Comments from Portfolio Manager Mark Snyderman: For the fiscal year, the fund's share classes (excluding sales charges, if applicable) returned roughly 1% to 2%, with all but one outpacing the 1.49% return of the Fidelity Real Estate Income Composite Index. The Composite index℠ is a 40/40/20 blend of the MSCI REIT Preferred Index, the ICE BofAML
® US Real Estate Index and FTSE
® NAREIT
® All REITs Index. I was mildly disappointed with the fund's performance, given my goal of generating a long-term annualized return in the mid-to-upper-single digits. On the positive side, however, I'm pleased with how the fund's real estate bond and preferred stocks did, given rising interest rates. Our portfolio of commercial mortgage-backed securities (CMBS) gained 5%, while our high-yield real estate bonds rose 4% and our investment-grade debt had a roughly flat result – all outperforming the ICE BofAML real estate bond index. Meanwhile, our preferred stock portfolio gained 5%, outperforming the MSCI preferred stock index. I was happy with the performance of these asset classes because of my regular focus on managing the fund's interest rate risk. In contrast, several of our common stock holdings underperformed this period, led by a poor-performing position in Colony NorthStar that, in hindsight, was a mistake because the company's businesses haven't been as strong as I expected. Overall, our common stock portfolio produced a slightly positive return, compared with a 4.35% increase for the FTSE NAREIT index.
The views expressed above reflect those of the portfolio manager(s) only through the end of the period as stated on the cover of this report and do not necessarily represent the views of Fidelity or any other person in the Fidelity organization. Any such views are subject to change at any time based upon market or other conditions and Fidelity disclaims any responsibility to update such views. These views may not be relied on as investment advice and, because investment decisions for a Fidelity fund are based on numerous factors, may not be relied on as an indication of trading intent on behalf of any Fidelity fund.
Investment Summary (Unaudited)
Top Five Stocks as of July 31, 2018
| | % of fund's net assets |
| Equity Lifestyle Properties, Inc. | 2.9 |
| Apartment Investment & Management Co. Class A | 2.4 |
| Acadia Realty Trust (SBI) | 2.2 |
| Ventas, Inc. | 2.1 |
| MFA Financial, Inc. | 2.0 |
| | 11.6 |
Top 5 Bonds as of July 31, 2018
| | % of fund's net assets |
| Senior Housing Properties Trust 4.75% 5/1/24 | 0.9 |
| RWT Holdings, Inc. 5.625% 11/15/19 | 0.7 |
| PennyMac Corp. 5.375% 5/1/20 | 0.7 |
| Kennedy-Wilson, Inc. 5.875% 4/1/24 | 0.7 |
| GS Mortgage Securities Trust Series 2016-REMZ Class MZB, 7.727% 2/10/21 | 0.6 |
| | 3.6 |
Top Five REIT Sectors as of July 31, 2018
| | % of fund's net assets |
| REITs - Mortgage | 16.5 |
| REITs - Health Care | 8.3 |
| REITs - Apartments | 7.4 |
| REITs - Diversified | 6.6 |
| REITs - Shopping Centers | 4.0 |
Asset Allocation (% of fund's net assets)
| As of July 31, 2018* |
| | Common Stocks | 31.9% |
| | Preferred Stocks | 17.1% |
| | Bonds | 33.6% |
| | Convertible Securities | 6.0% |
| | Other Investments | 4.6% |
| | Short-Term Investments and Net Other Assets (Liabilities) | 6.8% |

* Foreign investments - 2.0%
Schedule of Investments July 31, 2018
Showing Percentage of Net Assets
| Common Stocks - 31.9% | | | |
| | | Shares | Value |
| CONSUMER DISCRETIONARY - 0.5% | | | |
| Hotels, Restaurants & Leisure - 0.5% | | | |
| Wyndham Destinations, Inc. | | 271,200 | $12,507,744 |
| Wyndham Hotels & Resorts, Inc. | | 191,100 | 11,083,800 |
| | | | 23,591,544 |
| FINANCIALS - 5.0% | | | |
| Capital Markets - 1.1% | | | |
| Brookfield Asset Management, Inc. Class A | | 674,100 | 28,443,978 |
| Ellington Financial LLC (a) | | 1,635,484 | 26,952,776 |
| | | | 55,396,754 |
| Insurance - 0.1% | | | |
| FNF Group | | 188,500 | 7,634,250 |
| Mortgage Real Estate Investment Trusts - 3.8% | | | |
| Anworth Mortgage Asset Corp. | | 371,436 | 1,872,037 |
| Chimera Investment Corp. | | 1,383,600 | 26,426,760 |
| Dynex Capital, Inc. | | 1,315,663 | 8,749,159 |
| Ellington Residential Mortgage REIT (b) | | 350,300 | 3,923,360 |
| Great Ajax Corp. (a) | | 1,577,762 | 21,094,678 |
| Hunt Companies Finance Trust I (b) | | 547,901 | 1,835,468 |
| Invesco Mortgage Capital, Inc. | | 1,130,349 | 18,752,490 |
| MFA Financial, Inc. | | 12,785,422 | 102,922,647 |
| New Residential Investment Corp. | | 154,000 | 2,755,060 |
| Redwood Trust, Inc. | | 647,900 | 10,891,199 |
| | | | 199,222,858 |
|
| TOTAL FINANCIALS | | | 262,253,862 |
|
| REAL ESTATE - 26.4% | | | |
| Equity Real Estate Investment Trusts (REITs) - 25.9% | | | |
| Acadia Realty Trust (SBI) (a) | | 4,365,249 | 118,210,943 |
| American Homes 4 Rent Class A | | 948,722 | 21,004,705 |
| American Tower Corp. | | 654,300 | 96,993,432 |
| Apartment Investment & Management Co. Class A | | 2,927,796 | 124,870,499 |
| AvalonBay Communities, Inc. | | 192,200 | 33,990,570 |
| Boardwalk (REIT) (b) | | 256,500 | 9,022,900 |
| Brixmor Property Group, Inc. | | 308,200 | 5,452,058 |
| Cedar Realty Trust, Inc. | | 299,963 | 1,427,824 |
| Colony NorthStar, Inc. | | 8,369,748 | 51,557,648 |
| Crown Castle International Corp. | | 133,100 | 14,751,473 |
| DDR Corp. | | 1,379,550 | 18,899,835 |
| Equinix, Inc. | | 151,600 | 66,594,848 |
| Equity Lifestyle Properties, Inc. | | 1,671,802 | 152,117,257 |
| Equity Residential (SBI) | | 895,203 | 58,573,132 |
| Extra Space Storage, Inc. | | 88,800 | 8,344,536 |
| Gramercy Property Trust | | 632,447 | 17,322,723 |
| Healthcare Realty Trust, Inc. | | 431,300 | 12,813,923 |
| Healthcare Trust of America, Inc. | | 1,158,860 | 31,660,055 |
| Lexington Corporate Properties Trust | | 4,316,674 | 37,943,564 |
| Mid-America Apartment Communities, Inc. | | 847,806 | 85,441,889 |
| Omega Healthcare Investors, Inc. (b) | | 1,021,123 | 30,317,142 |
| Public Storage | | 168,491 | 36,702,395 |
| Rexford Industrial Realty, Inc. | | 307,400 | 9,418,736 |
| Sabra Health Care REIT, Inc. | | 2,698,275 | 58,309,723 |
| Safety Income and Growth, Inc. | | 393,600 | 7,006,080 |
| Senior Housing Properties Trust (SBI) | | 2,539,000 | 45,295,760 |
| Spirit MTA REIT | | 120,120 | 1,199,999 |
| Spirit Realty Capital, Inc. | | 1,201,200 | 10,054,044 |
| Store Capital Corp. | | 1,007,100 | 27,644,895 |
| Terreno Realty Corp. | | 503,628 | 18,588,909 |
| Ventas, Inc. | | 1,940,686 | 109,415,877 |
| VEREIT, Inc. | | 2,775,234 | 21,175,035 |
| Welltower, Inc. | | 343,974 | 21,532,772 |
| | | | 1,363,655,181 |
| Real Estate Management & Development - 0.5% | | | |
| Colony NorthStar Credit Real Estate, Inc. (b) | | 963,071 | 20,474,889 |
| Retail Value, Inc. (c) | | 137,955 | 4,558,033 |
| | | | 25,032,922 |
|
| TOTAL REAL ESTATE | | | 1,388,688,103 |
|
| TOTAL COMMON STOCKS | | | |
| (Cost $1,442,302,243) | | | 1,674,533,509 |
|
| Preferred Stocks - 18.6% | | | |
| Convertible Preferred Stocks - 1.5% | | | |
| FINANCIALS - 0.3% | | | |
| Mortgage Real Estate Investment Trusts - 0.3% | | | |
| Great Ajax Corp. 7.25% | | 281,000 | 6,982,400 |
| Sutherland Asset Management Corp. 7.00% | | 404,700 | 10,643,610 |
| | | | 17,626,010 |
| REAL ESTATE - 1.2% | | | |
| Equity Real Estate Investment Trusts (REITs) - 1.1% | | | |
| Alexandria Real Estate Equities, Inc. Series D, 7.00% | | 136,759 | 4,778,305 |
| Braemar Hotels & Resorts, Inc. 5.50% | | 95,791 | 1,829,608 |
| Equity Commonwealth 6.50% | | 31,237 | 810,319 |
| iStar Financial, Inc. Series J, 4.50% | | 213,773 | 10,047,630 |
| Lexington Corporate Properties Trust Series C, 6.50% | | 468,142 | 22,933,808 |
| QTS Realty Trust, Inc. 6.50% (c) | | 42,000 | 4,444,440 |
| RLJ Lodging Trust Series A, 1.95% | | 31,935 | 841,487 |
| Wheeler REIT, Inc. 8.75% | | 516,748 | 10,267,783 |
| | | | 55,953,380 |
| Real Estate Management & Development - 0.1% | | | |
| Landmark Infrastructure Partners LP 7.012% | | 191,800 | 4,420,990 |
| TOTAL REAL ESTATE | | | 60,374,370 |
|
| TOTAL CONVERTIBLE PREFERRED STOCKS | | | 78,000,380 |
|
| Nonconvertible Preferred Stocks - 17.1% | | | |
| ENERGY - 0.0% | | | |
| Oil, Gas & Consumable Fuels - 0.0% | | | |
| Global Partners LP 9.75% | | 120,000 | 3,000,000 |
| FINANCIALS - 8.0% | | | |
| Capital Markets - 0.1% | | | |
| Arlington Asset Investment Corp. 6.625% | | 182,517 | 4,451,097 |
| Mortgage Real Estate Investment Trusts - 7.8% | | | |
| AG Mortgage Investment Trust, Inc.: | | | |
| 8.00% | | 618,287 | 15,716,856 |
| 8.25% | | 38,935 | 1,001,408 |
| AGNC Investment Corp.: | | | |
| Series B, 7.75% | | 427,100 | 11,028,576 |
| Series C, 7.00% | | 361,900 | 9,379,109 |
| American Capital Mortgage Investment Corp. Series A, 8.125% | | 248,636 | 6,399,741 |
| Annaly Capital Management, Inc.: | | | |
| Series C, 7.625% | | 190,417 | 4,857,271 |
| Series D, 7.50% | | 621,976 | 15,816,850 |
| Series F, 6.95% | | 1,250,552 | 31,857,312 |
| Series G, 6.50% | | 720,300 | 17,481,681 |
| Anworth Mortgage Asset Corp. Series A, 8.625% | | 238,275 | 6,397,350 |
| Apollo Commercial Real Estate Finance, Inc. Series C, 8.00% | | 485,559 | 12,418,171 |
| Arbor Realty Trust, Inc.: | | | |
| Series A, 8.25% | | 189,089 | 4,906,860 |
| Series B, 7.75% | | 240,000 | 6,153,600 |
| Series C, 8.50% | | 100,000 | 2,642,000 |
| Armour Residential REIT, Inc. Series B, 7.875% | | 153,654 | 3,844,638 |
| Capstead Mortgage Corp. Series E, 7.50% | | 202,984 | 5,105,048 |
| Cherry Hill Mortgage Investment Corp. Series A, 8.20% | | 246,500 | 6,285,750 |
| Chimera Investment Corp.: | | | |
| Series A, 8.00% | | 204,800 | 5,267,456 |
| Series B, 8.00% | | 1,259,804 | 32,878,995 |
| CYS Investments, Inc.: | | | |
| Series A, 7.75% | | 118,428 | 2,965,437 |
| Series B, 7.50% | | 496,667 | 12,268,172 |
| Dynex Capital, Inc.: | | | |
| Series A, 8.50% | | 362,932 | 9,247,507 |
| Series B, 7.625% | | 252,120 | 6,214,758 |
| Exantas Capital Corp. 8.625% | | 168,316 | 4,285,309 |
| Hunt Companies Finance Trust I Series A, 8.75% | | 86,727 | 2,187,255 |
| Invesco Mortgage Capital, Inc.: | | | |
| 7.50% | | 1,244,215 | 31,105,375 |
| Series A, 7.75% | | 123,342 | 3,102,051 |
| Series B, 7.75% | | 856,479 | 22,299,630 |
| MFA Financial, Inc.: | | | |
| 8.00% | | 538,930 | 13,845,112 |
| Series B, 7.50% | | 616,232 | 15,597,448 |
| New York Mortgage Trust, Inc.: | | | |
| Series B, 7.75% | | 284,267 | 6,869,312 |
| Series C, 7.875% | | 280,725 | 6,830,039 |
| Series D, 8.00% | | 313,300 | 7,475,338 |
| PennyMac Mortgage Investment Trust: | | | |
| 8.125% | | 335,500 | 8,461,276 |
| Series B, 8.00% | | 593,631 | 14,977,310 |
| Two Harbors Investment Corp.: | | | |
| Series A, 8.125% | | 450,000 | 12,094,335 |
| Series B, 7.625% | | 618,504 | 15,808,962 |
| Series C, 7.25% | | 509,288 | 12,548,143 |
| Wells Fargo Real Estate Investment Corp. Series A, 6.375% | | 137,600 | 3,605,120 |
| | | | 411,226,561 |
| Real Estate Management & Development - 0.1% | | | |
| Brookfield Properties Corp. Series EE, 5.10% | | 264,300 | 5,122,038 |
| TOTAL FINANCIALS | | | 420,799,696 |
| REAL ESTATE - 9.0% | | | |
| Equity Real Estate Investment Trusts (REITs) - 8.9% | | | |
| American Homes 4 Rent: | | | |
| Series D, 6.50% | | 280,000 | 7,336,000 |
| Series E, 6.35% | | 210,000 | 5,451,621 |
| Series F, 5.875% | | 250,809 | 6,270,225 |
| Series G, 5.875% | | 202,000 | 4,995,460 |
| Ashford Hospitality Trust, Inc.: | | | |
| Series D, 8.45% | | 11,770 | 305,369 |
| Series F, 7.375% | | 268,000 | 6,463,946 |
| Series G, 7.375% | | 120,000 | 2,910,000 |
| Series H, 7.50% | | 168,800 | 4,137,474 |
| Series I, 7.50% | | 168,900 | 4,099,693 |
| Bluerock Residential Growth (REIT), Inc.: | | | |
| Series A, 8.25% | | 486,775 | 12,465,334 |
| Series C, 7.625% | | 146,969 | 3,624,285 |
| Series D, 7.125% | | 170,000 | 3,891,300 |
| Cedar Realty Trust, Inc.: | | | |
| Series B, 7.25% | | 97,922 | 2,446,092 |
| Series C, 6.50% | | 294,900 | 6,859,374 |
| City Office REIT, Inc. Series A, 6.625% | | 180,500 | 4,458,350 |
| Colony NorthStar, Inc.: | | | |
| Series B, 8.25% | | 207,861 | 5,352,421 |
| Series E, 8.75% | | 486,229 | 12,787,823 |
| Series G, 7.50% | | 195,730 | 4,728,837 |
| Series H, 7.125% | | 705,944 | 16,653,219 |
| Series I, 7.15% | | 797,130 | 18,597,043 |
| Series J, 7.15% | | 918,648 | 21,404,498 |
| DDR Corp.: | | | |
| Series J, 6.50% | | 340,721 | 8,463,510 |
| Series K, 6.25% | | 228,888 | 5,548,245 |
| Digital Realty Trust, Inc.: | | | |
| Series C, 6.625% | | 84,000 | 2,232,720 |
| Series G, 5.875% | | 40,444 | 1,022,020 |
| Series H, 7.375% | | 50,000 | 1,301,400 |
| Farmland Partners, Inc. Series B, 6.00% | | 630,200 | 14,614,338 |
| General Growth Properties, Inc. Series A, 6.375% | | 190,963 | 4,690,051 |
| Gladstone Commercial Corp. Series D, 7.00% | | 538,800 | 13,672,050 |
| Gladstone Land Corp. Series A, 6.375% | | 64,000 | 1,630,080 |
| Global Medical REIT, Inc. Series A, 7.50% | | 135,100 | 3,353,858 |
| Global Net Lease, Inc. Series A, 7.25% | | 509,800 | 12,903,446 |
| Government Properties Income Trust 5.875% | | 202,500 | 5,100,975 |
| Hersha Hospitality Trust: | | | |
| Series C, 6.875% | | 50,000 | 1,219,500 |
| Series D, 6.50% | | 200,000 | 4,624,000 |
| Investors Real Estate Trust Series C, 6.625% | | 320,900 | 7,947,506 |
| iStar Financial, Inc.: | | | |
| Series D, 8.00% | | 188,329 | 4,802,390 |
| Series G, 7.65% | | 222,721 | 5,576,934 |
| Series I, 7.50% | | 161,269 | 3,972,055 |
| Jernigan Capital, Inc. Series B, 7.00% | | 84,284 | 2,037,363 |
| LaSalle Hotel Properties: | | | |
| Series I, 6.375% | | 354,698 | 8,849,715 |
| Series J, 6.30% | | 240,000 | 6,048,000 |
| Monmouth Real Estate Investment Corp. Series C, 6.125% | | 225,900 | 5,512,773 |
| National Retail Properties, Inc. Series E, 5.70% | | 301,404 | 7,607,738 |
| National Storage Affiliates Trust Series A, 6.00% | | 67,600 | 1,688,648 |
| Pebblebrook Hotel Trust: | | | |
| Series C, 6.50% | | 204,321 | 5,142,514 |
| Series D, 6.375% | | 350,000 | 8,725,500 |
| Pennsylvania (REIT): | | | |
| Series B, 7.375% | | 100,510 | 2,466,515 |
| Series C, 7.20% | | 51,000 | 1,199,520 |
| Series D, 6.875% | | 151,800 | 3,427,644 |
| Plymouth Industrial REIT, Inc. Series A, 7.50% | | 169,400 | 4,217,891 |
| Prologis, Inc. Series Q, 8.54% | | 94,446 | 6,058,711 |
| Public Storage: | | | |
| Series F, 5.15% | | 173,400 | 4,303,788 |
| Series Y, 6.375% | | 102,224 | 2,641,468 |
| QTS Realty Trust, Inc. Series A, 7.125% | | 30,000 | 766,200 |
| RAIT Financial Trust: | | | |
| 7.125% | | 336,786 | 7,682,089 |
| 7.625% | | 224,590 | 4,395,226 |
| Rexford Industrial Realty, Inc.: | | | |
| Series A, 5.875% | | 135,000 | 3,324,038 |
| Series B, 5.875% | | 79,500 | 1,955,700 |
| Saul Centers, Inc.: | | | |
| Series C, 6.875% | | 183,479 | 4,586,975 |
| Series D, 6.125% | | 83,700 | 1,966,950 |
| Sotherly Hotels, Inc.: | | | |
| Series B, 8.00% | | 68,000 | 1,721,080 |
| Series C, 7.875% | | 108,200 | 2,708,571 |
| Spirit Realty Capital, Inc. Series A, 6.00% | | 95,200 | 2,239,409 |
| Stag Industrial, Inc. Series C, 6.875% | | 83,000 | 2,186,793 |
| Summit Hotel Properties, Inc.: | | | |
| Series D, 6.45% | | 210,000 | 5,105,100 |
| Series E, 6.25% | | 190,000 | 4,489,700 |
| Sunstone Hotel Investors, Inc.: | | | |
| Series E, 6.95% | | 42,000 | 1,094,310 |
| Series F, 6.45% | | 84,000 | 2,125,200 |
| Taubman Centers, Inc. Series K, 6.25% | | 157,322 | 3,925,184 |
| UMH Properties, Inc.: | | | |
| Series B, 8.00% | | 319,604 | 8,629,308 |
| Series C, 6.75% | | 341,140 | 8,825,292 |
| Series D, 6.375% | | 93,800 | 2,248,395 |
| Urstadt Biddle Properties, Inc.: | | | |
| Series G, 6.75% | | 160,000 | 4,016,000 |
| Series H, 6.25% | | 284,500 | 7,077,194 |
| VEREIT, Inc. Series F, 6.70% | | 1,959,376 | 49,885,713 |
| Washington Prime Group, Inc.: | | | |
| Series H, 7.50% | | 198,527 | 4,635,605 |
| Series I, 6.875% | | 298,115 | 6,278,302 |
| | | | 469,709,564 |
| Real Estate Management & Development - 0.1% | | | |
| Landmark Infrastructure Partners LP Series B, 7.90% | | 117,700 | 2,846,928 |
| TOTAL REAL ESTATE | | | 472,556,492 |
| UTILITIES - 0.1% | | | |
| Electric Utilities - 0.1% | | | |
| Brookfield Infrastructure Partners LP Series 5, 5.35% | | 169,300 | 3,364,266 |
|
| TOTAL NONCONVERTIBLE PREFERRED STOCKS | | | 899,720,454 |
|
| TOTAL PREFERRED STOCKS | | | |
| (Cost $960,623,563) | | | 977,720,834 |
| | | Principal Amount | Value |
|
| Corporate Bonds - 19.0% | | | |
| Convertible Bonds - 4.5% | | | |
| CONSUMER DISCRETIONARY - 0.1% | | | |
| Textiles, Apparel & Luxury Goods - 0.1% | | | |
| KKR Real Estate Finance Trust, Inc. 6.125% 5/15/23 unit (d) | | 8,100,000 | 8,104,050 |
| FINANCIALS - 4.4% | | | |
| Diversified Financial Services - 0.1% | | | |
| Granite Point Mortgage Trust, Inc. 5.625% 12/1/22 (d) | | 6,770,000 | 6,912,231 |
| Mortgage Real Estate Investment Trusts - 4.3% | | | |
| Arbor Realty Trust, Inc.: | | | |
| 5.25% 7/1/21 (d) | | 5,100,000 | 5,206,131 |
| 5.25% 7/1/21 (d) | | 6,710,000 | 6,589,904 |
| Blackstone Mortgage Trust, Inc.: | | | |
| 4.375% 5/5/22 | | 16,780,000 | 16,542,009 |
| 4.75% 3/15/23 | | 3,900,000 | 3,810,983 |
| Colony Financial, Inc.: | | | |
| 3.875% 1/15/21 | | 19,280,000 | 18,248,520 |
| 5% 4/15/23 | | 26,083,000 | 24,713,643 |
| Exantas Capital Corp.: | | | |
| 4.5% 8/15/22 | | 5,050,000 | 5,122,629 |
| 6% 12/1/18 | | 6,100,000 | 6,245,180 |
| 8% 1/15/20 | | 13,890,000 | 14,385,317 |
| PennyMac Corp. 5.375% 5/1/20 | | 35,606,000 | 35,609,454 |
| Redwood Trust, Inc. 5.625% 7/15/24 | | 11,710,000 | 11,527,020 |
| RWT Holdings, Inc. 5.625% 11/15/19 | | 36,880,000 | 37,292,134 |
| Starwood Property Trust, Inc. 4.375% 4/1/23 | | 11,080,000 | 11,119,412 |
| Two Harbors Investment Corp. 6.25% 1/15/22 | | 4,380,000 | 4,506,600 |
| Western Asset Mortgage Capital Corp. 6.75% 10/1/22 | | 21,100,000 | 21,745,386 |
| | | | 222,664,322 |
| TOTAL FINANCIALS | | | 229,576,553 |
|
| TOTAL CONVERTIBLE BONDS | | | 237,680,603 |
|
| Nonconvertible Bonds - 14.5% | | | |
| CONSUMER DISCRETIONARY - 3.4% | | | |
| Hotels, Restaurants & Leisure - 0.3% | | | |
| ESH Hospitality, Inc. 5.25% 5/1/25 (d) | | 8,040,000 | 7,798,800 |
| FelCor Lodging LP 6% 6/1/25 | | 2,025,000 | 2,070,563 |
| Times Square Hotel Trust 8.528% 8/1/26 (d) | | 6,483,409 | 7,478,827 |
| | | | 17,348,190 |
| Household Durables - 3.1% | | | |
| Ashton Woods U.S.A. LLC/Ashton Woods Finance Co.: | | | |
| 6.75% 8/1/25 (d) | | 14,772,000 | 13,830,285 |
| 6.875% 2/15/21 (d) | | 15,709,000 | 15,787,545 |
| Beazer Homes U.S.A., Inc.: | | | |
| 5.875% 10/15/27 | | 7,605,000 | 6,616,350 |
| 6.75% 3/15/25 | | 5,850,000 | 5,499,000 |
| 8.75% 3/15/22 | | 7,540,000 | 8,007,857 |
| Brookfield Residential Properties, Inc./Brookfield Residential U.S. Corp. 6.125% 7/1/22 (d) | | 5,495,000 | 5,522,475 |
| Brookfield Residential Properties, Inc.: | | | |
| 6.375% 5/15/25 (d) | | 5,580,000 | 5,552,100 |
| 6.5% 12/15/20 (d) | | 12,085,000 | 12,217,935 |
| KB Home 8% 3/15/20 | | 8,465,000 | 8,994,063 |
| LGI Homes, Inc. 6.875% 7/15/26 (d) | | 4,245,000 | 4,245,000 |
| M/I Homes, Inc.: | | | |
| 5.625% 8/1/25 | | 7,965,000 | 7,469,577 |
| 6.75% 1/15/21 | | 3,803,000 | 3,902,829 |
| Meritage Homes Corp.: | | | |
| 5.125% 6/6/27 | | 5,035,000 | 4,619,613 |
| 6% 6/1/25 | | 4,000,000 | 4,027,560 |
| 7% 4/1/22 | | 7,525,000 | 8,089,375 |
| 7.15% 4/15/20 | | 7,060,000 | 7,377,700 |
| New Home Co. LLC 7.25% 4/1/22 | | 9,200,000 | 9,436,072 |
| Taylor Morrison Communities, Inc./Monarch Communities, Inc. 5.875% 4/15/23 (d) | | 4,100,000 | 4,088,520 |
| TRI Pointe Homes, Inc.: | | | |
| 5.25% 6/1/27 | | 5,045,000 | 4,628,788 |
| 5.875% 6/15/24 | | 7,890,000 | 7,830,825 |
| William Lyon Homes, Inc.: | | | |
| 5.875% 1/31/25 | | 6,135,000 | 5,798,557 |
| 7% 8/15/22 | | 8,180,000 | 8,333,375 |
| | | | 161,875,401 |
| Media - 0.0% | | | |
| CBS Outdoor Americas Capital LLC/CBS Outdoor Americas Capital Corp. 5.625% 2/15/24 | | 1,300,000 | 1,311,037 |
| TOTAL CONSUMER DISCRETIONARY | | | 180,534,628 |
| CONSUMER STAPLES - 0.8% | | | |
| Food & Staples Retailing - 0.8% | | | |
| Ahold Lease U.S.A., Inc. 7.82% 1/2/20 | | 87,104 | 88,700 |
| Albertsons Companies LLC/Safeway, Inc./New Albertson's, Inc./Albertson's LLC: | | | |
| 5.75% 3/15/25 | | 17,225,000 | 15,469,428 |
| 6.625% 6/15/24 | | 10,760,000 | 10,302,700 |
| Albertsons, Inc. 8.7% 5/1/30 | | 5,080,000 | 4,394,200 |
| C&S Group Enterprises LLC 5.375% 7/15/22 (d) | | 9,705,000 | 9,620,081 |
| Cumberland Farms, Inc. 6.75% 5/1/25 (d) | | 2,075,000 | 2,087,969 |
| | | | 41,963,078 |
| FINANCIALS - 0.6% | | | |
| Diversified Financial Services - 0.6% | | | |
| Brixmor Operating Partnership LP: | | | |
| 3.65% 6/15/24 | | 6,000,000 | 5,774,001 |
| 3.85% 2/1/25 | | 8,384,000 | 8,086,364 |
| Five Point Operation Co. LP 7.875% 11/15/25 (d) | | 11,025,000 | 11,190,375 |
| Icahn Enterprises LP/Icahn Enterprises Finance Corp.: | | | |
| 5.875% 2/1/22 | | 3,680,000 | 3,703,000 |
| 6.25% 2/1/22 | | 1,695,000 | 1,727,832 |
| | | | 30,481,572 |
| Mortgage Real Estate Investment Trusts - 0.0% | | | |
| Starwood Property Trust, Inc. 4.75% 3/15/25 (d) | | 4,235,000 | 4,182,063 |
| TOTAL FINANCIALS | | | 34,663,635 |
| HEALTH CARE - 0.5% | | | |
| Health Care Providers & Services - 0.5% | | | |
| QCP SNF West (REIT) LLC 8.125% 11/1/23 (d) | | 6,245,000 | 6,791,438 |
| Sabra Health Care LP/Sabra Capital Corp.: | | | |
| 5.375% 6/1/23 | | 5,675,000 | 5,689,188 |
| 5.5% 2/1/21 | | 12,305,000 | 12,474,194 |
| | | | 24,954,820 |
| INDUSTRIALS - 0.2% | | | |
| Building Products - 0.2% | | | |
| Shea Homes Ltd. Partnership/Corp. 6.125% 4/1/25 (d) | | 8,900,000 | 8,811,000 |
| INFORMATION TECHNOLOGY - 0.1% | | | |
| Internet Software & Services - 0.1% | | | |
| CyrusOne LP/CyrusOne Finance Corp. 5% 3/15/24 | | 3,610,000 | 3,623,538 |
| REAL ESTATE - 8.9% | | | |
| Equity Real Estate Investment Trusts (REITs) - 6.5% | | | |
| ARC Properties Operating Partnership LP 4.6% 2/6/24 | | 10,480,000 | 10,493,058 |
| Care Capital Properties LP 5.125% 8/15/26 | | 20,493,000 | 19,668,970 |
| CBL & Associates LP: | | | |
| 4.6% 10/15/24 | | 26,758,000 | 22,297,602 |
| 5.25% 12/1/23 | | 11,500,000 | 10,175,564 |
| 5.95% 12/15/26 | | 10,434,000 | 8,992,511 |
| CTR Partnership LP/CareTrust Capital Corp. 5.25% 6/1/25 | | 7,577,000 | 7,368,633 |
| DDR Corp.: | | | |
| 3.625% 2/1/25 | | 5,551,000 | 5,263,863 |
| 4.625% 7/15/22 | | 2,096,000 | 2,145,959 |
| Equinix, Inc. 5.375% 5/15/27 | | 6,620,000 | 6,669,650 |
| HCP, Inc.: | | | |
| 4% 6/1/25 | | 1,000,000 | 977,198 |
| 4.25% 11/15/23 | | 1,707,000 | 1,712,959 |
| Healthcare Realty Trust, Inc. 3.75% 4/15/23 | | 966,000 | 946,203 |
| Healthcare Trust of America Holdings LP 3.75% 7/1/27 | | 8,395,000 | 7,928,594 |
| Hospitality Properties Trust 5% 8/15/22 | | 3,177,000 | 3,271,045 |
| iStar Financial, Inc.: | | | |
| 4.625% 9/15/20 | | 6,755,000 | 6,695,894 |
| 5% 7/1/19 | | 15,659,000 | 15,672,702 |
| 5.25% 9/15/22 | | 4,220,000 | 4,114,500 |
| 6% 4/1/22 | | 8,375,000 | 8,364,531 |
| Lexington Corporate Properties Trust 4.4% 6/15/24 | | 2,180,000 | 2,143,624 |
| MPT Operating Partnership LP/MPT Finance Corp.: | | | |
| 5% 10/15/27 | | 6,145,000 | 5,945,288 |
| 5.25% 8/1/26 | | 7,700,000 | 7,584,500 |
| 6.375% 3/1/24 | | 4,000,000 | 4,200,000 |
| National Retail Properties, Inc. 3.5% 10/15/27 | | 3,421,000 | 3,198,440 |
| Omega Healthcare Investors, Inc.: | | | |
| 4.375% 8/1/23 | | 3,303,000 | 3,278,308 |
| 4.5% 4/1/27 | | 2,462,000 | 2,347,920 |
| 4.75% 1/15/28 | | 12,204,000 | 11,793,667 |
| 4.95% 4/1/24 | | 2,898,000 | 2,930,549 |
| Regency Centers LP 3.6% 2/1/27 | | 2,558,000 | 2,430,722 |
| SBA Communications Corp. 4% 10/1/22 | | 5,535,000 | 5,356,884 |
| Select Income REIT: | | | |
| 4.15% 2/1/22 | | 11,170,000 | 11,087,305 |
| 4.25% 5/15/24 | | 5,030,000 | 4,812,343 |
| 4.5% 2/1/25 | | 21,294,000 | 20,611,565 |
| Senior Housing Properties Trust: | | | |
| 3.25% 5/1/19 | | 7,382,000 | 7,385,737 |
| 4.75% 5/1/24 | | 44,895,000 | 44,739,280 |
| 4.75% 2/15/28 | | 1,000,000 | 971,357 |
| 6.75% 4/15/20 | | 13,624,000 | 14,074,623 |
| 6.75% 12/15/21 | | 8,000,000 | 8,541,651 |
| VEREIT Operating Partnership LP 4.875% 6/1/26 | | 10,945,000 | 10,958,318 |
| WP Carey, Inc.: | | | |
| 4% 2/1/25 | | 6,985,000 | 6,763,592 |
| 4.25% 10/1/26 | | 7,242,000 | 7,062,213 |
| 4.6% 4/1/24 | | 11,323,000 | 11,423,339 |
| | | | 342,400,661 |
| Real Estate Management & Development - 2.4% | | | |
| Greystar Real Estate Partners 5.75% 12/1/25 (d) | | 7,625,000 | 7,396,250 |
| Howard Hughes Corp. 5.375% 3/15/25 (d) | | 26,067,000 | 25,513,076 |
| Kennedy-Wilson, Inc.: | | | |
| 5.875% 4/1/24 | | 34,760,000 | 33,891,000 |
| 5.875% 4/1/24 (d) | | 7,755,000 | 7,561,125 |
| Mattamy Group Corp.: | | | |
| 6.5% 10/1/25 (d) | | 11,595,000 | 11,305,125 |
| 6.875% 12/15/23 (d) | | 5,425,000 | 5,513,156 |
| Mid-America Apartments LP: | | | |
| 3.75% 6/15/24 | | 1,663,000 | 1,633,352 |
| 4.3% 10/15/23 | | 2,203,000 | 2,234,978 |
| Taylor Morrison Communities, Inc./Monarch Communities, Inc.: | | | |
| 5.25% 4/15/21 (d) | | 2,803,000 | 2,800,281 |
| 5.625% 3/1/24 (d) | | 7,045,000 | 6,853,376 |
| Washington Prime Group LP 5.95% 8/15/24 | | 21,080,000 | 20,819,049 |
| | | | 125,520,768 |
| TOTAL REAL ESTATE | | | 467,921,429 |
|
| TOTAL NONCONVERTIBLE BONDS | | | 762,472,128 |
|
| TOTAL CORPORATE BONDS | | | |
| (Cost $1,005,994,748) | | | 1,000,152,731 |
|
| Asset-Backed Securities - 2.5% | | | |
| American Homes 4 Rent: | | | |
| Series 2014-SFR2 Class E, 6.231% 10/17/36 (d) | | 3,000,000 | 3,281,031 |
| Series 2014-SFR3 Class E, 6.418% 12/17/36 (d) | | 9,025,000 | 9,984,533 |
| Series 2015-SFR1: | | | |
| Class E, 5.639% 4/17/52 (d) | | 1,999,310 | 2,119,998 |
| Class F, 5.885% 4/17/52 (d) | | 2,000,000 | 2,119,182 |
| Series 2015-SFR2: | | | |
| Class E, 6.07% 10/17/45 (d) | | 8,259,000 | 8,975,475 |
| Class XS, 0% 10/17/45 (d)(e)(f) | | 4,750,211 | 48 |
| Capital Trust RE CDO Ltd. Series 2005-1A Class D, 1 month U.S. LIBOR + 1.500% 3.5863% 3/20/50 (d)(e)(g)(h) | | 2,250,000 | 225 |
| Colony Starwood Homes Series 2016-2A Class F, 1 month U.S. LIBOR + 4.150% 6.2233% 12/17/33 (d)(e)(h) | | 1,500,000 | 1,548,534 |
| Conseco Finance Securitizations Corp. Series 2002-2 Class M2, 9.163% 3/1/33 | | 446,354 | 410,043 |
| Deutsche Financial Capital Securitization LLC Series 1997-I Class M, 7.275% 9/15/27 | | 2,078,169 | 2,118,456 |
| Green Tree Financial Corp.: | | | |
| Series 1996-4 Class M1, 7.75% 6/15/27 (e) | | 931,832 | 947,017 |
| Series 1997-3 Class M1, 7.53% 3/15/28 | | 6,165,103 | 6,154,087 |
| Home Partners of America Credit Trust Series 2017-1 Class F, 1 month U.S. LIBOR + 3.539% 5.6241% 7/17/34 (d)(e)(h) | | 6,318,500 | 6,360,901 |
| Home Partners of America Trust: | | | |
| Series 2016-2 Class F, 1 month U.S. LIBOR + 4.700% 6.7851% 10/17/33 (d)(e)(h) | | 3,393,000 | 3,424,427 |
| Series 2018-1 Class F, 1 month U.S. LIBOR + 2.350% 4.284% 7/17/37 (d)(e)(h) | | 3,896,000 | 3,901,418 |
| Invitation Homes Trust: | | | |
| Series 2017-SFR2 Class F, 1 month U.S. LIBOR + 3.000% 5.0851% 12/17/36 (d)(e)(h) | | 8,442,000 | 8,551,846 |
| Series 2018-SFR2 Class F, 1 month U.S. LIBOR + 2.250% 4.3216% 6/17/37 (d)(e)(h) | | 3,000,000 | 2,999,990 |
| Lehman ABS Manufactured Housing Contract Trust Series 2001-B Class M2, 7.17% 4/15/40 | | 762,408 | 535,439 |
| Merit Securities Corp. Series 13 Class M1, 7.9296% 12/28/33 (e) | | 1,854,289 | 1,908,208 |
| Progress Residential Trust: | | | |
| Series 2015-SFR3 Class F, 6.643% 11/12/32 (d) | | 2,940,000 | 3,048,054 |
| Series 2016-SFR1 Class F, 1 month U.S. LIBOR + 5.000% 7.0851% 9/17/33 (d)(e)(h) | | 8,459,000 | 8,494,659 |
| Series 2017-SFR1 Class F, 5.35% 8/17/34 (d) | | 3,073,000 | 3,122,910 |
| Series 2017-SFR2 Class F, 1 month U.S. LIBOR + 2.750% 4.836% 12/17/34 (d)(h) | | 2,568,000 | 2,567,541 |
| Series 2018-SFR2 Class F, 4.953% 8/17/35 (d) | | 3,402,000 | 3,398,811 |
| Starwood Waypoint Homes Trust Series 2017-1: | | | |
| Class E, 1 month U.S. LIBOR + 2.600% 4.6851% 1/17/35 (d)(e)(h) | | 5,906,000 | 5,941,647 |
| Class F, 1 month U.S. LIBOR + 3.400% 5.4851% 1/17/35 (d)(e)(h) | | 12,671,000 | 12,771,164 |
| Taberna Preferred Funding III Ltd. Series 2005-3A Class D, 3 month U.S. LIBOR + 2.650% 5.0131% 2/5/36 (d)(e)(g)(h) | | 4,358,340 | 327 |
| Tricon American Homes: | | | |
| Series 2017-SFR1 Class F, 5.151% 9/17/34 (d) | | 8,442,000 | 8,510,503 |
| Series 2017-SFR2 Class F, 5.104% 1/17/36 (d) | | 3,785,000 | 3,810,892 |
| Series 2018-SFR1 Class F, 4.96% 5/17/37 (d) | | 1,000,000 | 993,129 |
| Tricon American Homes Trust Series 2016-SFR1 Class F, 5.769% 11/17/33 (d) | | 2,544,000 | 2,607,930 |
| VB-S1 Issuer LLC: | | | |
| Series 2016-1A Class F, 6.901% 6/15/46 (d) | | 7,797,000 | 8,031,237 |
| Series 2018-1A Class F, 5.25% 2/15/48 (d) | | 1,354,000 | 1,353,573 |
| Wrightwood Capital Real Estate CDO Ltd. Series 2005-1A Class F, 3 month U.S. LIBOR + 1.950% 4.2813% 11/21/40 (d)(e)(h) | | 250,000 | 221,250 |
| TOTAL ASSET-BACKED SECURITIES | | | |
| (Cost $131,836,734) | | | 130,214,485 |
|
| Collateralized Mortgage Obligations - 0.2% | | | |
| Private Sponsor - 0.2% | | | |
| FREMF Mortgage Trust: | | | |
| Series 2010-K6 Class B, 5.5422% 12/25/46 (d)(e) | | 4,500,000 | 4,623,571 |
| Series 2010-K7 Class B, 5.6858% 4/25/20 (d)(e) | | 3,200,000 | 3,306,267 |
| RESI Finance LP/RESI Finance DE Corp. floater Series 2003-B Class B9, 1 month U.S. LIBOR + 11.950% 14.0363% 6/10/35 (d)(e)(h) | | 48,825 | 26,390 |
| RESIX Finance Ltd. floater: | | | |
| Series 2004-A Class B7, 1 month U.S. LIBOR + 4.250% 6.2962% 2/10/36 (d)(e)(g)(h) | | 14,817 | 200 |
| Series 2004-B Class B7, 1 month U.S. LIBOR + 4.000% 6.0464% 2/10/36 (d)(e)(g)(h) | | 8,789 | 63 |
|
| TOTAL PRIVATE SPONSOR | | | 7,956,491 |
|
| U.S. Government Agency - 0.0% | | | |
| Fannie Mae REMIC Trust: | | | |
| Series 2002-W1 subordinate REMIC pass thru certificates, Class 3B3, 3.7726% 2/25/42 (d)(e) | | 50,668 | 17,566 |
| Series 2003-W10 subordinate REMIC pass thru certificates, Class 2B3, 3.7153% 6/25/43 (d)(e) | | 86,035 | 40,557 |
|
| TOTAL U.S. GOVERNMENT AGENCY | | | 58,123 |
|
| TOTAL COLLATERALIZED MORTGAGE OBLIGATIONS | | | |
| (Cost $7,773,206) | | | 8,014,614 |
|
| Commercial Mortgage Securities - 16.4% | | | |
| Americold LLC Trust Series 2010-ARTA Class D, 7.443% 1/14/29 (d) | | 2,000,000 | 2,131,094 |
| BANK: | | | |
| Series 2017-BNK4 Class D, 3.357% 5/15/50 (d) | | 3,349,000 | 2,717,581 |
| Series 2018-BN12 Class D, 3% 5/15/61 (d) | | 1,701,000 | 1,303,366 |
| Barclays Commercial Mortgage Securities LLC Series 2015-STP: | | | |
| Class E, 4.4272% 9/10/28 (d)(e) | | 8,413,000 | 8,073,498 |
| Class F, 4.4272% 9/10/28 (d)(e) | | 4,074,000 | 3,746,545 |
| BX Trust Series 2017-IMC Class F, 1 month U.S. LIBOR + 4.250% 6.3233% 10/15/32 (d)(e)(h) | | 12,691,000 | 12,754,432 |
| CCRESG Commercial Mortgage Trust Series 2016-HEAT: | | | |
| Class E, 5.6712% 4/10/29 (d)(e) | | 4,536,000 | 4,548,728 |
| Class F, 5.6712% 4/10/29 (d)(e) | | 9,710,000 | 9,331,325 |
| CD Mortgage Trust Series 2017-CD3 Class D, 3.25% 2/10/50 (d) | | 3,391,000 | 2,813,410 |
| CGBAM Commercial Mortgage Trust Series 2015-SMRT Class F, 3.9121% 4/10/28 (d)(e) | | 9,911,000 | 9,808,275 |
| CGMS Commercial Mortgage Trust Series 2017-MDRB: | | | |
| Class D, 1 month U.S. LIBOR + 3.250% 5.3233% 7/15/30 (d)(e)(h) | | 5,000,000 | 4,989,318 |
| Class E, 1 month U.S. LIBOR + 3.872% 5.9431% 7/15/30 (d)(e)(h) | | 6,741,000 | 6,696,477 |
| Citigroup Commercial Mortgage Trust: | | | |
| Series 2013-GC15 Class D, 5.2749% 9/10/46 (d)(e) | | 5,254,000 | 5,167,173 |
| Series 2015-SHP2 Class E, 1 month U.S. LIBOR + 4.350% 6.4233% 7/15/27 (d)(e)(h) | | 2,933,000 | 2,951,082 |
| Series 2016-C3 Class D, 3% 11/15/49 (d) | | 7,089,000 | 5,446,837 |
| Series 2016-SMPL Class E, 4.509% 9/10/31 (d) | | 1,701,000 | 1,699,031 |
| COMM Mortgage Trust: | | | |
| sequential payer Series 2013-LC6 Class E, 3.5% 1/10/46 (d) | | 7,300,000 | 5,730,414 |
| Series 2012-CR1: | | | |
| Class C, 5.4983% 5/15/45 (e) | | 1,000,000 | 1,029,279 |
| Class D, 5.4983% 5/15/45 (d)(e) | | 5,550,000 | 5,543,487 |
| Class G, 2.462% 5/15/45 (d) | | 6,346,000 | 4,607,247 |
| Series 2012-CR5 Class D, 4.4638% 12/10/45 (d)(e) | | 2,000,000 | 1,923,350 |
| Series 2012-LC4: | | | |
| Class C, 5.7774% 12/10/44 (e) | | 2,000,000 | 1,986,373 |
| Class D, 5.7774% 12/10/44 (d)(e) | | 11,675,000 | 10,616,585 |
| Series 2013-CCRE6 Class E, 4.2031% 3/10/46 (d)(e) | | 882,000 | 715,281 |
| Series 2013-CR10 Class D, 4.9497% 8/10/46 (d)(e) | | 4,544,000 | 4,019,089 |
| Series 2013-CR12 Class D, 5.2474% 10/10/46 (d)(e) | | 4,500,000 | 3,868,104 |
| Series 2013-CR6 Class F, 4.2031% 3/10/46 (d)(e) | | 8,038,000 | 5,345,809 |
| Series 2013-CR9 Class D, 4.404% 7/10/45 (d)(e) | | 1,404,000 | 1,208,436 |
| Series 2013-LC6 Class D, 4.4414% 1/10/46 (d)(e) | | 8,301,000 | 7,890,164 |
| Series 2014-CR17: | | | |
| Class D, 4.9615% 5/10/47 (d)(e) | | 2,500,000 | 2,233,265 |
| Class E, 4.9615% 5/10/47 (d)(e) | | 3,098,000 | 2,487,488 |
| Series 2014-UBS2 Class D, 5.0145% 3/10/47 (d)(e) | | 3,713,000 | 3,170,809 |
| Series 2016-CD1 Class D, 2.9043% 8/10/49 (d)(e) | | 9,452,000 | 7,622,109 |
| Series 2017-CD4 Class D, 3.3% 5/10/50 (d) | | 2,800,000 | 2,304,489 |
| COMM Trust Series 2017-COR2 Class D, 3% 9/10/50 (d) | | 2,800,000 | 2,299,327 |
| Commercial Mortgage Trust pass-thru certificates Series 2012-CR2: | | | |
| Class D, 4.9926% 8/15/45 (d)(e) | | 4,500,000 | 4,419,294 |
| Class E, 4.9926% 8/15/45 (d)(e) | | 8,000,000 | 7,648,614 |
| Core Industrial Trust: | | | |
| Series 2015-TEXW Class F, 3.977% 2/10/34 (d)(e) | | 10,945,000 | 10,505,523 |
| Series 2015-WEST Class F, 4.3677% 2/10/37 (d)(e) | | 12,745,000 | 12,202,615 |
| CSAIL Commercial Mortgage Trust: | | | |
| Series 2017-C8 Class D, 4.47% 6/15/50 (d) | | 4,346,000 | 3,808,395 |
| Series 2017-CX10 Class UESD, 4.3778% 10/15/32 (d)(e) | | 5,076,000 | 4,892,543 |
| Series 2017-CX9 Class D, 4.2977% 9/15/50 (d)(e) | | 2,568,000 | 2,131,844 |
| CSMC Trust Series 2016-MFF Class F, 1 month U.S. LIBOR + 7.250% 9.3216% 11/15/33 (d)(e)(h) | | 6,300,000 | 6,358,788 |
| DBCCRE Mortgage Trust Series 2014-ARCP: | | | |
| Class D, 4.9345% 1/10/34 (d)(e) | | 1,000,000 | 978,837 |
| Class E, 5.099% 1/10/34 (d)(e) | | 10,853,000 | 10,336,724 |
| DBUBS Mortgage Trust: | | | |
| Series 2011-LC1A: | | | |
| Class E, 5.8842% 11/10/46 (d)(e) | | 14,031,000 | 14,484,420 |
| Class G, 4.652% 11/10/46 (d) | | 12,360,000 | 11,118,209 |
| Series 2011-LC3A Class D, 5.5154% 8/10/44 (d)(e) | | 3,945,000 | 4,053,618 |
| Freddie Mac: | | | |
| pass-thru certificates: | | | |
| Series K011 Class X3, 2.577% 12/25/43 (e)(f) | | 12,206,096 | 699,192 |
| Series K012 Class X3, 2.3288% 1/25/41 (e)(f) | | 20,724,835 | 1,052,146 |
| Series K013 Class X3, 2.814% 1/25/43 (e)(f) | | 14,360,000 | 941,832 |
| Series KAIV Class X2, 3.6147% 6/25/41 (e)(f) | | 7,430,000 | 684,506 |
| GAHR Commercial Mortgage Trust Series 2015-NRF: | | | |
| Class EFX, 3.4949% 12/15/34 (d)(e) | | 4,364,000 | 4,316,555 |
| Class FFX, 3.4949% 12/15/34 (d)(e) | | 14,402,000 | 14,177,987 |
| Class GFX, 3.4949% 12/15/34 (d)(e) | | 24,194,000 | 23,692,671 |
| GPMT Ltd. floater Series 2018-FL1 Class D, 1 month U.S. LIBOR + 2.950% 5.0379% 11/21/35 (d)(e)(h) | | 2,500,000 | 2,499,995 |
| GS Mortgage Securities Corp. II Series 2010-C1 Class D, 6.1964% 8/10/43 (d)(e) | | 1,966,000 | 1,990,880 |
| GS Mortgage Securities Trust: | | | |
| floater Series 2018-RIVR Class G, 1 month U.S. LIBOR + 2.600% 4.7% 7/15/35 (d)(e)(h) | | 3,808,000 | 3,766,463 |
| Series 2010-C2 Class D, 5.3547% 12/10/43 (d)(e) | | 3,000,000 | 3,046,714 |
| Series 2011-GC5: | | | |
| Class C, 5.5644% 8/10/44 (d)(e) | | 9,000,000 | 9,302,556 |
| Class D, 5.5644% 8/10/44 (d)(e) | | 7,000,000 | 6,823,282 |
| Class E, 5.5644% 8/10/44 (d)(e) | | 8,230,000 | 6,791,859 |
| Class F, 4.5% 8/10/44 (d) | | 7,986,000 | 4,341,613 |
| Series 2012-GC6: | | | |
| Class C, 5.8403% 1/10/45 (d)(e) | | 3,600,000 | 3,741,774 |
| Class D, 5.8403% 1/10/45 (d)(e) | | 4,165,000 | 3,975,119 |
| Class E, 5% 1/10/45 (d)(e) | | 4,516,000 | 3,888,303 |
| Series 2012-GCJ7: | | | |
| Class C, 5.8874% 5/10/45 (e) | | 6,500,000 | 6,686,046 |
| Class D, 5.8874% 5/10/45 (d)(e) | | 10,192,000 | 9,751,872 |
| Class E, 5% 5/10/45 (d) | | 6,920,000 | 4,785,586 |
| Series 2012-GCJ9 Class D, 4.9058% 11/10/45 (d)(e) | | 5,565,000 | 5,302,307 |
| Series 2013-GC14 Class D, 4.9229% 8/10/46 (d)(e) | | 1,680,000 | 1,601,750 |
| Series 2013-GC16: | | | |
| Class D, 5.503% 11/10/46 (d)(e) | | 3,750,000 | 3,696,472 |
| Class F, 3.5% 11/10/46 (d) | | 7,303,000 | 5,314,975 |
| Series 2016-GS3 Class D, 2.62% 10/10/49 (d) | | 3,398,000 | 2,662,728 |
| Series 2016-REMZ Class MZB, 7.727% 2/10/21 (d) | | 29,826,000 | 30,565,145 |
| Series 2016-RENT: | | | |
| Class E, 4.2022% 2/10/29 (d)(e) | | 2,509,000 | 2,466,667 |
| Class F, 4.2022% 2/10/29 (d)(e) | | 15,890,000 | 15,530,473 |
| Hilton U.S.A. Trust: | | | |
| Series 2016-HHV Class F, 4.3333% 11/5/38 (d)(e) | | 8,440,000 | 7,550,911 |
| Series 2016-SFP Class F, 6.1552% 11/5/35 (d) | | 8,457,000 | 8,564,017 |
| IMT Trust Series 2017-APTS: | | | |
| Class EFX, 3.6132% 6/15/34 (d)(e) | | 9,317,000 | 8,580,033 |
| Class FFL, 1 month U.S. LIBOR + 2.850% 4.9216% 6/15/34 (d)(e)(h) | | 3,909,000 | 3,917,450 |
| Independence Plaza Trust Series 2018-INDP Class E, 5.06% 7/10/35 (d) | | 2,896,000 | 2,901,105 |
| Invitation Homes Trust floater Series 2018-SFR3 Class F, 1 month U.S. LIBOR + 2.250% 4.25% 7/17/37 (d)(e)(h) | | 8,405,000 | 8,404,971 |
| JP Morgan Chase Commercial Mortgage Securities Trust floater Series 2018-LAQ Class E, 1 month U.S. LIBOR + 3.000% 5% 6/15/32 (d)(e)(h) | | 1,680,000 | 1,689,447 |
| JPMBB Commercial Mortgage Securities Trust: | | | |
| Series 2014-C23 Class UH5, 4.7094% 9/15/47 (d) | | 8,738,000 | 7,508,100 |
| Series 2014-C26 Class D, 4.0667% 1/15/48 (d)(e) | | 3,398,000 | 2,973,637 |
| JPMCC Commercial Mortgage Securities Trust Series 2016-JP4 Class D, 3.5957% 12/15/49 (d)(e) | | 10,241,000 | 8,555,864 |
| JPMDB Commercial Mortgage Securities Trust: | | | |
| Series 2016-C4 Class D, 3.2227% 12/15/49 (d)(e) | | 7,388,000 | 6,007,713 |
| Series 2018-C8 Class D, 3.2458% 6/15/51 (d)(e) | | 1,698,000 | 1,330,875 |
| JPMorgan Chase Commercial Mortgage Securities Corp.: | | | |
| Series 2003-C1 Class F, 5.6578% 1/12/37 (d)(e) | | 659,056 | 674,098 |
| Series 2010-CNTR Class XB, 1.1366% 8/5/32 (d)(f) | | 32,655,000 | 492,271 |
| Series 2012-CBX: | | | |
| Class C, 5.2137% 6/15/45 (e) | | 4,530,000 | 4,572,249 |
| Class E, 5.2137% 6/15/45 (d)(e) | | 4,635,000 | 4,222,035 |
| Class F, 4% 6/15/45 (d) | | 8,192,000 | 6,242,423 |
| Class G 4% 6/15/45 (d) | | 4,044,000 | 2,142,599 |
| JPMorgan Chase Commercial Mortgage Securities Trust: | | | |
| Series 2011-C3: | | | |
| Class E, 5.8653% 2/15/46 (d)(e) | | 11,147,000 | 10,920,238 |
| Class G, 4.409% 2/15/46 (d)(e) | | 4,671,000 | 3,785,054 |
| Class H, 4.409% 2/15/46 (d)(e) | | 7,077,000 | 5,175,875 |
| Series 2011-C4 Class F, 3.873% 7/15/46 (d) | | 1,400,000 | 1,367,592 |
| Series 2013-LC11: | | | |
| Class C, 3.9582% 4/15/46 (e) | | 848,000 | 828,033 |
| Class D, 4.2985% 4/15/46 (e) | | 7,672,000 | 6,642,135 |
| Class E, 3.25% 4/15/46 (d)(e) | | 472,000 | 340,787 |
| Class F, 3.25% 4/15/46 (d)(e) | | 2,518,000 | 1,519,306 |
| Series 2014-DSTY Class E, 3.9314% 6/10/27 (d)(e) | | 2,752,000 | 2,037,174 |
| Series 2015-UES Class F, 3.7417% 9/5/32 (d)(e) | | 5,432,000 | 5,309,378 |
| Series 2018-AON Class F, 4.6132% 7/5/31 (d) | | 5,096,000 | 4,983,996 |
| JPMorgan Commercial Mortgage Finance Corp. Series 1999-C8 Class H, 6% 7/15/31 (d) | | 105,503 | 98,957 |
| LSTAR Commercial Mortgage Trust Series 2014-2: | | | |
| Class D, 5.2247% 1/20/41 (d)(e) | | 3,000,000 | 2,981,752 |
| Class E, 5.2247% 1/20/41 (d)(e) | | 4,800,000 | 4,429,080 |
| Merrill Lynch Mortgage Trust Series 2006-C1 Class AJ, 5.7803% 5/12/39 (e) | | 2,172,254 | 2,192,630 |
| Morgan Stanley BAML Trust: | | | |
| Series 2012-C5 Class E, 4.8428% 8/15/45 (d)(e) | | 3,889,000 | 3,849,392 |
| Series 2012-C6 Class D, 4.7268% 11/15/45 (d)(e) | | 2,000,000 | 2,004,870 |
| Series 2013-C12 Class D, 4.9239% 10/15/46 (d)(e) | | 7,164,000 | 6,764,894 |
| Series 2013-C13: | | | |
| Class D, 5.0515% 11/15/46 (d)(e) | | 5,277,000 | 5,195,457 |
| Class E, 5.0515% 11/15/46 (d)(e) | | 3,379,000 | 2,972,356 |
| Series 2013-C7: | | | |
| Class D, 4.3877% 2/15/46 (d)(e) | | 5,650,000 | 5,155,482 |
| Class E, 4.3877% 2/15/46 (d)(e) | | 1,000,000 | 787,697 |
| Series 2013-C9: | | | |
| Class C, 4.1797% 5/15/46 (e) | | 3,339,000 | 3,240,792 |
| Class D, 4.2677% 5/15/46 (d)(e) | | 5,137,000 | 4,790,548 |
| Series 2016-C30 Class D, 3% 9/15/49 (d) | | 5,408,000 | 4,073,461 |
| Series 2016-C31 Class D, 3% 11/15/49 (d)(e) | | 1,500,000 | 1,123,088 |
| Series 2016-C32 Class D, 3.396% 12/15/49 (d) | | 5,929,000 | 4,809,764 |
| Morgan Stanley Capital I Trust: | | | |
| sequential payer Series 2012-C4 Class E, 5.6009% 3/15/45 (d)(e) | | 3,640,000 | 3,143,140 |
| Series 1997-RR Class F, 7.51% 4/30/39 (d)(e) | | 203,915 | 202,246 |
| Series 1998-CF1 Class G, 7.35% 7/15/32 (d) | | 426,754 | 364,537 |
| Series 2011-C2: | | | |
| Class D, 5.6659% 6/15/44 (d)(e) | | 5,387,000 | 5,286,864 |
| Class E, 5.6659% 6/15/44 (d)(e) | | 12,150,000 | 11,437,180 |
| Class F, 5.6659% 6/15/44 (d)(e) | | 4,440,000 | 3,921,037 |
| Class XB, 0.6118% 6/15/44 (d)(e)(f) | | 63,708,222 | 887,729 |
| Series 2011-C3: | | | |
| Class D, 5.3267% 7/15/49 (d)(e) | | 7,400,000 | 7,610,321 |
| Class E, 5.3267% 7/15/49 (d)(e) | | 1,353,000 | 1,351,994 |
| Class F, 5.3267% 7/15/49 (d)(e) | | 5,688,050 | 5,470,668 |
| Class G, 5.3267% 7/15/49 (d)(e) | | 3,902,000 | 3,394,485 |
| Series 2012-C4 Class D, 5.6009% 3/15/45 (d)(e) | | 6,310,000 | 5,988,239 |
| Series 2015-MS1 Class D, 4.1647% 5/15/48 (d)(e) | | 10,956,000 | 9,285,176 |
| Series 2015-UBS8 Class D, 3.18% 12/15/48 (d) | | 5,013,000 | 4,207,027 |
| Series 2016-BNK2 Class C, 3% 11/15/49 (d) | | 3,000,000 | 2,366,947 |
| Motel 6 Trust floater: | | | |
| Series 2017-M6MZ, Class M, 1 month U.S. LIBOR + 6.927% 8.9998% 8/15/19 (d)(e)(h) | | 7,805,403 | 7,881,905 |
| Series 2017-MTL6, Class F, 1 month U.S. LIBOR + 4.250% 6.3233% 8/15/34 (d)(e)(h) | | 13,370,859 | 13,454,466 |
| MSCG Trust Series 2016-SNR: | | | |
| Class D, 6.55% 11/15/34 (d) | | 10,105,650 | 9,990,340 |
| Class E, 6.8087% 11/15/34 (d) | | 9,659,400 | 9,167,279 |
| MSJP Commercial Securities Mortgage Trust Series 2015-HAUL Class E, 5.0127% 9/5/47 (d)(e) | | 1,500,000 | 1,365,749 |
| Natixis Commercial Mortgage Securities Trust floater Series 2018-FL1: | | | |
| Class WAN1, 1 month U.S. LIBOR + 2.750% 4.669% 6/15/35 (d)(e)(h) | | 1,743,000 | 1,744,659 |
| Class WAN2, 1 month U.S. LIBOR + 3.750% 5.669% 6/15/35 (d)(e)(h) | | 651,000 | 651,608 |
| Providence Place Group Ltd. Partnership Series 2000-C1 Class A2, 7.75% 7/20/28 (d) | | 4,155,513 | 5,074,713 |
| Starwood Retail Property Trust Series 2014-STAR Class D, 1 month U.S. LIBOR + 3.250% 5.3216% 11/15/27 (d)(e)(h) | | 2,500,000 | 2,414,291 |
| TIAA Seasoned Commercial Mortgage Trust sequential payer Series 2007-C4 Class AJ, 5.4771% 8/15/39 (e) | | 127,811 | 128,167 |
| UBS Commercial Mortgage Trust Series 2012-C1: | | | |
| Class D, 5.7289% 5/10/45 (d)(e) | | 3,235,000 | 3,194,669 |
| Class E, 5% 5/10/45 (d)(e) | | 6,339,000 | 5,437,240 |
| Class F, 5% 5/10/45 (d)(e) | | 2,221,350 | 1,573,841 |
| UBS-Citigroup Commercial Mortgage Trust Series 2011-C1 Class B, 6.2524% 1/10/45 (d)(e) | | 3,000,000 | 3,200,818 |
| Wells Fargo Commercial Mortgage Trust: | | | |
| Series 2012-LC5: | | | |
| Class D, 4.9229% 10/15/45 (d)(e) | | 12,964,000 | 12,823,915 |
| Class E, 4.9229% 10/15/45 (d)(e) | | 7,588,000 | 7,030,863 |
| Series 2016-BNK1 Class D, 3% 8/15/49 (d) | | 6,979,000 | 5,588,751 |
| Series 2016-C35 Class D, 3.142% 7/15/48 (d) | | 18,542,000 | 13,688,648 |
| Series 2016-NXS6 Class D, 3.059% 11/15/49 (d) | | 5,094,000 | 3,688,778 |
| Series 2017-C38 Class D, 3% 7/15/50 (d)(e) | | 4,373,000 | 3,399,805 |
| WF-RBS Commercial Mortgage Trust: | | | |
| sequential payer Series 2011-C4I Class G, 5% 6/15/44 (d) | | 4,000,000 | 2,271,404 |
| Series 2011-C3: | | | |
| Class C, 5.335% 3/15/44 (d) | | 4,900,000 | 4,857,307 |
| Class D, 5.8471% 3/15/44 (d)(e) | | 1,000,000 | 832,909 |
| Class E, 5% 3/15/44 (d) | | 3,000,000 | 1,429,645 |
| Series 2011-C5: | | | |
| Class E, 5.8594% 11/15/44 (d)(e) | | 3,807,000 | 3,795,970 |
| Class F, 5.25% 11/15/44 (d)(e) | | 3,000,000 | 2,617,457 |
| Class G, 5.25% 11/15/44 (d)(e) | | 2,000,000 | 1,641,122 |
| Series 2012-C7: | | | |
| Class D, 4.9788% 6/15/45 (d)(e) | | 2,380,000 | 2,120,560 |
| Class F, 4.5% 6/15/45 (d) | | 2,000,000 | 1,262,701 |
| Series 2012-C8 Class E, 5.0557% 8/15/45 (d)(e) | | 2,922,500 | 2,791,267 |
| Series 2013-C11: | | | |
| Class D, 4.4135% 3/15/45 (d)(e) | | 5,830,000 | 5,485,770 |
| Class E, 4.4135% 3/15/45 (d)(e) | | 4,780,000 | 3,783,205 |
| Series 2013-C13 Class D, 4.276% 5/15/45 (d)(e) | | 4,000,000 | 3,692,710 |
| Series 2013-C16 Class D, 5.1949% 9/15/46 (d)(e) | | 3,728,000 | 3,460,949 |
| Series 2013-UBS1 Class D, 4.7694% 3/15/46 (d)(e) | | 4,589,000 | 4,217,662 |
| WFCG Commercial Mortgage Trust floater Series 2015-BXRP: | | | |
| Class F, 1 month U.S. LIBOR + 3.720% 5.7936% 11/15/29 (d)(e)(h) | | 5,152,378 | 5,142,334 |
| Class G, 1 month U.S. LIBOR + 3.020% 5.0933% 11/15/29 (d)(e)(h) | | 8,859,793 | 8,733,180 |
| WP Glimcher Mall Trust Series 2015-WPG: | | | |
| Class PR1, 3.6332% 6/5/35 (d)(e) | | 6,725,000 | 5,187,157 |
| Class PR2, 3.6332% 6/5/35 (d)(e) | | 2,541,000 | 1,823,660 |
| TOTAL COMMERCIAL MORTGAGE SECURITIES | | | |
| (Cost $848,373,988) | | | 861,090,819 |
|
| Bank Loan Obligations - 4.6% | | | |
| CONSUMER DISCRETIONARY - 0.8% | | | |
| Hotels, Restaurants & Leisure - 0.6% | | | |
| Caesars Resort Collection LLC Tranche B 1LN, term loan 3 month U.S. LIBOR + 2.750% 4.8268% 12/22/24 (e)(h) | | 3,363,100 | 3,375,174 |
| ESH Hospitality, Inc. Tranche B, term loan 3 month U.S. LIBOR + 2.000% 4.0768% 8/30/23 (e)(h) | | 12,679,085 | 12,657,911 |
| LTF Merger Sub, Inc. Tranche B, term loan 3 month U.S. LIBOR + 2.750% 5.0572% 6/10/22 (e)(h) | | 2,543,593 | 2,544,305 |
| Playa Resorts Holding BV Tranche B, term loan 3 month U.S. LIBOR + 2.750% 4.83% 4/27/24 (e)(h) | | 6,300,756 | 6,239,324 |
| Wyndham Destinations, Inc. Tranche B, term loan 3 month U.S. LIBOR + 2.250% 4.3268% 5/31/25 (e)(h) | | 2,545,000 | 2,547,392 |
| Wyndham Hotels & Resorts, Inc. Tranche B, term loan 3 month U.S. LIBOR + 1.750% 3.8268% 5/30/25 (e)(h) | | 1,000,000 | 1,002,190 |
| | | | 28,366,296 |
| Multiline Retail - 0.2% | | | |
| JC Penney Corp., Inc. Tranche B, term loan 3 month U.S. LIBOR + 4.250% 6.5694% 6/23/23 (e)(h) | | 12,360,601 | 11,925,384 |
|
| TOTAL CONSUMER DISCRETIONARY | | | 40,291,680 |
|
| CONSUMER STAPLES - 0.5% | | | |
| Food & Staples Retailing - 0.5% | | | |
| Albertson's LLC Tranche B, term loan: | | | |
| 3 month U.S. LIBOR + 3.000% 5.3194% 6/22/23 (e)(h) | | 17,149,253 | 17,034,868 |
| 3 month U.S. LIBOR + 3.000% 5.337% 12/21/22 (e)(h) | | 11,499,606 | 11,449,353 |
| | | | 28,484,221 |
| ENERGY - 0.6% | | | |
| Energy Equipment & Services - 0.1% | | | |
| Kestrel Acquisition LLC Tranche B, term loan 3 month U.S. LIBOR + 4.250% 6.33% 6/1/25 (e)(h) | | 4,500,000 | 4,532,355 |
| Oil, Gas & Consumable Fuels - 0.5% | | | |
| Moxie Patriot LLC Tranche B, term loan 3 month U.S. LIBOR + 5.750% 8.0844% 12/19/20 (e)(h) | | 22,071,682 | 21,830,218 |
| TPF II Power LLC Tranche B, term loan 3 month U.S. LIBOR + 3.750% 5.8435% 10/2/23 (e)(h) | | 3,373,841 | 3,387,539 |
| | | | 25,217,757 |
|
| TOTAL ENERGY | | | 29,750,112 |
|
| FINANCIALS - 0.5% | | | |
| Diversified Financial Services - 0.2% | | | |
| Veritas-B Junior Mezz C LLC 10.4875% 2/6/21 (e)(g) | | 9,171,000 | 9,665,317 |
| Real Estate Management & Development - 0.3% | | | |
| DTZ U.S. Borrower LLC Tranche B 1LN, term loan 3 month U.S. LIBOR + 3.250% 5.5735% 11/4/21 (e)(h) | | 13,815,584 | 13,818,762 |
| Thrifts & Mortgage Finance - 0.0% | | | |
| Ocwen Loan Servicing LLC Tranche B, term loan 3 month U.S. LIBOR + 5.000% 7.0785% 12/5/20 (e)(h) | | 3,296,009 | 3,306,985 |
|
| TOTAL FINANCIALS | | | 26,791,064 |
|
| HEALTH CARE - 0.1% | | | |
| Health Care Providers & Services - 0.1% | | | |
| Community Health Systems, Inc. Tranche H, term loan 3 month U.S. LIBOR + 3.250% 5.5572% 1/27/21 (e)(h) | | 5,995,082 | 5,884,353 |
| INDUSTRIALS - 0.0% | | | |
| Commercial Services & Supplies - 0.0% | | | |
| Lineage Logistics Holdings, LLC. Tranche B, term loan 3 month U.S. LIBOR + 3.000% 5.0768% 2/27/25 (e)(h) | | 2,044,875 | 2,034,651 |
| INFORMATION TECHNOLOGY - 0.1% | | | |
| Electronic Equipment & Components - 0.1% | | | |
| Compass Power Generation LLC Tranche B, term loan 3 month U.S. LIBOR + 3.750% 5.8435% 12/20/24 (e)(h) | | 3,363,495 | 3,380,312 |
| REAL ESTATE - 1.2% | | | |
| Equity Real Estate Investment Trusts (REITs) - 0.6% | | | |
| Invitation Homes Operating Par Tranche B, term loan 3 month U.S. LIBOR + 1.800% 3.8785% 2/6/22 (e)(g)(h) | | 15,000,000 | 14,625,000 |
| iStar Financial, Inc. Tranche B 1LN, term loan 3 month U.S. LIBOR + 2.750% 4.8418% 6/28/23 (e)(h) | | 12,605,000 | 12,605,000 |
| The GEO Group, Inc. Tranche B 1LN, term loan 3 month U.S. LIBOR + 2.000% 4.1% 3/23/24 (e)(h) | | 2,992,424 | 2,979,347 |
| | | | 30,209,347 |
| Real Estate Management & Development - 0.6% | | | |
| Capital Automotive LP Tranche B 1LN, term loan 3 month U.S. LIBOR + 2.500% 4.58% 3/24/24 (e)(h) | | 3,096,374 | 3,092,503 |
| Realogy Group LLC Tranche B, term loan 3 month U.S. LIBOR + 2.250% 4.3165% 2/8/25 (e)(h) | | 4,000,000 | 4,002,520 |
| Simply Storage Management LLC 8.2375% 9/6/21 (e)(g) | | 16,974,000 | 17,038,501 |
| VICI Properties, LLC Tranche B 1LN, term loan 3 month U.S. LIBOR + 2.000% 4.081% 12/22/24 (e)(h) | | 5,955,000 | 5,959,645 |
| | | | 30,093,169 |
|
| TOTAL REAL ESTATE | | | 60,302,516 |
|
| TELECOMMUNICATION SERVICES - 0.2% | | | |
| Wireless Telecommunication Services - 0.2% | | | |
| SBA Senior Finance II, LLC Tranche B, term loan 3 month U.S. LIBOR + 2.000% 4.08% 4/11/25 (e)(h) | | 11,960,000 | 11,927,110 |
| UTILITIES - 0.6% | | | |
| Electric Utilities - 0.2% | | | |
| Lightstone Holdco LLC: | | | |
| Tranche B 1LN, term loan 3 month U.S. LIBOR + 3.750% 5.8268% 1/30/24 (e)(h) | | 8,900,897 | 8,931,071 |
| Tranche C 1LN, term loan 3 month U.S. LIBOR + 3.750% 5.8268% 1/30/24 (e)(h) | | 569,885 | 571,817 |
| Southeast Powergen LLC Tranche B, term loan 3 month U.S. LIBOR + 3.500% 5.58% 12/2/21 (e)(h) | | 2,491,846 | 2,304,957 |
| | | | 11,807,845 |
| Independent Power and Renewable Electricity Producers - 0.4% | | | |
| APLP Holdings LP Tranche B, term loan 3 month U.S. LIBOR + 3.000% 5.0768% 4/13/23 (e)(h) | | 8,316,308 | 8,330,862 |
| MRP Generation Holdings LLC Tranche B, term loan 3 month U.S. LIBOR + 7.000% 9.3344% 10/18/22 (e)(h) | | 14,483,552 | 13,759,374 |
| | | | 22,090,236 |
|
| TOTAL UTILITIES | | | 33,898,081 |
|
| TOTAL BANK LOAN OBLIGATIONS | | | |
| (Cost $242,530,833) | | | 242,744,100 |
|
| Preferred Securities - 0.0% | | | |
| FINANCIALS - 0.0% | | | |
| Diversified Financial Services - 0.0% | | | |
| Crest Dartmouth Street 2003 1 Ltd. Series 2003-1A Class PS, 6/28/38 (d)(g) | | 1,220,000 | 122 |
| Thrifts & Mortgage Finance - 0.0% | | | |
| Crest Clarendon Street 2002-1 Ltd. Series 2002-1A Class PS, 12/28/35 (d)(g) | | 500,000 | 45,000 |
| TOTAL PREFERRED SECURITIES | | | |
| (Cost $1,297,768) | | | 45,122 |
| | | Shares | Value |
|
| Money Market Funds - 6.9% | | | |
| Fidelity Cash Central Fund, 1.96% (i) | | 348,302,152 | 348,371,812 |
| Fidelity Securities Lending Cash Central Fund 1.97% (i)(j) | | 15,606,547 | 15,608,108 |
| TOTAL MONEY MARKET FUNDS | | | |
| (Cost $363,924,251) | | | 363,979,920 |
| TOTAL INVESTMENT IN SECURITIES - 100.1% | | | |
| (Cost $5,004,657,334) | | | 5,258,496,134 |
| NET OTHER ASSETS (LIABILITIES) - (0.1)% | | | (4,484,413) |
| NET ASSETS - 100% | | | $5,254,011,721 |
Legend
(a) Affiliated company
(b) Security or a portion of the security is on loan at period end.
(c) Non-income producing
(d) Security exempt from registration under Rule 144A of the Securities Act of 1933. These securities may be resold in transactions exempt from registration, normally to qualified institutional buyers. At the end of the period, the value of these securities amounted to $1,169,567,528 or 22.3% of net assets.
(e) Coupon rates for floating and adjustable rate securities reflect the rates in effect at period end.
(f) Security represents right to receive monthly interest payments on an underlying pool of mortgages or assets. Principal shown is the outstanding par amount of the pool as of the end of the period.
(g) Level 3 security
(h) Coupon is indexed to a floating interest rate which may be multiplied by a specified factor and/or subject to caps or floors.
(i) Affiliated fund that is generally available only to investment companies and other accounts managed by Fidelity Investments. The rate quoted is the annualized seven-day yield of the fund at period end. A complete unaudited listing of the fund's holdings as of its most recent quarter end is available upon request. In addition, each Fidelity Central Fund's financial statements, which are not covered by the Fund's Report of Independent Registered Public Accounting Firm, are available on the SEC's website or upon request.
(j) Investment made with cash collateral received from securities on loan.
Affiliated Central Funds
Information regarding fiscal year to date income earned by the Fund from investments in Fidelity Central Funds is as follows:
| Fund | Income earned |
| Fidelity Cash Central Fund | $4,957,774 |
| Fidelity Securities Lending Cash Central Fund | 358,945 |
| Total | $5,316,719 |
Amounts in the income column in the above table include any capital gain distributions from underlying funds, which are presented in the corresponding line-item in the Statement of Operations if applicable.
Other Affiliated Issuers
An affiliated company is a company in which the Fund has ownership of at least 5% of the voting securities. Fiscal year to date transactions with companies which are or were affiliates are as follows:
| Affiliate | Value, beginning of period | Purchases | Sales Proceeds | Dividend Income | Realized Gain (loss) | Change in Unrealized appreciation (depreciation) | Value, end of period |
| Acadia Realty Trust (SBI) | $124,832,133 | $3,899,390 | $-- | $3,554,765 | $1,009,405 | $(10,519,634) | $118,210,943 |
| Ellington Financial LLC | 25,147,846 | 1,105,555 | -- | 2,662,777 | -- | 699,375 | 26,952,776 |
| Great Ajax Corp. | 21,962,447 | -- | -- | 25,302 | 1,633,352 | (435,890) | 21,094,678 |
| Great Ajax Corp. 7.25% | 4,545,000 | 2,506,142 | -- | 326,250 | -- | (68,742) | -- |
| Total | $176,487,426 | $7,511,087 | $-- | $6,569,094 | $2,642,757 | $(10,324,891) | $166,258,397 |
Investment Valuation
The following is a summary of the inputs used, as of July 31, 2018, involving the Fund's assets and liabilities carried at fair value. The inputs or methodology used for valuing securities may not be an indication of the risk associated with investing in those securities. For more information on valuation inputs, and their aggregation into the levels used below, please refer to the Investment Valuation section in the accompanying Notes to Financial Statements.
| | Valuation Inputs at Reporting Date: |
| Description | Total | Level 1 | Level 2 | Level 3 |
| Investments in Securities: | | | | |
| Equities: | | | | |
| Consumer Discretionary | $23,591,544 | $23,591,544 | $-- | $-- |
| Energy | 3,000,000 | -- | 3,000,000 | -- |
| Financials | 700,679,568 | 683,053,558 | 17,626,010 | -- |
| Real Estate | 1,921,618,965 | 1,861,244,595 | 60,374,370 | -- |
| Utilities | 3,364,266 | 3,364,266 | -- | -- |
| Corporate Bonds | 1,000,152,731 | -- | 1,000,152,731 | -- |
| Asset-Backed Securities | 130,214,485 | -- | 130,213,933 | 552 |
| Collateralized Mortgage Obligations | 8,014,614 | -- | 8,014,351 | 263 |
| Commercial Mortgage Securities | 861,090,819 | -- | 861,090,819 | -- |
| Bank Loan Obligations | 242,744,100 | -- | 201,415,282 | 41,328,818 |
| Preferred Securities | 45,122 | -- | -- | 45,122 |
| Money Market Funds | 363,979,920 | 363,979,920 | -- | -- |
| Total Investments in Securities: | $5,258,496,134 | $2,935,233,883 | $2,281,887,496 | $41,374,755 |
The following is a reconciliation of Investments in Securities for which Level 3 inputs were used in determining value:
| Investments in Securities: | |
| Bank Loan Obligations | |
| Beginning Balance | $53,726,431 |
| Net Realized Gain (Loss) on Investment Securities | 109,454 |
| Net Unrealized Gain (Loss) on Investment Securities | 465,888 |
| Cost of Purchases | 9,689,437 |
| Proceeds of Sales | (22,789,931) |
| Amortization/Accretion | 127,539 |
| Transfers into Level 3 | -- |
| Transfers out of Level 3 | -- |
| Ending Balance | $41,328,818 |
| The change in unrealized gain (loss) for the period attributable to Level 3 securities held at July 31, 2018 | $410,229 |
| Other Investments in Securities | |
| Beginning Balance | $1,906,920 |
| Net Realized Gain (Loss) on Investment Securities | 71,923 |
| Net Unrealized Gain (Loss) on Investment Securities | 17,893 |
| Cost of Purchases | 92,444 |
| Proceeds of Sales | (315,466) |
| Amortization/Accretion | (107,556) |
| Transfers into Level 3 | -- |
| Transfers out of Level 3 | (1,620,221) |
| Ending Balance | $45,937 |
| The change in unrealized gain (loss) for the period attributable to Level 3 securities held at July 31, 2018 | $(42,355) |
The information used in the above reconciliations represents fiscal year to date activity for any Investments in Securities identified as using Level 3 inputs at either the beginning or the end of the current fiscal period. Transfers in or out of Level 3 represent the beginning value of any Security or Instrument where a change in the pricing level occurred from the beginning to the end of the period. The cost of purchases and the proceeds of sales may include securities received or delivered through corporate actions or exchanges. Realized and unrealized gains (losses) disclosed in the reconciliations are included in Net Gain (Loss) on the Fund's Statement of Operations.
Other Information
The composition of credit quality ratings as a percentage of Total Net Assets is as follows (Unaudited):
| U.S. Government and U.S. Government Agency Obligations | 0.1% |
| AAA,AA,A | 1.1% |
| BBB | 8.9% |
| BB | 9.0% |
| B | 11.0% |
| CCC,CC,C | 0.7% |
| Not Rated | 11.9% |
| Equities | 50.5% |
| Short-Term Investments and Net Other Assets | 6.8% |
| | 100.0% |
We have used ratings from Moody's Investors Service, Inc. Where Moody's® ratings are not available, we have used S&P® ratings. All ratings are as of the date indicated and do not reflect subsequent changes.
See accompanying notes which are an integral part of the financial statements.
Financial Statements
Statement of Assets and Liabilities
| | | July 31, 2018 |
| Assets | | |
Investment in securities, at value (including securities loaned of $15,352,489) — See accompanying schedule:
Unaffiliated issuers (cost $4,482,338,085) | $4,728,257,817 | |
| Fidelity Central Funds (cost $363,924,251) | 363,979,920 | |
| Other affiliated issuers (cost $158,394,998) | 166,258,397 | |
| Total Investment in Securities (cost $5,004,657,334) | | $5,258,496,134 |
| Cash | | 2,723,693 |
| Receivable for investments sold | | 9,759,741 |
| Receivable for fund shares sold | | 5,499,311 |
| Dividends receivable | | 2,984,420 |
| Interest receivable | | 21,332,181 |
| Distributions receivable from Fidelity Central Funds | | 673,709 |
| Prepaid expenses | | 13,049 |
| Other receivables | | 33,443 |
| Total assets | | 5,301,515,681 |
| Liabilities | | |
| Payable for investments purchased | $23,454,574 | |
| Payable for fund shares redeemed | 4,826,374 | |
| Accrued management fee | 2,357,401 | |
| Distribution and service plan fees payable | 264,351 | |
| Other affiliated payables | 885,931 | |
| Other payables and accrued expenses | 109,701 | |
| Collateral on securities loaned | 15,605,628 | |
| Total liabilities | | 47,503,960 |
| Net Assets | | $5,254,011,721 |
| Net Assets consist of: | | |
| Paid in capital | | $4,874,648,138 |
| Undistributed net investment income | | 38,805,646 |
| Accumulated undistributed net realized gain (loss) on investments and foreign currency transactions | | 86,719,050 |
| Net unrealized appreciation (depreciation) on investments and assets and liabilities in foreign currencies | | 253,838,887 |
| Net Assets | | $5,254,011,721 |
| Calculation of Maximum Offering Price | | |
| Class A: | | |
| Net Asset Value and redemption price per share ($297,722,001 ÷ 24,839,866 shares) | | $11.99 |
| Maximum offering price per share (100/96.00 of $11.99) | | $12.49 |
| Class M: | | |
| Net Asset Value and redemption price per share ($55,175,226 ÷ 4,601,531 shares) | | $11.99 |
| Maximum offering price per share (100/96.00 of $11.99) | | $12.49 |
| Class C: | | |
| Net Asset Value and offering price per share ($227,457,520 ÷ 19,190,796 shares)(a) | | $11.85 |
| Real Estate Income: | | |
| Net Asset Value, offering price and redemption price per share ($2,531,397,034 ÷ 210,087,983 shares) | | $12.05 |
| Class I: | | |
| Net Asset Value, offering price and redemption price per share ($2,142,259,940 ÷ 178,398,890 shares) | | $12.01 |
(a) Redemption price per share is equal to net asset value less any applicable contingent deferred sales charge.
See accompanying notes which are an integral part of the financial statements.
Statement of Operations
| | | Year ended July 31, 2018 |
| Investment Income | | |
| Dividends (including $6,569,094 earned from other affiliated issuers) | | $124,505,966 |
| Interest | | 131,846,468 |
| Income from Fidelity Central Funds | | 5,316,719 |
| Total income | | 261,669,153 |
| Expenses | | |
| Management fee | $28,363,995 | |
| Transfer agent fees | 9,335,255 | |
| Distribution and service plan fees | 3,528,520 | |
| Accounting and security lending fees | 1,383,124 | |
| Custodian fees and expenses | 60,495 | |
| Independent trustees' fees and expenses | 22,388 | |
| Registration fees | 208,238 | |
| Audit | 113,871 | |
| Legal | 12,655 | |
| Miscellaneous | 38,308 | |
| Total expenses before reductions | 43,066,849 | |
| Expense reductions | (161,892) | |
| Total expenses after reductions | | 42,904,957 |
| Net investment income (loss) | | 218,764,196 |
| Realized and Unrealized Gain (Loss) | | |
| Net realized gain (loss) on: | | |
| Investment securities: | | |
| Unaffiliated issuers | 111,573,397 | |
| Fidelity Central Funds | 7,996 | |
| Other affiliated issuers | 2,642,757 | |
| Foreign currency transactions | (6,711) | |
| Total net realized gain (loss) | | 114,217,439 |
| Change in net unrealized appreciation (depreciation) on: | | |
| Investment securities: | | |
| Unaffiliated issuers | (212,759,316) | |
| Fidelity Central Funds | (4,580) | |
| Other affiliated issuers | (10,324,891) | |
| Assets and liabilities in foreign currencies | (108) | |
| Total change in net unrealized appreciation (depreciation) | | (223,088,895) |
| Net gain (loss) | | (108,871,456) |
| Net increase (decrease) in net assets resulting from operations | | $109,892,740 |
See accompanying notes which are an integral part of the financial statements.
Statement of Changes in Net Assets
| | Year ended July 31, 2018 | Year ended July 31, 2017 |
| Increase (Decrease) in Net Assets | | |
| Operations | | |
| Net investment income (loss) | $218,764,196 | $210,270,861 |
| Net realized gain (loss) | 114,217,439 | 36,915,809 |
| Change in net unrealized appreciation (depreciation) | (223,088,895) | 22,370,918 |
| Net increase (decrease) in net assets resulting from operations | 109,892,740 | 269,557,588 |
| Distributions to shareholders from net investment income | (209,651,623) | (202,922,557) |
| Distributions to shareholders from net realized gain | (58,110,159) | (32,383,930) |
| Total distributions | (267,761,782) | (235,306,487) |
| Share transactions - net increase (decrease) | 122,424,204 | 397,445,047 |
| Redemption fees | 106,734 | 449,735 |
| Total increase (decrease) in net assets | (35,338,104) | 432,145,883 |
| Net Assets | | |
| Beginning of period | 5,289,349,825 | 4,857,203,942 |
| End of period | $5,254,011,721 | $5,289,349,825 |
| Other Information | | |
| Undistributed net investment income end of period | $38,805,646 | $40,995,155 |
See accompanying notes which are an integral part of the financial statements.
Financial Highlights
Fidelity Real Estate Income Fund Class A
| Years ended July 31, | 2018 | 2017 | 2016 | 2015 | 2014 |
| Selected Per–Share Data | | | | | |
| Net asset value, beginning of period | $12.32 | $12.25 | $11.66 | $11.86 | $11.67 |
| Income from Investment Operations | | | | | |
| Net investment income (loss)A | .47 | .49 | .49 | .52 | .49 |
| Net realized and unrealized gain (loss) | (.22) | .14 | .73 | .02 | .44 |
| Total from investment operations | .25 | .63 | 1.22 | .54 | .93 |
| Distributions from net investment income | (.45) | (.48) | (.48) | (.52) | (.50) |
| Distributions from net realized gain | (.13) | (.08) | (.14) | (.21) | (.24) |
| Total distributions | (.58) | (.56) | (.63)B | (.74)C | (.74) |
| Redemption fees added to paid in capitalA,D | – | – | – | – | – |
| Net asset value, end of period | $11.99 | $12.32 | $12.25 | $11.66 | $11.86 |
| Total ReturnE,F | 2.13% | 5.37% | 11.01% | 4.65% | 8.49% |
| Ratios to Average Net AssetsG,H | | | | | |
| Expenses before reductions | 1.02% | 1.03% | 1.03% | 1.04% | 1.06% |
| Expenses net of fee waivers, if any | 1.02% | 1.03% | 1.03% | 1.03% | 1.05% |
| Expenses net of all reductions | 1.01% | 1.02% | 1.03% | 1.03% | 1.05% |
| Net investment income (loss) | 3.98% | 4.08% | 4.29% | 4.40% | 4.28% |
| Supplemental Data | | | | | |
| Net assets, end of period (000 omitted) | $297,722 | $355,400 | $548,649 | $495,462 | $442,271 |
| Portfolio turnover rateI | 27% | 22% | 26% | 19% | 29% |
A Calculated based on average shares outstanding during the period.
B Total distributions of $.63 per share is comprised of distributions from net investment income of $.483 and distributions from net realized gain of $.142 per share.
C Total distributions of $.74 per share is comprised of distributions from net investment income of $.523 and distributions from net realized gain of $.212 per share.
D Amount represents less than $.005 per share.
E Total returns would have been lower if certain expenses had not been reduced during the applicable periods shown.
F Total returns do not include the effect of the sales charges.
G Fees and expenses of any underlying Fidelity Central Funds are not included in the Fund's expense ratio. The Fund indirectly bears its proportionate share of the expenses of any underlying Fidelity Central Funds.
H Expense ratios reflect operating expenses of the class. Expenses before reductions do not reflect amounts reimbursed by the investment adviser or reductions from brokerage service arrangements or reductions from other expense offset arrangements and do not represent the amount paid by the class during periods when reimbursements or reductions occur. Expenses net of fee waivers reflect expenses after reimbursement by the investment adviser but prior to reductions from brokerage service arrangements or other expense offset arrangements. Expenses net of all reductions represent the net expenses paid by the class.
I Amount does not include the portfolio activity of any underlying Fidelity Central Funds.
See accompanying notes which are an integral part of the financial statements.
Fidelity Real Estate Income Fund Class M
| Years ended July 31, | 2018 | 2017 | 2016 | 2015 | 2014 |
| Selected Per–Share Data | | | | | |
| Net asset value, beginning of period | $12.32 | $12.26 | $11.66 | $11.86 | $11.67 |
| Income from Investment Operations | | | | | |
| Net investment income (loss)A | .47 | .49 | .49 | .51 | .49 |
| Net realized and unrealized gain (loss) | (.22) | .13 | .73 | .02 | .43 |
| Total from investment operations | .25 | .62 | 1.22 | .53 | .92 |
| Distributions from net investment income | (.45) | (.48) | (.48) | (.52) | (.50) |
| Distributions from net realized gain | (.13) | (.08) | (.14) | (.21) | (.24) |
| Total distributions | (.58) | (.56) | (.62) | (.73) | (.73)B |
| Redemption fees added to paid in capitalA,C | – | – | – | – | – |
| Net asset value, end of period | $11.99 | $12.32 | $12.26 | $11.66 | $11.86 |
| Total ReturnD,E | 2.10% | 5.26% | 11.06% | 4.62% | 8.44% |
| Ratios to Average Net AssetsF,G | | | | | |
| Expenses before reductions | 1.04% | 1.06% | 1.07% | 1.06% | 1.08% |
| Expenses net of fee waivers, if any | 1.04% | 1.06% | 1.07% | 1.06% | 1.08% |
| Expenses net of all reductions | 1.04% | 1.05% | 1.06% | 1.06% | 1.07% |
| Net investment income (loss) | 3.95% | 4.05% | 4.26% | 4.37% | 4.26% |
| Supplemental Data | | | | | |
| Net assets, end of period (000 omitted) | $55,175 | $64,158 | $59,788 | $55,424 | $48,164 |
| Portfolio turnover rateH | 27% | 22% | 26% | 19% | 29% |
A Calculated based on average shares outstanding during the period.
B Total distributions of $.73 per share is comprised of distributions from net investment income of $.496 and distributions from net realized gain of $.236 per share.
C Amount represents less than $.005 per share.
D Total returns would have been lower if certain expenses had not been reduced during the applicable periods shown.
E Total returns do not include the effect of the sales charges.
F Fees and expenses of any underlying Fidelity Central Funds are not included in the Fund's expense ratio. The Fund indirectly bears its proportionate share of the expenses of any underlying Fidelity Central Funds.
G Expense ratios reflect operating expenses of the class. Expenses before reductions do not reflect amounts reimbursed by the investment adviser or reductions from brokerage service arrangements or reductions from other expense offset arrangements and do not represent the amount paid by the class during periods when reimbursements or reductions occur. Expenses net of fee waivers reflect expenses after reimbursement by the investment adviser but prior to reductions from brokerage service arrangements or other expense offset arrangements. Expenses net of all reductions represent the net expenses paid by the class.
H Amount does not include the portfolio activity of any underlying Fidelity Central Funds.
See accompanying notes which are an integral part of the financial statements.
Fidelity Real Estate Income Fund Class C
| Years ended July 31, | 2018 | 2017 | 2016 | 2015 | 2014 |
| Selected Per–Share Data | | | | | |
| Net asset value, beginning of period | $12.20 | $12.14 | $11.55 | $11.77 | $11.59 |
| Income from Investment Operations | | | | | |
| Net investment income (loss)A | .38 | .40 | .40 | .43 | .40 |
| Net realized and unrealized gain (loss) | (.22) | .13 | .73 | .01 | .43 |
| Total from investment operations | .16 | .53 | 1.13 | .44 | .83 |
| Distributions from net investment income | (.37) | (.39) | (.40) | (.45) | (.42) |
| Distributions from net realized gain | (.13) | (.08) | (.14) | (.21) | (.24) |
| Total distributions | (.51)B | (.47) | (.54) | (.66) | (.65)C |
| Redemption fees added to paid in capitalA,D | – | – | – | – | – |
| Net asset value, end of period | $11.85 | $12.20 | $12.14 | $11.55 | $11.77 |
| Total ReturnE,F | 1.31% | 4.54% | 10.29% | 3.82% | 7.66% |
| Ratios to Average Net AssetsG,H | | | | | |
| Expenses before reductions | 1.76% | 1.78% | 1.79% | 1.79% | 1.79% |
| Expenses net of fee waivers, if any | 1.76% | 1.78% | 1.78% | 1.78% | 1.79% |
| Expenses net of all reductions | 1.76% | 1.78% | 1.78% | 1.78% | 1.79% |
| Net investment income (loss) | 3.23% | 3.32% | 3.54% | 3.65% | 3.54% |
| Supplemental Data | | | | | |
| Net assets, end of period (000 omitted) | $227,458 | $287,598 | $289,430 | $291,387 | $246,306 |
| Portfolio turnover rateI | 27% | 22% | 26% | 19% | 29% |
A Calculated based on average shares outstanding during the period.
B Total distributions of $.51 per share is comprised of distributions from net investment income of $.373 and distributions from net realized gain of $.132 per share.
C Total distributions of $.65 per share is comprised of distributions from net investment income of $.417 and distributions from net realized gain of $.236 per share.
D Amount represents less than $.005 per share.
E Total returns would have been lower if certain expenses had not been reduced during the applicable periods shown.
F Total returns do not include the effect of the contingent deferred sales charge.
G Fees and expenses of any underlying Fidelity Central Funds are not included in the Fund's expense ratio. The Fund indirectly bears its proportionate share of the expenses of any underlying Fidelity Central Funds.
H Expense ratios reflect operating expenses of the class. Expenses before reductions do not reflect amounts reimbursed by the investment adviser or reductions from brokerage service arrangements or reductions from other expense offset arrangements and do not represent the amount paid by the class during periods when reimbursements or reductions occur. Expenses net of fee waivers reflect expenses after reimbursement by the investment adviser but prior to reductions from brokerage service arrangements or other expense offset arrangements. Expenses net of all reductions represent the net expenses paid by the class.
I Amount does not include the portfolio activity of any underlying Fidelity Central Funds.
See accompanying notes which are an integral part of the financial statements.
Fidelity Real Estate Income Fund
| Years ended July 31, | 2018 | 2017 | 2016 | 2015 | 2014 |
| Selected Per–Share Data | | | | | |
| Net asset value, beginning of period | $12.38 | $12.31 | $11.71 | $11.91 | $11.71 |
| Income from Investment Operations | | | | | |
| Net investment income (loss)A | .51 | .52 | .52 | .54 | .52 |
| Net realized and unrealized gain (loss) | (.22) | .14 | .73 | .02 | .44 |
| Total from investment operations | .29 | .66 | 1.25 | .56 | .96 |
| Distributions from net investment income | (.48) | (.51) | (.51) | (.55) | (.53) |
| Distributions from net realized gain | (.13) | (.08) | (.14) | (.21) | (.24) |
| Total distributions | (.62)B | (.59) | (.65) | (.76) | (.76)C |
| Redemption fees added to paid in capitalA,D | – | – | – | – | – |
| Net asset value, end of period | $12.05 | $12.38 | $12.31 | $11.71 | $11.91 |
| Total ReturnE | 2.40% | 5.60% | 11.29% | 4.84% | 8.78% |
| Ratios to Average Net AssetsF,G | | | | | |
| Expenses before reductions | .75% | .78% | .82% | .83% | .83% |
| Expenses net of fee waivers, if any | .75% | .78% | .81% | .82% | .83% |
| Expenses net of all reductions | .75% | .77% | .81% | .82% | .83% |
| Net investment income (loss) | 4.24% | 4.33% | 4.51% | 4.61% | 4.50% |
| Supplemental Data | | | | | |
| Net assets, end of period (000 omitted) | $2,531,397 | $2,630,901 | $2,719,387 | $2,561,268 | $2,627,382 |
| Portfolio turnover rateH | 27% | 22% | 26% | 19% | 29% |
A Calculated based on average shares outstanding during the period.
B Total distributions of $.62 per share is comprised of distributions from net investment income of $.484 and distributions from net realized gain of $.132 per share.
C Total distributions of $.76 per share is comprised of distributions from net investment income of $.525 and distributions from net realized gain of $.236 per share.
D Amount represents less than $.005 per share.
E Total returns would have been lower if certain expenses had not been reduced during the applicable periods shown.
F Fees and expenses of any underlying Fidelity Central Funds are not included in the Fund's expense ratio. The Fund indirectly bears its proportionate share of the expenses of any underlying Fidelity Central Funds.
G Expense ratios reflect operating expenses of the class. Expenses before reductions do not reflect amounts reimbursed by the investment adviser or reductions from brokerage service arrangements or reductions from other expense offset arrangements and do not represent the amount paid by the class during periods when reimbursements or reductions occur. Expenses net of fee waivers reflect expenses after reimbursement by the investment adviser but prior to reductions from brokerage service arrangements or other expense offset arrangements. Expenses net of all reductions represent the net expenses paid by the class.
H Amount does not include the portfolio activity of any underlying Fidelity Central Funds.
See accompanying notes which are an integral part of the financial statements.
Fidelity Real Estate Income Fund Class I
| Years ended July 31, | 2018 | 2017 | 2016 | 2015 | 2014 |
| Selected Per–Share Data | | | | | |
| Net asset value, beginning of period | $12.34 | $12.27 | $11.68 | $11.88 | $11.69 |
| Income from Investment Operations | | | | | |
| Net investment income (loss)A | .51 | .52 | .52 | .55 | .52 |
| Net realized and unrealized gain (loss) | (.22) | .14 | .73 | .02 | .44 |
| Total from investment operations | .29 | .66 | 1.25 | .57 | .96 |
| Distributions from net investment income | (.49) | (.51) | (.52) | (.55) | (.53) |
| Distributions from net realized gain | (.13) | (.08) | (.14) | (.21) | (.24) |
| Total distributions | (.62) | (.59) | (.66) | (.77)B | (.77) |
| Redemption fees added to paid in capitalA,C | – | – | – | – | – |
| Net asset value, end of period | $12.01 | $12.34 | $12.27 | $11.68 | $11.88 |
| Total ReturnD | 2.41% | 5.66% | 11.30% | 4.92% | 8.76% |
| Ratios to Average Net AssetsE,F | | | | | |
| Expenses before reductions | .75% | .76% | .77% | .77% | .78% |
| Expenses net of fee waivers, if any | .75% | .76% | .77% | .77% | .78% |
| Expenses net of all reductions | .75% | .76% | .76% | .77% | .78% |
| Net investment income (loss) | 4.25% | 4.34% | 4.56% | 4.66% | 4.55% |
| Supplemental Data | | | | | |
| Net assets, end of period (000 omitted) | $2,142,260 | $1,951,293 | $1,239,950 | $913,475 | $809,854 |
| Portfolio turnover rateG | 27% | 22% | 26% | 19% | 29% |
A Calculated based on average shares outstanding during the period.
B Total distributions of $.77 per share is comprised of distributions from net investment income of $.554 and distributions from net realized gain of $.212 per share.
C Amount represents less than $.005 per share.
D Total returns would have been lower if certain expenses had not been reduced during the applicable periods shown.
E Fees and expenses of any underlying Fidelity Central Funds are not included in the Fund's expense ratio. The Fund indirectly bears its proportionate share of the expenses of any underlying Fidelity Central Funds.
F Expense ratios reflect operating expenses of the class. Expenses before reductions do not reflect amounts reimbursed by the investment adviser or reductions from brokerage service arrangements or reductions from other expense offset arrangements and do not represent the amount paid by the class during periods when reimbursements or reductions occur. Expenses net of fee waivers reflect expenses after reimbursement by the investment adviser but prior to reductions from brokerage service arrangements or other expense offset arrangements. Expenses net of all reductions represent the net expenses paid by the class.
G Amount does not include the portfolio activity of any underlying Fidelity Central Funds.
See accompanying notes which are an integral part of the financial statements.
Notes to Financial Statements
For the period ended July 31, 2018
1. Organization.
Fidelity Real Estate Income Fund (the Fund) is a fund of Fidelity Securities Fund (the Trust) and is authorized to issue an unlimited number of shares. The Trust is registered under the Investment Company Act of 1940, as amended (the 1940 Act), as an open-end management investment company organized as a Massachusetts business trust. The Fund offers Class A, Class M, Class C, Real Estate Income and Class I shares, each of which has equal rights as to assets and voting privileges. Each class has exclusive voting rights with respect to matters that affect that class.
2. Investments in Fidelity Central Funds.
The Fund invests in Fidelity Central Funds, which are open-end investment companies generally available only to other investment companies and accounts managed by the investment adviser and its affiliates. The Fund's Schedule of Investments lists each of the Fidelity Central Funds held as of period end, if any, as an investment of the Fund, but does not include the underlying holdings of each Fidelity Central Fund. As an Investing Fund, the Fund indirectly bears its proportionate share of the expenses of the underlying Fidelity Central Funds.
The Money Market Central Funds seek preservation of capital and current income and are managed by Fidelity Investments Money Management, Inc. (FIMM), an affiliate of the investment adviser. Annualized expenses of the Money Market Central Funds as of their most recent shareholder report date are less than .005%.
A complete unaudited list of holdings for each Fidelity Central Fund is available upon request or at the Securities and Exchange Commission (the SEC) website at www.sec.gov. In addition, the financial statements of the Fidelity Central Funds, which are not covered by the Fund's Report of Independent Registered Public Accounting Firm, are available on the SEC website or upon request.
3. Significant Accounting Policies.
The Fund is an investment company and applies the accounting and reporting guidance of the Financial Accounting Standards Board (FASB) Accounting Standards Codification Topic 946 Financial Services – Investments Companies. The financial statements have been prepared in conformity with accounting principles generally accepted in the United States of America (GAAP), which require management to make certain estimates and assumptions at the date of the financial statements. Actual results could differ from those estimates. Subsequent events, if any, through the date that the financial statements were issued have been evaluated in the preparation of the financial statements. The following summarizes the significant accounting policies of the Fund:
Investment Valuation. Investments are valued as of 4:00 p.m. Eastern time on the last calendar day of the period. The Board of Trustees (the Board) has delegated the day to day responsibility for the valuation of the Fund's investments to the Fair Value Committee (the Committee) established by the Fund's investment adviser. In accordance with valuation policies and procedures approved by the Board, the Fund attempts to obtain prices from one or more third party pricing vendors or brokers to value its investments. When current market prices, quotations or currency exchange rates are not readily available or reliable, investments will be fair valued in good faith by the Committee, in accordance with procedures adopted by the Board. Factors used in determining fair value vary by investment type and may include market or investment specific events, changes in interest rates and credit quality. The frequency with which these procedures are used cannot be predicted and they may be utilized to a significant extent. The Committee oversees the Fund's valuation policies and procedures and reports to the Board on the Committee's activities and fair value determinations. The Board monitors the appropriateness of the procedures used in valuing the Fund's investments and ratifies the fair value determinations of the Committee.
The Fund categorizes the inputs to valuation techniques used to value its investments into a disclosure hierarchy consisting of three levels as shown below:
- Level 1 – quoted prices in active markets for identical investments
- Level 2 – other significant observable inputs (including quoted prices for similar investments, interest rates, prepayment speeds, etc.)
- Level 3 – unobservable inputs (including the Fund's own assumptions based on the best information available)
Valuation techniques used to value the Fund's investments by major category are as follows:
Equity securities, including restricted securities, for which market quotations are readily available, are valued at the last reported sale price or official closing price as reported by a third party pricing vendor on the primary market or exchange on which they are traded and are categorized as Level 1 in the hierarchy. In the event there were no sales during the day or closing prices are not available, securities are valued at the last quoted bid price or may be valued using the last available price and are generally categorized as Level 2 in the hierarchy. For foreign equity securities, when market or security specific events arise, comparisons to the valuation of American Depositary Receipts (ADRs), futures contracts, Exchange-Traded Funds (ETFs) and certain indexes as well as quoted prices for similar securities may be used and would be categorized as Level 2 in the hierarchy. Utilizing these techniques may result in transfers between Level 1 and Level 2. For equity securities, including restricted securities, where observable inputs are limited, assumptions about market activity and risk are used and these securities may be categorized as Level 3 in the hierarchy.
Debt securities, including restricted securities, are valued based on evaluated prices received from third party pricing vendors or from brokers who make markets in such securities. Corporate bonds, bank loan obligations and preferred securities are valued by pricing vendors who utilize matrix pricing which considers yield or price of bonds of comparable quality, coupon, maturity and type or by broker-supplied prices. Asset backed securities, collateralized mortgage obligations and commercial mortgage securities are valued by pricing vendors who utilize matrix pricing which considers prepayment speed assumptions, attributes of the collateral, yield or price of bonds of comparable quality, coupon, maturity and type or by broker-supplied prices. When independent prices are unavailable or unreliable, debt securities may be valued utilizing pricing methodologies which consider similar factors that would be used by third party pricing vendors. Debt securities are generally categorized as Level 2 in the hierarchy but may be Level 3 depending on the circumstances.
Investments in open-end mutual funds, including the Fidelity Central Funds, are valued at their closing net asset value (NAV) each business day and are categorized as Level 1 in the hierarchy.
Changes in valuation techniques may result in transfers in or out of an assigned level within the disclosure hierarchy. The aggregate value of investments by input level as of July 31, 2018, as well as a roll forward of Level 3 investments, is included at the end of the Fund's Schedule of Investments.
Foreign Currency. The Fund may use foreign currency contracts to facilitate transactions in foreign-denominated securities. Gains and losses from these transactions may arise from changes in the value of the foreign currency or if the counterparties do not perform under the contracts' terms.
Foreign-denominated assets, including investment securities, and liabilities are translated into U.S. dollars at the exchange rates at period end. Purchases and sales of investment securities, income and dividends received and expenses denominated in foreign currencies are translated into U.S. dollars at the exchange rate in effect on the transaction date.
The effects of exchange rate fluctuations on investments are included with the net realized and unrealized gain (loss) on investment securities. Other foreign currency transactions resulting in realized and unrealized gain (loss) are disclosed separately.
Investment Transactions and Income. For financial reporting purposes, the Fund's investment holdings and NAV include trades executed through the end of the last business day of the period. The NAV per share for processing shareholder transactions is calculated as of the close of business of the New York Stock Exchange (NYSE), normally 4:00 p.m. Eastern time and includes trades executed through the end of the prior business day. Gains and losses on securities sold are determined on the basis of identified cost and include proceeds received from litigation. Dividend income is recorded on the ex-dividend date, except for certain dividends from foreign securities where the ex-dividend date may have passed, which are recorded as soon as the Fund is informed of the ex-dividend date. Non-cash dividends included in dividend income, if any, are recorded at the fair market value of the securities received. Income and capital gain distributions from Fidelity Central Funds, if any, are recorded on the ex-dividend date. Certain distributions received by the Fund represent a return of capital or capital gain. The Fund determines the components of these distributions subsequent to the ex-dividend date, based upon receipt of tax filings or other correspondence relating to the underlying investment. These distributions are recorded as a reduction of cost of investments and/or as a realized gain. Interest income is accrued as earned and includes coupon interest and amortization of premium and accretion of discount on debt securities as applicable. For certain lower credit quality securitized assets that have contractual cash flows (for example, asset backed securities, collateralized mortgage obligations and commercial mortgage-backed securities), changes in estimated cash flows are periodically evaluated and the estimated yield is adjusted on a prospective basis, resulting in increases or decreases to Interest Income in the accompanying Statement of Operations. Investment income is recorded net of foreign taxes withheld where recovery of such taxes is uncertain. Debt obligations may be placed on non-accrual status and related interest income may be reduced by ceasing current accruals and writing off interest receivables when the collection of all or a portion of interest has become doubtful based on consistently applied procedures. A debt obligation is removed from non-accrual status when the issuer resumes interest payments or when collectability of interest is reasonably assured.
Class Allocations and Expenses. Investment income, realized and unrealized capital gains and losses, common expenses of the Fund, and certain fund-level expense reductions, if any, are allocated daily on a pro-rata basis to each class based on the relative net assets of each class to the total net assets of the Fund. Each class differs with respect to transfer agent and distribution and service plan fees incurred. Certain expense reductions may also differ by class. For the reporting period, the allocated portion of income and expenses to each class as a percent of its average net assets may vary due to the timing of recording these transactions in relation to fluctuating net assets of the classes. Expenses directly attributable to a fund are charged to that fund. Expenses attributable to more than one fund are allocated among the respective funds on the basis of relative net assets or other appropriate methods. Expense estimates are accrued in the period to which they relate and adjustments are made when actual amounts are known.
Income Tax Information and Distributions to Shareholders. Each year, the Fund intends to qualify as a regulated investment company under Subchapter M of the Internal Revenue Code, including distributing substantially all of its taxable income and realized gains. As a result, no provision for U.S. Federal income taxes is required. As of July 31, 2018, the Fund did not have any unrecognized tax benefits in the financial statements; nor is the Fund aware of any tax positions for which it is reasonably possible that the total amounts of unrecognized tax benefits will significantly change in the next twelve months. The Fund files a U.S. federal tax return, in addition to state and local tax returns as required. The Fund's federal income tax returns are subject to examination by the Internal Revenue Service (IRS) for a period of three fiscal years after they are filed. State and local tax returns may be subject to examination for an additional fiscal year depending on the jurisdiction. Foreign taxes are provided for based on the Fund's understanding of the tax rules and rates that exist in the foreign markets in which it invests.
Distributions are declared and recorded on the ex-dividend date. Income and capital gain distributions are declared separately for each class. Income and capital gain distributions are determined in accordance with income tax regulations, which may differ from GAAP. In addition, the Fund claimed a portion of the payment made to redeeming shareholders as a distribution for income tax purposes.
Capital accounts within the financial statements are adjusted for permanent book-tax differences. These adjustments have no impact on net assets or the results of operations. Capital accounts are not adjusted for temporary book-tax differences which will reverse in a subsequent period.
Book-tax differences are primarily due to the short-term gain distributions from the Underlying Funds, foreign currency transactions, passive foreign investment companies (PFIC), market discount, equity-debt classifications, certain conversion ratio adjustments, partnerships and losses deferred due to wash sales.
As of period end, the cost and unrealized appreciation (depreciation) in securities, and derivatives if applicable, for federal income tax purposes were as follows:
| Gross unrealized appreciation | $394,714,519 |
| Gross unrealized depreciation | (148,256,973) |
| Net unrealized appreciation (depreciation) | $246,457,546 |
| Tax Cost | $5,012,038,588 |
The tax-based components of distributable earnings as of period end were as follows:
| Undistributed ordinary income | $50,371,649 |
| Undistributed long-term capital gain | $82,869,359 |
| Net unrealized appreciation (depreciation) on securities and other investments | $246,457,633 |
The tax character of distributions paid was as follows:
| | July 31, 2018 | July 31, 2017 |
| Ordinary Income | $218,315,072 | $ 202,922,557 |
| Long-term Capital Gains | 49,446,710 | 32,383,930 |
| Total | $267,761,782 | $ 235,306,487 |
Short-Term Trading (Redemption) Fees. Shares held by investors in the Funds less than 90 days may be subject to a redemption fee equal to .75% of the NAV of shares redeemed. All redemption fees, which reduce the proceeds of the shareholder redemption, are retained by the Funds and accounted for as an addition to paid in capital. In November 2017, the Board of Trustees approved the elimination of these redemption fees effective December 18, 2017.
Restricted Securities. The Fund may invest in securities that are subject to legal or contractual restrictions on resale. These securities generally may be resold in transactions exempt from registration or to the public if the securities are registered. Disposal of these securities may involve time-consuming negotiations and expense, and prompt sale at an acceptable price may be difficult. Information regarding restricted securities is included at the end of the Fund's Schedule of Investments.
Loans and Other Direct Debt Instruments. The Fund invests in direct debt instruments which are interests in amounts owed to lenders by corporate or other borrowers. These instruments may be in the form of loans, trade claims or other receivables and may include standby financing commitments such as revolving credit facilities that obligate the Fund to supply additional cash to the borrower on demand. Loans may be acquired through assignment or participation. The Fund did not have any unfunded loan commitments, which are contractual obligations for future funding, at period end.
New Accounting Pronouncement. In March 2017, the Financial Accounting Standards Board (FASB) issued an Accounting Standards Update (ASU), ASU 2017-08, which amends the amortization period for certain callable debt securities that are held at a premium. The amendment requires the premium to be amortized to the earliest call date. The amendments do not require an accounting change for securities held at a discount. The ASU is effective for annual periods beginning after December 15, 2018. Management is currently evaluating the potential impact of these changes to the financial statements.
4. Purchases and Sales of Investments.
Purchases and sales of securities, other than short-term securities and U.S. government securities, aggregated $1,404,991,466 and $1,324,928,996, respectively.
5. Fees and Other Transactions with Affiliates.
Management Fee. Fidelity Management & Research Company (the investment adviser) and its affiliates provide the Fund with investment management related services for which the Fund pays a monthly management fee. The management fee is the sum of an individual fund fee rate that is based on an annual rate of .30% of the Fund's average net assets and an annualized group fee rate that averaged .24% during the period. The group fee rate is based upon the average net assets of all the mutual funds advised by the investment adviser, including any mutual funds previously advised by the investment adviser that are currently advised by Fidelity SelectCo, LLC, an affiliate of the investment adviser. The group fee rate decreases as assets under management increase and increases as assets under management decrease. For the reporting period, the total annual management fee rate was .54% of the Fund's average net assets.
Distribution and Service Plan Fees. In accordance with Rule 12b-1 of the 1940 Act, the Fund has adopted separate Distribution and Service Plans for each class of shares. Certain classes pay Fidelity Distributors Corporation (FDC), an affiliate of the investment adviser, separate Distribution and Service Fees, each of which is based on an annual percentage of each class' average net assets. In addition, FDC may pay financial intermediaries for selling shares of the Fund and providing shareholder support services. For the period, the Distribution and Service Fee rates, total fees and amounts retained by FDC were as follows:
| | Distribution Fee | Service Fee | Total Fees | Retained by FDC |
| Class A | -% | .25% | $805,400 | $– |
| Class M | -% | .25% | 148,351 | – |
| Class C | .75% | .25% | 2,574,769 | 291,290 |
| | | | $3,528,520 | $291,290 |
Sales Load. FDC may receive a front-end sales charge of up to 4.00% for selling Class A shares and Class M shares, some of which is paid to financial intermediaries for selling shares of the Fund. Depending on the holding period, FDC may receive contingent deferred sales charges levied on Class A, Class M and Class C redemptions. The deferred sales charges are 1.00% for Class C shares, 1.00% for certain purchases of Class A shares and .25% for certain purchases of Class M shares.
For the period, sales charge amounts retained by FDC were as follows:
| | Retained by FDC |
| Class A | $24,653 |
| Class M | 5,798 |
| Class C(a) | 28,402 |
| | $58,853 |
(a) When Class C shares are initially sold, FDC pays commissions from its own resources to financial intermediaries through which the sales are made.
Transfer Agent Fees. Fidelity Investments Institutional Operations Company, Inc., (FIIOC), an affiliate of the investment adviser, is the transfer, dividend disbursing and shareholder servicing agent for each class of the Fund. FIIOC receives account fees and asset-based fees that vary according to the account size and type of account of the shareholders of the respective classes of the Fund. FIIOC pays for typesetting, printing and mailing of shareholder reports, except proxy statements.
For the period, transfer agent fees for each class were as follows:
| | Amount | % of Class-Level Average Net Assets |
| Class A | $616,548 | .19 |
| Class M | 128,988 | .22 |
| Class C | 481,597 | .19 |
| Real Estate Income | 4,538,696 | .18 |
| Class I | 3,569,426 | .17 |
| | $9,335,255 | |
Accounting and Security Lending Fees. Fidelity Service Company, Inc. (FSC), an affiliate of the investment adviser, maintains the Fund's accounting records. The accounting fee is based on the level of average net assets for each month. Under a separate contract, FSC administers the security lending program. The security lending fee is based on the number and duration of lending transactions. For the period, the fees were equivalent to an annual rate of .03%.
Brokerage Commissions. The Fund placed a portion of its portfolio transactions with brokerage firms which are affiliates of the investment adviser. Brokerage commissions are included in net realized gain (loss) and change in net unrealized appreciation (depreciation) in the Statement of Operations. The commissions paid to these affiliated firms were $9,162 for the period.
Interfund Trades. The Fund may purchase from or sell securities to other Fidelity Funds under procedures adopted by the Board. The procedures have been designed to ensure these interfund trades are executed in accordance with Rule 17a-7 of the 1940 Act. Interfund trades are included within the respective purchases and sales amounts shown in the Purchases and Sales of Investments note.
6. Committed Line of Credit.
The Fund participates with other funds managed by the investment adviser or an affiliate in a $4.25 billion credit facility (the "line of credit") to be utilized for temporary or emergency purposes to fund shareholder redemptions or for other short-term liquidity purposes. The Fund has agreed to pay commitment fees on its pro-rata portion of the line of credit, which amounted to $14,837 and is reflected in Miscellaneous expenses on the Statement of Operations. During the period, the Fund did not borrow on this line of credit.
7. Security Lending.
The Fund lends portfolio securities through a lending agent from time to time in order to earn additional income. For equity securities, a lending agent is used and may loan securities to certain qualified borrowers, including Fidelity Capital Markets (FCM), a broker-dealer affiliated with the Fund. On the settlement date of the loan, the Fund receives collateral (in the form of U.S. Treasury obligations, letters of credit and/or cash) against the loaned securities and maintains collateral in an amount not less than 100% of the market value of the loaned securities during the period of the loan. The market value of the loaned securities is determined at the close of business of the Fund and any additional required collateral is delivered to the Fund on the next business day. The Fund or borrower may terminate the loan at any time, and if the borrower defaults on its obligation to return the securities loaned because of insolvency or other reasons, the Fund may apply collateral received from the borrower against the obligation. The Fund may experience delays and costs in recovering the securities loaned. Any cash collateral received is invested in the Fidelity Securities Lending Cash Central Fund. The value of loaned securities and cash collateral at period end are disclosed on the Fund's Statement of Assets and Liabilities. The value of securities loaned to FCM at period end was $1,115,251. Security lending income represents the income earned on investing cash collateral, less rebates paid to borrowers and any lending agent fees associated with the loan, plus any premium payments received for lending certain types of securities. Security lending income is presented in the Statement of Operations as a component of income from Fidelity Central Funds. Total security lending income during the period amounted to $358,945, including $25,992 from securities loaned to FCM.
8. Expense Reductions.
Commissions paid to certain brokers with whom the investment adviser, or its affiliates, places trades on behalf of the Fund include an amount in addition to trade execution, which may be rebated back to the Fund to offset certain expenses. This amount totaled $86,638 for the period. Through arrangements with the Fund's custodian, credits realized as a result of certain uninvested cash balances were used to reduce the Fund's expenses. During the period, these credits reduced the Fund's custody expenses by $20,756.
In addition, during the period the investment adviser reimbursed and/or waived a portion of fund-level operating expenses in the amount of $54,498.
9. Distributions to Shareholders.
Distributions to shareholders of each class were as follows:
| | Year ended
July 31, 2018 | Year ended
July 31, 2017 |
| From net investment income | | |
| Class A | $12,349,133 | $19,398,648 |
| Class M | 2,255,950 | 2,428,967 |
| Class C | 8,342,624 | 9,371,104 |
| Real Estate Income | 103,116,422 | 109,435,619 |
| Class I | 83,587,494 | 62,288,219 |
| Total | $209,651,623 | $202,922,557 |
| From net realized gain | | |
| Class A | $3,718,313 | $3,567,509 |
| Class M | 680,353 | 398,948 |
| Class C | 3,070,508 | 1,939,550 |
| Real Estate Income | 28,258,214 | 17,827,432 |
| Class I | 22,382,771 | 8,650,491 |
| Total | $58,110,159 | $32,383,930 |
10. Share Transactions.
Share transactions for each class were as follows and may contain automatic conversions between classes or exchanges between affiliated funds:
| | Shares | Shares | Dollars | Dollars |
| | Year ended July 31, 2018 | Year ended July 31, 2017 | Year ended July 31, 2018 | Year ended July 31, 2017 |
| Class A | | | | |
| Shares sold | 6,036,517 | 12,839,240 | $71,765,863 | $153,895,562 |
| Reinvestment of distributions | 1,301,260 | 1,848,521 | 15,605,254 | 21,908,312 |
| Shares redeemed | (11,347,678) | (30,631,418) | (134,310,067) | (367,310,909) |
| Net increase (decrease) | (4,009,901) | (15,943,657) | $(46,938,950) | $(191,507,035) |
| Class M | | | | |
| Shares sold | 733,876 | 1,228,326 | $8,765,829 | $14,708,870 |
| Reinvestment of distributions | 238,619 | 221,980 | 2,863,295 | 2,637,477 |
| Shares redeemed | (1,576,898) | (1,122,766) | (18,688,302) | (13,419,214) |
| Net increase (decrease) | (604,403) | 327,540 | $(7,059,178) | $3,927,133 |
| Class C | | | | |
| Shares sold | 2,391,083 | 5,359,653 | $28,308,215 | $63,747,841 |
| Reinvestment of distributions | 897,945 | 858,380 | 10,683,017 | 10,109,093 |
| Shares redeemed | (7,673,573) | (6,493,102) | (89,721,727) | (77,061,823) |
| Net increase (decrease) | (4,384,545) | (275,069) | $(50,730,495) | $(3,204,889) |
| Real Estate Income | | | | |
| Shares sold | 43,494,857 | 47,554,214 | $518,900,815 | $573,422,929 |
| Reinvestment of distributions | 9,523,043 | 9,324,516 | 114,640,546 | 111,248,966 |
| Shares redeemed | (55,394,813) | (65,327,473) | (656,921,503) | (784,201,096) |
| Net increase (decrease) | (2,376,913) | (8,448,743) | $(23,380,142) | $(99,529,201) |
| Class I | | | | |
| Shares sold | 81,604,369 | 91,593,798 | $971,878,458 | $1,102,392,455 |
| Reinvestment of distributions | 7,132,431 | 4,455,256 | 85,529,395 | 53,081,868 |
| Shares redeemed | (68,424,382) | (38,982,165) | (806,874,884) | (467,715,284) |
| Net increase (decrease) | 20,312,418 | 57,066,889 | $250,532,969 | $687,759,039 |
11. Other.
The Fund's organizational documents provide former and current trustees and officers with a limited indemnification against liabilities arising in connection with the performance of their duties to the Fund. In the normal course of business, the Fund may also enter into contracts that provide general indemnifications. The Fund's maximum exposure under these arrangements is unknown as this would be dependent on future claims that may be made against the Fund. The risk of material loss from such claims is considered remote.
Report of Independent Registered Public Accounting Firm
To the Trustees of Fidelity Securities Fund and Shareholders of Fidelity Real Estate Income Fund:
Opinion on the Financial Statements and Financial Highlights
We have audited the accompanying statement of assets and liabilities of Fidelity Real Estate Income Fund (the "Fund"), a fund of Fidelity Securities Fund, including the schedule of investments, as of July 31, 2018, and the related statement of operations for the year then ended, the statement of changes in net assets for each of the two years in the period then ended, the financial highlights for each of the five years in the period then ended, and the related notes. In our opinion, the financial statements and financial highlights present fairly, in all material respects, the financial position of the Fund as of July 31, 2018, and the results of its operations for the year then ended, the changes in its net assets for each of the two years in the period then ended, and the financial highlights for each of the five years in the period then ended, in conformity with accounting principles generally accepted in the United States of America.
Basis for Opinion
These financial statements and financial highlights are the responsibility of the Fund's management. Our responsibility is to express an opinion on the Fund's financial statements and financial highlights based on our audits. We are a public accounting firm registered with the Public Company Accounting Oversight Board (United States) (PCAOB) and are required to be independent with respect to the Fund in accordance with the U.S. federal securities laws and the applicable rules and regulations of the Securities and Exchange Commission and the PCAOB.
We conducted our audits in accordance with the standards of the PCAOB. Those standards require that we plan and perform the audit to obtain reasonable assurance about whether the financial statements and financial highlights are free of material misstatement, whether due to error or fraud. The Fund is not required to have, nor were we engaged to perform, an audit of its internal control over financial reporting. As part of our audits we are required to obtain an understanding of internal control over financial reporting but not for the purpose of expressing an opinion on the effectiveness of the Fund’s internal control over financial reporting. Accordingly, we express no such opinion.
Our audits included performing procedures to assess the risks of material misstatement of the financial statements and financial highlights, whether due to error or fraud, and performing procedures that respond to those risks. Such procedures included examining, on a test basis, evidence regarding the amounts and disclosures in the financial statements and financial highlights. Our audits also included evaluating the accounting principles used and significant estimates made by management, as well as evaluating the overall presentation of the financial statements and financial highlights. Our procedures included confirmation of securities owned as of July 31, 2018, by correspondence with the custodians and brokers; when replies were not received from brokers, we performed other auditing procedures. We believe that our audits provide a reasonable basis for our opinion.
/s/ Deloitte & Touche LLP
Boston, Massachusetts
September 18, 2018
We have served as the auditor of one or more of the Fidelity investment companies since 1999.
Trustees and Officers
The Trustees, Members of the Advisory Board (if any), and officers of the trust and fund, as applicable, are listed below. The Board of Trustees governs the fund and is responsible for protecting the interests of shareholders. The Trustees are experienced executives who meet periodically throughout the year to oversee the fund's activities, review contractual arrangements with companies that provide services to the fund, oversee management of the risks associated with such activities and contractual arrangements, and review the fund's performance. Except for Jonathan Chiel, each of the Trustees oversees 286 funds. Mr. Chiel oversees 150 funds.
The Trustees hold office without limit in time except that (a) any Trustee may resign; (b) any Trustee may be removed by written instrument, signed by at least two-thirds of the number of Trustees prior to such removal; (c) any Trustee who requests to be retired or who has become incapacitated by illness or injury may be retired by written instrument signed by a majority of the other Trustees; and (d) any Trustee may be removed at any special meeting of shareholders by a two-thirds vote of the outstanding voting securities of the trust. Each Trustee who is not an interested person (as defined in the 1940 Act) of the trust and the fund is referred to herein as an Independent Trustee. Each Independent Trustee shall retire not later than the last day of the calendar year in which his or her 75th birthday occurs. The Independent Trustees may waive this mandatory retirement age policy with respect to individual Trustees. Officers and Advisory Board Members hold office without limit in time, except that any officer or Advisory Board Member may resign or may be removed by a vote of a majority of the Trustees at any regular meeting or any special meeting of the Trustees. Except as indicated, each individual has held the office shown or other offices in the same company for the past five years.
The fund’s Statement of Additional Information (SAI) includes more information about the Trustees. To request a free copy, call Fidelity at 1-800-544-8544.
Experience, Skills, Attributes, and Qualifications of the Trustees. The Governance and Nominating Committee has adopted a statement of policy that describes the experience, qualifications, attributes, and skills that are necessary and desirable for potential Independent Trustee candidates (Statement of Policy). The Board believes that each Trustee satisfied at the time he or she was initially elected or appointed a Trustee, and continues to satisfy, the standards contemplated by the Statement of Policy. The Governance and Nominating Committee also engages professional search firms to help identify potential Independent Trustee candidates who have the experience, qualifications, attributes, and skills consistent with the Statement of Policy. From time to time, additional criteria based on the composition and skills of the current Independent Trustees, as well as experience or skills that may be appropriate in light of future changes to board composition, business conditions, and regulatory or other developments, have also been considered by the professional search firms and the Governance and Nominating Committee. In addition, the Board takes into account the Trustees' commitment and participation in Board and committee meetings, as well as their leadership of standing and ad hoc committees throughout their tenure.
In determining that a particular Trustee was and continues to be qualified to serve as a Trustee, the Board has considered a variety of criteria, none of which, in isolation, was controlling. The Board believes that, collectively, the Trustees have balanced and diverse experience, qualifications, attributes, and skills, which allow the Board to operate effectively in governing the fund and protecting the interests of shareholders. Information about the specific experience, skills, attributes, and qualifications of each Trustee, which in each case led to the Board's conclusion that the Trustee should serve (or continue to serve) as a trustee of the fund, is provided below.
Board Structure and Oversight Function. James C. Curvey is an interested person and currently serves as Chairman. The Trustees have determined that an interested Chairman is appropriate and benefits shareholders because an interested Chairman has a personal and professional stake in the quality and continuity of services provided to the fund. Independent Trustees exercise their informed business judgment to appoint an individual of their choosing to serve as Chairman, regardless of whether the Trustee happens to be independent or a member of management. The Independent Trustees have determined that they can act independently and effectively without having an Independent Trustee serve as Chairman and that a key structural component for assuring that they are in a position to do so is for the Independent Trustees to constitute a substantial majority for the Board. The Independent Trustees also regularly meet in executive session. Ned C. Lautenbach serves as Chairman of the Independent Trustees and as such (i) acts as a liaison between the Independent Trustees and management with respect to matters important to the Independent Trustees and (ii) with management prepares agendas for Board meetings.
Fidelity® funds are overseen by different Boards of Trustees. The fund's Board oversees Fidelity's high income and certain equity funds, and other Boards oversee Fidelity's investment-grade bond, money market, asset allocation, and other equity funds. The asset allocation funds may invest in Fidelity® funds overseen by the fund's Board. The use of separate Boards, each with its own committee structure, allows the Trustees of each group of Fidelity® funds to focus on the unique issues of the funds they oversee, including common research, investment, and operational issues. On occasion, the separate Boards establish joint committees to address issues of overlapping consequences for the Fidelity® funds overseen by each Board.
The Trustees operate using a system of committees to facilitate the timely and efficient consideration of all matters of importance to the Trustees, the fund, and fund shareholders and to facilitate compliance with legal and regulatory requirements and oversight of the fund's activities and associated risks. The Board, acting through its committees, has charged FMR and its affiliates with (i) identifying events or circumstances the occurrence of which could have demonstrably adverse effects on the fund's business and/or reputation; (ii) implementing processes and controls to lessen the possibility that such events or circumstances occur or to mitigate the effects of such events or circumstances if they do occur; and (iii) creating and maintaining a system designed to evaluate continuously business and market conditions in order to facilitate the identification and implementation processes described in (i) and (ii) above. Because the day-to-day operations and activities of the fund are carried out by or through FMR, its affiliates, and other service providers, the fund's exposure to risks is mitigated but not eliminated by the processes overseen by the Trustees. While each of the Board's committees has responsibility for overseeing different aspects of the fund's activities, oversight is exercised primarily through the Operations, Audit, and Compliance Committees. In addition, the Independent Trustees have worked with Fidelity to enhance the Board's oversight of investment and financial risks, legal and regulatory risks, technology risks, and operational risks, including the development of additional risk reporting to the Board. Appropriate personnel, including but not limited to the fund's Chief Compliance Officer (CCO), FMR's internal auditor, the independent accountants, the fund's Treasurer and portfolio management personnel, make periodic reports to the Board's committees, as appropriate, including an annual review of Fidelity's risk management program for the Fidelity® funds. The responsibilities of each standing committee, including their oversight responsibilities, are described further under "Standing Committees of the Trustees."
Interested Trustees*:
Correspondence intended for a Trustee who is an interested person may be sent to Fidelity Investments, 245 Summer Street, Boston, Massachusetts 02210.
Name, Year of Birth; Principal Occupations and Other Relevant Experience+
Jonathan Chiel (1957)
Year of Election or Appointment: 2016
Trustee
Mr. Chiel also serves as Trustee of other Fidelity® funds. Mr. Chiel is Executive Vice President and General Counsel for FMR LLC (diversified financial services company, 2012-present). Previously, Mr. Chiel served as general counsel (2004-2012) and senior vice president and deputy general counsel (2000-2004) for John Hancock Financial Services; a partner with Choate, Hall & Stewart (1996-2000) (law firm); and an Assistant United States Attorney for the United States Attorney’s Office of the District of Massachusetts (1986-95), including Chief of the Criminal Division (1993-1995). Mr. Chiel is a director on the boards of the Boston Bar Foundation and the Maimonides School.
James C. Curvey (1935)
Year of Election or Appointment: 2007
Trustee
Chairman of the Board of Trustees
Mr. Curvey also serves as Trustee of other Fidelity® funds. Mr. Curvey is Vice Chairman (2007-present) and Director of FMR LLC (diversified financial services company). In addition, Mr. Curvey is an Overseer Emeritus for the Boston Symphony Orchestra, a Director of Artis-Naples, and a Trustee of Brewster Academy in Wolfeboro, New Hampshire. Previously, Mr. Curvey served as a Director of Fidelity Research & Analysis Co. (investment adviser firm, 2009-2018), Director of Fidelity Investments Money Management, Inc. (investment adviser firm, 2009-2014) and a Director of FMR and FMR Co., Inc. (investment adviser firms, 2007-2014).
Charles S. Morrison (1960)
Year of Election or Appointment: 2014
Trustee
Mr. Morrison also serves as Trustee of other funds. He serves as President of Fidelity SelectCo, LLC (investment adviser firm, 2017-present) and Fidelity Management & Research Company (FMR) (investment adviser firm, 2016-present), a Director of Fidelity Investments Money Management, Inc. (FIMM) (investment adviser firm, 2014-present), Director of Fidelity SelectCo, LLC (investment adviser firm, 2014-present), President, Asset Management (2014-present), and is an employee of Fidelity Investments. Previously, Mr. Morrison served as Vice President of Fidelity's Fixed Income and Asset Allocation Funds (2012-2014), President, Fixed Income (2011-2014), Vice President of Fidelity's Money Market Funds (2005-2009), President, Money Market Group Leader of FMR (investment adviser firm, 2009), and Senior Vice President, Money Market Group of FMR (2004-2009). Mr. Morrison also served as Vice President of Fidelity's Bond Funds (2002-2005), certain Balanced Funds (2002-2005), and certain Asset Allocation Funds (2002-2007), and as Senior Vice President (2002-2005) of Fidelity's Bond Division.
* Determined to be an “Interested Trustee” by virtue of, among other things, his or her affiliation with the trust or various entities under common control with FMR.
+ The information includes the Trustee's principal occupation during the last five years and other information relating to the experience, attributes, and skills relevant to the Trustee's qualifications to serve as a Trustee, which led to the conclusion that the Trustee should serve as a Trustee for the fund.
Independent Trustees:
Correspondence intended for an Independent Trustee may be sent to Fidelity Investments, P.O. Box 55235, Boston, Massachusetts 02205-5235.
Name, Year of Birth; Principal Occupations and Other Relevant Experience+
Dennis J. Dirks (1948)
Year of Election or Appointment: 2005
Trustee
Mr. Dirks also serves as Trustee of other Fidelity® funds. Prior to his retirement in May 2003, Mr. Dirks was Chief Operating Officer and a member of the Board of The Depository Trust & Clearing Corporation (DTCC). He also served as President, Chief Operating Officer, and Board member of The Depository Trust Company (DTC) and President and Board member of the National Securities Clearing Corporation (NSCC). In addition, Mr. Dirks served as Chief Executive Officer and Board member of the Government Securities Clearing Corporation, Chief Executive Officer and Board member of the Mortgage-Backed Securities Clearing Corporation, as a Trustee and a member of the Finance Committee of Manhattan College (2005-2008), as a Trustee and a member of the Finance Committee of AHRC of Nassau County (2006-2008), as a member of the Independent Directors Council (IDC) Governing Council (2010-2015), and as a member of the Board of Directors for The Brookville Center for Children’s Services, Inc. (2009-2017). Mr. Dirks is a member of the Finance Committee (2016-present), Board of Directors (2017-present) and Board of Trustees (2018-present) and is Treasurer (2018-present) of the Asolo Repertory Theatre.
Donald F. Donahue (1950)
Year of Election or Appointment: 2018
Trustee
Mr. Donahue also serves as a Trustee of other Fidelity® funds. Mr. Donahue is President and Chief Executive Officer of Miranda Partners, LLC (risk consulting for the financial services industry, 2012-present). Previously, Mr. Donahue served as a Member of the Advisory Board of certain Fidelity® funds (2015-2018) and Chief Executive Officer (2006-2012), Chief Operating Officer (2003-2006), and Managing Director, Customer Marketing and Development (1999-2003) of The Depository Trust & Clearing Corporation (financial markets infrastructure). Mr. Donahue serves as a Member (2007-present) and Co-Chairman (2016-present) of the Board of Directors of United Way of New York, Member of the Board of Directors of NYC Leadership Academy (2012-present) and Member of the Board of Advisors of Ripple Labs, Inc. (financial services, 2015-present). He also served as Chairman (2010-2012) and Member of the Board of Directors (2012-2013) of Omgeo, LLC (financial services), Treasurer of United Way of New York (2012-2016), and Member of the Board of Directors of XBRL US (financial services non-profit, 2009-2012) and the International Securities Services Association (2009-2012).
Alan J. Lacy (1953)
Year of Election or Appointment: 2008
Trustee
Mr. Lacy also serves as Trustee of other Fidelity® funds. Mr. Lacy serves as a Director of Bristol-Myers Squibb Company (global pharmaceuticals, 2008-present). He is a Trustee of the California Chapter of The Nature Conservancy (2015-present) and a Director of the Center for Advanced Study in the Behavioral Sciences at Stanford University (2015-present). In addition, Mr. Lacy served as Senior Adviser (2007-2014) of Oak Hill Capital Partners, L.P. (private equity) and also served as Chief Executive Officer (2005) and Vice Chairman (2005-2006) of Sears Holdings Corporation (retail) and Chief Executive Officer and Chairman of the Board of Sears, Roebuck and Co. (retail, 2000-2005). Previously, Mr. Lacy served as Chairman (2014-2017) and a member (2010-2017) of the Board of Directors of Dave & Buster’s Entertainment, Inc. (restaurant and entertainment complexes), as Chairman (2008-2011) and a member (2006-2015) of the Board of Trustees of the National Parks Conservation Association, and as a member of the Board of Directors for The Hillman Companies, Inc. (hardware wholesalers, 2010-2014), Earth Fare, Inc. (retail grocery, 2010-2014), and The Western Union Company (global money transfer, 2006-2011).
Ned C. Lautenbach (1944)
Year of Election or Appointment: 2000
Trustee
Chairman of the Independent Trustees
Mr. Lautenbach also serves as Trustee of other Fidelity® funds. Mr. Lautenbach currently serves as Vice Chair of the Board of Governors, State University System of Florida (2013-present) and is a member of the Council on Foreign Relations (1994-present). He is also a member and has most recently served as Chairman of the Board of Directors of Artis-Naples (2012-present). Previously, Mr. Lautenbach served as a member and then Lead Director of the Board of Directors of Eaton Corporation (diversified industrial, 1997-2016). He was also a Partner and Advisory Partner at Clayton, Dubilier & Rice, LLC (private equity investment, 1998-2010), as well as a Director of Sony Corporation (2006-2007). In addition, Mr. Lautenbach also had a 30-year career with IBM (technology company) during which time he served as Senior Vice President and a member of the Corporate Executive Committee (1968-1998).
Joseph Mauriello (1944)
Year of Election or Appointment: 2008
Trustee
Mr. Mauriello also serves as Trustee of other Fidelity® funds. Prior to his retirement in January 2006, Mr. Mauriello served in numerous senior management positions including Deputy Chairman and Chief Operating Officer (2004-2005), and Vice Chairman of Financial Services (2002-2004) of KPMG LLP US (professional services, 1965-2005). Mr. Mauriello currently serves as a member of the Board of Directors of XL Group plc. (global insurance and re-insurance, 2006-present) and the Independent Directors Council (IDC) Governing Council (2015-present). Previously, Mr. Mauriello served as a Director of the Hamilton Funds of the Bank of New York (2006-2007) and of Arcadia Resources Inc. (health care services and products, 2007-2012).
Cornelia M. Small (1944)
Year of Election or Appointment: 2005
Trustee
Ms. Small also serves as Trustee of other Fidelity® funds. Ms. Small is a member of the Board of Directors (2009-present) and Chair of the Investment Committee (2010-present) of the Teagle Foundation. Ms. Small also serves on the Investment Committee of the Berkshire Taconic Community Foundation (2008-present). Previously, Ms. Small served as Chairperson (2002-2008) and a member of the Investment Committee and Chairperson (2008-2012) and a member of the Board of Trustees of Smith College. In addition, Ms. Small served as Chief Investment Officer, Director of Global Equity Investments, and a member of the Board of Directors of Scudder, Stevens & Clark and Scudder Kemper Investments.
Garnett A. Smith (1947)
Year of Election or Appointment: 2018
Trustee
Mr. Smith also serves as Trustee of other Fidelity® funds. Prior to Mr. Smith's retirement, he served as Chairman and Chief Executive Officer of Inbrand Corp. (manufacturer of personal absorbent products, 1990-1997). He also served as President (1986-1990) of Inbrand Corp. Prior to his employment with Inbrand Corp., he was employed by a retail fabric chain and North Carolina National Bank. In addition, Mr. Smith served as a Member of the Advisory Board of certain Fidelity® funds (2012-2013) and as a board member of the Jackson Hole Land Trust (2009-2012).
David M. Thomas (1949)
Year of Election or Appointment: 2008
Trustee
Mr. Thomas also serves as Trustee of other Fidelity® funds. Mr. Thomas serves as Non-Executive Chairman of the Board of Directors of Fortune Brands Home and Security (home and security products, 2011-present), as a member of the Board of Directors (2004-present) and Presiding Director (2013-present) of Interpublic Group of Companies, Inc. (marketing communication), and as a member of the Board of Trustees of the University of Florida (2013-present). Previously, Mr. Thomas served as Executive Chairman (2005-2006) and Chairman and Chief Executive Officer (2000-2005) of IMS Health, Inc. (pharmaceutical and healthcare information solutions), and a Director of Fortune Brands, Inc. (consumer products, 2000-2011).
+ The information includes the Trustee's principal occupation during the last five years and other information relating to the experience, attributes, and skills relevant to the Trustee's qualifications to serve as a Trustee, which led to the conclusion that the Trustee should serve as a Trustee for the fund.
Advisory Board Members and Officers:
Correspondence intended for a Member of the Advisory Board (if any) may be sent to Fidelity Investments, P.O. Box 55235, Boston, Massachusetts 02205-5235. Correspondence intended for an officer or Peter S. Lynch may be sent to Fidelity Investments, 245 Summer Street, Boston, Massachusetts 02210. Officers appear below in alphabetical order.
Name, Year of Birth; Principal Occupation
Peter S. Lynch (1944)
Year of Election or Appointment: 2003
Member of the Advisory Board
Mr. Lynch also serves as Member of the Advisory Board of other Fidelity® funds. Mr. Lynch is Vice Chairman and a Director of FMR (investment adviser firm) and FMR Co., Inc. (investment adviser firm). In addition, Mr. Lynch serves as a Trustee of Boston College and as the Chairman of the Inner-City Scholarship Fund. Previously, Mr. Lynch served on the Special Olympics International Board of Directors (1997-2006).
William S. Stavropoulos (1939)
Year of Election or Appointment: 2018
Member of the Advisory Board
Mr. Stavropoulos also serves as Member of the Advisory Board of other Fidelity® funds. Mr. Stavropoulos serves as President and Founder of the Michigan Baseball Foundation, the Great Lakes Loons (2007-present). Mr. Stavropoulos is Chairman Emeritus of the Board of Directors of The Dow Chemical Company, where he previously served in numerous senior management positions, including President, CEO (1995-2000; 2002-2004), Chairman of the Executive Committee (2000-2006), and as a member of the Board of Directors (1990-2006). Currently, Mr. Stavropoulos is Chairman of the Board of Directors of Univar Inc. (global distributor of commodity and specialty chemicals), a Director of Teradata Corporation (data warehousing and technology solutions), and a member of the Advisory Board for Metalmark Capital LLC (private equity investment, 2005-present). Mr. Stavropoulos is an operating advisor to Clayton, Dubilier & Rice, LLC (private equity investment). In addition, Mr. Stavropoulos is a member of the University of Notre Dame Advisory Council for the College of Science, a Trustee of the Rollin L. Gerstacker Foundation, and a Director of Artis-Naples in Naples, Florida. Previously, Mr. Stavropoulos served as Trustee of certain Fidelity® funds (2001-2018) and as a Director of Chemical Financial Corporation (bank holding company, 1993-2012) and Tyco International, Ltd. (multinational manufacturing and services, 2007-2012).
Carol B. Tomé (1957)
Year of Election or Appointment: 2018
Member of the Advisory Board
Ms. Tomé also serves as Member of the Advisory Board of other Fidelity® funds. Ms. Tomé is Chief Financial Officer (2001-present) and Executive Vice President of Corporate Services (2007-present) of The Home Depot, Inc. (home improvement retailer) and a Director (2003-present) and Chair of the Audit Committee (2004-present) of United Parcel Service, Inc. (package delivery and supply chain management). Previously, Ms. Tomé served as Trustee of certain Fidelity® funds (2017), Senior Vice President of Finance and Accounting/Treasurer (2000-2007) and Vice President and Treasurer (1995-2000) of The Home Depot, Inc. and Chair of the Board (2010-2012), Vice Chair of the Board (2009 and 2013), and a Director (2008-2013) of the Federal Reserve Bank of Atlanta. Ms. Tomé is also a director or trustee of many community and professional organizations.
Michael E. Wiley (1950)
Year of Election or Appointment: 2018
Member of the Advisory Board
Mr. Wiley also serves as Trustee or Member of the Advisory Board of other Fidelity® funds. Mr. Wiley serves as a Director of Andeavor Corporation (independent oil refiner and marketer, 2005-present), a Director of Andeavor Logistics LP (natural resources logistics, 2015-present), and a Director of Bill Barrett Corporation (exploration and production, 2005-present). In addition, Mr. Wiley also serves as a Director of Post Oak Bank (privately-held bank, 2004-present). Previously, Mr. Wiley served as a Trustee of other Fidelity® funds (2008-2013), as a Director of Asia Pacific Exploration Consolidated (international oil and gas exploration and production, 2008-2013), as a member of the Board of Trustees of the University of Tulsa (2000-2006; 2007-2010), as a Senior Energy Advisor of Katzenbach Partners, LLC (consulting, 2006-2007), as an Advisory Director of Riverstone Holdings (private investment), Chairman, President, and CEO of Baker Hughes, Inc. (oilfield services, 2000-2004), and as Director of Spinnaker Exploration Company (exploration and production, 2001-2005).
Elizabeth Paige Baumann (1968)
Year of Election or Appointment: 2017
Anti-Money Laundering (AML) Officer
Ms. Baumann also serves as AML Officer of other funds. She is Chief AML Officer (2012-present) and Senior Vice President (2014-present) of FMR LLC (diversified financial services company) and is an employee of Fidelity Investments. Previously, Ms. Baumann served as AML Officer of the funds (2012-2016), and Vice President (2007-2014) and Deputy Anti-Money Laundering Officer (2007-2012) of FMR LLC.
Marc R. Bryant (1966)
Year of Election or Appointment: 2015
Secretary and Chief Legal Officer (CLO)
Mr. Bryant also serves as Secretary and CLO of other funds. Mr. Bryant serves as CLO, Secretary, and Senior Vice President of Fidelity Management & Research Company (investment adviser firm, 2015-present) and FMR Co., Inc. (investment adviser firm, 2015-present); Secretary of Fidelity SelectCo, LLC (investment adviser firm, 2015-present) and Fidelity Investments Money Management, Inc. (investment adviser firm, 2015-present); and CLO of Fidelity Management & Research (Hong Kong) Limited and FMR Investment Management (UK) Limited (investment adviser firms, 2015-present) and Fidelity Management & Research (Japan) Limited (investment adviser firm, 2016-present). He is Senior Vice President and Deputy General Counsel of FMR LLC (diversified financial services company). Previously, Mr. Bryant served as Secretary and CLO of Fidelity Rutland Square Trust II (2010-2014) and Assistant Secretary of Fidelity's Fixed Income and Asset Allocation Funds (2013-2015). Prior to joining Fidelity Investments, Mr. Bryant served as a Senior Vice President and the Head of Global Retail Legal for AllianceBernstein L.P. (2006-2010), and as the General Counsel for ProFund Advisors LLC (2001-2006).
John J. Burke III (1964)
Year of Election or Appointment: 2018
Chief Financial Officer
Mr. Burke also serves as Chief Financial Officer of other funds. Mr. Burke serves as Head of Investment Operations for Fidelity Fund and Investment Operations (2018-present) and is an employee of Fidelity Investments (1998-present). Previously Mr. Burke served as head of Asset Management Investment Operations (2012-2018).
William C. Coffey (1969)
Year of Election or Appointment: 2009
Assistant Secretary
Mr. Coffey also serves as Assistant Secretary of other funds. He is Senior Vice President and Deputy General Counsel of FMR LLC (diversified financial services company, 2010-present), and is an employee of Fidelity Investments. Previously, Mr. Coffey served as Vice President and Associate General Counsel of FMR LLC (2005-2009).
Timothy M. Cohen (1969)
Year of Election or Appointment: 2018
Vice President
Mr. Cohen also serves as Vice President of other funds. Mr. Cohen serves as Co-Head of Global Equity Research (2016-present), a Director of Fidelity Management & Research (Japan) Limited (investment adviser firm, 2016-present), and is an employee of Fidelity Investments. Previously, Mr. Cohen served as Chief Investment Officer - Equity and a Director of Fidelity Management & Research (U.K.) Inc. (investment adviser firm, 2013-2015) and as a Director of Fidelity Management & Research (Hong Kong) Limited (investment adviser firm, 2017).
Jonathan Davis (1968)
Year of Election or Appointment: 2010
Assistant Treasurer
Mr. Davis also serves as Assistant Treasurer of other funds. Mr. Davis serves as Assistant Treasurer of FMR Capital, Inc. (2017-present) and is an employee of Fidelity Investments. Previously, Mr. Davis served as Vice President and Associate General Counsel of FMR LLC (diversified financial services company, 2003-2010).
Adrien E. Deberghes (1967)
Year of Election or Appointment: 2016
Assistant Treasurer
Mr. Deberghes also serves as an officer of other funds. He serves as Assistant Treasurer of FMR Capital, Inc. (2017-present), Executive Vice President of Fidelity Investments Money Management, Inc. (FIMM) (investment adviser firm, 2016-present), and is an employee of Fidelity Investments (2008-present). Previously, Mr. Deberghes served as President and Treasurer of certain Fidelity® funds (2013-2018). Prior to joining Fidelity Investments, Mr. Deberghes was Senior Vice President of Mutual Fund Administration at State Street Corporation (2007-2008), Senior Director of Mutual Fund Administration at Investors Bank & Trust (2005-2007), and Director of Finance for Dunkin' Brands (2000-2005). Previously, Mr. Deberghes served in other fund officer roles.
Laura M. Del Prato (1964)
Year of Election or Appointment: 2018
Assistant Treasurer
Ms. Del Prato also serves as an officer of other funds. Ms. Del Prato is an employee of Fidelity Investments (2017-present). Prior to joining Fidelity Investments, Ms. Del Prato served as a Managing Director and Treasurer of the JPMorgan Mutual Funds (2014-2017). Prior to JPMorgan, Ms. Del Prato served as a partner at Cohen Fund Audit Services (accounting firm, 2012-2013) and KPMG LLP (accounting firm, 2004-2012).
Colm A. Hogan (1973)
Year of Election or Appointment: 2016
Deputy Treasurer
Mr. Hogan also serves as an officer of other funds. Mr. Hogan serves as Assistant Treasurer of FMR Capital, Inc. (2017-present) and is an employee of Fidelity Investments (2005-present). Previously, Mr. Hogan served as Assistant Treasurer of certain Fidelity® funds (2016-2018).
Pamela R. Holding (1964)
Year of Election or Appointment: 2018
Vice President
Ms. Holding also serves as a Vice President of other funds. Ms. Holding serves as Co-Head of Global Equity Research (2018-present) and is an employee of Fidelity Investments (2013-present).
Chris Maher (1972)
Year of Election or Appointment: 2013
Assistant Treasurer
Mr. Maher serves as Assistant Treasurer of other funds. Mr. Maher is Vice President of Valuation Oversight, serves as Assistant Treasurer of FMR Capital, Inc. (2017-present), and is an employee of Fidelity Investments. Previously, Mr. Maher served as Vice President of Asset Management Compliance (2013), Vice President of the Program Management Group of FMR (investment adviser firm, 2010-2013), and Vice President of Valuation Oversight (2008-2010).
Rieco E. Mello (1969)
Year of Election or Appointment: 2017
Assistant Treasurer
Mr. Mello also serves as Assistant Treasurer of other funds. Mr. Mello serves as Assistant Treasurer of FMR Capital, Inc. (2017-present) and is an employee of Fidelity Investments (1995-present).
Kenneth B. Robins (1969)
Year of Election or Appointment: 2016
Chief Compliance Officer
Mr. Robins also serves as an officer of other funds. Mr. Robins serves as Compliance Officer of Fidelity Management & Research Company and FMR Co., Inc. (investment adviser firms, 2016-present) and is an employee of Fidelity Investments (2004-present). Previously, Mr. Robins served as Executive Vice President of Fidelity Investments Money Management, Inc. (investment adviser firm, 2013-2016) and served in other fund officer roles.
Stacie M. Smith (1974)
Year of Election or Appointment: 2016
President and Treasurer
Ms. Smith also serves as an officer of other funds. Ms. Smith serves as Assistant Treasurer of FMR Capital, Inc. (2017-present), is an employee of Fidelity Investments (2009-present), and has served in other fund officer roles. Prior to joining Fidelity Investments, Ms. Smith served as Senior Audit Manager of Ernst & Young LLP (accounting firm, 1996-2009). Previously, Ms. Smith served as Assistant Treasurer (2013-2018) and Deputy Treasurer (2013-2016) of certain Fidelity® funds.
Marc L. Spector (1972)
Year of Election or Appointment: 2016
Assistant Treasurer
Mr. Spector also serves as an officer of other funds. Mr. Spector serves as Assistant Treasurer of FMR Capital, Inc. (2017-present) and is an employee of Fidelity Investments (2016-present). Prior to joining Fidelity Investments, Mr. Spector served as Director at the Siegfried Group (accounting firm, 2013-2016), and prior to Siegfried Group as audit senior manager at Deloitte & Touche (accounting firm, 2005-2013).
Renee Stagnone (1975)
Year of Election or Appointment: 2016
Assistant Treasurer
Ms. Stagnone also serves as an officer of other funds. Ms. Stagnone serves as Assistant Treasurer of FMR Capital, Inc. (2017-present) and is an employee of Fidelity Investments (1997-present). Previously, Ms. Stagnone served as Deputy Treasurer of certain Fidelity® funds (2013-2016).
Shareholder Expense Example
As a shareholder of the Fund, you incur two types of costs: (1) transaction costs, including sales charges (loads) on purchase payments or redemption proceeds, and (2) ongoing costs, including management fees, distribution and/or service (12b-1) fees and other Fund expenses. This Example is intended to help you understand your ongoing costs (in dollars) of investing in the Fund and to compare these costs with the ongoing costs of investing in other mutual funds.
The Example is based on an investment of $1,000 invested at the beginning of the period and held for the entire period (February 1, 2018 to July 31, 2018).
Actual Expenses
The first line of the accompanying table for each class of the Fund provides information about actual account values and actual expenses. You may use the information in this line, together with the amount you invested, to estimate the expenses that you paid over the period. Simply divide your account value by $1,000.00 (for example, an $8,600 account value divided by $1,000.00 = 8.6), then multiply the result by the number in the first line for a class of the Fund under the heading entitled "Expenses Paid During Period" to estimate the expenses you paid on your account during this period. A small balance maintenance fee of $12.00 that is charged once a year may apply for certain accounts with a value of less than $2,000. This fee is not included in the table below. If it was, the estimate of expenses you paid during the period would be higher, and your ending account value lower, by this amount. In addition, the Fund, as a shareholder in the underlying Fidelity Central Funds, will indirectly bear its pro-rata share of the fees and expenses incurred by the underlying Fidelity Central Funds. These fees and expenses are not included in the Fund's annualized expense ratio used to calculate the expense estimate in the table below.
Hypothetical Example for Comparison Purposes
The second line of the accompanying table for each class of the Fund provides information about hypothetical account values and hypothetical expenses based on a Class' actual expense ratio and an assumed rate of return of 5% per year before expenses, which is not the Class' actual return. The hypothetical account values and expenses may not be used to estimate the actual ending account balance or expenses you paid for the period. You may use this information to compare the ongoing costs of investing in the Fund and other funds. To do so, compare this 5% hypothetical example with the 5% hypothetical examples that appear in the shareholder reports of the other funds. A small balance maintenance fee of $12.00 that is charged once a year may apply for certain accounts with a value of less than $2,000. This fee is not included in the table below. If it was, the estimate of expenses you paid during the period would be higher, and your ending account value lower, by this amount. In addition, the Fund, as a shareholder in the underlying Fidelity Central Funds, will indirectly bear its pro-rata share of the fees and expenses incurred by the underlying Fidelity Central Funds. These fees and expenses are not included in the Fund's annualized expense ratio used to calculate the expense estimate in the table below.
Please note that the expenses shown in the table are meant to highlight your ongoing costs only and do not reflect any transaction costs. Therefore, the second line of the table is useful in comparing ongoing costs only, and will not help you determine the relative total costs of owning different funds. In addition, if these transactional costs were included, your costs would have been higher.
| | Annualized Expense Ratio-A | Beginning
Account Value
February 1, 2018 | Ending
Account Value
July 31, 2018 | Expenses Paid
During Period-B
February 1, 2018
to July 31, 2018 |
| Class A | 1.02% | | | |
| Actual | | $1,000.00 | $1,037.50 | $5.15 |
| Hypothetical-C | | $1,000.00 | $1,019.74 | $5.11 |
| Class M | 1.04% | | | |
| Actual | | $1,000.00 | $1,036.50 | $5.25 |
| Hypothetical-C | | $1,000.00 | $1,019.64 | $5.21 |
| Class C | 1.76% | | | |
| Actual | | $1,000.00 | $1,033.10 | $8.87 |
| Hypothetical-C | | $1,000.00 | $1,016.07 | $8.80 |
| Real Estate Income | .75% | | | |
| Actual | | $1,000.00 | $1,038.50 | $3.79 |
| Hypothetical-C | | $1,000.00 | $1,021.08 | $3.76 |
| Class I | .75% | | | |
| Actual | | $1,000.00 | $1,038.60 | $3.79 |
| Hypothetical-C | | $1,000.00 | $1,021.08 | $3.76 |
A Annualized expense ratio reflects expenses net of applicable fee waivers.
B Expenses are equal to each Class' annualized expense ratio, multiplied by the average account value over the period, multiplied by 181/365 (to reflect the one-half year period).
C 5% return per year before expenses
Distributions (Unaudited)
The Board of Trustees of Fidelity Real Estate Income Fund voted to pay to shareholders of record at the opening of business on record date, the following distributions per share derived from capital gains realized from sales of portfolio securities, and dividends derived from net investment income:
| | Pay Date | Record Date | Dividends | Capital Gains |
| Fidelity Real Estate Income Fund | | | | |
| Class A | 09/10/18 | 09/07/18 | $0.132 | $0.191 |
| Class M | 09/10/18 | 09/07/18 | $0.131 | $0.191 |
| Class C | 09/10/18 | 09/07/18 | $0.108 | $0.191 |
| Fidelity Real Estate Income | 09/10/18 | 09/07/18 | $0.140 | $0.191 |
| Class I | 09/10/18 | 09/07/18 | $0.141 | $0.191 |
The fund hereby designates as a capital gain dividend with respect to the taxable year ended July 31, 2018, $108,134,418, or, if subsequently determined to be different, the net capital gain of such year.
A total of 0.37% of the dividends distributed during the fiscal year was derived from interest on U.S. Government securities which is generally exempt from state income tax.
The fund designates $54,447,650 of distributions paid during the period January 1, 2018 to July 31, 2018 as qualifying to be taxed as interest-related dividends for nonresident alien shareholders.
The fund will notify shareholders in January 2019 of amounts for use in preparing 2018 income tax returns.
Board Approval of Investment Advisory Contracts and Management Fees
Fidelity Real Estate Income Fund
At its July 2018 meeting, the Board of Trustees, including the Independent Trustees (together, the Board), voted to continue the management contract with Fidelity Management & Research Company (FMR) and the sub-advisory agreements (together, the Advisory Contracts) for the fund for six months through January 31, 2019, in connection with the reunification of the Fidelity Equity High Income Funds Board, which oversees the fund, and the Sector Portfolios Board.
The Board considered that the approval of the fund's Advisory Contracts will not result in any changes in (i) the investment process or strategies employed in the management of the fund's assets; (ii) the fees and expenses paid by shareholders; (iii) the nature, extent or quality of services provided under the fund's Advisory Contracts; or (iv) the day-to-day management of the fund or the persons primarily responsible for such management. The Board concluded that the fund's Advisory Contracts are fair and reasonable, and that the fund's Advisory Contracts should be renewed, without modification, through January 31, 2019, with the understanding that the Board will consider the annual renewal for a full one year period in January 2019.
In connection with its consideration of future renewals of the fund's Advisory Contracts, the Board will consider: (i) the nature, extent and quality of services provided to the fund, including shareholder and administrative services and investment performance; (ii) the competitiveness of the management fee and total expenses for the fund; (iii) the costs of the services and profitability, including the revenues earned and the expenses incurred in conducting the business of developing, marketing, distributing, managing, administering, and servicing the fund and its shareholders, to the extent applicable, as well as potential fall-out benefits from Fidelity's non-fund businesses; and (iv) whether there have been economies of scale in respect of the Fidelity funds, whether the Fidelity funds (including the fund) have appropriately benefited from any such economies of scale, and whether there is the potential for realization of any further economies.
Based on its evaluation of all of the conclusions noted above, and after considering all factors it believed relevant, the Board ultimately concluded that the fund's management fee structure is fair and reasonable, and that the continuation of the fund's Advisory Contracts should be approved.
Corporate Headquarters
245 Summer St.
Boston, MA 02210
www.fidelity.com
REI-ANN-0918
1.788862.115
Fidelity® Series Real Estate Income Fund
Annual Report July 31, 2018 |
|
Contents
To view a fund's proxy voting guidelines and proxy voting record for the 12-month period ended June 30, visit http://www.fidelity.com/proxyvotingresults or visit the Securities and Exchange Commission's (SEC) web site at http://www.sec.gov.
You may also call 1-800-544-8544 to request a free copy of the proxy voting guidelines.
Standard & Poor's, S&P and S&P 500 are registered service marks of The McGraw-Hill Companies, Inc. and have been licensed for use by Fidelity Distributors Corporation.
Other third-party marks appearing herein are the property of their respective owners.
All other marks appearing herein are registered or unregistered trademarks or service marks of FMR LLC or an affiliated company. © 2018 FMR LLC. All rights reserved.
This report and the financial statements contained herein are submitted for the general information of the shareholders of the Fund. This report is not authorized for distribution to prospective investors in the Fund unless preceded or accompanied by an effective prospectus.
A fund files its complete schedule of portfolio holdings with the SEC for the first and third quarters of each fiscal year on Form N-Q. Forms N-Q are available on the SEC’s web site at http://www.sec.gov. A fund's Forms N-Q may be reviewed and copied at the SEC’s Public Reference Room in Washington, DC. Information regarding the operation of the SEC's Public Reference Room may be obtained by calling 1-800-SEC-0330.
For a complete list of a fund's portfolio holdings, view the most recent holdings listing, semiannual report, or annual report on Fidelity's web site at http://www.fidelity.com, http://www.institutional.fidelity.com, or http://www.401k.com, as applicable.
NOT FDIC INSURED •MAY LOSE VALUE •NO BANK GUARANTEE
Neither the Fund nor Fidelity Distributors Corporation is a bank.
Performance: The Bottom Line
Average annual total return reflects the change in the value of an investment, assuming reinvestment of distributions from dividend income and capital gains (the profits earned upon the sale of securities that have grown in value, if any) and assuming a constant rate of performance each year. The hypothetical investment and the average annual total returns do not reflect the deduction of taxes that a shareholder would pay on fund distributions or the redemption of fund shares. During periods of reimbursement by Fidelity, a fund’s total return will be greater than it would be had the reimbursement not occurred. How a fund did yesterday is no guarantee of how it will do tomorrow.
Average Annual Total Returns
| For the periods ended July 31, 2018 | Past 1 year | Past 5 years | Life of fundA |
| Fidelity® Series Real Estate Income Fund | 3.61% | 6.29% | 8.32% |
A From October 20, 2011
$10,000 Over Life of Fund
Let's say hypothetically that $10,000 was invested in Fidelity® Series Real Estate Income Fund on October 20, 2011, when the fund started.
The chart shows how the value of your investment would have changed, and also shows how the S&P 500® Index performed over the same period.
| Period Ending Values |
| $17,193 | Fidelity® Series Real Estate Income Fund |
| $26,724 | S&P 500® Index |
Management's Discussion of Fund Performance
Market Recap: For the 12 months ending July 31, 2018, commercial real estate continued to benefit from a generally solid fundamental backdrop, with gently rising cash flows due to increasing rents and stable-to-rising occupancy rates. Certain markets, however, saw a modest pick-up in new supply, which slowed rental-income growth. For real estate investment trust (REIT) common stocks, it was an up-and-down period. U.S. REITs corrected sharply in late 2017 and the first two months of 2018 before enjoying a strong upward trend through the end of July. Higher interest rates also posed a headwind for U.S. REITs, as income-seeking investors perceived a correlation between the two factors. Against this backdrop, REIT common stocks, as measured by the FTSE
® NAREIT
® All REITs Index, gained 4.35%. In comparison, the S&P 500
® index, a measure of the broad U.S. stock market, rose 16.24%. Meanwhile, higher interest rates slowed more rate-sensitive asset types, such as real estate preferred stocks and bonds. The past 12 months, real estate preferreds gained 1.76%, as measured by the MSCI REIT Preferred Index, while the ICE BofAML
® US Real Estate Index – a market-capitalization-weighted measure of investment-grade corporate debt in the domestic real estate sector – returned -0.39%. In aggregate, real estate bonds continued to benefit from issuers’ strong credit quality, even as higher rates weighed on the securities’ prices.
Comments from Portfolio Manager Mark Snyderman: For the fiscal year, the fund returned 3.61%, outpacing the 1.00% return of the Fidelity Series Real Estate Income Composite IndexSM. The Composite index is a 40/40/20 blend of the MSCI REIT Preferred Index, ICE BofAML
® US Real Estate Index and FTSE
® NAREIT
® All REITs Index. I was mildly disappointed with the fund's performance, given my goal of generating a long-term annualized return in the mid-to-upper single digits. On the positive side, however, I'm pleased with how the fund's real estate bond and preferred stocks did, given rising interest rates. Our portfolio of commercial mortgage-backed securities (CMBS) gained about 5%, while our high-yield real estate bonds rose roughly 4% and our investment-grade debt had a roughly flat result – all outperforming the ICE BofAML real estate bond index. Meanwhile, our preferred stock portfolio gained 5%, outperforming the MSCI preferred stock index. I was happy with the performance of these asset classes because of my regular focus on managing the fund's interest rate risk. In contrast, several of our common stock holdings underperformed this period, led by a poor-performing position in Colony NorthStar that, in hindsight, was a mistake because the company's businesses haven't been as strong as I expected. Overall, our common stock portfolio produced a slightly negative return, compared with a 4.35% increase for the FTSE NAREIT index.
The views expressed above reflect those of the portfolio manager(s) only through the end of the period as stated on the cover of this report and do not necessarily represent the views of Fidelity or any other person in the Fidelity organization. Any such views are subject to change at any time based upon market or other conditions and Fidelity disclaims any responsibility to update such views. These views may not be relied on as investment advice and, because investment decisions for a Fidelity fund are based on numerous factors, may not be relied on as an indication of trading intent on behalf of any Fidelity fund.
Investment Summary (Unaudited)
Top Five Stocks as of July 31, 2018
| | % of fund's net assets |
| Equity Lifestyle Properties, Inc. | 1.5 |
| Acadia Realty Trust (SBI) | 1.2 |
| Apartment Investment & Management Co. Class A | 1.2 |
| Invesco Mortgage Capital, Inc. 7.50% | 1.0 |
| Ventas, Inc. | 1.0 |
| | 5.9 |
Top 5 Bonds as of July 31, 2018
| | % of fund's net assets |
| Senior Housing Properties Trust 4.75% 5/1/24 | 1.3 |
| RWT Holdings, Inc. 5.625% 11/15/19 | 1.3 |
| PennyMac Corp. 5.375% 5/1/20 | 0.8 |
| Howard Hughes Corp. 5.375% 3/15/25 | 0.7 |
| Care Capital Properties LP 5.125% 8/15/26 | 0.7 |
| | 4.8 |
Top Five REIT Sectors as of July 31, 2018
| | % of fund's net assets |
| REITs - Mortgage | 18.4 |
| REITs - Health Care | 7.3 |
| REITs - Diversified | 6.4 |
| REITs - Apartments | 4.7 |
| REITs - Shopping Centers | 3.0 |
Asset Allocation (% of fund's net assets)
| As of July 31, 2018* |
| | Common Stocks | 15.8% |
| | Preferred Stocks | 21.4% |
| | Bonds | 46.5% |
| | Convertible Securities | 8.3% |
| | Other Investments | 5.7% |
| | Short-Term Investments and Net Other Assets (Liabilities) | 2.3% |

* Foreign investments - 1.4%
Schedule of Investments July 31, 2018
Showing Percentage of Net Assets
| Common Stocks - 15.8% | | | |
| | | Shares | Value |
| CONSUMER DISCRETIONARY - 0.2% | | | |
| Hotels, Restaurants & Leisure - 0.2% | | | |
| Wyndham Destinations, Inc. | | 22,700 | $1,046,924 |
| Wyndham Hotels & Resorts, Inc. | | 16,600 | 962,800 |
| | | | 2,009,724 |
| FINANCIALS - 2.3% | | | |
| Capital Markets - 0.2% | | | |
| Ellington Financial LLC | | 124,800 | 2,056,704 |
| Insurance - 0.1% | | | |
| FNF Group | | 15,100 | 611,550 |
| Mortgage Real Estate Investment Trusts - 2.0% | | | |
| Anworth Mortgage Asset Corp. | | 35,512 | 178,980 |
| Chimera Investment Corp. | | 118,500 | 2,263,350 |
| Dynex Capital, Inc. | | 128,700 | 855,855 |
| Ellington Residential Mortgage REIT | | 32,300 | 361,760 |
| Great Ajax Corp. | | 199,926 | 2,673,011 |
| Hunt Companies Finance Trust I | | 17,008 | 56,977 |
| Invesco Mortgage Capital, Inc. | | 100,100 | 1,660,659 |
| MFA Financial, Inc. | | 1,122,900 | 9,039,345 |
| New Residential Investment Corp. | | 12,200 | 218,258 |
| Redwood Trust, Inc. | | 59,900 | 1,006,919 |
| | | | 18,315,114 |
|
| TOTAL FINANCIALS | | | 20,983,368 |
|
| REAL ESTATE - 13.3% | | | |
| Equity Real Estate Investment Trusts (REITs) - 13.1% | | | |
| Acadia Realty Trust (SBI) | | 420,000 | 11,373,600 |
| American Homes 4 Rent Class A | | 83,067 | 1,839,103 |
| American Tower Corp. | | 57,000 | 8,449,680 |
| Apartment Investment & Management Co. Class A | | 254,701 | 10,862,998 |
| AvalonBay Communities, Inc. | | 16,600 | 2,935,710 |
| Cedar Realty Trust, Inc. | | 32,200 | 153,272 |
| Colony NorthStar, Inc. | | 698,199 | 4,300,906 |
| Crown Castle International Corp. | | 9,900 | 1,097,217 |
| DDR Corp. | | 119,700 | 1,639,890 |
| Equinix, Inc. | | 13,200 | 5,798,496 |
| Equity Lifestyle Properties, Inc. | | 145,200 | 13,211,741 |
| Equity Residential (SBI) | | 78,100 | 5,110,083 |
| Extra Space Storage, Inc. | | 7,900 | 742,363 |
| Gramercy Property Trust | | 52,300 | 1,432,497 |
| Healthcare Realty Trust, Inc. | | 47,500 | 1,411,225 |
| Healthcare Trust of America, Inc. | | 98,950 | 2,703,314 |
| Lexington Corporate Properties Trust | | 384,422 | 3,379,069 |
| Mid-America Apartment Communities, Inc. | | 74,414 | 7,499,443 |
| Omega Healthcare Investors, Inc. | | 89,700 | 2,663,193 |
| Public Storage | | 14,000 | 3,049,620 |
| Rexford Industrial Realty, Inc. | | 24,400 | 747,616 |
| Sabra Health Care REIT, Inc. | | 241,000 | 5,208,010 |
| Safety Income and Growth, Inc. | | 46,000 | 818,800 |
| Senior Housing Properties Trust (SBI) | | 219,600 | 3,917,664 |
| Spirit MTA REIT | | 9,630 | 96,204 |
| Spirit Realty Capital, Inc. | | 96,300 | 806,031 |
| Store Capital Corp. | | 88,200 | 2,421,090 |
| Terreno Realty Corp. | | 44,480 | 1,641,757 |
| Ventas, Inc. | | 168,328 | 9,490,333 |
| VEREIT, Inc. | | 240,300 | 1,833,489 |
| Welltower, Inc. | | 29,500 | 1,846,700 |
| | | | 118,481,114 |
| Real Estate Management & Development - 0.2% | | | |
| Colony NorthStar Credit Real Estate, Inc. | | 81,100 | 1,724,186 |
| Retail Value, Inc. (a) | | 11,970 | 395,489 |
| | | | 2,119,675 |
|
| TOTAL REAL ESTATE | | | 120,600,789 |
|
| TOTAL COMMON STOCKS | | | |
| (Cost $119,102,305) | | | 143,593,881 |
|
| Preferred Stocks - 23.9% | | | |
| Convertible Preferred Stocks - 2.5% | | | |
| FINANCIALS - 1.0% | | | |
| Mortgage Real Estate Investment Trusts - 1.0% | | | |
| Great Ajax Corp. 7.25% | | 306,500 | 7,616,035 |
| Sutherland Asset Management Corp. 7.00% | | 68,900 | 1,812,070 |
| | | | 9,428,105 |
| REAL ESTATE - 1.5% | | | |
| Equity Real Estate Investment Trusts (REITs) - 1.3% | | | |
| Alexandria Real Estate Equities, Inc. Series D, 7.00% | | 8,241 | 287,937 |
| Braemar Hotels & Resorts, Inc. 5.50% | | 17,193 | 328,386 |
| iStar Financial, Inc. Series J, 4.50% | | 44,700 | 2,100,963 |
| Lexington Corporate Properties Trust Series C, 6.50% | | 70,019 | 3,430,161 |
| QTS Realty Trust, Inc. 6.50% (a) | | 8,000 | 846,560 |
| RLJ Lodging Trust Series A, 1.95% | | 38,600 | 1,017,110 |
| Wheeler REIT, Inc. 8.75% | | 208,000 | 4,132,960 |
| | | | 12,144,077 |
| Real Estate Management & Development - 0.2% | | | |
| Landmark Infrastructure Partners LP 0.00% | | 55,500 | 1,279,275 |
| TOTAL REAL ESTATE | | | 13,423,352 |
|
| TOTAL CONVERTIBLE PREFERRED STOCKS | | | 22,851,457 |
|
| Nonconvertible Preferred Stocks - 21.4% | | | |
| FINANCIALS - 10.2% | | | |
| Capital Markets - 0.1% | | | |
| Arlington Asset Investment Corp. 6.625% | | 31,528 | 768,883 |
| Mortgage Real Estate Investment Trusts - 10.1% | | | |
| AG Mortgage Investment Trust, Inc.: | | | |
| 8.00% | | 137,584 | 3,497,385 |
| 8.25% | | 1,300 | 33,436 |
| AGNC Investment Corp.: | | | |
| Series B, 7.75% | | 29,100 | 751,420 |
| Series C, 7.00% | | 61,500 | 1,593,852 |
| American Capital Mortgage Investment Corp. Series A, 8.125% | | 33,100 | 851,974 |
| Annaly Capital Management, Inc.: | | | |
| Series C, 7.625% | | 14,664 | 374,058 |
| Series D, 7.50% | | 83,513 | 2,123,736 |
| Series F, 6.95% | | 206,600 | 5,263,052 |
| Series G, 6.50% | | 118,900 | 2,885,703 |
| Anworth Mortgage Asset Corp. Series A, 8.625% | | 121,162 | 3,253,030 |
| Apollo Commercial Real Estate Finance, Inc. Series C, 8.00% | | 89,058 | 2,277,658 |
| Arbor Realty Trust, Inc.: | | | |
| Series A, 8.25% | | 41,922 | 1,087,876 |
| Series B, 7.75% | | 40,000 | 1,025,600 |
| Series C, 8.50% | | 15,000 | 396,300 |
| Armour Residential REIT, Inc. Series B, 7.875% | | 25,701 | 643,075 |
| Capstead Mortgage Corp. Series E, 7.50% | | 37,016 | 930,952 |
| Cherry Hill Mortgage Investment Corp. Series A, 8.20% | | 61,500 | 1,568,250 |
| Chimera Investment Corp.: | | | |
| Series A, 8.00% | | 36,200 | 931,064 |
| Series B, 8.00% | | 328,858 | 8,582,701 |
| CYS Investments, Inc.: | | | |
| Series A, 7.75% | | 10,314 | 258,263 |
| Series B, 7.50% | | 113,333 | 2,799,438 |
| Dynex Capital, Inc.: | | | |
| Series A, 8.50% | | 96,313 | 2,454,055 |
| Series B, 7.625% | | 47,335 | 1,166,808 |
| Exantas Capital Corp. 8.625% | | 2,011 | 51,200 |
| Hunt Companies Finance Trust I Series A, 8.75% | | 28,863 | 727,925 |
| Invesco Mortgage Capital, Inc.: | | | |
| 7.50% | | 381,256 | 9,531,400 |
| Series A, 7.75% | | 30,151 | 758,298 |
| Series B, 7.75% | | 226,916 | 5,908,076 |
| MFA Financial, Inc.: | | | |
| 8.00% | | 108,747 | 2,793,710 |
| Series B, 7.50% | | 188,749 | 4,777,426 |
| New York Mortgage Trust, Inc.: | | | |
| Series B, 7.75% | | 78,802 | 1,904,250 |
| Series C, 7.875% | | 117,633 | 2,862,011 |
| Series D, 8.00% | | 74,400 | 1,775,184 |
| PennyMac Mortgage Investment Trust: | | | |
| 8.125% | | 59,000 | 1,487,974 |
| Series B, 8.00% | | 102,800 | 2,593,644 |
| Two Harbors Investment Corp.: | | | |
| Series A, 8.125% | | 104,500 | 2,808,573 |
| Series B, 7.625% | | 220,055 | 5,624,606 |
| Series C, 7.25% | | 123,545 | 3,043,976 |
| Wells Fargo Real Estate Investment Corp. Series A, 6.375% | | 23,000 | 602,600 |
| | | | 92,000,539 |
| TOTAL FINANCIALS | | | 92,769,422 |
| REAL ESTATE - 11.1% | | | |
| Equity Real Estate Investment Trusts (REITs) - 11.0% | | | |
| American Homes 4 Rent: | | | |
| Series D, 6.50% | | 40,000 | 1,048,000 |
| Series E, 6.35% | | 40,000 | 1,038,404 |
| Series F, 5.875% | | 44,883 | 1,122,075 |
| Series G, 5.875% | | 34,800 | 860,604 |
| Ashford Hospitality Trust, Inc.: | | | |
| Series D, 8.45% | | 12,945 | 335,854 |
| Series F, 7.375% | | 52,000 | 1,254,198 |
| Series G, 7.375% | | 20,000 | 485,000 |
| Series H, 7.50% | | 28,700 | 703,469 |
| Series I, 7.50% | | 47,300 | 1,148,108 |
| Bluerock Residential Growth (REIT), Inc.: | | | |
| Series A, 8.25% | | 102,400 | 2,622,259 |
| Series C, 7.625% | | 27,200 | 670,757 |
| Series D, 7.125% | | 30,000 | 686,700 |
| Cedar Realty Trust, Inc.: | | | |
| Series B, 7.25% | | 24,806 | 619,654 |
| Series C, 6.50% | | 50,200 | 1,167,652 |
| City Office REIT, Inc. Series A, 6.625% | | 25,500 | 629,850 |
| Colony NorthStar, Inc.: | | | |
| Series B, 8.25% | | 42,790 | 1,101,843 |
| Series E, 8.75% | | 94,516 | 2,485,771 |
| Series G, 7.50% | | 72,608 | 1,754,209 |
| Series H, 7.125% | | 175,512 | 4,140,328 |
| Series I, 7.15% | | 196,135 | 4,575,830 |
| Series J, 7.15% | | 256,537 | 5,977,312 |
| DDR Corp.: | | | |
| Series J, 6.50% | | 70,181 | 1,743,296 |
| Series K, 6.25% | | 25,489 | 617,853 |
| Digital Realty Trust, Inc.: | | | |
| Series C, 6.625% | | 16,000 | 425,280 |
| Series G, 5.875% | | 28,270 | 714,383 |
| Series H, 7.375% | | 10,000 | 260,280 |
| Farmland Partners, Inc. Series B, 6.00% | | 110,000 | 2,550,900 |
| General Growth Properties, Inc. Series A, 6.375% | | 38,990 | 957,594 |
| Gladstone Commercial Corp. Series D, 7.00% | | 101,200 | 2,567,950 |
| Gladstone Land Corp. Series A, 6.375% | | 11,000 | 280,170 |
| Global Medical REIT, Inc. Series A, 7.50% | | 22,800 | 566,010 |
| Global Net Lease, Inc. Series A, 7.25% | | 123,600 | 3,128,415 |
| Government Properties Income Trust 5.875% | | 37,500 | 944,625 |
| Hersha Hospitality Trust Series D, 6.50% | | 40,000 | 924,800 |
| Investors Real Estate Trust Series C, 6.625% | | 54,100 | 1,339,857 |
| iStar Financial, Inc.: | | | |
| Series D, 8.00% | | 62,442 | 1,592,271 |
| Series G, 7.65% | | 96,000 | 2,403,840 |
| Series I, 7.50% | | 26,900 | 662,547 |
| Jernigan Capital, Inc. Series B, 7.00% | | 26,800 | 647,826 |
| Kimco Realty Corp. Series M, 5.25% | | 22,400 | 507,808 |
| LaSalle Hotel Properties: | | | |
| Series I, 6.375% | | 47,339 | 1,181,108 |
| Series J, 6.30% | | 40,000 | 1,008,000 |
| Monmouth Real Estate Investment Corp. Series C, 6.125% | | 40,400 | 985,905 |
| National Retail Properties, Inc. Series E, 5.70% | | 46,124 | 1,164,216 |
| National Storage Affiliates Trust Series A, 6.00% | | 11,300 | 282,274 |
| Pebblebrook Hotel Trust: | | | |
| Series C, 6.50% | | 71,130 | 1,790,257 |
| Series D, 6.375% | | 50,000 | 1,246,500 |
| Pennsylvania (REIT): | | | |
| Series B, 7.375% | | 55,408 | 1,359,712 |
| Series C, 7.20% | | 9,000 | 211,680 |
| Series D, 6.875% | | 25,700 | 580,306 |
| Plymouth Industrial REIT, Inc. Series A, 7.50% | | 28,100 | 699,662 |
| Prologis, Inc. Series Q, 8.54% | | 15,800 | 1,013,570 |
| PS Business Parks, Inc. Series U, 5.75% | | 102,483 | 2,581,957 |
| Public Storage: | | | |
| Series F, 5.15% | | 28,000 | 694,960 |
| Series Y, 6.375% | | 19,826 | 512,304 |
| QTS Realty Trust, Inc. Series A, 7.125% | | 32,500 | 830,050 |
| RAIT Financial Trust: | | | |
| 7.125% | | 82,863 | 1,890,105 |
| 7.625% | | 46,080 | 901,786 |
| Rexford Industrial Realty, Inc.: | | | |
| Series A, 5.875% | | 25,000 | 615,563 |
| Series B, 5.875% | | 49,100 | 1,207,860 |
| Saul Centers, Inc.: | | | |
| Series C, 6.875% | | 40,477 | 1,011,925 |
| Series D, 6.125% | | 15,000 | 352,500 |
| Sotherly Hotels, Inc.: | | | |
| Series B, 8.00% | | 12,000 | 303,720 |
| Series C, 7.875% | | 18,100 | 453,097 |
| Spirit Realty Capital, Inc. Series A, 6.00% | | 15,500 | 364,610 |
| Stag Industrial, Inc. Series C, 6.875% | | 17,000 | 447,897 |
| Summit Hotel Properties, Inc.: | | | |
| Series D, 6.45% | | 40,000 | 972,400 |
| Series E, 6.25% | | 32,000 | 756,160 |
| Sunstone Hotel Investors, Inc.: | | | |
| Series E, 6.95% | | 8,000 | 208,440 |
| Series F, 6.45% | | 16,000 | 404,800 |
| Taubman Centers, Inc. Series K, 6.25% | | 19,561 | 488,047 |
| UMH Properties, Inc.: | | | |
| Series B, 8.00% | | 150,700 | 4,068,900 |
| Series C, 6.75% | | 58,520 | 1,513,912 |
| Series D, 6.375% | | 19,700 | 472,211 |
| Urstadt Biddle Properties, Inc.: | | | |
| Series G, 6.75% | | 33,500 | 840,850 |
| Series H, 6.25% | | 48,000 | 1,194,043 |
| VEREIT, Inc. Series F, 6.70% | | 254,483 | 6,479,137 |
| Washington Prime Group, Inc.: | | | |
| Series H, 7.50% | | 53,575 | 1,250,976 |
| Series I, 6.875% | | 10,483 | 220,772 |
| | | | 99,825,754 |
| Real Estate Management & Development - 0.1% | | | |
| Landmark Infrastructure Partners LP Series B, 7.90% | | 20,800 | 503,110 |
| TOTAL REAL ESTATE | | | 100,328,864 |
| UTILITIES - 0.1% | | | |
| Electric Utilities - 0.1% | | | |
| Brookfield Infrastructure Partners LP Series 5, 5.35% | | 30,700 | 610,059 |
|
| TOTAL NONCONVERTIBLE PREFERRED STOCKS | | | 193,708,345 |
|
| TOTAL PREFERRED STOCKS | | | |
| (Cost $212,340,256) | | | 216,559,802 |
| | | Principal Amount | Value |
|
| Corporate Bonds - 24.8% | | | |
| Convertible Bonds - 5.8% | | | |
| CONSUMER DISCRETIONARY - 0.1% | | | |
| Textiles, Apparel & Luxury Goods - 0.1% | | | |
| KKR Real Estate Finance Trust, Inc. 6.125% 5/15/23 unit (b) | | 1,400,000 | 1,400,700 |
| FINANCIALS - 5.4% | | | |
| Diversified Financial Services - 0.3% | | | |
| Granite Point Mortgage Trust, Inc. 5.625% 12/1/22 (b) | | 2,620,000 | 2,675,044 |
| Mortgage Real Estate Investment Trusts - 5.1% | | | |
| Arbor Realty Trust, Inc.: | | | |
| 5.25% 7/1/21 (b) | | 900,000 | 918,729 |
| 5.25% 7/1/21 (b) | | 1,200,000 | 1,178,522 |
| Blackstone Mortgage Trust, Inc.: | | | |
| 4.375% 5/5/22 | | 2,940,000 | 2,898,302 |
| 4.75% 3/15/23 | | 1,600,000 | 1,563,480 |
| Colony Financial, Inc.: | | | |
| 3.875% 1/15/21 | | 5,220,000 | 4,940,730 |
| 5% 4/15/23 | | 3,395,000 | 3,216,763 |
| Exantas Capital Corp.: | | | |
| 4.5% 8/15/22 | | 870,000 | 882,512 |
| 6% 12/1/18 | | 1,110,000 | 1,136,418 |
| 8% 1/15/20 | | 1,810,000 | 1,874,545 |
| PennyMac Corp. 5.375% 5/1/20 | | 6,884,000 | 6,884,668 |
| Redwood Trust, Inc. 5.625% 7/15/24 | | 2,100,000 | 2,067,185 |
| RWT Holdings, Inc. 5.625% 11/15/19 | | 11,250,000 | 11,375,719 |
| Starwood Property Trust, Inc. 4.375% 4/1/23 | | 2,680,000 | 2,689,533 |
| Two Harbors Investment Corp. 6.25% 1/15/22 | | 780,000 | 802,545 |
| Western Asset Mortgage Capital Corp. 6.75% 10/1/22 | | 3,570,000 | 3,679,196 |
| | | | 46,108,847 |
| TOTAL FINANCIALS | | | 48,783,891 |
| REAL ESTATE - 0.3% | | | |
| Equity Real Estate Investment Trusts (REITs) - 0.3% | | | |
| American Realty Capital Properties, Inc. 3.75% 12/15/20 | | 2,660,000 | 2,679,977 |
|
| TOTAL CONVERTIBLE BONDS | | | 52,864,568 |
|
| Nonconvertible Bonds - 19.0% | | | |
| CONSUMER DISCRETIONARY - 4.6% | | | |
| Hotels, Restaurants & Leisure - 0.8% | | | |
| ESH Hospitality, Inc. 5.25% 5/1/25 (b) | | 3,460,000 | 3,356,200 |
| FelCor Lodging LP 6% 6/1/25 | | 1,380,000 | 1,411,050 |
| Hilton Grand Vacations Borrower LLC/Hilton Grand Vacations Borrower, Inc. 6.125% 12/1/24 | | 460,000 | 466,900 |
| Times Square Hotel Trust 8.528% 8/1/26 (b) | | 2,015,495 | 2,324,940 |
| | | | 7,559,090 |
| Household Durables - 3.8% | | | |
| Ashton Woods U.S.A. LLC/Ashton Woods Finance Co.: | | | |
| 6.75% 8/1/25 (b) | | 2,340,000 | 2,190,825 |
| 6.875% 2/15/21 (b) | | 2,669,000 | 2,682,345 |
| Beazer Homes U.S.A., Inc.: | | | |
| 5.875% 10/15/27 | | 1,280,000 | 1,113,600 |
| 6.75% 3/15/25 | | 1,535,000 | 1,442,900 |
| 8.75% 3/15/22 | | 1,330,000 | 1,412,527 |
| Brookfield Residential Properties, Inc./Brookfield Residential U.S. Corp. 6.125% 7/1/22 (b) | | 1,060,000 | 1,065,300 |
| Brookfield Residential Properties, Inc.: | | | |
| 6.375% 5/15/25 (b) | | 2,000,000 | 1,990,000 |
| 6.5% 12/15/20 (b) | | 2,425,000 | 2,451,675 |
| KB Home 8% 3/15/20 | | 2,395,000 | 2,544,688 |
| LGI Homes, Inc. 6.875% 7/15/26 (b) | | 755,000 | 755,000 |
| M/I Homes, Inc.: | | | |
| 5.625% 8/1/25 | | 1,395,000 | 1,308,231 |
| 6.75% 1/15/21 | | 735,000 | 754,294 |
| Meritage Homes Corp.: | | | |
| 5.125% 6/6/27 | | 885,000 | 811,988 |
| 6% 6/1/25 | | 3,085,000 | 3,106,256 |
| 7% 4/1/22 | | 2,005,000 | 2,155,375 |
| 7.15% 4/15/20 | | 1,940,000 | 2,027,300 |
| New Home Co. LLC 7.25% 4/1/22 | | 1,640,000 | 1,682,082 |
| Taylor Morrison Communities, Inc./Monarch Communities, Inc. 5.875% 4/15/23 (b) | | 760,000 | 757,872 |
| TRI Pointe Homes, Inc. 5.25% 6/1/27 | | 875,000 | 802,813 |
| William Lyon Homes, Inc.: | | | |
| 5.875% 1/31/25 | | 1,915,000 | 1,809,981 |
| 7% 8/15/22 | | 1,245,000 | 1,268,344 |
| | | | 34,133,396 |
| Media - 0.0% | | | |
| CBS Outdoor Americas Capital LLC/CBS Outdoor Americas Capital Corp. 5.625% 2/15/24 | | 240,000 | 242,038 |
| TOTAL CONSUMER DISCRETIONARY | | | 41,934,524 |
| CONSUMER STAPLES - 0.8% | | | |
| Food & Staples Retailing - 0.8% | | | |
| Albertsons Companies LLC/Safeway, Inc./New Albertson's, Inc./Albertson's LLC: | | | |
| 5.75% 3/15/25 | | 2,670,000 | 2,397,874 |
| 6.625% 6/15/24 | | 1,900,000 | 1,819,250 |
| Albertsons, Inc. 8.7% 5/1/30 | | 845,000 | 730,925 |
| C&S Group Enterprises LLC 5.375% 7/15/22 (b) | | 2,280,000 | 2,260,050 |
| Cumberland Farms, Inc. 6.75% 5/1/25 (b) | | 365,000 | 367,281 |
| | | | 7,575,380 |
| FINANCIALS - 0.6% | | | |
| Diversified Financial Services - 0.5% | | | |
| Brixmor Operating Partnership LP 3.85% 2/1/25 | | 1,659,000 | 1,600,105 |
| Five Point Operation Co. LP 7.875% 11/15/25 (b) | | 1,875,000 | 1,903,125 |
| Icahn Enterprises LP/Icahn Enterprises Finance Corp.: | | | |
| 5.875% 2/1/22 | | 820,000 | 825,125 |
| 6.25% 2/1/22 | | 280,000 | 285,424 |
| | | | 4,613,779 |
| Mortgage Real Estate Investment Trusts - 0.1% | | | |
| Starwood Property Trust, Inc. 4.75% 3/15/25 (b) | | 700,000 | 691,250 |
| TOTAL FINANCIALS | | | 5,305,029 |
| HEALTH CARE - 1.1% | | | |
| Health Care Providers & Services - 1.1% | | | |
| QCP SNF West (REIT) LLC 8.125% 11/1/23 (b) | | 1,255,000 | 1,364,813 |
| Sabra Health Care LP/Sabra Capital Corp.: | | | |
| 5.375% 6/1/23 | | 4,040,000 | 4,050,100 |
| 5.5% 2/1/21 | | 4,450,000 | 4,511,188 |
| | | | 9,926,101 |
| INDUSTRIALS - 0.1% | | | |
| Building Products - 0.1% | | | |
| Shea Homes Ltd. Partnership/Corp. 6.125% 4/1/25 (b) | | 1,100,000 | 1,089,000 |
| INFORMATION TECHNOLOGY - 0.1% | | | |
| Internet Software & Services - 0.1% | | | |
| CyrusOne LP/CyrusOne Finance Corp. 5% 3/15/24 | | 615,000 | 617,306 |
| REAL ESTATE - 11.7% | | | |
| Equity Real Estate Investment Trusts (REITs) - 8.7% | | | |
| American Homes 4 Rent 4.25% 2/15/28 | | 2,000,000 | 1,920,071 |
| ARC Properties Operating Partnership LP 4.6% 2/6/24 | | 1,640,000 | 1,642,043 |
| Care Capital Properties LP 5.125% 8/15/26 | | 6,386,000 | 6,129,217 |
| CBL & Associates LP: | | | |
| 4.6% 10/15/24 | | 5,401,000 | 4,500,686 |
| 5.25% 12/1/23 | | 3,500,000 | 3,096,911 |
| 5.95% 12/15/26 | | 2,434,000 | 2,097,735 |
| CTR Partnership LP/CareTrust Capital Corp. 5.25% 6/1/25 | | 1,343,000 | 1,306,068 |
| DCT Industrial Operating Partnership LP 4.5% 10/15/23 | | 2,000,000 | 2,061,368 |
| DDR Corp.: | | | |
| 3.625% 2/1/25 | | 128,000 | 121,379 |
| 4.625% 7/15/22 | | 370,000 | 378,819 |
| Equinix, Inc. 5.375% 5/15/27 | | 1,175,000 | 1,183,813 |
| HCP, Inc.: | | | |
| 4% 6/1/25 | | 2,000,000 | 1,954,396 |
| 4.25% 11/15/23 | | 1,185,000 | 1,189,137 |
| Healthcare Realty Trust, Inc. 3.75% 4/15/23 | | 967,000 | 947,182 |
| Hospitality Properties Trust 5% 8/15/22 | | 823,000 | 847,362 |
| iStar Financial, Inc.: | | | |
| 4.625% 9/15/20 | | 1,140,000 | 1,130,025 |
| 5% 7/1/19 | | 2,733,000 | 2,735,391 |
| 5.25% 9/15/22 | | 715,000 | 697,125 |
| 6% 4/1/22 | | 1,490,000 | 1,488,138 |
| Lexington Corporate Properties Trust: | | | |
| 4.25% 6/15/23 | | 2,500,000 | 2,453,013 |
| 4.4% 6/15/24 | | 385,000 | 378,576 |
| MPT Operating Partnership LP/MPT Finance Corp.: | | | |
| 5% 10/15/27 | | 3,540,000 | 3,424,950 |
| 5.25% 8/1/26 | | 1,380,000 | 1,359,300 |
| 6.375% 3/1/24 | | 790,000 | 829,500 |
| National Retail Properties, Inc. 3.5% 10/15/27 | | 579,000 | 541,332 |
| Omega Healthcare Investors, Inc.: | | | |
| 4.375% 8/1/23 | | 579,000 | 574,672 |
| 4.5% 4/1/27 | | 455,000 | 433,917 |
| 4.75% 1/15/28 | | 1,479,000 | 1,429,272 |
| 4.95% 4/1/24 | | 627,000 | 634,042 |
| Regency Centers LP 3.6% 2/1/27 | | 442,000 | 420,008 |
| SBA Communications Corp. 4% 10/1/22 | | 425,000 | 411,324 |
| Select Income REIT: | | | |
| 4.15% 2/1/22 | | 1,992,000 | 1,977,253 |
| 4.25% 5/15/24 | | 890,000 | 851,488 |
| 4.5% 2/1/25 | | 3,457,000 | 3,346,209 |
| Senior Housing Properties Trust: | | | |
| 3.25% 5/1/19 | | 500,000 | 500,253 |
| 4.75% 5/1/24 | | 11,978,000 | 11,936,454 |
| 4.75% 2/15/28 | | 4,000,000 | 3,885,429 |
| 6.75% 4/15/20 | | 576,000 | 595,052 |
| 6.75% 12/15/21 | | 2,000,000 | 2,135,413 |
| VEREIT Operating Partnership LP 4.875% 6/1/26 | | 2,055,000 | 2,057,501 |
| WP Carey, Inc.: | | | |
| 4% 2/1/25 | | 344,000 | 333,096 |
| 4.25% 10/1/26 | | 905,000 | 882,533 |
| 4.6% 4/1/24 | | 1,968,000 | 1,985,440 |
| | | | 78,802,893 |
| Real Estate Management & Development - 3.0% | | | |
| Greystar Real Estate Partners 5.75% 12/1/25 (b) | | 1,285,000 | 1,246,450 |
| Howard Hughes Corp. 5.375% 3/15/25 (b) | | 6,380,000 | 6,244,425 |
| Kennedy-Wilson, Inc.: | | | |
| 5.875% 4/1/24 (b) | | 3,795,000 | 3,700,125 |
| 5.875% 4/1/24 | | 6,110,000 | 5,957,250 |
| Mattamy Group Corp.: | | | |
| 6.5% 10/1/25 (b) | | 2,005,000 | 1,954,875 |
| 6.875% 12/15/23 (b) | | 1,985,000 | 2,017,256 |
| Mid-America Apartments LP: | | | |
| 3.75% 6/15/24 | | 337,000 | 330,992 |
| 4.3% 10/15/23 | | 740,000 | 750,742 |
| Taylor Morrison Communities, Inc./Monarch Communities, Inc. 5.625% 3/1/24 (b) | | 1,345,000 | 1,308,416 |
| Washington Prime Group LP 5.95% 8/15/24 | | 3,590,000 | 3,545,559 |
| | | | 27,056,090 |
| TOTAL REAL ESTATE | | | 105,858,983 |
|
| TOTAL NONCONVERTIBLE BONDS | | | 172,306,323 |
|
| TOTAL CORPORATE BONDS | | | |
| (Cost $225,674,800) | | | 225,170,891 |
|
| Asset-Backed Securities - 3.9% | | | |
| American Homes 4 Rent: | | | |
| Series 2014-SFR3 Class E, 6.418% 12/17/36 (b) | | 1,740,000 | 1,924,996 |
| Series 2015-SFR1 Class E, 5.639% 4/17/52 (b) | | 1,354,586 | 1,436,355 |
| Series 2015-SFR2: | | | |
| Class E, 6.07% 10/17/45 (b) | | 1,624,000 | 1,764,883 |
| Class XS, 0% 10/17/45 (b)(c)(d) | | 938,961 | 9 |
| Colony Starwood Homes Series 2016-2A Class F, 1 month U.S. LIBOR + 4.150% 6.2233% 12/17/33 (b)(c)(e) | | 1,500,000 | 1,548,534 |
| Conseco Finance Securitizations Corp.: | | | |
| Series 2002-1 Class M2, 9.546% 12/1/33 | | 1,216,000 | 1,292,787 |
| Series 2002-2 Class M2, 9.163% 3/1/33 | | 1,808,626 | 1,661,495 |
| Deutsche Financial Capital Securitization LLC Series 1997-I Class M, 7.275% 9/15/27 | | 355,914 | 362,814 |
| Home Partners of America Credit Trust Series 2017-1 Class F, 1 month U.S. LIBOR + 3.539% 5.6241% 7/17/34 (b)(c)(e) | | 1,099,000 | 1,106,375 |
| Home Partners of America Trust: | | | |
| Series 2016-2 Class F, 1 month U.S. LIBOR + 4.700% 6.7851% 10/17/33 (b)(c)(e) | | 607,000 | 612,622 |
| Series 2018-1 Class F, 1 month U.S. LIBOR + 2.350% 4.284% 7/17/37 (b)(c)(e) | | 604,000 | 604,840 |
| Invitation Homes Trust: | | | |
| Series 2017-SFR2 Class F, 1 month U.S. LIBOR + 3.000% 5.0851% 12/17/36 (b)(c)(e) | | 1,407,000 | 1,425,308 |
| Series 2018-SFR1 Class F, 1 month U.S. LIBOR + 2.500% 4.5851% 3/17/37 (b)(c)(e) | | 2,058,000 | 2,072,718 |
| Series 2018-SFR2 Class F, 1 month U.S. LIBOR + 2.250% 4.3216% 6/17/37 (b)(c)(e) | | 1,000,000 | 999,997 |
| Lehman ABS Manufactured Housing Contract Trust Series 2001-B Class M2, 7.17% 4/15/40 | | 2,564,740 | 1,801,218 |
| Progress Residential Trust: | | | |
| Series 2015-SFR3 Class F, 6.643% 11/12/32 (b) | | 588,000 | 609,611 |
| Series 2016-SFR1 Class F, 1 month U.S. LIBOR + 5.000% 7.0851% 9/17/33 (b)(c)(e) | | 2,276,000 | 2,285,594 |
| Series 2017-SFR1 Class F, 5.35% 8/17/34 (b) | | 526,000 | 534,543 |
| Series 2017-SFR2 Class F, 1 month U.S. LIBOR + 2.750% 4.836% 12/17/34 (b)(e) | | 783,000 | 782,860 |
| Series 2018-SFR2 Class F, 4.953% 8/17/35 (b) | | 598,000 | 597,439 |
| Residential Asset Securities Corp. Series 2003-KS10 Class MI3, 6.41% 12/25/33 | | 211,372 | 141,346 |
| Starwood Waypoint Homes Trust Series 2017-1: | | | |
| Class E, 1 month U.S. LIBOR + 2.600% 4.6851% 1/17/35 (b)(c)(e) | | 994,000 | 1,000,000 |
| Class F, 1 month U.S. LIBOR + 3.400% 5.4851% 1/17/35 (b)(c)(e) | | 2,132,000 | 2,148,853 |
| Tricon American Homes: | | | |
| Series 2017-SFR1 Class F, 5.151% 9/17/34 (b) | | 1,432,000 | 1,443,620 |
| Series 2017-SFR2 Class F, 5.104% 1/17/36 (b) | | 628,000 | 632,296 |
| Series 2018-SFR1 Class F, 4.96% 5/17/37 (b) | | 1,386,000 | 1,376,477 |
| Tricon American Homes Trust Series 2016-SFR1 Class F, 5.769% 11/17/33 (b) | | 1,310,000 | 1,342,920 |
| VB-S1 Issuer LLC: | | | |
| Series 2016-1A Class F, 6.901% 6/15/46 (b) | | 1,453,000 | 1,496,651 |
| Series 2018-1A Class F, 5.25% 2/15/48 (b) | | 2,044,000 | 2,043,355 |
| TOTAL ASSET-BACKED SECURITIES | | | |
| (Cost $34,334,095) | | | 35,050,516 |
|
| Collateralized Mortgage Obligations - 0.4% | | | |
| Private Sponsor - 0.4% | | | |
| FREMF Mortgage Trust: | | | |
| Series 2010-K6 Class B, 5.5422% 12/25/46 (b)(c) | | 811,000 | 833,270 |
| Series 2010-K7 Class B, 5.6858% 4/25/20 (b)(c) | | 2,605,000 | 2,691,508 |
| TOTAL COLLATERALIZED MORTGAGE OBLIGATIONS | | | |
| (Cost $3,362,513) | | | 3,524,778 |
|
| Commercial Mortgage Securities - 23.2% | | | |
| Aventura Mall Trust Series 2013-AVM Class E, 3.8674% 12/5/32 (b)(c) | | 2,000,000 | 2,028,480 |
| BANK: | | | |
| Series 2017-BNK4 Class D, 3.357% 5/15/50 (b) | | 588,000 | 477,139 |
| Series 2018-BN12 Class D, 3% 5/15/61 (b) | | 299,000 | 229,104 |
| Barclays Commercial Mortgage Securities LLC Series 2015-STP: | | | |
| Class E, 4.4272% 9/10/28 (b)(c) | | 1,626,000 | 1,560,384 |
| Class F, 4.4272% 9/10/28 (b)(c) | | 800,000 | 735,699 |
| BX Commercial Mortgage Trust floater Series 2018-BIOA Class F, 1 month U.S. LIBOR + 2.471% 4.5443% 3/15/37 (b)(c)(e) | | 2,000,000 | 2,001,240 |
| BX Trust Series 2017-IMC Class F, 1 month U.S. LIBOR + 4.250% 6.3233% 10/15/32 (b)(c)(e) | | 2,119,000 | 2,129,591 |
| CCRESG Commercial Mortgage Trust Series 2016-HEAT: | | | |
| Class E, 5.6712% 4/10/29 (b)(c) | | 806,000 | 808,262 |
| Class F, 5.6712% 4/10/29 (b)(c) | | 1,890,000 | 1,816,293 |
| CD Mortgage Trust Series 2017-CD3 Class D, 3.25% 2/10/50 (b) | | 2,188,000 | 1,815,317 |
| CGBAM Commercial Mortgage Trust Series 2015-SMRT: | | | |
| Class E, 3.9121% 4/10/28 (b)(c) | | 561,000 | 556,886 |
| Class F, 3.9121% 4/10/28 (b)(c) | | 1,882,000 | 1,862,494 |
| CGMS Commercial Mortgage Trust Series 2017-MDRB Class E, 1 month U.S. LIBOR + 3.872% 5.9431% 7/15/30 (b)(c)(e) | | 1,154,000 | 1,146,378 |
| Citigroup Commercial Mortgage Trust: | | | |
| Series 2013-GC15 Class D, 5.2749% 9/10/46 (b)(c) | | 2,496,000 | 2,454,751 |
| Series 2015-SHP2 Class E, 1 month U.S. LIBOR + 4.350% 6.4233% 7/15/27 (b)(c)(e) | | 567,000 | 570,496 |
| Series 2016-C3 Class D, 3% 11/15/49 (b) | | 2,911,000 | 2,236,669 |
| Series 2016-SMPL Class E, 4.509% 9/10/31 (b) | | 299,000 | 298,654 |
| COMM Mortgage Trust: | | | |
| sequential payer Series 2013-LC6 Class E, 3.5% 1/10/46 (b) | | 2,000,000 | 1,569,976 |
| Series 2012-CR1: | | | |
| Class C, 5.4983% 5/15/45(c) | | 3,000,000 | 3,087,837 |
| Class D, 5.4983% 5/15/45 (b)(c) | | 1,917,000 | 1,914,750 |
| Class G, 2.462% 5/15/45 (b) | | 1,133,000 | 822,567 |
| Series 2012-LC4: | | | |
| Class C, 5.7774% 12/10/44 (c) | | 780,000 | 774,686 |
| Class D, 5.7774% 12/10/44 (b)(c) | | 3,532,000 | 3,211,801 |
| Series 2013-CCRE6 Class E, 4.2031% 3/10/46 (b)(c) | | 147,000 | 119,214 |
| Series 2013-CR10 Class D, 4.9497% 8/10/46 (b)(c) | | 1,756,000 | 1,553,151 |
| Series 2013-CR12 Class D, 5.2474% 10/10/46 (b)(c) | | 2,900,000 | 2,492,778 |
| Series 2013-CR6 Class F, 4.2031% 3/10/46 (b)(c) | | 1,459,000 | 970,333 |
| Series 2013-CR9 Class D, 4.404% 7/10/45 (b)(c) | | 790,000 | 679,960 |
| Series 2013-LC6 Class D, 4.4414% 1/10/46 (b)(c) | | 2,732,000 | 2,596,787 |
| Series 2014-UBS2 Class D, 5.0145% 3/10/47 (b)(c) | | 537,000 | 458,585 |
| Series 2016-CD1 Class D, 2.9043% 8/10/49 (b)(c) | | 2,104,000 | 1,696,669 |
| Series 2017-CD4 Class D, 3.3% 5/10/50 (b) | | 1,161,000 | 955,540 |
| COMM Mortgage Trust pass-thru certificates Series 2005-LP5 Class F, 4.7224% 5/10/43 (b)(c) | | 1,549,468 | 1,537,284 |
| Commercial Mortgage Trust pass-thru certificates Series 2012-CR2 Class D, 4.9926% 8/15/45 (b)(c) | | 836,000 | 821,007 |
| Core Industrial Trust: | | | |
| Series 2015-TEXW Class F, 3.977% 2/10/34 (b)(c) | | 2,067,000 | 1,984,003 |
| Series 2015-WEST Class F, 4.3677% 2/10/37 (b)(c) | | 2,496,000 | 2,389,778 |
| CSAIL Commercial Mortgage Trust: | | | |
| Series 2017-C8 Class D, 4.47% 6/15/50 (b) | | 1,717,000 | 1,504,605 |
| Series 2017-CX10 Class UESD, 4.3778% 10/15/32 (b)(c) | | 840,000 | 809,641 |
| Series 2017-CX9 Class D, 4.2977% 9/15/50 (b)(c) | | 432,000 | 358,628 |
| CSMC Trust Series 2016-MFF Class F, 1 month U.S. LIBOR + 7.250% 9.3216% 11/15/33 (b)(c)(e) | | 2,700,000 | 2,725,195 |
| DBCCRE Mortgage Trust Series 2014-ARCP: | | | |
| Class D, 4.9345% 1/10/34 (b)(c) | | 1,000,000 | 978,837 |
| Class E, 5.099% 1/10/34 (b)(c) | | 2,047,000 | 1,949,624 |
| DBUBS Mortgage Trust: | | | |
| Series 2011-LC1A: | | | |
| Class E, 5.8842% 11/10/46 (b)(c) | | 2,745,000 | 2,833,706 |
| Class G, 4.652% 11/10/46 (b) | | 2,640,000 | 2,374,763 |
| Series 2011-LC3A Class D, 5.5154% 8/10/44 (b)(c) | | 728,000 | 748,044 |
| Freddie Mac pass-thru certificates: | | | |
| Series K011 Class X3, 2.577% 12/25/43 (c)(d) | | 4,947,000 | 283,375 |
| Series K012 Class X3, 2.3288% 1/25/41 (c)(d) | | 2,799,977 | 142,148 |
| Series K013 Class X3, 2.814% 1/25/43 (c)(d) | | 4,806,000 | 315,212 |
| GAHR Commercial Mortgage Trust Series 2015-NRF: | | | |
| Class DFX, 3.3822% 12/15/34 (b)(c) | | 300,000 | 298,271 |
| Class EFX, 3.4949% 12/15/34 (b)(c) | | 2,947,000 | 2,914,961 |
| Class FFX, 3.4949% 12/15/34 (b)(c) | | 3,708,000 | 3,650,325 |
| Class GFX, 3.4949% 12/15/34 (b)(c) | | 3,333,000 | 3,263,936 |
| GPMT Ltd. floater Series 2018-FL1 Class D, 1 month U.S. LIBOR + 2.950% 5.0379% 11/21/35 (b)(c)(e) | | 1,500,000 | 1,499,997 |
| GS Mortgage Securities Trust: | | | |
| floater Series 2018-RIVR Class G, 1 month U.S. LIBOR + 2.600% 4.7% 7/15/35 (b)(c)(e) | | 669,000 | 661,703 |
| Series 2010-C2 Class D, 5.3547% 12/10/43 (b)(c) | | 2,000,000 | 2,031,143 |
| Series 2011-GC5: | | | |
| Class D, 5.5644% 8/10/44 (b)(c) | | 2,075,000 | 2,022,616 |
| Class E, 5.5644% 8/10/44 (b)(c) | | 756,000 | 623,894 |
| Class F, 4.5% 8/10/44 (b) | | 588,000 | 319,668 |
| Series 2012-GC6: | | | |
| Class C, 5.8403% 1/10/45 (b)(c) | | 2,400,000 | 2,494,516 |
| Class D, 5.8403% 1/10/45 (b)(c) | | 1,816,000 | 1,733,209 |
| Class E, 5% 1/10/45 (b)(c) | | 831,000 | 715,496 |
| Series 2012-GCJ7: | | | |
| Class C, 5.8874% 5/10/45 (c) | | 3,500,000 | 3,600,178 |
| Class D, 5.8874% 5/10/45 (b)(c) | | 3,425,000 | 3,277,096 |
| Class E, 5% 5/10/45 (b) | | 1,760,000 | 1,217,143 |
| Series 2012-GCJ9 Class D, 4.9058% 11/10/45 (b)(c) | | 1,507,000 | 1,435,863 |
| Series 2013-GC14 Class D, 4.9229% 8/10/46 (b)(c) | | 320,000 | 305,095 |
| Series 2013-GC16: | | | |
| Class D, 5.503% 11/10/46 (b)(c) | | 3,250,000 | 3,203,609 |
| Class F, 3.5% 11/10/46 (b) | | 1,428,000 | 1,039,269 |
| Series 2016-GS2 Class D, 2.753% 5/10/49 (b) | | 1,964,000 | 1,570,317 |
| Series 2016-GS3 Class D, 2.62% 10/10/49 (b) | | 602,000 | 471,737 |
| Series 2016-REMZ Class MZB, 7.727% 2/10/21 (b) | | 5,523,000 | 5,659,870 |
| Series 2016-RENT: | | | |
| Class E, 4.2022% 2/10/29 (b)(c) | | 2,299,000 | 2,260,210 |
| Class F, 4.2022% 2/10/29 (b)(c) | | 3,110,000 | 3,039,633 |
| Hilton U.S.A. Trust: | | | |
| Series 2016-HHV Class F, 4.3333% 11/5/38 (b)(c) | | 1,460,000 | 1,306,200 |
| Series 2016-SFP Class F, 6.1552% 11/5/35 (b) | | 4,443,000 | 4,499,223 |
| IMT Trust Series 2017-APTS: | | | |
| Class EFX, 3.6132% 6/15/34 (b)(c) | | 1,589,000 | 1,463,311 |
| Class FFL, 1 month U.S. LIBOR + 2.850% 4.9216% 6/15/34 (b)(c)(e) | | 664,000 | 665,435 |
| Independence Plaza Trust Series 2018-INDP Class E, 5.06% 7/10/35 (b) | | 504,000 | 504,888 |
| Invitation Homes Trust floater Series 2018-SFR3 Class F, 1 month U.S. LIBOR + 2.250% 4.25% 7/17/37 (b)(c)(e) | | 1,491,000 | 1,490,995 |
| JPMBB Commercial Mortgage Securities Trust: | | | |
| Series 2014-C23 Class UH5, 4.7094% 9/15/47 (b) | | 1,526,000 | 1,311,211 |
| Series 2014-C26 Class D, 4.0667% 1/15/48 (b)(c) | | 602,000 | 526,819 |
| JPMCC Commercial Mortgage Securities Trust Series 2016-JP4 Class D, 3.5957% 12/15/49 (b)(c) | | 1,809,000 | 1,511,333 |
| JPMDB Commercial Mortgage Securities Trust: | | | |
| Series 2016-C4 Class D, 3.2227% 12/15/49 (b)(c) | | 1,308,000 | 1,063,629 |
| Series 2018-C8 Class D, 3.2458% 6/15/51 (b)(c) | | 302,000 | 236,705 |
| JPMorgan Chase Commercial Mortgage Securities Corp.: | | | |
| Series 2003-C1 Class F, 5.6578% 1/12/37 (b)(c) | | 498,246 | 509,618 |
| Series 2010-CNTR Class D, 6.3899% 8/5/32 (b)(c) | | 1,216,000 | 1,263,027 |
| Series 2012-CBX: | | | |
| Class C, 5.2137% 6/15/45 (c) | | 1,240,000 | 1,251,565 |
| Class E, 5.2137% 6/15/45 (b)(c) | | 865,000 | 787,931 |
| Class G 4% 6/15/45 (b) | | 805,000 | 426,506 |
| JPMorgan Chase Commercial Mortgage Securities Trust: | | | |
| Series 2011-C3: | | | |
| Class E, 5.8653% 2/15/46 (b)(c) | | 3,311,000 | 3,243,645 |
| Class G, 4.409% 2/15/46 (b)(c) | | 1,680,000 | 1,361,355 |
| Class H, 4.409% 2/15/46 (b)(c) | | 1,320,000 | 965,403 |
| Series 2011-C4 Class E, 5.6597% 7/15/46 (b)(c) | | 1,390,000 | 1,437,742 |
| Series 2013-LC11: | | | |
| Class D, 4.2985% 4/15/46 (c) | | 1,207,000 | 1,044,976 |
| Class F, 3.25% 4/15/46 (b)(c) | | 482,000 | 290,828 |
| Series 2015-UES Class F, 3.7417% 9/5/32 (b)(c) | | 1,843,000 | 1,801,396 |
| Series 2018-AON Class F, 4.6132% 7/5/31 (b) | | 904,000 | 884,131 |
| Merrill Lynch Mortgage Trust Series 2006-C1 Class AJ, 5.7803% 5/12/39 (c) | | 406,698 | 410,513 |
| Morgan Stanley BAML Trust: | | | |
| Series 2012-C5 Class E, 4.8428% 8/15/45 (b)(c) | | 670,000 | 663,176 |
| Series 2012-C6 Class D, 4.7268% 11/15/45 (b)(c) | | 2,000,000 | 2,004,870 |
| Series 2013-C12 Class D, 4.9239% 10/15/46 (b)(c) | | 1,500,000 | 1,416,435 |
| Series 2013-C13: | | | |
| Class D, 5.0515% 11/15/46 (b)(c) | | 2,935,000 | 2,889,647 |
| Class E, 5.0515% 11/15/46 (b)(c) | | 621,000 | 546,266 |
| Series 2013-C7: | | | |
| Class D, 4.3877% 2/15/46 (b)(c) | | 998,000 | 910,650 |
| Class E, 4.3877% 2/15/46 (b)(c) | | 1,490,000 | 1,173,669 |
| Series 2013-C9 Class C, 4.1797% 5/15/46 (c) | | 588,000 | 570,706 |
| Series 2016-C30 Class D, 3% 9/15/49 (b) | | 963,000 | 725,359 |
| Series 2016-C31 Class D, 3% 11/15/49 (b)(c) | | 1,500,000 | 1,123,088 |
| Series 2016-C32 Class D, 3.396% 12/15/49 (b) | | 1,071,000 | 868,824 |
| Morgan Stanley Capital I Trust: | | | |
| sequential payer Series 2012-C4 Class E, 5.6009% 3/15/45 (b)(c) | | 1,284,000 | 1,108,734 |
| Series 1997-RR Class F, 7.51% 4/30/39 (b)(c) | | 43,418 | 43,062 |
| Series 1998-CF1 Class G, 7.35% 7/15/32 (b) | | 290,877 | 248,470 |
| Series 2011-C2: | | | |
| Class D, 5.6659% 6/15/44 (b)(c) | | 2,382,000 | 2,337,722 |
| Class E, 5.6659% 6/15/44 (b)(c) | | 2,396,000 | 2,255,431 |
| Class F, 5.6659% 6/15/44 (b)(c) | | 1,467,000 | 1,295,532 |
| Class XB, 0.6118% 6/15/44 (b)(c)(d) | | 51,641,000 | 719,581 |
| Series 2011-C3: | | | |
| Class E, 5.3267% 7/15/49 (b)(c) | | 255,000 | 254,810 |
| Class F, 5.3267% 7/15/49 (b)(c) | | 572,000 | 550,140 |
| Class G, 5.3267% 7/15/49 (b)(c) | | 715,000 | 622,003 |
| Series 2012-C4 Class D, 5.6009% 3/15/45 (b)(c) | | 1,640,000 | 1,556,373 |
| Series 2015-MS1 Class D, 4.1647% 5/15/48 (b)(c) | | 1,922,000 | 1,628,889 |
| Series 2015-UBS8 Class D, 3.18% 12/15/48 (b) | | 987,000 | 828,314 |
| Series 2016-BNK2 Class C, 3% 11/15/49 (b) | | 2,312,000 | 1,824,127 |
| Motel 6 Trust floater: | | | |
| Series 2017-M6MZ, Class M, 1 month U.S. LIBOR + 6.927% 8.9998% 8/15/19 (b)(c)(e) | | 1,330,799 | 1,343,842 |
| Series 2017-MTL6, Class F, 1 month U.S. LIBOR + 4.250% 6.3233% 8/15/34 (b)(c)(e) | | 2,268,941 | 2,283,129 |
| MSCG Trust Series 2016-SNR: | | | |
| Class D, 6.55% 11/15/34 (b) | | 2,828,800 | 2,796,522 |
| Class E, 6.8087% 11/15/34 (b) | | 1,746,750 | 1,657,758 |
| MSJP Commercial Securities Mortgage Trust Series 2015-HAUL Class E, 5.0127% 9/5/47 (b)(c) | | 1,000,000 | 910,499 |
| Natixis Commercial Mortgage Securities Trust floater Series 2018-FL1: | | | |
| Class WAN1, 1 month U.S. LIBOR + 2.750% 4.669% 6/15/35 (b)(c)(e) | | 315,000 | 315,300 |
| Class WAN2, 1 month U.S. LIBOR + 3.750% 5.669% 6/15/35 (b)(c)(e) | | 113,725 | 113,831 |
| Providence Place Group Ltd. Partnership Series 2000-C1 Class A2, 7.75% 7/20/28 (b) | | 1,141,381 | 1,393,854 |
| RETL floater Series 2018-RVP Class E, 1 month U.S. LIBOR + 4.500% 6.5733% 3/15/33 (b)(c)(e) | | 1,535,153 | 1,557,231 |
| UBS Commercial Mortgage Trust Series 2012-C1: | | | |
| Class D, 5.7289% 5/10/45 (b)(c) | | 645,000 | 636,959 |
| Class E, 5% 5/10/45 (b)(c) | | 1,165,000 | 999,272 |
| Class F, 5% 5/10/45 (b)(c) | | 399,000 | 282,694 |
| UBS-BAMLL Trust Series 12-WRM Class D, 4.3793% 6/10/30 (b)(c) | | 1,460,000 | 1,408,071 |
| Wells Fargo Commercial Mortgage Trust: | | | |
| Series 2012-LC5: | | | |
| Class D, 4.9229% 10/15/45 (b)(c) | | 492,000 | 486,684 |
| Class E, 4.9229% 10/15/45 (b)(c) | | 1,298,000 | 1,202,696 |
| Series 2016-BNK1 Class D, 3% 8/15/49 (b) | | 1,260,000 | 1,009,002 |
| Series 2016-C35 Class D, 3.142% 7/15/48 (b) | | 3,317,000 | 2,448,778 |
| Series 2016-NXS6 Class D, 3.059% 11/15/49 (b) | | 906,000 | 656,072 |
| Series 2017-C38 Class D, 3% 7/15/50 (b)(c) | | 757,000 | 588,532 |
| WF-RBS Commercial Mortgage Trust: | | | |
| Series 2011-C3: | | | |
| Class C, 5.335% 3/15/44 (b) | | 2,100,000 | 2,081,703 |
| Class D, 5.8471% 3/15/44 (b)(c) | | 1,000,000 | 832,909 |
| Series 2011-C5: | | | |
| Class C, 5.8594% 11/15/44 (b)(c) | | 1,250,000 | 1,304,656 |
| Class E, 5.8594% 11/15/44 (b)(c) | | 693,000 | 690,992 |
| Class F, 5.25% 11/15/44 (b)(c) | | 2,000,000 | 1,744,972 |
| Class G, 5.25% 11/15/44 (b)(c) | | 1,000,000 | 820,561 |
| Series 2012-C7 Class D, 4.9788% 6/15/45 (b)(c) | | 620,000 | 552,415 |
| Series 2012-C8 Class E, 5.0557% 8/15/45 (b)(c) | | 524,000 | 500,470 |
| Series 2013-C16 Class D, 5.1949% 9/15/46 (b)(c) | | 673,000 | 624,790 |
| Series 2013-UBS1 Class D, 4.7694% 3/15/46 (b)(c) | | 859,000 | 789,490 |
| WFCG Commercial Mortgage Trust floater Series 2015-BXRP: | | | |
| Class F, 1 month U.S. LIBOR + 3.720% 5.7936% 11/15/29 (b)(c)(e) | | 952,061 | 950,205 |
| Class G, 1 month U.S. LIBOR + 3.020% 5.0933% 11/15/29 (b)(c)(e) | | 1,614,085 | 1,591,019 |
| WP Glimcher Mall Trust Series 2015-WPG: | | | |
| Class PR1, 3.6332% 6/5/35 (b)(c) | | 1,168,000 | 900,907 |
| Class PR2, 3.6332% 6/5/35 (b)(c) | | 459,000 | 329,422 |
| TOTAL COMMERCIAL MORTGAGE SECURITIES | | | |
| (Cost $204,741,186) | | | 210,927,576 |
|
| Bank Loan Obligations - 5.7% | | | |
| CONSUMER DISCRETIONARY - 0.7% | | | |
| Hotels, Restaurants & Leisure - 0.5% | | | |
| Caesars Resort Collection LLC Tranche B 1LN, term loan 3 month U.S. LIBOR + 2.750% 4.8268% 12/22/24 (c)(e) | | 567,150 | 569,186 |
| ESH Hospitality, Inc. Tranche B, term loan 3 month U.S. LIBOR + 2.000% 4.0768% 8/30/23 (c)(e) | | 2,251,397 | 2,247,637 |
| LTF Merger Sub, Inc. Tranche B, term loan 3 month U.S. LIBOR + 2.750% 5.0572% 6/10/22 (c)(e) | | 448,869 | 448,995 |
| Playa Resorts Holding BV Tranche B, term loan 3 month U.S. LIBOR + 2.750% 4.83% 4/27/24 (c)(e) | | 743,200 | 735,954 |
| Wyndham Destinations, Inc. Tranche B, term loan 3 month U.S. LIBOR + 2.250% 4.3268% 5/31/25 (c)(e) | | 455,000 | 455,428 |
| Wyndham Hotels & Resorts, Inc. Tranche B, term loan 3 month U.S. LIBOR + 1.750% 3.8268% 5/30/25 (c)(e) | | 240,000 | 240,526 |
| | | | 4,697,726 |
| Multiline Retail - 0.2% | | | |
| JC Penney Corp., Inc. Tranche B, term loan 3 month U.S. LIBOR + 4.250% 6.5694% 6/23/23 (c)(e) | | 1,877,675 | 1,811,562 |
|
| TOTAL CONSUMER DISCRETIONARY | | | 6,509,288 |
|
| CONSUMER STAPLES - 0.7% | | | |
| Food & Staples Retailing - 0.7% | | | |
| Albertson's LLC Tranche B, term loan: | | | |
| 3 month U.S. LIBOR + 3.000% 5.3194% 6/22/23 (c)(e) | | 3,114,248 | 3,093,476 |
| 3 month U.S. LIBOR + 3.000% 5.337% 12/21/22 (c)(e) | | 3,091,792 | 3,078,281 |
| | | | 6,171,757 |
| ENERGY - 0.7% | | | |
| Energy Equipment & Services - 0.1% | | | |
| Kestrel Acquisition LLC Tranche B, term loan 3 month U.S. LIBOR + 4.250% 6.33% 6/1/25 (c)(e) | | 1,500,000 | 1,510,785 |
| Oil, Gas & Consumable Fuels - 0.6% | | | |
| Moxie Patriot LLC Tranche B, term loan 3 month U.S. LIBOR + 5.750% 8.0844% 12/19/20 (c)(e) | | 4,428,536 | 4,380,088 |
| TPF II Power LLC Tranche B, term loan 3 month U.S. LIBOR + 3.750% 5.8435% 10/2/23 (c)(e) | | 1,002,160 | 1,006,229 |
| | | | 5,386,317 |
|
| TOTAL ENERGY | | | 6,897,102 |
|
| FINANCIALS - 0.8% | | | |
| Diversified Financial Services - 0.2% | | | |
| Veritas-B Junior Mezz C LLC 10.4875% 2/6/21 (c)(f) | | 1,629,000 | 1,716,803 |
| Real Estate Management & Development - 0.5% | | | |
| DTZ U.S. Borrower LLC Tranche B 1LN, term loan 3 month U.S. LIBOR + 3.250% 5.5735% 11/4/21 (c)(e) | | 4,891,083 | 4,892,208 |
| Thrifts & Mortgage Finance - 0.1% | | | |
| Ocwen Loan Servicing LLC Tranche B, term loan 3 month U.S. LIBOR + 5.000% 7.0785% 12/5/20 (c)(e) | | 564,574 | 566,454 |
|
| TOTAL FINANCIALS | | | 7,175,465 |
|
| HEALTH CARE - 0.2% | | | |
| Health Care Providers & Services - 0.2% | | | |
| Community Health Systems, Inc. Tranche H, term loan 3 month U.S. LIBOR + 3.250% 5.5572% 1/27/21 (c)(e) | | 1,564,324 | 1,535,431 |
| INDUSTRIALS - 0.2% | | | |
| Commercial Services & Supplies - 0.2% | | | |
| Lineage Logistics Holdings, LLC. Tranche B, term loan 3 month U.S. LIBOR + 3.000% 5.0768% 2/27/25 (c)(e) | | 1,855,350 | 1,846,073 |
| INFORMATION TECHNOLOGY - 0.1% | | | |
| Electronic Equipment & Components - 0.1% | | | |
| Compass Power Generation LLC Tranche B, term loan 3 month U.S. LIBOR + 3.750% 5.8435% 12/20/24 (c)(e) | | 555,622 | 558,400 |
| REAL ESTATE - 1.3% | | | |
| Equity Real Estate Investment Trusts (REITs) - 0.8% | | | |
| Invitation Homes Operating Par Tranche B, term loan 3 month U.S. LIBOR + 1.800% 3.8785% 2/6/22 (c)(e)(f) | | 5,000,000 | 4,875,000 |
| iStar Financial, Inc. Tranche B 1LN, term loan 3 month U.S. LIBOR + 2.750% 4.8418% 6/28/23 (c)(e) | | 2,240,000 | 2,240,000 |
| | | | 7,115,000 |
| Real Estate Management & Development - 0.5% | | | |
| Capital Automotive LP Tranche B 1LN, term loan 3 month U.S. LIBOR + 2.500% 4.58% 3/24/24 (c)(e) | | 553,271 | 552,579 |
| Simply Storage Management LLC 8.2375% 9/6/21 (c)(f) | | 3,026,000 | 3,037,499 |
| VICI Properties, LLC Tranche B 1LN, term loan 3 month U.S. LIBOR + 2.000% 4.081% 12/22/24 (c)(e) | | 1,045,000 | 1,045,815 |
| | | | 4,635,893 |
|
| TOTAL REAL ESTATE | | | 11,750,893 |
|
| TELECOMMUNICATION SERVICES - 0.3% | | | |
| Wireless Telecommunication Services - 0.3% | | | |
| SBA Senior Finance II, LLC Tranche B, term loan 3 month U.S. LIBOR + 2.000% 4.08% 4/11/25 (c)(e) | | 3,105,000 | 3,096,461 |
| UTILITIES - 0.7% | | | |
| Electric Utilities - 0.3% | | | |
| Lightstone Holdco LLC: | | | |
| Tranche B 1LN, term loan 3 month U.S. LIBOR + 3.750% 5.8268% 1/30/24 (c)(e) | | 1,791,402 | 1,797,475 |
| Tranche C 1LN, term loan 3 month U.S. LIBOR + 3.750% 5.8268% 1/30/24 (c)(e) | | 114,696 | 115,084 |
| Southeast Powergen LLC Tranche B, term loan 3 month U.S. LIBOR + 3.500% 5.58% 12/2/21 (c)(e) | | 481,277 | 445,181 |
| | | | 2,357,740 |
| Independent Power and Renewable Electricity Producers - 0.4% | | | |
| APLP Holdings LP Tranche B, term loan 3 month U.S. LIBOR + 3.000% 5.0768% 4/13/23 (c)(e) | | 1,520,848 | 1,523,509 |
| MRP Generation Holdings LLC Tranche B, term loan 3 month U.S. LIBOR + 7.000% 9.3344% 10/18/22 (c)(e) | | 2,578,459 | 2,449,536 |
| | | | 3,973,045 |
|
| TOTAL UTILITIES | | | 6,330,785 |
|
| TOTAL BANK LOAN OBLIGATIONS | | | |
| (Cost $51,854,232) | | | 51,871,655 |
| | | Shares | Value |
|
| Money Market Funds - 3.8% | | | |
| Fidelity Cash Central Fund, 1.96% (g) | | | |
| (Cost $34,732,960) | | 34,729,732 | 34,736,677 |
| TOTAL INVESTMENT IN SECURITIES - 101.5% | | | |
| (Cost $886,142,347) | | | 921,435,776 |
| NET OTHER ASSETS (LIABILITIES) - (1.5)% | | | (14,047,941) |
| NET ASSETS - 100% | | | $907,387,835 |
Legend
(a) Non-income producing
(b) Security exempt from registration under Rule 144A of the Securities Act of 1933. These securities may be resold in transactions exempt from registration, normally to qualified institutional buyers. At the end of the period, the value of these securities amounted to $280,656,232 or 30.9% of net assets.
(c) Coupon rates for floating and adjustable rate securities reflect the rates in effect at period end.
(d) Security represents right to receive monthly interest payments on an underlying pool of mortgages or assets. Principal shown is the outstanding par amount of the pool as of the end of the period.
(e) Coupon is indexed to a floating interest rate which may be multiplied by a specified factor and/or subject to caps or floors.
(f) Level 3 security
(g) Affiliated fund that is generally available only to investment companies and other accounts managed by Fidelity Investments. The rate quoted is the annualized seven-day yield of the fund at period end. A complete unaudited listing of the fund's holdings as of its most recent quarter end is available upon request. In addition, each Fidelity Central Fund's financial statements, which are not covered by the Fund's Report of Independent Registered Public Accounting Firm, are available on the SEC's website or upon request.
Affiliated Central Funds
Information regarding fiscal year to date income earned by the Fund from investments in Fidelity Central Funds is as follows:
| Fund | Income earned |
| Fidelity Cash Central Fund | $535,088 |
| Fidelity Securities Lending Cash Central Fund | 15,126 |
| Total | $550,214 |
Amounts in the income column in the above table include any capital gain distributions from underlying funds, which are presented in the corresponding line-item in the Statement of Operations if applicable.
Investment Valuation
The following is a summary of the inputs used, as of July 31, 2018, involving the Fund's assets and liabilities carried at fair value. The inputs or methodology used for valuing securities may not be an indication of the risk associated with investing in those securities. For more information on valuation inputs, and their aggregation into the levels used below, please refer to the Investment Valuation section in the accompanying Notes to Financial Statements.
| | Valuation Inputs at Reporting Date: |
| Description | Total | Level 1 | Level 2 | Level 3 |
| Investments in Securities: | | | | |
| Equities: | | | | |
| Consumer Discretionary | $2,009,724 | $2,009,724 | $-- | $-- |
| Financials | 123,180,895 | 113,752,790 | 9,428,105 | -- |
| Real Estate | 234,353,005 | 220,929,653 | 13,423,352 | -- |
| Utilities | 610,059 | 610,059 | -- | -- |
| Corporate Bonds | 225,170,891 | -- | 225,170,891 | -- |
| Asset-Backed Securities | 35,050,516 | -- | 35,050,516 | -- |
| Collateralized Mortgage Obligations | 3,524,778 | -- | 3,524,778 | -- |
| Commercial Mortgage Securities | 210,927,576 | -- | 210,927,576 | -- |
| Bank Loan Obligations | 51,871,655 | -- | 42,242,353 | 9,629,302 |
| Money Market Funds | 34,736,677 | 34,736,677 | -- | -- |
| Total Investments in Securities: | $921,435,776 | $372,038,903 | $539,767,571 | $9,629,302 |
The following is a reconciliation of Investments in Securities for which Level 3 inputs were used in determining value:
| Investments in Securities: | |
| Bank Loan Obligations | |
| Beginning Balance | $10,051,425 |
| Net Realized Gain (Loss) on Investment Securities | (6,195) |
| Net Unrealized Gain (Loss) on Investment Securities | 104,701 |
| Cost of Purchases | 1,721,087 |
| Proceeds of Sales | (2,275,425) |
| Amortization/Accretion | 33,709 |
| Transfers into Level 3 | -- |
| Transfers out of Level 3 | -- |
| Ending Balance | $9,629,302 |
| The change in unrealized gain (loss) for the period attributable to Level 3 securities held at July 31, 2018 | $94,960 |
| Other Investments in Securities | |
| Beginning Balance | $277,268 |
| Net Realized Gain (Loss) on Investment Securities | -- |
| Net Unrealized Gain (Loss) on Investment Securities | -- |
| Cost of Purchases | -- |
| Proceeds of Sales | -- |
| Amortization/Accretion | -- |
| Transfers into Level 3 | -- |
| Transfers out of Level 3 | (277,268) |
| Ending Balance | $-- |
| The change in unrealized gain (loss) for the period attributable to Level 3 securities held at July 31, 2018 | $-- |
The information used in the above reconciliations represents fiscal year to date activity for any Investments in Securities identified as using Level 3 inputs at either the beginning or the end of the current fiscal period. Transfers in or out of Level 3 represent the beginning value of any Security or Instrument where a change in the pricing level occurred from the beginning to the end of the period. The cost of purchases and the proceeds of sales may include securities received or delivered through corporate actions or exchanges. Realized and unrealized gains (losses) disclosed in the reconciliations are included in Net Gain (Loss) on the Fund's Statement of Operations.
Other Information
The composition of credit quality ratings as a percentage of Total Net Assets is as follows (Unaudited):
| U.S. Government and U.S. Government Agency Obligations | 0.3% |
| AAA,AA,A | 2.6% |
| BBB | 12.4% |
| BB | 12.3% |
| B | 13.6% |
| CCC,CC,C | 1.0% |
| Not Rated | 15.8% |
| Equities | 39.7% |
| Short-Term Investments and Net Other Assets | 2.3% |
| | 100.0% |
We have used ratings from Moody's Investors Service, Inc. Where Moody's® ratings are not available, we have used S&P® ratings. All ratings are as of the date indicated and do not reflect subsequent changes.
See accompanying notes which are an integral part of the financial statements.
Financial Statements
Statement of Assets and Liabilities
| | | July 31, 2018 |
| Assets | | |
Investment in securities, at value — See accompanying schedule:
Unaffiliated issuers (cost $851,409,387) | $886,699,099 | |
| Fidelity Central Funds (cost $34,732,960) | 34,736,677 | |
| Total Investment in Securities (cost $886,142,347) | | $921,435,776 |
| Cash | | 408,069 |
| Receivable for investments sold | | 1,820,113 |
| Receivable for fund shares sold | | 8,567 |
| Dividends receivable | | 336,443 |
| Interest receivable | | 4,718,324 |
| Distributions receivable from Fidelity Central Funds | | 56,768 |
| Other receivables | | 2,463 |
| Total assets | | 928,786,523 |
| Liabilities | | |
| Payable for investments purchased | $3,168,175 | |
| Payable for fund shares redeemed | 18,222,438 | |
| Other payables and accrued expenses | 8,075 | |
| Total liabilities | | 21,398,688 |
| Net Assets | | $907,387,835 |
| Net Assets consist of: | | |
| Paid in capital | | $853,400,357 |
| Undistributed net investment income | | 6,659,140 |
| Accumulated undistributed net realized gain (loss) on investments and foreign currency transactions | | 12,034,909 |
| Net unrealized appreciation (depreciation) on investments | | 35,293,429 |
| Net Assets | | $907,387,835 |
| Series Real Estate Income: | | |
| Net Asset Value, offering price and redemption price per share ($907,387,835 ÷ 82,727,416 shares) | | $10.97 |
See accompanying notes which are an integral part of the financial statements.
Statement of Operations
| | | Year ended July 31, 2018 |
| Investment Income | | |
| Dividends | | $18,074,593 |
| Interest | | 29,809,126 |
| Income from Fidelity Central Funds | | 550,214 |
| Total income | | 48,433,933 |
| Expenses | | |
| Custodian fees and expenses | $17,886 | |
| Independent trustees' fees and expenses | 3,853 | |
| Commitment fees | 2,549 | |
| Total expenses before reductions | 24,288 | |
| Expense reductions | (14,952) | |
| Total expenses after reductions | | 9,336 |
| Net investment income (loss) | | 48,424,597 |
| Realized and Unrealized Gain (Loss) | | |
| Net realized gain (loss) on: | | |
| Investment securities: | | |
| Unaffiliated issuers | 16,349,944 | |
| Fidelity Central Funds | 2,186 | |
| Foreign currency transactions | (799) | |
| Total net realized gain (loss) | | 16,351,331 |
| Change in net unrealized appreciation (depreciation) on: | | |
| Investment securities: | | |
| Unaffiliated issuers | (32,582,412) | |
| Fidelity Central Funds | (1,983) | |
| Assets and liabilities in foreign currencies | (4) | |
| Total change in net unrealized appreciation (depreciation) | | (32,584,399) |
| Net gain (loss) | | (16,233,068) |
| Net increase (decrease) in net assets resulting from operations | | $32,191,529 |
See accompanying notes which are an integral part of the financial statements.
Statement of Changes in Net Assets
| | Year ended July 31, 2018 | Year ended July 31, 2017 |
| Increase (Decrease) in Net Assets | | |
| Operations | | |
| Net investment income (loss) | $48,424,597 | $43,527,164 |
| Net realized gain (loss) | 16,351,331 | 9,060,937 |
| Change in net unrealized appreciation (depreciation) | (32,584,399) | (3,286,317) |
| Net increase (decrease) in net assets resulting from operations | 32,191,529 | 49,301,784 |
| Distributions to shareholders from net investment income | (49,000,695) | (41,562,413) |
| Distributions to shareholders from net realized gain | (12,651,932) | (13,652,895) |
| Total distributions | (61,652,627) | (55,215,308) |
| Share transactions - net increase (decrease) | 36,122,209 | 27,688,733 |
| Total increase (decrease) in net assets | 6,661,111 | 21,775,209 |
| Net Assets | | |
| Beginning of period | 900,726,724 | 878,951,515 |
| End of period | $907,387,835 | $900,726,724 |
| Other Information | | |
| Undistributed net investment income end of period | $6,659,140 | $8,852,160 |
See accompanying notes which are an integral part of the financial statements.
Financial Highlights
Fidelity Series Real Estate Income Fund
| Years ended July 31, | 2018 | 2017 | 2016 | 2015 | 2014 |
| Selected Per–Share Data | | | | | |
| Net asset value, beginning of period | $11.34 | $11.43 | $11.13 | $11.47 | $11.41 |
| Income from Investment Operations | | | | | |
| Net investment income (loss)A | .59 | .55 | .52 | .56 | .58 |
| Net realized and unrealized gain (loss) | (.20) | .06 | .42 | (.01) | .31 |
| Total from investment operations | .39 | .61 | .94 | .55 | .89 |
| Distributions from net investment income | (.60) | (.52) | (.53) | (.61) | (.59) |
| Distributions from net realized gain | (.16) | (.18) | (.11) | (.29) | (.24) |
| Total distributions | (.76) | (.70) | (.64) | (.89)B | (.83) |
| Net asset value, end of period | $10.97 | $11.34 | $11.43 | $11.13 | $11.47 |
| Total ReturnC,D | 3.61% | 5.65% | 8.93% | 5.05% | 8.33% |
| Ratios to Average Net AssetsE,F | | | | | |
| Expenses before reductions | - %G | .63% | .77% | .77% | .77% |
| Expenses net of fee waivers, if any | - %G | .63% | .77% | .77% | .77% |
| Expenses net of all reductions | - %G | .63% | .77% | .77% | .77% |
| Net investment income (loss) | 5.36% | 4.89% | 4.81% | 5.03% | 5.15% |
| Supplemental Data | | | | | |
| Net assets, end of period (000 omitted) | $907,388 | $423,538 | $411,102 | $401,861 | $409,084 |
| Portfolio turnover rateH | 27% | 24% | 24% | 19% | 33% |
A Calculated based on average shares outstanding during the period.
B Total distributions of $.89 per share is comprised of distributions from net investment income of $.606 and distributions from net realized gain of $.288 per share.
C Total returns for periods of less than one year are not annualized.
D Total returns would have been lower if certain expenses had not been reduced during the applicable periods shown.
E Fees and expenses of any underlying Fidelity Central Funds are not included in the Fund's expense ratio. The Fund indirectly bears its proportionate share of the expenses of any underlying Fidelity Central Funds.
F Expense ratios reflect operating expenses of the class. Expenses before reductions do not reflect amounts reimbursed by the investment adviser or reductions from brokerage service arrangements or reductions from other expense offset arrangements and do not represent the amount paid by the class during periods when reimbursements or reductions occur. Expenses net of fee waivers reflect expenses after reimbursement by the investment adviser but prior to reductions from brokerage service arrangements or other expense offset arrangements. Expenses net of all reductions represent the net expenses paid by the class.
G Amount represents less than .005%.
H Amount does not include the portfolio activity of any underlying Fidelity Central Funds.
See accompanying notes which are an integral part of the financial statements.
Notes to Financial Statements
For the period ended July 31, 2018
1. Organization.
Fidelity Series Real Estate Income Fund (the Fund) is a fund of Fidelity Securities Fund (the Trust) and is authorized to issue an unlimited number of shares. Shares of the Fund are only available for purchase by mutual funds for which Fidelity Management & Research Company (FMR) or an affiliate serves as an investment manager. The Trust is registered under the Investment Company Act of 1940, as amended (the 1940 Act), as an open-end management investment company organized as a Massachusetts business trust. Effective August 28, 2017, the Fund no longer offered Class F, and all outstanding shares of Class F were exchanged for shares of Series Real Estate Income.
2. Investments in Fidelity Central Funds.
The Fund invests in Fidelity Central Funds, which are open-end investment companies generally available only to other investment companies and accounts managed by the investment adviser and its affiliates. The Fund's Schedule of Investments lists each of the Fidelity Central Funds held as of period end, if any, as an investment of the Fund, but does not include the underlying holdings of each Fidelity Central Fund. As an Investing Fund, the Fund indirectly bears its proportionate share of the expenses of the underlying Fidelity Central Funds.
The Money Market Central Funds seek preservation of capital and current income and are managed by Fidelity Investments Money Management, Inc. (FIMM), an affiliate of the investment adviser. Annualized expenses of the Money Market Central Funds as of their most recent shareholder report date are less than .005%.
A complete unaudited list of holdings for each Fidelity Central Fund is available upon request or at the Securities and Exchange Commission (the SEC) website at www.sec.gov. In addition, the financial statements of the Fidelity Central Funds, which are not covered by the Fund's Report of Independent Registered Public Accounting Firm, are available on the SEC website or upon request.
3. Significant Accounting Policies.
The Fund is an investment company and applies the accounting and reporting guidance of the Financial Accounting Standards Board (FASB) Accounting Standards Codification Topic 946 Financial Services – Investments Companies. The financial statements have been prepared in conformity with accounting principles generally accepted in the United States of America (GAAP), which require management to make certain estimates and assumptions at the date of the financial statements. Actual results could differ from those estimates. Subsequent events, if any, through the date that the financial statements were issued have been evaluated in the preparation of the financial statements. The following summarizes the significant accounting policies of the Fund:
Investment Valuation. Investments are valued as of 4:00 p.m. Eastern time on the last calendar day of the period. The Board of Trustees (the Board) has delegated the day to day responsibility for the valuation of the Fund's investments to the Fair Value Committee (the Committee) established by the Fund's investment adviser. In accordance with valuation policies and procedures approved by the Board, the Fund attempts to obtain prices from one or more third party pricing vendors or brokers to value its investments. When current market prices, quotations or currency exchange rates are not readily available or reliable, investments will be fair valued in good faith by the Committee, in accordance with procedures adopted by the Board. Factors used in determining fair value vary by investment type and may include market or investment specific events, changes in interest rates and credit quality. The frequency with which these procedures are used cannot be predicted and they may be utilized to a significant extent. The Committee oversees the Fund's valuation policies and procedures and reports to the Board on the Committee's activities and fair value determinations. The Board monitors the appropriateness of the procedures used in valuing the Fund's investments and ratifies the fair value determinations of the Committee.
The Fund categorizes the inputs to valuation techniques used to value its investments into a disclosure hierarchy consisting of three levels as shown below:
- Level 1 – quoted prices in active markets for identical investments
- Level 2 – other significant observable inputs (including quoted prices for similar investments, interest rates, prepayment speeds, etc.)
- Level 3 – unobservable inputs (including the Fund's own assumptions based on the best information available)
Valuation techniques used to value the Fund's investments by major category are as follows:
Equity securities, including restricted securities, for which market quotations are readily available, are valued at the last reported sale price or official closing price as reported by a third party pricing vendor on the primary market or exchange on which they are traded and are categorized as Level 1 in the hierarchy. In the event there were no sales during the day or closing prices are not available, securities are valued at the last quoted bid price or may be valued using the last available price and are generally categorized as Level 2 in the hierarchy. For foreign equity securities, when market or security specific events arise, comparisons to the valuation of American Depositary Receipts (ADRs), futures contracts, Exchange-Traded Funds (ETFs) and certain indexes as well as quoted prices for similar securities may be used and would be categorized as Level 2 in the hierarchy. Utilizing these techniques may result in transfers between Level 1 and Level 2. For equity securities, including restricted securities, where observable inputs are limited, assumptions about market activity and risk are used and these securities may be categorized as Level 3 in the hierarchy.
Debt securities, including restricted securities, are valued based on evaluated prices received from third party pricing vendors or from brokers who make markets in such securities. Corporate bonds and bank loan obligations are valued by pricing vendors who utilize matrix pricing which considers yield or price of bonds of comparable quality, coupon, maturity and type or by broker-supplied prices. Asset backed securities, collateralized mortgage obligations and commercial mortgage securities are valued by pricing vendors who utilize matrix pricing which considers prepayment speed assumptions, attributes of the collateral, yield or price of bonds of comparable quality, coupon, maturity and type or by broker-supplied prices. When independent prices are unavailable or unreliable, debt securities may be valued utilizing pricing methodologies which consider similar factors that would be used by third party pricing vendors. Debt securities are generally categorized as Level 2 in the hierarchy but may be Level 3 depending on the circumstances. The Fund invests a significant portion of its assets in below investment grade securities. The value of these securities can be more volatile due to changes in the credit quality of the issuer and is sensitive to changes in economic, market and regulatory conditions.
Investments in open-end mutual funds, including the Fidelity Central Funds, are valued at their closing net asset value (NAV) each business day and are categorized as Level 1 in the hierarchy.
Changes in valuation techniques may result in transfers in or out of an assigned level within the disclosure hierarchy. The aggregate value of investments by input level as of July 31, 2018, as well as a roll forward of Level 3 investments, is included at the end of the Fund's Schedule of Investments.
Foreign Currency. The Fund may use foreign currency contracts to facilitate transactions in foreign-denominated securities. Gains and losses from these transactions may arise from changes in the value of the foreign currency or if the counterparties do not perform under the contracts' terms.
Foreign-denominated assets, including investment securities, and liabilities are translated into U.S. dollars at the exchange rates at period end. Purchases and sales of investment securities, income and dividends received and expenses denominated in foreign currencies are translated into U.S. dollars at the exchange rate in effect on the transaction date.
The effects of exchange rate fluctuations on investments are included with the net realized and unrealized gain (loss) on investment securities. Other foreign currency transactions resulting in realized and unrealized gain (loss) are disclosed separately.
Investment Transactions and Income. For financial reporting purposes, the Fund's investment holdings and NAV include trades executed through the end of the last business day of the period. The NAV per share for processing shareholder transactions is calculated as of the close of business of the New York Stock Exchange (NYSE), normally 4:00 p.m. Eastern time and includes trades executed through the end of the prior business day. Gains and losses on securities sold are determined on the basis of identified cost. Dividend income is recorded on the ex-dividend date, except for certain dividends from foreign securities where the ex-dividend date may have passed, which are recorded as soon as the Fund is informed of the ex-dividend date. Non-cash dividends included in dividend income, if any, are recorded at the fair market value of the securities received. Income and capital gain distributions from Fidelity Central Funds, if any, are recorded on the ex-dividend date. Certain distributions received by the Fund represent a return of capital or capital gain. The Fund determines the components of these distributions subsequent to the ex-dividend date, based upon receipt of tax filings or other correspondence relating to the underlying investment. These distributions are recorded as a reduction of cost of investments and/or as a realized gain. Interest income is accrued as earned and includes coupon interest and amortization of premium and accretion of discount on debt securities as applicable. Investment income is recorded net of foreign taxes withheld where recovery of such taxes is uncertain. Debt obligations may be placed on non-accrual status and related interest income may be reduced by ceasing current accruals and writing off interest receivables when the collection of all or a portion of interest has become doubtful based on consistently applied procedures. A debt obligation is removed from non-accrual status when the issuer resumes interest payments or when collectability of interest is reasonably assured.
Class Allocations and Expenses. Investment income, realized and unrealized capital gains and losses, common expenses of the Fund, and certain fund-level expense reductions, if any, are allocated daily on a pro-rata basis to each class based on the relative net assets of each class to the total net assets of the Fund. Each class differs with respect to fees incurred. Certain expense reductions may also differ by class. For the reporting period, the allocated portion of income and expenses to each class as a percent of its average net assets may vary due to the timing of recording these transactions in relation to fluctuating net assets of the classes. Expenses directly attributable to a fund are charged to that fund. Expenses attributable to more than one fund are allocated among the respective funds on the basis of relative net assets or other appropriate methods. Expense estimates are accrued in the period to which they relate and adjustments are made when actual amounts are known.
Income Tax Information and Distributions to Shareholders. Each year, the Fund intends to qualify as a regulated investment company under Subchapter M of the Internal Revenue Code, including distributing substantially all of its taxable income and realized gains. As a result, no provision for U.S. Federal income taxes is required. As of July 31, 2018, the Fund did not have any unrecognized tax benefits in the financial statements; nor is the Fund aware of any tax positions for which it is reasonably possible that the total amounts of unrecognized tax benefits will significantly change in the next twelve months. The Fund files a U.S. federal tax return, in addition to state and local tax returns as required. The Fund's federal income tax returns are subject to examination by the Internal Revenue Service (IRS) for a period of three fiscal years after they are filed. State and local tax returns may be subject to examination for an additional fiscal year depending on the jurisdiction. Foreign taxes are provided for based on the Fund's understanding of the tax rules and rates that exist in the foreign markets in which it invests.
Distributions are declared and recorded on the ex-dividend date. Income and capital gain distributions are declared separately for each class. Income and capital gain distributions are determined in accordance with income tax regulations, which may differ from GAAP.
Capital accounts within the financial statements are adjusted for permanent book-tax differences. These adjustments have no impact on net assets or the results of operations. Capital accounts are not adjusted for temporary book-tax differences which will reverse in a subsequent period.
Book-tax differences are primarily due to short-term capital gains, foreign currency transactions, equity-debt classifications, certain conversion ratio adjustments, partnerships and losses deferred due to wash sales.
As of period end, the cost and unrealized appreciation (depreciation) in securities, and derivatives if applicable, for federal income tax purposes were as follows:
| Gross unrealized appreciation | $48,746,800 |
| Gross unrealized depreciation | (16,228,384) |
| Net unrealized appreciation (depreciation) | $32,518,416 |
| Tax Cost | $888,917,360 |
The tax-based components of distributable earnings as of period end were as follows:
| Undistributed ordinary income | $10,548,988 |
| Undistributed long-term capital gain | $11,032,079 |
| Net unrealized appreciation (depreciation) on securities and other investments | $32,518,416 |
The tax character of distributions paid was as follows:
| | July 31, 2018 | July 31, 2017 |
| Ordinary Income | $49,000,695 | $ 43,512,826 |
| Long-term Capital Gains | 12,651,932 | 11,702,482 |
| Total | $61,652,627 | $ 55,215,308 |
Restricted Securities. The Fund may invest in securities that are subject to legal or contractual restrictions on resale. These securities generally may be resold in transactions exempt from registration or to the public if the securities are registered. Disposal of these securities may involve time-consuming negotiations and expense, and prompt sale at an acceptable price may be difficult. Information regarding restricted securities is included at the end of the Fund's Schedule of Investments.
Loans and Other Direct Debt Instruments. The Fund invests in direct debt instruments which are interests in amounts owed to lenders by corporate or other borrowers. These instruments may be in the form of loans, trade claims or other receivables and may include standby financing commitments such as revolving credit facilities that obligate the Fund to supply additional cash to the borrower on demand. Loans may be acquired through assignment or participation. The Fund did not have any unfunded loan commitments, which are contractual obligations for future funding, at period end.
New Accounting Pronouncement. In March 2017, the Financial Accounting Standards Board (FASB) issued an Accounting Standards Update (ASU), ASU 2017-08, which amends the amortization period for certain callable debt securities that are held at a premium. The amendment requires the premium to be amortized to the earliest call date. The amendments do not require an accounting change for securities held at a discount. The ASU is effective for annual periods beginning after December 15, 2018. Management is currently evaluating the potential impact of these changes to the financial statements.
4. Purchases and Sales of Investments.
Purchases and sales of securities, other than short-term securities, aggregated $270,375,935 and $237,432,568, respectively.
5. Fees and Other Transactions with Affiliates.
Management Fee. Fidelity Management & Research Company (the investment adviser) and its affiliates provide the Fund with investment management related services for which the Fund does not pay a management fee. Under the management contract, the investment adviser or an affiliate pays all ordinary operating expenses of the Fund, except custody fees, fees and expenses of the independent Trustees, and certain miscellaneous expenses such as proxy and shareholder meeting expenses.
Brokerage Commissions. The Fund placed a portion of its portfolio transactions with brokerage firms which are affiliates of the investment adviser. Brokerage commissions are included in net realized gain (loss) and change in net unrealized appreciation (depreciation) in the Statement of Operations. The commissions paid to these affiliated firms were $970 for the period.
Interfund Trades. The Fund may purchase from or sell securities to other Fidelity Funds under procedures adopted by the Board. The procedures have been designed to ensure these interfund trades are executed in accordance with Rule 17a-7 of the 1940 Act. Interfund trades are included within the respective purchases and sales amounts shown in the Purchases and Sales of Investments note.
6. Committed Line of Credit.
The Fund participates with other funds managed by the investment adviser or an affiliate in a $4.25 billion credit facility (the "line of credit") to be utilized for temporary or emergency purposes to fund shareholder redemptions or for other short-term liquidity purposes. The Fund has agreed to pay commitment fees on its pro-rata portion of the line of credit, which amounted to $2,549 and is reflected in Commitment fees on the Statement of Operations. During the period, the Fund did not borrow on this line of credit.
7. Security Lending.
The Fund lends portfolio securities through a lending agent from time to time in order to earn additional income. For equity securities, a lending agent is used and may loan securities to certain qualified borrowers, including Fidelity Capital Markets (FCM), a broker-dealer affiliated with the Fund. On the settlement date of the loan, the Fund receives collateral (in the form of U.S. Treasury obligations, letters of credit and/or cash) against the loaned securities and maintains collateral in an amount not less than 100% of the market value of the loaned securities during the period of the loan. The market value of the loaned securities is determined at the close of business of the Fund and any additional required collateral is delivered to the Fund on the next business day. The Fund or borrower may terminate the loan at any time, and if the borrower defaults on its obligation to return the securities loaned because of insolvency or other reasons, the Fund may apply collateral received from the borrower against the obligation. The Fund may experience delays and costs in recovering the securities loaned. Any cash collateral received is invested in the Fidelity Securities Lending Cash Central Fund. At period end, there were no security loans outstanding. Security lending income represents the income earned on investing cash collateral, less rebates paid to borrowers and any lending agent fees associated with the loan, plus any premium payments received for lending certain types of securities. Security lending income is presented in the Statement of Operations as a component of income from Fidelity Central Funds. Total security lending income during the period amounted to $15,126. During the period, there were no securities loaned to FCM.
8. Expense Reductions.
Commissions paid to certain brokers with whom the investment adviser, or its affiliates, places trades on behalf of the Fund include an amount in addition to trade execution, which may be rebated back to the Fund to offset certain expenses. This amount totaled $8,644 for the period. In addition, through arrangements with the Fund's custodian, credits realized as a result of certain uninvested cash balances were used to reduce the Fund's expenses. During the period, these credits reduced the Fund's custody expenses by $6,308.
9. Distributions to Shareholders.
Distributions to shareholders of each class were as follows:
| | Year ended
July 31, 2018 | Year ended
July 31, 2017 |
| From net investment income | | |
| Series Real Estate Income | $49,000,695 | $18,968,674 |
| Class F | – | 22,593,739 |
| Total | $49,000,695 | $41,562,413 |
| From net realized gain | | |
| Series Real Estate Income | $12,651,932 | $6,354,281 |
| Class F | – | 7,298,614 |
| Total | $12,651,932 | $13,652,895 |
10. Share Transactions.
Transactions for each class of shares were as follows:
| | Shares | Shares | Dollars | Dollars |
| | Year ended July 31, 2018 | Year ended July 31, 2017 | Year ended July 31, 2018 | Year ended July 31, 2017 |
| Series Real Estate Income | | | | |
| Shares sold | 48,557,771 | 2,702,003 | $549,896,778 | $30,208,172 |
| Reinvestment of distributions | 5,626,052 | 2,298,349 | 61,652,627 | 25,322,955 |
| Shares redeemed | (8,801,423) | (3,627,301) | (97,080,019) | (40,432,699) |
| Net increase (decrease) | 45,382,400 | 1,373,051 | $514,469,386 | $15,098,428 |
| Class F | | | | |
| Shares sold | 191,320 | 3,810,903 | $2,169,843 | $42,458,442 |
| Reinvestment of distributions | – | 2,712,239 | – | 29,892,353 |
| Shares redeemed | (42,260,435) | (5,374,089) | (480,517,020) | (59,760,490) |
| Net increase (decrease) | (42,069,115) | 1,149,053 | $(478,347,177) | $12,590,305 |
11. Other.
The Fund's organizational documents provide former and current trustees and officers with a limited indemnification against liabilities arising in connection with the performance of their duties to the Fund. In the normal course of business, the Fund may also enter into contracts that provide general indemnifications. The Fund's maximum exposure under these arrangements is unknown as this would be dependent on future claims that may be made against the Fund. The risk of material loss from such claims is considered remote.
At the end of the period, mutual funds managed by the investment adviser or its affiliates were the owners of record of all of the outstanding shares of the Fund.
Report of Independent Registered Public Accounting Firm
To the Trustees of Fidelity Securities Fund and Shareholders of Fidelity Series Real Estate Income Fund:
Opinion on the Financial Statements and Financial Highlights
We have audited the accompanying statement of assets and liabilities of Fidelity Series Real Estate Income Fund (the "Fund"), a fund of Fidelity Securities Fund, including the schedule of investments, as of July 31, 2018, and the related statement of operations for the year then ended, the statement of changes in net assets for each of the two years in the period then ended, the financial highlights for each of the five years in the period then ended, and the related notes. In our opinion, the financial statements and financial highlights present fairly, in all material respects, the financial position of the Fund as of July 31, 2018, and the results of its operations for the year then ended, the changes in its net assets for each of the two years in the period then ended, and the financial highlights for each of the five years in the period then ended, in conformity with accounting principles generally accepted in the United States of America.
Basis for Opinion
These financial statements and financial highlights are the responsibility of the Fund's management. Our responsibility is to express an opinion on the Fund's financial statements and financial highlights based on our audits. We are a public accounting firm registered with the Public Company Accounting Oversight Board (United States) (PCAOB) and are required to be independent with respect to the Fund in accordance with the U.S. federal securities laws and the applicable rules and regulations of the Securities and Exchange Commission and the PCAOB.
We conducted our audits in accordance with the standards of the PCAOB. Those standards require that we plan and perform the audit to obtain reasonable assurance about whether the financial statements and financial highlights are free of material misstatement, whether due to error or fraud. The Fund is not required to have, nor were we engaged to perform, an audit of its internal control over financial reporting. As part of our audits we are required to obtain an understanding of internal control over financial reporting but not for the purpose of expressing an opinion on the effectiveness of the Fund’s internal control over financial reporting. Accordingly, we express no such opinion.
Our audits included performing procedures to assess the risks of material misstatement of the financial statements and financial highlights, whether due to error or fraud, and performing procedures that respond to those risks. Such procedures included examining, on a test basis, evidence regarding the amounts and disclosures in the financial statements and financial highlights. Our audits also included evaluating the accounting principles used and significant estimates made by management, as well as evaluating the overall presentation of the financial statements and financial highlights. Our procedures included confirmation of securities owned as of July 31, 2018, by correspondence with the custodians and brokers; when replies were not received from brokers, we performed other auditing procedures. We believe that our audits provide a reasonable basis for our opinion.
/s/ Deloitte & Touche LLP
Boston, Massachusetts
September 18, 2018
We have served as the auditor of one or more of the Fidelity investment companies since 1999.
Trustees and Officers
The Trustees, Members of the Advisory Board (if any), and officers of the trust and fund, as applicable, are listed below. The Board of Trustees governs the fund and is responsible for protecting the interests of shareholders. The Trustees are experienced executives who meet periodically throughout the year to oversee the fund's activities, review contractual arrangements with companies that provide services to the fund, oversee management of the risks associated with such activities and contractual arrangements, and review the fund's performance. Except for Jonathan Chiel, each of the Trustees oversees 286 funds. Mr. Chiel oversees 150 funds.
The Trustees hold office without limit in time except that (a) any Trustee may resign; (b) any Trustee may be removed by written instrument, signed by at least two-thirds of the number of Trustees prior to such removal; (c) any Trustee who requests to be retired or who has become incapacitated by illness or injury may be retired by written instrument signed by a majority of the other Trustees; and (d) any Trustee may be removed at any special meeting of shareholders by a two-thirds vote of the outstanding voting securities of the trust. Each Trustee who is not an interested person (as defined in the 1940 Act) of the trust and the fund is referred to herein as an Independent Trustee. Each Independent Trustee shall retire not later than the last day of the calendar year in which his or her 75th birthday occurs. The Independent Trustees may waive this mandatory retirement age policy with respect to individual Trustees. Officers and Advisory Board Members hold office without limit in time, except that any officer or Advisory Board Member may resign or may be removed by a vote of a majority of the Trustees at any regular meeting or any special meeting of the Trustees. Except as indicated, each individual has held the office shown or other offices in the same company for the past five years.
The fund’s Statement of Additional Information (SAI) includes more information about the Trustees. To request a free copy, call Fidelity at 1-800-544-8544.
Experience, Skills, Attributes, and Qualifications of the Trustees. The Governance and Nominating Committee has adopted a statement of policy that describes the experience, qualifications, attributes, and skills that are necessary and desirable for potential Independent Trustee candidates (Statement of Policy). The Board believes that each Trustee satisfied at the time he or she was initially elected or appointed a Trustee, and continues to satisfy, the standards contemplated by the Statement of Policy. The Governance and Nominating Committee also engages professional search firms to help identify potential Independent Trustee candidates who have the experience, qualifications, attributes, and skills consistent with the Statement of Policy. From time to time, additional criteria based on the composition and skills of the current Independent Trustees, as well as experience or skills that may be appropriate in light of future changes to board composition, business conditions, and regulatory or other developments, have also been considered by the professional search firms and the Governance and Nominating Committee. In addition, the Board takes into account the Trustees' commitment and participation in Board and committee meetings, as well as their leadership of standing and ad hoc committees throughout their tenure.
In determining that a particular Trustee was and continues to be qualified to serve as a Trustee, the Board has considered a variety of criteria, none of which, in isolation, was controlling. The Board believes that, collectively, the Trustees have balanced and diverse experience, qualifications, attributes, and skills, which allow the Board to operate effectively in governing the fund and protecting the interests of shareholders. Information about the specific experience, skills, attributes, and qualifications of each Trustee, which in each case led to the Board's conclusion that the Trustee should serve (or continue to serve) as a trustee of the fund, is provided below.
Board Structure and Oversight Function. James C. Curvey is an interested person and currently serves as Chairman. The Trustees have determined that an interested Chairman is appropriate and benefits shareholders because an interested Chairman has a personal and professional stake in the quality and continuity of services provided to the fund. Independent Trustees exercise their informed business judgment to appoint an individual of their choosing to serve as Chairman, regardless of whether the Trustee happens to be independent or a member of management. The Independent Trustees have determined that they can act independently and effectively without having an Independent Trustee serve as Chairman and that a key structural component for assuring that they are in a position to do so is for the Independent Trustees to constitute a substantial majority for the Board. The Independent Trustees also regularly meet in executive session. Ned C. Lautenbach serves as Chairman of the Independent Trustees and as such (i) acts as a liaison between the Independent Trustees and management with respect to matters important to the Independent Trustees and (ii) with management prepares agendas for Board meetings.
Fidelity® funds are overseen by different Boards of Trustees. The fund's Board oversees Fidelity's high income and certain equity funds, and other Boards oversee Fidelity's investment-grade bond, money market, asset allocation, and other equity funds. The asset allocation funds may invest in Fidelity® funds overseen by the fund's Board. The use of separate Boards, each with its own committee structure, allows the Trustees of each group of Fidelity® funds to focus on the unique issues of the funds they oversee, including common research, investment, and operational issues. On occasion, the separate Boards establish joint committees to address issues of overlapping consequences for the Fidelity® funds overseen by each Board.
The Trustees operate using a system of committees to facilitate the timely and efficient consideration of all matters of importance to the Trustees, the fund, and fund shareholders and to facilitate compliance with legal and regulatory requirements and oversight of the fund's activities and associated risks. The Board, acting through its committees, has charged FMR and its affiliates with (i) identifying events or circumstances the occurrence of which could have demonstrably adverse effects on the fund's business and/or reputation; (ii) implementing processes and controls to lessen the possibility that such events or circumstances occur or to mitigate the effects of such events or circumstances if they do occur; and (iii) creating and maintaining a system designed to evaluate continuously business and market conditions in order to facilitate the identification and implementation processes described in (i) and (ii) above. Because the day-to-day operations and activities of the fund are carried out by or through FMR, its affiliates, and other service providers, the fund's exposure to risks is mitigated but not eliminated by the processes overseen by the Trustees. While each of the Board's committees has responsibility for overseeing different aspects of the fund's activities, oversight is exercised primarily through the Operations, Audit, and Compliance Committees. In addition, the Independent Trustees have worked with Fidelity to enhance the Board's oversight of investment and financial risks, legal and regulatory risks, technology risks, and operational risks, including the development of additional risk reporting to the Board. Appropriate personnel, including but not limited to the fund's Chief Compliance Officer (CCO), FMR's internal auditor, the independent accountants, the fund's Treasurer and portfolio management personnel, make periodic reports to the Board's committees, as appropriate, including an annual review of Fidelity's risk management program for the Fidelity® funds. The responsibilities of each standing committee, including their oversight responsibilities, are described further under "Standing Committees of the Trustees."
Interested Trustees*:
Correspondence intended for a Trustee who is an interested person may be sent to Fidelity Investments, 245 Summer Street, Boston, Massachusetts 02210.
Name, Year of Birth; Principal Occupations and Other Relevant Experience+
Jonathan Chiel (1957)
Year of Election or Appointment: 2016
Trustee
Mr. Chiel also serves as Trustee of other Fidelity® funds. Mr. Chiel is Executive Vice President and General Counsel for FMR LLC (diversified financial services company, 2012-present). Previously, Mr. Chiel served as general counsel (2004-2012) and senior vice president and deputy general counsel (2000-2004) for John Hancock Financial Services; a partner with Choate, Hall & Stewart (1996-2000) (law firm); and an Assistant United States Attorney for the United States Attorney’s Office of the District of Massachusetts (1986-95), including Chief of the Criminal Division (1993-1995). Mr. Chiel is a director on the boards of the Boston Bar Foundation and the Maimonides School.
James C. Curvey (1935)
Year of Election or Appointment: 2007
Trustee
Chairman of the Board of Trustees
Mr. Curvey also serves as Trustee of other Fidelity® funds. Mr. Curvey is Vice Chairman (2007-present) and Director of FMR LLC (diversified financial services company). In addition, Mr. Curvey is an Overseer Emeritus for the Boston Symphony Orchestra, a Director of Artis-Naples, and a Trustee of Brewster Academy in Wolfeboro, New Hampshire. Previously, Mr. Curvey served as a Director of Fidelity Research & Analysis Co. (investment adviser firm, 2009-2018), Director of Fidelity Investments Money Management, Inc. (investment adviser firm, 2009-2014) and a Director of FMR and FMR Co., Inc. (investment adviser firms, 2007-2014).
Charles S. Morrison (1960)
Year of Election or Appointment: 2014
Trustee
Mr. Morrison also serves as Trustee of other funds. He serves as President of Fidelity SelectCo, LLC (investment adviser firm, 2017-present) and Fidelity Management & Research Company (FMR) (investment adviser firm, 2016-present), a Director of Fidelity Investments Money Management, Inc. (FIMM) (investment adviser firm, 2014-present), Director of Fidelity SelectCo, LLC (investment adviser firm, 2014-present), President, Asset Management (2014-present), and is an employee of Fidelity Investments. Previously, Mr. Morrison served as Vice President of Fidelity's Fixed Income and Asset Allocation Funds (2012-2014), President, Fixed Income (2011-2014), Vice President of Fidelity's Money Market Funds (2005-2009), President, Money Market Group Leader of FMR (investment adviser firm, 2009), and Senior Vice President, Money Market Group of FMR (2004-2009). Mr. Morrison also served as Vice President of Fidelity's Bond Funds (2002-2005), certain Balanced Funds (2002-2005), and certain Asset Allocation Funds (2002-2007), and as Senior Vice President (2002-2005) of Fidelity's Bond Division.
* Determined to be an “Interested Trustee” by virtue of, among other things, his or her affiliation with the trust or various entities under common control with FMR.
+ The information includes the Trustee's principal occupation during the last five years and other information relating to the experience, attributes, and skills relevant to the Trustee's qualifications to serve as a Trustee, which led to the conclusion that the Trustee should serve as a Trustee for the fund.
Independent Trustees:
Correspondence intended for an Independent Trustee may be sent to Fidelity Investments, P.O. Box 55235, Boston, Massachusetts 02205-5235.
Name, Year of Birth; Principal Occupations and Other Relevant Experience+
Dennis J. Dirks (1948)
Year of Election or Appointment: 2005
Trustee
Mr. Dirks also serves as Trustee of other Fidelity® funds. Prior to his retirement in May 2003, Mr. Dirks was Chief Operating Officer and a member of the Board of The Depository Trust & Clearing Corporation (DTCC). He also served as President, Chief Operating Officer, and Board member of The Depository Trust Company (DTC) and President and Board member of the National Securities Clearing Corporation (NSCC). In addition, Mr. Dirks served as Chief Executive Officer and Board member of the Government Securities Clearing Corporation, Chief Executive Officer and Board member of the Mortgage-Backed Securities Clearing Corporation, as a Trustee and a member of the Finance Committee of Manhattan College (2005-2008), as a Trustee and a member of the Finance Committee of AHRC of Nassau County (2006-2008), as a member of the Independent Directors Council (IDC) Governing Council (2010-2015), and as a member of the Board of Directors for The Brookville Center for Children’s Services, Inc. (2009-2017). Mr. Dirks is a member of the Finance Committee (2016-present), Board of Directors (2017-present) and Board of Trustees (2018-present) and is Treasurer (2018-present) of the Asolo Repertory Theatre.
Donald F. Donahue (1950)
Year of Election or Appointment: 2018
Trustee
Mr. Donahue also serves as a Trustee of other Fidelity® funds. Mr. Donahue is President and Chief Executive Officer of Miranda Partners, LLC (risk consulting for the financial services industry, 2012-present). Previously, Mr. Donahue served as a Member of the Advisory Board of certain Fidelity® funds (2015-2018) and Chief Executive Officer (2006-2012), Chief Operating Officer (2003-2006), and Managing Director, Customer Marketing and Development (1999-2003) of The Depository Trust & Clearing Corporation (financial markets infrastructure). Mr. Donahue serves as a Member (2007-present) and Co-Chairman (2016-present) of the Board of Directors of United Way of New York, Member of the Board of Directors of NYC Leadership Academy (2012-present) and Member of the Board of Advisors of Ripple Labs, Inc. (financial services, 2015-present). He also served as Chairman (2010-2012) and Member of the Board of Directors (2012-2013) of Omgeo, LLC (financial services), Treasurer of United Way of New York (2012-2016), and Member of the Board of Directors of XBRL US (financial services non-profit, 2009-2012) and the International Securities Services Association (2009-2012).
Alan J. Lacy (1953)
Year of Election or Appointment: 2008
Trustee
Mr. Lacy also serves as Trustee of other Fidelity® funds. Mr. Lacy serves as a Director of Bristol-Myers Squibb Company (global pharmaceuticals, 2008-present). He is a Trustee of the California Chapter of The Nature Conservancy (2015-present) and a Director of the Center for Advanced Study in the Behavioral Sciences at Stanford University (2015-present). In addition, Mr. Lacy served as Senior Adviser (2007-2014) of Oak Hill Capital Partners, L.P. (private equity) and also served as Chief Executive Officer (2005) and Vice Chairman (2005-2006) of Sears Holdings Corporation (retail) and Chief Executive Officer and Chairman of the Board of Sears, Roebuck and Co. (retail, 2000-2005). Previously, Mr. Lacy served as Chairman (2014-2017) and a member (2010-2017) of the Board of Directors of Dave & Buster’s Entertainment, Inc. (restaurant and entertainment complexes), as Chairman (2008-2011) and a member (2006-2015) of the Board of Trustees of the National Parks Conservation Association, and as a member of the Board of Directors for The Hillman Companies, Inc. (hardware wholesalers, 2010-2014), Earth Fare, Inc. (retail grocery, 2010-2014), and The Western Union Company (global money transfer, 2006-2011).
Ned C. Lautenbach (1944)
Year of Election or Appointment: 2000
Trustee
Chairman of the Independent Trustees
Mr. Lautenbach also serves as Trustee of other Fidelity® funds. Mr. Lautenbach currently serves as Vice Chair of the Board of Governors, State University System of Florida (2013-present) and is a member of the Council on Foreign Relations (1994-present). He is also a member and has most recently served as Chairman of the Board of Directors of Artis-Naples (2012-present). Previously, Mr. Lautenbach served as a member and then Lead Director of the Board of Directors of Eaton Corporation (diversified industrial, 1997-2016). He was also a Partner and Advisory Partner at Clayton, Dubilier & Rice, LLC (private equity investment, 1998-2010), as well as a Director of Sony Corporation (2006-2007). In addition, Mr. Lautenbach also had a 30-year career with IBM (technology company) during which time he served as Senior Vice President and a member of the Corporate Executive Committee (1968-1998).
Joseph Mauriello (1944)
Year of Election or Appointment: 2008
Trustee
Mr. Mauriello also serves as Trustee of other Fidelity® funds. Prior to his retirement in January 2006, Mr. Mauriello served in numerous senior management positions including Deputy Chairman and Chief Operating Officer (2004-2005), and Vice Chairman of Financial Services (2002-2004) of KPMG LLP US (professional services, 1965-2005). Mr. Mauriello currently serves as a member of the Board of Directors of XL Group plc. (global insurance and re-insurance, 2006-present) and the Independent Directors Council (IDC) Governing Council (2015-present). Previously, Mr. Mauriello served as a Director of the Hamilton Funds of the Bank of New York (2006-2007) and of Arcadia Resources Inc. (health care services and products, 2007-2012).
Cornelia M. Small (1944)
Year of Election or Appointment: 2005
Trustee
Ms. Small also serves as Trustee of other Fidelity® funds. Ms. Small is a member of the Board of Directors (2009-present) and Chair of the Investment Committee (2010-present) of the Teagle Foundation. Ms. Small also serves on the Investment Committee of the Berkshire Taconic Community Foundation (2008-present). Previously, Ms. Small served as Chairperson (2002-2008) and a member of the Investment Committee and Chairperson (2008-2012) and a member of the Board of Trustees of Smith College. In addition, Ms. Small served as Chief Investment Officer, Director of Global Equity Investments, and a member of the Board of Directors of Scudder, Stevens & Clark and Scudder Kemper Investments.
Garnett A. Smith (1947)
Year of Election or Appointment: 2018
Trustee
Mr. Smith also serves as Trustee of other Fidelity® funds. Prior to Mr. Smith's retirement, he served as Chairman and Chief Executive Officer of Inbrand Corp. (manufacturer of personal absorbent products, 1990-1997). He also served as President (1986-1990) of Inbrand Corp. Prior to his employment with Inbrand Corp., he was employed by a retail fabric chain and North Carolina National Bank. In addition, Mr. Smith served as a Member of the Advisory Board of certain Fidelity® funds (2012-2013) and as a board member of the Jackson Hole Land Trust (2009-2012).
David M. Thomas (1949)
Year of Election or Appointment: 2008
Trustee
Mr. Thomas also serves as Trustee of other Fidelity® funds. Mr. Thomas serves as Non-Executive Chairman of the Board of Directors of Fortune Brands Home and Security (home and security products, 2011-present), as a member of the Board of Directors (2004-present) and Presiding Director (2013-present) of Interpublic Group of Companies, Inc. (marketing communication), and as a member of the Board of Trustees of the University of Florida (2013-present). Previously, Mr. Thomas served as Executive Chairman (2005-2006) and Chairman and Chief Executive Officer (2000-2005) of IMS Health, Inc. (pharmaceutical and healthcare information solutions), and a Director of Fortune Brands, Inc. (consumer products, 2000-2011).
+ The information includes the Trustee's principal occupation during the last five years and other information relating to the experience, attributes, and skills relevant to the Trustee's qualifications to serve as a Trustee, which led to the conclusion that the Trustee should serve as a Trustee for the fund.
Advisory Board Members and Officers:
Correspondence intended for a Member of the Advisory Board (if any) may be sent to Fidelity Investments, P.O. Box 55235, Boston, Massachusetts 02205-5235. Correspondence intended for an officer or Peter S. Lynch may be sent to Fidelity Investments, 245 Summer Street, Boston, Massachusetts 02210. Officers appear below in alphabetical order.
Name, Year of Birth; Principal Occupation
Peter S. Lynch (1944)
Year of Election or Appointment: 2003
Member of the Advisory Board
Mr. Lynch also serves as Member of the Advisory Board of other Fidelity® funds. Mr. Lynch is Vice Chairman and a Director of FMR (investment adviser firm) and FMR Co., Inc. (investment adviser firm). In addition, Mr. Lynch serves as a Trustee of Boston College and as the Chairman of the Inner-City Scholarship Fund. Previously, Mr. Lynch served on the Special Olympics International Board of Directors (1997-2006).
William S. Stavropoulos (1939)
Year of Election or Appointment: 2018
Member of the Advisory Board
Mr. Stavropoulos also serves as Member of the Advisory Board of other Fidelity® funds. Mr. Stavropoulos serves as President and Founder of the Michigan Baseball Foundation, the Great Lakes Loons (2007-present). Mr. Stavropoulos is Chairman Emeritus of the Board of Directors of The Dow Chemical Company, where he previously served in numerous senior management positions, including President, CEO (1995-2000; 2002-2004), Chairman of the Executive Committee (2000-2006), and as a member of the Board of Directors (1990-2006). Currently, Mr. Stavropoulos is Chairman of the Board of Directors of Univar Inc. (global distributor of commodity and specialty chemicals), a Director of Teradata Corporation (data warehousing and technology solutions), and a member of the Advisory Board for Metalmark Capital LLC (private equity investment, 2005-present). Mr. Stavropoulos is an operating advisor to Clayton, Dubilier & Rice, LLC (private equity investment). In addition, Mr. Stavropoulos is a member of the University of Notre Dame Advisory Council for the College of Science, a Trustee of the Rollin L. Gerstacker Foundation, and a Director of Artis-Naples in Naples, Florida. Previously, Mr. Stavropoulos served as Trustee of certain Fidelity® funds (2001-2018) and as a Director of Chemical Financial Corporation (bank holding company, 1993-2012) and Tyco International, Ltd. (multinational manufacturing and services, 2007-2012).
Carol B. Tomé (1957)
Year of Election or Appointment: 2018
Member of the Advisory Board
Ms. Tomé also serves as Member of the Advisory Board of other Fidelity® funds. Ms. Tomé is Chief Financial Officer (2001-present) and Executive Vice President of Corporate Services (2007-present) of The Home Depot, Inc. (home improvement retailer) and a Director (2003-present) and Chair of the Audit Committee (2004-present) of United Parcel Service, Inc. (package delivery and supply chain management). Previously, Ms. Tomé served as Trustee of certain Fidelity® funds (2017), Senior Vice President of Finance and Accounting/Treasurer (2000-2007) and Vice President and Treasurer (1995-2000) of The Home Depot, Inc. and Chair of the Board (2010-2012), Vice Chair of the Board (2009 and 2013), and a Director (2008-2013) of the Federal Reserve Bank of Atlanta. Ms. Tomé is also a director or trustee of many community and professional organizations.
Michael E. Wiley (1950)
Year of Election or Appointment: 2018
Member of the Advisory Board
Mr. Wiley also serves as Trustee or Member of the Advisory Board of other Fidelity® funds. Mr. Wiley serves as a Director of Andeavor Corporation (independent oil refiner and marketer, 2005-present), a Director of Andeavor Logistics LP (natural resources logistics, 2015-present), and a Director of Bill Barrett Corporation (exploration and production, 2005-present). In addition, Mr. Wiley also serves as a Director of Post Oak Bank (privately-held bank, 2004-present). Previously, Mr. Wiley served as a Trustee of other Fidelity® funds (2008-2013), as a Director of Asia Pacific Exploration Consolidated (international oil and gas exploration and production, 2008-2013), as a member of the Board of Trustees of the University of Tulsa (2000-2006; 2007-2010), as a Senior Energy Advisor of Katzenbach Partners, LLC (consulting, 2006-2007), as an Advisory Director of Riverstone Holdings (private investment), Chairman, President, and CEO of Baker Hughes, Inc. (oilfield services, 2000-2004), and as Director of Spinnaker Exploration Company (exploration and production, 2001-2005).
Elizabeth Paige Baumann (1968)
Year of Election or Appointment: 2017
Anti-Money Laundering (AML) Officer
Ms. Baumann also serves as AML Officer of other funds. She is Chief AML Officer (2012-present) and Senior Vice President (2014-present) of FMR LLC (diversified financial services company) and is an employee of Fidelity Investments. Previously, Ms. Baumann served as AML Officer of the funds (2012-2016), and Vice President (2007-2014) and Deputy Anti-Money Laundering Officer (2007-2012) of FMR LLC.
Marc R. Bryant (1966)
Year of Election or Appointment: 2015
Secretary and Chief Legal Officer (CLO)
Mr. Bryant also serves as Secretary and CLO of other funds. Mr. Bryant serves as CLO, Secretary, and Senior Vice President of Fidelity Management & Research Company (investment adviser firm, 2015-present) and FMR Co., Inc. (investment adviser firm, 2015-present); Secretary of Fidelity SelectCo, LLC (investment adviser firm, 2015-present) and Fidelity Investments Money Management, Inc. (investment adviser firm, 2015-present); and CLO of Fidelity Management & Research (Hong Kong) Limited and FMR Investment Management (UK) Limited (investment adviser firms, 2015-present) and Fidelity Management & Research (Japan) Limited (investment adviser firm, 2016-present). He is Senior Vice President and Deputy General Counsel of FMR LLC (diversified financial services company). Previously, Mr. Bryant served as Secretary and CLO of Fidelity Rutland Square Trust II (2010-2014) and Assistant Secretary of Fidelity's Fixed Income and Asset Allocation Funds (2013-2015). Prior to joining Fidelity Investments, Mr. Bryant served as a Senior Vice President and the Head of Global Retail Legal for AllianceBernstein L.P. (2006-2010), and as the General Counsel for ProFund Advisors LLC (2001-2006).
John J. Burke III (1964)
Year of Election or Appointment: 2018
Chief Financial Officer
Mr. Burke also serves as Chief Financial Officer of other funds. Mr. Burke serves as Head of Investment Operations for Fidelity Fund and Investment Operations (2018-present) and is an employee of Fidelity Investments (1998-present). Previously Mr. Burke served as head of Asset Management Investment Operations (2012-2018).
William C. Coffey (1969)
Year of Election or Appointment: 2009
Assistant Secretary
Mr. Coffey also serves as Assistant Secretary of other funds. He is Senior Vice President and Deputy General Counsel of FMR LLC (diversified financial services company, 2010-present), and is an employee of Fidelity Investments. Previously, Mr. Coffey served as Vice President and Associate General Counsel of FMR LLC (2005-2009).
Timothy M. Cohen (1969)
Year of Election or Appointment: 2018
Vice President
Mr. Cohen also serves as Vice President of other funds. Mr. Cohen serves as Co-Head of Global Equity Research (2016-present), a Director of Fidelity Management & Research (Japan) Limited (investment adviser firm, 2016-present), and is an employee of Fidelity Investments. Previously, Mr. Cohen served as Chief Investment Officer - Equity and a Director of Fidelity Management & Research (U.K.) Inc. (investment adviser firm, 2013-2015) and as a Director of Fidelity Management & Research (Hong Kong) Limited (investment adviser firm, 2017).
Jonathan Davis (1968)
Year of Election or Appointment: 2010
Assistant Treasurer
Mr. Davis also serves as Assistant Treasurer of other funds. Mr. Davis serves as Assistant Treasurer of FMR Capital, Inc. (2017-present) and is an employee of Fidelity Investments. Previously, Mr. Davis served as Vice President and Associate General Counsel of FMR LLC (diversified financial services company, 2003-2010).
Adrien E. Deberghes (1967)
Year of Election or Appointment: 2016
Assistant Treasurer
Mr. Deberghes also serves as an officer of other funds. He serves as Assistant Treasurer of FMR Capital, Inc. (2017-present), Executive Vice President of Fidelity Investments Money Management, Inc. (FIMM) (investment adviser firm, 2016-present), and is an employee of Fidelity Investments (2008-present). Previously, Mr. Deberghes served as President and Treasurer of certain Fidelity® funds (2013-2018). Prior to joining Fidelity Investments, Mr. Deberghes was Senior Vice President of Mutual Fund Administration at State Street Corporation (2007-2008), Senior Director of Mutual Fund Administration at Investors Bank & Trust (2005-2007), and Director of Finance for Dunkin' Brands (2000-2005). Previously, Mr. Deberghes served in other fund officer roles.
Laura M. Del Prato (1964)
Year of Election or Appointment: 2018
Assistant Treasurer
Ms. Del Prato also serves as an officer of other funds. Ms. Del Prato is an employee of Fidelity Investments (2017-present). Prior to joining Fidelity Investments, Ms. Del Prato served as a Managing Director and Treasurer of the JPMorgan Mutual Funds (2014-2017). Prior to JPMorgan, Ms. Del Prato served as a partner at Cohen Fund Audit Services (accounting firm, 2012-2013) and KPMG LLP (accounting firm, 2004-2012).
Colm A. Hogan (1973)
Year of Election or Appointment: 2016
Deputy Treasurer
Mr. Hogan also serves as an officer of other funds. Mr. Hogan serves as Assistant Treasurer of FMR Capital, Inc. (2017-present) and is an employee of Fidelity Investments (2005-present). Previously, Mr. Hogan served as Assistant Treasurer of certain Fidelity® funds (2016-2018).
Pamela R. Holding (1964)
Year of Election or Appointment: 2018
Vice President
Ms. Holding also serves as a Vice President of other funds. Ms. Holding serves as Co-Head of Global Equity Research (2018-present) and is an employee of Fidelity Investments (2013-present).
Chris Maher (1972)
Year of Election or Appointment: 2013
Assistant Treasurer
Mr. Maher serves as Assistant Treasurer of other funds. Mr. Maher is Vice President of Valuation Oversight, serves as Assistant Treasurer of FMR Capital, Inc. (2017-present), and is an employee of Fidelity Investments. Previously, Mr. Maher served as Vice President of Asset Management Compliance (2013), Vice President of the Program Management Group of FMR (investment adviser firm, 2010-2013), and Vice President of Valuation Oversight (2008-2010).
Rieco E. Mello (1969)
Year of Election or Appointment: 2017
Assistant Treasurer
Mr. Mello also serves as Assistant Treasurer of other funds. Mr. Mello serves as Assistant Treasurer of FMR Capital, Inc. (2017-present) and is an employee of Fidelity Investments (1995-present).
Kenneth B. Robins (1969)
Year of Election or Appointment: 2016
Chief Compliance Officer
Mr. Robins also serves as an officer of other funds. Mr. Robins serves as Compliance Officer of Fidelity Management & Research Company and FMR Co., Inc. (investment adviser firms, 2016-present) and is an employee of Fidelity Investments (2004-present). Previously, Mr. Robins served as Executive Vice President of Fidelity Investments Money Management, Inc. (investment adviser firm, 2013-2016) and served in other fund officer roles.
Stacie M. Smith (1974)
Year of Election or Appointment: 2016
President and Treasurer
Ms. Smith also serves as an officer of other funds. Ms. Smith serves as Assistant Treasurer of FMR Capital, Inc. (2017-present), is an employee of Fidelity Investments (2009-present), and has served in other fund officer roles. Prior to joining Fidelity Investments, Ms. Smith served as Senior Audit Manager of Ernst & Young LLP (accounting firm, 1996-2009). Previously, Ms. Smith served as Assistant Treasurer (2013-2018) and Deputy Treasurer (2013-2016) of certain Fidelity® funds.
Marc L. Spector (1972)
Year of Election or Appointment: 2016
Assistant Treasurer
Mr. Spector also serves as an officer of other funds. Mr. Spector serves as Assistant Treasurer of FMR Capital, Inc. (2017-present) and is an employee of Fidelity Investments (2016-present). Prior to joining Fidelity Investments, Mr. Spector served as Director at the Siegfried Group (accounting firm, 2013-2016), and prior to Siegfried Group as audit senior manager at Deloitte & Touche (accounting firm, 2005-2013).
Renee Stagnone (1975)
Year of Election or Appointment: 2016
Assistant Treasurer
Ms. Stagnone also serves as an officer of other funds. Ms. Stagnone serves as Assistant Treasurer of FMR Capital, Inc. (2017-present) and is an employee of Fidelity Investments (1997-present). Previously, Ms. Stagnone served as Deputy Treasurer of certain Fidelity® funds (2013-2016).
Shareholder Expense Example
As a shareholder of the Fund, you incur two types of costs: (1) transaction costs and (2) ongoing costs, including other Fund expenses. This Example is intended to help you understand your ongoing costs (in dollars) of investing in the Fund and to compare these costs with the ongoing costs of investing in other mutual funds.
The Example is based on an investment of $1,000 invested at the beginning of the period and held for the entire period (February 1, 2018 to July 31, 2018).
Actual Expenses
The first line of the accompanying table provides information about actual account values and actual expenses. You may use the information in this line, together with the amount you invested, to estimate the expenses that you paid over the period. Simply divide your account value by $1,000.00 (for example, an $8,600 account value divided by $1,000.00 = 8.6), then multiply the result by the number in the first line under the heading entitled "Expenses Paid During Period" to estimate the expenses you paid on your account during this period. In addition, the Fund, as a shareholder in the underlying Fidelity Central Funds, will indirectly bear its pro-rata share of the fees and expenses incurred by the underlying Fidelity Central Funds. These fees and expenses are not included in the Fund's annualized expense ratio used to calculate the expense estimate in the table below.
Hypothetical Example for Comparison Purposes
The second line of the accompanying table provides information about hypothetical account values and hypothetical expenses based on the Fund's actual expense ratio and an assumed rate of return of 5% per year before expenses, which is not the Fund's actual return. The hypothetical account values and expenses may not be used to estimate the actual ending account balance or expenses you paid for the period. You may use this information to compare the ongoing costs of investing in the Fund and other funds. To do so, compare this 5% hypothetical example with the 5% hypothetical examples that appear in the shareholder reports of the other funds. In addition, the Fund, as a shareholder in the underlying Fidelity Central Funds, will indirectly bear its pro-rata share of the fees and expenses incurred by the underlying Fidelity Central Funds. These fees and expenses are not included in the Fund's annualized expense ratio used to calculate the expense estimate in the table below.
Please note that the expenses shown in the table are meant to highlight your ongoing costs only and do not reflect any transaction costs. Therefore, the second line of the table is useful in comparing ongoing costs only, and will not help you determine the relative total costs of owning different funds.
| | Annualized Expense Ratio-A | Beginning
Account Value
February 1, 2018 | Ending
Account Value
July 31, 2018 | Expenses Paid
During Period-B
February 1, 2018
to July 31, 2018 |
| Series Real Estate Income | - %-C | | | |
| Actual | | $1,000.00 | $1,034.80 | $--D |
| Hypothetical-E | | $1,000.00 | $1,024.79 | $--D |
A Annualized expense ratio reflects expenses net of applicable fee waivers.
B Expenses are equal to the Fund's annualized expense ratio, multiplied by the average account value over the period, multiplied by 181/365 (to reflect the one-half year period).
C Amount represents less than .005%.
D Amount represents less than $.005.
E 5% return per year before expenses
Distributions (Unaudited)
The Board of Trustees of Fidelity Series Real Estate Income Fund voted to pay on September 10, 2018, to shareholders of record at the opening of business on September 7, 2018, a distribution of $0.144 per share derived from capital gains realized from sales of portfolio securities and a dividend of $0.151 per share from net investment income.
The fund hereby designates as a capital gain dividend with respect to the taxable year ended July 31, 2018, $ 15,630,175, or, if subsequently determined to be different, the net capital gain of such year.
A total of 0.23% of the dividends distributed during the fiscal year was derived from interest on U.S. Government securities which is generally exempt from state income tax.
The fund will notify shareholders in January 2019 of amounts for use in preparing 2018 income tax returns.
Board Approval of Investment Advisory Contracts and Management Fees
Fidelity Series Real Estate Income Fund
At its July 2018 meeting, the Board of Trustees, including the Independent Trustees (together, the Board), voted to continue the management contract with Fidelity Management & Research Company (FMR) and the sub-advisory agreements (together, the Advisory Contracts) for the fund for six months through January 31, 2019, in connection with the reunification of the Fidelity Equity High Income Funds Board, which oversees the fund, and the Sector Portfolios Board.
The Board considered that the approval of the fund's Advisory Contracts will not result in any changes in (i) the investment process or strategies employed in the management of the fund's assets; (ii) the fees and expenses paid by shareholders, including the expense cap arrangement currently in place for the fund; (iii) the nature, extent or quality of services provided under the fund's Advisory Contracts; or (iv) the day-to-day management of the fund or the persons primarily responsible for such management. The Board concluded that the fund's Advisory Contracts are fair and reasonable, and that the fund's Advisory Contracts should be renewed, without modification, through January 31, 2019, with the understanding that the Board will consider the annual renewal for a full one year period in January 2019.
In connection with its consideration of future renewals of the fund's Advisory Contracts, the Board will consider: (i) the nature, extent and quality of services provided to the fund, including shareholder and administrative services and investment performance; (ii) the competitiveness of the management fee and total expenses for the fund; (iii) the costs of the services and profitability, including the revenues earned and the expenses incurred in conducting the business of developing, marketing, distributing, managing, administering, and servicing the fund and its shareholders, to the extent applicable, as well as potential fall-out benefits from Fidelity's non-fund businesses; and (iv) whether there have been economies of scale in respect of the Fidelity funds, whether the Fidelity funds (including the fund) have appropriately benefited from any such economies of scale, and whether there is the potential for realization of any further economies.
Based on its evaluation of all of the conclusions noted above, and after considering all factors it believed relevant, the Board ultimately concluded that the fund's management fee structure is fair and reasonable, and that the continuation of the fund's Advisory Contracts should be approved.
Corporate Headquarters
245 Summer St.
Boston, MA 02210
www.fidelity.com
SRE-ANN-0918
1.924310.106
Fidelity® Series Blue Chip Growth Fund
Annual Report July 31, 2018 |
|
Contents
To view a fund's proxy voting guidelines and proxy voting record for the 12-month period ended June 30, visit http://www.fidelity.com/proxyvotingresults or visit the Securities and Exchange Commission's (SEC) web site at http://www.sec.gov.
You may also call 1-800-544-8544 to request a free copy of the proxy voting guidelines.
Standard & Poor's, S&P and S&P 500 are registered service marks of The McGraw-Hill Companies, Inc. and have been licensed for use by Fidelity Distributors Corporation.
Other third-party marks appearing herein are the property of their respective owners.
All other marks appearing herein are registered or unregistered trademarks or service marks of FMR LLC or an affiliated company. © 2018 FMR LLC. All rights reserved.
This report and the financial statements contained herein are submitted for the general information of the shareholders of the Fund. This report is not authorized for distribution to prospective investors in the Fund unless preceded or accompanied by an effective prospectus.
A fund files its complete schedule of portfolio holdings with the SEC for the first and third quarters of each fiscal year on Form N-Q. Forms N-Q are available on the SEC’s web site at http://www.sec.gov. A fund's Forms N-Q may be reviewed and copied at the SEC’s Public Reference Room in Washington, DC. Information regarding the operation of the SEC's Public Reference Room may be obtained by calling 1-800-SEC-0330.
For a complete list of a fund's portfolio holdings, view the most recent holdings listing, semiannual report, or annual report on Fidelity's web site at http://www.fidelity.com, http://www.institutional.fidelity.com, or http://www.401k.com, as applicable.
NOT FDIC INSURED •MAY LOSE VALUE •NO BANK GUARANTEE
Neither the Fund nor Fidelity Distributors Corporation is a bank.
Performance: The Bottom Line
Average annual total return reflects the change in the value of an investment, assuming reinvestment of distributions from dividend income and capital gains (the profits earned upon the sale of securities that have grown in value, if any) and assuming a constant rate of performance each year. The hypothetical investment and the average annual total returns do not reflect the deduction of taxes that a shareholder would pay on fund distributions or the redemption of fund shares. During periods of reimbursement by Fidelity, a fund’s total return will be greater than it would be had the reimbursement not occurred. How a fund did yesterday is no guarantee of how it will do tomorrow.
Average Annual Total Returns
| For the periods ended July 31, 2018 | Past 1 year | Life of fundA |
| Fidelity® Series Blue Chip Growth Fund | 26.54% | 16.65% |
A From November 7, 2013
$10,000 Over Life of Fund
Let's say hypothetically that $10,000 was invested in Fidelity® Series Blue Chip Growth Fund on November 7, 2013, when the fund started.
The chart shows how the value of your investment would have changed, and also shows how the Russell 1000® Growth Index performed over the same period.
| Period Ending Values |
| $20,724 | Fidelity® Series Blue Chip Growth Fund |
| $19,620 | Russell 1000® Growth Index |
Management's Discussion of Fund Performance
Market Recap: The U.S. equity bellwether S&P 500
® index gained 16.24% for the 12 months ending July 31, 2018, despite a resurgence in volatility that challenged the multiyear bull market. Stocks maintained their steady growth until a sharp reversal in February, as volatility spiked amid fear that rising inflation and the potential for the economy to overheat would prompt the U.S. Federal Reserve to pick up the pace of interest rate hikes. The index posted its first negative monthly result since October 2016, and then lost further ground in March on fear of a global trade war. The market stabilized in April and turned upward through mid-June, when escalating trade tension between the U.S. and China soured investor sentiment. The resulting uncertainty lingered into July, but strong corporate earnings helped the S&P 500 rise 3.72% that month to cap the period. For the full one-year period, growth handily topped value, while small-caps bested large-caps. By sector, information technology (+28%) led the way, boosted by strong earnings growth from several major index constituents. Consumer discretionary rose roughly 24%, driven by retailers (+49%). Energy (+20%) gained alongside higher oil prices. Laggards were telecommunication services (-2%), consumer staples (0%) and utilities (+3%), defensive groups that struggled amid rising interest rates and a general preference for risk. Real estate (+5%) fared a bit better but still lagged, as did financials, industrials, health care (each up 13%) and materials (+11%).
Comments from Portfolio Manager Sonu Kalra: For the year, the fund rose 26.54%, ahead of the 22.84% gain of the benchmark Russell 1000
® Growth Index. Choices in the consumer sectors of the market added the most relative value. It also helped to overweight strong-performing consumer discretionary and underweight weaker-performing consumer staples. JUUL Labs, an out-of-index investment, contributed more than any other single position by far this period. The firm has emerged as a leader in the rapidly growing electronic cigarette market. Its disruptive technology is intended to offer smokers a potentially safer alternative to tar-burning cigarettes. JUUL's success in penetrating the U.S. market supported a higher estimate of fair value for this position. It is not publicly traded. Competition in this space is likely to increase. The firm and the industry face a number of social and public policy concerns. E-commerce giant Amazon.com was another significant contributor and also was the fund’s second largest holding on July 31. Choices in information technology and health care hurt. Our biggest individual detractor was ride-share, taxi and food delivery firm Uber Technologies. Past scandals continued to cast a shadow over the firm’s image, while intensifying competition also hurt the privately held company’s valuation.
The views expressed above reflect those of the portfolio manager(s) only through the end of the period as stated on the cover of this report and do not necessarily represent the views of Fidelity or any other person in the Fidelity organization. Any such views are subject to change at any time based upon market or other conditions and Fidelity disclaims any responsibility to update such views. These views may not be relied on as investment advice and, because investment decisions for a Fidelity fund are based on numerous factors, may not be relied on as an indication of trading intent on behalf of any Fidelity fund.
Investment Summary (Unaudited)
Top Ten Stocks as of July 31, 2018
| | % of fund's net assets |
| Alphabet, Inc. Class A | 8.3 |
| Amazon.com, Inc. | 6.5 |
| Apple, Inc. | 6.4 |
| Facebook, Inc. Class A | 3.8 |
| Microsoft Corp. | 3.4 |
| JUUL Labs, Inc. Series C | 2.7 |
| NVIDIA Corp. | 2.7 |
| Salesforce.com, Inc. | 2.3 |
| Tesla, Inc. | 2.1 |
| Uber Technologies, Inc. Series D, 8.00% | 1.7 |
| | 39.9 |
Top Five Market Sectors as of July 31, 2018
| | % of fund's net assets |
| Information Technology | 45.3 |
| Consumer Discretionary | 25.2 |
| Health Care | 10.9 |
| Consumer Staples | 5.3 |
| Industrials | 4.8 |
Asset Allocation (% of fund's net assets)
| As of July 31, 2018* |
| | Stocks | 93.8% |
| | Convertible Securities | 6.1% |
| | Short-Term Investments and Net Other Assets (Liabilities) | 0.1% |

* Foreign investments - 9.2%
Schedule of Investments July 31, 2018
Showing Percentage of Net Assets
| Common Stocks - 93.8% | | | |
| | | Shares | Value |
| CONSUMER DISCRETIONARY - 24.7% | | | |
| Auto Components - 0.1% | | | |
| Aptiv PLC | | 35,000 | $3,432,450 |
| Veoneer, Inc. (a) | | 25,900 | 1,354,570 |
| | | | 4,787,020 |
| Automobiles - 2.1% | | | |
| Tesla, Inc. (a)(b) | | 424,737 | 126,631,089 |
| Diversified Consumer Services - 0.3% | | | |
| Chegg, Inc. (a) | | 87,700 | 2,429,290 |
| Grand Canyon Education, Inc. (a) | | 13,800 | 1,608,114 |
| New Oriental Education & Technology Group, Inc. sponsored ADR | | 119,200 | 10,255,968 |
| Weight Watchers International, Inc. (a) | | 55,800 | 4,995,774 |
| | | | 19,289,146 |
| Hotels, Restaurants & Leisure - 2.0% | | | |
| Accor SA | | 10,600 | 546,376 |
| Alsea S.A.B. de CV | | 358,600 | 1,236,973 |
| Caesars Entertainment Corp. (a) | | 463,400 | 5,236,420 |
| Chipotle Mexican Grill, Inc. (a) | | 36,500 | 15,828,590 |
| Eldorado Resorts, Inc. (a) | | 14,100 | 604,185 |
| Hilton Grand Vacations, Inc. (a) | | 130,500 | 4,513,995 |
| Hilton Worldwide Holdings, Inc. | | 71,700 | 5,639,922 |
| International Game Technology PLC | | 155,800 | 3,938,624 |
| Las Vegas Sands Corp. | | 82,500 | 5,931,750 |
| Marriott International, Inc. Class A | | 83,800 | 10,712,992 |
| McDonald's Corp. | | 93,100 | 14,666,974 |
| Melco Crown Entertainment Ltd. sponsored ADR | | 99,900 | 2,583,414 |
| Planet Fitness, Inc. (a) | | 148,900 | 7,075,728 |
| Restaurant Brands International, Inc. | | 104,000 | 6,634,862 |
| Royal Caribbean Cruises Ltd. | | 100,300 | 11,309,828 |
| Shake Shack, Inc. Class A (a) | | 29,200 | 1,820,036 |
| U.S. Foods Holding Corp. (a) | | 226,500 | 7,657,965 |
| Vail Resorts, Inc. | | 10,000 | 2,768,700 |
| Wyndham Destinations, Inc. | | 84,400 | 3,892,528 |
| Wyndham Hotels & Resorts, Inc. | | 71,300 | 4,135,400 |
| Wynn Resorts Ltd. | | 6,100 | 1,017,358 |
| | | | 117,752,620 |
| Household Durables - 0.2% | | | |
| Forbo Holding AG (Reg.) | | 390 | 617,997 |
| iRobot Corp. (a) | | 8,000 | 634,000 |
| SodaStream International Ltd. (a) | | 123,780 | 10,805,994 |
| | | | 12,057,991 |
| Internet & Direct Marketing Retail - 9.2% | | | |
| Amazon.com, Inc. (a) | | 220,080 | 391,178,995 |
| JD.com, Inc. sponsored ADR (a) | | 718,100 | 25,751,066 |
| Netflix, Inc. (a) | | 233,946 | 78,945,078 |
| The Booking Holdings, Inc. (a) | | 23,500 | 47,674,920 |
| The Honest Co., Inc. (a)(c)(d) | | 71,609 | 823,504 |
| TripAdvisor, Inc. (a) | | 11,500 | 666,885 |
| Wayfair LLC Class A (a) | | 57,100 | 6,213,622 |
| | | | 551,254,070 |
| Media - 0.7% | | | |
| China Literature Ltd. (a)(e) | | 472,574 | 3,952,642 |
| Grupo Televisa SA de CV (CPO) sponsored ADR | | 30,200 | 600,376 |
| The Walt Disney Co. | | 260,400 | 29,571,024 |
| WME Entertainment Parent, LLC Class A (a)(c)(d)(f) | | 3,058,566 | 7,646,415 |
| | | | 41,770,457 |
| Multiline Retail - 1.1% | | | |
| Avenue Supermarts Ltd. (a)(e) | | 34,373 | 830,907 |
| Dollar Tree, Inc. (a) | | 607,700 | 55,470,856 |
| Future Retail Ltd. | | 348,759 | 2,723,438 |
| Macy's, Inc. | | 136,200 | 5,411,226 |
| Ollie's Bargain Outlet Holdings, Inc. (a) | | 45,900 | 3,190,050 |
| V-Mart Retail Ltd. (a) | | 22,763 | 806,231 |
| | | | 68,432,708 |
| Specialty Retail - 4.6% | | | |
| At Home Group, Inc. (a) | | 34,300 | 1,244,061 |
| Burlington Stores, Inc. (a) | | 87,000 | 13,294,470 |
| Five Below, Inc. (a) | | 85,700 | 8,326,612 |
| Floor & Decor Holdings, Inc. Class A (a) | | 93,700 | 4,474,175 |
| Home Depot, Inc. | | 475,600 | 93,940,512 |
| Inditex SA | | 107,924 | 3,536,738 |
| Lowe's Companies, Inc. | | 575,000 | 57,120,500 |
| Michaels Companies, Inc. (a) | | 68,200 | 1,391,962 |
| RH (a)(b) | | 335,818 | 45,624,233 |
| Ross Stores, Inc. | | 165,900 | 14,504,637 |
| TCNS Clothing Co. Ltd. (a) | | 100,259 | 965,538 |
| Tiffany & Co., Inc. | | 51,000 | 7,015,560 |
| TJX Companies, Inc. | | 173,600 | 16,884,336 |
| Ulta Beauty, Inc. (a) | | 13,700 | 3,348,143 |
| Urban Outfitters, Inc. (a) | | 70,600 | 3,134,640 |
| | | | 274,806,117 |
| Textiles, Apparel & Luxury Goods - 4.4% | | | |
| adidas AG | | 98,035 | 21,683,632 |
| Canada Goose Holdings, Inc. (a) | | 99,600 | 5,717,133 |
| Carbon Black, Inc. | | 9,700 | 201,372 |
| Cibus Global Ltd. Series C (c)(d)(f) | | 726,554 | 1,525,763 |
| Crinetics Pharmaceuticals, Inc. (a) | | 28,600 | 703,846 |
| Despegar.com Corp. (b) | | 73,300 | 1,540,766 |
| Gildan Activewear, Inc. | | 22,400 | 577,026 |
| GreenSky, Inc. Class A | | 53,200 | 920,360 |
| Homology Medicines, Inc. (a)(b) | | 24,475 | 431,005 |
| Kering SA | | 71,618 | 38,188,408 |
| lululemon athletica, Inc. (a) | | 532,868 | 63,917,517 |
| LVMH Moet Hennessy - Louis Vuitton SA | | 21,671 | 7,552,085 |
| Michael Kors Holdings Ltd. (a) | | 190,300 | 12,698,719 |
| NIKE, Inc. Class B | | 410,100 | 31,540,791 |
| Pinduoduo, Inc. ADR | | 207,900 | 4,696,461 |
| Prada SpA | | 1,692,300 | 8,052,873 |
| PVH Corp. | | 124,200 | 19,067,184 |
| Rubius Therapeutics, Inc. (a) | | 30,200 | 634,200 |
| Scholar Rock Holding Corp. | | 32,100 | 521,304 |
| Shenzhou International Group Holdings Ltd. | | 153,000 | 1,876,182 |
| Skechers U.S.A., Inc. Class A (sub. vtg.) (a) | | 700,100 | 19,406,772 |
| Tapestry, Inc. | | 178,900 | 8,429,768 |
| Tory Burch LLC (c)(d)(f) | | 106,817 | 7,667,324 |
| Under Armour, Inc. Class C (non-vtg.) (a) | | 201,300 | 3,772,362 |
| VF Corp. | | 67,500 | 6,214,725 |
| | | | 267,537,578 |
|
| TOTAL CONSUMER DISCRETIONARY | | | 1,484,318,796 |
|
| CONSUMER STAPLES - 2.6% | | | |
| Beverages - 1.1% | | | |
| Constellation Brands, Inc. Class A (sub. vtg.) | | 84,600 | 17,785,458 |
| Diageo PLC | | 28,883 | 1,059,645 |
| Fever-Tree Drinks PLC | | 122,084 | 5,520,315 |
| Keurig Dr. Pepper, Inc. | | 235,000 | 5,642,350 |
| Monster Beverage Corp. (a) | | 401,143 | 24,076,603 |
| Pernod Ricard SA | | 3,500 | 564,591 |
| The Coca-Cola Co. | | 179,600 | 8,374,748 |
| | | | 63,023,710 |
| Food & Staples Retailing - 0.8% | | | |
| BJ's Wholesale Club Holdings, Inc. | | 268,600 | 6,658,594 |
| Costco Wholesale Corp. | | 162,000 | 35,431,020 |
| Performance Food Group Co. (a) | | 161,800 | 5,800,530 |
| | | | 47,890,144 |
| Food Products - 0.1% | | | |
| Blue Bottle Coffee, Inc. Class C (Escrow) (c)(d) | | 234,006 | 542,894 |
| Darling International, Inc. (a) | | 132,700 | 2,665,943 |
| Mondelez International, Inc. | | 16,900 | 733,122 |
| The Kraft Heinz Co. | | 48,200 | 2,904,050 |
| | | | 6,846,009 |
| Household Products - 0.1% | | | |
| Energizer Holdings, Inc. | | 79,300 | 5,049,824 |
| Personal Products - 0.5% | | | |
| Coty, Inc. Class A | | 559,200 | 7,498,872 |
| Estee Lauder Companies, Inc. Class A | | 76,800 | 10,363,392 |
| Herbalife Nutrition Ltd. (a) | | 177,476 | 9,163,086 |
| Kose Corp. | | 22,200 | 4,246,818 |
| | | | 31,272,168 |
| Tobacco - 0.0% | | | |
| JUUL Labs, Inc. (d) | | 2,450 | 410,449 |
|
| TOTAL CONSUMER STAPLES | | | 154,492,304 |
|
| ENERGY - 2.4% | | | |
| Oil, Gas & Consumable Fuels - 2.4% | | | |
| Anadarko Petroleum Corp. | | 257,278 | 18,819,886 |
| Andeavor | | 36,300 | 5,447,178 |
| BP PLC sponsored ADR | | 52,875 | 2,384,134 |
| Cenovus Energy, Inc. | | 116,900 | 1,172,729 |
| Continental Resources, Inc. (a) | | 304,364 | 19,439,729 |
| Delek U.S. Holdings, Inc. | | 141,200 | 7,528,784 |
| Diamondback Energy, Inc. | | 74,000 | 9,764,300 |
| EOG Resources, Inc. | | 87,026 | 11,221,132 |
| Extraction Oil & Gas, Inc. (a) | | 200,359 | 3,029,428 |
| Marathon Petroleum Corp. | | 50,000 | 4,041,500 |
| Petronet LNG Ltd. | | 172,492 | 577,367 |
| Phillips 66 Co. | | 5,300 | 653,702 |
| Pioneer Natural Resources Co. | | 61,500 | 11,640,105 |
| Reliance Industries Ltd. | | 846,521 | 14,665,117 |
| Valero Energy Corp. | | 97,000 | 11,479,950 |
| Whiting Petroleum Corp. (a) | | 413,900 | 20,550,135 |
| | | | 142,415,176 |
| FINANCIALS - 3.8% | | | |
| Banks - 1.8% | | | |
| Bank of America Corp. | | 1,284,700 | 39,671,536 |
| Citigroup, Inc. | | 272,489 | 19,589,234 |
| Coastal Financial Corp. of Washington (a) | | 9,700 | 157,528 |
| Cullen/Frost Bankers, Inc. | | 20,400 | 2,253,996 |
| HDFC Bank Ltd. sponsored ADR | | 82,300 | 8,504,882 |
| IndusInd Bank Ltd. | | 44,055 | 1,283,908 |
| JPMorgan Chase & Co. | | 271,672 | 31,228,696 |
| Kotak Mahindra Bank Ltd. | | 138,376 | 2,641,494 |
| | | | 105,331,274 |
| Capital Markets - 1.7% | | | |
| Apollo Global Management LLC Class A | | 57,500 | 2,041,250 |
| BlackRock, Inc. Class A | | 34,200 | 17,194,392 |
| Charles Schwab Corp. | | 292,900 | 14,955,474 |
| E*TRADE Financial Corp. (a) | | 79,300 | 4,742,933 |
| Edelweiss Financial Services Ltd. | | 287,620 | 1,300,088 |
| Fairfax India Holdings Corp. (a)(e) | | 427,900 | 6,889,190 |
| Goldman Sachs Group, Inc. | | 97,400 | 23,125,682 |
| HDFC Asset Management Co. Ltd. (a) | | 403 | 6,475 |
| Monex Group, Inc. | | 188,700 | 938,311 |
| Morgan Stanley | | 255,400 | 12,913,024 |
| MSCI, Inc. | | 13,300 | 2,210,327 |
| TD Ameritrade Holding Corp. | | 277,300 | 15,847,695 |
| Virtu Financial, Inc. Class A | | 113,700 | 2,291,055 |
| | | | 104,455,896 |
| Consumer Finance - 0.0% | | | |
| American Express Co. | | 25,700 | 2,557,664 |
| Diversified Financial Services - 0.3% | | | |
| Allakos, Inc. (a) | | 17,900 | 729,783 |
| Berkshire Hathaway, Inc. Class B (a) | | 69,600 | 13,771,752 |
| GDS Holdings Ltd. ADR (a) | | 21,900 | 478,077 |
| | | | 14,979,612 |
|
| TOTAL FINANCIALS | | | 227,324,446 |
|
| HEALTH CARE - 10.7% | | | |
| Biotechnology - 5.5% | | | |
| AC Immune SA (a) | | 223,136 | 2,153,262 |
| ACADIA Pharmaceuticals, Inc. (a) | | 87,700 | 1,323,393 |
| Acceleron Pharma, Inc. (a) | | 19,900 | 866,844 |
| Agios Pharmaceuticals, Inc. (a) | | 134,323 | 11,606,850 |
| Aimmune Therapeutics, Inc. (a) | | 115,000 | 3,325,800 |
| Alexion Pharmaceuticals, Inc. (a) | | 385,904 | 51,309,796 |
| Alkermes PLC (a) | | 356,759 | 15,643,882 |
| Alnylam Pharmaceuticals, Inc. (a) | | 347,200 | 32,984,000 |
| Amgen, Inc. | | 6,400 | 1,257,920 |
| AnaptysBio, Inc. (a) | | 31,600 | 2,474,912 |
| Arena Pharmaceuticals, Inc. (a) | | 84,000 | 3,241,560 |
| Ascendis Pharma A/S sponsored ADR (a) | | 122,000 | 8,288,680 |
| BeiGene Ltd. ADR (a) | | 29,600 | 5,613,936 |
| Biogen, Inc. (a) | | 8,800 | 2,942,456 |
| bluebird bio, Inc. (a) | | 128,200 | 19,858,180 |
| Blueprint Medicines Corp. (a) | | 14,200 | 845,468 |
| Celgene Corp. (a) | | 51,600 | 4,648,644 |
| Cellectis SA sponsored ADR (a) | | 42,400 | 1,225,360 |
| Chimerix, Inc. (a) | | 27,600 | 123,372 |
| Coherus BioSciences, Inc. (a) | | 185,500 | 3,533,775 |
| CytomX Therapeutics, Inc. (a)(e) | | 137,854 | 3,631,074 |
| CytomX Therapeutics, Inc. (a) | | 53,200 | 1,401,288 |
| DBV Technologies SA sponsored ADR (a) | | 33,900 | 611,217 |
| Deciphera Pharmaceuticals, Inc. (a) | | 15,900 | 546,960 |
| Denali Therapeutics, Inc. (a)(b) | | 178,800 | 2,251,092 |
| Editas Medicine, Inc. (a) | | 130,089 | 3,868,847 |
| Epizyme, Inc. (a) | | 77,100 | 994,590 |
| Exelixis, Inc. (a) | | 270,200 | 5,593,140 |
| FibroGen, Inc. (a) | | 63,500 | 4,006,850 |
| GenSight Biologics SA (a)(e) | | 194,511 | 489,021 |
| Global Blood Therapeutics, Inc. (a) | | 149,900 | 6,265,820 |
| Grifols SA ADR | | 30,900 | 642,102 |
| Heron Therapeutics, Inc. (a) | | 57,900 | 2,168,355 |
| ImmunoGen, Inc. (a) | | 55,500 | 516,150 |
| Insmed, Inc. (a) | | 38,700 | 962,469 |
| Intellia Therapeutics, Inc. (a)(b) | | 117,657 | 3,132,029 |
| Intercept Pharmaceuticals, Inc. (a) | | 94,100 | 8,576,274 |
| Ionis Pharmaceuticals, Inc. (a) | | 62,200 | 2,716,896 |
| Ironwood Pharmaceuticals, Inc. Class A (a) | | 340,200 | 6,559,056 |
| La Jolla Pharmaceutical Co. (a) | | 49,300 | 1,630,351 |
| Madrigal Pharmaceuticals, Inc. (a) | | 2,000 | 514,060 |
| Momenta Pharmaceuticals, Inc. (a) | | 35,300 | 1,044,880 |
| Neurocrine Biosciences, Inc. (a) | | 198,000 | 19,897,020 |
| Portola Pharmaceuticals, Inc. (a) | | 72,100 | 2,581,180 |
| Radius Health, Inc. (a)(b) | | 26,800 | 643,200 |
| Regeneron Pharmaceuticals, Inc. (a) | | 85,280 | 31,383,893 |
| Replimune Group, Inc. (a) | | 42,100 | 631,079 |
| Sage Therapeutics, Inc. (a) | | 127,986 | 18,470,940 |
| Sarepta Therapeutics, Inc. (a) | | 74,800 | 8,694,752 |
| Seres Therapeutics, Inc. (a) | | 17,900 | 135,503 |
| Trevena, Inc. (a) | | 265,000 | 408,100 |
| Ultragenyx Pharmaceutical, Inc. (a) | | 33,600 | 2,658,096 |
| Vertex Pharmaceuticals, Inc. (a) | | 59,600 | 10,432,980 |
| Xencor, Inc. (a) | | 109,200 | 4,064,424 |
| Zai Lab Ltd. ADR | | 45,800 | 1,003,936 |
| | | | 332,395,714 |
| Health Care Equipment & Supplies - 2.4% | | | |
| Align Technology, Inc. (a) | | 12,000 | 4,279,800 |
| Baxter International, Inc. | | 17,000 | 1,231,650 |
| Becton, Dickinson & Co. | | 44,000 | 11,016,280 |
| Boston Scientific Corp. (a) | | 1,310,000 | 44,029,100 |
| Danaher Corp. | | 89,200 | 9,150,136 |
| DexCom, Inc. (a) | | 35,400 | 3,367,602 |
| Edwards Lifesciences Corp. (a) | | 8,600 | 1,225,070 |
| Establishment Labs Holdings, Inc. (a) | | 100,600 | 2,617,612 |
| Fisher & Paykel Healthcare Corp. | | 68,839 | 694,426 |
| Hoya Corp. | | 10,200 | 611,188 |
| Insulet Corp. (a) | | 62,200 | 5,172,552 |
| Intuitive Surgical, Inc. (a) | | 89,200 | 45,330,548 |
| Invuity, Inc. (a)(b) | | 152,600 | 610,400 |
| iRhythm Technologies, Inc. (a) | | 115,700 | 8,741,135 |
| Novocure Ltd. (a) | | 46,000 | 1,564,000 |
| Penumbra, Inc. (a) | | 4,300 | 611,675 |
| Quanterix Corp. (a) | | 38,600 | 578,614 |
| Stryker Corp. | | 4,300 | 701,975 |
| | | | 141,533,763 |
| Health Care Providers & Services - 1.8% | | | |
| Humana, Inc. | | 143,000 | 44,927,740 |
| National Vision Holdings, Inc. | | 126,700 | 5,151,622 |
| Neuronetics, Inc. | | 14,000 | 349,300 |
| OptiNose, Inc. (b) | | 163,324 | 3,323,643 |
| UnitedHealth Group, Inc. | | 204,900 | 51,884,778 |
| | | | 105,637,083 |
| Health Care Technology - 0.1% | | | |
| Evolent Health, Inc. (a) | | 85,900 | 1,735,180 |
| Teladoc, Inc. (a)(b) | | 100,500 | 6,014,925 |
| | | | 7,750,105 |
| Life Sciences Tools & Services - 0.0% | | | |
| Illumina, Inc. (a) | | 2,100 | 681,156 |
| Pharmaceuticals - 0.9% | | | |
| Aclaris Therapeutics, Inc. (a) | | 42,700 | 731,878 |
| Akcea Therapeutics, Inc. | | 207,800 | 6,570,636 |
| Allergan PLC | | 3,500 | 644,315 |
| AstraZeneca PLC sponsored ADR | | 80,600 | 3,153,878 |
| Bausch Health Cos., Inc. (Canada) (a) | | 112,100 | 2,437,054 |
| Bayer AG | | 5,108 | 568,659 |
| Castle Creek Pharmaceuticals, LLC Class A-2 unit (a)(c)(d)(f)(g) | | 9,636 | 4,914,264 |
| Chiasma, Inc. warrants 12/16/24 (a) | | 23,784 | 3,599 |
| Collegium Pharmaceutical, Inc. (a)(b) | | 22,500 | 433,575 |
| Dova Pharmaceuticals, Inc. (a)(b) | | 54,700 | 1,179,879 |
| Intersect ENT, Inc. (a) | | 30,600 | 989,910 |
| Jazz Pharmaceuticals PLC (a) | | 65,700 | 11,371,356 |
| Mylan NV (a) | | 16,800 | 626,808 |
| MyoKardia, Inc. (a) | | 20,700 | 1,188,180 |
| Nektar Therapeutics (a) | | 185,700 | 9,767,820 |
| The Medicines Company (a) | | 170,200 | 6,762,046 |
| Theravance Biopharma, Inc. (a) | | 17,300 | 414,335 |
| Zogenix, Inc. (a) | | 30,000 | 1,702,500 |
| | | | 53,460,692 |
|
| TOTAL HEALTH CARE | | | 641,458,513 |
|
| INDUSTRIALS - 4.6% | | | |
| Aerospace & Defense - 1.5% | | | |
| Bombardier, Inc. Class B (sub. vtg.) (a) | | 2,170,500 | 8,175,770 |
| Elbit Systems Ltd. (b) | | 12,800 | 1,540,096 |
| General Dynamics Corp. | | 37,000 | 7,391,120 |
| Northrop Grumman Corp. | | 77,900 | 23,408,171 |
| Raytheon Co. | | 68,300 | 13,525,449 |
| Space Exploration Technologies Corp.: | | | |
| Class A (a)(c)(d) | | 22,703 | 3,836,807 |
| Class C (c)(d) | | 686 | 115,934 |
| The Boeing Co. | | 80,300 | 28,610,890 |
| United Technologies Corp. | | 29,000 | 3,936,460 |
| | | | 90,540,697 |
| Air Freight & Logistics - 0.3% | | | |
| Expeditors International of Washington, Inc. | | 8,500 | 647,445 |
| XPO Logistics, Inc. (a) | | 146,200 | 14,579,064 |
| | | | 15,226,509 |
| Airlines - 0.8% | | | |
| Delta Air Lines, Inc. | | 275,700 | 15,003,594 |
| Southwest Airlines Co. | | 31,900 | 1,855,304 |
| Spirit Airlines, Inc. (a) | | 289,300 | 12,567,192 |
| United Continental Holdings, Inc. (a) | | 161,600 | 12,992,640 |
| Wizz Air Holdings PLC (a)(e) | | 87,213 | 3,967,580 |
| | | | 46,386,310 |
| Building Products - 0.1% | | | |
| Masco Corp. | | 120,800 | 4,871,864 |
| Commercial Services & Supplies - 0.1% | | | |
| Copart, Inc. (a) | | 28,800 | 1,652,832 |
| Evoqua Water Technologies Corp. (a) | | 84,500 | 1,803,230 |
| HomeServe PLC | | 238,600 | 3,169,325 |
| Tomra Systems ASA | | 114,400 | 2,364,677 |
| | | | 8,990,064 |
| Electrical Equipment - 0.3% | | | |
| AMETEK, Inc. | | 17,000 | 1,322,600 |
| Fortive Corp. | | 97,750 | 8,023,320 |
| Melrose Industries PLC | | 263,929 | 747,921 |
| Nidec Corp. | | 12,600 | 1,823,262 |
| Regal Beloit Corp. | | 85,000 | 7,305,750 |
| | | | 19,222,853 |
| Industrial Conglomerates - 0.6% | | | |
| General Electric Co. | | 1,126,700 | 15,356,921 |
| Honeywell International, Inc. | | 83,200 | 13,282,880 |
| ITT, Inc. | | 106,900 | 6,058,023 |
| | | | 34,697,824 |
| Machinery - 0.5% | | | |
| Aumann AG (e) | | 42,400 | 2,959,952 |
| Deere & Co. | | 101,000 | 14,623,790 |
| Minebea Mitsumi, Inc. | | 26,400 | 473,804 |
| Rational AG | | 3,100 | 2,124,241 |
| SMC Corp. | | 1,300 | 435,755 |
| WABCO Holdings, Inc. (a) | | 28,200 | 3,544,176 |
| Xylem, Inc. | | 92,900 | 7,112,424 |
| | | | 31,274,142 |
| Professional Services - 0.1% | | | |
| CoStar Group, Inc. (a) | | 1,500 | 623,775 |
| Equifax, Inc. | | 10,400 | 1,305,200 |
| IHS Markit Ltd. (a) | | 98,100 | 5,202,243 |
| Recruit Holdings Co. Ltd. | | 22,700 | 622,013 |
| | | | 7,753,231 |
| Road & Rail - 0.2% | | | |
| J.B. Hunt Transport Services, Inc. | | 43,200 | 5,179,680 |
| Knight-Swift Transportation Holdings, Inc. Class A | | 250,500 | 8,153,775 |
| | | | 13,333,455 |
| Trading Companies & Distributors - 0.1% | | | |
| HD Supply Holdings, Inc. (a) | | 72,800 | 3,201,744 |
| Wolseley PLC | | 9,214 | 726,840 |
| | | | 3,928,584 |
| Transportation Infrastructure - 0.0% | | | |
| Adani Ports & Special Economic Zone Ltd. | | 91,432 | 533,888 |
|
| TOTAL INDUSTRIALS | | | 276,759,421 |
|
| INFORMATION TECHNOLOGY - 42.9% | | | |
| Communications Equipment - 0.3% | | | |
| Arista Networks, Inc. (a) | | 28,800 | 7,365,024 |
| Lumentum Holdings, Inc. (a) | | 11,700 | 611,325 |
| NETGEAR, Inc. (a) | | 171,500 | 11,293,275 |
| | | | 19,269,624 |
| Electronic Equipment & Components - 0.1% | | | |
| Corning, Inc. | | 83,300 | 2,763,894 |
| II-VI, Inc. (a) | | 27,900 | 1,093,680 |
| Jabil, Inc. | | 21,900 | 616,923 |
| | | | 4,474,497 |
| Internet Software & Services - 15.2% | | | |
| 2U, Inc. (a) | | 52,700 | 3,987,282 |
| Akamai Technologies, Inc. (a) | | 127,700 | 9,610,702 |
| Alibaba Group Holding Ltd. sponsored ADR (a) | | 267,800 | 50,140,194 |
| Alphabet, Inc. Class A (a) | | 405,913 | 498,144,550 |
| ANGI Homeservices, Inc. Class A (a) | | 304,500 | 4,783,695 |
| Carbonite, Inc. (a) | | 16,800 | 576,240 |
| CarGurus, Inc. Class A�� | | 127,088 | 5,509,265 |
| DocuSign, Inc. (b) | | 16,700 | 900,130 |
| Dropbox, Inc. Class A (a)(b) | | 28,600 | 765,622 |
| Facebook, Inc. Class A (a) | | 1,322,355 | 228,212,026 |
| GMO Internet, Inc. | | 108,200 | 2,294,345 |
| GoDaddy, Inc. (a) | | 103,800 | 7,641,756 |
| GrubHub, Inc. (a) | | 16,000 | 1,950,240 |
| HUYA, Inc. ADR (b) | | 63,171 | 2,034,106 |
| IAC/InterActiveCorp (a) | | 25,200 | 3,710,700 |
| Mercari, Inc. (a) | | 13,700 | 577,087 |
| Mimecast Ltd. (a) | | 15,500 | 556,605 |
| Momo, Inc. ADR (a) | | 96,000 | 3,937,920 |
| NetEase, Inc. ADR | | 25,800 | 6,656,400 |
| New Relic, Inc. (a) | | 2,800 | 273,560 |
| Nutanix, Inc. Class A (a) | | 198,844 | 9,721,483 |
| Okta, Inc. (a) | | 27,300 | 1,355,445 |
| Pandora Media, Inc. (a)(b) | | 80,400 | 541,896 |
| Shopify, Inc. Class A (a) | | 80,100 | 11,158,644 |
| Stamps.com, Inc. (a) | | 28,400 | 7,412,400 |
| Tencent Holdings Ltd. | | 641,000 | 29,174,729 |
| The Trade Desk, Inc. (a) | | 53,000 | 4,468,960 |
| Twilio, Inc. Class A (a) | | 26,400 | 1,528,296 |
| Twitter, Inc. (a) | | 28,100 | 895,547 |
| Wix.com Ltd. (a) | | 74,400 | 7,068,000 |
| Yandex NV Series A (a) | | 106,300 | 3,822,548 |
| YY, Inc. ADR (a) | | 36,200 | 3,374,926 |
| | | | 912,785,299 |
| IT Services - 4.2% | | | |
| Adyen BV (e) | | 10,515 | 6,718,379 |
| Alliance Data Systems Corp. | | 22,900 | 5,149,752 |
| Endava PLC ADR (a) | | 21,000 | 502,110 |
| FleetCor Technologies, Inc. (a) | | 23,200 | 5,034,400 |
| MasterCard, Inc. Class A | | 363,200 | 71,913,600 |
| Netcompany Group A/S | | 23,300 | 847,532 |
| PayPal Holdings, Inc. (a) | | 544,100 | 44,692,374 |
| Square, Inc. (a) | | 66,200 | 4,279,830 |
| Total System Services, Inc. | | 14,300 | 1,309,022 |
| Visa, Inc. Class A | | 739,848 | 101,166,816 |
| Wirecard AG | | 4,500 | 840,616 |
| Worldpay, Inc. (a) | | 108,800 | 8,942,272 |
| | | | 251,396,703 |
| Semiconductors & Semiconductor Equipment - 6.7% | | | |
| Acacia Communications, Inc. (a) | | 37,800 | 1,214,892 |
| Advanced Micro Devices, Inc. (a) | | 524,700 | 9,617,751 |
| Analog Devices, Inc. | | 69,900 | 6,720,186 |
| ASML Holding NV | | 8,800 | 1,883,200 |
| Broadcom, Inc. | | 437,700 | 97,068,729 |
| Inphi Corp. (a) | | 163,700 | 5,146,728 |
| Intel Corp. | | 281,300 | 13,530,530 |
| Marvell Technology Group Ltd. | | 1,148,300 | 24,470,273 |
| Micron Technology, Inc. (a) | | 799,600 | 42,210,884 |
| Monolithic Power Systems, Inc. | | 29,756 | 3,948,026 |
| NVIDIA Corp. | | 655,320 | 160,461,655 |
| NXP Semiconductors NV (a) | | 84,700 | 8,075,298 |
| Qualcomm, Inc. | | 315,900 | 20,246,031 |
| Renesas Electronics Corp. (a) | | 850,300 | 7,574,107 |
| | | | 402,168,290 |
| Software - 10.0% | | | |
| Activision Blizzard, Inc. | | 1,080,028 | 79,295,656 |
| Adobe Systems, Inc. (a) | | 197,520 | 48,329,194 |
| Altair Engineering, Inc. Class A (a) | | 24,100 | 845,910 |
| Atom Tickets LLC (a)(c)(d)(f) | | 344,068 | 1,999,998 |
| Avalara, Inc. | | 8,560 | 328,190 |
| Black Knight, Inc. (a) | | 11,800 | 609,470 |
| Electronic Arts, Inc. (a) | | 194,800 | 25,080,500 |
| HubSpot, Inc. (a) | | 17,800 | 2,208,980 |
| Intuit, Inc. | | 47,200 | 9,640,128 |
| Microsoft Corp. | | 1,923,400 | 204,034,272 |
| Nintendo Co. Ltd. | | 20,100 | 6,797,560 |
| Paycom Software, Inc. (a) | | 90,900 | 9,658,125 |
| Pluralsight, Inc. | | 65,800 | 1,527,218 |
| Proofpoint, Inc. (a) | | 35,400 | 4,037,370 |
| Red Hat, Inc. (a) | | 172,300 | 24,333,929 |
| RingCentral, Inc. (a) | | 48,500 | 3,576,875 |
| SailPoint Technologies Holding, Inc. (a) | | 75,700 | 1,823,613 |
| Salesforce.com, Inc. (a) | | 1,005,667 | 137,927,229 |
| SendGrid, Inc. (a) | | 100,400 | 2,563,212 |
| Smartsheet, Inc. | | 13,500 | 290,250 |
| Snap, Inc. Class A (a)(b) | | 767,872 | 9,598,400 |
| Splunk, Inc. (a) | | 17,100 | 1,643,310 |
| Talend SA ADR (a) | | 40,300 | 2,383,745 |
| Tanium, Inc. Class B (a)(c)(d) | | 151,000 | 1,024,565 |
| Tenable Holdings, Inc. | | 10,900 | 325,910 |
| Workday, Inc. Class A (a) | | 87,100 | 10,802,142 |
| Zendesk, Inc. (a) | | 169,422 | 9,228,416 |
| Zscaler, Inc. (a) | | 49,500 | 1,747,845 |
| | | | 601,662,012 |
| Technology Hardware, Storage & Peripherals - 6.4% | | | |
| Apple, Inc. | | 2,007,134 | 381,937,529 |
|
| TOTAL INFORMATION TECHNOLOGY | | | 2,573,693,954 |
|
| MATERIALS - 1.9% | | | |
| Chemicals - 1.9% | | | |
| Cabot Corp. | | 38,200 | 2,525,020 |
| CF Industries Holdings, Inc. | | 554,100 | 24,613,122 |
| DowDuPont, Inc. | | 145,693 | 10,019,308 |
| FMC Corp. | | 55,936 | 5,027,528 |
| LG Chemical Ltd. | | 4,021 | 1,354,213 |
| LyondellBasell Industries NV Class A | | 215,200 | 23,842,008 |
| Nutrien Ltd. | | 119,900 | 6,511,846 |
| Orion Engineered Carbons SA | | 64,700 | 2,122,160 |
| The Chemours Co. LLC | | 461,000 | 21,118,410 |
| The Mosaic Co. | | 208,600 | 6,280,946 |
| Tronox Ltd. Class A | | 377,100 | 6,957,495 |
| Westlake Chemical Corp. | | 42,200 | 4,524,684 |
| | | | 114,896,740 |
| Construction Materials - 0.0% | | | |
| Buzzi Unicem SpA | | 22,600 | 498,155 |
| Loma Negra Compania Industrial Argentina SA ADR (a) | | 88,600 | 995,864 |
| | | | 1,494,019 |
|
| TOTAL MATERIALS | | | 116,390,759 |
|
| REAL ESTATE - 0.1% | | | |
| Equity Real Estate Investment Trusts (REITs) - 0.1% | | | |
| Ant International Co. Ltd. (c)(d) | | 1,065,661 | 5,978,358 |
| TELECOMMUNICATION SERVICES - 0.1% | | | |
| Wireless Telecommunication Services - 0.1% | | | |
| Boingo Wireless, Inc. (a) | | 57,200 | 1,321,892 |
| T-Mobile U.S., Inc. (a) | | 103,200 | 6,192,000 |
| | | | 7,513,892 |
| UTILITIES - 0.0% | | | |
| Gas Utilities - 0.0% | | | |
| China Resource Gas Group Ltd. | | 184,000 | 872,055 |
| ENN Energy Holdings Ltd. | | 82,000 | 834,203 |
| | | | 1,706,258 |
| TOTAL COMMON STOCKS | | | |
| (Cost $3,135,757,404) | | | 5,632,051,877 |
|
| Preferred Stocks - 6.1% | | | |
| Convertible Preferred Stocks - 6.1% | | | |
| CONSUMER DISCRETIONARY - 0.5% | | | |
| Hotels, Restaurants & Leisure - 0.1% | | | |
| MOD Super Fast Pizza Holdings LLC Series 3 Preferred (a)(c)(d)(f) | | 24,573 | 3,768,024 |
| Neutron Holdings, Inc. Series C (c)(d) | | 12,405,800 | 2,268,276 |
| Topgolf International, Inc. Series F (c)(d) | | 106,191 | 1,635,341 |
| | | | 7,671,641 |
| Internet & Direct Marketing Retail - 0.3% | | | |
| China Internet Plus Holdings Ltd. Series A-11 (a)(c)(d) | | 1,581,852 | 7,909,260 |
| The Honest Co., Inc.: | | | |
| Series C (a)(c)(d) | | 167,087 | 3,275,707 |
| Series D (a)(c)(d) | | 27,712 | 543,288 |
| Series E (c)(d) | | 143,059 | 2,804,643 |
| | | | 14,532,898 |
| Leisure Products - 0.1% | | | |
| Peloton Interactive, Inc. Series E (a)(c)(d) | | 94,313 | 5,447,585 |
| Textiles, Apparel & Luxury Goods - 0.0% | | | |
| Generation Bio Series B (c)(d) | | 110,000 | 1,006,027 |
| TOTAL CONSUMER DISCRETIONARY | | | 28,658,151 |
| CONSUMER STAPLES - 2.7% | | | |
| Food Products - 0.0% | | | |
| Agbiome LLC Series C (c)(d) | | 266,499 | 1,687,925 |
| Tobacco - 2.7% | | | |
| JUUL Labs, Inc.: | | | |
| Series C (a)(c)(d) | | 966,268 | 161,878,878 |
| Series D (c)(d) | | 5,110 | 856,078 |
| | | | 162,734,956 |
| TOTAL CONSUMER STAPLES | | | 164,422,881 |
| FINANCIALS - 0.1% | | | |
| Consumer Finance - 0.1% | | | |
| Oportun Finance Corp. Series H (a)(c)(d) | | 1,527,120 | 3,695,630 |
| HEALTH CARE - 0.2% | | | |
| Biotechnology - 0.1% | | | |
| 23andMe, Inc. Series F (c)(d) | | 195,114 | 3,385,228 |
| Axcella Health, Inc. Series C (a)(c)(d) | | 248,015 | 3,204,354 |
| Immunocore Ltd. Series A (a)(c)(d) | | 4,035 | 536,976 |
| | | | 7,126,558 |
| Health Care Providers & Services - 0.1% | | | |
| Mulberry Health, Inc. Series A8 (a)(c)(d) | | 813,618 | 5,805,075 |
| TOTAL HEALTH CARE | | | 12,931,633 |
| INDUSTRIALS - 0.2% | | | |
| Aerospace & Defense - 0.2% | | | |
| Space Exploration Technologies Corp.: | | | |
| Series G (a)(c)(d) | | 42,650 | 7,207,850 |
| Series H (c)(d) | | 6,348 | 1,072,812 |
| | | | 8,280,662 |
| Professional Services - 0.0% | | | |
| YourPeople, Inc. Series C (a)(c)(d) | | 253,888 | 1,312,601 |
| TOTAL INDUSTRIALS | | | 9,593,263 |
| INFORMATION TECHNOLOGY - 2.4% | | | |
| Internet Software & Services - 2.0% | | | |
| ContextLogic, Inc. Series G (c)(d) | | 34,750 | 5,616,643 |
| Jet.Com, Inc. Series B1 (Escrow) (a)(c)(d) | | 922,232 | 41,869 |
| Lyft, Inc. Series I (c)(d) | | 137,264 | 6,499,986 |
| Reddit, Inc. Series B (c)(d) | | 129,280 | 4,389,056 |
| Starry, Inc. Series C (c)(d) | | 1,477,502 | 1,362,257 |
| Uber Technologies, Inc.: | | | |
| Series D, 8.00% (a)(c)(d) | | 2,553,952 | 102,158,080 |
| Series E, 8.00% (a)(c)(d) | | 46,973 | 1,878,920 |
| | | | 121,946,811 |
| IT Services - 0.1% | | | |
| AppNexus, Inc. Series E (Escrow)(a)(c)(d) | | 307,049 | 6,171,685 |
| Software - 0.3% | | | |
| Cloudflare, Inc. Series D, 8.00% (a)(c)(d) | | 323,080 | 3,221,108 |
| Compass, Inc. Series E (c)(d) | | 13,605 | 918,041 |
| Dataminr, Inc. Series D (a)(c)(d) | | 115,901 | 2,306,430 |
| Delphix Corp. Series D (a)(c)(d) | | 242,876 | 1,768,137 |
| Malwarebytes Corp. Series B (a)(c)(d) | | 329,349 | 5,348,628 |
| Taboola.Com Ltd. Series E (a)(c)(d) | | 289,958 | 5,053,968 |
| | | | 18,616,312 |
| TOTAL INFORMATION TECHNOLOGY | | | 146,734,808 |
|
| TOTAL CONVERTIBLE PREFERRED STOCKS | | | 366,036,366 |
|
| Nonconvertible Preferred Stocks - 0.0% | | | |
| CONSUMER STAPLES - 0.0% | | | |
| Tobacco - 0.0% | | | |
| PAX Labs, Inc. Series A (c)(d) | | 945,100 | 1,370,395 |
| TOTAL PREFERRED STOCKS | | | |
| (Cost $130,947,986) | | | 367,406,761 |
|
| Money Market Funds - 1.9% | | | |
| Fidelity Cash Central Fund, 1.96% (h) | | 4,843,234 | 4,844,203 |
| Fidelity Securities Lending Cash Central Fund 1.97% (h)(i) | | 111,277,662 | 111,288,790 |
| TOTAL MONEY MARKET FUNDS | | | |
| (Cost $116,132,993) | | | 116,132,993 |
| TOTAL INVESTMENT IN SECURITIES - 101.8% | | | |
| (Cost $3,382,838,383) | | | 6,115,591,631 |
| NET OTHER ASSETS (LIABILITIES) - (1.8)% | | | (109,611,475) |
| NET ASSETS - 100% | | | $6,005,980,156 |
Legend
(a) Non-income producing
(b) Security or a portion of the security is on loan at period end.
(c) Restricted securities - Investment in securities not registered under the Securities Act of 1933 (excluding 144A issues). At the end of the period, the value of restricted securities (excluding 144A issues) amounted to $403,482,587 or 6.7% of net assets.
(d) Level 3 security
(e) Security exempt from registration under Rule 144A of the Securities Act of 1933. These securities may be resold in transactions exempt from registration, normally to qualified institutional buyers. At the end of the period, the value of these securities amounted to $29,438,745 or 0.5% of net assets.
(f) Investment is owned by a wholly-owned subsidiary (Subsidiary) that is treated as a corporation for U.S. tax purposes.
(g) Investment represents common shares and preferred shares.
(h) Affiliated fund that is generally available only to investment companies and other accounts managed by Fidelity Investments. The rate quoted is the annualized seven-day yield of the fund at period end. A complete unaudited listing of the fund's holdings as of its most recent quarter end is available upon request. In addition, each Fidelity Central Fund's financial statements, which are not covered by the Fund's Report of Independent Registered Public Accounting Firm, are available on the SEC's website or upon request.
(i) Investment made with cash collateral received from securities on loan.
Additional information on each restricted holding is as follows:
| Security | Acquisition Date | Acquisition Cost |
| 23andMe, Inc. Series F | 8/31/17 | $2,709,002 |
| Agbiome LLC Series C | 6/29/18 | $1,687,925 |
| Ant International Co. Ltd. | 5/16/18 | $5,978,358 |
| AppNexus, Inc. Series E (Escrow) | 8/1/14 | $6,150,867 |
| Atom Tickets LLC | 8/15/17 | $1,999,998 |
| Axcella Health, Inc. Series C | 1/30/15 | $2,499,991 |
| Blue Bottle Coffee, Inc. Class C (Escrow) | 10/30/17 | $537,959 |
| Castle Creek Pharmaceuticals, LLC Class A-2 unit | 9/29/16 | $3,179,880 |
| China Internet Plus Holdings Ltd. Series A-11 | 1/26/15 | $4,999,997 |
| Cibus Global Ltd. Series C | 2/16/18 | $1,525,763 |
| Cloudflare, Inc. Series D, 8.00% | 11/5/14 - 6/24/15 | $2,010,032 |
| Compass, Inc. Series E | 11/3/17 | $918,041 |
| ContextLogic, Inc. Series G | 10/24/17 | $4,675,022 |
| Dataminr, Inc. Series D | 3/6/15 | $1,477,738 |
| Delphix Corp. Series D | 7/10/15 | $2,185,884 |
| Generation Bio Series B | 2/21/18 | $1,006,027 |
| Immunocore Ltd. Series A | 7/27/15 | $759,303 |
| Jet.Com, Inc. Series B1 (Escrow) | 9/19/16 | $-- |
| JUUL Labs, Inc. Series C | 5/22/15 - 7/6/18 | $5,691,100 |
| JUUL Labs, Inc. Series D | 6/25/18 - 7/6/18 | $615,640 |
| Lyft, Inc. Series I | 6/27/18 | $6,499,986 |
| Malwarebytes Corp. Series B | 12/21/15 | $3,416,996 |
| MOD Super Fast Pizza Holdings LLC Series 3 Preferred | 11/3/16 - 12/14/17 | $3,372,522 |
| Mulberry Health, Inc. Series A8 | 1/20/16 | $5,495,786 |
| Neutron Holdings, Inc. Series C | 7/3/18 | $2,268,276 |
| Oportun Finance Corp. Series H | 2/6/15 | $4,348,169 |
| PAX Labs, Inc. Series A | 5/22/15 | $699,375 |
| Peloton Interactive, Inc. Series E | 3/31/17 | $2,042,989 |
| Reddit, Inc. Series B | 7/26/17 | $1,835,324 |
| Space Exploration Technologies Corp. Class A | 4/6/17 - 9/11/17 | $2,534,625 |
| Space Exploration Technologies Corp. Class C | 9/11/17 | $92,610 |
| Space Exploration Technologies Corp. Series G | 1/20/15 | $3,303,669 |
| Space Exploration Technologies Corp. Series H | 8/4/17 | $856,980 |
| Starry, Inc. Series C | 12/8/17 | $1,362,257 |
| Taboola.Com Ltd. Series E | 12/22/14 | $3,022,928 |
| Tanium, Inc. Class B | 4/21/17 | $749,609 |
| The Honest Co., Inc. | 8/21/14 | $1,937,546 |
| The Honest Co., Inc. Series C | 8/21/14 | $4,520,923 |
| The Honest Co., Inc. Series D | 8/3/15 | $1,267,963 |
| The Honest Co., Inc. Series E | 9/28/17 | $2,804,643 |
| Topgolf International, Inc. Series F | 11/10/17 | $1,468,993 |
| Tory Burch LLC | 5/14/15 | $7,600,030 |
| Uber Technologies, Inc. Series D, 8.00% | 6/6/14 | $39,619,585 |
| Uber Technologies, Inc. Series E, 8.00% | 12/5/14 | $1,565,026 |
| WME Entertainment Parent, LLC Class A | 4/13/16 - 8/16/16 | $5,974,752 |
| YourPeople, Inc. Series C | 5/1/15 | $3,783,205 |
Affiliated Central Funds
Information regarding fiscal year to date income earned by the Fund from investments in Fidelity Central Funds is as follows:
| Fund | Income earned |
| Fidelity Cash Central Fund | $138,734 |
| Fidelity Securities Lending Cash Central Fund | 2,287,361 |
| Total | $2,426,095 |
Amounts in the income column in the above table include any capital gain distributions from underlying funds, which are presented in the corresponding line-item in the Statement of Operations if applicable.
Investment Valuation
The following is a summary of the inputs used, as of July 31, 2018, involving the Fund's assets and liabilities carried at fair value. The inputs or methodology used for valuing securities may not be an indication of the risk associated with investing in those securities. For more information on valuation inputs, and their aggregation into the levels used below, please refer to the Investment Valuation section in the accompanying Notes to Financial Statements.
| | Valuation Inputs at Reporting Date: |
| Description | Total | Level 1 | Level 2 | Level 3 |
| Investments in Securities: | | | | |
| Equities: | | | | |
| Consumer Discretionary | $1,512,976,947 | $1,455,566,967 | $11,088,823 | $46,321,157 |
| Consumer Staples | 320,285,580 | 152,479,316 | 1,059,645 | 166,746,619 |
| Energy | 142,415,176 | 142,415,176 | -- | -- |
| Financials | 231,020,076 | 227,317,971 | 6,475 | 3,695,630 |
| Health Care | 654,390,146 | 635,971,991 | 572,258 | 17,845,897 |
| Industrials | 286,352,684 | 271,710,863 | 1,095,817 | 13,546,004 |
| Information Technology | 2,720,428,762 | 2,534,697,102 | 35,972,289 | 149,759,371 |
| Materials | 116,390,759 | 116,390,759 | -- | -- |
| Real Estate | 5,978,358 | -- | -- | 5,978,358 |
| Telecommunication Services | 7,513,892 | 7,513,892 | -- | -- |
| Utilities | 1,706,258 | 1,706,258 | -- | -- |
| Money Market Funds | 116,132,993 | 116,132,993 | -- | -- |
| Total Investments in Securities: | $6,115,591,631 | $5,661,903,288 | $49,795,307 | $403,893,036 |
The following is a reconciliation of Investments in Securities for which Level 3 inputs were used in determining value:
| Investments in Securities: | |
| Equities - Consumer Staples | |
| Beginning Balance | $6,736,874 |
| Net Realized Gain (Loss) on Investment Securities | 3,051,521 |
| Net Unrealized Gain (Loss) on Investment Securities | 162,205,866 |
| Cost of Purchases | 6,148,533 |
| Proceeds of Sales | (11,396,175) |
| Amortization/Accretion | -- |
| Transfers into Level 3 | -- |
| Transfers out of Level 3 | -- |
| Ending Balance | $166,746,619 |
| The change in unrealized gain (loss) for the period attributable to Level 3 securities held at July 31, 2018 | $157,507,024 |
| Equities - Information Technology | |
| Beginning Balance | $154,201,176 |
| Net Realized Gain (Loss) on Investment Securities | 909,136 |
| Net Unrealized Gain (Loss) on Investment Securities | (19,126,594) |
| Cost of Purchases | 15,472,375 |
| Proceeds of Sales | (1,696,722) |
| Amortization/Accretion | -- |
| Transfers into Level 3 | -- |
| Transfers out of Level 3 | -- |
| Ending Balance | $149,759,371 |
| The change in unrealized gain (loss) for the period attributable to Level 3 securities held at July 31, 2018 | $(19,127,289) |
| Other Investments in Securities | |
| Beginning Balance | $63,044,801 |
| Net Realized Gain (Loss) on Investment Securities | (236,566) |
| Net Unrealized Gain (Loss) on Investment Securities | 6,354,197 |
| Cost of Purchases | 19,688,048 |
| Proceeds of Sales | (1,463,434) |
| Amortization/Accretion | -- |
| Transfers into Level 3 | -- |
| Transfers out of Level 3 | -- |
| Ending Balance | $87,387,046 |
| The change in unrealized gain (loss) for the period attributable to Level 3 securities held at July 31, 2018 | $6,437,901 |
The information used in the above reconciliations represents fiscal year to date activity for any Investments in Securities identified as using Level 3 inputs at either the beginning or the end of the current fiscal period. Transfers in or out of Level 3 represent the beginning value of any Security or Instrument where a change in the pricing level occurred from the beginning to the end of the period. The cost of purchases and the proceeds of sales may include securities received or delivered through corporate actions or exchanges. Realized and unrealized gains (losses) disclosed in the reconciliations are included in Net Gain (Loss) on the Fund's Statement of Operations.
See accompanying notes which are an integral part of the financial statements.
Financial Statements
Statement of Assets and Liabilities
| | | July 31, 2018 |
| Assets | | |
Investment in securities, at value (including securities loaned of $110,395,793) — See accompanying schedule:
Unaffiliated issuers (cost $3,266,705,390) | $5,999,458,638 | |
| Fidelity Central Funds (cost $116,132,993) | 116,132,993 | |
| Total Investment in Securities (cost $3,382,838,383) | | $6,115,591,631 |
| Restricted cash | | 228,151 |
| Foreign currency held at value (cost $1,296,669) | | 1,299,983 |
| Receivable for investments sold | | 179,195,454 |
| Receivable for fund shares sold | | 3,040 |
| Dividends receivable | | 1,221,722 |
| Distributions receivable from Fidelity Central Funds | | 182,280 |
| Other receivables | | 96,458 |
| Total assets | | 6,297,818,719 |
| Liabilities | | |
| Payable to custodian bank | $3,141,836 | |
| Payable for investments purchased | 20,504,616 | |
| Payable for fund shares redeemed | 155,903,899 | |
| Other payables and accrued expenses | 1,010,207 | |
| Collateral on securities loaned | 111,278,005 | |
| Total liabilities | | 291,838,563 |
| Net Assets | | $6,005,980,156 |
| Net Assets consist of: | | |
| Paid in capital | | $2,706,722,761 |
| Undistributed net investment income | | 27,489,767 |
| Accumulated undistributed net realized gain (loss) on investments and foreign currency transactions | | 539,930,551 |
| Net unrealized appreciation (depreciation) on investments and assets and liabilities in foreign currencies | | 2,731,837,077 |
| Net Assets | | $6,005,980,156 |
| Series Blue Chip Growth: | | |
| Net Asset Value, offering price and redemption price per share ($6,005,980,156 ÷ 377,616,059 shares) | | $15.90 |
See accompanying notes which are an integral part of the financial statements.
Statement of Operations
| | | Year ended July 31, 2018 |
| Investment Income | | |
| Dividends | | $39,489,730 |
| Special dividends | | 6,032,025 |
| Income from Fidelity Central Funds | | 2,426,095 |
| Total income | | 47,947,850 |
| Expenses | | |
| Custodian fees and expenses | $209,358 | |
| Independent trustees' fees and expenses | 25,089 | |
| Legal | 462 | |
| Interest | 32,524 | |
| Commitment fees | 16,423 | |
| Total expenses before reductions | 283,856 | |
| Expense reductions | (272,802) | |
| Total expenses after reductions | | 11,054 |
| Net investment income (loss) | | 47,936,796 |
| Realized and Unrealized Gain (Loss) | | |
| Net realized gain (loss) on: | | |
| Investment securities: | | |
| Unaffiliated issuers (net of foreign taxes of $64,311) | 672,813,509 | |
| Fidelity Central Funds | 16,520 | |
| Foreign currency transactions | (33,839) | |
| Total net realized gain (loss) | | 672,796,190 |
| Change in net unrealized appreciation (depreciation) on: | | |
| Investment securities: | | |
| Unaffiliated issuers (net of increase in deferred foreign taxes of $717,650) | 683,613,710 | |
| Fidelity Central Funds | (4,049) | |
| Assets and liabilities in foreign currencies | 7,472 | |
| Total change in net unrealized appreciation (depreciation) | | 683,617,133 |
| Net gain (loss) | | 1,356,413,323 |
| Net increase (decrease) in net assets resulting from operations | | $1,404,350,119 |
See accompanying notes which are an integral part of the financial statements.
Statement of Changes in Net Assets
| | Year ended July 31, 2018 | Year ended July 31, 2017 |
| Increase (Decrease) in Net Assets | | |
| Operations | | |
| Net investment income (loss) | $47,936,796 | $19,600,185 |
| Net realized gain (loss) | 672,796,190 | 587,442,057 |
| Change in net unrealized appreciation (depreciation) | 683,617,133 | 616,542,740 |
| Net increase (decrease) in net assets resulting from operations | 1,404,350,119 | 1,223,584,982 |
| Distributions to shareholders from net investment income | (30,301,164) | (22,221,065) |
| Distributions to shareholders from net realized gain | (594,846,797) | (63,873,266) |
| Total distributions | (625,147,961) | (86,094,331) |
| Share transactions - net increase (decrease) | (294,231,172) | (1,796,179,085) |
| Total increase (decrease) in net assets | 484,970,986 | (658,688,434) |
| Net Assets | | |
| Beginning of period | 5,521,009,170 | 6,179,697,604 |
| End of period | $6,005,980,156 | $5,521,009,170 |
| Other Information | | |
| Undistributed net investment income end of period | $27,489,767 | $10,888,691 |
See accompanying notes which are an integral part of the financial statements.
Financial Highlights
Fidelity Series Blue Chip Growth Fund
| Years ended July 31, | 2018 | 2017 | 2016 | 2015 | 2014 A |
| Selected Per–Share Data | | | | | |
| Net asset value, beginning of period | $14.07 | $11.47 | $13.36 | $11.18 | $10.00 |
| Income from Investment Operations | | | | | |
| Net investment income (loss)B | .12C | .03 | .02 | .03 | .02 |
| Net realized and unrealized gain (loss) | 3.28 | 2.74 | (.42) | 2.27 | 1.17 |
| Total from investment operations | 3.40 | 2.77 | (.40) | 2.30 | 1.19 |
| Distributions from net investment income | (.07) | (.03) | (.02) | (.02) | (.01) |
| Distributions from net realized gain | (1.50) | (.14) | (1.48) | (.10) | – |
| Total distributions | (1.57) | (.17) | (1.49)D | (.12) | (.01) |
| Net asset value, end of period | $15.90 | $14.07 | $11.47 | $13.36 | $11.18 |
| Total ReturnE,F | 26.54% | 24.50% | (2.63)% | 20.74% | 11.90% |
| Ratios to Average Net AssetsG,H | | | | | |
| Expenses before reductions | - %I | .59% | .73% | .79% | .74%J |
| Expenses net of fee waivers, if any | - %I | .59% | .73% | .78% | .74%J |
| Expenses net of all reductions | - %I | .59% | .73% | .78% | .74%J |
| Net investment income (loss) | .81%C | .26% | .17% | .20% | .26%J |
| Supplemental Data | | | | | |
| Net assets, end of period (000 omitted) | $6,005,980 | $2,208,451 | $2,417,952 | $2,831,293 | $3,288,708 |
| Portfolio turnover rateK | 41% | 47% | 55% | 57% | 67%J,L |
A For the period November 7, 2013 (commencement of operations) to July 31, 2014.
B Calculated based on average shares outstanding during the period.
C Net investment income per share reflects a large, non-recurring dividend which amounted to $.01 per share. Excluding this non-recurring dividend, the ratio of net investment income (loss) to average net assets would have been .71%.
D Total distributions of $1.49 per share is comprised of distributions from net investment income of $.015 and distributions from net realized gain of $1.477 per share.
E Total returns for periods of less than one year are not annualized.
F Total returns would have been lower if certain expenses had not been reduced during the applicable periods shown.
G Fees and expenses of any underlying Fidelity Central Funds are not included in the Fund's expense ratio. The Fund indirectly bears its proportionate share of the expenses of any underlying Fidelity Central Funds.
H Expense ratios reflect operating expenses of the class. Expenses before reductions do not reflect amounts reimbursed by the investment adviser or reductions from brokerage service arrangements or reductions from other expense offset arrangements and do not represent the amount paid by the class during periods when reimbursements or reductions occur. Expense ratios before reductions for start-up periods may not be representative of longer-term operating periods. Expenses net of fee waivers reflect expenses after reimbursement by the investment adviser but prior to reductions from brokerage service arrangements or other expense offset arrangements. Expenses net of all reductions represent the net expenses paid by the class.
I Amount represents less than .005%.
J Annualized
K Amount does not include the portfolio activity of any underlying Fidelity Central Funds.
L Portfolio turnover rate excludes securities received or delivered in-kind.
See accompanying notes which are an integral part of the financial statements.
Notes to Financial Statements
For the period ended July 31, 2018
1. Organization.
Fidelity Series Blue Chip Growth Fund (the Fund) is a fund of Fidelity Securities Fund (the Trust) and is authorized to issue an unlimited number of shares. Shares of the Fund are only available for purchase by mutual funds for which FMR or an affiliate serves as an investment manager. The Trust is registered under the Investment Company Act of 1940, as amended (the 1940 Act), as an open-end management investment company organized as a Massachusetts business trust. Effective August 28, 2017, the Fund no longer offered Class F, and all outstanding shares of Class F were exchanged for shares of Series Blue Chip Growth.
2. Investments in Fidelity Central Funds.
The Fund invests in Fidelity Central Funds, which are open-end investment companies generally available only to other investment companies and accounts managed by the investment adviser and its affiliates. The Fund's Schedule of Investments lists each of the Fidelity Central Funds held as of period end, if any, as an investment of the Fund, but does not include the underlying holdings of each Fidelity Central Fund. As an Investing Fund, the Fund indirectly bears its proportionate share of the expenses of the underlying Fidelity Central Funds.
The Money Market Central Funds seek preservation of capital and current income and are managed by Fidelity Investments Money Management, Inc. (FIMM), an affiliate of the investment adviser. Annualized expenses of the Money Market Central Funds as of their most recent shareholder report date are less than .005%.
A complete unaudited list of holdings for each Fidelity Central Fund is available upon request or at the Securities and Exchange Commission (the SEC) website at www.sec.gov. In addition, the financial statements of the Fidelity Central Funds, which are not covered by the Fund's Report of Independent Registered Public Accounting Firm, are available on the SEC website or upon request.
3. Significant Accounting Policies.
The Fund is an investment company and applies the accounting and reporting guidance of the Financial Accounting Standards Board (FASB) Accounting Standards Codification Topic 946 Financial Services – Investments Companies. The financial statements have been prepared in conformity with accounting principles generally accepted in the United States of America (GAAP), which require management to make certain estimates and assumptions at the date of the financial statements. Actual results could differ from those estimates. Subsequent events, if any, through the date that the financial statements were issued have been evaluated in the preparation of the financial statements. The following summarizes the significant accounting policies of the Fund:
Investment Valuation. Investments are valued as of 4:00 p.m. Eastern time on the last calendar day of the period. The Board of Trustees (the Board) has delegated the day to day responsibility for the valuation of the Fund's investments to the Fair Value Committee (the Committee) established by the Fund's investment adviser. In accordance with valuation policies and procedures approved by the Board, the Fund attempts to obtain prices from one or more third party pricing vendors or brokers to value its investments. When current market prices, quotations or currency exchange rates are not readily available or reliable, investments will be fair valued in good faith by the Committee, in accordance with procedures adopted by the Board. Factors used in determining fair value vary by investment type and may include market or investment specific events. The frequency with which these procedures are used cannot be predicted and they may be utilized to a significant extent. The Committee oversees the Fund's valuation policies and procedures and reports to the Board on the Committee's activities and fair value determinations. The Board monitors the appropriateness of the procedures used in valuing the Fund's investments and ratifies the fair value determinations of the Committee.
The Fund categorizes the inputs to valuation techniques used to value its investments into a disclosure hierarchy consisting of three levels as shown below:
- Level 1 – quoted prices in active markets for identical investments
- Level 2 – other significant observable inputs (including quoted prices for similar investments, interest rates, prepayment speeds, etc.)
- Level 3 – unobservable inputs (including the Fund's own assumptions based on the best information available)
Valuation techniques used to value the Fund's investments by major category are as follows:
Equity securities, including restricted securities, for which market quotations are readily available, are valued at the last reported sale price or official closing price as reported by a third party pricing vendor on the primary market or exchange on which they are traded and are categorized as Level 1 in the hierarchy. In the event there were no sales during the day or closing prices are not available, securities are valued at the last quoted bid price or may be valued using the last available price and are generally categorized as Level 2 in the hierarchy. For foreign equity securities, when market or security specific events arise, comparisons to the valuation of American Depositary Receipts (ADRs), futures contracts, Exchange-Traded Funds (ETFs) and certain indexes as well as quoted prices for similar securities may be used and would be categorized as Level 2 in the hierarchy. Utilizing these techniques may result in transfers between Level 1 and Level 2. For equity securities, including restricted securities, where observable inputs are limited, assumptions about market activity and risk are used and these securities may be categorized as Level 3 in the hierarchy. Equity securities, including restricted securities, for which observable inputs are not available are valued using alternate valuation approaches, including the market approach and the income approach and are categorized as Level 3 in the hierarchy. The market approach generally consists of using comparable market transactions while the income approach generally consists of using the net present value of estimated future cash flows, adjusted as appropriate for liquidity, credit, market and/or other risk factors.
Investments in open-end mutual funds, including the Fidelity Central Funds, are valued at their closing net asset value (NAV) each business day and are categorized as Level 1 in the hierarchy.
The following provides information on Level 3 securities held by the Fund that were valued at period end based on unobservable inputs. These amounts exclude valuations provided by a broker.
| Asset Type | Fair Value | Valuation Technique(s) | Unobservable Input | Amount or Range/Weighted Average | Impact to Valuation from an Increase in Input(a) |
| Equities | $403,893,036 | Market comparable | Enterprise value/Sales multiple (EV/S) | 1.2 - 12.2 / 5.1 | Increase |
| | | | Transaction price | $9.15 - $330.00 / $179.53 | Increase |
| | | | Enterprise value/EBITDA multiple (EV/EBITDA) | 12.4 | Increase |
| | | | Enterprise value/Gross profit multiple (EV/GP) | 4.3 | Increase |
| | | | Discount rate | 7.5% - 69.1% / 41.4% | Decrease |
| | | | Price/Earnings multiple (P/E) | 15.1 | Increase |
| | | | Conversion ratio | 3.0 | Increase |
| | | | Discount for lack of marketability | 10.0% - 25.0% / 13.1% | Decrease |
| | | | Premium rate | 7.5% - 76.0% / 33.8% | Increase |
| | | | Proxy premium | 28.2% - 54.5% / 44.1% | Increase |
| | | | Liquidity preference | $14.90 | Increase |
| | | Market approach | Transaction price | $0.18 - $179.25 / $107.52 | Increase |
| | | | Tender price | $143.40 | Increase |
| | | Recovery value | Recovery value | 0.0% - 2.3% / 2.2% | Increase |
(a) Represents the expected directional change in the fair value of the Level 3 investments that would result from an increase in the corresponding input. A decrease to the unobservable input would have the opposite effect. Significant changes in these inputs could result in significantly higher or lower fair value measurements.
Changes in valuation techniques may result in transfers in or out of an assigned level within the disclosure hierarchy. The aggregate value of investments by input level as of July 31, 2018, as well as a roll forward of Level 3 investments, is included at the end of the Fund's Schedule of Investments.
Foreign Currency. The Fund may use foreign currency contracts to facilitate transactions in foreign-denominated securities. Gains and losses from these transactions may arise from changes in the value of the foreign currency or if the counterparties do not perform under the contracts' terms.
Foreign-denominated assets, including investment securities, and liabilities are translated into U.S. dollars at the exchange rates at period end. Purchases and sales of investment securities, income and dividends received and expenses denominated in foreign currencies are translated into U.S. dollars at the exchange rate in effect on the transaction date.
The effects of exchange rate fluctuations on investments are included with the net realized and unrealized gain (loss) on investment securities. Other foreign currency transactions resulting in realized and unrealized gain (loss) are disclosed separately.
Investment Transactions and Income. For financial reporting purposes, the Fund's investment holdings and NAV include trades executed through the end of the last business day of the period. The NAV per share for processing shareholder transactions is calculated as of the close of business of the New York Stock Exchange (NYSE), normally 4:00 p.m. Eastern time and includes trades executed through the end of the prior business day. Gains and losses on securities sold are determined on the basis of identified cost and include proceeds received from litigation. Dividend income is recorded on the ex-dividend date, except for certain dividends from foreign securities where the ex-dividend date may have passed, which are recorded as soon as the Fund is informed of the ex-dividend date. Non-cash dividends included in dividend income, if any, are recorded at the fair market value of the securities received. Income and capital gain distributions from Fidelity Central Funds, if any, are recorded on the ex-dividend date. Certain distributions received by the Fund represent a return of capital or capital gain. The Fund determines the components of these distributions subsequent to the ex-dividend date, based upon receipt of tax filings or other correspondence relating to the underlying investment. These distributions are recorded as a reduction of cost of investments and/or as a realized gain. Large, non-recurring dividends recognized by the Fund are presented separately on the Statement of Operations as "Special Dividends" and the impact of these dividends is presented in the Financial Highlights. Investment income is recorded net of foreign taxes withheld where recovery of such taxes is uncertain.
Class Allocations and Expenses. Investment income, realized and unrealized capital gains and losses, common expenses of the Fund, and certain fund-level expense reductions, if any, are allocated daily on a pro-rata basis to each class based on the relative net assets of each class to the total net assets of the Fund. Each class differs with respect to fees incurred. Certain expense reductions may also differ by class. For the reporting period, the allocated portion of income and expenses to each class as a percent of its average net assets may vary due to the timing of recording these transactions in relation to fluctuating net assets of the classes. Expenses directly attributable to a fund are charged to that fund. Expenses attributable to more than one fund are allocated among the respective funds on the basis of relative net assets or other appropriate methods. Expense estimates are accrued in the period to which they relate and adjustments are made when actual amounts are known.
Income Tax Information and Distributions to Shareholders. Each year, the Fund intends to qualify as a regulated investment company under Subchapter M of the Internal Revenue Code, including distributing substantially all of its taxable income and realized gains. As a result, no provision for U.S. Federal income taxes is required. As of July 31, 2018, the Fund did not have any unrecognized tax benefits in the financial statements; nor is the Fund aware of any tax positions for which it is reasonably possible that the total amounts of unrecognized tax benefits will significantly change in the next twelve months. The Fund files a U.S. federal tax return, in addition to state and local tax returns as required. The Fund's federal income tax returns are subject to examination by the Internal Revenue Service (IRS) for a period of three fiscal years after they are filed. State and local tax returns may be subject to examination for an additional fiscal year depending on the jurisdiction. Foreign taxes are provided for based on the Fund's understanding of the tax rules and rates that exist in the foreign markets in which it invests. The Fund is subject to a tax imposed on capital gains by certain countries in which it invests. An estimated deferred tax liability for net unrealized appreciation on the applicable securities is included in Other payables and accrued expenses on the Statement of Assets & Liabilities.
Distributions are declared and recorded on the ex-dividend date. Income and capital gain distributions are declared separately for each class. Income and capital gain distributions are determined in accordance with income tax regulations, which may differ from GAAP.
Capital accounts within the financial statements are adjusted for permanent book-tax differences. These adjustments have no impact on net assets or the results of operations. Capital accounts are not adjusted for temporary book-tax differences which will reverse in a subsequent period.
Book-tax differences are primarily due to foreign currency transactions, certain foreign taxes, passive foreign investment companies (PFIC), partnerships, and losses deferred due to wash sales.
As of period end, the cost and unrealized appreciation (depreciation) in securities, and derivatives if applicable, for federal income tax purposes were as follows:
| Gross unrealized appreciation | $2,812,075,018 |
| Gross unrealized depreciation | (93,055,298) |
| Net unrealized appreciation (depreciation) | $2,719,019,720 |
| Tax Cost | $3,396,571,911 |
The tax-based components of distributable earnings as of period end were as follows:
| Undistributed ordinary income | $52,276,229 |
| Undistributed long-term capital gain | $528,890,545 |
| Net unrealized appreciation (depreciation) on securities and other investments | $2,719,021,140 |
The tax character of distributions paid was as follows:
| | July 31, 2018 | July 31, 2017 |
| Ordinary Income | $33,839,264 | $ 22,221,065 |
| Long-term Capital Gains | 591,308,697 | 63,873,266 |
| Total | $625,147,961 | $ 86,094,331 |
Restricted Securities. The Fund may invest in securities that are subject to legal or contractual restrictions on resale. These securities generally may be resold in transactions exempt from registration or to the public if the securities are registered. Disposal of these securities may involve time-consuming negotiations and expense, and prompt sale at an acceptable price may be difficult. Information regarding restricted securities is included at the end of the Fund's Schedule of Investments.
Consolidated Subsidiary. The Fund invests in certain investments through a wholly-owned subsidiary ("Subsidiary"), which may be subject to federal and state taxes upon disposition.
As of period end, the Fund held an investment of $27,749,939 in these Subsidiaries, representing .46% of the Fund's net assets. The financial statements have been consolidated and include accounts of the Fund and each Subsidiary. Accordingly, all inter-company transactions and balances have been eliminated.
Any cash held by the Subsidiaries is restricted as to its use and is presented as Restricted cash in the Statement of Assets and Liabilities.
4. Purchases and Sales of Investments.
Purchases and sales of securities, other than short-term securities, aggregated $2,419,246,290 and $3,267,865,129, respectively.
5. Fees and Other Transactions with Affiliates.
Management Fee. Fidelity Management & Research Company (the investment adviser) and its affiliates provide the Fund with investment management related services for which the Fund does not pay a management fee. Under the management contract, the investment adviser or an affiliate pays all ordinary operating expenses of the Fund, except custody fees, fees and expenses of the independent Trustees, and certain miscellaneous expenses such as proxy and shareholder meeting expenses.
Brokerage Commissions. The Fund placed a portion of its portfolio transactions with brokerage firms which are affiliates of the investment adviser. Brokerage commissions are included in net realized gain (loss) and change in net unrealized appreciation (depreciation) in the Statement of Operations. The commissions paid to these affiliated firms were $45,304 for the period.
Interfund Lending Program. Pursuant to an Exemptive Order issued by the SEC, the Fund, along with other registered investment companies having management contracts with Fidelity Management & Research Company (FMR) or other affiliated entities of FMR, may participate in an interfund lending program. This program provides an alternative credit facility allowing the funds to borrow from, or lend money to, other participating affiliated funds. At period end, there were no interfund loans outstanding. The Fund's activity in this program during the period for which loans were outstanding was as follows:
| Borrower or Lender | Average Loan Balance | Weighted Average Interest Rate | Interest Expense |
| Borrower | $24,073,320 | 1.95% | $32,524 |
Interfund Trades. The Fund may purchase from or sell securities to other Fidelity Funds under procedures adopted by the Board. The procedures have been designed to ensure these interfund trades are executed in accordance with Rule 17a-7 of the 1940 Act. Interfund trades are included within the respective purchases and sales amounts shown in the Purchases and Sales of Investments note.
6. Committed Line of Credit.
The Fund participates with other funds managed by the investment adviser or an affiliate in a $4.25 billion credit facility (the "line of credit") to be utilized for temporary or emergency purposes to fund shareholder redemptions or for other short-term liquidity purposes. The Fund has agreed to pay commitment fees on its pro-rata portion of the line of credit, which amounted to $16,423 and is reflected in Commitment fees on the Statement of Operations. During the period, the Fund did not borrow on this line of credit.
7. Security Lending.
The Fund lends portfolio securities through a lending agent from time to time in order to earn additional income. For equity securities, a lending agent is used and may loan securities to certain qualified borrowers, including Fidelity Capital Markets (FCM), a broker-dealer affiliated with the Fund. On the settlement date of the loan, the Fund receives collateral (in the form of U.S. Treasury obligations, letters of credit and/or cash) against the loaned securities and maintains collateral in an amount not less than 100% of the market value of the loaned securities during the period of the loan. The market value of the loaned securities is determined at the close of business of the Fund and any additional required collateral is delivered to the Fund on the next business day. The Fund or borrower may terminate the loan at any time, and if the borrower defaults on its obligation to return the securities loaned because of insolvency or other reasons, the Fund may apply collateral received from the borrower against the obligation. The Fund may experience delays and costs in recovering the securities loaned. Any cash collateral received is invested in the Fidelity Securities Lending Cash Central Fund. The value of loaned securities and cash collateral at period end are disclosed on the Fund's Statement of Assets and Liabilities. The value of securities loaned to FCM at period end was $41,316,166. Security lending income represents the income earned on investing cash collateral, less rebates paid to borrowers and any lending agent fees associated with the loan, plus any premium payments received for lending certain types of securities. Security lending income is presented in the Statement of Operations as a component of income from Fidelity Central Funds. Total security lending income during the period amounted to $2,287,361, including $135,154 from securities loaned to FCM.
8. Expense Reductions.
Commissions paid to certain brokers with whom the investment adviser, or its affiliates, places trades on behalf of the Fund include an amount in addition to trade execution, which may be rebated back to the Fund to offset certain expenses. This amount totaled $272,802 for the period.
9. Distributions to Shareholders.
Distributions to shareholders of each class were as follows:
| | Year ended
July 31, 2018 | Year ended
July 31, 2017 |
| From net investment income | | |
| Series Blue Chip Growth | $30,301,164 | $6,353,988 |
| Class F | – | 15,867,077 |
| Total | $30,301,164 | $22,221,065 |
| From net realized gain | | |
| Series Blue Chip Growth | $594,846,797 | $24,770,768 |
| Class F | – | 39,102,498 |
| Total | $594,846,797 | $63,873,266 |
10. Share Transactions.
Transactions for each class of shares were as follows:
| | Shares | Shares | Dollars | Dollars |
| | Year ended July 31, 2018 | Year ended July 31, 2017 | Year ended July 31, 2018 | Year ended July 31, 2017 |
| Series Blue Chip Growth | | | | |
| Shares sold | 269,791,046 | 16,702,875 | $3,797,539,895 | $213,421,848 |
| Reinvestment of distributions | 46,816,082 | 2,696,789 | 625,147,961 | 31,124,756 |
| Shares redeemed | (95,983,048) | (73,247,198) | (1,414,376,373) | (899,683,273) |
| Net increase (decrease) | 220,624,080 | (53,847,534) | $3,008,311,483 | $(655,136,669) |
| Class F | | | | |
| Shares sold | 1,143,506 | 31,746,375 | $16,094,327 | $392,182,056 |
| Reinvestment of distributions | – | 4,765,212 | – | 54,969,575 |
| Shares redeemed | (236,497,813) | (128,891,023) | (3,318,636,982) | (1,588,194,047) |
| Net increase (decrease) | (235,354,307) | (92,379,436) | $(3,302,542,655) | $(1,141,042,416) |
11. Other.
The Fund's organizational documents provide former and current trustees and officers with a limited indemnification against liabilities arising in connection with the performance of their duties to the Fund. In the normal course of business, the Fund may also enter into contracts that provide general indemnifications. The Fund's maximum exposure under these arrangements is unknown as this would be dependent on future claims that may be made against the Fund. The risk of material loss from such claims is considered remote.
At the end of the period, mutual funds managed by the investment adviser or its affiliates were the owners of record of all of the outstanding shares of the Fund.
Report of Independent Registered Public Accounting Firm
To the Trustees of Fidelity Securities Fund and Shareholders of Fidelity Series Blue Chip Growth Fund:
Opinion on the Financial Statements and Financial Highlights
We have audited the accompanying statement of assets and liabilities of Fidelity Series Blue Chip Growth Fund (the "Fund"), a fund of Fidelity Securities Fund, including the schedule of investments, as of July 31, 2018, and the related statement of operations for the year then ended, the statement of changes in net assets for each of the two years in the period then ended, the financial highlights for each of the five years in the period then ended, and the related notes. In our opinion, the financial statements and financial highlights present fairly, in all material respects, the financial position of the Fund as of July 31, 2018, and the results of its operations for the year then ended, the changes in its net assets for each of the two years in the period then ended, and the financial highlights for each of the five years in the period then ended, in conformity with accounting principles generally accepted in the United States of America.
Basis for Opinion
These financial statements and financial highlights are the responsibility of the Fund's management. Our responsibility is to express an opinion on the Fund's financial statements and financial highlights based on our audits. We are a public accounting firm registered with the Public Company Accounting Oversight Board (United States) (PCAOB) and are required to be independent with respect to the Fund in accordance with the U.S. federal securities laws and the applicable rules and regulations of the Securities and Exchange Commission and the PCAOB.
We conducted our audits in accordance with the standards of the PCAOB. Those standards require that we plan and perform the audit to obtain reasonable assurance about whether the financial statements and financial highlights are free of material misstatement, whether due to error or fraud. The Fund is not required to have, nor were we engaged to perform, an audit of its internal control over financial reporting. As part of our audits we are required to obtain an understanding of internal control over financial reporting but not for the purpose of expressing an opinion on the effectiveness of the Fund’s internal control over financial reporting. Accordingly, we express no such opinion.
Our audits included performing procedures to assess the risks of material misstatement of the financial statements and financial highlights, whether due to error or fraud, and performing procedures that respond to those risks. Such procedures included examining, on a test basis, evidence regarding the amounts and disclosures in the financial statements and financial highlights. Our audits also included evaluating the accounting principles used and significant estimates made by management, as well as evaluating the overall presentation of the financial statements and financial highlights. Our procedures included confirmation of securities owned as of July 31, 2018, by correspondence with the custodians and brokers; when replies were not received from brokers, we performed other auditing procedures. We believe that our audits provide a reasonable basis for our opinion.
/s/ Deloitte & Touche LLP
Boston, Massachusetts
September 17, 2018
We have served as the auditor of one or more of the Fidelity investment companies since 1999.
Trustees and Officers
The Trustees, Members of the Advisory Board (if any), and officers of the trust and fund, as applicable, are listed below. The Board of Trustees governs the fund and is responsible for protecting the interests of shareholders. The Trustees are experienced executives who meet periodically throughout the year to oversee the fund's activities, review contractual arrangements with companies that provide services to the fund, oversee management of the risks associated with such activities and contractual arrangements, and review the fund's performance. Except for Jonathan Chiel, each of the Trustees oversees 286 funds. Mr. Chiel oversees 150.
The Trustees hold office without limit in time except that (a) any Trustee may resign; (b) any Trustee may be removed by written instrument, signed by at least two-thirds of the number of Trustees prior to such removal; (c) any Trustee who requests to be retired or who has become incapacitated by illness or injury may be retired by written instrument signed by a majority of the other Trustees; and (d) any Trustee may be removed at any special meeting of shareholders by a two-thirds vote of the outstanding voting securities of the trust. Each Trustee who is not an interested person (as defined in the 1940 Act) of the trust and the fund is referred to herein as an Independent Trustee. Each Independent Trustee shall retire not later than the last day of the calendar year in which his or her 75th birthday occurs. The Independent Trustees may waive this mandatory retirement age policy with respect to individual Trustees. Officers and Advisory Board Members hold office without limit in time, except that any officer or Advisory Board Member may resign or may be removed by a vote of a majority of the Trustees at any regular meeting or any special meeting of the Trustees. Except as indicated, each individual has held the office shown or other offices in the same company for the past five years.
The fund’s Statement of Additional Information (SAI) includes more information about the Trustees. To request a free copy, call Fidelity at 1-800-544-8544.
Experience, Skills, Attributes, and Qualifications of the Trustees. The Governance and Nominating Committee has adopted a statement of policy that describes the experience, qualifications, attributes, and skills that are necessary and desirable for potential Independent Trustee candidates (Statement of Policy). The Board believes that each Trustee satisfied at the time he or she was initially elected or appointed a Trustee, and continues to satisfy, the standards contemplated by the Statement of Policy. The Governance and Nominating Committee also engages professional search firms to help identify potential Independent Trustee candidates who have the experience, qualifications, attributes, and skills consistent with the Statement of Policy. From time to time, additional criteria based on the composition and skills of the current Independent Trustees, as well as experience or skills that may be appropriate in light of future changes to board composition, business conditions, and regulatory or other developments, have also been considered by the professional search firms and the Governance and Nominating Committee. In addition, the Board takes into account the Trustees' commitment and participation in Board and committee meetings, as well as their leadership of standing and ad hoc committees throughout their tenure.
In determining that a particular Trustee was and continues to be qualified to serve as a Trustee, the Board has considered a variety of criteria, none of which, in isolation, was controlling. The Board believes that, collectively, the Trustees have balanced and diverse experience, qualifications, attributes, and skills, which allow the Board to operate effectively in governing the fund and protecting the interests of shareholders. Information about the specific experience, skills, attributes, and qualifications of each Trustee, which in each case led to the Board's conclusion that the Trustee should serve (or continue to serve) as a trustee of the fund, is provided below.
Board Structure and Oversight Function. James C. Curvey is an interested person and currently serves as Chairman. The Trustees have determined that an interested Chairman is appropriate and benefits shareholders because an interested Chairman has a personal and professional stake in the quality and continuity of services provided to the fund. Independent Trustees exercise their informed business judgment to appoint an individual of their choosing to serve as Chairman, regardless of whether the Trustee happens to be independent or a member of management. The Independent Trustees have determined that they can act independently and effectively without having an Independent Trustee serve as Chairman and that a key structural component for assuring that they are in a position to do so is for the Independent Trustees to constitute a substantial majority for the Board. The Independent Trustees also regularly meet in executive session. Ned C. Lautenbach serves as Chairman of the Independent Trustees and as such (i) acts as a liaison between the Independent Trustees and management with respect to matters important to the Independent Trustees and (ii) with management prepares agendas for Board meetings.
Fidelity® funds are overseen by different Boards of Trustees. The fund's Board oversees Fidelity's high income and certain equity funds, and other Boards oversee Fidelity's investment-grade bond, money market, asset allocation, and other equity funds. The asset allocation funds may invest in Fidelity® funds overseen by the fund's Board. The use of separate Boards, each with its own committee structure, allows the Trustees of each group of Fidelity® funds to focus on the unique issues of the funds they oversee, including common research, investment, and operational issues. On occasion, the separate Boards establish joint committees to address issues of overlapping consequences for the Fidelity® funds overseen by each Board.
The Trustees operate using a system of committees to facilitate the timely and efficient consideration of all matters of importance to the Trustees, the fund, and fund shareholders and to facilitate compliance with legal and regulatory requirements and oversight of the fund's activities and associated risks. The Board, acting through its committees, has charged FMR and its affiliates with (i) identifying events or circumstances the occurrence of which could have demonstrably adverse effects on the fund's business and/or reputation; (ii) implementing processes and controls to lessen the possibility that such events or circumstances occur or to mitigate the effects of such events or circumstances if they do occur; and (iii) creating and maintaining a system designed to evaluate continuously business and market conditions in order to facilitate the identification and implementation processes described in (i) and (ii) above. Because the day-to-day operations and activities of the fund are carried out by or through FMR, its affiliates, and other service providers, the fund's exposure to risks is mitigated but not eliminated by the processes overseen by the Trustees. While each of the Board's committees has responsibility for overseeing different aspects of the fund's activities, oversight is exercised primarily through the Operations, Audit, and Compliance Committees. In addition, the Independent Trustees have worked with Fidelity to enhance the Board's oversight of investment and financial risks, legal and regulatory risks, technology risks, and operational risks, including the development of additional risk reporting to the Board. Appropriate personnel, including but not limited to the fund's Chief Compliance Officer (CCO), FMR's internal auditor, the independent accountants, the fund's Treasurer and portfolio management personnel, make periodic reports to the Board's committees, as appropriate, including an annual review of Fidelity's risk management program for the Fidelity® funds. The responsibilities of each standing committee, including their oversight responsibilities, are described further under "Standing Committees of the Trustees."
Interested Trustees*:
Correspondence intended for a Trustee who is an interested person may be sent to Fidelity Investments, 245 Summer Street, Boston, Massachusetts 02210.
Name, Year of Birth; Principal Occupations and Other Relevant Experience+
Jonathan Chiel (1957)
Year of Election or Appointment: 2016
Trustee
Mr. Chiel also serves as Trustee of other Fidelity® funds. Mr. Chiel is Executive Vice President and General Counsel for FMR LLC (diversified financial services company, 2012-present). Previously, Mr. Chiel served as general counsel (2004-2012) and senior vice president and deputy general counsel (2000-2004) for John Hancock Financial Services; a partner with Choate, Hall & Stewart (1996-2000) (law firm); and an Assistant United States Attorney for the United States Attorney’s Office of the District of Massachusetts (1986-95), including Chief of the Criminal Division (1993-1995). Mr. Chiel is a director on the boards of the Boston Bar Foundation and the Maimonides School.
James C. Curvey (1935)
Year of Election or Appointment: 2007
Trustee
Chairman of the Board of Trustees
Mr. Curvey also serves as Trustee of other Fidelity® funds. Mr. Curvey is Vice Chairman (2007-present) and Director of FMR LLC (diversified financial services company). In addition, Mr. Curvey is an Overseer Emeritus for the Boston Symphony Orchestra, a Director of Artis-Naples, and a Trustee of Brewster Academy in Wolfeboro, New Hampshire. Previously, Mr. Curvey served as a Director of Fidelity Research & Analysis Co. (investment adviser firm, 2009-2018), Director of Fidelity Investments Money Management, Inc. (investment adviser firm, 2009-2014) and a Director of FMR and FMR Co., Inc. (investment adviser firms, 2007-2014).
Charles S. Morrison (1960)
Year of Election or Appointment: 2014
Trustee
Mr. Morrison also serves as Trustee of other funds. He serves as President of Fidelity SelectCo, LLC (investment adviser firm, 2017-present) and Fidelity Management & Research Company (FMR) (investment adviser firm, 2016-present), a Director of Fidelity Investments Money Management, Inc. (FIMM) (investment adviser firm, 2014-present), Director of Fidelity SelectCo, LLC (investment adviser firm, 2014-present), President, Asset Management (2014-present), and is an employee of Fidelity Investments. Previously, Mr. Morrison served as Vice President of Fidelity's Fixed Income and Asset Allocation Funds (2012-2014), President, Fixed Income (2011-2014), Vice President of Fidelity's Money Market Funds (2005-2009), President, Money Market Group Leader of FMR (investment adviser firm, 2009), and Senior Vice President, Money Market Group of FMR (2004-2009). Mr. Morrison also served as Vice President of Fidelity's Bond Funds (2002-2005), certain Balanced Funds (2002-2005), and certain Asset Allocation Funds (2002-2007), and as Senior Vice President (2002-2005) of Fidelity's Bond Division.
* Determined to be an “Interested Trustee” by virtue of, among other things, his or her affiliation with the trust or various entities under common control with FMR.
+ The information includes the Trustee's principal occupation during the last five years and other information relating to the experience, attributes, and skills relevant to the Trustee's qualifications to serve as a Trustee, which led to the conclusion that the Trustee should serve as a Trustee for the fund.
Independent Trustees:
Correspondence intended for an Independent Trustee may be sent to Fidelity Investments, P.O. Box 55235, Boston, Massachusetts 02205-5235.
Name, Year of Birth; Principal Occupations and Other Relevant Experience+
Dennis J. Dirks (1948)
Year of Election or Appointment: 2005
Trustee
Mr. Dirks also serves as Trustee of other Fidelity® funds. Prior to his retirement in May 2003, Mr. Dirks was Chief Operating Officer and a member of the Board of The Depository Trust & Clearing Corporation (DTCC). He also served as President, Chief Operating Officer, and Board member of The Depository Trust Company (DTC) and President and Board member of the National Securities Clearing Corporation (NSCC). In addition, Mr. Dirks served as Chief Executive Officer and Board member of the Government Securities Clearing Corporation, Chief Executive Officer and Board member of the Mortgage-Backed Securities Clearing Corporation, as a Trustee and a member of the Finance Committee of Manhattan College (2005-2008), as a Trustee and a member of the Finance Committee of AHRC of Nassau County (2006-2008), as a member of the Independent Directors Council (IDC) Governing Council (2010-2015), and as a member of the Board of Directors for The Brookville Center for Children’s Services, Inc. (2009-2017). Mr. Dirks is a member of the Finance Committee (2016-present), Board of Directors (2017-present) and Board of Trustees (2018-present) and is Treasurer (2018-present) of the Asolo Repertory Theatre.
Donald F. Donahue (1950)
Year of Election or Appointment: 2018
Trustee
Mr. Donahue also serves as a Trustee of other Fidelity® funds. Mr. Donahue is President and Chief Executive Officer of Miranda Partners, LLC (risk consulting for the financial services industry, 2012-present). Previously, Mr. Donahue served as a Member of the Advisory Board of certain Fidelity® funds (2015-2018) and Chief Executive Officer (2006-2012), Chief Operating Officer (2003-2006), and Managing Director, Customer Marketing and Development (1999-2003) of The Depository Trust & Clearing Corporation (financial markets infrastructure). Mr. Donahue serves as a Member (2007-present) and Co-Chairman (2016-present) of the Board of Directors of United Way of New York, Member of the Board of Directors of NYC Leadership Academy (2012-present) and Member of the Board of Advisors of Ripple Labs, Inc. (financial services, 2015-present). He also served as Chairman (2010-2012) and Member of the Board of Directors (2012-2013) of Omgeo, LLC (financial services), Treasurer of United Way of New York (2012-2016), and Member of the Board of Directors of XBRL US (financial services non-profit, 2009-2012) and the International Securities Services Association (2009-2012).
Alan J. Lacy (1953)
Year of Election or Appointment: 2008
Trustee
Mr. Lacy also serves as Trustee of other Fidelity® funds. Mr. Lacy serves as a Director of Bristol-Myers Squibb Company (global pharmaceuticals, 2008-present). He is a Trustee of the California Chapter of The Nature Conservancy (2015-present) and a Director of the Center for Advanced Study in the Behavioral Sciences at Stanford University (2015-present). In addition, Mr. Lacy served as Senior Adviser (2007-2014) of Oak Hill Capital Partners, L.P. (private equity) and also served as Chief Executive Officer (2005) and Vice Chairman (2005-2006) of Sears Holdings Corporation (retail) and Chief Executive Officer and Chairman of the Board of Sears, Roebuck and Co. (retail, 2000-2005). Previously, Mr. Lacy served as Chairman (2014-2017) and a member (2010-2017) of the Board of Directors of Dave & Buster’s Entertainment, Inc. (restaurant and entertainment complexes), as Chairman (2008-2011) and a member (2006-2015) of the Board of Trustees of the National Parks Conservation Association, and as a member of the Board of Directors for The Hillman Companies, Inc. (hardware wholesalers, 2010-2014), Earth Fare, Inc. (retail grocery, 2010-2014), and The Western Union Company (global money transfer, 2006-2011).
Ned C. Lautenbach (1944)
Year of Election or Appointment: 2000
Trustee
Chairman of the Independent Trustees
Mr. Lautenbach also serves as Trustee of other Fidelity® funds. Mr. Lautenbach currently serves as Vice Chair of the Board of Governors, State University System of Florida (2013-present) and is a member of the Council on Foreign Relations (1994-present). He is also a member and has most recently served as Chairman of the Board of Directors of Artis-Naples (2012-present). Previously, Mr. Lautenbach served as a member and then Lead Director of the Board of Directors of Eaton Corporation (diversified industrial, 1997-2016). He was also a Partner and Advisory Partner at Clayton, Dubilier & Rice, LLC (private equity investment, 1998-2010), as well as a Director of Sony Corporation (2006-2007). In addition, Mr. Lautenbach also had a 30-year career with IBM (technology company) during which time he served as Senior Vice President and a member of the Corporate Executive Committee (1968-1998).
Joseph Mauriello (1944)
Year of Election or Appointment: 2008
Trustee
Mr. Mauriello also serves as Trustee of other Fidelity® funds. Prior to his retirement in January 2006, Mr. Mauriello served in numerous senior management positions including Deputy Chairman and Chief Operating Officer (2004-2005), and Vice Chairman of Financial Services (2002-2004) of KPMG LLP US (professional services, 1965-2005). Mr. Mauriello currently serves as a member of the Board of Directors of XL Group plc. (global insurance and re-insurance, 2006-present) and the Independent Directors Council (IDC) Governing Council (2015-present). Previously, Mr. Mauriello served as a Director of the Hamilton Funds of the Bank of New York (2006-2007) and of Arcadia Resources Inc. (health care services and products, 2007-2012).
Cornelia M. Small (1944)
Year of Election or Appointment: 2005
Trustee
Ms. Small also serves as Trustee of other Fidelity® funds. Ms. Small is a member of the Board of Directors (2009-present) and Chair of the Investment Committee (2010-present) of the Teagle Foundation. Ms. Small also serves on the Investment Committee of the Berkshire Taconic Community Foundation (2008-present). Previously, Ms. Small served as Chairperson (2002-2008) and a member of the Investment Committee and Chairperson (2008-2012) and a member of the Board of Trustees of Smith College. In addition, Ms. Small served as Chief Investment Officer, Director of Global Equity Investments, and a member of the Board of Directors of Scudder, Stevens & Clark and Scudder Kemper Investments.
Garnett A. Smith (1947)
Year of Election or Appointment: 2018
Trustee
Mr. Smith also serves as Trustee of other Fidelity® funds. Prior to Mr. Smith's retirement, he served as Chairman and Chief Executive Officer of Inbrand Corp. (manufacturer of personal absorbent products, 1990-1997). He also served as President (1986-1990) of Inbrand Corp. Prior to his employment with Inbrand Corp., he was employed by a retail fabric chain and North Carolina National Bank. In addition, Mr. Smith served as a Member of the Advisory Board of certain Fidelity® funds (2012-2013) and as a board member of the Jackson Hole Land Trust (2009-2012).
David M. Thomas (1949)
Year of Election or Appointment: 2008
Trustee
Mr. Thomas also serves as Trustee of other Fidelity® funds. Mr. Thomas serves as Non-Executive Chairman of the Board of Directors of Fortune Brands Home and Security (home and security products, 2011-present), as a member of the Board of Directors (2004-present) and Presiding Director (2013-present) of Interpublic Group of Companies, Inc. (marketing communication), and as a member of the Board of Trustees of the University of Florida (2013-present). Previously, Mr. Thomas served as Executive Chairman (2005-2006) and Chairman and Chief Executive Officer (2000-2005) of IMS Health, Inc. (pharmaceutical and healthcare information solutions), and a Director of Fortune Brands, Inc. (consumer products, 2000-2011).
+ The information includes the Trustee's principal occupation during the last five years and other information relating to the experience, attributes, and skills relevant to the Trustee's qualifications to serve as a Trustee, which led to the conclusion that the Trustee should serve as a Trustee for the fund.
Advisory Board Members and Officers:
Correspondence intended for a Member of the Advisory Board (if any) may be sent to Fidelity Investments, P.O. Box 55235, Boston, Massachusetts 02205-5235. Correspondence intended for an officer or Peter S. Lynch may be sent to Fidelity Investments, 245 Summer Street, Boston, Massachusetts 02210. Officers appear below in alphabetical order.
Name, Year of Birth; Principal Occupation
Peter S. Lynch (1944)
Year of Election or Appointment: 2003
Member of the Advisory Board
Mr. Lynch also serves as Member of the Advisory Board of other Fidelity® funds. Mr. Lynch is Vice Chairman and a Director of FMR (investment adviser firm) and FMR Co., Inc. (investment adviser firm). In addition, Mr. Lynch serves as a Trustee of Boston College and as the Chairman of the Inner-City Scholarship Fund. Previously, Mr. Lynch served on the Special Olympics International Board of Directors (1997-2006).
William S. Stavropoulos (1939)
Year of Election or Appointment: 2018
Member of the Advisory Board
Mr. Stavropoulos also serves as Member of the Advisory Board of other Fidelity® funds. Mr. Stavropoulos serves as President and Founder of the Michigan Baseball Foundation, the Great Lakes Loons (2007-present). Mr. Stavropoulos is Chairman Emeritus of the Board of Directors of The Dow Chemical Company, where he previously served in numerous senior management positions, including President, CEO (1995-2000; 2002-2004), Chairman of the Executive Committee (2000-2006), and as a member of the Board of Directors (1990-2006). Currently, Mr. Stavropoulos is Chairman of the Board of Directors of Univar Inc. (global distributor of commodity and specialty chemicals), a Director of Teradata Corporation (data warehousing and technology solutions), and a member of the Advisory Board for Metalmark Capital LLC (private equity investment, 2005-present). Mr. Stavropoulos is an operating advisor to Clayton, Dubilier & Rice, LLC (private equity investment). In addition, Mr. Stavropoulos is a member of the University of Notre Dame Advisory Council for the College of Science, a Trustee of the Rollin L. Gerstacker Foundation, and a Director of Artis-Naples in Naples, Florida. Previously, Mr. Stavropoulos served as Trustee of certain Fidelity® funds (2001-2018) and as a Director of Chemical Financial Corporation (bank holding company, 1993-2012) and Tyco International, Ltd. (multinational manufacturing and services, 2007-2012).
Carol B. Tomé (1957)
Year of Election or Appointment: 2018
Member of the Advisory Board
Ms. Tomé also serves as Member of the Advisory Board of other Fidelity® funds. Ms. Tomé is Chief Financial Officer (2001-present) and Executive Vice President of Corporate Services (2007-present) of The Home Depot, Inc. (home improvement retailer) and a Director (2003-present) and Chair of the Audit Committee (2004-present) of United Parcel Service, Inc. (package delivery and supply chain management). Previously, Ms. Tomé served as Trustee of certain Fidelity® funds (2017), Senior Vice President of Finance and Accounting/Treasurer (2000-2007) and Vice President and Treasurer (1995-2000) of The Home Depot, Inc. and Chair of the Board (2010-2012), Vice Chair of the Board (2009 and 2013), and a Director (2008-2013) of the Federal Reserve Bank of Atlanta. Ms. Tomé is also a director or trustee of many community and professional organizations.
Michael E. Wiley (1950)
Year of Election or Appointment: 2018
Member of the Advisory Board
Mr. Wiley also serves as Trustee or Member of the Advisory Board of other Fidelity® funds. Mr. Wiley serves as a Director of Andeavor Corporation (independent oil refiner and marketer, 2005-present), a Director of Andeavor Logistics LP (natural resources logistics, 2015-present), and a Director of Bill Barrett Corporation (exploration and production, 2005-present). In addition, Mr. Wiley also serves as a Director of Post Oak Bank (privately-held bank, 2004-present). Previously, Mr. Wiley served as a Trustee of other Fidelity® funds (2008-2013), as a Director of Asia Pacific Exploration Consolidated (international oil and gas exploration and production, 2008-2013), as a member of the Board of Trustees of the University of Tulsa (2000-2006; 2007-2010), as a Senior Energy Advisor of Katzenbach Partners, LLC (consulting, 2006-2007), as an Advisory Director of Riverstone Holdings (private investment), Chairman, President, and CEO of Baker Hughes, Inc. (oilfield services, 2000-2004), and as Director of Spinnaker Exploration Company (exploration and production, 2001-2005).
Elizabeth Paige Baumann (1968)
Year of Election or Appointment: 2017
Anti-Money Laundering (AML) Officer
Ms. Baumann also serves as AML Officer of other funds. She is Chief AML Officer (2012-present) and Senior Vice President (2014-present) of FMR LLC (diversified financial services company) and is an employee of Fidelity Investments. Previously, Ms. Baumann served as AML Officer of the funds (2012-2016), and Vice President (2007-2014) and Deputy Anti-Money Laundering Officer (2007-2012) of FMR LLC.
Marc R. Bryant (1966)
Year of Election or Appointment: 2015
Secretary and Chief Legal Officer (CLO)
Mr. Bryant also serves as Secretary and CLO of other funds. Mr. Bryant serves as CLO, Secretary, and Senior Vice President of Fidelity Management & Research Company (investment adviser firm, 2015-present) and FMR Co., Inc. (investment adviser firm, 2015-present); Secretary of Fidelity SelectCo, LLC (investment adviser firm, 2015-present) and Fidelity Investments Money Management, Inc. (investment adviser firm, 2015-present); and CLO of Fidelity Management & Research (Hong Kong) Limited and FMR Investment Management (UK) Limited (investment adviser firms, 2015-present) and Fidelity Management & Research (Japan) Limited (investment adviser firm, 2016-present). He is Senior Vice President and Deputy General Counsel of FMR LLC (diversified financial services company). Previously, Mr. Bryant served as Secretary and CLO of Fidelity Rutland Square Trust II (2010-2014) and Assistant Secretary of Fidelity's Fixed Income and Asset Allocation Funds (2013-2015). Prior to joining Fidelity Investments, Mr. Bryant served as a Senior Vice President and the Head of Global Retail Legal for AllianceBernstein L.P. (2006-2010), and as the General Counsel for ProFund Advisors LLC (2001-2006).
John J. Burke III (1964)
Year of Election or Appointment: 2018
Chief Financial Officer
Mr. Burke also serves as Chief Financial Officer of other funds. Mr. Burke serves as Head of Investment Operations for Fidelity Fund and Investment Operations (2018-present) and is an employee of Fidelity Investments (1998-present). Previously Mr. Burke served as head of Asset Management Investment Operations (2012-2018).
William C. Coffey (1969)
Year of Election or Appointment: 2009
Assistant Secretary
Mr. Coffey also serves as Assistant Secretary of other funds. He is Senior Vice President and Deputy General Counsel of FMR LLC (diversified financial services company, 2010-present), and is an employee of Fidelity Investments. Previously, Mr. Coffey served as Vice President and Associate General Counsel of FMR LLC (2005-2009).
Timothy M. Cohen (1969)
Year of Election or Appointment: 2018
Vice President
Mr. Cohen also serves as Vice President of other funds. Mr. Cohen serves as Co-Head of Global Equity Research (2016-present), a Director of Fidelity Management & Research (Japan) Limited (investment adviser firm, 2016-present), and is an employee of Fidelity Investments. Previously, Mr. Cohen served as Chief Investment Officer - Equity and a Director of Fidelity Management & Research (U.K.) Inc. (investment adviser firm, 2013-2015) and as a Director of Fidelity Management & Research (Hong Kong) Limited (investment adviser firm, 2017).
Jonathan Davis (1968)
Year of Election or Appointment: 2010
Assistant Treasurer
Mr. Davis also serves as Assistant Treasurer of other funds. Mr. Davis serves as Assistant Treasurer of FMR Capital, Inc. (2017-present) and is an employee of Fidelity Investments. Previously, Mr. Davis served as Vice President and Associate General Counsel of FMR LLC (diversified financial services company, 2003-2010).
Adrien E. Deberghes (1967)
Year of Election or Appointment: 2016
Assistant Treasurer
Mr. Deberghes also serves as an officer of other funds. He serves as Assistant Treasurer of FMR Capital, Inc. (2017-present), Executive Vice President of Fidelity Investments Money Management, Inc. (FIMM) (investment adviser firm, 2016-present), and is an employee of Fidelity Investments (2008-present). Previously, Mr. Deberghes served as President and Treasurer of certain Fidelity® funds (2013-2018). Prior to joining Fidelity Investments, Mr. Deberghes was Senior Vice President of Mutual Fund Administration at State Street Corporation (2007-2008), Senior Director of Mutual Fund Administration at Investors Bank & Trust (2005-2007), and Director of Finance for Dunkin' Brands (2000-2005). Previously, Mr. Deberghes served in other fund officer roles.
Laura M. Del Prato (1964)
Year of Election or Appointment: 2018
Assistant Treasurer
Ms. Del Prato also serves as an officer of other funds. Ms. Del Prato is an employee of Fidelity Investments (2017-present). Prior to joining Fidelity Investments, Ms. Del Prato served as a Managing Director and Treasurer of the JPMorgan Mutual Funds (2014-2017). Prior to JPMorgan, Ms. Del Prato served as a partner at Cohen Fund Audit Services (accounting firm, 2012-2013) and KPMG LLP (accounting firm, 2004-2012).
Colm A. Hogan (1973)
Year of Election or Appointment: 2016
Deputy Treasurer
Mr. Hogan also serves as an officer of other funds. Mr. Hogan serves as Assistant Treasurer of FMR Capital, Inc. (2017-present) and is an employee of Fidelity Investments (2005-present). Previously, Mr. Hogan served as Assistant Treasurer of certain Fidelity® funds (2016-2018).
Pamela R. Holding (1964)
Year of Election or Appointment: 2018
Vice President
Ms. Holding also serves as a Vice President of other funds. Ms. Holding serves as Co-Head of Global Equity Research (2018-present) and is an employee of Fidelity Investments (2013-present).
Chris Maher (1972)
Year of Election or Appointment: 2013
Assistant Treasurer
Mr. Maher serves as Assistant Treasurer of other funds. Mr. Maher is Vice President of Valuation Oversight, serves as Assistant Treasurer of FMR Capital, Inc. (2017-present), and is an employee of Fidelity Investments. Previously, Mr. Maher served as Vice President of Asset Management Compliance (2013), Vice President of the Program Management Group of FMR (investment adviser firm, 2010-2013), and Vice President of Valuation Oversight (2008-2010).
Rieco E. Mello (1969)
Year of Election or Appointment: 2017
Assistant Treasurer
Mr. Mello also serves as Assistant Treasurer of other funds. Mr. Mello serves as Assistant Treasurer of FMR Capital, Inc. (2017-present) and is an employee of Fidelity Investments (1995-present).
Kenneth B. Robins (1969)
Year of Election or Appointment: 2016
Chief Compliance Officer
Mr. Robins also serves as an officer of other funds. Mr. Robins serves as Compliance Officer of Fidelity Management & Research Company and FMR Co., Inc. (investment adviser firms, 2016-present) and is an employee of Fidelity Investments (2004-present). Previously, Mr. Robins served as Executive Vice President of Fidelity Investments Money Management, Inc. (investment adviser firm, 2013-2016) and served in other fund officer roles.
Stacie M. Smith (1974)
Year of Election or Appointment: 2016
President and Treasurer
Ms. Smith also serves as an officer of other funds. Ms. Smith serves as Assistant Treasurer of FMR Capital, Inc. (2017-present), is an employee of Fidelity Investments (2009-present), and has served in other fund officer roles. Prior to joining Fidelity Investments, Ms. Smith served as Senior Audit Manager of Ernst & Young LLP (accounting firm, 1996-2009). Previously, Ms. Smith served as Assistant Treasurer (2013-2018) and Deputy Treasurer (2013-2016) of certain Fidelity® funds.
Marc L. Spector (1972)
Year of Election or Appointment: 2016
Assistant Treasurer
Mr. Spector also serves as an officer of other funds. Mr. Spector serves as Assistant Treasurer of FMR Capital, Inc. (2017-present) and is an employee of Fidelity Investments (2016-present). Prior to joining Fidelity Investments, Mr. Spector served as Director at the Siegfried Group (accounting firm, 2013-2016), and prior to Siegfried Group as audit senior manager at Deloitte & Touche (accounting firm, 2005-2013).
Renee Stagnone (1975)
Year of Election or Appointment: 2016
Assistant Treasurer
Ms. Stagnone also serves as an officer of other funds. Ms. Stagnone serves as Assistant Treasurer of FMR Capital, Inc. (2017-present) and is an employee of Fidelity Investments (1997-present). Previously, Ms. Stagnone served as Deputy Treasurer of certain Fidelity® funds (2013-2016).
Shareholder Expense Example
As a shareholder of the Fund, you incur two types of costs: (1) transaction costs and (2) ongoing costs, including other Fund expenses. This Example is intended to help you understand your ongoing costs (in dollars) of investing in the Fund and to compare these costs with the ongoing costs of investing in other mutual funds.
The Example is based on an investment of $1,000 invested at the beginning of the period and held for the entire period (February 1, 2018 to July 31, 2018).
Actual Expenses
The first line of the accompanying table provides information about actual account values and actual expenses. You may use the information in this line, together with the amount you invested, to estimate the expenses that you paid over the period. Simply divide your account value by $1,000.00 (for example, an $8,600 account value divided by $1,000.00 = 8.6), then multiply the result by the number in the first line under the heading entitled "Expenses Paid During Period" to estimate the expenses you paid on your account during this period. In addition, the Fund, as a shareholder in the underlying Fidelity Central Funds, will indirectly bear its pro-rata share of the fees and expenses incurred by the underlying Fidelity Central Funds. These fees and expenses are not included in the Fund's annualized expense ratio used to calculate the expense estimate in the table below.
Hypothetical Example for Comparison Purposes
The second line of the accompanying table provides information about hypothetical account values and hypothetical expenses based on the Fund's actual expense ratio and an assumed rate of return of 5% per year before expenses, which is not the Fund's actual return. The hypothetical account values and expenses may not be used to estimate the actual ending account balance or expenses you paid for the period. You may use this information to compare the ongoing costs of investing in the Fund and other funds. To do so, compare this 5% hypothetical example with the 5% hypothetical examples that appear in the shareholder reports of the other funds. In addition, the Fund, as a shareholder in the underlying Fidelity Central Funds, will indirectly bear its pro-rata share of the fees and expenses incurred by the underlying Fidelity Central Funds. These fees and expenses are not included in the Fund's annualized expense ratio used to calculate the expense estimate in the table below.
Please note that the expenses shown in the table are meant to highlight your ongoing costs only and do not reflect any transaction costs. Therefore, the second line of the table is useful in comparing ongoing costs only, and will not help you determine the relative total costs of owning different funds.
| | Annualized Expense Ratio-A | Beginning
Account Value
February 1, 2018 | Ending
Account Value
July 31, 2018 | Expenses Paid
During Period-B
February 1, 2018
to July 31, 2018 |
| Series Blue Chip Growth | - %-C | | | |
| Actual | | $1,000.00 | $1,057.90 | $--D |
| Hypothetical-E | | $1,000.00 | $1,024.77 | $--D |
A Annualized expense ratio reflects expenses net of applicable fee waivers.
B Expenses are equal to the Fund's annualized expense ratio, multiplied by the average account value over the period, multiplied by 181/365 (to reflect the one-half year period).
C Amount represents less than .005%.
D Amount represents less than $.005.
E 5% return per year before expenses
Distributions (Unaudited)
The Board of Trustees of Fidelity Series Blue Chip Growth Fund voted to pay on September 17, 2018, to shareholders of record at the opening of business on September 14, 2018, a distribution of $1.491 per share derived from capital gains realized from sales of portfolio securities and a dividend of $0.075 per share from net investment income.
The fund hereby designates as a capital gain dividend with respect to the taxable year ended July 31, 2018, $642,686,078, or, if subsequently determined to be different, the net capital gain of such year.
The fund designates 100% and 75% of the dividends distributed in September and December 2017, respectively during the fiscal year as qualifying for the dividends–received deduction for corporate shareholders.
The fund 100% and 90% of the dividends distributed in September and December 2017, respectively during the fiscal year as amounts which may be taken into account as a dividend for the purposes of the maximum rate under section 1(h)(11) of the Internal Revenue Code.
The fund will notify shareholders in January 2019 of amounts for use in preparing 2018 income tax returns.
Board Approval of Investment Advisory Contracts
Fidelity Series Blue Chip Growth Fund
At its July 2018 meeting, the Board of Trustees, including the Independent Trustees (together, the Board), voted to continue the management contract with Fidelity Management & Research Company (FMR) and the sub-advisory agreements (together, the Advisory Contracts) for the fund for six months through January 31, 2019, in connection with the reunification of the Fidelity Equity High Income Funds Board, which oversees the fund, and the Sector Portfolios Board.
The Board considered that the approval of the fund's Advisory Contracts will not result in any changes in (i) the investment process or strategies employed in the management of the fund's assets; (ii) the fees and expenses paid by shareholders, including the expense cap arrangement currently in place for the fund; (iii) the nature, extent or quality of services provided under the fund's Advisory Contracts; or (iv) the day-to-day management of the fund or the persons primarily responsible for such management. The Board concluded that the fund's Advisory Contracts are fair and reasonable, and that the fund's Advisory Contracts should be renewed, without modification, through January 31, 2019, with the understanding that the Board will consider the annual renewal for a full one year period in January 2019.
In connection with its consideration of future renewals of the fund's Advisory Contracts, the Board will consider: (i) the nature, extent and quality of services provided to the fund, including shareholder and administrative services and investment performance; (ii) the competitiveness of the management fee and total expenses for the fund; (iii) the costs of the services and profitability, including the revenues earned and the expenses incurred in conducting the business of developing, marketing, distributing, managing, administering, and servicing the fund and its shareholders, to the extent applicable, as well as potential fall-out benefits from Fidelity's non-fund businesses; and (iv) whether there have been economies of scale in respect of the Fidelity funds, whether the Fidelity funds (including the fund) have appropriately benefited from any such economies of scale, and whether there is the potential for realization of any further economies.
Based on its evaluation of all of the conclusions noted above, and after considering all factors it believed relevant, the Board ultimately concluded that the fund's management fee structure is fair and reasonable, and that the continuation of the fund's Advisory Contracts should be approved.
Corporate Headquarters
245 Summer St.
Boston, MA 02210
www.fidelity.com
XS1-ANN-0918
1.967985.104
Fidelity Flex℠ Funds Fidelity Flex℠ Large Cap Growth Fund
Annual Report July 31, 2018 |
|
Contents
To view a fund's proxy voting guidelines and proxy voting record for the 12-month period ended June 30, visit http://www.fidelity.com/proxyvotingresults or visit the Securities and Exchange Commission's (SEC) web site at http://www.sec.gov.
You may also call 1-800-835-5092 to request a free copy of the proxy voting guidelines.
Standard & Poor's, S&P and S&P 500 are registered service marks of The McGraw-Hill Companies, Inc. and have been licensed for use by Fidelity Distributors Corporation.
Other third-party marks appearing herein are the property of their respective owners.
All other marks appearing herein are registered or unregistered trademarks or service marks of FMR LLC or an affiliated company. © 2018 FMR LLC. All rights reserved.
This report and the financial statements contained herein are submitted for the general information of the shareholders of the Fund. This report is not authorized for distribution to prospective investors in the Fund unless preceded or accompanied by an effective prospectus.
A fund files its complete schedule of portfolio holdings with the SEC for the first and third quarters of each fiscal year on Form N-Q. Forms N-Q are available on the SEC’s web site at http://www.sec.gov. A fund's Forms N-Q may be reviewed and copied at the SEC’s Public Reference Room in Washington, DC. Information regarding the operation of the SEC's Public Reference Room may be obtained by calling 1-800-SEC-0330.
For a complete list of a fund's portfolio holdings, view the most recent holdings listing, semiannual report, or annual report on Fidelity's web site at http://www.fidelity.com, http://www.institutional.fidelity.com, or http://www.401k.com, as applicable.
NOT FDIC INSURED •MAY LOSE VALUE •NO BANK GUARANTEE
Neither the Fund nor Fidelity Distributors Corporation is a bank.
Performance: The Bottom Line
Average annual total return reflects the change in the value of an investment, assuming reinvestment of distributions from dividend income and capital gains (the profits earned upon the sale of securities that have grown in value, if any) and assuming a constant rate of performance each year. The hypothetical investment and the average annual total returns do not reflect the deduction of taxes that a shareholder would pay on fund distributions or the redemption of fund shares. During periods of reimbursement by Fidelity, a fund’s total return will be greater than it would be had the reimbursement not occurred. How a fund did yesterday is no guarantee of how it will do tomorrow.
Average Annual Total Returns
| For the periods ended July 31, 2018 | Past 1 year | Life of fundA |
| Fidelity Flex℠ Large Cap Growth Fund | 24.90% | 28.21% |
A From March 8, 2017
$10,000 Over Life of Fund
Let's say hypothetically that $10,000 was invested in Fidelity Flex℠ Large Cap Growth Fund on March 8, 2017, when the fund started.
The chart shows how the value of your investment would have changed, and also shows how the Russell 1000® Growth Index performed over the same period.
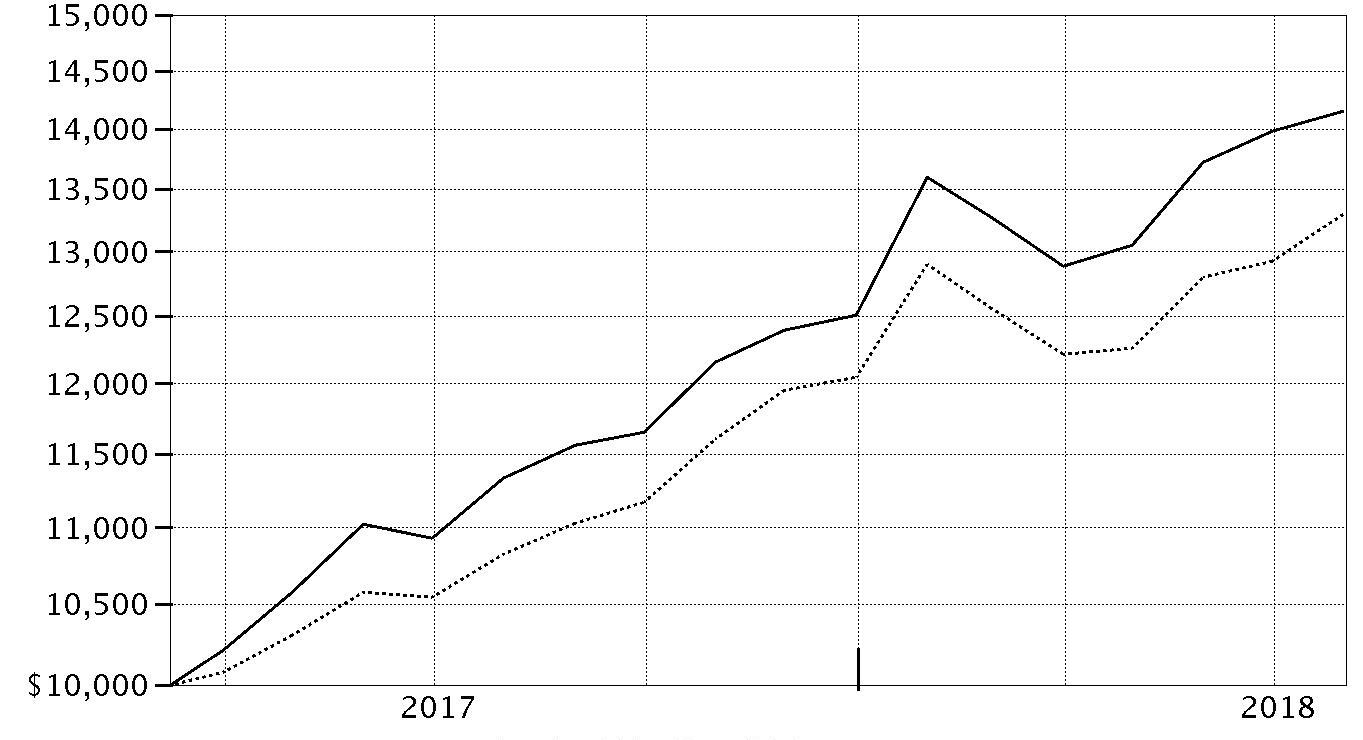
| Period Ending Values |
| $14,151 | Fidelity Flex℠ Large Cap Growth Fund |
| $13,300 | Russell 1000® Growth Index |
Management's Discussion of Fund Performance
Market Recap: The U.S. equity bellwether S&P 500
® index gained 16.24% for the 12 months ending July 31, 2018, despite a resurgence in volatility that challenged the multiyear bull market. Stocks maintained their steady growth until a sharp reversal in February, as volatility spiked amid fear that rising inflation and the potential for the economy to overheat would prompt the U.S. Federal Reserve to pick up the pace of interest rate hikes. The index posted its first negative monthly result since October 2016, and then lost further ground in March on fear of a global trade war. The market stabilized in April and turned upward through mid-June, when escalating trade tension between the U.S. and China soured investor sentiment. The resulting uncertainty lingered into July, but strong corporate earnings helped the S&P 500 rise 3.72% that month to cap the period. For the full one-year period, growth handily topped value, while small-caps bested large-caps. By sector, information technology (+28%) led the way, boosted by strong earnings growth from several major index constituents. Consumer discretionary rose roughly 24%, driven by retailers (+49%). Energy (+20%) gained alongside higher oil prices. Laggards were telecommunication services (-2%), consumer staples (0%) and utilities (+3%), defensive groups that struggled amid rising interest rates and a general preference for risk. Real estate (+5%) fared a bit better but still lagged, as did financials, industrials, health care (each up 13%) and materials (+11%).
Comments from Portfolio Manager Sonu Kalra: For the fiscal year, the fund gained 24.90%, ahead of the 22.84% return of the benchmark Russell 1000
® Growth Index. Versus the benchmark, security selection in consumer discretionary contributed most. It also helped to overweight this strong-performing sector, particularly retailers. My picks in energy and information technology also helped our relative result. An overweighting in Amazon.com, one of the fund’s largest holdings, was the largest individual contributor. Amazon continued to take market share from overall retail sales, and also showed continued growth in its Amazon Web Services (AWS) cloud business, as well as signs of improving profitability. An overweighting in chip designer Nvidia was another notable contributor. Nvidia makes chips for AI (artificial intelligence), VR (virtual reality) and autonomous-driving applications, among others. This period, the company continued to grow its AI/machine learning business and advanced its hardware and software offerings. Conversely, my picks in health care hurt the fund’s result versus the benchmark. Here, Regeneron Pharmaceuticals was the largest individual detractor. The firm faced a number of headwinds the past 12 months, including a slow start for its cholesterol drug Praluent
®, which faced stiff competition and slow reimbursement from insurers.
The views expressed above reflect those of the portfolio manager(s) only through the end of the period as stated on the cover of this report and do not necessarily represent the views of Fidelity or any other person in the Fidelity organization. Any such views are subject to change at any time based upon market or other conditions and Fidelity disclaims any responsibility to update such views. These views may not be relied on as investment advice and, because investment decisions for a Fidelity fund are based on numerous factors, may not be relied on as an indication of trading intent on behalf of any Fidelity fund.
Investment Summary (Unaudited)
Top Ten Stocks as of July 31, 2018
| | % of fund's net assets |
| Alphabet, Inc. Class A | 7.9 |
| Amazon.com, Inc. | 7.1 |
| Apple, Inc. | 6.2 |
| Microsoft Corp. | 4.6 |
| Facebook, Inc. Class A | 3.7 |
| NVIDIA Corp. | 2.8 |
| Salesforce.com, Inc. | 2.5 |
| Visa, Inc. Class A | 2.0 |
| Tesla, Inc. | 1.9 |
| Broadcom, Inc. | 1.9 |
| | 40.6 |
Top Five Market Sectors as of July 31, 2018
| | % of fund's net assets |
| Information Technology | 46.2 |
| Consumer Discretionary | 24.5 |
| Health Care | 9.6 |
| Industrials | 4.5 |
| Financials | 4.1 |
Asset Allocation (% of fund's net assets)
| As of July 31, 2018* |
| | Stocks | 95.4% |
| | Convertible Securities | 1.4% |
| | Short-Term Investments and Net Other Assets (Liabilities) | 3.2% |

* Foreign investments – 9.6%
Schedule of Investments July 31, 2018
Showing Percentage of Net Assets
| Common Stocks - 95.4% | | | |
| | | Shares | Value |
| CONSUMER DISCRETIONARY - 24.4% | | | |
| Auto Components - 0.1% | | | |
| Aptiv PLC | | 87 | $8,532 |
| Veoneer, Inc. (a) | | 58 | 3,033 |
| | | | 11,565 |
| Automobiles - 1.9% | | | |
| Tesla, Inc. (a) | | 950 | 283,233 |
| Diversified Consumer Services - 0.3% | | | |
| Chegg, Inc. (a) | | 243 | 6,731 |
| Grand Canyon Education, Inc. (a) | | 29 | 3,379 |
| New Oriental Education & Technology Group, Inc. sponsored ADR | | 323 | 27,791 |
| Weight Watchers International, Inc. (a) | | 121 | 10,833 |
| | | | 48,734 |
| Hotels, Restaurants & Leisure - 2.3% | | | |
| Accor SA | | 24 | 1,237 |
| Alsea S.A.B. de CV | | 700 | 2,415 |
| Caesars Entertainment Corp. (a) | | 1,223 | 13,820 |
| Chipotle Mexican Grill, Inc. (a) | | 82 | 35,560 |
| Eldorado Resorts, Inc. (a) | | 30 | 1,286 |
| Hilton Grand Vacations, Inc. (a) | | 336 | 11,622 |
| Hilton Worldwide Holdings, Inc. | | 168 | 13,215 |
| International Game Technology PLC | | 356 | 9,000 |
| Las Vegas Sands Corp. | | 201 | 14,452 |
| Marriott International, Inc. Class A | | 214 | 27,358 |
| McDonald's Corp. | | 465 | 73,256 |
| Melco Crown Entertainment Ltd. sponsored ADR | | 259 | 6,698 |
| Penn National Gaming, Inc. (a) | | 143 | 4,583 |
| Planet Fitness, Inc. (a) | | 336 | 15,967 |
| Restaurant Brands International, Inc. | | 254 | 16,204 |
| Royal Caribbean Cruises Ltd. | | 245 | 27,626 |
| Shake Shack, Inc. Class A (a) | | 99 | 6,171 |
| U.S. Foods Holding Corp. (a) | | 614 | 20,759 |
| Vail Resorts, Inc. | | 23 | 6,368 |
| Wyndham Destinations, Inc. | | 199 | 9,178 |
| Wyndham Hotels & Resorts, Inc. | | 168 | 9,744 |
| Wynn Resorts Ltd. | | 14 | 2,335 |
| | | | 328,854 |
| Household Durables - 0.2% | | | |
| Forbo Holding AG (Reg.) | | 1 | 1,585 |
| iRobot Corp. (a) | | 19 | 1,506 |
| SodaStream International Ltd. (a) | | 240 | 20,952 |
| | | | 24,043 |
| Internet & Direct Marketing Retail - 9.9% | | | |
| Amazon.com, Inc. (a) | | 586 | 1,041,580 |
| JD.com, Inc. sponsored ADR (a) | | 1,844 | 66,126 |
| Netflix, Inc. (a) | | 584 | 197,071 |
| The Booking Holdings, Inc. (a) | | 60 | 121,723 |
| TripAdvisor, Inc. (a) | | 25 | 1,450 |
| Wayfair LLC Class A (a) | | 223 | 24,267 |
| | | | 1,452,217 |
| Media - 0.8% | | | |
| China Literature Ltd. (a)(b) | | 1,573 | 13,157 |
| Grupo Televisa SA de CV (CPO) sponsored ADR | | 66 | 1,312 |
| The Walt Disney Co. | | 929 | 105,497 |
| | | | 119,966 |
| Multiline Retail - 1.1% | | | |
| Avenue Supermarts Ltd. (a)(b) | | 73 | 1,765 |
| Dollar Tree, Inc. (a) | | 1,516 | 138,380 |
| Future Retail Ltd. | | 785 | 6,130 |
| Macy's, Inc. | | 314 | 12,475 |
| Ollie's Bargain Outlet Holdings, Inc. (a) | | 94 | 6,533 |
| V-Mart Retail Ltd. (a) | | 35 | 1,240 |
| | | | 166,523 |
| Specialty Retail - 4.0% | | | |
| At Home Group, Inc. (a) | | 78 | 2,829 |
| Burlington Stores, Inc. (a) | | 216 | 33,007 |
| Five Below, Inc. (a) | | 198 | 19,238 |
| Floor & Decor Holdings, Inc. Class A (a) | | 333 | 15,901 |
| Home Depot, Inc. | | 1,275 | 251,838 |
| Inditex SA | | 264 | 8,651 |
| Lowe's Companies, Inc. | | 1,359 | 135,003 |
| Michaels Companies, Inc. (a) | | 143 | 2,919 |
| Ross Stores, Inc. | | 421 | 36,808 |
| TCNS Clothing Co. Ltd. (a) | | 35 | 337 |
| Tiffany & Co., Inc. | | 118 | 16,232 |
| TJX Companies, Inc. | | 500 | 48,630 |
| Ulta Beauty, Inc. (a) | | 35 | 8,554 |
| Urban Outfitters, Inc. (a) | | 165 | 7,326 |
| | | | 587,273 |
| Textiles, Apparel & Luxury Goods - 3.8% | | | |
| adidas AG | | 220 | 48,660 |
| Canada Goose Holdings, Inc. (a) | | 458 | 26,290 |
| Carbon Black, Inc. | | 150 | 3,114 |
| Crinetics Pharmaceuticals, Inc. (a) | | 87 | 2,141 |
| Despegar.com Corp. | | 148 | 3,111 |
| Gildan Activewear, Inc. | | 52 | 1,340 |
| GreenSky, Inc. Class A | | 117 | 2,024 |
| Kering SA | | 167 | 89,048 |
| lululemon athletica, Inc. (a) | | 978 | 117,311 |
| LVMH Moet Hennessy - Louis Vuitton SA | | 46 | 16,030 |
| Michael Kors Holdings Ltd. (a) | | 473 | 31,563 |
| NIKE, Inc. Class B | | 1,040 | 79,986 |
| Pinduoduo, Inc. ADR | | 759 | 17,146 |
| Prada SpA | | 3,762 | 17,902 |
| PVH Corp. | | 348 | 53,425 |
| Rubius Therapeutics, Inc. (a) | | 66 | 1,386 |
| Scholar Rock Holding Corp. | | 89 | 1,445 |
| Shenzhou International Group Holdings Ltd. | | 160 | 1,962 |
| Tapestry, Inc. | | 406 | 19,131 |
| Under Armour, Inc. Class C (non-vtg.) (a) | | 516 | 9,670 |
| VF Corp. | | 163 | 15,007 |
| | | | 557,692 |
|
| TOTAL CONSUMER DISCRETIONARY | | | 3,580,100 |
|
| CONSUMER STAPLES - 3.1% | | | |
| Beverages - 1.1% | | | |
| Constellation Brands, Inc. Class A (sub. vtg.) | | 222 | 46,671 |
| Diageo PLC | | 52 | 1,908 |
| Fever-Tree Drinks PLC | | 284 | 12,842 |
| Keurig Dr. Pepper, Inc. | | 511 | 12,269 |
| Monster Beverage Corp. (a) | | 1,040 | 62,421 |
| Pernod Ricard SA | | 8 | 1,290 |
| The Coca-Cola Co. | | 443 | 20,657 |
| | | | 158,058 |
| Food & Staples Retailing - 0.9% | | | |
| Bj's Wholesale Club Holdings, Inc. | | 715 | 17,725 |
| Costco Wholesale Corp. | | 487 | 106,512 |
| Performance Food Group Co. (a) | | 357 | 12,798 |
| | | | 137,035 |
| Food Products - 0.1% | | | |
| Darling International, Inc. (a) | | 292 | 5,866 |
| Mondelez International, Inc. | | 32 | 1,388 |
| The Kraft Heinz Co. | | 106 | 6,387 |
| | | | 13,641 |
| Household Products - 0.1% | | | |
| Energizer Holdings, Inc. | | 185 | 11,781 |
| MTG Co. Ltd. | | 100 | 6,752 |
| | | | 18,533 |
| Personal Products - 0.6% | | | |
| Coty, Inc. Class A | | 1,335 | 17,902 |
| Estee Lauder Companies, Inc. Class A | | 194 | 26,178 |
| Herbalife Nutrition Ltd. (a) | | 543 | 28,035 |
| Kose Corp. | | 52 | 9,948 |
| | | | 82,063 |
| Tobacco - 0.3% | | | |
| JUUL Labs, Inc. Class A(c)(d) | | 217 | 36,354 |
|
| TOTAL CONSUMER STAPLES | | | 445,684 |
|
| ENERGY - 2.4% | | | |
| Oil, Gas & Consumable Fuels - 2.4% | | | |
| Anadarko Petroleum Corp. | | 653 | 47,767 |
| Andeavor | | 90 | 13,505 |
| BP PLC sponsored ADR | | 121 | 5,456 |
| Cenovus Energy, Inc. | | 269 | 2,699 |
| Continental Resources, Inc. (a) | | 766 | 48,924 |
| Delek U.S. Holdings, Inc. | | 375 | 19,995 |
| Diamondback Energy, Inc. | | 178 | 23,487 |
| EOG Resources, Inc. | | 218 | 28,109 |
| Extraction Oil & Gas, Inc. (a) | | 480 | 7,258 |
| Marathon Petroleum Corp. | | 123 | 9,942 |
| Petronet LNG Ltd. | | 338 | 1,131 |
| Phillips 66 Co. | | 12 | 1,480 |
| Pioneer Natural Resources Co. | | 166 | 31,419 |
| Reliance Industries Ltd. | | 2,155 | 37,333 |
| Valero Energy Corp. | | 243 | 28,759 |
| Whiting Petroleum Corp. (a) | | 993 | 49,302 |
| | | | 356,566 |
| FINANCIALS - 4.1% | | | |
| Banks - 2.0% | | | |
| Bank of America Corp. | | 3,381 | 104,405 |
| Citigroup, Inc. | | 763 | 54,852 |
| Coastal Financial Corp. of Washington (a) | | 400 | 6,496 |
| Cullen/Frost Bankers, Inc. | | 45 | 4,972 |
| HDFC Bank Ltd. sponsored ADR | | 242 | 25,008 |
| IndusInd Bank Ltd. | | 95 | 2,769 |
| JPMorgan Chase & Co. | | 733 | 84,258 |
| Kotak Mahindra Bank Ltd. | | 291 | 5,555 |
| | | | 288,315 |
| Capital Markets - 1.7% | | | |
| Apollo Global Management LLC Class A | | 134 | 4,757 |
| BlackRock, Inc. Class A | | 89 | 44,746 |
| Charles Schwab Corp. | | 770 | 39,316 |
| E*TRADE Financial Corp. (a) | | 225 | 13,457 |
| Edelweiss Financial Services Ltd. | | 619 | 2,798 |
| Fairfax India Holdings Corp. (a)(b) | | 246 | 3,961 |
| Goldman Sachs Group, Inc. | | 246 | 58,408 |
| Monex Group, Inc. | | 433 | 2,153 |
| Morgan Stanley | | 645 | 32,611 |
| MSCI, Inc. | | 27 | 4,487 |
| TD Ameritrade Holding Corp. | | 704 | 40,234 |
| Virtu Financial, Inc. Class A | | 279 | 5,622 |
| | | | 252,550 |
| Consumer Finance - 0.0% | | | |
| American Express Co. | | 55 | 5,474 |
| Diversified Financial Services - 0.3% | | | |
| Allakos, Inc. (a) | | 174 | 7,094 |
| Berkshire Hathaway, Inc. Class B (a) | | 172 | 34,034 |
| GDS Holdings Ltd. ADR (a) | | 47 | 1,026 |
| | | | 42,154 |
| Thrifts & Mortgage Finance - 0.1% | | | |
| Housing Development Finance Corp. Ltd. | | 365 | 10,636 |
|
| TOTAL FINANCIALS | | | 599,129 |
|
| HEALTH CARE - 9.5% | | | |
| Biotechnology - 4.4% | | | |
| AC Immune SA (a) | | 325 | 3,136 |
| ACADIA Pharmaceuticals, Inc. (a) | | 144 | 2,173 |
| Acceleron Pharma, Inc. (a) | | 40 | 1,742 |
| Agios Pharmaceuticals, Inc. (a) | | 39 | 3,370 |
| Aimmune Therapeutics, Inc. (a) | | 302 | 8,734 |
| Alexion Pharmaceuticals, Inc. (a) | | 936 | 124,451 |
| Alkermes PLC (a) | | 586 | 25,696 |
| Alnylam Pharmaceuticals, Inc. (a) | | 519 | 49,305 |
| Amgen, Inc. | | 194 | 38,131 |
| AnaptysBio, Inc. (a) | | 64 | 5,012 |
| Arena Pharmaceuticals, Inc. (a) | | 187 | 7,216 |
| Ascendis Pharma A/S sponsored ADR (a) | | 175 | 11,890 |
| BeiGene Ltd. ADR (a) | | 59 | 11,190 |
| Biogen, Inc. (a) | | 20 | 6,687 |
| bluebird bio, Inc. (a) | | 194 | 30,051 |
| Blueprint Medicines Corp. (a) | | 31 | 1,846 |
| Celgene Corp. (a) | | 117 | 10,541 |
| Cellectis SA sponsored ADR (a) | | 40 | 1,156 |
| Coherus BioSciences, Inc. (a) | | 288 | 5,486 |
| DBV Technologies SA sponsored ADR (a) | | 51 | 920 |
| Deciphera Pharmaceuticals, Inc. (a) | | 33 | 1,135 |
| Denali Therapeutics, Inc. (a) | | 448 | 5,640 |
| Editas Medicine, Inc. (a) | | 289 | 8,595 |
| Epizyme, Inc. (a) | | 139 | 1,793 |
| Exelixis, Inc. (a) | | 652 | 13,496 |
| FibroGen, Inc. (a) | | 186 | 11,737 |
| GenSight Biologics SA (a)(b) | | 263 | 661 |
| Global Blood Therapeutics, Inc. (a) | | 316 | 13,209 |
| Grifols SA ADR | | 46 | 956 |
| Heron Therapeutics, Inc. (a) | | 113 | 4,232 |
| ImmunoGen, Inc. (a) | | 116 | 1,079 |
| Insmed, Inc. (a) | | 75 | 1,865 |
| Intellia Therapeutics, Inc. (a) | | 317 | 8,439 |
| Intercept Pharmaceuticals, Inc. (a) | | 143 | 13,033 |
| Ironwood Pharmaceuticals, Inc. Class A (a) | | 524 | 10,103 |
| Liquidia Technologies, Inc. | | 1,200 | 13,152 |
| Madrigal Pharmaceuticals, Inc. (a) | | 4 | 1,028 |
| Neurocrine Biosciences, Inc. (a) | | 173 | 17,385 |
| Portola Pharmaceuticals, Inc. (a) | | 199 | 7,124 |
| Radius Health, Inc. (a) | | 35 | 840 |
| Regeneron Pharmaceuticals, Inc. (a) | | 206 | 75,810 |
| Replimune Group, Inc. (a) | | 92 | 1,379 |
| Sage Therapeutics, Inc. (a) | | 151 | 21,792 |
| Sarepta Therapeutics, Inc. (a) | | 170 | 19,761 |
| Trevena, Inc. (a) | | 430 | 662 |
| Ultragenyx Pharmaceutical, Inc. (a) | | 71 | 5,617 |
| Vertex Pharmaceuticals, Inc. (a) | | 149 | 26,082 |
| Xencor, Inc. (a) | | 200 | 7,444 |
| Zai Lab Ltd. ADR | | 97 | 2,126 |
| | | | 644,908 |
| Health Care Equipment & Supplies - 2.5% | | | |
| Align Technology, Inc. (a) | | 28 | 9,986 |
| Baxter International, Inc. | | 38 | 2,753 |
| Becton, Dickinson & Co. | | 104 | 26,038 |
| Boston Scientific Corp. (a) | | 3,593 | 120,761 |
| Danaher Corp. | | 247 | 25,337 |
| DexCom, Inc. (a) | | 86 | 8,181 |
| Edwards Lifesciences Corp. (a) | | 20 | 2,849 |
| Establishment Labs Holdings, Inc. (a) | | 359 | 9,341 |
| Fisher & Paykel Healthcare Corp. | | 123 | 1,241 |
| Hoya Corp. | | 20 | 1,198 |
| Insulet Corp. (a) | | 123 | 10,229 |
| Intuitive Surgical, Inc. (a) | | 234 | 118,916 |
| Invuity, Inc. (a) | | 285 | 1,140 |
| iRhythm Technologies, Inc. (a) | | 282 | 21,305 |
| Novocure Ltd. (a) | | 84 | 2,856 |
| Penumbra, Inc. (a) | | 10 | 1,423 |
| Quanterix Corp. (a) | | 83 | 1,244 |
| Stryker Corp. | | 8 | 1,306 |
| | | | 366,104 |
| Health Care Providers & Services - 1.8% | | | |
| Humana, Inc. | | 318 | 99,909 |
| National Vision Holdings, Inc. | | 321 | 13,052 |
| Neuronetics, Inc. | | 300 | 7,485 |
| OptiNose, Inc. | | 764 | 15,547 |
| UnitedHealth Group, Inc. | | 489 | 123,825 |
| | | | 259,818 |
| Health Care Technology - 0.1% | | | |
| Evolent Health, Inc. (a) | | 169 | 3,414 |
| Teladoc, Inc. (a) | | 211 | 12,628 |
| | | | 16,042 |
| Life Sciences Tools & Services - 0.0% | | | |
| Illumina, Inc. (a) | | 5 | 1,622 |
| Pharmaceuticals - 0.7% | | | |
| Aclaris Therapeutics, Inc. (a) | | 88 | 1,508 |
| Akcea Therapeutics, Inc. | | 417 | 13,186 |
| Allergan PLC | | 8 | 1,473 |
| AstraZeneca PLC sponsored ADR | | 199 | 7,787 |
| Bausch Health Cos., Inc. (Canada) (a) | | 268 | 5,826 |
| Bayer AG | | 11 | 1,225 |
| Collegium Pharmaceutical, Inc. (a) | | 51 | 983 |
| Dova Pharmaceuticals, Inc. (a) | | 96 | 2,071 |
| Intersect ENT, Inc. (a) | | 46 | 1,488 |
| Jazz Pharmaceuticals PLC (a) | | 169 | 29,251 |
| Mylan NV (a) | | 35 | 1,306 |
| MyoKardia, Inc. (a) | | 53 | 3,042 |
| Nektar Therapeutics (a) | | 428 | 22,513 |
| The Medicines Company (a) | | 248 | 9,853 |
| Theravance Biopharma, Inc. (a) | | 20 | 479 |
| Zogenix, Inc. (a) | | 59 | 3,348 |
| | | | 105,339 |
|
| TOTAL HEALTH CARE | | | 1,393,833 |
|
| INDUSTRIALS - 4.5% | | | |
| Aerospace & Defense - 1.5% | | | |
| Bombardier, Inc. Class B (sub. vtg.) (a) | | 4,778 | 17,998 |
| Elbit Systems Ltd. | | 27 | 3,249 |
| General Dynamics Corp. | | 84 | 16,780 |
| Northrop Grumman Corp. | | 193 | 57,995 |
| Raytheon Co. | | 172 | 34,061 |
| The Boeing Co. | | 210 | 74,823 |
| United Technologies Corp. | | 66 | 8,959 |
| | | | 213,865 |
| Air Freight & Logistics - 0.3% | | | |
| Expeditors International of Washington, Inc. | | 19 | 1,447 |
| XPO Logistics, Inc. (a) | | 365 | 36,398 |
| | | | 37,845 |
| Airlines - 0.7% | | | |
| Delta Air Lines, Inc. | | 731 | 39,781 |
| Southwest Airlines Co. | | 76 | 4,420 |
| Spirit Airlines, Inc. (a) | | 609 | 26,455 |
| United Continental Holdings, Inc. (a) | | 401 | 32,240 |
| Wizz Air Holdings PLC (a)(b) | | 128 | 5,823 |
| | | | 108,719 |
| Building Products - 0.1% | | | |
| Masco Corp. | | 250 | 10,083 |
| Commercial Services & Supplies - 0.1% | | | |
| Copart, Inc. (a) | | 63 | 3,616 |
| Evoqua Water Technologies Corp. (a) | | 170 | 3,628 |
| HomeServe PLC | | 421 | 5,592 |
| Tomra Systems ASA | | 247 | 5,106 |
| | | | 17,942 |
| Electrical Equipment - 0.3% | | | |
| AMETEK, Inc. | | 37 | 2,879 |
| Fortive Corp. | | 244 | 20,028 |
| Melrose Industries PLC | | 436 | 1,236 |
| Nidec Corp. | | 16 | 2,315 |
| Regal Beloit Corp. | | 190 | 16,331 |
| | | | 42,789 |
| Industrial Conglomerates - 0.6% | | | |
| General Electric Co. | | 2,736 | 37,292 |
| Honeywell International, Inc. | | 227 | 36,241 |
| ITT, Inc. | | 275 | 15,584 |
| | | | 89,117 |
| Machinery - 0.5% | | | |
| Aumann AG (b) | | 85 | 5,934 |
| Deere & Co. | | 252 | 36,487 |
| Eicher Motors Ltd. | | 7 | 2,842 |
| Minebea Mitsumi, Inc. | | 57 | 1,023 |
| Rational AG | | 8 | 5,482 |
| SMC Corp. | | 3 | 1,006 |
| WABCO Holdings, Inc. (a) | | 67 | 8,421 |
| Xylem, Inc. | | 207 | 15,848 |
| | | | 77,043 |
| Professional Services - 0.1% | | | |
| CoStar Group, Inc. (a) | | 3 | 1,248 |
| Equifax, Inc. | | 22 | 2,761 |
| IHS Markit Ltd. (a) | | 228 | 12,091 |
| Recruit Holdings Co. Ltd. | | 50 | 1,370 |
| | | | 17,470 |
| Road & Rail - 0.2% | | | |
| J.B. Hunt Transport Services, Inc. | | 91 | 10,911 |
| Knight-Swift Transportation Holdings, Inc. Class A | | 571 | 18,586 |
| | | | 29,497 |
| Trading Companies & Distributors - 0.1% | | | |
| HD Supply Holdings, Inc. (a) | | 157 | 6,905 |
| Wolseley PLC | | 8 | 631 |
| | | | 7,536 |
| Transportation Infrastructure - 0.0% | | | |
| Adani Ports & Special Economic Zone Ltd. | | 185 | 1,080 |
|
| TOTAL INDUSTRIALS | | | 652,986 |
|
| INFORMATION TECHNOLOGY - 45.2% | | | |
| Communications Equipment - 0.3% | | | |
| Arista Networks, Inc. (a) | | 68 | 17,390 |
| Lumentum Holdings, Inc. (a) | | 27 | 1,411 |
| NETGEAR, Inc. (a) | | 364 | 23,969 |
| | | | 42,770 |
| Electronic Equipment & Components - 0.1% | | | |
| Corning, Inc. | | 193 | 6,404 |
| Dell Technologies, Inc. (a) | | 122 | 11,287 |
| II-VI, Inc. (a) | | 65 | 2,548 |
| Jabil, Inc. | | 48 | 1,352 |
| | | | 21,591 |
| Internet Software & Services - 14.7% | | | |
| 2U, Inc. (a) | | 116 | 8,777 |
| Akamai Technologies, Inc. (a) | | 328 | 24,685 |
| Alibaba Group Holding Ltd. sponsored ADR (a) | | 638 | 119,453 |
| Alphabet, Inc. Class A (a) | | 941 | 1,154,801 |
| ANGI Homeservices, Inc. Class A (a) | | 718 | 11,280 |
| Carbonite, Inc. (a) | | 38 | 1,303 |
| CarGurus, Inc. Class A | | 400 | 17,340 |
| DocuSign, Inc. | | 105 | 5,660 |
| Dropbox, Inc. Class A (a) | | 300 | 8,031 |
| Facebook, Inc. Class A (a) | | 3,172 | 547,424 |
| GMO Internet, Inc. | | 244 | 5,174 |
| GoDaddy, Inc. (a) | | 230 | 16,933 |
| GrubHub, Inc. (a) | | 36 | 4,388 |
| HUYA, Inc. ADR | | 229 | 7,374 |
| IAC/InterActiveCorp (a) | | 59 | 8,688 |
| Mercari, Inc. (a) | | 200 | 8,425 |
| Mimecast Ltd. (a) | | 35 | 1,257 |
| Momo, Inc. ADR (a) | | 232 | 9,517 |
| NetEase, Inc. ADR | | 58 | 14,964 |
| New Relic, Inc. (a) | | 45 | 4,397 |
| Okta, Inc. (a) | | 55 | 2,731 |
| Pandora Media, Inc. (a) | | 185 | 1,247 |
| Shopify, Inc. Class A (a) | | 151 | 21,036 |
| Stamps.com, Inc. (a) | | 55 | 14,355 |
| Tencent Holdings Ltd. | | 1,988 | 90,483 |
| The Trade Desk, Inc. (a) | | 130 | 10,962 |
| Twilio, Inc. Class A (a) | | 56 | 3,242 |
| Twitter, Inc. (a) | | 62 | 1,976 |
| Wix.com Ltd. (a) | | 169 | 16,055 |
| Yandex NV Series A (a) | | 254 | 9,134 |
| YY, Inc. ADR (a) | | 77 | 7,179 |
| | | | 2,158,271 |
| IT Services - 5.2% | | | |
| Adyen BV (b) | | 118 | 75,394 |
| Alliance Data Systems Corp. | | 56 | 12,593 |
| Endava PLC ADR (a) | | 155 | 3,706 |
| FleetCor Technologies, Inc. (a) | | 64 | 13,888 |
| MasterCard, Inc. Class A | | 1,019 | 201,762 |
| Netcompany Group A/S | | 281 | 10,221 |
| PayPal Holdings, Inc. (a) | | 1,435 | 117,871 |
| Square, Inc. (a) | | 132 | 8,534 |
| Total System Services, Inc. | | 32 | 2,929 |
| Visa, Inc. Class A | | 2,084 | 284,966 |
| Wirecard AG | | 10 | 1,868 |
| Worldpay, Inc. (a) | | 257 | 21,123 |
| | | | 754,855 |
| Semiconductors & Semiconductor Equipment - 7.0% | | | |
| Acacia Communications, Inc. (a) | | 79 | 2,539 |
| Advanced Micro Devices, Inc. (a) | | 1,172 | 21,483 |
| Analog Devices, Inc. | | 160 | 15,382 |
| ASML Holding NV | | 21 | 4,494 |
| Broadcom, Inc. | | 1,265 | 280,539 |
| Inphi Corp. (a) | | 285 | 8,960 |
| Intel Corp. | | 705 | 33,911 |
| Marvell Technology Group Ltd. | | 2,779 | 59,220 |
| Micron Technology, Inc. (a) | | 1,939 | 102,360 |
| Monolithic Power Systems, Inc. | | 90 | 11,941 |
| NVIDIA Corp. | | 1,641 | 401,815 |
| NXP Semiconductors NV (a) | | 190 | 18,115 |
| Qualcomm, Inc. | | 778 | 49,862 |
| Renesas Electronics Corp. (a) | | 1,836 | 16,354 |
| | | | 1,026,975 |
| Software - 11.7% | | | |
| Activision Blizzard, Inc. | | 2,574 | 188,983 |
| Adobe Systems, Inc. (a) | | 550 | 134,574 |
| Altair Engineering, Inc. Class A (a) | | 276 | 9,688 |
| Avalara, Inc. | | 118 | 4,524 |
| Black Knight, Inc. (a) | | 28 | 1,446 |
| Electronic Arts, Inc. (a) | | 493 | 63,474 |
| HubSpot, Inc. (a) | | 21 | 2,606 |
| Intuit, Inc. | | 115 | 23,488 |
| Microsoft Corp. | | 6,308 | 669,153 |
| Nintendo Co. Ltd. | | 48 | 16,233 |
| Paycom Software, Inc. (a) | | 237 | 25,181 |
| Pluralsight, Inc. | | 302 | 7,009 |
| Proofpoint, Inc. (a) | | 88 | 10,036 |
| Red Hat, Inc. (a) | | 441 | 62,282 |
| RingCentral, Inc. (a) | | 110 | 8,113 |
| SailPoint Technologies Holding, Inc. (a) | | 363 | 8,745 |
| Salesforce.com, Inc. (a) | | 2,659 | 364,682 |
| SendGrid, Inc. (a) | | 299 | 7,633 |
| Smartsheet, Inc. | | 219 | 4,709 |
| Snap, Inc. Class A (a) | | 1,789 | 22,363 |
| Splunk, Inc. (a) | | 40 | 3,844 |
| Talend SA ADR (a) | | 80 | 4,732 |
| Tanium, Inc. Class B (a)(c)(d) | | 131 | 889 |
| Tenable Holdings, Inc. | | 300 | 8,970 |
| Workday, Inc. Class A (a) | | 222 | 27,532 |
| Zendesk, Inc. (a) | | 242 | 13,182 |
| Zscaler, Inc. (a) | | 431 | 15,219 |
| | | | 1,709,290 |
| Technology Hardware, Storage & Peripherals - 6.2% | | | |
| Apple, Inc. | | 4,738 | 901,594 |
|
| TOTAL INFORMATION TECHNOLOGY | | | 6,615,346 |
|
| MATERIALS - 2.0% | | | |
| Chemicals - 2.0% | | | |
| Cabot Corp. | | 81 | 5,354 |
| CF Industries Holdings, Inc. | | 1,441 | 64,009 |
| DowDuPont, Inc. | | 454 | 31,222 |
| FMC Corp. | | 130 | 11,684 |
| LG Chemical Ltd. | | 7 | 2,358 |
| LyondellBasell Industries NV Class A | | 552 | 61,156 |
| Nutrien Ltd. | | 257 | 13,958 |
| Orion Engineered Carbons SA | | 133 | 4,362 |
| The Chemours Co. LLC | | 1,197 | 54,835 |
| The Mosaic Co. | | 488 | 14,694 |
| Tronox Ltd. Class A | | 729 | 13,450 |
| Westlake Chemical Corp. | | 101 | 10,829 |
| | | | 287,911 |
| Construction Materials - 0.0% | | | |
| Buzzi Unicem SpA | | 21 | 463 |
| Loma Negra Compania Industrial Argentina SA ADR (a) | | 178 | 2,001 |
| | | | 2,464 |
|
| TOTAL MATERIALS | | | 290,375 |
|
| REAL ESTATE - 0.1% | | | |
| Equity Real Estate Investment Trusts (REITs) - 0.1% | | | |
| Ant International Co. Ltd. (c)(d) | | 2,450 | 13,745 |
| TELECOMMUNICATION SERVICES - 0.1% | | | |
| Wireless Telecommunication Services - 0.1% | | | |
| Boingo Wireless, Inc. (a) | | 129 | 2,981 |
| T-Mobile U.S., Inc. (a) | | 249 | 14,940 |
| | | | 17,921 |
| UTILITIES - 0.0% | | | |
| Gas Utilities - 0.0% | | | |
| China Resource Gas Group Ltd. | | 400 | 1,896 |
| ENN Energy Holdings Ltd. | | 177 | 1,801 |
| | | | 3,697 |
| TOTAL COMMON STOCKS | | | |
| (Cost $10,897,020) | | | 13,969,382 |
|
| Convertible Preferred Stocks - 1.4% | | | |
| CONSUMER DISCRETIONARY - 0.1% | | | |
| Hotels, Restaurants & Leisure - 0.1% | | | |
| Neutron Holdings, Inc. Series C (c)(d) | | 26,100 | 4,772 |
| Topgolf International, Inc. Series F (c)(d) | | 217 | 3,342 |
| | | | 8,114 |
| Internet & Direct Marketing Retail - 0.0% | | | |
| The Honest Co., Inc. Series E (c)(d) | | 282 | 5,529 |
| Textiles, Apparel & Luxury Goods - 0.0% | | | |
| Generation Bio Series B (c)(d) | | 200 | 1,829 |
|
| TOTAL CONSUMER DISCRETIONARY | | | 15,472 |
|
| CONSUMER STAPLES - 0.2% | | | |
| Food & Staples Retailing - 0.1% | | | |
| Roofoods Ltd. Series F (c)(d) | | 17 | 6,969 |
| Food Products - 0.0% | | | |
| Agbiome LLC Series C (c)(d) | | 557 | 3,528 |
| Tobacco - 0.1% | | | |
| JUUL Labs, Inc. Series E (c)(d) | | 127 | 21,276 |
|
| TOTAL CONSUMER STAPLES | | | 31,773 |
|
| HEALTH CARE - 0.1% | | | |
| Biotechnology - 0.1% | | | |
| 23andMe, Inc. Series F (c)(d) | | 339 | 5,882 |
| INFORMATION TECHNOLOGY - 1.0% | | | |
| Internet Software & Services - 1.0% | | | |
| ContextLogic, Inc. Series G (c)(d) | | 67 | 10,829 |
| Lyft, Inc.: | | | |
| Series H (c)(d) | | 2,516 | 119,142 |
| Series I (c)(d) | | 289 | 13,685 |
| Starry, Inc. Series C (c)(d) | | 3,181 | 2,933 |
| | | | 146,589 |
| Software - 0.0% | | | |
| Compass, Inc. Series E (c)(d) | | 28 | 1,889 |
|
| TOTAL INFORMATION TECHNOLOGY | | | 148,478 |
|
| TOTAL CONVERTIBLE PREFERRED STOCKS | | | |
| (Cost $179,184) | | | 201,605 |
|
| Money Market Funds - 3.1% | | | |
| Fidelity Cash Central Fund, 1.96% (e) | | | |
| (Cost $458,655) | | 458,563 | 458,655 |
| TOTAL INVESTMENT IN SECURITIES - 99.9% | | | |
| (Cost $11,534,859) | | | 14,629,642 |
| NET OTHER ASSETS (LIABILITIES) - 0.1% | | | 11,402 |
| NET ASSETS - 100% | | | $14,641,044 |
Legend
(a) Non-income producing
(b) Security exempt from registration under Rule 144A of the Securities Act of 1933. These securities may be resold in transactions exempt from registration, normally to qualified institutional buyers. At the end of the period, the value of these securities amounted to $106,695 or 0.7% of net assets.
(c) Restricted securities - Investment in securities not registered under the Securities Act of 1933 (excluding 144A issues). At the end of the period, the value of restricted securities (excluding 144A issues) amounted to $252,593 or 1.7% of net assets.
(d) Level 3 security
(e) Affiliated fund that is generally available only to investment companies and other accounts managed by Fidelity Investments. The rate quoted is the annualized seven-day yield of the fund at period end. A complete unaudited listing of the fund's holdings as of its most recent quarter end is available upon request. In addition, each Fidelity Central Fund's financial statements, which are not covered by the Fund's Report of Independent Registered Public Accounting Firm, are available on the SEC's website or upon request.
Additional information on each restricted holding is as follows:
| Security | Acquisition Date | Acquisition Cost |
| 23andMe, Inc. Series F | 8/31/17 | $4,707 |
| Agbiome LLC Series C | 6/29/18 | $3,528 |
| Ant International Co. Ltd. | 5/16/18 | $13,745 |
| Compass, Inc. Series E | 11/3/17 | $1,889 |
| ContextLogic, Inc. Series G | 10/24/17 | $9,014 |
| Generation Bio Series B | 2/21/18 | $1,829 |
| JUUL Labs, Inc. Class A | 12/20/17 - 7/6/18 | $38,305 |
| JUUL Labs, Inc. Series E | 12/20/17 - 7/6/18 | $22,284 |
| Lyft, Inc. Series H | 11/22/17 | $100,001 |
| Lyft, Inc. Series I | 6/27/18 | $13,685 |
| Neutron Holdings, Inc. Series C | 7/3/18 | $4,772 |
| Roofoods Ltd. Series F | 9/12/17 | $6,011 |
| Starry, Inc. Series C | 12/8/17 | $2,933 |
| Tanium, Inc. Class B | 4/21/17 | $650 |
| The Honest Co., Inc. Series E | 9/28/17 | $5,529 |
| Topgolf International, Inc. Series F | 11/10/17 | $3,002 |
Affiliated Central Funds
Information regarding fiscal year to date income earned by the Fund from investments in Fidelity Central Funds is as follows:
| Fund | Income earned |
| Fidelity Cash Central Fund | $2,264 |
| Total | $2,264 |
Amounts in the income column in the above table include any capital gain distributions from underlying funds, which are presented in the corresponding line-item in the Statement of Operations if applicable.
Investment Valuation
The following is a summary of the inputs used, as of July 31, 2018, involving the Fund's assets and liabilities carried at fair value. The inputs or methodology used for valuing securities may not be an indication of the risk associated with investing in those securities. For more information on valuation inputs, and their aggregation into the levels used below, please refer to the Investment Valuation section in the accompanying Notes to Financial Statements.
| | Valuation Inputs at Reporting Date: |
| Description | Total | Level 1 | Level 2 | Level 3 |
| Investments in Securities: | | | | |
| Equities: | | | | |
| Consumer Discretionary | $3,595,572 | $3,555,419 | $24,681 | $15,472 |
| Consumer Staples | 477,457 | 407,422 | 1,908 | 68,127 |
| Energy | 356,566 | 356,566 | -- | -- |
| Financials | 599,129 | 599,129 | -- | -- |
| Health Care | 1,399,715 | 1,392,608 | 1,225 | 5,882 |
| Industrials | 652,986 | 650,593 | 2,393 | -- |
| Information Technology | 6,763,824 | 6,507,741 | 106,716 | 149,367 |
| Materials | 290,375 | 290,375 | -- | -- |
| Real Estate | 13,745 | -- | -- | 13,745 |
| Telecommunication Services | 17,921 | 17,921 | -- | -- |
| Utilities | 3,697 | 3,697 | -- | -- |
| Money Market Funds | 458,655 | 458,655 | -- | -- |
| Total Investments in Securities: | $14,629,642 | $14,240,126 | $136,923 | $252,593 |
The following is a reconciliation of Investments in Securities for which Level 3 inputs were used in determining value:
The information used in the above reconciliation represents fiscal year to date activity for any Investments in Securities identified as using Level 3 inputs at either the beginning or the end of the current fiscal period. Transfers in or out of Level 3 represent the beginning value of any Security or Instrument where a change in the pricing level occurred from the beginning to the end of the period. The cost of purchases and the proceeds of sales may include securities received or delivered through corporate actions or exchanges. Realized and unrealized gains (losses) disclosed in the reconciliation are included in Net Gain (Loss) on the Fund's Statement of Operations.
The following is a reconciliation of Investments in Securities for which Level 3 inputs were used in determining value:
| Investments in Securities: | |
| Information Technology | |
| Beginning Balance | $650 |
| Net Realized Gain (Loss) on Investment Securities | -- |
| Net Unrealized Gain (Loss) on Investment Securities | 21,195 |
| Cost of Purchases | 127,522 |
| Proceeds of Sales | -- |
| Amortization/Accretion | -- |
| Transfers into Level 3 | -- |
| Transfers out of Level 3 | -- |
| Ending Balance | $149,367 |
| The change in unrealized gain (loss) for the period attributable to Level 3 securities held at July 31, 2018 | $21,195 |
| Other Investments in Securities | |
| Beginning Balance | $1,654 |
| Net Realized Gain (Loss) on Investment Securities | (27) |
| Net Unrealized Gain (Loss) on Investment Securities | (563) |
| Cost of Purchases | 103,711 |
| Proceeds of Sales | (1,549) |
| Amortization/Accretion | -- |
| Transfers into Level 3 | -- |
| Transfers out of Level 3 | -- |
| Ending Balance | $103,226 |
| The change in unrealized gain (loss) for the period attributable to Level 3 securities held at July 31, 2018 | $(485) |
The information used in the above reconciliations represents fiscal year to date activity for any Investments in Securities identified as using Level 3 inputs at either the beginning or the end of the current fiscal period. Transfers in or out of Level 3 represent the beginning value of any Security or Instrument where a change in the pricing level occurred from the beginning to the end of the period. The cost of purchases and the proceeds of sales may include securities received or delivered through corporate actions or exchanges. Realized and unrealized gains (losses) disclosed in the reconciliations are included in Net Gain (Loss) on the Fund's Statement of Operations.
See accompanying notes which are an integral part of the financial statements.
Financial Statements
Statement of Assets and Liabilities
| | | July 31, 2018 |
| Assets | | |
Investment in securities, at value — See accompanying schedule:
Unaffiliated issuers (cost $11,076,204) | $14,170,987 | |
| Fidelity Central Funds (cost $458,655) | 458,655 | |
| Total Investment in Securities (cost $11,534,859) | | $14,629,642 |
| Cash | | 3,099 |
| Foreign currency held at value (cost $2) | | 2 |
| Receivable for investments sold | | 54,283 |
| Receivable for fund shares sold | | 3,055 |
| Dividends receivable | | 2,671 |
| Distributions receivable from Fidelity Central Funds | | 444 |
| Other receivables | | 151 |
| Total assets | | 14,693,347 |
| Liabilities | | |
| Payable for investments purchased | $51,855 | |
| Other payables and accrued expenses | 448 | |
| Total liabilities | | 52,303 |
| Net Assets | | $14,641,044 |
| Net Assets consist of: | | |
| Paid in capital | | $11,241,060 |
| Undistributed net investment income | | 68,832 |
| Accumulated undistributed net realized gain (loss) on investments and foreign currency transactions | | 236,809 |
| Net unrealized appreciation (depreciation) on investments and assets and liabilities in foreign currencies | | 3,094,343 |
| Net Assets, for 1,042,461 shares outstanding | | $14,641,044 |
| Net Asset Value, offering price and redemption price per share ($14,641,044 ÷ 1,042,461 shares) | | $14.04 |
See accompanying notes which are an integral part of the financial statements.
Statement of Operations
| | | Year ended July 31, 2018 |
| Investment Income | | |
| Dividends | | $92,512 |
| Special dividends | | 12,325 |
| Interest | | 2,887 |
| Income from Fidelity Central Funds | | 2,264 |
| Total income | | 109,988 |
| Expenses | | |
| Independent trustees' fees and expenses | $52 | |
| Commitment fees | 33 | |
| Total expenses | | 85 |
| Net investment income (loss) | | 109,903 |
| Realized and Unrealized Gain (Loss) | | |
| Net realized gain (loss) on: | | |
| Investment securities: | | |
| Unaffiliated issuers | 248,874 | |
| Foreign currency transactions | 58 | |
| Total net realized gain (loss) | | 248,932 |
| Change in net unrealized appreciation (depreciation) on: | | |
| Investment securities: | | |
| Unaffiliated issuers (net of increase in deferred foreign taxes of $459) | 2,408,892 | |
| Assets and liabilities in foreign currencies | 11 | |
| Total change in net unrealized appreciation (depreciation) | | 2,408,903 |
| Net gain (loss) | | 2,657,835 |
| Net increase (decrease) in net assets resulting from operations | | $2,767,738 |
See accompanying notes which are an integral part of the financial statements.
Statement of Changes in Net Assets
| | Year ended July 31, 2018 | For the period
March 8, 2017 (commencement of operations) to July 31, 2017 |
| Increase (Decrease) in Net Assets | | |
| Operations | | |
| Net investment income (loss) | $109,903 | $18,262 |
| Net realized gain (loss) | 248,932 | 20,535 |
| Change in net unrealized appreciation (depreciation) | 2,408,903 | 685,440 |
| Net increase (decrease) in net assets resulting from operations | 2,767,738 | 724,237 |
| Distributions to shareholders from net investment income | (59,022) | – |
| Distributions to shareholders from net realized gain | (32,969) | – |
| Total distributions | (91,991) | – |
| Share transactions | | |
| Proceeds from sales of shares | 10,131,063 | 8,053,459 |
| Reinvestment of distributions | 91,990 | – |
| Cost of shares redeemed | (6,834,098) | (201,354) |
| Net increase (decrease) in net assets resulting from share transactions | 3,388,955 | 7,852,105 |
| Total increase (decrease) in net assets | 6,064,702 | 8,576,342 |
| Net Assets | | |
| Beginning of period | 8,576,342 | – |
| End of period | $14,641,044 | $8,576,342 |
| Other Information | | |
| Undistributed net investment income end of period | $68,832 | $18,262 |
| Shares | | |
| Sold | 808,079 | 775,327 |
| Issued in reinvestment of distributions | 7,709 | – |
| Redeemed | (530,535) | (18,119) |
| Net increase (decrease) | 285,253 | 757,208 |
See accompanying notes which are an integral part of the financial statements.
Financial Highlights
Fidelity Flex Large Cap Growth Fund
| | | |
| Years ended July 31, | 2018 | 2017 A |
| Selected Per–Share Data | | |
| Net asset value, beginning of period | $11.33 | $10.00 |
| Income from Investment Operations | | |
| Net investment income (loss)B | .11C | .03 |
| Net realized and unrealized gain (loss) | 2.69 | 1.30 |
| Total from investment operations | 2.80 | 1.33 |
| Distributions from net investment income | (.06) | – |
| Distributions from net realized gain | (.04) | – |
| Total distributions | (.09)D | – |
| Net asset value, end of period | $14.04 | $11.33 |
| Total Return | 24.90% | 13.30% |
| Ratios to Average Net AssetsE,F | | |
| Expenses before reductionsG | -% | - %H |
| Expenses net of fee waivers, if anyG | -% | - %H |
| Expenses net of all reductionsG | -% | - %H |
| Net investment income (loss) | .87%C | .79%H |
| Supplemental Data | | |
| Net assets, end of period (000 omitted) | $14,641 | $8,576 |
| Portfolio turnover rateI | 65% | 17%J |
A For the period March 8, 2017 (commencement of operations) to July 31, 2017.
B Calculated based on average shares outstanding during the period.
C Net investment income per share reflects a large, non-recurring dividend which amounted to $.01 per share. Excluding this non-recurring dividend, the ratio of net investment income (loss) to average net assets would have been .77%.
D Total distributions of $.09 per share is comprised of distributions from net investment income of $.059 and distributions from net realized gain of $.035 per share.
E Fees and expenses of any underlying Fidelity Central Funds are not included in the Fund's expense ratio. The Fund indirectly bears its proportionate share of the expenses of any underlying Fidelity Central Funds.
F Expense ratios reflect operating expenses of the Fund. Expenses before reductions do not reflect amounts reimbursed by the investment adviser or reductions from expense offset arrangements and do not represent the amount paid by the Fund during periods when reimbursements or reductions occur. Expenses net of fee waivers reflect expenses after reimbursement by the investment adviser but prior to reductions from expense offset arrangements. Expenses net of all reductions represent the net expenses paid by the Fund.
G Amount represents less than .005%.
H Annualized
I Amount does not include the portfolio activity of any underlying Fidelity Central Funds.
J��Amount not annualized.
See accompanying notes which are an integral part of the financial statements.
Notes to Financial Statements
For the period ended July 31, 2018
1. Organization.
Fidelity Flex Large Cap Growth Fund (the Fund) is a fund of Fidelity Securities Fund (the Trust) and is authorized to issue an unlimited number of shares. Share transactions on the Statement of Changes in Net Assets may contain exchanges between affiliated funds. The Trust is registered under the Investment Company Act of 1940, as amended (the 1940 Act), as an open-end management investment company organized as a Massachusetts business trust. The Fund is available only to certain fee-based accounts offered by Fidelity.
2. Investments in Fidelity Central Funds.
The Fund invests in Fidelity Central Funds, which are open-end investment companies generally available only to other investment companies and accounts managed by the investment adviser and its affiliates. The Fund's Schedule of Investments lists each of the Fidelity Central Funds held as of period end, if any, as an investment of the Fund, but does not include the underlying holdings of each Fidelity Central Fund. As an Investing Fund, the Fund indirectly bears its proportionate share of the expenses of the underlying Fidelity Central Funds.
The Money Market Central Funds seek preservation of capital and current income and are managed by Fidelity Investments Money Management, Inc. (FIMM), an affiliate of the investment adviser. Annualized expenses of the Money Market Central Funds as of their most recent shareholder report date are less than .005%.
A complete unaudited list of holdings for each Fidelity Central Fund is available upon request or at the Securities and Exchange Commission (the SEC) website at www.sec.gov. In addition, the financial statements of the Fidelity Central Funds, which are not covered by the Fund's Report of Independent Registered Public Accounting Firm, are available on the SEC website or upon request.
3. Significant Accounting Policies.
The Fund is an investment company and applies the accounting and reporting guidance of the Financial Accounting Standards Board (FASB) Accounting Standards Codification Topic 946 Financial Services – Investments Companies. The financial statements have been prepared in conformity with accounting principles generally accepted in the United States of America (GAAP), which require management to make certain estimates and assumptions at the date of the financial statements. Actual results could differ from those estimates. Subsequent events, if any, through the date that the financial statements were issued have been evaluated in the preparation of the financial statements. The following summarizes the significant accounting policies of the Fund:
Investment Valuation. Investments are valued as of 4:00 p.m. Eastern time on the last calendar day of the period. The Board of Trustees (the Board) has delegated the day to day responsibility for the valuation of the Fund's investments to the Fair Value Committee (the Committee) established by the Fund's investment adviser. In accordance with valuation policies and procedures approved by the Board, the Fund attempts to obtain prices from one or more third party pricing vendors or brokers to value its investments. When current market prices, quotations or currency exchange rates are not readily available or reliable, investments will be fair valued in good faith by the Committee, in accordance with procedures adopted by the Board. Factors used in determining fair value vary by investment type and may include market or investment specific events. The frequency with which these procedures are used cannot be predicted and they may be utilized to a significant extent. The Committee oversees the Fund's valuation policies and procedures and reports to the Board on the Committee's activities and fair value determinations. The Board monitors the appropriateness of the procedures used in valuing the Fund's investments and ratifies the fair value determinations of the Committee.
The Fund categorizes the inputs to valuation techniques used to value its investments into a disclosure hierarchy consisting of three levels as shown below:
- Level 1 – quoted prices in active markets for identical investments
- Level 2 – other significant observable inputs (including quoted prices for similar investments, interest rates, prepayment speeds, etc.)
- Level 3 – unobservable inputs (including the Fund's own assumptions based on the best information available)
Valuation techniques used to value the Fund's investments by major category are as follows:
Equity securities, including restricted securities, for which market quotations are readily available, are valued at the last reported sale price or official closing price as reported by a third party pricing vendor on the primary market or exchange on which they are traded and are categorized as Level 1 in the hierarchy. In the event there were no sales during the day or closing prices are not available, securities are valued at the last quoted bid price or may be valued using the last available price and are generally categorized as Level 2 in the hierarchy. For foreign equity securities, when market or security specific events arise, comparisons to the valuation of American Depositary Receipts (ADRs), futures contracts, Exchange-Traded Funds (ETFs) and certain indexes as well as quoted prices for similar securities may be used and would be categorized as Level 2 in the hierarchy. Utilizing these techniques may result in transfers between Level 1 and Level 2. For equity securities, including restricted securities, where observable inputs are limited, assumptions about market activity and risk are used and these securities may be categorized as Level 3 in the hierarchy. Equity securities, including restricted securities, for which observable inputs are not available are valued using alternate valuation approaches, including the market approach and the income approach and are categorized as Level 3 in the hierarchy. The market approach generally consists of using comparable market transactions while the income approach generally consists of using the net present value of estimated future cash flows, adjusted as appropriate for liquidity, credit, market and/or other risk factors.
Investments in open-end mutual funds, including the Fidelity Central Funds, are valued at their closing net asset value (NAV) each business day and are categorized as Level 1 in the hierarchy.
The following provides information on Level 3 securities held by the Fund that were valued at period end based on unobservable inputs. These amounts exclude valuations provided by a broker.
| Asset Type | Fair Value | Valuation Technique(s) | Unobservable Input | Amount or Range/Weighted Average | Impact to Valuation from an Increase in Input(a) |
| Equities | $252,593 | Market comparable | Enterprise value/Sales multiple (EV/S) | 2.1 - 3.6 / 2.9 | Increase |
| | | | Transaction price | $9.15 | Increase |
| | | | Discount rate | 38.0% - 73.0% / 61.7% | Decrease |
| | | | Discount for lack of marketability | 15.0% | Decrease |
| | | | Premium rate | 9.0% | Increase |
| | | Market approach | Transaction price | $0.18 - $179.25 / $74.33 | Increase |
| | | | Tender price | $143.40 | Increase |
(a) Represents the expected directional change in the fair value of the Level 3 investments that would result from an increase in the corresponding input. A decrease to the unobservable input would have the opposite effect. Significant changes in these inputs could result in significantly higher or lower fair value measurements.
Changes in valuation techniques may result in transfers in or out of an assigned level within the disclosure hierarchy. The aggregate value of investments by input level as of July 31, 2018, as well as a roll forward of Level 3 investments, is included at the end of the Fund's Schedule of Investments.
Foreign Currency. The Fund may use foreign currency contracts to facilitate transactions in foreign-denominated securities. Gains and losses from these transactions may arise from changes in the value of the foreign currency or if the counterparties do not perform under the contracts' terms.
Foreign-denominated assets, including investment securities, and liabilities are translated into U.S. dollars at the exchange rates at period end. Purchases and sales of investment securities, income and dividends received and expenses denominated in foreign currencies are translated into U.S. dollars at the exchange rate in effect on the transaction date.
The effects of exchange rate fluctuations on investments are included with the net realized and unrealized gain (loss) on investment securities. Other foreign currency transactions resulting in realized and unrealized gain (loss) are disclosed separately.
Investment Transactions and Income. For financial reporting purposes, the Fund's investment holdings and NAV include trades executed through the end of the last business day of the period. The NAV per share for processing shareholder transactions is calculated as of the close of business of the New York Stock Exchange (NYSE), normally 4:00 p.m. Eastern time and includes trades executed through the end of the prior business day. Gains and losses on securities sold are determined on the basis of identified cost. Dividend income is recorded on the ex-dividend date, except for certain dividends from foreign securities where the ex-dividend date may have passed, which are recorded as soon as the Fund is informed of the ex-dividend date. Non-cash dividends included in dividend income, if any, are recorded at the fair market value of the securities received. Income and capital gain distributions from Fidelity Central Funds, if any, are recorded on the ex-dividend date. Certain distributions received by the Fund represent a return of capital or capital gain. The Fund determines the components of these distributions subsequent to the ex-dividend date, based upon receipt of tax filings or other correspondence relating to the underlying investment. These distributions are recorded as a reduction of cost of investments and/or as a realized gain. Large, non-recurring dividends recognized by the Fund are presented separately on the Statement of Operations as "Special Dividends" and the impact of these dividends is presented in the Financial Highlights. Interest income is accrued as earned and includes coupon interest and amortization of premium and accretion of discount on debt securities as applicable. Investment income is recorded net of foreign taxes withheld where recovery of such taxes is uncertain.
Expenses. Expenses directly attributable to a fund are charged to that fund. Expenses attributable to more than one fund are allocated among the respective funds on the basis of relative net assets or other appropriate methods. Expense estimates are accrued in the period to which they relate and adjustments are made when actual amounts are known.
Income Tax Information and Distributions to Shareholders. Each year, the Fund intends to qualify as a regulated investment company under Subchapter M of the Internal Revenue Code, including distributing substantially all of its taxable income and realized gains. As a result, no provision for U.S. Federal income taxes is required. As of July 31, 2018, the Fund did not have any unrecognized tax benefits in the financial statements; nor is the Fund aware of any tax positions for which it is reasonably possible that the total amounts of unrecognized tax benefits will significantly change in the next twelve months. The Fund files a U.S. federal tax return, in addition to state and local tax returns as required. The Fund's federal income tax returns are subject to examination by the Internal Revenue Service (IRS) for a period of three fiscal years after they are filed. State and local tax returns may be subject to examination for an additional fiscal year depending on the jurisdiction. Foreign taxes are provided for based on the Fund's understanding of the tax rules and rates that exist in the foreign markets in which it invests. The Fund is subject to a tax imposed on capital gains by certain countries in which it invests. An estimated deferred tax liability for net unrealized appreciation on the applicable securities is included in Other payables and accrued expenses on the Statement of Assets & Liabilities.
Distributions are declared and recorded on the ex-dividend date. Income and capital gain distributions are determined in accordance with income tax regulations, which may differ from GAAP. In addition, the Fund claimed a portion of the payment made to redeeming shareholders as a distribution for income tax purposes.
Capital accounts within the financial statements are adjusted for permanent book-tax differences. These adjustments have no impact on net assets or the results of operations. Capital accounts are not adjusted for temporary book-tax differences which will reverse in a subsequent period.
Book-tax differences are primarily due to foreign currency transactions, partnerships, passive foreign investment companies (PFIC) and losses deferred due to wash sales.
As of period end, the cost and unrealized appreciation (depreciation) in securities, and derivatives if applicable, for federal income tax purposes were as follows:
| Gross unrealized appreciation | $3,303,831 |
| Gross unrealized depreciation | (229,007) |
| Net unrealized appreciation (depreciation) | $3,074,824 |
| Tax Cost | $11,554,818 |
The tax-based components of distributable earnings as of period end were as follows:
| Undistributed ordinary income | $229,895 |
| Undistributed long-term capital gain | $95,736 |
| Net unrealized appreciation (depreciation) on securities and other investments | $3,047,812 |
The tax character of distributions paid was as follows:
| | July 31, 2018 |
| Ordinary Income | $91,991 |
Restricted Securities. The Fund may invest in securities that are subject to legal or contractual restrictions on resale. These securities generally may be resold in transactions exempt from registration or to the public if the securities are registered. Disposal of these securities may involve time-consuming negotiations and expense, and prompt sale at an acceptable price may be difficult. Information regarding restricted securities is included at the end of the Fund's Schedule of Investments.
4. Purchases and Sales of Investments.
Purchases and sales of securities, other than short-term securities, aggregated $11,061,305 and $8,081,141, respectively.
5. Fees and Other Transactions with Affiliates.
Management Fee. Fidelity Management & Research Company (the investment adviser) and its affiliates provide the Fund with investment management related services and the Fund does not pay any fees for these services. Under the management contract, the investment adviser or an affiliate pays all other expenses of the Fund, excluding fees and expenses of the independent Trustees, and certain miscellaneous expenses such as proxy and shareholder meeting expenses.
Brokerage Commissions. The Fund placed a portion of its portfolio transactions with brokerage firms which are affiliates of the investment adviser. Brokerage commissions are included in net realized gain (loss) and change in net unrealized appreciation (depreciation) in the Statement of Operations. The commissions paid to these affiliated firms were $395 for the period.
Interfund Trades. The Fund may purchase from or sell securities to other Fidelity Funds under procedures adopted by the Board. The procedures have been designed to ensure these interfund trades are executed in accordance with Rule 17a-7 of the 1940 Act. Interfund trades are included within the respective purchases and sales amounts shown in the Purchases and Sales of Investments note.
6. Committed Line of Credit.
The Fund participates with other funds managed by the investment adviser or an affiliate in a $4.25 billion credit facility (the "line of credit") to be utilized for temporary or emergency purposes to fund shareholder redemptions or for other short-term liquidity purposes. The Fund has agreed to pay commitment fees on its pro-rata portion of the line of credit, which amounted to $33 and is reflected in Commitment fees on the Statement of Operations. During the period, the Fund did not borrow on this line of credit.
7. Other.
The Fund's organizational documents provide former and current trustees and officers with a limited indemnification against liabilities arising in connection with the performance of their duties to the Fund. In the normal course of business, the Fund may also enter into contracts that provide general indemnifications. The Fund's maximum exposure under these arrangements is unknown as this would be dependent on future claims that may be made against the Fund. The risk of material loss from such claims is considered remote.
At the end of the period, the investment adviser or its affiliates were the owners of record of 48% of the total outstanding shares of the Fund.
Report of Independent Registered Public Accounting Firm
To the Trustees of Fidelity Securities Fund and Shareholders of Fidelity Flex Large Cap Growth Fund:
Opinion on the Financial Statements and Financial Highlights
We have audited the accompanying statement of assets and liabilities of Fidelity Flex Large Cap Growth Fund (the "Fund"), a fund of Fidelity Securities Fund including the schedule of investments, as of July 31, 2018, the related statement of operations for the year then ended, the statement of changes in net assets and the financial highlights for the year then ended and for the period from March 8, 2017 (commencement of operations) to July 31, 2017, and the related notes. In our opinion, the financial statements and financial highlights present fairly, in all material respects, the financial position of the Fund as of July 31, 2018, the results of its operations for the year then ended, and the changes in its net assets and the financial highlights for the year then ended and for the period from March 8, 2017 (commencement of operations) to July 31, 2017, in conformity with accounting principles generally accepted in the United States of America.
Basis for Opinion
These financial statements and financial highlights are the responsibility of the Fund's management. Our responsibility is to express an opinion on the Fund's financial statements and financial highlights based on our audits. We are a public accounting firm registered with the Public Company Accounting Oversight Board (United States) (PCAOB) and are required to be independent with respect to the Fund in accordance with the U.S. federal securities laws and the applicable rules and regulations of the Securities and Exchange Commission and the PCAOB.
We conducted our audits in accordance with the standards of the PCAOB. Those standards require that we plan and perform the audit to obtain reasonable assurance about whether the financial statements and financial highlights are free of material misstatement, whether due to error or fraud. The Fund is not required to have, nor were we engaged to perform, an audit of its internal control over financial reporting. As part of our audits we are required to obtain an understanding of internal control over financial reporting but not for the purpose of expressing an opinion on the effectiveness of the Fund’s internal control over financial reporting. Accordingly, we express no such opinion.
Our audits included performing procedures to assess the risks of material misstatement of the financial statements and financial highlights, whether due to error or fraud, and performing procedures that respond to those risks. Such procedures included examining, on a test basis, evidence regarding the amounts and disclosures in the financial statements and financial highlights. Our audits also included evaluating the accounting principles used and significant estimates made by management, as well as evaluating the overall presentation of the financial statements and financial highlights. Our procedures included confirmation of securities owned as of July 31, 2018, by correspondence with the custodians and brokers; when replies were not received from brokers, we performed other auditing procedures. We believe that our audits provide a reasonable basis for our opinion.
/s/ Deloitte & Touche LLP
Boston, Massachusetts
September 17, 2018
We have served as the auditor of one or more of the Fidelity investment companies since 1999.
Trustees and Officers
The Trustees, Members of the Advisory Board (if any), and officers of the trust and fund, as applicable, are listed below. The Board of Trustees governs the fund and is responsible for protecting the interests of shareholders. The Trustees are experienced executives who meet periodically throughout the year to oversee the fund's activities, review contractual arrangements with companies that provide services to the fund, oversee management of the risks associated with such activities and contractual arrangements, and review the fund's performance. Except for Jonathan Chiel, each of the Trustees oversees 286 funds. Mr. Chiel oversees 150 funds.
The Trustees hold office without limit in time except that (a) any Trustee may resign; (b) any Trustee may be removed by written instrument, signed by at least two-thirds of the number of Trustees prior to such removal; (c) any Trustee who requests to be retired or who has become incapacitated by illness or injury may be retired by written instrument signed by a majority of the other Trustees; and (d) any Trustee may be removed at any special meeting of shareholders by a two-thirds vote of the outstanding voting securities of the trust. Each Trustee who is not an interested person (as defined in the 1940 Act) of the trust and the fund is referred to herein as an Independent Trustee. Each Independent Trustee shall retire not later than the last day of the calendar year in which his or her 75th birthday occurs. The Independent Trustees may waive this mandatory retirement age policy with respect to individual Trustees. Officers and Advisory Board Members hold office without limit in time, except that any officer or Advisory Board Member may resign or may be removed by a vote of a majority of the Trustees at any regular meeting or any special meeting of the Trustees. Except as indicated, each individual has held the office shown or other offices in the same company for the past five years.
The fund’s Statement of Additional Information (SAI) includes more information about the Trustees. To request a free copy, call Fidelity at 1-800-835-5092.
Experience, Skills, Attributes, and Qualifications of the Trustees. The Governance and Nominating Committee has adopted a statement of policy that describes the experience, qualifications, attributes, and skills that are necessary and desirable for potential Independent Trustee candidates (Statement of Policy). The Board believes that each Trustee satisfied at the time he or she was initially elected or appointed a Trustee, and continues to satisfy, the standards contemplated by the Statement of Policy. The Governance and Nominating Committee also engages professional search firms to help identify potential Independent Trustee candidates who have the experience, qualifications, attributes, and skills consistent with the Statement of Policy. From time to time, additional criteria based on the composition and skills of the current Independent Trustees, as well as experience or skills that may be appropriate in light of future changes to board composition, business conditions, and regulatory or other developments, have also been considered by the professional search firms and the Governance and Nominating Committee. In addition, the Board takes into account the Trustees' commitment and participation in Board and committee meetings, as well as their leadership of standing and ad hoc committees throughout their tenure.
In determining that a particular Trustee was and continues to be qualified to serve as a Trustee, the Board has considered a variety of criteria, none of which, in isolation, was controlling. The Board believes that, collectively, the Trustees have balanced and diverse experience, qualifications, attributes, and skills, which allow the Board to operate effectively in governing the fund and protecting the interests of shareholders. Information about the specific experience, skills, attributes, and qualifications of each Trustee, which in each case led to the Board's conclusion that the Trustee should serve (or continue to serve) as a trustee of the fund, is provided below.
Board Structure and Oversight Function. James C. Curvey is an interested person and currently serves as Chairman. The Trustees have determined that an interested Chairman is appropriate and benefits shareholders because an interested Chairman has a personal and professional stake in the quality and continuity of services provided to the fund. Independent Trustees exercise their informed business judgment to appoint an individual of their choosing to serve as Chairman, regardless of whether the Trustee happens to be independent or a member of management. The Independent Trustees have determined that they can act independently and effectively without having an Independent Trustee serve as Chairman and that a key structural component for assuring that they are in a position to do so is for the Independent Trustees to constitute a substantial majority for the Board. The Independent Trustees also regularly meet in executive session. Ned C. Lautenbach serves as Chairman of the Independent Trustees and as such (i) acts as a liaison between the Independent Trustees and management with respect to matters important to the Independent Trustees and (ii) with management prepares agendas for Board meetings.
Fidelity® funds are overseen by different Boards of Trustees. The fund's Board oversees Fidelity's high income and certain equity funds, and other Boards oversee Fidelity's investment-grade bond, money market, asset allocation, and other equity funds. The asset allocation funds may invest in Fidelity® funds overseen by the fund's Board. The use of separate Boards, each with its own committee structure, allows the Trustees of each group of Fidelity® funds to focus on the unique issues of the funds they oversee, including common research, investment, and operational issues. On occasion, the separate Boards establish joint committees to address issues of overlapping consequences for the Fidelity® funds overseen by each Board.
The Trustees operate using a system of committees to facilitate the timely and efficient consideration of all matters of importance to the Trustees, the fund, and fund shareholders and to facilitate compliance with legal and regulatory requirements and oversight of the fund's activities and associated risks. The Board, acting through its committees, has charged FMR and its affiliates with (i) identifying events or circumstances the occurrence of which could have demonstrably adverse effects on the fund's business and/or reputation; (ii) implementing processes and controls to lessen the possibility that such events or circumstances occur or to mitigate the effects of such events or circumstances if they do occur; and (iii) creating and maintaining a system designed to evaluate continuously business and market conditions in order to facilitate the identification and implementation processes described in (i) and (ii) above. Because the day-to-day operations and activities of the fund are carried out by or through FMR, its affiliates, and other service providers, the fund's exposure to risks is mitigated but not eliminated by the processes overseen by the Trustees. While each of the Board's committees has responsibility for overseeing different aspects of the fund's activities, oversight is exercised primarily through the Operations, Audit, and Compliance Committees. In addition, the Independent Trustees have worked with Fidelity to enhance the Board's oversight of investment and financial risks, legal and regulatory risks, technology risks, and operational risks, including the development of additional risk reporting to the Board. Appropriate personnel, including but not limited to the fund's Chief Compliance Officer (CCO), FMR's internal auditor, the independent accountants, the fund's Treasurer and portfolio management personnel, make periodic reports to the Board's committees, as appropriate, including an annual review of Fidelity's risk management program for the Fidelity® funds. The responsibilities of each standing committee, including their oversight responsibilities, are described further under "Standing Committees of the Trustees."
Interested Trustees*:
Correspondence intended for a Trustee who is an interested person may be sent to Fidelity Investments, 245 Summer Street, Boston, Massachusetts 02210.
Name, Year of Birth; Principal Occupations and Other Relevant Experience+
Jonathan Chiel (1957)
Year of Election or Appointment: 2016
Trustee
Mr. Chiel also serves as Trustee of other Fidelity® funds. Mr. Chiel is Executive Vice President and General Counsel for FMR LLC (diversified financial services company, 2012-present). Previously, Mr. Chiel served as general counsel (2004-2012) and senior vice president and deputy general counsel (2000-2004) for John Hancock Financial Services; a partner with Choate, Hall & Stewart (1996-2000) (law firm); and an Assistant United States Attorney for the United States Attorney’s Office of the District of Massachusetts (1986-95), including Chief of the Criminal Division (1993-1995). Mr. Chiel is a director on the boards of the Boston Bar Foundation and the Maimonides School.
James C. Curvey (1935)
Year of Election or Appointment: 2007
Trustee
Chairman of the Board of Trustees
Mr. Curvey also serves as Trustee of other Fidelity® funds. Mr. Curvey is Vice Chairman (2007-present) and Director of FMR LLC (diversified financial services company). In addition, Mr. Curvey is an Overseer Emeritus for the Boston Symphony Orchestra, a Director of Artis-Naples, and a Trustee of Brewster Academy in Wolfeboro, New Hampshire. Previously, Mr. Curvey served as a Director of Fidelity Research & Analysis Co. (investment adviser firm, 2009-2018), Director of Fidelity Investments Money Management, Inc. (investment adviser firm, 2009-2014) and a Director of FMR and FMR Co., Inc. (investment adviser firms, 2007-2014).
Charles S. Morrison (1960)
Year of Election or Appointment: 2014
Trustee
Mr. Morrison also serves as Trustee of other funds. He serves as President of Fidelity SelectCo, LLC (investment adviser firm, 2017-present) and Fidelity Management & Research Company (FMR) (investment adviser firm, 2016-present), a Director of Fidelity Investments Money Management, Inc. (FIMM) (investment adviser firm, 2014-present), Director of Fidelity SelectCo, LLC (investment adviser firm, 2014-present), President, Asset Management (2014-present), and is an employee of Fidelity Investments. Previously, Mr. Morrison served as Vice President of Fidelity's Fixed Income and Asset Allocation Funds (2012-2014), President, Fixed Income (2011-2014), Vice President of Fidelity's Money Market Funds (2005-2009), President, Money Market Group Leader of FMR (investment adviser firm, 2009), and Senior Vice President, Money Market Group of FMR (2004-2009). Mr. Morrison also served as Vice President of Fidelity's Bond Funds (2002-2005), certain Balanced Funds (2002-2005), and certain Asset Allocation Funds (2002-2007), and as Senior Vice President (2002-2005) of Fidelity's Bond Division.
* Determined to be an “Interested Trustee” by virtue of, among other things, his or her affiliation with the trust or various entities under common control with FMR.
+ The information includes the Trustee's principal occupation during the last five years and other information relating to the experience, attributes, and skills relevant to the Trustee's qualifications to serve as a Trustee, which led to the conclusion that the Trustee should serve as a Trustee for the fund.
Independent Trustees:
Correspondence intended for an Independent Trustee may be sent to Fidelity Investments, P.O. Box 55235, Boston, Massachusetts 02205-5235.
Name, Year of Birth; Principal Occupations and Other Relevant Experience+
Dennis J. Dirks (1948)
Year of Election or Appointment: 2005
Trustee
Mr. Dirks also serves as Trustee of other Fidelity® funds. Prior to his retirement in May 2003, Mr. Dirks was Chief Operating Officer and a member of the Board of The Depository Trust & Clearing Corporation (DTCC). He also served as President, Chief Operating Officer, and Board member of The Depository Trust Company (DTC) and President and Board member of the National Securities Clearing Corporation (NSCC). In addition, Mr. Dirks served as Chief Executive Officer and Board member of the Government Securities Clearing Corporation, Chief Executive Officer and Board member of the Mortgage-Backed Securities Clearing Corporation, as a Trustee and a member of the Finance Committee of Manhattan College (2005-2008), as a Trustee and a member of the Finance Committee of AHRC of Nassau County (2006-2008), as a member of the Independent Directors Council (IDC) Governing Council (2010-2015), and as a member of the Board of Directors for The Brookville Center for Children’s Services, Inc. (2009-2017). Mr. Dirks is a member of the Finance Committee (2016-present), Board of Directors (2017-present) and Board of Trustees (2018-present) and is Treasurer (2018-present) of the Asolo Repertory Theatre.
Donald F. Donahue (1950)
Year of Election or Appointment: 2018
Trustee
Mr. Donahue also serves as a Trustee of other Fidelity® funds. Mr. Donahue is President and Chief Executive Officer of Miranda Partners, LLC (risk consulting for the financial services industry, 2012-present). Previously, Mr. Donahue served as a Member of the Advisory Board of certain Fidelity® funds (2015-2018) and Chief Executive Officer (2006-2012), Chief Operating Officer (2003-2006), and Managing Director, Customer Marketing and Development (1999-2003) of The Depository Trust & Clearing Corporation (financial markets infrastructure). Mr. Donahue serves as a Member (2007-present) and Co-Chairman (2016-present) of the Board of Directors of United Way of New York, Member of the Board of Directors of NYC Leadership Academy (2012-present) and Member of the Board of Advisors of Ripple Labs, Inc. (financial services, 2015-present). He also served as Chairman (2010-2012) and Member of the Board of Directors (2012-2013) of Omgeo, LLC (financial services), Treasurer of United Way of New York (2012-2016), and Member of the Board of Directors of XBRL US (financial services non-profit, 2009-2012) and the International Securities Services Association (2009-2012).
Alan J. Lacy (1953)
Year of Election or Appointment: 2008
Trustee
Mr. Lacy also serves as Trustee of other Fidelity® funds. Mr. Lacy serves as a Director of Bristol-Myers Squibb Company (global pharmaceuticals, 2008-present). He is a Trustee of the California Chapter of The Nature Conservancy (2015-present) and a Director of the Center for Advanced Study in the Behavioral Sciences at Stanford University (2015-present). In addition, Mr. Lacy served as Senior Adviser (2007-2014) of Oak Hill Capital Partners, L.P. (private equity) and also served as Chief Executive Officer (2005) and Vice Chairman (2005-2006) of Sears Holdings Corporation (retail) and Chief Executive Officer and Chairman of the Board of Sears, Roebuck and Co. (retail, 2000-2005). Previously, Mr. Lacy served as Chairman (2014-2017) and a member (2010-2017) of the Board of Directors of Dave & Buster’s Entertainment, Inc. (restaurant and entertainment complexes), as Chairman (2008-2011) and a member (2006-2015) of the Board of Trustees of the National Parks Conservation Association, and as a member of the Board of Directors for The Hillman Companies, Inc. (hardware wholesalers, 2010-2014), Earth Fare, Inc. (retail grocery, 2010-2014), and The Western Union Company (global money transfer, 2006-2011).
Ned C. Lautenbach (1944)
Year of Election or Appointment: 2000
Trustee
Chairman of the Independent Trustees
Mr. Lautenbach also serves as Trustee of other Fidelity® funds. Mr. Lautenbach currently serves as Vice Chair of the Board of Governors, State University System of Florida (2013-present) and is a member of the Council on Foreign Relations (1994-present). He is also a member and has most recently served as Chairman of the Board of Directors of Artis-Naples (2012-present). Previously, Mr. Lautenbach served as a member and then Lead Director of the Board of Directors of Eaton Corporation (diversified industrial, 1997-2016). He was also a Partner and Advisory Partner at Clayton, Dubilier & Rice, LLC (private equity investment, 1998-2010), as well as a Director of Sony Corporation (2006-2007). In addition, Mr. Lautenbach also had a 30-year career with IBM (technology company) during which time he served as Senior Vice President and a member of the Corporate Executive Committee (1968-1998).
Joseph Mauriello (1944)
Year of Election or Appointment: 2008
Trustee
Mr. Mauriello also serves as Trustee of other Fidelity® funds. Prior to his retirement in January 2006, Mr. Mauriello served in numerous senior management positions including Deputy Chairman and Chief Operating Officer (2004-2005), and Vice Chairman of Financial Services (2002-2004) of KPMG LLP US (professional services, 1965-2005). Mr. Mauriello currently serves as a member of the Board of Directors of XL Group plc. (global insurance and re-insurance, 2006-present) and the Independent Directors Council (IDC) Governing Council (2015-present). Previously, Mr. Mauriello served as a Director of the Hamilton Funds of the Bank of New York (2006-2007) and of Arcadia Resources Inc. (health care services and products, 2007-2012).
Cornelia M. Small (1944)
Year of Election or Appointment: 2005
Trustee
Ms. Small also serves as Trustee of other Fidelity® funds. Ms. Small is a member of the Board of Directors (2009-present) and Chair of the Investment Committee (2010-present) of the Teagle Foundation. Ms. Small also serves on the Investment Committee of the Berkshire Taconic Community Foundation (2008-present). Previously, Ms. Small served as Chairperson (2002-2008) and a member of the Investment Committee and Chairperson (2008-2012) and a member of the Board of Trustees of Smith College. In addition, Ms. Small served as Chief Investment Officer, Director of Global Equity Investments, and a member of the Board of Directors of Scudder, Stevens & Clark and Scudder Kemper Investments.
Garnett A. Smith (1947)
Year of Election or Appointment: 2018
Trustee
Mr. Smith also serves as Trustee of other Fidelity® funds. Prior to Mr. Smith's retirement, he served as Chairman and Chief Executive Officer of Inbrand Corp. (manufacturer of personal absorbent products, 1990-1997). He also served as President (1986-1990) of Inbrand Corp. Prior to his employment with Inbrand Corp., he was employed by a retail fabric chain and North Carolina National Bank. In addition, Mr. Smith served as a Member of the Advisory Board of certain Fidelity® funds (2012-2013) and as a board member of the Jackson Hole Land Trust (2009-2012).
David M. Thomas (1949)
Year of Election or Appointment: 2008
Trustee
Mr. Thomas also serves as Trustee of other Fidelity® funds. Mr. Thomas serves as Non-Executive Chairman of the Board of Directors of Fortune Brands Home and Security (home and security products, 2011-present), as a member of the Board of Directors (2004-present) and Presiding Director (2013-present) of Interpublic Group of Companies, Inc. (marketing communication), and as a member of the Board of Trustees of the University of Florida (2013-present). Previously, Mr. Thomas served as Executive Chairman (2005-2006) and Chairman and Chief Executive Officer (2000-2005) of IMS Health, Inc. (pharmaceutical and healthcare information solutions), and a Director of Fortune Brands, Inc. (consumer products, 2000-2011).
+ The information includes the Trustee's principal occupation during the last five years and other information relating to the experience, attributes, and skills relevant to the Trustee's qualifications to serve as a Trustee, which led to the conclusion that the Trustee should serve as a Trustee for the fund.
Advisory Board Members and Officers:
Correspondence intended for a Member of the Advisory Board (if any) may be sent to Fidelity Investments, P.O. Box 55235, Boston, Massachusetts 02205-5235. Correspondence intended for an officer or Peter S. Lynch may be sent to Fidelity Investments, 245 Summer Street, Boston, Massachusetts 02210. Officers appear below in alphabetical order.
Name, Year of Birth; Principal Occupation
Peter S. Lynch (1944)
Year of Election or Appointment: 2003
Member of the Advisory Board
Mr. Lynch also serves as Member of the Advisory Board of other Fidelity® funds. Mr. Lynch is Vice Chairman and a Director of FMR (investment adviser firm) and FMR Co., Inc. (investment adviser firm). In addition, Mr. Lynch serves as a Trustee of Boston College and as the Chairman of the Inner-City Scholarship Fund. Previously, Mr. Lynch served on the Special Olympics International Board of Directors (1997-2006).
William S. Stavropoulos (1939)
Year of Election or Appointment: 2018
Member of the Advisory Board
Mr. Stavropoulos also serves as Member of the Advisory Board of other Fidelity® funds. Mr. Stavropoulos serves as President and Founder of the Michigan Baseball Foundation, the Great Lakes Loons (2007-present). Mr. Stavropoulos is Chairman Emeritus of the Board of Directors of The Dow Chemical Company, where he previously served in numerous senior management positions, including President, CEO (1995-2000; 2002-2004), Chairman of the Executive Committee (2000-2006), and as a member of the Board of Directors (1990-2006). Currently, Mr. Stavropoulos is Chairman of the Board of Directors of Univar Inc. (global distributor of commodity and specialty chemicals), a Director of Teradata Corporation (data warehousing and technology solutions), and a member of the Advisory Board for Metalmark Capital LLC (private equity investment, 2005-present). Mr. Stavropoulos is an operating advisor to Clayton, Dubilier & Rice, LLC (private equity investment). In addition, Mr. Stavropoulos is a member of the University of Notre Dame Advisory Council for the College of Science, a Trustee of the Rollin L. Gerstacker Foundation, and a Director of Artis-Naples in Naples, Florida. Previously, Mr. Stavropoulos served as Trustee of certain Fidelity® funds (2001-2018) and as a Director of Chemical Financial Corporation (bank holding company, 1993-2012) and Tyco International, Ltd. (multinational manufacturing and services, 2007-2012).
Carol B. Tomé (1957)
Year of Election or Appointment: 2018
Member of the Advisory Board
Ms. Tomé also serves as Member of the Advisory Board of other Fidelity® funds. Ms. Tomé is Chief Financial Officer (2001-present) and Executive Vice President of Corporate Services (2007-present) of The Home Depot, Inc. (home improvement retailer) and a Director (2003-present) and Chair of the Audit Committee (2004-present) of United Parcel Service, Inc. (package delivery and supply chain management). Previously, Ms. Tomé served as Trustee of certain Fidelity® funds (2017), Senior Vice President of Finance and Accounting/Treasurer (2000-2007) and Vice President and Treasurer (1995-2000) of The Home Depot, Inc. and Chair of the Board (2010-2012), Vice Chair of the Board (2009 and 2013), and a Director (2008-2013) of the Federal Reserve Bank of Atlanta. Ms. Tomé is also a director or trustee of many community and professional organizations.
Michael E. Wiley (1950)
Year of Election or Appointment: 2018
Member of the Advisory Board
Mr. Wiley also serves as Trustee or Member of the Advisory Board of other Fidelity® funds. Mr. Wiley serves as a Director of Andeavor Corporation (independent oil refiner and marketer, 2005-present), a Director of Andeavor Logistics LP (natural resources logistics, 2015-present), and a Director of Bill Barrett Corporation (exploration and production, 2005-present). In addition, Mr. Wiley also serves as a Director of Post Oak Bank (privately-held bank, 2004-present). Previously, Mr. Wiley served as a Trustee of other Fidelity® funds (2008-2013), as a Director of Asia Pacific Exploration Consolidated (international oil and gas exploration and production, 2008-2013), as a member of the Board of Trustees of the University of Tulsa (2000-2006; 2007-2010), as a Senior Energy Advisor of Katzenbach Partners, LLC (consulting, 2006-2007), as an Advisory Director of Riverstone Holdings (private investment), Chairman, President, and CEO of Baker Hughes, Inc. (oilfield services, 2000-2004), and as Director of Spinnaker Exploration Company (exploration and production, 2001-2005).
Elizabeth Paige Baumann (1968)
Year of Election or Appointment: 2017
Anti-Money Laundering (AML) Officer
Ms. Baumann also serves as AML Officer of other funds. She is Chief AML Officer (2012-present) and Senior Vice President (2014-present) of FMR LLC (diversified financial services company) and is an employee of Fidelity Investments. Previously, Ms. Baumann served as AML Officer of the funds (2012-2016), and Vice President (2007-2014) and Deputy Anti-Money Laundering Officer (2007-2012) of FMR LLC.
Marc R. Bryant (1966)
Year of Election or Appointment: 2015
Secretary and Chief Legal Officer (CLO)
Mr. Bryant also serves as Secretary and CLO of other funds. Mr. Bryant serves as CLO, Secretary, and Senior Vice President of Fidelity Management & Research Company (investment adviser firm, 2015-present) and FMR Co., Inc. (investment adviser firm, 2015-present); Secretary of Fidelity SelectCo, LLC (investment adviser firm, 2015-present) and Fidelity Investments Money Management, Inc. (investment adviser firm, 2015-present); and CLO of Fidelity Management & Research (Hong Kong) Limited and FMR Investment Management (UK) Limited (investment adviser firms, 2015-present) and Fidelity Management & Research (Japan) Limited (investment adviser firm, 2016-present). He is Senior Vice President and Deputy General Counsel of FMR LLC (diversified financial services company). Previously, Mr. Bryant served as Secretary and CLO of Fidelity Rutland Square Trust II (2010-2014) and Assistant Secretary of Fidelity's Fixed Income and Asset Allocation Funds (2013-2015). Prior to joining Fidelity Investments, Mr. Bryant served as a Senior Vice President and the Head of Global Retail Legal for AllianceBernstein L.P. (2006-2010), and as the General Counsel for ProFund Advisors LLC (2001-2006).
John J. Burke III (1964)
Year of Election or Appointment: 2018
Chief Financial Officer
Mr. Burke also serves as Chief Financial Officer of other funds. Mr. Burke serves as Head of Investment Operations for Fidelity Fund and Investment Operations (2018-present) and is an employee of Fidelity Investments (1998-present). Previously Mr. Burke served as head of Asset Management Investment Operations (2012-2018).
William C. Coffey (1969)
Year of Election or Appointment: 2009
Assistant Secretary
Mr. Coffey also serves as Assistant Secretary of other funds. He is Senior Vice President and Deputy General Counsel of FMR LLC (diversified financial services company, 2010-present), and is an employee of Fidelity Investments. Previously, Mr. Coffey served as Vice President and Associate General Counsel of FMR LLC (2005-2009).
Timothy M. Cohen (1969)
Year of Election or Appointment: 2018
Vice President
Mr. Cohen also serves as Vice President of other funds. Mr. Cohen serves as Co-Head of Global Equity Research (2016-present), a Director of Fidelity Management & Research (Japan) Limited (investment adviser firm, 2016-present), and is an employee of Fidelity Investments. Previously, Mr. Cohen served as Chief Investment Officer - Equity and a Director of Fidelity Management & Research (U.K.) Inc. (investment adviser firm, 2013-2015) and as a Director of Fidelity Management & Research (Hong Kong) Limited (investment adviser firm, 2017).
Jonathan Davis (1968)
Year of Election or Appointment: 2010
Assistant Treasurer
Mr. Davis also serves as Assistant Treasurer of other funds. Mr. Davis serves as Assistant Treasurer of FMR Capital, Inc. (2017-present) and is an employee of Fidelity Investments. Previously, Mr. Davis served as Vice President and Associate General Counsel of FMR LLC (diversified financial services company, 2003-2010).
Adrien E. Deberghes (1967)
Year of Election or Appointment: 2016
Assistant Treasurer
Mr. Deberghes also serves as an officer of other funds. He serves as Assistant Treasurer of FMR Capital, Inc. (2017-present), Executive Vice President of Fidelity Investments Money Management, Inc. (FIMM) (investment adviser firm, 2016-present), and is an employee of Fidelity Investments (2008-present). Previously, Mr. Deberghes served as President and Treasurer of certain Fidelity® funds (2013-2018). Prior to joining Fidelity Investments, Mr. Deberghes was Senior Vice President of Mutual Fund Administration at State Street Corporation (2007-2008), Senior Director of Mutual Fund Administration at Investors Bank & Trust (2005-2007), and Director of Finance for Dunkin' Brands (2000-2005). Previously, Mr. Deberghes served in other fund officer roles.
Laura M. Del Prato (1964)
Year of Election or Appointment: 2018
Assistant Treasurer
Ms. Del Prato also serves as an officer of other funds. Ms. Del Prato is an employee of Fidelity Investments (2017-present). Prior to joining Fidelity Investments, Ms. Del Prato served as a Managing Director and Treasurer of the JPMorgan Mutual Funds (2014-2017). Prior to JPMorgan, Ms. Del Prato served as a partner at Cohen Fund Audit Services (accounting firm, 2012-2013) and KPMG LLP (accounting firm, 2004-2012).
Colm A. Hogan (1973)
Year of Election or Appointment: 2016
Deputy Treasurer
Mr. Hogan also serves as an officer of other funds. Mr. Hogan serves as Assistant Treasurer of FMR Capital, Inc. (2017-present) and is an employee of Fidelity Investments (2005-present). Previously, Mr. Hogan served as Assistant Treasurer of certain Fidelity® funds (2016-2018).
Pamela R. Holding (1964)
Year of Election or Appointment: 2018
Vice President
Ms. Holding also serves as a Vice President of other funds. Ms. Holding serves as Co-Head of Global Equity Research (2018-present) and is an employee of Fidelity Investments (2013-present).
Chris Maher (1972)
Year of Election or Appointment: 2013
Assistant Treasurer
Mr. Maher serves as Assistant Treasurer of other funds. Mr. Maher is Vice President of Valuation Oversight, serves as Assistant Treasurer of FMR Capital, Inc. (2017-present), and is an employee of Fidelity Investments. Previously, Mr. Maher served as Vice President of Asset Management Compliance (2013), Vice President of the Program Management Group of FMR (investment adviser firm, 2010-2013), and Vice President of Valuation Oversight (2008-2010).
Rieco E. Mello (1969)
Year of Election or Appointment: 2017
Assistant Treasurer
Mr. Mello also serves as Assistant Treasurer of other funds. Mr. Mello serves as Assistant Treasurer of FMR Capital, Inc. (2017-present) and is an employee of Fidelity Investments (1995-present).
Kenneth B. Robins (1969)
Year of Election or Appointment: 2016
Chief Compliance Officer
Mr. Robins also serves as an officer of other funds. Mr. Robins serves as Compliance Officer of Fidelity Management & Research Company and FMR Co., Inc. (investment adviser firms, 2016-present) and is an employee of Fidelity Investments (2004-present). Previously, Mr. Robins served as Executive Vice President of Fidelity Investments Money Management, Inc. (investment adviser firm, 2013-2016) and served in other fund officer roles.
Stacie M. Smith (1974)
Year of Election or Appointment: 2016
President and Treasurer
Ms. Smith also serves as an officer of other funds. Ms. Smith serves as Assistant Treasurer of FMR Capital, Inc. (2017-present), is an employee of Fidelity Investments (2009-present), and has served in other fund officer roles. Prior to joining Fidelity Investments, Ms. Smith served as Senior Audit Manager of Ernst & Young LLP (accounting firm, 1996-2009). Previously, Ms. Smith served as Assistant Treasurer (2013-2018) and Deputy Treasurer (2013-2016) of certain Fidelity® funds.
Marc L. Spector (1972)
Year of Election or Appointment: 2016
Assistant Treasurer
Mr. Spector also serves as an officer of other funds. Mr. Spector serves as Assistant Treasurer of FMR Capital, Inc. (2017-present) and is an employee of Fidelity Investments (2016-present). Prior to joining Fidelity Investments, Mr. Spector served as Director at the Siegfried Group (accounting firm, 2013-2016), and prior to Siegfried Group as audit senior manager at Deloitte & Touche (accounting firm, 2005-2013).
Renee Stagnone (1975)
Year of Election or Appointment: 2016
Assistant Treasurer
Ms. Stagnone also serves as an officer of other funds. Ms. Stagnone serves as Assistant Treasurer of FMR Capital, Inc. (2017-present) and is an employee of Fidelity Investments (1997-present). Previously, Ms. Stagnone served as Deputy Treasurer of certain Fidelity® funds (2013-2016).
Shareholder Expense Example
As a shareholder of the Fund, you incur two types of costs: (1) transaction costs, and (2) ongoing costs, including other Fund expenses. This Example is intended to help you understand your ongoing costs (in dollars) of investing in the Fund and to compare these costs with the ongoing costs of investing in other mutual funds.
The Example is based on an investment of $1,000 invested at the beginning of the period and held for the entire period (February 1, 2018 to July 31, 2018).
Actual Expenses
The first line of the accompanying table provides information about actual account values and actual expenses. You may use the information in this line, together with the amount you invested, to estimate the expenses that you paid over the period. Simply divide your account value by $1,000.00 (for example, an $8,600 account value divided by $1,000.00 = 8.6), then multiply the result by the number in the first line under the heading entitled "Expenses Paid During Period" to estimate the expenses you paid on your account during this period. In addition, the Fund, as a shareholder in the underlying Fidelity Central Funds, will indirectly bear its pro-rata share of the fees and expenses incurred by the underlying Fidelity Central Funds. These fees and expenses are not included in the Fund's annualized expense ratio used to calculate the expense estimate in the table below.
Hypothetical Example for Comparison Purposes
The second line of the accompanying table provides information about hypothetical account values and hypothetical expenses based on the Fund's actual expense ratio and an assumed rate of return of 5% per year before expenses, which is not the Fund's actual return. The hypothetical account values and expenses may not be used to estimate the actual ending account balance or expenses you paid for the period. You may use this information to compare the ongoing costs of investing in the Fund and other funds. To do so, compare this 5% hypothetical example with the 5% hypothetical examples that appear in the shareholder reports of the other funds. In addition, the Fund, as a shareholder in the underlying Fidelity Central Funds, will indirectly bear its pro-rata share of the fees and expenses incurred by the underlying Fidelity Central Funds. These fees and expenses are not included in the Fund's annualized expense ratio used to calculate the expense estimate in the table below.
Please note that the expenses shown in the table are meant to highlight your ongoing costs only and do not reflect any transaction costs. Therefore, the second line of the table is useful in comparing ongoing costs only, and will not help you determine the relative total costs of owning different funds.
| | Annualized Expense Ratio-A | Beginning
Account Value
February 1, 2018 | Ending
Account Value
July 31, 2018 | Expenses Paid
During Period-B
February 1, 2018
to July 31, 2018 |
| Actual | - %-C | $1,000.00 | $1,040.80 | $--D |
| Hypothetical-E | | $1,000.00 | $1,024.79 | $--D |
A Annualized expense ratio reflects expenses net of applicable fee waivers.
B Expenses are equal to the Fund's annualized expense ratio, multiplied by the average account value over the period, multiplied by 181/365 (to reflect the one-half year period).
C Amount represents less than .005%.
D Amount represents less than $.005.
E 5% return per year before expenses
Distributions (Unaudited)
The Board of Trustees of Fidelity Flex Large Cap Growth Fund voted to pay on September 17, 2018, to shareholders of record at the opening of business on September 14, 2018, a distribution of $0.236 per share derived from capital gains realized from sales of portfolio securities and a dividend of $0.063 per share from net investment income.
The fund hereby designates as a capital gain dividend with respect to the taxable year ended July 31, 2018, $95,736, or, if subsequently determined to be different, the net capital gain of such year.
The fund designates 30% and 73% of the dividends distributed in September and December, respectively during the fiscal year as qualifying for the dividends–received deduction for corporate shareholders.
The fund designates 37% and 88% of the dividends distributed in September and December, respectively during the fiscal year as amounts which may be taken into account as a dividend for the purposes of the maximum rate under section 1(h)(11) of the Internal Revenue Code.
The fund will notify shareholders in January 2019 of amounts for use in preparing 2018 income tax returns.
Board Approval of Investment Advisory Contracts
Fidelity Flex Large Cap Growth Fund
At its July 2018 meeting, the Board of Trustees, including the Independent Trustees (together, the Board), voted to continue the management contract with Fidelity Management & Research Company (FMR) and the sub-advisory agreements (together, the Advisory Contracts) for the fund for six months through January 31, 2019, in connection with the reunification of the Fidelity Equity High Income Funds Board, which oversees the fund, and the Sector Portfolios Board.
The Board considered that the approval of the fund's Advisory Contracts will not result in any changes in (i) the investment process or strategies employed in the management of the fund's assets; (ii) the fees and expenses paid by shareholders; (iii) the nature, extent or quality of services provided under the fund's Advisory Contracts; or (iv) the day-to-day management of the fund or the persons primarily responsible for such management. The Board concluded that the fund's Advisory Contracts are fair and reasonable, and that the fund's Advisory Contracts should be renewed, without modification, through January 31, 2019, with the understanding that the Board will consider the annual renewal for a full one year period in January 2019.
In connection with its consideration of future renewals of the fund's Advisory Contracts, the Board will consider: (i) the nature, extent and quality of services provided to the fund, including shareholder and administrative services and investment performance; (ii) the competitiveness of the management fee and total expenses for the fund; (iii) the costs of the services and profitability, including the revenues earned and the expenses incurred in conducting the business of developing, marketing, distributing, managing, administering, and servicing the fund and its shareholders, to the extent applicable, as well as potential fall-out benefits from Fidelity's non-fund businesses; and (iv) whether there have been economies of scale in respect of the Fidelity funds, whether the Fidelity funds (including the fund) have appropriately benefited from any such economies of scale, and whether there is the potential for realization of any further economies.
Based on its evaluation of all of the conclusions noted above, and after considering all factors it believed relevant, the Board ultimately concluded that the fund's management fee structure is fair and reasonable, and that the continuation of the fund's Advisory Contracts should be approved.
Corporate Headquarters
245 Summer St.
Boston, MA 02210
www.fidelity.com
ZLG-ANN-0918
1.9881575.101
Fidelity® Blue Chip Growth K6 Fund
Annual Report July 31, 2018 |
|
Contents
To view a fund's proxy voting guidelines and proxy voting record for the 12-month period ended June 30, visit http://www.fidelity.com/proxyvotingresults or visit the Securities and Exchange Commission's (SEC) web site at http://www.sec.gov.
You may also call 1-800-835-5092 to request a free copy of the proxy voting guidelines.
Standard & Poor's, S&P and S&P 500 are registered service marks of The McGraw-Hill Companies, Inc. and have been licensed for use by Fidelity Distributors Corporation.
Other third-party marks appearing herein are the property of their respective owners.
All other marks appearing herein are registered or unregistered trademarks or service marks of FMR LLC or an affiliated company. © 2018 FMR LLC. All rights reserved.
This report and the financial statements contained herein are submitted for the general information of the shareholders of the Fund. This report is not authorized for distribution to prospective investors in the Fund unless preceded or accompanied by an effective prospectus.
A fund files its complete schedule of portfolio holdings with the SEC for the first and third quarters of each fiscal year on Form N-Q. Forms N-Q are available on the SEC’s web site at http://www.sec.gov. A fund's Forms N-Q may be reviewed and copied at the SEC’s Public Reference Room in Washington, DC. Information regarding the operation of the SEC's Public Reference Room may be obtained by calling 1-800-SEC-0330.
For a complete list of a fund's portfolio holdings, view the most recent holdings listing, semiannual report, or annual report on Fidelity's web site at http://www.fidelity.com, http://www.institutional.fidelity.com, or http://www.401k.com, as applicable.
NOT FDIC INSURED •MAY LOSE VALUE •NO BANK GUARANTEE
Neither the Fund nor Fidelity Distributors Corporation is a bank.
Performance: The Bottom Line
Average annual total return reflects the change in the value of an investment, assuming reinvestment of distributions from dividend income and capital gains (the profits earned upon the sale of securities that have grown in value, if any) and assuming a constant rate of performance each year. The hypothetical investment and the average annual total returns do not reflect the deduction of taxes that a shareholder would pay on fund distributions or the redemption of fund shares. During periods of reimbursement by Fidelity, a fund’s total return will be greater than it would be had the reimbursement not occurred. How a fund did yesterday is no guarantee of how it will do tomorrow.
Average Annual Total Returns
| For the periods ended July 31, 2018 | Past 1 year | Life of fundA |
| Fidelity® Blue Chip Growth K6 Fund | 24.10% | 23.25% |
A From May 25, 2017
$10,000 Over Life of Fund
Let's say hypothetically that $10,000 was invested in Fidelity® Blue Chip Growth K6 Fund on May 25, 2017, when the fund started.
The chart shows how the value of your investment would have changed, and also shows how the Russell 1000® Growth Index performed over the same period.
| Period Ending Values |
| $12,807 | Fidelity® Blue Chip Growth K6 Fund |
| $12,597 | Russell 1000® Growth Index |
Management's Discussion of Fund Performance
Market Recap: The U.S. equity bellwether S&P 500
® index gained 16.24% for the 12 months ending July 31, 2018, despite a resurgence in volatility that challenged the multiyear bull market. Stocks maintained their steady growth until a sharp reversal in February, as volatility spiked amid fear that rising inflation and the potential for the economy to overheat would prompt the U.S. Federal Reserve to pick up the pace of interest rate hikes. The index posted its first negative monthly result since October 2016, and then lost further ground in March on fear of a global trade war. The market stabilized in April and turned upward through mid-June, when escalating trade tension between the U.S. and China soured investor sentiment. The resulting uncertainty lingered into July, but strong corporate earnings helped the S&P 500 rise 3.72% that month to cap the period. For the full one-year period, growth handily topped value, while small-caps bested large-caps. By sector, information technology (+28%) led the way, boosted by strong earnings growth from several major index constituents. Consumer discretionary rose roughly 24%, driven by retailers (+49%). Energy (+20%) gained alongside higher oil prices. Laggards were telecommunication services (-2%), consumer staples (0%) and utilities (+3%), defensive groups that struggled amid rising interest rates and a general preference for risk. Real estate (+5%) fared a bit better but still lagged, as did financials, industrials, health care (each up 13%) and materials (+11%).
Comments from Portfolio Manager Sonu Kalra: For the year, the fund's share classes rose 24.10%, ahead of the 22.84% gain of the benchmark Russell 1000
® Growth Index. Choices in the consumer discretionary sector added the most relative value, while picks in energy also contributed. An overweighting in Amazon.com, one of the fund’s largest holdings this period, helped the most. Amazon continued to take market share from overall retail sales and also showed continued growth in its Amazon Web Services (AWS) cloud business. Underexposure to index component and cable giant Comcast also contributed. The fund held a small stake in Comcast early in the year, before we completely sold the position by July 31. The firm faced profit-margin pressure from its cable-TV operations, largely due to cord cutters. Investors also negatively viewed the company’s negotiations to purchase European pay-TV giant Sky to expand Comcast’s operations abroad. Elsewhere, choices in information technology and health care hurt the return. An underweighting in software & services giant Microsoft detracted more than any other holding. The company continued to execute very well this period, with its stock hitting a record high in July after the firm announced stellar quarterly results.
The views expressed above reflect those of the portfolio manager(s) only through the end of the period as stated on the cover of this report and do not necessarily represent the views of Fidelity or any other person in the Fidelity organization. Any such views are subject to change at any time based upon market or other conditions and Fidelity disclaims any responsibility to update such views. These views may not be relied on as investment advice and, because investment decisions for a Fidelity fund are based on numerous factors, may not be relied on as an indication of trading intent on behalf of any Fidelity fund.
Investment Summary (Unaudited)
Top Ten Stocks as of July 31, 2018
| | % of fund's net assets |
| Amazon.com, Inc. | 7.6 |
| Alphabet, Inc. Class A | 7.1 |
| Apple, Inc. | 6.6 |
| Facebook, Inc. Class A | 4.0 |
| Microsoft Corp. | 3.3 |
| NVIDIA Corp. | 2.9 |
| Salesforce.com, Inc. | 2.6 |
| Visa, Inc. Class A | 2.1 |
| Tesla, Inc. | 2.0 |
| Broadcom, Inc. | 1.9 |
| | 40.1 |
Top Five Market Sectors as of July 31, 2018
| | % of fund's net assets |
| Information Technology | 45.4 |
| Consumer Discretionary | 25.7 |
| Health Care | 9.7 |
| Industrials | 5.1 |
| Financials | 4.2 |
Asset Allocation (% of fund's net assets)
| As of July 31, 2018* |
| | Stocks | 97.1% |
| | Convertible Securities | 1.1% |
| | Short-Term Investments and Net Other Assets (Liabilities) | 1.8% |

* Foreign investments - 8.9%
Schedule of Investments July 31, 2018
Showing Percentage of Net Assets
| Common Stocks - 97.1% | | | |
| | | Shares | Value |
| CONSUMER DISCRETIONARY - 25.6% | | | |
| Auto Components - 0.1% | | | |
| Aptiv PLC | | 10,015 | $982,171 |
| Veoneer, Inc. (a) | | 7,000 | 366,100 |
| | | | 1,348,271 |
| Automobiles - 2.0% | | | |
| Tesla, Inc. (a) | | 114,040 | 33,999,886 |
| Diversified Consumer Services - 0.3% | | | |
| Chegg, Inc. (a) | | 24,213 | 670,700 |
| Grand Canyon Education, Inc. (a) | | 3,410 | 397,367 |
| New Oriental Education & Technology Group, Inc. sponsored ADR | | 37,753 | 3,248,268 |
| Weight Watchers International, Inc. (a) | | 15,838 | 1,417,976 |
| | | | 5,734,311 |
| Hotels, Restaurants & Leisure - 2.4% | | | |
| Accor SA | | 2,767 | 142,625 |
| Alsea S.A.B. de CV | | 82,800 | 285,615 |
| Caesars Entertainment Corp. (a) | | 135,688 | 1,533,274 |
| Chipotle Mexican Grill, Inc. (a) | | 12,943 | 5,612,861 |
| Eldorado Resorts, Inc. (a) | | 3,600 | 154,260 |
| Hilton Grand Vacations, Inc. (a) | | 37,248 | 1,288,408 |
| Hilton Worldwide Holdings, Inc. | | 20,564 | 1,617,564 |
| International Game Technology PLC | | 42,929 | 1,085,245 |
| Las Vegas Sands Corp. | | 26,703 | 1,919,946 |
| Marriott International, Inc. Class A | | 25,370 | 3,243,301 |
| McDonald's Corp. | | 54,307 | 8,555,525 |
| Melco Crown Entertainment Ltd. sponsored ADR | | 29,238 | 756,095 |
| Penn National Gaming, Inc. (a) | | 7,332 | 234,991 |
| Planet Fitness, Inc. (a) | | 40,900 | 1,943,568 |
| Restaurant Brands International, Inc. | | 29,918 | 1,908,671 |
| Royal Caribbean Cruises Ltd. | | 28,570 | 3,221,553 |
| Shake Shack, Inc. Class A (a) | | 17,412 | 1,085,290 |
| U.S. Foods Holding Corp. (a) | | 70,361 | 2,378,905 |
| Vail Resorts, Inc. | | 2,679 | 741,735 |
| Wyndham Destinations, Inc. | | 24,108 | 1,111,861 |
| Wyndham Hotels & Resorts, Inc. | | 20,408 | 1,183,664 |
| Wynn Resorts Ltd. | | 1,542 | 257,175 |
| | | | 40,262,132 |
| Household Durables - 0.2% | | | |
| Forbo Holding AG (Reg.) | | 82 | 129,938 |
| iRobot Corp. (a) | | 2,200 | 174,350 |
| SodaStream International Ltd. (a) | | 37,242 | 3,251,227 |
| | | | 3,555,515 |
| Internet & Direct Marketing Retail - 10.5% | | | |
| Amazon.com, Inc. (a) | | 71,417 | 126,939,440 |
| JD.com, Inc. sponsored ADR (a) | | 220,780 | 7,917,171 |
| Netflix, Inc. (a) | | 69,285 | 23,380,223 |
| The Booking Holdings, Inc. (a) | | 7,764 | 15,750,982 |
| TripAdvisor, Inc. (a) | | 2,900 | 168,171 |
| Wayfair LLC Class A (a) | | 13,900 | 1,512,598 |
| | | | 175,668,585 |
| Media - 0.5% | | | |
| China Literature Ltd. (a)(b) | | 124,988 | 1,045,408 |
| Grupo Televisa SA de CV (CPO) sponsored ADR | | 8,100 | 161,028 |
| The Walt Disney Co. | | 71,341 | 8,101,484 |
| | | | 9,307,920 |
| Multiline Retail - 1.2% | | | |
| Avenue Supermarts Ltd. (a)(b) | | 3,665 | 88,595 |
| Dollar Tree, Inc. (a) | | 185,211 | 16,906,060 |
| Future Retail Ltd. | | 75,965 | 593,206 |
| Macy's, Inc. | | 39,223 | 1,558,330 |
| Ollie's Bargain Outlet Holdings, Inc. (a) | | 12,155 | 844,773 |
| V-Mart Retail Ltd. (a) | | 2,254 | 79,833 |
| | | | 20,070,797 |
| Specialty Retail - 4.5% | | | |
| At Home Group, Inc. (a) | | 9,300 | 337,311 |
| Burlington Stores, Inc. (a) | | 23,220 | 3,548,248 |
| Five Below, Inc. (a) | | 24,709 | 2,400,726 |
| Floor & Decor Holdings, Inc. Class A (a) | | 24,715 | 1,180,141 |
| Home Depot, Inc. | | 153,925 | 30,403,266 |
| Inditex SA | | 29,018 | 950,938 |
| Lowe's Companies, Inc. | | 161,827 | 16,075,894 |
| Michaels Companies, Inc. (a) | | 17,600 | 359,216 |
| RH (a) | | 47,476 | 6,450,089 |
| Ross Stores, Inc. | | 49,647 | 4,340,637 |
| TCNS Clothing Co. Ltd. (a) | | 3,760 | 36,210 |
| Tiffany & Co., Inc. | | 13,700 | 1,884,572 |
| TJX Companies, Inc. | | 54,931 | 5,342,589 |
| Ulta Beauty, Inc. (a) | | 3,784 | 924,772 |
| Urban Outfitters, Inc. (a) | | 19,376 | 860,294 |
| | | | 75,094,903 |
| Textiles, Apparel & Luxury Goods - 3.9% | | | |
| adidas AG | | 35,480 | 7,847,557 |
| Canada Goose Holdings, Inc. (a) | | 23,689 | 1,359,771 |
| Carbon Black, Inc. | | 2,536 | 52,647 |
| Cibus Global Ltd. Series C (c)(d)(e) | | 133,810 | 281,001 |
| Crinetics Pharmaceuticals, Inc. (a) | | 7,800 | 191,958 |
| Despegar.com Corp. | | 18,759 | 394,314 |
| Gildan Activewear, Inc. | | 6,100 | 157,136 |
| GreenSky, Inc. Class A | | 13,898 | 240,435 |
| Homology Medicines, Inc. (a)(f) | | 5,103 | 89,864 |
| Kering SA | | 20,413 | 10,884,693 |
| lululemon athletica, Inc. (a) | | 82,995 | 9,955,250 |
| LVMH Moet Hennessy - Louis Vuitton SA | | 6,092 | 2,122,989 |
| Michael Kors Holdings Ltd. (a) | | 55,176 | 3,681,894 |
| NIKE, Inc. Class B | | 122,883 | 9,450,932 |
| Pinduoduo, Inc. ADR | | 57,000 | 1,287,630 |
| Prada SpA | | 453,500 | 2,157,997 |
| PVH Corp. | | 41,807 | 6,418,211 |
| Rubius Therapeutics, Inc. (a) | | 8,100 | 170,100 |
| Scholar Rock Holding Corp. | | 10,103 | 164,073 |
| Shenzhou International Group Holdings Ltd. | | 37,000 | 453,717 |
| Skechers U.S.A., Inc. Class A (sub. vtg.) (a) | | 103,797 | 2,877,253 |
| Tapestry, Inc. | | 53,885 | 2,539,061 |
| Under Armour, Inc. Class C (non-vtg.) (a) | | 53,220 | 997,343 |
| VF Corp. | | 19,178 | 1,765,718 |
| | | | 65,541,544 |
|
| TOTAL CONSUMER DISCRETIONARY | | | 430,583,864 |
|
| CONSUMER STAPLES - 3.1% | | | |
| Beverages - 1.2% | | | |
| Constellation Brands, Inc. Class A (sub. vtg.) | | 26,846 | 5,643,835 |
| Diageo PLC | | 8,944 | 328,133 |
| Fever-Tree Drinks PLC | | 33,275 | 1,504,607 |
| Keurig Dr. Pepper, Inc. | | 64,841 | 1,556,832 |
| Monster Beverage Corp. (a) | | 127,023 | 7,623,920 |
| Pernod Ricard SA | | 888 | 143,245 |
| The Coca-Cola Co. | | 49,200 | 2,294,196 |
| | | | 19,094,768 |
| Food & Staples Retailing - 0.9% | | | |
| BJ's Wholesale Club Holdings, Inc. | | 72,100 | 1,787,359 |
| Costco Wholesale Corp. | | 54,676 | 11,958,188 |
| Performance Food Group Co. (a) | | 44,052 | 1,579,264 |
| | | | 15,324,811 |
| Food Products - 0.1% | | | |
| Darling International, Inc. (a) | | 34,493 | 692,964 |
| Mondelez International, Inc. | | 4,100 | 177,858 |
| The Kraft Heinz Co. | | 12,878 | 775,900 |
| | | | 1,646,722 |
| Household Products - 0.1% | | | |
| Energizer Holdings, Inc. | | 21,700 | 1,381,856 |
| MTG Co. Ltd. | | 2,100 | 141,797 |
| | | | 1,523,653 |
| Personal Products - 0.6% | | | |
| Coty, Inc. Class A | | 161,078 | 2,160,056 |
| Estee Lauder Companies, Inc. Class A | | 23,281 | 3,141,538 |
| Herbalife Nutrition Ltd. (a) | | 67,319 | 3,475,680 |
| Kose Corp. | | 6,107 | 1,168,258 |
| | | | 9,945,532 |
| Tobacco - 0.2% | | | |
| JUUL Labs, Inc. Class A (d)(e) | | 23,134 | 3,875,639 |
|
| TOTAL CONSUMER STAPLES | | | 51,411,125 |
|
| ENERGY - 2.5% | | | |
| Oil, Gas & Consumable Fuels - 2.5% | | | |
| Anadarko Petroleum Corp. | | 78,544 | 5,745,494 |
| Andeavor | | 10,261 | 1,539,766 |
| BP PLC sponsored ADR | | 13,767 | 620,754 |
| Cenovus Energy, Inc. | | 28,848 | 289,400 |
| Continental Resources, Inc. (a) | | 91,775 | 5,861,669 |
| Delek U.S. Holdings, Inc. | | 40,507 | 2,159,833 |
| Diamondback Energy, Inc. | | 20,864 | 2,753,005 |
| EOG Resources, Inc. | | 28,243 | 3,641,652 |
| Extraction Oil & Gas, Inc. (a) | | 54,323 | 821,364 |
| Marathon Petroleum Corp. | | 14,655 | 1,184,564 |
| Petronet LNG Ltd. | | 17,729 | 59,343 |
| Phillips 66 Co. | | 1,320 | 162,809 |
| Pioneer Natural Resources Co. | | 19,670 | 3,722,941 |
| Reliance Industries Ltd. | | 224,842 | 3,895,159 |
| Valero Energy Corp. | | 27,734 | 3,282,319 |
| Whiting Petroleum Corp. (a) | | 114,491 | 5,684,478 |
| | | | 41,424,550 |
| FINANCIALS - 4.2% | | | |
| Banks - 2.1% | | | |
| Bank of America Corp. | | 420,767 | 12,993,285 |
| Citigroup, Inc. | | 97,468 | 7,006,975 |
| Coastal Financial Corp. of Washington (a) | | 2,600 | 42,224 |
| Cullen/Frost Bankers, Inc. | | 5,276 | 582,945 |
| HDFC Bank Ltd. sponsored ADR | | 28,510 | 2,946,223 |
| IndusInd Bank Ltd. | | 8,949 | 260,803 |
| JPMorgan Chase & Co. | | 90,336 | 10,384,123 |
| Kotak Mahindra Bank Ltd. | | 18,502 | 353,189 |
| | | | 34,569,767 |
| Capital Markets - 1.8% | | | |
| Apollo Global Management LLC Class A | | 14,421 | 511,946 |
| BlackRock, Inc. Class A | | 10,623 | 5,340,819 |
| Charles Schwab Corp. | | 91,647 | 4,679,496 |
| E*TRADE Financial Corp. (a) | | 22,335 | 1,335,856 |
| Edelweiss Financial Services Ltd. | | 58,486 | 264,366 |
| Fairfax India Holdings Corp. (a)(b) | | 48,805 | 785,761 |
| Goldman Sachs Group, Inc. | | 31,294 | 7,430,134 |
| HDFC Asset Management Co. Ltd. (a) | | 110 | 1,767 |
| Monex Group, Inc. | | 49,200 | 244,647 |
| Morgan Stanley | | 80,968 | 4,093,742 |
| MSCI, Inc. | | 3,397 | 564,547 |
| TD Ameritrade Holding Corp. | | 81,812 | 4,675,556 |
| Virtu Financial, Inc. Class A | | 31,651 | 637,768 |
| | | | 30,566,405 |
| Consumer Finance - 0.0% | | | |
| American Express Co. | | 6,700 | 666,784 |
| Diversified Financial Services - 0.3% | | | |
| Allakos, Inc. (a) | | 4,900 | 199,773 |
| Berkshire Hathaway, Inc. Class B (a) | | 19,330 | 3,824,827 |
| GDS Holdings Ltd. ADR (a) | | 5,426 | 118,450 |
| | | | 4,143,050 |
| Thrifts & Mortgage Finance - 0.0% | | | |
| Housing Development Finance Corp. Ltd. | | 20,960 | 610,752 |
|
| TOTAL FINANCIALS | | | 70,556,758 |
|
| HEALTH CARE - 9.7% | | | |
| Biotechnology - 4.5% | | | |
| AC Immune SA (a) | | 44,991 | 434,163 |
| ACADIA Pharmaceuticals, Inc. (a) | | 15,130 | 228,312 |
| Acceleron Pharma, Inc. (a) | | 4,964 | 216,232 |
| Agios Pharmaceuticals, Inc. (a) | | 17,509 | 1,512,953 |
| Aimmune Therapeutics, Inc. (a) | | 33,095 | 957,107 |
| Alexion Pharmaceuticals, Inc. (a) | | 113,300 | 15,064,368 |
| Alkermes PLC (a) | | 62,366 | 2,734,749 |
| Alnylam Pharmaceuticals, Inc. (a) | | 44,606 | 4,237,570 |
| Amgen, Inc. | | 5,339 | 1,049,380 |
| AnaptysBio, Inc. (a) | | 7,220 | 565,470 |
| Arena Pharmaceuticals, Inc. (a) | | 22,747 | 877,807 |
| Ascendis Pharma A/S sponsored ADR (a) | | 22,886 | 1,554,875 |
| BeiGene Ltd. ADR (a) | | 6,478 | 1,228,617 |
| Biogen, Inc. (a) | | 2,500 | 835,925 |
| bluebird bio, Inc. (a) | | 20,753 | 3,214,640 |
| Blueprint Medicines Corp. (a) | | 1,434 | 85,380 |
| Celgene Corp. (a) | | 13,958 | 1,257,476 |
| Cellectis SA sponsored ADR (a) | | 7,931 | 229,206 |
| Chimerix, Inc. (a) | | 972 | 4,345 |
| Coherus BioSciences, Inc. (a) | | 36,121 | 688,105 |
| CytomX Therapeutics, Inc. (a) | | 8,794 | 231,634 |
| DBV Technologies SA sponsored ADR (a) | | 6,123 | 110,398 |
| Deciphera Pharmaceuticals, Inc. (a) | | 4,100 | 141,040 |
| Denali Therapeutics, Inc. (a) | | 47,414 | 596,942 |
| Editas Medicine, Inc. (a) | | 34,202 | 1,017,167 |
| Epizyme, Inc. (a) | | 18,904 | 243,862 |
| Exelixis, Inc. (a) | | 87,953 | 1,820,627 |
| FibroGen, Inc. (a) | | 20,412 | 1,287,997 |
| GenSight Biologics SA (a)(b)(f) | | 36,360 | 91,413 |
| Global Blood Therapeutics, Inc. (a) | | 40,433 | 1,690,099 |
| Grifols SA ADR | | 6,306 | 131,039 |
| Heron Therapeutics, Inc. (a) | | 11,706 | 438,390 |
| ImmunoGen, Inc. (a) | | 14,300 | 132,990 |
| Insmed, Inc. (a) | | 8,194 | 203,785 |
| Intellia Therapeutics, Inc. (a) | | 34,468 | 917,538 |
| Intercept Pharmaceuticals, Inc. (a) | | 15,600 | 1,421,784 |
| Ionis Pharmaceuticals, Inc. (a) | | 6,755 | 295,058 |
| Ironwood Pharmaceuticals, Inc. Class A (a) | | 60,695 | 1,170,200 |
| La Jolla Pharmaceutical Co. (a)(f) | | 9,405 | 311,023 |
| Liquidia Technologies, Inc. | | 139,778 | 1,531,967 |
| Madrigal Pharmaceuticals, Inc. (a) | | 500 | 128,515 |
| Momenta Pharmaceuticals, Inc. (a) | | 5,196 | 153,802 |
| Neurocrine Biosciences, Inc. (a) | | 33,436 | 3,359,984 |
| Portola Pharmaceuticals, Inc. (a) | | 21,711 | 777,254 |
| Radius Health, Inc. (a)(f) | | 4,851 | 116,424 |
| Regeneron Pharmaceuticals, Inc. (a) | | 27,733 | 10,206,021 |
| Replimune Group, Inc. (a) | | 11,300 | 169,387 |
| Sage Therapeutics, Inc. (a) | | 24,255 | 3,500,482 |
| Sarepta Therapeutics, Inc. (a) | | 19,268 | 2,239,712 |
| Seres Therapeutics, Inc. (a) | | 2,622 | 19,849 |
| Trevena, Inc. (a) | | 55,370 | 85,270 |
| Ultragenyx Pharmaceutical, Inc. (a) | | 8,622 | 682,086 |
| Vertex Pharmaceuticals, Inc. (a) | | 17,507 | 3,064,600 |
| Xencor, Inc. (a) | | 24,906 | 927,001 |
| Zai Lab Ltd. ADR | | 10,491 | 229,963 |
| | | | 76,421,983 |
| Health Care Equipment & Supplies - 2.6% | | | |
| Align Technology, Inc. (a) | | 3,536 | 1,261,114 |
| Baxter International, Inc. | | 4,463 | 323,344 |
| Becton, Dickinson & Co. | | 13,181 | 3,300,127 |
| Boston Scientific Corp. (a) | | 438,921 | 14,752,135 |
| Danaher Corp. | | 28,145 | 2,887,114 |
| DexCom, Inc. (a) | | 9,543 | 907,826 |
| Edwards Lifesciences Corp. (a) | | 2,232 | 317,948 |
| Establishment Labs Holdings, Inc. (a) | | 43,100 | 1,121,462 |
| Fisher & Paykel Healthcare Corp. | | 15,761 | 158,992 |
| Hoya Corp. | | 2,100 | 125,833 |
| Insulet Corp. (a) | | 13,377 | 1,112,431 |
| Intuitive Surgical, Inc. (a) | | 27,920 | 14,188,665 |
| Invuity, Inc. (a)(f) | | 34,874 | 139,496 |
| iRhythm Technologies, Inc. (a) | | 33,026 | 2,495,114 |
| Novocure Ltd. (a) | | 8,680 | 295,120 |
| Penumbra, Inc. (a) | | 839 | 119,348 |
| Quanterix Corp. (a) | | 9,219 | 138,193 |
| Stryker Corp. | | 914 | 149,211 |
| | | | 43,793,473 |
| Health Care Providers & Services - 1.8% | | | |
| Humana, Inc. | | 39,369 | 12,368,952 |
| National Vision Holdings, Inc. | | 36,385 | 1,479,414 |
| Neuronetics, Inc. | | 3,600 | 89,820 |
| OptiNose, Inc. | | 34,132 | 694,586 |
| UnitedHealth Group, Inc. | | 58,726 | 14,870,598 |
| | | | 29,503,370 |
| Health Care Technology - 0.1% | | | |
| Evolent Health, Inc. (a) | | 18,969 | 383,174 |
| Teladoc, Inc. (a) | | 23,293 | 1,394,086 |
| | | | 1,777,260 |
| Life Sciences Tools & Services - 0.0% | | | |
| Illumina, Inc. (a) | | 600 | 194,616 |
| Pharmaceuticals - 0.7% | | | |
| Aclaris Therapeutics, Inc. (a) | | 9,749 | 167,098 |
| Akcea Therapeutics, Inc. (f) | | 46,627 | 1,474,346 |
| Allergan PLC | | 1,000 | 184,090 |
| AstraZeneca PLC sponsored ADR | | 21,799 | 852,995 |
| Bausch Health Cos., Inc. (Canada) (a) | | 29,112 | 632,895 |
| Bayer AG | | 1,312 | 146,061 |
| Collegium Pharmaceutical, Inc. (a) | | 5,655 | 108,972 |
| Dova Pharmaceuticals, Inc. (a) | | 12,588 | 271,523 |
| Intersect ENT, Inc. (a) | | 6,756 | 218,557 |
| Jazz Pharmaceuticals PLC (a) | | 19,329 | 3,345,463 |
| Mylan NV (a) | | 4,300 | 160,433 |
| MyoKardia, Inc. (a) | | 6,035 | 346,409 |
| Nektar Therapeutics (a) | | 47,452 | 2,495,975 |
| The Medicines Company (a) | | 28,128 | 1,117,525 |
| Theravance Biopharma, Inc. (a) | | 3,288 | 78,748 |
| Zogenix, Inc. (a) | | 6,920 | 392,710 |
| | | | 11,993,800 |
|
| TOTAL HEALTH CARE | | | 163,684,502 |
|
| INDUSTRIALS - 5.1% | | | |
| Aerospace & Defense - 1.9% | | | |
| Bombardier, Inc. Class B (sub. vtg.) (a) | | 580,607 | 2,187,012 |
| Elbit Systems Ltd. | | 3,085 | 371,187 |
| General Dynamics Corp. | | 10,814 | 2,160,205 |
| Northrop Grumman Corp. | | 23,159 | 6,959,048 |
| Raytheon Co. | | 20,680 | 4,095,260 |
| The Boeing Co. | | 40,996 | 14,606,875 |
| United Technologies Corp. | | 7,837 | 1,063,794 |
| | | | 31,443,381 |
| Air Freight & Logistics - 0.3% | | | |
| Expeditors International of Washington, Inc. | | 2,231 | 169,935 |
| XPO Logistics, Inc. (a) | | 42,238 | 4,211,973 |
| | | | 4,381,908 |
| Airlines - 0.8% | | | |
| Delta Air Lines, Inc. | | 87,915 | 4,784,334 |
| Southwest Airlines Co. | | 8,800 | 511,808 |
| Spirit Airlines, Inc. (a) | | 74,747 | 3,247,010 |
| United Continental Holdings, Inc. (a) | | 51,009 | 4,101,124 |
| Wizz Air Holdings PLC (a)(b) | | 15,309 | 696,452 |
| | | | 13,340,728 |
| Building Products - 0.1% | | | |
| Masco Corp. | | 32,943 | 1,328,591 |
| Commercial Services & Supplies - 0.1% | | | |
| Copart, Inc. (a) | | 7,245 | 415,791 |
| Evoqua Water Technologies Corp. (a) | | 21,141 | 451,149 |
| HomeServe PLC | | 58,092 | 771,636 |
| Tomra Systems ASA | | 29,800 | 615,973 |
| | | | 2,254,549 |
| Electrical Equipment - 0.3% | | | |
| AMETEK, Inc. | | 4,331 | 336,952 |
| Fortive Corp. | | 33,486 | 2,748,531 |
| Melrose Industries PLC | | 60,069 | 170,223 |
| Nidec Corp. | | 2,900 | 419,640 |
| Regal Beloit Corp. | | 21,263 | 1,827,555 |
| | | | 5,502,901 |
| Industrial Conglomerates - 0.6% | | | |
| General Electric Co. | | 314,883 | 4,291,855 |
| Honeywell International, Inc. | | 27,096 | 4,325,876 |
| ITT, Inc. | | 30,139 | 1,707,977 |
| | | | 10,325,708 |
| Machinery - 0.6% | | | |
| Aumann AG (b) | | 8,470 | 591,292 |
| Deere & Co. | | 29,870 | 4,324,877 |
| Eicher Motors Ltd. | | 429 | 174,198 |
| Minebea Mitsumi, Inc. | | 6,200 | 111,272 |
| Rational AG | | 961 | 658,515 |
| SMC Corp. | | 200 | 67,039 |
| WABCO Holdings, Inc. (a) | | 9,409 | 1,182,523 |
| Xylem, Inc. | | 27,034 | 2,069,723 |
| | | | 9,179,439 |
| Professional Services - 0.1% | | | |
| CoStar Group, Inc. (a) | | 400 | 166,340 |
| Equifax, Inc. | | 2,600 | 326,300 |
| IHS Markit Ltd. (a) | | 29,731 | 1,576,635 |
| Recruit Holdings Co. Ltd. | | 5,900 | 161,669 |
| | | | 2,230,944 |
| Road & Rail - 0.2% | | | |
| J.B. Hunt Transport Services, Inc. | | 12,452 | 1,492,995 |
| Knight-Swift Transportation Holdings, Inc. Class A | | 68,357 | 2,225,020 |
| | | | 3,718,015 |
| Trading Companies & Distributors - 0.1% | | | |
| HD Supply Holdings, Inc. (a) | | 19,100 | 840,018 |
| Wolseley PLC | | 1,734 | 136,785 |
| | | | 976,803 |
| Transportation Infrastructure - 0.0% | | | |
| Adani Ports & Special Economic Zone Ltd. | | 9,677 | 56,506 |
|
| TOTAL INDUSTRIALS | | | 84,739,473 |
|
| INFORMATION TECHNOLOGY - 44.6% | | | |
| Communications Equipment - 0.3% | | | |
| Arista Networks, Inc. (a) | | 9,067 | 2,318,704 |
| Lumentum Holdings, Inc. (a) | | 3,200 | 167,200 |
| NETGEAR, Inc. (a) | | 43,270 | 2,849,330 |
| | | | 5,335,234 |
| Electronic Equipment & Components - 0.2% | | | |
| Corning, Inc. | | 22,800 | 756,504 |
| Dell Technologies, Inc. (a) | | 18,120 | 1,676,462 |
| II-VI, Inc. (a) | | 7,600 | 297,920 |
| Jabil, Inc. | | 5,900 | 166,203 |
| | | | 2,897,089 |
| Internet Software & Services - 14.8% | | | |
| 2U, Inc. (a) | | 13,473 | 1,019,367 |
| Akamai Technologies, Inc. (a) | | 38,071 | 2,865,223 |
| Alibaba Group Holding Ltd. sponsored ADR (a) | | 78,294 | 14,658,986 |
| Alphabet, Inc.: | | | |
| Class A (a) | | 97,330 | 119,445,323 |
| Class C (a) | | 10,136 | 12,338,147 |
| ANGI Homeservices, Inc. Class A (a) | | 75,078 | 1,179,475 |
| Carbonite, Inc. (a) | | 4,600 | 157,780 |
| CarGurus, Inc. Class A | | 36,183 | 1,568,533 |
| DocuSign, Inc. (f) | | 4,263 | 229,776 |
| Dropbox, Inc. Class A (a)(f) | | 7,414 | 198,473 |
| Facebook, Inc. Class A (a) | | 386,402 | 66,685,257 |
| GMO Internet, Inc. | | 27,700 | 587,369 |
| GoDaddy, Inc. (a) | | 29,403 | 2,164,649 |
| GrubHub, Inc. (a) | | 3,827 | 466,473 |
| HUYA, Inc. ADR (f) | | 16,435 | 529,207 |
| IAC/InterActiveCorp (a) | | 6,769 | 996,735 |
| Mercari, Inc. (a) | | 3,500 | 147,431 |
| Mimecast Ltd. (a) | | 4,032 | 144,789 |
| Momo, Inc. ADR (a) | | 26,273 | 1,077,718 |
| NetEase, Inc. ADR | | 7,100 | 1,831,800 |
| New Relic, Inc. (a) | | 5,313 | 519,080 |
| Okta, Inc. (a) | | 5,865 | 291,197 |
| Pandora Media, Inc. (a) | | 20,899 | 140,859 |
| Shopify, Inc. Class A (a) | | 18,038 | 2,512,854 |
| Stamps.com, Inc. (a) | | 7,498 | 1,956,978 |
| Tencent Holdings Ltd. | | 204,500 | 9,307,694 |
| The Trade Desk, Inc. (a) | | 15,314 | 1,291,276 |
| Twilio, Inc. Class A (a) | | 6,663 | 385,721 |
| Twitter, Inc. (a) | | 7,600 | 242,212 |
| Wix.com Ltd. (a) | | 21,590 | 2,051,050 |
| Yandex NV Series A (a) | | 30,626 | 1,101,311 |
| YY, Inc. ADR (a) | | 9,500 | 885,685 |
| | | | 248,978,428 |
| IT Services - 5.0% | | | |
| Adyen BV (b) | | 3,700 | 2,364,052 |
| Alliance Data Systems Corp. | | 6,533 | 1,469,141 |
| Endava PLC ADR (a) | | 5,700 | 136,287 |
| FleetCor Technologies, Inc. (a) | | 6,664 | 1,446,088 |
| MasterCard, Inc. Class A | | 124,293 | 24,610,014 |
| Netcompany Group A/S | | 6,000 | 218,249 |
| PayPal Holdings, Inc. (a) | | 175,435 | 14,410,231 |
| Square, Inc. (a) | | 18,394 | 1,189,172 |
| Total System Services, Inc. | | 3,800 | 347,852 |
| Visa, Inc. Class A | | 252,278 | 34,496,494 |
| Wirecard AG | | 1,203 | 224,725 |
| Worldpay, Inc. (a) | | 30,396 | 2,498,247 |
| | | | 83,410,552 |
| Semiconductors & Semiconductor Equipment - 7.3% | | | |
| Acacia Communications, Inc. (a) | | 9,800 | 314,972 |
| Advanced Micro Devices, Inc. (a) | | 138,114 | 2,531,630 |
| Analog Devices, Inc. | | 20,179 | 1,940,009 |
| ASML Holding NV | | 2,400 | 513,600 |
| Broadcom, Inc. | | 144,949 | 32,145,340 |
| Inphi Corp. (a) | | 38,981 | 1,225,563 |
| Intel Corp. | | 87,064 | 4,187,778 |
| Marvell Technology Group Ltd. | | 341,150 | 7,269,907 |
| Micron Technology, Inc. (a) | | 230,797 | 12,183,774 |
| Monolithic Power Systems, Inc. | | 11,844 | 1,571,462 |
| NVIDIA Corp. | | 199,938 | 48,956,819 |
| NXP Semiconductors NV (a) | | 23,333 | 2,224,568 |
| Qualcomm, Inc. | | 93,572 | 5,997,029 |
| Renesas Electronics Corp. (a) | | 237,900 | 2,119,111 |
| | | | 123,181,562 |
| Software - 10.4% | | | |
| Activision Blizzard, Inc. | | 312,712 | 22,959,315 |
| Adobe Systems, Inc. (a) | | 67,167 | 16,434,422 |
| Altair Engineering, Inc. Class A (a) | | 5,264 | 184,766 |
| Avalara, Inc. | | 2,207 | 84,616 |
| Black Knight, Inc. (a) | | 3,071 | 158,617 |
| Electronic Arts, Inc. (a) | | 62,036 | 7,987,135 |
| HubSpot, Inc. (a) | | 2,900 | 359,890 |
| Intuit, Inc. | | 14,692 | 3,000,694 |
| Microsoft Corp. | | 520,981 | 55,265,664 |
| Nintendo Co. Ltd. | | 5,600 | 1,893,848 |
| Paycom Software, Inc. (a) | | 28,039 | 2,979,144 |
| Pluralsight, Inc. | | 17,145 | 397,935 |
| Proofpoint, Inc. (a) | | 10,328 | 1,177,908 |
| Red Hat, Inc. (a) | | 51,638 | 7,292,835 |
| RingCentral, Inc. (a) | | 12,504 | 922,170 |
| SailPoint Technologies Holding, Inc. (a) | | 13,808 | 332,635 |
| Salesforce.com, Inc. (a) | | 324,382 | 44,488,991 |
| SendGrid, Inc. (a) | | 24,243 | 618,924 |
| Smartsheet, Inc. | | 3,450 | 74,175 |
| Snap, Inc. Class A (a)(f) | | 220,070 | 2,750,875 |
| Splunk, Inc. (a) | | 4,292 | 412,461 |
| Talend SA ADR (a) | | 9,847 | 582,450 |
| Tenable Holdings, Inc. | | 3,000 | 89,700 |
| Workday, Inc. Class A (a) | | 25,834 | 3,203,933 |
| Zendesk, Inc. (a) | | 26,141 | 1,423,900 |
| Zscaler, Inc. (a)(f) | | 12,301 | 434,348 |
| | | | 175,511,351 |
| Technology Hardware, Storage & Peripherals - 6.6% | | | |
| Apple, Inc. | | 580,703 | 110,501,974 |
| Samsung Electronics Co. Ltd. | | 1,300 | 53,998 |
| | | | 110,555,972 |
|
| TOTAL INFORMATION TECHNOLOGY | | | 749,870,188 |
|
| MATERIALS - 2.1% | | | |
| Chemicals - 2.1% | | | |
| Cabot Corp. | | 9,469 | 625,901 |
| CF Industries Holdings, Inc. | | 171,262 | 7,607,458 |
| DowDuPont, Inc. | | 61,596 | 4,235,957 |
| FMC Corp. | | 15,111 | 1,358,177 |
| LyondellBasell Industries NV Class A | | 67,536 | 7,482,313 |
| Nutrien Ltd. | | 31,044 | 1,686,020 |
| Orion Engineered Carbons SA | | 16,025 | 525,620 |
| The Chemours Co. LLC | | 142,026 | 6,506,211 |
| The Mosaic Co. | | 57,184 | 1,721,810 |
| Tronox Ltd. Class A | | 78,204 | 1,442,864 |
| Westlake Chemical Corp. | | 12,043 | 1,291,250 |
| | | | 34,483,581 |
| Construction Materials - 0.0% | | | |
| Buzzi Unicem SpA | | 4,273 | 94,187 |
| Loma Negra Compania Industrial Argentina SA ADR (a) | | 21,141 | 237,625 |
| | | | 331,812 |
|
| TOTAL MATERIALS | | | 34,815,393 |
|
| REAL ESTATE - 0.1% | | | |
| Equity Real Estate Investment Trusts (REITs) - 0.1% | | | |
| Ant International Co. Ltd. (d)(e) | | 274,458 | 1,539,709 |
| TELECOMMUNICATION SERVICES - 0.1% | | | |
| Wireless Telecommunication Services - 0.1% | | | |
| Boingo Wireless, Inc. (a) | | 15,500 | 358,205 |
| T-Mobile U.S., Inc. (a) | | 33,466 | 2,007,960 |
| | | | 2,366,165 |
| UTILITIES - 0.0% | | | |
| Gas Utilities - 0.0% | | | |
| China Resource Gas Group Ltd. | | 46,000 | 218,014 |
| ENN Energy Holdings Ltd. | | 21,000 | 213,636 |
| | | | 431,650 |
| TOTAL COMMON STOCKS | | | |
| (Cost $1,425,681,305) | | | 1,631,423,377 |
|
| Convertible Preferred Stocks - 1.1% | | | |
| CONSUMER DISCRETIONARY - 0.1% | | | |
| Hotels, Restaurants & Leisure - 0.1% | | | |
| Neutron Holdings, Inc. Series C (d)(e) | | 3,178,083 | 581,081 |
| Topgolf International, Inc. Series F (d)(e) | | 9,181 | 141,387 |
| | | | 722,468 |
| Internet & Direct Marketing Retail - 0.0% | | | |
| The Honest Co., Inc. Series E (d)(e) | | 11,802 | 231,376 |
| Textiles, Apparel & Luxury Goods - 0.0% | | | |
| Generation Bio Series B (d)(e) | | 22,400 | 204,864 |
|
| TOTAL CONSUMER DISCRETIONARY | | | 1,158,708 |
|
| CONSUMER STAPLES - 0.2% | | | |
| Food & Staples Retailing - 0.0% | | | |
| Roofoods Ltd. Series F (d)(e) | | 337 | 138,153 |
| Food Products - 0.1% | | | |
| Agbiome LLC Series C (d)(e) | | 68,700 | 435,125 |
| Tobacco - 0.1% | | | |
| JUUL Labs, Inc. Series E (d)(e) | | 12,508 | 2,095,465 |
|
| TOTAL CONSUMER STAPLES | | | 2,668,743 |
|
| HEALTH CARE - 0.0% | | | |
| Biotechnology - 0.0% | | | |
| 23andMe, Inc. Series F (d)(e) | | 6,504 | 112,844 |
| INFORMATION TECHNOLOGY - 0.8% | | | |
| Internet Software & Services - 0.8% | | | |
| ContextLogic, Inc. Series G (d)(e) | | 2,862 | 462,585 |
| Lyft, Inc.: | | | |
| Series H (d)(e) | | 100,639 | 4,765,649 |
| Series I (d)(e) | | 177,388 | 8,400,014 |
| Starry, Inc. Series C (d)(e) | | 158,250 | 145,907 |
| | | | 13,774,155 |
| Software - 0.0% | | | |
| Compass, Inc. Series E (d)(e) | | 1,181 | 79,692 |
|
| TOTAL INFORMATION TECHNOLOGY | | | 13,853,847 |
|
| TOTAL CONVERTIBLE PREFERRED STOCKS | | | |
| (Cost $17,015,803) | | | 17,794,142 |
|
| Money Market Funds - 2.2% | | | |
| Fidelity Cash Central Fund, 1.96% (g) | | 33,220,742 | 33,227,387 |
| Fidelity Securities Lending Cash Central Fund 1.97% (g)(h) | | 4,529,247 | 4,529,700 |
| TOTAL MONEY MARKET FUNDS | | | |
| (Cost $37,757,087) | | | 37,757,087 |
| TOTAL INVESTMENT IN SECURITIES - 100.4% | | | |
| (Cost $1,480,454,195) | | | 1,686,974,606 |
| NET OTHER ASSETS (LIABILITIES) - (0.4)% | | | (6,930,253) |
| NET ASSETS - 100% | | | $1,680,044,353 |
Legend
(a) Non-income producing
(b) Security exempt from registration under Rule 144A of the Securities Act of 1933. These securities may be resold in transactions exempt from registration, normally to qualified institutional buyers. At the end of the period, the value of these securities amounted to $5,662,973 or 0.3% of net assets.
(c) Investment is owned by a wholly-owned subsidiary (Subsidiary) that is treated as a corporation for U.S. tax purposes.
(d) Restricted securities - Investment in securities not registered under the Securities Act of 1933 (excluding 144A issues). At the end of the period, the value of restricted securities (excluding 144A issues) amounted to $23,490,491 or 1.4% of net assets.
(e) Level 3 security
(f) Security or a portion of the security is on loan at period end.
(g) Affiliated fund that is generally available only to investment companies and other accounts managed by Fidelity Investments. The rate quoted is the annualized seven-day yield of the fund at period end. A complete unaudited listing of the fund's holdings as of its most recent quarter end is available upon request. In addition, each Fidelity Central Fund's financial statements, which are not covered by the Fund's Report of Independent Registered Public Accounting Firm, are available on the SEC's website or upon request.
(h) Investment made with cash collateral received from securities on loan.
Additional information on each restricted holding is as follows:
| Security | Acquisition Date | Acquisition Cost |
| 23andMe, Inc. Series F | 8/31/17 | $90,303 |
| Agbiome LLC Series C | 6/29/18 | $435,125 |
| Ant International Co. Ltd. | 5/16/18 | $1,539,709 |
| Cibus Global Ltd. Series C | 2/16/18 | $281,001 |
| Compass, Inc. Series E | 11/3/17 | $79,692 |
| ContextLogic, Inc. Series G | 10/24/17 | $385,033 |
| Generation Bio Series B | 2/21/18 | $204,864 |
| JUUL Labs, Inc. Class A | 12/20/17 - 7/6/18 | $4,110,283 |
| JUUL Labs, Inc. Series E | 12/20/17 - 7/6/18 | $2,216,242 |
| Lyft, Inc. Series H | 11/22/17 | $4,000,008 |
| Lyft, Inc. Series I | 6/27/18 | $8,400,014 |
| Neutron Holdings, Inc. Series C | 7/3/18 | $581,081 |
| Roofoods Ltd. Series F | 9/12/17 | $119,153 |
| Starry, Inc. Series C | 12/8/17 | $145,907 |
| The Honest Co., Inc. Series E | 9/28/17 | $231,376 |
| Topgolf International, Inc. Series F | 11/10/17 | $127,005 |
Affiliated Central Funds
Information regarding fiscal year to date income earned by the Fund from investments in Fidelity Central Funds is as follows:
| Fund | Income earned |
| Fidelity Cash Central Fund | $193,969 |
| Fidelity Securities Lending Cash Central Fund | 166,583 |
| Total | $360,552 |
Amounts in the income column in the above table include any capital gain distributions from underlying funds, which are presented in the corresponding line-item in the Statement of Operations if applicable.
Investment Valuation
The following is a summary of the inputs used, as of July 31, 2018, involving the Fund's assets and liabilities carried at fair value. The inputs or methodology used for valuing securities may not be an indication of the risk associated with investing in those securities. For more information on valuation inputs, and their aggregation into the levels used below, please refer to the Investment Valuation section in the accompanying Notes to Financial Statements.
| | Valuation Inputs at Reporting Date: |
| Description | Total | Level 1 | Level 2 | Level 3 |
| Investments in Securities: | | | | |
| Equities: | | | | |
| Consumer Discretionary | $431,742,572 | $427,228,936 | $3,073,927 | $1,439,709 |
| Consumer Staples | 54,079,868 | 47,207,353 | 328,133 | 6,544,382 |
| Energy | 41,424,550 | 41,424,550 | -- | -- |
| Financials | 70,556,758 | 70,554,991 | 1,767 | -- |
| Health Care | 163,797,346 | 163,538,441 | 146,061 | 112,844 |
| Industrials | 84,739,473 | 84,466,532 | 272,941 | -- |
| Information Technology | 763,724,035 | 738,668,646 | 11,201,542 | 13,853,847 |
| Materials | 34,815,393 | 34,815,393 | -- | -- |
| Real Estate | 1,539,709 | -- | -- | 1,539,709 |
| Telecommunication Services | 2,366,165 | 2,366,165 | -- | -- |
| Utilities | 431,650 | 431,650 | -- | -- |
| Money Market Funds | 37,757,087 | 37,757,087 | -- | -- |
| Total Investments in Securities: | $1,686,974,606 | $1,648,459,744 | $15,024,371 | $23,490,491 |
The following is a reconciliation of Investments in Securities for which Level 3 inputs were used in determining value:
| Investments in Securities: | |
| Beginning Balance | $52,898 |
| Net Realized Gain (Loss) on Investment Securities | (50,719) |
| Net Unrealized Gain (Loss) on Investment Securities | 543,410 |
| Cost of Purchases | 23,236,017 |
| Proceeds of Sales | (291,115) |
| Amortization/Accretion | -- |
| Transfers into Level 3 | -- |
| Transfers out of Level 3 | -- |
| Ending Balance | $23,490,491 |
| The change in unrealized gain (loss) for the period attributable to Level 3 securities held at July 31, 2018 | $543,696 |
The information used in the above reconciliation represents fiscal year to date activity for any Investments in Securities identified as using Level 3 inputs at either the beginning or the end of the current fiscal period and includes securities received through in-kind transactions. Transfers in or out of Level 3 represent the beginning value of any Security or Instrument where a change in the pricing level occurred from the beginning to the end of the period. The cost of purchases and the proceeds of sales may include securities received or delivered through corporate actions or exchanges. Realized and unrealized gains (losses) disclosed in the reconciliation are included in Net Gain (Loss) on the Fund's Statement of Operations.
See accompanying notes which are an integral part of the financial statements.
Financial Statements
Statement of Assets and Liabilities
| | | July 31, 2018 |
| Assets | | |
Investment in securities, at value (including securities loaned of $4,417,915) — See accompanying schedule:
Unaffiliated issuers (cost $1,442,697,108) | $1,649,217,519 | |
| Fidelity Central Funds (cost $37,757,087) | 37,757,087 | |
| Total Investment in Securities (cost $1,480,454,195) | | $1,686,974,606 |
| Cash | | 1,651,558 |
| Foreign currency held at value (cost $347,214) | | 348,879 |
| Receivable for investments sold | | 7,088,236 |
| Receivable for fund shares sold | | 956,096 |
| Dividends receivable | | 322,387 |
| Distributions receivable from Fidelity Central Funds | | 61,887 |
| Other receivables | | 21,130 |
| Total assets | | 1,697,424,779 |
| Liabilities | | |
| Payable for investments purchased | $7,146,239 | |
| Payable for fund shares redeemed | 4,993,088 | |
| Accrued management fee | 636,359 | |
| Other payables and accrued expenses | 75,540 | |
| Collateral on securities loaned | 4,529,200 | |
| Total liabilities | | 17,380,426 |
| Net Assets | | $1,680,044,353 |
| Net Assets consist of: | | |
| Paid in capital | | $1,484,120,056 |
| Undistributed net investment income | | 3,740,420 |
| Accumulated undistributed net realized gain (loss) on investments and foreign currency transactions | | (14,263,937) |
| Net unrealized appreciation (depreciation) on investments and assets and liabilities in foreign currencies | | 206,447,814 |
| Net Assets, for 131,377,282 shares outstanding | | $1,680,044,353 |
| Net Asset Value, offering price and redemption price per share ($1,680,044,353 ÷ 131,377,282 shares) | | $12.79 |
See accompanying notes which are an integral part of the financial statements.
Statement of Operations
| | | Year ended July 31, 2018 |
| Investment Income | | |
| Dividends | | $7,082,449 |
| Special dividends | | 1,582,426 |
| Interest | | 144,362 |
| Income from Fidelity Central Funds | | 360,552 |
| Total income | | 9,169,789 |
| Expenses | | |
| Management fee | $4,615,303 | |
| Independent trustees' fees and expenses | 3,830 | |
| Commitment fees | 1,203 | |
| Total expenses before reductions | 4,620,336 | |
| Expense reductions | (45,791) | |
| Total expenses after reductions | | 4,574,545 |
| Net investment income (loss) | | 4,595,244 |
| Realized and Unrealized Gain (Loss) | | |
| Net realized gain (loss) on: | | |
| Investment securities: | | |
| Unaffiliated issuers | (14,269,775) | |
| Fidelity Central Funds | 500 | |
| Foreign currency transactions | 3,993 | |
| Total net realized gain (loss) | | (14,265,282) |
| Change in net unrealized appreciation (depreciation) on: | | |
| Investment securities: | | |
| Unaffiliated issuers (net of increase in deferred foreign taxes of $75,540) | 207,754,900 | |
| Assets and liabilities in foreign currencies | 2,943 | |
| Total change in net unrealized appreciation (depreciation) | | 207,757,843 |
| Net gain (loss) | | 193,492,561 |
| Net increase (decrease) in net assets resulting from operations | | $198,087,805 |
See accompanying notes which are an integral part of the financial statements.
Statement of Changes in Net Assets
| | Year ended July 31, 2018 | For the period
May 25, 2017 (commencement of operations) to July 31, 2017 |
| Increase (Decrease) in Net Assets | | |
| Operations | | |
| Net investment income (loss) | $4,595,244 | $(2,606) |
| Net realized gain (loss) | (14,265,282) | (159) |
| Change in net unrealized appreciation (depreciation) | 207,757,843 | (1,310,029) |
| Net increase (decrease) in net assets resulting from operations | 198,087,805 | (1,312,794) |
| Distributions to shareholders from net investment income | (737,285) | – |
| Distributions to shareholders from net realized gain | (113,428) | – |
| Total distributions | (850,713) | – |
| Share transactions | | |
| Proceeds from sales of shares | 1,506,071,314 | 181,817,461 |
| Reinvestment of distributions | 850,713 | – |
| Cost of shares redeemed | (204,338,016) | (281,417) |
| Net increase (decrease) in net assets resulting from share transactions | 1,302,584,011 | 181,536,044 |
| Total increase (decrease) in net assets | 1,499,821,103 | 180,223,250 |
| Net Assets | | |
| Beginning of period | 180,223,250 | – |
| End of period | $1,680,044,353 | $180,223,250 |
| Other Information | | |
| Undistributed net investment income end of period | $3,740,420 | $– |
| Shares | | |
| Sold | 130,929,525 | 17,490,141 |
| Issued in reinvestment of distributions | 75,151 | – |
| Redeemed | (17,090,266) | (27,269) |
| Net increase (decrease) | 113,914,410 | 17,462,872 |
See accompanying notes which are an integral part of the financial statements.
Financial Highlights
Fidelity Blue Chip Growth K6 Fund
| | | |
| Years ended July 31, | 2018 | 2017 A |
| Selected Per–Share Data | | |
| Net asset value, beginning of period | $10.32 | $10.00 |
| Income from Investment Operations | | |
| Net investment income (loss)B | .05C | –D |
| Net realized and unrealized gain (loss) | 2.44 | .32E |
| Total from investment operations | 2.49 | .32 |
| Distributions from net investment income | (.01) | – |
| Distributions from net realized gain | –D | – |
| Total distributions | (.02)F | – |
| Net asset value, end of period | $12.79 | $10.32 |
| Total ReturnG,H | 24.10% | 3.20% |
| Ratios to Average Net AssetsI,J | | |
| Expenses before reductions | .45% | .45%K |
| Expenses net of fee waivers, if any | .45% | .45%K |
| Expenses net of all reductions | .45% | .45%K |
| Net investment income (loss) | .45%C | (.24)%K |
| Supplemental Data | | |
| Net assets, end of period (000 omitted) | $1,680,044 | $180,223 |
| Portfolio turnover rateL | 40%M | 3%M,N |
A For the period May 25, 2017 (commencement of operations) to July 31, 2017.
B Calculated based on average shares outstanding during the period.
C Net investment income per share reflects a large, non-recurring dividend which amounted to $.02 per share. Excluding this non-recurring dividend, the ratio of net investment income (loss) to average net assets would have been .29%.
D Amount represents less than $.005 per share.
E The amount shown for a share outstanding does not correspond with the aggregate net gain (loss) on investments for the period due to the timing of sales and repurchases of shares in relation to fluctuating market values of the investments of the Fund.
F Total distributions of $.02 per share is comprised of distributions from net investment income of $.013 and distributions from net realized gain of $.002 per share.
G Total returns for periods of less than one year are not annualized.
H Total returns would have been lower if certain expenses had not been reduced during the applicable periods shown.
I Fees and expenses of any underlying Fidelity Central Funds are not included in the Fund's expense ratio. The Fund indirectly bears its proportionate share of the expenses of any underlying Fidelity Central Funds.
J Expense ratios reflect operating expenses of the Fund. Expenses before reductions do not reflect amounts reimbursed by the investment adviser or reductions from brokerage service arrangements or reductions from other expense offset arrangements and do not represent the amount paid by the Fund during periods when reimbursements or reductions occur. Expense ratios before reductions for start-up periods may not be representative of longer term operating periods. Expenses net of fee waivers reflect expenses after reimbursement by the investment adviser but prior to reductions from brokerage service arrangements or other expense offset arrangements. Expenses net of all reductions represent the net expenses paid by the Fund.
K Annualized
L Amount does not include the portfolio activity of any underlying Fidelity Central Funds.
M Portfolio turnover rate excludes securities received or delivered in-kind.
N Amount not annualized.
See accompanying notes which are an integral part of the financial statements.
Notes to Financial Statements
For the period ended July 31, 2018
1. Organization.
Fidelity Blue Chip Growth K6 Fund (the Fund) is a fund of Fidelity Securities Fund (the Trust) and is authorized to issue an unlimited number of shares. Share transactions on the Statement of Changes in Net Assets may contain exchanges between affiliated funds. The Trust is registered under the Investment Company Act of 1940, as amended (the 1940 Act), as an open-end management investment company organized as a Massachusetts business trust. Shares generally are available only to employer-sponsored retirement plans that are recordkept by Fidelity, or to certain employer-sponsored retirement plans that are not recordkept by Fidelity.
2. Investments in Fidelity Central Funds.
The Fund invests in Fidelity Central Funds, which are open-end investment companies generally available only to other investment companies and accounts managed by the investment adviser and its affiliates. The Fund's Schedule of Investments lists each of the Fidelity Central Funds held as of period end, if any, as an investment of the Fund, but does not include the underlying holdings of each Fidelity Central Fund. As an Investing Fund, the Fund indirectly bears its proportionate share of the expenses of the underlying Fidelity Central Funds.
The Money Market Central Funds seek preservation of capital and current income and are managed by Fidelity Investments Money Management, Inc. (FIMM), an affiliate of the investment adviser. Annualized expenses of the Money Market Central Funds as of their most recent shareholder report date are less than .005%.
A complete unaudited list of holdings for each Fidelity Central Fund is available upon request or at the Securities and Exchange Commission (the SEC) website at www.sec.gov. In addition, the financial statements of the Fidelity Central Funds, which are not covered by the Fund's Report of Independent Registered Public Accounting Firm, are available on the SEC website or upon request.
3. Significant Accounting Policies.
The Fund is an investment company and applies the accounting and reporting guidance of the Financial Accounting Standards Board (FASB) Accounting Standards Codification Topic 946 Financial Services – Investments Companies. The financial statements have been prepared in conformity with accounting principles generally accepted in the United States of America (GAAP), which require management to make certain estimates and assumptions at the date of the financial statements. Actual results could differ from those estimates. Subsequent events, if any, through the date that the financial statements were issued have been evaluated in the preparation of the financial statements. The following summarizes the significant accounting policies of the Fund:
Investment Valuation. Investments are valued as of 4:00 p.m. Eastern time on the last calendar day of the period. The Board of Trustees (the Board) has delegated the day to day responsibility for the valuation of the Fund's investments to the Fair Value Committee (the Committee) established by the Fund's investment adviser. In accordance with valuation policies and procedures approved by the Board, the Fund attempts to obtain prices from one or more third party pricing vendors or brokers to value its investments. When current market prices, quotations or currency exchange rates are not readily available or reliable, investments will be fair valued in good faith by the Committee, in accordance with procedures adopted by the Board. Factors used in determining fair value vary by investment type and may include market or investment specific events. The frequency with which these procedures are used cannot be predicted and they may be utilized to a significant extent. The Committee oversees the Fund's valuation policies and procedures and reports to the Board on the Committee's activities and fair value determinations. The Board monitors the appropriateness of the procedures used in valuing the Fund's investments and ratifies the fair value determinations of the Committee.
The Fund categorizes the inputs to valuation techniques used to value its investments into a disclosure hierarchy consisting of three levels as shown below:
- Level 1 – quoted prices in active markets for identical investments
- Level 2 – other significant observable inputs (including quoted prices for similar investments, interest rates, prepayment speeds, etc.)
- Level 3 – unobservable inputs (including the Fund's own assumptions based on the best information available)
Valuation techniques used to value the Fund's investments by major category are as follows:
Equity securities, including restricted securities, for which market quotations are readily available, are valued at the last reported sale price or official closing price as reported by a third party pricing vendor on the primary market or exchange on which they are traded and are categorized as Level 1 in the hierarchy. In the event there were no sales during the day or closing prices are not available, securities are valued at the last quoted bid price or may be valued using the last available price and are generally categorized as Level 2 in the hierarchy. For foreign equity securities, when market or security specific events arise, comparisons to the valuation of American Depositary Receipts (ADRs), futures contracts, Exchange-Traded Funds (ETFs) and certain indexes as well as quoted prices for similar securities may be used and would be categorized as Level 2 in the hierarchy. Utilizing these techniques may result in transfers between Level 1 and Level 2. For equity securities, including restricted securities, where observable inputs are limited, assumptions about market activity and risk are used and these securities may be categorized as Level 3 in the hierarchy. Equity securities, including restricted securities, for which observable inputs are not available are valued using alternate valuation approaches, including the market approach and the income approach and are categorized as Level 3 in the hierarchy. The market approach generally consists of using comparable market transactions while the income approach generally consists of using the net present value of estimated future cash flows, adjusted as appropriate for liquidity, credit, market and/or other risk factors.
Investments in open-end mutual funds, including the Fidelity Central Funds, are valued at their closing net asset value (NAV) each business day and are categorized as Level 1 in the hierarchy.
The following provides information on Level 3 securities held by the Fund that were valued at period end based on unobservable inputs. These amounts exclude valuations provided by a broker.
| Asset Type | Fair Value | Valuation Technique(s) | Unobservable Input | Amount or Range/Weighted Average | Impact to Valuation from an Increase in Input(a) |
| Equities | $23,490,491 | Market comparable | Enterprise value/Sales multiple (EV/S) | 2.1 - 3.6 / 3.0 | Increase |
| | | | Transaction price | $9.15 | Increase |
| | | | Discount rate | 38.0% - 73.0% / 55.3% | Decrease |
| | | | Discount for lack of marketability | 15.0% | Decrease |
| | | | Premium rate | 9.0% | Increase |
| | | Market approach | Transaction price | $0.18 - $179.25 / $76.20 | Increase |
| | | | Tender price | $143.40 | Increase |
(a) Represents the expected directional change in the fair value of the Level 3 investments that would result from an increase in the corresponding input. A decrease to the unobservable input would have the opposite effect. Significant changes in these inputs could result in significantly higher or lower fair value measurements.
Changes in valuation techniques may result in transfers in or out of an assigned level within the disclosure hierarchy. The aggregate value of investments by input level as of July 31, 2018, as well as a roll forward of Level 3 investments, is included at the end of the Fund's Schedule of Investments.
Foreign Currency. The Fund may use foreign currency contracts to facilitate transactions in foreign-denominated securities. Gains and losses from these transactions may arise from changes in the value of the foreign currency or if the counterparties do not perform under the contracts' terms.
Foreign-denominated assets, including investment securities, and liabilities are translated into U.S. dollars at the exchange rates at period end. Purchases and sales of investment securities, income and dividends received and expenses denominated in foreign currencies are translated into U.S. dollars at the exchange rate in effect on the transaction date.
The effects of exchange rate fluctuations on investments are included with the net realized and unrealized gain (loss) on investment securities. Other foreign currency transactions resulting in realized and unrealized gain (loss) are disclosed separately.
Investment Transactions and Income. For financial reporting purposes, the Fund's investment holdings and NAV include trades executed through the end of the last business day of the period. The NAV per share for processing shareholder transactions is calculated as of the close of business of the New York Stock Exchange (NYSE), normally 4:00 p.m. Eastern time and includes trades executed through the end of the prior business day. Gains and losses on securities sold are determined on the basis of identified cost. Dividend income is recorded on the ex-dividend date, except for certain dividends from foreign securities where the ex-dividend date may have passed, which are recorded as soon as the Fund is informed of the ex-dividend date. Non-cash dividends included in dividend income, if any, are recorded at the fair market value of the securities received. Income and capital gain distributions from Fidelity Central Funds, if any, are recorded on the ex-dividend date. Certain distributions received by the Fund represent a return of capital or capital gain. The Fund determines the components of these distributions subsequent to the ex-dividend date, based upon receipt of tax filings or other correspondence relating to the underlying investment. These distributions are recorded as a reduction of cost of investments and/or as a realized gain. Large, non-recurring dividends recognized by the Fund are presented separately on the Statement of Operations as "Special Dividends" and the impact of these dividends is presented in the Financial Highlights. Interest income is accrued as earned and includes coupon interest and amortization of premium and accretion of discount on debt securities as applicable. Investment income is recorded net of foreign taxes withheld where recovery of such taxes is uncertain.
Expenses. Expenses directly attributable to a fund are charged to that fund. Expenses attributable to more than one fund are allocated among the respective funds on the basis of relative net assets or other appropriate methods. Expense estimates are accrued in the period to which they relate and adjustments are made when actual amounts are known.
Income Tax Information and Distributions to Shareholders. Each year, the Fund intends to qualify as a regulated investment company under Subchapter M of the Internal Revenue Code, including distributing substantially all of its taxable income and realized gains. As a result, no provision for U.S. Federal income taxes is required. As of July 31, 2018, the Fund did not have any unrecognized tax benefits in the financial statements; nor is the Fund aware of any tax positions for which it is reasonably possible that the total amounts of unrecognized tax benefits will significantly change in the next twelve months. The Fund files a U.S. federal tax return, in addition to state and local tax returns as required. The Fund's federal income tax returns are subject to examination by the Internal Revenue Service (IRS) for a period of three fiscal years after they are filed. State and local tax returns may be subject to examination for an additional fiscal year depending on the jurisdiction. Foreign taxes are provided for based on the Fund's understanding of the tax rules and rates that exist in the foreign markets in which it invests. The Fund is subject to a tax imposed on capital gains by certain countries in which it invests. An estimated deferred tax liability for net unrealized appreciation on the applicable securities is included in Other payables and accrued expenses on the Statement of Assets & Liabilities.
Distributions are declared and recorded on the ex-dividend date. Income and capital gain distributions are determined in accordance with income tax regulations, which may differ from GAAP.
Capital accounts within the financial statements are adjusted for permanent book-tax differences. These adjustments have no impact on net assets or the results of operations. Capital accounts are not adjusted for temporary book-tax differences which will reverse in a subsequent period.
Book-tax differences are primarily due to the foreign currency transactions, passive foreign investment companies (PFIC), partnerships, capital loss carryforwards and losses deferred due to wash sales.
As of period end, the cost and unrealized appreciation (depreciation) in securities, and derivatives if applicable, for federal income tax purposes were as follows:
| Gross unrealized appreciation | $243,544,559 |
| Gross unrealized depreciation | (38,814,794) |
| Net unrealized appreciation (depreciation) | $204,729,765 |
| Tax Cost | $1,482,244,841 |
The tax-based components of distributable earnings as of period end were as follows:
| Undistributed ordinary income | $3,743,915 |
| Capital loss carryforward | $(12,473,290) |
| Net unrealized appreciation (depreciation) on securities and other investments | $204,729,214 |
Capital loss carryforwards are only available to offset future capital gains of the Fund to the extent provided by regulations and may be limited. Under the Regulated Investment Company Modernization Act of 2010 (the Act), the Fund is permitted to carry forward capital losses incurred in taxable years beginning after December 22, 2010 for an unlimited period and such capital losses are required to be used prior to any losses that expire. The capital loss carryforward information presented below, including any applicable limitation, is estimated as of fiscal period end and is subject to adjustment.
| No expiration | |
| Short-term | $(12,463,098) |
| Long-term | (10,192) |
| Total no expiration | (12,473,290) |
| Total capital loss carryforward | $(12,473,290) |
The tax character of distributions paid was as follows:
| | July 31, 2018 | July 31, 2017 |
| Ordinary Income | $850,713 | $ - |
Restricted Securities. The Fund may invest in securities that are subject to legal or contractual restrictions on resale. These securities generally may be resold in transactions exempt from registration or to the public if the securities are registered. Disposal of these securities may involve time-consuming negotiations and expense, and prompt sale at an acceptable price may be difficult. Information regarding restricted securities is included at the end of the Fund's Schedule of Investments.
Consolidated Subsidiary. The Fund invests in certain investments through a wholly-owned subsidiary ("Subsidiary"), which may be subject to federal and state taxes upon disposition.
As of period end, the Fund held an investment of $281,001 in this Subsidiary, representing .02% of the Fund's net assets. The financial statements have been consolidated and include accounts of the Fund and the Subsidiary. Accordingly, all inter-company transactions and balances have been eliminated.
4. Purchases and Sales of Investments.
Purchases and sales of securities, other than short-term securities and in-kind transactions, aggregated $579,488,462 and $367,703,311, respectively.
Exchanges In-Kind. Investments and cash, received in-kind through subscriptions totaled $1,068,331,023 in exchange for 93,987,183 shares of the Fund. The amount of in-kind exchanges is included in share transactions in the accompanying Statement of Changes in Net Assets. The Fund recognized no gain or loss for federal income tax purposes.
5. Fees and Other Transactions with Affiliates.
Management Fee. Fidelity Management & Research Company (the investment adviser) and its affiliates provide the Fund with investment management related services for which the Fund pays a monthly management fee that is based on an annual rate of .45% of average net assets. Under the management contract, the investment adviser or an affiliate pays all other expenses of the Fund, excluding fees and expenses of the independent Trustees, and certain miscellaneous expenses such as proxy and shareholder meeting expenses.
Brokerage Commissions. The Fund placed a portion of its portfolio transactions with brokerage firms which are affiliates of the investment adviser. Brokerage commissions are included in net realized gain (loss) and change in net unrealized appreciation (depreciation) in the Statement of Operations. The commissions paid to these affiliated firms were $8,309 for the period.
Interfund Trades. The Fund may purchase from or sell securities to other Fidelity Funds under procedures adopted by the Board. The procedures have been designed to ensure these interfund trades are executed in accordance with Rule 17a-7 of the 1940 Act. Interfund trades are included within the respective purchases and sales amounts shown in the Purchases and Sales of Investments note.
Prior Fiscal Year Exchanges In-Kind. During the prior period, an affiliated entity completed an exchange in-kind with the Fund. The affiliated entity delivered investments and cash valued at $179,817,385 in exchange for 17,290,133 shares of the Fund. The amount of in-kind exchanges is included in share transactions in the accompanying Statement of Changes in Net Assets. The Fund recognized no gain or loss for federal income tax purposes.
6. Committed Line of Credit.
The Fund participates with other funds managed by the investment adviser or an affiliate in a $4.25 billion credit facility (the "line of credit") to be utilized for temporary or emergency purposes to fund shareholder redemptions or for other short-term liquidity purposes. The Fund has agreed to pay commitment fees on its pro-rata portion of the line of credit, which amounted to $1,203 and is reflected in Commitment fees on the Statement of Operations.
7. Security Lending.
The Fund lends portfolio securities through a lending agent from time to time in order to earn additional income. For equity securities, a lending agent is used and may loan securities to certain qualified borrowers, including Fidelity Capital Markets (FCM), a broker-dealer affiliated with the Fund. On the settlement date of the loan, the Fund receives collateral (in the form of U.S. Treasury obligations, letters of credit and/or cash) against the loaned securities and maintains collateral in an amount not less than 100% of the market value of the loaned securities during the period of the loan. The market value of the loaned securities is determined at the close of business of the Fund and any additional required collateral is delivered to the Fund on the next business day. The Fund or borrower may terminate the loan at any time, and if the borrower defaults on its obligation to return the securities loaned because of insolvency or other reasons, the Fund may apply collateral received from the borrower against the obligation. The Fund may experience delays and costs in recovering the securities loaned. Any cash collateral received is invested in the Fidelity Securities Lending Cash Central Fund. The value of loaned securities and cash collateral at period end are disclosed on the Fund's Statement of Assets and Liabilities. The value of securities loaned to FCM at period end was $63,203. Security lending income represents the income earned on investing cash collateral, less rebates paid to borrowers and any lending agent fees associated with the loan, plus any premium payments received for lending certain types of securities. Security lending income is presented in the Statement of Operations as a component of income from Fidelity Central Funds. Total security lending income during the period amounted to $166,583, including $10,382 from securities loaned to FCM.
8. Expense Reductions.
Commissions paid to certain brokers with whom the investment adviser, or its affiliates, places trades on behalf of the Fund include an amount in addition to trade execution, which may be rebated back to the Fund to offset certain expenses. This amount totaled $45,553 for the period. In addition, through arrangements with the Fund's custodian, credits realized as a result of certain uninvested cash balances were used to reduce the Fund's expenses. During the period, these credits reduced the Fund's expenses by $238.
9. Other.
The Fund's organizational documents provide former and current trustees and officers with a limited indemnification against liabilities arising in connection with the performance of their duties to the Fund. In the normal course of business, the Fund may also enter into contracts that provide general indemnifications. The Fund's maximum exposure under these arrangements is unknown as this would be dependent on future claims that may be made against the Fund. The risk of material loss from such claims is considered remote.
Report of Independent Registered Public Accounting Firm
To the Trustees of Fidelity Securities Fund and Shareholders of Fidelity Blue Chip Growth K6 Fund:
Opinion on the Financial Statements and Financial Highlights
We have audited the accompanying statement of assets and liabilities of Fidelity Blue Chip Growth K6 Fund (the "Fund"), a fund of Fidelity Securities Fund, including the schedule of investments, as of July 31, 2018, the related statement of operations for the year then ended, the statement of changes in net assets and the financial highlights for the year then ended and for the period from May 25, 2017 (commencement of operations) to July 31, 2017, and the related notes. In our opinion, the financial statements and financial highlights present fairly, in all material respects, the financial position of the Fund as of July 31, 2018, the results of its operations for the year then ended, and the changes in its net assets, and the financial highlights for the year then ended and for the period from May 25, 2017 (commencement of operations) to July 31, 2017, in conformity with accounting principles generally accepted in the United States of America.
Basis for Opinion
These financial statements and financial highlights are the responsibility of the Fund's management. Our responsibility is to express an opinion on the Fund's financial statements and financial highlights based on our audits. We are a public accounting firm registered with the Public Company Accounting Oversight Board (United States) (PCAOB) and are required to be independent with respect to the Fund in accordance with the U.S. federal securities laws and the applicable rules and regulations of the Securities and Exchange Commission and the PCAOB.
We conducted our audits in accordance with the standards of the PCAOB. Those standards require that we plan and perform the audit to obtain reasonable assurance about whether the financial statements and financial highlights are free of material misstatement, whether due to error or fraud. The Fund is not required to have, nor were we engaged to perform, an audit of its internal control over financial reporting. As part of our audits we are required to obtain an understanding of internal control over financial reporting but not for the purpose of expressing an opinion on the effectiveness of the Fund’s internal control over financial reporting. Accordingly, we express no such opinion.
Our audits included performing procedures to assess the risks of material misstatement of the financial statements and financial highlights, whether due to error or fraud, and performing procedures that respond to those risks. Such procedures included examining, on a test basis, evidence regarding the amounts and disclosures in the financial statements and financial highlights. Our audits also included evaluating the accounting principles used and significant estimates made by management, as well as evaluating the overall presentation of the financial statements and financial highlights. Our procedures included confirmation of securities owned as of July 31, 2018, by correspondence with the custodians and brokers; when replies were not received from brokers, we performed other auditing procedures. We believe that our audits provide a reasonable basis for our opinion.
/s/ Deloitte & Touche LLP
Boston, Massachusetts
September 17, 2018
We have served as the auditor of one or more of the Fidelity investment companies since 1999.
Trustees and Officers
The Trustees, Members of the Advisory Board (if any), and officers of the trust and fund, as applicable, are listed below. The Board of Trustees governs the fund and is responsible for protecting the interests of shareholders. The Trustees are experienced executives who meet periodically throughout the year to oversee the fund's activities, review contractual arrangements with companies that provide services to the fund, oversee management of the risks associated with such activities and contractual arrangements, and review the fund's performance. Except for Jonathan Chiel, each of the Trustees oversees 286 funds. Mr. Chiel oversees 150 funds.
The Trustees hold office without limit in time except that (a) any Trustee may resign; (b) any Trustee may be removed by written instrument, signed by at least two-thirds of the number of Trustees prior to such removal; (c) any Trustee who requests to be retired or who has become incapacitated by illness or injury may be retired by written instrument signed by a majority of the other Trustees; and (d) any Trustee may be removed at any special meeting of shareholders by a two-thirds vote of the outstanding voting securities of the trust. Each Trustee who is not an interested person (as defined in the 1940 Act) of the trust and the fund is referred to herein as an Independent Trustee. Each Independent Trustee shall retire not later than the last day of the calendar year in which his or her 75th birthday occurs. The Independent Trustees may waive this mandatory retirement age policy with respect to individual Trustees. Officers and Advisory Board Members hold office without limit in time, except that any officer or Advisory Board Member may resign or may be removed by a vote of a majority of the Trustees at any regular meeting or any special meeting of the Trustees. Except as indicated, each individual has held the office shown or other offices in the same company for the past five years.
The fund’s Statement of Additional Information (SAI) includes more information about the Trustees. To request a free copy, call Fidelity at 1-800-835-5092.
Experience, Skills, Attributes, and Qualifications of the Trustees. The Governance and Nominating Committee has adopted a statement of policy that describes the experience, qualifications, attributes, and skills that are necessary and desirable for potential Independent Trustee candidates (Statement of Policy). The Board believes that each Trustee satisfied at the time he or she was initially elected or appointed a Trustee, and continues to satisfy, the standards contemplated by the Statement of Policy. The Governance and Nominating Committee also engages professional search firms to help identify potential Independent Trustee candidates who have the experience, qualifications, attributes, and skills consistent with the Statement of Policy. From time to time, additional criteria based on the composition and skills of the current Independent Trustees, as well as experience or skills that may be appropriate in light of future changes to board composition, business conditions, and regulatory or other developments, have also been considered by the professional search firms and the Governance and Nominating Committee. In addition, the Board takes into account the Trustees' commitment and participation in Board and committee meetings, as well as their leadership of standing and ad hoc committees throughout their tenure.
In determining that a particular Trustee was and continues to be qualified to serve as a Trustee, the Board has considered a variety of criteria, none of which, in isolation, was controlling. The Board believes that, collectively, the Trustees have balanced and diverse experience, qualifications, attributes, and skills, which allow the Board to operate effectively in governing the fund and protecting the interests of shareholders. Information about the specific experience, skills, attributes, and qualifications of each Trustee, which in each case led to the Board's conclusion that the Trustee should serve (or continue to serve) as a trustee of the fund, is provided below.
Board Structure and Oversight Function. James C. Curvey is an interested person and currently serves as Chairman. The Trustees have determined that an interested Chairman is appropriate and benefits shareholders because an interested Chairman has a personal and professional stake in the quality and continuity of services provided to the fund. Independent Trustees exercise their informed business judgment to appoint an individual of their choosing to serve as Chairman, regardless of whether the Trustee happens to be independent or a member of management. The Independent Trustees have determined that they can act independently and effectively without having an Independent Trustee serve as Chairman and that a key structural component for assuring that they are in a position to do so is for the Independent Trustees to constitute a substantial majority for the Board. The Independent Trustees also regularly meet in executive session. Ned C. Lautenbach serves as Chairman of the Independent Trustees and as such (i) acts as a liaison between the Independent Trustees and management with respect to matters important to the Independent Trustees and (ii) with management prepares agendas for Board meetings.
Fidelity® funds are overseen by different Boards of Trustees. The fund's Board oversees Fidelity's high income and certain equity funds, and other Boards oversee Fidelity's investment-grade bond, money market, asset allocation, and other equity funds. The asset allocation funds may invest in Fidelity® funds overseen by the fund's Board. The use of separate Boards, each with its own committee structure, allows the Trustees of each group of Fidelity® funds to focus on the unique issues of the funds they oversee, including common research, investment, and operational issues. On occasion, the separate Boards establish joint committees to address issues of overlapping consequences for the Fidelity® funds overseen by each Board.
The Trustees operate using a system of committees to facilitate the timely and efficient consideration of all matters of importance to the Trustees, the fund, and fund shareholders and to facilitate compliance with legal and regulatory requirements and oversight of the fund's activities and associated risks. The Board, acting through its committees, has charged FMR and its affiliates with (i) identifying events or circumstances the occurrence of which could have demonstrably adverse effects on the fund's business and/or reputation; (ii) implementing processes and controls to lessen the possibility that such events or circumstances occur or to mitigate the effects of such events or circumstances if they do occur; and (iii) creating and maintaining a system designed to evaluate continuously business and market conditions in order to facilitate the identification and implementation processes described in (i) and (ii) above. Because the day-to-day operations and activities of the fund are carried out by or through FMR, its affiliates, and other service providers, the fund's exposure to risks is mitigated but not eliminated by the processes overseen by the Trustees. While each of the Board's committees has responsibility for overseeing different aspects of the fund's activities, oversight is exercised primarily through the Operations, Audit, and Compliance Committees. In addition, the Independent Trustees have worked with Fidelity to enhance the Board's oversight of investment and financial risks, legal and regulatory risks, technology risks, and operational risks, including the development of additional risk reporting to the Board. Appropriate personnel, including but not limited to the fund's Chief Compliance Officer (CCO), FMR's internal auditor, the independent accountants, the fund's Treasurer and portfolio management personnel, make periodic reports to the Board's committees, as appropriate, including an annual review of Fidelity's risk management program for the Fidelity® funds. The responsibilities of each standing committee, including their oversight responsibilities, are described further under "Standing Committees of the Trustees."
Interested Trustees*:
Correspondence intended for a Trustee who is an interested person may be sent to Fidelity Investments, 245 Summer Street, Boston, Massachusetts 02210.
Name, Year of Birth; Principal Occupations and Other Relevant Experience+
Jonathan Chiel (1957)
Year of Election or Appointment: 2016
Trustee
Mr. Chiel also serves as Trustee of other Fidelity® funds. Mr. Chiel is Executive Vice President and General Counsel for FMR LLC (diversified financial services company, 2012-present). Previously, Mr. Chiel served as general counsel (2004-2012) and senior vice president and deputy general counsel (2000-2004) for John Hancock Financial Services; a partner with Choate, Hall & Stewart (1996-2000) (law firm); and an Assistant United States Attorney for the United States Attorney’s Office of the District of Massachusetts (1986-95), including Chief of the Criminal Division (1993-1995). Mr. Chiel is a director on the boards of the Boston Bar Foundation and the Maimonides School.
James C. Curvey (1935)
Year of Election or Appointment: 2007
Trustee
Chairman of the Board of Trustees
Mr. Curvey also serves as Trustee of other Fidelity® funds. Mr. Curvey is Vice Chairman (2007-present) and Director of FMR LLC (diversified financial services company). In addition, Mr. Curvey is an Overseer Emeritus for the Boston Symphony Orchestra, a Director of Artis-Naples, and a Trustee of Brewster Academy in Wolfeboro, New Hampshire. Previously, Mr. Curvey served as a Director of Fidelity Research & Analysis Co. (investment adviser firm, 2009-2018), Director of Fidelity Investments Money Management, Inc. (investment adviser firm, 2009-2014) and a Director of FMR and FMR Co., Inc. (investment adviser firms, 2007-2014).
Charles S. Morrison (1960)
Year of Election or Appointment: 2014
Trustee
Mr. Morrison also serves as Trustee of other funds. He serves as President of Fidelity SelectCo, LLC (investment adviser firm, 2017-present) and Fidelity Management & Research Company (FMR) (investment adviser firm, 2016-present), a Director of Fidelity Investments Money Management, Inc. (FIMM) (investment adviser firm, 2014-present), Director of Fidelity SelectCo, LLC (investment adviser firm, 2014-present), President, Asset Management (2014-present), and is an employee of Fidelity Investments. Previously, Mr. Morrison served as Vice President of Fidelity's Fixed Income and Asset Allocation Funds (2012-2014), President, Fixed Income (2011-2014), Vice President of Fidelity's Money Market Funds (2005-2009), President, Money Market Group Leader of FMR (investment adviser firm, 2009), and Senior Vice President, Money Market Group of FMR (2004-2009). Mr. Morrison also served as Vice President of Fidelity's Bond Funds (2002-2005), certain Balanced Funds (2002-2005), and certain Asset Allocation Funds (2002-2007), and as Senior Vice President (2002-2005) of Fidelity's Bond Division.
* Determined to be an “Interested Trustee” by virtue of, among other things, his or her affiliation with the trust or various entities under common control with FMR.
+ The information includes the Trustee's principal occupation during the last five years and other information relating to the experience, attributes, and skills relevant to the Trustee's qualifications to serve as a Trustee, which led to the conclusion that the Trustee should serve as a Trustee for the fund.
Independent Trustees:
Correspondence intended for an Independent Trustee may be sent to Fidelity Investments, P.O. Box 55235, Boston, Massachusetts 02205-5235.
Name, Year of Birth; Principal Occupations and Other Relevant Experience+
Dennis J. Dirks (1948)
Year of Election or Appointment: 2005
Trustee
Mr. Dirks also serves as Trustee of other Fidelity® funds. Prior to his retirement in May 2003, Mr. Dirks was Chief Operating Officer and a member of the Board of The Depository Trust & Clearing Corporation (DTCC). He also served as President, Chief Operating Officer, and Board member of The Depository Trust Company (DTC) and President and Board member of the National Securities Clearing Corporation (NSCC). In addition, Mr. Dirks served as Chief Executive Officer and Board member of the Government Securities Clearing Corporation, Chief Executive Officer and Board member of the Mortgage-Backed Securities Clearing Corporation, as a Trustee and a member of the Finance Committee of Manhattan College (2005-2008), as a Trustee and a member of the Finance Committee of AHRC of Nassau County (2006-2008), as a member of the Independent Directors Council (IDC) Governing Council (2010-2015), and as a member of the Board of Directors for The Brookville Center for Children’s Services, Inc. (2009-2017). Mr. Dirks is a member of the Finance Committee (2016-present), Board of Directors (2017-present) and Board of Trustees (2018-present) and is Treasurer (2018-present) of the Asolo Repertory Theatre.
Donald F. Donahue (1950)
Year of Election or Appointment: 2018
Trustee
Mr. Donahue also serves as a Trustee of other Fidelity® funds. Mr. Donahue is President and Chief Executive Officer of Miranda Partners, LLC (risk consulting for the financial services industry, 2012-present). Previously, Mr. Donahue served as a Member of the Advisory Board of certain Fidelity® funds (2015-2018) and Chief Executive Officer (2006-2012), Chief Operating Officer (2003-2006), and Managing Director, Customer Marketing and Development (1999-2003) of The Depository Trust & Clearing Corporation (financial markets infrastructure). Mr. Donahue serves as a Member (2007-present) and Co-Chairman (2016-present) of the Board of Directors of United Way of New York, Member of the Board of Directors of NYC Leadership Academy (2012-present) and Member of the Board of Advisors of Ripple Labs, Inc. (financial services, 2015-present). He also served as Chairman (2010-2012) and Member of the Board of Directors (2012-2013) of Omgeo, LLC (financial services), Treasurer of United Way of New York (2012-2016), and Member of the Board of Directors of XBRL US (financial services non-profit, 2009-2012) and the International Securities Services Association (2009-2012).
Alan J. Lacy (1953)
Year of Election or Appointment: 2008
Trustee
Mr. Lacy also serves as Trustee of other Fidelity® funds. Mr. Lacy serves as a Director of Bristol-Myers Squibb Company (global pharmaceuticals, 2008-present). He is a Trustee of the California Chapter of The Nature Conservancy (2015-present) and a Director of the Center for Advanced Study in the Behavioral Sciences at Stanford University (2015-present). In addition, Mr. Lacy served as Senior Adviser (2007-2014) of Oak Hill Capital Partners, L.P. (private equity) and also served as Chief Executive Officer (2005) and Vice Chairman (2005-2006) of Sears Holdings Corporation (retail) and Chief Executive Officer and Chairman of the Board of Sears, Roebuck and Co. (retail, 2000-2005). Previously, Mr. Lacy served as Chairman (2014-2017) and a member (2010-2017) of the Board of Directors of Dave & Buster’s Entertainment, Inc. (restaurant and entertainment complexes), as Chairman (2008-2011) and a member (2006-2015) of the Board of Trustees of the National Parks Conservation Association, and as a member of the Board of Directors for The Hillman Companies, Inc. (hardware wholesalers, 2010-2014), Earth Fare, Inc. (retail grocery, 2010-2014), and The Western Union Company (global money transfer, 2006-2011).
Ned C. Lautenbach (1944)
Year of Election or Appointment: 2000
Trustee
Chairman of the Independent Trustees
Mr. Lautenbach also serves as Trustee of other Fidelity® funds. Mr. Lautenbach currently serves as Vice Chair of the Board of Governors, State University System of Florida (2013-present) and is a member of the Council on Foreign Relations (1994-present). He is also a member and has most recently served as Chairman of the Board of Directors of Artis-Naples (2012-present). Previously, Mr. Lautenbach served as a member and then Lead Director of the Board of Directors of Eaton Corporation (diversified industrial, 1997-2016). He was also a Partner and Advisory Partner at Clayton, Dubilier & Rice, LLC (private equity investment, 1998-2010), as well as a Director of Sony Corporation (2006-2007). In addition, Mr. Lautenbach also had a 30-year career with IBM (technology company) during which time he served as Senior Vice President and a member of the Corporate Executive Committee (1968-1998).
Joseph Mauriello (1944)
Year of Election or Appointment: 2008
Trustee
Mr. Mauriello also serves as Trustee of other Fidelity® funds. Prior to his retirement in January 2006, Mr. Mauriello served in numerous senior management positions including Deputy Chairman and Chief Operating Officer (2004-2005), and Vice Chairman of Financial Services (2002-2004) of KPMG LLP US (professional services, 1965-2005). Mr. Mauriello currently serves as a member of the Board of Directors of XL Group plc. (global insurance and re-insurance, 2006-present) and the Independent Directors Council (IDC) Governing Council (2015-present). Previously, Mr. Mauriello served as a Director of the Hamilton Funds of the Bank of New York (2006-2007) and of Arcadia Resources Inc. (health care services and products, 2007-2012).
Cornelia M. Small (1944)
Year of Election or Appointment: 2005
Trustee
Ms. Small also serves as Trustee of other Fidelity® funds. Ms. Small is a member of the Board of Directors (2009-present) and Chair of the Investment Committee (2010-present) of the Teagle Foundation. Ms. Small also serves on the Investment Committee of the Berkshire Taconic Community Foundation (2008-present). Previously, Ms. Small served as Chairperson (2002-2008) and a member of the Investment Committee and Chairperson (2008-2012) and a member of the Board of Trustees of Smith College. In addition, Ms. Small served as Chief Investment Officer, Director of Global Equity Investments, and a member of the Board of Directors of Scudder, Stevens & Clark and Scudder Kemper Investments.
Garnett A. Smith (1947)
Year of Election or Appointment: 2018
Trustee
Mr. Smith also serves as Trustee of other Fidelity® funds. Prior to Mr. Smith's retirement, he served as Chairman and Chief Executive Officer of Inbrand Corp. (manufacturer of personal absorbent products, 1990-1997). He also served as President (1986-1990) of Inbrand Corp. Prior to his employment with Inbrand Corp., he was employed by a retail fabric chain and North Carolina National Bank. In addition, Mr. Smith served as a Member of the Advisory Board of certain Fidelity® funds (2012-2013) and as a board member of the Jackson Hole Land Trust (2009-2012).
David M. Thomas (1949)
Year of Election or Appointment: 2008
Trustee
Mr. Thomas also serves as Trustee of other Fidelity® funds. Mr. Thomas serves as Non-Executive Chairman of the Board of Directors of Fortune Brands Home and Security (home and security products, 2011-present), as a member of the Board of Directors (2004-present) and Presiding Director (2013-present) of Interpublic Group of Companies, Inc. (marketing communication), and as a member of the Board of Trustees of the University of Florida (2013-present). Previously, Mr. Thomas served as Executive Chairman (2005-2006) and Chairman and Chief Executive Officer (2000-2005) of IMS Health, Inc. (pharmaceutical and healthcare information solutions), and a Director of Fortune Brands, Inc. (consumer products, 2000-2011).
+ The information includes the Trustee's principal occupation during the last five years and other information relating to the experience, attributes, and skills relevant to the Trustee's qualifications to serve as a Trustee, which led to the conclusion that the Trustee should serve as a Trustee for the fund.
Advisory Board Members and Officers:
Correspondence intended for a Member of the Advisory Board (if any) may be sent to Fidelity Investments, P.O. Box 55235, Boston, Massachusetts 02205-5235. Correspondence intended for an officer or Peter S. Lynch may be sent to Fidelity Investments, 245 Summer Street, Boston, Massachusetts 02210. Officers appear below in alphabetical order.
Name, Year of Birth; Principal Occupation
Peter S. Lynch (1944)
Year of Election or Appointment: 2003
Member of the Advisory Board
Mr. Lynch also serves as Member of the Advisory Board of other Fidelity® funds. Mr. Lynch is Vice Chairman and a Director of FMR (investment adviser firm) and FMR Co., Inc. (investment adviser firm). In addition, Mr. Lynch serves as a Trustee of Boston College and as the Chairman of the Inner-City Scholarship Fund. Previously, Mr. Lynch served on the Special Olympics International Board of Directors (1997-2006).
William S. Stavropoulos (1939)
Year of Election or Appointment: 2018
Member of the Advisory Board
Mr. Stavropoulos also serves as Member of the Advisory Board of other Fidelity® funds. Mr. Stavropoulos serves as President and Founder of the Michigan Baseball Foundation, the Great Lakes Loons (2007-present). Mr. Stavropoulos is Chairman Emeritus of the Board of Directors of The Dow Chemical Company, where he previously served in numerous senior management positions, including President, CEO (1995-2000; 2002-2004), Chairman of the Executive Committee (2000-2006), and as a member of the Board of Directors (1990-2006). Currently, Mr. Stavropoulos is Chairman of the Board of Directors of Univar Inc. (global distributor of commodity and specialty chemicals), a Director of Teradata Corporation (data warehousing and technology solutions), and a member of the Advisory Board for Metalmark Capital LLC (private equity investment, 2005-present). Mr. Stavropoulos is an operating advisor to Clayton, Dubilier & Rice, LLC (private equity investment). In addition, Mr. Stavropoulos is a member of the University of Notre Dame Advisory Council for the College of Science, a Trustee of the Rollin L. Gerstacker Foundation, and a Director of Artis-Naples in Naples, Florida. Previously, Mr. Stavropoulos served as Trustee of certain Fidelity® funds (2001-2018) and as a Director of Chemical Financial Corporation (bank holding company, 1993-2012) and Tyco International, Ltd. (multinational manufacturing and services, 2007-2012).
Carol B. Tomé (1957)
Year of Election or Appointment: 2018
Member of the Advisory Board
Ms. Tomé also serves as Member of the Advisory Board of other Fidelity® funds. Ms. Tomé is Chief Financial Officer (2001-present) and Executive Vice President of Corporate Services (2007-present) of The Home Depot, Inc. (home improvement retailer) and a Director (2003-present) and Chair of the Audit Committee (2004-present) of United Parcel Service, Inc. (package delivery and supply chain management). Previously, Ms. Tomé served as Trustee of certain Fidelity® funds (2017), Senior Vice President of Finance and Accounting/Treasurer (2000-2007) and Vice President and Treasurer (1995-2000) of The Home Depot, Inc. and Chair of the Board (2010-2012), Vice Chair of the Board (2009 and 2013), and a Director (2008-2013) of the Federal Reserve Bank of Atlanta. Ms. Tomé is also a director or trustee of many community and professional organizations.
Michael E. Wiley (1950)
Year of Election or Appointment: 2018
Member of the Advisory Board
Mr. Wiley also serves as Trustee or Member of the Advisory Board of other Fidelity® funds. Mr. Wiley serves as a Director of Andeavor Corporation (independent oil refiner and marketer, 2005-present), a Director of Andeavor Logistics LP (natural resources logistics, 2015-present), and a Director of Bill Barrett Corporation (exploration and production, 2005-present). In addition, Mr. Wiley also serves as a Director of Post Oak Bank (privately-held bank, 2004-present). Previously, Mr. Wiley served as a Trustee of other Fidelity® funds (2008-2013), as a Director of Asia Pacific Exploration Consolidated (international oil and gas exploration and production, 2008-2013), as a member of the Board of Trustees of the University of Tulsa (2000-2006; 2007-2010), as a Senior Energy Advisor of Katzenbach Partners, LLC (consulting, 2006-2007), as an Advisory Director of Riverstone Holdings (private investment), Chairman, President, and CEO of Baker Hughes, Inc. (oilfield services, 2000-2004), and as Director of Spinnaker Exploration Company (exploration and production, 2001-2005).
Elizabeth Paige Baumann (1968)
Year of Election or Appointment: 2017
Anti-Money Laundering (AML) Officer
Ms. Baumann also serves as AML Officer of other funds. She is Chief AML Officer (2012-present) and Senior Vice President (2014-present) of FMR LLC (diversified financial services company) and is an employee of Fidelity Investments. Previously, Ms. Baumann served as AML Officer of the funds (2012-2016), and Vice President (2007-2014) and Deputy Anti-Money Laundering Officer (2007-2012) of FMR LLC.
Marc R. Bryant (1966)
Year of Election or Appointment: 2015
Secretary and Chief Legal Officer (CLO)
Mr. Bryant also serves as Secretary and CLO of other funds. Mr. Bryant serves as CLO, Secretary, and Senior Vice President of Fidelity Management & Research Company (investment adviser firm, 2015-present) and FMR Co., Inc. (investment adviser firm, 2015-present); Secretary of Fidelity SelectCo, LLC (investment adviser firm, 2015-present) and Fidelity Investments Money Management, Inc. (investment adviser firm, 2015-present); and CLO of Fidelity Management & Research (Hong Kong) Limited and FMR Investment Management (UK) Limited (investment adviser firms, 2015-present) and Fidelity Management & Research (Japan) Limited (investment adviser firm, 2016-present). He is Senior Vice President and Deputy General Counsel of FMR LLC (diversified financial services company). Previously, Mr. Bryant served as Secretary and CLO of Fidelity Rutland Square Trust II (2010-2014) and Assistant Secretary of Fidelity's Fixed Income and Asset Allocation Funds (2013-2015). Prior to joining Fidelity Investments, Mr. Bryant served as a Senior Vice President and the Head of Global Retail Legal for AllianceBernstein L.P. (2006-2010), and as the General Counsel for ProFund Advisors LLC (2001-2006).
John J. Burke III (1964)
Year of Election or Appointment: 2018
Chief Financial Officer
Mr. Burke also serves as Chief Financial Officer of other funds. Mr. Burke serves as Head of Investment Operations for Fidelity Fund and Investment Operations (2018-present) and is an employee of Fidelity Investments (1998-present). Previously Mr. Burke served as head of Asset Management Investment Operations (2012-2018).
William C. Coffey (1969)
Year of Election or Appointment: 2009
Assistant Secretary
Mr. Coffey also serves as Assistant Secretary of other funds. He is Senior Vice President and Deputy General Counsel of FMR LLC (diversified financial services company, 2010-present), and is an employee of Fidelity Investments. Previously, Mr. Coffey served as Vice President and Associate General Counsel of FMR LLC (2005-2009).
Timothy M. Cohen (1969)
Year of Election or Appointment: 2018
Vice President
Mr. Cohen also serves as Vice President of other funds. Mr. Cohen serves as Co-Head of Global Equity Research (2016-present), a Director of Fidelity Management & Research (Japan) Limited (investment adviser firm, 2016-present), and is an employee of Fidelity Investments. Previously, Mr. Cohen served as Chief Investment Officer - Equity and a Director of Fidelity Management & Research (U.K.) Inc. (investment adviser firm, 2013-2015) and as a Director of Fidelity Management & Research (Hong Kong) Limited (investment adviser firm, 2017).
Jonathan Davis (1968)
Year of Election or Appointment: 2010
Assistant Treasurer
Mr. Davis also serves as Assistant Treasurer of other funds. Mr. Davis serves as Assistant Treasurer of FMR Capital, Inc. (2017-present) and is an employee of Fidelity Investments. Previously, Mr. Davis served as Vice President and Associate General Counsel of FMR LLC (diversified financial services company, 2003-2010).
Adrien E. Deberghes (1967)
Year of Election or Appointment: 2016
Assistant Treasurer
Mr. Deberghes also serves as an officer of other funds. He serves as Assistant Treasurer of FMR Capital, Inc. (2017-present), Executive Vice President of Fidelity Investments Money Management, Inc. (FIMM) (investment adviser firm, 2016-present), and is an employee of Fidelity Investments (2008-present). Previously, Mr. Deberghes served as President and Treasurer of certain Fidelity® funds (2013-2018). Prior to joining Fidelity Investments, Mr. Deberghes was Senior Vice President of Mutual Fund Administration at State Street Corporation (2007-2008), Senior Director of Mutual Fund Administration at Investors Bank & Trust (2005-2007), and Director of Finance for Dunkin' Brands (2000-2005). Previously, Mr. Deberghes served in other fund officer roles.
Laura M. Del Prato (1964)
Year of Election or Appointment: 2018
Assistant Treasurer
Ms. Del Prato also serves as an officer of other funds. Ms. Del Prato is an employee of Fidelity Investments (2017-present). Prior to joining Fidelity Investments, Ms. Del Prato served as a Managing Director and Treasurer of the JPMorgan Mutual Funds (2014-2017). Prior to JPMorgan, Ms. Del Prato served as a partner at Cohen Fund Audit Services (accounting firm, 2012-2013) and KPMG LLP (accounting firm, 2004-2012).
Colm A. Hogan (1973)
Year of Election or Appointment: 2016
Deputy Treasurer
Mr. Hogan also serves as an officer of other funds. Mr. Hogan serves as Assistant Treasurer of FMR Capital, Inc. (2017-present) and is an employee of Fidelity Investments (2005-present). Previously, Mr. Hogan served as Assistant Treasurer of certain Fidelity® funds (2016-2018).
Pamela R. Holding (1964)
Year of Election or Appointment: 2018
Vice President
Ms. Holding also serves as a Vice President of other funds. Ms. Holding serves as Co-Head of Global Equity Research (2018-present) and is an employee of Fidelity Investments (2013-present).
Chris Maher (1972)
Year of Election or Appointment: 2013
Assistant Treasurer
Mr. Maher serves as Assistant Treasurer of other funds. Mr. Maher is Vice President of Valuation Oversight, serves as Assistant Treasurer of FMR Capital, Inc. (2017-present), and is an employee of Fidelity Investments. Previously, Mr. Maher served as Vice President of Asset Management Compliance (2013), Vice President of the Program Management Group of FMR (investment adviser firm, 2010-2013), and Vice President of Valuation Oversight (2008-2010).
Rieco E. Mello (1969)
Year of Election or Appointment: 2017
Assistant Treasurer
Mr. Mello also serves as Assistant Treasurer of other funds. Mr. Mello serves as Assistant Treasurer of FMR Capital, Inc. (2017-present) and is an employee of Fidelity Investments (1995-present).
Kenneth B. Robins (1969)
Year of Election or Appointment: 2016
Chief Compliance Officer
Mr. Robins also serves as an officer of other funds. Mr. Robins serves as Compliance Officer of Fidelity Management & Research Company and FMR Co., Inc. (investment adviser firms, 2016-present) and is an employee of Fidelity Investments (2004-present). Previously, Mr. Robins served as Executive Vice President of Fidelity Investments Money Management, Inc. (investment adviser firm, 2013-2016) and served in other fund officer roles.
Stacie M. Smith (1974)
Year of Election or Appointment: 2016
President and Treasurer
Ms. Smith also serves as an officer of other funds. Ms. Smith serves as Assistant Treasurer of FMR Capital, Inc. (2017-present), is an employee of Fidelity Investments (2009-present), and has served in other fund officer roles. Prior to joining Fidelity Investments, Ms. Smith served as Senior Audit Manager of Ernst & Young LLP (accounting firm, 1996-2009). Previously, Ms. Smith served as Assistant Treasurer (2013-2018) and Deputy Treasurer (2013-2016) of certain Fidelity® funds.
Marc L. Spector (1972)
Year of Election or Appointment: 2016
Assistant Treasurer
Mr. Spector also serves as an officer of other funds. Mr. Spector serves as Assistant Treasurer of FMR Capital, Inc. (2017-present) and is an employee of Fidelity Investments (2016-present). Prior to joining Fidelity Investments, Mr. Spector served as Director at the Siegfried Group (accounting firm, 2013-2016), and prior to Siegfried Group as audit senior manager at Deloitte & Touche (accounting firm, 2005-2013).
Renee Stagnone (1975)
Year of Election or Appointment: 2016
Assistant Treasurer
Ms. Stagnone also serves as an officer of other funds. Ms. Stagnone serves as Assistant Treasurer of FMR Capital, Inc. (2017-present) and is an employee of Fidelity Investments (1997-present). Previously, Ms. Stagnone served as Deputy Treasurer of certain Fidelity® funds (2013-2016).
Shareholder Expense Example
As a shareholder of the Fund, you incur two types of costs: (1) transaction costs and (2) ongoing costs, including management fees and other Fund expenses. This Example is intended to help you understand your ongoing costs (in dollars) of investing in the Fund and to compare these costs with the ongoing costs of investing in other mutual funds.
The Example is based on an investment of $1,000 invested at the beginning of the period and held for the entire period (February 1, 2018 to July 31, 2018).
Actual Expenses
The first line of the accompanying table provides information about actual account values and actual expenses. You may use the information in this line, together with the amount you invested, to estimate the expenses that you paid over the period. Simply divide your account value by $1,000.00 (for example, an $8,600 account value divided by $1,000.00 = 8.6), then multiply the result by the number in the first line under the heading entitled "Expenses Paid During Period" to estimate the expenses you paid on your account during this period. In addition, the Fund, as a shareholder in the underlying Fidelity Central Funds, will indirectly bear its pro-rata share of the fees and expenses incurred by the underlying Fidelity Central Funds. These fees and expenses are not included in the Fund's annualized expense ratio used to calculate the expense estimate in the table below.
Hypothetical Example for Comparison Purposes
The second line of the accompanying table provides information about hypothetical account values and hypothetical expenses based on the Fund's actual expense ratio and an assumed rate of return of 5% per year before expenses, which is not the Fund's actual return. The hypothetical account values and expenses may not be used to estimate the actual ending account balance or expenses you paid for the period. You may use this information to compare the ongoing costs of investing in the Fund and other funds. To do so, compare this 5% hypothetical example with the 5% hypothetical examples that appear in the shareholder reports of the other funds. In addition, the Fund, as a shareholder in the underlying Fidelity Central Funds, will indirectly bear its pro-rata share of the fees and expenses incurred by the underlying Fidelity Central Funds. These fees and expenses are not included in the Fund's annualized expense ratio used to calculate the expense estimate in the table below.
Please note that the expenses shown in the table are meant to highlight your ongoing costs only and do not reflect any transaction costs. Therefore, the second line of the table is useful in comparing ongoing costs only, and will not help you determine the relative total costs of owning different funds.
| | Annualized Expense Ratio-A | Beginning
Account Value
February 1, 2018 | Ending
Account Value
July 31, 2018 | Expenses Paid
During Period-B
February 1, 2018
to July 31, 2018 |
| Actual | .45% | $1,000.00 | $1,031.50 | $2.27 |
| Hypothetical-C | | $1,000.00 | $1,022.56 | $2.26 |
A Annualized expense ratio reflects expenses net of applicable fee waivers.
B Expenses are equal to the Fund's annualized expense ratio, multiplied by the average account value over the period, multiplied by 181/365 (to reflect the one-half year period).
C 5% return per year before expenses
Distributions (Unaudited)
The fund designates 100% of the dividend distributed during the fiscal year as qualifying for the dividends–received deduction for corporate shareholders.
The fund designates 100% of the dividend distributed during the fiscal year as an amount which may be taken into account as a dividend for the purposes of the maximum rate under section 1(h)(11) of the Internal Revenue Code.
The fund will notify shareholders in January 2019 of amounts for use in preparing 2018 income tax returns.
Board Approval of Investment Advisory Contracts
Fidelity Blue Chip Growth K6 Fund
At its July 2018 meeting, the Board of Trustees, including the Independent Trustees (together, the Board), voted to continue the management contract with Fidelity Management & Research Company (FMR) and the sub-advisory agreements (together, the Advisory Contracts) for the fund for six months through January 31, 2019, in connection with the reunification of the Fidelity Equity High Income Funds Board, which oversees the fund, and the Sector Portfolios Board.
The Board considered that the approval of the fund's Advisory Contracts will not result in any changes in (i) the investment process or strategies employed in the management of the fund's assets; (ii) the fees and expenses paid by shareholders; (iii) the nature, extent or quality of services provided under the fund's Advisory Contracts; or (iv) the day-to-day management of the fund or the persons primarily responsible for such management. The Board concluded that the fund's Advisory Contracts are fair and reasonable, and that the fund's Advisory Contracts should be renewed, without modification, through January 31, 2019, with the understanding that the Board will consider the annual renewal for a full one year period in January 2019.
In connection with its consideration of future renewals of the fund's Advisory Contracts, the Board will consider: (i) the nature, extent and quality of services provided to the fund, including shareholder and administrative services and investment performance; (ii) the competitiveness of the management fee and total expenses for the fund; (iii) the costs of the services and profitability, including the revenues earned and the expenses incurred in conducting the business of developing, marketing, distributing, managing, administering, and servicing the fund and its shareholders, to the extent applicable, as well as potential fall-out benefits from Fidelity's non-fund businesses; and (iv) whether there have been economies of scale in respect of the Fidelity funds, whether the Fidelity funds (including the fund) have appropriately benefited from any such economies of scale, and whether there is the potential for realization of any further economies.
Based on its evaluation of all of the conclusions noted above, and after considering all factors it believed relevant, the Board ultimately concluded that the fund's management fee structure is fair and reasonable, and that the continuation of the fund's Advisory Contracts should be approved.
Corporate Headquarters
245 Summer St.
Boston, MA 02210
www.fidelity.com
BCFK6-ANN-0918
1.9884007.101
Fidelity® Small Cap Growth K6 Fund
Annual Report July 31, 2018 |
|
Contents
To view a fund's proxy voting guidelines and proxy voting record for the 12-month period ended June 30, visit http://www.fidelity.com/proxyvotingresults or visit the Securities and Exchange Commission's (SEC) web site at http://www.sec.gov.
You may also call 1-800-835-5092 to request a free copy of the proxy voting guidelines.
Standard & Poor's, S&P and S&P 500 are registered service marks of The McGraw-Hill Companies, Inc. and have been licensed for use by Fidelity Distributors Corporation.
Other third-party marks appearing herein are the property of their respective owners.
All other marks appearing herein are registered or unregistered trademarks or service marks of FMR LLC or an affiliated company. © 2018 FMR LLC. All rights reserved.
This report and the financial statements contained herein are submitted for the general information of the shareholders of the Fund. This report is not authorized for distribution to prospective investors in the Fund unless preceded or accompanied by an effective prospectus.
A fund files its complete schedule of portfolio holdings with the SEC for the first and third quarters of each fiscal year on Form N-Q. Forms N-Q are available on the SEC’s web site at http://www.sec.gov. A fund's Forms N-Q may be reviewed and copied at the SEC’s Public Reference Room in Washington, DC. Information regarding the operation of the SEC's Public Reference Room may be obtained by calling 1-800-SEC-0330.
For a complete list of a fund's portfolio holdings, view the most recent holdings listing, semiannual report, or annual report on Fidelity's web site at http://www.fidelity.com, http://www.institutional.fidelity.com, or http://www.401k.com, as applicable.
NOT FDIC INSURED •MAY LOSE VALUE •NO BANK GUARANTEE
Neither the Fund nor Fidelity Distributors Corporation is a bank.
Performance: The Bottom Line
Average annual total return reflects the change in the value of an investment, assuming reinvestment of distributions from dividend income and capital gains (the profits earned upon the sale of securities that have grown in value, if any) and assuming a constant rate of performance each year. The hypothetical investment and the average annual total returns do not reflect the deduction of taxes that a shareholder would pay on fund distributions or the redemption of fund shares. During periods of reimbursement by Fidelity, a fund’s total return will be greater than it would be had the reimbursement not occurred. How a fund did yesterday is no guarantee of how it will do tomorrow.
Average Annual Total Returns
| For the periods ended July 31, 2018 | Past 1 year | Life of fundA |
| Fidelity® Small Cap Growth K6 Fund | 28.72% | 28.16% |
A From May 25, 2017
$10,000 Over Life of Fund
Let's say hypothetically that $10,000 was invested in Fidelity® Small Cap Growth K6 Fund on May 25, 2017, when the fund started.
The chart shows how the value of your investment would have changed, and also shows how the Russell 2000® Growth Index performed over the same period.
| Period Ending Values |
| $13,413 | Fidelity® Small Cap Growth K6 Fund |
| $12,727 | Russell 2000® Growth Index |
Management's Discussion of Fund Performance
Market Recap: The U.S. equity bellwether S&P 500
® index gained 16.24% for the 12 months ending July 31, 2018, despite a resurgence in volatility that challenged the multiyear bull market. Stocks maintained their steady growth until a sharp reversal in February, as volatility spiked amid fear that rising inflation and the potential for the economy to overheat would prompt the U.S. Federal Reserve to pick up the pace of interest rate hikes. The index posted its first negative monthly result since October 2016, and then lost further ground in March on fear of a global trade war. The market stabilized in April and turned upward through mid-June, when escalating trade tension between the U.S. and China soured investor sentiment. The resulting uncertainty lingered into July, but strong corporate earnings helped the S&P 500 rise 3.72% that month to cap the period. For the full one-year period, growth handily topped value, while small-caps bested large-caps. By sector, information technology (+28%) led the way, boosted by strong earnings growth from several major index constituents. Consumer discretionary rose roughly 24%, driven by retailers (+49%). Energy (+20%) gained alongside higher oil prices. Laggards were telecommunication services (-2%), consumer staples (0%) and utilities (+3%), defensive groups that struggled amid rising interest rates and a general preference for risk. Real estate (+5%) fared a bit better but still lagged, as did financials, industrials, health care (each up 13%) and materials (+11%).
Comments from Portfolio Manager Patrick Venanzi: For the fiscal year, the fund advanced 28.72%, outpacing the 22.91% gain of the benchmark Russell 2000
® Growth Index. Versus the benchmark, picks in the information technology sector’s software & services industry helped fund performance the most. Our biggest individual contributor was Stamps.com, one of the fund’s largest holdings. Shares of the internet-based shipping-services provider gained 76% on the back of consecutive quarters of stellar financial results. AnaptysBio, which we added to the fund early in the period, also lifted relative results. Shares of this clinical-stage biotech popped in October, after phase-2 trials suggested that its eczema drug outperformed rival offerings from two competitors. The firm also announced positive results from multiple trials of its treatment for atopic dermatitis – a drug also being targeted to treat peanut allergies and asthma. Our stock picks in consumer discretionary and industrials also materially contributed. Conversely, choices in the health care equipment & services industry hurt, including Medicaid-related managed-care firm Magellan Health. Shares of Magellan plunged in late April on disappointing financial results. The company also lowered its full-year guidance. Cotiviti Holdings was also a sizable detractor, and we sold off this position during the period.
The views expressed above reflect those of the portfolio manager(s) only through the end of the period as stated on the cover of this report and do not necessarily represent the views of Fidelity or any other person in the Fidelity organization. Any such views are subject to change at any time based upon market or other conditions and Fidelity disclaims any responsibility to update such views. These views may not be relied on as investment advice and, because investment decisions for a Fidelity fund are based on numerous factors, may not be relied on as an indication of trading intent on behalf of any Fidelity fund.
Note to Shareholders: Following a three-month leave of absence, Patrick Venanzi returned to Fidelity on August 30, 2018, and resumed his day-to-day responsibilities as Portfolio Manager. In his stead, Jennifer Fo Cardillo and Slava Kruzement-Prykhodko served as interim managers of the fund.
Investment Summary (Unaudited)
Top Ten Stocks as of July 31, 2018
| | % of fund's net assets |
| CarGurus, Inc. Class A | 2.6 |
| Stamps.com, Inc. | 1.8 |
| 2U, Inc. | 1.6 |
| Weight Watchers International, Inc. | 1.5 |
| Asgn, Inc. | 1.4 |
| Generac Holdings, Inc. | 1.4 |
| Vail Resorts, Inc. | 1.2 |
| Cavco Industries, Inc. | 1.2 |
| Copart, Inc. | 1.2 |
| Entegris, Inc. | 1.1 |
| | 15.0 |
Top Five Market Sectors as of July 31, 2018
| | % of fund's net assets |
| Health Care | 22.6 |
| Information Technology | 22.2 |
| Industrials | 18.5 |
| Consumer Discretionary | 15.6 |
| Financials | 5.9 |
Asset Allocation (% of fund's net assets)
| As of July 31, 2018* |
| | Stocks/ETFs | 97.9% |
| | Convertible Securities | 0.2% |
| | Short-Term Investments and Net Other Assets (Liabilities) | 1.9% |

* Foreign investments – 7.7%
Schedule of Investments July 31, 2018
Showing Percentage of Net Assets
| Common Stocks - 94.3% | | | |
| | | Shares | Value |
| CONSUMER DISCRETIONARY - 15.6% | | | |
| Auto Components - 0.7% | | | |
| Gentex Corp. | | 174,600 | $4,050,720 |
| Diversified Consumer Services - 3.1% | | | |
| Bright Horizons Family Solutions, Inc. (a) | | 36,473 | 3,902,246 |
| Grand Canyon Education, Inc. (a) | | 41,854 | 4,877,247 |
| Weight Watchers International, Inc. (a) | | 95,519 | 8,551,816 |
| | | | 17,331,309 |
| Hotels, Restaurants & Leisure - 5.2% | | | |
| Boyd Gaming Corp. | | 73,914 | 2,760,688 |
| Cedar Fair LP (depositary unit) | | 60,130 | 3,435,828 |
| Hilton Grand Vacations, Inc. (a) | | 92,224 | 3,190,028 |
| Marriott Vacations Worldwide Corp. | | 15,753 | 1,876,340 |
| Planet Fitness, Inc. (a) | | 119,100 | 5,659,632 |
| Texas Roadhouse, Inc. Class A | | 45,166 | 2,838,231 |
| U.S. Foods Holding Corp. (a) | | 84,946 | 2,872,024 |
| Vail Resorts, Inc. | | 24,751 | 6,852,809 |
| | | | 29,485,580 |
| Household Durables - 3.1% | | | |
| Cavco Industries, Inc. (a) | | 30,990 | 6,583,826 |
| LGI Homes, Inc. (a)(b) | | 50,136 | 2,591,530 |
| SodaStream International Ltd. (a) | | 42,178 | 3,682,139 |
| Taylor Morrison Home Corp. (a) | | 113,758 | 2,221,694 |
| TopBuild Corp. (a) | | 34,799 | 2,584,870 |
| | | | 17,664,059 |
| Internet & Direct Marketing Retail - 0.4% | | | |
| Gaia, Inc. Class A (a) | | 128,744 | 2,343,141 |
| Multiline Retail - 0.5% | | | |
| Ollie's Bargain Outlet Holdings, Inc. (a) | | 36,976 | 2,569,832 |
| Specialty Retail - 1.7% | | | |
| Five Below, Inc. (a) | | 59,100 | 5,742,156 |
| The Children's Place Retail Stores, Inc. | | 30,014 | 3,688,721 |
| | | | 9,430,877 |
| Textiles, Apparel & Luxury Goods - 0.9% | | | |
| Cadence Bancorp | | 120,900 | 3,292,107 |
| Columbia Sportswear Co. | | 22,072 | 1,919,823 |
| | | | 5,211,930 |
|
| TOTAL CONSUMER DISCRETIONARY | | | 88,087,448 |
|
| CONSUMER STAPLES - 2.5% | | | |
| Food & Staples Retailing - 0.7% | | | |
| Performance Food Group Co. (a) | | 108,500 | 3,889,725 |
| Food Products - 1.1% | | | |
| Nomad Foods Ltd. (a) | | 149,449 | 2,839,531 |
| Post Holdings, Inc. (a) | | 37,437 | 3,240,547 |
| | | | 6,080,078 |
| Household Products - 0.7% | | | |
| Central Garden & Pet Co. (a) | | 51,835 | 2,237,717 |
| Central Garden & Pet Co. Class A (non-vtg.) (a) | | 49,950 | 2,003,994 |
| | | | 4,241,711 |
|
| TOTAL CONSUMER STAPLES | | | 14,211,514 |
|
| ENERGY - 1.6% | | | |
| Energy Equipment & Services - 0.3% | | | |
| NCS Multistage Holdings, Inc. (a) | | 116,413 | 1,846,310 |
| Oil, Gas & Consumable Fuels - 1.3% | | | |
| Delek U.S. Holdings, Inc. | | 65,125 | 3,472,465 |
| Extraction Oil & Gas, Inc. (a) | | 123,322 | 1,864,629 |
| Whiting Petroleum Corp. (a) | | 34,800 | 1,727,820 |
| | | | 7,064,914 |
|
| TOTAL ENERGY | | | 8,911,224 |
|
| FINANCIALS - 5.9% | | | |
| Banks - 0.8% | | | |
| First Citizen Bancshares, Inc. | | 10,890 | 4,430,270 |
| Capital Markets - 3.8% | | | |
| Apollo Global Management LLC Class A | | 131,222 | 4,658,381 |
| Hamilton Lane, Inc. Class A | | 62,000 | 3,036,140 |
| Lazard Ltd. Class A | | 43,404 | 2,356,837 |
| LPL Financial | | 42,900 | 2,843,841 |
| Morningstar, Inc. | | 20,500 | 2,706,000 |
| MSCI, Inc. | | 22,685 | 3,770,020 |
| Virtu Financial, Inc. Class A | | 105,400 | 2,123,810 |
| | | | 21,495,029 |
| Consumer Finance - 0.6% | | | |
| Green Dot Corp. Class A (a) | | 44,900 | 3,561,468 |
| Insurance - 0.7% | | | |
| Enstar Group Ltd. (a) | | 17,998 | 3,891,168 |
|
| TOTAL FINANCIALS | | | 33,377,935 |
|
| HEALTH CARE - 22.6% | | | |
| Biotechnology - 7.7% | | | |
| Abeona Therapeutics, Inc. (a)(b) | | 84,119 | 1,215,520 |
| Acceleron Pharma, Inc. (a) | | 45,188 | 1,968,389 |
| Acorda Therapeutics, Inc. (a) | | 35,240 | 879,238 |
| Alder Biopharmaceuticals, Inc. (a) | | 93,511 | 1,772,033 |
| AnaptysBio, Inc. (a) | | 21,869 | 1,712,780 |
| Arena Pharmaceuticals, Inc. (a) | | 33,571 | 1,295,505 |
| Argenx SE ADR (a) | | 19,677 | 1,785,688 |
| Ascendis Pharma A/S sponsored ADR (a) | | 47,924 | 3,255,957 |
| Atara Biotherapeutics, Inc. (a) | | 38,575 | 1,448,491 |
| Audentes Therapeutics, Inc. (a) | | 66,426 | 2,500,939 |
| Blueprint Medicines Corp. (a) | | 34,041 | 2,026,801 |
| FibroGen, Inc. (a) | | 65,928 | 4,160,057 |
| Five Prime Therapeutics, Inc. (a) | | 26,906 | 400,899 |
| Global Blood Therapeutics, Inc. (a) | | 51,169 | 2,138,864 |
| Heron Therapeutics, Inc. (a) | | 44,180 | 1,654,541 |
| Ligand Pharmaceuticals, Inc. Class B (a) | | 11,835 | 2,583,936 |
| Loxo Oncology, Inc. (a) | | 21,786 | 3,651,116 |
| Mirati Therapeutics, Inc. (a) | | 59,245 | 3,637,643 |
| Sarepta Therapeutics, Inc. (a) | | 29,680 | 3,450,003 |
| Spark Therapeutics, Inc. (a) | | 22,600 | 1,733,872 |
| TESARO, Inc. (a) | | 8,284 | 288,532 |
| | | | 43,560,804 |
| Health Care Equipment & Supplies - 7.7% | | | |
| Cantel Medical Corp. | | 24,670 | 2,287,156 |
| CONMED Corp. | | 31,500 | 2,331,000 |
| Globus Medical, Inc. (a) | | 101,500 | 5,225,220 |
| Hill-Rom Holdings, Inc. | | 40,800 | 3,843,360 |
| ICU Medical, Inc. (a) | | 12,562 | 3,602,782 |
| Insulet Corp. (a) | | 53,462 | 4,445,900 |
| Integer Holdings Corp. (a) | | 26,600 | 1,900,570 |
| Integra LifeSciences Holdings Corp. (a) | | 85,303 | 5,316,936 |
| iRhythm Technologies, Inc. (a) | | 53,980 | 4,078,189 |
| Masimo Corp. (a) | | 55,800 | 5,547,636 |
| Novocure Ltd. (a) | | 90,709 | 3,084,106 |
| Quanterix Corp. (a) | | 92,994 | 1,393,980 |
| | | | 43,056,835 |
| Health Care Providers & Services - 3.5% | | | |
| Chemed Corp. | | 12,400 | 3,918,772 |
| G1 Therapeutics, Inc. (a) | | 61,963 | 3,181,800 |
| Magellan Health Services, Inc. (a) | | 65,050 | 4,732,388 |
| Molina Healthcare, Inc. (a) | | 49,662 | 5,169,318 |
| Tivity Health, Inc. (a) | | 75,197 | 2,534,139 |
| | | | 19,536,417 |
| Health Care Technology - 0.8% | | | |
| HTG Molecular Diagnostics (a) | | 98,390 | 287,299 |
| Teladoc, Inc. (a)(b) | | 72,400 | 4,333,140 |
| | | | 4,620,439 |
| Life Sciences Tools & Services - 1.3% | | | |
| ICON PLC (a) | | 40,569 | 5,645,582 |
| Morphosys AG (a) | | 11,300 | 1,485,215 |
| | | | 7,130,797 |
| Pharmaceuticals - 1.6% | | | |
| Aclaris Therapeutics, Inc. (a) | | 69,966 | 1,199,217 |
| Aerie Pharmaceuticals, Inc. (a) | | 37,757 | 2,550,485 |
| Akcea Therapeutics, Inc. (b) | | 41,603 | 1,315,487 |
| Nektar Therapeutics (a) | | 39,737 | 2,090,166 |
| The Medicines Company (a) | | 41,427 | 1,645,895 |
| Theravance Biopharma, Inc. (a) | | 17,568 | 420,754 |
| | | | 9,222,004 |
|
| TOTAL HEALTH CARE | | | 127,127,296 |
|
| INDUSTRIALS - 18.5% | | | |
| Aerospace & Defense - 2.7% | | | |
| BWX Technologies, Inc. | | 72,255 | 4,751,489 |
| HEICO Corp. Class A | | 82,547 | 5,344,918 |
| Teledyne Technologies, Inc. (a) | | 23,735 | 5,207,934 |
| | | | 15,304,341 |
| Air Freight & Logistics - 0.6% | | | |
| Atlas Air Worldwide Holdings, Inc. (a) | | 50,500 | 3,386,025 |
| Airlines - 1.1% | | | |
| SkyWest, Inc. | | 98,087 | 5,875,411 |
| Commercial Services & Supplies - 1.5% | | | |
| Copart, Inc. (a) | | 114,651 | 6,579,821 |
| Viad Corp. | | 34,942 | 2,005,671 |
| | | | 8,585,492 |
| Construction & Engineering - 2.0% | | | |
| Dycom Industries, Inc. (a) | | 54,038 | 4,818,028 |
| Jacobs Engineering Group, Inc. | | 92,486 | 6,254,828 |
| | | | 11,072,856 |
| Electrical Equipment - 1.4% | | | |
| Generac Holdings, Inc. (a) | | 148,253 | 7,968,599 |
| Industrial Conglomerates - 1.0% | | | |
| ITT, Inc. | | 102,199 | 5,791,617 |
| Machinery - 3.0% | | | |
| AGCO Corp. | | 42,063 | 2,650,810 |
| Allison Transmission Holdings, Inc. | | 44,945 | 2,112,415 |
| Gardner Denver Holdings, Inc. (a) | | 98,000 | 2,803,780 |
| John Bean Technologies Corp. | | 16,665 | 1,843,149 |
| Milacron Holdings Corp. (a) | | 139,685 | 2,912,432 |
| Oshkosh Corp. | | 28,528 | 2,146,732 |
| WABCO Holdings, Inc. (a) | | 17,501 | 2,199,526 |
| | | | 16,668,844 |
| Professional Services - 4.3% | | | |
| Asgn, Inc. (a) | | 88,780 | 8,016,834 |
| Exponent, Inc. | | 102,249 | 4,999,976 |
| FTI Consulting, Inc. (a) | | 77,403 | 6,111,741 |
| Insperity, Inc. | | 54,593 | 5,191,794 |
| | | | 24,320,345 |
| Trading Companies & Distributors - 0.9% | | | |
| SiteOne Landscape Supply, Inc. (a) | | 31,784 | 2,833,861 |
| Univar, Inc. (a) | | 87,383 | 2,402,159 |
| | | | 5,236,020 |
|
| TOTAL INDUSTRIALS | | | 104,209,550 |
|
| INFORMATION TECHNOLOGY - 22.0% | | | |
| Electronic Equipment & Components - 0.9% | | | |
| Dolby Laboratories, Inc. Class A | | 37,803 | 2,436,403 |
| Novanta, Inc. (a) | | 42,777 | 2,667,146 |
| | | | 5,103,549 |
| Internet Software & Services - 11.2% | | | |
| 2U, Inc. (a) | | 118,915 | 8,997,109 |
| ANGI Homeservices, Inc. Class A (a)(b) | | 173,205 | 2,721,051 |
| BlackLine, Inc. (a) | | 45,021 | 1,922,397 |
| CarGurus, Inc. Class A (b) | | 332,800 | 14,426,880 |
| Five9, Inc. (a) | | 106,559 | 3,399,232 |
| GoDaddy, Inc. (a) | | 75,316 | 5,544,764 |
| Instructure, Inc. (a) | | 49,901 | 1,931,169 |
| MINDBODY, Inc. (a) | | 95,404 | 3,563,339 |
| New Relic, Inc. (a) | | 29,354 | 2,867,886 |
| Okta, Inc. (a) | | 32,485 | 1,612,880 |
| ShotSpotter, Inc. (a)(b) | | 53,427 | 2,279,730 |
| Stamps.com, Inc. (a) | | 37,916 | 9,896,076 |
| The Trade Desk, Inc. (a) | | 47,200 | 3,979,904 |
| | | | 63,142,417 |
| IT Services - 2.4% | | | |
| EPAM Systems, Inc. (a) | | 41,125 | 5,354,886 |
| Genpact Ltd. | | 78,761 | 2,392,759 |
| Interxion Holding N.V. (a) | | 32,077 | 2,081,156 |
| Leidos Holdings, Inc. | | 53,212 | 3,640,765 |
| | | | 13,469,566 |
| Semiconductors & Semiconductor Equipment - 1.1% | | | |
| Entegris, Inc. | | 172,440 | 6,061,266 |
| Software - 6.4% | | | |
| 8x8, Inc. (a) | | 120,005 | 2,394,100 |
| Black Knight, Inc. (a) | | 53,620 | 2,769,473 |
| Cardlytics, Inc. (a) | | 232,944 | 4,384,006 |
| Everbridge, Inc. (a) | | 96,051 | 4,320,374 |
| HubSpot, Inc. (a) | | 33,200 | 4,120,120 |
| Pluralsight, Inc. | | 181,559 | 4,213,984 |
| PROS Holdings, Inc. (a) | | 80,411 | 2,986,465 |
| RealPage, Inc. (a) | | 65,400 | 3,603,540 |
| Talend SA ADR (a) | | 46,448 | 2,747,399 |
| Zendesk, Inc. (a) | | 59,386 | 3,234,755 |
| Zscaler, Inc. (a)(b) | | 34,919 | 1,232,990 |
| | | | 36,007,206 |
|
| TOTAL INFORMATION TECHNOLOGY | | | 123,784,004 |
|
| MATERIALS - 4.5% | | | |
| Chemicals - 1.7% | | | |
| Orion Engineered Carbons SA | | 133,967 | 4,394,118 |
| The Chemours Co. LLC | | 111,104 | 5,089,674 |
| | | | 9,483,792 |
| Construction Materials - 1.3% | | | |
| Eagle Materials, Inc. | | 40,119 | 3,985,823 |
| Summit Materials, Inc. | | 124,274 | 3,119,277 |
| | | | 7,105,100 |
| Containers & Packaging - 1.2% | | | |
| Aptargroup, Inc. | | 30,000 | 3,072,900 |
| Avery Dennison Corp. | | 30,265 | 3,470,790 |
| | | | 6,543,690 |
| Paper & Forest Products - 0.3% | | | |
| Neenah, Inc. | | 22,474 | 1,973,217 |
| Quintis Ltd. (a)(c) | | 547,553 | 4 |
| | | | 1,973,221 |
|
| TOTAL MATERIALS | | | 25,105,803 |
|
| REAL ESTATE - 1.1% | | | |
| Equity Real Estate Investment Trusts (REITs) - 1.1% | | | |
| Rexford Industrial Realty, Inc. | | 66,759 | 2,045,496 |
| Store Capital Corp. | | 71,877 | 1,973,024 |
| Terreno Realty Corp. | | 59,867 | 2,209,691 |
| | | | 6,228,211 |
| TOTAL COMMON STOCKS | | | |
| (Cost $471,009,069) | | | 531,042,985 |
|
| Convertible Preferred Stocks - 0.2% | | | |
| INFORMATION TECHNOLOGY - 0.2% | | | |
| Software - 0.2% | | | |
| Compass, Inc. Series E (c)(d) | | | |
| (Cost $1,124,254) | | 16,661 | 1,124,254 |
|
| Investment Companies - 3.6% | | | |
| iShares Russell 2000 Growth Index ETF (b) | | | |
| (Cost $20,298,962) | | 96,500 | 20,028,571 |
|
| Money Market Funds - 7.5% | | | |
| Fidelity Cash Central Fund, 1.96% (e) | | 7,065,286 | 7,066,699 |
| Fidelity Securities Lending Cash Central Fund 1.97% (e)(f) | | 35,119,673 | 35,123,185 |
| TOTAL MONEY MARKET FUNDS | | | |
| (Cost $42,189,884) | | | 42,189,884 |
| TOTAL INVESTMENT IN SECURITIES - 105.6% | | | |
| (Cost $534,622,169) | | | 594,385,694 |
| NET OTHER ASSETS (LIABILITIES) - (5.6)% | | | (31,568,414) |
| NET ASSETS - 100% | | | $562,817,280 |
Security Type Abbreviations
ETF – Exchange-Traded Fund
Legend
(a) Non-income producing
(b) Security or a portion of the security is on loan at period end.
(c) Level 3 security
(d) Restricted securities - Investment in securities not registered under the Securities Act of 1933 (excluding 144A issues). At the end of the period, the value of restricted securities (excluding 144A issues) amounted to $1,124,254 or 0.2% of net assets.
(e) Affiliated fund that is generally available only to investment companies and other accounts managed by Fidelity Investments. The rate quoted is the annualized seven-day yield of the fund at period end. A complete unaudited listing of the fund's holdings as of its most recent quarter end is available upon request. In addition, each Fidelity Central Fund's financial statements, which are not covered by the Fund's Report of Independent Registered Public Accounting Firm, are available on the SEC's website or upon request.
(f) Investment made with cash collateral received from securities on loan.
Additional information on each restricted holding is as follows:
| Security | Acquisition Date | Acquisition Cost |
| Compass, Inc. Series E | 11/3/17 | $1,124,254 |
Affiliated Central Funds
Information regarding fiscal year to date income earned by the Fund from investments in Fidelity Central Funds is as follows:
| Fund | Income earned |
| Fidelity Cash Central Fund | $146,993 |
| Fidelity Securities Lending Cash Central Fund | 159,500 |
| Total | $306,493 |
Amounts in the income column in the above table include any capital gain distributions from underlying funds, which are presented in the corresponding line-item in the Statement of Operations if applicable.
Investment Valuation
The following is a summary of the inputs used, as of July 31, 2018, involving the Fund's assets and liabilities carried at fair value. The inputs or methodology used for valuing securities may not be an indication of the risk associated with investing in those securities. For more information on valuation inputs, and their aggregation into the levels used below, please refer to the Investment Valuation section in the accompanying Notes to Financial Statements.
| | Valuation Inputs at Reporting Date: |
| Description | Total | Level 1 | Level 2 | Level 3 |
| Investments in Securities: | | | | |
| Equities: | | | | |
| Consumer Discretionary | $88,087,448 | $88,087,448 | $-- | $-- |
| Consumer Staples | 14,211,514 | 14,211,514 | -- | -- |
| Energy | 8,911,224 | 8,911,224 | -- | -- |
| Financials | 33,377,935 | 33,377,935 | -- | -- |
| Health Care | 127,127,296 | 127,127,296 | -- | -- |
| Industrials | 104,209,550 | 104,209,550 | -- | -- |
| Information Technology | 124,908,258 | 123,784,004 | -- | 1,124,254 |
| Materials | 25,105,803 | 25,105,799 | -- | 4 |
| Real Estate | 6,228,211 | 6,228,211 | -- | -- |
| Investment Companies | 20,028,571 | 20,028,571 | -- | -- |
| Money Market Funds | 42,189,884 | 42,189,884 | -- | -- |
| Total Investments in Securities: | $594,385,694 | $593,261,436 | $-- | $1,124,258 |
See accompanying notes which are an integral part of the financial statements.
Financial Statements
Statement of Assets and Liabilities
| | | July 31, 2018 |
| Assets | | |
Investment in securities, at value (including securities loaned of $35,390,053) — See accompanying schedule:
Unaffiliated issuers (cost $492,432,285) | $552,195,810 | |
| Fidelity Central Funds (cost $42,189,884) | 42,189,884 | |
| Total Investment in Securities (cost $534,622,169) | | $594,385,694 |
| Cash | | 1,731,132 |
| Receivable for investments sold | | 3,164,891 |
| Receivable for fund shares sold | | 742,413 |
| Dividends receivable | | 22,271 |
| Distributions receivable from Fidelity Central Funds | | 35,817 |
| Other receivables | | 14,600 |
| Total assets | | 600,096,818 |
| Liabilities | | |
| Payable for investments purchased | $1,145,634 | |
| Payable for fund shares redeemed | 728,787 | |
| Accrued management fee | 283,275 | |
| Collateral on securities loaned | 35,121,842 | |
| Total liabilities | | 37,279,538 |
| Net Assets | | $562,817,280 |
| Net Assets consist of: | | |
| Paid in capital | | $493,105,242 |
| Accumulated undistributed net realized gain (loss) on investments and foreign currency transactions | | 9,948,513 |
| Net unrealized appreciation (depreciation) on investments | | 59,763,525 |
| Net Assets, for 41,993,339 shares outstanding | | $562,817,280 |
| Net Asset Value, offering price and redemption price per share ($562,817,280 ÷ 41,993,339 shares) | | $13.40 |
See accompanying notes which are an integral part of the financial statements.
Statement of Operations
| | | Year ended July 31, 2018 |
| Investment Income | | |
| Dividends | | $1,379,185 |
| Income from Fidelity Central Funds (including $159,500 from security lending) | | 306,493 |
| Total income | | 1,685,678 |
| Expenses | | |
| Management fee | $1,896,380 | |
| Independent trustees' fees and expenses | 1,167 | |
| Commitment fees | 370 | |
| Total expenses before reductions | 1,897,917 | |
| Expense reductions | (36,176) | |
| Total expenses after reductions | | 1,861,741 |
| Net investment income (loss) | | (176,063) |
| Realized and Unrealized Gain (Loss) | | |
| Net realized gain (loss) on: | | |
| Investment securities: | | |
| Unaffiliated issuers | 10,324,178 | |
| Fidelity Central Funds | 1,343 | |
| Foreign currency transactions | 585 | |
| Total net realized gain (loss) | | 10,326,106 |
| Change in net unrealized appreciation (depreciation) on investment securities | | 59,820,458 |
| Net gain (loss) | | 70,146,564 |
| Net increase (decrease) in net assets resulting from operations | | $69,970,501 |
See accompanying notes which are an integral part of the financial statements.
Statement of Changes in Net Assets
| | Year ended July 31, 2018 | For the period
May 25, 2017 (commencement of operations) to July 31, 2017 |
| Increase (Decrease) in Net Assets | | |
| Operations | | |
| Net investment income (loss) | $(176,063) | $(1,752) |
| Net realized gain (loss) | 10,326,106 | 905 |
| Change in net unrealized appreciation (depreciation) | 59,820,458 | (56,933) |
| Net increase (decrease) in net assets resulting from operations | 69,970,501 | (57,780) |
| Distributions to shareholders from net investment income | (36,508) | – |
| Distributions to shareholders from net realized gain | (164,284) | – |
| Total distributions | (200,792) | – |
| Share transactions | | |
| Proceeds from sales of shares | 498,597,078 | 74,935,286 |
| Reinvestment of distributions | 200,792 | – |
| Cost of shares redeemed | (80,571,061) | (56,744) |
| Net increase (decrease) in net assets resulting from share transactions | 418,226,809 | 74,878,542 |
| Total increase (decrease) in net assets | 487,996,518 | 74,820,762 |
| Net Assets | | |
| Beginning of period | 74,820,762 | – |
| End of period | $562,817,280 | $74,820,762 |
| Other Information | | |
| Shares | | |
| Sold | 41,337,823 | 7,186,659 |
| Issued in reinvestment of distributions | 17,629 | – |
| Redeemed | (6,543,326) | (5,446) |
| Net increase (decrease) | 34,812,126 | 7,181,213 |
See accompanying notes which are an integral part of the financial statements.
Financial Highlights
Fidelity Small Cap Growth K6 Fund
| | | |
| Years ended July 31, | 2018 | 2017 A |
| Selected Per–Share Data | | |
| Net asset value, beginning of period | $10.42 | $10.00 |
| Income from Investment Operations | | |
| Net investment income (loss)B | (.01) | (.01) |
| Net realized and unrealized gain (loss) | 3.00 | .43 |
| Total from investment operations | 2.99 | .42 |
| Distributions from net investment income | –C | – |
| Distributions from net realized gain | (.01) | – |
| Total distributions | (.01) | – |
| Net asset value, end of period | $13.40 | $10.42 |
| Total ReturnD,E | 28.72% | 4.20% |
| Ratios to Average Net AssetsF,G | | |
| Expenses before reductions | .60% | .60%H |
| Expenses net of fee waivers, if any | .60% | .60%H |
| Expenses net of all reductions | .59% | .60%H |
| Net investment income (loss) | (.06)% | (.45)%H |
| Supplemental Data | | |
| Net assets, end of period (000 omitted) | $562,817 | $74,821 |
| Portfolio turnover rateI | 114%J | 79%J,K |
A For the period May 25, 2017 (commencement of operations) to July 31, 2017.
B Calculated based on average shares outstanding during the period.
C Amount represents less than $.005 per share.
D Total returns would have been lower if certain expenses had not been reduced during the applicable periods shown.
E Total returns for periods of less than one year are not annualized.
F Fees and expenses of any underlying Fidelity Central Funds are not included in the Fund's expense ratio. The Fund indirectly bears its proportionate share of the expenses of any underlying Fidelity Central Funds.
G Expense ratios reflect operating expenses of the Fund. Expenses before reductions do not reflect amounts reimbursed by the investment adviser or reductions from brokerage service arrangements or reductions from other expense offset arrangements and do not represent the amount paid by the Fund during periods when reimbursements or reductions occur. Expense ratios before reductions for start-up periods may not be representative of longer term operating periods. Expenses net of fee waivers reflect expenses after reimbursement by the investment adviser but prior to reductions from brokerage service arrangements or other expense offset arrangements. Expenses net of all reductions represent the net expenses paid by the Fund.
H Annualized
I Amount does not include the portfolio activity of any underlying Fidelity Central Funds.
J Portfolio turnover rate excludes securities received or delivered in-kind.
K Amount not annualized.
See accompanying notes which are an integral part of the financial statements.
Notes to Financial Statements
For the period ended July 31, 2018
1. Organization.
Fidelity Small Cap Growth K6 Fund (the Fund) is a fund of Fidelity Securities Fund (the Trust) and is authorized to issue an unlimited number of shares. Share transactions on the Statement of Changes in Net Assets may contain exchanges between affiliated funds. The Trust is registered under the Investment Company Act of 1940, as amended (the 1940 Act), as an open-end management investment company organized as a Massachusetts business trust. Shares generally are available only to employer-sponsored retirement plans that are recordkept by Fidelity, or to certain employer-sponsored retirement plans that are not recordkept by Fidelity. Effective the close of business on February 2, 2018, the Fund was closed to new accounts with certain exceptions.
2. Investments in Fidelity Central Funds.
The Fund invests in Fidelity Central Funds, which are open-end investment companies generally available only to other investment companies and accounts managed by the investment adviser and its affiliates. The Fund's Schedule of Investments lists each of the Fidelity Central Funds held as of period end, if any, as an investment of the Fund, but does not include the underlying holdings of each Fidelity Central Fund. As an Investing Fund, the Fund indirectly bears its proportionate share of the expenses of the underlying Fidelity Central Funds.
The Money Market Central Funds seek preservation of capital and current income and are managed by Fidelity Investments Money Management, Inc. (FIMM), an affiliate of the investment adviser. Annualized expenses of the Money Market Central Funds as of their most recent shareholder report date are less than .005%.
A complete unaudited list of holdings for each Fidelity Central Fund is available upon request or at the Securities and Exchange Commission (the SEC) website at www.sec.gov. In addition, the financial statements of the Fidelity Central Funds, which are not covered by the Fund's Report of Independent Registered Public Accounting Firm, are available on the SEC website or upon request.
3. Significant Accounting Policies.
The Fund is an investment company and applies the accounting and reporting guidance of the Financial Accounting Standards Board (FASB) Accounting Standards Codification Topic 946 Financial Services – Investments Companies. The financial statements have been prepared in conformity with accounting principles generally accepted in the United States of America (GAAP), which require management to make certain estimates and assumptions at the date of the financial statements. Actual results could differ from those estimates. Subsequent events, if any, through the date that the financial statements were issued have been evaluated in the preparation of the financial statements. The following summarizes the significant accounting policies of the Fund:
Investment Valuation. Investments are valued as of 4:00 p.m. Eastern time on the last calendar day of the period. The Board of Trustees (the Board) has delegated the day to day responsibility for the valuation of the Fund's investments to the Fair Value Committee (the Committee) established by the each Fund's investment adviser. In accordance with valuation policies and procedures approved by the Board, the Fund attempts to obtain prices from one or more third party pricing vendors or brokers to value its investments. When current market prices, quotations or currency exchange rates are not readily available or reliable, investments will be fair valued in good faith by the Committee, in accordance with procedures adopted by the Board. Factors used in determining fair value vary by investment type and may include market or investment specific events. The frequency with which these procedures are used cannot be predicted and they may be utilized to a significant extent. The Committee oversees the Fund's valuation policies and procedures and reports to the Board on the Committee's activities and fair value determinations. The Board monitors the appropriateness of the procedures used in valuing the Fund's investments and ratifies the fair value determinations of the Committee.
The Fund categorizes the inputs to valuation techniques used to value its investments into a disclosure hierarchy consisting of three levels as shown below:
- Level 1 – quoted prices in active markets for identical investments
- Level 2 – other significant observable inputs (including quoted prices for similar investments, interest rates, prepayment speeds, etc.)
- Level 3 – unobservable inputs (including the Fund's own assumptions based on the best information available)
Valuation techniques used to value the Fund's investments by major category are as follows:
Equity securities, including restricted securities, for which market quotations are readily available, are valued at the last reported sale price or official closing price as reported by a third party pricing vendor on the primary market or exchange on which they are traded and are categorized as Level 1 in the hierarchy. In the event there were no sales during the day or closing prices are not available, securities are valued at the last quoted bid price or may be valued using the last available price and are generally categorized as Level 2 in the hierarchy. For foreign equity securities, when market or security specific events arise, comparisons to the valuation of American Depositary Receipts (ADRs), futures contracts, Exchange-Traded Funds (ETFs) and certain indexes as well as quoted prices for similar securities may be used and would be categorized as Level 2 in the hierarchy. Utilizing these techniques may result in transfers between Level 1 and Level 2. For equity securities, including restricted securities, where observable inputs are limited, assumptions about market activity and risk are used and these securities may be categorized as Level 3 in the hierarchy.
ETFs are valued at their last sale price or official closing price as reported by a third party pricing vendor on the primary market or exchange on which they are traded and are categorized as Level 1 in the hierarchy. In the event there were no sales during the day but the exchange reports a closing bid level, ETFs are valued at the closing bid and would be categorized as Level 1 in the hierarchy. In the event there was no closing bid, ETFs may be valued by another method that the Board believes reflects fair value in accordance with the Board's fair value pricing policies and may be categorized as Level 2 in the hierarchy.
Investments in open-end mutual funds, including the Fidelity Central Funds, are valued at their closing net asset value (NAV) each business day and are categorized as Level 1 in the hierarchy.
Changes in valuation techniques may result in transfers in or out of an assigned level within the disclosure hierarchy. The aggregate value of investments by input level as of July 31, 2018 is included at the end of the Fund's Schedule of Investments.
Foreign Currency. The Fund may use foreign currency contracts to facilitate transactions in foreign-denominated securities. Gains and losses from these transactions may arise from changes in the value of the foreign currency or if the counterparties do not perform under the contracts' terms.
Foreign-denominated assets, including investment securities, and liabilities are translated into U.S. dollars at the exchange rates at period end. Purchases and sales of investment securities, income and dividends received and expenses denominated in foreign currencies are translated into U.S. dollars at the exchange rate in effect on the transaction date.
The effects of exchange rate fluctuations on investments are included with the net realized and unrealized gain (loss) on investment securities. Other foreign currency transactions resulting in realized and unrealized gain (loss) are disclosed separately.
Investment Transactions and Income. For financial reporting purposes, the Fund's investment holdings and NAV include trades executed through the end of the last business day of the period. The NAV per share for processing shareholder transactions is calculated as of the close of business of the New York Stock Exchange (NYSE), normally 4:00 p.m. Eastern time and includes trades executed through the end of the prior business day. Gains and losses on securities sold are determined on the basis of identified cost. Dividend income is recorded on the ex-dividend date, except for certain dividends from foreign securities where the ex-dividend date may have passed, which are recorded as soon as the Fund is informed of the ex-dividend date. Non-cash dividends included in dividend income, if any, are recorded at the fair market value of the securities received. Income and capital gain distributions from Fidelity Central Funds, if any, are recorded on the ex-dividend date. Certain distributions received by the Fund represent a return of capital or capital gain. The Fund determines the components of these distributions subsequent to the ex-dividend date, based upon receipt of tax filings or other correspondence relating to the underlying investment. These distributions are recorded as a reduction of cost of investments and/or as a realized gain.
Expenses. Expenses directly attributable to a fund are charged to that fund. Expenses attributable to more than one fund are allocated among the respective funds on the basis of relative net assets or other appropriate methods. Expense estimates are accrued in the period to which they relate and adjustments are made when actual amounts are known.
Income Tax Information and Distributions to Shareholders. Each year, the Fund intends to qualify as a regulated investment company under Subchapter M of the Internal Revenue Code, including distributing substantially all of its taxable income and realized gains. As a result, no provision for U.S. Federal income taxes is required. As of July 31, 2018, the Fund did not have any unrecognized tax benefits in the financial statements; nor is the Fund aware of any tax positions for which it is reasonably possible that the total amounts of unrecognized tax benefits will significantly change in the next twelve months. The Fund files a U.S. federal tax return, in addition to state and local tax returns as required. The Fund's federal income tax returns are subject to examination by the Internal Revenue Service (IRS) for a period of three fiscal years after they are filed. State and local tax returns may be subject to examination for an additional fiscal year depending on the jurisdiction. Foreign taxes are provided for based on the Fund's understanding of the tax rules and rates that exist in the foreign markets in which it invests.
Distributions are declared and recorded on the ex-dividend date. Income and capital gain distributions are determined in accordance with income tax regulations, which may differ from GAAP.
Capital accounts within the financial statements are adjusted for permanent book-tax differences. These adjustments have no impact on net assets or the results of operations. Capital accounts are not adjusted for temporary book-tax differences which will reverse in a subsequent period.
Book-tax differences are primarily due to foreign currency transactions, partnerships, net operating losses, passive foreign investment companies (PFIC), and losses deferred due to wash sales.
As of period end, the cost and unrealized appreciation (depreciation) in securities, and derivatives if applicable, for federal income tax purposes were as follows:
| Gross unrealized appreciation | $73,989,537 |
| Gross unrealized depreciation | (16,030,943) |
| Net unrealized appreciation (depreciation) | $57,958,594 |
| Tax Cost | $536,427,100 |
The tax-based components of distributable earnings as of period end were as follows:
| Undistributed ordinary income | $11,727,967 |
| Undistributed long-term capital gain | $25,479 |
| Net unrealized appreciation (depreciation) on securities and other investments | $57,958,594 |
The tax character of distributions paid was as follows:
| | July 31, 2018 |
| Ordinary Income | $182,538 |
| Long-term Capital Gains | 18,254 |
| Total | $200,792 |
Restricted Securities. The Fund may invest in securities that are subject to legal or contractual restrictions on resale. These securities generally may be resold in transactions exempt from registration or to the public if the securities are registered. Disposal of these securities may involve time-consuming negotiations and expense, and prompt sale at an acceptable price may be difficult. Information regarding restricted securities is included at the end of the Fund's Schedule of Investments.
4. Purchases and Sales of Investments.
Purchases and sales of securities, other than short-term securities and in-kind transactions, aggregated $649,669,273 and $337,681,565, respectively.
Exchanges In-Kind. Investments and cash, received in-kind through subscriptions totaled $99,242,172 in exchange for 8,140,978 shares of the Fund. The amount of in-kind exchanges is included in share transactions in the accompanying Statement of Changes in Net Assets. The Fund recognized no gain or loss for federal income tax purposes.
5. Fees and Other Transactions with Affiliates.
Management Fee. Fidelity Management & Research Company (the investment adviser) and its affiliates provide the Fund with investment management related services for which the Fund pays a monthly management fee that is based on an annual rate of .60% of average net assets. Under the management contract, the investment adviser or an affiliate pays all other expenses of the Fund, excluding fees and expenses of the independent Trustees, and certain miscellaneous expenses such as proxy and shareholder meeting expenses.
Brokerage Commissions. The Fund placed a portion of its portfolio transactions with brokerage firms which are affiliates of the investment adviser. Brokerage commissions are included in net realized gain (loss) and change in net unrealized appreciation (depreciation) in the Statement of Operations. The commissions paid to these affiliated firms were $18,031 for the period.
Interfund Trades. The Fund may purchase from or sell securities to other Fidelity Funds under procedures adopted by the Board. The procedures have been designed to ensure these interfund trades are executed in accordance with Rule 17a-7 of the 1940 Act. Interfund trades are included within the respective purchases and sales amounts shown in the Purchases and Sales of Investments note.
Prior Fiscal Year Exchanges In-Kind. During the prior period, an affiliated entity completed an exchange in-kind with the Fund. The affiliated entity delivered investments and cash valued at $74,384,639 in exchange for 7,131,797 shares of the Fund. The amount of in-kind exchanges is included in share transactions in the accompanying Statement of Changes in Net Assets. The Fund recognized no gain or loss for federal income tax purposes.
6. Committed Line of Credit.
The Fund participates with other funds managed by the investment adviser or an affiliate in a $4.25 billion credit facility (the "line of credit") to be utilized for temporary or emergency purposes to fund shareholder redemptions or for other short-term liquidity purposes. The Fund has agreed to pay commitment fees on its pro-rata portion of the line of credit, which amounted to $370 and is reflected in Commitment fees on the Statement of Operations. During the period, the Fund did not borrow on this line of credit.
7. Security Lending.
The Fund lends portfolio securities through a lending agent from time to time in order to earn additional income. For equity securities, a lending agent is used and may loan securities to certain qualified borrowers, including Fidelity Capital Markets (FCM), a broker-dealer affiliated with the Fund. On the settlement date of the loan, the Fund receives collateral (in the form of U.S. Treasury obligations, letters of credit and/or cash) against the loaned securities and maintains collateral in an amount not less than 100% of the market value of the loaned securities during the period of the loan. The market value of the loaned securities is determined at the close of business of the Fund and any additional required collateral is delivered to the Fund on the next business day. The Fund or borrower may terminate the loan at any time, and if the borrower defaults on its obligation to return the securities loaned because of insolvency or other reasons, the Fund may apply collateral received from the borrower against the obligation. The Fund may experience delays and costs in recovering the securities loaned. Any cash collateral received is invested in the Fidelity Securities Lending Cash Central Fund. The value of loaned securities and cash collateral at period end are disclosed on the Fund's Statement of Assets and Liabilities. The value of securities loaned to FCM at period end was $1,667,778. Security lending income represents the income earned on investing cash collateral, less rebates paid to borrowers and any lending agent fees associated with the loan, plus any premium payments received for lending certain types of securities. Security lending income is presented in the Statement of Operations as a component of income from Fidelity Central Funds, and includes $11,863 from securities loaned to FCM.
8. Expense Reductions.
Commissions paid to certain brokers with whom the investment adviser, or its affiliates, places trades on behalf of the Fund include an amount in addition to trade execution, which may be rebated back to the Fund to offset certain expenses. This amount totaled $35,272 for the period. In addition, through arrangements with the Fund's custodian, credits realized as a result of certain uninvested cash balances were used to reduce the Fund's expenses. During the period, these credits reduced the Fund's expenses by $904.
9. Other.
The Fund's organizational documents provide former and current trustees and officers with a limited indemnification against liabilities arising in connection with the performance of their duties to the Fund. In the normal course of business, the Fund may also enter into contracts that provide general indemnifications. The Fund's maximum exposure under these arrangements is unknown as this would be dependent on future claims that may be made against the Fund. The risk of material loss from such claims is considered remote.
Report of Independent Registered Public Accounting Firm
To the Board of Trustees of Fidelity Securities Fund and Shareholders of Fidelity Small Cap Growth K6 Fund:
Opinion on the Financial Statements
We have audited the accompanying statement of assets and liabilities, including the schedule of investments, of Fidelity Small Cap Growth K6 Fund (one of the funds constituting Fidelity Securities Fund, referred to hereafter as the “Fund”) as of July 31, 2018, the related statement of operations for the year ended July 31, 2018 and the statement of changes in net assets and the financial highlights for the year ended July 31, 2018 and for the period May 25, 2017 (commencement of operations) through July 31, 2017, including the related notes (collectively referred to as the “financial statements”). In our opinion, the financial statements present fairly, in all material respects, the financial position of the Fund as of July 31, 2018, the results of its operations for the year ended July 31, 2018, and the changes in its net assets and the financial highlights for the year ended July 31, 2018 and for the period May 25, 2017 (commencement of operations) through July 31, 2017 in conformity with accounting principles generally accepted in the United States of America.
Basis for Opinion
These financial statements are the responsibility of the Fund’s management. Our responsibility is to express an opinion on the Fund’s financial statements based on our audits. We are a public accounting firm registered with the Public Company Accounting Oversight Board (United States) (“PCAOB”) and are required to be independent with respect to the Fund in accordance with the U.S. federal securities laws and the applicable rules and regulations of the Securities and Exchange Commission and the PCAOB.
We conducted our audits of these financial statements in accordance with the standards of the PCAOB. Those standards require that we plan and perform the audit to obtain reasonable assurance about whether the financial statements are free of material misstatement, whether due to error or fraud.
Our audits included performing procedures to assess the risks of material misstatement of the financial statements, whether due to error or fraud, and performing procedures that respond to those risks. Such procedures included examining, on a test basis, evidence regarding the amounts and disclosures in the financial statements. Our audits also included evaluating the accounting principles used and significant estimates made by management, as well as evaluating the overall presentation of the financial statements. Our procedures included confirmation of securities owned as of July 31, 2018 by correspondence with the custodian and brokers; when replies were not received from brokers, we performed other auditing procedures. We believe that our audits provide a reasonable basis for our opinion.
PricewaterhouseCoopers LLP
Boston, Massachusetts
September 17, 2018
We have served as the auditor of one or more investment companies in the Fidelity group of funds since 1932.
Trustees and Officers
The Trustees, Members of the Advisory Board (if any), and officers of the trust and fund, as applicable, are listed below. The Board of Trustees governs the fund and is responsible for protecting the interests of shareholders. The Trustees are experienced executives who meet periodically throughout the year to oversee the fund's activities, review contractual arrangements with companies that provide services to the fund, oversee management of the risks associated with such activities and contractual arrangements, and review the fund's performance. Except for Jonathan Chiel, each of the Trustees oversees 286 funds. Mr. Chiel oversees 150 funds.
The Trustees hold office without limit in time except that (a) any Trustee may resign; (b) any Trustee may be removed by written instrument, signed by at least two-thirds of the number of Trustees prior to such removal; (c) any Trustee who requests to be retired or who has become incapacitated by illness or injury may be retired by written instrument signed by a majority of the other Trustees; and (d) any Trustee may be removed at any special meeting of shareholders by a two-thirds vote of the outstanding voting securities of the trust. Each Trustee who is not an interested person (as defined in the 1940 Act) of the trust and the fund is referred to herein as an Independent Trustee. Each Independent Trustee shall retire not later than the last day of the calendar year in which his or her 75th birthday occurs. The Independent Trustees may waive this mandatory retirement age policy with respect to individual Trustees. Officers and Advisory Board Members hold office without limit in time, except that any officer or Advisory Board Member may resign or may be removed by a vote of a majority of the Trustees at any regular meeting or any special meeting of the Trustees. Except as indicated, each individual has held the office shown or other offices in the same company for the past five years.
The fund’s Statement of Additional Information (SAI) includes more information about the Trustees. To request a free copy, call Fidelity at 1-800-835-5092.
Experience, Skills, Attributes, and Qualifications of the Trustees. The Governance and Nominating Committee has adopted a statement of policy that describes the experience, qualifications, attributes, and skills that are necessary and desirable for potential Independent Trustee candidates (Statement of Policy). The Board believes that each Trustee satisfied at the time he or she was initially elected or appointed a Trustee, and continues to satisfy, the standards contemplated by the Statement of Policy. The Governance and Nominating Committee also engages professional search firms to help identify potential Independent Trustee candidates who have the experience, qualifications, attributes, and skills consistent with the Statement of Policy. From time to time, additional criteria based on the composition and skills of the current Independent Trustees, as well as experience or skills that may be appropriate in light of future changes to board composition, business conditions, and regulatory or other developments, have also been considered by the professional search firms and the Governance and Nominating Committee. In addition, the Board takes into account the Trustees' commitment and participation in Board and committee meetings, as well as their leadership of standing and ad hoc committees throughout their tenure.
In determining that a particular Trustee was and continues to be qualified to serve as a Trustee, the Board has considered a variety of criteria, none of which, in isolation, was controlling. The Board believes that, collectively, the Trustees have balanced and diverse experience, qualifications, attributes, and skills, which allow the Board to operate effectively in governing the fund and protecting the interests of shareholders. Information about the specific experience, skills, attributes, and qualifications of each Trustee, which in each case led to the Board's conclusion that the Trustee should serve (or continue to serve) as a trustee of the fund, is provided below.
Board Structure and Oversight Function. James C. Curvey is an interested person and currently serves as Chairman. The Trustees have determined that an interested Chairman is appropriate and benefits shareholders because an interested Chairman has a personal and professional stake in the quality and continuity of services provided to the fund. Independent Trustees exercise their informed business judgment to appoint an individual of their choosing to serve as Chairman, regardless of whether the Trustee happens to be independent or a member of management. The Independent Trustees have determined that they can act independently and effectively without having an Independent Trustee serve as Chairman and that a key structural component for assuring that they are in a position to do so is for the Independent Trustees to constitute a substantial majority for the Board. The Independent Trustees also regularly meet in executive session. Ned C. Lautenbach serves as Chairman of the Independent Trustees and as such (i) acts as a liaison between the Independent Trustees and management with respect to matters important to the Independent Trustees and (ii) with management prepares agendas for Board meetings.
Fidelity® funds are overseen by different Boards of Trustees. The fund's Board oversees Fidelity's high income and certain equity funds, and other Boards oversee Fidelity's investment-grade bond, money market, asset allocation, and other equity funds. The asset allocation funds may invest in Fidelity® funds overseen by the fund's Board. The use of separate Boards, each with its own committee structure, allows the Trustees of each group of Fidelity® funds to focus on the unique issues of the funds they oversee, including common research, investment, and operational issues. On occasion, the separate Boards establish joint committees to address issues of overlapping consequences for the Fidelity® funds overseen by each Board.
The Trustees operate using a system of committees to facilitate the timely and efficient consideration of all matters of importance to the Trustees, the fund, and fund shareholders and to facilitate compliance with legal and regulatory requirements and oversight of the fund's activities and associated risks. The Board, acting through its committees, has charged FMR and its affiliates with (i) identifying events or circumstances the occurrence of which could have demonstrably adverse effects on the fund's business and/or reputation; (ii) implementing processes and controls to lessen the possibility that such events or circumstances occur or to mitigate the effects of such events or circumstances if they do occur; and (iii) creating and maintaining a system designed to evaluate continuously business and market conditions in order to facilitate the identification and implementation processes described in (i) and (ii) above. Because the day-to-day operations and activities of the fund are carried out by or through FMR, its affiliates, and other service providers, the fund's exposure to risks is mitigated but not eliminated by the processes overseen by the Trustees. While each of the Board's committees has responsibility for overseeing different aspects of the fund's activities, oversight is exercised primarily through the Operations, Audit, and Compliance Committees. In addition, the Independent Trustees have worked with Fidelity to enhance the Board's oversight of investment and financial risks, legal and regulatory risks, technology risks, and operational risks, including the development of additional risk reporting to the Board. Appropriate personnel, including but not limited to the fund's Chief Compliance Officer (CCO), FMR's internal auditor, the independent accountants, the fund's Treasurer and portfolio management personnel, make periodic reports to the Board's committees, as appropriate, including an annual review of Fidelity's risk management program for the Fidelity® funds. The responsibilities of each standing committee, including their oversight responsibilities, are described further under "Standing Committees of the Trustees."
Interested Trustees*:
Correspondence intended for a Trustee who is an interested person may be sent to Fidelity Investments, 245 Summer Street, Boston, Massachusetts 02210.
Name, Year of Birth; Principal Occupations and Other Relevant Experience+
Jonathan Chiel (1957)
Year of Election or Appointment: 2016
Trustee
Mr. Chiel also serves as Trustee of other Fidelity® funds. Mr. Chiel is Executive Vice President and General Counsel for FMR LLC (diversified financial services company, 2012-present). Previously, Mr. Chiel served as general counsel (2004-2012) and senior vice president and deputy general counsel (2000-2004) for John Hancock Financial Services; a partner with Choate, Hall & Stewart (1996-2000) (law firm); and an Assistant United States Attorney for the United States Attorney’s Office of the District of Massachusetts (1986-95), including Chief of the Criminal Division (1993-1995). Mr. Chiel is a director on the boards of the Boston Bar Foundation and the Maimonides School.
James C. Curvey (1935)
Year of Election or Appointment: 2007
Trustee
Chairman of the Board of Trustees
Mr. Curvey also serves as Trustee of other Fidelity® funds. Mr. Curvey is Vice Chairman (2007-present) and Director of FMR LLC (diversified financial services company). In addition, Mr. Curvey is an Overseer Emeritus for the Boston Symphony Orchestra, a Director of Artis-Naples, and a Trustee of Brewster Academy in Wolfeboro, New Hampshire. Previously, Mr. Curvey served as a Director of Fidelity Research & Analysis Co. (investment adviser firm, 2009-2018), Director of Fidelity Investments Money Management, Inc. (investment adviser firm, 2009-2014) and a Director of FMR and FMR Co., Inc. (investment adviser firms, 2007-2014).
Charles S. Morrison (1960)
Year of Election or Appointment: 2014
Trustee
Mr. Morrison also serves as Trustee of other funds. He serves as President of Fidelity SelectCo, LLC (investment adviser firm, 2017-present) and Fidelity Management & Research Company (FMR) (investment adviser firm, 2016-present), a Director of Fidelity Investments Money Management, Inc. (FIMM) (investment adviser firm, 2014-present), Director of Fidelity SelectCo, LLC (investment adviser firm, 2014-present), President, Asset Management (2014-present), and is an employee of Fidelity Investments. Previously, Mr. Morrison served as Vice President of Fidelity's Fixed Income and Asset Allocation Funds (2012-2014), President, Fixed Income (2011-2014), Vice President of Fidelity's Money Market Funds (2005-2009), President, Money Market Group Leader of FMR (investment adviser firm, 2009), and Senior Vice President, Money Market Group of FMR (2004-2009). Mr. Morrison also served as Vice President of Fidelity's Bond Funds (2002-2005), certain Balanced Funds (2002-2005), and certain Asset Allocation Funds (2002-2007), and as Senior Vice President (2002-2005) of Fidelity's Bond Division.
* Determined to be an “Interested Trustee” by virtue of, among other things, his or her affiliation with the trust or various entities under common control with FMR.
+ The information includes the Trustee's principal occupation during the last five years and other information relating to the experience, attributes, and skills relevant to the Trustee's qualifications to serve as a Trustee, which led to the conclusion that the Trustee should serve as a Trustee for the fund.
Independent Trustees:
Correspondence intended for an Independent Trustee may be sent to Fidelity Investments, P.O. Box 55235, Boston, Massachusetts 02205-5235.
Name, Year of Birth; Principal Occupations and Other Relevant Experience+
Dennis J. Dirks (1948)
Year of Election or Appointment: 2005
Trustee
Mr. Dirks also serves as Trustee of other Fidelity® funds. Prior to his retirement in May 2003, Mr. Dirks was Chief Operating Officer and a member of the Board of The Depository Trust & Clearing Corporation (DTCC). He also served as President, Chief Operating Officer, and Board member of The Depository Trust Company (DTC) and President and Board member of the National Securities Clearing Corporation (NSCC). In addition, Mr. Dirks served as Chief Executive Officer and Board member of the Government Securities Clearing Corporation, Chief Executive Officer and Board member of the Mortgage-Backed Securities Clearing Corporation, as a Trustee and a member of the Finance Committee of Manhattan College (2005-2008), as a Trustee and a member of the Finance Committee of AHRC of Nassau County (2006-2008), as a member of the Independent Directors Council (IDC) Governing Council (2010-2015), and as a member of the Board of Directors for The Brookville Center for Children’s Services, Inc. (2009-2017). Mr. Dirks is a member of the Finance Committee (2016-present), Board of Directors (2017-present) and Board of Trustees (2018-present) and is Treasurer (2018-present) of the Asolo Repertory Theatre.
Donald F. Donahue (1950)
Year of Election or Appointment: 2018
Trustee
Mr. Donahue also serves as a Trustee of other Fidelity® funds. Mr. Donahue is President and Chief Executive Officer of Miranda Partners, LLC (risk consulting for the financial services industry, 2012-present). Previously, Mr. Donahue served as a Member of the Advisory Board of certain Fidelity® funds (2015-2018) and Chief Executive Officer (2006-2012), Chief Operating Officer (2003-2006), and Managing Director, Customer Marketing and Development (1999-2003) of The Depository Trust & Clearing Corporation (financial markets infrastructure). Mr. Donahue serves as a Member (2007-present) and Co-Chairman (2016-present) of the Board of Directors of United Way of New York, Member of the Board of Directors of NYC Leadership Academy (2012-present) and Member of the Board of Advisors of Ripple Labs, Inc. (financial services, 2015-present). He also served as Chairman (2010-2012) and Member of the Board of Directors (2012-2013) of Omgeo, LLC (financial services), Treasurer of United Way of New York (2012-2016), and Member of the Board of Directors of XBRL US (financial services non-profit, 2009-2012) and the International Securities Services Association (2009-2012).
Alan J. Lacy (1953)
Year of Election or Appointment: 2008
Trustee
Mr. Lacy also serves as Trustee of other Fidelity® funds. Mr. Lacy serves as a Director of Bristol-Myers Squibb Company (global pharmaceuticals, 2008-present). He is a Trustee of the California Chapter of The Nature Conservancy (2015-present) and a Director of the Center for Advanced Study in the Behavioral Sciences at Stanford University (2015-present). In addition, Mr. Lacy served as Senior Adviser (2007-2014) of Oak Hill Capital Partners, L.P. (private equity) and also served as Chief Executive Officer (2005) and Vice Chairman (2005-2006) of Sears Holdings Corporation (retail) and Chief Executive Officer and Chairman of the Board of Sears, Roebuck and Co. (retail, 2000-2005). Previously, Mr. Lacy served as Chairman (2014-2017) and a member (2010-2017) of the Board of Directors of Dave & Buster’s Entertainment, Inc. (restaurant and entertainment complexes), as Chairman (2008-2011) and a member (2006-2015) of the Board of Trustees of the National Parks Conservation Association, and as a member of the Board of Directors for The Hillman Companies, Inc. (hardware wholesalers, 2010-2014), Earth Fare, Inc. (retail grocery, 2010-2014), and The Western Union Company (global money transfer, 2006-2011).
Ned C. Lautenbach (1944)
Year of Election or Appointment: 2000
Trustee
Chairman of the Independent Trustees
Mr. Lautenbach also serves as Trustee of other Fidelity® funds. Mr. Lautenbach currently serves as Vice Chair of the Board of Governors, State University System of Florida (2013-present) and is a member of the Council on Foreign Relations (1994-present). He is also a member and has most recently served as Chairman of the Board of Directors of Artis-Naples (2012-present). Previously, Mr. Lautenbach served as a member and then Lead Director of the Board of Directors of Eaton Corporation (diversified industrial, 1997-2016). He was also a Partner and Advisory Partner at Clayton, Dubilier & Rice, LLC (private equity investment, 1998-2010), as well as a Director of Sony Corporation (2006-2007). In addition, Mr. Lautenbach also had a 30-year career with IBM (technology company) during which time he served as Senior Vice President and a member of the Corporate Executive Committee (1968-1998).
Joseph Mauriello (1944)
Year of Election or Appointment: 2008
Trustee
Mr. Mauriello also serves as Trustee of other Fidelity® funds. Prior to his retirement in January 2006, Mr. Mauriello served in numerous senior management positions including Deputy Chairman and Chief Operating Officer (2004-2005), and Vice Chairman of Financial Services (2002-2004) of KPMG LLP US (professional services, 1965-2005). Mr. Mauriello currently serves as a member of the Board of Directors of XL Group plc. (global insurance and re-insurance, 2006-present) and the Independent Directors Council (IDC) Governing Council (2015-present). Previously, Mr. Mauriello served as a Director of the Hamilton Funds of the Bank of New York (2006-2007) and of Arcadia Resources Inc. (health care services and products, 2007-2012).
Cornelia M. Small (1944)
Year of Election or Appointment: 2005
Trustee
Ms. Small also serves as Trustee of other Fidelity® funds. Ms. Small is a member of the Board of Directors (2009-present) and Chair of the Investment Committee (2010-present) of the Teagle Foundation. Ms. Small also serves on the Investment Committee of the Berkshire Taconic Community Foundation (2008-present). Previously, Ms. Small served as Chairperson (2002-2008) and a member of the Investment Committee and Chairperson (2008-2012) and a member of the Board of Trustees of Smith College. In addition, Ms. Small served as Chief Investment Officer, Director of Global Equity Investments, and a member of the Board of Directors of Scudder, Stevens & Clark and Scudder Kemper Investments.
Garnett A. Smith (1947)
Year of Election or Appointment: 2018
Trustee
Mr. Smith also serves as Trustee of other Fidelity® funds. Prior to Mr. Smith's retirement, he served as Chairman and Chief Executive Officer of Inbrand Corp. (manufacturer of personal absorbent products, 1990-1997). He also served as President (1986-1990) of Inbrand Corp. Prior to his employment with Inbrand Corp., he was employed by a retail fabric chain and North Carolina National Bank. In addition, Mr. Smith served as a Member of the Advisory Board of certain Fidelity® funds (2012-2013) and as a board member of the Jackson Hole Land Trust (2009-2012).
David M. Thomas (1949)
Year of Election or Appointment: 2008
Trustee
Mr. Thomas also serves as Trustee of other Fidelity® funds. Mr. Thomas serves as Non-Executive Chairman of the Board of Directors of Fortune Brands Home and Security (home and security products, 2011-present), as a member of the Board of Directors (2004-present) and Presiding Director (2013-present) of Interpublic Group of Companies, Inc. (marketing communication), and as a member of the Board of Trustees of the University of Florida (2013-present). Previously, Mr. Thomas served as Executive Chairman (2005-2006) and Chairman and Chief Executive Officer (2000-2005) of IMS Health, Inc. (pharmaceutical and healthcare information solutions), and a Director of Fortune Brands, Inc. (consumer products, 2000-2011).
+ The information includes the Trustee's principal occupation during the last five years and other information relating to the experience, attributes, and skills relevant to the Trustee's qualifications to serve as a Trustee, which led to the conclusion that the Trustee should serve as a Trustee for the fund.
Advisory Board Members and Officers:
Correspondence intended for a Member of the Advisory Board (if any) may be sent to Fidelity Investments, P.O. Box 55235, Boston, Massachusetts 02205-5235. Correspondence intended for an officer or Peter S. Lynch may be sent to Fidelity Investments, 245 Summer Street, Boston, Massachusetts 02210. Officers appear below in alphabetical order.
Name, Year of Birth; Principal Occupation
Peter S. Lynch (1944)
Year of Election or Appointment: 2003
Member of the Advisory Board
Mr. Lynch also serves as Member of the Advisory Board of other Fidelity® funds. Mr. Lynch is Vice Chairman and a Director of FMR (investment adviser firm) and FMR Co., Inc. (investment adviser firm). In addition, Mr. Lynch serves as a Trustee of Boston College and as the Chairman of the Inner-City Scholarship Fund. Previously, Mr. Lynch served on the Special Olympics International Board of Directors (1997-2006).
William S. Stavropoulos (1939)
Year of Election or Appointment: 2018
Member of the Advisory Board
Mr. Stavropoulos also serves as Member of the Advisory Board of other Fidelity® funds. Mr. Stavropoulos serves as President and Founder of the Michigan Baseball Foundation, the Great Lakes Loons (2007-present). Mr. Stavropoulos is Chairman Emeritus of the Board of Directors of The Dow Chemical Company, where he previously served in numerous senior management positions, including President, CEO (1995-2000; 2002-2004), Chairman of the Executive Committee (2000-2006), and as a member of the Board of Directors (1990-2006). Currently, Mr. Stavropoulos is Chairman of the Board of Directors of Univar Inc. (global distributor of commodity and specialty chemicals), a Director of Teradata Corporation (data warehousing and technology solutions), and a member of the Advisory Board for Metalmark Capital LLC (private equity investment, 2005-present). Mr. Stavropoulos is an operating advisor to Clayton, Dubilier & Rice, LLC (private equity investment). In addition, Mr. Stavropoulos is a member of the University of Notre Dame Advisory Council for the College of Science, a Trustee of the Rollin L. Gerstacker Foundation, and a Director of Artis-Naples in Naples, Florida. Previously, Mr. Stavropoulos served as Trustee of certain Fidelity® funds (2001-2018) and as a Director of Chemical Financial Corporation (bank holding company, 1993-2012) and Tyco International, Ltd. (multinational manufacturing and services, 2007-2012).
Carol B. Tomé (1957)
Year of Election or Appointment: 2018
Member of the Advisory Board
Ms. Tomé also serves as Member of the Advisory Board of other Fidelity® funds. Ms. Tomé is Chief Financial Officer (2001-present) and Executive Vice President of Corporate Services (2007-present) of The Home Depot, Inc. (home improvement retailer) and a Director (2003-present) and Chair of the Audit Committee (2004-present) of United Parcel Service, Inc. (package delivery and supply chain management). Previously, Ms. Tomé served as Trustee of certain Fidelity® funds (2017), Senior Vice President of Finance and Accounting/Treasurer (2000-2007) and Vice President and Treasurer (1995-2000) of The Home Depot, Inc. and Chair of the Board (2010-2012), Vice Chair of the Board (2009 and 2013), and a Director (2008-2013) of the Federal Reserve Bank of Atlanta. Ms. Tomé is also a director or trustee of many community and professional organizations.
Michael E. Wiley (1950)
Year of Election or Appointment: 2018
Member of the Advisory Board
Mr. Wiley also serves as Trustee or Member of the Advisory Board of other Fidelity® funds. Mr. Wiley serves as a Director of Andeavor Corporation (independent oil refiner and marketer, 2005-present), a Director of Andeavor Logistics LP (natural resources logistics, 2015-present), and a Director of Bill Barrett Corporation (exploration and production, 2005-present). In addition, Mr. Wiley also serves as a Director of Post Oak Bank (privately-held bank, 2004-present). Previously, Mr. Wiley served as a Trustee of other Fidelity® funds (2008-2013), as a Director of Asia Pacific Exploration Consolidated (international oil and gas exploration and production, 2008-2013), as a member of the Board of Trustees of the University of Tulsa (2000-2006; 2007-2010), as a Senior Energy Advisor of Katzenbach Partners, LLC (consulting, 2006-2007), as an Advisory Director of Riverstone Holdings (private investment), Chairman, President, and CEO of Baker Hughes, Inc. (oilfield services, 2000-2004), and as Director of Spinnaker Exploration Company (exploration and production, 2001-2005).
Elizabeth Paige Baumann (1968)
Year of Election or Appointment: 2017
Anti-Money Laundering (AML) Officer
Ms. Baumann also serves as AML Officer of other funds. She is Chief AML Officer (2012-present) and Senior Vice President (2014-present) of FMR LLC (diversified financial services company) and is an employee of Fidelity Investments. Previously, Ms. Baumann served as AML Officer of the funds (2012-2016), and Vice President (2007-2014) and Deputy Anti-Money Laundering Officer (2007-2012) of FMR LLC.
Marc R. Bryant (1966)
Year of Election or Appointment: 2015
Secretary and Chief Legal Officer (CLO)
Mr. Bryant also serves as Secretary and CLO of other funds. Mr. Bryant serves as CLO, Secretary, and Senior Vice President of Fidelity Management & Research Company (investment adviser firm, 2015-present) and FMR Co., Inc. (investment adviser firm, 2015-present); Secretary of Fidelity SelectCo, LLC (investment adviser firm, 2015-present) and Fidelity Investments Money Management, Inc. (investment adviser firm, 2015-present); and CLO of Fidelity Management & Research (Hong Kong) Limited and FMR Investment Management (UK) Limited (investment adviser firms, 2015-present) and Fidelity Management & Research (Japan) Limited (investment adviser firm, 2016-present). He is Senior Vice President and Deputy General Counsel of FMR LLC (diversified financial services company). Previously, Mr. Bryant served as Secretary and CLO of Fidelity Rutland Square Trust II (2010-2014) and Assistant Secretary of Fidelity's Fixed Income and Asset Allocation Funds (2013-2015). Prior to joining Fidelity Investments, Mr. Bryant served as a Senior Vice President and the Head of Global Retail Legal for AllianceBernstein L.P. (2006-2010), and as the General Counsel for ProFund Advisors LLC (2001-2006).
John J. Burke III (1964)
Year of Election or Appointment: 2018
Chief Financial Officer
Mr. Burke also serves as Chief Financial Officer of other funds. Mr. Burke serves as Head of Investment Operations for Fidelity Fund and Investment Operations (2018-present) and is an employee of Fidelity Investments (1998-present). Previously Mr. Burke served as head of Asset Management Investment Operations (2012-2018).
William C. Coffey (1969)
Year of Election or Appointment: 2009
Assistant Secretary
Mr. Coffey also serves as Assistant Secretary of other funds. He is Senior Vice President and Deputy General Counsel of FMR LLC (diversified financial services company, 2010-present), and is an employee of Fidelity Investments. Previously, Mr. Coffey served as Vice President and Associate General Counsel of FMR LLC (2005-2009).
Timothy M. Cohen (1969)
Year of Election or Appointment: 2018
Vice President
Mr. Cohen also serves as Vice President of other funds. Mr. Cohen serves as Co-Head of Global Equity Research (2016-present), a Director of Fidelity Management & Research (Japan) Limited (investment adviser firm, 2016-present), and is an employee of Fidelity Investments. Previously, Mr. Cohen served as Chief Investment Officer - Equity and a Director of Fidelity Management & Research (U.K.) Inc. (investment adviser firm, 2013-2015) and as a Director of Fidelity Management & Research (Hong Kong) Limited (investment adviser firm, 2017).
Jonathan Davis (1968)
Year of Election or Appointment: 2010
Assistant Treasurer
Mr. Davis also serves as Assistant Treasurer of other funds. Mr. Davis serves as Assistant Treasurer of FMR Capital, Inc. (2017-present) and is an employee of Fidelity Investments. Previously, Mr. Davis served as Vice President and Associate General Counsel of FMR LLC (diversified financial services company, 2003-2010).
Adrien E. Deberghes (1967)
Year of Election or Appointment: 2016
Assistant Treasurer
Mr. Deberghes also serves as an officer of other funds. He serves as Assistant Treasurer of FMR Capital, Inc. (2017-present), Executive Vice President of Fidelity Investments Money Management, Inc. (FIMM) (investment adviser firm, 2016-present), and is an employee of Fidelity Investments (2008-present). Previously, Mr. Deberghes served as President and Treasurer of certain Fidelity® funds (2013-2018). Prior to joining Fidelity Investments, Mr. Deberghes was Senior Vice President of Mutual Fund Administration at State Street Corporation (2007-2008), Senior Director of Mutual Fund Administration at Investors Bank & Trust (2005-2007), and Director of Finance for Dunkin' Brands (2000-2005). Previously, Mr. Deberghes served in other fund officer roles.
Laura M. Del Prato (1964)
Year of Election or Appointment: 2018
Assistant Treasurer
Ms. Del Prato also serves as an officer of other funds. Ms. Del Prato is an employee of Fidelity Investments (2017-present). Prior to joining Fidelity Investments, Ms. Del Prato served as a Managing Director and Treasurer of the JPMorgan Mutual Funds (2014-2017). Prior to JPMorgan, Ms. Del Prato served as a partner at Cohen Fund Audit Services (accounting firm, 2012-2013) and KPMG LLP (accounting firm, 2004-2012).
Colm A. Hogan (1973)
Year of Election or Appointment: 2016
Deputy Treasurer
Mr. Hogan also serves as an officer of other funds. Mr. Hogan serves as Assistant Treasurer of FMR Capital, Inc. (2017-present) and is an employee of Fidelity Investments (2005-present). Previously, Mr. Hogan served as Assistant Treasurer of certain Fidelity® funds (2016-2018).
Pamela R. Holding (1964)
Year of Election or Appointment: 2018
Vice President
Ms. Holding also serves as a Vice President of other funds. Ms. Holding serves as Co-Head of Global Equity Research (2018-present) and is an employee of Fidelity Investments (2013-present).
Chris Maher (1972)
Year of Election or Appointment: 2013
Assistant Treasurer
Mr. Maher serves as Assistant Treasurer of other funds. Mr. Maher is Vice President of Valuation Oversight, serves as Assistant Treasurer of FMR Capital, Inc. (2017-present), and is an employee of Fidelity Investments. Previously, Mr. Maher served as Vice President of Asset Management Compliance (2013), Vice President of the Program Management Group of FMR (investment adviser firm, 2010-2013), and Vice President of Valuation Oversight (2008-2010).
Rieco E. Mello (1969)
Year of Election or Appointment: 2017
Assistant Treasurer
Mr. Mello also serves as Assistant Treasurer of other funds. Mr. Mello serves as Assistant Treasurer of FMR Capital, Inc. (2017-present) and is an employee of Fidelity Investments (1995-present).
Kenneth B. Robins (1969)
Year of Election or Appointment: 2016
Chief Compliance Officer
Mr. Robins also serves as an officer of other funds. Mr. Robins serves as Compliance Officer of Fidelity Management & Research Company and FMR Co., Inc. (investment adviser firms, 2016-present) and is an employee of Fidelity Investments (2004-present). Previously, Mr. Robins served as Executive Vice President of Fidelity Investments Money Management, Inc. (investment adviser firm, 2013-2016) and served in other fund officer roles.
Stacie M. Smith (1974)
Year of Election or Appointment: 2016
President and Treasurer
Ms. Smith also serves as an officer of other funds. Ms. Smith serves as Assistant Treasurer of FMR Capital, Inc. (2017-present), is an employee of Fidelity Investments (2009-present), and has served in other fund officer roles. Prior to joining Fidelity Investments, Ms. Smith served as Senior Audit Manager of Ernst & Young LLP (accounting firm, 1996-2009). Previously, Ms. Smith served as Assistant Treasurer (2013-2018) and Deputy Treasurer (2013-2016) of certain Fidelity® funds.
Marc L. Spector (1972)
Year of Election or Appointment: 2016
Assistant Treasurer
Mr. Spector also serves as an officer of other funds. Mr. Spector serves as Assistant Treasurer of FMR Capital, Inc. (2017-present) and is an employee of Fidelity Investments (2016-present). Prior to joining Fidelity Investments, Mr. Spector served as Director at the Siegfried Group (accounting firm, 2013-2016), and prior to Siegfried Group as audit senior manager at Deloitte & Touche (accounting firm, 2005-2013).
Renee Stagnone (1975)
Year of Election or Appointment: 2016
Assistant Treasurer
Ms. Stagnone also serves as an officer of other funds. Ms. Stagnone serves as Assistant Treasurer of FMR Capital, Inc. (2017-present) and is an employee of Fidelity Investments (1997-present). Previously, Ms. Stagnone served as Deputy Treasurer of certain Fidelity® funds (2013-2016).
Shareholder Expense Example
As a shareholder of the Fund, you incur two types of costs: (1) transaction costs, and (2) ongoing costs, including management fees and other Fund expenses. This Example is intended to help you understand your ongoing costs (in dollars) of investing in the Fund and to compare these costs with the ongoing costs of investing in other mutual funds.
The Example is based on an investment of $1,000 invested at the beginning of the period and held for the entire period (February 1, 2018 to July 31, 2018).
Actual Expenses
The first line of the accompanying table provides information about actual account values and actual expenses. You may use the information in this line, together with the amount you invested, to estimate the expenses that you paid over the period. Simply divide your account value by $1,000.00 (for example, an $8,600 account value divided by $1,000.00 = 8.6), then multiply the result by the number in the first line under the heading entitled "Expenses Paid During Period" to estimate the expenses you paid on your account during this period. In addition, the Fund, as a shareholder in the underlying Fidelity Central Funds, will indirectly bear its pro-rata share of the fees and expenses incurred by the underlying Fidelity Central Funds. These fees and expenses are not included in the Fund's annualized expense ratio used to calculate the expense estimate in the table below.
Hypothetical Example for Comparison Purposes
The second line of the accompanying table provides information about hypothetical account values and hypothetical expenses based on the Fund's actual expense ratio and an assumed rate of return of 5% per year before expenses, which is not the Fund's actual return. The hypothetical account values and expenses may not be used to estimate the actual ending account balance or expenses you paid for the period. You may use this information to compare the ongoing costs of investing in the Fund and other funds. To do so, compare this 5% hypothetical example with the 5% hypothetical examples that appear in the shareholder reports of the other funds. In addition, the Fund, as a shareholder in the underlying Fidelity Central Funds, will indirectly bear its pro-rata share of the fees and expenses incurred by the underlying Fidelity Central Funds. These fees and expenses are not included in the Fund's annualized expense ratio used to calculate the expense estimate in the table below.
Please note that the expenses shown in the table are meant to highlight your ongoing costs only and do not reflect any transaction costs. Therefore, the second line of the table is useful in comparing ongoing costs only, and will not help you determine the relative total costs of owning different funds.
| | Annualized Expense Ratio-A | Beginning
Account Value
February 1, 2018 | Ending
Account Value
July 31, 2018 | Expenses Paid
During Period-B
February 1, 2018
to July 31, 2018 |
| Actual | .60% | $1,000.00 | $1,092.10 | $3.11 |
| Hypothetical-C | | $1,000.00 | $1,021.82 | $3.01 |
A Annualized expense ratio reflects expenses net of applicable fee waivers.
B Expenses are equal to the Fund's annualized expense ratio, multiplied by the average account value over the period, multiplied by 181/365 (to reflect the one-half year period).
C 5% return per year before expenses
Distributions (Unaudited)
The Board of Trustees of Fidelity Small Cap Growth K6 Fund voted to pay on September 17, 2018, to shareholders of record at the opening of business on September 14, 2018, a distribution of $0.268 per share derived from capital gains realized from sales of portfolio securities.
The fund hereby designates as a capital gain dividend with respect to the taxable year ended July 31, 2018, $43,721, or, if subsequently determined to be different, the net capital gain of such year.
The fund designates 100% of the dividend distributed during the fiscal year as qualifying for the dividends–received deduction for corporate shareholders.
The fund designates 100% of the dividend distributed during the fiscal year as amounts which may be taken into account as a dividend for the purposes of the maximum rate under section 1(h)(11) of the Internal Revenue Code.
The fund will notify shareholders in January 2019 of amounts for use in preparing 2018 income tax returns.
Board Approval of Investment Advisory Contracts
Fidelity Small Cap Growth K6 Fund
At its July 2018 meeting, the Board of Trustees, including the Independent Trustees (together, the Board), voted to continue the management contract with Fidelity Management & Research Company (FMR) and the sub-advisory agreements (together, the Advisory Contracts) for the fund for six months through January 31, 2019, in connection with the reunification of the Fidelity Equity High Income Funds Board, which oversees the fund, and the Sector Portfolios Board.
The Board considered that the approval of the fund's Advisory Contracts will not result in any changes in (i) the investment process or strategies employed in the management of the fund's assets; (ii) the fees and expenses paid by shareholders; (iii) the nature, extent or quality of services provided under the fund's Advisory Contracts; or (iv) the day-to-day management of the fund or the persons primarily responsible for such management. The Board concluded that the fund's Advisory Contracts are fair and reasonable, and that the fund's Advisory Contracts should be renewed, without modification, through January 31, 2019, with the understanding that the Board will consider the annual renewal for a full one year period in January 2019.
In connection with its consideration of future renewals of the fund's Advisory Contracts, the Board will consider: (i) the nature, extent and quality of services provided to the fund, including shareholder and administrative services and investment performance; (ii) the competitiveness of the management fee and total expenses for the fund; (iii) the costs of the services and profitability, including the revenues earned and the expenses incurred in conducting the business of developing, marketing, distributing, managing, administering, and servicing the fund and its shareholders, to the extent applicable, as well as potential fall-out benefits from Fidelity's non-fund businesses; and (iv) whether there have been economies of scale in respect of the Fidelity funds, whether the Fidelity funds (including the fund) have appropriately benefited from any such economies of scale, and whether there is the potential for realization of any further economies.
Based on its evaluation of all of the conclusions noted above, and after considering all factors it believed relevant, the Board ultimately concluded that the fund's management fee structure is fair and reasonable, and that the continuation of the fund's Advisory Contracts should be approved.
Corporate Headquarters
245 Summer St.
Boston, MA 02210
www.fidelity.com
SCPK6-ANN-0918
1.9884011.101
Item 2.
Code of Ethics
As of the end of the period, July 31, 2018, Fidelity Securities Fund (the trust) has adopted a code of ethics, as defined in Item 2 of Form N-CSR, that applies to its President and Treasurer and its Chief Financial Officer. A copy of the code of ethics is filed as an exhibit to this Form N-CSR.
Item 3.
Audit Committee Financial Expert
The Board of Trustees of the trust has determined that Joseph Mauriello is an audit committee financial expert, as defined in Item 3 of Form N-CSR. Mr. Mauriello is independent for purposes of Item 3 of Form N-CSR.
Item 4.
Principal Accountant Fees and Services
Fees and Services
The following table presents fees billed by Deloitte & Touche LLP, the member firms of Deloitte Touche Tohmatsu, and their respective affiliates (collectively, “Deloitte Entities”) in each of the last two fiscal years for services rendered to Fidelity Blue Chip Growth Fund, Fidelity Blue Chip Growth K6 Fund, Fidelity Flex Large Cap Growth Fund, Fidelity OTC Portfolio, Fidelity Real Estate Income Fund, Fidelity Series Blue Chip Growth Fund, Fidelity Series Real Estate Income Fund and Fidelity Series Small Cap Opportunities Fund (the “Funds”):
Services Billed by Deloitte Entities
July 31, 2018 FeesA
| | | | |
| Audit Fees | Audit-Related Fees | Tax Fees | All Other Fees |
Fidelity Blue Chip Growth Fund | $75,000 | $200 | $18,300 | $2,800 |
Fidelity Blue Chip Growth K6 Fund | $49,000 | $100 | $3,800 | $1,200 |
Fidelity Flex Large Cap Growth Fund | $50,000 | $100 | $3,800 | $1,300 |
Fidelity OTC Portfolio | $79,000 | $100 | $19,100 | $1,800 |
Fidelity Real Estate Income Fund | $86,000 | $200 | $7,700 | $3,400 |
Fidelity Series Blue Chip Growth Fund | $70,000 | $100 | $18,300 | $1,900 |
Fidelity Series Real Estate Income Fund | $77,000 | $100 | $6,600 | $2,100 |
Fidelity Series Small Cap Opportunities Fund | $42,000 | $100 | $5,300 | $1,300 |
| | | | |
| Audit Fees | Audit-Related Fees | Tax Fees | All Other Fees |
Fidelity Blue Chip Growth Fund | $140,000 | $200 | $5,400 | $3,400 |
Fidelity Blue Chip Growth K6 Fund | $39,000 | $- | $3,700 | $200 |
Fidelity Flex Large Cap Growth Fund | $40,000 | $- | $3,700 | $400 |
Fidelity OTC Portfolio | $63,000 | $100 | $6,200 | $1,600 |
Fidelity Real Estate Income Fund | $165,000 | $200 | $7,200 | $4,500 |
Fidelity Series Blue Chip Growth Fund | $65,000 | $100 | $5,400 | $1,700 |
Fidelity Series Real Estate Income Fund | $78,000 | $100 | $6,500 | $2,200 |
Fidelity Series Small Cap Opportunities Fund | $50,000 | $100 | $5,400 | $1,400 |
A Amounts may reflect rounding.
B Fidelity Blue Chip Growth K6 Fund commenced operations on May 25, 2017. Fidelity Flex Large Cap Growth Fund commenced operation on March 8, 2017.
The following table presents fees billed by PricewaterhouseCoopers LLP (“PwC”) in each of the last two fiscal years for services rendered to Fidelity Blue Chip Value Fund, Fidelity Dividend Growth Fund, Fidelity Growth & Income Portfolio, Fidelity Leveraged Company Stock Fund, Fidelity Small Cap Growth Fund, Fidelity Small Cap Growth K6 Fund and Fidelity Small Cap Value Fund (the “Funds”):
Services Billed by PwC
July 31, 2018 FeesA
| | | | |
| Audit Fees | Audit-Related Fees | Tax Fees | All Other Fees |
Fidelity Blue Chip Value Fund | $51,000 | $4,400 | $3,500 | $2,200 |
Fidelity Dividend Growth Fund | $60,000 | $5,100 | $3,500 | $2,500 |
Fidelity Growth & Income Portfolio | $67,000 | $5,900 | $7,000 | $2,900 |
Fidelity Leveraged Company Stock Fund | $51,000 | $4,500 | $4,400 | $2,200 |
Fidelity Small Cap Growth Fund | $54,000 | $4,400 | $3,500 | $2,200 |
Fidelity Small Cap Growth K6 Fund | $41,000 | $3,500 | $3,900 | $1,700 |
Fidelity Small Cap Value Fund | $51,000 | $4,400 | $3,300 | $2,200 |
| | | | |
| Audit Fees | Audit-Related Fees | Tax Fees | All Other Fees |
Fidelity Blue Chip Value Fund | $51,000 | $4,900 | $3,700 | $2,300 |
Fidelity Dividend Growth Fund | $59,000 | $5,700 | $3,700 | $2,700 |
Fidelity Growth & Income Portfolio | $66,000 | $6,500 | $6,800 | $3,100 |
Fidelity Leveraged Company Stock Fund | $51,000 | $5,100 | $4,600 | $2,400 |
Fidelity Small Cap Growth Fund | $56,000 | $4,900 | $3,500 | $2,300 |
Fidelity Small Cap Growth K6 Fund | $34,000 | $1,000 | $3,500 | $300 |
Fidelity Small Cap Value Fund | $51,000 | $5,000 | $3,500 | $2,300 |
A Amounts may reflect rounding.
B Fidelity Small Cap Growth K6 Fund commenced operations on May 25, 2017.
The following table presents fees billed by PwC and Deloitte Entities that were required to be approved by the Audit Committee for services that relate directly to the operations and financial reporting of the Funds and that are rendered on behalf of Fidelity Management & Research Company (“FMR”) and entities controlling, controlled by, or under common control with FMR (not including any sub-adviser whose role is primarily portfolio management and is subcontracted with or overseen by another investment adviser) that provide ongoing services to the Funds (“Fund Service Providers”):
Services Billed by Deloitte Entities
| | |
| July 31, 2018A | July 31, 2017A,B |
Audit-Related Fees | $5,000 | $- |
Tax Fees | $5,000 | $25,000 |
All Other Fees | $- | $- |
A Amounts may reflect rounding.
B May include amounts billed prior to the Fidelity Blue Chip Growth K6 Fund and Fidelity Flex Large Cap Growth Fund’s commencement of operations.
Services Billed by PwC
| | |
| July 31, 2018A | July 31, 2017A,B |
Audit-Related Fees | $7,605,000 | $6,070,000 |
Tax Fees | $20,000 | $160,000 |
All Other Fees | $- | $- |
A Amounts may reflect rounding.
B May include amounts billed prior to the Fidelity Small Cap Growth K6 Fund’s commencement of operations.
“Audit-Related Fees” represent fees billed for assurance and related services that are reasonably related to the performance of the fund audit or the review of the fund's financial statements and that are not reported under Audit Fees.
“Tax Fees” represent fees billed for tax compliance, tax advice or tax planning that relate directly to the operations and financial reporting of the fund.
“All Other Fees” represent fees billed for services provided to the fund or Fund Service Provider, a significant portion of which are assurance related, that relate directly to the operations and financial reporting of the fund, excluding those services that are reported under Audit Fees, Audit-Related Fees or Tax Fees.
Assurance services must be performed by an independent public accountant.
* * *
The aggregate non-audit fees billed by PwC and Deloitte Entities for services rendered to the Funds, FMR (not including any sub-adviser whose role is primarily portfolio management and is subcontracted with or overseen by another investment adviser), and any Fund Service Provider for each of the last two fiscal years of the Funds are as follows:
| | |
Billed By | July 31, 2018A | July 31, 2017A,B |
Deloitte Entities | $445,000 | $560,000 |
PwC | $10,435,000 | $7,575,000 |
A Amounts may reflect rounding.
B May include amounts billed prior to the Fidelity Blue Chip Growth K6 Fund, Fidelity Flex Large Cap Growth Fund and Fidelity Small Cap Growth K6 Fund’s commencement of operations.
The trust's Audit Committee has considered non-audit services that were not pre-approved that were provided by PwC and Deloitte Entities to Fund Service Providers to be compatible with maintaining the independence of PwC and Deloitte Entities in their audits of the Funds, taking into account representations from PwC and Deloitte Entities, in accordance with Public Company Accounting Oversight Board rules, regarding their independence from the Funds and their related entities and FMR’s review of the appropriateness and permissibility under applicable law of such non-audit services prior to their provision to the Fund Service Providers.
Audit Committee Pre-Approval Policies and Procedures
The trust’s Audit Committee must pre-approve all audit and non-audit services provided by a fund’s independent registered public accounting firm relating to the operations or financial reporting of the fund. Prior to the commencement of any audit or non-audit services to a fund, the Audit Committee reviews the services to determine whether they are appropriate and permissible under applicable law.
The Audit Committee has adopted policies and procedures to, among other purposes, provide a framework for the Committee’s consideration of non-audit services by the audit firms that audit the Fidelity funds. The policies and procedures require that any non-audit service provided by a fund audit firm to a Fidelity fund and any non-audit service provided by a fund auditor to a Fund Service Provider that relates directly to the operations and financial reporting of a Fidelity fund (“Covered Service”) are subject to approval by the Audit Committee before such service is provided.
All Covered Services must be approved in advance of provision of the service either: (i) by formal resolution of the Audit Committee, or (ii) by oral or written approval of the service by the Chair of the Audit Committee (or if the Chair is unavailable, such other member of the Audit Committee as may be designated by the Chair to act in the Chair’s absence). The approval contemplated by (ii) above is permitted where the Treasurer determines that action on such an engagement is necessary before the next meeting of the Audit Committee.
Non-audit services provided by a fund audit firm to a Fund Service Provider that do not relate directly to the operations and financial reporting of a Fidelity fund are reported to the Audit Committee periodically.
Non-Audit Services Approved Pursuant to Rule 2-01(c)(7)(i)(C) and (ii) of Regulation S-X (“De Minimis Exception”)
There were no non-audit services approved or required to be approved by the Audit Committee pursuant to the De Minimis Exception during the Funds’ last two fiscal years relating to services provided to (i) the Funds or (ii) any Fund Service Provider that relate directly to the operations and financial reporting of the Funds.
Item 5.
Audit Committee of Listed Registrants
Not applicable.
Item 6.
Investments
(a)
Not applicable.
(b)
Not applicable
Item 7.
Disclosure of Proxy Voting Policies and Procedures for Closed-End Management Investment Companies
Not applicable.
Item 8.
Portfolio Managers of Closed-End Management Investment Companies
Not applicable.
Item 9.
Purchase of Equity Securities by Closed-End Management Investment Company and Affiliated Purchasers
Not applicable.
Item 10.
Submission of Matters to a Vote of Security Holders
There were no material changes to the procedures by which shareholders may recommend nominees to the trust’s Board of Trustees.
Item 11.
Controls and Procedures
(a)(i) The President and Treasurer and the Chief Financial Officer have concluded that the trust’s disclosure controls and procedures (as defined in Rule 30a-3(c) under the Investment Company Act) provide reasonable assurances that material information relating to the trust is made known to them by the appropriate persons, based on their evaluation of these controls and procedures as of a date within 90 days of the filing date of this report.
(a)(ii) There was no change in the trust’s internal control over financial reporting (as defined in Rule 30a-3(d) under the Investment Company Act) that occurred during the period covered by this report that has materially affected, or is reasonably likely to materially affect, the trust’s internal control over financial reporting.
Item 12.
Disclosure of Securities Lending Activities for Closed-End Management
Investment Companies
Not applicable.
Item 13.
Exhibits
| | |
(a) | (1) | Code of Ethics pursuant to Item 2 of Form N-CSR is filed and attached hereto as EX-99.CODE ETH. |
(a) | (2) | Certification pursuant to Rule 30a-2(a) under the Investment Company Act of 1940 (17 CFR 270.30a-2(a)) is filed and attached hereto as Exhibit 99.CERT. |
(a) | (3) | Not applicable. |
(b) | | Certification pursuant to Rule 30a-2(b) under the Investment Company Act of 1940 (17 CFR 270.30a-2(b)) is furnished and attached hereto as Exhibit 99.906CERT. |
SIGNATURES
Pursuant to the requirements of the Securities Exchange Act of 1934 and the Investment Company Act of 1940, the registrant has duly caused this report to be signed on its behalf by the undersigned, thereunto duly authorized.
Fidelity Securities Fund
| |
By: | /s/ Stacie M. Smith |
| Stacie M. Smith |
| President and Treasurer |
| |
Date: | September 26, 2018 |
Pursuant to the requirements of the Securities Exchange Act of 1934 and the Investment Company Act of 1940, this report has been signed below by the following persons on behalf of the registrant and in the capacities and on the dates indicated.
| |
By: | /s/Stacie M. Smith |
| Stacie M. Smith |
| President and Treasurer |
| |
Date: | September 26, 2018 |
| |
By: | /s/John J. Burke III |
| John J. Burke III |
| Chief Financial Officer |
| |
Date: | September 26, 2018 |