UNITED STATES
SECURITIES AND EXCHANGE COMMISSION
Washington, D.C. 20549
FORM N-CSR
CERTIFIED SHAREHOLDER REPORT OF REGISTERED
MANAGEMENT INVESTMENT COMPANIES
Investment Company Act file number 811-4118
Fidelity Securities Fund
(Exact name of registrant as specified in charter)
245 Summer St., Boston, Massachusetts 02210
(Address of principal executive offices) (Zip code)
Marc Bryant, Secretary
245 Summer St.
Boston, Massachusetts 02210
(Name and address of agent for service)
Registrant's telephone number, including area code:
617-563-7000
| |
Date of fiscal year end: | July 31 |
| |
Date of reporting period: | July 31, 2016 |
Item 1.
Reports to Stockholders
Fidelity® Leveraged Company Stock Fund
Annual Report July 31, 2016 |
 |
Contents
To view a fund's proxy voting guidelines and proxy voting record for the 12-month period ended June 30, visit http://www.fidelity.com/proxyvotingresults or visit the Securities and Exchange Commission's (SEC) web site at http://www.sec.gov.
You may also call 1-800-544-8544 to request a free copy of the proxy voting guidelines.
Standard & Poor's, S&P and S&P 500 are registered service marks of The McGraw-Hill Companies, Inc. and have been licensed for use by Fidelity Distributors Corporation.
Other third-party marks appearing herein are the property of their respective owners.
All other marks appearing herein are registered or unregistered trademarks or service marks of FMR LLC or an affiliated company. © 2016 FMR LLC. All rights reserved.
This report and the financial statements contained herein are submitted for the general information of the shareholders of the Fund. This report is not authorized for distribution to prospective investors in the Fund unless preceded or accompanied by an effective prospectus.
A fund files its complete schedule of portfolio holdings with the SEC for the first and third quarters of each fiscal year on Form N-Q. Forms N-Q are available on the SEC’s web site at http://www.sec.gov. A fund's Forms N-Q may be reviewed and copied at the SEC’s Public Reference Room in Washington, DC. Information regarding the operation of the SEC's Public Reference Room may be obtained by calling 1-800-SEC-0330.
For a complete list of a fund's portfolio holdings, view the most recent holdings listing, semiannual report, or annual report on Fidelity's web site at http://www.fidelity.com, http://www.institutional.fidelity.com, or http://www.401k.com, as applicable.
NOT FDIC INSURED •MAY LOSE VALUE •NO BANK GUARANTEE
Neither the Fund nor Fidelity Distributors Corporation is a bank.
Performance: The Bottom Line
Average annual total return reflects the change in the value of an investment, assuming reinvestment of distributions from dividend income and capital gains (the profits earned upon the sale of securities that have grown in value, if any) and assuming a constant rate of performance each year. The hypothetical investment and the average annual total returns do not reflect the deduction of taxes that a shareholder would pay on fund distributions or the redemption of fund shares. During periods of reimbursement by Fidelity, a fund’s total return will be greater than it would be had the reimbursement not occurred. How a fund did yesterday is no guarantee of how it will do tomorrow.
Average Annual Total Returns
| For the periods ended July 31, 2016 | Past 1 year | Past 5 years | Past 10 years |
| Fidelity® Leveraged Company Stock Fund | (7.23)% | 9.21% | 6.23% |
$10,000 Over 10 Years
Let's say hypothetically that $10,000 was invested in Fidelity® Leveraged Company Stock Fund, a class of the fund, on July 31, 2006.
The chart shows how the value of your investment would have changed, and also shows how the S&P 500® Index performed over the same period.
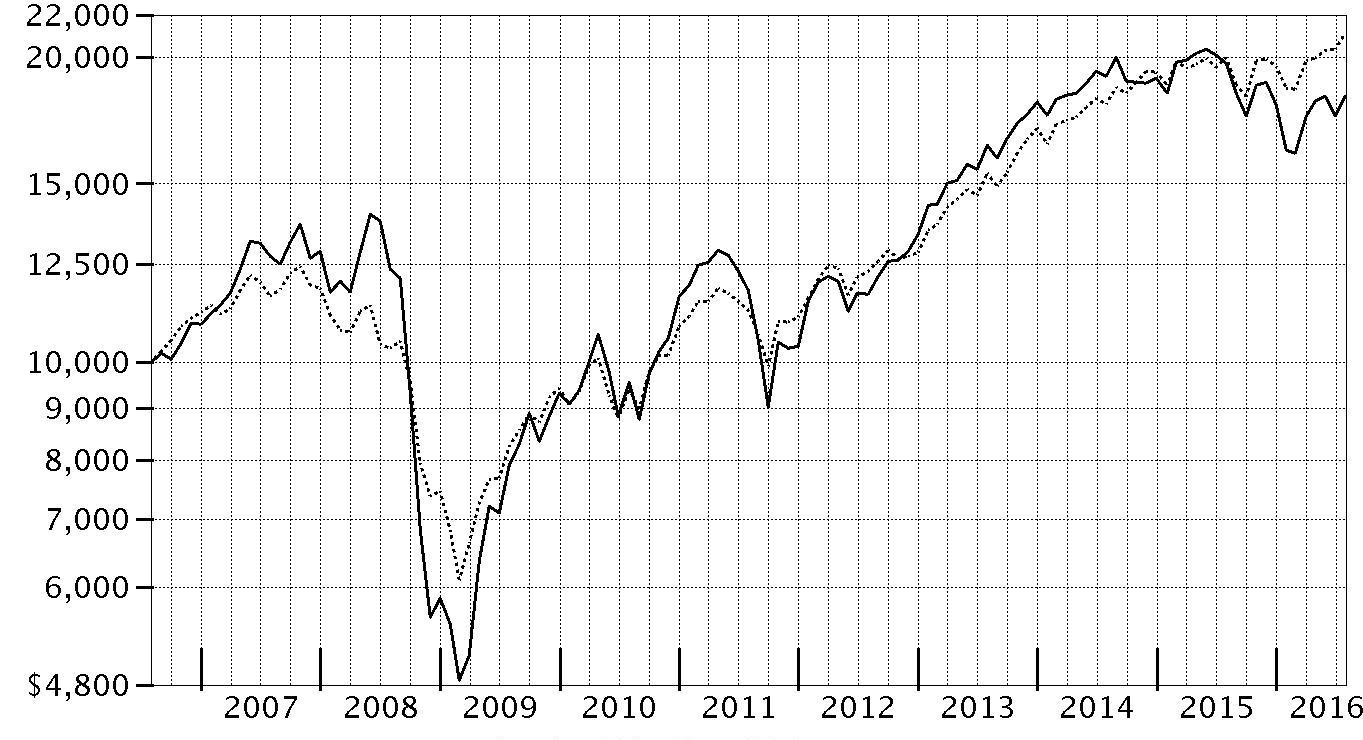
| Period Ending Values |
| $18,303 | Fidelity® Leveraged Company Stock Fund |
| $21,089 | S&P 500® Index |
Management's Discussion of Fund Performance
Market Recap: U.S. equities gained modestly for the year ending July 31, 2016, overcoming persistent concern about global economic growth, uncertainty regarding U.S. monetary policy and the U.K.’s late-June vote to leave the European Union, dubbed Brexit. The S&P 500 index rose 5.61%, with larger-cap, value-oriented stocks and defensive sectors shining brightest. Volatility peaked in the early weeks of 2016, as continued oil-price weakness and U.S.-dollar strength pushed the S&P 500
® to its worst January since 2009. Markets then rose beginning in February amid U.S. job gains, a broad rally in energy and materials markets, global economic stimulus and perceived softening of monetary policy by the U.S. Federal Reserve. The June 23 Brexit vote surprised markets and resulted in a sharp two-day decline for stocks, followed by a rebound as investor sentiment shifted and remained positive through July 31. For the year, dividend-rich telecom services (+26%), utilities (+23%) and consumer staples (+12%) led the way amid strong investor demand for yield. Industrials (+10%) and information technology (+10%) also outperformed, as did materials (+8%), despite a weak commodities environment overall. Conversely, a strong run for real estate stocks couldn’t keep financials (-4%) from losing ground, as low interest rates continued to squeeze bank profits.
Comments from Portfolio Manager Tom Soviero: For the 12-month period, the fund’s share classes returned about -7%, lagging the gain of the S&P 500
® but topping the -7.98% result of the Credit Suisse Leveraged Equity Index. Security selection accounted for most of the fund’s underperformance of the S&P 500
®, with all 10 sectors detracting. The largest negative impact came from picks in the materials, consumer discretionary, health care, financials and industrials sectors. Our biggest individual disappointment was Netherlands-based LyondellBasell Industries, a multinational plastics, chemicals and refining company that also was our largest position and about 8% of assets this period. Low oil prices and concern that increased ethylene supply would pressure pricing led to the stock’s double-digit decline. In health care, our investments in Community Health Systems and Tenet Healthcare took a beating as investors grew increasingly worried that fewer privately insured patients, a greater number of uninsured patients and rising labor costs could hurt hospital operators’ profits. By contrast, medical supplies and devices company Boston Scientific was our top contributor by a wide margin, benefiting from the launch of new products, expansion overseas, the settlement of a pending lawsuit and ongoing cost reductions.
The views expressed above reflect those of the portfolio manager(s) only through the end of the period as stated on the cover of this report and do not necessarily represent the views of Fidelity or any other person in the Fidelity organization. Any such views are subject to change at any time based upon market or other conditions and Fidelity disclaims any responsibility to update such views. These views may not be relied on as investment advice and, because investment decisions for a Fidelity fund are based on numerous factors, may not be relied on as an indication of trading intent on behalf of any Fidelity fund.
Investment Summary (Unaudited)
Top Ten Stocks as of July 31, 2016
| | % of fund's net assets | % of fund's net assets 6 months ago |
| LyondellBasell Industries NV Class A | 7.8 | 8.1 |
| Service Corp. International | 7.1 | 6.2 |
| Boston Scientific Corp. | 6.0 | 4.3 |
| WestRock Co. | 3.2 | 2.6 |
| General Motors Co. | 3.2 | 2.7 |
| NXP Semiconductors NV | 3.1 | 2.0 |
| Bank of America Corp. | 3.1 | 3.0 |
| Delta Air Lines, Inc. | 2.9 | 3.2 |
| Tenet Healthcare Corp. | 2.6 | 2.3 |
| Comcast Corp. Class A | 2.4 | 2.7 |
| | 41.4 | |
Top Five Market Sectors as of July 31, 2016
| | % of fund's net assets | % of fund's net assets 6 months ago |
| Consumer Discretionary | 23.8 | 24.9 |
| Health Care | 17.4 | 14.8 |
| Materials | 14.6 | 13.9 |
| Financials | 12.1 | 11.6 |
| Industrials | 9.6 | 12.4 |
Asset Allocation (% of fund's net assets)
| As of July 31, 2016* |
| | Stocks | 96.1% |
| | Bonds | 0.7% |
| | Short-Term Investments and Net Other Assets (Liabilities) | 3.2% |

* Foreign investments - 15.9%
| As of January 31, 2016* |
| | Stocks | 97.8% |
| | Bonds | 0.2% |
| | Short-Term Investments and Net Other Assets (Liabilities) | 2.0% |

* Foreign investments - 14.8%
Investments July 31, 2016
Showing Percentage of Net Assets
| Common Stocks - 96.1% | | | |
| | | Shares | Value (000s) |
| CONSUMER DISCRETIONARY - 23.8% | | | |
| Auto Components - 2.6% | | | |
| Delphi Automotive PLC | | 490,700 | $33,279 |
| Hertz Global Holdings, Inc. (a) | | 420,040 | 20,448 |
| Tenneco, Inc. (a) | | 674,800 | 38,140 |
| | | | 91,867 |
| Automobiles - 4.8% | | | |
| Ford Motor Co. | | 3,862,533 | 48,900 |
| General Motors Co. | | 3,448,107 | 108,753 |
| General Motors Co. warrants 7/10/19 (a) | | 482,521 | 6,572 |
| | | | 164,225 |
| Diversified Consumer Services - 7.1% | | | |
| Service Corp. International | | 8,773,727 | 243,208 |
| Hotels, Restaurants & Leisure - 0.7% | | | |
| ARAMARK Holdings Corp. | | 494,844 | 17,740 |
| Penn National Gaming, Inc. (a) | | 360,340 | 5,412 |
| Red Rock Resorts, Inc. | | 5,847 | 128 |
| | | | 23,280 |
| Household Durables - 2.9% | | | |
| Lennar Corp. Class A | | 677,100 | 31,688 |
| Newell Brands, Inc. | | 1,287,247 | 67,529 |
| | | | 99,217 |
| Media - 5.0% | | | |
| Cinemark Holdings, Inc. | | 1,853,345 | 69,686 |
| Comcast Corp. Class A | | 1,223,934 | 82,310 |
| Gray Television, Inc. (a) | | 1,232,064 | 12,197 |
| Nexstar Broadcasting Group, Inc. Class A (b) | | 178,698 | 9,033 |
| | | | 173,226 |
| Specialty Retail - 0.7% | | | |
| Sally Beauty Holdings, Inc. (a) | | 808,000 | 23,699 |
|
| TOTAL CONSUMER DISCRETIONARY | | | 818,722 |
|
| CONSUMER STAPLES - 2.5% | | | |
| Food Products - 2.0% | | | |
| ConAgra Foods, Inc. | | 541,700 | 25,330 |
| Darling International, Inc. (a) | | 2,698,383 | 42,580 |
| | | | 67,910 |
| Personal Products - 0.5% | | | |
| Revlon, Inc. (a) | | 553,261 | 19,635 |
|
| TOTAL CONSUMER STAPLES | | | 87,545 |
|
| ENERGY - 6.0% | | | |
| Energy Equipment & Services - 1.8% | | | |
| Halliburton Co. | | 1,126,593 | 49,187 |
| SAExploration Holdings, Inc. (c) | | 419,175 | 4,611 |
| Schlumberger Ltd. | | 109,400 | 8,809 |
| | | | 62,607 |
| Oil, Gas & Consumable Fuels - 4.2% | | | |
| Continental Resources, Inc. (a) | | 1,184,374 | 52,172 |
| Hess Corp. | | 825,110 | 44,267 |
| QEP Resources, Inc. | | 901,000 | 16,398 |
| Range Resources Corp. (b) | | 465,400 | 18,760 |
| Whiting Petroleum Corp. (a) | | 1,439,895 | 10,612 |
| | | | 142,209 |
|
| TOTAL ENERGY | | | 204,816 |
|
| FINANCIALS - 12.1% | | | |
| Banks - 9.5% | | | |
| Bank of America Corp. | | 7,243,199 | 104,954 |
| Barclays PLC sponsored ADR (b) | | 2,083,121 | 17,165 |
| CIT Group, Inc. | | 229,310 | 7,925 |
| Citigroup, Inc. | | 1,664,147 | 72,906 |
| Huntington Bancshares, Inc. | | 4,806,680 | 45,663 |
| Regions Financial Corp. | | 4,496,280 | 41,231 |
| SunTrust Banks, Inc. | | 895,500 | 37,871 |
| | | | 327,715 |
| Consumer Finance - 1.0% | | | |
| American Express Co. | | 542,948 | 34,998 |
| Insurance - 0.6% | | | |
| Lincoln National Corp. | | 435,700 | 19,027 |
| Real Estate Investment Trusts - 1.0% | | | |
| Gaming & Leisure Properties | | 430,875 | 15,438 |
| Host Hotels & Resorts, Inc. | | 1,016,122 | 18,026 |
| | | | 33,464 |
|
| TOTAL FINANCIALS | | | 415,204 |
|
| HEALTH CARE - 17.4% | | | |
| Health Care Equipment & Supplies - 6.0% | | | |
| Boston Scientific Corp. (a) | | 8,457,056 | 205,337 |
| Health Care Providers & Services - 6.7% | | | |
| Community Health Systems, Inc. (a)(b) | | 1,213,027 | 15,490 |
| DaVita HealthCare Partners, Inc. (a) | | 532,952 | 41,325 |
| HCA Holdings, Inc. (a) | | 532,479 | 41,070 |
| Tenet Healthcare Corp. (a) | | 2,965,644 | 90,778 |
| Universal Health Services, Inc. Class B | | 334,505 | 43,328 |
| | | | 231,991 |
| Life Sciences Tools & Services - 0.9% | | | |
| PRA Health Sciences, Inc. (a) | | 651,400 | 30,212 |
| Pharmaceuticals - 3.8% | | | |
| Merck & Co., Inc. | | 1,390,800 | 81,584 |
| Valeant Pharmaceuticals International, Inc. (Canada) (a) | | 2,200,900 | 49,080 |
| | | | 130,664 |
|
| TOTAL HEALTH CARE | | | 598,204 |
|
| INDUSTRIALS - 9.6% | | | |
| Aerospace & Defense - 1.7% | | | |
| Huntington Ingalls Industries, Inc. | | 210,260 | 36,287 |
| Textron, Inc. | | 602,700 | 23,505 |
| | | | 59,792 |
| Airlines - 3.8% | | | |
| American Airlines Group, Inc. | | 860,580 | 30,551 |
| Delta Air Lines, Inc. | | 2,531,601 | 98,100 |
| | | | 128,651 |
| Building Products - 0.5% | | | |
| Allegion PLC | | 246,500 | 17,844 |
| Commercial Services & Supplies - 0.9% | | | |
| Civeo Corp. (a) | | 540,932 | 741 |
| Deluxe Corp. | | 431,413 | 29,159 |
| | | | 29,900 |
| Electrical Equipment - 0.8% | | | |
| Emerson Electric Co. | | 163,500 | 9,140 |
| Generac Holdings, Inc. (a)(b) | | 490,557 | 18,538 |
| | | | 27,678 |
| Machinery - 1.4% | | | |
| Ingersoll-Rand PLC | | 648,800 | 42,989 |
| Pentair PLC | | 78,757 | 5,026 |
| | | | 48,015 |
| Marine - 0.0% | | | |
| Genco Shipping & Trading Ltd. (a) | | 831 | 5 |
| Trading Companies & Distributors - 0.5% | | | |
| Herc Holdings, Inc. (a) | | 140,013 | 4,949 |
| United Rentals, Inc. (a) | | 147,000 | 11,711 |
| | | | 16,660 |
|
| TOTAL INDUSTRIALS | | | 328,545 |
|
| INFORMATION TECHNOLOGY - 8.5% | | | |
| Electronic Equipment & Components - 2.3% | | | |
| Avnet, Inc. | | 594,313 | 24,426 |
| Belden, Inc. | | 510,764 | 37,393 |
| Corning, Inc. | | 726,800 | 16,149 |
| | | | 77,968 |
| Semiconductors & Semiconductor Equipment - 4.5% | | | |
| Intersil Corp. Class A | | 1,460,387 | 22,315 |
| Micron Technology, Inc. (a) | | 2,079,945 | 28,578 |
| NXP Semiconductors NV (a) | | 1,259,664 | 105,925 |
| | | | 156,818 |
| Software - 0.6% | | | |
| Citrix Systems, Inc. (a) | | 230,899 | 20,580 |
| Technology Hardware, Storage & Peripherals - 1.1% | | | |
| NCR Corp. (a) | | 1,117,931 | 36,858 |
|
| TOTAL INFORMATION TECHNOLOGY | | | 292,224 |
|
| MATERIALS - 14.2% | | | |
| Chemicals - 8.3% | | | |
| Ingevity Corp. (a) | | 431,788 | 16,525 |
| LyondellBasell Industries NV Class A | | 3,565,555 | 268,348 |
| Phosphate Holdings, Inc. (a) | | 307,500 | 2 |
| | | | 284,875 |
| Containers & Packaging - 3.9% | | | |
| Sealed Air Corp. | | 483,434 | 22,808 |
| WestRock Co. | | 2,590,728 | 111,168 |
| | | | 133,976 |
| Metals & Mining - 1.0% | | | |
| Alcoa, Inc. | | 1,432,700 | 15,215 |
| Freeport-McMoRan, Inc. | | 1,514,400 | 19,627 |
| Ormet Corp. (a)(d) | | 1,075,000 | 0 |
| | | | 34,842 |
| Paper & Forest Products - 1.0% | | | |
| Kapstone Paper & Packaging Corp. | | 989,200 | 14,126 |
| Neenah Paper, Inc. | | 266,200 | 20,079 |
| | | | 34,205 |
|
| TOTAL MATERIALS | | | 487,898 |
|
| TELECOMMUNICATION SERVICES - 1.6% | | | |
| Diversified Telecommunication Services - 1.6% | | | |
| Frontier Communications Corp. | | 5,528,256 | 28,747 |
| Level 3 Communications, Inc. (a) | | 514,400 | 26,029 |
| | | | 54,776 |
| UTILITIES - 0.4% | | | |
| Electric Utilities - 0.4% | | | |
| FirstEnergy Corp. | | 421,304 | 14,712 |
| TOTAL COMMON STOCKS | | | |
| (Cost $2,124,443) | | | 3,302,646 |
| | | Principal Amount (000s) | Value (000s) |
|
| Nonconvertible Bonds - 0.7% | | | |
| ENERGY - 0.3% | | | |
| Energy Equipment & Services - 0.1% | | | |
| SAExploration Holdings, Inc. 10% 4/14/19 (c) | | 5,004 | 3,502 |
| Oil, Gas & Consumable Fuels - 0.2% | | | |
| Chesapeake Energy Corp. 8% 12/15/22 (c) | | 7,680 | 6,682 |
|
| TOTAL ENERGY | | | 10,184 |
|
| MATERIALS - 0.4% | | | |
| Metals & Mining - 0.4% | | | |
| Freeport-McMoRan, Inc.: | | | |
| 3.55% 3/1/22 | | 7,675 | 6,562 |
| 3.875% 3/15/23 | | 7,675 | 6,601 |
| | | | 13,163 |
| TOTAL NONCONVERTIBLE BONDS | | | |
| (Cost $16,468) | | | 23,347 |
| | | Shares | Value (000s) |
|
| Money Market Funds - 3.8% | | | |
| Fidelity Cash Central Fund, 0.42% (e) | | 119,437,198 | 119,437 |
| Fidelity Securities Lending Cash Central Fund, 0.45% (e)(f) | | 9,990,000 | 9,990 |
| TOTAL MONEY MARKET FUNDS | | | |
| (Cost $129,427) | | | 129,427 |
| TOTAL INVESTMENT PORTFOLIO - 100.6% | | | |
| (Cost $2,270,338) | | | 3,455,420 |
| NET OTHER ASSETS (LIABILITIES) - (0.6)% | | | (20,677) |
| NET ASSETS - 100% | | | $3,434,743 |
Values shown as $0 may reflect amounts less than $500.
Legend
(a) Non-income producing
(b) Security or a portion of the security is on loan at period end.
(c) Security exempt from registration under Rule 144A of the Securities Act of 1933. These securities may be resold in transactions exempt from registration, normally to qualified institutional buyers. At the end of the period, the value of these securities amounted to $14,795,000 or 0.4% of net assets.
(d) Affiliated company
(e) Affiliated fund that is generally available only to investment companies and other accounts managed by Fidelity Investments. The rate quoted is the annualized seven-day yield of the fund at period end. A complete unaudited listing of the fund's holdings as of its most recent quarter end is available upon request. In addition, each Fidelity Central Fund's financial statements, which are not covered by the Fund's Report of Independent Registered Public Accounting Firm, are available on the SEC's website or upon request.
(f) Investment made with cash collateral received from securities on loan.
Affiliated Central Funds
Information regarding fiscal year to date income earned by the Fund from investments in Fidelity Central Funds is as follows:
| Fund | Income earned |
| | (Amounts in thousands) |
| Fidelity Cash Central Fund | $314 |
| Fidelity Securities Lending Cash Central Fund | 1,199 |
| Total | $1,513 |
Other Affiliated Issuers
An affiliated company is a company in which the Fund has ownership of at least 5% of the voting securities. Fiscal year to date transactions with companies which are or were affiliates are as follows:
| Affiliate (Amounts in thousands) | Value, beginning of period | Purchases | Sales Proceeds | Dividend Income | Value, end of period |
| Gray Television, Inc. | $63,611 | $-- | $30,602 | $-- | $-- |
| OMNOVA Solutions, Inc. | 20,154 | -- | 15,824 | -- | -- |
| Ormet Corp. | 5 | -- | -- | -- | 0 |
| SAExploration Holdings, Inc. | -- | -- | 248 | -- | -- |
| Total | $83,770 | $-- | $46,674 | $-- | $0 |
Investment Valuation
The following is a summary of the inputs used, as of July 31, 2016, involving the Fund's assets and liabilities carried at fair value. The inputs or methodology used for valuing securities may not be an indication of the risk associated with investing in those securities. For more information on valuation inputs, and their aggregation into the levels used below, please refer to the Investment Valuation section in the accompanying Notes to Financial Statements.
| | Valuation Inputs at Reporting Date: |
| Description | Total | Level 1 | Level 2 | Level 3 |
| (Amounts in thousands) | | | | |
| Investments in Securities: | | | | |
| Equities: | | | | |
| Consumer Discretionary | $818,722 | $818,594 | $128 | $-- |
| Consumer Staples | 87,545 | 87,545 | -- | -- |
| Energy | 204,816 | 204,816 | -- | -- |
| Financials | 415,204 | 415,204 | -- | -- |
| Health Care | 598,204 | 598,204 | -- | -- |
| Industrials | 328,545 | 328,545 | -- | -- |
| Information Technology | 292,224 | 292,224 | -- | -- |
| Materials | 487,898 | 487,898 | -- | -- |
| Telecommunication Services | 54,776 | 54,776 | -- | -- |
| Utilities | 14,712 | 14,712 | -- | -- |
| Corporate Bonds | 23,347 | -- | 23,347 | -- |
| Money Market Funds | 129,427 | 129,427 | -- | -- |
| Total Investments in Securities: | $3,455,420 | $3,431,945 | $23,475 | $-- |
Other Information
Distribution of investments by country or territory of incorporation, as a percentage of Total Net Assets, is as follows (Unaudited):
| United States of America | 84.1% |
| Netherlands | 10.9% |
| Ireland | 1.9% |
| Canada | 1.4% |
| Others (Individually Less Than 1%) | 1.7% |
| | 100.0% |
See accompanying notes which are an integral part of the financial statements.
Financial Statements
Statement of Assets and Liabilities
| Amounts in thousands (except per-share amounts) | | July 31, 2016 |
| Assets | | |
Investment in securities, at value (including securities loaned of $9,637) — See accompanying schedule:
Unaffiliated issuers (cost $2,120,355) | $3,325,993 | |
| Fidelity Central Funds (cost $129,427) | 129,427 | |
| Other affiliated issuers (cost $20,556) | 0 | |
| Total Investments (cost $2,270,338) | | $3,455,420 |
| Receivable for fund shares sold | | 885 |
| Dividends receivable | | 1,274 |
| Interest receivable | | 345 |
| Distributions receivable from Fidelity Central Funds | | 55 |
| Other receivables | | 46 |
| Total assets | | 3,458,025 |
| Liabilities | | |
| Payable for fund shares redeemed | $11,009 | |
| Accrued management fee | 1,714 | |
| Other affiliated payables | 508 | |
| Other payables and accrued expenses | 61 | |
| Collateral on securities loaned, at value | 9,990 | |
| Total liabilities | | 23,282 |
| Net Assets | | $3,434,743 |
| Net Assets consist of: | | |
| Paid in capital | | $2,041,379 |
| Undistributed net investment income | | 19,397 |
| Accumulated undistributed net realized gain (loss) on investments and foreign currency transactions | | 188,885 |
| Net unrealized appreciation (depreciation) on investments | | 1,185,082 |
| Net Assets | | $3,434,743 |
| Leveraged Company Stock: | | |
| Net Asset Value, offering price and redemption price per share ($2,861,447 ÷ 70,346 shares) | | $40.68 |
| Class K: | | |
| Net Asset Value, offering price and redemption price per share ($573,296 ÷ 14,065 shares) | | $40.76 |
See accompanying notes which are an integral part of the financial statements.
Statement of Operations
| Amounts in thousands | | Year ended July 31, 2016 |
| Investment Income | | |
| Dividends | | $65,759 |
| Interest | | 2,380 |
| Income from Fidelity Central Funds | | 1,513 |
| Total income | | 69,652 |
| Expenses | | |
| Management fee | $22,785 | |
| Transfer agent fees | 5,511 | |
| Accounting and security lending fees | 1,055 | |
| Custodian fees and expenses | 32 | |
| Independent trustees' fees and expenses | 17 | |
| Registration fees | 51 | |
| Audit | 65 | |
| Legal | 18 | |
| Miscellaneous | 34 | |
| Total expenses before reductions | 29,568 | |
| Expense reductions | (123) | 29,445 |
| Net investment income (loss) | | 40,207 |
| Realized and Unrealized Gain (Loss) | | |
| Net realized gain (loss) on: | | |
| Investment securities: | | |
| Unaffiliated issuers | 300,346 | |
| Other affiliated issuers | (9,340) | |
| Foreign currency transactions | 2 | |
| Total net realized gain (loss) | | 291,008 |
| Change in net unrealized appreciation (depreciation) on investment securities | | (703,593) |
| Net gain (loss) | | (412,585) |
| Net increase (decrease) in net assets resulting from operations | | $(372,378) |
See accompanying notes which are an integral part of the financial statements.
Statement of Changes in Net Assets
| Amounts in thousands | Year ended July 31, 2016 | Year ended July 31, 2015 |
| Increase (Decrease) in Net Assets | | |
| Operations | | |
| Net investment income (loss) | $40,207 | $45,844 |
| Net realized gain (loss) | 291,008 | 235,817 |
| Change in net unrealized appreciation (depreciation) | (703,593) | (131,060) |
| Net increase (decrease) in net assets resulting from operations | (372,378) | 150,601 |
| Distributions to shareholders from net investment income | (39,813) | (41,090) |
| Distributions to shareholders from net realized gain | (240,243) | – |
| Total distributions | (280,056) | (41,090) |
| Share transactions - net increase (decrease) | (659,264) | (743,092) |
| Redemption fees | 156 | 302 |
| Total increase (decrease) in net assets | (1,311,542) | (633,279) |
| Net Assets | | |
| Beginning of period | 4,746,285 | 5,379,564 |
| End of period | $3,434,743 | $4,746,285 |
| Other Information | | |
| Undistributed net investment income end of period | $19,397 | $24,974 |
See accompanying notes which are an integral part of the financial statements.
Financial Highlights — Fidelity Leveraged Company Stock Fund
| Years ended July 31, | 2016 | 2015 | 2014 | 2013 | 2012 |
| Selected Per–Share Data | | | | | |
| Net asset value, beginning of period | $46.90 | $45.82 | $39.44 | $28.22 | $28.85 |
| Income from Investment Operations | | | | | |
| Net investment income (loss)A | .41 | .41 | .34 | .42B | .16 |
| Net realized and unrealized gain (loss) | (3.77) | 1.01 | 6.31 | 10.92 | (.50) |
| Total from investment operations | (3.36) | 1.42 | 6.65 | 11.34 | (.34) |
| Distributions from net investment income | (.40) | (.34) | (.27) | (.12) | (.29) |
| Distributions from net realized gain | (2.46) | – | – | – | – |
| Total distributions | (2.86) | (.34) | (.27) | (.12) | (.29) |
| Redemption fees added to paid in capitalA,C | – | – | – | – | – |
| Net asset value, end of period | $40.68 | $46.90 | $45.82 | $39.44 | $28.22 |
| Total ReturnD | (7.23)% | 3.12% | 16.96% | 40.31% | (1.05)% |
| Ratios to Average Net AssetsE,F | | | | | |
| Expenses before reductions | .80% | .79% | .79% | .82% | .86% |
| Expenses net of fee waivers, if any | .80% | .78% | .79% | .82% | .86% |
| Expenses net of all reductions | .80% | .78% | .79% | .82% | .85% |
| Net investment income (loss) | 1.03% | .87% | .81% | 1.25%B | .60% |
| Supplemental Data | | | | | |
| Net assets, end of period (in millions) | $2,861 | $3,755 | $4,207 | $4,227 | $3,009 |
| Portfolio turnover rateG | 9% | 4% | 10% | 21% | 29% |
A Calculated based on average shares outstanding during the period.
B Net Investment income per share reflects a large, non-recurring dividend which amounted to $.08 per share. Excluding this non-recurring dividend, the ratio of net investment income (loss) to average net assets would have been 1.03%.
C Amount represents less than $.005 per share.
D Total returns would have been lower if certain expenses had not been reduced during the applicable periods shown.
E Fees and expenses of any underlying Fidelity Central Funds are not included in the Fund's expense ratio. The Fund indirectly bears its proportionate share of the expenses of any underlying Fidelity Central Funds.
F Expense ratios reflect operating expenses of the class. Expenses before reductions do not reflect amounts reimbursed by the investment adviser or reductions from brokerage service arrangements or reductions from other expense offset arrangements and do not represent the amount paid by the class during periods when reimbursements or reductions occur. Expenses net of fee waivers reflect expenses after reimbursement by the investment adviser but prior to reductions from brokerage service arrangements or other expense offset arrangements. Expenses net of all reductions represent the net expenses paid by the class.
G Amount does not include the portfolio activity of any underlying Fidelity Central Funds.
See accompanying notes which are an integral part of the financial statements.
Financial Highlights — Fidelity Leveraged Company Stock Fund Class K
| Years ended July 31, | 2016 | 2015 | 2014 | 2013 | 2012 |
| Selected Per–Share Data | | | | | |
| Net asset value, beginning of period | $47.00 | $45.91 | $39.52 | $28.26 | $28.86 |
| Income from Investment Operations | | | | | |
| Net investment income (loss)A | .46 | .46 | .40 | .47B | .20 |
| Net realized and unrealized gain (loss) | (3.79) | 1.03 | 6.31 | 10.93 | (.49) |
| Total from investment operations | (3.33) | 1.49 | 6.71 | 11.40 | (.29) |
| Distributions from net investment income | (.45) | (.40) | (.32) | (.14) | (.31) |
| Distributions from net realized gain | (2.46) | – | – | – | – |
| Total distributions | (2.91) | (.40) | (.32) | (.14) | (.31) |
| Redemption fees added to paid in capitalA,C | – | – | – | – | – |
| Net asset value, end of period | $40.76 | $47.00 | $45.91 | $39.52 | $28.26 |
| Total ReturnD | (7.14)% | 3.26% | 17.10% | 40.47% | (.87)% |
| Ratios to Average Net AssetsE,F | | | | | |
| Expenses before reductions | .68% | .67% | .67% | .69% | .69% |
| Expenses net of fee waivers, if any | .68% | .67% | .67% | .69% | .69% |
| Expenses net of all reductions | .68% | .67% | .67% | .68% | .69% |
| Net investment income (loss) | 1.15% | .99% | .92% | 1.39%B | .76% |
| Supplemental Data | | | | | |
| Net assets, end of period (in millions) | $573 | $991 | $1,173 | $1,053 | $600 |
| Portfolio turnover rateG | 9% | 4% | 10% | 21% | 29% |
A Calculated based on average shares outstanding during the period.
B Net Investment income per share reflects a large, non-recurring dividend which amounted to $.08 per share. Excluding this non-recurring dividend, the ratio of net investment income (loss) to average net assets would have been 1.17%.
C Amount represents less than $.005 per share.
D Total returns would have been lower if certain expenses had not been reduced during the applicable periods shown.
E Fees and expenses of any underlying Fidelity Central Funds are not included in the Fund's expense ratio. The Fund indirectly bears its proportionate share of the expenses of any underlying Fidelity Central Funds.
F Expense ratios reflect operating expenses of the class. Expenses before reductions do not reflect amounts reimbursed by the investment adviser or reductions from brokerage service arrangements or reductions from other expense offset arrangements and do not represent the amount paid by the class during periods when reimbursements or reductions occur. Expenses net of fee waivers reflect expenses after reimbursement by the investment adviser but prior to reductions from brokerage service arrangements or other expense offset arrangements. Expenses net of all reductions represent the net expenses paid by the class.
G Amount does not include the portfolio activity of any underlying Fidelity Central Funds.
See accompanying notes which are an integral part of the financial statements.
Notes to Financial Statements
For the period ended July 31, 2016
(Amounts in thousands except percentages)
1. Organization.
Fidelity Leveraged Company Stock Fund (the Fund) is a fund of Fidelity Securities Fund (the Trust) and is authorized to issue an unlimited number of shares. The Trust is registered under the Investment Company Act of 1940, as amended (the 1940 Act), as an open-end management investment company organized as a Massachusetts business trust. The Fund offers Leveraged Company Stock and Class K shares, each of which has equal rights as to assets and voting privileges. Each class has exclusive voting rights with respect to matters that affect that class.
2. Investments in Fidelity Central Funds.
The Fund invests in Fidelity Central Funds, which are open-end investment companies generally available only to other investment companies and accounts managed by the investment adviser and its affiliates. The Fund's Schedule of Investments lists each of the Fidelity Central Funds held as of period end, if any, as an investment of the Fund, but does not include the underlying holdings of each Fidelity Central Fund. As an Investing Fund, the Fund indirectly bears its proportionate share of the expenses of the underlying Fidelity Central Funds.
The Money Market Central Funds seek preservation of capital and current income and are managed by Fidelity Investments Money Management, Inc. (FIMM), an affiliate of the investment adviser. Annualized expenses of the Money Market Central Funds as of their most recent shareholder report date are less than .005%.
A complete unaudited list of holdings for each Fidelity Central Fund is available upon request or at the Securities and Exchange Commission (the SEC) website at www.sec.gov. In addition, the financial statements of the Fidelity Central Funds, which are not covered by the Fund's Report of Independent Registered Public Accounting Firm, are available on the SEC website or upon request.
3. Significant Accounting Policies.
The financial statements have been prepared in conformity with accounting principles generally accepted in the United States of America (GAAP), which require management to make certain estimates and assumptions at the date of the financial statements. Actual results could differ from those estimates. Subsequent events, if any, through the date that the financial statements were issued have been evaluated in the preparation of the financial statements. The following summarizes the significant accounting policies of the Fund:
Investment Valuation. Investments are valued as of 4:00 p.m. Eastern time on the last calendar day of the period. The Board of Trustees (the Board) has delegated the day to day responsibility for the valuation of the Fund's investments to the Fidelity Management & Research Company (FMR) Fair Value Committee (the Committee). In accordance with valuation policies and procedures approved by the Board, the Fund attempts to obtain prices from one or more third party pricing vendors or brokers to value its investments. When current market prices, quotations or currency exchange rates are not readily available or reliable, investments will be fair valued in good faith by the Committee, in accordance with procedures adopted by the Board. Factors used in determining fair value vary by investment type and may include market or investment specific events, changes in interest rates and credit quality. The frequency with which these procedures are used cannot be predicted and they may be utilized to a significant extent. The Committee oversees the Fund's valuation policies and procedures and reports to the Board on the Committee's activities and fair value determinations. The Board monitors the appropriateness of the procedures used in valuing the Fund's investments and ratifies the fair value determinations of the Committee.
The Fund categorizes the inputs to valuation techniques used to value its investments into a disclosure hierarchy consisting of three levels as shown below:
- Level 1 – quoted prices in active markets for identical investments
- Level 2 – other significant observable inputs (including quoted prices for similar investments, interest rates, prepayment speeds, etc.)
- Level 3 – unobservable inputs (including the Fund's own assumptions based on the best information available)
Valuation techniques used to value the Fund's investments by major category are as follows:
Equity securities, including restricted securities, for which market quotations are readily available, are valued at the last reported sale price or official closing price as reported by a third party pricing vendor on the primary market or exchange on which they are traded and are categorized as Level 1 in the hierarchy. In the event there were no sales during the day or closing prices are not available, securities are valued at the last quoted bid price or may be valued using the last available price and are generally categorized as Level 2 in the hierarchy. For foreign equity securities, when market or security specific events arise, comparisons to the valuation of American Depositary Receipts (ADRs), futures contracts, Exchange-Traded Funds (ETFs) and certain indexes as well as quoted prices for similar securities may be used and would be categorized as Level 2 in the hierarchy. Utilizing these techniques may result in transfers between Level 1 and Level 2. For equity securities, including restricted securities, where observable inputs are limited, assumptions about market activity and risk are used and these securities may be categorized as Level 3 in the hierarchy.
Debt securities, including restricted securities, are valued based on evaluated prices received from third party pricing vendors or from brokers who make markets in such securities. Corporate bonds are valued by pricing vendors who utilize matrix pricing which considers yield or price of bonds of comparable quality, coupon, maturity and type or by broker-supplied prices. When independent prices are unavailable or unreliable, debt securities may be valued utilizing pricing methodologies which consider similar factors that would be used by third party pricing vendors. Debt securities are generally categorized as Level 2 in the hierarchy but may be Level 3 depending on the circumstances.
Investments in open-end mutual funds, including the Fidelity Central Funds, are valued at their closing net asset value (NAV) each business day and are categorized as Level 1 in the hierarchy.
Changes in valuation techniques may result in transfers in or out of an assigned level within the disclosure hierarchy. The aggregate value of investments by input level as of July 31, 2016 is included at the end of the Fund's Schedule of Investments.
Foreign Currency. The Fund may use foreign currency contracts to facilitate transactions in foreign-denominated securities. Gains and losses from these transactions may arise from changes in the value of the foreign currency or if the counterparties do not perform under the contracts' terms.
Foreign-denominated assets, including investment securities, and liabilities are translated into U.S. dollars at the exchange rates at period end. Purchases and sales of investment securities, income and dividends received and expenses denominated in foreign currencies are translated into U.S. dollars at the exchange rate in effect on the transaction date.
The effects of exchange rate fluctuations on investments are included with the net realized and unrealized gain (loss) on investment securities. Other foreign currency transactions resulting in realized and unrealized gain (loss) are disclosed separately.
Investment Transactions and Income. For financial reporting purposes, the Fund's investment holdings and NAV include trades executed through the end of the last business day of the period. The NAV per share for processing shareholder transactions is calculated as of the close of business of the New York Stock Exchange (NYSE), normally 4:00 p.m. Eastern time and includes trades executed through the end of the prior business day. Gains and losses on securities sold are determined on the basis of identified cost and may include proceeds received from litigation. Dividend income is recorded on the ex-dividend date, except for certain dividends from foreign securities where the ex-dividend date may have passed, which are recorded as soon as the Fund is informed of the ex-dividend date. Non-cash dividends included in dividend income, if any, are recorded at the fair market value of the securities received. Income and capital gain distributions from Fidelity Central Funds, if any, are recorded on the ex-dividend date. Distributions received on securities that represent a return of capital or capital gain are recorded as a reduction of cost of investments and/or as a realized gain. Subsequent to ex-dividend date the Fund determines the components of these distributions, based upon receipt of tax filings or other correspondence relating to the underlying investment. Interest income is accrued as earned and includes coupon interest and amortization of premium and accretion of discount on debt securities as applicable. Investment income is recorded net of foreign taxes withheld where recovery of such taxes is uncertain.
Class Allocations and Expenses. Investment income, realized and unrealized capital gains and losses, common expenses of the Fund, and certain fund-level expense reductions, if any, are allocated daily on a pro-rata basis to each class based on the relative net assets of each class to the total net assets of the Fund. Each class differs with respect to transfer agent fees incurred. Certain expense reductions may also differ by class. For the reporting period, the allocated portion of income and expenses to each class as a percent of its average net assets may vary due to the timing of recording these transactions in relation to fluctuating net assets of the classes. Expenses directly attributable to a fund are charged to that fund. Expenses attributable to more than one fund are allocated among the respective funds on the basis of relative net assets or other appropriate methods. Expense estimates are accrued in the period to which they relate and adjustments are made when actual amounts are known.
Income Tax Information and Distributions to Shareholders. Each year, the Fund intends to qualify as a regulated investment company under Subchapter M of the Internal Revenue Code, including distributing substantially all of its taxable income and realized gains. As a result, no provision for U.S. Federal income taxes is required. As of July 31, 2016, the Fund did not have any unrecognized tax benefits in the financial statements; nor is the Fund aware of any tax positions for which it is reasonably possible that the total amounts of unrecognized tax benefits will significantly change in the next twelve months. The Fund files a U.S. federal tax return, in addition to state and local tax returns as required. The Fund's federal income tax returns are subject to examination by the Internal Revenue Service (IRS) for a period of three fiscal years after they are filed. State and local tax returns may be subject to examination for an additional fiscal year depending on the jurisdiction. Foreign taxes are provided for based on the Fund's understanding of the tax rules and rates that exist in the foreign markets in which it invests.
Distributions are declared and recorded on the ex-dividend date. Income dividends and capital gain distributions are declared separately for each class. Income and capital gain distributions are determined in accordance with income tax regulations, which may differ from GAAP. In addition, the Fund claimed a portion of the payment made to redeeming shareholders as a distribution for income tax purposes.
Capital accounts within the financial statements are adjusted for permanent book-tax differences. These adjustments have no impact on net assets or the results of operations. Capital accounts are not adjusted for temporary book-tax differences which will reverse in a subsequent period.
Book-tax differences are primarily due to foreign currency transactions, market discount, equity-debt classifications and losses deferred due to wash sales.
The federal tax cost of investment securities and unrealized appreciation (depreciation) as of period end were as follows:
| Gross unrealized appreciation | $1,367,964 |
| Gross unrealized depreciation | (183,832) |
| Net unrealized appreciation (depreciation) on securities | $1,184,132 |
| Tax Cost | $2,271,288 |
The tax-based components of distributable earnings as of period end were as follows:
| Undistributed ordinary income | $19,014 |
| Undistributed long-term capital gain | $190,218 |
| Net unrealized appreciation (depreciation) on securities and other investments | $1,184,132 |
The tax character of distributions paid was as follows:
| | July 31, 2016 | July 31, 2015 |
| Ordinary Income | $39,813 | $ 41,090 |
| Long-term Capital Gains | 240,243 | – |
| Total | $280,056 | $ 41,090 |
Short-Term Trading (Redemption) Fees. Shares held by investors in the Fund less than 90 days may have been subject to a redemption fee equal to 1.50% of the NAV of shares redeemed All redemption fees, which reduce the proceeds of the shareholder redemption, are retained by the Fund and accounted for as an addition to paid in capital.
Restricted Securities. The Fund may invest in securities that are subject to legal or contractual restrictions on resale. These securities generally may be resold in transactions exempt from registration or to the public if the securities are registered. Disposal of these securities may involve time-consuming negotiations and expense, and prompt sale at an acceptable price may be difficult. Information regarding restricted securities is included at the end of the Fund's Schedule of Investments.
4. Purchases and Sales of Investments.
Purchases and sales of securities, other than short-term securities, aggregated $334,892 and $1,205,664, respectively.
5. Fees and Other Transactions with Affiliates.
Management Fee. Fidelity Management & Research Company (the investment adviser) and its affiliates provide the Fund with investment management related services for which the Fund pays a monthly management fee. The management fee is the sum of an individual fund fee rate that is based on an annual rate of .35% of the Fund's average net assets and an annualized group fee rate that averaged .25% during the period. The group fee rate is based upon the average net assets of all the mutual funds advised by the investment adviser, including any mutual funds previously advised by the investment adviser that are currently advised by Fidelity SelectCo, LLC, an affiliate of the investment adviser. The group fee rate decreases as assets under management increase and increases as assets under management decrease. For the reporting period, the total annual management fee rate was .60% of the Fund's average net assets.
Transfer Agent Fees. Fidelity Investments Institutional Operations Company, Inc., (FIIOC), an affiliate of the investment adviser, is the transfer, dividend disbursing and shareholder servicing agent for each class of the Fund. FIIOC receives account fees and asset-based fees that vary according to the account size and type of account of the shareholders of Leveraged Company Stock, except for Class K. FIIOC receives an asset-based fee of Class K's average net assets. FIIOC pays for typesetting, printing and mailing of shareholder reports, except proxy statements.
For the period, transfer agent fees for each class were as follows:
| | Amount | % of
Class-Level Average
Net Assets |
| Leveraged Company Stock | $5,179 | .17 |
| Class K | 332 | .05 |
| | $5,511 | |
Accounting and Security Lending Fees. Fidelity Service Company, Inc. (FSC), an affiliate of the investment adviser, maintains the Fund's accounting records. The accounting fee is based on the level of average net assets for each month. Under a separate contract, FSC administers the security lending program. The security lending fee is based on the number and duration of lending transactions.
Brokerage Commissions. The Fund placed a portion of its portfolio transactions with brokerage firms which are affiliates of the investment adviser. Brokerage commissions are included in net realized gain (loss) and change in net unrealized appreciation (depreciation) in the Statement of Operations. The commissions paid to these affiliated firms were $20 for the period.
Interfund Trades. The Fund may purchase from or sell securities to other Fidelity Funds under procedures adopted by the Board. The procedures have been designed to ensure these interfund trades are executed in accordance with Rule 17a-7 of the 1940 Act. Interfund trades are included within the respective purchases and sales amounts shown in the Purchases and Sales of Investments note.
Other. During the period, the investment adviser reimbursed the Fund for certain losses in the amount of $3.
6. Committed Line of Credit.
The Fund participates with other funds managed by the investment adviser or an affiliate in a $4.25 billion credit facility (the "line of credit") to be utilized for temporary or emergency purposes to fund shareholder redemptions or for other short-term liquidity purposes. The Fund has agreed to pay commitment fees on its pro-rata portion of the line of credit, which amounted to $8 and is reflected in Miscellaneous expenses on the Statement of Operations. During the period, the Fund did not borrow on this line of credit.
7. Security Lending.
The Fund lends portfolio securities through a lending agent from time to time in order to earn additional income. For equity securities, a lending agent is used and may loan securities to certain qualified borrowers, including Fidelity Capital Markets (FCM), a broker-dealer affiliated with the Fund. On the settlement date of the loan, the Fund receives collateral (in the form of U.S. Treasury obligations, letters of credit and/or cash) against the loaned securities and maintains collateral in an amount not less than 100% of the market value of the loaned securities during the period of the loan. The market value of the loaned securities is determined at the close of business of the Fund and any additional required collateral is delivered to the Fund on the next business day. The Fund or borrower may terminate the loan at any time, and if the borrower defaults on its obligation to return the securities loaned because of insolvency or other reasons, the Fund may apply collateral received from the borrower against the obligation. The Fund may experience delays and costs in recovering the securities loaned. Any cash collateral received is invested in the Fidelity Securities Lending Cash Central Fund. The value of loaned securities and cash collateral at period end are disclosed on the Fund's Statement of Assets and Liabilities. Security lending income represents the income earned on investing cash collateral, less rebates paid to borrowers and any lending agent fees associated with the loan, plus any premium payments received for lending certain types of securities. Security lending income is presented in the Statement of Operations as a component of income from Fidelity Central Funds. Total security lending income during the period amounted to $1,199, including $139 from securities loaned to FCM.
8. Expense Reductions.
Commissions paid to certain brokers with whom the investment adviser, or its affiliates, places trades on behalf of the Fund include an amount in addition to trade execution, which may be rebated back to the Fund to offset certain expenses. This amount totaled $94 for the period.
In addition, during the period the investment adviser reimbursed and/or waived a portion of fund-level operating expenses in the amount of $29.
9. Distributions to Shareholders.
Distributions to shareholders of each class were as follows:
| | Year ended
July 31, 2016 | Year ended July 31, 2015 |
| From net investment income | | |
| Leveraged Company Stock | $31,472 | $30,775 |
| Class K | 8,341 | 10,315 |
| Total | $39,813 | $41,090 |
| From net realized gain | | |
| Leveraged Company Stock | $194,477 | $– |
| Class K | 45,766 | – |
| Total | $240,243 | $– |
10. Share Transactions.
Share transactions for each class were as follows and may contain automatic conversions between classes or exchanges between affiliated funds:
| | Shares | Shares | Dollars | Dollars |
| | Year ended
July 31, 2016 | Year ended July 31, 2015 | Year ended
July 31, 2016 | Year ended July 31, 2015 |
| Leveraged Company Stock | | | | |
| Shares sold | 3,277 | 5,334 | $130,866 | $246,873 |
| Reinvestment of distributions | 5,086 | 626 | 212,362 | 29,028 |
| Shares redeemed | (18,084) | (17,699) | (716,560) | (811,035) |
| Net increase (decrease) | (9,721) | (11,739) | $(373,332) | $(535,134) |
| Class K | | | | |
| Shares sold | 2,482 | 5,815 | $96,640 | $269,619 |
| Reinvestment of distributions | 1,294 | 222 | 54,107 | 10,315 |
| Shares redeemed | (10,794) | (10,500) | (436,679) | (487,892) |
| Net increase (decrease) | (7,018) | (4,463) | $(285,932) | $(207,958) |
11. Other.
The Fund's organizational documents provide former and current trustees and officers with a limited indemnification against liabilities arising in connection with the performance of their duties to the Fund. In the normal course of business, the Fund may also enter into contracts that provide general indemnifications. The Fund's maximum exposure under these arrangements is unknown as this would be dependent on future claims that may be made against the Fund. The risk of material loss from such claims is considered remote.
Report of Independent Registered Public Accounting Firm
To the Trustees of Fidelity Securities Fund and Shareholders of Fidelity Leveraged Company Stock Fund:
In our opinion, the accompanying statement of assets and liabilities, including the schedule of investments, and the related statements of operations and of changes in net assets and the financial highlights present fairly, in all material respects, the financial position of Fidelity Leveraged Company Stock Fund (a fund of Fidelity Securities Fund) at July 31, 2016, the results of its operations for the year then ended, the changes in its net assets for each of the two years in the period then ended and the financial highlights for each of the five years in the period then ended, in conformity with accounting principles generally accepted in the United States of America. These financial statements and financial highlights (hereafter referred to as “financial statements”) are the responsibility of the Fidelity Leveraged Company Stock Fund’s management. Our responsibility is to express an opinion on these financial statements based on our audits. We conducted our audits of these financial statements in accordance with the standards of the Public Company Accounting Oversight Board (United States). Those standards require that we plan and perform the audit to obtain reasonable assurance about whether the financial statements are free of material misstatement. An audit includes examining, on a test basis, evidence supporting the amounts and disclosures in the financial statements, assessing the accounting principles used and significant estimates made by management, and evaluating the overall financial statement presentation. We believe that our audits, which included confirmation of securities at July 31, 2016 by correspondence with the custodian and brokers, provide a reasonable basis for our opinion.
PricewaterhouseCoopers LLP
Boston, Massachusetts
September 20, 2016
Trustees and Officers
The Trustees, Members of the Advisory Board (if any), and officers of the trust and fund, as applicable, are listed below. The Board of Trustees governs the fund and is responsible for protecting the interests of shareholders. The Trustees are experienced executives who meet periodically throughout the year to oversee the fund's activities, review contractual arrangements with companies that provide services to the fund, oversee management of the risks associated with such activities and contractual arrangements, and review the fund's performance. Each of the Trustees oversees 170 funds.
The Trustees hold office without limit in time except that (a) any Trustee may resign; (b) any Trustee may be removed by written instrument, signed by at least two-thirds of the number of Trustees prior to such removal; (c) any Trustee who requests to be retired or who has become incapacitated by illness or injury may be retired by written instrument signed by a majority of the other Trustees; and (d) any Trustee may be removed at any special meeting of shareholders by a two-thirds vote of the outstanding voting securities of the trust. Each Trustee who is not an interested person (as defined in the 1940 Act) of the trust and the fund is referred to herein as an Independent Trustee. Each Independent Trustee shall retire not later than the last day of the calendar year in which his or her 75th birthday occurs. The Independent Trustees may waive this mandatory retirement age policy with respect to individual Trustees. Officers and Advisory Board Members hold office without limit in time, except that any officer or Advisory Board Member may resign or may be removed by a vote of a majority of the Trustees at any regular meeting or any special meeting of the Trustees. Except as indicated, each individual has held the office shown or other offices in the same company for the past five years.
The fund’s Statement of Additional Information (SAI) includes more information about the Trustees. To request a free copy, call Fidelity at 1-800-544-8544.
Experience, Skills, Attributes, and Qualifications of the Trustees. The Governance and Nominating Committee has adopted a statement of policy that describes the experience, qualifications, attributes, and skills that are necessary and desirable for potential Independent Trustee candidates (Statement of Policy). The Board believes that each Trustee satisfied at the time he or she was initially elected or appointed a Trustee, and continues to satisfy, the standards contemplated by the Statement of Policy. The Governance and Nominating Committee also engages professional search firms to help identify potential Independent Trustee candidates who have the experience, qualifications, attributes, and skills consistent with the Statement of Policy. From time to time, additional criteria based on the composition and skills of the current Independent Trustees, as well as experience or skills that may be appropriate in light of future changes to board composition, business conditions, and regulatory or other developments, have also been considered by the professional search firms and the Governance and Nominating Committee. In addition, the Board takes into account the Trustees' commitment and participation in Board and committee meetings, as well as their leadership of standing and ad hoc committees throughout their tenure.
In determining that a particular Trustee was and continues to be qualified to serve as a Trustee, the Board has considered a variety of criteria, none of which, in isolation, was controlling. The Board believes that, collectively, the Trustees have balanced and diverse experience, qualifications, attributes, and skills, which allow the Board to operate effectively in governing the fund and protecting the interests of shareholders. Information about the specific experience, skills, attributes, and qualifications of each Trustee, which in each case led to the Board's conclusion that the Trustee should serve (or continue to serve) as a trustee of the fund, is provided below.
Board Structure and Oversight Function. James C. Curvey is an interested person and currently serves as Chairman. The Trustees have determined that an interested Chairman is appropriate and benefits shareholders because an interested Chairman has a personal and professional stake in the quality and continuity of services provided to the fund. Independent Trustees exercise their informed business judgment to appoint an individual of their choosing to serve as Chairman, regardless of whether the Trustee happens to be independent or a member of management. The Independent Trustees have determined that they can act independently and effectively without having an Independent Trustee serve as Chairman and that a key structural component for assuring that they are in a position to do so is for the Independent Trustees to constitute a substantial majority for the Board. The Independent Trustees also regularly meet in executive session. Ned C. Lautenbach serves as Chairman of the Independent Trustees and as such (i) acts as a liaison between the Independent Trustees and management with respect to matters important to the Independent Trustees and (ii) with management prepares agendas for Board meetings.
Fidelity® funds are overseen by different Boards of Trustees. The fund's Board oversees Fidelity's high income and certain equity funds, and other Boards oversee Fidelity's investment-grade bond, money market, asset allocation, and sector funds. The asset allocation funds may invest in Fidelity® funds overseen by the fund's Board. The use of separate Boards, each with its own committee structure, allows the Trustees of each group of Fidelity® funds to focus on the unique issues of the funds they oversee, including common research, investment, and operational issues. On occasion, the separate Boards establish joint committees to address issues of overlapping consequences for the Fidelity® funds overseen by each Board.
The Trustees operate using a system of committees to facilitate the timely and efficient consideration of all matters of importance to the Trustees, the fund, and fund shareholders and to facilitate compliance with legal and regulatory requirements and oversight of the fund's activities and associated risks. The Board, acting through its committees, has charged FMR and its affiliates with (i) identifying events or circumstances the occurrence of which could have demonstrably adverse effects on the fund's business and/or reputation; (ii) implementing processes and controls to lessen the possibility that such events or circumstances occur or to mitigate the effects of such events or circumstances if they do occur; and (iii) creating and maintaining a system designed to evaluate continuously business and market conditions in order to facilitate the identification and implementation processes described in (i) and (ii) above. Because the day-to-day operations and activities of the fund are carried out by or through FMR, its affiliates, and other service providers, the fund's exposure to risks is mitigated but not eliminated by the processes overseen by the Trustees. While each of the Board's committees has responsibility for overseeing different aspects of the fund's activities, oversight is exercised primarily through the Operations, Audit, and Compliance Committees. In addition, the Independent Trustees have worked with FMR to enhance the Board's oversight of investment and financial risks, legal and regulatory risks, technology risks, and operational risks, including the development of additional risk reporting to the Board. For example, a working group comprised of Independent Trustees and FMR has worked and continues to work to review the Fidelity® funds' valuation-related activities, reporting and risk management. Appropriate personnel, including but not limited to the fund's Chief Compliance Officer (CCO), FMR's internal auditor, the independent accountants, the fund's Treasurer and portfolio management personnel, make periodic reports to the Board's committees, as appropriate, including an annual review of Fidelity's risk management program for the Fidelity® funds. The responsibilities of each standing committee, including their oversight responsibilities, are described further under "Standing Committees of the Trustees."
Interested Trustees*:
Correspondence intended for a Trustee who is an interested person may be sent to Fidelity Investments, 245 Summer Street, Boston, Massachusetts 02210.
Name, Year of Birth; Principal Occupations and Other Relevant Experience+
James C. Curvey (1935)
Year of Election or Appointment: 2007
Trustee
Chairman of the Board of Trustees
Mr. Curvey also serves as Trustee of other Fidelity® funds. Mr. Curvey is a Director of Fidelity Research & Analysis Co. (investment adviser firm, 2009-present), and Vice Chairman (2007-present) and Director of FMR LLC (diversified financial services company). In addition, Mr. Curvey serves as an Overseer for the Boston Symphony Orchestra and a member of the board of Artis-Naples, Naples, Florida, and as a Trustee for Brewster Academy, Wolfeboro, New Hampshire. Previously, Mr. Curvey served as a Director of Fidelity Investments Money Management, Inc. (investment adviser firm, 2009-2014) and a Director of FMR and FMR Co., Inc. (investment adviser firms, 2007-2014).
Charles S. Morrison (1960)
Year of Election or Appointment: 2014
Trustee
Mr. Morrison also serves as Trustee of other funds. He serves as a Director of Fidelity Investments Money Management, Inc. (FIMM) (investment adviser firm, 2014-present), Director of Fidelity SelectCo, LLC (investment adviser firm, 2014-present), President, Asset Management (2014-present), and is an employee of Fidelity Investments. Previously, Mr. Morrison served as Vice President of Fidelity's Fixed Income and Asset Allocation Funds (2012-2014), President, Fixed Income (2011-2014), Vice President of Fidelity's Money Market Funds (2005-2009), President, Money Market Group Leader of FMR (investment adviser firm, 2009), and Senior Vice President, Money Market Group of FMR (2004-2009). Mr. Morrison also served as Vice President of Fidelity's Bond Funds (2002-2005), certain Balanced Funds (2002-2005), and certain Asset Allocation Funds (2002-2007), and as Senior Vice President (2002-2005) of Fidelity's Bond Division.
* Determined to be an “Interested Trustee” by virtue of, among other things, his or her affiliation with the trust or various entities under common control with FMR.
+ The information includes the Trustee's principal occupation during the last five years and other information relating to the experience, attributes, and skills relevant to the Trustee's qualifications to serve as a Trustee, which led to the conclusion that the Trustee should serve as a Trustee for the fund.
Independent Trustees:
Correspondence intended for an Independent Trustee may be sent to Fidelity Investments, P.O. Box 55235, Boston, Massachusetts 02205-5235.
Name, Year of Birth; Principal Occupations and Other Relevant Experience+
Dennis J. Dirks (1948)
Year of Election or Appointment: 2005
Trustee
Mr. Dirks also serves as Trustee of other Fidelity® funds. Prior to his retirement in May 2003, Mr. Dirks was Chief Operating Officer and a member of the Board of The Depository Trust & Clearing Corporation (DTCC). He also served as President, Chief Operating Officer, and Board member of The Depository Trust Company (DTC) and President and Board member of the National Securities Clearing Corporation (NSCC). In addition, Mr. Dirks served as Chief Executive Officer and Board member of the Government Securities Clearing Corporation, Chief Executive Officer and Board member of the Mortgage-Backed Securities Clearing Corporation, as a Trustee and a member of the Finance Committee of Manhattan College (2005-2008), as a Trustee and a member of the Finance Committee of AHRC of Nassau County (2006-2008), and as a member of the Independent Directors Council (IDC) Governing Council (2010-2015). Mr. Dirks is a member of the Board of Directors for The Brookville Center for Children's Services, Inc. (2009-present).
Alan J. Lacy (1953)
Year of Election or Appointment: 2008
Trustee
Mr. Lacy also serves as Trustee of other Fidelity® funds. Mr. Lacy serves as Chairman (2014-present) and a member (2010-present) of the Board of Directors of Dave & Buster's Entertainment, Inc. (restaurant and entertainment complexes) and a Director of Bristol-Myers Squibb Company (global pharmaceuticals, 2008-present). He is a Trustee of the California Chapter of The Nature Conservancy (2015-present) and a Director of the Center for Advanced Study in the Behavioral Sciences at Stanford University (2015-present). In addition, Mr. Lacy served as Senior Adviser (2007-2014) of Oak Hill Capital Partners, L.P. (private equity) and also served as Chief Executive Officer (2005) and Vice Chairman (2005-2006) of Sears Holdings Corporation (retail) and Chief Executive Officer and Chairman of the Board of Sears, Roebuck and Co. (retail, 2000-2005). Previously, Mr. Lacy served as Chairman (2008-2011) and a member (2006-2015) of the Board of Trustees of the National Parks Conservation Association and as a member of the Board of Directors for The Western Union Company (global money transfer, 2006-2011), The Hillman Companies, Inc. (hardware wholesalers, 2010-2014), and Earth Fare, Inc. (retail grocery, 2010-2014).
Ned C. Lautenbach (1944)
Year of Election or Appointment: 2000
Trustee
Chairman of the Independent Trustees
Mr. Lautenbach also serves as Trustee of other Fidelity® funds. Mr. Lautenbach currently serves as the Lead Director of the Eaton Corporation Board of Directors (diversified industrial, 1997-present). Mr. Lautenbach is Chairman of the Board of Directors of Artis-Naples in Naples, Florida (2012-present), a member of the Council on Foreign Relations (1994-present), and a member of the Board of Governors, State University System of Florida (2013-present). Previously, Mr. Lautenbach was a Partner/Advisory Partner at Clayton, Dubilier & Rice, LLC (private equity investment, 1998-2010), as well as a Director of Sony Corporation (2006-2007).
Joseph Mauriello (1944)
Year of Election or Appointment: 2008
Trustee
Mr. Mauriello also serves as Trustee of other Fidelity® funds. Prior to his retirement in January 2006, Mr. Mauriello served in numerous senior management positions including Deputy Chairman and Chief Operating Officer (2004-2005), and Vice Chairman of Financial Services (2002-2004) of KPMG LLP US (professional services, 1965-2005). Mr. Mauriello currently serves as a member of the Board of Directors of XL Group plc. (global insurance and re-insurance, 2006-present) and the Independent Directors Council (IDC) Governing Council (2015-present). Previously, Mr. Mauriello served as a Director of the Hamilton Funds of the Bank of New York (2006-2007) and of Arcadia Resources Inc. (health care services and products, 2007-2012).
Robert W. Selander (1950)
Year of Election or Appointment: 2011
Trustee
Mr. Selander also serves as Trustee of other Fidelity® funds. Mr. Selander serves as a Director of The Western Union Company (global money transfer, 2014-present) and a non-executive Chairman of Health Equity, Inc. (health savings custodian, 2015-present). Previously, Mr. Selander served as a Member of the Advisory Board of certain Fidelity® funds (2011), and Executive Vice Chairman (2010), Chief Executive Officer (2009-2010), and President and Chief Executive Officer (1997-2009) of Mastercard, Inc.
Cornelia M. Small (1944)
Year of Election or Appointment: 2005
Trustee
Ms. Small also serves as Trustee of other Fidelity® funds. Ms. Small is a member of the Board of Directors (2009-present) and Chair of the Investment Committee (2010-present) of the Teagle Foundation. Ms. Small also serves on the Investment Committee of the Berkshire Taconic Community Foundation (2008-present). Previously, Ms. Small served as Chairperson (2002-2008) and a member of the Investment Committee and Chairperson (2008-2012) and a member of the Board of Trustees of Smith College. In addition, Ms. Small served as Chief Investment Officer, Director of Global Equity Investments, and a member of the Board of Directors of Scudder, Stevens & Clark and Scudder Kemper Investments.
William S. Stavropoulos (1939)
Year of Election or Appointment: 2002
Trustee
Vice Chairman of the Independent Trustees
Mr. Stavropoulos also serves as Trustee of other Fidelity® funds. Mr. Stavropoulos serves as President and Founder of the Michigan Baseball Foundation, the Great Lakes Loons (2007-present). Mr. Stavropoulos is Chairman Emeritus of the Board of Directors of The Dow Chemical Company, where he previously served in numerous senior management positions, including President, CEO (1995-2000; 2002-2004), Chairman of the Executive Committee (2000-2006), and as a member of the Board of Directors (1990-2006). Currently, Mr. Stavropoulos is Chairman of the Board of Directors of Univar Inc. (global distributor of commodity and specialty chemicals), a Director of Teradata Corporation (data warehousing and technology solutions), and Maersk Inc. (industrial conglomerate), and a member of the Advisory Board for Metalmark Capital LLC (private equity investment, 2005-present). Mr. Stavropoulos is an operating advisor to Clayton, Dubilier & Rice, LLC (private equity investment). In addition, Mr. Stavropoulos is a member of the University of Notre Dame Advisory Council for the College of Science, a Trustee of the Rollin L. Gerstacker Foundation, and a Director of the Naples Philharmonic Center for the Arts. Previously, Mr. Stavropoulos served as a Director of Chemical Financial Corporation (bank holding company, 1993-2012) and Tyco International, Ltd. (multinational manufacturing and services, 2007-2012).
David M. Thomas (1949)
Year of Election or Appointment: 2008
Trustee
Mr. Thomas also serves as Trustee of other Fidelity® funds. Mr. Thomas serves as Non-Executive Chairman of the Board of Directors of Fortune Brands Home and Security (home and security products, 2011-present), as a member of the Board of Directors (2004-present) and Presiding Director (2013-present) of Interpublic Group of Companies, Inc. (marketing communication), and as a member of the Board of Trustees of the University of Florida (2013-present). Previously, Mr. Thomas served as Executive Chairman (2005-2006) and Chairman and Chief Executive Officer (2000-2005) of IMS Health, Inc. (pharmaceutical and healthcare information solutions), and a Director of Fortune Brands, Inc. (consumer products, 2000-2011).
+ The information includes the Trustee's principal occupation during the last five years and other information relating to the experience, attributes, and skills relevant to the Trustee's qualifications to serve as a Trustee, which led to the conclusion that the Trustee should serve as a Trustee for the fund.
Advisory Board Members and Officers:
Correspondence intended for an officer or Peter S. Lynch may be sent to Fidelity Investments, 245 Summer Street, Boston, Massachusetts 02210. Officers appear below in alphabetical order.
Name, Year of Birth; Principal Occupation
Peter S. Lynch (1944)
Year of Election or Appointment: 2003
Member of the Advisory Board
Mr. Lynch also serves as Member of the Advisory Board of other Fidelity® funds. Mr. Lynch is Vice Chairman and a Director of FMR (investment adviser firm) and FMR Co., Inc. (investment adviser firm). In addition, Mr. Lynch serves as a Trustee of Boston College and as the Chairman of the Inner-City Scholarship Fund. Previously, Mr. Lynch served on the Special Olympics International Board of Directors (1997-2006).
Marc R. Bryant (1966)
Year of Election or Appointment: 2015
Secretary and Chief Legal Officer (CLO)
Mr. Bryant also serves as Secretary and CLO of other funds. Mr. Bryant serves as CLO, Secretary, and Senior Vice President of Fidelity Management & Research Company (investment adviser firm, 2015-present) and FMR Co., Inc. (investment adviser firm, 2015-present); Secretary of Fidelity SelectCo, LLC (investment adviser firm, 2015-present) and Fidelity Investments Money Management, Inc. (investment adviser firm, 2015-present); and CLO of Fidelity Management & Research (Hong Kong) Limited and FMR Investment Management (U.K.) Limited (investment adviser firms, 2015-present) and Fidelity Management & Research (Japan) Limited (investment adviser firm, 2016-present). He is Senior Vice President and Deputy General Counsel of FMR LLC (diversified financial services company). Previously, Mr. Bryant served as Secretary and CLO of Fidelity Rutland Square Trust II (2010-2014) and Assistant Secretary of Fidelity's Fixed Income and Asset Allocation Funds (2013-2015). Prior to joining Fidelity Investments, Mr. Bryant served as a Senior Vice President and the Head of Global Retail Legal for AllianceBernstein L.P. (2006-2010), and as the General Counsel for ProFund Advisors LLC (2001-2006).
Jeffrey S. Christian (1961)
Year of Election or Appointment: 2016
Assistant Treasurer
Mr. Christian also serves as Assistant Treasurer of other funds. Mr. Christian is an employee of Fidelity Investments (2003-present).
William C. Coffey (1969)
Year of Election or Appointment: 2009
Assistant Secretary
Mr. Coffey also serves as Assistant Secretary of other funds. He is Senior Vice President and Deputy General Counsel of FMR LLC (diversified financial services company, 2010-present), and is an employee of Fidelity Investments. Previously, Mr. Coffey served as Vice President and Associate General Counsel of FMR LLC (2005-2009).
Jonathan Davis (1968)
Year of Election or Appointment: 2010
Assistant Treasurer
Mr. Davis also serves as Assistant Treasurer of other funds, and is an employee of Fidelity Investments. Previously, Mr. Davis served as Vice President and Associate General Counsel of FMR LLC (diversified financial services company, 2003-2010).
Adrien E. Deberghes (1967)
Year of Election or Appointment: 2016
Assistant Treasurer
Mr. Deberghes also serves as an officer of other funds. He serves as Executive Vice President of Fidelity Investments Money Management, Inc. (FIMM) (investment adviser firm, 2016-present) and is an employee of Fidelity Investments (2008-present). Prior to joining Fidelity Investments, Mr. Deberghes was Senior Vice President of Mutual Fund Administration at State Street Corporation (2007-2008), Senior Director of Mutual Fund Administration at Investors Bank & Trust (2005-2007), and Director of Finance for Dunkin' Brands (2000-2005). Previously, Mr. Deberghes served in other fund officer roles.
Stephanie J. Dorsey (1969)
Year of Election or Appointment: 2010
Assistant Treasurer
Ms. Dorsey also serves as an officer of other funds. She is an employee of Fidelity Investments (2008-present) and has served in other fund officer roles. Prior to joining Fidelity Investments, Ms. Dorsey served as Treasurer (2004-2008) of the JPMorgan Mutual Funds and Vice President (2004-2008) of JPMorgan Chase Bank.
Howard J. Galligan III (1966)
Year of Election or Appointment: 2014
Chief Financial Officer
Mr. Galligan also serves as Chief Financial Officer of other funds. Mr. Galligan serves as President of Fidelity Pricing and Cash Management Services (FPCMS) (2014-present) and as a Director of Strategic Advisers, Inc. (investment adviser firm, 2008-present). Previously, Mr. Galligan served as Chief Administrative Officer of Asset Management (2011-2014) and Chief Operating Officer and Senior Vice President of Investment Support for Strategic Advisers, Inc. (2003-2011).
Scott C. Goebel (1968)
Year of Election or Appointment: 2015
Vice President
Mr. Goebel serves as Vice President of other funds and is an employee of Fidelity Investments (2001-present). Mr. Goebel serves as Senior Vice President of Fidelity Management & Research Company (FMR) (investment adviser firm, 2016-present). Previously, Mr. Goebel served as Secretary of Fidelity SelectCo, LLC (investment adviser firm, 2013-2015), Fidelity Investments Money Management, Inc. (FIMM) (investment adviser firm, 2010-2015), and Fidelity Research and Analysis Company (FRAC) (investment adviser firm, 2010-2015); General Counsel, Secretary, and Senior Vice President of FMR (investment adviser firm, 2008-2015) and FMR Co., Inc. (investment adviser firm, 2008-2015); Assistant Secretary of Fidelity Management & Research (Japan) Limited (investment adviser firm, 2008-2015) and Fidelity Management & Research (U.K.) Inc. (investment adviser firm, 2008-2015); Chief Legal Officer (CLO) of Fidelity Management & Research (Hong Kong) Limited (investment adviser firm, 2008-2015); Secretary and CLO of certain Fidelity® funds (2008-2015); Assistant Secretary of FIMM (2008-2010), FRAC (2008-2010), and certain funds (2007-2008); and as Vice President and Secretary of Fidelity Distributors Corporation (FDC) (2005-2007).
Thomas C. Hense (1964)
Year of Election or Appointment: 2008, 2010, or 2015
Vice President
Mr. Hense serves as Vice President of Fidelity Advisor® Multi-Asset Income Fund (2015) and other funds (High Income (2008), Small Cap (2008), and Value (2010) funds), and is an employee of Fidelity Investments (1993-present). Previously, Mr. Hense served as a portfolio manager for Fidelity's Institutional Money Management Group (Pyramis) (2003-2008).
Brian B. Hogan (1964)
Year of Election or Appointment: 2009
Vice President
Mr. Hogan also serves as Trustee or Vice President of other funds. Mr. Hogan serves as a Director of FMR Investment Management (U.K.) Limited (investment adviser firm, 2015-present) and Fidelity SelectCo, LLC (investment adviser firm, 2014-present) and President of the Equity Division of FMR (investment adviser firm, 2009-present). Previously, Mr. Hogan served as Senior Vice President, Equity Research of FMR (2006-2009) and as a portfolio manager. Mr. Brian B. Hogan is not related to Mr. Colm A. Hogan.
Colm A. Hogan (1973)
Year of Election or Appointment: 2016
Deputy Treasurer
Mr. Hogan also serves as an officer of other funds. Mr. Hogan is an employee of Fidelity Investments (2005-present). Mr. Colm A. Hogan is not related to Mr. Brian B. Hogan.
Chris Maher (1972)
Year of Election or Appointment: 2013
Assistant Treasurer
Mr. Maher serves as Assistant Treasurer of other funds. Mr. Maher is Vice President of Valuation Oversight and is an employee of Fidelity Investments. Previously, Mr. Maher served as Vice President of Asset Management Compliance (2013), Vice President of the Program Management Group of FMR (investment adviser firm, 2010-2013), and Vice President of Valuation Oversight (2008-2010).
John F. Papandrea (1972)
Year of Election or Appointment: 2016
Anti-Money Laundering (AML) Officer
Mr. Papandrea also serves as AML Officer of other funds. Mr. Papandrea is Vice President of FMR LLC (diversified financial services company, 2008-present) and is an employee of Fidelity Investments (2005-present).
Kenneth B. Robins (1969)
Year of Election or Appointment: 2016
Chief Compliance Officer
Mr. Robins also serves as an officer of other funds. Mr. Robins serves as Compliance Officer of Fidelity Management & Research Company and FMR Co., Inc. (investment adviser firms, 2016-present) and is an employee of Fidelity Investments (2004-present). Previously, Mr. Robins served as Executive Vice President of Fidelity Investments Money Management, Inc. (investment adviser firm, 2013-2016) and served in other fund officer roles.
Stacie M. Smith (1974)
Year of Election or Appointment: 2016
President and Treasurer
Ms. Smith also serves as an officer of other funds. She is an employee of Fidelity Investments (2009-present) and has served in other fund officer roles. Prior to joining Fidelity Investments, Ms. Smith served as Senior Audit Manager of Ernst & Young LLP (1996-2009). Previously, Ms. Smith served as Deputy Treasurer of certain Fidelity® funds (2013-2016).
Renee Stagnone (1975)
Year of Election or Appointment: 2016
Assistant Treasurer
Ms. Stagnone also serves as an officer of other funds. Ms. Stagnone is an employee of Fidelity Investments (1997-present). Previously, Ms. Stagnone served as Deputy Treasurer of certain Fidelity® funds (2013-2016).
Shareholder Expense Example
As a shareholder of the Fund, you incur two types of costs: (1) transaction costs, including redemption fees and (2) ongoing costs, including management fees and other Fund expenses. This Example is intended to help you understand your ongoing costs (in dollars) of investing in the Fund and to compare these costs with the ongoing costs of investing in other mutual funds.
The Example is based on an investment of $1,000 invested at the beginning of the period and held for the entire period (February 1, 2016 to July 31, 2016).
Actual Expenses
The first line of the accompanying table for each class of the Fund provides information about actual account values and actual expenses. You may use the information in this line, together with the amount you invested, to estimate the expenses that you paid over the period. Simply divide your account value by $1,000.00 (for example, an $8,600 account value divided by $1,000.00 = 8.6), then multiply the result by the number in the first line for a class of the Fund under the heading entitled "Expenses Paid During Period" to estimate the expenses you paid on your account during this period. A small balance maintenance fee of $12.00 that is charged once a year may apply for certain accounts with a value of less than $2,000. This fee is not included in the table below. If it was, the estimate of expenses you paid during the period would be higher, and your ending account value lower, by this amount. In addition, the Fund, as a shareholder in the underlying Fidelity Central Funds, will indirectly bear its pro-rata share of the fees and expenses incurred by the underlying Fidelity Central Funds. These fees and expenses are not included in the Fund's annualized expense ratio used to calculate the expense estimate in the table below.
Hypothetical Example for Comparison Purposes
The second line of the accompanying table for each class of the Fund provides information about hypothetical account values and hypothetical expenses based on a Class' actual expense ratio and an assumed rate of return of 5% per year before expenses, which is not the Class' actual return. The hypothetical account values and expenses may not be used to estimate the actual ending account balance or expenses you paid for the period. You may use this information to compare the ongoing costs of investing in the Fund and other funds. To do so, compare this 5% hypothetical example with the 5% hypothetical examples that appear in the shareholder reports of the other funds. A small balance maintenance fee of $12.00 that is charged once a year may apply for certain accounts with a value of less than $2,000. This fee is not included in the table below. If it was, the estimate of expenses you paid during the period would be higher, and your ending account value lower, by this amount. In addition, the Fund, as a shareholder in the underlying Fidelity Central Funds, will indirectly bear its pro-rata share of the fees and expenses incurred by the underlying Fidelity Central Funds. These fees and expenses are not included in the Fund's annualized expense ratio used to calculate the expense estimate in the table below.
Please note that the expenses shown in the table are meant to highlight your ongoing costs only and do not reflect any transaction costs. Therefore, the second line of the table is useful in comparing ongoing costs only, and will not help you determine the relative total costs of owning different funds. In addition, if these transactional costs were included, your costs would have been higher.
| | Annualized Expense Ratio-A | Beginning
Account Value
February 1, 2016 | Ending
Account Value
July 31, 2016 | Expenses Paid
During Period-B
February 1, 2016
to July 31, 2016 |
| Leveraged Company Stock | .80% | | | |
| Actual | | $1,000.00 | $1,132.50 | $4.24 |
| Hypothetical-C | | $1,000.00 | $1,020.89 | $4.02 |
| Class K | .68% | | | |
| Actual | | $1,000.00 | $1,133.20 | $3.61 |
| Hypothetical-C | | $1,000.00 | $1,021.48 | $3.42 |
A Annualized expense ratio reflects expenses net of applicable fee waivers.
B Expenses are equal to each Class' annualized expense ratio, multiplied by the average account value over the period, multiplied by 182/366 (to reflect the one-half year period).
C 5% return per year before expenses
Distributions (Unaudited)
The Board of Trustees of Leveraged Company Stock voted to pay to shareholders of record at the opening of business on record date, the following distributions per share derived from capital gains realized from sales of portfolio securities, and dividends derived from net investment income:
| | Pay Date | Record Date | Dividends | Capital Gains |
| Leveraged Company Stock | 9/19/2016 | 9/16/2016 | $0.230 | $2.327 |
| Class K | 9/19/2016 | 9/16/2016 | $0.258 | $2.327 |
| | |
The fund hereby designates as a capital gain dividend with respect to the taxable year ended July 31, 2016, $295,796,944 or, if subsequently determined to be different, the net capital gain of such year.
Leveraged Company Stock designates 100% and Class K designates 100% of the dividends distributed in September and December, respectively during the fiscal year as qualifying for the dividends–received deduction for corporate shareholders.
Leveraged Company Stock designates 100% and Class K designates 100% of the dividends distributed in September and December, respectively during the fiscal year as amounts which may be taken into account as a dividend for the purposes of the maximum rate under section 1(h)(11) of the Internal Revenue Code.
The fund will notify shareholders in January 2017 of amounts for use in preparing 2016 income tax returns.
Board Approval of Investment Advisory Contracts and Management Fees
Fidelity Leveraged Company Stock Fund
Each year, the Board of Trustees, including the Independent Trustees (together, the Board), votes on the renewal of the management contract with Fidelity Management & Research Company (FMR) and the sub-advisory agreements (together, the Advisory Contracts) for the fund. The Board, assisted by the advice of fund counsel and Independent Trustees' counsel, requests and considers a broad range of information relevant to the renewal of the Advisory Contracts throughout the year.
The Board meets regularly and, at each of its meetings, covers an extensive agenda of topics and materials and considers factors that are relevant to its annual consideration of the renewal of the fund's Advisory Contracts, including the services and support provided to the fund and its shareholders. The Board has established various standing committees (Committees), each composed of and chaired by Independent Trustees with varying backgrounds, to which the Board has assigned specific subject matter responsibilities in order to enhance effective decision-making by the Board. The Board, acting directly and through its Committees, requests and receives information concerning the annual consideration of the renewal of the fund's Advisory Contracts. The Board also meets as needed to consider matters specifically related to the Board's annual consideration of the renewal of the Advisory Contracts. Members of the Board may also meet with trustees of other Fidelity funds through ad hoc joint committees to discuss certain matters relevant to all of the Fidelity funds.
At its July 2016 meeting, the Board unanimously determined to renew the fund's Advisory Contracts. In reaching its determination, the Board considered all factors it believed relevant, including (i) the nature, extent, and quality of the services to be provided to the fund and its shareholders (including the investment performance of the fund); (ii) the competitiveness of the fund's management fee and total expense ratio relative to peer funds; (iii) the total costs of the services to be provided by and the profits to be realized by Fidelity from its relationships with the fund; and (iv) the extent to which, if any, economies of scale exist and would be realized as the fund grows, and whether any economies of scale are appropriately shared with fund shareholders.
In considering whether to renew the Advisory Contracts for the fund, the Board reached a determination, with the assistance of fund counsel and Independent Trustees' counsel and through the exercise of its business judgment, that the renewal of the Advisory Contracts was in the best interests of the fund and its shareholders and that the compensation payable under the Advisory Contracts was fair and reasonable. The Board's decision to renew the Advisory Contracts was not based on any single factor, but rather was based on a comprehensive consideration of all the information provided to the Board at its meetings throughout the year. The Board, in reaching its determination to renew the Advisory Contracts, was aware that shareholders of the fund have a broad range of investment choices available to them, including a wide choice among funds offered by Fidelity's competitors, and that the fund's shareholders, who have the opportunity to review and weigh the disclosure provided by the fund in its prospectus and other public disclosures, have chosen to invest in this fund, which is part of the Fidelity family of funds.
Nature, Extent, and Quality of Services Provided. The Board considered Fidelity's staffing as it relates to the fund, including the backgrounds of investment personnel of Fidelity, and also considered the fund's investment objective, strategies, and related investment philosophy. The Independent Trustees also had discussions with senior management of Fidelity's investment operations and investment groups. The Board considered the structure of the investment personnel compensation program and whether this structure provides appropriate incentives to act in the best interests of the fund. Additionally, the Board considered the portfolio managers' investments, if any, in the funds that they manage.
Resources Dedicated to Investment Management and Support Services. The Board and the Fund Oversight and Research Committees reviewed the general qualifications and capabilities of Fidelity's investment staff, including its size, education, experience, and resources, as well as Fidelity's approach to recruiting, training, managing, and compensating investment personnel. The Board noted that Fidelity has continued to increase the resources devoted to non-U.S. offices, including expansion of Fidelity's global investment organization. The Board also noted that Fidelity's analysts have extensive resources, tools and capabilities that allow them to conduct sophisticated quantitative and fundamental analysis, as well as credit analysis of issuers, counterparties and guarantors. Further, the Board considered that Fidelity's investment professionals have sufficient access to global information and data so as to provide competitive investment results over time, and that those professionals also have access to sophisticated tools that permit them to assess portfolio construction and risk and performance attribution characteristics continuously, as well as to transmit new information and research conclusions rapidly around the world. Additionally, in its deliberations, the Board considered Fidelity's trading, risk management, compliance, and technology and operations capabilities and resources, which are integral parts of the investment management process.
Shareholder and Administrative Services. The Board considered (i) the nature, extent, quality, and cost of advisory, administrative, and shareholder services performed by FMR, the sub-advisers (together with FMR, the Investment Advisers), and their affiliates under the Advisory Contracts and under separate agreements covering transfer agency, pricing and bookkeeping, and securities lending services for the fund; (ii) the nature and extent of the supervision of third party service providers, principally custodians, subcustodians, and pricing vendors; and (iii) the resources devoted to, and the record of compliance with, the fund's compliance policies and procedures. The Board also reviewed the allocation of fund brokerage, including allocations to brokers affiliated with the Investment Advisers, the use of brokerage commissions to pay fund expenses, and the use of "soft" commission dollars to pay for research services.
The Board noted that the growth of fund assets over time across the complex allows Fidelity to reinvest in the development of services designed to enhance the value or convenience of the Fidelity funds as investment vehicles. These services include 24-hour access to account information and market information through telephone representatives and over the Internet, investor education materials and asset allocation tools, and the expanded availability of Fidelity Investor Centers.
In 2014, the Board formed an ad hoc Committee on Transfer Agency Fees to review the variety of transfer agency fee structures throughout the industry and Fidelity's competitive positioning with respect to industry participants.
Investment in a Large Fund Family. The Board considered the benefits to shareholders of investing in a Fidelity fund, including the benefits of investing in a fund that is part of a large family of funds offering a variety of investment disciplines and providing a large variety of mutual fund investor services. The Board noted that Fidelity had taken, or had made recommendations that resulted in the Fidelity funds taking, a number of actions over the previous year that benefited particular funds, including: (i) continuing to dedicate additional resources to investment research and to the support of the senior management team that oversees asset management; (ii) continuing efforts to enhance Fidelity's global research capabilities; (iii) launching new funds and making other enhancements to meet client needs; (iv) broadening eligibility requirements for certain lower-priced share classes of, and streamlining the fee structure for, certain existing equity index funds; (v) lowering expense caps for certain existing funds and classes to reduce expenses paid by shareholders; (vi) eliminating redemption fees for certain variable insurance product funds and classes; (vii) continuing to launch dedicated lower cost underlying funds to meet portfolio construction needs related to expanding underlying fund options for Fidelity funds of funds, specifically for the Freedom Fund product lines; (viii) launching a lower cost share class for use by the Freedom Index Fund product line; (ix) rationalizing product lines and gaining increased efficiencies through fund mergers and share class consolidations; (x) continuing to develop, acquire and implement systems and technology to improve services to the funds and shareholders, strengthen information security, and increase efficiency; (xi) implementing investment enhancements to further strengthen Fidelity's target date product line to increase investors' probability of success in achieving their goals; (xii) accelerating the conversion of all remaining Class B shares to Class A shares, which have a lower expense structure; and (xiii) implementing changes to Fidelity's money market fund product line in response to recent regulatory reforms.
Investment Performance. The Board considered whether the fund has operated in accordance with its investment objective, as well as its record of compliance with its investment restrictions and its performance history.
The Board took into account discussions with representatives of the Investment Advisers about fund investment performance that occur at Board meetings throughout the year. In this regard the Board noted that as part of regularly scheduled fund reviews and other reports to the Board on fund performance, the Board considers annualized return information for the fund, for different time periods, measured against a securities market index ("benchmark index") and a peer group of funds with similar objectives ("peer group"), if any. In its evaluation of fund investment performance, the Board gave particular attention to information indicating changes in performance of certain Fidelity funds for specific time periods and discussed with the Investment Advisers the reasons for any overperformance or underperformance.
In addition to reviewing absolute and relative fund performance, the Independent Trustees periodically consider the appropriateness of fund performance metrics in evaluating the results achieved. In general, the Independent Trustees believe that fund performance should be evaluated based on net performance (after fees and expenses) of both the highest performing and lowest performing fund share classes, where applicable, compared to appropriate benchmark indices, over appropriate time periods that may include full market cycles, and compared to peer groups, as applicable, over the same periods, taking into account relevant factors including the following: general market conditions; issuer-specific information; and fund cash flows and other factors.
The Independent Trustees recognize that shareholders evaluate performance on a net basis over their own holding periods, for which one-, three-, and five-year periods are often used as a proxy. For this reason, the performance information reviewed by the Board also included net cumulative calendar year total return information for the fund and an appropriate benchmark index and peer group for the most recent one-, three-, and five-year periods, as shown below. Returns are shown compared to the 25th percentile (top of box, 75% beaten) and 75th percentile (bottom of box, 25% beaten) of the peer universe.
Fidelity Leveraged Company Stock Fund
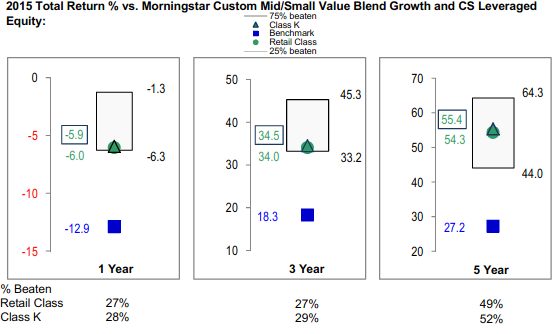
Based on its review, the Board concluded that the nature, extent, and quality of services provided to the fund under the Advisory Contracts should continue to benefit the shareholders of the fund.
Competitiveness of Management Fee and Total Expense Ratio. The Board considered the fund's management fee and total expense ratio compared to "mapped groups" of competitive funds and classes created for the purpose of facilitating the Trustees' competitive analysis of management fees and total expenses. Fidelity creates "mapped groups" by combining similar Broadridge investment objective categories that have comparable investment mandates. Combining Broadridge investment objective categories aids the Board's management fee and total expense ratio comparisons by broadening the competitive group used for comparison.
Management Fee. The Board considered two proprietary management fee comparisons for the 12-month periods shown in basis points (BP) in the chart below. The group of Broadridge funds used by the Board for management fee comparisons is referred to below as the "Total Mapped Group." The Total Mapped Group comparison focuses on a fund's standing in terms of gross management fees before expense reimbursements or caps relative to the total universe of funds with comparable investment mandates, regardless of whether their management fee structures also are comparable. Funds with comparable investment mandates offer exposure to similar types of securities. Funds with comparable management fee structures have similar management fee contractual arrangements (
e.g., flat rate charged for advisory services, all-inclusive fee rate,
etc.). "TMG %" represents the percentage of funds in the Total Mapped Group that had management fees that were lower than the fund's. For example, a hypothetical TMG % of 20% would mean that 80% of the funds in the Total Mapped Group had higher, and 20% had lower, management fees than the fund. The fund's actual TMG %s and the number of funds in the Total Mapped Group are in the chart below. The "Asset-Size Peer Group" (ASPG) comparison focuses on a fund's standing relative to a subset of non-Fidelity funds within the Total Mapped Group that are similar in size and management fee structure. For example, if a fund is in the first quartile of the ASPG, the fund's management fee ranks in the least expensive or lowest 25% of funds in the ASPG. The ASPG represents at least 15% of the funds in the Total Mapped Group with comparable asset size and management fee structures, subject to a minimum of 50 funds (or all funds in the Total Mapped Group if fewer than 50). Additional information, such as the ASPG quartile in which the fund's management fee rate ranked, is also included in the chart and considered by the Board.
Fidelity Leveraged Company Stock Fund
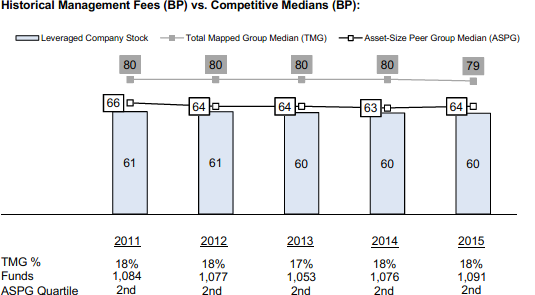
The Board noted that the fund's management fee rate ranked below the median of its Total Mapped Group and below the median of its ASPG for 2015.
The Board noted that, in 2014, the ad hoc Committee on Group Fee was formed by it and the boards of other Fidelity funds to conduct an in-depth review of the "group fee" component of the management fee of funds with such management fee structures. The Committee's focus included the mechanics of the group fee, the competitive landscape of group fee structures, Fidelity funds with no group fee component and investment products not included in group fee assets. The Board also considered that, for funds subject to the group fee, FMR agreed to voluntarily waive fees over a specified period of time in amounts designed to account for assets converted from certain funds to certain collective investment trusts.
The Board also noted that, in 2013, the ad hoc Committee on Management Fees was formed to conduct an in-depth review of the management fee rates of Fidelity's active equity mutual funds. The Committee focused on the following areas: (i) standard fee structures; (ii) research consumption and trading evolution; (iii) management fee competitiveness/profitability by category; and (iv) factors that drive institutional pricing.
Based on its review, the Board concluded that the fund's management fee is fair and reasonable in light of the services that the fund receives and the other factors considered.
Total Expense Ratio. In its review of each class's total expense ratio, the Board considered the fund's management fee rate as well as other fund or class expenses, as applicable, such as transfer agent fees, pricing and bookkeeping fees, and custodial, legal, and audit fees. The Board also noted that Fidelity may agree to waive fees and expenses from time to time, and the extent to which, if any, it has done so for the fund. As part of its review, the Board also considered the current and historical total expense ratios of each class of the fund compared to competitive fund median expenses. Each class of the fund is compared to those funds and classes in the Total Mapped Group (used by the Board for management fee comparisons) that have a similar sales load structure.
The Board noted that the total expense ratio of each class ranked below the competitive median for 2015.
Fees Charged to Other Fidelity Clients. The Board also considered Fidelity fee structures and other information with respect to clients of Fidelity, such as other funds advised or subadvised by Fidelity, pension plan clients, and other institutional clients with similar mandates. The Board noted the findings of the 2013 ad hoc joint committee (created with the board of other Fidelity funds), which reviewed and compared Fidelity's institutional investment advisory business with its business of providing services to the Fidelity funds, including the differences in services provided, fees charged, and costs incurred, as well as competition in their respective marketplaces.
Based on its review of total expense ratios and fees charged to other Fidelity clients, the Board concluded that the total expense ratio of each class of the fund was reasonable in light of the services that the fund and its shareholders receive and the other factors considered.
Costs of the Services and Profitability. The Board considered the revenues earned and the expenses incurred by Fidelity in conducting the business of developing, marketing, distributing, managing, administering and servicing the fund and servicing the fund's shareholders. The Board also considered the level of Fidelity's profits in respect of all the Fidelity funds.
On an annual basis, Fidelity presents to the Board information about the profitability of its relationship with the fund. Fidelity calculates profitability information for each fund, as well as aggregate profitability information for groups of Fidelity funds and all Fidelity funds, using a series of detailed revenue and cost allocation methodologies which originate with the books and records of Fidelity on which Fidelity's audited financial statements are based. The Audit Committee of the Board reviews any significant changes from the prior year's methodologies.
PricewaterhouseCoopers LLP (PwC), independent registered public accounting firm and auditor to Fidelity and certain Fidelity funds, has been engaged annually by the Board as part of the Board's assessment of Fidelity's profitability analysis. PwC's engagement includes the review and assessment of the methodologies used by Fidelity in determining the revenues and expenses attributable to Fidelity's mutual fund business, and completion of agreed-upon procedures in respect of the mathematical accuracy of the fund profitability information and its conformity to established allocation methodologies. After considering PwC's reports issued under the engagement and information provided by Fidelity, the Board concluded that while other allocation methods may also be reasonable, Fidelity's profitability methodologies are reasonable in all material respects.
The Board also reviewed Fidelity's non-fund businesses and fall-out benefits related to the mutual fund business as well as cases where Fidelity's affiliates may benefit from or be related to the fund's business.
The Board considered the costs of the services provided by and the profits realized by Fidelity in connection with the operation of the fund and was satisfied that the profitability was not excessive.
Economies of Scale. The Board considered whether there have been economies of scale in respect of the management of the Fidelity funds, whether the Fidelity funds (including the fund) have appropriately benefited from any such economies of scale, and whether there is potential for realization of any further economies of scale. The Board considered the extent to which the fund will benefit from economies of scale as assets grow through increased services to the fund, through waivers or reimbursements, or through fee or expense ratio reductions. The Board also noted that in 2013, it and the boards of other Fidelity funds created an ad hoc committee (the Economies of Scale Committee) to analyze whether Fidelity attains economies of scale in respect of the management and servicing of the Fidelity funds, whether the Fidelity funds have appropriately benefited from such economies of scale, and whether there is potential for realization of any further economies of scale.
The Board recognized that the fund's management contract incorporates a "group fee" structure, which provides for lower group fee rates as total group assets increase, and for higher group fee rates as total group assets decrease (with "group assets" defined to include fund assets under FMR's management plus the assets of sector funds previously under FMR's management). FMR calculates the group fee rates based on a tiered asset "breakpoint" schedule that varies based on asset class. The Board considered that the group fee is designed to deliver the benefits of economies of scale to fund shareholders when total Fidelity fund assets increase, even if assets of any particular fund are unchanged or have declined, because some portion of Fidelity's costs are attributable to services provided to all Fidelity funds, and all funds benefit if those costs can be allocated among more assets. The Board concluded that, given the group fee structure, fund shareholders will benefit from lower management fees as group assets increase at the fund complex level, regardless of whether Fidelity achieves any such economies of scale.
The Board concluded, taking into account the analysis of the Economies of Scale Committee, that economies of scale, if any, are being appropriately shared between fund shareholders and Fidelity.
Additional Information Requested by the Board. In order to develop fully the factual basis for consideration of the Fidelity funds' Advisory Contracts, the Board requested and received additional information on certain topics, including: (i) fund performance trends and Fidelity's long-term strategies for certain funds; (ii) the various share classes employed by Fidelity and the attributes of each class, together with similar information on the distribution and servicing payments made by Fidelity or the funds to third-party participants in the distribution channels; (iii) fund profitability, and fund performance in relation to fund profitability; (iv) the methodology with respect to evaluating competitive fund data and peer group classifications and fee comparisons; (v) annual fund profitability margins; (vi) the realization of fall-out benefits in and attribution of fall-out benefits to certain Fidelity business units; (vii) the appropriateness of certain funds' benchmarks; (viii) the rationalization for certain share classes and expenses; (ix) sub-advisory fee rates for comparable investment mandates; (x) product strategy for certain underperforming funds; and (xi) Fidelity's resources and strategy for cybersecurity.
Based on its evaluation of all of the conclusions noted above, and after considering all factors it believed relevant, the Board concluded that the advisory fee structures are fair and reasonable, and that the fund's Advisory Contracts should be renewed.

Corporate Headquarters
245 Summer St.
Boston, MA 02210
www.fidelity.com
LSF-ANN-0916
1.762413.115
Fidelity® Series Small Cap Opportunities Fund Fidelity® Series Small Cap Opportunities Fund
Class F
Annual Report July 31, 2016 |
|
Contents
To view a fund's proxy voting guidelines and proxy voting record for the 12-month period ended June 30, visit http://www.fidelity.com/proxyvotingresults or visit the Securities and Exchange Commission's (SEC) web site at http://www.sec.gov.
You may also call 1-800-544-8544, or for Class F, call 1-800-835-5092, to request a free copy of the proxy voting guidelines.
Standard & Poor's, S&P and S&P 500 are registered service marks of The McGraw-Hill Companies, Inc. and have been licensed for use by Fidelity Distributors Corporation.
Other third-party marks appearing herein are the property of their respective owners.
All other marks appearing herein are registered or unregistered trademarks or service marks of FMR LLC or an affiliated company. © 2016 FMR LLC. All rights reserved.
This report and the financial statements contained herein are submitted for the general information of the shareholders of the Fund. This report is not authorized for distribution to prospective investors in the Fund unless preceded or accompanied by an effective prospectus.
A fund files its complete schedule of portfolio holdings with the SEC for the first and third quarters of each fiscal year on Form N-Q. Forms N-Q are available on the SEC’s web site at http://www.sec.gov. A fund's Forms N-Q may be reviewed and copied at the SEC’s Public Reference Room in Washington, DC. Information regarding the operation of the SEC's Public Reference Room may be obtained by calling 1-800-SEC-0330.
For a complete list of a fund's portfolio holdings, view the most recent holdings listing, semiannual report, or annual report on Fidelity's web site at http://www.fidelity.com, http://www.institutional.fidelity.com, or http://www.401k.com, as applicable.
NOT FDIC INSURED •MAY LOSE VALUE •NO BANK GUARANTEE
Neither the Fund nor Fidelity Distributors Corporation is a bank.
Performance: The Bottom Line
Average annual total return reflects the change in the value of an investment, assuming reinvestment of distributions from dividend income and capital gains (the profits earned upon the sale of securities that have grown in value, if any) and assuming a constant rate of performance each year. The hypothetical investment and the average annual total returns do not reflect the deduction of taxes that a shareholder would pay on fund distributions or the redemption of fund shares. During periods of reimbursement by Fidelity, a fund’s total return will be greater than it would be had the reimbursement not occurred. How a fund did yesterday is no guarantee of how it will do tomorrow.
Average Annual Total Returns
| For the periods ended July 31, 2016 | Past 1 year | Past 5 years | Life of fundA |
| Fidelity® Series Small Cap Opportunities Fund | (0.94)% | 8.89% | 6.10% |
| Class F | (0.84)% | 9.07% | 6.25% |
A From March 22, 2007
The initial offering of Class F shares took place on June 26, 2009. Returns prior to June 26, 2009 are those of Fidelity® Series Small Cap Opportunities Fund, the original class of the fund.
$10,000 Over Life of Fund
Let's say hypothetically that $10,000 was invested in Fidelity® Series Small Cap Opportunities Fund, a class of the fund, on March 22, 2007, when the fund started.
The chart shows how the value of your investment would have changed, and also shows how the Russell 2000® Index performed over the same period.

| Period Ending Values |
| $17,413 | Fidelity® Series Small Cap Opportunities Fund |
| $17,190 | Russell 2000® Index |
Management's Discussion of Fund Performance
Market Recap: U.S. equities gained modestly for the year ending July 31, 2016, overcoming persistent concern about global economic growth, uncertainty regarding U.S. monetary policy and the U.K.’s late-June vote to leave the European Union, dubbed Brexit. The S&P 500
® index rose 5.61%, with larger-cap, value-oriented stocks and defensive sectors shining brightest. Volatility peaked in the early weeks of 2016, as continued oil-price weakness and U.S.-dollar strength pushed the S&P 500
® to its worst January since 2009. Markets then rose beginning in February amid U.S. job gains, a broad rally in energy and materials markets, global economic stimulus and perceived softening of monetary policy by the U.S. Federal Reserve. The June 23 Brexit vote surprised markets and resulted in a sharp two-day decline for stocks, followed by a rebound as investor sentiment shifted and remained positive through July 31. For the year, dividend-rich telecom services (+26%), utilities (+23%) and consumer staples (+12%) led the way amid strong investor demand for yield. Industrials (+10%) and information technology (+10%) also outperformed, as did materials (+8%), despite a weak commodities environment overall. Conversely, a strong run for real estate stocks couldn’t keep financials (-4%) from losing ground, as low interest rates continued to squeeze bank profits.
Comments from Lead Portfolio Manager Rich Thompson: For the year, the fund’s share classes had modestly negative results, trailing the 0.00% return of the benchmark Russell 2000
® Index. Fears of a global economic slowdown and the U.K.'s decision to exit the European Union contributed to volatility across all market-capitalization tiers, especially small-caps. After a challenging first half, small-caps rebounded in the period’s later months, but not enough to end in positive territory. Versus the benchmark, stock selection in information technology was the biggest detractor, including IT consulting and software developer Virtusa. Two recent strategic acquisitions weighed on Virtusa’s balance sheet, and subsequently its stock price. Also detracting was G-III Apparel Group, as high inventories and a disappointing holiday sales season dragged on the company’s profits, and the stock faltered. Conversely, stock picking in consumer discretionary boosted relative results. The fund’s top two contributors were non-benchmark real estate investment trusts (REITs) – Mid-America Apartment Communities and Equity LifeStyle Properties. Each benefited from investors’ appetite for dividend-paying securities, which are often considered more defensive.
The views expressed above reflect those of the portfolio manager(s) only through the end of the period as stated on the cover of this report and do not necessarily represent the views of Fidelity or any other person in the Fidelity organization. Any such views are subject to change at any time based upon market or other conditions and Fidelity disclaims any responsibility to update such views. These views may not be relied on as investment advice and, because investment decisions for a Fidelity fund are based on numerous factors, may not be relied on as an indication of trading intent on behalf of any Fidelity fund.
Note to Shareholders: Effective May 13, 2016, Morgen Peck assumed responsibilities for the fund’s information technology and telecommunication services subportfolios, succeeding Rayna Lesser Hannaway. Peck continues to manage the fund’s consumer discretionary, consumer staples and financials sleeves.
Investment Summary (Unaudited)
Top Ten Stocks as of July 31, 2016
| | % of fund's net assets | % of fund's net assets 6 months ago |
| MB Financial, Inc. | 1.4 | 1.3 |
| Allied World Assurance Co. Holdings AG | 1.4 | 1.3 |
| WSFS Financial Corp. | 1.3 | 1.1 |
| Coresite Realty Corp. | 1.2 | 1.0 |
| Equity Lifestyle Properties, Inc. | 1.1 | 1.0 |
| Huntington Bancshares, Inc. | 1.1 | 0.9 |
| EMCOR Group, Inc. | 1.1 | 0.9 |
| Store Capital Corp. | 1.0 | 0.8 |
| Ramco-Gershenson Properties Trust (SBI) | 1.0 | 1.0 |
| Associated Banc-Corp. | 1.0 | 1.1 |
| | 11.6 | |
Top Five Market Sectors as of July 31, 2016
| | % of fund's net assets | % of fund's net assets 6 months ago |
| Financials | 24.7 | 23.7 |
| Information Technology | 17.5 | 18.3 |
| Health Care | 14.0 | 13.5 |
| Industrials | 13.6 | 12.3 |
| Consumer Discretionary | 13.1 | 12.7 |
Asset Allocation (% of fund's net assets)
| As of July 31, 2016* |
| | Stocks and Equity Futures | 97.4% |
| | Short-Term Investments and Net Other Assets (Liabilities) | 2.6% |

* Foreign investments - 9.2%
| As of January 31, 2016* |
| | Stocks and Equity Futures | 97.2% |
| | Short-Term Investments and Net Other Assets (Liabilities) | 2.8% |

* Foreign investments - 9.4%
Investments July 31, 2016
Showing Percentage of Net Assets
| Common Stocks - 96.7% | | | |
| | | Shares | Value |
| CONSUMER DISCRETIONARY - 13.1% | | | |
| Auto Components - 1.6% | | | |
| Standard Motor Products, Inc. | | 440,524 | $18,475,577 |
| Tenneco, Inc. (a) | | 779,286 | 44,045,245 |
| Visteon Corp. | | 319,400 | 22,386,746 |
| | | | 84,907,568 |
| Diversified Consumer Services - 0.6% | | | |
| Service Corp. International | | 1,189,700 | 32,978,484 |
| Hotels, Restaurants & Leisure - 2.2% | | | |
| Cedar Fair LP (depositary unit) | | 302,000 | 17,878,400 |
| Dave & Buster's Entertainment, Inc. (a) | | 608,700 | 27,087,150 |
| Domino's Pizza, Inc. | | 205,500 | 30,270,150 |
| Texas Roadhouse, Inc. Class A | | 886,443 | 41,857,838 |
| | | | 117,093,538 |
| Household Durables - 1.5% | | | |
| Ethan Allen Interiors, Inc. | | 1,108,435 | 38,495,948 |
| Helen of Troy Ltd. (a) | | 235,400 | 23,448,194 |
| Meritage Homes Corp. (a) | | 496,900 | 18,082,191 |
| | | | 80,026,333 |
| Leisure Products - 1.2% | | | |
| Brunswick Corp. | | 575,600 | 28,561,272 |
| Vista Outdoor, Inc. (a) | | 673,748 | 33,721,087 |
| | | | 62,282,359 |
| Media - 1.1% | | | |
| Nexstar Broadcasting Group, Inc. Class A (b) | | 696,317 | 35,198,824 |
| Starz Series A (a) | | 769,800 | 23,271,054 |
| | | | 58,469,878 |
| Specialty Retail - 2.4% | | | |
| Burlington Stores, Inc. (a) | | 486,200 | 37,199,162 |
| Genesco, Inc. (a) | | 360,925 | 25,055,414 |
| Murphy U.S.A., Inc. (a) | | 359,400 | 27,544,416 |
| Sally Beauty Holdings, Inc. (a) | | 788,800 | 23,135,504 |
| Urban Outfitters, Inc. (a) | | 623,600 | 18,645,640 |
| | | | 131,580,136 |
| Textiles, Apparel & Luxury Goods - 2.5% | | | |
| Deckers Outdoor Corp. (a) | | 545,100 | 35,982,051 |
| G-III Apparel Group Ltd. (a) | | 960,774 | 38,459,783 |
| Kate Spade & Co. (a) | | 790,200 | 17,139,438 |
| Steven Madden Ltd. (a) | | 1,174,939 | 41,146,364 |
| | | | 132,727,636 |
|
| TOTAL CONSUMER DISCRETIONARY | | | 700,065,932 |
|
| CONSUMER STAPLES - 2.8% | | | |
| Beverages - 0.2% | | | |
| Coca-Cola Bottling Co. Consolidated | | 84,085 | 11,974,545 |
| Food & Staples Retailing - 0.7% | | | |
| Casey's General Stores, Inc. | | 138,250 | 18,461,905 |
| Performance Food Group Co. | | 768,400 | 21,084,896 |
| | | | 39,546,801 |
| Food Products - 1.3% | | | |
| Greencore Group PLC | | 2,857,809 | 12,390,380 |
| Ingredion, Inc. | | 128,300 | 17,094,692 |
| J&J Snack Foods Corp. | | 198,450 | 24,133,505 |
| TreeHouse Foods, Inc. (a) | | 169,400 | 17,480,386 |
| | | | 71,098,963 |
| Household Products - 0.2% | | | |
| Central Garden & Pet Co. Class A (non-vtg.) (a) | | 348,600 | 7,944,594 |
| Personal Products - 0.4% | | | |
| Inter Parfums, Inc. | | 616,200 | 20,051,148 |
|
| TOTAL CONSUMER STAPLES | | | 150,616,051 |
|
| ENERGY - 2.9% | | | |
| Energy Equipment & Services - 0.8% | | | |
| Nabors Industries Ltd. | | 2,167,800 | 19,510,200 |
| Rowan Companies PLC | | 476,200 | 7,257,288 |
| Total Energy Services, Inc. | | 1,266,170 | 12,412,956 |
| | | | 39,180,444 |
| Oil, Gas & Consumable Fuels - 2.1% | | | |
| Boardwalk Pipeline Partners, LP | | 1,177,347 | 19,673,468 |
| Diamondback Energy, Inc. | | 179,193 | 15,731,353 |
| Newfield Exploration Co. (a) | | 482,012 | 20,871,120 |
| PDC Energy, Inc. (a) | | 434,000 | 23,770,180 |
| Western Refining, Inc. (b) | | 760,212 | 15,850,420 |
| WPX Energy, Inc. (a) | | 1,791,600 | 17,898,084 |
| | | | 113,794,625 |
|
| TOTAL ENERGY | | | 152,975,069 |
|
| FINANCIALS - 24.7% | | | |
| Banks - 10.2% | | | |
| Associated Banc-Corp. | | 2,956,913 | 54,998,582 |
| BancFirst Corp. | | 496,478 | 32,554,062 |
| Bank of the Ozarks, Inc. (b) | | 1,447,174 | 52,083,792 |
| Banner Corp. | | 1,249,571 | 52,157,094 |
| BBCN Bancorp, Inc. | | 3,073,510 | 47,239,849 |
| Community Bank System, Inc. | | 1,069,472 | 47,195,799 |
| Huntington Bancshares, Inc. | | 6,080,100 | 57,760,950 |
| Investors Bancorp, Inc. | | 4,178,700 | 47,470,032 |
| MB Financial, Inc. | | 2,033,800 | 78,077,584 |
| PacWest Bancorp | | 935,592 | 38,686,729 |
| Tompkins Financial Corp. | | 488,719 | 35,549,420 |
| | | | 543,773,893 |
| Capital Markets - 1.7% | | | |
| AURELIUS AG | | 886,843 | 54,026,316 |
| OM Asset Management Ltd. | | 2,811,024 | 39,354,336 |
| | | | 93,380,652 |
| Insurance - 2.9% | | | |
| Allied World Assurance Co. Holdings AG | | 1,764,513 | 72,327,388 |
| Aspen Insurance Holdings Ltd. | | 727,190 | 33,421,652 |
| Employers Holdings, Inc. | | 415,980 | 11,863,750 |
| James River Group Holdings Ltd. | | 1,065,386 | 35,860,893 |
| | | | 153,473,683 |
| Real Estate Investment Trusts - 8.6% | | | |
| Coresite Realty Corp. | | 754,300 | 62,252,379 |
| Cousins Properties, Inc. | | 2,915,320 | 31,019,005 |
| Equity Lifestyle Properties, Inc. | | 712,300 | 58,579,552 |
| Kite Realty Group Trust | | 1,602,455 | 48,730,657 |
| Mid-America Apartment Communities, Inc. | | 504,600 | 53,497,692 |
| National Retail Properties, Inc. | | 1,015,141 | 53,964,896 |
| Ramco-Gershenson Properties Trust (SBI) | | 2,795,450 | 55,461,728 |
| Store Capital Corp. | | 1,785,903 | 55,702,315 |
| Urban Edge Properties | | 1,448,300 | 43,318,653 |
| | | | 462,526,877 |
| Thrifts & Mortgage Finance - 1.3% | | | |
| WSFS Financial Corp. (c) | | 2,030,253 | 71,444,603 |
|
| TOTAL FINANCIALS | | | 1,324,599,708 |
|
| HEALTH CARE - 14.0% | | | |
| Biotechnology - 6.2% | | | |
| ACADIA Pharmaceuticals, Inc. (a) | | 399,727 | 14,805,888 |
| Acorda Therapeutics, Inc. (a) | | 581,100 | 14,690,208 |
| Advanced Accelerator Applications SA sponsored ADR (b) | | 403,200 | 12,616,128 |
| Agios Pharmaceuticals, Inc. (a)(b) | | 167,563 | 7,578,874 |
| Ascendis Pharma A/S sponsored ADR (a) | | 870,553 | 12,535,963 |
| BioMarin Pharmaceutical, Inc. (a) | | 155,444 | 15,454,242 |
| bluebird bio, Inc. (a) | | 151,768 | 8,678,094 |
| Cellectis SA sponsored ADR (a) | | 448,095 | 11,816,265 |
| Coherus BioSciences, Inc. (a)(b) | | 681,111 | 17,293,408 |
| Curis, Inc. (a)(b)(c) | | 6,736,556 | 11,317,414 |
| CytomX Therapeutics, Inc. | | 267,800 | 2,694,068 |
| CytomX Therapeutics, Inc. (d) | | 105,499 | 1,061,320 |
| Five Prime Therapeutics, Inc. (a) | | 390,800 | 19,809,652 |
| Genocea Biosciences, Inc. (a)(b)(c) | | 1,802,810 | 7,337,437 |
| Heron Therapeutics, Inc. (a)(b) | | 531,800 | 8,838,516 |
| Intercept Pharmaceuticals, Inc. (a) | | 71,798 | 12,423,208 |
| Ionis Pharmaceuticals, Inc. (a) | | 275,872 | 8,052,704 |
| La Jolla Pharmaceutical Co. (a) | | 667,883 | 11,354,011 |
| Macrogenics, Inc. (a) | | 537,200 | 16,432,948 |
| Mirati Therapeutics, Inc. (a)(b) | | 192,003 | 890,894 |
| Neurocrine Biosciences, Inc. (a) | | 359,682 | 18,066,827 |
| Novavax, Inc. (a) | | 2,193,539 | 16,056,705 |
| Sage Therapeutics, Inc. (a) | | 35,500 | 1,592,530 |
| Spark Therapeutics, Inc. (a) | | 312,600 | 18,112,044 |
| TESARO, Inc. (a) | | 317,500 | 29,603,700 |
| Ultragenyx Pharmaceutical, Inc. (a) | | 304,506 | 19,269,140 |
| Vitae Pharmaceuticals, Inc. (a)(b) | | 1,327,400 | 14,136,810 |
| | | | 332,518,998 |
| Health Care Equipment & Supplies - 3.6% | | | |
| Hill-Rom Holdings, Inc. | | 656,300 | 35,066,109 |
| Integra LifeSciences Holdings Corp. (a) | | 620,368 | 52,278,411 |
| NxStage Medical, Inc. (a) | | 1,964,700 | 43,439,517 |
| Steris PLC | | 100,667 | 7,142,324 |
| Teleflex, Inc. | | 118,600 | 21,384,766 |
| Wright Medical Group NV (a) | | 1,447,152 | 31,736,043 |
| | | | 191,047,170 |
| Health Care Providers & Services - 2.6% | | | |
| Amedisys, Inc. (a) | | 315,400 | 16,889,670 |
| AmSurg Corp. (a) | | 322,900 | 24,220,729 |
| Molina Healthcare, Inc. (a) | | 265,500 | 15,083,055 |
| Surgical Care Affiliates, Inc. (a) | | 920,886 | 47,895,281 |
| Team Health Holdings, Inc. (a) | | 500,700 | 20,448,588 |
| VCA, Inc. (a) | | 196,600 | 14,025,444 |
| | | | 138,562,767 |
| Health Care Technology - 0.2% | | | |
| Press Ganey Holdings, Inc. (a) | | 286,350 | 11,431,092 |
| Life Sciences Tools & Services - 0.5% | | | |
| Bruker Corp. | | 1,074,903 | 26,786,583 |
| Pharmaceuticals - 0.9% | | | |
| Innoviva, Inc. (b) | | 1,084,849 | 13,962,007 |
| Prestige Brands Holdings, Inc. (a) | | 313,554 | 16,775,139 |
| Theravance Biopharma, Inc. (a) | | 673,846 | 17,189,811 |
| | | | 47,926,957 |
|
| TOTAL HEALTH CARE | | | 748,273,567 |
|
| INDUSTRIALS - 13.6% | | | |
| Aerospace & Defense - 2.2% | | | |
| Moog, Inc. Class A (a) | | 616,698 | 33,961,559 |
| Orbital ATK, Inc. | | 420,591 | 36,641,888 |
| Teledyne Technologies, Inc. (a) | | 468,431 | 49,185,255 |
| | | | 119,788,702 |
| Air Freight & Logistics - 0.9% | | | |
| Hub Group, Inc. Class A (a) | | 1,137,378 | 46,564,255 |
| Airlines - 0.4% | | | |
| JetBlue Airways Corp. (a) | | 1,300,112 | 23,831,053 |
| Building Products - 0.7% | | | |
| Allegion PLC | | 279,918 | 20,263,264 |
| Simpson Manufacturing Co. Ltd. | | 457,100 | 18,649,680 |
| | | | 38,912,944 |
| Commercial Services & Supplies - 3.7% | | | |
| Deluxe Corp. | | 741,774 | 50,136,505 |
| Interface, Inc. | | 1,764,330 | 31,510,934 |
| Matthews International Corp. Class A | | 396,558 | 23,837,101 |
| Multi-Color Corp. | | 375,606 | 24,256,635 |
| Waste Connection, Inc. (Canada) | | 368,598 | 27,463,113 |
| West Corp. | | 1,853,264 | 40,975,667 |
| | | | 198,179,955 |
| Construction & Engineering - 1.7% | | | |
| EMCOR Group, Inc. | | 1,002,598 | 55,844,709 |
| Valmont Industries, Inc. | | 248,384 | 32,525,885 |
| | | | 88,370,594 |
| Industrial Conglomerates - 0.5% | | | |
| ITT, Inc. | | 874,659 | 27,735,437 |
| Machinery - 1.1% | | | |
| AGCO Corp. | | 592,353 | 28,527,720 |
| Standex International Corp. | | 331,000 | 29,392,800 |
| | | | 57,920,520 |
| Trading Companies & Distributors - 2.4% | | | |
| Kaman Corp. | | 845,807 | 36,505,030 |
| Titan Machinery, Inc. (a)(b)(c) | | 1,609,419 | 18,041,587 |
| Watsco, Inc. | | 363,302 | 52,330,020 |
| WESCO International, Inc. (a)(b) | | 390,800 | 21,783,192 |
| | | | 128,659,829 |
|
| TOTAL INDUSTRIALS | | | 729,963,289 |
|
| INFORMATION TECHNOLOGY - 17.5% | | | |
| Communications Equipment - 0.8% | | | |
| NETGEAR, Inc. (a) | | 863,570 | 44,413,405 |
| Electronic Equipment & Components - 2.7% | | | |
| Cardtronics PLC | | 702,202 | 30,889,866 |
| CDW Corp. | | 663,474 | 28,482,939 |
| Jabil Circuit, Inc. | | 960,945 | 19,555,231 |
| Tech Data Corp. (a) | | 453,394 | 35,332,994 |
| Trimble Navigation Ltd. (a) | | 1,200,625 | 31,744,525 |
| | | | 146,005,555 |
| Internet Software & Services - 0.4% | | | |
| Bankrate, Inc. (a) | | 127,338 | 1,014,884 |
| Stamps.com, Inc. (a) | | 241,832 | 18,332,075 |
| | | | 19,346,959 |
| IT Services - 6.3% | | | |
| Convergys Corp. | | 330,800 | 8,815,820 |
| CSG Systems International, Inc. | | 212,200 | 8,543,172 |
| EPAM Systems, Inc. (a) | | 437,160 | 30,706,118 |
| Euronet Worldwide, Inc. (a) | | 512,547 | 39,086,834 |
| ExlService Holdings, Inc. (a) | | 664,051 | 32,877,165 |
| Global Payments, Inc. | | 432,600 | 32,297,916 |
| ManTech International Corp. Class A | | 843,284 | 33,318,151 |
| Maximus, Inc. | | 685,500 | 40,389,660 |
| Perficient, Inc. (a) | | 739,508 | 16,431,868 |
| Science Applications International Corp. | | 606,972 | 36,879,619 |
| Virtusa Corp. (a) | | 938,700 | 25,532,640 |
| WEX, Inc. (a) | | 333,200 | 31,214,176 |
| | | | 336,093,139 |
| Semiconductors & Semiconductor Equipment - 2.5% | | | |
| Cirrus Logic, Inc. (a) | | 542,700 | 26,369,793 |
| Intersil Corp. Class A | | 1,973,600 | 30,156,608 |
| Monolithic Power Systems, Inc. | | 483,370 | 35,150,666 |
| ON Semiconductor Corp. (a) | | 1,905,500 | 19,112,165 |
| Qorvo, Inc. (a) | | 392,750 | 24,833,583 |
| | | | 135,622,815 |
| Software - 4.0% | | | |
| CommVault Systems, Inc. (a) | | 399,134 | 20,651,193 |
| Manhattan Associates, Inc. (a) | | 572,027 | 33,206,167 |
| Paycom Software, Inc. (a) | | 735,248 | 34,711,058 |
| Pegasystems, Inc. | | 1,057,226 | 29,496,605 |
| Qlik Technologies, Inc. (a) | | 723,600 | 21,852,720 |
| RealPage, Inc. (a) | | 1,349,900 | 33,949,985 |
| Tyler Technologies, Inc. (a) | | 234,172 | 38,174,719 |
| | | | 212,042,447 |
| Technology Hardware, Storage & Peripherals - 0.8% | | | |
| Electronics for Imaging, Inc. (a) | | 462,671 | 20,491,699 |
| Super Micro Computer, Inc. (a) | | 1,075,249 | 23,171,616 |
| | | | 43,663,315 |
|
| TOTAL INFORMATION TECHNOLOGY | | | 937,187,635 |
|
| MATERIALS - 3.8% | | | |
| Chemicals - 1.6% | | | |
| Chase Corp. | | 288,234 | 17,464,098 |
| Innospec, Inc. | | 533,908 | 26,839,555 |
| PolyOne Corp. | | 624,401 | 21,897,743 |
| Trinseo SA | | 423,538 | 21,087,957 |
| | | | 87,289,353 |
| Containers & Packaging - 1.6% | | | |
| Avery Dennison Corp. | | 296,100 | 23,063,229 |
| Berry Plastics Group, Inc. (a) | | 1,032,360 | 42,326,760 |
| Silgan Holdings, Inc. | | 402,100 | 19,936,118 |
| | | | 85,326,107 |
| Metals & Mining - 0.6% | | | |
| Compass Minerals International, Inc. | | 204,400 | 14,224,196 |
| Steel Dynamics, Inc. | | 639,500 | 17,151,390 |
| | | | 31,375,586 |
|
| TOTAL MATERIALS | | | 203,991,046 |
|
| TELECOMMUNICATION SERVICES - 0.3% | | | |
| Diversified Telecommunication Services - 0.3% | | | |
| Cogent Communications Group, Inc. | | 298,100 | 12,737,813 |
| UTILITIES - 4.0% | | | |
| Electric Utilities - 1.8% | | | |
| El Paso Electric Co. | | 522,380 | 24,907,078 |
| Great Plains Energy, Inc. | | 436,880 | 13,010,286 |
| IDACORP, Inc. | | 374,600 | 30,286,410 |
| Portland General Electric Co. | | 709,232 | 30,972,161 |
| | | | 99,175,935 |
| Gas Utilities - 2.2% | | | |
| Atmos Energy Corp. | | 220,886 | 17,624,494 |
| New Jersey Resources Corp. | | 458,200 | 17,063,368 |
| South Jersey Industries, Inc. | | 363,700 | 11,594,756 |
| Southwest Gas Corp. | | 500,200 | 38,765,500 |
| Spire, Inc. | | 454,200 | 31,521,480 |
| | | | 116,569,598 |
|
| TOTAL UTILITIES | | | 215,745,533 |
|
| TOTAL COMMON STOCKS | | | |
| (Cost $4,352,221,266) | | | 5,176,155,643 |
| | | Principal Amount | Value |
|
| U.S. Treasury Obligations - 0.0% | | | |
| U.S. Treasury Bills, yield at date of purchase 0.2% to 0.33% 8/4/16 to 10/27/16 (e) | | | |
| (Cost $1,279,770) | | 1,280,000 | 1,279,815 |
| | | Shares | Value |
|
| Money Market Funds - 4.7% | | | |
| Fidelity Cash Central Fund, 0.42% (f) | | 186,339,464 | $186,339,464 |
| Fidelity Securities Lending Cash Central Fund, 0.45% (f)(g) | | 64,781,028 | 64,781,028 |
| TOTAL MONEY MARKET FUNDS | | | |
| (Cost $251,120,492) | | | 251,120,492 |
| TOTAL INVESTMENT PORTFOLIO - 101.4% | | | |
| (Cost $4,604,621,528) | | | 5,428,555,950 |
| NET OTHER ASSETS (LIABILITIES) - (1.4)% | | | (72,684,174) |
| NET ASSETS - 100% | | | $5,355,871,776 |
| Futures Contracts | | | |
| | Expiration Date | Underlying Face Amount at Value | Unrealized Appreciation/(Depreciation) |
| Purchased | | | |
| Equity Index Contracts | | | |
| 293 ICE Russell 2000 Index Contracts (United States) | Sept. 2016 | 35,658,100 | $1,783,845 |
The face value of futures purchased as a percentage of Net Assets is 0.7%
Legend
(a) Non-income producing
(b) Security or a portion of the security is on loan at period end.
(c) Affiliated company
(d) Security exempt from registration under Rule 144A of the Securities Act of 1933. These securities may be resold in transactions exempt from registration, normally to qualified institutional buyers. At the end of the period, the value of these securities amounted to $1,061,320 or 0.0% of net assets.
(e) Security or a portion of the security was pledged to cover margin requirements for futures contracts. At period end, the value of securities pledged amounted to $1,279,815.
(f) Affiliated fund that is generally available only to investment companies and other accounts managed by Fidelity Investments. The rate quoted is the annualized seven-day yield of the fund at period end. A complete unaudited listing of the fund's holdings as of its most recent quarter end is available upon request. In addition, each Fidelity Central Fund's financial statements, which are not covered by the Fund's Report of Independent Registered Public Accounting Firm, are available on the SEC's website or upon request.
(g) Investment made with cash collateral received from securities on loan.
Affiliated Central Funds
Information regarding fiscal year to date income earned by the Fund from investments in Fidelity Central Funds is as follows:
| Fund | Income earned |
| Fidelity Cash Central Fund | $641,526 |
| Fidelity Securities Lending Cash Central Fund | 2,748,783 |
| Total | $3,390,309 |
Other Affiliated Issuers
An affiliated company is a company in which the Fund has ownership of at least 5% of the voting securities. Fiscal year to date transactions with companies which are or were affiliates are as follows:
| Affiliate | Value, beginning of period | Purchases | Sales Proceeds | Dividend Income | Value, end of period |
| Banner Corp. | $59,301,956 | $12,523,135 | $12,157,085 | $1,012,915 | $-- |
| Curis, Inc. | 17,343,495 | 3,447,169 | 1,813,163 | -- | 11,317,414 |
| Datalink Corp. | 11,285,581 | -- | 8,966,446 | -- | -- |
| Genocea Biosciences, Inc. | 11,551,566 | 4,471,467 | -- | -- | 7,337,437 |
| MINDBODY, Inc. | 5,160,680 | 1,625,644 | 9,376,437 | -- | -- |
| Silicon Graphics International Corp. | 11,178,886 | -- | 11,024,038 | -- | -- |
| Titan Machinery, Inc. | 22,265,302 | 309,663 | 5,721 | -- | 18,041,587 |
| Towerstream Corp. | 8,511,267 | -- | 1,209,780 | -- | -- |
| WSFS Financial Corp. | 56,720,998 | 6,593,132 | 5,206,273 | 454,466 | 71,444,603 |
| Total | $203,319,731 | $28,970,210 | $49,758,943 | $1,467,381 | $108,141,041 |
Investment Valuation
The following is a summary of the inputs used, as of July 31, 2016, involving the Fund's assets and liabilities carried at fair value. The inputs or methodology used for valuing securities may not be an indication of the risk associated with investing in those securities. For more information on valuation inputs, and their aggregation into the levels used below, please refer to the Investment Valuation section in the accompanying Notes to Financial Statements.
| | Valuation Inputs at Reporting Date: |
| Description | Total | Level 1 | Level 2 | Level 3 |
| Investments in Securities: | | | | |
| Equities: | | | | |
| Consumer Discretionary | $700,065,932 | $700,065,932 | $-- | $-- |
| Consumer Staples | 150,616,051 | 150,616,051 | -- | -- |
| Energy | 152,975,069 | 152,975,069 | -- | -- |
| Financials | 1,324,599,708 | 1,324,599,708 | -- | -- |
| Health Care | 748,273,567 | 748,273,567 | -- | -- |
| Industrials | 729,963,289 | 729,963,289 | -- | -- |
| Information Technology | 937,187,635 | 937,187,635 | -- | -- |
| Materials | 203,991,046 | 203,991,046 | -- | -- |
| Telecommunication Services | 12,737,813 | 12,737,813 | -- | -- |
| Utilities | 215,745,533 | 215,745,533 | -- | -- |
| U.S. Government and Government Agency Obligations | 1,279,815 | -- | 1,279,815 | -- |
| Money Market Funds | 251,120,492 | 251,120,492 | -- | -- |
| Total Investments in Securities: | $5,428,555,950 | $5,427,276,135 | $1,279,815 | $-- |
| Derivative Instruments: | | | | |
| Assets | | | | |
| Futures Contracts | $1,783,845 | $1,783,845 | $-- | $-- |
| Total Assets | $1,783,845 | $1,783,845 | $-- | $-- |
| Total Derivative Instruments: | $1,783,845 | $1,783,845 | $-- | $-- |
Value of Derivative Instruments
The following table is a summary of the Fund's value of derivative instruments by primary risk exposure as of July 31, 2016. For additional information on derivative instruments, please refer to the Derivative Instruments section in the accompanying Notes to Financial Statements.
| Primary Risk Exposure / Derivative Type | Value |
| | Asset | Liability |
| Equity Risk | | |
| Futures Contracts(a) | $1,783,845 | $0 |
| Total Equity Risk | 1,783,845 | 0 |
| Total Value of Derivatives | $1,783,845 | $0 |
(a) Reflects gross cumulative appreciation (depreciation) on futures contracts as presented in the Schedule of Investments. Only the period end receivable or payable for daily variation margin and net unrealized appreciation (depreciation) are presented in the Statement of Assets and Liabilities.
See accompanying notes which are an integral part of the financial statements.
Financial Statements
Statement of Assets and Liabilities
| | | July 31, 2016 |
| Assets | | |
Investment in securities, at value (including securities loaned of $62,598,800) — See accompanying schedule:
Unaffiliated issuers (cost $4,250,144,446) | $5,069,294,417 | |
| Fidelity Central Funds (cost $251,120,492) | 251,120,492 | |
| Other affiliated issuers (cost $103,356,590) | 108,141,041 | |
| Total Investments (cost $4,604,621,528) | | $5,428,555,950 |
| Receivable for investments sold | | 52,321,618 |
| Receivable for fund shares sold | | 5,996,619 |
| Dividends receivable | | 1,834,780 |
| Distributions receivable from Fidelity Central Funds | | 169,417 |
| Receivable for daily variation margin for derivative instruments | | 137,099 |
| Other receivables | | 152,868 |
| Total assets | | 5,489,168,351 |
| Liabilities | | |
| Payable to custodian bank | $282,275 | |
| Payable for investments purchased | 64,227,203 | |
| Payable for fund shares redeemed | 709,180 | |
| Accrued management fee | 2,796,982 | |
| Other affiliated payables | 413,814 | |
| Other payables and accrued expenses | 86,093 | |
| Collateral on securities loaned, at value | 64,781,028 | |
| Total liabilities | | 133,296,575 |
| Net Assets | | $5,355,871,776 |
| Net Assets consist of: | | |
| Paid in capital | | $4,609,435,295 |
| Undistributed net investment income | | 15,525,552 |
| Accumulated undistributed net realized gain (loss) on investments and foreign currency transactions | | (94,779,976) |
| Net unrealized appreciation (depreciation) on investments and assets and liabilities in foreign currencies | | 825,690,905 |
| Net Assets | | $5,355,871,776 |
| Series Small Cap Opportunities: | | |
| Net Asset Value, offering price and redemption price per share ($2,433,488,702 ÷ 188,098,609 shares) | | $12.94 |
| Class F: | | |
| Net Asset Value, offering price and redemption price per share ($2,922,383,074 ÷ 224,404,014 shares) | | $13.02 |
See accompanying notes which are an integral part of the financial statements.
Statement of Operations
| | | Year ended July 31, 2016 |
| Investment Income | | |
| Dividends (including $1,467,382 earned from other affiliated issuers) | | $64,359,280 |
| Interest | | 11,491 |
| Income from Fidelity Central Funds | | 3,390,309 |
| Total income | | 67,761,080 |
| Expenses | | |
| Management fee | | |
| Basic fee | $36,238,330 | |
| Performance adjustment | (2,040,380) | |
| Transfer agent fees | 3,961,170 | |
| Accounting and security lending fees | 1,116,719 | |
| Custodian fees and expenses | 109,543 | |
| Independent trustees' fees and expenses | 23,009 | |
| Audit | 68,644 | |
| Legal | 16,282 | |
| Miscellaneous | 40,342 | |
| Total expenses before reductions | 39,533,659 | |
| Expense reductions | (419,847) | 39,113,812 |
| Net investment income (loss) | | 28,647,268 |
| Realized and Unrealized Gain (Loss) | | |
| Net realized gain (loss) on: | | |
| Investment securities: | | |
| Unaffiliated issuers | (48,556,913) | |
| Other affiliated issuers | (44,800,523) | |
| Foreign currency transactions | (66,026) | |
| Futures contracts | 138,179 | |
| Total net realized gain (loss) | | (93,285,283) |
Change in net unrealized appreciation (depreciation) on:
Investment securities | 20,309,086 | |
| Assets and liabilities in foreign currencies | 12,541 | |
| Futures contracts | 2,631,827 | |
| Total change in net unrealized appreciation (depreciation) | | 22,953,454 |
| Net gain (loss) | | (70,331,829) |
| Net increase (decrease) in net assets resulting from operations | | $(41,684,561) |
See accompanying notes which are an integral part of the financial statements.
Statement of Changes in Net Assets
| | Year ended July 31, 2016 | Year ended July 31, 2015 |
| Increase (Decrease) in Net Assets | | |
| Operations | | |
| Net investment income (loss) | $28,647,268 | $27,929,552 |
| Net realized gain (loss) | (93,285,283) | 299,741,252 |
| Change in net unrealized appreciation (depreciation) | 22,953,454 | 340,925,005 |
| Net increase (decrease) in net assets resulting from operations | (41,684,561) | 668,595,809 |
| Distributions to shareholders from net investment income | (25,267,159) | (23,180,446) |
| Distributions to shareholders from net realized gain | (274,804,438) | (274,549,615) |
| Total distributions | (300,071,597) | (297,730,061) |
| Share transactions - net increase (decrease) | 129,114,071 | 171,463,697 |
| Total increase (decrease) in net assets | (212,642,087) | 542,329,445 |
| Net Assets | | |
| Beginning of period | 5,568,513,863 | 5,026,184,418 |
| End of period | $5,355,871,776 | $5,568,513,863 |
| Other Information | | |
| Undistributed net investment income end of period | $15,525,552 | $12,811,213 |
See accompanying notes which are an integral part of the financial statements.
Financial Highlights — Fidelity Series Small Cap Opportunities Fund
| Years ended July 31, | 2016 | 2015 | 2014 | 2013 | 2012 |
| Selected Per–Share Data | | | | | |
| Net asset value, beginning of period | $13.83 | $12.96 | $13.55 | $10.93 | $11.22 |
| Income from Investment Operations | | | | | |
| Net investment income (loss)A | .06 | .05 | .02 | .04 | –B |
| Net realized and unrealized gain (loss) | (.22) | 1.53 | .77 | 3.20 | (.17) |
| Total from investment operations | (.16) | 1.58 | .79 | 3.24 | (.17) |
| Distributions from net investment income | (.05) | (.04) | –B | (.05) | –B |
| Distributions from net realized gain | (.68) | (.66) | (1.38) | (.57) | (.11) |
| Total distributions | (.73) | (.71)C | (1.38) | (.62) | (.12)D |
| Net asset value, end of period | $12.94 | $13.83 | $12.96 | $13.55 | $10.93 |
| Total ReturnE | (.94)% | 12.66% | 6.29% | 30.91% | (1.41)% |
| Ratios to Average Net AssetsF,G | | | | | |
| Expenses before reductions | .85% | .77% | .82% | .98% | 1.12% |
| Expenses net of fee waivers, if any | .85% | .76% | .82% | .98% | 1.12% |
| Expenses net of all reductions | .84% | .76% | .82% | .96% | 1.11% |
| Net investment income (loss) | .46% | .41% | .19% | .30% | .04% |
| Supplemental Data | | | | | |
| Net assets, end of period (000 omitted) | $2,433,489 | $2,647,013 | $2,425,973 | $1,602,664 | $1,329,447 |
| Portfolio turnover rateH | 58% | 59% | 90%I | 77% | 66% |
A Calculated based on average shares outstanding during the period.
B Amount represents less than $.005 per share.
C Total distributions of $.71 per share is comprised of distributions from net investment income of $.042 and distributions from net realized gain of $.664 per share.
D Total distributions of $.12 per share is comprised of distributions from net investment income of $.003 and distributions from net realized gain of $.113 per share.
E Total returns would have been lower if certain expenses had not been reduced during the applicable periods shown.
F Fees and expenses of any underlying Fidelity Central Funds are not included in the Fund's expense ratio. The Fund indirectly bears its proportionate share of the expenses of any underlying Fidelity Central Funds.
G Expense ratios reflect operating expenses of the class. Expenses before reductions do not reflect amounts reimbursed by the investment adviser or reductions from brokerage service arrangements or reductions from other expense offset arrangements and do not represent the amount paid by the class during periods when reimbursements or reductions occur. Expenses net of fee waivers reflect expenses after reimbursement by the investment adviser but prior to reductions from brokerage service arrangements or other expense offset arrangements. Expenses net of all reductions represent the net expenses paid by the class.
H Amount does not include the portfolio activity of any underlying Fidelity Central Funds.
I Portfolio turnover rate excludes securities received or delivered in-kind.
See accompanying notes which are an integral part of the financial statements.
Financial Highlights — Fidelity Series Small Cap Opportunities Fund Class F
| Years ended July 31, | 2016 | 2015 | 2014 | 2013 | 2012 |
| Selected Per–Share Data | | | | | |
| Net asset value, beginning of period | $13.92 | $13.04 | $13.62 | $10.99 | $11.27 |
| Income from Investment Operations | | | | | |
| Net investment income (loss)A | .08 | .08 | .05 | .06 | .03 |
| Net realized and unrealized gain (loss) | (.23) | 1.53 | .77 | 3.21 | (.18) |
| Total from investment operations | (.15) | 1.61 | .82 | 3.27 | (.15) |
| Distributions from net investment income | (.07) | (.07) | (.01) | (.07) | (.01) |
| Distributions from net realized gain | (.68) | (.66) | (1.39) | (.57) | (.11) |
| Total distributions | (.75) | (.73) | (1.40) | (.64) | (.13)B |
| Net asset value, end of period | $13.02 | $13.92 | $13.04 | $13.62 | $10.99 |
| Total ReturnC | (.84)% | 12.87% | 6.52% | 31.09% | (1.23)% |
| Ratios to Average Net AssetsD,E | | | | | |
| Expenses before reductions | .69% | .60% | .65% | .79% | .91% |
| Expenses net of fee waivers, if any | .68% | .60% | .65% | .79% | .91% |
| Expenses net of all reductions | .68% | .59% | .65% | .77% | .91% |
| Net investment income (loss) | .63% | .58% | .36% | .49% | .24% |
| Supplemental Data | | | | | |
| Net assets, end of period (000 omitted) | $2,922,383 | $2,921,501 | $2,600,212 | $1,351,926 | $923,975 |
| Portfolio turnover rateF | 58% | 59% | 90%G | 77% | 66% |
A Calculated based on average shares outstanding during the period.
B Total distributions of $.13 per share is comprised of distributions from net investment income of $.012 and distributions from net realized gain of $.113 per share.
C Total returns would have been lower if certain expenses had not been reduced during the applicable periods shown.
D Fees and expenses of any underlying Fidelity Central Funds are not included in the Fund's expense ratio. The Fund indirectly bears its proportionate share of the expenses of any underlying Fidelity Central Funds.
E Expense ratios reflect operating expenses of the class. Expenses before reductions do not reflect amounts reimbursed by the investment adviser or reductions from brokerage service arrangements or reductions from other expense offset arrangements and do not represent the amount paid by the class during periods when reimbursements or reductions occur. Expenses net of fee waivers reflect expenses after reimbursement by the investment adviser but prior to reductions from brokerage service arrangements or other expense offset arrangements. Expenses net of all reductions represent the net expenses paid by the class.
F Amount does not include the portfolio activity of any underlying Fidelity Central Funds.
G Portfolio turnover rate excludes securities received or delivered in-kind.
See accompanying notes which are an integral part of the financial statements.
Notes to Financial Statements
For the period ended July 31, 2016
1. Organization.
Fidelity Series Small Cap Opportunities Fund (the Fund) is a fund of Fidelity Securities Fund (the Trust) and is authorized to issue an unlimited number of shares. Shares of the Fund are only available for purchase by mutual funds for which FMR or an affiliate serves as an investment manager and, for shares of Series Small Cap Opportunities, FMR investment professionals. The Trust is registered under the Investment Company Act of 1940, as amended (the 1940 Act), as an open-end management investment company organized as a Massachusetts business trust. The Fund offers Series Small Cap Opportunities and Class F shares, each of which has equal rights as to assets and voting privileges. Each class has exclusive voting rights with respect to matters that affect that class.
2. Investments in Fidelity Central Funds.
The Fund may invest in Fidelity Central Funds, which are open-end investment companies generally available only to other investment companies and accounts managed by the investment adviser and its affiliates. The Fund's Schedule of Investments lists each of the Fidelity Central Funds held as of period end, if any, as an investment of the Fund, but does not include the underlying holdings of each Fidelity Central Fund. As an Investing Fund, the Fund indirectly bears its proportionate share of the expenses of the underlying Fidelity Central Funds.
The Money Market Central Funds seek preservation of capital and current income and are managed by Fidelity Investments Money Management, Inc. (FIMM), an affiliate of the investment adviser. Annualized expenses of the Money Market Central Funds as of their most recent shareholder report date are less than .005%.
A complete unaudited list of holdings for each Fidelity Central Fund is available upon request or at the Securities and Exchange Commission (the SEC) website at www.sec.gov. In addition, the financial statements of the Fidelity Central Funds, which are not covered by the Fund's Report of Independent Registered Public Accounting Firm, are available on the SEC website or upon request.
3. Significant Accounting Policies.
The financial statements have been prepared in conformity with accounting principles generally accepted in the United States of America (GAAP), which require management to make certain estimates and assumptions at the date of the financial statements. Actual results could differ from those estimates. Subsequent events, if any, through the date that the financial statements were issued have been evaluated in the preparation of the financial statements. The following summarizes the significant accounting policies of the Fund:
Investment Valuation. Investments are valued as of 4:00 p.m. Eastern time on the last calendar day of the period. The Board of Trustees (the Board) has delegated the day to day responsibility for the valuation of the Fund's investments to the FMR Fair Value Committee (the Committee). In accordance with valuation policies and procedures approved by the Board, the Fund attempts to obtain prices from one or more third party pricing vendors or brokers to value its investments. When current market prices, quotations or currency exchange rates are not readily available or reliable, investments will be fair valued in good faith by the Committee, in accordance with procedures adopted by the Board. Factors used in determining fair value vary by investment type and may include market or investment specific events, changes in interest rates and credit quality. The frequency with which these procedures are used cannot be predicted and they may be utilized to a significant extent. The Committee oversees the Fund's valuation policies and procedures and reports to the Board on the Committee's activities and fair value determinations. The Board monitors the appropriateness of the procedures used in valuing the Fund's investments and ratifies the fair value determinations of the Committee.
The Fund categorizes the inputs to valuation techniques used to value its investments into a disclosure hierarchy consisting of three levels as shown below:
- Level 1 – quoted prices in active markets for identical investments
- Level 2 – other significant observable inputs (including quoted prices for similar investments, interest rates, prepayment speeds, etc.)
- Level 3 – unobservable inputs (including the Fund's own assumptions based on the best information available)
Valuation techniques used to value the Fund's investments by major category are as follows:
Equity securities, including restricted securities, for which market quotations are readily available, are valued at the last reported sale price or official closing price as reported by a third party pricing vendor on the primary market or exchange on which they are traded and are categorized as Level 1 in the hierarchy. In the event there were no sales during the day or closing prices are not available, securities are valued at the last quoted bid price or may be valued using the last available price and are generally categorized as Level 2 in the hierarchy. For foreign equity securities, when market or security specific events arise, comparisons to the valuation of American Depositary Receipts (ADRs), futures contracts, Exchange-Traded Funds (ETFs) and certain indexes as well as quoted prices for similar securities may be used and would be categorized as Level 2 in the hierarchy. Utilizing these techniques may result in transfers between Level 1 and Level 2. For equity securities, including restricted securities, where observable inputs are limited, assumptions about market activity and risk are used and these securities may be categorized as Level 3 in the hierarchy.
Debt securities, including restricted securities, are valued based on evaluated prices received from third party pricing vendors or from brokers who make markets in such securities. U.S. government and government agency obligations are valued by pricing vendors who utilize matrix pricing which considers yield or price of bonds of comparable quality, coupon, maturity and type or by broker-supplied prices. When independent prices are unavailable or unreliable, debt securities may be valued utilizing pricing methodologies which consider similar factors that would be used by third party pricing vendors. Debt securities are generally categorized as Level 2 in the hierarchy but may be Level 3 depending on the circumstances.
Futures contracts are valued at the settlement price established each day by the board of trade or exchange on which they are traded and are categorized as Level 1 in the hierarchy. Investments in open-end mutual funds, including the Fidelity Central Funds, are valued at their closing net asset value (NAV) each business day and are categorized as Level 1 in the hierarchy.
Changes in valuation techniques may result in transfers in or out of an assigned level within the disclosure hierarchy. The aggregate value of investments by input level as of July 31, 2016, is included at the end of the Fund's Schedule of Investments.
Foreign Currency. The Fund may use foreign currency contracts to facilitate transactions in foreign-denominated securities. Gains and losses from these transactions may arise from changes in the value of the foreign currency or if the counterparties do not perform under the contracts' terms.
Foreign-denominated assets, including investment securities, and liabilities are translated into U.S. dollars at the exchange rates at period end. Purchases and sales of investment securities, income and dividends received and expenses denominated in foreign currencies are translated into U.S. dollars at the exchange rate in effect on the transaction date.
The effects of exchange rate fluctuations on investments are included with the net realized and unrealized gain (loss) on investment securities. Other foreign currency transactions resulting in realized and unrealized gain (loss) are disclosed separately.
Investment Transactions and Income. For financial reporting purposes, the Fund's investment holdings and NAV include trades executed through the end of the last business day of the period. The NAV per share for processing shareholder transactions is calculated as of the close of business of the New York Stock Exchange (NYSE), normally 4:00 p.m. Eastern time and includes trades executed through the end of the prior business day. Gains and losses on securities sold are determined on the basis of identified cost and may include proceeds received from litigation. Dividend income is recorded on the ex-dividend date, except for certain dividends from foreign securities where the ex-dividend date may have passed, which are recorded as soon as the Fund is informed of the ex-dividend date. Non-cash dividends included in dividend income, if any, are recorded at the fair market value of the securities received. Income and capital gain distributions from Fidelity Central Funds, if any, are recorded on the ex-dividend date. Distributions received on securities that represent a return of capital or capital gain are recorded as a reduction of cost of investments and/or as a realized gain. Subsequent to ex-dividend date the Fund determines the components of these distributions, based upon receipt of tax filings or other correspondence relating to the underlying investment. Interest income is accrued as earned and includes coupon interest and amortization of premium and accretion of discount on debt securities as applicable. Investment income is recorded net of foreign taxes withheld where recovery of such taxes is uncertain.
Class Allocations and Expenses. Investment income, realized and unrealized capital gains and losses, common expenses of the Fund, and certain fund-level expense reductions, if any, are allocated daily on a pro-rata basis to each class based on the relative net assets of each class to the total net assets of the Fund. Each class differs with respect to transfer agent fees incurred. Certain expense reductions may also differ by class. For the reporting period, the allocated portion of income and expenses to each class as a percent of its average net assets may vary due to the timing of recording these transactions in relation to fluctuating net assets of the classes. Expenses directly attributable to a fund are charged to that fund. Expenses attributable to more than one fund are allocated among the respective funds on the basis of relative net assets or other appropriate methods. Expense estimates are accrued in the period to which they relate and adjustments are made when actual amounts are known.
Income Tax Information and Distributions to Shareholders. Each year, the Fund intends to qualify as a regulated investment company under Subchapter M of the Internal Revenue Code, including distributing substantially all of its taxable income and realized gains. As a result, no provision for U.S. Federal income taxes is required. As of July 31, 2016, the Fund did not have any unrecognized tax benefits in the financial statements; nor is the Fund aware of any tax positions for which it is reasonably possible that the total amounts of unrecognized tax benefits will significantly change in the next twelve months. The Fund files a U.S. federal tax return, in addition to state and local tax returns as required. The Fund's federal income tax returns are subject to examination by the Internal Revenue Service (IRS) for a period of three fiscal years after they are filed. State and local tax returns may be subject to examination for an additional fiscal year depending on the jurisdiction. Foreign taxes are provided for based on the Fund's understanding of the tax rules and rates that exist in the foreign markets in which it invests.
Distributions are declared and recorded on the ex-dividend date. Income dividends and capital gain distributions are declared separately for each class. Income and capital gain distributions are determined in accordance with income tax regulations, which may differ from GAAP. In addition, the Fund claimed a portion of the payment made to redeeming shareholders as a distribution for income tax purposes.
Capital accounts within the financial statements are adjusted for permanent book-tax differences. These adjustments have no impact on net assets or the results of operations. Capital accounts are not adjusted for temporary book-tax differences which will reverse in a subsequent period.
Book-tax differences are primarily due to futures transactions, foreign currency transactions, market discount, partnerships, capital loss carryforwards and losses deferred due to wash sales.
The federal tax cost of investment securities and unrealized appreciation (depreciation) as of period end were as follows:
| Gross unrealized appreciation | $1,024,294,967 |
| Gross unrealized depreciation | (211,450,221) |
| Net unrealized appreciation (depreciation) on securities | $812,844,746 |
| Tax Cost | $4,615,711,204 |
The tax-based components of distributable earnings as of period end were as follows:
| Undistributed ordinary income | $15,524,937 |
| Capital loss carryforward | $(81,905,842) |
| Net unrealized appreciation (depreciation) on securities and other investments | $812,817,384 |
Capital loss carryforwards are only available to offset future capital gains of the Fund to the extent provided by regulations and may be limited. Under the Regulated Investment Company Modernization Act of 2010 (the Act), the Fund is permitted to carry forward capital losses incurred in taxable years beginning after December 22, 2010 for an unlimited period and such capital losses are required to be used prior to any losses that expire. The capital loss carryforward information presented below, including any applicable limitation, is estimated as of fiscal period end and is subject to adjustment.
| No expiration | |
| Short-term | $(54,677,976) |
| Long-term | (27,227,866) |
| Total capital loss carryforward | $(81,905,842) |
The tax character of distributions paid was as follows:
| | July 31, 2016 | July 31, 2015 |
| Ordinary Income | $25,267,159 | $ 111,703,354 |
| Long-term Capital Gains | 274,804,438 | 186,026,707 |
| Total | $300,071,597 | $ 297,730,061 |
Restricted Securities. The Fund may invest in securities that are subject to legal or contractual restrictions on resale. These securities generally may be resold in transactions exempt from registration or to the public if the securities are registered. Disposal of these securities may involve time-consuming negotiations and expense, and prompt sale at an acceptable price may be difficult. Information regarding restricted securities is included at the end of the Fund's Schedule of Investments.
4. Derivative Instruments.
Risk Exposures and the Use of Derivative Instruments. The Fund's investment objective allows the Fund to enter into various types of derivative contracts, including futures contracts. Derivatives are investments whose value is primarily derived from underlying assets, indices or reference rates and may be transacted on an exchange or over-the-counter (OTC). Derivatives may involve a future commitment to buy or sell a specified asset based on specified terms, to exchange future cash flows at periodic intervals based on a notional principal amount, or for one party to make one or more payments upon the occurrence of specified events in exchange for periodic payments from the other party.
The Fund used derivatives to increase returns and to manage exposure to certain risks as defined below. The success of any strategy involving derivatives depends on analysis of numerous economic factors, and if the strategies for investment do not work as intended, the Fund may not achieve its objectives.
The Fund's use of derivatives increased or decreased its exposure to the following risk:
| Equity Risk | Equity risk relates to the fluctuations in the value of financial instruments as a result of changes in market prices (other than those arising from interest rate risk or foreign exchange risk), whether caused by factors specific to an individual investment, its issuer, or all factors affecting all instruments traded in a market or market segment.
|
The Fund is also exposed to additional risks from investing in derivatives, such as liquidity risk and counterparty credit risk. Liquidity risk is the risk that the Fund will be unable to close out the derivative in the open market in a timely manner. Counterparty credit risk is the risk that the counterparty will not be able to fulfill its obligation to the Fund. Counterparty credit risk related to exchange-traded futures contracts may be mitigated by the protection provided by the exchange on which they trade.
Investing in derivatives may involve greater risks than investing in the underlying assets directly and, to varying degrees, may involve risk of loss in excess of any initial investment and collateral received and amounts recognized in the Statement of Assets and Liabilities. In addition, there may be the risk that the change in value of the derivative contract does not correspond to the change in value of the underlying instrument.
Futures Contracts. A futures contract is an agreement between two parties to buy or sell a specified underlying instrument for a fixed price at a specified future date. The Fund used futures contracts to manage its exposure to the stock market.
Upon entering into a futures contract, a fund is required to deposit either cash or securities (initial margin) with a clearing broker in an amount equal to a certain percentage of the face value of the contract. Futures contracts are marked-to-market daily and subsequent daily payments (variation margin) are made or received by a fund depending on the daily fluctuations in the value of the futures contracts and are recorded as unrealized appreciation or (depreciation). This receivable and/or payable, if any, is included in daily variation margin for derivative instruments in the Statement of Assets and Liabilities. Realized gain or (loss) is recorded upon the expiration or closing of a futures contract.
Any open futures contracts at period end are presented in the Schedule of Investments under the caption "Futures Contracts". The underlying face amount at value reflects each contract's exposure to the underlying instrument or index at period end and is representative of volume of activity during the period. Securities deposited to meet initial margin requirements are identified in the Schedule of Investments.
During the period the Fund recognized net realized gain (loss) of $138,179 and a change in net unrealized appreciation (depreciation) of $2,631,827 related to its investment in futures contracts. These amounts are included in the Statement of Operations.
5. Purchases and Sales of Investments.
Purchases and sales of securities, other than short-term securities, aggregated $2,952,061,791 and $2,908,528,024, respectively.
6. Fees and Other Transactions with Affiliates.
Management Fee. Fidelity Management & Research Company (the investment adviser) and its affiliates provide the Fund with investment management related services for which the Fund pays a monthly management fee. The management fee is the sum of an individual fund fee rate that is based on an annual rate of .45% of the Fund's average net assets and an annualized group fee rate that averaged .25% during the period. The group fee rate is based upon the average net assets of all the mutual funds advised by the investment adviser, including any mutual funds previously advised by the investment adviser that are currently advised by Fidelity SelectCo, LLC, an affiliate of the investment adviser. The group fee rate decreases as assets under management increase and increases as assets under management decrease. In addition, the management fee is subject to a performance adjustment (up to a maximum of +/- .20% of the Fund's average net assets over a 36 month performance period). The upward or downward adjustment to the management fee is based on the relative investment performance of Series Small Cap Opportunities as compared to its benchmark index, the Russell 2000 Index, over the same 36 month performance period. For the reporting period, the total annual management fee rate, including the performance adjustment, was .66% of the Fund's average net assets. The performance adjustment included in the management fee rate may be higher or lower than the maximum performance adjustment rate due to the difference between the average net assets for the reporting and performance periods.
Transfer Agent Fees. Fidelity Investments Institutional Operations Company, Inc., (FIIOC), an affiliate of the investment adviser, is the transfer, dividend disbursing and shareholder servicing agent for each class of the Fund. FIIOC receives account fees and asset-based fees that vary according to the account size and type of account of the shareholders of Series Small Cap Opportunities. FIIOC receives no fees for providing transfer agency services to Class F. FIIOC pays for typesetting, printing and mailing of shareholder reports, except proxy statements.
For the period, transfer agent fees for each applicable class were as follows:
| | Amount | % of
Class-Level Average
Net Assets |
| Series Small Cap Opportunities | $3,961,170 | .17 |
Accounting and Security Lending Fees. Fidelity Service Company, Inc. (FSC), an affiliate of the investment adviser, maintains the Fund's accounting records. The accounting fee is based on the level of average net assets for each month. Under a separate contract, FSC administers the security lending program. The security lending fee is based on the number and duration of lending transactions.
Brokerage Commissions. The Fund placed a portion of its portfolio transactions with brokerage firms which are affiliates of the investment adviser. Brokerage commissions are included in net realized gain (loss) and change in net unrealized appreciation (depreciation) in the Statement of Operations. The commissions paid to these affiliated firms were $110,290 for the period.
Interfund Trades. The Fund may purchase from or sell securities to other Fidelity Funds under procedures adopted by the Board. The procedures have been designed to ensure these interfund trades are executed in accordance with Rule 17a-7 of the 1940 Act. Interfund trades are included within the respective purchases and sales amounts shown in the Purchases and Sales of Investments note.
7. Committed Line of Credit.
The Fund participates with other funds managed by the investment adviser or an affiliate in a $4.25 billion credit facility (the "line of credit") to be utilized for temporary or emergency purposes to fund shareholder redemptions or for other short-term liquidity purposes. The Fund has agreed to pay commitment fees on its pro-rata portion of the line of credit, which amounted to $10,652 and is reflected in Miscellaneous expenses on the Statement of Operations. During the period, the Fund did not borrow on this line of credit.
8. Security Lending.
The Fund lends portfolio securities through a lending agent from time to time in order to earn additional income. For equity securities, a lending agent is used and may loan securities to certain qualified borrowers, including Fidelity Capital Markets (FCM), a broker-dealer affiliated with the Fund. On the settlement date of the loan, the Fund receives collateral (in the form of U.S. Treasury obligations, letters of credit and/or cash) against the loaned securities and maintains collateral in an amount not less than 100% of the market value of the loaned securities during the period of the loan. The market value of the loaned securities is determined at the close of business of the Fund and any additional required collateral is delivered to the Fund on the next business day. The Fund or borrower may terminate the loan at any time, and if the borrower defaults on its obligation to return the securities loaned because of insolvency or other reasons, the Fund may apply collateral received from the borrower against the obligation. The Fund may experience delays and costs in recovering the securities loaned. Any cash collateral received is invested in Fidelity Securities Lending Cash Central Fund. The value of loaned securities and cash collateral at period end are disclosed on the Fund's Statement of Assets and Liabilities. The value of securities loaned to FCM at period end was $3,186,942. Security lending income represents the income earned on investing cash collateral, less rebates paid to borrowers and any lending agent fees associated with the loan, plus any premium payments received for lending certain types of securities. Security lending income is presented in the Statement of Operations as a component of income from Fidelity Central Funds. Total security lending income during the period amounted to $2,748,783 from securities loaned to FCM, including $419,478 from securities loaned to FCM.
9. Expense Reductions.
Commissions paid to certain brokers with whom the investment adviser, or its affiliates, places trades on behalf of the Fund include an amount in addition to trade execution, which may be rebated back to the Fund to offset certain expenses. This amount totaled $380,945 for the period. Through arrangements with the Fund's custodian, credits realized as a result of certain uninvested cash balances were used to reduce the Fund's expenses. During the period, these credits reduced the Fund's custody expenses by $821.
In addition, during the period the investment adviser reimbursed and/or waived a portion of fund-level operating expenses in the amount of $38,081.
10. Distributions to Shareholders.
Distributions to shareholders of each class were as follows:
| | Year ended
July 31, 2016 | Year ended July 31, 2015 |
| From net investment income | | |
| Series Small Cap Opportunities | $9,533,676 | $8,552,160 |
| Class F | 15,733,483 | 14,628,286 |
| Total | $25,267,159 | $23,180,446 |
| From net realized gain | | |
| Series Small Cap Opportunities | $129,456,186 | $131,736,083 |
| Class F | 145,348,252 | 142,813,532 |
| Total | $274,804,438 | $274,549,615 |
11. Share Transactions.
Transactions for each class of shares were as follows:
| | Shares | Shares | Dollars | Dollars |
| | Year ended
July 31, 2016 | Year ended July 31, 2015 | Year ended
July 31, 2016 | Year ended July 31, 2015 |
| Series Small Cap Opportunities | | | | |
| Shares sold | 21,652,402 | 28,483,380 | $258,866,910 | $373,867,989 |
| Reinvestment of distributions | 11,216,113 | 11,011,697 | 138,989,862 | 140,288,243 |
| Shares redeemed | (36,188,248) | (35,222,232) | (445,277,816) | (467,728,523) |
| Net increase (decrease) | (3,319,733) | 4,272,845 | $(47,421,044) | $46,427,709 |
| Class F | | | | |
| Shares sold | 41,429,247 | 42,361,309 | $502,713,957 | $560,257,508 |
| Reinvestment of distributions | 12,929,264 | 12,293,383 | 161,081,735 | 157,441,818 |
| Shares redeemed | (39,887,913) | (44,064,466) | (487,260,577) | (592,663,338) |
| Net increase (decrease) | 14,470,598 | 10,590,226 | $176,535,115 | $125,035,988 |
12. Other.
The Fund's organizational documents provide former and current trustees and officers with a limited indemnification against liabilities arising in connection with the performance of their duties to the Fund. In the normal course of business, the Fund may also enter into contracts that provide general indemnifications. The Fund's maximum exposure under these arrangements is unknown as this would be dependent on future claims that may be made against the Fund. The risk of material loss from such claims is considered remote.
At the end of the period, mutual funds managed by the investment adviser or its affiliates were the owners of record of all of the outstanding shares of the Fund.
Report of Independent Registered Public Accounting Firm
To the Trustees of Fidelity Securities Fund and Shareholders of Fidelity Series Small Cap Opportunities Fund:
We have audited the accompanying statement of assets and liabilities of Fidelity Series Small Cap Opportunities Fund (the Fund), a fund of Fidelity Securities Fund, including the schedule of investments, as of July 31, 2016, and the related statement of operations for the year then ended, the statement of changes in net assets for each of the two years in the period then ended, and the financial highlights for each of the five years in the period then ended. These financial statements and financial highlights are the responsibility of the Fund's management. Our responsibility is to express an opinion on these financial statements and financial highlights based on our audits.
We conducted our audits in accordance with the standards of the Public Company Accounting Oversight Board (United States). Those standards require that we plan and perform the audit to obtain reasonable assurance about whether the financial statements and financial highlights are free of material misstatement. The Fund is not required to have, nor were we engaged to perform, an audit of its internal control over financial reporting. Our audits included consideration of internal control over financial reporting as a basis for designing audit procedures that are appropriate in the circumstances, but not for the purpose of expressing an opinion on the effectiveness of the Fund's internal control over financial reporting. Accordingly, we express no such opinion. An audit also includes examining, on a test basis, evidence supporting the amounts and disclosures in the financial statements, assessing the accounting principles used and significant estimates made by management, as well as evaluating the overall financial statement presentation. Our procedures included confirmation of securities owned as of July 31, 2016, by correspondence with the custodians and brokers; when replies were not received from brokers, we performed other auditing procedures. We believe that our audits provide a reasonable basis for our opinion.
In our opinion, such financial statements and financial highlights referred to above present fairly, in all material respects, the financial position of Fidelity Series Small Cap Opportunities Fund as of July 31, 2016, the results of its operations for the year then ended, the changes in its net assets for each of the two years in the period then ended, and the financial highlights for each of the five years in the period then ended, in conformity with accounting principles generally accepted in the United States of America.
DELOITTE & TOUCHE LLP
Boston, Massachusetts
September 20, 2016
Trustees and Officers
The Trustees, Members of the Advisory Board (if any), and officers of the trust and fund, as applicable, are listed below. The Board of Trustees governs the fund and is responsible for protecting the interests of shareholders. The Trustees are experienced executives who meet periodically throughout the year to oversee the fund's activities, review contractual arrangements with companies that provide services to the fund, oversee management of the risks associated with such activities and contractual arrangements, and review the fund's performance. Each of the Trustees oversees 170 funds.
The Trustees hold office without limit in time except that (a) any Trustee may resign; (b) any Trustee may be removed by written instrument, signed by at least two-thirds of the number of Trustees prior to such removal; (c) any Trustee who requests to be retired or who has become incapacitated by illness or injury may be retired by written instrument signed by a majority of the other Trustees; and (d) any Trustee may be removed at any special meeting of shareholders by a two-thirds vote of the outstanding voting securities of the trust. Each Trustee who is not an interested person (as defined in the 1940 Act) of the trust and the fund is referred to herein as an Independent Trustee. Each Independent Trustee shall retire not later than the last day of the calendar year in which his or her 75th birthday occurs. The Independent Trustees may waive this mandatory retirement age policy with respect to individual Trustees. Officers and Advisory Board Members hold office without limit in time, except that any officer or Advisory Board Member may resign or may be removed by a vote of a majority of the Trustees at any regular meeting or any special meeting of the Trustees. Except as indicated, each individual has held the office shown or other offices in the same company for the past five years.
The fund’s Statement of Additional Information (SAI) includes more information about the Trustees. To request a free copy, call Fidelity at 1-800-544-8544 for Fidelity® Series Small Cap Opportunities Fund, or 1-800-835-5092 for Class F.
Experience, Skills, Attributes, and Qualifications of the Trustees. The Governance and Nominating Committee has adopted a statement of policy that describes the experience, qualifications, attributes, and skills that are necessary and desirable for potential Independent Trustee candidates (Statement of Policy). The Board believes that each Trustee satisfied at the time he or she was initially elected or appointed a Trustee, and continues to satisfy, the standards contemplated by the Statement of Policy. The Governance and Nominating Committee also engages professional search firms to help identify potential Independent Trustee candidates who have the experience, qualifications, attributes, and skills consistent with the Statement of Policy. From time to time, additional criteria based on the composition and skills of the current Independent Trustees, as well as experience or skills that may be appropriate in light of future changes to board composition, business conditions, and regulatory or other developments, have also been considered by the professional search firms and the Governance and Nominating Committee. In addition, the Board takes into account the Trustees' commitment and participation in Board and committee meetings, as well as their leadership of standing and ad hoc committees throughout their tenure.
In determining that a particular Trustee was and continues to be qualified to serve as a Trustee, the Board has considered a variety of criteria, none of which, in isolation, was controlling. The Board believes that, collectively, the Trustees have balanced and diverse experience, qualifications, attributes, and skills, which allow the Board to operate effectively in governing the fund and protecting the interests of shareholders. Information about the specific experience, skills, attributes, and qualifications of each Trustee, which in each case led to the Board's conclusion that the Trustee should serve (or continue to serve) as a trustee of the fund, is provided below.
Board Structure and Oversight Function. James C. Curvey is an interested person and currently serves as Chairman. The Trustees have determined that an interested Chairman is appropriate and benefits shareholders because an interested Chairman has a personal and professional stake in the quality and continuity of services provided to the fund. Independent Trustees exercise their informed business judgment to appoint an individual of their choosing to serve as Chairman, regardless of whether the Trustee happens to be independent or a member of management. The Independent Trustees have determined that they can act independently and effectively without having an Independent Trustee serve as Chairman and that a key structural component for assuring that they are in a position to do so is for the Independent Trustees to constitute a substantial majority for the Board. The Independent Trustees also regularly meet in executive session. Ned C. Lautenbach serves as Chairman of the Independent Trustees and as such (i) acts as a liaison between the Independent Trustees and management with respect to matters important to the Independent Trustees and (ii) with management prepares agendas for Board meetings.
Fidelity® funds are overseen by different Boards of Trustees. The fund's Board oversees Fidelity's high income and certain equity funds, and other Boards oversee Fidelity's investment-grade bond, money market, asset allocation, and sector funds. The asset allocation funds may invest in Fidelity® funds overseen by the fund's Board. The use of separate Boards, each with its own committee structure, allows the Trustees of each group of Fidelity® funds to focus on the unique issues of the funds they oversee, including common research, investment, and operational issues. On occasion, the separate Boards establish joint committees to address issues of overlapping consequences for the Fidelity® funds overseen by each Board.
The Trustees operate using a system of committees to facilitate the timely and efficient consideration of all matters of importance to the Trustees, the fund, and fund shareholders and to facilitate compliance with legal and regulatory requirements and oversight of the fund's activities and associated risks. The Board, acting through its committees, has charged FMR and its affiliates with (i) identifying events or circumstances the occurrence of which could have demonstrably adverse effects on the fund's business and/or reputation; (ii) implementing processes and controls to lessen the possibility that such events or circumstances occur or to mitigate the effects of such events or circumstances if they do occur; and (iii) creating and maintaining a system designed to evaluate continuously business and market conditions in order to facilitate the identification and implementation processes described in (i) and (ii) above. Because the day-to-day operations and activities of the fund are carried out by or through FMR, its affiliates, and other service providers, the fund's exposure to risks is mitigated but not eliminated by the processes overseen by the Trustees. While each of the Board's committees has responsibility for overseeing different aspects of the fund's activities, oversight is exercised primarily through the Operations, Audit, and Compliance Committees. In addition, the Independent Trustees have worked with FMR to enhance the Board's oversight of investment and financial risks, legal and regulatory risks, technology risks, and operational risks, including the development of additional risk reporting to the Board. For example, a working group comprised of Independent Trustees and FMR has worked and continues to work to review the Fidelity® funds' valuation-related activities, reporting and risk management. Appropriate personnel, including but not limited to the fund's Chief Compliance Officer (CCO), FMR's internal auditor, the independent accountants, the fund's Treasurer and portfolio management personnel, make periodic reports to the Board's committees, as appropriate, including an annual review of Fidelity's risk management program for the Fidelity® funds. The responsibilities of each standing committee, including their oversight responsibilities, are described further under "Standing Committees of the Trustees."
Interested Trustees*:
Correspondence intended for a Trustee who is an interested person may be sent to Fidelity Investments, 245 Summer Street, Boston, Massachusetts 02210.
Name, Year of Birth; Principal Occupations and Other Relevant Experience+
James C. Curvey (1935)
Year of Election or Appointment: 2007
Trustee
Chairman of the Board of Trustees
Mr. Curvey also serves as Trustee of other Fidelity® funds. Mr. Curvey is a Director of Fidelity Research & Analysis Co. (investment adviser firm, 2009-present), and Vice Chairman (2007-present) and Director of FMR LLC (diversified financial services company). In addition, Mr. Curvey serves as an Overseer for the Boston Symphony Orchestra and a member of the board of Artis-Naples, Naples, Florida, and as a Trustee for Brewster Academy, Wolfeboro, New Hampshire. Previously, Mr. Curvey served as a Director of Fidelity Investments Money Management, Inc. (investment adviser firm, 2009-2014) and a Director of FMR and FMR Co., Inc. (investment adviser firms, 2007-2014).
Charles S. Morrison (1960)
Year of Election or Appointment: 2014
Trustee
Mr. Morrison also serves as Trustee of other funds. He serves as a Director of Fidelity Investments Money Management, Inc. (FIMM) (investment adviser firm, 2014-present), Director of Fidelity SelectCo, LLC (investment adviser firm, 2014-present), President, Asset Management (2014-present), and is an employee of Fidelity Investments. Previously, Mr. Morrison served as Vice President of Fidelity's Fixed Income and Asset Allocation Funds (2012-2014), President, Fixed Income (2011-2014), Vice President of Fidelity's Money Market Funds (2005-2009), President, Money Market Group Leader of FMR (investment adviser firm, 2009), and Senior Vice President, Money Market Group of FMR (2004-2009). Mr. Morrison also served as Vice President of Fidelity's Bond Funds (2002-2005), certain Balanced Funds (2002-2005), and certain Asset Allocation Funds (2002-2007), and as Senior Vice President (2002-2005) of Fidelity's Bond Division.
* Determined to be an “Interested Trustee” by virtue of, among other things, his or her affiliation with the trust or various entities under common control with FMR.
+ The information includes the Trustee's principal occupation during the last five years and other information relating to the experience, attributes, and skills relevant to the Trustee's qualifications to serve as a Trustee, which led to the conclusion that the Trustee should serve as a Trustee for the fund.
Independent Trustees:
Correspondence intended for an Independent Trustee may be sent to Fidelity Investments, P.O. Box 55235, Boston, Massachusetts 02205-5235.
Name, Year of Birth; Principal Occupations and Other Relevant Experience+
Dennis J. Dirks (1948)
Year of Election or Appointment: 2005
Trustee
Mr. Dirks also serves as Trustee of other Fidelity® funds. Prior to his retirement in May 2003, Mr. Dirks was Chief Operating Officer and a member of the Board of The Depository Trust & Clearing Corporation (DTCC). He also served as President, Chief Operating Officer, and Board member of The Depository Trust Company (DTC) and President and Board member of the National Securities Clearing Corporation (NSCC). In addition, Mr. Dirks served as Chief Executive Officer and Board member of the Government Securities Clearing Corporation, Chief Executive Officer and Board member of the Mortgage-Backed Securities Clearing Corporation, as a Trustee and a member of the Finance Committee of Manhattan College (2005-2008), as a Trustee and a member of the Finance Committee of AHRC of Nassau County (2006-2008), and as a member of the Independent Directors Council (IDC) Governing Council (2010-2015). Mr. Dirks is a member of the Board of Directors for The Brookville Center for Children's Services, Inc. (2009-present).
Alan J. Lacy (1953)
Year of Election or Appointment: 2008
Trustee
Mr. Lacy also serves as Trustee of other Fidelity® funds. Mr. Lacy serves as Chairman (2014-present) and a member (2010-present) of the Board of Directors of Dave & Buster's Entertainment, Inc. (restaurant and entertainment complexes) and a Director of Bristol-Myers Squibb Company (global pharmaceuticals, 2008-present). He is a Trustee of the California Chapter of The Nature Conservancy (2015-present) and a Director of the Center for Advanced Study in the Behavioral Sciences at Stanford University (2015-present). In addition, Mr. Lacy served as Senior Adviser (2007-2014) of Oak Hill Capital Partners, L.P. (private equity) and also served as Chief Executive Officer (2005) and Vice Chairman (2005-2006) of Sears Holdings Corporation (retail) and Chief Executive Officer and Chairman of the Board of Sears, Roebuck and Co. (retail, 2000-2005). Previously, Mr. Lacy served as Chairman (2008-2011) and a member (2006-2015) of the Board of Trustees of the National Parks Conservation Association and as a member of the Board of Directors for The Western Union Company (global money transfer, 2006-2011), The Hillman Companies, Inc. (hardware wholesalers, 2010-2014), and Earth Fare, Inc. (retail grocery, 2010-2014).
Ned C. Lautenbach (1944)
Year of Election or Appointment: 2000
Trustee
Chairman of the Independent Trustees
Mr. Lautenbach also serves as Trustee of other Fidelity® funds. Mr. Lautenbach currently serves as the Lead Director of the Eaton Corporation Board of Directors (diversified industrial, 1997-present). Mr. Lautenbach is Chairman of the Board of Directors of Artis-Naples in Naples, Florida (2012-present), a member of the Council on Foreign Relations (1994-present), and a member of the Board of Governors, State University System of Florida (2013-present). Previously, Mr. Lautenbach was a Partner/Advisory Partner at Clayton, Dubilier & Rice, LLC (private equity investment, 1998-2010), as well as a Director of Sony Corporation (2006-2007).
Joseph Mauriello (1944)
Year of Election or Appointment: 2008
Trustee
Mr. Mauriello also serves as Trustee of other Fidelity® funds. Prior to his retirement in January 2006, Mr. Mauriello served in numerous senior management positions including Deputy Chairman and Chief Operating Officer (2004-2005), and Vice Chairman of Financial Services (2002-2004) of KPMG LLP US (professional services, 1965-2005). Mr. Mauriello currently serves as a member of the Board of Directors of XL Group plc. (global insurance and re-insurance, 2006-present) and the Independent Directors Council (IDC) Governing Council (2015-present). Previously, Mr. Mauriello served as a Director of the Hamilton Funds of the Bank of New York (2006-2007) and of Arcadia Resources Inc. (health care services and products, 2007-2012).
Robert W. Selander (1950)
Year of Election or Appointment: 2011
Trustee
Mr. Selander also serves as Trustee of other Fidelity® funds. Mr. Selander serves as a Director of The Western Union Company (global money transfer, 2014-present) and a non-executive Chairman of Health Equity, Inc. (health savings custodian, 2015-present). Previously, Mr. Selander served as a Member of the Advisory Board of certain Fidelity® funds (2011), and Executive Vice Chairman (2010), Chief Executive Officer (2009-2010), and President and Chief Executive Officer (1997-2009) of Mastercard, Inc.
Cornelia M. Small (1944)
Year of Election or Appointment: 2005
Trustee
Ms. Small also serves as Trustee of other Fidelity® funds. Ms. Small is a member of the Board of Directors (2009-present) and Chair of the Investment Committee (2010-present) of the Teagle Foundation. Ms. Small also serves on the Investment Committee of the Berkshire Taconic Community Foundation (2008-present). Previously, Ms. Small served as Chairperson (2002-2008) and a member of the Investment Committee and Chairperson (2008-2012) and a member of the Board of Trustees of Smith College. In addition, Ms. Small served as Chief Investment Officer, Director of Global Equity Investments, and a member of the Board of Directors of Scudder, Stevens & Clark and Scudder Kemper Investments.
William S. Stavropoulos (1939)
Year of Election or Appointment: 2002
Trustee
Vice Chairman of the Independent Trustees
Mr. Stavropoulos also serves as Trustee of other Fidelity® funds. Mr. Stavropoulos serves as President and Founder of the Michigan Baseball Foundation, the Great Lakes Loons (2007-present). Mr. Stavropoulos is Chairman Emeritus of the Board of Directors of The Dow Chemical Company, where he previously served in numerous senior management positions, including President, CEO (1995-2000; 2002-2004), Chairman of the Executive Committee (2000-2006), and as a member of the Board of Directors (1990-2006). Currently, Mr. Stavropoulos is Chairman of the Board of Directors of Univar Inc. (global distributor of commodity and specialty chemicals), a Director of Teradata Corporation (data warehousing and technology solutions), and Maersk Inc. (industrial conglomerate), and a member of the Advisory Board for Metalmark Capital LLC (private equity investment, 2005-present). Mr. Stavropoulos is an operating advisor to Clayton, Dubilier & Rice, LLC (private equity investment). In addition, Mr. Stavropoulos is a member of the University of Notre Dame Advisory Council for the College of Science, a Trustee of the Rollin L. Gerstacker Foundation, and a Director of the Naples Philharmonic Center for the Arts. Previously, Mr. Stavropoulos served as a Director of Chemical Financial Corporation (bank holding company, 1993-2012) and Tyco International, Ltd. (multinational manufacturing and services, 2007-2012).
David M. Thomas (1949)
Year of Election or Appointment: 2008
Trustee
Mr. Thomas also serves as Trustee of other Fidelity® funds. Mr. Thomas serves as Non-Executive Chairman of the Board of Directors of Fortune Brands Home and Security (home and security products, 2011-present), as a member of the Board of Directors (2004-present) and Presiding Director (2013-present) of Interpublic Group of Companies, Inc. (marketing communication), and as a member of the Board of Trustees of the University of Florida (2013-present). Previously, Mr. Thomas served as Executive Chairman (2005-2006) and Chairman and Chief Executive Officer (2000-2005) of IMS Health, Inc. (pharmaceutical and healthcare information solutions), and a Director of Fortune Brands, Inc. (consumer products, 2000-2011).
+ The information includes the Trustee's principal occupation during the last five years and other information relating to the experience, attributes, and skills relevant to the Trustee's qualifications to serve as a Trustee, which led to the conclusion that the Trustee should serve as a Trustee for the fund.
Advisory Board Members and Officers:
Correspondence intended for an officer or Peter S. Lynch may be sent to Fidelity Investments, 245 Summer Street, Boston, Massachusetts 02210. Officers appear below in alphabetical order.
Name, Year of Birth; Principal Occupation
Peter S. Lynch (1944)
Year of Election or Appointment: 2003
Member of the Advisory Board
Mr. Lynch also serves as Member of the Advisory Board of other Fidelity® funds. Mr. Lynch is Vice Chairman and a Director of FMR (investment adviser firm) and FMR Co., Inc. (investment adviser firm). In addition, Mr. Lynch serves as a Trustee of Boston College and as the Chairman of the Inner-City Scholarship Fund. Previously, Mr. Lynch served on the Special Olympics International Board of Directors (1997-2006).
Marc R. Bryant (1966)
Year of Election or Appointment: 2015
Secretary and Chief Legal Officer (CLO)
Mr. Bryant also serves as Secretary and CLO of other funds. Mr. Bryant serves as CLO, Secretary, and Senior Vice President of Fidelity Management & Research Company (investment adviser firm, 2015-present) and FMR Co., Inc. (investment adviser firm, 2015-present); Secretary of Fidelity SelectCo, LLC (investment adviser firm, 2015-present) and Fidelity Investments Money Management, Inc. (investment adviser firm, 2015-present); and CLO of Fidelity Management & Research (Hong Kong) Limited and FMR Investment Management (U.K.) Limited (investment adviser firms, 2015-present) and Fidelity Management & Research (Japan) Limited (investment adviser firm, 2016-present). He is Senior Vice President and Deputy General Counsel of FMR LLC (diversified financial services company). Previously, Mr. Bryant served as Secretary and CLO of Fidelity Rutland Square Trust II (2010-2014) and Assistant Secretary of Fidelity's Fixed Income and Asset Allocation Funds (2013-2015). Prior to joining Fidelity Investments, Mr. Bryant served as a Senior Vice President and the Head of Global Retail Legal for AllianceBernstein L.P. (2006-2010), and as the General Counsel for ProFund Advisors LLC (2001-2006).
Jeffrey S. Christian (1961)
Year of Election or Appointment: 2016
Assistant Treasurer
Mr. Christian also serves as Assistant Treasurer of other funds. Mr. Christian is an employee of Fidelity Investments (2003-present).
William C. Coffey (1969)
Year of Election or Appointment: 2009
Assistant Secretary
Mr. Coffey also serves as Assistant Secretary of other funds. He is Senior Vice President and Deputy General Counsel of FMR LLC (diversified financial services company, 2010-present), and is an employee of Fidelity Investments. Previously, Mr. Coffey served as Vice President and Associate General Counsel of FMR LLC (2005-2009).
Jonathan Davis (1968)
Year of Election or Appointment: 2010
Assistant Treasurer
Mr. Davis also serves as Assistant Treasurer of other funds, and is an employee of Fidelity Investments. Previously, Mr. Davis served as Vice President and Associate General Counsel of FMR LLC (diversified financial services company, 2003-2010).
Adrien E. Deberghes (1967)
Year of Election or Appointment: 2016
Assistant Treasurer
Mr. Deberghes also serves as an officer of other funds. He serves as Executive Vice President of Fidelity Investments Money Management, Inc. (FIMM) (investment adviser firm, 2016-present) and is an employee of Fidelity Investments (2008-present). Prior to joining Fidelity Investments, Mr. Deberghes was Senior Vice President of Mutual Fund Administration at State Street Corporation (2007-2008), Senior Director of Mutual Fund Administration at Investors Bank & Trust (2005-2007), and Director of Finance for Dunkin' Brands (2000-2005). Previously, Mr. Deberghes served in other fund officer roles.
Stephanie J. Dorsey (1969)
Year of Election or Appointment: 2010
Assistant Treasurer
Ms. Dorsey also serves as an officer of other funds. She is an employee of Fidelity Investments (2008-present) and has served in other fund officer roles. Prior to joining Fidelity Investments, Ms. Dorsey served as Treasurer (2004-2008) of the JPMorgan Mutual Funds and Vice President (2004-2008) of JPMorgan Chase Bank.
Howard J. Galligan III (1966)
Year of Election or Appointment: 2014
Chief Financial Officer
Mr. Galligan also serves as Chief Financial Officer of other funds. Mr. Galligan serves as President of Fidelity Pricing and Cash Management Services (FPCMS) (2014-present) and as a Director of Strategic Advisers, Inc. (investment adviser firm, 2008-present). Previously, Mr. Galligan served as Chief Administrative Officer of Asset Management (2011-2014) and Chief Operating Officer and Senior Vice President of Investment Support for Strategic Advisers, Inc. (2003-2011).
Scott C. Goebel (1968)
Year of Election or Appointment: 2015
Vice President
Mr. Goebel serves as Vice President of other funds and is an employee of Fidelity Investments (2001-present). Mr. Goebel serves as Senior Vice President of Fidelity Management & Research Company (FMR) (investment adviser firm, 2016-present). Previously, Mr. Goebel served as Secretary of Fidelity SelectCo, LLC (investment adviser firm, 2013-2015), Fidelity Investments Money Management, Inc. (FIMM) (investment adviser firm, 2010-2015), and Fidelity Research and Analysis Company (FRAC) (investment adviser firm, 2010-2015); General Counsel, Secretary, and Senior Vice President of FMR (investment adviser firm, 2008-2015) and FMR Co., Inc. (investment adviser firm, 2008-2015); Assistant Secretary of Fidelity Management & Research (Japan) Limited (investment adviser firm, 2008-2015) and Fidelity Management & Research (U.K.) Inc. (investment adviser firm, 2008-2015); Chief Legal Officer (CLO) of Fidelity Management & Research (Hong Kong) Limited (investment adviser firm, 2008-2015); Secretary and CLO of certain Fidelity® funds (2008-2015); Assistant Secretary of FIMM (2008-2010), FRAC (2008-2010), and certain funds (2007-2008); and as Vice President and Secretary of Fidelity Distributors Corporation (FDC) (2005-2007).
Thomas C. Hense (1964)
Year of Election or Appointment: 2008, 2010, or 2015
Vice President
Mr. Hense serves as Vice President of Fidelity Advisor® Multi-Asset Income Fund (2015) and other funds (High Income (2008), Small Cap (2008), and Value (2010) funds), and is an employee of Fidelity Investments (1993-present). Previously, Mr. Hense served as a portfolio manager for Fidelity's Institutional Money Management Group (Pyramis) (2003-2008).
Brian B. Hogan (1964)
Year of Election or Appointment: 2009
Vice President
Mr. Hogan also serves as Trustee or Vice President of other funds. Mr. Hogan serves as a Director of FMR Investment Management (U.K.) Limited (investment adviser firm, 2015-present) and Fidelity SelectCo, LLC (investment adviser firm, 2014-present) and President of the Equity Division of FMR (investment adviser firm, 2009-present). Previously, Mr. Hogan served as Senior Vice President, Equity Research of FMR (2006-2009) and as a portfolio manager. Mr. Brian B. Hogan is not related to Mr. Colm A. Hogan.
Colm A. Hogan (1973)
Year of Election or Appointment: 2016
Deputy Treasurer
Mr. Hogan also serves as an officer of other funds. Mr. Hogan is an employee of Fidelity Investments (2005-present). Mr. Colm A. Hogan is not related to Mr. Brian B. Hogan.
Chris Maher (1972)
Year of Election or Appointment: 2013
Assistant Treasurer
Mr. Maher serves as Assistant Treasurer of other funds. Mr. Maher is Vice President of Valuation Oversight and is an employee of Fidelity Investments. Previously, Mr. Maher served as Vice President of Asset Management Compliance (2013), Vice President of the Program Management Group of FMR (investment adviser firm, 2010-2013), and Vice President of Valuation Oversight (2008-2010).
John F. Papandrea (1972)
Year of Election or Appointment: 2016
Anti-Money Laundering (AML) Officer
Mr. Papandrea also serves as AML Officer of other funds. Mr. Papandrea is Vice President of FMR LLC (diversified financial services company, 2008-present) and is an employee of Fidelity Investments (2005-present).
Kenneth B. Robins (1969)
Year of Election or Appointment: 2016
Chief Compliance Officer
Mr. Robins also serves as an officer of other funds. Mr. Robins serves as Compliance Officer of Fidelity Management & Research Company and FMR Co., Inc. (investment adviser firms, 2016-present) and is an employee of Fidelity Investments (2004-present). Previously, Mr. Robins served as Executive Vice President of Fidelity Investments Money Management, Inc. (investment adviser firm, 2013-2016) and served in other fund officer roles.
Stacie M. Smith (1974)
Year of Election or Appointment: 2016
President and Treasurer
Ms. Smith also serves as an officer of other funds. She is an employee of Fidelity Investments (2009-present) and has served in other fund officer roles. Prior to joining Fidelity Investments, Ms. Smith served as Senior Audit Manager of Ernst & Young LLP (1996-2009). Previously, Ms. Smith served as Deputy Treasurer of certain Fidelity® funds (2013-2016).
Renee Stagnone (1975)
Year of Election or Appointment: 2016
Assistant Treasurer
Ms. Stagnone also serves as an officer of other funds. Ms. Stagnone is an employee of Fidelity Investments (1997-present). Previously, Ms. Stagnone served as Deputy Treasurer of certain Fidelity® funds (2013-2016).
Shareholder Expense Example
As a shareholder of the Fund, you incur two types of costs: (1) transaction costs, and (2) ongoing costs, including management fees and other Fund expenses. This Example is intended to help you understand your ongoing costs (in dollars) of investing in the Fund and to compare these costs with the ongoing costs of investing in other mutual funds.
The Example is based on an investment of $1,000 invested at the beginning of the period and held for the entire period (February 1, 2016 to July 31, 2016).
Actual Expenses
The first line of the accompanying table for each class of the Fund provides information about actual account values and actual expenses. You may use the information in this line, together with the amount you invested, to estimate the expenses that you paid over the period. Simply divide your account value by $1,000.00 (for example, an $8,600 account value divided by $1,000.00 = 8.6), then multiply the result by the number in the first line for a class of the Fund under the heading entitled "Expenses Paid During Period" to estimate the expenses you paid on your account during this period. In addition, the Fund, as a shareholder in the underlying Fidelity Central Funds, will indirectly bear its pro-rata share of the fees and expenses incurred by the underlying Fidelity Central Funds. These fees and expenses are not included in the Fund's annualized expense ratio used to calculate the expense estimate in the table below.
Hypothetical Example for Comparison Purposes
The second line of the accompanying table for each class of the Fund provides information about hypothetical account values and hypothetical expenses based on a Class' actual expense ratio and an assumed rate of return of 5% per year before expenses, which is not the Class' actual return. The hypothetical account values and expenses may not be used to estimate the actual ending account balance or expenses you paid for the period. You may use this information to compare the ongoing costs of investing in the Fund and other funds. To do so, compare this 5% hypothetical example with the 5% hypothetical examples that appear in the shareholder reports of the other funds. In addition, the Fund, as a shareholder in the underlying Fidelity Central Funds, will indirectly bear its pro-rata share of the fees and expenses incurred by the underlying Fidelity Central Funds. These fees and expenses are not included in the Fund's annualized expense ratio used to calculate the expense estimate in the table below.
Please note that the expenses shown in the table are meant to highlight your ongoing costs only and do not reflect any transaction costs. Therefore, the second line of the table is useful in comparing ongoing costs only, and will not help you determine the relative total costs of owning different funds.
| | Annualized Expense Ratio-A | Beginning
Account Value
February 1, 2016 | Ending
Account Value
July 31, 2016 | Expenses Paid
During Period-B
February 1, 2016
to July 31, 2016 |
| Series Small Cap Opportunities | .87% | | | |
| Actual | | $1,000.00 | $1,144.10 | $4.64 |
| Hypothetical-C | | $1,000.00 | $1,020.54 | $4.37 |
| Class F | .70% | | | |
| Actual | | $1,000.00 | $1,144.10 | $3.73 |
| Hypothetical-C | | $1,000.00 | $1,021.38 | $3.52 |
A Annualized expense ratio reflects expenses net of applicable fee waivers.
B Expenses are equal to each Class' annualized expense ratio, multiplied by the average account value over the period, multiplied by 182/366 (to reflect the one-half year period).
C 5% return per year before expenses
Distributions (Unaudited)
Series Small Cap Opportunities Fund and Class F designate 100% of the dividends distributed in September and December during the fiscal year as qualifying for the dividends–received deduction for corporate shareholders.
Series Small Cap Opportunities Fund and Class F designate 100% of the dividends distributed in September and December during the fiscal year as amounts which may be taken into account as a dividend for purposes of the maximum rate under section 1(h)(11) of the Internal Revenue Code.
The fund will notify shareholders in January 2017 of amounts for use in preparing 2016 income tax returns.
Board Approval of Investment Advisory Contracts and Management Fees
Fidelity Series Small Cap Opportunities Fund
Each year, the Board of Trustees, including the Independent Trustees (together, the Board), votes on the renewal of the management contract with Fidelity Management & Research Company (FMR) and the sub-advisory agreements (together, the Advisory Contracts) for the fund. The Board, assisted by the advice of fund counsel and Independent Trustees' counsel, requests and considers a broad range of information relevant to the renewal of the Advisory Contracts throughout the year.
The Board meets regularly and, at each of its meetings, covers an extensive agenda of topics and materials and considers factors that are relevant to its annual consideration of the renewal of the fund's Advisory Contracts, including the services and support provided to the fund and its shareholders. The Board has established various standing committees (Committees), each composed of and chaired by Independent Trustees with varying backgrounds, to which the Board has assigned specific subject matter responsibilities in order to enhance effective decision-making by the Board. The Board, acting directly and through its Committees, requests and receives information concerning the annual consideration of the renewal of the fund's Advisory Contracts. The Board also meets as needed to consider matters specifically related to the Board's annual consideration of the renewal of the Advisory Contracts. Members of the Board may also meet with trustees of other Fidelity funds through ad hoc joint committees to discuss certain matters relevant to all of the Fidelity funds.
At its July 2016 meeting, the Board unanimously determined to renew the fund's Advisory Contracts. In reaching its determination, the Board considered all factors it believed relevant, including (i) the nature, extent, and quality of the services to be provided to the fund and its shareholders (including the investment performance of the fund); (ii) the competitiveness of the fund's management fee and total expense ratio relative to peer funds; (iii) the total costs of the services to be provided by and the profits to be realized by Fidelity from its relationships with the fund; and (iv) the extent to which, if any, economies of scale exist and would be realized as the fund grows, and whether any economies of scale are appropriately shared with fund shareholders.
In considering whether to renew the Advisory Contracts for the fund, the Board reached a determination, with the assistance of fund counsel and Independent Trustees' counsel and through the exercise of its business judgment, that the renewal of the Advisory Contracts was in the best interests of the fund and its shareholders and that the compensation payable under the Advisory Contracts was fair and reasonable. The Board's decision to renew the Advisory Contracts was not based on any single factor, but rather was based on a comprehensive consideration of all the information provided to the Board at its meetings throughout the year. The Board, in reaching its determination to renew the Advisory Contracts, was aware that shareholders of the fund have a broad range of investment choices available to them, including a wide choice among funds offered by Fidelity's competitors, and that the fund's shareholders, who have the opportunity to review and weigh the disclosure provided by the fund in its prospectus and other public disclosures, have chosen to invest in this fund, which is part of the Fidelity family of funds.
Nature, Extent, and Quality of Services Provided. The Board considered Fidelity's staffing as it relates to the fund, including the backgrounds of investment personnel of Fidelity, and also considered the fund's investment objective, strategies, and related investment philosophy. The Independent Trustees also had discussions with senior management of Fidelity's investment operations and investment groups. The Board considered the structure of the investment personnel compensation program and whether this structure provides appropriate incentives to act in the best interests of the fund. Additionally, the Board considered the portfolio managers' investments, if any, in the funds that they manage.
Resources Dedicated to Investment Management and Support Services. The Board and the Fund Oversight and Research Committees reviewed the general qualifications and capabilities of Fidelity's investment staff, including its size, education, experience, and resources, as well as Fidelity's approach to recruiting, training, managing, and compensating investment personnel. The Board noted that Fidelity has continued to increase the resources devoted to non-U.S. offices, including expansion of Fidelity's global investment organization. The Board also noted that Fidelity's analysts have extensive resources, tools and capabilities that allow them to conduct sophisticated quantitative and fundamental analysis, as well as credit analysis of issuers, counterparties and guarantors. Further, the Board considered that Fidelity's investment professionals have sufficient access to global information and data so as to provide competitive investment results over time, and that those professionals also have access to sophisticated tools that permit them to assess portfolio construction and risk and performance attribution characteristics continuously, as well as to transmit new information and research conclusions rapidly around the world. Additionally, in its deliberations, the Board considered Fidelity's trading, risk management, compliance, and technology and operations capabilities and resources, which are integral parts of the investment management process.
Shareholder and Administrative Services. The Board considered (i) the nature, extent, quality, and cost of advisory, administrative, and shareholder services performed by FMR, the sub-advisers (together with FMR, the Investment Advisers), and their affiliates under the Advisory Contracts and under separate agreements covering transfer agency, pricing and bookkeeping, and securities lending services for the fund; (ii) the nature and extent of the supervision of third party service providers, principally custodians, subcustodians, and pricing vendors; and (iii) the resources devoted to, and the record of compliance with, the fund's compliance policies and procedures. The Board also reviewed the allocation of fund brokerage, including allocations to brokers affiliated with the Investment Advisers, the use of brokerage commissions to pay fund expenses, and the use of "soft" commission dollars to pay for research services.
The Board noted that the growth of fund assets over time across the complex allows Fidelity to reinvest in the development of services designed to enhance the value or convenience of the Fidelity funds as investment vehicles. These services include 24-hour access to account information and market information through telephone representatives and over the Internet, investor education materials and asset allocation tools, and the expanded availability of Fidelity Investor Centers.
In 2014, the Board formed an ad hoc Committee on Transfer Agency Fees to review the variety of transfer agency fee structures throughout the industry and Fidelity's competitive positioning with respect to industry participants.
Investment in a Large Fund Family. The Board considered the benefits to shareholders of investing in a Fidelity fund, including the benefits of investing in a fund that is part of a large family of funds offering a variety of investment disciplines and providing a large variety of mutual fund investor services. The Board noted that Fidelity had taken, or had made recommendations that resulted in the Fidelity funds taking, a number of actions over the previous year that benefited particular funds, including: (i) continuing to dedicate additional resources to investment research and to the support of the senior management team that oversees asset management; (ii) continuing efforts to enhance Fidelity's global research capabilities; (iii) launching new funds and making other enhancements to meet client needs; (iv) broadening eligibility requirements for certain lower-priced share classes of, and streamlining the fee structure for, certain existing equity index funds; (v) lowering expense caps for certain existing funds and classes to reduce expenses paid by shareholders; (vi) eliminating redemption fees for certain variable insurance product funds and classes; (vii) continuing to launch dedicated lower cost underlying funds to meet portfolio construction needs related to expanding underlying fund options for Fidelity funds of funds, specifically for the Freedom Fund product lines; (viii) launching a lower cost share class for use by the Freedom Index Fund product line; (ix) rationalizing product lines and gaining increased efficiencies through fund mergers and share class consolidations; (x) continuing to develop, acquire and implement systems and technology to improve services to the funds and shareholders, strengthen information security, and increase efficiency; (xi) implementing investment enhancements to further strengthen Fidelity's target date product line to increase investors' probability of success in achieving their goals; (xii) accelerating the conversion of all remaining Class B shares to Class A shares, which have a lower expense structure; and (xiii) implementing changes to Fidelity's money market fund product line in response to recent regulatory reforms.
Investment Performance. The Board considered whether the fund has operated in accordance with its investment objective, as well as its record of compliance with its investment restrictions and its performance history. The Board noted that there were portfolio management changes for the fund in October 2013, September 2014, and May 2016.
The Board took into account discussions with representatives of the Investment Advisers about fund investment performance that occur at Board meetings throughout the year. In this regard the Board noted that as part of regularly scheduled fund reviews and other reports to the Board on fund performance, the Board considers annualized return information for the fund, for different time periods, measured against a securities market index ("benchmark index") and a peer group of funds with similar objectives ("peer group"), if any. In its evaluation of fund investment performance, the Board gave particular attention to information indicating changes in performance of certain Fidelity funds for specific time periods and discussed with the Investment Advisers the reasons for any overperformance or underperformance.
In addition to reviewing absolute and relative fund performance, the Independent Trustees periodically consider the appropriateness of fund performance metrics in evaluating the results achieved. In general, the Independent Trustees believe that fund performance should be evaluated based on net performance (after fees and expenses) of both the highest performing and lowest performing fund share classes, where applicable, compared to appropriate benchmark indices, over appropriate time periods that may include full market cycles, and compared to peer groups, as applicable, over the same periods, taking into account relevant factors including the following: general market conditions; issuer-specific information; and fund cash flows and other factors.
The Independent Trustees recognize that shareholders evaluate performance on a net basis over their own holding periods, for which one-, three-, and five-year periods are often used as a proxy. For this reason, the performance information reviewed by the Board also included net cumulative calendar year total return information for the fund and an appropriate benchmark index and peer group for the most recent one-, three-, and five-year periods, as shown below. Returns are shown compared to the 25th percentile (top of box, 75% beaten) and 75th percentile (bottom of box, 25% beaten) of the peer universe.
Fidelity Series Small Cap Opportunities Fund
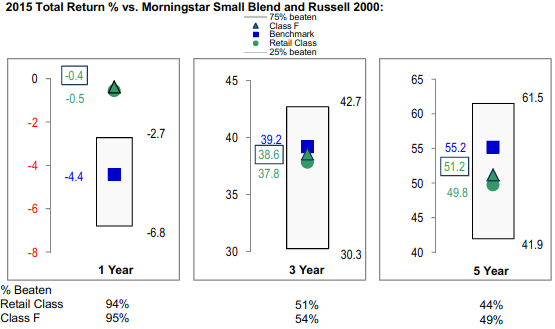
The Board also considered that the fund's management fee is subject to upward or downward adjustment depending upon whether, and to what extent, the fund's investment performance for the performance period exceeds, or is exceeded by, a securities index, thus leading to a performance adjustment for the same period. The Board noted that the performance adjustment provides FMR with a strong economic incentive to seek to achieve superior performance for the fund's shareholders and helps to more closely align the interests of FMR and the shareholders of the fund.
Based on its review, the Board concluded that the nature, extent, and quality of services provided to the fund under the Advisory Contracts should continue to benefit the shareholders of the fund.
Competitiveness of Management Fee and Total Expense Ratio. The Board considered the fund's management fee and total expense ratio compared to "mapped groups" of competitive funds and classes created for the purpose of facilitating the Trustees' competitive analysis of management fees and total expenses. Fidelity creates "mapped groups" by combining similar Broadridge investment objective categories that have comparable investment mandates. Combining Broadridge investment objective categories aids the Board's management fee and total expense ratio comparisons by broadening the competitive group used for comparison.
Management Fee. The Board considered two proprietary management fee comparisons for the 12-month periods shown in basis points (BP) in the chart below. The group of Broadridge funds used by the Board for management fee comparisons is referred to below as the "Total Mapped Group." The Total Mapped Group comparison focuses on a fund's standing in terms of gross management fees before expense reimbursements or caps, and without giving effect to the fund's performance adjustment, relative to the total universe of funds with comparable investment mandates, regardless of whether their management fee structures also are comparable. Funds with comparable investment mandates offer exposure to similar types of securities. Funds with comparable management fee structures have similar management fee contractual arrangements (
e.g., flat rate charged for advisory services, all-inclusive fee rate,
etc.). "TMG %" represents the percentage of funds in the Total Mapped Group that had management fees that were lower than the fund's. For example, a hypothetical TMG % of 20% would mean that 80% of the funds in the Total Mapped Group had higher, and 20% had lower, management fees than the fund. The fund's actual TMG %s and the number of funds in the Total Mapped Group are in the chart below. The "Asset-Size Peer Group" (ASPG) comparison focuses on a fund's standing relative to a subset of non-Fidelity funds within the Total Mapped Group that are similar in size and management fee structure without taking into account performance adjustments, if any. For example, if a fund is in the first quartile of the ASPG, the fund's management fee ranks in the least expensive or lowest 25% of funds in the ASPG. The ASPG represents at least 15% of the funds in the Total Mapped Group with comparable asset size and management fee structures, subject to a minimum of 50 funds (or all funds in the Total Mapped Group if fewer than 50). Additional information, such as the ASPG quartile in which the fund's management fee rate ranked and the impact of the fund's performance adjustment, is also included in the chart and considered by the Board.
Fidelity Series Small Cap Opportunities Fund
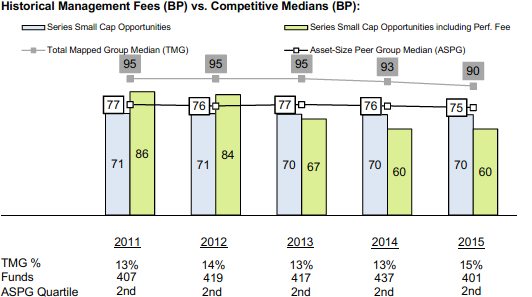
The Board noted that the fund's management fee rate ranked below the median of its Total Mapped Group and below the median of its ASPG for 2015. The Board also noted the effect of the fund's performance adjustment, if any, on the fund's management fee ranking. The Board noted that the comparisons for 2015 reflect a revised Total Mapped Group that no longer includes funds with micro-cap objectives and that FMR believes this Total Mapped Group is a more appropriate comparison because the fund does not have a micro-cap objective.
The Board noted that, in 2014, the ad hoc Committee on Group Fee was formed by it and the boards of other Fidelity funds to conduct an in-depth review of the "group fee" component of the management fee of funds with such management fee structures. The Committee's focus included the mechanics of the group fee, the competitive landscape of group fee structures, Fidelity funds with no group fee component and investment products not included in group fee assets. The Board also considered that, for funds subject to the group fee, FMR agreed to voluntarily waive fees over a specified period of time in amounts designed to account for assets converted from certain funds to certain collective investment trusts.
The Board also noted that, in 2013, the ad hoc Committee on Management Fees was formed to conduct an in-depth review of the management fee rates of Fidelity's active equity mutual funds. The Committee focused on the following areas: (i) standard fee structures; (ii) research consumption and trading evolution; (iii) management fee competitiveness/profitability by category; and (iv) factors that drive institutional pricing.
Based on its review, the Board concluded that the fund's management fee is fair and reasonable in light of the services that the fund receives and the other factors considered.
Total Expense Ratio. In its review of each class's total expense ratio, the Board considered the fund's management fee rate as well as other fund or class expenses, as applicable, such as transfer agent fees, pricing and bookkeeping fees, and custodial, legal, and audit fees. The Board noted the impact of the fund's performance adjustment. The Board also noted that Fidelity may agree to waive fees and expenses from time to time, and the extent to which, if any, it has done so for the fund. As part of its review, the Board also considered the current and historical total expense ratios of each class of the fund compared to competitive fund median expenses. Each class of the fund is compared to those funds and classes in the Total Mapped Group (used by the Board for management fee comparisons) that have a similar sales load structure.
The Board noted that the total expense ratio of each class ranked below the competitive median for 2015.
Fees Charged to Other Fidelity Clients. The Board also considered Fidelity fee structures and other information with respect to clients of Fidelity, such as other funds advised or subadvised by Fidelity, pension plan clients, and other institutional clients with similar mandates. The Board noted the findings of the 2013 ad hoc joint committee (created with the board of other Fidelity funds), which reviewed and compared Fidelity's institutional investment advisory business with its business of providing services to the Fidelity funds, including the differences in services provided, fees charged, and costs incurred, as well as competition in their respective marketplaces.
Based on its review of total expense ratios and fees charged to other Fidelity clients, the Board concluded that the total expense ratio of each class of the fund was reasonable in light of the services that the fund and its shareholders receive and the other factors considered.
Costs of the Services and Profitability. The Board considered the revenues earned and the expenses incurred by Fidelity in conducting the business of developing, marketing, distributing, managing, administering and servicing the fund and servicing the fund's shareholders. The Board also considered the level of Fidelity's profits in respect of all the Fidelity funds.
On an annual basis, Fidelity presents to the Board information about the profitability of its relationship with the fund. Fidelity calculates profitability information for each fund, as well as aggregate profitability information for groups of Fidelity funds and all Fidelity funds, using a series of detailed revenue and cost allocation methodologies which originate with the books and records of Fidelity on which Fidelity's audited financial statements are based. The Audit Committee of the Board reviews any significant changes from the prior year's methodologies.
PricewaterhouseCoopers LLP (PwC), independent registered public accounting firm and auditor to Fidelity and certain Fidelity funds, has been engaged annually by the Board as part of the Board's assessment of Fidelity's profitability analysis. PwC's engagement includes the review and assessment of the methodologies used by Fidelity in determining the revenues and expenses attributable to Fidelity's mutual fund business, and completion of agreed-upon procedures in respect of the mathematical accuracy of the fund profitability information and its conformity to established allocation methodologies. After considering PwC's reports issued under the engagement and information provided by Fidelity, the Board concluded that while other allocation methods may also be reasonable, Fidelity's profitability methodologies are reasonable in all material respects.
The Board also reviewed Fidelity's non-fund businesses and fall-out benefits related to the mutual fund business as well as cases where Fidelity's affiliates may benefit from or be related to the fund's business.
The Board considered the costs of the services provided by and the profits realized by Fidelity in connection with the operation of the fund and was satisfied that the profitability was not excessive.
Economies of Scale. The Board considered whether there have been economies of scale in respect of the management of the Fidelity funds, whether the Fidelity funds (including the fund) have appropriately benefited from any such economies of scale, and whether there is potential for realization of any further economies of scale. The Board considered the extent to which the fund will benefit from economies of scale as assets grow through increased services to the fund, through waivers or reimbursements, or through fee or expense ratio reductions. The Board also noted that in 2013, it and the boards of other Fidelity funds created an ad hoc committee (the Economies of Scale Committee) to analyze whether Fidelity attains economies of scale in respect of the management and servicing of the Fidelity funds, whether the Fidelity funds have appropriately benefited from such economies of scale, and whether there is potential for realization of any further economies of scale.
The Board recognized that the fund's management contract incorporates a "group fee" structure, which provides for lower group fee rates as total group assets increase, and for higher group fee rates as total group assets decrease (with "group assets" defined to include fund assets under FMR's management plus the assets of sector funds previously under FMR's management). FMR calculates the group fee rates based on a tiered asset "breakpoint" schedule that varies based on asset class. The Board considered that the group fee is designed to deliver the benefits of economies of scale to fund shareholders when total Fidelity fund assets increase, even if assets of any particular fund are unchanged or have declined, because some portion of Fidelity's costs are attributable to services provided to all Fidelity funds, and all funds benefit if those costs can be allocated among more assets. The Board also considered that although the fund is offered only to other Fidelity funds, it continues to incur investment management expenses. The Board further noted that the fund may continue to realize benefits from the group fee structure, even though assets may not be expected to grow significantly at the fund level. The Board concluded that, given the group fee structure, fund shareholders will benefit from lower management fees as group assets increase at the fund complex level, regardless of whether Fidelity achieves any such economies of scale.
The Board concluded, taking into account the analysis of the Economies of Scale Committee, that economies of scale, if any, are being appropriately shared between fund shareholders and Fidelity.
Approval of New Advisory Contracts. The Board also voted to approve a new management contract and new sub-advisory agreements for the fund (New Advisory Contracts) that will take effect if the shareholders of certain other Fidelity funds that invest in the fund (referred to herein as Freedom Funds) approve new management contracts for the Freedom Funds. Under the New Advisory Contracts the fund will no longer pay a management fee to FMR. The new sub-advisory agreements provide that FMR or its affiliates will pay the fees based on a portion of the management fees received by an affiliate of FMR under its management contracts with the Freedom Funds. The Board noted the New Advisory Contracts are expected to result in an overall decrease in the fees and expenses payable by the fund. The Board considered that the approval of the New Advisory Contracts will not result in any changes to (i) the investment process or strategies employed in the management of the fund's assets; (ii) the nature, extent and quality of services provided to the fund; or (iii) the day-to-day management of the fund and the personnel primarily responsible for such management. The Board considered that the new management contract does not have a performance fee adjustment, which would have the effect of eliminating the negative performance fee for the fund, but noted that FMR will no longer charge a management fee for the fund. The Board also considered that the New Advisory Contracts provide that FMR or an affiliate undertakes to pay all operating expenses of the fund, except transfer agent fees, 12b-1 fees, Independent Trustee expenses, custodian fees and expenses, expenses related to proxy solicitations, interest, taxes, brokerage expenses, and extraordinary expenses (such as litigation expenses).
Additional Information Requested by the Board. In order to develop fully the factual basis for consideration of the Fidelity funds' Advisory Contracts, the Board requested and received additional information on certain topics, including: (i) fund performance trends and Fidelity's long-term strategies for certain funds; (ii) the various share classes employed by Fidelity and the attributes of each class, together with similar information on the distribution and servicing payments made by Fidelity or the funds to third-party participants in the distribution channels; (iii) fund profitability, and fund performance in relation to fund profitability; (iv) the methodology with respect to evaluating competitive fund data and peer group classifications and fee comparisons; (v) annual fund profitability margins; (vi) the realization of fall-out benefits in and attribution of fall-out benefits to certain Fidelity business units; (vii) the appropriateness of certain funds' benchmarks; (viii) the rationalization for certain share classes and expenses; (ix) sub-advisory fee rates for comparable investment mandates; (x) product strategy for certain underperforming funds; and (xi) Fidelity's resources and strategy for cybersecurity.
Based on its evaluation of all of the conclusions noted above, and after considering all factors it believed relevant, the Board concluded that the advisory fee structures are fair and reasonable, and that the fund's Advisory Contracts should be renewed.
Corporate Headquarters
245 Summer St.
Boston, MA 02210
www.fidelity.com
SMO-ANN-0916
1.839807.109
Fidelity® Series Blue Chip Growth Fund Fidelity® Series Blue Chip Growth Fund
Class F
Annual Report July 31, 2016 |
|
Contents
To view a fund's proxy voting guidelines and proxy voting record for the 12-month period ended June 30, visit http://www.fidelity.com/proxyvotingresults or visit the Securities and Exchange Commission's (SEC) web site at http://www.sec.gov.
You may also call 1-800-544-8544, or for Class F, call 1-800-835-5092, to request a free copy of the proxy voting guidelines.
Standard & Poor's, S&P and S&P 500 are registered service marks of The McGraw-Hill Companies, Inc. and have been licensed for use by Fidelity Distributors Corporation.
Other third-party marks appearing herein are the property of their respective owners.
All other marks appearing herein are registered or unregistered trademarks or service marks of FMR LLC or an affiliated company. © 2016 FMR LLC. All rights reserved.
This report and the financial statements contained herein are submitted for the general information of the shareholders of the Fund. This report is not authorized for distribution to prospective investors in the Fund unless preceded or accompanied by an effective prospectus.
A fund files its complete schedule of portfolio holdings with the SEC for the first and third quarters of each fiscal year on Form N-Q. Forms N-Q are available on the SEC’s web site at http://www.sec.gov. A fund's Forms N-Q may be reviewed and copied at the SEC’s Public Reference Room in Washington, DC. Information regarding the operation of the SEC's Public Reference Room may be obtained by calling 1-800-SEC-0330.
For a complete list of a fund's portfolio holdings, view the most recent holdings listing, semiannual report, or annual report on Fidelity's web site at http://www.fidelity.com, http://www.institutional.fidelity.com, or http://www.401k.com, as applicable.
NOT FDIC INSURED •MAY LOSE VALUE •NO BANK GUARANTEE
Neither the Fund nor Fidelity Distributors Corporation is a bank.
Performance: The Bottom Line
Average annual total return reflects the change in the value of an investment, assuming reinvestment of distributions from dividend income and capital gains (the profits earned upon the sale of securities that have grown in value, if any) and assuming a constant rate of performance each year. The hypothetical investment and the average annual total returns do not reflect the deduction of taxes that a shareholder would pay on fund distributions or the redemption of fund shares. During periods of reimbursement by Fidelity, a fund’s total return will be greater than it would be had the reimbursement not occurred. How a fund did yesterday is no guarantee of how it will do tomorrow.
Average Annual Total Returns
| For the periods ended July 31, 2016 | Past 1 year | Life of fundA |
| Fidelity® Series Blue Chip Growth Fund | (2.63)% | 10.56% |
| Class F | (2.52)% | 10.74% |
A From November 7, 2013
$10,000 Over Life of Fund
Let's say hypothetically that $10,000 was invested in Fidelity® Series Blue Chip Growth Fund, a class of the fund, on November 7, 2013, when the fund started.
The chart shows how the value of your investment would have changed, and also shows how the Russell 1000® Growth Index performed over the same period.
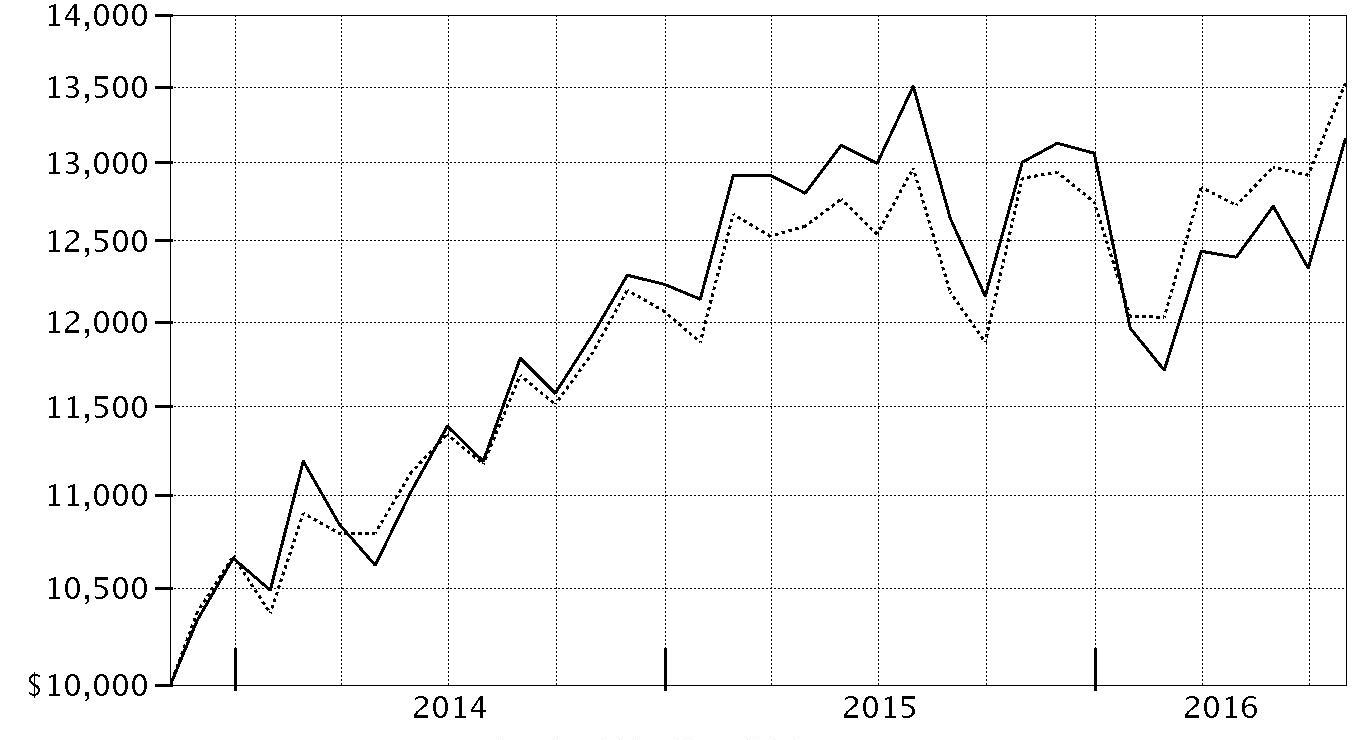
| Period Ending Values |
| $13,155 | Fidelity® Series Blue Chip Growth Fund |
| $13,530 | Russell 1000® Growth Index |
Management's Discussion of Fund Performance
Market Recap: U.S. equities gained modestly for the year ending July 31, 2016, overcoming persistent concern about global economic growth, uncertainty regarding U.S. monetary policy and the U.K.’s late-June vote to leave the European Union, dubbed Brexit. The S&P 500
® index rose 5.61%, with larger-cap, value-oriented stocks and defensive sectors shining brightest. Volatility peaked in the early weeks of 2016, as continued oil-price weakness and U.S.-dollar strength pushed the S&P 500
® to its worst January since 2009. Markets then rose beginning in February amid U.S. job gains, a broad rally in energy and materials markets, global economic stimulus and perceived softening of monetary policy by the U.S. Federal Reserve. The June 23 Brexit vote surprised markets and resulted in a sharp two-day decline for stocks, followed by a rebound as investor sentiment shifted and remained positive through July 31. For the year, dividend-rich telecom services (+26%), utilities (+23%) and consumer staples (+12%) led the way amid strong investor demand for yield. Industrials (+10%) and information technology (+10%) also outperformed, as did materials (+8%), despite a weak commodities environment overall. Conversely, a strong run for real estate stocks couldn’t keep financials (-4%) from losing ground, as low interest rates continued to squeeze bank profits.
Comments from Portfolio Manager Sonu Kalra: For the year, the fund’s share classes returned about -3%, well behind the 4.35% result of the benchmark Russell 1000
® Growth Index. Investors tended to favor companies with perceived lower volatility and high dividends, while growth stocks, such as those held in the fund, largely fell out of favor. Versus the benchmark, weak stock selection overall was the primary detractor, especially in pharmaceuticals, biotechnology & life sciences. A non-benchmark stake in Canada-based Valeant Pharmaceuticals International was a notable individual detractor. The stock plunged in October on allegations of accounting irregularities and a U.S. investigation into the firm's drug pricing. Shares fell further in mid-March after Valeant said it may default on its debt and would not meet earnings targets. An out-of-index stake in Restoration Hardware, an upscale home furnishing retailer, was the largest individual detractor. The firm struggled due to a slowdown in the high-end furnishing space. On the plus side, the fund’s stake in Amazon.com, a large fund holding within consumer discretionary, was the biggest individual contributor. Shares rose about 42%, with Amazon reporting four straight quarters of profit. Early on, results were backed by strong revenue growth and tight cost controls that benefited gross profit margins.
The views expressed above reflect those of the portfolio manager(s) only through the end of the period as stated on the cover of this report and do not necessarily represent the views of Fidelity or any other person in the Fidelity organization. Any such views are subject to change at any time based upon market or other conditions and Fidelity disclaims any responsibility to update such views. These views may not be relied on as investment advice and, because investment decisions for a Fidelity fund are based on numerous factors, may not be relied on as an indication of trading intent on behalf of any Fidelity fund.
Investment Summary (Unaudited)
Top Ten Stocks as of July 31, 2016
| | % of fund's net assets | % of fund's net assets 6 months ago |
| Alphabet, Inc. Class A | 7.3 | 6.9 |
| Amazon.com, Inc. | 5.6 | 4.7 |
| Apple, Inc. | 5.1 | 3.5 |
| Facebook, Inc. Class A | 4.0 | 4.0 |
| Tesla Motors, Inc. | 2.3 | 1.1 |
| Salesforce.com, Inc. | 2.2 | 1.7 |
| Uber Technologies, Inc. Series D, 8.00% | 2.0 | 2.1 |
| Broadcom Ltd. | 2.0 | 1.5 |
| Home Depot, Inc. | 2.0 | 1.8 |
| Visa, Inc. Class A | 1.9 | 1.8 |
| | 34.4 | |
Top Five Market Sectors as of July 31, 2016
| | % of fund's net assets | % of fund's net assets 6 months ago |
| Information Technology | 38.6 | 37.0 |
| Consumer Discretionary | 26.0 | 25.5 |
| Health Care | 14.4 | 16.0 |
| Consumer Staples | 8.0 | 10.2 |
| Industrials | 4.6 | 4.8 |
Asset Allocation (% of fund's net assets)
| As of July 31, 2016* |
| | Stocks | 96.1% |
| | Convertible Securities | 3.4% |
| | Short-Term Investments and Net Other Assets (Liabilities) | 0.5% |

* Foreign investments - 12.0%
| As of January 31, 2016* |
| | Stocks | 94.0% |
| | Convertible Securities | 3.4% |
| | Short-Term Investments and Net Other Assets (Liabilities) | 2.6% |

* Foreign investments - 12.4%
Investments July 31, 2016
Showing Percentage of Net Assets
| Common Stocks - 96.0% | | | |
| | | Shares | Value |
| CONSUMER DISCRETIONARY - 25.8% | | | |
| Auto Components - 0.0% | | | |
| Delphi Automotive PLC | | 18,200 | $1,234,324 |
| Automobiles - 2.3% | | | |
| BYD Co. Ltd. (H Shares) (a) | | 339,500 | 2,152,944 |
| General Motors Co. | | 58,700 | 1,851,398 |
| Tesla Motors, Inc. (a) | | 601,437 | 141,211,393 |
| | | | 145,215,735 |
| Diversified Consumer Services - 0.2% | | | |
| New Oriental Education & Technology Group, Inc. sponsored ADR | | 161,200 | 7,102,472 |
| ServiceMaster Global Holdings, Inc. (a) | | 76,500 | 2,893,995 |
| Weight Watchers International, Inc. (a) | | 40,299 | 480,767 |
| | | | 10,477,234 |
| Hotels, Restaurants & Leisure - 4.6% | | | |
| Buffalo Wild Wings, Inc. (a) | | 160,514 | 26,959,931 |
| Chipotle Mexican Grill, Inc. (a) | | 204,800 | 86,833,152 |
| Darden Restaurants, Inc. | | 28,700 | 1,766,772 |
| Dave & Buster's Entertainment, Inc. (a) | | 543,900 | 24,203,550 |
| Domino's Pizza, Inc. | | 70,200 | 10,340,460 |
| Hilton Worldwide Holdings, Inc. | | 263,600 | 6,112,884 |
| Las Vegas Sands Corp. | | 77,900 | 3,945,635 |
| McDonald's Corp. | | 251,300 | 29,565,445 |
| MGM Mirage, Inc. (a) | | 404,600 | 9,702,308 |
| Panera Bread Co. Class A (a) | | 41,900 | 9,189,508 |
| Starbucks Corp. | | 1,250,320 | 72,581,076 |
| Texas Roadhouse, Inc. Class A | | 12,600 | 594,972 |
| Wingstop, Inc. (b) | | 47,200 | 1,227,200 |
| | | | 283,022,893 |
| Household Durables - 1.1% | | | |
| Mohawk Industries, Inc. (a) | | 3,500 | 731,290 |
| Newell Brands, Inc. | | 403,235 | 21,153,708 |
| Nien Made Enterprise Co. Ltd. | | 139,000 | 1,454,697 |
| Sony Corp. | | 487,000 | 15,986,706 |
| Sony Corp. sponsored ADR | | 284,300 | 9,498,463 |
| Whirlpool Corp. | | 106,400 | 20,467,104 |
| | | | 69,291,968 |
| Internet & Catalog Retail - 7.7% | | | |
| Amazon.com, Inc. (a) | | 457,380 | 347,064,518 |
| Ctrip.com International Ltd. ADR (a) | | 195,986 | 8,558,709 |
| Expedia, Inc. | | 290,977 | 33,942,467 |
| Groupon, Inc. Class A (a) | | 1,196,800 | 5,768,576 |
| Netflix, Inc. (a) | | 293,646 | 26,795,198 |
| Priceline Group, Inc. (a) | | 37,300 | 50,385,213 |
| The Honest Co., Inc. (a)(c) | | 71,609 | 2,757,541 |
| | | | 475,272,222 |
| Leisure Products - 0.3% | | | |
| Mattel, Inc. | | 374,600 | 12,504,148 |
| Spin Master Corp. (a) | | 148,900 | 3,056,347 |
| | | | 15,560,495 |
| Media - 0.8% | | | |
| Altice NV Class A (a) | | 754,615 | 11,199,581 |
| Charter Communications, Inc. Class A (a) | | 80,003 | 18,790,305 |
| Lions Gate Entertainment Corp. (b) | | 222,000 | 4,437,780 |
| Naspers Ltd. Class N | | 54,100 | 8,489,552 |
| The Walt Disney Co. | | 96,817 | 9,289,591 |
| | | | 52,206,809 |
| Multiline Retail - 1.2% | | | |
| B&M European Value Retail S.A. | | 1,344,545 | 4,578,494 |
| Dollar Tree, Inc. (a) | | 239,800 | 23,090,342 |
| JC Penney Corp., Inc. (a) | | 71,100 | 686,826 |
| Kohl's Corp. | | 117,300 | 4,878,507 |
| Macy's, Inc. | | 189,800 | 6,800,534 |
| Ollie's Bargain Outlet Holdings, Inc. (a) | | 27,800 | 726,692 |
| Target Corp. | | 413,141 | 31,121,912 |
| | | | 71,883,307 |
| Specialty Retail - 4.0% | | | |
| Abercrombie & Fitch Co. Class A | | 91,000 | 1,884,610 |
| Advance Auto Parts, Inc. | | 15,100 | 2,564,886 |
| AutoZone, Inc. (a) | | 7,100 | 5,779,187 |
| Dick's Sporting Goods, Inc. | | 48,500 | 2,487,565 |
| Home Depot, Inc. | | 875,300 | 121,001,472 |
| Inditex SA | | 150,637 | 5,209,591 |
| L Brands, Inc. | | 523,114 | 38,658,125 |
| Lowe's Companies, Inc. | | 117,000 | 9,626,760 |
| O'Reilly Automotive, Inc. (a) | | 9,700 | 2,819,111 |
| Restoration Hardware Holdings, Inc. (a)(b) | | 636,518 | 19,611,120 |
| Ross Stores, Inc. | | 110,676 | 6,843,097 |
| The Children's Place Retail Stores, Inc. | | 30,200 | 2,524,116 |
| TJX Companies, Inc. | | 321,800 | 26,297,496 |
| Ulta Salon, Cosmetics & Fragrance, Inc. (a) | | 10,300 | 2,690,463 |
| | | | 247,997,599 |
| Textiles, Apparel & Luxury Goods - 3.6% | | | |
| adidas AG | | 419,100 | 68,846,324 |
| Coach, Inc. | | 60,500 | 2,608,155 |
| G-III Apparel Group Ltd. (a) | | 217,880 | 8,721,736 |
| Kate Spade & Co. (a) | | 220,400 | 4,780,476 |
| lululemon athletica, Inc. (a) | | 497,000 | 38,592,050 |
| NIKE, Inc. Class B | | 560,200 | 31,091,100 |
| PVH Corp. | | 191,900 | 19,393,414 |
| Ralph Lauren Corp. | | 82,000 | 8,043,380 |
| Regina Miracle International Holdings Ltd. | | 1,958,693 | 2,150,967 |
| Skechers U.S.A., Inc. Class A (sub. vtg.) (a) | | 820,800 | 19,715,616 |
| Tory Burch LLC unit (c)(d) | | 106,817 | 6,645,086 |
| Under Armour, Inc. Class C (non-vtg.) | | 326,877 | 11,669,509 |
| | | | 222,257,813 |
|
| TOTAL CONSUMER DISCRETIONARY | | | 1,594,420,399 |
|
| CONSUMER STAPLES - 7.8% | | | |
| Beverages - 2.5% | | | |
| Anheuser-Busch InBev SA NV ADR | | 106,500 | 13,785,360 |
| Constellation Brands, Inc. Class A (sub. vtg.) | | 120,400 | 19,821,452 |
| Molson Coors Brewing Co. Class B | | 332,700 | 33,988,632 |
| Monster Beverage Corp. (a) | | 328,681 | 52,796,029 |
| The Coca-Cola Co. | | 737,881 | 32,193,748 |
| | | | 152,585,221 |
| Food & Staples Retailing - 1.3% | | | |
| Costco Wholesale Corp. | | 375,600 | 62,807,832 |
| CVS Health Corp. | | 143,000 | 13,258,960 |
| Sprouts Farmers Market LLC (a) | | 111,200 | 2,572,056 |
| United Natural Foods, Inc. (a) | | 37,000 | 1,849,260 |
| Whole Foods Market, Inc. | | 45,160 | 1,376,477 |
| | | | 81,864,585 |
| Food Products - 1.3% | | | |
| Associated British Foods PLC | | 286,300 | 10,196,300 |
| Bunge Ltd. | | 63,000 | 4,147,920 |
| Edita Food Industries SAE GDR (e) | | 89,200 | 544,120 |
| Mead Johnson Nutrition Co. Class A | | 161,700 | 14,423,640 |
| Mondelez International, Inc. | | 664,100 | 29,207,118 |
| The Hain Celestial Group, Inc. (a) | | 337,600 | 17,821,904 |
| The J.M. Smucker Co. | | 4,300 | 662,888 |
| TreeHouse Foods, Inc. (a) | | 30,900 | 3,188,571 |
| | | | 80,192,461 |
| Household Products - 0.2% | | | |
| Spectrum Brands Holdings, Inc. | | 95,900 | 12,349,043 |
| Personal Products - 1.9% | | | |
| Coty, Inc. Class A | | 74,400 | 1,999,128 |
| Estee Lauder Companies, Inc. Class A | | 299,800 | 27,851,420 |
| Herbalife Ltd. (a) | | 687,638 | 46,766,260 |
| Nu Skin Enterprises, Inc. Class A (b) | | 707,600 | 37,785,840 |
| | | | 114,402,648 |
| Tobacco - 0.6% | | | |
| Imperial Tobacco Group PLC | | 57,971 | 3,056,210 |
| Reynolds American, Inc. | | 732,900 | 36,688,974 |
| | | | 39,745,184 |
|
| TOTAL CONSUMER STAPLES | | | 481,139,142 |
|
| ENERGY - 2.2% | | | |
| Energy Equipment & Services - 0.2% | | | |
| Baker Hughes, Inc. | | 159,900 | 7,648,017 |
| National Oilwell Varco, Inc. | | 72,200 | 2,335,670 |
| | | | 9,983,687 |
| Oil, Gas & Consumable Fuels - 2.0% | | | |
| Anadarko Petroleum Corp. | | 408,578 | 22,279,758 |
| Apache Corp. | | 78,400 | 4,116,000 |
| Cabot Oil & Gas Corp. | | 52,100 | 1,285,307 |
| Carrizo Oil & Gas, Inc. (a) | | 88,500 | 2,902,800 |
| Cimarex Energy Co. | | 104,730 | 12,569,695 |
| Continental Resources, Inc. (a) | | 361,564 | 15,926,894 |
| Devon Energy Corp. | | 264,500 | 10,125,060 |
| EOG Resources, Inc. | | 168,126 | 13,735,894 |
| Noble Energy, Inc. | | 1,900 | 67,868 |
| Oasis Petroleum, Inc. (a) | | 208,100 | 1,581,560 |
| Pioneer Natural Resources Co. | | 103,900 | 16,891,023 |
| SM Energy Co. | | 293,000 | 7,949,090 |
| Southwestern Energy Co. (a) | | 48,400 | 705,672 |
| Suncor Energy, Inc. | | 85,700 | 2,306,512 |
| Targa Resources Corp. | | 62,500 | 2,328,750 |
| Whiting Petroleum Corp. (a) | | 774,700 | 5,709,539 |
| Williams Partners LP | | 182,600 | 6,818,284 |
| | | | 127,299,706 |
|
| TOTAL ENERGY | | | 137,283,393 |
|
| FINANCIALS - 4.1% | | | |
| Banks - 1.3% | | | |
| Bank of America Corp. | | 1,015,400 | 14,713,146 |
| Citigroup, Inc. | | 345,789 | 15,149,016 |
| HDFC Bank Ltd. sponsored ADR | | 229,300 | 15,883,611 |
| JPMorgan Chase & Co. | | 504,272 | 32,258,280 |
| SunTrust Banks, Inc. | | 33,400 | 1,412,486 |
| | | | 79,416,539 |
| Capital Markets - 0.5% | | | |
| BlackRock, Inc. Class A | | 42,500 | 15,565,625 |
| Charles Schwab Corp. | | 218,500 | 6,209,770 |
| Fairfax India Holdings Corp. (a) | | 427,900 | 4,304,674 |
| Goldman Sachs Group, Inc. | | 29,800 | 4,732,538 |
| | | | 30,812,607 |
| Diversified Financial Services - 2.2% | | | |
| Bats Global Markets, Inc. | | 179,700 | 4,560,786 |
| Broadcom Ltd. | | 759,600 | 123,040,008 |
| MSCI, Inc. Class A | | 47,600 | 4,095,504 |
| WME Entertainment Parent, LLC Class A unit (c)(d) | | 1,150,016 | 2,362,147 |
| | | | 134,058,445 |
| Real Estate Investment Trusts - 0.1% | | | |
| Extra Space Storage, Inc. | | 87,100 | 7,492,342 |
|
| TOTAL FINANCIALS | | | 251,779,933 |
|
| HEALTH CARE - 14.2% | | | |
| Biotechnology - 9.3% | | | |
| ACADIA Pharmaceuticals, Inc. (a) | | 35,900 | 1,329,736 |
| Acceleron Pharma, Inc. (a) | | 51,300 | 1,740,096 |
| Agios Pharmaceuticals, Inc. (a) | | 97,900 | 4,428,017 |
| Aimmune Therapeutics, Inc. (a) | | 126,100 | 1,511,939 |
| Alexion Pharmaceuticals, Inc. (a) | | 337,204 | 43,364,434 |
| Alkermes PLC (a) | | 393,500 | 19,635,650 |
| Alnylam Pharmaceuticals, Inc. (a) | | 339,100 | 23,085,928 |
| Amgen, Inc. | | 587,498 | 101,067,281 |
| ARIAD Pharmaceuticals, Inc. (a) | | 138,100 | 1,313,331 |
| Ascendis Pharma A/S sponsored ADR (a) | | 116,100 | 1,671,840 |
| BeiGene Ltd. sponsored ADR | | 10,600 | 278,144 |
| Biogen, Inc. (a) | | 238,300 | 69,090,319 |
| BioMarin Pharmaceutical, Inc. (a) | | 92,300 | 9,176,466 |
| bluebird bio, Inc. (a) | | 111,200 | 6,358,416 |
| Catabasis Pharmaceuticals, Inc. (a) | | 168,000 | 645,120 |
| Celgene Corp. (a) | | 752,600 | 84,434,194 |
| Cellectis SA sponsored ADR (a) | | 25,300 | 667,161 |
| Chiasma, Inc. (a)(b) | | 107,500 | 284,875 |
| Chiasma, Inc. (e) | | 95,140 | 252,121 |
| Chiasma, Inc. warrants | | 23,784 | 17,176 |
| Chimerix, Inc. (a) | | 31,200 | 124,488 |
| Coherus BioSciences, Inc. (a) | | 174,000 | 4,417,860 |
| Corvus Pharmaceuticals, Inc. | | 44,800 | 589,120 |
| CytomX Therapeutics, Inc. | | 53,200 | 535,192 |
| CytomX Therapeutics, Inc. (e) | | 137,854 | 1,386,811 |
| DBV Technologies SA sponsored ADR (a) | | 38,700 | 1,339,020 |
| Editas Medicine, Inc. | | 101,500 | 2,610,580 |
| Editas Medicine, Inc. | | 96,289 | 2,451,788 |
| Exelixis, Inc. (a) | | 1,012,000 | 9,290,160 |
| FibroGen, Inc. (a) | | 93,400 | 1,786,742 |
| GenSight Biologics SA | | 219,991 | 1,967,600 |
| Gilead Sciences, Inc. | | 115,335 | 9,165,672 |
| Global Blood Therapeutics, Inc. (a) | | 164,000 | 2,932,320 |
| Heron Therapeutics, Inc. (a) | | 35,600 | 591,672 |
| Intellia Therapeutics, Inc. | | 60,400 | 1,142,768 |
| Intellia Therapeutics, Inc. | | 128,357 | 2,185,663 |
| Intercept Pharmaceuticals, Inc. (a) | | 57,100 | 9,880,013 |
| Intrexon Corp. (a)(b) | | 138,900 | 3,518,337 |
| Ionis Pharmaceuticals, Inc. (a) | | 62,200 | 1,815,618 |
| Ironwood Pharmaceuticals, Inc. Class A (a) | | 524,816 | 7,415,650 |
| Merrimack Pharmaceuticals, Inc. (a) | | 813,200 | 4,716,560 |
| Mirati Therapeutics, Inc. (a) | | 28,200 | 130,848 |
| Momenta Pharmaceuticals, Inc. (a) | | 35,500 | 399,730 |
| Neurocrine Biosciences, Inc. (a) | | 209,200 | 10,508,116 |
| Novavax, Inc. (a) | | 146,100 | 1,069,452 |
| Portola Pharmaceuticals, Inc. (a) | | 88,900 | 2,307,844 |
| Prothena Corp. PLC (a) | | 38,700 | 2,130,435 |
| Radius Health, Inc. (a) | | 30,500 | 1,437,160 |
| Regeneron Pharmaceuticals, Inc. (a) | | 158,580 | 67,415,530 |
| Sage Therapeutics, Inc. (a) | | 37,800 | 1,695,708 |
| Seattle Genetics, Inc. (a) | | 127,800 | 6,142,068 |
| Seres Therapeutics, Inc. (a) | | 17,900 | 195,826 |
| Spark Therapeutics, Inc. (a) | | 50,710 | 2,938,137 |
| TESARO, Inc. (a) | | 21,300 | 1,986,012 |
| Trevena, Inc. (a) | | 308,900 | 1,936,803 |
| Ultragenyx Pharmaceutical, Inc. (a) | | 24,400 | 1,544,032 |
| Vertex Pharmaceuticals, Inc. (a) | | 328,800 | 31,893,600 |
| Xencor, Inc. (a) | | 37,200 | 704,568 |
| | | | 574,651,747 |
| Health Care Equipment & Supplies - 1.9% | | | |
| Boston Scientific Corp. (a) | | 1,351,600 | 32,816,848 |
| Danaher Corp. | | 164,900 | 13,429,456 |
| DexCom, Inc. (a) | | 38,100 | 3,513,963 |
| Edwards Lifesciences Corp. (a) | | 20,400 | 2,336,208 |
| Insulet Corp. (a) | | 37,100 | 1,312,969 |
| Intuitive Surgical, Inc. (a) | | 44,500 | 30,961,320 |
| Invuity, Inc. (a) | | 216,800 | 2,233,040 |
| Medtronic PLC | | 218,825 | 19,175,635 |
| Nevro Corp. (a)(b) | | 150,750 | 12,467,025 |
| Olympus Corp. | | 30,200 | 1,042,136 |
| | | | 119,288,600 |
| Health Care Providers & Services - 0.6% | | | |
| Adeptus Health, Inc. Class A (a)(b) | | 257,808 | 11,490,503 |
| AmSurg Corp. (a) | | 127,300 | 9,548,773 |
| Anthem, Inc. | | 35,800 | 4,701,972 |
| Cigna Corp. | | 40,600 | 5,235,776 |
| Dr Lal Pathlabs Ltd. | | 2,393 | 34,914 |
| UnitedHealth Group, Inc. | | 24,100 | 3,451,120 |
| Wellcare Health Plans, Inc. (a) | | 11,000 | 1,174,800 |
| | | | 35,637,858 |
| Health Care Technology - 0.1% | | | |
| athenahealth, Inc. (a) | | 36,700 | 4,689,893 |
| Evolent Health, Inc. (a) | | 77,800 | 1,831,412 |
| | | | 6,521,305 |
| Life Sciences Tools & Services - 0.0% | | | |
| Lonza Group AG | | 13,733 | 2,588,753 |
| Thermo Fisher Scientific, Inc. | | 4,000 | 635,360 |
| | | | 3,224,113 |
| Pharmaceuticals - 2.3% | | | |
| Achaogen, Inc. (a) | | 161,500 | 634,695 |
| Bristol-Myers Squibb Co. | | 626,300 | 46,853,503 |
| Catalent, Inc. (a) | | 26,000 | 664,040 |
| Cempra, Inc. (a) | | 39,900 | 717,003 |
| CSPC Pharmaceutical Group Ltd. | | 786,000 | 679,787 |
| Dermira, Inc. (a) | | 120,600 | 4,047,336 |
| Eli Lilly & Co. | | 73,800 | 6,117,282 |
| Endo International PLC (a) | | 660,229 | 11,461,575 |
| GW Pharmaceuticals PLC ADR (a) | | 71,857 | 6,777,552 |
| Intra-Cellular Therapies, Inc. (a) | | 55,400 | 2,260,320 |
| Jazz Pharmaceuticals PLC (a) | | 99,100 | 14,961,127 |
| Johnson & Johnson | | 31,700 | 3,969,791 |
| Pacira Pharmaceuticals, Inc. (a) | | 185,600 | 6,728,000 |
| Patheon NV | | 84,200 | 2,177,412 |
| Teva Pharmaceutical Industries Ltd. sponsored ADR | | 459,000 | 24,556,500 |
| The Medicines Company (a) | | 170,200 | 6,656,522 |
| | | | 139,262,445 |
|
| TOTAL HEALTH CARE | | | 878,586,068 |
|
| INDUSTRIALS - 4.5% | | | |
| Aerospace & Defense - 0.8% | | | |
| Honeywell International, Inc. | | 237,000 | 27,570,210 |
| Lockheed Martin Corp. | | 26,200 | 6,621,526 |
| Northrop Grumman Corp. | | 32,800 | 7,105,464 |
| Raytheon Co. | | 38,200 | 5,330,046 |
| Taser International, Inc. (a) | | 21,700 | 628,432 |
| TransDigm Group, Inc. (a) | | 2,200 | 614,944 |
| | | | 47,870,622 |
| Airlines - 1.9% | | | |
| American Airlines Group, Inc. | | 215,700 | 7,657,350 |
| Delta Air Lines, Inc. | | 701,900 | 27,198,625 |
| InterGlobe Aviation Ltd. (a) | | 141,443 | 2,096,128 |
| JetBlue Airways Corp. (a) | | 259,800 | 4,762,134 |
| Southwest Airlines Co. | | 1,058,400 | 39,171,384 |
| Spirit Airlines, Inc. (a) | | 385,100 | 16,463,025 |
| United Continental Holdings, Inc. (a) | | 403,900 | 18,938,871 |
| Wizz Air Holdings PLC (a) | | 108,003 | 2,214,087 |
| | | | 118,501,604 |
| Building Products - 0.1% | | | |
| Apogee Enterprises, Inc. | | 12,900 | 603,075 |
| Builders FirstSource, Inc. (a) | | 168,800 | 2,175,832 |
| Masco Corp. | | 94,100 | 3,432,768 |
| | | | 6,211,675 |
| Construction & Engineering - 0.4% | | | |
| Dycom Industries, Inc. (a) | | 247,900 | 23,314,995 |
| Electrical Equipment - 0.4% | | | |
| Acuity Brands, Inc. | | 48,900 | 12,832,827 |
| AMETEK, Inc. | | 51,000 | 2,398,530 |
| Emerson Electric Co. | | 43,100 | 2,409,290 |
| Fortive Corp. (a) | | 94,750 | 4,567,898 |
| Regal Beloit Corp. | | 61,000 | 3,721,610 |
| SolarCity Corp. (a) | | 48,500 | 1,294,950 |
| | | | 27,225,105 |
| Industrial Conglomerates - 0.1% | | | |
| Koninklijke Philips Electronics NV (depositary receipt) (NY Reg.) | | 205,900 | 5,468,704 |
| Machinery - 0.5% | | | |
| Allison Transmission Holdings, Inc. | | 188,600 | 5,435,452 |
| Caterpillar, Inc. | | 54,900 | 4,543,524 |
| Ingersoll-Rand PLC | | 55,300 | 3,664,178 |
| Pentair PLC | | 35,400 | 2,259,228 |
| Rational AG | | 5,200 | 2,515,545 |
| Wabtec Corp. | | 98,100 | 6,719,850 |
| Xylem, Inc. | | 99,600 | 4,761,876 |
| | | | 29,899,653 |
| Professional Services - 0.0% | | | |
| Equifax, Inc. | | 7,400 | 980,204 |
| Road & Rail - 0.0% | | | |
| Genesee & Wyoming, Inc. Class A (a) | | 19,400 | 1,256,150 |
| Trading Companies & Distributors - 0.3% | | | |
| HD Supply Holdings, Inc. (a) | | 534,900 | 19,358,031 |
|
| TOTAL INDUSTRIALS | | | 280,086,743 |
|
| INFORMATION TECHNOLOGY - 35.9% | | | |
| Communications Equipment - 0.1% | | | |
| Arista Networks, Inc. (a)(b) | | 52,400 | 3,734,548 |
| Electronic Equipment & Components - 0.2% | | | |
| Fitbit, Inc. (a)(b) | | 500,413 | 6,835,642 |
| Jabil Circuit, Inc. | | 172,600 | 3,512,410 |
| QLogic Corp. (a) | | 79,500 | 1,233,840 |
| | | | 11,581,892 |
| Internet Software & Services - 14.3% | | | |
| 58.com, Inc. ADR (a) | | 119,900 | 6,235,999 |
| Akamai Technologies, Inc. (a) | | 89,700 | 4,532,541 |
| Alibaba Group Holding Ltd. sponsored ADR (a) | | 562,100 | 46,362,008 |
| Alphabet, Inc.: | | | |
| Class A | | 569,113 | 450,361,878 |
| Class C (a) | | 11,353 | 8,728,073 |
| eBay, Inc. (a) | | 1,849,200 | 57,621,072 |
| Facebook, Inc. Class A (a) | | 2,002,555 | 248,196,667 |
| GoDaddy, Inc. (a) | | 39,900 | 1,193,808 |
| Gogo, Inc. (a)(b) | | 525,700 | 4,421,137 |
| LinkedIn Corp. Class A (a) | | 22,400 | 4,317,152 |
| MercadoLibre, Inc. | | 13,900 | 2,127,812 |
| New Relic, Inc. (a) | | 8,700 | 299,628 |
| Rackspace Hosting, Inc. (a) | | 1,024,495 | 24,003,918 |
| Shopify, Inc. Class A (a) | | 49,400 | 1,692,938 |
| Tencent Holdings Ltd. | | 791,600 | 19,119,616 |
| Yandex NV (a) | | 156,100 | 3,379,565 |
| | | | 882,593,812 |
| IT Services - 3.9% | | | |
| Cognizant Technology Solutions Corp. Class A (a) | | 824,948 | 47,426,261 |
| EOH Holdings Ltd. | | 78,500 | 801,329 |
| Global Payments, Inc. | | 16,200 | 1,209,492 |
| MasterCard, Inc. Class A | | 752,900 | 71,706,196 |
| Vakrangee Ltd. (a) | | 231,557 | 647,373 |
| Visa, Inc. Class A | | 1,499,448 | 117,031,916 |
| | | | 238,822,567 |
| Semiconductors & Semiconductor Equipment - 4.2% | | | |
| Analog Devices, Inc. | | 56,288 | 3,592,863 |
| Applied Materials, Inc. | | 1,310,000 | 34,439,900 |
| Cavium, Inc. (a) | | 369,255 | 17,233,131 |
| Cirrus Logic, Inc. (a) | | 638,300 | 31,014,997 |
| Lam Research Corp. | | 115,900 | 10,404,343 |
| Maxim Integrated Products, Inc. | | 16,300 | 664,714 |
| Mellanox Technologies Ltd. (a) | | 73,900 | 3,264,902 |
| Micron Technology, Inc. (a) | | 242,900 | 3,337,446 |
| Monolithic Power Systems, Inc. | | 6,556 | 476,752 |
| NVIDIA Corp. | | 902,520 | 51,533,892 |
| NXP Semiconductors NV (a) | | 1,224,369 | 102,957,189 |
| Qualcomm, Inc. | | 10,000 | 625,800 |
| Semtech Corp. (a) | | 93,400 | 2,374,228 |
| | | | 261,920,157 |
| Software - 7.8% | | | |
| Activision Blizzard, Inc. | | 2,624,028 | 105,380,964 |
| Adobe Systems, Inc. (a) | | 287,520 | 28,136,707 |
| Appirio, Inc. (a)(c) | | 43,764 | 157,550 |
| Electronic Arts, Inc. (a) | | 775,900 | 59,216,688 |
| Ellie Mae, Inc. (a) | | 8,300 | 764,513 |
| HubSpot, Inc. (a) | | 17,800 | 971,702 |
| Microsoft Corp. | | 1,164,800 | 66,020,864 |
| Mobileye NV (a)(b) | | 456,000 | 21,846,960 |
| Nintendo Co. Ltd. | | 37,900 | 7,866,812 |
| Paycom Software, Inc. (a)(b) | | 133,500 | 6,302,535 |
| RealPage, Inc. (a) | | 18,200 | 457,730 |
| Red Hat, Inc. (a) | | 92,600 | 6,971,854 |
| Salesforce.com, Inc. (a) | | 1,678,267 | 137,282,241 |
| SAP AG sponsored ADR | | 40,200 | 3,513,078 |
| Splunk, Inc. (a) | | 48,000 | 3,001,920 |
| Tableau Software, Inc. (a) | | 155,200 | 8,770,352 |
| Workday, Inc. Class A (a) | | 243,100 | 20,259,954 |
| Zendesk, Inc. (a) | | 242,500 | 7,333,200 |
| | | | 484,255,624 |
| Technology Hardware, Storage & Peripherals - 5.4% | | | |
| Apple, Inc. | | 3,027,034 | 315,447,213 |
| Samsung Electronics Co. Ltd. | | 4,221 | 5,837,634 |
| Western Digital Corp. | | 256,500 | 12,186,315 |
| | | | 333,471,162 |
|
| TOTAL INFORMATION TECHNOLOGY | | | 2,216,379,762 |
|
| MATERIALS - 1.5% | | | |
| Chemicals - 1.5% | | | |
| Albemarle Corp. U.S. | | 167,200 | 14,073,224 |
| Ashland, Inc. | | 50,600 | 5,729,944 |
| CF Industries Holdings, Inc. | | 818,500 | 20,200,580 |
| E.I. du Pont de Nemours & Co. | | 44,400 | 3,071,148 |
| FMC Corp. | | 75,600 | 3,594,024 |
| Monsanto Co. | | 178,100 | 19,015,737 |
| Potash Corp. of Saskatchewan, Inc. | | 263,300 | 4,103,822 |
| PPG Industries, Inc. | | 12,000 | 1,256,520 |
| Sherwin-Williams Co. | | 12,400 | 3,716,652 |
| Sociedad Quimica y Minera de Chile SA (PN-B) sponsored ADR | | 137,400 | 3,404,772 |
| The Dow Chemical Co. | | 148,400 | 7,964,628 |
| W.R. Grace & Co. | | 16,000 | 1,197,920 |
| Westlake Chemical Corp. | | 54,300 | 2,483,682 |
| | | | 89,812,653 |
| Construction Materials - 0.0% | | | |
| Martin Marietta Materials, Inc. | | 6,500 | 1,317,225 |
| U.S. Concrete, Inc. (a) | | 9,900 | 638,550 |
| | | | 1,955,775 |
|
| TOTAL MATERIALS | | | 91,768,428 |
|
| TELECOMMUNICATION SERVICES - 0.0% | | | |
| Wireless Telecommunication Services - 0.0% | | | |
| T-Mobile U.S., Inc. (a) | | 75,400 | 3,494,036 |
| TOTAL COMMON STOCKS | | | |
| (Cost $4,591,653,990) | | | 5,934,937,904 |
|
| Preferred Stocks - 3.5% | | | |
| Convertible Preferred Stocks - 3.4% | | | |
| CONSUMER DISCRETIONARY - 0.1% | | | |
| Internet & Catalog Retail - 0.1% | | | |
| The Honest Co., Inc.: | | | |
| Series C (a)(c) | | 167,087 | 6,434,236 |
| Series D (c) | | 27,712 | 1,067,142 |
| | | | 7,501,378 |
| CONSUMER STAPLES - 0.2% | | | |
| Food & Staples Retailing - 0.1% | | | |
| Blue Apron, Inc. Series D (a)(c) | | 285,138 | 4,733,291 |
| Food Products - 0.1% | | | |
| BLUE BOTTLE Coffee, Inc. Series C (a)(c) | | 234,006 | 3,772,177 |
| Tobacco - 0.0% | | | |
| PAX Labs, Inc. Series C (a)(c) | | 945,100 | 2,485,613 |
| TOTAL CONSUMER STAPLES | | | 10,991,081 |
| FINANCIALS - 0.1% | | | |
| Consumer Finance - 0.1% | | | |
| Oportun Finance Corp. Series H (a)(c) | | 1,527,120 | 4,214,851 |
| HEALTH CARE - 0.2% | | | |
| Biotechnology - 0.1% | | | |
| AC Immune SA Series E (c) | | 192,250 | 1,853,290 |
| Immunocore Ltd. Series A (c) | | 4,035 | 942,371 |
| Pronutria Biosciences, Inc. Series C (a)(c) | | 248,015 | 4,263,378 |
| | | | 7,059,039 |
| Health Care Providers & Services - 0.1% | | | |
| Mulberry Health, Inc. Series A8 (c) | | 813,618 | 5,931,519 |
| TOTAL HEALTH CARE | | | 12,990,558 |
| INDUSTRIALS - 0.1% | | | |
| Aerospace & Defense - 0.1% | | | |
| Space Exploration Technologies Corp. Series G (a)(c) | | 42,650 | 4,112,313 |
| Professional Services - 0.0% | | | |
| YourPeople, Inc. Series C (a)(c) | | 253,888 | 3,859,098 |
| TOTAL INDUSTRIALS | | | 7,971,411 |
| INFORMATION TECHNOLOGY - 2.7% | | | |
| Internet Software & Services - 2.2% | | | |
| Jet.Com, Inc. Series B1 (c) | | 922,232 | 8,055,697 |
| Uber Technologies, Inc.: | | | |
| Series D, 8.00% (a)(c) | | 2,578,476 | 125,758,019 |
| Series E, 8.00% (a)(c) | | 47,420 | 2,312,779 |
| | | | 136,126,495 |
| IT Services - 0.1% | | | |
| AppNexus, Inc. Series E (a)(c) | | 307,049 | 5,287,384 |
| Nutanix, Inc. Series E (a)(c) | | 230,044 | 3,586,386 |
| | | | 8,873,770 |
| Software - 0.4% | | | |
| Appirio, Inc. Series E (a)(c) | | 306,351 | 1,102,864 |
| Cloudflare, Inc. Series D (a)(c) | | 323,080 | 2,012,788 |
| Dataminr, Inc. Series D (a)(c) | | 115,901 | 746,055 |
| Delphix Corp. Series D (c) | | 242,876 | 1,311,530 |
| Malwarebytes Corp. Series B (c) | | 329,349 | 3,070,093 |
| Snapchat, Inc. Series F (a)(c) | | 320,236 | 9,837,650 |
| Taboola.Com Ltd. Series E (a)(c) | | 289,958 | 3,253,329 |
| | | | 21,334,309 |
| TOTAL INFORMATION TECHNOLOGY | | | 166,334,574 |
|
| TOTAL CONVERTIBLE PREFERRED STOCKS | | | 210,003,853 |
|
| Nonconvertible Preferred Stocks - 0.1% | | | |
| CONSUMER DISCRETIONARY - 0.1% | | | |
| Internet & Catalog Retail - 0.1% | | | |
| China Internet Plus Holdings Ltd. Series A-11 (c) | | 1,581,852 | 6,107,056 |
| TOTAL PREFERRED STOCKS | | | |
| (Cost $127,618,619) | | | 216,110,909 |
|
| Money Market Funds - 1.4% | | | |
| Fidelity Cash Central Fund, 0.42% (f) | | 39,787,470 | 39,787,470 |
| Fidelity Securities Lending Cash Central Fund, 0.45% (f)(g) | | 46,183,027 | 46,183,027 |
| TOTAL MONEY MARKET FUNDS | | | |
| (Cost $85,970,497) | | | 85,970,497 |
| TOTAL INVESTMENT PORTFOLIO - 100.9% | | | |
| (Cost $4,805,243,106) | | | 6,237,019,310 |
| NET OTHER ASSETS (LIABILITIES) - (0.9)% | | | (57,321,706) |
| NET ASSETS - 100% | | | $6,179,697,604 |
Legend
(a) Non-income producing
(b) Security or a portion of the security is on loan at period end.
(c) Restricted securities - Investment in securities not registered under the Securities Act of 1933 (excluding 144A issues). At the end of the period, the value of restricted securities (excluding 144A issues) amounted to $228,033,231 or 3.7% of net assets.
(d) Investment is owned by a wholly-owned subsidiary (Subsidiary) that is treated as a corporation for U.S. tax purposes.
(e) Security exempt from registration under Rule 144A of the Securities Act of 1933. These securities may be resold in transactions exempt from registration, normally to qualified institutional buyers. At the end of the period, the value of these securities amounted to $2,183,052 or 0.0% of net assets.
(f) Affiliated fund that is generally available only to investment companies and other accounts managed by Fidelity Investments. The rate quoted is the annualized seven-day yield of the fund at period end. A complete unaudited listing of the fund's holdings as of its most recent quarter end is available upon request. In addition, each Fidelity Central Fund's financial statements, which are not covered by the Fund's Report of Independent Registered Public Accounting Firm, are available on the SEC's website or upon request.
(g) Investment made with cash collateral received from securities on loan.
Additional information on each restricted holding is as follows:
| Security | Acquisition Date | Acquisition Cost |
| AC Immune SA Series E | 10/19/15 | $1,852,567 |
| Appirio, Inc. | 2/12/15 | $312,497 |
| Appirio, Inc. Series E | 2/12/15 | $2,187,499 |
| AppNexus, Inc. Series E | 8/1/14 | $6,150,867 |
| Blue Apron, Inc. Series D | 5/18/15 | $3,800,006 |
| BLUE BOTTLE Coffee, Inc. Series C | 5/29/15 | $7,797,080 |
| China Internet Plus Holdings Ltd. Series A-11 | 1/26/15 | $4,999,997 |
| Cloudflare, Inc. Series D | 11/5/14 - 6/24/15 | $2,010,032 |
| Dataminr, Inc. Series D | 3/6/15 | $1,477,738 |
| Delphix Corp. Series D | 7/10/15 | $2,185,884 |
| Immunocore Ltd. Series A | 7/27/15 | $759,303 |
| Jet.Com, Inc. Series B1 | 11/24/15 | $4,600,001 |
| Malwarebytes Corp. Series B | 12/21/15 | $3,416,996 |
| Mulberry Health, Inc. Series A8 | 1/20/16 | $5,495,786 |
| Nutanix, Inc. Series E | 8/26/14 | $3,081,784 |
| Oportun Finance Corp. Series H | 2/6/15 | $4,348,169 |
| PAX Labs, Inc. Series C | 5/22/15 | $3,638,635 |
| Pronutria Biosciences, Inc. Series C | 1/30/15 | $2,499,991 |
| Snapchat, Inc. Series F | 3/25/15 - 2/12/16 | $9,837,650 |
| Space Exploration Technologies Corp. Series G | 1/20/15 | $3,303,669 |
| Taboola.Com Ltd. Series E | 12/22/14 | $3,022,928 |
| The Honest Co., Inc. | 8/21/14 | $1,937,546 |
| The Honest Co., Inc. Series C | 8/21/14 | $4,520,923 |
| The Honest Co., Inc. Series D | 8/3/15 | $1,267,963 |
| Tory Burch LLC unit | 5/14/15 | $7,600,030 |
| Uber Technologies, Inc. Series D, 8.00% | 6/6/14 | $40,000,027 |
| Uber Technologies, Inc. Series E, 8.00% | 12/5/14 | $1,579,919 |
| WME Entertainment Parent, LLC Class A unit | 4/13/16 | $2,362,133 |
| YourPeople, Inc. Series C | 5/1/15 | $3,783,205 |
Affiliated Central Funds
Information regarding fiscal year to date income earned by the Fund from investments in Fidelity Central Funds is as follows:
| Fund | Income earned |
| Fidelity Cash Central Fund | $94,216 |
| Fidelity Securities Lending Cash Central Fund | 3,327,334 |
| Total | $3,421,550 |
Investment Valuation
The following is a summary of the inputs used, as of July 31, 2016, involving the Fund's assets and liabilities carried at fair value. The inputs or methodology used for valuing securities may not be an indication of the risk associated with investing in those securities. For more information on valuation inputs, and their aggregation into the levels used below, please refer to the Investment Valuation section in the accompanying Notes to Financial Statements.
| | Valuation Inputs at Reporting Date: |
| Description | Total | Level 1 | Level 2 | Level 3 |
| Investments in Securities: | | | | |
| Equities: | | | | |
| Consumer Discretionary | $1,608,028,833 | $1,486,485,599 | $98,532,173 | $23,011,061 |
| Consumer Staples | 492,130,223 | 481,139,142 | -- | 10,991,081 |
| Energy | 137,283,393 | 137,283,393 | -- | -- |
| Financials | 255,994,784 | 249,417,786 | -- | 6,576,998 |
| Health Care | 891,576,626 | 872,889,305 | 5,696,763 | 12,990,558 |
| Industrials | 288,058,154 | 280,086,743 | -- | 7,971,411 |
| Information Technology | 2,382,714,336 | 2,189,235,784 | 26,986,428 | 166,492,124 |
| Materials | 91,768,428 | 91,768,428 | -- | -- |
| Telecommunication Services | 3,494,036 | 3,494,036 | -- | -- |
| Money Market Funds | 85,970,497 | 85,970,497 | -- | -- |
| Total Investments in Securities: | $6,237,019,310 | $5,877,770,713 | $131,215,364 | $228,033,233 |
The following is a reconciliation of Investments in Securities for which Level 3 inputs were used in determining value:
| Investments in Securities: | |
| Equities - Information Technology | |
| Beginning Balance | $133,080,515 |
| Net Realized Gain (Loss) on Investment Securities | -- |
| Net Unrealized Gain (Loss) on Investment Securities | 23,151,899 |
| Cost of Purchases | 10,259,710 |
| Proceeds of Sales | -- |
| Amortization/Accretion | -- |
| Transfers into Level 3 | -- |
| Transfers out of Level 3 | -- |
| Ending Balance | $166,492,124 |
| The change in unrealized gain (loss) for the period attributable to Level 3 securities held at July 31, 2016 | $23,151,899 |
| Equities - Other Investments in Securities | |
| Beginning Balance | $62,822,943 |
| Net Realized Gain (Loss) on Investment Securities | (1,347,394) |
| Net Unrealized Gain (Loss) on Investment Securities | (3,452,704) |
| Cost of Purchases | 16,016,144 |
| Proceeds of Sales | (12,497,880) |
| Amortization/Accretion | -- |
| Transfers into Level 3 | -- |
| Transfers out of Level 3 | -- |
| Ending Balance | $61,541,109 |
| The change in unrealized gain (loss) for the period attributable to Level 3 securities held at July 31, 2016 | $(4,074,865) |
The information used in the above reconciliations represents fiscal year to date activity for any Investments in Securities identified as using Level 3 inputs at either the beginning or the end of the current fiscal period. Transfers in or out of Level 3 represent the beginning value of any Security or Instrument where a change in the pricing level occurred from the beginning to the end of the period. The cost of purchases and the proceeds of sales may include securities received or delivered through corporate actions or exchanges. Realized and unrealized gains (losses) disclosed in the reconciliations are included in Net Gain (Loss) on the Fund's Statement of Operations.
Other Information
Distribution of investments by country or territory of incorporation, as a percentage of Total Net Assets, is as follows (Unaudited):
| United States of America | 88.0% |
| Netherlands | 2.5% |
| Cayman Islands | 2.3% |
| Singapore | 2.0% |
| Germany | 1.2% |
| Ireland | 1.2% |
| Others (Individually Less Than 1%) | 2.8% |
| | 100.0% |
See accompanying notes which are an integral part of the financial statements.
Financial Statements
Statement of Assets and Liabilities
| | | July 31, 2016 |
| Assets | | |
Investment in securities, at value (including securities loaned of $45,688,499) — See accompanying schedule:
Unaffiliated issuers (cost $4,719,272,609) | $6,151,048,813 | |
| Fidelity Central Funds (cost $85,970,497) | 85,970,497 | |
| Total Investments (cost $4,805,243,106) | | $6,237,019,310 |
| Restricted cash | | 35,096 |
| Receivable for investments sold | | 82,575,373 |
| Receivable for fund shares sold | | 7,642,005 |
| Dividends receivable | | 1,353,230 |
| Distributions receivable from Fidelity Central Funds | | 69,273 |
| Other receivables | | 67,331 |
| Total assets | | 6,328,761,618 |
| Liabilities | | |
| Payable for investments purchased | $99,595,851 | |
| Payable for fund shares redeemed | 394,358 | |
| Accrued management fee | 2,303,125 | |
| Other affiliated payables | 402,870 | |
| Other payables and accrued expenses | 184,783 | |
| Collateral on securities loaned, at value | 46,183,027 | |
| Total liabilities | | 149,064,014 |
| Net Assets | | $6,179,697,604 |
| Net Assets consist of: | | |
| Paid in capital | | $4,797,412,435 |
| Undistributed net investment income | | 13,539,983 |
| Accumulated undistributed net realized gain (loss) on investments and foreign currency transactions | | (62,932,018) |
| Net unrealized appreciation (depreciation) on investments and assets and liabilities in foreign currencies | | 1,431,677,204 |
| Net Assets | | $6,179,697,604 |
| Series Blue Chip Growth: | | |
| Net Asset Value, offering price and redemption price per share ($2,417,952,284 ÷ 210,839,513 shares) | | $11.47 |
| Class F: | | |
| Net Asset Value, offering price and redemption price per share ($3,761,745,320 ÷ 327,733,743 shares) | | $11.48 |
See accompanying notes which are an integral part of the financial statements.
Statement of Operations
| | | Year ended July 31, 2016 |
| Investment Income | | |
| Dividends | | $51,541,372 |
| Income from Fidelity Central Funds (including $3,327,334 from security lending) | | 3,421,550 |
| Total income | | 54,962,922 |
| Expenses | | |
| Management fee | | |
| Basic fee | $33,663,509 | |
| Performance adjustment | (403,875) | |
| Transfer agent fees | 3,952,469 | |
| Accounting and security lending fees | 1,152,090 | |
| Custodian fees and expenses | 220,661 | |
| Independent trustees' fees and expenses | 27,668 | |
| Audit | 93,616 | |
| Legal | 17,520 | |
| Interest | 20,227 | |
| Miscellaneous | 52,337 | |
| Total expenses before reductions | 38,796,222 | |
| Expense reductions | (214,173) | 38,582,049 |
| Net investment income (loss) | | 16,380,873 |
| Realized and Unrealized Gain (Loss) | | |
| Net realized gain (loss) on: | | |
| Investment securities: | | |
| Unaffiliated issuers | 73,199,710 | |
| Foreign currency transactions | (207,574) | |
| Total net realized gain (loss) | | 72,992,136 |
Change in net unrealized appreciation (depreciation) on:
Investment securities (net of increase in deferred foreign taxes of $89,393) | (256,128,675) | |
| Assets and liabilities in foreign currencies | (13,275) | |
| Total change in net unrealized appreciation (depreciation) | | (256,141,950) |
| Net gain (loss) | | (183,149,814) |
| Net increase (decrease) in net assets resulting from operations | | $(166,768,941) |
See accompanying notes which are an integral part of the financial statements.
Statement of Changes in Net Assets
| | Year ended July 31, 2016 | Year ended July 31, 2015 |
| Increase (Decrease) in Net Assets | | |
| Operations | | |
| Net investment income (loss) | $16,380,873 | $24,084,478 |
| Net realized gain (loss) | 72,992,136 | 648,703,997 |
| Change in net unrealized appreciation (depreciation) | (256,141,950) | 876,323,552 |
| Net increase (decrease) in net assets resulting from operations | (166,768,941) | 1,549,112,027 |
| Distributions to shareholders from net investment income | (14,390,063) | (23,623,473) |
| Distributions to shareholders from net realized gain | (753,239,546) | (69,954,848) |
| Total distributions | (767,629,609) | (93,578,321) |
| Share transactions - net increase (decrease) | 218,143,104 | (2,451,650,515) |
| Total increase (decrease) in net assets | (716,255,446) | (996,116,809) |
| Net Assets | | |
| Beginning of period | 6,895,953,050 | 7,892,069,859 |
| End of period | $6,179,697,604 | $6,895,953,050 |
| Other Information | | |
| Undistributed net investment income end of period | $13,539,983 | $12,115,675 |
See accompanying notes which are an integral part of the financial statements.
Financial Highlights — Fidelity Series Blue Chip Growth Fund
| Years ended July 31, | 2016 | 2015 | 2014 A |
| Selected Per–Share Data | | | |
| Net asset value, beginning of period | $13.36 | $11.18 | $10.00 |
| Income from Investment Operations | | | |
| Net investment income (loss)B | .02 | .03 | .02 |
| Net realized and unrealized gain (loss) | (.42) | 2.27 | 1.17 |
| Total from investment operations | (.40) | 2.30 | 1.19 |
| Distributions from net investment income | (.02) | (.02) | (.01) |
| Distributions from net realized gain | (1.48) | (.10) | – |
| Total distributions | (1.49)C | (.12) | (.01) |
| Net asset value, end of period | $11.47 | $13.36 | $11.18 |
| Total ReturnD,E | (2.63)% | 20.74% | 11.90% |
| Ratios to Average Net AssetsF,G | | | |
| Expenses before reductions | .73% | .79% | .74%H |
| Expenses net of fee waivers, if any | .73% | .78% | .74%H |
| Expenses net of all reductions | .73% | .78% | .74%H |
| Net investment income (loss) | .17% | .20% | .26%H |
| Supplemental Data | | | |
| Net assets, end of period (000 omitted) | $2,417,952 | $2,831,293 | $3,288,708 |
| Portfolio turnover rateI | 55% | 57% | 67%H,J |
A For the period November 7, 2013 (commencement of operations) to July 31, 2014.
B Calculated based on average shares outstanding during the period.
C Total distributions of $1.49 per share is comprised of distributions from net investment income of $0.015 and distributions from net realized gain of $1.477 per share.
D Total returns for periods of less than one year are not annualized.
E Total returns would have been lower if certain expenses had not been reduced during the applicable periods shown.
F Fees and expenses of any underlying Fidelity Central Funds are not included in the Fund's expense ratio. The Fund indirectly bears its proportionate share of the expenses of any underlying Fidelity Central Funds.
G Expense ratios reflect operating expenses of the class. Expenses before reductions do not reflect amounts reimbursed by the investment adviser or reductions from brokerage service arrangements or reductions from other expense offset arrangements and do not represent the amount paid by the class during periods when reimbursements or reductions occur. Expense ratios before reductions for start-up periods may not be representative of longer-term operating periods. Expenses net of fee waivers reflect expenses after reimbursement by the investment adviser but prior to reductions from brokerage service arrangements or other expense offset arrangements. Expenses net of all reductions represent the net expenses paid by the class.
H Annualized
I Amount does not include the portfolio activity of any underlying Fidelity Central Funds.
J Portfolio turnover rate excludes securities received or delivered in-kind.
See accompanying notes which are an integral part of the financial statements.
Financial Highlights — Fidelity Series Blue Chip Growth Fund Class F
| Years ended July 31, | 2016 | 2015 | 2014 A |
| Selected Per–Share Data | | | |
| Net asset value, beginning of period | $13.38 | $11.19 | $10.00 |
| Income from Investment Operations | | | |
| Net investment income (loss)B | .04 | .05 | .03 |
| Net realized and unrealized gain (loss) | (.43) | 2.28 | 1.17 |
| Total from investment operations | (.39) | 2.33 | 1.20 |
| Distributions from net investment income | (.04) | (.04) | (.01) |
| Distributions from net realized gain | (1.48) | (.10) | – |
| Total distributions | (1.51)C | (.14) | (.01) |
| Net asset value, end of period | $11.48 | $13.38 | $11.19 |
| Total ReturnD,E | (2.52)% | 21.00% | 12.03% |
| Ratios to Average Net AssetsF,G | | | |
| Expenses before reductions | .57% | .62% | .57%H |
| Expenses net of fee waivers, if any | .57% | .62% | .57%H |
| Expenses net of all reductions | .56% | .62% | .57%H |
| Net investment income (loss) | .33% | .37% | .43%H |
| Supplemental Data | | | |
| Net assets, end of period (000 omitted) | $3,761,745 | $4,064,661 | $4,603,361 |
| Portfolio turnover rateI | 55% | 57% | 67%H,J |
A For the period November 7, 2013 (commencement of operations) to July 31, 2014.
B Calculated based on average shares outstanding during the period.
C Total distributions of $1.51 per share is comprised of distributions from net investment income of $.037 and distributions from net realized gain of $1.477 per share.
D Total returns for periods of less than one year are not annualized.
E Total returns would have been lower if certain expenses had not been reduced during the applicable periods shown.
F Fees and expenses of any underlying Fidelity Central Funds are not included in the Fund's expense ratio. The Fund indirectly bears its proportionate share of the expenses of any underlying Fidelity Central Funds.
G Expense ratios reflect operating expenses of the class. Expenses before reductions do not reflect amounts reimbursed by the investment adviser or reductions from brokerage service arrangements or reductions from other expense offset arrangements and do not represent the amount paid by the class during periods when reimbursements or reductions occur. Expense ratios before reductions for start-up periods may not be representative of longer-term operating periods. Expenses net of fee waivers reflect expenses after reimbursement by the investment adviser but prior to reductions from brokerage service arrangements or other expense offset arrangements. Expenses net of all reductions represent the net expenses paid by the class.
H Annualized
I Amount does not include the portfolio activity of any underlying Fidelity Central Funds.
J Portfolio turnover rate excludes securities received or delivered in-kind.
See accompanying notes which are an integral part of the financial statements.
Notes to Financial Statements
For the period ended July 31, 2016
1. Organization.
Fidelity Series Blue Chip Growth Fund (the Fund) is a fund of Fidelity Securities Fund (the Trust) and is authorized to issue an unlimited number of shares. Shares of the Fund are only available for purchase by mutual funds for which Fidelity Management & Research Company (FMR) or an affiliate serves as an investment manager. The Trust is registered under the Investment Company Act of 1940, as amended (the 1940 Act), as an open-end management investment company organized as a Massachusetts business trust. The Fund offers Series Blue Chip Growth and Class F shares, each of which has equal rights as to assets and voting privileges. Each class has exclusive voting rights with respect to matters that affect that class.
2. Investments in Fidelity Central Funds.
The Fund invests in Fidelity Central Funds, which are open-end investment companies generally available only to other investment companies and accounts managed by the investment adviser and its affiliates. The Fund's Schedule of Investments lists each of the Fidelity Central Funds held as of period end, if any, as an investment of the Fund, but does not include the underlying holdings of each Fidelity Central Fund. As an Investing Fund, the Fund indirectly bears its proportionate share of the expenses of the underlying Fidelity Central Funds.
The Money Market Central Funds seek preservation of capital and current income and are managed by Fidelity Investments Money Management, Inc. (FIMM), an affiliate of the investment adviser. Annualized expenses of the Money Market Central Funds as of their most recent shareholder report date are less than .005%.
A complete unaudited list of holdings for each Fidelity Central Fund is available upon request or at the Securities and Exchange Commission (the SEC) website at www.sec.gov. In addition, the financial statements of the Fidelity Central Funds, which are not covered by the Fund's Report of Independent Registered Public Accounting Firm, are available on the SEC website or upon request.
3. Significant Accounting Policies.
The financial statements have been prepared in conformity with accounting principles generally accepted in the United States of America (GAAP), which require management to make certain estimates and assumptions at the date of the financial statements. Actual results could differ from those estimates. Subsequent events, if any, through the date that the financial statements were issued have been evaluated in the preparation of the financial statements. The following summarizes the significant accounting policies of the Fund:
Investment Valuation. Investments are valued as of 4:00 p.m. Eastern time on the last calendar day of the period. The Board of Trustees (the Board) has delegated the day to day responsibility for the valuation of the Fund's investments to the FMR Fair Value Committee (the Committee). In accordance with valuation policies and procedures approved by the Board, the Fund attempts to obtain prices from one or more third party pricing vendors or brokers to value its investments. When current market prices, quotations or currency exchange rates are not readily available or reliable, investments will be fair valued in good faith by the Committee, in accordance with procedures adopted by the Board. Factors used in determining fair value vary by investment type and may include market or investment specific events. The frequency with which these procedures are used cannot be predicted and they may be utilized to a significant extent. The Committee oversees the Fund's valuation policies and procedures and reports to the Board on the Committee's activities and fair value determinations. The Board monitors the appropriateness of the procedures used in valuing the Fund's investments and ratifies the fair value determinations of the Committee.
The Fund categorizes the inputs to valuation techniques used to value its investments into a disclosure hierarchy consisting of three levels as shown below:
- Level 1 – quoted prices in active markets for identical investments
- Level 2 – other significant observable inputs (including quoted prices for similar investments, interest rates, prepayment speeds, etc.)
- Level 3 – unobservable inputs (including the Fund's own assumptions based on the best information available)
Valuation techniques used to value the Fund's investments by major category are as follows:
Equity securities, including restricted securities, for which market quotations are readily available, are valued at the last reported sale price or official closing price as reported by a third party pricing vendor on the primary market or exchange on which they are traded and are categorized as Level 1 in the hierarchy. In the event there were no sales during the day or closing prices are not available, securities are valued at the last quoted bid price or may be valued using the last available price and are generally categorized as Level 2 in the hierarchy. For foreign equity securities, when market or security specific events arise, comparisons to the valuation of American Depositary Receipts (ADRs), futures contracts, Exchange-Traded Funds (ETFs) and certain indexes as well as quoted prices for similar securities may be used and would be categorized as Level 2 in the hierarchy. Utilizing these techniques may result in transfers between Level 1 and Level 2. For equity securities, including restricted securities, where observable inputs are limited, assumptions about market activity and risk are used and these securities may be categorized as Level 3 in the hierarchy. Equity securities, including restricted securities, for which observable inputs are not available are valued using alternate valuation approaches, including the market approach and the income approach and are categorized as Level 3 in the hierarchy. The market approach generally consists of using comparable market transactions while the income approach generally consists of using the net present value of estimated future cash flows, adjusted as appropriate for liquidity, credit, market and/or other risk factors.
Investments in open-end mutual funds, including the Fidelity Central Funds, are valued at their closing net asset value (NAV) each business day and are categorized as Level 1 in the hierarchy.
The following provides information on Level 3 securities held by the Fund that were valued at period end based on unobservable inputs. These amounts exclude valuations provided by a broker.
| Asset Type | Fair Value at 07/31/2016 | Valuation Technique(s) | Unobservable Input | Amount or Range/Weighted Average | Impact to Valuation from an Increase in Input(a) |
| Equities | $228,033,233 | Discounted cash flow | Weighted average cost of capital (WACC) | 11.6% | Decrease |
| | | | Discount for lack of marketability | 25.0% | Decrease |
| | | | Growth rate | 2.5% | Increase |
| | | Market approach | Acquisition terms | $8.74 | Increase |
| | | | Transaction price | $2.05 - $150.00 / $45.66 | Increase |
| | | | Proxy based premium | 21.3% | Decrease |
| | | | Premium rate | 15.0% | Increase |
| | | Market comparable | Enterprise value/Sales multiple (EV/S) | 0.6 - 8.0 / 3.5 | Increase |
| | | | Discount rate | 0.9% - 30.0% / 11.9% | Decrease |
| | | | Price/Earnings multiple (P/E) | 10.6 - 10.9 / 10.7 | Increase |
| | | | Enterprise value/EBITDA multiple (EV/EBITDA) | 9.9 | Increase |
| | | | Discount for lack of marketability | 10.0% - 25.0% / 14.1% | Decrease |
| | | | Enterprise value/Gross profit multiple (EV/GP) | 4.8 | Increase |
| | | | Premium rate | 1.0% - 35.0% / 20.1% | Increase |
| | | Recovery value | Liquidation preference | $12.75 - $23.41 / $22.09 | Increase |
(a) Represents the expected directional change in the fair value of the Level 3 investments that would result from an increase in the corresponding input. A decrease to the unobservable input would have the opposite effect. Significant changes in these inputs could result in significantly higher or lower fair value measurements.
Changes in valuation techniques may result in transfers in or out of an assigned level within the disclosure hierarchy. The aggregate value of investments by input level as of July 31, 2016, as well as a roll forward of Level 3 investments, is included at the end of the Fund's Schedule of Investments.
Foreign Currency. The Fund may use foreign currency contracts to facilitate transactions in foreign-denominated securities. Gains and losses from these transactions may arise from changes in the value of the foreign currency or if the counterparties do not perform under the contracts' terms.
Foreign-denominated assets, including investment securities, and liabilities are translated into U.S. dollars at the exchange rates at period end. Purchases and sales of investment securities, income and dividends received and expenses denominated in foreign currencies are translated into U.S. dollars at the exchange rate in effect on the transaction date.
The effects of exchange rate fluctuations on investments are included with the net realized and unrealized gain (loss) on investment securities. Other foreign currency transactions resulting in realized and unrealized gain (loss) are disclosed separately.
Investment Transactions and Income. For financial reporting purposes, the Fund's investment holdings and NAV include trades executed through the end of the last business day of the period. The NAV per share for processing shareholder transactions is calculated as of the close of business of the New York Stock Exchange (NYSE), normally 4:00 p.m. Eastern time and includes trades executed through the end of the prior business day. Gains and losses on securities sold are determined on the basis of identified cost. Dividend income is recorded on the ex-dividend date, except for certain dividends from foreign securities where the ex-dividend date may have passed, which are recorded as soon as the Fund is informed of the ex-dividend date. Non-cash dividends included in dividend income, if any, are recorded at the fair market value of the securities received. Income and capital gain distributions from Fidelity Central Funds, if any, are recorded on the ex-dividend date. Distributions received on securities that represent a return of capital or capital gain are recorded as a reduction of cost of investments and/or as a realized gain. Subsequent to ex-dividend date the Fund determines the components of these distributions, based upon receipt of tax filings or other correspondence relating to the underlying investment. Interest income is accrued as earned and includes coupon interest and amortization of premium and accretion of discount on debt securities as applicable. Investment income is recorded net of foreign taxes withheld where recovery of such taxes is uncertain.
Class Allocations and Expenses. Investment income, realized and unrealized capital gains and losses, common expenses of the Fund, and certain fund-level expense reductions, if any, are allocated daily on a pro-rata basis to each class based on the relative net assets of each class to the total net assets of the Fund. Each class differs with respect to transfer agent fees incurred. Certain expense reductions may also differ by class. For the reporting period, the allocated portion of income and expenses to each class as a percent of its average net assets may vary due to the timing of recording these transactions in relation to fluctuating net assets of the classes. Expenses directly attributable to a fund are charged to that fund. Expenses attributable to more than one fund are allocated among the respective funds on the basis of relative net assets or other appropriate methods. Expense estimates are accrued in the period to which they relate and adjustments are made when actual amounts are known.
Income Tax Information and Distributions to Shareholders. Each year, the Fund intends to qualify as a regulated investment company under Subchapter M of the Internal Revenue Code, including distributing substantially all of its taxable income and realized gains. As a result, no provision for U.S. Federal income taxes is required. As of July 31, 2016, the Fund did not have any unrecognized tax benefits in the financial statements; nor is the Fund aware of any tax positions for which it is reasonably possible that the total amounts of unrecognized tax benefits will significantly change in the next twelve months. The Fund files a U.S. federal tax return, in addition to state and local tax returns as required. The Fund's federal income tax returns are subject to examination by the Internal Revenue Service (IRS) for a period of three fiscal years after they are filed. State and local tax returns may be subject to examination for an additional fiscal year depending on the jurisdiction. Foreign taxes are provided for based on the Fund's understanding of the tax rules and rates that exist in the foreign markets in which it invests. The Fund is subject to a tax imposed on capital gains by certain countries in which it invests. An estimated deferred tax liability for net unrealized appreciation on the applicable securities is included in Other payables and accrued expenses on the Statement of Assets & Liabilities.
Distributions are declared and recorded on the ex-dividend date. Income dividends and capital gain distributions are declared separately for each class. Income and capital gain distributions are determined in accordance with income tax regulations, which may differ from GAAP.
Capital accounts within the financial statements are adjusted for permanent book-tax differences. These adjustments have no impact on net assets or the results of operations. Capital accounts are not adjusted for temporary book-tax differences which will reverse in a subsequent period.
Book-tax differences are primarily due to foreign currency transactions, passive foreign investment companies (PFIC), partnerships, security level mergers and exchanges and losses deferred due to wash sales and excise tax regulations.
The federal tax cost of investment securities and unrealized appreciation (depreciation) as of period end were as follows:
| Gross unrealized appreciation | $1,600,167,026 |
| Gross unrealized depreciation | (219,007,395) |
| Net unrealized appreciation (depreciation) on securities | $1,381,159,631 |
| Tax Cost | $4,855,859,679 |
The tax-based components of distributable earnings as of period end were as follows:
| Undistributed ordinary income | $13,539,983 |
| Net unrealized appreciation (depreciation) on securities and other investments | $1,381,150,024 |
The Fund intends to elect to defer to its next fiscal year $12,315,444 of capital losses recognized during the period November 1, 2015 to July 31, 2016.
The tax character of distributions paid was as follows:
| | July 31, 2016 | July 31, 2015 |
| Ordinary Income | $50,723,978 | $93,578,321 |
| Long-term Capital Gains | 716,905,631 | – |
| Total | $767,629,609 | $93,578,321 |
Restricted Securities. The Fund may invest in securities that are subject to legal or contractual restrictions on resale. These securities generally may be resold in transactions exempt from registration or to the public if the securities are registered. Disposal of these securities may involve time-consuming negotiations and expense, and prompt sale at an acceptable price may be difficult. Information regarding restricted securities is included at the end of the Fund's Schedule of Investments.
Consolidated Subsidiary. The Fund invests in certain investments through a wholly-owned subsidiary ("Subsidiary"), which may be subject to federal and state taxes upon disposition.
At period end, investments held through these Subsidiaries were $9,042,329 representing 0.15% of the Fund's net assets. The financial statements have been consolidated and include accounts of the Fund and each Subsidiary. Accordingly, all inter-company transactions and balances have been eliminated.
Any cash held by the Subsidiaries is restricted as to its use and is presented as Restricted cash in the Statement of Assets and Liabilities.
4. Purchases and Sales of Investments.
Purchases and sales of securities, other than short-term securities, aggregated $3,355,305,186 and $3,905,215,400, respectively.
5. Fees and Other Transactions with Affiliates.
Management Fee. Fidelity Management & Research Company (the investment adviser) and its affiliates provide the Fund with investment management related services for which the Fund pays a monthly management fee. The management fee is the sum of an individual fund fee rate that is based on an annual rate of .30% of the Fund's average net assets and an annualized group fee rate that averaged .25% during the period. The group fee rate is based upon the average net assets of all the mutual funds advised by the investment adviser, including any mutual funds previously advised by the investment adviser that are currently advised by Fidelity SelectCo, LLC, an affiliate of the investment adviser. The group fee rate decreases as assets under management increase and increases as assets under management decrease. In addition, the management fee is subject to a performance adjustment (up to a maximum of +/- .20% of the Fund's average net assets over a 36 month performance period). The upward or downward adjustment to the management fee is based on the relative investment performance of Series Blue Chip Growth as compared to its benchmark index, the Russell 1000 Growth Index, over the same 36 month performance period. For the reporting period, the total annual management fee rate, including the performance adjustment, was .54% of the Fund's average net assets. The performance adjustment included in the management fee rate may be higher or lower than the maximum performance adjustment rate due to the difference between the average net assets for the reporting and performance periods.
Transfer Agent Fees. Fidelity Investments Institutional Operations Company, Inc., (FIIOC), an affiliate of the investment adviser, is the transfer, dividend disbursing and shareholder servicing agent for each class of the Fund. FIIOC receives account fees and asset-based fees that vary according to the account size and type of account of the shareholders of Series Blue Chip Growth. FIIOC receives no fees for providing transfer agency services to Class F. FIIOC pays for typesetting, printing and mailing of shareholder reports, except proxy statements.
For the period, transfer agent fees for each applicable class were as follows:
| | Amount | % of Class-Level Average Net Assets |
| Series Blue Chip Growth | $3,952,469 | .16 |
Accounting and Security Lending Fees. Fidelity Service Company, Inc. (FSC), an affiliate of the investment adviser, maintains the Fund's accounting records. The accounting fee is based on the level of average net assets for each month. Under a separate contract, FSC administers the security lending program. The security lending fee is based on the number and duration of lending transactions.
Brokerage Commissions. The Fund placed a portion of its portfolio transactions with brokerage firms which are affiliates of the investment adviser. Brokerage commissions are included in net realized gain (loss) and change in net unrealized appreciation (depreciation) in the Statement of Operations. The commissions paid to these affiliated firms were $72,731 for the period.
Interfund Lending Program. Pursuant to an Exemptive Order issued by the SEC, the Fund, along with other registered investment companies having management contracts with FMR or other affiliated entities of FMR, may participate in an interfund lending program. This program provides an alternative credit facility allowing the funds to borrow from, or lend money to, other participating affiliated funds. At period end, there were no interfund loans outstanding. The Fund's activity in this program during the period for which loans were outstanding was as follows:
| Borrower or Lender | Average Loan Balance | Weighted Average Interest Rate | Interest Expense |
| Borrower | $54,514,074 | .49% | $20,227 |
Interfund Trades. The Fund may purchase from or sell securities to other Fidelity Funds under procedures adopted by the Board. The procedures have been designed to ensure these interfund trades are executed in accordance with Rule 17a-7 of the 1940 Act. Interfund trades are included within the respective purchases and sales amounts shown in the Purchases and Sales of Investments note.
6. Committed Line of Credit.
The Fund participates with other funds managed by the investment adviser or an affiliate in a $4.25 billion credit facility (the "line of credit") to be utilized for temporary or emergency purposes to fund shareholder redemptions or for other short-term liquidity purposes. The Fund has agreed to pay commitment fees on its pro-rata portion of the line of credit, which amounted to $12,668 and is reflected in Miscellaneous expenses on the Statement of Operations. During the period, the Fund did not borrow on this line of credit.
7. Security Lending.
The Fund lends portfolio securities from time to time in order to earn additional income. For equity securities, a lending agent is used and may loan securities to certain qualified borrowers, including Fidelity Capital Markets (FCM), a broker-dealer affiliated with the Fund. On the settlement date of the loan, the Fund receives collateral (in the form of U.S. Treasury obligations, letters of credit and/or cash) against the loaned securities and maintains collateral in an amount not less than 100% of the market value of the loaned securities during the period of the loan. The market value of the loaned securities is determined at the close of business of the Fund and any additional required collateral is delivered to the Fund on the next business day. The Fund or borrower may terminate the loan at any time, and if the borrower defaults on its obligation to return the securities loaned because of insolvency or other reasons, the Fund may apply collateral received from the borrower against the obligation. The Fund may experience delays and costs in recovering the securities loaned. Any cash collateral received is invested in the Fidelity Securities Lending Cash Central Fund. The value of loaned securities and cash collateral at period end are disclosed on the Fund's Statement of Assets and Liabilities. Security lending income represents the income earned on investing cash collateral, less rebates paid to borrowers plus any premium payments received for lending certain types of securities. Security lending income is presented in the Statement of Operations as a component of income from Fidelity Central Funds. During the period, there were no securities loaned to FCM.
8. Expense Reductions.
Commissions paid to certain brokers with whom the investment adviser, or its affiliates, places trades on behalf of the Fund include an amount in addition to trade execution, which may be rebated back to the Fund to offset certain expenses. This amount totaled $168,007 for the period.
In addition, during the period the investment adviser reimbursed and/or waived a portion of fund-level operating expenses in the amount of $46,166.
9. Distributions to Shareholders.
Distributions to shareholders of each class were as follows:
| | Year ended
July 31, 2016 | Year ended July 31, 2015 |
| From net investment income | | |
| Series Blue Chip Growth | $3,058,399 | $6,705,207 |
| Class F | 11,331,664 | 16,918,266 |
| Total | $14,390,063 | $23,623,473 |
| From net realized gain | | |
| Series Blue Chip Growth | $304,663,602 | $29,046,969 |
| Class F | 448,575,944 | 40,907,879 |
| Total | $753,239,546 | $69,954,848 |
10. Share Transactions.
Transactions for each class of shares were as follows:
| | Shares | Shares | Dollars | Dollars |
| | Year ended
July 31, 2016 | Year ended July 31, 2015 | Year ended
July 31, 2016 | Year ended July 31, 2015 |
| Series Blue Chip Growth | | | | |
| Shares sold | 22,878,098 | 26,920,810 | $250,290,391 | $331,819,807 |
| Reinvestment of distributions | 27,279,668 | 3,044,141 | 307,722,000 | 35,752,176 |
| Shares redeemed | (51,211,311) | (112,224,694) | (587,966,404) | (1,422,685,058) |
| Net increase (decrease) | (1,053,545) | (82,259,743) | $(29,954,013) | $(1,055,113,075) |
| Class F | | | | |
| Shares sold | 60,433,236 | 62,307,299 | $665,079,863 | $764,020,110 |
| Reinvestment of distributions | 40,774,349 | 4,922,720 | 459,907,607 | 57,826,145 |
| Shares redeemed | (77,352,051) | (174,704,050) | (876,890,353) | (2,218,383,695) |
| Net increase (decrease) | 23,855,534 | (107,474,031) | $248,097,117 | $(1,396,537,440) |
11. Other.
The Fund's organizational documents provide former and current trustees and officers with a limited indemnification against liabilities arising in connection with the performance of their duties to the Fund. In the normal course of business, the Fund may also enter into contracts that provide general indemnifications. The Fund's maximum exposure under these arrangements is unknown as this would be dependent on future claims that may be made against the Fund. The risk of material loss from such claims is considered remote.
At the end of the period, mutual funds managed by the investment adviser or its affiliates were the owners of record of all of the outstanding shares of the Fund.
Report of Independent Registered Public Accounting Firm
To the Trustees of Fidelity Securities Fund and Shareholders of Fidelity Series Blue Chip Growth Fund:
We have audited the accompanying statement of assets and liabilities of Fidelity Series Blue Chip Growth Fund (the Fund), a fund of Fidelity Securities Fund, including the schedule of investments, as of July 31, 2016, and the related statement of operations for the year then ended, the statement of changes in net assets for each of the two years in the period then ended, and the financial highlights for each of the two years in the period then ended and for the period from November 7, 2013 (commencement of operations) to July 31, 2014. These financial statements and financial highlights are the responsibility of the Fund's management. Our responsibility is to express an opinion on these financial statements and financial highlights based on our audits.
We conducted our audits in accordance with the standards of the Public Company Accounting Oversight Board (United States). Those standards require that we plan and perform the audit to obtain reasonable assurance about whether the financial statements and financial highlights are free of material misstatement. The Fund is not required to have, nor were we engaged to perform, an audit of its internal control over financial reporting. Our audits included consideration of internal control over financial reporting as a basis for designing audit procedures that are appropriate in the circumstances, but not for the purpose of expressing an opinion on the effectiveness of the Fund's internal control over financial reporting. Accordingly, we express no such opinion. An audit also includes examining, on a test basis, evidence supporting the amounts and disclosures in the financial statements, assessing the accounting principles used and significant estimates made by management, as well as evaluating the overall financial statement presentation. Our procedures included confirmation of securities owned as of July 31, 2016, by correspondence with the custodians and brokers; when replies were not received from brokers, we performed other auditing procedures. We believe that our audits provide a reasonable basis for our opinion.
In our opinion, such financial statements and financial highlights referred to above present fairly, in all material respects, the financial position of Fidelity Series Blue Chip Growth Fund as of July 31, 2016, the results of its operations for the year then ended, the changes in its net assets for each of the two years in the period then ended, and the financial highlights for each of the two years in the period then ended and for the period from November 7, 2013 (commencement of operations) to July 31, 2014, in conformity with accounting principles generally accepted in the United States of America.
DELOITTE & TOUCHE LLP
Boston, Massachusetts
September 20, 2016
Trustees and Officers
The Trustees, Members of the Advisory Board (if any), and officers of the trust and fund, as applicable, are listed below. The Board of Trustees governs the fund and is responsible for protecting the interests of shareholders. The Trustees are experienced executives who meet periodically throughout the year to oversee the fund's activities, review contractual arrangements with companies that provide services to the fund, oversee management of the risks associated with such activities and contractual arrangements, and review the fund's performance. Each of the Trustees oversees 170 funds.
The Trustees hold office without limit in time except that (a) any Trustee may resign; (b) any Trustee may be removed by written instrument, signed by at least two-thirds of the number of Trustees prior to such removal; (c) any Trustee who requests to be retired or who has become incapacitated by illness or injury may be retired by written instrument signed by a majority of the other Trustees; and (d) any Trustee may be removed at any special meeting of shareholders by a two-thirds vote of the outstanding voting securities of the trust. Each Trustee who is not an interested person (as defined in the 1940 Act) of the trust and the fund is referred to herein as an Independent Trustee. Each Independent Trustee shall retire not later than the last day of the calendar year in which his or her 75th birthday occurs. The Independent Trustees may waive this mandatory retirement age policy with respect to individual Trustees. Officers and Advisory Board Members hold office without limit in time, except that any officer or Advisory Board Member may resign or may be removed by a vote of a majority of the Trustees at any regular meeting or any special meeting of the Trustees. Except as indicated, each individual has held the office shown or other offices in the same company for the past five years.
The fund’s Statement of Additional Information (SAI) includes more information about the Trustees. To request a free copy, call Fidelity at 1-800-544-8544 for Fidelity Series Blue Chip Growth Fund, or 1-800-835-5092 for Class F.
Experience, Skills, Attributes, and Qualifications of the Trustees. The Governance and Nominating Committee has adopted a statement of policy that describes the experience, qualifications, attributes, and skills that are necessary and desirable for potential Independent Trustee candidates (Statement of Policy). The Board believes that each Trustee satisfied at the time he or she was initially elected or appointed a Trustee, and continues to satisfy, the standards contemplated by the Statement of Policy. The Governance and Nominating Committee also engages professional search firms to help identify potential Independent Trustee candidates who have the experience, qualifications, attributes, and skills consistent with the Statement of Policy. From time to time, additional criteria based on the composition and skills of the current Independent Trustees, as well as experience or skills that may be appropriate in light of future changes to board composition, business conditions, and regulatory or other developments, have also been considered by the professional search firms and the Governance and Nominating Committee. In addition, the Board takes into account the Trustees' commitment and participation in Board and committee meetings, as well as their leadership of standing and ad hoc committees throughout their tenure.
In determining that a particular Trustee was and continues to be qualified to serve as a Trustee, the Board has considered a variety of criteria, none of which, in isolation, was controlling. The Board believes that, collectively, the Trustees have balanced and diverse experience, qualifications, attributes, and skills, which allow the Board to operate effectively in governing the fund and protecting the interests of shareholders. Information about the specific experience, skills, attributes, and qualifications of each Trustee, which in each case led to the Board's conclusion that the Trustee should serve (or continue to serve) as a trustee of the fund, is provided below.
Board Structure and Oversight Function. James C. Curvey is an interested person and currently serves as Chairman. The Trustees have determined that an interested Chairman is appropriate and benefits shareholders because an interested Chairman has a personal and professional stake in the quality and continuity of services provided to the fund. Independent Trustees exercise their informed business judgment to appoint an individual of their choosing to serve as Chairman, regardless of whether the Trustee happens to be independent or a member of management. The Independent Trustees have determined that they can act independently and effectively without having an Independent Trustee serve as Chairman and that a key structural component for assuring that they are in a position to do so is for the Independent Trustees to constitute a substantial majority for the Board. The Independent Trustees also regularly meet in executive session. Ned C. Lautenbach serves as Chairman of the Independent Trustees and as such (i) acts as a liaison between the Independent Trustees and management with respect to matters important to the Independent Trustees and (ii) with management prepares agendas for Board meetings.
Fidelity® funds are overseen by different Boards of Trustees. The fund's Board oversees Fidelity's high income and certain equity funds, and other Boards oversee Fidelity's investment-grade bond, money market, asset allocation, and sector funds. The asset allocation funds may invest in Fidelity® funds overseen by the fund's Board. The use of separate Boards, each with its own committee structure, allows the Trustees of each group of Fidelity® funds to focus on the unique issues of the funds they oversee, including common research, investment, and operational issues. On occasion, the separate Boards establish joint committees to address issues of overlapping consequences for the Fidelity® funds overseen by each Board.
The Trustees operate using a system of committees to facilitate the timely and efficient consideration of all matters of importance to the Trustees, the fund, and fund shareholders and to facilitate compliance with legal and regulatory requirements and oversight of the fund's activities and associated risks. The Board, acting through its committees, has charged FMR and its affiliates with (i) identifying events or circumstances the occurrence of which could have demonstrably adverse effects on the fund's business and/or reputation; (ii) implementing processes and controls to lessen the possibility that such events or circumstances occur or to mitigate the effects of such events or circumstances if they do occur; and (iii) creating and maintaining a system designed to evaluate continuously business and market conditions in order to facilitate the identification and implementation processes described in (i) and (ii) above. Because the day-to-day operations and activities of the fund are carried out by or through FMR, its affiliates, and other service providers, the fund's exposure to risks is mitigated but not eliminated by the processes overseen by the Trustees. While each of the Board's committees has responsibility for overseeing different aspects of the fund's activities, oversight is exercised primarily through the Operations, Audit, and Compliance Committees. In addition, the Independent Trustees have worked with FMR to enhance the Board's oversight of investment and financial risks, legal and regulatory risks, technology risks, and operational risks, including the development of additional risk reporting to the Board. For example, a working group comprised of Independent Trustees and FMR has worked and continues to work to review the Fidelity® funds' valuation-related activities, reporting and risk management. Appropriate personnel, including but not limited to the fund's Chief Compliance Officer (CCO), FMR's internal auditor, the independent accountants, the fund's Treasurer and portfolio management personnel, make periodic reports to the Board's committees, as appropriate, including an annual review of Fidelity's risk management program for the Fidelity® funds. The responsibilities of each standing committee, including their oversight responsibilities, are described further under "Standing Committees of the Trustees."
Interested Trustees*:
Correspondence intended for a Trustee who is an interested person may be sent to Fidelity Investments, 245 Summer Street, Boston, Massachusetts 02210.
Name, Year of Birth; Principal Occupations and Other Relevant Experience+
James C. Curvey (1935)
Year of Election or Appointment: 2007
Trustee
Chairman of the Board of Trustees
Mr. Curvey also serves as Trustee of other Fidelity® funds. Mr. Curvey is a Director of Fidelity Research & Analysis Co. (investment adviser firm, 2009-present), and Vice Chairman (2007-present) and Director of FMR LLC (diversified financial services company). In addition, Mr. Curvey serves as an Overseer for the Boston Symphony Orchestra and a member of the board of Artis-Naples, Naples, Florida, and as a Trustee for Brewster Academy, Wolfeboro, New Hampshire. Previously, Mr. Curvey served as a Director of Fidelity Investments Money Management, Inc. (investment adviser firm, 2009-2014) and a Director of FMR and FMR Co., Inc. (investment adviser firms, 2007-2014).
Charles S. Morrison (1960)
Year of Election or Appointment: 2014
Trustee
Mr. Morrison also serves as Trustee of other funds. He serves as a Director of Fidelity Investments Money Management, Inc. (FIMM) (investment adviser firm, 2014-present), Director of Fidelity SelectCo, LLC (investment adviser firm, 2014-present), President, Asset Management (2014-present), and is an employee of Fidelity Investments. Previously, Mr. Morrison served as Vice President of Fidelity's Fixed Income and Asset Allocation Funds (2012-2014), President, Fixed Income (2011-2014), Vice President of Fidelity's Money Market Funds (2005-2009), President, Money Market Group Leader of FMR (investment adviser firm, 2009), and Senior Vice President, Money Market Group of FMR (2004-2009). Mr. Morrison also served as Vice President of Fidelity's Bond Funds (2002-2005), certain Balanced Funds (2002-2005), and certain Asset Allocation Funds (2002-2007), and as Senior Vice President (2002-2005) of Fidelity's Bond Division.
* Determined to be an “Interested Trustee” by virtue of, among other things, his or her affiliation with the trust or various entities under common control with FMR.
+ The information includes the Trustee's principal occupation during the last five years and other information relating to the experience, attributes, and skills relevant to the Trustee's qualifications to serve as a Trustee, which led to the conclusion that the Trustee should serve as a Trustee for the fund.
Independent Trustees:
Correspondence intended for an Independent Trustee may be sent to Fidelity Investments, P.O. Box 55235, Boston, Massachusetts 02205-5235.
Name, Year of Birth; Principal Occupations and Other Relevant Experience+
Dennis J. Dirks (1948)
Year of Election or Appointment: 2005
Trustee
Mr. Dirks also serves as Trustee of other Fidelity® funds. Prior to his retirement in May 2003, Mr. Dirks was Chief Operating Officer and a member of the Board of The Depository Trust & Clearing Corporation (DTCC). He also served as President, Chief Operating Officer, and Board member of The Depository Trust Company (DTC) and President and Board member of the National Securities Clearing Corporation (NSCC). In addition, Mr. Dirks served as Chief Executive Officer and Board member of the Government Securities Clearing Corporation, Chief Executive Officer and Board member of the Mortgage-Backed Securities Clearing Corporation, as a Trustee and a member of the Finance Committee of Manhattan College (2005-2008), as a Trustee and a member of the Finance Committee of AHRC of Nassau County (2006-2008), and as a member of the Independent Directors Council (IDC) Governing Council (2010-2015). Mr. Dirks is a member of the Board of Directors for The Brookville Center for Children's Services, Inc. (2009-present).
Alan J. Lacy (1953)
Year of Election or Appointment: 2008
Trustee
Mr. Lacy also serves as Trustee of other Fidelity® funds. Mr. Lacy serves as Chairman (2014-present) and a member (2010-present) of the Board of Directors of Dave & Buster's Entertainment, Inc. (restaurant and entertainment complexes) and a Director of Bristol-Myers Squibb Company (global pharmaceuticals, 2008-present). He is a Trustee of the California Chapter of The Nature Conservancy (2015-present) and a Director of the Center for Advanced Study in the Behavioral Sciences at Stanford University (2015-present). In addition, Mr. Lacy served as Senior Adviser (2007-2014) of Oak Hill Capital Partners, L.P. (private equity) and also served as Chief Executive Officer (2005) and Vice Chairman (2005-2006) of Sears Holdings Corporation (retail) and Chief Executive Officer and Chairman of the Board of Sears, Roebuck and Co. (retail, 2000-2005). Previously, Mr. Lacy served as Chairman (2008-2011) and a member (2006-2015) of the Board of Trustees of the National Parks Conservation Association and as a member of the Board of Directors for The Western Union Company (global money transfer, 2006-2011), The Hillman Companies, Inc. (hardware wholesalers, 2010-2014), and Earth Fare, Inc. (retail grocery, 2010-2014).
Ned C. Lautenbach (1944)
Year of Election or Appointment: 2000
Trustee
Chairman of the Independent Trustees
Mr. Lautenbach also serves as Trustee of other Fidelity® funds. Mr. Lautenbach currently serves as the Lead Director of the Eaton Corporation Board of Directors (diversified industrial, 1997-present). Mr. Lautenbach is Chairman of the Board of Directors of Artis-Naples in Naples, Florida (2012-present), a member of the Council on Foreign Relations (1994-present), and a member of the Board of Governors, State University System of Florida (2013-present). Previously, Mr. Lautenbach was a Partner/Advisory Partner at Clayton, Dubilier & Rice, LLC (private equity investment, 1998-2010), as well as a Director of Sony Corporation (2006-2007).
Joseph Mauriello (1944)
Year of Election or Appointment: 2008
Trustee
Mr. Mauriello also serves as Trustee of other Fidelity® funds. Prior to his retirement in January 2006, Mr. Mauriello served in numerous senior management positions including Deputy Chairman and Chief Operating Officer (2004-2005), and Vice Chairman of Financial Services (2002-2004) of KPMG LLP US (professional services, 1965-2005). Mr. Mauriello currently serves as a member of the Board of Directors of XL Group plc. (global insurance and re-insurance, 2006-present) and the Independent Directors Council (IDC) Governing Council (2015-present). Previously, Mr. Mauriello served as a Director of the Hamilton Funds of the Bank of New York (2006-2007) and of Arcadia Resources Inc. (health care services and products, 2007-2012).
Robert W. Selander (1950)
Year of Election or Appointment: 2011
Trustee
Mr. Selander also serves as Trustee of other Fidelity® funds. Mr. Selander serves as a Director of The Western Union Company (global money transfer, 2014-present) and a non-executive Chairman of Health Equity, Inc. (health savings custodian, 2015-present). Previously, Mr. Selander served as a Member of the Advisory Board of certain Fidelity® funds (2011), and Executive Vice Chairman (2010), Chief Executive Officer (2009-2010), and President and Chief Executive Officer (1997-2009) of Mastercard, Inc.
Cornelia M. Small (1944)
Year of Election or Appointment: 2005
Trustee
Ms. Small also serves as Trustee of other Fidelity® funds. Ms. Small is a member of the Board of Directors (2009-present) and Chair of the Investment Committee (2010-present) of the Teagle Foundation. Ms. Small also serves on the Investment Committee of the Berkshire Taconic Community Foundation (2008-present). Previously, Ms. Small served as Chairperson (2002-2008) and a member of the Investment Committee and Chairperson (2008-2012) and a member of the Board of Trustees of Smith College. In addition, Ms. Small served as Chief Investment Officer, Director of Global Equity Investments, and a member of the Board of Directors of Scudder, Stevens & Clark and Scudder Kemper Investments.
William S. Stavropoulos (1939)
Year of Election or Appointment: 2002
Trustee
Vice Chairman of the Independent Trustees
Mr. Stavropoulos also serves as Trustee of other Fidelity® funds. Mr. Stavropoulos serves as President and Founder of the Michigan Baseball Foundation, the Great Lakes Loons (2007-present). Mr. Stavropoulos is Chairman Emeritus of the Board of Directors of The Dow Chemical Company, where he previously served in numerous senior management positions, including President, CEO (1995-2000; 2002-2004), Chairman of the Executive Committee (2000-2006), and as a member of the Board of Directors (1990-2006). Currently, Mr. Stavropoulos is Chairman of the Board of Directors of Univar Inc. (global distributor of commodity and specialty chemicals), a Director of Teradata Corporation (data warehousing and technology solutions), and Maersk Inc. (industrial conglomerate), and a member of the Advisory Board for Metalmark Capital LLC (private equity investment, 2005-present). Mr. Stavropoulos is an operating advisor to Clayton, Dubilier & Rice, LLC (private equity investment). In addition, Mr. Stavropoulos is a member of the University of Notre Dame Advisory Council for the College of Science, a Trustee of the Rollin L. Gerstacker Foundation, and a Director of the Naples Philharmonic Center for the Arts. Previously, Mr. Stavropoulos served as a Director of Chemical Financial Corporation (bank holding company, 1993-2012) and Tyco International, Ltd. (multinational manufacturing and services, 2007-2012).
David M. Thomas (1949)
Year of Election or Appointment: 2008
Trustee
Mr. Thomas also serves as Trustee of other Fidelity® funds. Mr. Thomas serves as Non-Executive Chairman of the Board of Directors of Fortune Brands Home and Security (home and security products, 2011-present), as a member of the Board of Directors (2004-present) and Presiding Director (2013-present) of Interpublic Group of Companies, Inc. (marketing communication), and as a member of the Board of Trustees of the University of Florida (2013-present). Previously, Mr. Thomas served as Executive Chairman (2005-2006) and Chairman and Chief Executive Officer (2000-2005) of IMS Health, Inc. (pharmaceutical and healthcare information solutions), and a Director of Fortune Brands, Inc. (consumer products, 2000-2011).
+ The information includes the Trustee's principal occupation during the last five years and other information relating to the experience, attributes, and skills relevant to the Trustee's qualifications to serve as a Trustee, which led to the conclusion that the Trustee should serve as a Trustee for the fund.
Advisory Board Members and Officers:
Correspondence intended for an officer or Peter S. Lynch may be sent to Fidelity Investments, 245 Summer Street, Boston, Massachusetts 02210. Officers appear below in alphabetical order.
Name, Year of Birth; Principal Occupation
Peter S. Lynch (1944)
Year of Election or Appointment: 2003
Member of the Advisory Board
Mr. Lynch also serves as Member of the Advisory Board of other Fidelity® funds. Mr. Lynch is Vice Chairman and a Director of FMR (investment adviser firm) and FMR Co., Inc. (investment adviser firm). In addition, Mr. Lynch serves as a Trustee of Boston College and as the Chairman of the Inner-City Scholarship Fund. Previously, Mr. Lynch served on the Special Olympics International Board of Directors (1997-2006).
Marc R. Bryant (1966)
Year of Election or Appointment: 2015
Secretary and Chief Legal Officer (CLO)
Mr. Bryant also serves as Secretary and CLO of other funds. Mr. Bryant serves as CLO, Secretary, and Senior Vice President of Fidelity Management & Research Company (investment adviser firm, 2015-present) and FMR Co., Inc. (investment adviser firm, 2015-present); Secretary of Fidelity SelectCo, LLC (investment adviser firm, 2015-present) and Fidelity Investments Money Management, Inc. (investment adviser firm, 2015-present); and CLO of Fidelity Management & Research (Hong Kong) Limited and FMR Investment Management (U.K.) Limited (investment adviser firms, 2015-present) and Fidelity Management & Research (Japan) Limited (investment adviser firm, 2016-present). He is Senior Vice President and Deputy General Counsel of FMR LLC (diversified financial services company). Previously, Mr. Bryant served as Secretary and CLO of Fidelity Rutland Square Trust II (2010-2014) and Assistant Secretary of Fidelity's Fixed Income and Asset Allocation Funds (2013-2015). Prior to joining Fidelity Investments, Mr. Bryant served as a Senior Vice President and the Head of Global Retail Legal for AllianceBernstein L.P. (2006-2010), and as the General Counsel for ProFund Advisors LLC (2001-2006).
Jeffrey S. Christian (1961)
Year of Election or Appointment: 2016
Assistant Treasurer
Mr. Christian also serves as Assistant Treasurer of other funds. Mr. Christian is an employee of Fidelity Investments (2003-present).
William C. Coffey (1969)
Year of Election or Appointment: 2009
Assistant Secretary
Mr. Coffey also serves as Assistant Secretary of other funds. He is Senior Vice President and Deputy General Counsel of FMR LLC (diversified financial services company, 2010-present), and is an employee of Fidelity Investments. Previously, Mr. Coffey served as Vice President and Associate General Counsel of FMR LLC (2005-2009).
Jonathan Davis (1968)
Year of Election or Appointment: 2010
Assistant Treasurer
Mr. Davis also serves as Assistant Treasurer of other funds, and is an employee of Fidelity Investments. Previously, Mr. Davis served as Vice President and Associate General Counsel of FMR LLC (diversified financial services company, 2003-2010).
Adrien E. Deberghes (1967)
Year of Election or Appointment: 2016
Assistant Treasurer
Mr. Deberghes also serves as an officer of other funds. He serves as Executive Vice President of Fidelity Investments Money Management, Inc. (FIMM) (investment adviser firm, 2016-present) and is an employee of Fidelity Investments (2008-present). Prior to joining Fidelity Investments, Mr. Deberghes was Senior Vice President of Mutual Fund Administration at State Street Corporation (2007-2008), Senior Director of Mutual Fund Administration at Investors Bank & Trust (2005-2007), and Director of Finance for Dunkin' Brands (2000-2005). Previously, Mr. Deberghes served in other fund officer roles.
Stephanie J. Dorsey (1969)
Year of Election or Appointment: 2010
Assistant Treasurer
Ms. Dorsey also serves as an officer of other funds. She is an employee of Fidelity Investments (2008-present) and has served in other fund officer roles. Prior to joining Fidelity Investments, Ms. Dorsey served as Treasurer (2004-2008) of the JPMorgan Mutual Funds and Vice President (2004-2008) of JPMorgan Chase Bank.
Howard J. Galligan III (1966)
Year of Election or Appointment: 2014
Chief Financial Officer
Mr. Galligan also serves as Chief Financial Officer of other funds. Mr. Galligan serves as President of Fidelity Pricing and Cash Management Services (FPCMS) (2014-present) and as a Director of Strategic Advisers, Inc. (investment adviser firm, 2008-present). Previously, Mr. Galligan served as Chief Administrative Officer of Asset Management (2011-2014) and Chief Operating Officer and Senior Vice President of Investment Support for Strategic Advisers, Inc. (2003-2011).
Scott C. Goebel (1968)
Year of Election or Appointment: 2015
Vice President
Mr. Goebel serves as Vice President of other funds and is an employee of Fidelity Investments (2001-present). Mr. Goebel serves as Senior Vice President of Fidelity Management & Research Company (FMR) (investment adviser firm, 2016-present). Previously, Mr. Goebel served as Secretary of Fidelity SelectCo, LLC (investment adviser firm, 2013-2015), Fidelity Investments Money Management, Inc. (FIMM) (investment adviser firm, 2010-2015), and Fidelity Research and Analysis Company (FRAC) (investment adviser firm, 2010-2015); General Counsel, Secretary, and Senior Vice President of FMR (investment adviser firm, 2008-2015) and FMR Co., Inc. (investment adviser firm, 2008-2015); Assistant Secretary of Fidelity Management & Research (Japan) Limited (investment adviser firm, 2008-2015) and Fidelity Management & Research (U.K.) Inc. (investment adviser firm, 2008-2015); Chief Legal Officer (CLO) of Fidelity Management & Research (Hong Kong) Limited (investment adviser firm, 2008-2015); Secretary and CLO of certain Fidelity® funds (2008-2015); Assistant Secretary of FIMM (2008-2010), FRAC (2008-2010), and certain funds (2007-2008); and as Vice President and Secretary of Fidelity Distributors Corporation (FDC) (2005-2007).
Brian B. Hogan (1964)
Year of Election or Appointment: 2009
Vice President
Mr. Hogan also serves as Trustee or Vice President of other funds. Mr. Hogan serves as a Director of FMR Investment Management (U.K.) Limited (investment adviser firm, 2015-present) and Fidelity SelectCo, LLC (investment adviser firm, 2014-present) and President of the Equity Division of FMR (investment adviser firm, 2009-present). Previously, Mr. Hogan served as Senior Vice President, Equity Research of FMR (2006-2009) and as a portfolio manager. Mr. Brian B. Hogan is not related to Mr. Colm A. Hogan.
Colm A. Hogan (1973)
Year of Election or Appointment: 2016
Deputy Treasurer
Mr. Hogan also serves as an officer of other funds. Mr. Hogan is an employee of Fidelity Investments (2005-present). Mr. Colm A. Hogan is not related to Mr. Brian B. Hogan.
Chris Maher (1972)
Year of Election or Appointment: 2013
Assistant Treasurer
Mr. Maher serves as Assistant Treasurer of other funds. Mr. Maher is Vice President of Valuation Oversight and is an employee of Fidelity Investments. Previously, Mr. Maher served as Vice President of Asset Management Compliance (2013), Vice President of the Program Management Group of FMR (investment adviser firm, 2010-2013), and Vice President of Valuation Oversight (2008-2010).
John F. Papandrea (1972)
Year of Election or Appointment: 2016
Anti-Money Laundering (AML) Officer
Mr. Papandrea also serves as AML Officer of other funds. Mr. Papandrea is Vice President of FMR LLC (diversified financial services company, 2008-present) and is an employee of Fidelity Investments (2005-present).
Melissa M. Reilly (1971)
Year of Election or Appointment: 2014
Vice President of certain Equity Funds
Ms. Reilly also serves as Vice President of other funds. Ms. Reilly is an employee of Fidelity Investments (2004-present).
Kenneth B. Robins (1969)
Year of Election or Appointment: 2016
Chief Compliance Officer
Mr. Robins also serves as an officer of other funds. Mr. Robins serves as Compliance Officer of Fidelity Management & Research Company and FMR Co., Inc. (investment adviser firms, 2016-present) and is an employee of Fidelity Investments (2004-present). Previously, Mr. Robins served as Executive Vice President of Fidelity Investments Money Management, Inc. (investment adviser firm, 2013-2016) and served in other fund officer roles.
Stacie M. Smith (1974)
Year of Election or Appointment: 2016
President and Treasurer
Ms. Smith also serves as an officer of other funds. She is an employee of Fidelity Investments (2009-present) and has served in other fund officer roles. Prior to joining Fidelity Investments, Ms. Smith served as Senior Audit Manager of Ernst & Young LLP (1996-2009). Previously, Ms. Smith served as Deputy Treasurer of certain Fidelity® funds (2013-2016).
Renee Stagnone (1975)
Year of Election or Appointment: 2016
Assistant Treasurer
Ms. Stagnone also serves as an officer of other funds. Ms. Stagnone is an employee of Fidelity Investments (1997-present). Previously, Ms. Stagnone served as Deputy Treasurer of certain Fidelity® funds (2013-2016).
Shareholder Expense Example
As a shareholder of the Fund, you incur two types of costs: (1) transaction costs, and (2) ongoing costs, including management fees and other Fund expenses. This Example is intended to help you understand your ongoing costs (in dollars) of investing in the Fund and to compare these costs with the ongoing costs of investing in other mutual funds.
The Example is based on an investment of $1,000 invested at the beginning of the period and held for the entire period (February 1, 2016 to July 31, 2016).
Actual Expenses
The first line of the accompanying table for each class of the Fund provides information about actual account values and actual expenses. You may use the information in this line, together with the amount you invested, to estimate the expenses that you paid over the period. Simply divide your account value by $1,000.00 (for example, an $8,600 account value divided by $1,000.00 = 8.6), then multiply the result by the number in the first line for a class of the Fund under the heading entitled "Expenses Paid During Period" to estimate the expenses you paid on your account during this period. In addition, the Fund, as a shareholder in the underlying Fidelity Central Funds, will indirectly bear its pro-rata share of the fees and expenses incurred by the underlying Fidelity Central Funds. These fees and expenses are not included in the Fund's annualized expense ratio used to calculate the expense estimate in the table below.
Hypothetical Example for Comparison Purposes
The second line of the accompanying table for each class of the Fund provides information about hypothetical account values and hypothetical expenses based on a Class' actual expense ratio and an assumed rate of return of 5% per year before expenses, which is not the Class' actual return. The hypothetical account values and expenses may not be used to estimate the actual ending account balance or expenses you paid for the period. You may use this information to compare the ongoing costs of investing in the Fund and other funds. To do so, compare this 5% hypothetical example with the 5% hypothetical examples that appear in the shareholder reports of the other funds. In addition, the Fund, as a shareholder in the underlying Fidelity Central Funds, will indirectly bear its pro-rata share of the fees and expenses incurred by the underlying Fidelity Central Funds. These fees and expenses are not included in the Fund's annualized expense ratio used to calculate the expense estimate in the table below.
Please note that the expenses shown in the table are meant to highlight your ongoing costs only and do not reflect any transaction costs. Therefore, the second line of the table is useful in comparing ongoing costs only, and will not help you determine the relative total costs of owning different funds.
| | Annualized Expense Ratio-A | Beginning
Account Value
February 1, 2016 | Ending
Account Value
July 31, 2016 | Expenses Paid
During Period-B
February 1, 2016
to July 31, 2016 |
| Series Blue Chip Growth | .65% | | | |
| Actual | | $1,000.00 | $1,099.70 | $3.39 |
| Hypothetical-C | | $1,000.00 | $1,021.63 | $3.27 |
| Class F | .49% | | | |
| Actual | | $1,000.00 | $1,100.70 | $2.56 |
| Hypothetical-C | | $1,000.00 | $1,022.43 | $2.46 |
A Annualized expense ratio reflects expenses net of applicable fee waivers.
B Expenses are equal to each Class' annualized expense ratio, multiplied by the average account value over the period, multiplied by 182/366 (to reflect the one-half year period).
C 5% return per year before expenses
Distributions (Unaudited)
Fidelity Series Blue Chip Growth Fund hereby designates as a capital gain dividend with respect to the taxable year ended July 31, 2016, $98,533,246, or, if subsequently determined to be different, the net capital gain of such year.
Series Blue Chip Growth designates 79% and 100%; Class F designates 68% and 91% of the dividends distributed in September and December, respectively during the fiscal year as qualifying for the dividends–received deduction for corporate shareholders.
Series Blue Chip Growth designates 90% and 100%; Class F designates 77% and 94% of the dividends distributed in September and December, respectively during the fiscal year as amounts which may be taken into account as a dividend for purposes of the maximum rate under section 1(h)(11) of the Internal Revenue Code.
The fund will notify shareholders in January 2017 of amounts for use in preparing 2016 income tax returns.
Board Approval of Investment Advisory Contracts and Management Fees
Fidelity Series Blue Chip Growth Fund
Each year, the Board of Trustees, including the Independent Trustees (together, the Board), votes on the renewal of the management contract with Fidelity Management & Research Company (FMR) and the sub-advisory agreements (together, the Advisory Contracts) for the fund. The Board, assisted by the advice of fund counsel and Independent Trustees' counsel, requests and considers a broad range of information relevant to the renewal of the Advisory Contracts throughout the year.
The Board meets regularly and, at each of its meetings, covers an extensive agenda of topics and materials and considers factors that are relevant to its annual consideration of the renewal of the fund's Advisory Contracts, including the services and support provided to the fund and its shareholders. The Board has established various standing committees (Committees), each composed of and chaired by Independent Trustees with varying backgrounds, to which the Board has assigned specific subject matter responsibilities in order to enhance effective decision-making by the Board. The Board, acting directly and through its Committees, requests and receives information concerning the annual consideration of the renewal of the fund's Advisory Contracts. The Board also meets as needed to consider matters specifically related to the Board's annual consideration of the renewal of the Advisory Contracts. Members of the Board may also meet with trustees of other Fidelity funds through ad hoc joint committees to discuss certain matters relevant to all of the Fidelity funds.
At its July 2016 meeting, the Board unanimously determined to renew the fund's Advisory Contracts. In reaching its determination, the Board considered all factors it believed relevant, including (i) the nature, extent, and quality of the services to be provided to the fund and its shareholders (including the investment performance of the fund); (ii) the competitiveness of the fund's management fee and total expense ratio relative to peer funds; (iii) the total costs of the services to be provided by and the profits to be realized by Fidelity from its relationships with the fund; and (iv) the extent to which, if any, economies of scale exist and would be realized as the fund grows, and whether any economies of scale are appropriately shared with fund shareholders.
In considering whether to renew the Advisory Contracts for the fund, the Board reached a determination, with the assistance of fund counsel and Independent Trustees' counsel and through the exercise of its business judgment, that the renewal of the Advisory Contracts was in the best interests of the fund and its shareholders and that the compensation payable under the Advisory Contracts was fair and reasonable. The Board's decision to renew the Advisory Contracts was not based on any single factor, but rather was based on a comprehensive consideration of all the information provided to the Board at its meetings throughout the year. The Board, in reaching its determination to renew the Advisory Contracts, was aware that shareholders of the fund have a broad range of investment choices available to them, including a wide choice among funds offered by Fidelity's competitors, and that the fund's shareholders, who have the opportunity to review and weigh the disclosure provided by the fund in its prospectus and other public disclosures, have chosen to invest in this fund, which is part of the Fidelity family of funds.
Nature, Extent, and Quality of Services Provided. The Board considered Fidelity's staffing as it relates to the fund, including the backgrounds of investment personnel of Fidelity, and also considered the fund's investment objective, strategies, and related investment philosophy. The Independent Trustees also had discussions with senior management of Fidelity's investment operations and investment groups. The Board considered the structure of the investment personnel compensation program and whether this structure provides appropriate incentives to act in the best interests of the fund. Additionally, the Board considered the portfolio managers' investments, if any, in the funds that they manage.
Resources Dedicated to Investment Management and Support Services. The Board and the Fund Oversight and Research Committees reviewed the general qualifications and capabilities of Fidelity's investment staff, including its size, education, experience, and resources, as well as Fidelity's approach to recruiting, training, managing, and compensating investment personnel. The Board noted that Fidelity has continued to increase the resources devoted to non-U.S. offices, including expansion of Fidelity's global investment organization. The Board also noted that Fidelity's analysts have extensive resources, tools and capabilities that allow them to conduct sophisticated quantitative and fundamental analysis, as well as credit analysis of issuers, counterparties and guarantors. Further, the Board considered that Fidelity's investment professionals have sufficient access to global information and data so as to provide competitive investment results over time, and that those professionals also have access to sophisticated tools that permit them to assess portfolio construction and risk and performance attribution characteristics continuously, as well as to transmit new information and research conclusions rapidly around the world. Additionally, in its deliberations, the Board considered Fidelity's trading, risk management, compliance, and technology and operations capabilities and resources, which are integral parts of the investment management process.
Shareholder and Administrative Services. The Board considered (i) the nature, extent, quality, and cost of advisory, administrative, and shareholder services performed by FMR, the sub-advisers (together with FMR, the Investment Advisers), and their affiliates under the Advisory Contracts and under separate agreements covering transfer agency, pricing and bookkeeping, and securities lending services for the fund; (ii) the nature and extent of the supervision of third party service providers, principally custodians, subcustodians, and pricing vendors; and (iii) the resources devoted to, and the record of compliance with, the fund's compliance policies and procedures. The Board also reviewed the allocation of fund brokerage, including allocations to brokers affiliated with the Investment Advisers, the use of brokerage commissions to pay fund expenses, and the use of "soft" commission dollars to pay for research services.
The Board noted that the growth of fund assets over time across the complex allows Fidelity to reinvest in the development of services designed to enhance the value or convenience of the Fidelity funds as investment vehicles. These services include 24-hour access to account information and market information through telephone representatives and over the Internet, investor education materials and asset allocation tools, and the expanded availability of Fidelity Investor Centers.
In 2014, the Board formed an ad hoc Committee on Transfer Agency Fees to review the variety of transfer agency fee structures throughout the industry and Fidelity's competitive positioning with respect to industry participants.
Investment in a Large Fund Family. The Board considered the benefits to shareholders of investing in a Fidelity fund, including the benefits of investing in a fund that is part of a large family of funds offering a variety of investment disciplines and providing a large variety of mutual fund investor services. The Board noted that Fidelity had taken, or had made recommendations that resulted in the Fidelity funds taking, a number of actions over the previous year that benefited particular funds, including: (i) continuing to dedicate additional resources to investment research and to the support of the senior management team that oversees asset management; (ii) continuing efforts to enhance Fidelity's global research capabilities; (iii) launching new funds and making other enhancements to meet client needs; (iv) broadening eligibility requirements for certain lower-priced share classes of, and streamlining the fee structure for, certain existing equity index funds; (v) lowering expense caps for certain existing funds and classes to reduce expenses paid by shareholders; (vi) eliminating redemption fees for certain variable insurance product funds and classes; (vii) continuing to launch dedicated lower cost underlying funds to meet portfolio construction needs related to expanding underlying fund options for Fidelity funds of funds, specifically for the Freedom Fund product lines; (viii) launching a lower cost share class for use by the Freedom Index Fund product line; (ix) rationalizing product lines and gaining increased efficiencies through fund mergers and share class consolidations; (x) continuing to develop, acquire and implement systems and technology to improve services to the funds and shareholders, strengthen information security, and increase efficiency; (xi) implementing investment enhancements to further strengthen Fidelity's target date product line to increase investors' probability of success in achieving their goals; (xii) accelerating the conversion of all remaining Class B shares to Class A shares, which have a lower expense structure; and (xiii) implementing changes to Fidelity's money market fund product line in response to recent regulatory reforms.
Investment Performance. The Board considered whether the fund has operated in accordance with its investment objective, as well as its record of compliance with its investment restrictions and its performance history.
The Board took into account discussions with representatives of the Investment Advisers about fund investment performance that occur at Board meetings throughout the year. In this regard the Board noted that as part of regularly scheduled fund reviews and other reports to the Board on fund performance, the Board considers annualized return information for the fund, for different time periods, measured against a securities market index ("benchmark index") and a peer group of funds with similar objectives ("peer group"), if any. In its evaluation of fund investment performance, the Board gave particular attention to information indicating changes in performance of certain Fidelity funds for specific time periods and discussed with the Investment Advisers the reasons for any overperformance or underperformance.
In addition to reviewing absolute and relative fund performance, the Independent Trustees periodically consider the appropriateness of fund performance metrics in evaluating the results achieved. In general, the Independent Trustees believe that fund performance should be evaluated based on net performance (after fees and expenses) of both the highest performing and lowest performing fund share classes, where applicable, compared to appropriate benchmark indices, over appropriate time periods that may include full market cycles, and compared to peer groups, as applicable, over the same periods, taking into account relevant factors including the following: general market conditions; issuer-specific information; and fund cash flows and other factors.
The Independent Trustees recognize that shareholders evaluate performance on a net basis over their own holding periods, for which one-, three-, and five-year periods are often used as a proxy. For this reason, the performance information reviewed by the Board also included net cumulative calendar year total return information for the fund and an appropriate benchmark index and peer group for the most recent one-year period, as shown below. Returns are shown compared to the 25th percentile (top of box, 75% beaten) and 75th percentile (bottom of box, 25% beaten) of the peer universe.
Fidelity Series Blue Chip Growth Fund
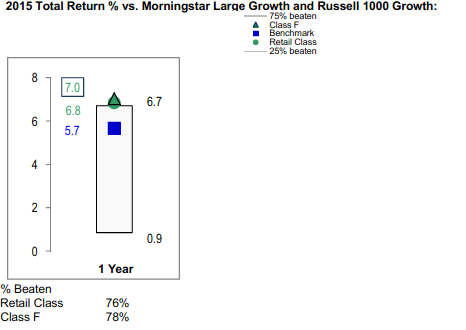
The Board also considered that the fund's management fee is subject to upward or downward adjustment depending upon whether, and to what extent, the fund's investment performance for the performance period exceeds, or is exceeded by, a securities index, thus leading to a performance adjustment for the same period. The Board noted that the performance adjustment provides FMR with a strong economic incentive to seek to achieve superior performance for the fund's shareholders and helps to more closely align the interests of FMR and the shareholders of the fund.
Based on its review, the Board concluded that the nature, extent, and quality of services provided to the fund under the Advisory Contracts should continue to benefit the shareholders of the fund.
Competitiveness of Management Fee and Total Expense Ratio. The Board considered the fund's management fee and total expense ratio compared to "mapped groups" of competitive funds and classes created for the purpose of facilitating the Trustees' competitive analysis of management fees and total expenses. Fidelity creates "mapped groups" by combining similar Broadridge investment objective categories that have comparable investment mandates. Combining Broadridge investment objective categories aids the Board's management fee and total expense ratio comparisons by broadening the competitive group used for comparison.
Management Fee. The Board considered two proprietary management fee comparisons for the 12-month periods shown in basis points (BP) in the chart below. The group of Broadridge funds used by the Board for management fee comparisons is referred to below as the "Total Mapped Group." The Total Mapped Group comparison focuses on a fund's standing in terms of gross management fees before expense reimbursements or caps, and without giving effect to the fund's performance adjustment, relative to the total universe of funds with comparable investment mandates, regardless of whether their management fee structures also are comparable. Funds with comparable investment mandates offer exposure to similar types of securities. Funds with comparable management fee structures have similar management fee contractual arrangements (
e.g., flat rate charged for advisory services, all-inclusive fee rate,
etc.). "TMG %" represents the percentage of funds in the Total Mapped Group that had management fees that were lower than the fund's. For example, a hypothetical TMG % of 20% would mean that 80% of the funds in the Total Mapped Group had higher, and 20% had lower, management fees than the fund. The fund's actual TMG %s and the number of funds in the Total Mapped Group are in the chart below. The "Asset-Size Peer Group" (ASPG) comparison focuses on a fund's standing relative to a subset of non-Fidelity funds within the Total Mapped Group that are similar in size and management fee structure without taking into account performance adjustments, if any. For example, if a fund is in the first quartile of the ASPG, the fund's management fee ranks in the least expensive or lowest 25% of funds in the ASPG. The ASPG represents at least 15% of the funds in the Total Mapped Group with comparable asset size and management fee structures, subject to a minimum of 50 funds (or all funds in the Total Mapped Group if fewer than 50). Additional information, such as the ASPG quartile in which the fund's management fee rate ranked and the impact of the fund's performance adjustment, is also included in the chart and considered by the Board.
Fidelity Series Blue Chip Growth Fund
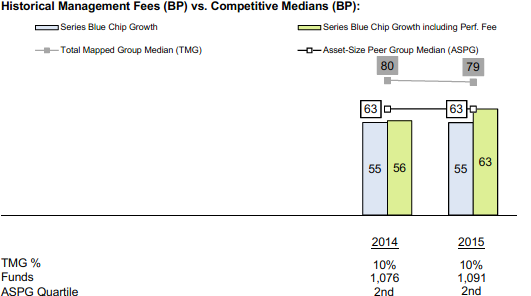
The Board noted that the fund's management fee rate ranked below the median of its Total Mapped Group and below the median of its ASPG for 2015. The Board also noted the effect of the fund's performance adjustment, if any, on the fund's management fee ranking.
The Board noted that, in 2014, the ad hoc Committee on Group Fee was formed by it and the boards of other Fidelity funds to conduct an in-depth review of the "group fee" component of the management fee of funds with such management fee structures. The Committee's focus included the mechanics of the group fee, the competitive landscape of group fee structures, Fidelity funds with no group fee component and investment products not included in group fee assets. The Board also considered that, for funds subject to the group fee, FMR agreed to voluntarily waive fees over a specified period of time in amounts designed to account for assets converted from certain funds to certain collective investment trusts.
The Board also noted that, in 2013, the ad hoc Committee on Management Fees was formed to conduct an in-depth review of the management fee rates of Fidelity's active equity mutual funds. The Committee focused on the following areas: (i) standard fee structures; (ii) research consumption and trading evolution; (iii) management fee competitiveness/profitability by category; and (iv) factors that drive institutional pricing.
Based on its review, the Board concluded that the fund's management fee is fair and reasonable in light of the services that the fund receives and the other factors considered.
Total Expense Ratio. In its review of each class's total expense ratio, the Board considered the fund's management fee rate as well as other fund or class expenses, as applicable, such as transfer agent fees, pricing and bookkeeping fees, and custodial, legal, and audit fees. The Board noted the impact of the fund's performance adjustment. The Board also noted that Fidelity may agree to waive fees and expenses from time to time, and the extent to which, if any, it has done so for the fund. As part of its review, the Board also considered the current and historical total expense ratios of each class of the fund compared to competitive fund median expenses. Each class of the fund is compared to those funds and classes in the Total Mapped Group (used by the Board for management fee comparisons) that have a similar sales load structure.
The Board noted that the total expense ratio of each class ranked below the competitive median for 2015.
Fees Charged to Other Fidelity Clients. The Board also considered Fidelity fee structures and other information with respect to clients of Fidelity, such as other funds advised or subadvised by Fidelity, pension plan clients, and other institutional clients with similar mandates. The Board noted the findings of the 2013 ad hoc joint committee (created with the board of other Fidelity funds), which reviewed and compared Fidelity's institutional investment advisory business with its business of providing services to the Fidelity funds, including the differences in services provided, fees charged, and costs incurred, as well as competition in their respective marketplaces.
Based on its review of total expense ratios and fees charged to other Fidelity clients, the Board concluded that the total expense ratio of each class of the fund was reasonable in light of the services that the fund and its shareholders receive and the other factors considered.
Costs of the Services and Profitability. The Board considered the revenues earned and the expenses incurred by Fidelity in conducting the business of developing, marketing, distributing, managing, administering and servicing the fund and servicing the fund's shareholders. The Board also considered the level of Fidelity's profits in respect of all the Fidelity funds.
On an annual basis, Fidelity presents to the Board information about the profitability of its relationship with the fund. Fidelity calculates profitability information for each fund, as well as aggregate profitability information for groups of Fidelity funds and all Fidelity funds, using a series of detailed revenue and cost allocation methodologies which originate with the books and records of Fidelity on which Fidelity's audited financial statements are based. The Audit Committee of the Board reviews any significant changes from the prior year's methodologies.
PricewaterhouseCoopers LLP (PwC), independent registered public accounting firm and auditor to Fidelity and certain Fidelity funds, has been engaged annually by the Board as part of the Board's assessment of Fidelity's profitability analysis. PwC's engagement includes the review and assessment of the methodologies used by Fidelity in determining the revenues and expenses attributable to Fidelity's mutual fund business, and completion of agreed-upon procedures in respect of the mathematical accuracy of the fund profitability information and its conformity to established allocation methodologies. After considering PwC's reports issued under the engagement and information provided by Fidelity, the Board concluded that while other allocation methods may also be reasonable, Fidelity's profitability methodologies are reasonable in all material respects.
The Board also reviewed Fidelity's non-fund businesses and fall-out benefits related to the mutual fund business as well as cases where Fidelity's affiliates may benefit from or be related to the fund's business.
The Board considered the costs of the services provided by and the profits realized by Fidelity in connection with the operation of the fund and was satisfied that the profitability was not excessive.
Economies of Scale. The Board considered whether there have been economies of scale in respect of the management of the Fidelity funds, whether the Fidelity funds (including the fund) have appropriately benefited from any such economies of scale, and whether there is potential for realization of any further economies of scale. The Board considered the extent to which the fund will benefit from economies of scale as assets grow through increased services to the fund, through waivers or reimbursements, or through fee or expense ratio reductions. The Board also noted that in 2013, it and the boards of other Fidelity funds created an ad hoc committee (the Economies of Scale Committee) to analyze whether Fidelity attains economies of scale in respect of the management and servicing of the Fidelity funds, whether the Fidelity funds have appropriately benefited from such economies of scale, and whether there is potential for realization of any further economies of scale.
The Board recognized that the fund's management contract incorporates a "group fee" structure, which provides for lower group fee rates as total group assets increase, and for higher group fee rates as total group assets decrease (with "group assets" defined to include fund assets under FMR's management plus the assets of sector funds previously under FMR's management). FMR calculates the group fee rates based on a tiered asset "breakpoint" schedule that varies based on asset class. The Board considered that the group fee is designed to deliver the benefits of economies of scale to fund shareholders when total Fidelity fund assets increase, even if assets of any particular fund are unchanged or have declined, because some portion of Fidelity's costs are attributable to services provided to all Fidelity funds, and all funds benefit if those costs can be allocated among more assets. The Board also considered that although the fund is offered only to other Fidelity funds, it continues to incur investment management expenses. The Board further noted that the fund may continue to realize benefits from the group fee structure, even though assets may not be expected to grow significantly at the fund level. The Board concluded that, given the group fee structure, fund shareholders will benefit from lower management fees as group assets increase at the fund complex level, regardless of whether Fidelity achieves any such economies of scale.
The Board concluded, taking into account the analysis of the Economies of Scale Committee, that economies of scale, if any, are being appropriately shared between fund shareholders and Fidelity.
Approval of New Advisory Contracts. The Board also voted to approve a new management contract and new sub-advisory agreements for the fund (New Advisory Contracts) that will take effect if the shareholders of certain other Fidelity funds that invest in the fund (referred to herein as Freedom Funds) approve new management contracts for the Freedom Funds. Under the New Advisory Contracts the fund will no longer pay a management fee to FMR. The new sub-advisory agreements provide that FMR or its affiliates will pay the fees based on a portion of the management fees received by an affiliate of FMR under its management contracts with the Freedom Funds. The Board noted the New Advisory Contracts are expected to result in an overall decrease in the fees and expenses payable by the fund. The Board considered that the approval of the New Advisory Contracts will not result in any changes to (i) the investment process or strategies employed in the management of the fund's assets; (ii) the nature, extent and quality of services provided to the fund; or (iii) the day-to-day management of the fund and the personnel primarily responsible for such management. The Board considered that the new management contract does not have a performance fee adjustment, but noted that FMR will no longer charge a management fee for the fund. The Board also considered that the New Advisory Contracts provide that FMR or an affiliate undertakes to pay all operating expenses of the fund, except transfer agent fees, 12b-1 fees, Independent Trustee expenses, custodian fees and expenses, expenses related to proxy solicitations, interest, taxes, brokerage expenses, and extraordinary expenses (such as litigation expenses).
Additional Information Requested by the Board. In order to develop fully the factual basis for consideration of the Fidelity funds' Advisory Contracts, the Board requested and received additional information on certain topics, including: (i) fund performance trends and Fidelity's long-term strategies for certain funds; (ii) the various share classes employed by Fidelity and the attributes of each class, together with similar information on the distribution and servicing payments made by Fidelity or the funds to third-party participants in the distribution channels; (iii) fund profitability, and fund performance in relation to fund profitability; (iv) the methodology with respect to evaluating competitive fund data and peer group classifications and fee comparisons; (v) annual fund profitability margins; (vi) the realization of fall-out benefits in and attribution of fall-out benefits to certain Fidelity business units; (vii) the appropriateness of certain funds' benchmarks; (viii) the rationalization for certain share classes and expenses; (ix) sub-advisory fee rates for comparable investment mandates; (x) product strategy for certain underperforming funds; and (xi) Fidelity's resources and strategy for cybersecurity.
Based on its evaluation of all of the conclusions noted above, and after considering all factors it believed relevant, the Board concluded that the advisory fee structures are fair and reasonable, and that the fund's Advisory Contracts should be renewed.
Corporate Headquarters
245 Summer St.
Boston, MA 02210
www.fidelity.com
XS1-ANN-0916
1.967985.102
Fidelity® OTC Portfolio
Annual Report July 31, 2016 |
|
Contents
To view a fund's proxy voting guidelines and proxy voting record for the 12-month period ended June 30, visit http://www.fidelity.com/proxyvotingresults or visit the Securities and Exchange Commission's (SEC) web site at http://www.sec.gov.
You may also call 1-800-544-8544 to request a free copy of the proxy voting guidelines.
Standard & Poor's, S&P and S&P 500 are registered service marks of The McGraw-Hill Companies, Inc. and have been licensed for use by Fidelity Distributors Corporation.
Other third-party marks appearing herein are the property of their respective owners.
All other marks appearing herein are registered or unregistered trademarks or service marks of FMR LLC or an affiliated company. © 2016 FMR LLC. All rights reserved.
This report and the financial statements contained herein are submitted for the general information of the shareholders of the Fund. This report is not authorized for distribution to prospective investors in the Fund unless preceded or accompanied by an effective prospectus.
A fund files its complete schedule of portfolio holdings with the SEC for the first and third quarters of each fiscal year on Form N-Q. Forms N-Q are available on the SEC’s web site at http://www.sec.gov. A fund's Forms N-Q may be reviewed and copied at the SEC’s Public Reference Room in Washington, DC. Information regarding the operation of the SEC's Public Reference Room may be obtained by calling 1-800-SEC-0330.
For a complete list of a fund's portfolio holdings, view the most recent holdings listing, semiannual report, or annual report on Fidelity's web site at http://www.fidelity.com, http://www.institutional.fidelity.com, or http://www.401k.com, as applicable.
NOT FDIC INSURED •MAY LOSE VALUE •NO BANK GUARANTEE
Neither the Fund nor Fidelity Distributors Corporation is a bank.
Performance: The Bottom Line
Average annual total return reflects the change in the value of an investment, assuming reinvestment of distributions from dividend income and capital gains (the profits earned upon the sale of securities that have grown in value, if any) and assuming a constant rate of performance each year. The hypothetical investment and the average annual total returns do not reflect the deduction of taxes that a shareholder would pay on fund distributions or the redemption of fund shares. During periods of reimbursement by Fidelity, a fund’s total return will be greater than it would be had the reimbursement not occurred. How a fund did yesterday is no guarantee of how it will do tomorrow.
Average Annual Total Returns
| For the periods ended July 31, 2016 | Past 1 year | Past 5 years | Past 10 years |
| Fidelity® OTC Portfolio | 3.68% | 14.72% | 13.00% |
$10,000 Over 10 Years
Let's say hypothetically that $10,000 was invested in Fidelity® OTC Portfolio, a class of the fund, on July 31, 2006.
The chart shows how the value of your investment would have changed, and also shows how the Nasdaq Composite Index® performed over the same period.
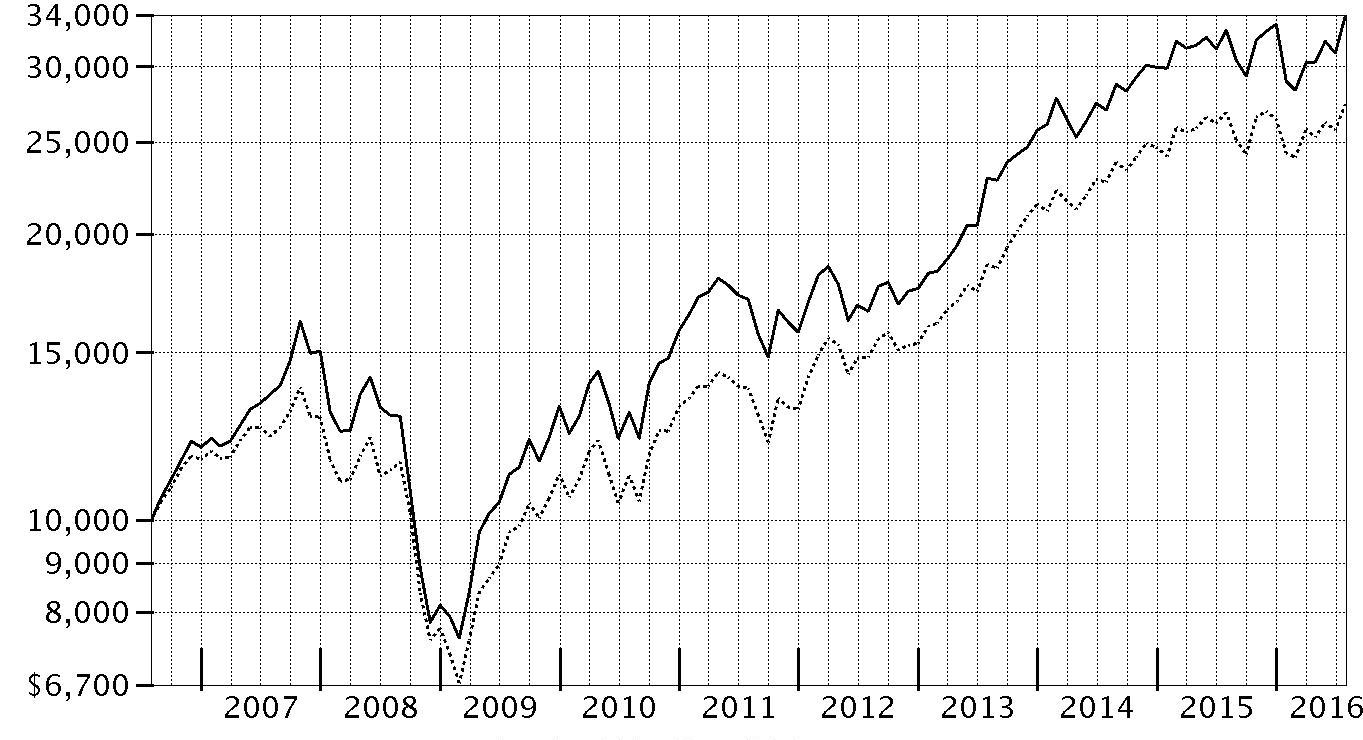
| Period Ending Values |
| $33,938 | Fidelity® OTC Portfolio |
| $27,394 | Nasdaq Composite Index® |
Management's Discussion of Fund Performance
Market Recap: U.S. equities gained modestly for the year ending July 31, 2016, overcoming persistent concern about global economic growth, uncertainty regarding U.S. monetary policy and the U.K.’s late-June vote to leave the European Union, dubbed Brexit. The S&P 500
® index rose 5.61%, with larger-cap, value-oriented stocks and defensive sectors shining brightest. Volatility peaked in the early weeks of 2016, as continued oil-price weakness and U.S.-dollar strength pushed the S&P 500
® to its worst January since 2009. Markets then rose beginning in February amid U.S. job gains, a broad rally in energy and materials markets, global economic stimulus and perceived softening of monetary policy by the U.S. Federal Reserve. The June 23 Brexit vote surprised markets and resulted in a sharp two-day decline for stocks, followed by a rebound as investor sentiment shifted and remained positive through July 31. For the year, dividend-rich telecom services (+26%), utilities (+23%) and consumer staples (+12%) led the way amid strong investor demand for yield. Industrials (+10%) and information technology (+10%) also outperformed, as did materials (+8%), despite a weak commodities environment overall. Conversely, a strong run for real estate stocks couldn’t keep financials (-4%) from losing ground, as low interest rates continued to squeeze bank profits.
Comments from Portfolio Manager Gavin Baker: For the year, the fund’s share classes outpaced the 1.92% return of the Nasdaq Composite
® Index by about 1.7 percentage points. Versus the benchmark, security selection proved additive, notably in technology and consumer discretionary. Stock picks and an overweighting in health care – particularly the pharmaceuticals, biotechnology & life sciences group – detracted most from relative results. Selections in financials also hurt. The fund's top individual contributor on a relative basis was an overweighting in computer-processor maker NVIDIA, which nearly tripled in value this period; NVIDIA was one of the fund's largest holdings. An out-of-benchmark stake in France-based game developer Ubisoft Entertainment, which more than doubled in value this period, also helped. Conversely, several pharma, biotech & life sciences names detracted, including Clovis Oncology and Alexion Pharmaceuticals. After multiyear, gains the group pulled back amid concerns over drug prices, as well as some earnings and clinical-trial disappointments. Health care weightings generally were kept steady, as the fund increased its share-count in several underperforming names. The fund's biggest detractor, though, was an overweighting in solar-energy system provider SolarCity; its stock lost just over half its value this period, pressured by disappointing quarterly results and guidance.
The views expressed above reflect those of the portfolio manager(s) only through the end of the period as stated on the cover of this report and do not necessarily represent the views of Fidelity or any other person in the Fidelity organization. Any such views are subject to change at any time based upon market or other conditions and Fidelity disclaims any responsibility to update such views. These views may not be relied on as investment advice and, because investment decisions for a Fidelity fund are based on numerous factors, may not be relied on as an indication of trading intent on behalf of any Fidelity fund.
Investment Summary (Unaudited)
Top Ten Stocks as of July 31, 2016
| | % of fund's net assets | % of fund's net assets 6 months ago |
| Apple, Inc. | 7.2 | 5.4 |
| Amazon.com, Inc. | 5.9 | 4.6 |
| Tesla Motors, Inc. | 5.5 | 3.4 |
| Alphabet, Inc. Class A | 5.4 | 5.3 |
| NVIDIA Corp. | 4.3 | 3.0 |
| Activision Blizzard, Inc. | 4.1 | 4.4 |
| Alphabet, Inc. Class C | 3.8 | 4.0 |
| Facebook, Inc. Class A | 3.3 | 4.2 |
| Ubisoft Entertainment SA | 3.1 | 2.3 |
| Microsoft Corp. | 2.8 | 4.0 |
| | 45.4 | |
Top Five Market Sectors as of July 31, 2016
| | % of fund's net assets | % of fund's net assets 6 months ago |
| Information Technology | 48.8 | 50.1 |
| Health Care | 19.9 | 19.8 |
| Consumer Discretionary | 19.2 | 16.6 |
| Financials | 4.7 | 4.7 |
| Consumer Staples | 3.5 | 4.9 |
Asset Allocation (% of fund's net assets)
| As of July 31, 2016 * |
| | Stocks | 96.7% |
| | Convertible Securities | 3.2% |
| | Short-Term Investments and Net Other Assets (Liabilities) | 0.1% |

* Foreign investments - 13.2%
| As of January 31, 2016 * |
| | Stocks | 96.6% |
| | Convertible Securities | 3.3% |
| | Short-Term Investments and Net Other Assets (Liabilities) | 0.1% |

* Foreign investments - 7.8%
Investments July 31, 2016
Showing Percentage of Net Assets
| Common Stocks - 96.7% | | | |
| | | Shares | Value (000s) |
| CONSUMER DISCRETIONARY - 18.8% | | | |
| Automobiles - 5.5% | | | |
| Tesla Motors, Inc. (a) | | 3,139,299 | $737,076 |
| Hotels, Restaurants & Leisure - 1.4% | | | |
| Buffalo Wild Wings, Inc. (a) | | 328,300 | 55,141 |
| Chipotle Mexican Grill, Inc. (a) | | 264,100 | 111,976 |
| Intrawest Resorts Holdings, Inc. (a) | | 726,835 | 10,568 |
| Vail Resorts, Inc. | | 85,500 | 12,232 |
| | | | 189,917 |
| Internet & Catalog Retail - 9.1% | | | |
| Amazon.com, Inc. (a) | | 1,044,898 | 792,879 |
| Etsy, Inc. (a) | | 1,870,275 | 18,815 |
| Groupon, Inc. Class A (a)(b)(c) | | 62,409,181 | 300,812 |
| Wayfair LLC Class A (a)(b) | | 2,482,768 | 108,000 |
| | | | 1,220,506 |
| Media - 1.7% | | | |
| Altice NV (a) | | 1,015,500 | 14,603 |
| Charter Communications, Inc. Class A (a) | | 588,182 | 138,146 |
| Liberty Global PLC: | | | |
| Class A (a) | | 1,860,400 | 58,993 |
| LiLAC Class A (a) | | 256,099 | 8,797 |
| | | | 220,539 |
| Specialty Retail - 0.3% | | | |
| Ross Stores, Inc. | | 730,200 | 45,148 |
| Textiles, Apparel & Luxury Goods - 0.8% | | | |
| lululemon athletica, Inc. (a) | | 1,080,546 | 83,904 |
| Ralph Lauren Corp. | | 151,900 | 14,900 |
| | | | 98,804 |
|
| TOTAL CONSUMER DISCRETIONARY | | | 2,511,990 |
|
| CONSUMER STAPLES - 3.4% | | | |
| Beverages - 0.5% | | | |
| Monster Beverage Corp. (a) | | 431,400 | 69,296 |
| Food & Staples Retailing - 1.8% | | | |
| Costco Wholesale Corp. | | 1,421,150 | 237,645 |
| Walgreens Boots Alliance, Inc. | | 1,500 | 119 |
| | | | 237,764 |
| Food Products - 1.1% | | | |
| Mondelez International, Inc. | | 3,337,900 | 146,801 |
|
| TOTAL CONSUMER STAPLES | | | 453,861 |
|
| ENERGY - 0.7% | | | |
| Energy Equipment & Services - 0.1% | | | |
| Oceaneering International, Inc. | | 319,700 | 8,913 |
| Oil, Gas & Consumable Fuels - 0.6% | | | |
| Anadarko Petroleum Corp. | | 1,003,200 | 54,704 |
| Diamondback Energy, Inc. | | 111,100 | 9,753 |
| EOG Resources, Inc. | | 194,900 | 15,923 |
| | | | 80,380 |
|
| TOTAL ENERGY | | | 89,293 |
|
| FINANCIALS - 4.4% | | | |
| Banks - 2.5% | | | |
| Bank of America Corp. | | 3,897,600 | 56,476 |
| Bank of the Ozarks, Inc. | | 545,100 | 19,618 |
| Citigroup, Inc. | | 1,441,200 | 63,139 |
| Commerce Bancshares, Inc. | | 784,189 | 37,084 |
| Fifth Third Bancorp | | 515,900 | 9,792 |
| Huntington Bancshares, Inc. | | 1,784,000 | 16,948 |
| Signature Bank (a) | | 261,300 | 31,419 |
| UMB Financial Corp. | | 531,500 | 29,450 |
| Wells Fargo & Co. | | 1,324,900 | 63,555 |
| | | | 327,481 |
| Capital Markets - 0.4% | | | |
| Carlyle Group LP | | 630,500 | 10,895 |
| Northern Trust Corp. | | 537,600 | 36,336 |
| | | | 47,231 |
| Consumer Finance - 0.7% | | | |
| Capital One Financial Corp. | | 1,407,400 | 94,408 |
| Diversified Financial Services - 0.8% | | | |
| Broadcom Ltd. | | 684,326 | 110,847 |
| Real Estate Management & Development - 0.0% | | | |
| WeWork Companies, Inc. Class A (a)(d) | | 29,911 | 1,501 |
|
| TOTAL FINANCIALS | | | 581,468 |
|
| HEALTH CARE - 19.5% | | | |
| Biotechnology - 12.4% | | | |
| Acceleron Pharma, Inc. (a) | | 262,300 | 8,897 |
| Aduro Biotech, Inc. (e) | | 1,938,567 | 28,458 |
| Advanced Accelerator Applications SA sponsored ADR | | 360,800 | 11,289 |
| Adverum Biotechnologies, Inc. (a) | | 988,352 | 3,578 |
| Alexion Pharmaceuticals, Inc. (a) | | 1,755,789 | 225,794 |
| Alkermes PLC (a) | | 1,115,087 | 55,643 |
| Alnylam Pharmaceuticals, Inc. (a) | | 138,100 | 9,402 |
| Amgen, Inc. | | 913,300 | 157,115 |
| Bellicum Pharmaceuticals, Inc. (a)(b)(c) | | 2,331,847 | 37,030 |
| Biogen, Inc. (a) | | 19,700 | 5,712 |
| BioMarin Pharmaceutical, Inc. (a) | | 1,869,456 | 185,861 |
| bluebird bio, Inc. (a) | | 181,808 | 10,396 |
| Blueprint Medicines Corp. (a) | | 382,300 | 8,453 |
| Celldex Therapeutics, Inc. (a)(b) | | 1,273,285 | 5,883 |
| Cellectis SA sponsored ADR (a) | | 371,100 | 9,786 |
| Chiasma, Inc. (a)(b) | | 402,104 | 1,066 |
| Chimerix, Inc. (a) | | 54,700 | 218 |
| Coherus BioSciences, Inc. (a)(b) | | 877,215 | 22,272 |
| CytomX Therapeutics, Inc. | | 517,300 | 5,204 |
| CytomX Therapeutics, Inc. (e) | | 244,269 | 2,457 |
| Dicerna Pharmaceuticals, Inc. (a) | | 492,107 | 1,580 |
| Editas Medicine, Inc. (b) | | 1,150,400 | 29,588 |
| Editas Medicine, Inc. | | 176,244 | 4,488 |
| Galapagos Genomics NV sponsored ADR (a) | | 554,000 | 30,564 |
| Genocea Biosciences, Inc. (a)(b) | | 845,070 | 3,439 |
| GenSight Biologics SA | | 411,444 | 3,680 |
| Gilead Sciences, Inc. | | 59,799 | 4,752 |
| Heron Therapeutics, Inc. (a) | | 757,077 | 12,583 |
| Intellia Therapeutics, Inc. (b) | | 679,900 | 12,864 |
| Intellia Therapeutics, Inc. | | 260,358 | 4,433 |
| Intercept Pharmaceuticals, Inc. (a) | | 318,619 | 55,131 |
| Ionis Pharmaceuticals, Inc. (a) | | 220,506 | 6,437 |
| Ironwood Pharmaceuticals, Inc. Class A (a) | | 3,015,642 | 42,611 |
| Karyopharm Therapeutics, Inc. (a) | | 614,200 | 4,533 |
| Lion Biotechnologies, Inc. (a)(b) | | 2,913,500 | 25,755 |
| Medivation, Inc. (a) | | 490,000 | 31,355 |
| Neurocrine Biosciences, Inc. (a) | | 976,100 | 49,030 |
| Novavax, Inc. (a)(b) | | 10,970,600 | 80,305 |
| OvaScience, Inc. (a)(b) | | 1,188,097 | 5,988 |
| Portola Pharmaceuticals, Inc. (a) | | 643,275 | 16,699 |
| ProNai Therapeutics, Inc. (a)(b) | | 193,200 | 381 |
| Puma Biotechnology, Inc. (a) | | 743,687 | 37,103 |
| Regeneron Pharmaceuticals, Inc. (a) | | 328,800 | 139,779 |
| Sage Therapeutics, Inc. (a) | | 15,800 | 709 |
| Seattle Genetics, Inc. (a)(b) | | 22,086 | 1,061 |
| Spark Therapeutics, Inc. (a) | | 319,480 | 18,511 |
| TESARO, Inc. (a)(b) | | 1,973,322 | 183,993 |
| Trevena, Inc. (a)(c) | | 3,326,521 | 20,857 |
| Ultragenyx Pharmaceutical, Inc. (a) | | 401,496 | 25,407 |
| uniQure B.V. (a) | | 302,200 | 2,197 |
| Vertex Pharmaceuticals, Inc. (a) | | 5,400 | 524 |
| | | | 1,650,851 |
| Health Care Equipment & Supplies - 0.3% | | | |
| IDEXX Laboratories, Inc. (a) | | 393,804 | 36,935 |
| Insulet Corp. (a) | | 122,700 | 4,342 |
| | | | 41,277 |
| Health Care Providers & Services - 0.2% | | | |
| Accretive Health, Inc. (a)(c) | | 6,962,302 | 13,855 |
| Diplomat Pharmacy, Inc. (a)(b) | | 574,900 | 20,656 |
| | | | 34,511 |
| Health Care Technology - 2.3% | | | |
| athenahealth, Inc. (a)(c) | | 2,409,983 | 307,972 |
| Castlight Health, Inc. Class B (a) | | 63,800 | 238 |
| | | | 308,210 |
| Pharmaceuticals - 4.3% | | | |
| Achaogen, Inc. (a) | | 805,700 | 3,166 |
| Endo International PLC (a)(c) | | 17,919,319 | 311,079 |
| Flex Pharma, Inc. (a)(b) | | 251,834 | 2,984 |
| GW Pharmaceuticals PLC ADR (a) | | 127,027 | 11,981 |
| Horizon Pharma PLC (a) | | 3,917,200 | 75,563 |
| Innoviva, Inc. | | 78 | 1 |
| Intra-Cellular Therapies, Inc. (a) | | 414,207 | 16,900 |
| Jazz Pharmaceuticals PLC (a) | | 133,600 | 20,170 |
| Relypsa, Inc. (a)(b) | | 518,000 | 16,545 |
| The Medicines Company (a) | | 297,800 | 11,647 |
| Valeant Pharmaceuticals International, Inc. (United States) (a) | | 4,599,200 | 102,562 |
| | | | 572,598 |
|
| TOTAL HEALTH CARE | | | 2,607,447 |
|
| INDUSTRIALS - 3.0% | | | |
| Aerospace & Defense - 0.1% | | | |
| Space Exploration Technologies Corp. Class A (a)(d) | | 110,610 | 10,665 |
| Airlines - 0.9% | | | |
| American Airlines Group, Inc. | | 3,506,300 | 124,474 |
| Wheels Up Partners Holdings LLC Series B unit (d)(f) | | 1,760,377 | 4,119 |
| | | | 128,593 |
| Commercial Services & Supplies - 0.3% | | | |
| Stericycle, Inc. (a) | | 404,300 | 36,496 |
| Electrical Equipment - 1.7% | | | |
| SolarCity Corp. (a)(c) | | 8,686,248 | 231,923 |
| Road & Rail - 0.0% | | | |
| J.B. Hunt Transport Services, Inc. | | 780 | 65 |
|
| TOTAL INDUSTRIALS | | | 407,742 |
|
| INFORMATION TECHNOLOGY - 46.9% | | | |
| Communications Equipment - 0.0% | | | |
| Cisco Systems, Inc. | | 98,400 | 3,004 |
| Electronic Equipment & Components - 0.3% | | | |
| Fitbit, Inc. (a)(b) | | 2,677,728 | 36,578 |
| Internet Software & Services - 16.7% | | | |
| 2U, Inc. (a)(b) | | 1,118,041 | 39,109 |
| Alphabet, Inc.: | | | |
| Class A | | 903,427 | 714,918 |
| Class C (a) | | 651,869 | 501,150 |
| Criteo SA sponsored ADR (a)(b)(c) | | 5,430,471 | 239,973 |
| Dropbox, Inc. (a)(d) | | 331,524 | 3,683 |
| Facebook, Inc. Class A (a) | | 3,536,538 | 438,319 |
| GoDaddy, Inc. (a) | | 1,557,300 | 46,594 |
| New Relic, Inc. (a)(b) | | 1,500,711 | 51,684 |
| Rackspace Hosting, Inc. (a) | | 4,862,230 | 113,922 |
| Shopify, Inc. Class A (a) | | 902,226 | 30,919 |
| Twilio, Inc. (b) | | 167,100 | 6,789 |
| Twilio, Inc. | | 351,811 | 12,865 |
| Wix.com Ltd. (a) | | 923,005 | 32,859 |
| | | | 2,232,784 |
| IT Services - 1.4% | | | |
| Cognizant Technology Solutions Corp. Class A (a) | | 2,118,300 | 121,781 |
| PayPal Holdings, Inc. (a) | | 1,462,800 | 54,475 |
| Sabre Corp. | | 136,900 | 3,991 |
| Square, Inc. (a)(b) | | 483,500 | 4,869 |
| | | | 185,116 |
| Semiconductors & Semiconductor Equipment - 7.0% | | | |
| Cirrus Logic, Inc. (a) | | 676,030 | 32,848 |
| Marvell Technology Group Ltd. | | 5,136,900 | 60,359 |
| Micron Technology, Inc. (a) | | 110,400 | 1,517 |
| NVIDIA Corp. | | 10,020,411 | 572,165 |
| NXP Semiconductors NV (a) | | 1,694,100 | 142,457 |
| Qorvo, Inc.(a) | | 1,070,000 | 67,656 |
| Qualcomm, Inc. | | 178,953 | 11,199 |
| SolarEdge Technologies, Inc. (a)(b)(c) | | 2,437,000 | 43,622 |
| | | | 931,823 |
| Software - 14.3% | | | |
| Activision Blizzard, Inc. | | 13,623,689 | 547,127 |
| Electronic Arts, Inc. (a) | | 481,200 | 36,725 |
| HubSpot, Inc. (a) | | 883,980 | 48,256 |
| Interactive Intelligence Group, Inc. (a) | | 211,287 | 11,399 |
| LINE Corp. sponsored ADR | | 31,555 | 1,159 |
| Microsoft Corp. | | 6,706,239 | 380,110 |
| Paylocity Holding Corp. (a)(b) | | 345,500 | 15,423 |
| Salesforce.com, Inc. (a) | | 2,509,020 | 205,238 |
| Tyler Technologies, Inc. (a) | | 208,400 | 33,973 |
| Ubisoft Entertainment SA (a)(c) | | 10,178,905 | 417,931 |
| Workday, Inc. Class A (a) | | 535,100 | 44,595 |
| Xero Ltd. (a)(b) | | 628,814 | 8,987 |
| Zendesk, Inc. (a)(c) | | 5,252,784 | 158,844 |
| | | | 1,909,767 |
| Technology Hardware, Storage & Peripherals - 7.2% | | | |
| Apple, Inc. | | 9,173,620 | 955,990 |
| Western Digital Corp. | | 42,961 | 2,041 |
| | | | 958,031 |
|
| TOTAL INFORMATION TECHNOLOGY | | | 6,257,103 |
|
| TOTAL COMMON STOCKS | | | |
| (Cost $9,583,282) | | | 12,908,904 |
|
| Convertible Preferred Stocks - 3.2% | | | |
| CONSUMER DISCRETIONARY - 0.4% | | | |
| Diversified Consumer Services - 0.0% | | | |
| Handy Technologies, Inc. Series C (d) | | 415,643 | 2,091 |
| Household Durables - 0.3% | | | |
| Roku, Inc.: | | | |
| Series F, 8.00% (a)(d) | | 16,562,507 | 28,322 |
| Series G, 8.00% (a)(d) | | 3,185,945 | 5,448 |
| Series H (d) | | 1,931,947 | 3,304 |
| | | | 37,074 |
| Internet & Catalog Retail - 0.0% | | | |
| One Kings Lane, Inc. Series E (a)(d) | | 648,635 | 428 |
| The Honest Co., Inc. Series D (d) | | 75,268 | 2,898 |
| | | | 3,326 |
| Media - 0.1% | | | |
| Turn, Inc. Series E (a)(d) | | 1,199,041 | 3,825 |
|
| TOTAL CONSUMER DISCRETIONARY | | | 46,316 |
|
| CONSUMER STAPLES - 0.1% | | | |
| Food & Staples Retailing - 0.1% | | | |
| Blue Apron, Inc. Series D (a)(d) | | 866,669 | 14,387 |
| FINANCIALS - 0.3% | | | |
| Real Estate Management & Development - 0.3% | | | |
| Redfin Corp. Series G (a)(d) | | 6,064,833 | 25,290 |
| WeWork Companies, Inc. Series E (a)(d) | | 269,198 | 13,512 |
| | | | 38,802 |
| HEALTH CARE - 0.4% | | | |
| Biotechnology - 0.2% | | | |
| 23andMe, Inc. Series E (a)(d) | | 1,817,170 | 17,245 |
| Jounce Therapeutics, Inc. Series B (a)(d) | | 2,212,389 | 7,655 |
| Ovid Therapeutics, Inc. Series B (d) | | 314,408 | 1,170 |
| | | | 26,070 |
| Health Care Providers & Services - 0.2% | | | |
| Mulberry Health, Inc. Series A8 (d) | | 4,342,250 | 31,656 |
|
| TOTAL HEALTH CARE | | | 57,726 |
|
| INDUSTRIALS - 0.1% | | | |
| Aerospace & Defense - 0.1% | | | |
| Space Exploration Technologies Corp. Series G (a)(d) | | 62,037 | 5,982 |
| Professional Services - 0.0% | | | |
| YourPeople, Inc. Series C (a)(d) | | 335,546 | 5,100 |
|
| TOTAL INDUSTRIALS | | | 11,082 |
|
| INFORMATION TECHNOLOGY - 1.9% | | | |
| Internet Software & Services - 1.2% | | | |
| Jet.Com, Inc. Series B1 (d) | | 4,896,249 | 42,769 |
| Pinterest, Inc. Series G, 8.00% (a)(d) | | 139,290 | 1,220 |
| Uber Technologies, Inc.: | | | |
| Series D, 8.00% (a)(d) | | 2,256,164 | 110,038 |
| Series E, 8.00% (a)(d) | | 150,072 | 7,319 |
| | | | 161,346 |
| IT Services - 0.2% | | | |
| AppNexus, Inc. Series E (a)(d) | | 1,416,796 | 24,397 |
| Nutanix, Inc. Series E (a)(d) | | 311,503 | 4,856 |
| | | | 29,253 |
| Software - 0.5% | | | |
| Bracket Computing, Inc. Series C (d) | | 1,877,241 | 6,345 |
| Cloudera, Inc. Series F (a)(d) | | 126,709 | 3,704 |
| Cloudflare, Inc. Series D (a)(d) | | 395,787 | 2,466 |
| Dataminr, Inc. Series D (a)(d) | | 2,219,446 | 14,287 |
| Delphix Corp. Series D (d) | | 427,177 | 2,307 |
| Snapchat, Inc. Series F (a)(d) | | 510,029 | 15,668 |
| Taboola.Com Ltd. Series E (a)(d) | | 1,918,392 | 21,524 |
| | | | 66,301 |
|
| TOTAL INFORMATION TECHNOLOGY | | | 256,900 |
|
| TELECOMMUNICATION SERVICES - 0.0% | | | |
| Wireless Telecommunication Services - 0.0% | | | |
| Altiostar Networks, Inc. Series D (a)(d) | | 1,220,504 | 5,956 |
| TOTAL CONVERTIBLE PREFERRED STOCKS | | | |
| (Cost $344,400) | | | 431,169 |
| | | Principal Amount (000s) | Value (000s) |
|
| Convertible Bonds - 0.0% | | | |
| CONSUMER DISCRETIONARY - 0.0% | | | |
| Media - 0.0% | | | |
| Turn, Inc. 1.48% 3/2/23(d) | | | |
| (Cost $373) | | 373 | 373 |
| | | Shares | Value (000s) |
|
| Money Market Funds - 2.7% | | | |
| Fidelity Cash Central Fund, 0.42% (g) | | 14,888,292 | 14,888 |
| Fidelity Securities Lending Cash Central Fund, 0.45% (g)(h) | | 340,289,278 | 340,289 |
| TOTAL MONEY MARKET FUNDS | | | |
| (Cost $355,177) | | | 355,177 |
| TOTAL INVESTMENT PORTFOLIO - 102.6% | | | |
| (Cost $10,283,232) | | | 13,695,623 |
| NET OTHER ASSETS (LIABILITIES) - (2.6)% | | | (341,867) |
| NET ASSETS - 100% | | | $13,353,756 |
Legend
(a) Non-income producing
(b) Security or a portion of the security is on loan at period end.
(c) Affiliated company
(d) Restricted securities - Investment in securities not registered under the Securities Act of 1933 (excluding 144A issues). At the end of the period, the value of restricted securities (excluding 144A issues) amounted to $451,511,000 or 3.4% of net assets.
(e) Security exempt from registration under Rule 144A of the Securities Act of 1933. These securities may be resold in transactions exempt from registration, normally to qualified institutional buyers. At the end of the period, the value of these securities amounted to $30,915,000 or 0.2% of net assets.
(f) Investment is owned by a wholly-owned subsidiary (Subsidiary) that is treated as a corporation for U.S. tax purposes.
(g) Affiliated fund that is generally available only to investment companies and other accounts managed by Fidelity Investments. The rate quoted is the annualized seven-day yield of the fund at period end. A complete unaudited listing of the fund's holdings as of its most recent quarter end is available upon request. In addition, each Fidelity Central Fund's financial statements, which are not covered by the Fund's Report of Independent Registered Public Accounting Firm, are available on the SEC's website or upon request.
(h) Investment made with cash collateral received from securities on loan.
Additional information on each restricted holding is as follows:
| Security | Acquisition Date | Acquisition Cost (000s) |
| 23andMe, Inc. Series E | 6/18/15 | $19,675 |
| Altiostar Networks, Inc. Series D | 1/7/15 | $15,000 |
| AppNexus, Inc. Series E | 8/1/14 - 9/17/14 | $28,382 |
| Blue Apron, Inc. Series D | 5/18/15 | $11,550 |
| Bracket Computing, Inc. Series C | 9/9/15 | $14,766 |
| Cloudera, Inc. Series F | 2/5/14 | $1,845 |
| Cloudflare, Inc. Series D | 11/5/14 | $2,424 |
| Dataminr, Inc. Series D | 2/18/15 - 3/6/15 | $28,298 |
| Delphix Corp. Series D | 7/10/15 | $3,845 |
| Dropbox, Inc. | 5/2/12 | $3,000 |
| Handy Technologies, Inc. Series C | 10/14/15 | $2,436 |
| Jet.Com, Inc. Series B1 | 11/24/15 | $24,422 |
| Jounce Therapeutics, Inc. Series B | 4/17/15 | $5,000 |
| Mulberry Health, Inc. Series A8 | 1/20/16 | $29,331 |
| Nutanix, Inc. Series E | 8/26/14 | $4,173 |
| One Kings Lane, Inc. Series E | 1/29/14 | $429 |
| Ovid Therapeutics, Inc. Series B | 8/10/15 | $1,959 |
| Pinterest, Inc. Series G, 8.00% | 2/27/15 | $1,000 |
| Redfin Corp. Series G | 12/16/14 | $20,000 |
| Roku, Inc. Series F, 8.00% | 5/7/13 | $15,000 |
| Roku, Inc. Series G, 8.00% | 10/1/14 | $4,140 |
| Roku, Inc. Series H | 11/9/15 | $2,954 |
| Snapchat, Inc. Series F | 3/25/15 - 2/12/16 | $15,668 |
| Space Exploration Technologies Corp. Class A | 10/16/15 | $9,844 |
| Space Exploration Technologies Corp. Series G | 1/20/15 | $4,805 |
| Taboola.Com Ltd. Series E | 12/22/14 | $20,000 |
| The Honest Co., Inc. Series D | 8/3/15 | $3,444 |
| Turn, Inc. Series E | 12/30/13 | $10,000 |
| Turn, Inc. 1.48% 3/2/23 | 3/2/16 | $373 |
| Uber Technologies, Inc. Series D, 8.00% | 6/6/14 | $35,000 |
| Uber Technologies, Inc. Series E, 8.00% | 12/5/14 | $5,000 |
| WeWork Companies, Inc. Class A | 6/23/15 | $984 |
| WeWork Companies, Inc. Series E | 6/23/15 | $8,854 |
| Wheels Up Partners Holdings LLC Series B unit | 9/18/15 | $5,000 |
| YourPeople, Inc. Series C | 5/1/15 | $5,000 |
Affiliated Central Funds
Information regarding fiscal year to date income earned by the Fund from investments in Fidelity Central Funds is as follows:
| Fund | Income earned |
| | (Amounts in thousands) |
| Fidelity Cash Central Fund | $46 |
| Fidelity Securities Lending Cash Central Fund | 28,604 |
| Total | $28,650 |
Other Affiliated Issuers
An affiliated company is a company in which the Fund has ownership of at least 5% of the voting securities. Fiscal year to date transactions with companies which are or were affiliates are as follows:
| Affiliate (Amounts in thousands) | Value, beginning of period | Purchases | Sales Proceeds* | Dividend Income | Value, end of period |
| Accretive Health, Inc. | $18,789 | $-- | $703 | $-- | $13,855 |
| athenahealth, Inc. | 327,395 | 13,283 | 3,192 | -- | 307,972 |
| Bellicum Pharmaceuticals, Inc. | 20,012 | 27,012 | 12,571 | -- | 37,030 |
| Criteo SA sponsored ADR | 291,470 | -- | 1,762 | -- | 239,973 |
| Endo International PLC | -- | 285,775 | -- | -- | 311,079 |
| GameLoft SE | 36,312 | -- | 68,556 | -- | -- |
| Groupon, Inc. Class A | 317,266 | -- | 12,726 | -- | 300,812 |
| Lion Biotechnologies, Inc. | 25,788 | -- | 747 | -- | -- |
| Portola Pharmaceuticals, Inc. | 140,217 | 4,896 | 57,458 | -- | -- |
| SolarCity Corp. | 89,259 | 232,675 | 11,228 | -- | 231,923 |
| SolarEdge Technologies, Inc. | -- | 63,165 | -- | -- | 43,622 |
| Synchronoss Technologies, Inc. | 127,356 | 3,746 | 110,002 | -- | -- |
| Trevena, Inc. | 19,522 | -- | 310 | -- | 20,857 |
| Ubisoft Entertainment SA | 204,478 | -- | 9,994 | -- | 417,931 |
| Zendesk, Inc. | 106,272 | 3,035 | 989 | -- | 158,844 |
| Total | $1,724,136 | $633,587 | $290,238 | $-- | $2,083,898 |
* Includes the value of securities delivered through in-kind transactions, if applicable.
Investment Valuation
The following is a summary of the inputs used, as of July 31, 2016, involving the Fund's assets and liabilities carried at fair value. The inputs or methodology used for valuing securities may not be an indication of the risk associated with investing in those securities. For more information on valuation inputs, and their aggregation into the levels used below, please refer to the Investment Valuation section in the accompanying Notes to Financial Statements.
| | Valuation Inputs at Reporting Date: |
| Description | Total | Level 1 | Level 2 | Level 3 |
| (Amounts in thousands) | | | | |
| Investments in Securities: | | | | |
| Equities: | | | | |
| Consumer Discretionary | $2,558,306 | $2,511,990 | $-- | $46,316 |
| Consumer Staples | 468,248 | 453,861 | -- | 14,387 |
| Energy | 89,293 | 89,293 | -- | -- |
| Financials | 620,270 | 579,967 | -- | 40,303 |
| Health Care | 2,665,173 | 2,598,526 | 8,921 | 57,726 |
| Industrials | 418,824 | 392,958 | -- | 25,866 |
| Information Technology | 6,514,003 | 6,240,555 | 12,865 | 260,583 |
| Telecommunication Services | 5,956 | -- | -- | 5,956 |
| Corporate Bonds | 373 | -- | -- | 373 |
| Money Market Funds | 355,177 | 355,177 | -- | -- |
| Total Investments in Securities: | $13,695,623 | $13,222,327 | $21,786 | $451,510 |
The following is a reconciliation of Investments in Securities for which Level 3 inputs were used in determining value:
| (Amounts in thousands) | |
| Investments in Securities: | |
| Equities - Information Technology | |
| Beginning Balance | $203,955 |
| Net Realized Gain (Loss) on Investment Securities | -- |
| Net Unrealized Gain (Loss) on Investment Securities | 8,033 |
| Cost of Purchases | 53,856 |
| Proceeds of Sales | (5,261) |
| Amortization/Accretion | -- |
| Transfers into Level 3 | -- |
| Transfers out of Level 3 | -- |
| Ending Balance | $260,583 |
| The change in unrealized gain (loss) for the period attributable to Level 3 securities held at July 31, 2016 | $10,130 |
| Other Investments in Securities | |
| Beginning Balance | $133,963 |
| Net Realized Gain (Loss) on Investment Securities | (9,169) |
| Net Unrealized Gain (Loss) on Investment Securities | 15,556 |
| Cost of Purchases | 55,771 |
| Proceeds of Sales | (5,194) |
| Amortization/Accretion | -- |
| Transfers into Level 3 | -- |
| Transfers out of Level 3 | -- |
| Ending Balance | $190,927 |
| The change in unrealized gain (loss) for the period attributable to Level 3 securities held at July 31, 2016 | $15,538 |
The information used in the above reconciliations represents fiscal year to date activity for any Investments in Securities identified as using Level 3 inputs at either the beginning or the end of the current fiscal period. Transfers in or out of Level 3 represent the beginning value of any Security or Instrument where a change in the pricing level occurred from the beginning to the end of the period. The cost of purchases and the proceeds of sales may include securities received or delivered through corporate actions or exchanges. Realized and unrealized gains (losses) disclosed in the reconciliations are included in Net Gain (Loss) on the Fund's Statement of Operations.
Other Information
Distribution of investments by country or territory of incorporation, as a percentage of Total Net Assets, is as follows (Unaudited):
| United States of America | 86.8% |
| France | 5.0% |
| Ireland | 3.5% |
| Netherlands | 1.2% |
| Canada | 1.0% |
| Others (Individually Less Than 1%) | 2.5% |
| | 100.0% |
See accompanying notes which are an integral part of the financial statements.
Financial Statements
Statement of Assets and Liabilities
| Amounts in thousands (except per-share amounts) | | July 31, 2016 |
| Assets | | |
Investment in securities, at value (including securities loaned of $330,576) — See accompanying schedule:
Unaffiliated issuers (cost $8,019,372) | $11,256,548 | |
| Fidelity Central Funds (cost $355,177) | 355,177 | |
| Other affiliated issuers (cost $1,908,683) | 2,083,898 | |
| Total Investments (cost $10,283,232) | | $13,695,623 |
| Receivable for investments sold | | 58,828 |
| Receivable for fund shares sold | | 16,630 |
| Dividends receivable | | 338 |
| Interest receivable | | 2 |
| Distributions receivable from Fidelity Central Funds | | 689 |
| Other receivables | | 298 |
| Total assets | | 13,772,408 |
| Liabilities | | |
| Payable to custodian bank | $1,690 | |
| Payable for investments purchased | 53,943 | |
| Payable for fund shares redeemed | 14,579 | |
| Accrued management fee | 6,442 | |
| Other affiliated payables | 1,505 | |
| Other payables and accrued expenses | 204 | |
| Collateral on securities loaned, at value | 340,289 | |
| Total liabilities | | 418,652 |
| Net Assets | | $13,353,756 |
| Net Assets consist of: | | |
| Paid in capital | | $9,996,193 |
| Accumulated net investment loss | | (5,835) |
| Accumulated undistributed net realized gain (loss) on investments and foreign currency transactions | | (48,961) |
| Net unrealized appreciation (depreciation) on investments and assets and liabilities in foreign currencies | | 3,412,359 |
| Net Assets | | $13,353,756 |
| OTC: | | |
| Net Asset Value, offering price and redemption price per share ($9,845,460 ÷ 115,479 shares) | | $85.26 |
| Class K: | | |
| Net Asset Value, offering price and redemption price per share ($3,508,296 ÷ 40,691 shares) | | $86.22 |
See accompanying notes which are an integral part of the financial statements.
Statement of Operations
| Amounts in thousands | | Year ended July 31, 2016 |
| Investment Income | | |
| Dividends | | $76,464 |
| Interest | | 2 |
| Income from Fidelity Central Funds (including $28,604 from security lending) | | 28,650�� |
| Total income | | 105,116 |
| Expenses | | |
| Management fee | | |
| Basic fee | $75,511 | |
| Performance adjustment | 15,828 | |
| Transfer agent fees | 16,566 | |
| Accounting and security lending fees | 1,532 | |
| Custodian fees and expenses | 318 | |
| Independent trustees' fees and expenses | 56 | |
| Registration fees | 224 | |
| Audit | 96 | |
| Legal | 45 | |
| Interest | 36 | |
| Miscellaneous | 99 | |
| Total expenses before reductions | 110,311 | |
| Expense reductions | (559) | 109,752 |
| Net investment income (loss) | | (4,636) |
| Realized and Unrealized Gain (Loss) | | |
| Net realized gain (loss) on: | | |
| Investment securities: | | |
| Unaffiliated issuers | 119,969 | |
| Other affiliated issuers | 39,805 | |
| Foreign currency transactions | 29 | |
| Total net realized gain (loss) | | 159,803 |
Change in net unrealized appreciation (depreciation) on:
Investment securities | 263,020 | |
| Assets and liabilities in foreign currencies | (1) | |
| Total change in net unrealized appreciation (depreciation) | | 263,019 |
| Net gain (loss) | | 422,822 |
| Net increase (decrease) in net assets resulting from operations | | $418,186 |
See accompanying notes which are an integral part of the financial statements.
Statement of Changes in Net Assets
| Amounts in thousands | Year ended July 31, 2016 | Year ended July 31, 2015 |
| Increase (Decrease) in Net Assets | | |
| Operations | | |
| Net investment income (loss) | $(4,636) | $(11,952) |
| Net realized gain (loss) | 159,803 | 1,282,162 |
| Change in net unrealized appreciation (depreciation) | 263,019 | 1,068,362 |
| Net increase (decrease) in net assets resulting from operations | 418,186 | 2,338,572 |
| Distributions to shareholders from net realized gain | (704,905) | (1,408,892) |
| Share transactions - net increase (decrease) | 93,627 | 1,841,344 |
| Total increase (decrease) in net assets | (193,092) | 2,771,024 |
| Net Assets | | |
| Beginning of period | 13,546,848 | 10,775,824 |
| End of period | $13,353,756 | $13,546,848 |
| Other Information | | |
| Accumulated net investment loss end of period | $(5,835) | $(135) |
See accompanying notes which are an integral part of the financial statements.
Financial Highlights — Fidelity OTC Portfolio
| Years ended July 31, | 2016 | 2015 | 2014 | 2013 | 2012 |
| Selected Per–Share Data | | | | | |
| Net asset value, beginning of period | $86.98 | $81.23 | $78.98 | $57.53 | $59.28 |
| Income from Investment Operations | | | | | |
| Net investment income (loss)A | (.05) | (.11) | (.06) | .36B | (.08)C |
| Net realized and unrealized gain (loss) | 2.84 | 16.14 | 12.78 | 21.37 | (1.67) |
| Total from investment operations | 2.79 | 16.03 | 12.72 | 21.73 | (1.75) |
| Distributions from net investment income | – | – | (.05) | (.28) | – |
| Distributions from net realized gain | (4.51) | (10.28) | (10.42) | – | – |
| Total distributions | (4.51) | (10.28) | (10.47) | (.28) | – |
| Net asset value, end of period | $85.26 | $86.98 | $81.23 | $78.98 | $57.53 |
| Total ReturnD | 3.68% | 21.34% | 17.96% | 37.93% | (2.95)% |
| Ratios to Average Net AssetsE,F | | | | | |
| Expenses before reductions | .91% | .83% | .77% | .76% | .91% |
| Expenses net of fee waivers, if any | .91% | .83% | .77% | .76% | .91% |
| Expenses net of all reductions | .90% | .83% | .76% | .74% | .90% |
| Net investment income (loss) | (.07)% | (.13)% | (.08)% | .55%B | (.14)%C |
| Supplemental Data | | | | | |
| Net assets, end of period (in millions) | $9,845 | $9,710 | $7,870 | $6,693 | $5,499 |
| Portfolio turnover rateG | 56%H | 66%H | 106% | 116% | 149% |
A Calculated based on average shares outstanding during the period.
B Net Investment income per share reflects a large, non-recurring dividend which amounted to $.10 per share. Excluding this non-recurring dividend, the ratio of net investment income (loss) to average net assets would have been .40%.
C Net Investment income per share reflects a large, non-recurring dividend which amounted to $.03 per share. Excluding this non-recurring dividend, the ratio of net investment income (loss) to average net assets would have been (.20)%.
D Total returns would have been lower if certain expenses had not been reduced during the applicable periods shown.
E Fees and expenses of any underlying Fidelity Central Funds are not included in the Fund's expense ratio. The Fund indirectly bears its proportionate share of the expenses of any underlying Fidelity Central Funds.
F Expense ratios reflect operating expenses of the class. Expenses before reductions do not reflect amounts reimbursed by the investment adviser or reductions from brokerage service arrangements or reductions from other expense offset arrangements and do not represent the amount paid by the class during periods when reimbursements or reductions occur. Expenses net of fee waivers reflect expenses after reimbursement by the investment adviser but prior to reductions from brokerage service arrangements or other expense offset arrangements. Expenses net of all reductions represent the net expenses paid by the class.
G Amount does not include the portfolio activity of any underlying Fidelity Central Funds.
H Portfolio turnover rate excludes securities received or delivered in-kind.
See accompanying notes which are an integral part of the financial statements.
Financial Highlights — Fidelity OTC Portfolio Class K
| Years ended July 31, | 2016 | 2015 | 2014 | 2013 | 2012 |
| Selected Per–Share Data | | | | | |
| Net asset value, beginning of period | $87.87 | $81.96 | $79.60 | $57.94 | $59.61 |
| Income from Investment Operations | | | | | |
| Net investment income (loss)A | .04 | (.01) | .04 | .45B | –C,D |
| Net realized and unrealized gain (loss) | 2.88 | 16.29 | 12.87 | 21.53 | (1.67) |
| Total from investment operations | 2.92 | 16.28 | 12.91 | 21.98 | (1.67) |
| Distributions from net investment income | – | – | (.10) | (.32) | – |
| Distributions from net realized gain | (4.57) | (10.37) | (10.46) | – | – |
| Total distributions | (4.57) | (10.37) | (10.55)E | (.32) | – |
| Net asset value, end of period | $86.22 | $87.87 | $81.96 | $79.60 | $57.94 |
| Total ReturnF | 3.80% | 21.49% | 18.10% | 38.11% | (2.80)% |
| Ratios to Average Net AssetsG,H | | | | | |
| Expenses before reductions | .79% | .72% | .65% | .62% | .77% |
| Expenses net of fee waivers, if any | .79% | .72% | .65% | .62% | .77% |
| Expenses net of all reductions | .79% | .71% | .64% | .60% | .76% |
| Net investment income (loss) | .05% | (.02)% | .05% | .69%B | - %C,I |
| Supplemental Data | | | | | |
| Net assets, end of period (in millions) | $3,508 | $3,836 | $2,906 | $2,260 | $1,644 |
| Portfolio turnover rateJ | 56%K | 66%K | 106% | 116% | 149% |
A Calculated based on average shares outstanding during the period.
B Net Investment income per share reflects a large, non-recurring dividend which amounted to $.10 per share. Excluding this non-recurring dividend, the ratio of net investment income (loss) to average net assets would have been .53%.
C Net Investment income per share reflects a large, non-recurring dividend which amounted to $.03 per share. Excluding this non-recurring dividend, the ratio of net investment income (loss) to average net assets would have been (.06)%.
D Amount represents less than $.005 per share.
E Total distributions of $10.55 per share is comprised of distributions from net investment income of $.098 and distributions from net realized gain of $10.456 per share.
F Total returns would have been lower if certain expenses had not been reduced during the applicable periods shown.
G Fees and expenses of any underlying Fidelity Central Funds are not included in the Fund's expense ratio. The Fund indirectly bears its proportionate share of the expenses of any underlying Fidelity Central Funds.
H Expense ratios reflect operating expenses of the class. Expenses before reductions do not reflect amounts reimbursed by the investment adviser or reductions from brokerage service arrangements or reductions from other expense offset arrangements and do not represent the amount paid by the class during periods when reimbursements or reductions occur. Expenses net of fee waivers reflect expenses after reimbursement by the investment adviser but prior to reductions from brokerage service arrangements or other expense offset arrangements. Expenses net of all reductions represent the net expenses paid by the class.
I Amount represents less than .005%.
J Amount does not include the portfolio activity of any underlying Fidelity Central Funds.
K Portfolio turnover rate excludes securities received or delivered in-kind.
See accompanying notes which are an integral part of the financial statements.
Notes to Financial Statements
For the period ended July 31, 2016
(Amounts in thousands except percentages)
1. Organization.
Fidelity OTC Portfolio (the Fund) is a non-diversified fund of Fidelity Securities Fund (the Trust) and is authorized to issue an unlimited number of shares. The Trust is registered under the Investment Company Act of 1940, as amended (the 1940 Act), as an open-end management investment company organized as a Massachusetts business trust. The Fund offers OTC and Class K shares, each of which has equal rights as to assets and voting privileges. Each class has exclusive voting rights with respect to matters that affect that class.
2. Investments in Fidelity Central Funds.
The Fund invests in Fidelity Central Funds, which are open-end investment companies generally available only to other investment companies and accounts managed by the investment adviser and its affiliates. The Fund's Schedule of Investments lists each of the Fidelity Central Funds held as of period end, if any, as an investment of the Fund, but does not include the underlying holdings of each Fidelity Central Fund. As an Investing Fund, the Fund indirectly bears its proportionate share of the expenses of the underlying Fidelity Central Funds.
The Money Market Central Funds seek preservation of capital and current income and are managed by Fidelity Investments Money Management, Inc. (FIMM), an affiliate of the investment adviser. Annualized expenses of the Money Market Central Funds as of their most recent shareholder report date are less than .005%.
A complete unaudited list of holdings for each Fidelity Central Fund is available upon request or at the Securities and Exchange Commission (the SEC) website at www.sec.gov. In addition, the financial statements of the Fidelity Central Funds, which are not covered by the Fund's Report of Independent Registered Public Accounting Firm, are available on the SEC website or upon request.
3. Significant Accounting Policies.
The financial statements have been prepared in conformity with accounting principles generally accepted in the United States of America (GAAP), which require management to make certain estimates and assumptions at the date of the financial statements. Actual results could differ from those estimates. Subsequent events, if any, through the date that the financial statements were issued have been evaluated in the preparation of the financial statements. The following summarizes the significant accounting policies of the Fund:
Investment Valuation. Investments are valued as of 4:00 p.m. Eastern time on the last calendar day of the period. The Board of Trustees (the Board) has delegated the day to day responsibility for the valuation of the Fund's investments to the Fidelity Management & Research Company (FMR) Fair Value Committee (the Committee). In accordance with valuation policies and procedures approved by the Board, the Fund attempts to obtain prices from one or more third party pricing vendors or brokers to value its investments. When current market prices, quotations or currency exchange rates are not readily available or reliable, investments will be fair valued in good faith by the Committee, in accordance with procedures adopted by the Board. Factors used in determining fair value vary by investment type and may include market or investment specific events, changes in interest rates and credit quality. The frequency with which these procedures are used cannot be predicted and they may be utilized to a significant extent. The Committee oversees the Fund's valuation policies and procedures and reports to the Board on the Committee's activities and fair value determinations. The Board monitors the appropriateness of the procedures used in valuing the Fund's investments and ratifies the fair value determinations of the Committee.
The Fund categorizes the inputs to valuation techniques used to value its investments into a disclosure hierarchy consisting of three levels as shown below:
- Level 1 – quoted prices in active markets for identical investments
- Level 2 – other significant observable inputs (including quoted prices for similar investments, interest rates, prepayment speeds, etc.)
- Level 3 – unobservable inputs (including the Fund's own assumptions based on the best information available)
Valuation techniques used to value the Fund's investments by major category are as follows:
Equity securities, including restricted securities, for which market quotations are readily available, are valued at the last reported sale price or official closing price as reported by a third party pricing vendor on the primary market or exchange on which they are traded and are categorized as Level 1 in the hierarchy. In the event there were no sales during the day or closing prices are not available, securities are valued at the last quoted bid price or may be valued using the last available price and are generally categorized as Level 2 in the hierarchy. For foreign equity securities, when market or security specific events arise, comparisons to the valuation of American Depositary Receipts (ADRs), futures contracts, Exchange-Traded Funds (ETFs) and certain indexes as well as quoted prices for similar securities may be used and would be categorized as Level 2 in the hierarchy. Utilizing these techniques may result in transfers between Level 1 and Level 2. For equity securities, including restricted securities, where observable inputs are limited, assumptions about market activity and risk are used and these securities may be categorized as Level 3 in the hierarchy. Equity securities, including restricted securities, for which observable inputs are not available are valued using alternate valuation approaches, including the market approach and the income approach and are categorized as Level 3 in the hierarchy. The market approach generally consists of using comparable market transactions while the income approach generally consists of using the net present value of estimated future cash flows, adjusted as appropriate for liquidity, credit, market and/or other risk factors.
Debt securities, including restricted securities, are valued based on evaluated prices received from third party pricing vendors or from brokers who make markets in such securities. Corporate bonds are valued by pricing vendors who utilize matrix pricing which considers yield or price of bonds of comparable quality, coupon, maturity and type or by broker-supplied prices. When independent prices are unavailable or unreliable, debt securities may be valued utilizing pricing methodologies which consider similar factors that would be used by third party pricing vendors. Debt securities are generally categorized as Level 2 in the hierarchy but may be Level 3 depending on the circumstances.
Investments in open-end mutual funds, including the Fidelity Central Funds, are valued at their closing net asset value (NAV) each business day and are categorized as Level 1 in the hierarchy.
The following provides information on Level 3 securities held by the Fund that were valued at period end based on unobservable inputs. These amounts exclude valuations provided by a broker.
| Asset Type | Fair Value at 07/31/16 (000s) | Valuation Technique(s) | Unobservable Input | Amount or Range/Weighted Average | Impact to Valuation from an Increase in Input(a) |
| Corporate Bonds | $ 373 | Market approach | Transaction price | $100 | Increase |
| Equities | $ 451,137 | Discounted cash flow | Discount rate | 8.0% - 20.0% / 16.1% | Decrease |
| | | | Weighted average cost of capital (WACC) | 11.6% - 40.0% / 15.3% | Decrease |
| | | | Discount for lack of marketability | 20.0% - 25.0% / 23.0% | Decrease |
| | | | Growth rate | 2.5% - 3.0% / 2.7% | Increase |
| | | Market approach | Acquisition terms | $0.66- $8.74 / $8.65 | Increase |
| | | | Transaction price | $3.46 - $96.42 / $49.55 | Increase |
| | | | Proxy based discount | 40.3% | Decrease |
| | | Market comparable | Enterprise value/Sales multiple (EV/S) | 0.6 - 15.6 / 3.3 | Increase |
| | | | Discount rate | 0.9% - 50.0% / 13.3% | Decrease |
| | | | Price/Earnings multiple (P/E) | 9.1 | Increase |
| | | | Discount for lack of marketability | 10.0% - 25.0% / 16.2% | Decrease |
| | | | Growth rate | 3.0% | Increase |
| | | | Enterprise value/Gross profit multiple (EV/GP) | 4.8 | Increase |
| | | | Premium rate | 4.0% - 235.0% / 27.2% | Increase |
| | | Recovery value | Liquidation preference | $8.34 - $23.41 / $18.47 | Increase |
(a) Represents the expected directional change in the fair value of the Level 3 investments that would result from an increase in the corresponding input. A decrease to the unobservable input would have the opposite effect. Significant changes in these inputs could result in significantly higher or lower fair value measurements.
Changes in valuation techniques may result in transfers in or out of an assigned level within the disclosure hierarchy. The aggregate value of investments by input level as of July 31, 2016, as well as a roll forward of Level 3 investments, is included at the end of the Fund's Schedule of Investments.
Foreign Currency. The Fund may use foreign currency contracts to facilitate transactions in foreign-denominated securities. Gains and losses from these transactions may arise from changes in the value of the foreign currency or if the counterparties do not perform under the contracts' terms.
Foreign-denominated assets, including investment securities, and liabilities are translated into U.S. dollars at the exchange rates at period end. Purchases and sales of investment securities, income and dividends received and expenses denominated in foreign currencies are translated into U.S. dollars at the exchange rate in effect on the transaction date.
The effects of exchange rate fluctuations on investments are included with the net realized and unrealized gain (loss) on investment securities. Other foreign currency transactions resulting in realized and unrealized gain (loss) are disclosed separately.
Investment Transactions and Income. For financial reporting purposes, the Fund's investment holdings and NAV include trades executed through the end of the last business day of the period. The NAV per share for processing shareholder transactions is calculated as of the close of business of the New York Stock Exchange (NYSE), normally 4:00 p.m. Eastern time and includes trades executed through the end of the prior business day. Gains and losses on securities sold are determined on the basis of identified cost and may include proceeds received from litigation. Dividend income is recorded on the ex-dividend date, except for certain dividends from foreign securities where the ex-dividend date may have passed, which are recorded as soon as the Fund is informed of the ex-dividend date. Non-cash dividends included in dividend income, if any, are recorded at the fair market value of the securities received. Income and capital gain distributions from Fidelity Central Funds, if any, are recorded on the ex-dividend date. Distributions received on securities that represent a return of capital or capital gain are recorded as a reduction of cost of investments and/or as a realized gain. Subsequent to ex-dividend date the Fund determines the components of these distributions, based upon receipt of tax filings or other correspondence relating to the underlying investment. Interest income is accrued as earned and includes coupon interest and amortization of premium and accretion of discount on debt securities as applicable. Investment income is recorded net of foreign taxes withheld where recovery of such taxes is uncertain.
Class Allocations and Expenses. Investment income, realized and unrealized capital gains and losses, common expenses of the Fund, and certain fund-level expense reductions, if any, are allocated daily on a pro-rata basis to each class based on the relative net assets of each class to the total net assets of the Fund. Each class differs with respect to transfer agent fees incurred. Certain expense reductions may also differ by class. For the reporting period, the allocated portion of income and expenses to each class as a percent of its average net assets may vary due to the timing of recording these transactions in relation to fluctuating net assets of the classes. Expenses directly attributable to a fund are charged to that fund. Expenses attributable to more than one fund are allocated among the respective funds on the basis of relative net assets or other appropriate methods. Expense estimates are accrued in the period to which they relate and adjustments are made when actual amounts are known.
Deferred Trustee Compensation. Under a Deferred Compensation Plan (the Plan), independent Trustees may elect to defer receipt of a portion of their annual compensation. Deferred amounts are invested in a cross-section of Fidelity funds, are marked-to-market and remain in the Fund until distributed in accordance with the Plan. The investment of deferred amounts and the offsetting payable to the Trustees are included in the accompanying Statement of Assets and Liabilities.
Income Tax Information and Distributions to Shareholders. Each year, the Fund intends to qualify as a regulated investment company under Subchapter M of the Internal Revenue Code, including distributing substantially all of its taxable income and realized gains. As a result, no provision for U.S. Federal income taxes is required. As of July 31, 2016, the Fund did not have any unrecognized tax benefits in the financial statements; nor is the Fund aware of any tax positions for which it is reasonably possible that the total amounts of unrecognized tax benefits will significantly change in the next twelve months. The Fund files a U.S. federal tax return, in addition to state and local tax returns as required. The Fund's federal income tax returns are subject to examination by the Internal Revenue Service (IRS) for a period of three fiscal years after they are filed. State and local tax returns may be subject to examination for an additional fiscal year depending on the jurisdiction. Foreign taxes are provided for based on the Fund's understanding of the tax rules and rates that exist in the foreign markets in which it invests.
Distributions are declared and recorded on the ex-dividend date. Income dividends and capital gain distributions are declared separately for each class. Income and capital gain distributions are determined in accordance with income tax regulations, which may differ from GAAP. In addition, the Fund claimed a portion of the payment made to redeeming shareholders as a distribution for income tax purposes.
Capital accounts within the financial statements are adjusted for permanent book-tax differences. These adjustments have no impact on net assets or the results of operations. Capital accounts are not adjusted for temporary book-tax differences which will reverse in a subsequent period.
Book-tax differences are primarily due to redemptions in-kind, foreign currency transactions, passive foreign investment companies (PFIC), partnerships, deferred trustees compensation and losses deferred due to wash sales and excise tax regulations.
The federal tax cost of investment securities and unrealized appreciation (depreciation) as of period end were as follows:
| Gross unrealized appreciation | $4,383,043 |
| Gross unrealized depreciation | (1,019,613) |
| Net unrealized appreciation (depreciation) on securities | $3,363,430 |
| Tax Cost | $10,332,193 |
The tax-based components of distributable earnings as of period end were as follows:
| Net unrealized appreciation (depreciation) on securities and other investments | $3,363,398 |
The Fund intends to elect to defer to its next fiscal year $5,717 of ordinary losses recognized during the period January 1, 2016 to July 31, 2016.
The tax character of distributions paid was as follows:
| | July 31, 2016 | July 31, 2015 |
| Ordinary Income | $274,436 | $ 637,244 |
| Long-term Capital Gains | 430,469 | 771,648 |
| Total | $704,905 | $ 1,408,892 |
Restricted Securities. The Fund may invest in securities that are subject to legal or contractual restrictions on resale. These securities generally may be resold in transactions exempt from registration or to the public if the securities are registered. Disposal of these securities may involve time-consuming negotiations and expense, and prompt sale at an acceptable price may be difficult. Information regarding restricted securities is included at the end of the Fund's Schedule of Investments.
Consolidated Subsidiary. The Fund invests in certain investments through a wholly-owned subsidiary ("Subsidiary"), which may be subject to federal and state taxes upon disposition.
At period end, investments held through this Subsidiary were $4,119 representing 0.03% of the Fund's net assets. The financial statements have been consolidated and include accounts of the Fund and each Subsidiary. Accordingly, all inter-company transactions and balances have been eliminated.
4. Purchases and Sales of Investments.
Purchases and sales of securities, other than short-term securities and in-kind transactions, aggregated $7,148,000 and $7,557,829, respectively.
Redemptions In-Kind. During the period, 1,292 shares of the Fund held by an unaffiliated entity were redeemed in-kind for cash and investments with a value of $104,098. The net realized gain of $41,724 on investments delivered through the in-kind redemptions is included in the accompanying Statement of Operations. The amount of in-kind redemptions is included in share transactions in the accompanying Statement of Changes in Net Assets as well as Note 11: Share Transactions. The Fund recognized no gain or loss for federal income tax purposes.
Prior Fiscal Year Redemptions In-Kind. During the prior period, 2,605 shares of the Fund held by unaffiliated entities were redeemed for cash and investments with a value of $225,764. The Fund had a net realized gain of $95,853 on investments delivered through the in-kind redemptions. The amount of in-kind redemptions is included in share transactions in the accompanying Statement of Changes in Net Assets as well as Note 11: Share Transactions. The Fund recognized no gain or loss for federal income tax purposes.
5. Fees and Other Transactions with Affiliates.
Management Fee. Fidelity Management & Research Company (the investment adviser) and its affiliates provide the Fund with investment management related services for which the Fund pays a monthly management fee. The management fee is the sum of an individual fund fee rate that is based on an annual rate of .35% of the Fund's average net assets and an annualized group fee rate that averaged .25% during the period. The group fee rate is based upon the average net assets of all the mutual funds advised by the investment adviser, including any mutual funds previously advised by the investment adviser that are currently advised by Fidelity SelectCo, LLC, an affiliate of the investment adviser. The group fee rate decreases as assets under management increase and increases as assets under management decrease. In addition, the management fee is subject to a performance adjustment (up to a maximum of +/- .20% of the Fund's average net assets over a 36 month performance period). The upward or downward adjustment to the management fee is based on the relative investment performance of OTC as compared to its benchmark index, the Nasdaq Composite Index, over the same 36 month performance period. For the reporting period, the total annual management fee rate, including the performance adjustment, was .72% of the Fund's average net assets. The performance adjustment included in the management fee rate may be higher or lower than the maximum performance adjustment rate due to the difference between the average net assets for the reporting and performance periods.
Transfer Agent Fees. Fidelity Investments Institutional Operations Company, Inc., (FIIOC), an affiliate of the investment adviser, is the transfer, dividend disbursing and shareholder servicing agent for each class of the Fund. FIIOC receives account fees and asset-based fees that vary according to the account size and type of account of the shareholders of OTC. FIIOC receives an asset-based fee of Class K's average net assets. FIIOC pays for typesetting, printing and mailing of shareholder reports, except proxy statements.
For the period, transfer agent fees for each class were as follows:
| | Amount | % of
Class-Level Average
Net Assets |
| OTC | $14,944 | .16 |
| Class K | 1,622 | .05 |
| | $ 16,566 | |
Accounting and Security Lending Fees. Fidelity Service Company, Inc. (FSC), an affiliate of the investment adviser, maintains the Fund's accounting records. The accounting fee is based on the level of average net assets for each month. Under a separate contract, FSC administers the security lending program. The security lending fee is based on the number and duration of lending transactions.
Brokerage Commissions. The Fund placed a portion of its portfolio transactions with brokerage firms which are affiliates of the investment adviser. Brokerage commissions are included in net realized gain (loss) and change in net unrealized appreciation (depreciation) in the Statement of Operations. The commissions paid to these affiliated firms were $201 for the period.
Interfund Lending Program. Pursuant to an Exemptive Order issued by the SEC, the Fund, along with other registered investment companies having management contracts with FMR or other affiliated entities of FMR, may participate in an interfund lending program. This program provides an alternative credit facility allowing the funds to borrow from, or lend money to, other participating affiliated funds. At period end, there were no interfund loans outstanding. The Fund's activity in this program during the period for which loans were outstanding was as follows:
| Borrower or Lender | Average Loan Balance | Weighted Average Interest Rate | Interest Expense |
| Borrower | $16,554 | .57% | $34 |
Interfund Trades. The Fund may purchase from or sell securities to other Fidelity Funds under procedures adopted by the Board. The procedures have been designed to ensure these interfund trades are executed in accordance with Rule 17a-7 of the 1940 Act. Interfund trades are included within the respective purchases and sales amounts shown in the Purchases and Sales of Investments note.
6. Committed Line of Credit.
The Fund participates with other funds managed by the investment adviser or an affiliate in a $4.25 billion credit facility (the "line of credit") to be utilized for temporary or emergency purposes to fund shareholder redemptions or for other short-term liquidity purposes. The Fund has agreed to pay commitment fees on its pro-rata portion of the line of credit, which amounted to $26 and is reflected in Miscellaneous expenses on the Statement of Operations. During the period, the Fund did not borrow on this line of credit.
7. Security Lending.
The Fund lends portfolio securities through a lending agent from time to time in order to earn additional income. For equity securities, a lending agent is used and may loan securities to certain qualified borrowers, including Fidelity Capital Markets (FCM), a broker-dealer affiliated with the Fund. On the settlement date of the loan, the Fund receives collateral (in the form of U.S. Treasury obligations, letters of credit and/or cash) against the loaned securities and maintains collateral in an amount not less than 100% of the market value of the loaned securities during the period of the loan. The market value of the loaned securities is determined at the close of business of the Fund and any additional required collateral is delivered to the Fund on the next business day. The Fund or borrower may terminate the loan at any time, and if the borrower defaults on its obligation to return the securities loaned because of insolvency or other reasons, the Fund may apply collateral received from the borrower against the obligation. The Fund may experience delays and costs in recovering the securities loaned. Any cash collateral received is invested in the Fidelity Securities Lending Cash Central Fund. The value of loaned securities and cash collateral at period end are disclosed on the Fund's Statement of Assets and Liabilities. The value of securities loaned to FCM at period end was $26,708. Security lending income represents the income earned on investing cash collateral, less rebates paid to borrowers and any lending agent fees associated with the loan, plus any premium payments received for lending certain types of securities. Security lending income is presented in the Statement of Operations as a component of income from Fidelity Central Funds, and includes $2,706 from securities loaned to FCM.
8. Bank Borrowings.
The Fund is permitted to have bank borrowings for temporary or emergency purposes to fund shareholder redemptions or for other short-term liquidity requirements. The Fund has established borrowing arrangements with certain banks. The interest rate on the borrowings is the bank's base rate, as revised from time to time. The average loan balance during the period for which loans were outstanding amounted to $10,860. The weighted average interest rate was .88%. The interest expense amounted to $2 under the bank borrowing program. At period end, there were no bank borrowings outstanding.
9. Expense Reductions.
Commissions paid to certain brokers with whom the investment adviser, or its affiliates, places trades on behalf of the Fund include an amount in addition to trade execution, which may be rebated back to the Fund to offset certain expenses. This amount totaled $460 for the period. In addition, through arrangements with the Fund's custodian, credits realized as a result of certain uninvested cash balances were used to reduce the Fund's expenses. During the period, these credits reduced the Fund's custody expenses by $1.
In addition, during the period the investment adviser reimbursed and/or waived a portion of fund-level operating expenses in the amount of $98.
10. Distributions to Shareholders.
Distributions to shareholders of each class were as follows:
| | Year ended
July 31, 2016 | Year ended July 31, 2015 |
| From net realized gain | | |
| OTC | $505,475 | $1,012,327 |
| Class K | 199,430 | 396,565 |
| Total | $704,905 | $1,408,892 |
11. Share Transactions.
Share transactions for each class were as follows and may contain automatic conversions between classes or exchanges between affiliated funds:
| | Shares | Shares | Dollars | Dollars |
| | Year ended
July 31, 2016 | Year ended
July 31, 2015 | Year ended
July 31, 2016 | Year ended
July 31, 2015 |
| OTC | | | | |
| Shares sold | 23,178 | 22,946 | $1,818,054 | $1,893,100 |
| Reinvestment of distributions | 6,240 | 12,406 | 491,074 | 985,025 |
| Shares redeemed | (25,573) | (20,601) | (1,979,810) | (1,665,615) |
| Net increase (decrease) | 3,845 | 14,751 | $329,318 | $1,212,510 |
| Class K | | | | |
| Shares sold | 11,562 | 16,984 | $911,130 | $1,383,593 |
| Reinvestment of distributions | 2,509 | 4,953 | 199,430 | 396,565 |
| Shares redeemed | (17,040)(a) | (13,732)(b) | (1,346,251)(a) | (1,151,324)(b) |
| Net increase (decrease) | (2,969) | 8,205 | $(235,691) | $628,834 |
(a) Amount includes in-kind redemptions (see Note 4: Redemptions In-Kind).
(b) Amount includes in-kind redemptions (see Note 4: Prior Fiscal Year Redemptions In-Kind).
12. Other.
The Fund's organizational documents provide former and current trustees and officers with a limited indemnification against liabilities arising in connection with the performance of their duties to the Fund. In the normal course of business, the Fund may also enter into contracts that provide general indemnifications. The Fund's maximum exposure under these arrangements is unknown as this would be dependent on future claims that may be made against the Fund. The risk of material loss from such claims is considered remote.
Report of Independent Registered Public Accounting Firm
To the Trustees of Fidelity Securities Fund and Shareholders of Fidelity OTC Portfolio:
We have audited the accompanying statement of assets and liabilities of Fidelity OTC Portfolio (the Fund), a fund of Fidelity Securities Fund, including the schedule of investments, as of July 31, 2016, and the related statement of operations for the year then ended, the statement of changes in net assets for each of the two years in the period then ended, and the financial highlights for each of the five years in the period then ended. These financial statements and financial highlights are the responsibility of the Fund's management. Our responsibility is to express an opinion on these financial statements and financial highlights based on our audits.
We conducted our audits in accordance with the standards of the Public Company Accounting Oversight Board (United States). Those standards require that we plan and perform the audit to obtain reasonable assurance about whether the financial statements and financial highlights are free of material misstatement. The Fund is not required to have, nor were we engaged to perform, an audit of its internal control over financial reporting. Our audits included consideration of internal control over financial reporting as a basis for designing audit procedures that are appropriate in the circumstances, but not for the purpose of expressing an opinion on the effectiveness of the Fund's internal control over financial reporting. Accordingly, we express no such opinion. An audit also includes examining, on a test basis, evidence supporting the amounts and disclosures in the financial statements, assessing the accounting principles used and significant estimates made by management, as well as evaluating the overall financial statement presentation. Our procedures included confirmation of securities owned as of July 31, 2016, by correspondence with the custodians and brokers; when replies were not received from brokers, we performed other auditing procedures. We believe that our audits provide a reasonable basis for our opinion.
In our opinion, such financial statements and financial highlights referred to above present fairly, in all material respects, the financial position of Fidelity OTC Portfolio as of July 31, 2016, the results of its operations for the year then ended, the changes in its net assets for each of the two years in the period then ended, and the financial highlights for each of the five years in the period then ended, in conformity with accounting principles generally accepted in the United States of America.
DELOITTE & TOUCHE LLP
Boston, Massachusetts
September 19, 2016
Trustees and Officers
The Trustees, Members of the Advisory Board (if any), and officers of the trust and fund, as applicable, are listed below. The Board of Trustees governs the fund and is responsible for protecting the interests of shareholders. The Trustees are experienced executives who meet periodically throughout the year to oversee the fund's activities, review contractual arrangements with companies that provide services to the fund, oversee management of the risks associated with such activities and contractual arrangements, and review the fund's performance. Each of the Trustees oversees 170 funds.
The Trustees hold office without limit in time except that (a) any Trustee may resign; (b) any Trustee may be removed by written instrument, signed by at least two-thirds of the number of Trustees prior to such removal; (c) any Trustee who requests to be retired or who has become incapacitated by illness or injury may be retired by written instrument signed by a majority of the other Trustees; and (d) any Trustee may be removed at any special meeting of shareholders by a two-thirds vote of the outstanding voting securities of the trust. Each Trustee who is not an interested person (as defined in the 1940 Act) of the trust and the fund is referred to herein as an Independent Trustee. Each Independent Trustee shall retire not later than the last day of the calendar year in which his or her 75th birthday occurs. The Independent Trustees may waive this mandatory retirement age policy with respect to individual Trustees. Officers and Advisory Board Members hold office without limit in time, except that any officer or Advisory Board Member may resign or may be removed by a vote of a majority of the Trustees at any regular meeting or any special meeting of the Trustees. Except as indicated, each individual has held the office shown or other offices in the same company for the past five years.
The fund’s Statement of Additional Information (SAI) includes more information about the Trustees. To request a free copy, call Fidelity at 1-800-544-8544.
Experience, Skills, Attributes, and Qualifications of the Trustees. The Governance and Nominating Committee has adopted a statement of policy that describes the experience, qualifications, attributes, and skills that are necessary and desirable for potential Independent Trustee candidates (Statement of Policy). The Board believes that each Trustee satisfied at the time he or she was initially elected or appointed a Trustee, and continues to satisfy, the standards contemplated by the Statement of Policy. The Governance and Nominating Committee also engages professional search firms to help identify potential Independent Trustee candidates who have the experience, qualifications, attributes, and skills consistent with the Statement of Policy. From time to time, additional criteria based on the composition and skills of the current Independent Trustees, as well as experience or skills that may be appropriate in light of future changes to board composition, business conditions, and regulatory or other developments, have also been considered by the professional search firms and the Governance and Nominating Committee. In addition, the Board takes into account the Trustees' commitment and participation in Board and committee meetings, as well as their leadership of standing and ad hoc committees throughout their tenure.
In determining that a particular Trustee was and continues to be qualified to serve as a Trustee, the Board has considered a variety of criteria, none of which, in isolation, was controlling. The Board believes that, collectively, the Trustees have balanced and diverse experience, qualifications, attributes, and skills, which allow the Board to operate effectively in governing the fund and protecting the interests of shareholders. Information about the specific experience, skills, attributes, and qualifications of each Trustee, which in each case led to the Board's conclusion that the Trustee should serve (or continue to serve) as a trustee of the fund, is provided below.
Board Structure and Oversight Function. James C. Curvey is an interested person and currently serves as Chairman. The Trustees have determined that an interested Chairman is appropriate and benefits shareholders because an interested Chairman has a personal and professional stake in the quality and continuity of services provided to the fund. Independent Trustees exercise their informed business judgment to appoint an individual of their choosing to serve as Chairman, regardless of whether the Trustee happens to be independent or a member of management. The Independent Trustees have determined that they can act independently and effectively without having an Independent Trustee serve as Chairman and that a key structural component for assuring that they are in a position to do so is for the Independent Trustees to constitute a substantial majority for the Board. The Independent Trustees also regularly meet in executive session. Ned C. Lautenbach serves as Chairman of the Independent Trustees and as such (i) acts as a liaison between the Independent Trustees and management with respect to matters important to the Independent Trustees and (ii) with management prepares agendas for Board meetings.
Fidelity® funds are overseen by different Boards of Trustees. The fund's Board oversees Fidelity's high income and certain equity funds, and other Boards oversee Fidelity's investment-grade bond, money market, asset allocation, and sector funds. The asset allocation funds may invest in Fidelity® funds overseen by the fund's Board. The use of separate Boards, each with its own committee structure, allows the Trustees of each group of Fidelity® funds to focus on the unique issues of the funds they oversee, including common research, investment, and operational issues. On occasion, the separate Boards establish joint committees to address issues of overlapping consequences for the Fidelity® funds overseen by each Board.
The Trustees operate using a system of committees to facilitate the timely and efficient consideration of all matters of importance to the Trustees, the fund, and fund shareholders and to facilitate compliance with legal and regulatory requirements and oversight of the fund's activities and associated risks. The Board, acting through its committees, has charged FMR and its affiliates with (i) identifying events or circumstances the occurrence of which could have demonstrably adverse effects on the fund's business and/or reputation; (ii) implementing processes and controls to lessen the possibility that such events or circumstances occur or to mitigate the effects of such events or circumstances if they do occur; and (iii) creating and maintaining a system designed to evaluate continuously business and market conditions in order to facilitate the identification and implementation processes described in (i) and (ii) above. Because the day-to-day operations and activities of the fund are carried out by or through FMR, its affiliates, and other service providers, the fund's exposure to risks is mitigated but not eliminated by the processes overseen by the Trustees. While each of the Board's committees has responsibility for overseeing different aspects of the fund's activities, oversight is exercised primarily through the Operations, Audit, and Compliance Committees. In addition, the Independent Trustees have worked with FMR to enhance the Board's oversight of investment and financial risks, legal and regulatory risks, technology risks, and operational risks, including the development of additional risk reporting to the Board. For example, a working group comprised of Independent Trustees and FMR has worked and continues to work to review the Fidelity® funds' valuation-related activities, reporting and risk management. Appropriate personnel, including but not limited to the fund's Chief Compliance Officer (CCO), FMR's internal auditor, the independent accountants, the fund's Treasurer and portfolio management personnel, make periodic reports to the Board's committees, as appropriate, including an annual review of Fidelity's risk management program for the Fidelity® funds. The responsibilities of each standing committee, including their oversight responsibilities, are described further under "Standing Committees of the Trustees."
Interested Trustees*:
Correspondence intended for a Trustee who is an interested person may be sent to Fidelity Investments, 245 Summer Street, Boston, Massachusetts 02210.
Name, Year of Birth; Principal Occupations and Other Relevant Experience+
James C. Curvey (1935)
Year of Election or Appointment: 2007
Trustee
Chairman of the Board of Trustees
Mr. Curvey also serves as Trustee of other Fidelity® funds. Mr. Curvey is a Director of Fidelity Research & Analysis Co. (investment adviser firm, 2009-present), and Vice Chairman (2007-present) and Director of FMR LLC (diversified financial services company). In addition, Mr. Curvey serves as an Overseer for the Boston Symphony Orchestra and a member of the board of Artis-Naples, Naples, Florida, and as a Trustee for Brewster Academy, Wolfeboro, New Hampshire. Previously, Mr. Curvey served as a Director of Fidelity Investments Money Management, Inc. (investment adviser firm, 2009-2014) and a Director of FMR and FMR Co., Inc. (investment adviser firms, 2007-2014).
Charles S. Morrison (1960)
Year of Election or Appointment: 2014
Trustee
Mr. Morrison also serves as Trustee of other funds. He serves as a Director of Fidelity Investments Money Management, Inc. (FIMM) (investment adviser firm, 2014-present), Director of Fidelity SelectCo, LLC (investment adviser firm, 2014-present), President, Asset Management (2014-present), and is an employee of Fidelity Investments. Previously, Mr. Morrison served as Vice President of Fidelity's Fixed Income and Asset Allocation Funds (2012-2014), President, Fixed Income (2011-2014), Vice President of Fidelity's Money Market Funds (2005-2009), President, Money Market Group Leader of FMR (investment adviser firm, 2009), and Senior Vice President, Money Market Group of FMR (2004-2009). Mr. Morrison also served as Vice President of Fidelity's Bond Funds (2002-2005), certain Balanced Funds (2002-2005), and certain Asset Allocation Funds (2002-2007), and as Senior Vice President (2002-2005) of Fidelity's Bond Division.
* Determined to be an “Interested Trustee” by virtue of, among other things, his or her affiliation with the trust or various entities under common control with FMR.
+ The information includes the Trustee's principal occupation during the last five years and other information relating to the experience, attributes, and skills relevant to the Trustee's qualifications to serve as a Trustee, which led to the conclusion that the Trustee should serve as a Trustee for the fund.
Independent Trustees:
Correspondence intended for an Independent Trustee may be sent to Fidelity Investments, P.O. Box 55235, Boston, Massachusetts 02205-5235.
Name, Year of Birth; Principal Occupations and Other Relevant Experience+
Dennis J. Dirks (1948)
Year of Election or Appointment: 2005
Trustee
Mr. Dirks also serves as Trustee of other Fidelity® funds. Prior to his retirement in May 2003, Mr. Dirks was Chief Operating Officer and a member of the Board of The Depository Trust & Clearing Corporation (DTCC). He also served as President, Chief Operating Officer, and Board member of The Depository Trust Company (DTC) and President and Board member of the National Securities Clearing Corporation (NSCC). In addition, Mr. Dirks served as Chief Executive Officer and Board member of the Government Securities Clearing Corporation, Chief Executive Officer and Board member of the Mortgage-Backed Securities Clearing Corporation, as a Trustee and a member of the Finance Committee of Manhattan College (2005-2008), as a Trustee and a member of the Finance Committee of AHRC of Nassau County (2006-2008), and as a member of the Independent Directors Council (IDC) Governing Council (2010-2015). Mr. Dirks is a member of the Board of Directors for The Brookville Center for Children's Services, Inc. (2009-present).
Alan J. Lacy (1953)
Year of Election or Appointment: 2008
Trustee
Mr. Lacy also serves as Trustee of other Fidelity® funds. Mr. Lacy serves as Chairman (2014-present) and a member (2010-present) of the Board of Directors of Dave & Buster's Entertainment, Inc. (restaurant and entertainment complexes) and a Director of Bristol-Myers Squibb Company (global pharmaceuticals, 2008-present). He is a Trustee of the California Chapter of The Nature Conservancy (2015-present) and a Director of the Center for Advanced Study in the Behavioral Sciences at Stanford University (2015-present). In addition, Mr. Lacy served as Senior Adviser (2007-2014) of Oak Hill Capital Partners, L.P. (private equity) and also served as Chief Executive Officer (2005) and Vice Chairman (2005-2006) of Sears Holdings Corporation (retail) and Chief Executive Officer and Chairman of the Board of Sears, Roebuck and Co. (retail, 2000-2005). Previously, Mr. Lacy served as Chairman (2008-2011) and a member (2006-2015) of the Board of Trustees of the National Parks Conservation Association and as a member of the Board of Directors for The Western Union Company (global money transfer, 2006-2011), The Hillman Companies, Inc. (hardware wholesalers, 2010-2014), and Earth Fare, Inc. (retail grocery, 2010-2014).
Ned C. Lautenbach (1944)
Year of Election or Appointment: 2000
Trustee
Chairman of the Independent Trustees
Mr. Lautenbach also serves as Trustee of other Fidelity® funds. Mr. Lautenbach currently serves as the Lead Director of the Eaton Corporation Board of Directors (diversified industrial, 1997-present). Mr. Lautenbach is Chairman of the Board of Directors of Artis-Naples in Naples, Florida (2012-present), a member of the Council on Foreign Relations (1994-present), and a member of the Board of Governors, State University System of Florida (2013-present). Previously, Mr. Lautenbach was a Partner/Advisory Partner at Clayton, Dubilier & Rice, LLC (private equity investment, 1998-2010), as well as a Director of Sony Corporation (2006-2007).
Joseph Mauriello (1944)
Year of Election or Appointment: 2008
Trustee
Mr. Mauriello also serves as Trustee of other Fidelity® funds. Prior to his retirement in January 2006, Mr. Mauriello served in numerous senior management positions including Deputy Chairman and Chief Operating Officer (2004-2005), and Vice Chairman of Financial Services (2002-2004) of KPMG LLP US (professional services, 1965-2005). Mr. Mauriello currently serves as a member of the Board of Directors of XL Group plc. (global insurance and re-insurance, 2006-present) and the Independent Directors Council (IDC) Governing Council (2015-present). Previously, Mr. Mauriello served as a Director of the Hamilton Funds of the Bank of New York (2006-2007) and of Arcadia Resources Inc. (health care services and products, 2007-2012).
Robert W. Selander (1950)
Year of Election or Appointment: 2011
Trustee
Mr. Selander also serves as Trustee of other Fidelity® funds. Mr. Selander serves as a Director of The Western Union Company (global money transfer, 2014-present) and a non-executive Chairman of Health Equity, Inc. (health savings custodian, 2015-present). Previously, Mr. Selander served as a Member of the Advisory Board of certain Fidelity® funds (2011), and Executive Vice Chairman (2010), Chief Executive Officer (2009-2010), and President and Chief Executive Officer (1997-2009) of Mastercard, Inc.
Cornelia M. Small (1944)
Year of Election or Appointment: 2005
Trustee
Ms. Small also serves as Trustee of other Fidelity® funds. Ms. Small is a member of the Board of Directors (2009-present) and Chair of the Investment Committee (2010-present) of the Teagle Foundation. Ms. Small also serves on the Investment Committee of the Berkshire Taconic Community Foundation (2008-present). Previously, Ms. Small served as Chairperson (2002-2008) and a member of the Investment Committee and Chairperson (2008-2012) and a member of the Board of Trustees of Smith College. In addition, Ms. Small served as Chief Investment Officer, Director of Global Equity Investments, and a member of the Board of Directors of Scudder, Stevens & Clark and Scudder Kemper Investments.
William S. Stavropoulos (1939)
Year of Election or Appointment: 2002
Trustee
Vice Chairman of the Independent Trustees
Mr. Stavropoulos also serves as Trustee of other Fidelity® funds. Mr. Stavropoulos serves as President and Founder of the Michigan Baseball Foundation, the Great Lakes Loons (2007-present). Mr. Stavropoulos is Chairman Emeritus of the Board of Directors of The Dow Chemical Company, where he previously served in numerous senior management positions, including President, CEO (1995-2000; 2002-2004), Chairman of the Executive Committee (2000-2006), and as a member of the Board of Directors (1990-2006). Currently, Mr. Stavropoulos is Chairman of the Board of Directors of Univar Inc. (global distributor of commodity and specialty chemicals), a Director of Teradata Corporation (data warehousing and technology solutions), and Maersk Inc. (industrial conglomerate), and a member of the Advisory Board for Metalmark Capital LLC (private equity investment, 2005-present). Mr. Stavropoulos is an operating advisor to Clayton, Dubilier & Rice, LLC (private equity investment). In addition, Mr. Stavropoulos is a member of the University of Notre Dame Advisory Council for the College of Science, a Trustee of the Rollin L. Gerstacker Foundation, and a Director of the Naples Philharmonic Center for the Arts. Previously, Mr. Stavropoulos served as a Director of Chemical Financial Corporation (bank holding company, 1993-2012) and Tyco International, Ltd. (multinational manufacturing and services, 2007-2012).
David M. Thomas (1949)
Year of Election or Appointment: 2008
Trustee
Mr. Thomas also serves as Trustee of other Fidelity® funds. Mr. Thomas serves as Non-Executive Chairman of the Board of Directors of Fortune Brands Home and Security (home and security products, 2011-present), as a member of the Board of Directors (2004-present) and Presiding Director (2013-present) of Interpublic Group of Companies, Inc. (marketing communication), and as a member of the Board of Trustees of the University of Florida (2013-present). Previously, Mr. Thomas served as Executive Chairman (2005-2006) and Chairman and Chief Executive Officer (2000-2005) of IMS Health, Inc. (pharmaceutical and healthcare information solutions), and a Director of Fortune Brands, Inc. (consumer products, 2000-2011).
+ The information includes the Trustee's principal occupation during the last five years and other information relating to the experience, attributes, and skills relevant to the Trustee's qualifications to serve as a Trustee, which led to the conclusion that the Trustee should serve as a Trustee for the fund.
Advisory Board Members and Officers:
Correspondence intended for an officer or Peter S. Lynch may be sent to Fidelity Investments, 245 Summer Street, Boston, Massachusetts 02210. Officers appear below in alphabetical order.
Name, Year of Birth; Principal Occupation
Peter S. Lynch (1944)
Year of Election or Appointment: 2003
Member of the Advisory Board
Mr. Lynch also serves as Member of the Advisory Board of other Fidelity® funds. Mr. Lynch is Vice Chairman and a Director of FMR (investment adviser firm) and FMR Co., Inc. (investment adviser firm). In addition, Mr. Lynch serves as a Trustee of Boston College and as the Chairman of the Inner-City Scholarship Fund. Previously, Mr. Lynch served on the Special Olympics International Board of Directors (1997-2006).
Marc R. Bryant (1966)
Year of Election or Appointment: 2015
Secretary and Chief Legal Officer (CLO)
Mr. Bryant also serves as Secretary and CLO of other funds. Mr. Bryant serves as CLO, Secretary, and Senior Vice President of Fidelity Management & Research Company (investment adviser firm, 2015-present) and FMR Co., Inc. (investment adviser firm, 2015-present); Secretary of Fidelity SelectCo, LLC (investment adviser firm, 2015-present) and Fidelity Investments Money Management, Inc. (investment adviser firm, 2015-present); and CLO of Fidelity Management & Research (Hong Kong) Limited and FMR Investment Management (U.K.) Limited (investment adviser firms, 2015-present) and Fidelity Management & Research (Japan) Limited (investment adviser firm, 2016-present). He is Senior Vice President and Deputy General Counsel of FMR LLC (diversified financial services company). Previously, Mr. Bryant served as Secretary and CLO of Fidelity Rutland Square Trust II (2010-2014) and Assistant Secretary of Fidelity's Fixed Income and Asset Allocation Funds (2013-2015). Prior to joining Fidelity Investments, Mr. Bryant served as a Senior Vice President and the Head of Global Retail Legal for AllianceBernstein L.P. (2006-2010), and as the General Counsel for ProFund Advisors LLC (2001-2006).
Jeffrey S. Christian (1961)
Year of Election or Appointment: 2016
Assistant Treasurer
Mr. Christian also serves as Assistant Treasurer of other funds. Mr. Christian is an employee of Fidelity Investments (2003-present).
William C. Coffey (1969)
Year of Election or Appointment: 2009
Assistant Secretary
Mr. Coffey also serves as Assistant Secretary of other funds. He is Senior Vice President and Deputy General Counsel of FMR LLC (diversified financial services company, 2010-present), and is an employee of Fidelity Investments. Previously, Mr. Coffey served as Vice President and Associate General Counsel of FMR LLC (2005-2009).
Jonathan Davis (1968)
Year of Election or Appointment: 2010
Assistant Treasurer
Mr. Davis also serves as Assistant Treasurer of other funds, and is an employee of Fidelity Investments. Previously, Mr. Davis served as Vice President and Associate General Counsel of FMR LLC (diversified financial services company, 2003-2010).
Adrien E. Deberghes (1967)
Year of Election or Appointment: 2016
Assistant Treasurer
Mr. Deberghes also serves as an officer of other funds. He serves as Executive Vice President of Fidelity Investments Money Management, Inc. (FIMM) (investment adviser firm, 2016-present) and is an employee of Fidelity Investments (2008-present). Prior to joining Fidelity Investments, Mr. Deberghes was Senior Vice President of Mutual Fund Administration at State Street Corporation (2007-2008), Senior Director of Mutual Fund Administration at Investors Bank & Trust (2005-2007), and Director of Finance for Dunkin' Brands (2000-2005). Previously, Mr. Deberghes served in other fund officer roles.
Stephanie J. Dorsey (1969)
Year of Election or Appointment: 2010
Assistant Treasurer
Ms. Dorsey also serves as an officer of other funds. She is an employee of Fidelity Investments (2008-present) and has served in other fund officer roles. Prior to joining Fidelity Investments, Ms. Dorsey served as Treasurer (2004-2008) of the JPMorgan Mutual Funds and Vice President (2004-2008) of JPMorgan Chase Bank.
Howard J. Galligan III (1966)
Year of Election or Appointment: 2014
Chief Financial Officer
Mr. Galligan also serves as Chief Financial Officer of other funds. Mr. Galligan serves as President of Fidelity Pricing and Cash Management Services (FPCMS) (2014-present) and as a Director of Strategic Advisers, Inc. (investment adviser firm, 2008-present). Previously, Mr. Galligan served as Chief Administrative Officer of Asset Management (2011-2014) and Chief Operating Officer and Senior Vice President of Investment Support for Strategic Advisers, Inc. (2003-2011).
Scott C. Goebel (1968)
Year of Election or Appointment: 2015
Vice President
Mr. Goebel serves as Vice President of other funds and is an employee of Fidelity Investments (2001-present). Mr. Goebel serves as Senior Vice President of Fidelity Management & Research Company (FMR) (investment adviser firm, 2016-present). Previously, Mr. Goebel served as Secretary of Fidelity SelectCo, LLC (investment adviser firm, 2013-2015), Fidelity Investments Money Management, Inc. (FIMM) (investment adviser firm, 2010-2015), and Fidelity Research and Analysis Company (FRAC) (investment adviser firm, 2010-2015); General Counsel, Secretary, and Senior Vice President of FMR (investment adviser firm, 2008-2015) and FMR Co., Inc. (investment adviser firm, 2008-2015); Assistant Secretary of Fidelity Management & Research (Japan) Limited (investment adviser firm, 2008-2015) and Fidelity Management & Research (U.K.) Inc. (investment adviser firm, 2008-2015); Chief Legal Officer (CLO) of Fidelity Management & Research (Hong Kong) Limited (investment adviser firm, 2008-2015); Secretary and CLO of certain Fidelity® funds (2008-2015); Assistant Secretary of FIMM (2008-2010), FRAC (2008-2010), and certain funds (2007-2008); and as Vice President and Secretary of Fidelity Distributors Corporation (FDC) (2005-2007).
Brian B. Hogan (1964)
Year of Election or Appointment: 2009
Vice President
Mr. Hogan also serves as Trustee or Vice President of other funds. Mr. Hogan serves as a Director of FMR Investment Management (U.K.) Limited (investment adviser firm, 2015-present) and Fidelity SelectCo, LLC (investment adviser firm, 2014-present) and President of the Equity Division of FMR (investment adviser firm, 2009-present). Previously, Mr. Hogan served as Senior Vice President, Equity Research of FMR (2006-2009) and as a portfolio manager. Mr. Brian B. Hogan is not related to Mr. Colm A. Hogan.
Colm A. Hogan (1973)
Year of Election or Appointment: 2016
Deputy Treasurer
Mr. Hogan also serves as an officer of other funds. Mr. Hogan is an employee of Fidelity Investments (2005-present). Mr. Colm A. Hogan is not related to Mr. Brian B. Hogan.
Chris Maher (1972)
Year of Election or Appointment: 2013
Assistant Treasurer
Mr. Maher serves as Assistant Treasurer of other funds. Mr. Maher is Vice President of Valuation Oversight and is an employee of Fidelity Investments. Previously, Mr. Maher served as Vice President of Asset Management Compliance (2013), Vice President of the Program Management Group of FMR (investment adviser firm, 2010-2013), and Vice President of Valuation Oversight (2008-2010).
John F. Papandrea (1972)
Year of Election or Appointment: 2016
Anti-Money Laundering (AML) Officer
Mr. Papandrea also serves as AML Officer of other funds. Mr. Papandrea is Vice President of FMR LLC (diversified financial services company, 2008-present) and is an employee of Fidelity Investments (2005-present).
Melissa M. Reilly (1971)
Year of Election or Appointment: 2014
Vice President of certain Equity Funds
Ms. Reilly also serves as Vice President of other funds. Ms. Reilly is an employee of Fidelity Investments (2004-present).
Kenneth B. Robins (1969)
Year of Election or Appointment: 2016
Chief Compliance Officer
Mr. Robins also serves as an officer of other funds. Mr. Robins serves as Compliance Officer of Fidelity Management & Research Company and FMR Co., Inc. (investment adviser firms, 2016-present) and is an employee of Fidelity Investments (2004-present). Previously, Mr. Robins served as Executive Vice President of Fidelity Investments Money Management, Inc. (investment adviser firm, 2013-2016) and served in other fund officer roles.
Stacie M. Smith (1974)
Year of Election or Appointment: 2016
President and Treasurer
Ms. Smith also serves as an officer of other funds. She is an employee of Fidelity Investments (2009-present) and has served in other fund officer roles. Prior to joining Fidelity Investments, Ms. Smith served as Senior Audit Manager of Ernst & Young LLP (1996-2009). Previously, Ms. Smith served as Deputy Treasurer of certain Fidelity® funds (2013-2016).
Renee Stagnone (1975)
Year of Election or Appointment: 2016
Assistant Treasurer
Ms. Stagnone also serves as an officer of other funds. Ms. Stagnone is an employee of Fidelity Investments (1997-present). Previously, Ms. Stagnone served as Deputy Treasurer of certain Fidelity® funds (2013-2016).
Shareholder Expense Example
As a shareholder of the Fund, you incur two types of costs: (1) transaction costs and (2) ongoing costs, including management fees and other Fund expenses. This Example is intended to help you understand your ongoing costs (in dollars) of investing in the Fund and to compare these costs with the ongoing costs of investing in other mutual funds.
The Example is based on an investment of $1,000 invested at the beginning of the period and held for the entire period (February 1, 2016 to July 31, 2016).
Actual Expenses
The first line of the accompanying table for each class of the Fund provides information about actual account values and actual expenses. You may use the information in this line, together with the amount you invested, to estimate the expenses that you paid over the period. Simply divide your account value by $1,000.00 (for example, an $8,600 account value divided by $1,000.00 = 8.6), then multiply the result by the number in the first line for a class of the Fund under the heading entitled "Expenses Paid During Period" to estimate the expenses you paid on your account during this period. A small balance maintenance fee of $12.00 that is charged once a year may apply for certain accounts with a value of less than $2,000. This fee is not included in the table below. If it was, the estimate of expenses you paid during the period would be higher, and your ending account value lower, by this amount. In addition, the Fund, as a shareholder in the underlying Fidelity Central Funds, will indirectly bear its pro-rata share of the fees and expenses incurred by the underlying Fidelity Central Funds. These fees and expenses are not included in the Fund's annualized expense ratio used to calculate the expense estimate in the table below.
Hypothetical Example for Comparison Purposes
The second line of the accompanying table for each class of the Fund provides information about hypothetical account values and hypothetical expenses based on a Class' actual expense ratio and an assumed rate of return of 5% per year before expenses, which is not the Class' actual return. The hypothetical account values and expenses may not be used to estimate the actual ending account balance or expenses you paid for the period. You may use this information to compare the ongoing costs of investing in the Fund and other funds. To do so, compare this 5% hypothetical example with the 5% hypothetical examples that appear in the shareholder reports of the other funds. A small balance maintenance fee of $12.00 that is charged once a year may apply for certain accounts with a value of less than $2,000. This fee is not included in the table below. If it was, the estimate of expenses you paid during the period would be higher, and your ending account value lower, by this amount. In addition, the Fund, as a shareholder in the underlying Fidelity Central Funds, will indirectly bear its pro-rata share of the fees and expenses incurred by the underlying Fidelity Central Funds. These fees and expenses are not included in the Fund's annualized expense ratio used to calculate the expense estimate in the table below.
Please note that the expenses shown in the table are meant to highlight your ongoing costs only and do not reflect any transaction costs. Therefore, the second line of the table is useful in comparing ongoing costs only, and will not help you determine the relative total costs of owning different funds.
| | Annualized Expense Ratio-A | Beginning
Account Value
February 1, 2016 | Ending
Account Value
July 31, 2016 | Expenses Paid
During Period-B
February 1, 2016
to July 31, 2016 |
| OTC | .87% | | | |
| Actual | | $1,000.00 | $1,171.00 | $4.70 |
| Hypothetical-C | | $1,000.00 | $1,020.54 | $4.37 |
| Class K | .75% | | | |
| Actual | | $1,000.00 | $1,171.60 | $4.05 |
| Hypothetical-C | | $1,000.00 | $1,021.13 | $3.77 |
A Annualized expense ratio reflects expenses net of applicable fee waivers.
B Expenses are equal to each Class' annualized expense ratio, multiplied by the average account value over the period, multiplied by 182/366 (to reflect the one-half year period).
C 5% return per year before expenses
Distributions (Unaudited)
The fund hereby designates as a capital gain dividend with respect to the taxable year ended July 31, 2016, $112,418,165 or, if subsequently determined to be different, the net capital gain of such year.
OTC Portfolio and Class K designates 16% of the dividends distributed during the fiscal year as qualifying for the dividends–received deduction for corporate shareholders.
OTC Portfolio and Class K designates 18% of the dividends distributed during the fiscal year as amounts which may be taken into account as a dividend for purposes of the maximum rate under section 1(h)(11) of the Internal Revenue Code.
The fund will notify shareholders in January 2017 of amounts for use in preparing 2016 income tax returns.
Board Approval of Investment Advisory Contracts and Management Fees
Fidelity OTC Portfolio
Each year, the Board of Trustees, including the Independent Trustees (together, the Board), votes on the renewal of the management contract with Fidelity Management & Research Company (FMR) and the sub-advisory agreements (together, the Advisory Contracts) for the fund. The Board, assisted by the advice of fund counsel and Independent Trustees' counsel, requests and considers a broad range of information relevant to the renewal of the Advisory Contracts throughout the year.
The Board meets regularly and, at each of its meetings, covers an extensive agenda of topics and materials and considers factors that are relevant to its annual consideration of the renewal of the fund's Advisory Contracts, including the services and support provided to the fund and its shareholders. The Board has established various standing committees (Committees), each composed of and chaired by Independent Trustees with varying backgrounds, to which the Board has assigned specific subject matter responsibilities in order to enhance effective decision-making by the Board. The Board, acting directly and through its Committees, requests and receives information concerning the annual consideration of the renewal of the fund's Advisory Contracts. The Board also meets as needed to consider matters specifically related to the Board's annual consideration of the renewal of the Advisory Contracts. Members of the Board may also meet with trustees of other Fidelity funds through ad hoc joint committees to discuss certain matters relevant to all of the Fidelity funds.
At its July 2016 meeting, the Board unanimously determined to renew the fund's Advisory Contracts. In reaching its determination, the Board considered all factors it believed relevant, including (i) the nature, extent, and quality of the services to be provided to the fund and its shareholders (including the investment performance of the fund); (ii) the competitiveness of the fund's management fee and total expense ratio relative to peer funds; (iii) the total costs of the services to be provided by and the profits to be realized by Fidelity from its relationships with the fund; and (iv) the extent to which, if any, economies of scale exist and would be realized as the fund grows, and whether any economies of scale are appropriately shared with fund shareholders.
In considering whether to renew the Advisory Contracts for the fund, the Board reached a determination, with the assistance of fund counsel and Independent Trustees' counsel and through the exercise of its business judgment, that the renewal of the Advisory Contracts was in the best interests of the fund and its shareholders and that the compensation payable under the Advisory Contracts was fair and reasonable. The Board's decision to renew the Advisory Contracts was not based on any single factor, but rather was based on a comprehensive consideration of all the information provided to the Board at its meetings throughout the year. The Board, in reaching its determination to renew the Advisory Contracts, was aware that shareholders of the fund have a broad range of investment choices available to them, including a wide choice among funds offered by Fidelity's competitors, and that the fund's shareholders, who have the opportunity to review and weigh the disclosure provided by the fund in its prospectus and other public disclosures, have chosen to invest in this fund, which is part of the Fidelity family of funds.
Nature, Extent, and Quality of Services Provided. The Board considered Fidelity's staffing as it relates to the fund, including the backgrounds of investment personnel of Fidelity, and also considered the fund's investment objective, strategies, and related investment philosophy. The Independent Trustees also had discussions with senior management of Fidelity's investment operations and investment groups. The Board considered the structure of the investment personnel compensation program and whether this structure provides appropriate incentives to act in the best interests of the fund. Additionally, the Board considered the portfolio managers' investments, if any, in the funds that they manage.
Resources Dedicated to Investment Management and Support Services. The Board and the Fund Oversight and Research Committees reviewed the general qualifications and capabilities of Fidelity's investment staff, including its size, education, experience, and resources, as well as Fidelity's approach to recruiting, training, managing, and compensating investment personnel. The Board noted that Fidelity has continued to increase the resources devoted to non-U.S. offices, including expansion of Fidelity's global investment organization. The Board also noted that Fidelity's analysts have extensive resources, tools and capabilities that allow them to conduct sophisticated quantitative and fundamental analysis, as well as credit analysis of issuers, counterparties and guarantors. Further, the Board considered that Fidelity's investment professionals have sufficient access to global information and data so as to provide competitive investment results over time, and that those professionals also have access to sophisticated tools that permit them to assess portfolio construction and risk and performance attribution characteristics continuously, as well as to transmit new information and research conclusions rapidly around the world. Additionally, in its deliberations, the Board considered Fidelity's trading, risk management, compliance, and technology and operations capabilities and resources, which are integral parts of the investment management process.
Shareholder and Administrative Services. The Board considered (i) the nature, extent, quality, and cost of advisory, administrative, and shareholder services performed by FMR, the sub-advisers (together with FMR, the Investment Advisers), and their affiliates under the Advisory Contracts and under separate agreements covering transfer agency, pricing and bookkeeping, and securities lending services for the fund; (ii) the nature and extent of the supervision of third party service providers, principally custodians, subcustodians, and pricing vendors; and (iii) the resources devoted to, and the record of compliance with, the fund's compliance policies and procedures. The Board also reviewed the allocation of fund brokerage, including allocations to brokers affiliated with the Investment Advisers, the use of brokerage commissions to pay fund expenses, and the use of "soft" commission dollars to pay for research services.
The Board noted that the growth of fund assets over time across the complex allows Fidelity to reinvest in the development of services designed to enhance the value or convenience of the Fidelity funds as investment vehicles. These services include 24-hour access to account information and market information through telephone representatives and over the Internet, investor education materials and asset allocation tools, and the expanded availability of Fidelity Investor Centers.
In 2014, the Board formed an ad hoc Committee on Transfer Agency Fees to review the variety of transfer agency fee structures throughout the industry and Fidelity's competitive positioning with respect to industry participants.
Investment in a Large Fund Family. The Board considered the benefits to shareholders of investing in a Fidelity fund, including the benefits of investing in a fund that is part of a large family of funds offering a variety of investment disciplines and providing a large variety of mutual fund investor services. The Board noted that Fidelity had taken, or had made recommendations that resulted in the Fidelity funds taking, a number of actions over the previous year that benefited particular funds, including: (i) continuing to dedicate additional resources to investment research and to the support of the senior management team that oversees asset management; (ii) continuing efforts to enhance Fidelity's global research capabilities; (iii) launching new funds and making other enhancements to meet client needs; (iv) broadening eligibility requirements for certain lower-priced share classes of, and streamlining the fee structure for, certain existing equity index funds; (v) lowering expense caps for certain existing funds and classes to reduce expenses paid by shareholders; (vi) eliminating redemption fees for certain variable insurance product funds and classes; (vii) continuing to launch dedicated lower cost underlying funds to meet portfolio construction needs related to expanding underlying fund options for Fidelity funds of funds, specifically for the Freedom Fund product lines; (viii) launching a lower cost share class for use by the Freedom Index Fund product line; (ix) rationalizing product lines and gaining increased efficiencies through fund mergers and share class consolidations; (x) continuing to develop, acquire and implement systems and technology to improve services to the funds and shareholders, strengthen information security, and increase efficiency; (xi) implementing investment enhancements to further strengthen Fidelity's target date product line to increase investors' probability of success in achieving their goals; (xii) accelerating the conversion of all remaining Class B shares to Class A shares, which have a lower expense structure; and (xiii) implementing changes to Fidelity's money market fund product line in response to recent regulatory reforms.
Investment Performance. The Board considered whether the fund has operated in accordance with its investment objective, as well as its record of compliance with its investment restrictions and its performance history.
The Board took into account discussions with representatives of the Investment Advisers about fund investment performance that occur at Board meetings throughout the year. In this regard the Board noted that as part of regularly scheduled fund reviews and other reports to the Board on fund performance, the Board considers annualized return information for the fund, for different time periods, measured against a securities market index ("benchmark index") and a peer group of funds with similar objectives ("peer group"), if any. In its evaluation of fund investment performance, the Board gave particular attention to information indicating changes in performance of certain Fidelity funds for specific time periods and discussed with the Investment Advisers the reasons for any overperformance or underperformance.
In addition to reviewing absolute and relative fund performance, the Independent Trustees periodically consider the appropriateness of fund performance metrics in evaluating the results achieved. In general, the Independent Trustees believe that fund performance should be evaluated based on net performance (after fees and expenses) of both the highest performing and lowest performing fund share classes, where applicable, compared to appropriate benchmark indices, over appropriate time periods that may include full market cycles, and compared to peer groups, as applicable, over the same periods, taking into account relevant factors including the following: general market conditions; issuer-specific information; and fund cash flows and other factors.
The Independent Trustees recognize that shareholders evaluate performance on a net basis over their own holding periods, for which one-, three-, and five-year periods are often used as a proxy. For this reason, the performance information reviewed by the Board also included net cumulative calendar year total return information for the fund and an appropriate benchmark index for the most recent one-, three-, and five-year periods, as shown below. A peer group is not shown below because the fund does not generally utilize a peer group for performance comparison purposes.
Fidelity OTC Portfolio
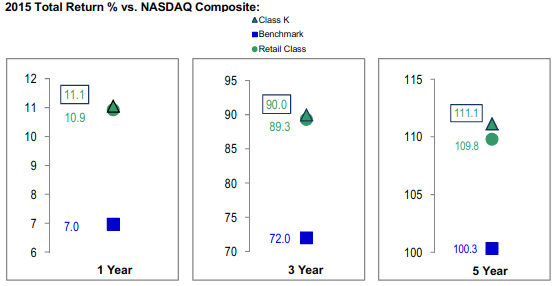
The Board also considered that the fund's management fee is subject to upward or downward adjustment depending upon whether, and to what extent, the fund's investment performance for the performance period exceeds, or is exceeded by, a securities index, thus leading to a performance adjustment for the same period. The Board noted that the performance adjustment provides FMR with a strong economic incentive to seek to achieve superior performance for the fund's shareholders and helps to more closely align the interests of FMR and the shareholders of the fund.
Based on its review, the Board concluded that the nature, extent, and quality of services provided to the fund under the Advisory Contracts should continue to benefit the shareholders of the fund.
Competitiveness of Management Fee and Total Expense Ratio. The Board considered the fund's management fee and total expense ratio compared to "mapped groups" of competitive funds and classes created for the purpose of facilitating the Trustees' competitive analysis of management fees and total expenses. Fidelity creates "mapped groups" by combining similar Broadridge investment objective categories that have comparable investment mandates. Combining Broadridge investment objective categories aids the Board's management fee and total expense ratio comparisons by broadening the competitive group used for comparison.
Management Fee. The Board considered two proprietary management fee comparisons for the 12-month periods shown in basis points (BP) in the chart below. The group of Broadridge funds used by the Board for management fee comparisons is referred to below as the "Total Mapped Group." The Total Mapped Group comparison focuses on a fund's standing in terms of gross management fees before expense reimbursements or caps, and without giving effect to the fund's performance adjustment, relative to the total universe of funds with comparable investment mandates, regardless of whether their management fee structures also are comparable. Funds with comparable investment mandates offer exposure to similar types of securities. Funds with comparable management fee structures have similar management fee contractual arrangements (
e.g., flat rate charged for advisory services, all-inclusive fee rate,
etc.). "TMG %" represents the percentage of funds in the Total Mapped Group that had management fees that were lower than the fund's. For example, a hypothetical TMG % of 20% would mean that 80% of the funds in the Total Mapped Group had higher, and 20% had lower, management fees than the fund. The fund's actual TMG %s and the number of funds in the Total Mapped Group are in the chart below. The "Asset-Size Peer Group" (ASPG) comparison focuses on a fund's standing relative to a subset of non-Fidelity funds within the Total Mapped Group that are similar in size and management fee structure without taking into account performance adjustments, if any. For example, if a fund is in the first quartile of the ASPG, the fund's management fee ranks in the least expensive or lowest 25% of funds in the ASPG. The ASPG represents at least 15% of the funds in the Total Mapped Group with comparable asset size and management fee structures, subject to a minimum of 50 funds (or all funds in the Total Mapped Group if fewer than 50). Additional information, such as the ASPG quartile in which the fund's management fee rate ranked and the impact of the fund's performance adjustment, is also included in the chart and considered by the Board.
Fidelity OTC Portfolio
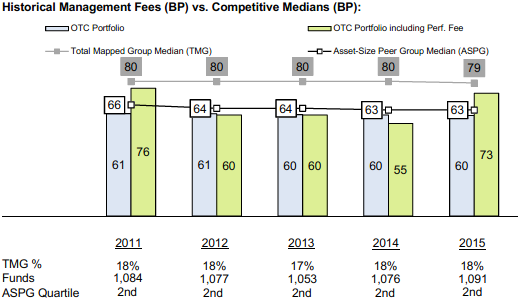
The Board noted that the fund's management fee rate ranked below the median of its Total Mapped Group and below the median of its ASPG for 2015. The Board also noted the effect of the fund's performance adjustment, if any, on the fund's management fee ranking.
The Board noted that, in 2014, the ad hoc Committee on Group Fee was formed by it and the boards of other Fidelity funds to conduct an in-depth review of the "group fee" component of the management fee of funds with such management fee structures. The Committee's focus included the mechanics of the group fee, the competitive landscape of group fee structures, Fidelity funds with no group fee component and investment products not included in group fee assets. The Board also considered that, for funds subject to the group fee, FMR agreed to voluntarily waive fees over a specified period of time in amounts designed to account for assets converted from certain funds to certain collective investment trusts.
The Board also noted that, in 2013, the ad hoc Committee on Management Fees was formed to conduct an in-depth review of the management fee rates of Fidelity's active equity mutual funds. The Committee focused on the following areas: (i) standard fee structures; (ii) research consumption and trading evolution; (iii) management fee competitiveness/profitability by category; and (iv) factors that drive institutional pricing.
Based on its review, the Board concluded that the fund's management fee is fair and reasonable in light of the services that the fund receives and the other factors considered.
Total Expense Ratio. In its review of each class's total expense ratio, the Board considered the fund's management fee rate as well as other fund or class expenses, as applicable, such as transfer agent fees, pricing and bookkeeping fees, and custodial, legal, and audit fees. The Board noted the impact of the fund's performance adjustment. The Board also noted that Fidelity may agree to waive fees and expenses from time to time, and the extent to which, if any, it has done so for the fund. As part of its review, the Board also considered the current and historical total expense ratios of each class of the fund compared to competitive fund median expenses. Each class of the fund is compared to those funds and classes in the Total Mapped Group (used by the Board for management fee comparisons) that have a similar sales load structure.
The Board noted that the total expense ratio of each class ranked below the competitive median for 2015.
Fees Charged to Other Fidelity Clients. The Board also considered Fidelity fee structures and other information with respect to clients of Fidelity, such as other funds advised or subadvised by Fidelity, pension plan clients, and other institutional clients with similar mandates. The Board noted the findings of the 2013 ad hoc joint committee (created with the board of other Fidelity funds), which reviewed and compared Fidelity's institutional investment advisory business with its business of providing services to the Fidelity funds, including the differences in services provided, fees charged, and costs incurred, as well as competition in their respective marketplaces.
Based on its review of total expense ratios and fees charged to other Fidelity clients, the Board concluded that the total expense ratio of each class of the fund was reasonable in light of the services that the fund and its shareholders receive and the other factors considered.
Costs of the Services and Profitability. The Board considered the revenues earned and the expenses incurred by Fidelity in conducting the business of developing, marketing, distributing, managing, administering and servicing the fund and servicing the fund's shareholders. The Board also considered the level of Fidelity's profits in respect of all the Fidelity funds.
On an annual basis, Fidelity presents to the Board information about the profitability of its relationship with the fund. Fidelity calculates profitability information for each fund, as well as aggregate profitability information for groups of Fidelity funds and all Fidelity funds, using a series of detailed revenue and cost allocation methodologies which originate with the books and records of Fidelity on which Fidelity's audited financial statements are based. The Audit Committee of the Board reviews any significant changes from the prior year's methodologies.
PricewaterhouseCoopers LLP (PwC), independent registered public accounting firm and auditor to Fidelity and certain Fidelity funds, has been engaged annually by the Board as part of the Board's assessment of Fidelity's profitability analysis. PwC's engagement includes the review and assessment of the methodologies used by Fidelity in determining the revenues and expenses attributable to Fidelity's mutual fund business, and completion of agreed-upon procedures in respect of the mathematical accuracy of the fund profitability information and its conformity to established allocation methodologies. After considering PwC's reports issued under the engagement and information provided by Fidelity, the Board concluded that while other allocation methods may also be reasonable, Fidelity's profitability methodologies are reasonable in all material respects.
The Board also reviewed Fidelity's non-fund businesses and fall-out benefits related to the mutual fund business as well as cases where Fidelity's affiliates may benefit from or be related to the fund's business.
The Board considered the costs of the services provided by and the profits realized by Fidelity in connection with the operation of the fund and was satisfied that the profitability was not excessive.
Economies of Scale. The Board considered whether there have been economies of scale in respect of the management of the Fidelity funds, whether the Fidelity funds (including the fund) have appropriately benefited from any such economies of scale, and whether there is potential for realization of any further economies of scale. The Board considered the extent to which the fund will benefit from economies of scale as assets grow through increased services to the fund, through waivers or reimbursements, or through fee or expense ratio reductions. The Board also noted that in 2013, it and the boards of other Fidelity funds created an ad hoc committee (the Economies of Scale Committee) to analyze whether Fidelity attains economies of scale in respect of the management and servicing of the Fidelity funds, whether the Fidelity funds have appropriately benefited from such economies of scale, and whether there is potential for realization of any further economies of scale.
The Board recognized that the fund's management contract incorporates a "group fee" structure, which provides for lower group fee rates as total group assets increase, and for higher group fee rates as total group assets decrease (with "group assets" defined to include fund assets under FMR's management plus the assets of sector funds previously under FMR's management). FMR calculates the group fee rates based on a tiered asset "breakpoint" schedule that varies based on asset class. The Board considered that the group fee is designed to deliver the benefits of economies of scale to fund shareholders when total Fidelity fund assets increase, even if assets of any particular fund are unchanged or have declined, because some portion of Fidelity's costs are attributable to services provided to all Fidelity funds, and all funds benefit if those costs can be allocated among more assets. The Board concluded that, given the group fee structure, fund shareholders will benefit from lower management fees as group assets increase at the fund complex level, regardless of whether Fidelity achieves any such economies of scale.
The Board concluded, taking into account the analysis of the Economies of Scale Committee, that economies of scale, if any, are being appropriately shared between fund shareholders and Fidelity.
Additional Information Requested by the Board. In order to develop fully the factual basis for consideration of the Fidelity funds' Advisory Contracts, the Board requested and received additional information on certain topics, including: (i) fund performance trends and Fidelity's long-term strategies for certain funds; (ii) the various share classes employed by Fidelity and the attributes of each class, together with similar information on the distribution and servicing payments made by Fidelity or the funds to third-party participants in the distribution channels; (iii) fund profitability, and fund performance in relation to fund profitability; (iv) the methodology with respect to evaluating competitive fund data and peer group classifications and fee comparisons; (v) annual fund profitability margins; (vi) the realization of fall-out benefits in and attribution of fall-out benefits to certain Fidelity business units; (vii) the appropriateness of certain funds' benchmarks; (viii) the rationalization for certain share classes and expenses; (ix) sub-advisory fee rates for comparable investment mandates; (x) product strategy for certain underperforming funds; and (xi) Fidelity's resources and strategy for cybersecurity.
Based on its evaluation of all of the conclusions noted above, and after considering all factors it believed relevant, the Board concluded that the advisory fee structures are fair and reasonable, and that the fund's Advisory Contracts should be renewed.
Corporate Headquarters
245 Summer St.
Boston, MA 02210
www.fidelity.com
OTC-ANN-0916
1.536191.119
Fidelity® Real Estate Income Fund
Annual Report July 31, 2016 |
|
Contents
To view a fund's proxy voting guidelines and proxy voting record for the 12-month period ended June 30, visit http://www.fidelity.com/proxyvotingresults or visit the Securities and Exchange Commission's (SEC) web site at http://www.sec.gov.
You may also call 1-800-544-8544 to request a free copy of the proxy voting guidelines.
Standard & Poor's, S&P and S&P 500 are registered service marks of The McGraw-Hill Companies, Inc. and have been licensed for use by Fidelity Distributors Corporation.
Other third-party marks appearing herein are the property of their respective owners.
All other marks appearing herein are registered or unregistered trademarks or service marks of FMR LLC or an affiliated company. © 2016 FMR LLC. All rights reserved.
This report and the financial statements contained herein are submitted for the general information of the shareholders of the Fund. This report is not authorized for distribution to prospective investors in the Fund unless preceded or accompanied by an effective prospectus.
A fund files its complete schedule of portfolio holdings with the SEC for the first and third quarters of each fiscal year on Form N-Q. Forms N-Q are available on the SEC’s web site at http://www.sec.gov. A fund's Forms N-Q may be reviewed and copied at the SEC’s Public Reference Room in Washington, DC. Information regarding the operation of the SEC's Public Reference Room may be obtained by calling 1-800-SEC-0330.
For a complete list of a fund's portfolio holdings, view the most recent holdings listing, semiannual report, or annual report on Fidelity's web site at http://www.fidelity.com, http://www.institutional.fidelity.com, or http://www.401k.com, as applicable.
NOT FDIC INSURED •MAY LOSE VALUE •NO BANK GUARANTEE
Neither the Fund nor Fidelity Distributors Corporation is a bank.
Performance: The Bottom Line
Average annual total return reflects the change in the value of an investment, assuming reinvestment of distributions from dividend income and capital gains (the profits earned upon the sale of securities that have grown in value, if any) and assuming a constant rate of performance each year. The hypothetical investment and the average annual total returns do not reflect the deduction of taxes that a shareholder would pay on fund distributions or the redemption of fund shares. During periods of reimbursement by Fidelity, a fund’s total return will be greater than it would be had the reimbursement not occurred. How a fund did yesterday is no guarantee of how it will do tomorrow.
Average Annual Total Returns
| For the periods ended July 31, 2016 | Past 1 year | Past 5 years | Past 10 years |
| Fidelity® Real Estate Income Fund | 11.29% | 9.40% | 7.08% |
$10,000 Over 10 Years
Let's say hypothetically that $10,000 was invested in Fidelity® Real Estate Income Fund, a class of the fund, on July 31, 2006.
The chart shows how the value of your investment would have changed, and also shows how the S&P 500® Index performed over the same period.
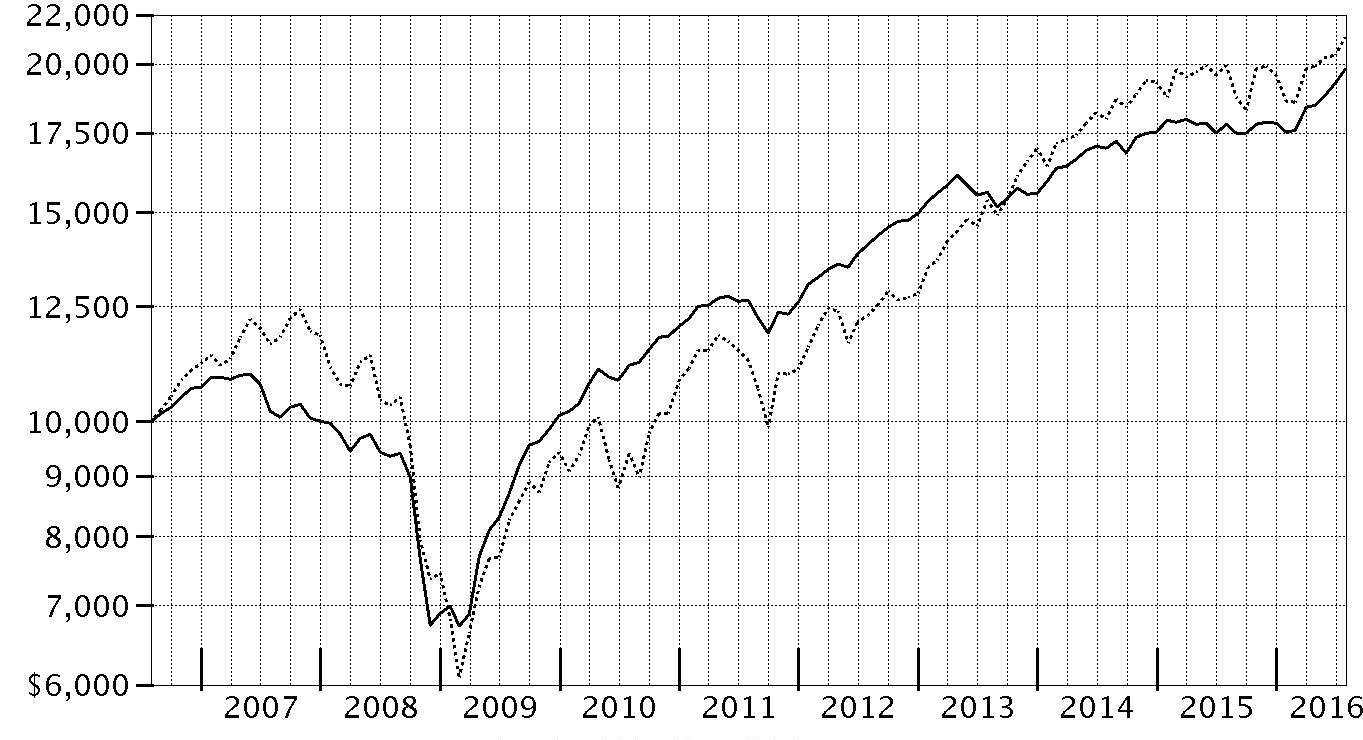
| Period Ending Values |
| $19,819 | Fidelity® Real Estate Income Fund |
| $21,089 | S&P 500® Index |
Management's Discussion of Fund Performance
Market Recap: Most types of real estate securities enjoyed a strong result for the 12 months ending July 31, 2016, due partly to investors’ continued search for yield. The fundamental backdrop remained solid across most property types and local markets, with the notable exceptions of hotels and, in certain markets, apartments. Real estate investment trust (REIT) common stocks performed particularly well the past 12 months, with the FTSE
® NAREIT
® All REITs Index gaining 21.53%, overcoming a two-month decline roughly midway through the period. Industrial REITs were particularly strong performers, as warehouse operators benefited from increased demand associated with e-commerce. Meanwhile, REIT preferred stocks, as measured by the MSCI REIT Preferred Index, rose 9.94%. Declining interest rates provided a tailwind for this rate-sensitive segment, as their income offerings became more attractive to investors seeking yield in a lower-rate environment. Looking at fixed-income securities, The BofA Merrill Lynch℠ US Real Estate Index, a market-capitalization-weighted measure of investment-grade corporate debt in the domestic real estate sector, gained 7.88%.
Comments from Portfolio Manager Mark Snyderman: For the year, the fund’s share classes (excluding sales charges, if applicable) posted low-double-digit gains, roughly in line with the 11.50% return of the Fidelity Real Estate Composite Index and well ahead of the broad-market S&P 500
®. In a strong market for real estate securities, the fund’s common stock and preferred equity investments performed particularly well, while most of the fund’s fixed-income holdings nearly kept pace with the overall real estate bond market, despite my continued focus on managing the portfolio’s exposure to interest rates. On the stock side, portfolio holdings in REIT common stocks gained about 24%, well ahead of the approximately 22% return produced by the FTSE
® NAREIT
® All REITs Index. Our preferred stock investments gained 12%, outpacing the MSCI preferred stock index by about two percentage points. The fund’s high-yield and investment-grade real estate bond holdings each lagged the 8% return of the BofA Merrill Lynch index, while our CMBS holdings returned about 3%, reflecting the weaker performance of this segment. Of final note, I maintained a 7% cash allocation, on average. I typically like to hold anywhere from 5% to 10% in cash securities, as it provides flexibility to invest in companies I like at times when others may be forced to sell. With essentially zero yield, however, our cash allocation detracted from results in a strong market.
The views expressed above reflect those of the portfolio manager(s) only through the end of the period as stated on the cover of this report and do not necessarily represent the views of Fidelity or any other person in the Fidelity organization. Any such views are subject to change at any time based upon market or other conditions and Fidelity disclaims any responsibility to update such views. These views may not be relied on as investment advice and, because investment decisions for a Fidelity fund are based on numerous factors, may not be relied on as an indication of trading intent on behalf of any Fidelity fund.
Investment Summary (Unaudited)
Top Five Stocks as of July 31, 2016
| | % of fund's net assets | % of fund's net assets 6 months ago |
| Equity Lifestyle Properties, Inc. | 3.9 | 4.2 |
| Acadia Realty Trust (SBI) | 2.9 | 3.1 |
| MFA Financial, Inc. | 2.7 | 2.8 |
| Ventas, Inc. | 2.4 | 2.0 |
| Apartment Investment & Management Co. Class A | 1.4 | 0.9 |
| | 13.3 | |
Top 5 Bonds as of July 31, 2016
| | % of fund's net assets | % of fund's net assets 6 months ago |
| IAS Operating Partnership LP 5% 3/15/18 | 0.8 | 0.8 |
| RAIT Financial Trust 4% 10/1/33 | 0.8 | 0.7 |
| RWT Holdings, Inc. 5.625% 11/15/19 | 0.8 | 0.6 |
| Senior Housing Properties Trust 4.75% 5/1/24 | 0.7 | 0.1 |
| Kennedy-Wilson, Inc. 5.875% 4/1/24 | 0.7 | 0.2 |
| | 3.8 | |
Top Five REIT Sectors as of July 31, 2016
| | % of fund's net assets | % of fund's net assets 6 months ago |
| REITs - Mortgage | 17.3 | 17.7 |
| REITs - Health Care | 7.9 | 6.4 |
| REITs - Apartments | 5.2 | 5.3 |
| REITs - Diversified | 5.2 | 2.4 |
| REITs - Shopping Centers | 4.6 | 5.7 |
Asset Allocation (% of fund's net assets)
| As of July 31, 2016* |
| | Common Stocks | 32.4% |
| | Preferred Stocks | 17.7% |
| | Bonds | 31.4% |
| | Convertible Securities | 6.5% |
| | Other Investments | 5.3% |
| | Short-Term Investments and Net Other Assets (Liabilities) | 6.7% |

* Foreign investments - 1.1%
| As of January 31, 2016* |
| | Common Stocks | 31.0% |
| | Preferred Stocks | 19.2% |
| | Bonds | 29.5% |
| | Convertible Securities | 5.7% |
| | Other Investments | 6.8% |
| | Short-Term Investments and Net Other Assets (Liabilities) | 7.8% |

* Foreign investments - 0.7%
Investments July 31, 2016
Showing Percentage of Net Assets
| Common Stocks - 32.4% | | | |
| | | Shares | Value |
| CONSUMER DISCRETIONARY - 0.1% | | | |
| Household Durables - 0.1% | | | |
| Stanley Martin Communities LLC Class B (a) | | 4,620 | $5,806,693 |
| FINANCIALS - 32.3% | | | |
| Capital Markets - 0.9% | | | |
| Brookfield Asset Management, Inc. Class A | | 492,000 | 16,990,985 |
| Ellington Financial LLC | | 1,140,284 | 19,635,690 |
| NorthStar Asset Management Group, Inc. | | 545,500 | 6,469,630 |
| | | | 43,096,305 |
| Real Estate Investment Trusts - 31.1% | | | |
| Acadia Realty Trust (SBI) | | 3,799,549 | 143,091,015 |
| AG Mortgage Investment Trust, Inc. | | 849,900 | 12,731,502 |
| American Tower Corp. | | 208,100 | 24,091,737 |
| Annaly Capital Management, Inc. | | 792,728 | 8,704,153 |
| Anworth Mortgage Asset Corp. | | 1,148,310 | 5,649,685 |
| Apartment Investment & Management Co. Class A | | 1,522,900 | 70,007,713 |
| Arbor Realty Trust, Inc. (b) | | 3,058,527 | 21,868,468 |
| AvalonBay Communities, Inc. | | 108,100 | 20,068,765 |
| Boardwalk (REIT) | | 219,500 | 9,429,598 |
| Care Capital Properties, Inc. | | 97,603 | 2,887,097 |
| CBL & Associates Properties, Inc. | | 1,788,353 | 21,978,858 |
| Cedar Shopping Centers, Inc. | | 838,510 | 6,741,620 |
| Chimera Investment Corp. | | 338,200 | 5,674,996 |
| Community Healthcare Trust, Inc. (c) | | 338,862 | 7,790,437 |
| CYS Investments, Inc. | | 827,839 | 7,409,159 |
| Douglas Emmett, Inc. | | 341,200 | 12,979,248 |
| Dynex Capital, Inc. | | 1,668,486 | 11,712,772 |
| Ellington Residential Mortgage REIT | | 260,000 | 3,676,400 |
| Equity Lifestyle Properties, Inc. | | 2,281,560 | 187,635,488 |
| Extra Space Storage, Inc. | | 518,300 | 44,584,166 |
| First Potomac Realty Trust | | 1,476,944 | 14,931,904 |
| Five Oaks Investment Corp. (c) | | 479,100 | 2,802,735 |
| Great Ajax Corp. (b) | | 1,416,687 | 19,621,115 |
| Healthcare Realty Trust, Inc. | | 264,600 | 9,567,936 |
| Invesco Mortgage Capital, Inc. | | 874,600 | 12,594,240 |
| Lexington Corporate Properties Trust | | 4,872,447 | 52,963,499 |
| MFA Financial, Inc. | | 17,592,122 | 132,292,757 |
| Mid-America Apartment Communities, Inc. | | 490,200 | 51,971,004 |
| Monmouth Real Estate Investment Corp. Class A | | 537,573 | 7,429,259 |
| Monogram Residential Trust, Inc. | | 1,980,900 | 21,215,439 |
| National Retail Properties, Inc. | | 179,200 | 9,526,272 |
| New Residential Investment Corp. | | 1,866,600 | 25,516,422 |
| New Senior Investment Group, Inc. | | 1,942,525 | 23,290,875 |
| Newcastle Investment Corp. | | 1,840,830 | 8,725,534 |
| NorthStar Realty Finance Corp. | | 3,591,659 | 48,128,231 |
| Potlatch Corp. | | 1,013,940 | 38,783,205 |
| Public Storage | | 13,600 | 3,249,312 |
| Sabra Health Care REIT, Inc. | | 1,106,003 | 26,444,532 |
| Select Income REIT | | 404,600 | 11,231,696 |
| Senior Housing Properties Trust (SBI) | | 2,994,400 | 66,505,624 |
| Store Capital Corp. | | 1,203,400 | 37,534,046 |
| Terreno Realty Corp. | | 1,654,764 | 46,085,177 |
| Two Harbors Investment Corp. | | 2,742,680 | 23,998,450 |
| Ventas, Inc. | | 1,522,086 | 115,922,070 |
| VEREIT, Inc. | | 1,442,934 | 15,958,850 |
| WP Carey, Inc. | | 791,000 | 57,466,150 |
| | | | 1,512,469,211 |
| Real Estate Management & Development - 0.3% | | | |
| Kennedy-Wilson Holdings, Inc. | | 620,621 | 13,064,072 |
|
| TOTAL FINANCIALS | | | 1,568,629,588 |
|
| TOTAL COMMON STOCKS | | | |
| (Cost $1,222,023,865) | | | 1,574,436,281 |
|
| Preferred Stocks - 18.4% | | | |
| Convertible Preferred Stocks - 0.7% | | | |
| FINANCIALS - 0.7% | | | |
| Real Estate Investment Trusts - 0.7% | | | |
| Alexandria Real Estate Equities, Inc. Series D, 7.00% | | 236,759 | 8,341,020 |
| Equity Commonwealth 6.50% | | 31,237 | 844,024 |
| Lexington Corporate Properties Trust Series C, 6.50% | | 468,742 | 23,741,782 |
| | | | 32,926,826 |
| Nonconvertible Preferred Stocks - 17.7% | | | |
| FINANCIALS - 17.7% | | | |
| Capital Markets - 0.1% | | | |
| Arlington Asset Investment Corp. 6.625% | | 182,517 | 4,143,136 |
| Real Estate Investment Trusts - 17.4% | | | |
| AG Mortgage Investment Trust, Inc.: | | | |
| 8.00% | | 611,662 | 15,218,151 |
| 8.25% | | 38,935 | 994,400 |
| Alexandria Real Estate Equities, Inc. Series E, 6.45% | | 145,913 | 3,793,738 |
| American Capital Agency Corp.: | | | |
| 8.00% | | 200,000 | 5,290,000 |
| Series B, 7.75% | | 427,100 | 11,164,394 |
| American Capital Mortgage Investment Corp. Series A, 8.125% | | 248,636 | 6,352,650 |
| American Home Mortgage Investment Corp.: | | | |
| Series A, 9.75% (d) | | 120,300 | 1 |
| Series B, 9.25% (d) | | 124,100 | 1 |
| American Homes 4 Rent: | | | |
| Series A, 5.00% | | 581,770 | 16,056,852 |
| Series B, 5.00% | | 377,286 | 10,413,094 |
| Series C, 5.50% | | 915,240 | 24,986,052 |
| Series D, 6.50% | | 280,000 | 7,450,800 |
| Series E, 6.35% | | 210,000 | 5,352,900 |
| Annaly Capital Management, Inc.: | | | |
| Series A, 7.875% | | 134,900 | 3,507,400 |
| Series C, 7.625% | | 326,429 | 8,467,568 |
| Series D, 7.50% | | 621,976 | 16,252,233 |
| Series E, 7.625% | | 672,961 | 17,449,879 |
| Anworth Mortgage Asset Corp. Series A, 8.625% | | 309,630 | 7,886,276 |
| Apollo Commercial Real Estate Finance, Inc. Series A, 8.625% | | 375,101 | 9,677,606 |
| Apollo Residential Mortgage, Inc. Series A, 8.00% | | 485,559 | 11,915,618 |
| Arbor Realty Trust, Inc.: | | | |
| 7.375% (b) | | 430,605 | 11,010,570 |
| Series A, 8.25% (b) | | 189,089 | 4,785,843 |
| Series B, 7.75% (b) | | 240,000 | 6,000,000 |
| Series C, 8.50% (b) | | 100,000 | 2,575,000 |
| Armour Residential REIT, Inc. Series B, 7.875% | | 153,654 | 3,587,821 |
| Ashford Hospitality Trust, Inc.: | | | |
| Series D, 8.45% | | 47,000 | 1,199,910 |
| Series E, 9.00% | | 178,291 | 4,494,716 |
| Series F, 7.375% | | 268,000 | 6,673,200 |
| Bluerock Residential Growth (REIT), Inc.: | | | |
| Series A, 8.25% | | 486,775 | 12,953,083 |
| Series C, 7.625% | | 134,300 | 3,511,945 |
| Brandywine Realty Trust Series E, 6.90% | | 95,000 | 2,455,750 |
| Capstead Mortgage Corp. Series E, 7.50% | | 202,984 | 5,153,764 |
| CBL & Associates Properties, Inc.: | | | |
| Series D, 7.375% | | 286,376 | 7,136,490 |
| Series E, 6.625% | | 139,398 | 3,530,951 |
| Cedar Shopping Centers, Inc. Series B, 7.25% | | 415,750 | 10,938,383 |
| Chesapeake Lodging Trust Series A, 7.75% | | 266,916 | 7,049,252 |
| Colony Financial, Inc.: | | | |
| Series A, 8.50% | | 283,920 | 7,404,634 |
| Series B, 7.50% | | 108,867 | 2,768,488 |
| Series C, 7.125% | | 552,328 | 13,642,502 |
| Coresite Realty Corp. Series A, 7.25% | | 369,799 | 9,781,184 |
| Corporate Office Properties Trust Series L, 7.375% | | 167,140 | 4,407,482 |
| CubeSmart Series A, 7.75% | | 40,000 | 1,025,600 |
| CYS Investments, Inc.: | | | |
| Series A, 7.75% | | 118,428 | 2,886,090 |
| Series B, 7.50% | | 496,667 | 11,711,408 |
| DDR Corp.: | | | |
| Series J, 6.50% | | 340,721 | 8,794,009 |
| Series K, 6.25% | | 228,888 | 5,925,910 |
| Digital Realty Trust, Inc.: | | | |
| Series E, 7.00% | | 219,819 | 5,598,790 |
| Series G, 5.875% | | 145,444 | 3,806,269 |
| Series H, 7.375% | | 50,000 | 1,430,000 |
| DuPont Fabros Technology, Inc. Series C, 6.625% | | 84,000 | 2,362,080 |
| Dynex Capital, Inc.: | | | |
| Series A, 8.50% | | 362,932 | 9,236,619 |
| Series B, 7.625% | | 252,120 | 6,151,728 |
| Equity Lifestyle Properties, Inc. Series C, 6.75% | | 950,148 | 24,732,352 |
| Five Oaks Investment Corp. Series A, 8.75% | | 142,000 | 3,109,800 |
| General Growth Properties, Inc. Series A, 6.375% | | 166,463 | 4,411,270 |
| Gladstone Commercial Corp.: | | | |
| Series C, 7.125% | | 81,435 | 2,055,419 |
| Series D, 7.00% | | 200,000 | 5,106,000 |
| Government Properties Income Trust 5.875% | | 202,500 | 5,198,175 |
| Hersha Hospitality Trust: | | | |
| Series C, 6.875% | | 50,000 | 1,263,000 |
| Series D, 6.50% | | 200,000 | 5,058,000 |
| Hospitality Properties Trust Series D, 7.125% | | 40,800 | 1,075,488 |
| Invesco Mortgage Capital, Inc.: | | | |
| Series A, 7.75% | | 123,342 | 3,145,221 |
| Series B, 7.75% | | 844,337 | 21,505,263 |
| Investors Real Estate Trust Series B, 7.95% | | 126,572 | 3,335,172 |
| iStar Financial, Inc.: | | | |
| Series D, 8.00% | | 74,567 | 1,826,892 |
| Series E, 7.875% | | 281,296 | 6,714,536 |
| Series F, 7.80% | | 451,476 | 10,758,673 |
| Series G, 7.65% | | 10,497 | 245,630 |
| Kilroy Realty Corp.: | | | |
| Series G, 6.875% | | 46,760 | 1,201,264 |
| Series H, 6.375% | | 143,296 | 3,676,975 |
| LaSalle Hotel Properties: | | | |
| Series H, 7.50% | | 141,308 | 3,623,137 |
| Series I, 6.375% | | 354,698 | 9,222,148 |
| Series J, 6.30% | | 240,000 | 6,477,600 |
| MFA Financial, Inc.: | | | |
| 8.00% | | 538,930 | 13,812,776 |
| Series B, 7.50% | | 616,232 | 15,843,325 |
| Monmouth Real Estate Investment Corp.: | | | |
| Series A, 7.625% | | 80,000 | 2,160,000 |
| Series B, 7.875% | | 95,000 | 2,534,600 |
| National Retail Properties, Inc.: | | | |
| Series D, 6.625% | | 222,138 | 5,775,588 |
| Series E, 5.70% | | 301,404 | 7,993,234 |
| New York Mortgage Trust, Inc.: | | | |
| Series B, 7.75% | | 254,840 | 6,054,998 |
| Series C, 7.875% | | 244,689 | 5,769,767 |
| Newcastle Investment Corp.: | | | |
| Series B, 9.75% | | 17,942 | 465,954 |
| Series D, 8.375% | | 2,000 | 50,300 |
| NorthStar Realty Finance Corp.: | | | |
| Series A, 8.75% | | 7,890 | 200,722 |
| Series B, 8.25% | | 429,039 | 10,816,073 |
| Series C, 8.875% | | 329,101 | 8,471,060 |
| Series D, 8.50% | | 270,715 | 6,857,211 |
| Series E, 8.75% | | 481,729 | 12,245,551 |
| Pebblebrook Hotel Trust: | | | |
| Series B, 8.00% | | 185,085 | 4,699,308 |
| Series C, 6.50% | | 204,321 | 5,332,778 |
| Series D, 6.375% | | 350,000 | 9,712,500 |
| Pennsylvania (REIT) Series B, 7.375% | | 100,510 | 2,653,464 |
| Prologis, Inc. Series Q, 8.54% | | 94,446 | 6,661,399 |
| PS Business Parks, Inc.: | | | |
| Series S, 6.45% | | 93,809 | 2,451,229 |
| Series T, 6.00% | | 198,899 | 5,187,286 |
| Public Storage Series Y, 6.375% | | 122,000 | 3,447,720 |
| RAIT Financial Trust: | | | |
| 7.125% | | 336,786 | 8,372,500 |
| 7.625% | | 224,590 | 5,257,652 |
| Regency Centers Corp.: | | | |
| Series 6, 6.625% | | 152,661 | 3,956,973 |
| Series 7, 6.00% | | 176,250 | 4,573,688 |
| Resource Capital Corp. 8.625% | | 156,870 | 3,509,182 |
| Retail Properties America, Inc. Series A, 7.00% | | 394,411 | 10,649,097 |
| Sabra Health Care REIT, Inc. Series A, 7.125% | | 318,623 | 8,555,028 |
| Saul Centers, Inc. Series C, 6.875% | | 315,478 | 8,341,238 |
| Stag Industrial, Inc.: | | | |
| Series A, 9.00% | | 280,000 | 7,196,000 |
| Series B, 6.625% | | 80,300 | 2,115,102 |
| Series C, 6.875% | | 83,000 | 2,266,730 |
| Summit Hotel Properties, Inc.: | | | |
| Series A, 9.25% | | 138,340 | 3,583,006 |
| Series B, 7.875% | | 190,173 | 5,085,226 |
| Series C, 7.125% | | 153,212 | 4,037,136 |
| Series D, 6.45% | | 210,000 | 5,439,000 |
| Sun Communities, Inc. Series A, 7.125% | | 375,000 | 9,825,000 |
| Sunstone Hotel Investors, Inc.: | | | |
| Series E, 6.95% | | 42,000 | 1,144,500 |
| Series F, 6.45% | | 84,000 | 2,196,600 |
| Taubman Centers, Inc. Series K, 6.25% | | 157,322 | 4,120,263 |
| Terreno Realty Corp. Series A, 7.75% | | 213,890 | 5,653,113 |
| UMH Properties, Inc.: | | | |
| Series A, 8.25% | | 600,200 | 15,755,250 |
| Series B, 8.00% | | 321,929 | 8,724,276 |
| Urstadt Biddle Properties, Inc.: | | | |
| Series F, 7.125% | | 210,000 | 5,577,600 |
| Series G, 6.75% | | 160,000 | 4,337,600 |
| VEREIT, Inc. Series F, 6.70% | | 2,038,849 | 55,089,700 |
| Wells Fargo Real Estate Investment Corp. Series A, 6.375% | | 137,600 | 3,826,656 |
| Welltower, Inc. 6.50% | | 81,600 | 2,166,480 |
| WP Glimcher, Inc.: | | | |
| Series H, 7.50% | | 198,527 | 5,147,805 |
| Series I, 6.875% | | 256,115 | 6,812,659 |
| | | | 848,473,002 |
| Real Estate Management & Development - 0.2% | | | |
| Kennedy-Wilson, Inc. 7.75% | | 321,574 | 8,444,533 |
| TOTAL FINANCIALS | | | 861,060,671 |
| TOTAL PREFERRED STOCKS | | | |
| (Cost $846,139,860) | | | 893,987,497 |
| | | Principal Amount | Value |
|
| Corporate Bonds - 20.3% | | | |
| Convertible Bonds - 5.8% | | | |
| FINANCIALS - 5.8% | | | |
| Consumer Finance - 0.0% | | | |
| Zais Financial Partners LP 8% 11/15/16 (e) | | 2,000,000 | 1,985,000 |
| Diversified Financial Services - 0.8% | | | |
| RWT Holdings, Inc. 5.625% 11/15/19 | | 36,880,000 | 37,202,700 |
| Real Estate Investment Trusts - 4.1% | | | |
| American Realty Capital Properties, Inc. 3.75% 12/15/20 | | 25,928,000 | 26,252,100 |
| Apollo Commercial Real Estate Finance, Inc. 5.5% 3/15/19 | | 5,600,000 | 5,722,500 |
| Blackstone Mortgage Trust, Inc. 5.25% 12/1/18 | | 4,900,000 | 5,282,813 |
| Colony Financial, Inc.: | | | |
| 3.875% 1/15/21 | | 15,580,000 | 15,161,288 |
| 5% 4/15/23 | | 26,083,000 | 25,675,453 |
| NorthStar Realty Finance LP 7.25% 6/15/27 (e) | | 562,000 | 537,244 |
| PennyMac Corp. 5.375% 5/1/20 | | 28,556,000 | 27,556,540 |
| RAIT Financial Trust 4% 10/1/33 | | 42,310,000 | 38,475,656 |
| Redwood Trust, Inc. 4.625% 4/15/18 | | 14,700,000 | 14,700,000 |
| Resource Capital Corp.: | | | |
| 6% 12/1/18 | | 6,910,000 | 6,668,150 |
| 8% 1/15/20 | | 16,490,000 | 16,292,780 |
| Starwood Property Trust, Inc.: | | | |
| 3.75% 10/15/17 | | 10,750,000 | 10,938,125 |
| 4.55% 3/1/18 | | 3,846,000 | 4,098,394 |
| | | | 197,361,043 |
| Real Estate Management & Development - 0.1% | | | |
| Consolidated-Tomoka Land Co. 4.5% 3/15/20 | | 3,350,000 | 3,230,656 |
| Thrifts & Mortgage Finance - 0.8% | | | |
| IAS Operating Partnership LP 5% 3/15/18 (e) | | 42,350,000 | 41,926,500 |
| TOTAL FINANCIALS | | | 281,705,899 |
| Nonconvertible Bonds - 14.5% | | | |
| CONSUMER DISCRETIONARY - 3.7% | | | |
| Hotels, Restaurants & Leisure - 0.5% | | | |
| ESH Hospitality, Inc. 5.25% 5/1/25 (e) | | 8,040,000 | 7,999,800 |
| FelCor Lodging LP: | | | |
| 5.625% 3/1/23 | | 2,000,000 | 2,050,000 |
| 6% 6/1/25 | | 2,025,000 | 2,090,813 |
| Hilton Worldwide Finance LLC/Hilton Worldwide Finance Corp. 5.625% 10/15/21 | | 4,000,000 | 4,145,160 |
| Times Square Hotel Trust 8.528% 8/1/26 (e) | | 7,508,963 | 8,912,886 |
| | | | 25,198,659 |
| Household Durables - 3.1% | | | |
| Ashton Woods U.S.A. LLC/Ashton Woods Finance Co. 6.875% 2/15/21 (e) | | 13,825,000 | 13,202,875 |
| Brookfield Residential Properties, Inc./Brookfield Residential U.S. Corp. 6.125% 7/1/22 (e) | | 3,725,000 | 3,687,750 |
| Brookfield Residential Properties, Inc.: | | | |
| 6.375% 5/15/25 (e) | | 3,100,000 | 2,991,500 |
| 6.5% 12/15/20 (e) | | 12,085,000 | 12,326,700 |
| CalAtlantic Group, Inc.: | | | |
| 5.875% 11/15/24 | | 3,250,000 | 3,469,375 |
| 8.375% 5/15/18 | | 13,458,000 | 14,803,800 |
| D.R. Horton, Inc.: | | | |
| 4.375% 9/15/22 | | 4,175,000 | 4,404,625 |
| 4.75% 5/15/17 | | 2,000,000 | 2,037,500 |
| 5.75% 8/15/23 | | 2,510,000 | 2,798,650 |
| KB Home: | | | |
| 8% 3/15/20 | | 8,465,000 | 9,353,825 |
| 9.1% 9/15/17 | | 4,985,000 | 5,321,488 |
| Lennar Corp.: | | | |
| 4.125% 12/1/18 | | 5,520,000 | 5,671,800 |
| 4.5% 6/15/19 | | 1,830,000 | 1,916,925 |
| 4.5% 11/15/19 | | 2,000,000 | 2,102,500 |
| M/I Homes, Inc. 6.75% 1/15/21 | | 3,803,000 | 3,917,090 |
| Meritage Homes Corp.: | | | |
| 6% 6/1/25 | | 4,000,000 | 4,167,520 |
| 7% 4/1/22 | | 7,525,000 | 8,258,688 |
| 7.15% 4/15/20 | | 7,060,000 | 7,713,050 |
| Ryland Group, Inc.: | | | |
| 6.625% 5/1/20 | | 1,555,000 | 1,726,050 |
| 8.4% 5/15/17 | | 5,420,000 | 5,677,450 |
| Taylor Morrison Communities, Inc./Monarch Communities, Inc. 5.875% 4/15/23 (e) | | 4,100,000 | 4,223,000 |
| TRI Pointe Homes, Inc. 5.875% 6/15/24 | | 3,890,000 | 4,006,700 |
| WCI Communities, Inc. 6.875% 8/15/21 | | 1,845,000 | 1,895,738 |
| William Lyon Homes, Inc.: | | | |
| 7% 8/15/22 | | 8,180,000 | 8,261,800 |
| 8.5% 11/15/20 | | 15,550,000 | 16,366,375 |
| | | | 150,302,774 |
| Media - 0.0% | | | |
| CBS Outdoor Americas Capital LLC/CBS Outdoor Americas Capital Corp. 5.625% 2/15/24 | | 1,300,000 | 1,371,500 |
| Multiline Retail - 0.1% | | | |
| JC Penney Corp., Inc. 5.875% 7/1/23 (e) | | 3,175,000 | 3,254,693 |
| TOTAL CONSUMER DISCRETIONARY | | | 180,127,626 |
| CONSUMER STAPLES - 0.2% | | | |
| Food & Staples Retailing - 0.2% | | | |
| Ahold Lease Series 2001 A1 pass thru trust certificates 7.82% 1/2/20 | | 428,368 | 465,450 |
| Albertsons Companies LLC/Safeway, Inc./New Albertson's, Inc./Albertson's LLC 6.625% 6/15/24 (e) | | 4,835,000 | 5,137,188 |
| C&S Group Enterprises LLC 5.375% 7/15/22 (e) | | 5,860,000 | 5,625,600 |
| | | | 11,228,238 |
| FINANCIALS - 10.0% | | | |
| Diversified Financial Services - 0.5% | | | |
| Brixmor Operating Partnership LP: | | | |
| 3.85% 2/1/25 | | 8,384,000 | 8,535,994 |
| 4.125% 6/15/26 | | 2,000 | 2,073 |
| Icahn Enterprises LP/Icahn Enterprises Finance Corp.: | | | |
| 5.875% 2/1/22 | | 3,680,000 | 3,514,400 |
| 6% 8/1/20 | | 12,690,000 | 12,658,275 |
| | | | 24,710,742 |
| Real Estate Investment Trusts - 6.9% | | | |
| American Campus Communities Operating Partnership LP 4.125% 7/1/24 | | 2,000,000 | 2,128,240 |
| ARC Properties Operating Partnership LP 4.6% 2/6/24 | | 15,480,000 | 16,176,600 |
| Care Capital Properties LP 5.125% 8/15/26 (e) | | 8,454,000 | 8,563,074 |
| CBL & Associates LP: | | | |
| 4.6% 10/15/24 | | 21,758,000 | 20,538,660 |
| 5.25% 12/1/23 | | 11,500,000 | 11,391,969 |
| Corporate Office Properties LP 3.6% 5/15/23 | | 5,000,000 | 4,978,470 |
| Crown Castle International Corp. 5.25% 1/15/23 | | 4,000,000 | 4,578,640 |
| CTR Partnership LP/CareTrust Capital Corp. 5.875% 6/1/21 | | 12,182,000 | 12,486,550 |
| CubeSmart LP 4.8% 7/15/22 | | 2,000,000 | 2,223,318 |
| DDR Corp.: | | | |
| 7.5% 7/15/18 | | 8,756,000 | 9,632,432 |
| 7.875% 9/1/20 | | 4,637,000 | 5,614,405 |
| DuPont Fabros Technology LP 5.875% 9/15/21 | | 1,000,000 | 1,048,125 |
| HCP, Inc. 4% 6/1/25 | | 1,000,000 | 1,022,949 |
| Health Care Property Investors, Inc.: | | | |
| 5.625% 5/1/17 | | 2,980,000 | 3,072,165 |
| 6% 1/30/17 | | 2,383,000 | 2,436,760 |
| Health Care REIT, Inc.: | | | |
| 4% 6/1/25 | | 1,551,000 | 1,653,941 |
| 4.125% 4/1/19 | | 2,000,000 | 2,111,258 |
| Healthcare Realty Trust, Inc.: | | | |
| 3.75% 4/15/23 | | 4,022,000 | 4,071,310 |
| 5.75% 1/15/21 | | 3,095,000 | 3,498,737 |
| Highwoods/Forsyth LP: | | | |
| 3.625% 1/15/23 | | 1,607,000 | 1,647,377 |
| 5.85% 3/15/17 | | 2,800,000 | 2,872,615 |
| Hospitality Properties Trust: | | | |
| 5% 8/15/22 | | 3,177,000 | 3,442,159 |
| 5.625% 3/15/17 | | 915,000 | 935,903 |
| HRPT Properties Trust: | | | |
| 6.25% 6/15/17 | | 1,055,000 | 1,072,351 |
| 6.65% 1/15/18 | | 4,246,000 | 4,422,778 |
| iStar Financial, Inc.: | | | |
| 4% 11/1/17 | | 27,605,000 | 27,397,963 |
| 5% 7/1/19 | | 24,265,000 | 23,901,025 |
| 5.85% 3/15/17 | | 3,587,000 | 3,622,870 |
| 7.125% 2/15/18 | | 5,725,000 | 5,896,750 |
| 9% 6/1/17 | | 9,175,000 | 9,542,000 |
| MPT Operating Partnership LP/MPT Finance Corp.: | | | |
| 5.25% 8/1/26 | | 4,385,000 | 4,609,731 |
| 6.375% 2/15/22 | | 3,610,000 | 3,790,500 |
| 6.375% 3/1/24 | | 4,000,000 | 4,360,000 |
| 6.875% 5/1/21 | | 2,000,000 | 2,070,600 |
| National Retail Properties, Inc. 3.3% 4/15/23 | | 2,000,000 | 2,046,450 |
| Omega Healthcare Investors, Inc.: | | | |
| 4.5% 4/1/27 | | 2,462,000 | 2,454,949 |
| 4.95% 4/1/24 | | 2,898,000 | 3,012,894 |
| Potlatch Corp. 7.5% 11/1/19 | | 1,000,000 | 1,105,000 |
| Reckson Operating Partnership LP/SL Green Realty Corp./SL Green Operating Partnership LP 7.75% 3/15/20 | | 2,000,000 | 2,327,996 |
| Select Income REIT: | | | |
| 4.15% 2/1/22 | | 6,937,000 | 6,988,306 |
| 4.5% 2/1/25 | | 19,802,000 | 19,656,257 |
| Senior Housing Properties Trust: | | | |
| 3.25% 5/1/19 | | 2,882,000 | 2,909,967 |
| 4.75% 5/1/24 | | 33,918,000 | 34,984,891 |
| 6.75% 4/15/20 | | 13,624,000 | 15,054,983 |
| 6.75% 12/15/21 | | 8,000,000 | 9,224,552 |
| VEREIT Operating Partnership LP 4.875% 6/1/26 | | 10,945,000 | 11,492,250 |
| WP Carey, Inc.: | | | |
| 4% 2/1/25 | | 5,000,000 | 4,965,970 |
| 4.6% 4/1/24 | | 3,355,000 | 3,490,488 |
| | | | 336,527,178 |
| Real Estate Management & Development - 2.3% | | | |
| CBRE Group, Inc.: | | | |
| 5% 3/15/23 | | 6,020,000 | 6,296,065 |
| 5.25% 3/15/25 | | 3,295,000 | 3,523,521 |
| Host Hotels & Resorts LP 5.25% 3/15/22 | | 2,000,000 | 2,212,212 |
| Howard Hughes Corp. 6.875% 10/1/21 (e) | | 23,985,000 | 24,884,438 |
| Hunt Companies, Inc. 9.625% 3/1/21 (e) | | 7,460,000 | 7,571,900 |
| Kennedy-Wilson, Inc. 5.875% 4/1/24 | | 31,370,000 | 31,683,700 |
| Mid-America Apartments LP: | | | |
| 3.75% 6/15/24 | | 1,663,000 | 1,744,439 |
| 6.05% 9/1/16 | | 2,500,000 | 2,508,413 |
| Realogy Group LLC/Realogy Co.-Issuer Corp.: | | | |
| 4.5% 4/15/19 (e) | | 4,805,000 | 4,985,188 |
| 4.875% 6/1/23 (e) | | 3,365,000 | 3,415,475 |
| 5.25% 12/1/21 (e) | | 8,290,000 | 8,663,050 |
| Regency Centers LP 5.875% 6/15/17 | | 300,000 | 310,710 |
| Taylor Morrison Communities, Inc./Monarch Communities, Inc.: | | | |
| 5.25% 4/15/21 (e) | | 7,000,000 | 7,122,500 |
| 5.625% 3/1/24 (e) | | 2,270,000 | 2,304,050 |
| Ventas Realty LP/Ventas Capital Corp. 4% 4/30/19 | | 2,262,000 | 2,386,238 |
| Wells Operating Partnership II LP 5.875% 4/1/18 | | 3,000,000 | 3,178,155 |
| | | | 112,790,054 |
| Thrifts & Mortgage Finance - 0.3% | | | |
| Cantor Commercial Real Estate Co. LP/CCRE Finance Corp. 7.75% 2/15/18 (e) | | 4,755,000 | 4,707,450 |
| Ocwen Financial Corp. 6.625% 5/15/19 | | 14,073,000 | 9,886,283 |
| | | | 14,593,733 |
| TOTAL FINANCIALS | | | 488,621,707 |
| HEALTH CARE - 0.4% | | | |
| Health Care Providers & Services - 0.4% | | | |
| Sabra Health Care LP/Sabra Capital Corp.: | | | |
| 5.375% 6/1/23 | | 5,230,000 | 5,269,225 |
| 5.5% 2/1/21 | | 12,305,000 | 12,827,963 |
| | | | 18,097,188 |
| INDUSTRIALS - 0.1% | | | |
| Industrial Conglomerates - 0.1% | | | |
| Ladder Capital Finance Holdings LLLP/Ladder Capital Finance Corp. 7.375% 10/1/17 | | 3,050,000 | 3,088,125 |
| INFORMATION TECHNOLOGY - 0.1% | | | |
| Internet Software & Services - 0.1% | | | |
| CyrusOne LP/CyrusOne Finance Corp. 6.375% 11/15/22 | | 4,000,000 | 4,190,000 |
|
| TOTAL NONCONVERTIBLE BONDS | | | 705,352,884 |
|
| TOTAL CORPORATE BONDS | | | |
| (Cost $954,512,135) | | | 987,058,783 |
|
| Asset-Backed Securities - 2.3% | | | |
| American Homes 4 Rent: | | | |
| Series 2014-SFR1 Class E, 2.9461% 6/17/31 (e)(f) | | 6,698,000 | 6,408,173 |
| Series 2014-SFR2 Class E, 6.231% 10/17/36 (e) | | 3,000,000 | 3,247,094 |
| Series 2014-SFR3 Class E, 6.418% 12/17/36 (e) | | 9,025,000 | 9,895,200 |
| Series 2015-SFR1: | | | |
| Class E, 5.639% 4/17/52 (e) | | 1,999,310 | 2,079,419 |
| Class F, 5.885% 4/17/52 (e) | | 2,000,000 | 1,963,554 |
| Series 2015-SFR2: | | | |
| Class E, 6.07% 10/17/45 (e) | | 8,259,000 | 8,844,185 |
| Class XS, 0% 10/17/45 (e)(f)(g) | | 4,849,315 | 48 |
| Capital Trust RE CDO Ltd. Series 2005-1A Class D, 1.9866% 3/20/50 (e)(f) | | 2,250,000 | 225 |
| CapLease CDO Ltd. Series 2005-1A Class A, 4.926% 1/29/40 (e) | | 722,850 | 724,803 |
| Conseco Finance Securitizations Corp. Series 2002-2 Class M2, 9.163% 3/1/33 | | 492,032 | 430,987 |
| Crest Clarendon Street Ltd./Crest Clarendon Corp. Series 2002-1A Class D, 9% 12/28/35 (e) | | 278,763 | 82,812 |
| Deutsche Financial Capital Securitization LLC Series 1997-I Class M, 7.275% 9/15/27 | | 4,450,694 | 4,614,236 |
| Green Tree Financial Corp.: | | | |
| Series 1996-4 Class M1, 7.75% 6/15/27 (f) | | 1,307,311 | 1,296,388 |
| Series 1997-3 Class M1, 7.53% 3/15/28 | | 6,658,526 | 6,655,361 |
| Invitation Homes Trust: | | | |
| Series 2013-SFR1 Class F, 4.101% 12/17/30 (e)(f) | | 1,750,000 | 1,713,832 |
| Series 2014-SFR1: | | | |
| Class E, 3.6961% 6/17/31 (e)(f) | | 10,000,000 | 9,877,155 |
| Class F, 4.1961% 6/17/31 (e)(f) | | 9,504,000 | 9,273,725 |
| Series 2014-SFR3: | | | |
| Class E, 4.9461% 12/17/31 (e)(f) | | 4,336,000 | 4,403,042 |
| Class F, 5.4461% 12/17/31 (e)(f) | | 2,215,000 | 2,232,319 |
| Series 2015-SFR2 Class E, 3.5971% 6/17/32 (e)(f) | | 2,450,000 | 2,405,656 |
| Series 2015-SFR3 Class F, 5.1961% 8/17/32 (e)(f) | | 2,000,000 | 2,003,672 |
| Series 2015-SRF1 Class F, 4.7461% 3/17/32 (e)(f) | | 5,500,000 | 5,436,015 |
| Lehman ABS Manufactured Housing Contract Trust Series 2001-B Class M2, 7.17% 4/15/40 | | 912,073 | 639,310 |
| Merit Securities Corp. Series 13 Class M1, 7.8304% 12/28/33 (f) | | 1,923,000 | 2,000,267 |
| Progress Residential Trust: | | | |
| Series 2015-SFR1 Class E, 4.483% 2/17/32 (e)(f) | | 1,500,000 | 1,504,976 |
| Series 2015-SFR3 Class F, 6.643% 11/12/32 (e) | | 2,940,000 | 3,017,104 |
| Series 2016-SFR1 Class F, 5.4821% 9/17/33 (e)(f) | | 8,459,000 | 8,534,903 |
| Starwood Waypoint Residential Trust Series 2014-1 Class F, 4.9961% 1/17/32 (e)(f) | | 4,071,000 | 4,025,785 |
| Taberna Preferred Funding III Ltd. Series 2005-3A Class D, 3.2829% 2/5/36 (e)(f) | | 4,037,577 | 404 |
| VB-S1 Issuer LLC Series 2016-1A Class F, 6.901% 6/15/46 (e) | | 7,797,000 | 7,828,921 |
| Wrightwood Capital Real Estate CDO Ltd. Series 2005-1A: | | | |
| Class A1, 0.9382% 11/21/40 (e)(f) | | 1,990,796 | 1,956,883 |
| Class F, 2.5682% 11/21/40 (e)(f) | | 250,000 | 125,474 |
| TOTAL ASSET-BACKED SECURITIES | | | |
| (Cost $115,474,944) | | | 113,221,928 |
|
| Collateralized Mortgage Obligations - 0.2% | | | |
| Private Sponsor - 0.2% | | | |
| Countrywide Home Loans, Inc.: | | | |
| Series 2002-R2 Class 2B3, 3.7124% 7/25/33 (e)(f) | | 151,839 | 22,338 |
| Series 2003-R3 Class B2, 5.5% 11/25/33 (e) | | 198,868 | 2,655 |
| FREMF Mortgage Trust: | | | |
| Series 2010-K6 Class B, 5.5327% 12/25/46 (e)(f) | | 4,500,000 | 4,911,560 |
| Series 2010-K7 Class B, 5.6244% 4/25/20 (e)(f) | | 3,200,000 | 3,563,855 |
| Merrill Lynch Mortgage Investors Trust Series 1998-C3 Class F, 6% 12/15/30 (e) | | 298,176 | 300,330 |
| RESI Finance LP/RESI Finance DE Corp. floater Series 2003-B Class B9, 12.3953% 6/10/35 (e)(f) | | 86,014 | 65,206 |
| Residential Funding Securities Corp. Series 2002-RM1 Class BI1, 5.5% 12/25/17 (e) | | 5,422 | 5,178 |
| RESIX Finance Ltd. floater: | | | |
| Series 2003-D Class B8, 6.9379% 12/10/35 (e)(f) | | 105,447 | 13,670 |
| Series 2004-A Class B7, 4.6879% 2/10/36 (e)(f) | | 107,029 | 32,465 |
| Series 2004-B Class B7, 4.4379% 2/10/36 (e)(f) | | 132,495 | 36,381 |
|
| TOTAL PRIVATE SPONSOR | | | 8,953,638 |
|
| U.S. Government Agency - 0.0% | | | |
| Fannie Mae REMIC Trust: | | | |
| Series 2001-W3 subordinate REMIC pass thru certificates, Class B3, 7% 9/25/41 (a) | | 53,996 | 4,155 |
| Series 2002-W1 subordinate REMIC pass thru certificates, Class 3B3, 3.2341% 2/25/42 (e)(f) | | 63,841 | 46,007 |
| Series 2003-W1 subordinate REMIC pass thru certificates, Class B3, 4.08% 12/25/42 (a)(f) | | 87,161 | 13,363 |
| Series 2003-W10 subordinate REMIC pass thru certificates, Class 2B3, 3.2087% 6/25/43 (e)(f) | | 101,389 | 67,798 |
| Series 2003-W4 subordinate REMIC pass thru certificates, Class 2B3, 3.1308% 10/25/42 (e)(f) | | 44,538 | 11,334 |
|
| TOTAL U.S. GOVERNMENT AGENCY | | | 142,657 |
|
| TOTAL COLLATERALIZED MORTGAGE OBLIGATIONS | | | |
| (Cost $9,030,796) | | | 9,096,295 |
|
| Commercial Mortgage Securities - 14.4% | | | |
| Americold LLC Trust Series 2010-ARTA Class D, 7.443% 1/14/29 (e) | | 2,000,000 | 2,237,270 |
| Banc of America Commercial Mortgage Trust: | | | |
| Series 2005-1 Class CJ, 5.5273% 11/10/42 (f) | | 642,708 | 642,137 |
| Series 2005-5 Class D, 5.5734% 10/10/45 (f) | | 1,810,745 | 1,810,942 |
| Bank of America Commercial Mortgage Trust Series 2015-UBS7 Class D, 3.167% 9/15/48 | | 1,000,000 | 783,085 |
| Barclays Commercial Mortgage Securities LLC Series 2015-STP: | | | |
| Class E, 4.4272% 9/10/28 (e)(f) | | 8,341,000 | 7,758,640 |
| Class F, 4.4272% 9/10/28 (e)(f) | | 4,074,000 | 3,702,373 |
| Bear Stearns Commercial Mortgage Securities Trust Series 2006-T22 Class B, 5.9067% 4/12/38 (e)(f) | | 2,234,360 | 2,241,131 |
| Bear Stearns Commercial Mortgage Securities Trust, Series 2006-PWR11 Class AJ, 5.5616% 3/11/39 (f) | | 5,700,000 | 5,443,500 |
| BLCP Hotel Trust floater Series 2014-CLRN Class F, 3.5146% 8/15/29 (e)(f) | | 2,500,000 | 2,299,434 |
| CCRESG Commercial Mortgage Trust Series 2016-HEAT: | | | |
| Class E, 5.6712% 4/10/29 (e)(f) | | 4,536,000 | 4,400,670 |
| Class F, 5.6712% 4/10/29 (e)(f) | | 9,710,000 | 8,959,282 |
| CGBAM Commercial Mortgage Trust: | | | |
| floater Series 2014-HD Class E, 3.4421% 2/15/31 (e)(f) | | 5,769,000 | 5,449,450 |
| Series 2015-SMRT: | | | |
| Class E, 3.9121% 4/10/28 (e)(f) | | 3,023,000 | 2,918,551 |
| Class F, 3.9121% 4/10/28 (e)(f) | | 9,911,000 | 9,349,205 |
| CGGS Commercial Mortgage Trust Series 2016-RND Class DFL, 5.1921% 2/15/33 (e)(f) | | 2,100,000 | 2,133,735 |
| Citigroup Commercial Mortgage Trust: | | | |
| Series 2013-GC15 Class D, 5.2737% 9/10/46 (e)(f) | | 5,254,000 | 5,145,853 |
| Series 2015-SHP2 Class E, 4.7921% 7/15/27 (e)(f) | | 2,933,000 | 2,730,187 |
| COMM Mortgage Trust: | | | |
| sequential payer Series 2013-LC6 Class E, 3.5% 1/10/46 (e) | | 7,300,000 | 5,135,185 |
| Series 2012-CR5 Class D, 4.4787% 12/10/45 (e)(f) | | 2,000,000 | 1,984,082 |
| Series 2013-CR10 Class D, 4.9493% 8/10/46 (e)(f) | | 2,000,000 | 1,809,040 |
| Series 2013-CR12 Class D, 5.2531% 10/10/46 (e)(f) | | 4,500,000 | 4,228,567 |
| Series 2013-CR6 Class F, 4.1715% 3/10/46 (e)(f) | | 8,038,000 | 5,165,204 |
| Series 2013-CR9 Class D, 4.3992% 7/10/45 (e)(f) | | 1,404,000 | 1,261,778 |
| Series 2013-LC6 Class D, 4.4274% 1/10/46 (e)(f) | | 6,374,000 | 5,946,210 |
| Series 2014-CR17: | | | |
| Class D, 4.959% 5/10/47 (e)(f) | | 2,500,000 | 2,259,909 |
| Class E, 4.799% 5/10/47 (e)(f) | | 1,575,000 | 1,225,018 |
| Series 2014-UBS2 Class D, 5.1822% 3/10/47 (e)(f) | | 3,713,000 | 3,218,973 |
| Commercial Mortgage Acceptance Corp. Series 1998-C2 Class J, 5.44% 9/15/30 (e) | | 1,423,263 | 1,392,640 |
| Commercial Mortgage Trust pass-thru certificates: | | | |
| Series 2012-CR1: | | | |
| Class C, 5.544% 5/15/45 (f) | | 1,000,000 | 1,119,861 |
| Class D, 5.544% 5/15/45 (e)(f) | | 5,550,000 | 5,768,729 |
| Class G, 2.462% 5/15/45 (e) | | 2,180,000 | 1,354,420 |
| Series 2012-CR2: | | | |
| Class D, 5.0166% 8/15/45 (e)(f) | | 4,500,000 | 4,603,062 |
| Class E, 5.0166% 8/15/45 (e)(f) | | 6,000,000 | 5,772,638 |
| Series 2012-LC4: | | | |
| Class C, 5.8068% 12/10/44 (f) | | 2,000,000 | 2,281,803 |
| Class D, 5.8068% 12/10/44 (e)(f) | | 11,675,000 | 12,181,549 |
| Core Industrial Trust: | | | |
| Series 2015-TEXW Class F, 3.977% 2/10/34 (e)(f) | | 10,746,000 | 9,514,532 |
| Series 2015-WEST Class F, 4.3677% 2/10/37 (e)(f) | | 12,745,000 | 11,161,944 |
| Credit Suisse First Boston Mortgage Securities Corp.: | | | |
| Series 1998-C1 Class F, 6% 5/17/40 (e) | | 790,550 | 814,175 |
| Series 1998-C2 Class F, 6.75% 11/15/30 (e) | | 303,593 | 306,436 |
| CSMC Trust floater Series 2015-DEAL: | | | |
| Class E, 4.481% 4/15/29 (e)(f) | | 2,000,000 | 1,908,528 |
| Class F, 5.231% 4/15/29 (e)(f) | | 5,053,000 | 4,917,330 |
| DBCCRE Mortgage Trust Series 2014-ARCP Class E, 5.099% 1/10/34 (e)(f) | | 10,853,000 | 10,218,352 |
| DBUBS Mortgage Trust: | | | |
| Series 2011-LC1A: | | | |
| Class E, 5.8835% 11/10/46 (e)(f) | | 14,031,000 | 15,375,074 |
| Class G, 4.652% 11/10/46 (e) | | 12,360,000 | 11,032,393 |
| Series 2011-LC3A Class D, 5.5485% 8/10/44 (e)(f) | | 3,945,000 | 4,239,818 |
| Extended Stay America Trust Series 2013-ESH7 Class C7, 3.9017% 12/5/31 (e) | | 500,000 | 503,092 |
| Freddie Mac: | | | |
| pass-thru certificates: | | | |
| Series K011 Class X3, 2.6635% 12/25/43 (f)(g) | | 12,206,096 | 1,218,605 |
| Series K012 Class X3, 2.3286% 1/25/41 (f)(g) | | 20,724,910 | 1,840,670 |
| Series K013 Class X3, 2.8134% 1/25/43 (f)(g) | | 14,360,000 | 1,567,292 |
| Series KAIV Class X2, 3.6147% 6/25/46 (f)(g) | | 7,430,000 | 1,141,408 |
| GAHR Commercial Mortgage Trust Series 2015-NRF: | | | |
| Class EFX, 3.4949% 12/15/34 (e)(f) | | 9,164,000 | 8,970,694 |
| Class FFX, 3.4949% 12/15/34 (e)(f) | | 8,032,000 | 7,620,833 |
| GMAC Commercial Mortgage Securities, Inc. Series 1997-C2 Class G, 6.75% 4/15/29 (f) | | 365,467 | 373,897 |
| GP Portfolio Trust Series 2014-GPP Class E, 4.2921% 2/15/27 (e)(f) | | 2,823,000 | 2,708,801 |
| GS Mortgage Securities Corp. II Series 2010-C1: | | | |
| Class D, 6.2151% 8/10/43 (e)(f) | | 4,000,000 | 4,226,292 |
| Class E, 4% 8/10/43 (e) | | 3,770,000 | 3,534,110 |
| GS Mortgage Securities Trust: | | | |
| Series 2010-C2 Class D, 5.3573% 12/10/43 (e)(f) | | 3,000,000 | 3,082,902 |
| Series 2011-GC5: | | | |
| Class C, 5.5484% 8/10/44 (e)(f) | | 9,000,000 | 9,983,171 |
| Class D, 5.5484% 8/10/44 (e)(f) | | 7,000,000 | 7,213,800 |
| Class E, 5.5484% 8/10/44 (e)(f) | | 4,049,000 | 3,741,910 |
| Class F, 4.5% 8/10/44 (e) | | 4,500,000 | 3,473,609 |
| Series 2012-GC6: | | | |
| Class C, 5.835% 1/10/45 (e)(f) | | 3,600,000 | 4,016,318 |
| Class D, 5.835% 1/10/45 (e)(f) | | 2,000,000 | 1,986,492 |
| Class E, 5% 1/10/45 (e)(f) | | 4,516,000 | 3,735,853 |
| Series 2012-GCJ7: | | | |
| Class C, 5.9132% 5/10/45 (f) | | 6,500,000 | 7,129,964 |
| Class D, 5.9132% 5/10/45 (e)(f) | | 9,205,000 | 9,122,962 |
| Class E, 5% 5/10/45 (e) | | 6,920,000 | 5,576,620 |
| Series 2012-GCJ9 Class D, 5.015% 11/10/45 (e)(f) | | 4,504,000 | 4,242,114 |
| Series 2013-GC14 Class D, 4.9269% 8/10/46 (e)(f) | | 1,680,000 | 1,616,669 |
| Series 2013-GC16: | | | |
| Class D, 5.4973% 11/10/46 (e)(f) | | 3,750,000 | 3,471,068 |
| Class F, 3.5% 11/10/46 (e) | | 7,303,000 | 4,928,221 |
| Series 2014-NEW Class D, 3.79% 1/10/31 (e) | | 2,510,000 | 2,476,813 |
| Series 2016-REMZ Class MZB, 7.727% 2/10/21 (e) | | 29,826,000 | 29,019,893 |
| Series 2016-RENT Class F, 4.2022% 2/10/29 (e)(f) | | 15,890,000 | 14,628,053 |
| Hilton U.S.A. Trust: | | | |
| floater Series 2014-ORL Class E, 3.6921% 7/15/29 (e)(f) | | 7,241,000 | 6,913,990 |
| Series 2013-HLT Class EFX, 4.6017% 11/5/30 (e)(f) | | 5,000,000 | 5,026,275 |
| Invitation Homes Trust floater Series 2013-SFR1 Class E, 3.101% 12/17/30 (e)(f) | | 1,500,000 | 1,465,792 |
| JPMorgan Chase Commercial Mortgage Securities Corp.: | | | |
| Series 2003-C1 Class F, 5.6132% 1/12/37 (e)(f) | | 1,000,000 | 987,796 |
| Series 2009-IWST: | | | |
| Class C, 7.6935% 12/5/27 (e)(f) | | 3,000,000 | 3,436,879 |
| Class D, 7.6935% 12/5/27 (e)(f) | | 9,550,000 | 10,886,424 |
| Series 2010-CNTR: | | | |
| Class D, 6.3899% 8/5/32 (e)(f) | | 4,500,000 | 5,044,717 |
| Class XB, 1.1366% 8/5/32 (e)(f)(g) | | 32,655,000 | 1,134,928 |
| Series 2012-CBX: | | | |
| Class C, 5.3934% 6/15/45 (f) | | 4,530,000 | 4,983,454 |
| Class E, 5.3934% 6/15/45 (e)(f) | | 4,635,000 | 4,737,611 |
| Class F, 4% 6/15/45 (e) | | 8,192,000 | 6,743,404 |
| Class G 4% 6/15/45 (e) | | 4,044,000 | 2,833,566 |
| JPMorgan Chase Commercial Mortgage Securities Trust: | | | |
| floater Series 2014-INN: | | | |
| Class E, 4.081% 6/15/29 (e)(f) | | 10,174,000 | 9,842,189 |
| Class F, 4.481% 6/15/29 (e)(f) | | 9,618,000 | 9,231,917 |
| Series 2011-C3: | | | |
| Class E, 5.8013% 2/15/46 (e)(f) | | 2,705,000 | 2,890,211 |
| Class H, 4.409% 2/15/46 (e)(f) | | 7,077,000 | 5,835,244 |
| Series 2011-C4 Class F, 3.873% 7/15/46 (e) | | 1,400,000 | 1,195,853 |
| Series 2013-LC11: | | | |
| Class C, 3.9582% 4/15/46 (f) | | 848,000 | 882,613 |
| Class D, 4.3786% 4/15/46 (f) | | 7,672,000 | 7,237,848 |
| Class E, 3.25% 4/15/46 (e)(f) | | 472,000 | 337,781 |
| Class F, 3.25% 4/15/46 (e)(f) | | 2,518,000 | 1,498,151 |
| Series 2014-DSTY Class E, 3.9314% 6/10/27 (e)(f) | | 2,752,000 | 2,553,226 |
| Series 2015-UES Class F, 3.7417% 9/5/32 (e)(f) | | 3,500,000 | 3,243,805 |
| JPMorgan Commercial Mortgage Finance Corp. Series 1999-C8 Class H, 6% 7/15/31 (e) | | 617,700 | 548,628 |
| LB-UBS Commercial Mortgage Trust: | | | |
| sequential payer Series 2006-C7 Class AM, 5.378% 11/15/38 | | 2,040,000 | 2,048,421 |
| Series 2006-C4 Class AJ, 5.9912% 6/15/38 (f) | | 691,282 | 690,942 |
| LSTAR Commercial Mortgage Trust Series 2014-2: | | | |
| Class D, 5.0182% 1/20/41 (e)(f) | | 3,000,000 | 2,965,477 |
| Class E, 5.0182% 1/20/41 (e)(f) | | 4,800,000 | 4,400,562 |
| Merrill Lynch Mortgage Trust Series 2006-C1 Class AJ, 5.7424% 5/12/39 (f) | | 19,155,001 | 19,046,260 |
| Mezz Capital Commercial Mortgage Trust Series 2004-C1 Class IO, 9.321% 1/15/37 (e)(f)(g) | | 241,146 | 10,554 |
| Morgan Stanley BAML Trust: | | | |
| Series 2012-C6 Class D, 4.8125% 11/15/45 (e)(f) | | 2,000,000 | 2,026,012 |
| Series 2013-C12 Class D, 4.9246% 10/15/46 (e)(f) | | 3,250,000 | 3,119,944 |
| Series 2013-C13: | | | |
| Class D, 5.0548% 11/15/46 (e)(f) | | 5,221,000 | 5,100,392 |
| Class E, 5.0548% 11/15/46 (e)(f) | | 3,379,000 | 2,684,629 |
| Series 2013-C7 Class E, 4.4312% 2/15/46 (e)(f) | | 1,000,000 | 780,996 |
| Series 2013-C9 Class D, 4.2942% 5/15/46 (e)(f) | | 5,137,000 | 4,640,393 |
| Morgan Stanley Capital I Trust: | | | |
| sequential payer: | | | |
| Series 2006-HQ10 Class AM, 5.36% 11/12/41 | | 8,200,000 | 8,227,910 |
| Series 2012-C4 Class E, 5.7045% 3/15/45 (e)(f) | | 7,294,000 | 7,322,017 |
| Series 1997-RR Class F, 7.4205% 4/30/39 (e)(f) | | 437,133 | 432,723 |
| Series 1998-CF1 Class G, 7.35% 7/15/32 (e) | | 2,229,907 | 2,232,452 |
| Series 2006-IQ12 Class AMFX, 5.37% 12/15/43 | | 7,500,000 | 7,546,523 |
| Series 2011-C1 Class C, 5.6007% 9/15/47 (e)(f) | | 4,000,000 | 4,535,209 |
| Series 2011-C2: | | | |
| Class D, 5.6471% 6/15/44 (e)(f) | | 4,887,000 | 5,234,662 |
| Class E, 5.6471% 6/15/44 (e)(f) | | 9,600,000 | 10,076,873 |
| Class F, 5.6471% 6/15/44 (e)(f) | | 4,440,000 | 4,323,360 |
| Class XB, 0.6038% 6/15/44 (e)(f)(g) | | 63,708,222 | 1,473,093 |
| Series 2011-C3: | | | |
| Class C, 5.3479% 7/15/49 (e)(f) | | 2,000,000 | 2,229,481 |
| Class D, 5.3479% 7/15/49 (e)(f) | | 7,400,000 | 8,019,110 |
| Class E, 5.3479% 7/15/49 (e)(f) | | 832,000 | 867,505 |
| Class G, 5.3479% 7/15/49 (e)(f) | | 3,283,000 | 2,588,889 |
| Series 2012-C4 Class D, 5.7045% 3/15/45 (e)(f) | | 6,310,000 | 6,634,620 |
| Series 2015-UBS8 Class D, 3.25% 12/15/48 (e) | | 5,013,000 | 3,706,867 |
| Motel 6 Trust Series 2015-MTL6: | | | |
| Class E, 5.2785% 2/5/30 (e) | | 8,349,000 | 8,340,763 |
| Class F, 5% 2/5/30 (e) | | 14,325,000 | 13,558,274 |
| MSJP Commercial Securities Mortgage Trust Series 2015-HAUL Class E, 5.0127% 9/5/47 (e)(f) | | 1,500,000 | 1,222,641 |
| Providence Place Group Ltd. Partnership Series 2000-C1 Class A2, 7.75% 7/20/28 (e) | | 4,679,368 | 5,582,018 |
| SCG Trust Series 2013-SRP1 Class D, 3.7764% 11/15/26 (e)(f) | | 4,347,000 | 4,089,027 |
| TIAA Seasoned Commercial Mortgage Trust sequential payer Series 2007-C4 Class AJ, 5.5379% 8/15/39 (f) | | 451,162 | 453,300 |
| UBS Commercial Mortgage Trust Series 2012-C1: | | | |
| Class D, 5.7152% 5/10/45 (e)(f) | | 3,235,000 | 3,331,743 |
| Class E, 5% 5/10/45 (e)(f) | | 4,053,000 | 3,525,031 |
| UBS-Barclays Commercial Mortgage Trust sequential payer Series 2012-C3 Class A1, 0.726% 8/10/49 | | 974,264 | 972,271 |
| UBS-Citigroup Commercial Mortgage Trust Series 2011-C1 Class B, 6.0842% 1/10/45 (e)(f) | | 3,000,000 | 3,477,196 |
| Vornado DP LLC Series 2010-VNO Class D, 6.3555% 9/13/28 (e) | | 2,540,000 | 2,840,395 |
| Wachovia Bank Commercial Mortgage Trust Series 2004-C11 Class D, 5.8847% 1/15/41 (f) | | 4,712,822 | 4,775,705 |
| Wells Fargo Commercial Mortgage Trust: | | | |
| Series 2012-LC5 Class D, 4.9355% 10/15/45 (e)(f) | | 9,999,000 | 9,778,278 |
| Series 2016-C35 Class D, 3.142% 7/15/48 (e) | | 8,358,000 | 5,993,783 |
| WF-RBS Commercial Mortgage Trust: | | | |
| sequential payer Series 2011-C4I Class G, 5% 6/15/44 (e) | | 4,000,000 | 3,161,344 |
| Series 2011-C3: | | | |
| Class C, 5.335% 3/15/44 (e) | | 4,900,000 | 5,346,789 |
| Class D, 5.8071% 3/15/44 (e)(f) | | 1,000,000 | 1,052,505 |
| Class E, 5% 3/15/44 (e) | | 3,000,000 | 2,737,148 |
| Series 2011-C5: | | | |
| Class F, 5.25% 11/15/44 (e)(f) | | 3,000,000 | 2,574,344 |
| Class G, 5.25% 11/15/44 (e)(f) | | 2,000,000 | 1,578,224 |
| Series 2012-C10 Class E, 4.6017% 12/15/45 (e)(f) | | 4,090,000 | 3,322,304 |
| Series 2012-C7: | | | |
| Class D, 4.9916% 6/15/45 (e)(f) | | 2,380,000 | 2,458,015 |
| Class F, 4.5% 6/15/45 (e) | | 2,000,000 | 1,498,030 |
| Series 2013-C11: | | | |
| Class D, 4.3175% 3/15/45 (e)(f) | | 5,830,000 | 5,449,120 |
| Class E, 4.3175% 3/15/45 (e)(f) | | 4,780,000 | 3,607,374 |
| Series 2013-C13 Class D, 4.1386% 5/15/45 (e)(f) | | 4,000,000 | 3,609,846 |
| Series 2013-C16 Class D, 5.1491% 9/15/46 (e)(f) | | 3,728,000 | 3,665,161 |
| Series 2013-UBS1 Class D, 4.7827% 3/15/46 (e)(f) | | 1,668,000 | 1,622,433 |
| WFCG Commercial Mortgage Trust floater Series 2015-BXRP: | | | |
| Class F, 4.1624% 11/15/29 (e)(f) | | 5,152,378 | 4,950,843 |
| Class G, 3.4621% 11/15/29 (e)(f) | | 4,994,505 | 4,605,234 |
| TOTAL COMMERCIAL MORTGAGE SECURITIES | | | |
| (Cost $671,982,193) | | | 698,992,138 |
|
| Bank Loan Obligations - 5.3% | | | |
| CONSUMER DISCRETIONARY - 1.9% | | | |
| Hotels, Restaurants & Leisure - 1.5% | | | |
| Caesars Entertainment Resort Properties LLC Tranche B 1LN, term loan 7% 10/11/20 (f) | | 13,103,706 | 12,782,665 |
| Caesars Growth Properties Holdings, LLC Tranche 1LN, term loan 6.25% 5/8/21 (f) | | 10,091,606 | 9,612,254 |
| Cooper Hotel Group 12% 11/6/17 | | 13,106,661 | 13,237,727 |
| Four Seasons Holdings, Inc.: | | | |
| Tranche 2LN, term loan 7.75% 12/27/20 (f) | | 2,150,000 | 2,150,000 |
| Tranche B 1LN, term loan 5.25% 6/27/20 (f) | | 1,986,701 | 1,987,317 |
| Hilton Worldwide Finance, LLC Tranche B, term loan 3.5% 10/25/20 (f) | | 14,821,555 | 14,855,792 |
| La Quinta Intermediate Holdings LLC Tranche B LN, term loan 3.75% 4/14/21 (f) | | 13,049,903 | 12,935,717 |
| Playa Resorts Holding BV Tranche B, term loan 4% 8/9/19 (f) | | 4,052,685 | 4,032,422 |
| Ryman Hospitality Properties, Inc. Tranche B, term loan 3.5% 1/15/21 (f) | | 2,244,200 | 2,247,566 |
| | | | 73,841,460 |
| Media - 0.2% | | | |
| CBS Outdoor Americas Capital LLC/CBS Outdoor Americas Capital Corp. Tranche B, term loan 3% 1/31/21 (f) | | 7,361,813 | 7,355,702 |
| Multiline Retail - 0.2% | | | |
| JC Penney Corp., Inc. Tranche B, term loan 5.25% 6/23/23 (f) | | 10,115,000 | 10,123,395 |
|
| TOTAL CONSUMER DISCRETIONARY | | | 91,320,557 |
|
| CONSUMER STAPLES - 0.4% | | | |
| Food & Staples Retailing - 0.4% | | | |
| Albertson's LLC: | | | |
| Tranche B 5LN, term loan 4.75% 12/21/22 (f) | | 5,642,488 | 5,669,910 |
| Tranche B 6LN, term loan 4.75% 6/22/23 (f) | | 12,665,000 | 12,741,497 |
| | | | 18,411,407 |
| ENERGY - 0.7% | | | |
| Oil, Gas & Consumable Fuels - 0.7% | | | |
| Moxie Patriot LLC Tranche B, term loan 6.75% 12/19/20 (f) | | 17,393,422 | 16,610,718 |
| Panda Temple Power, LLC term loan 7.25% 4/3/19 (f) | | 8,537,100 | 7,854,132 |
| TPF II Power, LLC Tranche B, term loan 5.5% 10/2/21 (f) | | 8,131,336 | 8,163,861 |
| | | | 32,628,711 |
| FINANCIALS - 1.1% | | | |
| Real Estate Investment Trusts - 0.4% | | | |
| iStar Financial, Inc. Tranche B, term loan 5.5% 7/1/20 (f) | | 8,435,000 | 8,493,033 |
| Starwood Property Trust, Inc. Tranche B, term loan 3.5% 4/17/20 (f) | | 10,712,049 | 10,695,338 |
| | | | 19,188,371 |
| Real Estate Management & Development - 0.6% | | | |
| Americold Realty Operating Partnership LP Tranche B, term loan 5.75% 12/1/22 (f) | | 11,225,640 | 11,337,897 |
| DTZ U.S. Borrower LLC Tranche B 1LN, term loan 4.25% 11/4/21 (f) | | 8,987,406 | 8,923,775 |
| NorthStar Asset Management LP Tranche B 1LN, term loan 4.6265% 1/29/23 (f) | | 4,997,475 | 4,974,587 |
| Realogy Group LLC Tranche B, term loan 3.75% 7/20/22 (f) | | 3,300,000 | 3,316,500 |
| | | | 28,552,759 |
| Thrifts & Mortgage Finance - 0.1% | | | |
| Ocwen Loan Servicing, LLC Tranche B, term loan 5.5% 2/15/18 (f) | | 6,610,838 | 6,511,675 |
|
| TOTAL FINANCIALS | | | 54,252,805 |
|
| HEALTH CARE - 0.1% | | | |
| Health Care Providers & Services - 0.1% | | | |
| Community Health Systems, Inc.: | | | |
| Tranche F, term loan 3.9241% 12/31/18 (f) | | 1,756,471 | 1,739,222 |
| Tranche H, term loan 4% 1/27/21 (f) | | 3,088,463 | 3,048,900 |
| | | | 4,788,122 |
| INDUSTRIALS - 0.3% | | | |
| Commercial Services & Supplies - 0.1% | | | |
| Lineage Logistics Holdings, LLC. Tranche B, term loan 4.5% 4/7/21 (f) | | 3,910,000 | 3,701,480 |
| Pilot Travel Centers LLC Tranche B, term loan 3.2456% 5/25/23 (f) | | 4,178,425 | 4,194,094 |
| | | | 7,895,574 |
| Construction & Engineering - 0.2% | | | |
| Drumm Investors LLC Tranche B, term loan 9.5% 5/4/18 (f) | | 8,531,846 | 8,354,128 |
|
| TOTAL INDUSTRIALS | | | 16,249,702 |
|
| UTILITIES - 0.8% | | | |
| Electric Utilities - 0.4% | | | |
| Calpine Construction Finance Co. LP Tranche B 2LN, term loan 3.25% 1/31/22 (f) | | 7,231,946 | 7,130,699 |
| Dynegy Finance IV, Inc. Tranche C, term loan 5% 6/27/23 (f) | | 4,220,000 | 4,220,000 |
| Essential Power LLC Tranche B, term loan 4.75% 8/8/19 (f) | | 6,683,047 | 6,616,216 |
| Southeast Powergen LLC Tranche B, term loan 4.5% 12/2/21 (f) | | 2,641,888 | 2,546,119 |
| | | | 20,513,034 |
| Independent Power and Renewable Electricity Producers - 0.4% | | | |
| APLP Holdings LP Tranche B, term loan 6% 4/13/23 (f) | | 7,227,165 | 7,245,233 |
| Tempus Public Foundation Generation Holdings LLC Tranche B, term loan 4.75% 12/31/17 (f) | | 11,369,138 | 10,933,359 |
| | | | 18,178,592 |
|
| TOTAL UTILITIES | | | 38,691,626 |
|
| TOTAL BANK LOAN OBLIGATIONS | | | |
| (Cost $258,138,621) | | | 256,342,930 |
|
| Preferred Securities - 0.0% | | | |
| FINANCIALS - 0.0% | | | |
| Diversified Financial Services - 0.0% | | | |
| Crest Dartmouth Street 2003 1 Ltd. Series 2003-1A Class PS, 6/28/38 (e) | | 1,220,000 | 20,679 |
| Thrifts & Mortgage Finance - 0.0% | | | |
| Crest Clarendon Street 2002-1 Ltd. Series 2002-1A Class PS, 12/28/35 (e) | | 500,000 | 247 |
| TOTAL PREFERRED SECURITIES | | | |
| (Cost $1,297,768) | | | 20,926 |
| | | Shares | Value |
|
| Money Market Funds - 6.5% | | | |
| Fidelity Cash Central Fund, 0.42% (h) | | 314,785,413 | 314,785,413 |
| Fidelity Securities Lending Cash Central Fund, 0.45% (h)(i) | | 1,316,700 | 1,316,700 |
| TOTAL MONEY MARKET FUNDS | | | |
| (Cost $316,102,113) | | | 316,102,113 |
| TOTAL INVESTMENT PORTFOLIO - 99.8% | | | |
| (Cost $4,394,702,295) | | | 4,849,258,891 |
| NET OTHER ASSETS (LIABILITIES) - 0.2% | | | 7,945,051 |
| NET ASSETS - 100% | | | $4,857,203,942 |
Legend
(a) Restricted securities - Investment in securities not registered under the Securities Act of 1933 (excluding 144A issues). At the end of the period, the value of restricted securities (excluding 144A issues) amounted to $5,824,211 or 0.1% of net assets.
(b) Affiliated company
(c) Security or a portion of the security is on loan at period end.
(d) Non-income producing
(e) Security exempt from registration under Rule 144A of the Securities Act of 1933. These securities may be resold in transactions exempt from registration, normally to qualified institutional buyers. At the end of the period, the value of these securities amounted to $907,486,670 or 18.7% of net assets.
(f) Coupon rates for floating and adjustable rate securities reflect the rates in effect at period end.
(g) Security represents right to receive monthly interest payments on an underlying pool of mortgages or assets. Principal shown is the outstanding par amount of the pool as of the end of the period.
(h) Affiliated fund that is generally available only to investment companies and other accounts managed by Fidelity Investments. The rate quoted is the annualized seven-day yield of the fund at period end. A complete unaudited listing of the fund's holdings as of its most recent quarter end is available upon request. In addition, each Fidelity Central Fund's financial statements, which are not covered by the Fund's Report of Independent Registered Public Accounting Firm, are available on the SEC's website or upon request.
(i) Investment made with cash collateral received from securities on loan.
Additional information on each restricted holding is as follows:
| Security | Acquisition Date | Acquisition Cost |
| Fannie Mae REMIC Trust Series 2001-W3 subordinate REMIC pass thru certificates, Class B3, 7% 9/25/41 | 5/21/03 | $46,791 |
| Fannie Mae REMIC Trust Series 2003-W1 subordinate REMIC pass thru certificates, Class B3, 4.08% 12/25/42 | 3/25/03 | $51,824 |
| Stanley Martin Communities LLC Class B | 8/3/05 - 3/1/07 | $4,244,623 |
Affiliated Central Funds
Information regarding fiscal year to date income earned by the Fund from investments in Fidelity Central Funds is as follows:
| Fund | Income earned |
| Fidelity Cash Central Fund | $942,575 |
| Fidelity Securities Lending Cash Central Fund | 28,725 |
| Total | $971,300 |
Other Affiliated Issuers
An affiliated company is a company in which the Fund has ownership of at least 5% of the voting securities. Fiscal year to date transactions with companies which are or were affiliates are as follows:
| Affiliate | Value, beginning of period | Purchases | Sales Proceeds | Dividend Income | Value, end of period |
| Acadia Realty Trust (SBI) | $119,299,759 | $3,255,274 | $965,602 | $3,155,180 | $-- |
| Arbor Realty Trust, Inc. | 20,991,789 | -- | 75,982 | 1,838,251 | 21,868,468 |
| Arbor Realty Trust, Inc. 7.375% | 10,597,189 | -- | -- | 793,928 | 11,010,570 |
| Arbor Realty Trust, Inc. Series A, 8.25% | 4,814,206 | -- | -- | 389,996 | 4,785,843 |
| Arbor Realty Trust, Inc. Series B, 7.75% | 5,940,000 | -- | -- | 465,000 | 6,000,000 |
| Arbor Realty Trust, Inc. Series C, 8.50% | 2,578,000 | -- | -- | 212,500 | 2,575,000 |
| Great Ajax Corp. | 7,020,000 | 12,241,285 | -- | 201,403 | 19,621,115 |
| Total | $171,240,943 | $15,496,559 | $1,041,584 | $7,056,258 | $65,860,996 |
Investment Valuation
The following is a summary of the inputs used, as of July 31, 2016, involving the Fund's assets and liabilities carried at fair value. The inputs or methodology used for valuing securities may not be an indication of the risk associated with investing in those securities. For more information on valuation inputs, and their aggregation into the levels used below, please refer to the Investment Valuation section in the accompanying Notes to Financial Statements.
| | Valuation Inputs at Reporting Date: |
| Description | Total | Level 1 | Level 2 | Level 3 |
| Investments in Securities: | | | | |
| Equities: | | | | |
| Consumer Discretionary | $5,806,693 | $-- | $-- | $5,806,693 |
| Financials | 2,462,617,085 | 2,450,757,509 | 11,859,574 | 2 |
| Corporate Bonds | 987,058,783 | -- | 987,058,783 | -- |
| Asset-Backed Securities | 113,221,928 | -- | 112,373,703 | 848,225 |
| Collateralized Mortgage Obligations | 9,096,295 | -- | 8,846,129 | 250,166 |
| Commercial Mortgage Securities | 698,992,138 | -- | 684,740,742 | 14,251,396 |
| Bank Loan Obligations | 256,342,930 | -- | 243,105,203 | 13,237,727 |
| Preferred Securities | 20,926 | -- | -- | 20,926 |
| Money Market Funds | 316,102,113 | 316,102,113 | -- | -- |
| Total Investments in Securities: | $4,849,258,891 | $2,766,859,622 | $2,047,984,134 | $34,415,135 |
Other Information
The composition of credit quality ratings as a percentage of Total Net Assets is as follows (Unaudited):
| U.S. Government and U.S. Government Agency Obligations | 0.1% |
| AAA,AA,A | 2.3% |
| BBB | 9.0% |
| BB | 9.0% |
| B | 10.6% |
| CCC,CC,C | 0.8% |
| D | 0.0% |
| Not Rated | 10.7% |
| Equities | 50.8% |
| Short-Term Investments and Net Other Assets | 6.7% |
| | 100% |
We have used ratings from Moody's Investors Service, Inc. Where Moody's® ratings are not available, we have used S&P® ratings. All ratings are as of the date indicated and do not reflect subsequent changes.
Percentages shown as 0.0% may reflect amounts less than 0.05%.
See accompanying notes which are an integral part of the financial statements.
Financial Statements
Statement of Assets and Liabilities
| | | July 31, 2016 |
| Assets | | |
Investment in securities, at value (including securities loaned of $1,300,873) — See accompanying schedule:
Unaffiliated issuers (cost $4,012,720,751) | $4,467,295,782 | |
| Fidelity Central Funds (cost $316,102,113) | 316,102,113 | |
| Other affiliated issuers (cost $65,879,431) | 65,860,996 | |
| Total Investments (cost $4,394,702,295) | | $4,849,258,891 |
| Cash | | 5,534,808 |
| Receivable for investments sold | | 18,455,612 |
| Receivable for fund shares sold | | 10,387,409 |
| Dividends receivable | | 2,677,994 |
| Interest receivable | | 19,180,238 |
| Distributions receivable from Fidelity Central Funds | | 114,067 |
| Other receivables | | 20,587 |
| Total assets | | 4,905,629,606 |
| Liabilities | | |
| Payable for investments purchased | $39,637,835 | |
| Payable for fund shares redeemed | 3,993,810 | |
| Accrued management fee | 2,181,907 | |
| Distribution and service plan fees payable | 360,628 | |
| Other affiliated payables | 841,801 | |
| Other payables and accrued expenses | 92,983 | |
| Collateral on securities loaned, at value | 1,316,700 | |
| Total liabilities | | 48,425,664 |
| Net Assets | | $4,857,203,942 |
| Net Assets consist of: | | |
| Paid in capital | | $4,339,374,272 |
| Undistributed net investment income | | 37,962,753 |
| Accumulated undistributed net realized gain (loss) on investments and foreign currency transactions | | 25,310,053 |
| Net unrealized appreciation (depreciation) on investments and assets and liabilities in foreign currencies | | 454,556,864 |
| Net Assets | | $4,857,203,942 |
| Calculation of Maximum Offering Price | | |
| Class A: | | |
| Net Asset Value and redemption price per share ($548,648,862 ÷ 44,793,424 shares) | | $12.25 |
| Maximum offering price per share (100/96.00 of $12.25) | | $12.76 |
| Class T: | | |
| Net Asset Value and redemption price per share ($59,787,558 ÷ 4,878,394 shares) | | $12.26 |
| Maximum offering price per share (100/96.00 of $12.26) | | $12.77 |
| Class C: | | |
| Net Asset Value and offering price per share ($289,430,349 ÷ 23,850,410 shares)(a) | | $12.14 |
| Real Estate Income: | | |
| Net Asset Value, offering price and redemption price per share ($2,719,387,305 ÷ 220,913,639 shares) | | $12.31 |
| Class I: | | |
| Net Asset Value, offering price and redemption price per share ($1,239,949,868 ÷ 101,019,583 shares) | | $12.27 |
(a) Redemption price per share is equal to net asset value less any applicable contingent deferred sales charge.
See accompanying notes which are an integral part of the financial statements.
Statement of Operations
| | | Year ended July 31, 2016 |
| Investment Income | | |
| Dividends (including $7,056,258 earned from other affiliated issuers) | | $118,594,202 |
| Interest | | 108,853,784 |
| Income from Fidelity Central Funds | | 971,300 |
| Total income | | 228,419,286 |
| Expenses | | |
| Management fee | $23,555,488 | |
| Transfer agent fees | 8,899,268 | |
| Distribution and service plan fees | 4,148,288 | |
| Accounting and security lending fees | 1,338,246 | |
| Custodian fees and expenses | 44,656 | |
| Independent trustees' fees and expenses | 18,781 | |
| Registration fees | 185,537 | |
| Audit | 198,658 | |
| Legal | 11,016 | |
| Miscellaneous | 32,158 | |
| Total expenses before reductions | 38,432,096 | |
| Expense reductions | (95,724) | 38,336,372 |
| Net investment income (loss) | | 190,082,914 |
| Realized and Unrealized Gain (Loss) | | |
| Net realized gain (loss) on: | | |
| Investment securities: | | |
| Unaffiliated issuers | 44,680,443 | |
| Other affiliated issuers | 1,863,343 | |
| Foreign currency transactions | (105,863) | |
| Total net realized gain (loss) | | 46,437,923 |
Change in net unrealized appreciation (depreciation) on:
Investment securities | 237,758,482 | |
| Assets and liabilities in foreign currencies | 70,248 | |
| Total change in net unrealized appreciation (depreciation) | | 237,828,730 |
| Net gain (loss) | | 284,266,653 |
| Net increase (decrease) in net assets resulting from operations | | $474,349,567 |
See accompanying notes which are an integral part of the financial statements.
Statement of Changes in Net Assets
| | Year ended July 31, 2016 | Year ended July 31, 2015 |
| Increase (Decrease) in Net Assets | | |
| Operations | | |
| Net investment income (loss) | $190,082,914 | $200,528,467 |
| Net realized gain (loss) | 46,437,923 | 54,207,307 |
| Change in net unrealized appreciation (depreciation) | 237,828,730 | (52,184,229) |
| Net increase (decrease) in net assets resulting from operations | 474,349,567 | 202,551,545 |
| Distributions to shareholders from net investment income | (185,109,460) | (199,452,326) |
| Distributions to shareholders from net realized gain | (51,815,852) | (75,677,564) |
| Total distributions | (236,925,312) | (275,129,890) |
| Share transactions - net increase (decrease) | 302,433,412 | 215,193,161 |
| Redemption fees | 329,841 | 424,938 |
| Total increase (decrease) in net assets | 540,187,508 | 143,039,754 |
| Net Assets | | |
| Beginning of period | 4,317,016,434 | 4,173,976,680 |
| End of period | $4,857,203,942 | $4,317,016,434 |
| Other Information | | |
| Undistributed net investment income end of period | $37,962,753 | $34,176,266 |
See accompanying notes which are an integral part of the financial statements.
Financial Highlights — Fidelity Real Estate Income Fund Class A
| Years ended July 31, | 2016 | 2015 | 2014 | 2013 | 2012 |
| Selected Per–Share Data | | | | | |
| Net asset value, beginning of period | $11.66 | $11.86 | $11.67 | $11.26 | $10.73 |
| Income from Investment Operations | | | | | |
| Net investment income (loss)A | .49 | .52 | .49 | .54 | .52 |
| Net realized and unrealized gain (loss) | .73 | .02 | .44 | .60 | .61 |
| Total from investment operations | 1.22 | .54 | .93 | 1.14 | 1.13 |
| Distributions from net investment income | (.48) | (.52) | (.50) | (.53) | (.51) |
| Distributions from net realized gain | (.14) | (.21) | (.24) | (.20) | (.10) |
| Total distributions | (.63)B | (.74)C | (.74) | (.73) | (.60)D |
| Redemption fees added to paid in capitalA,E | – | – | – | – | – |
| Net asset value, end of period | $12.25 | $11.66 | $11.86 | $11.67 | $11.26 |
| Total ReturnF,G | 11.01% | 4.65% | 8.49% | 10.45% | 11.24% |
| Ratios to Average Net AssetsH,I | | | | | |
| Expenses before reductions | 1.03% | 1.04% | 1.06% | 1.08% | 1.12% |
| Expenses net of fee waivers, if any | 1.03% | 1.03% | 1.05% | 1.08% | 1.12% |
| Expenses net of all reductions | 1.03% | 1.03% | 1.05% | 1.07% | 1.11% |
| Net investment income (loss) | 4.29% | 4.40% | 4.28% | 4.62% | 4.89% |
| Supplemental Data | | | | | |
| Net assets, end of period (000 omitted) | $548,649 | $495,462 | $442,271 | $378,269 | $137,352 |
| Portfolio turnover rateJ | 26% | 19% | 29% | 26% | 27% |
A Calculated based on average shares outstanding during the period.
B Total distributions of $.63 per share is comprised of distributions from net investment income of $.483 and distributions from net realized gain of $.142 per share.
C Total distributions of $.74 per share is comprised of distributions from net investment income of $.523 and distributions from net realized gain of $.212 per share.
D Total distributions of $.60 per share is comprised of distributions from net investment income of $.505 and distributions from net realized gain of $.097 per share.
E Amount represents less than $.005 per share.
F Total returns would have been lower if certain expenses had not been reduced during the applicable periods shown.
G Total returns do not include the effect of the sales charges.
H Fees and expenses of any underlying Fidelity Central Funds are not included in the Fund's expense ratio. The Fund indirectly bears its proportionate share of the expenses of any underlying Fidelity Central Funds.
I Expense ratios reflect operating expenses of the class. Expenses before reductions do not reflect amounts reimbursed by the investment adviser or reductions from brokerage service arrangements or reductions from other expense offset arrangements and do not represent the amount paid by the class during periods when reimbursements or reductions occur. Expenses net of fee waivers reflect expenses after reimbursement by the investment adviser but prior to reductions from brokerage service arrangements or other expense offset arrangements. Expenses net of all reductions represent the net expenses paid by the class.
J Amount does not include the portfolio activity of any underlying Fidelity Central Funds.
See accompanying notes which are an integral part of the financial statements.
Financial Highlights — Fidelity Real Estate Income Fund Class T
| Years ended July 31, | 2016 | 2015 | 2014 | 2013 | 2012 |
| Selected Per–Share Data | | | | | |
| Net asset value, beginning of period | $11.66 | $11.86 | $11.67 | $11.26 | $10.72 |
| Income from Investment Operations | | | | | |
| Net investment income (loss)A | .49 | .51 | .49 | .54 | .52 |
| Net realized and unrealized gain (loss) | .73 | .02 | .43 | .60 | .62 |
| Total from investment operations | 1.22 | .53 | .92 | 1.14 | 1.14 |
| Distributions from net investment income | (.48) | (.52) | (.50) | (.53) | (.50) |
| Distributions from net realized gain | (.14) | (.21) | (.24) | (.20) | (.10) |
| Total distributions | (.62) | (.73) | (.73)B | (.73) | (.60) |
| Redemption fees added to paid in capitalA,C | – | – | – | – | – |
| Net asset value, end of period | $12.26 | $11.66 | $11.86 | $11.67 | $11.26 |
| Total ReturnD,E | 11.06% | 4.62% | 8.44% | 10.42% | 11.33% |
| Ratios to Average Net AssetsF,G | | | | | |
| Expenses before reductions | 1.07% | 1.06% | 1.08% | 1.08% | 1.11% |
| Expenses net of fee waivers, if any | 1.07% | 1.06% | 1.08% | 1.08% | 1.11% |
| Expenses net of all reductions | 1.06% | 1.06% | 1.07% | 1.08% | 1.11% |
| Net investment income (loss) | 4.26% | 4.37% | 4.26% | 4.61% | 4.90% |
| Supplemental Data | | | | | |
| Net assets, end of period (000 omitted) | $59,788 | $55,424 | $48,164 | $46,198 | $26,143 |
| Portfolio turnover rateH | 26% | 19% | 29% | 26% | 27% |
A Calculated based on average shares outstanding during the period.
B Total distributions of $.73 per share is comprised of distributions from net investment income of $.496 and distributions from net realized gain of $.236 per share.
C Amount represents less than $.005 per share.
D Total returns would have been lower if certain expenses had not been reduced during the applicable periods shown.
E Total returns do not include the effect of the sales charges.
F Fees and expenses of any underlying Fidelity Central Funds are not included in the Fund's expense ratio. The Fund indirectly bears its proportionate share of the expenses of any underlying Fidelity Central Funds.
G Expense ratios reflect operating expenses of the class. Expenses before reductions do not reflect amounts reimbursed by the investment adviser or reductions from brokerage service arrangements or reductions from other expense offset arrangements and do not represent the amount paid by the class during periods when reimbursements or reductions occur. Expenses net of fee waivers reflect expenses after reimbursement by the investment adviser but prior to reductions from brokerage service arrangements or other expense offset arrangements. Expenses net of all reductions represent the net expenses paid by the class.
H Amount does not include the portfolio activity of any underlying Fidelity Central Funds.
See accompanying notes which are an integral part of the financial statements.
Financial Highlights — Fidelity Real Estate Income Fund Class C
| Years ended July 31, | 2016 | 2015 | 2014 | 2013 | 2012 |
| Selected Per–Share Data | | | | | |
| Net asset value, beginning of period | $11.55 | $11.77 | $11.59 | $11.20 | $10.67 |
| Income from Investment Operations | | | | | |
| Net investment income (loss)A | .40 | .43 | .40 | .45 | .44 |
| Net realized and unrealized gain (loss) | .73 | .01 | .43 | .60 | .62 |
| Total from investment operations | 1.13 | .44 | .83 | 1.05 | 1.06 |
| Distributions from net investment income | (.40) | (.45) | (.42) | (.46) | (.43) |
| Distributions from net realized gain | (.14) | (.21) | (.24) | (.20) | (.10) |
| Total distributions | (.54) | (.66) | (.65)B | (.66) | (.53) |
| Redemption fees added to paid in capitalA,C | – | – | – | – | – |
| Net asset value, end of period | $12.14 | $11.55 | $11.77 | $11.59 | $11.20 |
| Total ReturnD,E | 10.29% | 3.82% | 7.66% | 9.66% | 10.49% |
| Ratios to Average Net AssetsF,G | | | | | |
| Expenses before reductions | 1.79% | 1.79% | 1.79% | 1.81% | 1.87% |
| Expenses net of fee waivers, if any | 1.78% | 1.78% | 1.79% | 1.81% | 1.87% |
| Expenses net of all reductions | 1.78% | 1.78% | 1.79% | 1.81% | 1.87% |
| Net investment income (loss) | 3.54% | 3.65% | 3.54% | 3.88% | 4.14% |
| Supplemental Data | | | | | |
| Net assets, end of period (000 omitted) | $289,430 | $291,387 | $246,306 | $204,012 | $52,780 |
| Portfolio turnover rateH | 26% | 19% | 29% | 26% | 27% |
A Calculated based on average shares outstanding during the period.
B Total distributions of $.65 per share is comprised of distributions from net investment income of $.417 and distributions from net realized gain of $.236 per share.
C Amount represents less than $.005 per share.
D Total returns would have been lower if certain expenses had not been reduced during the applicable periods shown.
E Total returns do not include the effect of the contingent deferred sales charge.
F Fees and expenses of any underlying Fidelity Central Funds are not included in the Fund's expense ratio. The Fund indirectly bears its proportionate share of the expenses of any underlying Fidelity Central Funds.
G Expense ratios reflect operating expenses of the class. Expenses before reductions do not reflect amounts reimbursed by the investment adviser or reductions from brokerage service arrangements or reductions from other expense offset arrangements and do not represent the amount paid by the class during periods when reimbursements or reductions occur. Expenses net of fee waivers reflect expenses after reimbursement by the investment adviser but prior to reductions from brokerage service arrangements or other expense offset arrangements. Expenses net of all reductions represent the net expenses paid by the class.
H Amount does not include the portfolio activity of any underlying Fidelity Central Funds.
See accompanying notes which are an integral part of the financial statements.
Financial Highlights — Fidelity Real Estate Income Fund
| Years ended July 31, | 2016 | 2015 | 2014 | 2013 | 2012 |
| Selected Per–Share Data | | | | | |
| Net asset value, beginning of period | $11.71 | $11.91 | $11.71 | $11.29 | $10.75 |
| Income from Investment Operations | | | | | |
| Net investment income (loss)A | .52 | .54 | .52 | .57 | .54 |
| Net realized and unrealized gain (loss) | .73 | .02 | .44 | .60 | .62 |
| Total from investment operations | 1.25 | .56 | .96 | 1.17 | 1.16 |
| Distributions from net investment income | (.51) | (.55) | (.53) | (.55) | (.52) |
| Distributions from net realized gain | (.14) | (.21) | (.24) | (.20) | (.10) |
| Total distributions | (.65) | (.76) | (.76)B | (.75) | (.62) |
| Redemption fees added to paid in capitalA,C | – | – | – | – | – |
| Net asset value, end of period | $12.31 | $11.71 | $11.91 | $11.71 | $11.29 |
| Total ReturnD | 11.29% | 4.84% | 8.78% | 10.71% | 11.50% |
| Ratios to Average Net AssetsE,F | | | | | |
| Expenses before reductions | .82% | .83% | .83% | .84% | .90% |
| Expenses net of fee waivers, if any | .81% | .82% | .83% | .84% | .89% |
| Expenses net of all reductions | .81% | .82% | .83% | .84% | .89% |
| Net investment income (loss) | 4.51% | 4.61% | 4.50% | 4.85% | 5.12% |
| Supplemental Data | | | | | |
| Net assets, end of period (000 omitted) | $2,719,387 | $2,561,268 | $2,627,382 | $2,884,545 | $2,252,149 |
| Portfolio turnover rateG | 26% | 19% | 29% | 26% | 27% |
A Calculated based on average shares outstanding during the period.
B Total distributions of $.76 per share is comprised of distributions from net investment income of $.525 and distributions from net realized gain of $.236 per share.
C Amount represents less than $.005 per share.
D Total returns would have been lower if certain expenses had not been reduced during the applicable periods shown.
E Fees and expenses of any underlying Fidelity Central Funds are not included in the Fund's expense ratio. The Fund indirectly bears its proportionate share of the expenses of any underlying Fidelity Central Funds.
F Expense ratios reflect operating expenses of the class. Expenses before reductions do not reflect amounts reimbursed by the investment adviser or reductions from brokerage service arrangements or reductions from other expense offset arrangements and do not represent the amount paid by the class during periods when reimbursements or reductions occur. Expenses net of fee waivers reflect expenses after reimbursement by the investment adviser but prior to reductions from brokerage service arrangements or other expense offset arrangements. Expenses net of all reductions represent the net expenses paid by the class.
G Amount does not include the portfolio activity of any underlying Fidelity Central Funds.
See accompanying notes which are an integral part of the financial statements.
Financial Highlights — Fidelity Real Estate Income Fund Class I
| Years ended July 31, | 2016 | 2015 | 2014 | 2013 | 2012 |
| Selected Per–Share Data | | | | | |
| Net asset value, beginning of period | $11.68 | $11.88 | $11.69 | $11.28 | $10.74 |
| Income from Investment Operations | | | | | |
| Net investment income (loss)A | .52 | .55 | .52 | .57 | .55 |
| Net realized and unrealized gain (loss) | .73 | .02 | .44 | .60 | .62 |
| Total from investment operations | 1.25 | .57 | .96 | 1.17 | 1.17 |
| Distributions from net investment income | (.52) | (.55) | (.53) | (.56) | (.53) |
| Distributions from net realized gain | (.14) | (.21) | (.24) | (.20) | (.10) |
| Total distributions | (.66) | (.77)B | (.77) | (.76) | (.63) |
| Redemption fees added to paid in capitalA,C | – | – | – | – | – |
| Net asset value, end of period | $12.27 | $11.68 | $11.88 | $11.69 | $11.28 |
| Total ReturnD | 11.30% | 4.92% | 8.76% | 10.72% | 11.62% |
| Ratios to Average Net AssetsE,F | | | | | |
| Expenses before reductions | .77% | .77% | .78% | .80% | .84% |
| Expenses net of fee waivers, if any | .77% | .77% | .78% | .80% | .84% |
| Expenses net of all reductions | .76% | .77% | .78% | .80% | .84% |
| Net investment income (loss) | 4.56% | 4.66% | 4.55% | 4.89% | 5.17% |
| Supplemental Data | | | | | |
| Net assets, end of period (000 omitted) | $1,239,950 | $913,475 | $809,854 | $610,045 | $217,435 |
| Portfolio turnover rateG | 26% | 19% | 29% | 26% | 27% |
A Calculated based on average shares outstanding during the period.
B Total distributions of $.77 per share is comprised of distributions from net investment income of $.554 and distributions from net realized gain of $.212 per share.
C Amount represents less than $.005 per share.
D Total returns would have been lower if certain expenses had not been reduced during the applicable periods shown.
E Fees and expenses of any underlying Fidelity Central Funds are not included in the Fund's expense ratio. The Fund indirectly bears its proportionate share of the expenses of any underlying Fidelity Central Funds.
F Expense ratios reflect operating expenses of the class. Expenses before reductions do not reflect amounts reimbursed by the investment adviser or reductions from brokerage service arrangements or reductions from other expense offset arrangements and do not represent the amount paid by the class during periods when reimbursements or reductions occur. Expenses net of fee waivers reflect expenses after reimbursement by the investment adviser but prior to reductions from brokerage service arrangements or other expense offset arrangements. Expenses net of all reductions represent the net expenses paid by the class.
G Amount does not include the portfolio activity of any underlying Fidelity Central Funds.
See accompanying notes which are an integral part of the financial statements.
Notes to Financial Statements
For the period ended July 31, 2016
1. Organization.
Fidelity Real Estate Income Fund (the Fund) is a fund of Fidelity Securities Fund (the Trust) and is authorized to issue an unlimited number of shares. The Trust is registered under the Investment Company Act of 1940, as amended (the 1940 Act), as an open-end management investment company organized as a Massachusetts business trust. The Fund offers Class A, Class T, Class C, Real Estate Income and Class I shares, each of which has equal rights as to assets and voting privileges. Each class has exclusive voting rights with respect to matters that affect that class.
2. Investments in Fidelity Central Funds.
The Fund invests in Fidelity Central Funds, which are open-end investment companies generally available only to other investment companies and accounts managed by the investment adviser and its affiliates. The Fund's Schedule of Investments lists each of the Fidelity Central Funds held as of period end, if any, as an investment of the Fund, but does not include the underlying holdings of each Fidelity Central Fund. As an Investing Fund, the Fund indirectly bears its proportionate share of the expenses of the underlying Fidelity Central Funds.
The Money Market Central Funds seek preservation of capital and current income and are managed by Fidelity Investments Money Management, Inc. (FIMM), an affiliate of the investment adviser. Annualized expenses of the Money Market Central Funds as of their most recent shareholder report date are less than .005%.
A complete unaudited list of holdings for each Fidelity Central Fund is available upon request or at the Securities and Exchange Commission (the SEC) website at www.sec.gov. In addition, the financial statements of the Fidelity Central Funds, which are not covered by the Fund's Report of Independent Registered Public Accounting Firm, are available on the SEC website or upon request.
3. Significant Accounting Policies.
The financial statements have been prepared in conformity with accounting principles generally accepted in the United States of America (GAAP), which require management to make certain estimates and assumptions at the date of the financial statements. Actual results could differ from those estimates. Subsequent events, if any, through the date that the financial statements were issued have been evaluated in the preparation of the financial statements. The following summarizes the significant accounting policies of the Fund:
Investment Valuation. Investments are valued as of 4:00 p.m. Eastern time on the last calendar day of the period. The Board of Trustees (the Board) has delegated the day to day responsibility for the valuation of the Fund's investments to the Fidelity Management & Research Company (FMR) Fair Value Committee (the Committee). In accordance with valuation policies and procedures approved by the Board, the Fund attempts to obtain prices from one or more third party pricing vendors or brokers to value its investments. When current market prices, quotations or currency exchange rates are not readily available or reliable, investments will be fair valued in good faith by the Committee, in accordance with procedures adopted by the Board. Factors used in determining fair value vary by investment type and may include market or investment specific events, changes in interest rates and credit quality. The frequency with which these procedures are used cannot be predicted and they may be utilized to a significant extent. The Committee oversees the Fund's valuation policies and procedures and reports to the Board on the Committee's activities and fair value determinations. The Board monitors the appropriateness of the procedures used in valuing the Fund's investments and ratifies the fair value determinations of the Committee.
The Fund categorizes the inputs to valuation techniques used to value its investments into a disclosure hierarchy consisting of three levels as shown below:
- Level 1 – quoted prices in active markets for identical investments
- Level 2 – other significant observable inputs (including quoted prices for similar investments, interest rates, prepayment speeds, etc.)
- Level 3 – unobservable inputs (including the Fund's own assumptions based on the best information available)
Valuation techniques used to value the Fund's investments by major category are as follows:
Equity securities, including restricted securities, for which market quotations are readily available, are valued at the last reported sale price or official closing price as reported by a third party pricing vendor on the primary market or exchange on which they are traded and are categorized as Level 1 in the hierarchy. In the event there were no sales during the day or closing prices are not available, securities are valued at the last quoted bid price or may be valued using the last available price and are generally categorized as Level 2 in the hierarchy. For foreign equity securities, when market or security specific events arise, comparisons to the valuation of American Depositary Receipts (ADRs), futures contracts, Exchange-Traded Funds (ETFs) and certain indexes as well as quoted prices for similar securities may be used and would be categorized as Level 2 in the hierarchy. Utilizing these techniques may result in transfers between Level 1 and Level 2. For equity securities, including restricted securities, where observable inputs are limited, assumptions about market activity and risk are used and these securities may be categorized as Level 3 in the hierarchy.
Debt securities, including restricted securities, are valued based on evaluated prices received from third party pricing vendors or from brokers who make markets in such securities. Corporate bonds, bank loan obligations and preferred securities are valued by pricing vendors who utilize matrix pricing which considers yield or price of bonds of comparable quality, coupon, maturity and type or by broker-supplied prices. Asset backed securities, collateralized mortgage obligations and commercial mortgage securities are valued by pricing vendors who utilize matrix pricing which considers prepayment speed assumptions, attributes of the collateral, yield or price of bonds of comparable quality, coupon, maturity and type or by broker-supplied prices. When independent prices are unavailable or unreliable, debt securities may be valued utilizing pricing methodologies which consider similar factors that would be used by third party pricing vendors. Debt securities are generally categorized as Level 2 in the hierarchy but may be Level 3 depending on the circumstances.
Investments in open-end mutual funds, including the Fidelity Central Funds, are valued at their closing net asset value (NAV) each business day and are categorized as Level 1 in the hierarchy.
Changes in valuation techniques may result in transfers in or out of an assigned level within the disclosure hierarchy. The aggregate value of investments by input level as of July 31, 2016, is included at the end of the Fund's Schedule of Investments.
Foreign Currency. The Fund may use foreign currency contracts to facilitate transactions in foreign-denominated securities. Gains and losses from these transactions may arise from changes in the value of the foreign currency or if the counterparties do not perform under the contracts' terms.
Foreign-denominated assets, including investment securities, and liabilities are translated into U.S. dollars at the exchange rates at period end. Purchases and sales of investment securities, income and dividends received and expenses denominated in foreign currencies are translated into U.S. dollars at the exchange rate in effect on the transaction date.
The effects of exchange rate fluctuations on investments are included with the net realized and unrealized gain (loss) on investment securities. Other foreign currency transactions resulting in realized and unrealized gain (loss) are disclosed separately.
Investment Transactions and Income. For financial reporting purposes, the Fund's investment holdings and NAV include trades executed through the end of the last business day of the period. The NAV per share for processing shareholder transactions is calculated as of the close of business of the New York Stock Exchange (NYSE), normally 4:00 p.m. Eastern time and includes trades executed through the end of the prior business day. Gains and losses on securities sold are determined on the basis of identified cost. Dividend income is recorded on the ex-dividend date, except for certain dividends from foreign securities where the ex-dividend date may have passed, which are recorded as soon as the Fund is informed of the ex-dividend date. Non-cash dividends included in dividend income, if any, are recorded at the fair market value of the securities received. Income and capital gain distributions from Fidelity Central Funds, if any, are recorded on the ex-dividend date. Distributions received on securities that represent a return of capital or capital gain are recorded as a reduction of cost of investments and/or as a realized gain. Subsequent to ex-dividend date the Fund determines the components of these distributions, based upon receipt of tax filings or other correspondence relating to the underlying investment. Interest income is accrued as earned and includes coupon interest and amortization of premium and accretion of discount on debt securities as applicable. For certain lower credit quality securitized assets that have contractual cash flows (for example, asset backed securities, collateralized mortgage obligations and commercial mortgage-backed securities), changes in estimated cash flows are periodically evaluated and the estimated yield is adjusted on a prospective basis, resulting in increases or decreases to Interest Income in the accompanying Statement of Operations. Investment income is recorded net of foreign taxes withheld where recovery of such taxes is uncertain. Debt obligations may be placed on non-accrual status and related interest income may be reduced by ceasing current accruals and writing off interest receivables when the collection of all or a portion of interest has become doubtful based on consistently applied procedures. A debt obligation is removed from non-accrual status when the issuer resumes interest payments or when collectability of interest is reasonably assured.
Class Allocations and Expenses. Investment income, realized and unrealized capital gains and losses, common expenses of the Fund, and certain fund-level expense reductions, if any, are allocated daily on a pro-rata basis to each class based on the relative net assets of each class to the total net assets of the Fund. Each class differs with respect to transfer agent and distribution and service plan fees incurred. Certain expense reductions may also differ by class. For the reporting period, the allocated portion of income and expenses to each class as a percent of its average net assets may vary due to the timing of recording these transactions in relation to fluctuating net assets of the classes. Expenses directly attributable to a fund are charged to that fund. Expenses attributable to more than one fund are allocated among the respective funds on the basis of relative net assets or other appropriate methods. Expense estimates are accrued in the period to which they relate and adjustments are made when actual amounts are known.
Income Tax Information and Distributions to Shareholders. Each year, the Fund intends to qualify as a regulated investment company under Subchapter M of the Internal Revenue Code, including distributing substantially all of its taxable income and realized gains. As a result, no provision for U.S. Federal income taxes is required. As of July 31, 2016, the Fund did not have any unrecognized tax benefits in the financial statements; nor is the Fund aware of any tax positions for which it is reasonably possible that the total amounts of unrecognized tax benefits will significantly change in the next twelve months. The Fund files a U.S. federal tax return, in addition to state and local tax returns as required. The Fund's federal income tax returns are subject to examination by the Internal Revenue Service (IRS) for a period of three fiscal years after they are filed. State and local tax returns may be subject to examination for an additional fiscal year depending on the jurisdiction. Foreign taxes are provided for based on the Fund's understanding of the tax rules and rates that exist in the foreign markets in which it invests.
Distributions are declared and recorded on the ex-dividend date. Income dividends and capital gain distributions are declared separately for each class. Income and capital gain distributions are determined in accordance with income tax regulations, which may differ from GAAP. In addition, the Fund claimed a portion of the payment made to redeeming shareholders as a distribution for income tax purposes.
Capital accounts within the financial statements are adjusted for permanent book-tax differences. These adjustments have no impact on net assets or the results of operations. Capital accounts are not adjusted for temporary book-tax differences which will reverse in a subsequent period.
Book-tax differences are primarily due to foreign currency transactions, passive foreign investment companies (PFIC), market discount, equity-debt classifications, certain conversion ratio adjustments, partnerships and losses deferred due to wash sales.
The federal tax cost of investment securities and unrealized appreciation (depreciation) as of period end were as follows:
| Gross unrealized appreciation | $585,886,559 |
| Gross unrealized depreciation | (135,755,064) |
| Net unrealized appreciation (depreciation) on securities | $450,131,495 |
| Tax Cost | $4,399,127,396 |
The tax-based components of distributable earnings as of period end were as follows:
| Undistributed ordinary income | $40,564,435 |
| Undistributed long-term capital gain | $27,579,151 |
| Net unrealized appreciation (depreciation) on securities and other investments | $450,131,763 |
The tax character of distributions paid was as follows:
| | July 31, 2016 | July 31, 2015 |
| Ordinary Income | $185,109,460 | $ 202,287,403 |
| Long-term Capital Gains | 51,815,852 | 72,842,487 |
| Total | $236,925,312 | $ 275,129,890 |
Short-Term Trading (Redemption) Fees. Shares held by investors in the Fund less than 90 days may have been subject to a redemption fee equal to .75% of the NAV of shares redeemed. All redemption fees, which reduce the proceeds of the shareholder redemption, are retained by the Fund and accounted for as an addition to paid in capital.
Restricted Securities. The Fund may invest in securities that are subject to legal or contractual restrictions on resale. These securities generally may be resold in transactions exempt from registration or to the public if the securities are registered. Disposal of these securities may involve time-consuming negotiations and expense, and prompt sale at an acceptable price may be difficult. Information regarding restricted securities is included at the end of the Fund's Schedule of Investments.
Loans and Other Direct Debt Instruments. The Fund invests in direct debt instruments which are interests in amounts owed to lenders by corporate or other borrowers. These instruments may be in the form of loans, trade claims or other receivables and may include standby financing commitments such as revolving credit facilities that obligate the Fund to supply additional cash to the borrower on demand. Loans may be acquired through assignment or participation. The Fund did not have any unfunded loan commitments, which are contractual obligations for future funding, at period end.
4. Purchases and Sales of Investments.
Purchases and sales of securities, other than short-term securities and U.S. government securities, aggregated $1,246,117,317 and $1,026,796,771, respectively.
5. Fees and Other Transactions with Affiliates.
Management Fee. Fidelity Management & Research Company (the investment adviser) and its affiliates provide the Fund with investment management related services for which the Fund pays a monthly management fee. The management fee is the sum of an individual fund fee rate that is based on an annual rate of .30% of the Fund's average net assets and an annualized group fee rate that averaged .25% during the period. The group fee rate is based upon the average net assets of all the mutual funds advised by the investment adviser, including any mutual funds previously advised by the investment adviser that are currently advised by Fidelity SelectCo, LLC, an affiliate of the investment adviser. The group fee rate decreases as assets under management increase and increases as assets under management decrease. For the reporting period, the total annual management fee rate was .55% of the Fund's average net assets.
Distribution and Service Plan Fees. In accordance with Rule 12b-1 of the 1940 Act, the Fund has adopted separate Distribution and Service Plans for each class of shares. Certain classes pay Fidelity Distributors Corporation (FDC), an affiliate of the investment adviser, separate Distribution and Service Fees, each of which is based on an annual percentage of each class' average net assets. In addition, FDC may pay financial intermediaries for selling shares of the Fund and providing shareholder support services. For the period, the Distribution and Service Fee rates, total fees and amounts retained by FDC were as follows:
| | Distribution
Fee | Service
Fee | Total Fees | Retained
by FDC |
| Class A | -% | .25% | $1,249,583 | $– |
| Class T | -% | .25% | 140,262 | – |
| Class C | .75% | .25% | 2,758,443 | 452,312 |
| | | | $4,148,288 | $452,312 |
Sales Load. FDC may receive a front-end sales charge of up to 4.00% for selling Class A shares and Class T shares, some of which is paid to financial intermediaries for selling shares of the Fund. Depending on the holding period, FDC may receive contingent deferred sales charges levied on Class A, Class T, and Class C redemptions. The deferred sales charges are 1.00% for Class C shares, 1.00% for certain purchases of Class A shares and .25% for certain purchases of Class T shares.
For the period, sales charge amounts retained by FDC were as follows:
| | Retained
by FDC |
| Class A | $77,989 |
| Class T | 9,945 |
| Class C(a) | 33,753 |
| | $121,687 |
(a) When Class C shares are initially sold, FDC pays commissions from its own resources to financial intermediaries through which the sales are made.
Transfer Agent Fees. Fidelity Investments Institutional Operations Company, Inc., (FIIOC), an affiliate of the investment adviser, is the transfer, dividend disbursing and shareholder servicing agent for each class of the Fund. FIIOC receives account fees and asset-based fees that vary according to the account size and type of account of the shareholders of the respective classes of the Fund. FIIOC pays for typesetting, printing and mailing of shareholder reports, except proxy statements.
For the period, transfer agent fees for each class were as follows:
| | Amount | % of
Class-Level Average
Net Assets |
| Class A | $952,659 | .19 |
| Class T | 125,890 | .22 |
| Class C | 534,908 | .19 |
| Real Estate Income | 5,677,459 | .22 |
| Class I | 1,608,352 | .17 |
| | $ 8,899,268 | |
Accounting and Security Lending Fees. Fidelity Service Company, Inc. (FSC), an affiliate of the investment adviser, maintains the Fund's accounting records. The accounting fee is based on the level of average net assets for each month. Under a separate contract, FSC administers the security lending program. The security lending fee is based on the number and duration of lending transactions.
Brokerage Commissions. The Fund placed a portion of its portfolio transactions with brokerage firms which are affiliates of the investment adviser. Brokerage commissions are included in net realized gain (loss) and change in net unrealized appreciation (depreciation) in the Statement of Operations. The commissions paid to these affiliated firms were $14,078 for the period.
Interfund Trades. The Fund may purchase from or sell securities to other Fidelity Funds under procedures adopted by the Board. The procedures have been designed to ensure these interfund trades are executed in accordance with Rule 17a-7 of the 1940 Act. Interfund trades are included within the respective purchases and sales amounts shown in the Purchases and Sales of Investments note.
6. Committed Line of Credit.
The Fund participates with other funds managed by the investment adviser or an affiliate in a $4.25 billion credit facility (the "line of credit") to be utilized for temporary or emergency purposes to fund shareholder redemptions or for other short-term liquidity purposes. The Fund has agreed to pay commitment fees on its pro-rata portion of the line of credit, which amounted to $8,876 and is reflected in Miscellaneous expenses on the Statement of Operations. During the period, the Fund did not borrow on this line of credit.
7. Security Lending.
The Fund lends portfolio securities through a lending agent from time to time in order to earn additional income. For equity securities, a lending agent is used and may loan securities to certain qualified borrowers, including Fidelity Capital Markets (FCM), a broker-dealer affiliated with the Fund. On the settlement date of the loan, the Fund receives collateral (in the form of U.S. Treasury obligations, letters of credit and/or cash) against the loaned securities and maintains collateral in an amount not less than 100% of the market value of the loaned securities during the period of the loan. The market value of the loaned securities is determined at the close of business of the Fund and any additional required collateral is delivered to the Fund on the next business day. The Fund or borrower may terminate the loan at any time, and if the borrower defaults on its obligation to return the securities loaned because of insolvency or other reasons, the Fund may apply collateral received from the borrower against the obligation. The Fund may experience delays and costs in recovering the securities loaned. Any cash collateral received is invested in the Fidelity Securities Lending Cash Central Fund. The value of loaned securities and cash collateral at period end are disclosed on the Fund's Statement of Assets and Liabilities. Security lending income represents the income earned on investing cash collateral, less rebates paid to borrowers and any lending agent fees associated with the loan, plus any premium payments received for lending certain types of securities. Security lending income is presented in the Statement of Operations as a component of income from Fidelity Central Funds. Total security lending income during the period amounted to $28,725. During the period, there were no securities loaned to FCM.
8. Expense Reductions.
Commissions paid to certain brokers with whom the investment adviser, or its affiliates, places trades on behalf of the Fund include an amount in addition to trade execution, which may be rebated back to the Fund to offset certain expenses. This amount totaled $60,649 for the period. In addition, through arrangements with the Fund's custodian and each class' transfer agent, credits realized as a result of certain uninvested cash balances were used to reduce the Fund's expenses. During the period, these credits reduced the Fund's custody expenses by $5,383.
In addition, during the period the investment adviser reimbursed and/or waived a portion of fund-level operating expenses in the amount of $29,692.
9. Distributions to Shareholders.
Distributions to shareholders of each class were as follows:
| | Year ended
July 31, 2016 | Year ended
July 31, 2015 |
| From net investment income | | |
| Class A | $20,776,428 | $21,010,715 |
| Class T | 2,323,930 | 2,305,119 |
| Class C | 9,744,417 | 10,465,476 |
| Real Estate Income | 111,450,147 | 122,206,251 |
| Class I | 40,814,538 | 43,464,765 |
| Total | $185,109,460 | $199,452,326 |
| From net realized gain | | |
| Class A | $6,008,082 | $7,958,848 |
| Class T | 680,042 | 875,220 |
| Class C | 3,527,228 | 4,645,932 |
| Real Estate Income | 30,805,486 | 46,720,433 |
| Class I | 10,795,014 | 15,477,131 |
| Total | $51,815,852 | $75,677,564 |
10. Share Transactions.
Share transactions for each class were as follows and may contain automatic conversions between classes or exchanges between affiliated funds:
| | Shares | Shares | Dollars | Dollars |
| | Year ended
July 31, 2016 | Year ended
July 31, 2015 | Year ended
July 31, 2016 | Year ended
July 31, 2015 |
| Class A | | | | |
| Shares sold | 15,526,418 | 17,614,783 | $176,978,857 | $207,492,435 |
| Reinvestment of distributions | 2,217,782 | 2,253,682 | 24,934,959 | 26,209,333 |
| Shares redeemed | (15,457,212) | (14,664,043) | (176,322,303) | (171,937,484) |
| Net increase (decrease) | 2,286,988 | 5,204,422 | $25,591,513 | $61,764,284 |
| Class T | | | | |
| Shares sold | 1,214,951 | 1,551,308 | $13,936,304 | $18,286,948 |
| Reinvestment of distributions | 246,897 | 251,652 | 2,775,517 | 2,927,374 |
| Shares redeemed | (1,335,803) | (1,110,729) | (15,332,670) | (13,074,996) |
| Net increase (decrease) | 126,045 | 692,231 | $1,379,151 | $8,139,326 |
| Class C | | | | |
| Shares sold | 4,854,016 | 7,875,459 | $55,310,329 | $92,082,413 |
| Reinvestment of distributions | 1,043,618 | 1,105,279 | 11,628,023 | 12,763,694 |
| Shares redeemed | (7,264,769) | (4,690,719) | (81,984,542) | (54,577,835) |
| Net increase (decrease) | (1,367,135) | 4,290,019 | $(15,046,190) | $50,268,272 |
| Real Estate Income | | | | |
| Shares sold | 54,340,979 | 51,184,144 | $625,193,342 | $605,520,317 |
| Reinvestment of distributions | 11,080,986 | 12,742,585 | 125,130,837 | 148,826,128 |
| Shares redeemed | (63,200,104) | (65,882,524) | (728,426,852) | (777,479,294) |
| Net increase (decrease) | 2,221,861 | (1,955,795) | $21,897,327 | $(23,132,849) |
| Class I | | | | |
| Shares sold | 51,672,151 | 38,671,974 | $597,272,677 | $455,469,590 |
| Reinvestment of distributions | 3,437,483 | 3,704,065 | 38,745,091 | 43,129,998 |
| Shares redeemed | (32,289,301) | (32,342,580) | (367,406,157) | (380,445,460) |
| Net increase (decrease) | 22,820,333 | 10,033,459 | $268,611,611 | $118,154,128 |
11. Other.
The Fund's organizational documents provide former and current trustees and officers with a limited indemnification against liabilities arising in connection with the performance of their duties to the Fund. In the normal course of business, the Fund may also enter into contracts that provide general indemnifications. The Fund's maximum exposure under these arrangements is unknown as this would be dependent on future claims that may be made against the Fund. The risk of material loss from such claims is considered remote.
Report of Independent Registered Public Accounting Firm
To the Trustees of Fidelity Securities Fund and Shareholders of Fidelity Real Estate Income Fund:
We have audited the accompanying statement of assets and liabilities of Fidelity Real Estate Income Fund (the Fund), a fund of Fidelity Securities Fund, including the schedule of investments, as of July 31, 2016, and the related statement of operations for the year then ended, the statement of changes in net assets for each of the two years in the period then ended, and the financial highlights for each of the five years in the period then ended. These financial statements and financial highlights are the responsibility of the Fund's management. Our responsibility is to express an opinion on these financial statements and financial highlights based on our audits.
We conducted our audits in accordance with the standards of the Public Company Accounting Oversight Board (United States). Those standards require that we plan and perform the audit to obtain reasonable assurance about whether the financial statements and financial highlights are free of material misstatement. The Fund is not required to have, nor were we engaged to perform, an audit of its internal control over financial reporting. Our audits included consideration of internal control over financial reporting as a basis for designing audit procedures that are appropriate in the circumstances, but not for the purpose of expressing an opinion on the effectiveness of the Fund's internal control over financial reporting. Accordingly, we express no such opinion. An audit also includes examining, on a test basis, evidence supporting the amounts and disclosures in the financial statements, assessing the accounting principles used and significant estimates made by management, as well as evaluating the overall financial statement presentation. Our procedures included confirmation of securities owned as of July 31, 2016, by correspondence with the custodians and brokers; when replies were not received from brokers, we performed other auditing procedures. We believe that our audits provide a reasonable basis for our opinion.
In our opinion, such financial statements and financial highlights referred to above present fairly, in all material respects, the financial position of Fidelity Real Estate Income Fund as of July 31, 2016, the results of its operations for the year then ended, the changes in its net assets for each of the two years in the period then ended, and the financial highlights for each of the five years in the period then ended, in conformity with accounting principles generally accepted in the United States of America.
DELOITTE & TOUCHE LLP
Boston, Massachusetts
September 19, 2016
Trustees and Officers
The Trustees, Members of the Advisory Board (if any), and officers of the trust and fund, as applicable, are listed below. The Board of Trustees governs the fund and is responsible for protecting the interests of shareholders. The Trustees are experienced executives who meet periodically throughout the year to oversee the fund's activities, review contractual arrangements with companies that provide services to the fund, oversee management of the risks associated with such activities and contractual arrangements, and review the fund's performance. Each of the Trustees oversees 170 funds.
The Trustees hold office without limit in time except that (a) any Trustee may resign; (b) any Trustee may be removed by written instrument, signed by at least two-thirds of the number of Trustees prior to such removal; (c) any Trustee who requests to be retired or who has become incapacitated by illness or injury may be retired by written instrument signed by a majority of the other Trustees; and (d) any Trustee may be removed at any special meeting of shareholders by a two-thirds vote of the outstanding voting securities of the trust. Each Trustee who is not an interested person (as defined in the 1940 Act) of the trust and the fund is referred to herein as an Independent Trustee. Each Independent Trustee shall retire not later than the last day of the calendar year in which his or her 75th birthday occurs. The Independent Trustees may waive this mandatory retirement age policy with respect to individual Trustees. Officers and Advisory Board Members hold office without limit in time, except that any officer or Advisory Board Member may resign or may be removed by a vote of a majority of the Trustees at any regular meeting or any special meeting of the Trustees. Except as indicated, each individual has held the office shown or other offices in the same company for the past five years.
The fund’s Statement of Additional Information (SAI) includes more information about the Trustees. To request a free copy, call Fidelity at 1-800-544-8544.
Experience, Skills, Attributes, and Qualifications of the Trustees. The Governance and Nominating Committee has adopted a statement of policy that describes the experience, qualifications, attributes, and skills that are necessary and desirable for potential Independent Trustee candidates (Statement of Policy). The Board believes that each Trustee satisfied at the time he or she was initially elected or appointed a Trustee, and continues to satisfy, the standards contemplated by the Statement of Policy. The Governance and Nominating Committee also engages professional search firms to help identify potential Independent Trustee candidates who have the experience, qualifications, attributes, and skills consistent with the Statement of Policy. From time to time, additional criteria based on the composition and skills of the current Independent Trustees, as well as experience or skills that may be appropriate in light of future changes to board composition, business conditions, and regulatory or other developments, have also been considered by the professional search firms and the Governance and Nominating Committee. In addition, the Board takes into account the Trustees' commitment and participation in Board and committee meetings, as well as their leadership of standing and ad hoc committees throughout their tenure.
In determining that a particular Trustee was and continues to be qualified to serve as a Trustee, the Board has considered a variety of criteria, none of which, in isolation, was controlling. The Board believes that, collectively, the Trustees have balanced and diverse experience, qualifications, attributes, and skills, which allow the Board to operate effectively in governing the fund and protecting the interests of shareholders. Information about the specific experience, skills, attributes, and qualifications of each Trustee, which in each case led to the Board's conclusion that the Trustee should serve (or continue to serve) as a trustee of the fund, is provided below.
Board Structure and Oversight Function. James C. Curvey is an interested person and currently serves as Chairman. The Trustees have determined that an interested Chairman is appropriate and benefits shareholders because an interested Chairman has a personal and professional stake in the quality and continuity of services provided to the fund. Independent Trustees exercise their informed business judgment to appoint an individual of their choosing to serve as Chairman, regardless of whether the Trustee happens to be independent or a member of management. The Independent Trustees have determined that they can act independently and effectively without having an Independent Trustee serve as Chairman and that a key structural component for assuring that they are in a position to do so is for the Independent Trustees to constitute a substantial majority for the Board. The Independent Trustees also regularly meet in executive session. Ned C. Lautenbach serves as Chairman of the Independent Trustees and as such (i) acts as a liaison between the Independent Trustees and management with respect to matters important to the Independent Trustees and (ii) with management prepares agendas for Board meetings.
Fidelity® funds are overseen by different Boards of Trustees. The fund's Board oversees Fidelity's high income and certain equity funds, and other Boards oversee Fidelity's investment-grade bond, money market, asset allocation, and sector funds. The asset allocation funds may invest in Fidelity® funds overseen by the fund's Board. The use of separate Boards, each with its own committee structure, allows the Trustees of each group of Fidelity® funds to focus on the unique issues of the funds they oversee, including common research, investment, and operational issues. On occasion, the separate Boards establish joint committees to address issues of overlapping consequences for the Fidelity® funds overseen by each Board.
The Trustees operate using a system of committees to facilitate the timely and efficient consideration of all matters of importance to the Trustees, the fund, and fund shareholders and to facilitate compliance with legal and regulatory requirements and oversight of the fund's activities and associated risks. The Board, acting through its committees, has charged FMR and its affiliates with (i) identifying events or circumstances the occurrence of which could have demonstrably adverse effects on the fund's business and/or reputation; (ii) implementing processes and controls to lessen the possibility that such events or circumstances occur or to mitigate the effects of such events or circumstances if they do occur; and (iii) creating and maintaining a system designed to evaluate continuously business and market conditions in order to facilitate the identification and implementation processes described in (i) and (ii) above. Because the day-to-day operations and activities of the fund are carried out by or through FMR, its affiliates, and other service providers, the fund's exposure to risks is mitigated but not eliminated by the processes overseen by the Trustees. While each of the Board's committees has responsibility for overseeing different aspects of the fund's activities, oversight is exercised primarily through the Operations, Audit, and Compliance Committees. In addition, the Independent Trustees have worked with FMR to enhance the Board's oversight of investment and financial risks, legal and regulatory risks, technology risks, and operational risks, including the development of additional risk reporting to the Board. For example, a working group comprised of Independent Trustees and FMR has worked and continues to work to review the Fidelity® funds' valuation-related activities, reporting and risk management. Appropriate personnel, including but not limited to the fund's Chief Compliance Officer (CCO), FMR's internal auditor, the independent accountants, the fund's Treasurer and portfolio management personnel, make periodic reports to the Board's committees, as appropriate, including an annual review of Fidelity's risk management program for the Fidelity® funds. The responsibilities of each standing committee, including their oversight responsibilities, are described further under "Standing Committees of the Trustees."
Interested Trustees*:
Correspondence intended for a Trustee who is an interested person may be sent to Fidelity Investments, 245 Summer Street, Boston, Massachusetts 02210.
Name, Year of Birth; Principal Occupations and Other Relevant Experience+
James C. Curvey (1935)
Year of Election or Appointment: 2007
Trustee
Chairman of the Board of Trustees
Mr. Curvey also serves as Trustee of other Fidelity® funds. Mr. Curvey is a Director of Fidelity Research & Analysis Co. (investment adviser firm, 2009-present), and Vice Chairman (2007-present) and Director of FMR LLC (diversified financial services company). In addition, Mr. Curvey serves as an Overseer for the Boston Symphony Orchestra and a member of the board of Artis-Naples, Naples, Florida, and as a Trustee for Brewster Academy, Wolfeboro, New Hampshire. Previously, Mr. Curvey served as a Director of Fidelity Investments Money Management, Inc. (investment adviser firm, 2009-2014) and a Director of FMR and FMR Co., Inc. (investment adviser firms, 2007-2014).
Charles S. Morrison (1960)
Year of Election or Appointment: 2014
Trustee
Mr. Morrison also serves as Trustee of other funds. He serves as a Director of Fidelity Investments Money Management, Inc. (FIMM) (investment adviser firm, 2014-present), Director of Fidelity SelectCo, LLC (investment adviser firm, 2014-present), President, Asset Management (2014-present), and is an employee of Fidelity Investments. Previously, Mr. Morrison served as Vice President of Fidelity's Fixed Income and Asset Allocation Funds (2012-2014), President, Fixed Income (2011-2014), Vice President of Fidelity's Money Market Funds (2005-2009), President, Money Market Group Leader of FMR (investment adviser firm, 2009), and Senior Vice President, Money Market Group of FMR (2004-2009). Mr. Morrison also served as Vice President of Fidelity's Bond Funds (2002-2005), certain Balanced Funds (2002-2005), and certain Asset Allocation Funds (2002-2007), and as Senior Vice President (2002-2005) of Fidelity's Bond Division.
* Determined to be an “Interested Trustee” by virtue of, among other things, his or her affiliation with the trust or various entities under common control with FMR.
+ The information includes the Trustee's principal occupation during the last five years and other information relating to the experience, attributes, and skills relevant to the Trustee's qualifications to serve as a Trustee, which led to the conclusion that the Trustee should serve as a Trustee for the fund.
Independent Trustees:
Correspondence intended for an Independent Trustee may be sent to Fidelity Investments, P.O. Box 55235, Boston, Massachusetts 02205-5235.
Name, Year of Birth; Principal Occupations and Other Relevant Experience+
Dennis J. Dirks (1948)
Year of Election or Appointment: 2005
Trustee
Mr. Dirks also serves as Trustee of other Fidelity® funds. Prior to his retirement in May 2003, Mr. Dirks was Chief Operating Officer and a member of the Board of The Depository Trust & Clearing Corporation (DTCC). He also served as President, Chief Operating Officer, and Board member of The Depository Trust Company (DTC) and President and Board member of the National Securities Clearing Corporation (NSCC). In addition, Mr. Dirks served as Chief Executive Officer and Board member of the Government Securities Clearing Corporation, Chief Executive Officer and Board member of the Mortgage-Backed Securities Clearing Corporation, as a Trustee and a member of the Finance Committee of Manhattan College (2005-2008), as a Trustee and a member of the Finance Committee of AHRC of Nassau County (2006-2008), and as a member of the Independent Directors Council (IDC) Governing Council (2010-2015). Mr. Dirks is a member of the Board of Directors for The Brookville Center for Children's Services, Inc. (2009-present).
Alan J. Lacy (1953)
Year of Election or Appointment: 2008
Trustee
Mr. Lacy also serves as Trustee of other Fidelity® funds. Mr. Lacy serves as Chairman (2014-present) and a member (2010-present) of the Board of Directors of Dave & Buster's Entertainment, Inc. (restaurant and entertainment complexes) and a Director of Bristol-Myers Squibb Company (global pharmaceuticals, 2008-present). He is a Trustee of the California Chapter of The Nature Conservancy (2015-present) and a Director of the Center for Advanced Study in the Behavioral Sciences at Stanford University (2015-present). In addition, Mr. Lacy served as Senior Adviser (2007-2014) of Oak Hill Capital Partners, L.P. (private equity) and also served as Chief Executive Officer (2005) and Vice Chairman (2005-2006) of Sears Holdings Corporation (retail) and Chief Executive Officer and Chairman of the Board of Sears, Roebuck and Co. (retail, 2000-2005). Previously, Mr. Lacy served as Chairman (2008-2011) and a member (2006-2015) of the Board of Trustees of the National Parks Conservation Association and as a member of the Board of Directors for The Western Union Company (global money transfer, 2006-2011), The Hillman Companies, Inc. (hardware wholesalers, 2010-2014), and Earth Fare, Inc. (retail grocery, 2010-2014).
Ned C. Lautenbach (1944)
Year of Election or Appointment: 2000
Trustee
Chairman of the Independent Trustees
Mr. Lautenbach also serves as Trustee of other Fidelity® funds. Mr. Lautenbach currently serves as the Lead Director of the Eaton Corporation Board of Directors (diversified industrial, 1997-present). Mr. Lautenbach is Chairman of the Board of Directors of Artis-Naples in Naples, Florida (2012-present), a member of the Council on Foreign Relations (1994-present), and a member of the Board of Governors, State University System of Florida (2013-present). Previously, Mr. Lautenbach was a Partner/Advisory Partner at Clayton, Dubilier & Rice, LLC (private equity investment, 1998-2010), as well as a Director of Sony Corporation (2006-2007).
Joseph Mauriello (1944)
Year of Election or Appointment: 2008
Trustee
Mr. Mauriello also serves as Trustee of other Fidelity® funds. Prior to his retirement in January 2006, Mr. Mauriello served in numerous senior management positions including Deputy Chairman and Chief Operating Officer (2004-2005), and Vice Chairman of Financial Services (2002-2004) of KPMG LLP US (professional services, 1965-2005). Mr. Mauriello currently serves as a member of the Board of Directors of XL Group plc. (global insurance and re-insurance, 2006-present) and the Independent Directors Council (IDC) Governing Council (2015-present). Previously, Mr. Mauriello served as a Director of the Hamilton Funds of the Bank of New York (2006-2007) and of Arcadia Resources Inc. (health care services and products, 2007-2012).
Robert W. Selander (1950)
Year of Election or Appointment: 2011
Trustee
Mr. Selander also serves as Trustee of other Fidelity® funds. Mr. Selander serves as a Director of The Western Union Company (global money transfer, 2014-present) and a non-executive Chairman of Health Equity, Inc. (health savings custodian, 2015-present). Previously, Mr. Selander served as a Member of the Advisory Board of certain Fidelity® funds (2011), and Executive Vice Chairman (2010), Chief Executive Officer (2009-2010), and President and Chief Executive Officer (1997-2009) of Mastercard, Inc.
Cornelia M. Small (1944)
Year of Election or Appointment: 2005
Trustee
Ms. Small also serves as Trustee of other Fidelity® funds. Ms. Small is a member of the Board of Directors (2009-present) and Chair of the Investment Committee (2010-present) of the Teagle Foundation. Ms. Small also serves on the Investment Committee of the Berkshire Taconic Community Foundation (2008-present). Previously, Ms. Small served as Chairperson (2002-2008) and a member of the Investment Committee and Chairperson (2008-2012) and a member of the Board of Trustees of Smith College. In addition, Ms. Small served as Chief Investment Officer, Director of Global Equity Investments, and a member of the Board of Directors of Scudder, Stevens & Clark and Scudder Kemper Investments.
William S. Stavropoulos (1939)
Year of Election or Appointment: 2002
Trustee
Vice Chairman of the Independent Trustees
Mr. Stavropoulos also serves as Trustee of other Fidelity® funds. Mr. Stavropoulos serves as President and Founder of the Michigan Baseball Foundation, the Great Lakes Loons (2007-present). Mr. Stavropoulos is Chairman Emeritus of the Board of Directors of The Dow Chemical Company, where he previously served in numerous senior management positions, including President, CEO (1995-2000; 2002-2004), Chairman of the Executive Committee (2000-2006), and as a member of the Board of Directors (1990-2006). Currently, Mr. Stavropoulos is Chairman of the Board of Directors of Univar Inc. (global distributor of commodity and specialty chemicals), a Director of Teradata Corporation (data warehousing and technology solutions), and Maersk Inc. (industrial conglomerate), and a member of the Advisory Board for Metalmark Capital LLC (private equity investment, 2005-present). Mr. Stavropoulos is an operating advisor to Clayton, Dubilier & Rice, LLC (private equity investment). In addition, Mr. Stavropoulos is a member of the University of Notre Dame Advisory Council for the College of Science, a Trustee of the Rollin L. Gerstacker Foundation, and a Director of the Naples Philharmonic Center for the Arts. Previously, Mr. Stavropoulos served as a Director of Chemical Financial Corporation (bank holding company, 1993-2012) and Tyco International, Ltd. (multinational manufacturing and services, 2007-2012).
David M. Thomas (1949)
Year of Election or Appointment: 2008
Trustee
Mr. Thomas also serves as Trustee of other Fidelity® funds. Mr. Thomas serves as Non-Executive Chairman of the Board of Directors of Fortune Brands Home and Security (home and security products, 2011-present), as a member of the Board of Directors (2004-present) and Presiding Director (2013-present) of Interpublic Group of Companies, Inc. (marketing communication), and as a member of the Board of Trustees of the University of Florida (2013-present). Previously, Mr. Thomas served as Executive Chairman (2005-2006) and Chairman and Chief Executive Officer (2000-2005) of IMS Health, Inc. (pharmaceutical and healthcare information solutions), and a Director of Fortune Brands, Inc. (consumer products, 2000-2011).
+ The information includes the Trustee's principal occupation during the last five years and other information relating to the experience, attributes, and skills relevant to the Trustee's qualifications to serve as a Trustee, which led to the conclusion that the Trustee should serve as a Trustee for the fund.
Advisory Board Members and Officers:
Correspondence intended for an officer or Peter S. Lynch may be sent to Fidelity Investments, 245 Summer Street, Boston, Massachusetts 02210. Officers appear below in alphabetical order.
Name, Year of Birth; Principal Occupation
Peter S. Lynch (1944)
Year of Election or Appointment: 2003
Member of the Advisory Board
Mr. Lynch also serves as Member of the Advisory Board of other Fidelity® funds. Mr. Lynch is Vice Chairman and a Director of FMR (investment adviser firm) and FMR Co., Inc. (investment adviser firm). In addition, Mr. Lynch serves as a Trustee of Boston College and as the Chairman of the Inner-City Scholarship Fund. Previously, Mr. Lynch served on the Special Olympics International Board of Directors (1997-2006).
Marc R. Bryant (1966)
Year of Election or Appointment: 2015
Secretary and Chief Legal Officer (CLO)
Mr. Bryant also serves as Secretary and CLO of other funds. Mr. Bryant serves as CLO, Secretary, and Senior Vice President of Fidelity Management & Research Company (investment adviser firm, 2015-present) and FMR Co., Inc. (investment adviser firm, 2015-present); Secretary of Fidelity SelectCo, LLC (investment adviser firm, 2015-present) and Fidelity Investments Money Management, Inc. (investment adviser firm, 2015-present); and CLO of Fidelity Management & Research (Hong Kong) Limited and FMR Investment Management (U.K.) Limited (investment adviser firms, 2015-present) and Fidelity Management & Research (Japan) Limited (investment adviser firm, 2016-present). He is Senior Vice President and Deputy General Counsel of FMR LLC (diversified financial services company). Previously, Mr. Bryant served as Secretary and CLO of Fidelity Rutland Square Trust II (2010-2014) and Assistant Secretary of Fidelity's Fixed Income and Asset Allocation Funds (2013-2015). Prior to joining Fidelity Investments, Mr. Bryant served as a Senior Vice President and the Head of Global Retail Legal for AllianceBernstein L.P. (2006-2010), and as the General Counsel for ProFund Advisors LLC (2001-2006).
Jeffrey S. Christian (1961)
Year of Election or Appointment: 2016
Assistant Treasurer
Mr. Christian also serves as Assistant Treasurer of other funds. Mr. Christian is an employee of Fidelity Investments (2003-present).
William C. Coffey (1969)
Year of Election or Appointment: 2009
Assistant Secretary
Mr. Coffey also serves as Assistant Secretary of other funds. He is Senior Vice President and Deputy General Counsel of FMR LLC (diversified financial services company, 2010-present), and is an employee of Fidelity Investments. Previously, Mr. Coffey served as Vice President and Associate General Counsel of FMR LLC (2005-2009).
Jonathan Davis (1968)
Year of Election or Appointment: 2010
Assistant Treasurer
Mr. Davis also serves as Assistant Treasurer of other funds, and is an employee of Fidelity Investments. Previously, Mr. Davis served as Vice President and Associate General Counsel of FMR LLC (diversified financial services company, 2003-2010).
Adrien E. Deberghes (1967)
Year of Election or Appointment: 2016
Assistant Treasurer
Mr. Deberghes also serves as an officer of other funds. He serves as Executive Vice President of Fidelity Investments Money Management, Inc. (FIMM) (investment adviser firm, 2016-present) and is an employee of Fidelity Investments (2008-present). Prior to joining Fidelity Investments, Mr. Deberghes was Senior Vice President of Mutual Fund Administration at State Street Corporation (2007-2008), Senior Director of Mutual Fund Administration at Investors Bank & Trust (2005-2007), and Director of Finance for Dunkin' Brands (2000-2005). Previously, Mr. Deberghes served in other fund officer roles.
Stephanie J. Dorsey (1969)
Year of Election or Appointment: 2010
Assistant Treasurer
Ms. Dorsey also serves as an officer of other funds. She is an employee of Fidelity Investments (2008-present) and has served in other fund officer roles. Prior to joining Fidelity Investments, Ms. Dorsey served as Treasurer (2004-2008) of the JPMorgan Mutual Funds and Vice President (2004-2008) of JPMorgan Chase Bank.
Howard J. Galligan III (1966)
Year of Election or Appointment: 2014
Chief Financial Officer
Mr. Galligan also serves as Chief Financial Officer of other funds. Mr. Galligan serves as President of Fidelity Pricing and Cash Management Services (FPCMS) (2014-present) and as a Director of Strategic Advisers, Inc. (investment adviser firm, 2008-present). Previously, Mr. Galligan served as Chief Administrative Officer of Asset Management (2011-2014) and Chief Operating Officer and Senior Vice President of Investment Support for Strategic Advisers, Inc. (2003-2011).
Scott C. Goebel (1968)
Year of Election or Appointment: 2015
Vice President
Mr. Goebel serves as Vice President of other funds and is an employee of Fidelity Investments (2001-present). Mr. Goebel serves as Senior Vice President of Fidelity Management & Research Company (FMR) (investment adviser firm, 2016-present). Previously, Mr. Goebel served as Secretary of Fidelity SelectCo, LLC (investment adviser firm, 2013-2015), Fidelity Investments Money Management, Inc. (FIMM) (investment adviser firm, 2010-2015), and Fidelity Research and Analysis Company (FRAC) (investment adviser firm, 2010-2015); General Counsel, Secretary, and Senior Vice President of FMR (investment adviser firm, 2008-2015) and FMR Co., Inc. (investment adviser firm, 2008-2015); Assistant Secretary of Fidelity Management & Research (Japan) Limited (investment adviser firm, 2008-2015) and Fidelity Management & Research (U.K.) Inc. (investment adviser firm, 2008-2015); Chief Legal Officer (CLO) of Fidelity Management & Research (Hong Kong) Limited (investment adviser firm, 2008-2015); Secretary and CLO of certain Fidelity® funds (2008-2015); Assistant Secretary of FIMM (2008-2010), FRAC (2008-2010), and certain funds (2007-2008); and as Vice President and Secretary of Fidelity Distributors Corporation (FDC) (2005-2007).
Thomas C. Hense (1964)
Year of Election or Appointment: 2008, 2010, or 2015
Vice President
Mr. Hense serves as Vice President of Fidelity Advisor® Multi-Asset Income Fund (2015) and other funds (High Income (2008), Small Cap (2008), and Value (2010) funds), and is an employee of Fidelity Investments (1993-present). Previously, Mr. Hense served as a portfolio manager for Fidelity's Institutional Money Management Group (Pyramis) (2003-2008).
Brian B. Hogan (1964)
Year of Election or Appointment: 2009
Vice President
Mr. Hogan also serves as Trustee or Vice President of other funds. Mr. Hogan serves as a Director of FMR Investment Management (U.K.) Limited (investment adviser firm, 2015-present) and Fidelity SelectCo, LLC (investment adviser firm, 2014-present) and President of the Equity Division of FMR (investment adviser firm, 2009-present). Previously, Mr. Hogan served as Senior Vice President, Equity Research of FMR (2006-2009) and as a portfolio manager. Mr. Brian B. Hogan is not related to Mr. Colm A. Hogan.
Colm A. Hogan (1973)
Year of Election or Appointment: 2016
Deputy Treasurer
Mr. Hogan also serves as an officer of other funds. Mr. Hogan is an employee of Fidelity Investments (2005-present). Mr. Colm A. Hogan is not related to Mr. Brian B. Hogan.
Chris Maher (1972)
Year of Election or Appointment: 2013
Assistant Treasurer
Mr. Maher serves as Assistant Treasurer of other funds. Mr. Maher is Vice President of Valuation Oversight and is an employee of Fidelity Investments. Previously, Mr. Maher served as Vice President of Asset Management Compliance (2013), Vice President of the Program Management Group of FMR (investment adviser firm, 2010-2013), and Vice President of Valuation Oversight (2008-2010).
John F. Papandrea (1972)
Year of Election or Appointment: 2016
Anti-Money Laundering (AML) Officer
Mr. Papandrea also serves as AML Officer of other funds. Mr. Papandrea is Vice President of FMR LLC (diversified financial services company, 2008-present) and is an employee of Fidelity Investments (2005-present).
Kenneth B. Robins (1969)
Year of Election or Appointment: 2016
Chief Compliance Officer
Mr. Robins also serves as an officer of other funds. Mr. Robins serves as Compliance Officer of Fidelity Management & Research Company and FMR Co., Inc. (investment adviser firms, 2016-present) and is an employee of Fidelity Investments (2004-present). Previously, Mr. Robins served as Executive Vice President of Fidelity Investments Money Management, Inc. (investment adviser firm, 2013-2016) and served in other fund officer roles.
Stacie M. Smith (1974)
Year of Election or Appointment: 2016
President and Treasurer
Ms. Smith also serves as an officer of other funds. She is an employee of Fidelity Investments (2009-present) and has served in other fund officer roles. Prior to joining Fidelity Investments, Ms. Smith served as Senior Audit Manager of Ernst & Young LLP (1996-2009). Previously, Ms. Smith served as Deputy Treasurer of certain Fidelity® funds (2013-2016).
Renee Stagnone (1975)
Year of Election or Appointment: 2016
Assistant Treasurer
Ms. Stagnone also serves as an officer of other funds. Ms. Stagnone is an employee of Fidelity Investments (1997-present). Previously, Ms. Stagnone served as Deputy Treasurer of certain Fidelity® funds (2013-2016).
Shareholder Expense Example
As a shareholder of the Fund, you incur two types of costs: (1) transaction costs, including sales charges (loads) on purchase payments or redemption proceeds, redemption fees and (2) ongoing costs, including management fees, distribution and/or service (12b-1) fees and other Fund expenses. This Example is intended to help you understand your ongoing costs (in dollars) of investing in the Fund and to compare these costs with the ongoing costs of investing in other mutual funds.
The Example is based on an investment of $1,000 invested at the beginning of the period and held for the entire period (February 1, 2016 to July 31, 2016).
Actual Expenses
The first line of the accompanying table for each class of the Fund provides information about actual account values and actual expenses. You may use the information in this line, together with the amount you invested, to estimate the expenses that you paid over the period. Simply divide your account value by $1,000.00 (for example, an $8,600 account value divided by $1,000.00 = 8.6), then multiply the result by the number in the first line for a class of the Fund under the heading entitled "Expenses Paid During Period" to estimate the expenses you paid on your account during this period. A small balance maintenance fee of $12.00 that is charged once a year may apply for certain accounts with a value of less than $2,000. This fee is not included in the table below. If it was, the estimate of expenses you paid during the period would be higher, and your ending account value lower, by this amount. In addition, the Fund, as a shareholder in the underlying Fidelity Central Funds, will indirectly bear its pro-rata share of the fees and expenses incurred by the underlying Fidelity Central Funds. These fees and expenses are not included in the Fund's annualized expense ratio used to calculate the expense estimate in the table below.
Hypothetical Example for Comparison Purposes
The second line of the accompanying table for each class of the Fund provides information about hypothetical account values and hypothetical expenses based on a Class' actual expense ratio and an assumed rate of return of 5% per year before expenses, which is not the Class' actual return. The hypothetical account values and expenses may not be used to estimate the actual ending account balance or expenses you paid for the period. You may use this information to compare the ongoing costs of investing in the Fund and other funds. To do so, compare this 5% hypothetical example with the 5% hypothetical examples that appear in the shareholder reports of the other funds. A small balance maintenance fee of $12.00 that is charged once a year may apply for certain accounts with a value of less than $2,000. This fee is not included in the table below. If it was, the estimate of expenses you paid during the period would be higher, and your ending account value lower, by this amount. In addition, the Fund, as a shareholder in the underlying Fidelity Central Funds, will indirectly bear its pro-rata share of the fees and expenses incurred by the underlying Fidelity Central Funds. These fees and expenses are not included in the Fund's annualized expense ratio used to calculate the expense estimate in the table below.
Please note that the expenses shown in the table are meant to highlight your ongoing costs only and do not reflect any transaction costs. Therefore, the second line of the table is useful in comparing ongoing costs only, and will not help you determine the relative total costs of owning different funds. In addition, if these transactional costs were included, your costs would have been higher.
| | Annualized Expense Ratio-A | Beginning
Account Value
February 1, 2016 | Ending
Account Value
July 31, 2016 | Expenses Paid
During Period-B
February 1, 2016
to July 31, 2016 |
| Class A | 1.03% | | | |
| Actual | | $1,000.00 | $1,129.80 | $5.45 |
| Hypothetical-C | | $1,000.00 | $1,019.74 | $5.17 |
| Class T | 1.06% | | | |
| Actual | | $1,000.00 | $1,129.50 | $5.61 |
| Hypothetical-C | | $1,000.00 | $1,019.59 | $5.32 |
| Class C | 1.78% | | | |
| Actual | | $1,000.00 | $1,125.70 | $9.41 |
| Hypothetical-C | | $1,000.00 | $1,016.01 | $8.92 |
| Real Estate Income | .79% | | | |
| Actual | | $1,000.00 | $1,131.20 | $4.19 |
| Hypothetical-C | | $1,000.00 | $1,020.93 | $3.97 |
| Class I | .76% | | | |
| Actual | | $1,000.00 | $1,130.90 | $4.03 |
| Hypothetical-C | | $1,000.00 | $1,021.08 | $3.82 |
A Annualized expense ratio reflects expenses net of applicable fee waivers.
B Expenses are equal to each Class' annualized expense ratio, multiplied by the average account value over the period, multiplied by 182/366 (to reflect the one-half year period).
C 5% return per year before expenses
Distributions (Unaudited)
The Board of Trustees of Fidelity Real Estate Income Fund voted to pay to shareholders of record at the opening of business on record date, the following distributions per share derived from capital gains realized from sales of portfolio securities, and dividends derived from net investment income:
| | Pay Date | Record Date | Dividends | Capital Gains |
| Class A | 09/12/16 | 09/09/16 | $0.131 | $0.070 |
| Class T | 09/12/16 | 09/09/16 | $0.130 | $0.070 |
| Class C | 09/12/16 | 09/09/16 | $0.115 | $0.070 |
| Class I | 09/12/16 | 09/09/16 | $0.140 | $0.070 |
| Fidelity Real Estate Income | 09/12/16 | 09/09/16 | $0.138 | $0.070 |
| |
The fund hereby designates as a capital gain dividend with respect to the taxable year ended July 31, 2016, $43,043,673, or, if subsequently determined to be different, the net capital gain of such year.
A total of 0.11% of the dividends distributed during the fiscal year was derived from interest on U.S. Government securities which is generally exempt from state income tax.
The fund will notify shareholders in January 2017 of amounts for use in preparing 2016 income tax returns.
Board Approval of Investment Advisory Contracts and Management Fees
Fidelity Real Estate Income Fund
Each year, the Board of Trustees, including the Independent Trustees (together, the Board), votes on the renewal of the management contract with Fidelity Management & Research Company (FMR) and the sub-advisory agreements (together, the Advisory Contracts) for the fund. The Board, assisted by the advice of fund counsel and Independent Trustees' counsel, requests and considers a broad range of information relevant to the renewal of the Advisory Contracts throughout the year.
The Board meets regularly and, at each of its meetings, covers an extensive agenda of topics and materials and considers factors that are relevant to its annual consideration of the renewal of the fund's Advisory Contracts, including the services and support provided to the fund and its shareholders. The Board has established various standing committees (Committees), each composed of and chaired by Independent Trustees with varying backgrounds, to which the Board has assigned specific subject matter responsibilities in order to enhance effective decision-making by the Board. The Board, acting directly and through its Committees, requests and receives information concerning the annual consideration of the renewal of the fund's Advisory Contracts. The Board also meets as needed to consider matters specifically related to the Board's annual consideration of the renewal of the Advisory Contracts. Members of the Board may also meet with trustees of other Fidelity funds through ad hoc joint committees to discuss certain matters relevant to all of the Fidelity funds.
At its July 2016 meeting, the Board unanimously determined to renew the fund's Advisory Contracts. In reaching its determination, the Board considered all factors it believed relevant, including (i) the nature, extent, and quality of the services to be provided to the fund and its shareholders (including the investment performance of the fund); (ii) the competitiveness of the fund's management fee and total expense ratio relative to peer funds; (iii) the total costs of the services to be provided by and the profits to be realized by Fidelity from its relationships with the fund; and (iv) the extent to which, if any, economies of scale exist and would be realized as the fund grows, and whether any economies of scale are appropriately shared with fund shareholders.
In considering whether to renew the Advisory Contracts for the fund, the Board reached a determination, with the assistance of fund counsel and Independent Trustees' counsel and through the exercise of its business judgment, that the renewal of the Advisory Contracts was in the best interests of the fund and its shareholders and that the compensation payable under the Advisory Contracts was fair and reasonable. The Board's decision to renew the Advisory Contracts was not based on any single factor, but rather was based on a comprehensive consideration of all the information provided to the Board at its meetings throughout the year. The Board, in reaching its determination to renew the Advisory Contracts, was aware that shareholders of the fund have a broad range of investment choices available to them, including a wide choice among funds offered by Fidelity's competitors, and that the fund's shareholders, who have the opportunity to review and weigh the disclosure provided by the fund in its prospectus and other public disclosures, have chosen to invest in this fund, which is part of the Fidelity family of funds.
Nature, Extent, and Quality of Services Provided. The Board considered Fidelity's staffing as it relates to the fund, including the backgrounds of investment personnel of Fidelity, and also considered the fund's investment objective, strategies, and related investment philosophy. The Independent Trustees also had discussions with senior management of Fidelity's investment operations and investment groups. The Board considered the structure of the investment personnel compensation program and whether this structure provides appropriate incentives to act in the best interests of the fund. Additionally, the Board considered the portfolio managers' investments, if any, in the funds that they manage.
Resources Dedicated to Investment Management and Support Services. The Board and the Fund Oversight and Research Committees reviewed the general qualifications and capabilities of Fidelity's investment staff, including its size, education, experience, and resources, as well as Fidelity's approach to recruiting, training, managing, and compensating investment personnel. The Board noted that Fidelity has continued to increase the resources devoted to non-U.S. offices, including expansion of Fidelity's global investment organization. The Board also noted that Fidelity's analysts have extensive resources, tools and capabilities that allow them to conduct sophisticated quantitative and fundamental analysis, as well as credit analysis of issuers, counterparties and guarantors. Further, the Board considered that Fidelity's investment professionals have sufficient access to global information and data so as to provide competitive investment results over time, and that those professionals also have access to sophisticated tools that permit them to assess portfolio construction and risk and performance attribution characteristics continuously, as well as to transmit new information and research conclusions rapidly around the world. Additionally, in its deliberations, the Board considered Fidelity's trading, risk management, compliance, and technology and operations capabilities and resources, which are integral parts of the investment management process.
Shareholder and Administrative Services. The Board considered (i) the nature, extent, quality, and cost of advisory, administrative, and shareholder services performed by FMR, the sub-advisers (together with FMR, the Investment Advisers), and their affiliates under the Advisory Contracts and under separate agreements covering transfer agency, pricing and bookkeeping, and securities lending services for the fund; (ii) the nature and extent of the supervision of third party service providers, principally custodians, subcustodians, and pricing vendors; and (iii) the resources devoted to, and the record of compliance with, the fund's compliance policies and procedures. The Board also reviewed the allocation of fund brokerage, including allocations to brokers affiliated with the Investment Advisers, the use of brokerage commissions to pay fund expenses, and the use of "soft" commission dollars to pay for research services.
The Board noted that the growth of fund assets over time across the complex allows Fidelity to reinvest in the development of services designed to enhance the value or convenience of the Fidelity funds as investment vehicles. These services include 24-hour access to account information and market information through telephone representatives and over the Internet, investor education materials and asset allocation tools, and the expanded availability of Fidelity Investor Centers.
In 2014, the Board formed an ad hoc Committee on Transfer Agency Fees to review the variety of transfer agency fee structures throughout the industry and Fidelity's competitive positioning with respect to industry participants.
Investment in a Large Fund Family. The Board considered the benefits to shareholders of investing in a Fidelity fund, including the benefits of investing in a fund that is part of a large family of funds offering a variety of investment disciplines and providing a large variety of mutual fund investor services. The Board noted that Fidelity had taken, or had made recommendations that resulted in the Fidelity funds taking, a number of actions over the previous year that benefited particular funds, including: (i) continuing to dedicate additional resources to investment research and to the support of the senior management team that oversees asset management; (ii) continuing efforts to enhance Fidelity's global research capabilities; (iii) launching new funds and making other enhancements to meet client needs; (iv) broadening eligibility requirements for certain lower-priced share classes of, and streamlining the fee structure for, certain existing equity index funds; (v) lowering expense caps for certain existing funds and classes to reduce expenses paid by shareholders; (vi) eliminating redemption fees for certain variable insurance product funds and classes; (vii) continuing to launch dedicated lower cost underlying funds to meet portfolio construction needs related to expanding underlying fund options for Fidelity funds of funds, specifically for the Freedom Fund product lines; (viii) launching a lower cost share class for use by the Freedom Index Fund product line; (ix) rationalizing product lines and gaining increased efficiencies through fund mergers and share class consolidations; (x) continuing to develop, acquire and implement systems and technology to improve services to the funds and shareholders, strengthen information security, and increase efficiency; (xi) implementing investment enhancements to further strengthen Fidelity's target date product line to increase investors' probability of success in achieving their goals; (xii) accelerating the conversion of all remaining Class B shares to Class A shares, which have a lower expense structure; and (xiii) implementing changes to Fidelity's money market fund product line in response to recent regulatory reforms.
Investment Performance. The Board considered whether the fund has operated in accordance with its investment objective, as well as its record of compliance with its investment restrictions and its performance history.
The Board took into account discussions with representatives of the Investment Advisers about fund investment performance that occur at Board meetings throughout the year. In this regard the Board noted that as part of regularly scheduled fund reviews and other reports to the Board on fund performance, the Board considers annualized return information for the fund, for different time periods, measured against a securities market index ("benchmark index") and a peer group of funds with similar objectives ("peer group"), if any. In its evaluation of fund investment performance, the Board gave particular attention to information indicating changes in performance of certain Fidelity funds for specific time periods and discussed with the Investment Advisers the reasons for any overperformance or underperformance.
In addition to reviewing absolute and relative fund performance, the Independent Trustees periodically consider the appropriateness of fund performance metrics in evaluating the results achieved. In general, the Independent Trustees believe that fund performance should be evaluated based on net performance (after fees and expenses) of both the highest performing and lowest performing fund share classes, where applicable, compared to appropriate benchmark indices, over appropriate time periods that may include full market cycles, and compared to peer groups, as applicable, over the same periods, taking into account relevant factors including the following: general market conditions; issuer-specific information; and fund cash flows and other factors.
The Independent Trustees recognize that shareholders evaluate performance on a net basis over their own holding periods, for which one-, three-, and five-year periods are often used as a proxy. For this reason, the performance information reviewed by the Board also included net cumulative calendar year total return information for the fund and an appropriate benchmark index and peer group for the most recent one-, three-, and five-year periods, as shown below. Returns are shown compared to the 25th percentile (top of box, 75% beaten) and 75th percentile (bottom of box, 25% beaten) of the peer universe.
Fidelity Real Estate Income Fund
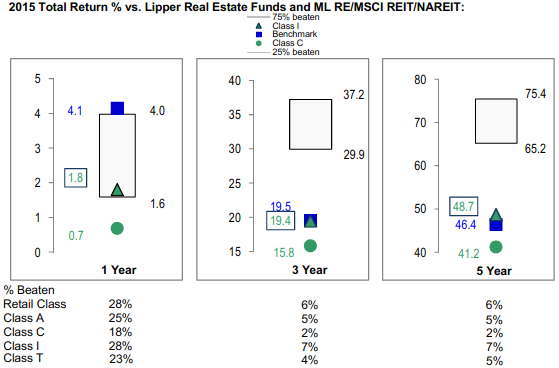
The Board has discussed the fund's underperformance with FMR and has engaged with FMR to consider what steps might be taken to remediate the fund's underperformance.
Based on its review, the Board concluded that the nature, extent, and quality of services provided to the fund under the Advisory Contracts should continue to benefit the shareholders of the fund.
Competitiveness of Management Fee and Total Expense Ratio. The Board considered the fund's management fee and total expense ratio compared to "mapped groups" of competitive funds and classes created for the purpose of facilitating the Trustees' competitive analysis of management fees and total expenses. Fidelity creates "mapped groups" by combining similar Broadridge investment objective categories that have comparable investment mandates. Combining Broadridge investment objective categories aids the Board's management fee and total expense ratio comparisons by broadening the competitive group used for comparison.
Management Fee. The Board considered two proprietary management fee comparisons for the 12-month periods shown in basis points (BP) in the chart below. The group of Broadridge funds used by the Board for management fee comparisons is referred to below as the "Total Mapped Group." The Total Mapped Group is broader than the Broadridge peer group used by the Board for performance comparisons because the Total Mapped Group combines several Broadridge investment objective categories while the Broadridge peer group does not. The Total Mapped Group comparison focuses on a fund's standing in terms of gross management fees before expense reimbursements or caps relative to the total universe of funds with comparable investment mandates, regardless of whether their management fee structures also are comparable. Funds with comparable investment mandates offer exposure to similar types of securities. Funds with comparable management fee structures have similar management fee contractual arrangements (
e.g., flat rate charged for advisory services, all-inclusive fee rate,
etc.). "TMG %" represents the percentage of funds in the Total Mapped Group that had management fees that were lower than the fund's. For example, a hypothetical TMG % of 20% would mean that 80% of the funds in the Total Mapped Group had higher, and 20% had lower, management fees than the fund. The fund's actual TMG %s and the number of funds in the Total Mapped Group are in the chart below. The "Asset-Size Peer Group" (ASPG) comparison focuses on a fund's standing relative to a subset of non-Fidelity funds within the Total Mapped Group that are similar in size and management fee structure. For example, if a fund is in the first quartile of the ASPG, the fund's management fee ranks in the least expensive or lowest 25% of funds in the ASPG. The ASPG represents at least 15% of the funds in the Total Mapped Group with comparable asset size and management fee structures, subject to a minimum of 50 funds (or all funds in the Total Mapped Group if fewer than 50). Additional information, such as the ASPG quartile in which the fund's management fee rate ranked, is also included in the chart and considered by the Board.
Fidelity Real Estate Income Fund
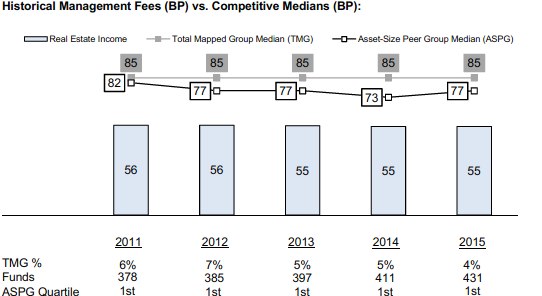
The Board noted that the fund's management fee rate ranked below the median of its Total Mapped Group and below the median of its ASPG for 2015.
The Board noted that, in 2014, the ad hoc Committee on Group Fee was formed by it and the boards of other Fidelity funds to conduct an in-depth review of the "group fee" component of the management fee of funds with such management fee structures. The Committee's focus included the mechanics of the group fee, the competitive landscape of group fee structures, Fidelity funds with no group fee component and investment products not included in group fee assets. The Board also considered that, for funds subject to the group fee, FMR agreed to voluntarily waive fees over a specified period of time in amounts designed to account for assets converted from certain funds to certain collective investment trusts.
The Board also noted that, in 2013, the ad hoc Committee on Management Fees was formed to conduct an in-depth review of the management fee rates of Fidelity's active equity mutual funds. The Committee focused on the following areas: (i) standard fee structures; (ii) research consumption and trading evolution; (iii) management fee competitiveness/profitability by category; and (iv) factors that drive institutional pricing.
Based on its review, the Board concluded that the fund's management fee is fair and reasonable in light of the services that the fund receives and the other factors considered.
Total Expense Ratio. In its review of each class's total expense ratio, the Board considered the fund's management fee rate as well as other fund or class expenses, as applicable, such as transfer agent fees, pricing and bookkeeping fees, fund-paid 12b-1 fees, and custodial, legal, and audit fees. The Board also noted that Fidelity may agree to waive fees and expenses from time to time, and the extent to which, if any, it has done so for the fund. As part of its review, the Board also considered the current and historical total expense ratios of each class of the fund compared to competitive fund median expenses. Each class of the fund is compared to those funds and classes in the Total Mapped Group (used by the Board for management fee comparisons) that have a similar sales load structure.
The Board noted that the total expense ratio of each class ranked below the competitive median for 2015.
Fees Charged to Other Fidelity Clients. The Board also considered Fidelity fee structures and other information with respect to clients of Fidelity, such as other funds advised or subadvised by Fidelity, pension plan clients, and other institutional clients with similar mandates. The Board noted the findings of the 2013 ad hoc joint committee (created with the board of other Fidelity funds), which reviewed and compared Fidelity's institutional investment advisory business with its business of providing services to the Fidelity funds, including the differences in services provided, fees charged, and costs incurred, as well as competition in their respective marketplaces.
Based on its review of total expense ratios and fees charged to other Fidelity clients, the Board concluded that the total expense ratio of each class of the fund was reasonable in light of the services that the fund and its shareholders receive and the other factors considered.
Costs of the Services and Profitability. The Board considered the revenues earned and the expenses incurred by Fidelity in conducting the business of developing, marketing, distributing, managing, administering and servicing the fund and servicing the fund's shareholders. The Board also considered the level of Fidelity's profits in respect of all the Fidelity funds.
On an annual basis, Fidelity presents to the Board information about the profitability of its relationship with the fund. Fidelity calculates profitability information for each fund, as well as aggregate profitability information for groups of Fidelity funds and all Fidelity funds, using a series of detailed revenue and cost allocation methodologies which originate with the books and records of Fidelity on which Fidelity's audited financial statements are based. The Audit Committee of the Board reviews any significant changes from the prior year's methodologies.
PricewaterhouseCoopers LLP (PwC), independent registered public accounting firm and auditor to Fidelity and certain Fidelity funds, has been engaged annually by the Board as part of the Board's assessment of Fidelity's profitability analysis. PwC's engagement includes the review and assessment of the methodologies used by Fidelity in determining the revenues and expenses attributable to Fidelity's mutual fund business, and completion of agreed-upon procedures in respect of the mathematical accuracy of the fund profitability information and its conformity to established allocation methodologies. After considering PwC's reports issued under the engagement and information provided by Fidelity, the Board concluded that while other allocation methods may also be reasonable, Fidelity's profitability methodologies are reasonable in all material respects.
The Board also reviewed Fidelity's non-fund businesses and fall-out benefits related to the mutual fund business as well as cases where Fidelity's affiliates may benefit from or be related to the fund's business.
The Board considered the costs of the services provided by and the profits realized by Fidelity in connection with the operation of the fund and was satisfied that the profitability was not excessive.
Economies of Scale. The Board considered whether there have been economies of scale in respect of the management of the Fidelity funds, whether the Fidelity funds (including the fund) have appropriately benefited from any such economies of scale, and whether there is potential for realization of any further economies of scale. The Board considered the extent to which the fund will benefit from economies of scale as assets grow through increased services to the fund, through waivers or reimbursements, or through fee or expense ratio reductions. The Board also noted that in 2013, it and the boards of other Fidelity funds created an ad hoc committee (the Economies of Scale Committee) to analyze whether Fidelity attains economies of scale in respect of the management and servicing of the Fidelity funds, whether the Fidelity funds have appropriately benefited from such economies of scale, and whether there is potential for realization of any further economies of scale.
The Board recognized that the fund's management contract incorporates a "group fee" structure, which provides for lower group fee rates as total group assets increase, and for higher group fee rates as total group assets decrease (with "group assets" defined to include fund assets under FMR's management plus the assets of sector funds previously under FMR's management). FMR calculates the group fee rates based on a tiered asset "breakpoint" schedule that varies based on asset class. The Board considered that the group fee is designed to deliver the benefits of economies of scale to fund shareholders when total Fidelity fund assets increase, even if assets of any particular fund are unchanged or have declined, because some portion of Fidelity's costs are attributable to services provided to all Fidelity funds, and all funds benefit if those costs can be allocated among more assets. The Board concluded that, given the group fee structure, fund shareholders will benefit from lower management fees as group assets increase at the fund complex level, regardless of whether Fidelity achieves any such economies of scale.
The Board concluded, taking into account the analysis of the Economies of Scale Committee, that economies of scale, if any, are being appropriately shared between fund shareholders and Fidelity.
Additional Information Requested by the Board. In order to develop fully the factual basis for consideration of the Fidelity funds' Advisory Contracts, the Board requested and received additional information on certain topics, including: (i) fund performance trends and Fidelity's long-term strategies for certain funds; (ii) the various share classes employed by Fidelity and the attributes of each class, together with similar information on the distribution and servicing payments made by Fidelity or the funds to third-party participants in the distribution channels; (iii) fund profitability, and fund performance in relation to fund profitability; (iv) the methodology with respect to evaluating competitive fund data and peer group classifications and fee comparisons; (v) annual fund profitability margins; (vi) the realization of fall-out benefits in and attribution of fall-out benefits to certain Fidelity business units; (vii) the appropriateness of certain funds' benchmarks; (viii) the rationalization for certain share classes and expenses; (ix) sub-advisory fee rates for comparable investment mandates; (x) product strategy for certain underperforming funds; and (xi) Fidelity's resources and strategy for cybersecurity.
Based on its evaluation of all of the conclusions noted above, and after considering all factors it believed relevant, the Board concluded that the advisory fee structures are fair and reasonable, and that the fund's Advisory Contracts should be renewed.
Corporate Headquarters
245 Summer St.
Boston, MA 02210
www.fidelity.com
REI-ANN-0916
1.788862.113
Fidelity® Dividend Growth Fund Class K
Annual Report July 31, 2016 |
|
Contents
To view a fund's proxy voting guidelines and proxy voting record for the 12-month period ended June 30, visit http://www.fidelity.com/proxyvotingresults or visit the Securities and Exchange Commission's (SEC) web site at http://www.sec.gov.
You may also call 1-800-835-5092 to request a free copy of the proxy voting guidelines.
Standard & Poor's, S&P and S&P 500 are registered service marks of The McGraw-Hill Companies, Inc. and have been licensed for use by Fidelity Distributors Corporation.
Other third-party marks appearing herein are the property of their respective owners.
All other marks appearing herein are registered or unregistered trademarks or service marks of FMR LLC or an affiliated company. © 2016 FMR LLC. All rights reserved.
This report and the financial statements contained herein are submitted for the general information of the shareholders of the Fund. This report is not authorized for distribution to prospective investors in the Fund unless preceded or accompanied by an effective prospectus.
A fund files its complete schedule of portfolio holdings with the SEC for the first and third quarters of each fiscal year on Form N-Q. Forms N-Q are available on the SEC’s web site at http://www.sec.gov. A fund's Forms N-Q may be reviewed and copied at the SEC’s Public Reference Room in Washington, DC. Information regarding the operation of the SEC's Public Reference Room may be obtained by calling 1-800-SEC-0330.
For a complete list of a fund's portfolio holdings, view the most recent holdings listing, semiannual report, or annual report on Fidelity's web site at http://www.fidelity.com, http://www.institutional.fidelity.com, or http://www.401k.com, as applicable.
NOT FDIC INSURED •MAY LOSE VALUE •NO BANK GUARANTEE
Neither the Fund nor Fidelity Distributors Corporation is a bank.
Performance: The Bottom Line
Average annual total return reflects the change in the value of an investment, assuming reinvestment of distributions from dividend income and capital gains (the profits earned upon the sale of securities that have grown in value, if any) and assuming a constant rate of performance each year. The hypothetical investment and the average annual total returns do not reflect the deduction of taxes that a shareholder would pay on fund distributions or the redemption of fund shares. During periods of reimbursement by Fidelity, a fund’s total return will be greater than it would be had the reimbursement not occurred. How a fund did yesterday is no guarantee of how it will do tomorrow.
Average Annual Total Returns
| For the periods ended July 31, 2016 | Past 1 year | Past 5 years | Past 10 years |
| Class K | 0.39% | 10.32% | 7.06% |
The initial offering of Class K shares took place on May 9, 2008. Returns prior to May 9, 2008 are those of Fidelity® Dividend Growth Fund, the original class of the fund.
$10,000 Over 10 Years
Let's say hypothetically that $10,000 was invested in Fidelity® Dividend Growth Fund - Class K on July 31, 2006. The chart shows how the value of your investment would have changed, and also shows how the S&P 500® Index performed over the same period. See above for additional information regarding the performance of Class K.
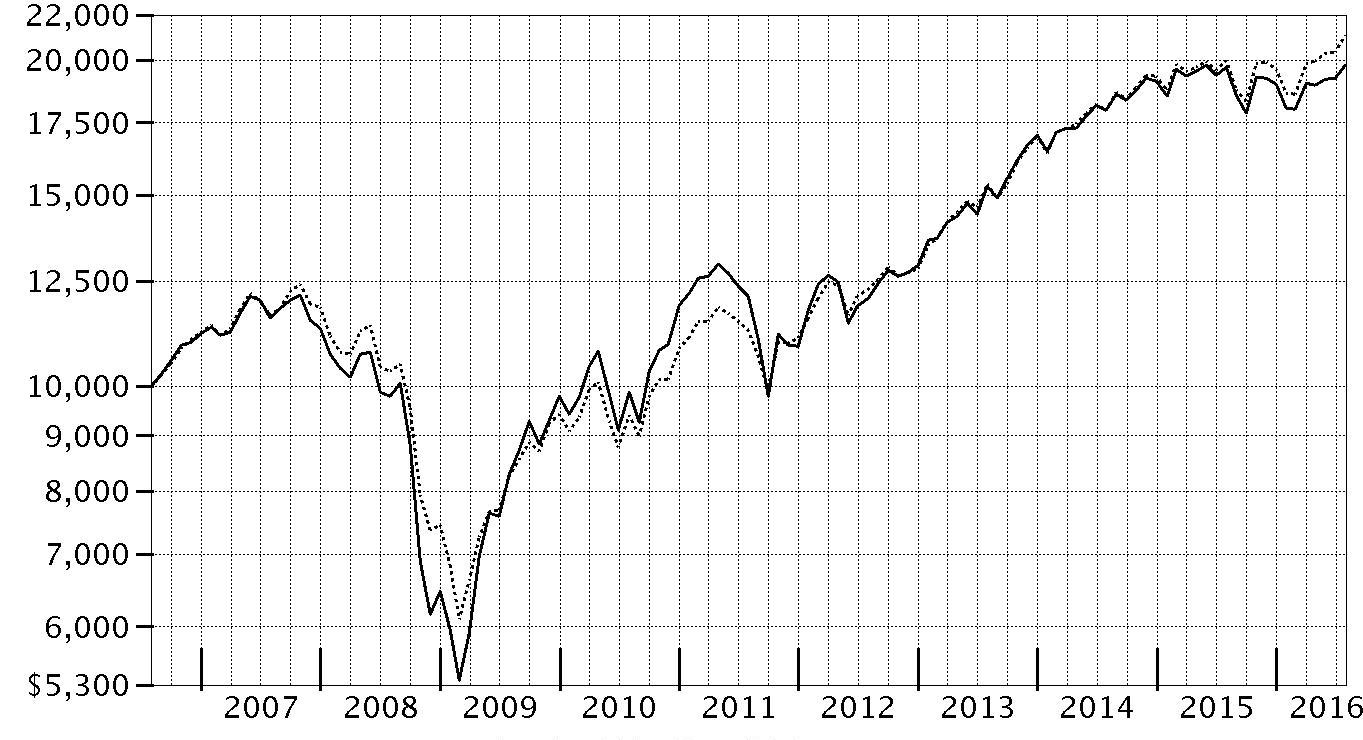
| Period Ending Values |
| $19,782 | Fidelity® Dividend Growth Fund - Class K |
| $21,089 | S&P 500® Index |
Management's Discussion of Fund Performance
Market Recap: U.S. equities gained modestly for the year ending July 31, 2016, overcoming persistent concern about global economic growth, uncertainty regarding U.S. monetary policy and the U.K.’s late-June vote to leave the European Union, dubbed Brexit. The S&P 500
® index rose 5.61%, with larger-cap, value-oriented stocks and defensive sectors shining brightest. Volatility peaked in the early weeks of 2016, as continued oil-price weakness and U.S.-dollar strength pushed the S&P 500
® to its worst January since 2009. Markets then rose beginning in February amid U.S. job gains, a broad rally in energy and materials markets, global economic stimulus and perceived softening of monetary policy by the U.S. Federal Reserve. The June 23 Brexit vote surprised markets and resulted in a sharp two-day decline for stocks, followed by a rebound as investor sentiment shifted and remained positive through July 31. For the year, dividend-rich telecom services (+26%), utilities (+23%) and consumer staples (+12%) led the way amid strong investor demand for yield. Industrials (+10%) and information technology (+10%) also outperformed, as did materials (+8%), despite a weak commodities environment overall. Conversely, a strong run for real estate stocks couldn’t keep financials (-4%) from losing ground, as low interest rates continued to squeeze bank profits.
Comments from Portfolio Manager Ramona Persaud: For the year, the fund’s share classes produced very modest gains, significantly underperforming the 5.61% result of the benchmark S&P 500
® index. Global growth remained slow and unsteady, and late in the period, investors were rewarded for owning more-defensive, higher-quality stocks, while paying little regard to valuation. This hurt the fund, which is focused on both quality and value. From a sector perspective, stock selection in consumer discretionary, consumer staples, materials and financials hampered results versus the benchmark. Our fairly large out-of-index stake in Teva Pharmaceutical Industries was the biggest relative detractor, returning -21% this period. Market fears regarding price deflation for generic drugs and delays in Teva's pending acquisition of Allergan's generics business held back the stock. Elsewhere, an overweighting in fertilizer manufacturer CF Industries Holdings detracted, as did a non-benchmark stake in European telecom and media company Altice. We sold CF Industries from the fund by period end. Conversely, successful positioning in energy and picks in health care were a slight plus. The fund’s largest individual contributor was ASAC II. The limited partnership is an investment vehicle led by video game publisher Activision Blizzard’s CEO and co-chairman. Shares of ASAC II and Activision turned in strong results amid a robust gaming cycle.
The views expressed above reflect those of the portfolio manager(s) only through the end of the period as stated on the cover of this report and do not necessarily represent the views of Fidelity or any other person in the Fidelity organization. Any such views are subject to change at any time based upon market or other conditions and Fidelity disclaims any responsibility to update such views. These views may not be relied on as investment advice and, because investment decisions for a Fidelity fund are based on numerous factors, may not be relied on as an indication of trading intent on behalf of any Fidelity fund.
Investment Summary (Unaudited)
Top Ten Stocks as of July 31, 2016
| | % of fund's net assets | % of fund's net assets 6 months ago |
| Apple, Inc. | 4.3 | 4.2 |
| Johnson & Johnson | 3.3 | 3.4 |
| Microsoft Corp. | 3.1 | 3.5 |
| General Electric Co. | 2.6 | 2.9 |
| Alphabet, Inc. Class C | 2.6 | 2.4 |
| Exxon Mobil Corp. | 2.5 | 2.5 |
| Chevron Corp. | 2.2 | 2.1 |
| AT&T, Inc. | 2.2 | 1.9 |
| JPMorgan Chase & Co. | 2.1 | 2.5 |
| Wells Fargo & Co. | 2.1 | 2.5 |
| | 27.0 | |
Top Five Market Sectors as of July 31, 2016
| | % of fund's net assets | % of fund's net assets 6 months ago |
| Information Technology | 21.6 | 23.0 |
| Financials | 15.3 | 15.7 |
| Consumer Staples | 14.0 | 14.9 |
| Health Care | 12.2 | 13.4 |
| Industrials | 9.1 | 9.6 |
Asset Allocation (% of fund's net assets)
| As of July 31, 2016* |
| | Stocks | 94.0% |
| | Convertible Securities | 0.1% |
| | Short-Term Investments and Net Other Assets (Liabilities) | 5.9% |

* Foreign investments - 12.8%
| As of January 31, 2016* |
| | Stocks | 96.7% |
| | Convertible Securities | 0.1% |
| | Short-Term Investments and Net Other Assets (Liabilities) | 3.2% |

* Foreign investments - 15.9%
Investments July 31, 2016
Showing Percentage of Net Assets
| Common Stocks - 94.0% | | | |
| | | Shares | Value (000s) |
| CONSUMER DISCRETIONARY - 8.5% | | | |
| Diversified Consumer Services - 0.6% | | | |
| H&R Block, Inc. | | 1,609,650 | $38,294 |
| ServiceMaster Global Holdings, Inc. (a) | | 208,000 | 7,869 |
| | | | 46,163 |
| Hotels, Restaurants & Leisure - 2.2% | | | |
| Las Vegas Sands Corp. | | 717,200 | 36,326 |
| McDonald's Corp. | | 537,600 | 63,249 |
| Wyndham Worldwide Corp. | | 992,291 | 70,473 |
| | | | 170,048 |
| Internet & Catalog Retail - 0.1% | | | |
| Liberty Interactive Corp. QVC Group Series A (a) | | 264,900 | 7,102 |
| Leisure Products - 0.1% | | | |
| Vista Outdoor, Inc. (a) | | 153,900 | 7,703 |
| Media - 1.6% | | | |
| Altice NV Class A (a) | | 631,339 | 9,370 |
| Comcast Corp. Class A | | 1,650,996 | 111,029 |
| | | | 120,399 |
| Multiline Retail - 1.3% | | | |
| Dillard's, Inc. Class A | | 162,100 | 10,971 |
| Target Corp. | | 1,206,500 | 90,886 |
| | | | 101,857 |
| Specialty Retail - 2.3% | | | |
| AutoZone, Inc. (a) | | 79,200 | 64,466 |
| Foot Locker, Inc. | | 1,077,879 | 64,263 |
| L Brands, Inc. | | 311,700 | 23,035 |
| Ross Stores, Inc. | | 309,200 | 19,118 |
| | | | 170,882 |
| Textiles, Apparel & Luxury Goods - 0.3% | | | |
| VF Corp. | | 334,700 | 20,895 |
|
| TOTAL CONSUMER DISCRETIONARY | | | 645,049 |
|
| CONSUMER STAPLES - 14.0% | | | |
| Beverages - 5.7% | | | |
| Constellation Brands, Inc. Class A (sub. vtg.) | | 438,200 | 72,141 |
| Dr. Pepper Snapple Group, Inc. | | 609,208 | 60,013 |
| Molson Coors Brewing Co. Class B | | 369,300 | 37,728 |
| PepsiCo, Inc. | | 1,233,600 | 134,364 |
| The Coca-Cola Co. | | 2,936,038 | 128,099 |
| | | | 432,345 |
| Food & Staples Retailing - 3.4% | | | |
| CVS Health Corp. | | 1,344,200 | 124,634 |
| Kroger Co. | | 840,418 | 28,734 |
| Rami Levi Chain Stores Hashikma Marketing 2006 Ltd. | | 557,501 | 21,580 |
| Rite Aid Corp. (a) | | 662,300 | 4,636 |
| Walgreens Boots Alliance, Inc. | | 920,436 | 72,945 |
| | | | 252,529 |
| Food Products - 0.6% | | | |
| Greencore Group PLC | | 7,318,277 | 31,729 |
| Hilton Food Group PLC | | 1,951,505 | 15,419 |
| | | | 47,148 |
| Household Products - 2.1% | | | |
| Procter & Gamble Co. | | 1,812,600 | 155,140 |
| Tobacco - 2.2% | | | |
| British American Tobacco PLC (United Kingdom) | | 737,803 | 47,090 |
| Imperial Tobacco Group PLC | | 689,702 | 36,361 |
| Reynolds American, Inc. | | 1,638,300 | 82,013 |
| | | | 165,464 |
|
| TOTAL CONSUMER STAPLES | | | 1,052,626 |
|
| ENERGY - 7.7% | | | |
| Energy Equipment & Services - 0.3% | | | |
| Baker Hughes, Inc. | | 441,600 | 21,122 |
| Oil, Gas & Consumable Fuels - 7.4% | | | |
| Chevron Corp. | | 1,640,800 | 168,149 |
| ConocoPhillips Co. | | 966,300 | 39,444 |
| Exxon Mobil Corp. | | 2,107,097 | 187,426 |
| Imperial Oil Ltd. | | 1,899,100 | 58,428 |
| Kinder Morgan, Inc. | | 1,191,500 | 24,223 |
| Northern Oil & Gas, Inc. (a)(b) | | 1,037,290 | 4,108 |
| PrairieSky Royalty Ltd. (b) | | 971,100 | 18,899 |
| Suncor Energy, Inc. | | 2,209,100 | 59,455 |
| | | | 560,132 |
|
| TOTAL ENERGY | | | 581,254 |
|
| FINANCIALS - 15.3% | | | |
| Banks - 9.8% | | | |
| Bank of America Corp. | | 8,479,217 | 122,864 |
| Citigroup, Inc. | | 2,158,161 | 94,549 |
| JPMorgan Chase & Co. | | 2,531,435 | 161,936 |
| PacWest Bancorp | | 1,236,200 | 51,117 |
| SunTrust Banks, Inc. | | 1,238,400 | 52,372 |
| U.S. Bancorp | | 2,318,369 | 97,766 |
| Wells Fargo & Co. | | 3,251,193 | 155,960 |
| | | | 736,564 |
| Capital Markets - 0.5% | | | |
| Diamond Hill Investment Group, Inc. | | 77,538 | 14,809 |
| Franklin Resources, Inc. | | 646,900 | 23,411 |
| | | | 38,220 |
| Consumer Finance - 0.0% | | | |
| Imperial Holdings, Inc. warrants 4/11/19 (a) | | 48,012 | 2 |
| Diversified Financial Services - 2.8% | | | |
| Berkshire Hathaway, Inc. Class B (a) | | 494,600 | 71,356 |
| McGraw Hill Financial, Inc. | | 768,527 | 93,914 |
| MSCI, Inc. Class A | | 536,900 | 46,195 |
| | | | 211,465 |
| Insurance - 1.3% | | | |
| Chubb Ltd. | | 632,000 | 79,164 |
| MetLife, Inc. | | 537,200 | 22,960 |
| | | | 102,124 |
| Real Estate Investment Trusts - 0.9% | | | |
| American Tower Corp. | | 576,800 | 66,776 |
|
| TOTAL FINANCIALS | | | 1,155,151 |
|
| HEALTH CARE - 12.2% | | | |
| Biotechnology - 2.0% | | | |
| AbbVie, Inc. | | 740,700 | 49,057 |
| Amgen, Inc. | | 579,010 | 99,607 |
| Gilead Sciences, Inc. | | 39,700 | 3,155 |
| United Therapeutics Corp. (a) | | 8,800 | 1,065 |
| | | | 152,884 |
| Health Care Equipment & Supplies - 2.8% | | | |
| Danaher Corp. | | 1,275,892 | 103,909 |
| Medtronic PLC | | 1,228,603 | 107,662 |
| | | | 211,571 |
| Health Care Providers & Services - 0.6% | | | |
| HealthSouth Corp. warrants 1/17/17 (a) | | 12,959 | 44 |
| McKesson Corp. | | 230,858 | 44,916 |
| | | | 44,960 |
| Health Care Technology - 0.3% | | | |
| CompuGroup Medical AG | | 552,022 | 23,835 |
| Pharmaceuticals - 6.5% | | | |
| Allergan PLC (a) | | 257,000 | 65,008 |
| Astellas Pharma, Inc. | | 1,933,100 | 32,209 |
| GlaxoSmithKline PLC | | 527,400 | 11,778 |
| Johnson & Johnson | | 1,999,343 | 250,378 |
| Sanofi SA sponsored ADR | | 912,600 | 38,904 |
| Teva Pharmaceutical Industries Ltd. sponsored ADR | | 1,617,200 | 86,520 |
| | | | 484,797 |
|
| TOTAL HEALTH CARE | | | 918,047 |
|
| INDUSTRIALS - 9.1% | | | |
| Aerospace & Defense - 3.2% | | | |
| BWX Technologies, Inc. | | 1,156,800 | 42,582 |
| General Dynamics Corp. | | 304,700 | 44,757 |
| Honeywell International, Inc. | | 419,600 | 48,812 |
| The Boeing Co. | | 276,000 | 36,890 |
| United Technologies Corp. | | 662,500 | 71,318 |
| | | | 244,359 |
| Air Freight & Logistics - 0.2% | | | |
| C.H. Robinson Worldwide, Inc. | | 230,000 | 16,013 |
| Commercial Services & Supplies - 0.2% | | | |
| Deluxe Corp. | | 238,500 | 16,120 |
| Construction & Engineering - 0.1% | | | |
| Astaldi SpA | | 1,100,200 | 4,812 |
| Electrical Equipment - 1.2% | | | |
| AMETEK, Inc. | | 1,240,200 | 58,327 |
| Fortive Corp. (a) | | 637,946 | 30,755 |
| | | | 89,082 |
| Industrial Conglomerates - 4.0% | | | |
| General Electric Co. | | 6,189,700 | 192,747 |
| Roper Technologies, Inc. | | 617,144 | 105,137 |
| | | | 297,884 |
| Machinery - 0.2% | | | |
| Wabtec Corp. | | 240,100 | 16,447 |
|
| TOTAL INDUSTRIALS | | | 684,717 |
|
| INFORMATION TECHNOLOGY - 21.6% | | | |
| Communications Equipment - 1.8% | | | |
| Cisco Systems, Inc. | | 4,458,986 | 136,133 |
| Internet Software & Services - 2.6% | | | |
| Alphabet, Inc. Class C (a) | | 249,706 | 191,971 |
| IT Services - 3.8% | | | |
| Accenture PLC Class A | | 1,067,500 | 120,425 |
| ASAC II LP (a)(c) | | 2,514,134 | 422 |
| Fidelity National Information Services, Inc. | | 411,850 | 32,754 |
| IBM Corp. | | 498,100 | 80,005 |
| Sabre Corp. | | 264,900 | 7,722 |
| Total System Services, Inc. | | 802,900 | 40,884 |
| | | | 282,212 |
| Semiconductors & Semiconductor Equipment - 1.0% | | | |
| Qualcomm, Inc. | | 1,229,483 | 76,941 |
| Software - 6.6% | | | |
| Activision Blizzard, Inc. | | 3,412,922 | 137,063 |
| Micro Focus International PLC | | 1,907,363 | 48,870 |
| Microsoft Corp. | | 4,076,216 | 231,040 |
| Oracle Corp. | | 1,989,760 | 81,660 |
| | | | 498,633 |
| Technology Hardware, Storage & Peripherals - 5.8% | | | |
| Apple, Inc. | | 3,127,618 | 325,929 |
| EMC Corp. | | 4,023,500 | 113,785 |
| | | | 439,714 |
|
| TOTAL INFORMATION TECHNOLOGY | | | 1,625,604 |
|
| MATERIALS - 3.4% | | | |
| Chemicals - 3.0% | | | |
| E.I. du Pont de Nemours & Co. | | 1,163,900 | 80,507 |
| LyondellBasell Industries NV Class A | | 709,500 | 53,397 |
| Monsanto Co. | | 331,200 | 35,362 |
| The Dow Chemical Co. | | 750,800 | 40,295 |
| W.R. Grace & Co. | | 194,300 | 14,547 |
| | | | 224,108 |
| Containers & Packaging - 0.4% | | | |
| Ball Corp. | | 488,100 | 34,494 |
|
| TOTAL MATERIALS | | | 258,602 |
|
| TELECOMMUNICATION SERVICES - 2.2% | | | |
| Diversified Telecommunication Services - 2.2% | | | |
| AT&T, Inc. | | 3,831,300 | 165,857 |
| TOTAL COMMON STOCKS | | | |
| (Cost $5,669,302) | | | 7,086,907 |
| | | Principal Amount (000s) | Value (000s) |
|
| Convertible Bonds - 0.1% | | | |
| ENERGY - 0.1% | | | |
| Oil, Gas & Consumable Fuels - 0.1% | | | |
Amyris, Inc. 3% 2/27/17
(Cost $7,356) | | 7,356 | 7,035 |
| | | Shares | Value (000s) |
|
| Money Market Funds - 6.1% | | | |
| Fidelity Cash Central Fund, 0.42% (d) | | 449,185,364 | 449,185 |
| Fidelity Securities Lending Cash Central Fund, 0.45% (d)(e) | | 11,379,095 | 11,379 |
| TOTAL MONEY MARKET FUNDS | | | |
| (Cost $460,564) | | | 460,564 |
| TOTAL INVESTMENT PORTFOLIO - 100.2% | | | |
| (Cost $6,137,222) | | | 7,554,506 |
| NET OTHER ASSETS (LIABILITIES) - (0.2)% | | | (15,214) |
| NET ASSETS - 100% | | | $7,539,292 |
Legend
(a) Non-income producing
(b) Security or a portion of the security is on loan at period end.
(c) Restricted securities - Investment in securities not registered under the Securities Act of 1933 (excluding 144A issues). At the end of the period, the value of restricted securities (excluding 144A issues) amounted to $422,000 or 0.0% of net assets.
(d) Affiliated fund that is generally available only to investment companies and other accounts managed by Fidelity Investments. The rate quoted is the annualized seven-day yield of the fund at period end. A complete unaudited listing of the fund's holdings as of its most recent quarter end is available upon request. In addition, each Fidelity Central Fund's financial statements, which are not covered by the Fund's Report of Independent Registered Public Accounting Firm, are available on the SEC's website or upon request.
(e) Investment made with cash collateral received from securities on loan.
Additional information on each restricted holding is as follows:
| Security | Acquisition Date | Acquisition Cost (000s) |
| ASAC II LP | 10/10/13 | $25,141 |
Affiliated Central Funds
Information regarding fiscal year to date income earned by the Fund from investments in Fidelity Central Funds is as follows:
| Fund | Income earned |
| | (Amounts in thousands) |
| Fidelity Cash Central Fund | $781 |
| Fidelity Securities Lending Cash Central Fund | 292 |
| Total | $1,073 |
Investment Valuation
The following is a summary of the inputs used, as of July 31, 2016, involving the Fund's assets and liabilities carried at fair value. The inputs or methodology used for valuing securities may not be an indication of the risk associated with investing in those securities. For more information on valuation inputs, and their aggregation into the levels used below, please refer to the Investment Valuation section in the accompanying Notes to Financial Statements.
| | Valuation Inputs at Reporting Date: |
| Description | Total | Level 1 | Level 2 | Level 3 |
| (Amounts in thousands) | | | | |
| Investments in Securities: | | | | |
| Equities: | | | | |
| Consumer Discretionary | $645,049 | $645,049 | $-- | $-- |
| Consumer Staples | 1,052,626 | 1,005,536 | 47,090 | -- |
| Energy | 581,254 | 581,254 | -- | -- |
| Financials | 1,155,151 | 1,155,149 | 2 | -- |
| Health Care | 918,047 | 874,060 | 43,987 | -- |
| Industrials | 684,717 | 684,717 | -- | -- |
| Information Technology | 1,625,604 | 1,625,182 | -- | 422 |
| Materials | 258,602 | 258,602 | -- | -- |
| Telecommunication Services | 165,857 | 165,857 | -- | -- |
| Corporate Bonds | 7,035 | -- | 7,035 | -- |
| Money Market Funds | 460,564 | 460,564 | -- | -- |
| Total Investments in Securities: | $7,554,506 | $7,455,970 | $98,114 | $422 |
Other Information
Distribution of investments by country or territory of incorporation, as a percentage of Total Net Assets, is as follows (Unaudited):
| United States of America | 87.2% |
| Ireland | 4.3% |
| United Kingdom | 2.1% |
| Canada | 1.8% |
| Israel | 1.5% |
| Switzerland | 1.0% |
| Others (Individually Less Than 1%) | 2.1% |
| | 100.0% |
See accompanying notes which are an integral part of the financial statements.
Financial Statements
Statement of Assets and Liabilities
| Amounts in thousands (except per-share amounts) | | July 31, 2016 |
| Assets | | |
Investment in securities, at value (including securities loaned of $11,104) — See accompanying schedule:
Unaffiliated issuers (cost $5,676,658) | $7,093,942 | |
| Fidelity Central Funds (cost $460,564) | 460,564 | |
| Total Investments (cost $6,137,222) | | $7,554,506 |
| Receivable for fund shares sold | | 2,446 |
| Dividends receivable | | 6,673 |
| Interest receivable | | 94 |
| Distributions receivable from Fidelity Central Funds | | 140 |
| Other receivables | | 501 |
| Total assets | | 7,564,360 |
| Liabilities | | |
| Payable for investments purchased | $4,104 | |
| Payable for fund shares redeemed | 5,823 | |
| Accrued management fee | 2,269 | |
| Other affiliated payables | 951 | |
| Other payables and accrued expenses | 542 | |
| Collateral on securities loaned, at value | 11,379 | |
| Total liabilities | | 25,068 |
| Net Assets | | $7,539,292 |
| Net Assets consist of: | | |
| Paid in capital | | $6,189,409 |
| Undistributed net investment income | | 64,469 |
| Accumulated undistributed net realized gain (loss) on investments and foreign currency transactions | | (131,844) |
| Net unrealized appreciation (depreciation) on investments and assets and liabilities in foreign currencies | | 1,417,258 |
| Net Assets | | $7,539,292 |
| Dividend Growth: | | |
| Net Asset Value, offering price and redemption price per share ($5,848,558 ÷ 185,589 shares) | | $31.51 |
| Class K: | | |
| Net Asset Value, offering price and redemption price per share ($1,690,734 ÷ 53,675 shares) | | $31.50 |
See accompanying notes which are an integral part of the financial statements.
Statement of Operations
| Amounts in thousands | | Year ended July 31, 2016 |
| Investment Income | | |
| Dividends | | $165,431 |
| Interest | | 221 |
| Income from Fidelity Central Funds | | 1,073 |
| Total income | | 166,725 |
| Expenses | | |
| Management fee | | |
| Basic fee | $41,571 | |
| Performance adjustment | (9,103) | |
| Transfer agent fees | 10,524 | |
| Accounting and security lending fees | 1,195 | |
| Custodian fees and expenses | 114 | |
| Independent trustees' fees and expenses | 34 | |
| Registration fees | 62 | |
| Audit | 85 | |
| Legal | 30 | |
| Miscellaneous | 62 | |
| Total expenses before reductions | 44,574 | |
| Expense reductions | (180) | 44,394 |
| Net investment income (loss) | | 122,331 |
| Realized and Unrealized Gain (Loss) | | |
| Net realized gain (loss) on: | | |
| Investment securities: | | |
| Unaffiliated issuers | (82,793) | |
| Foreign currency transactions | (34) | |
| Total net realized gain (loss) | | (82,827) |
Change in net unrealized appreciation (depreciation) on:
Investment securities | (61,631) | |
| Assets and liabilities in foreign currencies | (6) | |
| Total change in net unrealized appreciation (depreciation) | | (61,637) |
| Net gain (loss) | | (144,464) |
| Net increase (decrease) in net assets resulting from operations | | $(22,133) |
See accompanying notes which are an integral part of the financial statements.
Statement of Changes in Net Assets
| Amounts in thousands | Year ended July 31, 2016 | Year ended July 31, 2015 |
| Increase (Decrease) in Net Assets | | |
| Operations | | |
| Net investment income (loss) | $122,331 | $125,774 |
| Net realized gain (loss) | (82,827) | 767,929 |
| Change in net unrealized appreciation (depreciation) | (61,637) | (102,174) |
| Net increase (decrease) in net assets resulting from operations | (22,133) | 791,529 |
| Distributions to shareholders from net investment income | (116,882) | (124,133) |
| Distributions to shareholders from net realized gain | (571,365) | (1,267,766) |
| Total distributions | (688,247) | (1,391,899) |
| Share transactions - net increase (decrease) | (166,713) | 479,167 |
| Total increase (decrease) in net assets | (877,093) | (121,203) |
| Net Assets | | |
| Beginning of period | 8,416,385 | 8,537,588 |
| End of period | $7,539,292 | $8,416,385 |
| Other Information | | |
| Undistributed net investment income end of period | $64,469 | $65,329 |
See accompanying notes which are an integral part of the financial statements.
Financial Highlights — Fidelity Dividend Growth Fund
| Years ended July 31, | 2016 | 2015 | 2014 | 2013 | 2012 |
| Selected Per–Share Data | | | | | |
| Net asset value, beginning of period | $34.46 | $37.27 | $35.33 | $28.61 | $28.96 |
| Income from Investment Operations | | | | | |
| Net investment income (loss)A | .48 | .49 | .56 | .40 | .20 |
| Net realized and unrealized gain (loss) | (.61)B | 2.71 | 4.98 | 7.12 | (.41) |
| Total from investment operations | (.13) | 3.20 | 5.54 | 7.52 | (.21) |
| Distributions from net investment income | (.47) | (.51) | (.37) | (.30) | (.12) |
| Distributions from net realized gain | (2.36) | (5.49) | (3.23) | (.50) | (.02) |
| Total distributions | (2.82)C | (6.01)D | (3.60) | (.80) | (.14) |
| Net asset value, end of period | $31.51 | $34.46 | $37.27 | $35.33 | $28.61 |
| Total ReturnB,E | .26%B | 9.54% | 17.30% | 26.83% | (.67)% |
| Ratios to Average Net AssetsF,G | | | | | |
| Expenses before reductions | .62% | .69% | .56% | .63% | .91% |
| Expenses net of fee waivers, if any | .61% | .68% | .56% | .63% | .91% |
| Expenses net of all reductions | .61% | .68% | .56% | .62% | .91% |
| Net investment income (loss) | 1.59% | 1.43% | 1.58% | 1.26% | .75% |
| Supplemental Data | | | | | |
| Net assets, end of period (in millions) | $5,849 | $6,474 | $6,481 | $6,633 | $5,905 |
| Portfolio turnover rateH | 30% | 64% | 99% | 69% | 63%I |
A Calculated based on average shares outstanding during the period.
B Net realized and unrealized gain (loss) per share reflects proceeds received from litigation which amounted to $.01 per share. Excluding these litigation proceeds, the total return would have been .22%
C Total distributions of $2.82 per share is comprised of distributions from net investment income of $.465 and distributions from net realized gain of $2.358 per share.
D Total distributions of $6.01 per share is comprised of distributions from net investment income of $.512 and distributions from net realized gain of $5.493 per share.
E Total returns would have been lower if certain expenses had not been reduced during the applicable periods shown.
F Fees and expenses of any underlying Fidelity Central Funds are not included in the Fund's expense ratio. The Fund indirectly bears its proportionate share of the expenses of any underlying Fidelity Central Funds.
G Expense ratios reflect operating expenses of the class. Expenses before reductions do not reflect amounts reimbursed by the investment adviser or reductions from brokerage service arrangements or reductions from other expense offset arrangements and do not represent the amount paid by the class during periods when reimbursements or reductions occur. Expenses net of fee waivers reflect expenses after reimbursement by the investment adviser but prior to reductions from brokerage service arrangements or other expense offset arrangements. Expenses net of all reductions represent the net expenses paid by the class.
H Amount does not include the portfolio activity of any underlying Fidelity Central Funds.
I Portfolio turnover rate excludes securities received or delivered in-kind.
See accompanying notes which are an integral part of the financial statements.
Financial Highlights — Fidelity Dividend Growth Fund Class K
| Years ended July 31, | 2016 | 2015 | 2014 | 2013 | 2012 |
| Selected Per–Share Data | | | | | |
| Net asset value, beginning of period | $34.45 | $37.27 | $35.34 | $28.62 | $28.98 |
| Income from Investment Operations | | | | | |
| Net investment income (loss)A | .52 | .53 | .60 | .45 | .25 |
| Net realized and unrealized gain (loss) | (.61)B | 2.70 | 4.97 | 7.12 | (.43) |
| Total from investment operations | (.09) | 3.23 | 5.57 | 7.57 | (.18) |
| Distributions from net investment income | (.50) | (.56) | (.42) | (.35) | (.17) |
| Distributions from net realized gain | (2.36) | (5.49) | (3.23) | (.50) | (.02) |
| Total distributions | (2.86) | (6.05) | (3.64)C | (.85) | (.18)D |
| Net asset value, end of period | $31.50 | $34.45 | $37.27 | $35.34 | $28.62 |
| Total ReturnB,E | .39%B | 9.65% | 17.44% | 27.04% | (.52)% |
| Ratios to Average Net AssetsF,G | | | | | |
| Expenses before reductions | .50% | .57% | .44% | .48% | .75% |
| Expenses net of fee waivers, if any | .50% | .57% | .43% | .48% | .75% |
| Expenses net of all reductions | .49% | .57% | .43% | .47% | .75% |
| Net investment income (loss) | 1.71% | 1.54% | 1.70% | 1.41% | .91% |
| Supplemental Data | | | | | |
| Net assets, end of period (in millions) | $1,691 | $1,942 | $2,057 | $1,639 | $1,221 |
| Portfolio turnover rateH | 30% | 64% | 99% | 69% | 63%I |
A Calculated based on average shares outstanding during the period.
B Net realized and unrealized gain (loss) per share reflects proceeds received from litigation which amounted to $.01 per share. Excluding these litigation proceeds, the total return would have been .35%
C Total distributions of $3.64 per share is comprised of distributions from net investment income of $.419 and distributions from net realized gain of $3.225 per share.
D Total distributions of $.18 per share is comprised of distributions from net investment income of $.169 and distributions from net realized gain of $.015 per share.
E Total returns would have been lower if certain expenses had not been reduced during the applicable periods shown.
F Fees and expenses of any underlying Fidelity Central Funds are not included in the Fund's expense ratio. The Fund indirectly bears its proportionate share of the expenses of any underlying Fidelity Central Funds.
G Expense ratios reflect operating expenses of the class. Expenses before reductions do not reflect amounts reimbursed by the investment adviser or reductions from brokerage service arrangements or reductions from other expense offset arrangements and do not represent the amount paid by the class during periods when reimbursements or reductions occur. Expenses net of fee waivers reflect expenses after reimbursement by the investment adviser but prior to reductions from brokerage service arrangements or other expense offset arrangements. Expenses net of all reductions represent the net expenses paid by the class.
H Amount does not include the portfolio activity of any underlying Fidelity Central Funds.
I Portfolio turnover rate excludes securities received or delivered in-kind.
See accompanying notes which are an integral part of the financial statements.
Notes to Financial Statements
For the period ended July 31, 2016
(Amounts in thousands except percentages)
1. Organization.
Fidelity Dividend Growth Fund (the Fund) is a fund of Fidelity Securities Fund (the Trust) and is authorized to issue an unlimited number of shares. The Trust is registered under the Investment Company Act of 1940, as amended (the 1940 Act), as an open-end management investment company organized as a Massachusetts business trust. The Fund offers Dividend Growth and Class K shares, each of which has equal rights as to assets and voting privileges. Each class has exclusive voting rights with respect to matters that affect that class.
2. Investments in Fidelity Central Funds.
The Fund invests in Fidelity Central Funds, which are open-end investment companies generally available only to other investment companies and accounts managed by the investment adviser and its affiliates. The Fund's Schedule of Investments lists each of the Fidelity Central Funds held as of period end, if any, as an investment of the Fund, but does not include the underlying holdings of each Fidelity Central Fund. As an Investing Fund, the Fund indirectly bears its proportionate share of the expenses of the underlying Fidelity Central Funds.
The Money Market Central Funds seek preservation of capital and current income and are managed by Fidelity Investments Money Management, Inc. (FIMM), an affiliate of the investment adviser. Annualized expenses of the Money Market Central Funds as of their most recent shareholder report date are less than .005%.
A complete unaudited list of holdings for each Fidelity Central Fund is available upon request or at the Securities and Exchange Commission (the SEC) website at www.sec.gov. In addition, the financial statements of the Fidelity Central Funds, which are not covered by the Fund's Report of Independent Registered Public Accounting Firm, are available on the SEC website or upon request.
3. Significant Accounting Policies.
The financial statements have been prepared in conformity with accounting principles generally accepted in the United States of America (GAAP), which require management to make certain estimates and assumptions at the date of the financial statements. Actual results could differ from those estimates. Subsequent events, if any, through the date that the financial statements were issued have been evaluated in the preparation of the financial statements. The following summarizes the significant accounting policies of the Fund:
Investment Valuation. Investments are valued as of 4:00 p.m. Eastern time on the last calendar day of the period. The Board of Trustees (the Board) has delegated the day to day responsibility for the valuation of the Fund's investments to the Fidelity Management & Research Company (FMR) Fair Value Committee (the Committee). In accordance with valuation policies and procedures approved by the Board, the Fund attempts to obtain prices from one or more third party pricing vendors or brokers to value its investments. When current market prices, quotations or currency exchange rates are not readily available or reliable, investments will be fair valued in good faith by the Committee, in accordance with procedures adopted by the Board. Factors used in determining fair value vary by investment type and may include market or investment specific events, changes in interest rates and credit quality. The frequency with which these procedures are used cannot be predicted and they may be utilized to a significant extent. The Committee oversees the Fund's valuation policies and procedures and reports to the Board on the Committee's activities and fair value determinations. The Board monitors the appropriateness of the procedures used in valuing the Fund's investments and ratifies the fair value determinations of the Committee.
The Fund categorizes the inputs to valuation techniques used to value its investments into a disclosure hierarchy consisting of three levels as shown below:
- Level 1 – quoted prices in active markets for identical investments
- Level 2 – other significant observable inputs (including quoted prices for similar investments, interest rates, prepayment speeds, etc.)
- Level 3 – unobservable inputs (including the Fund's own assumptions based on the best information available)
Valuation techniques used to value the Fund's investments by major category are as follows:
Equity securities, including restricted securities, for which market quotations are readily available, are valued at the last reported sale price or official closing price as reported by a third party pricing vendor on the primary market or exchange on which they are traded and are categorized as Level 1 in the hierarchy. In the event there were no sales during the day or closing prices are not available, securities are valued at the last quoted bid price or may be valued using the last available price and are generally categorized as Level 2 in the hierarchy. For foreign equity securities, when market or security specific events arise, comparisons to the valuation of American Depositary Receipts (ADRs), futures contracts, Exchange-Traded Funds (ETFs) and certain indexes as well as quoted prices for similar securities may be used and would be categorized as Level 2 in the hierarchy. Utilizing these techniques may result in transfers between Level 1 and Level 2. For equity securities, including restricted securities, where observable inputs are limited, assumptions about market activity and risk are used and these securities may be categorized as Level 3 in the hierarchy.
Debt securities, including restricted securities, are valued based on evaluated prices received from third party pricing vendors or from brokers who make markets in such securities. Corporate bonds are valued by pricing vendors who utilize matrix pricing which considers yield or price of bonds of comparable quality, coupon, maturity and type or by broker-supplied prices. When independent prices are unavailable or unreliable, debt securities may be valued utilizing pricing methodologies which consider similar factors that would be used by third party pricing vendors. Debt securities are generally categorized as Level 2 in the hierarchy but may be Level 3 depending on the circumstances.
Investments in open-end mutual funds, including the Fidelity Central Funds, are valued at their closing net asset value (NAV) each business day and are categorized as Level 1 in the hierarchy.
Changes in valuation techniques may result in transfers in or out of an assigned level within the disclosure hierarchy. The aggregate value of investments by input level as of July 31, 2016 is included at the end of the Fund's Schedule of Investments.
Foreign Currency. The Fund may use foreign currency contracts to facilitate transactions in foreign-denominated securities. Gains and losses from these transactions may arise from changes in the value of the foreign currency or if the counterparties do not perform under the contracts' terms.
Foreign-denominated assets, including investment securities, and liabilities are translated into U.S. dollars at the exchange rates at period end. Purchases and sales of investment securities, income and dividends received and expenses denominated in foreign currencies are translated into U.S. dollars at the exchange rate in effect on the transaction date.
The effects of exchange rate fluctuations on investments are included with the net realized and unrealized gain (loss) on investment securities. Other foreign currency transactions resulting in realized and unrealized gain (loss) are disclosed separately.
Investment Transactions and Income. For financial reporting purposes, the Fund's investment holdings and NAV include trades executed through the end of the last business day of the period. The NAV per share for processing shareholder transactions is calculated as of the close of business of the New York Stock Exchange (NYSE), normally 4:00 p.m. Eastern time and includes trades executed through the end of the prior business day. Gains and losses on securities sold are determined on the basis of identified cost and may include proceeds received from litigation. Dividend income is recorded on the ex-dividend date, except for certain dividends from foreign securities where the ex-dividend date may have passed, which are recorded as soon as the Fund is informed of the ex-dividend date. Non-cash dividends included in dividend income, if any, are recorded at the fair market value of the securities received. Income and capital gain distributions from Fidelity Central Funds, if any, are recorded on the ex-dividend date. Distributions received on securities that represent a return of capital or capital gain are recorded as a reduction of cost of investments and/or as a realized gain. Subsequent to ex-dividend date the Fund determines the components of these distributions, based upon receipt of tax filings or other correspondence relating to the underlying investment. Interest income is accrued as earned and includes coupon interest and amortization of premium and accretion of discount on debt securities as applicable. Investment income is recorded net of foreign taxes withheld where recovery of such taxes is uncertain.
Class Allocations and Expenses. Investment income, realized and unrealized capital gains and losses, common expenses of the Fund, and certain fund-level expense reductions, if any, are allocated daily on a pro-rata basis to each class based on the relative net assets of each class to the total net assets of the Fund. Each class differs with respect to transfer agent fees incurred. Certain expense reductions may also differ by class. For the reporting period, the allocated portion of income and expenses to each class as a percent of its average net assets may vary due to the timing of recording these transactions in relation to fluctuating net assets of the classes. Expenses directly attributable to a fund are charged to that fund. Expenses attributable to more than one fund are allocated among the respective funds on the basis of relative net assets or other appropriate methods. Expense estimates are accrued in the period to which they relate and adjustments are made when actual amounts are known.
Deferred Trustee Compensation. Under a Deferred Compensation Plan (the Plan), independent Trustees may elect to defer receipt of a portion of their annual compensation. Deferred amounts are invested in a cross-section of Fidelity funds, are marked-to-market and remain in the Fund until distributed in accordance with the Plan. The investment of deferred amounts and the offsetting payable to the Trustees are included in the accompanying Statement of Assets and Liabilities.
Income Tax Information and Distributions to Shareholders. Each year, the Fund intends to qualify as a regulated investment company under Subchapter M of the Internal Revenue Code, including distributing substantially all of its taxable income and realized gains. As a result, no provision for U.S. Federal income taxes is required. As of July 31, 2016, the Fund did not have any unrecognized tax benefits in the financial statements; nor is the Fund aware of any tax positions for which it is reasonably possible that the total amounts of unrecognized tax benefits will significantly change in the next twelve months. The Fund files a U.S. federal tax return, in addition to state and local tax returns as required. The Fund's federal income tax returns are subject to examination by the Internal Revenue Service (IRS) for a period of three fiscal years after they are filed. State and local tax returns may be subject to examination for an additional fiscal year depending on the jurisdiction. Foreign taxes are provided for based on the Fund's understanding of the tax rules and rates that exist in the foreign markets in which it invests.
Distributions are declared and recorded on the ex-dividend date. Income dividends and capital gain distributions are declared separately for each class. Income and capital gain distributions are determined in accordance with income tax regulations, which may differ from GAAP. In addition, the Fund claimed a portion of the payment made to redeeming shareholders as a distribution for income tax purposes.
Capital accounts within the financial statements are adjusted for permanent book-tax differences. These adjustments have no impact on net assets or the results of operations. Capital accounts are not adjusted for temporary book-tax differences which will reverse in a subsequent period.
Book-tax differences are primarily due to foreign currency transactions, partnerships, deferred trustees compensation and losses deferred due to wash sales and excise tax regulations.
The federal tax cost of investment securities and unrealized appreciation (depreciation) as of period end were as follows:
| Gross unrealized appreciation | $1,606,185 |
| Gross unrealized depreciation | (195,351) |
| Net unrealized appreciation (depreciation) on securities | $1,410,834 |
| Tax Cost | $6,143,672 |
The tax-based components of distributable earnings as of period end were as follows:
| Undistributed ordinary income | $64,926 |
| Net unrealized appreciation (depreciation) on securities and other investments | $1,410,808 |
The tax character of distributions paid was as follows:
| | July 31, 2016 | July 31, 2015 |
| Ordinary Income | $124,272 | $ 247,357 |
| Long-term Capital Gains | 563,975 | 1,144,542 |
| Total | $688,247 | $ 1,391,899 |
The Fund intends to elect to defer to its next fiscal year $125,394,187 of capital losses recognized during the period November 1, 2015 to July 31, 2016.
Restricted Securities. The Fund may invest in securities that are subject to legal or contractual restrictions on resale. These securities generally may be resold in transactions exempt from registration or to the public if the securities are registered. Disposal of these securities may involve time-consuming negotiations and expense, and prompt sale at an acceptable price may be difficult. Information regarding restricted securities is included at the end of the Fund's Schedule of Investments.
4. Purchases and Sales of Investments.
Purchases and sales of securities, other than short-term securities, aggregated $2,174,142 and $3,145,373, respectively.
5. Fees and Other Transactions with Affiliates.
Management Fee. Fidelity Management & Research Company (the investment adviser) and its affiliates provide the Fund with investment management related services for which the Fund pays a monthly management fee. The management fee is the sum of an individual fund fee rate that is based on an annual rate of .30% of the Fund's average net assets and an annualized group fee rate that averaged .25% during the period. The group fee rate is based upon the average net assets of all the mutual funds advised by the investment adviser, including any mutual funds previously advised by the investment adviser that are currently advised by Fidelity SelectCo, LLC, an affiliate of the investment adviser. The group fee rate decreases as assets under management increase and increases as assets under management decrease. In addition, the management fee is subject to a performance adjustment (up to a maximum of +/- .20% of the Fund's average net assets over a 36 month performance period). The upward or downward adjustment to the management fee is based on the relative investment performance of Dividend Growth as compared to its benchmark index, the S&P 500 Index, over the same 36 month performance period. For the reporting period, the total annual management fee rate, including the performance adjustment, was .43% of the Fund's average net assets. The performance adjustment included in the management fee rate may be higher or lower than the maximum performance adjustment rate due to the difference between the average net assets for the reporting and performance periods.
Transfer Agent Fees. Fidelity Investments Institutional Operations Company, Inc., (FIIOC), an affiliate of the investment adviser, is the transfer, dividend disbursing and shareholder servicing agent for each class of the Fund. FIIOC receives account fees and asset-based fees that vary according to the account size and type of account of the shareholders of Dividend Growth, except for Class K. FIIOC receives an asset-based fee of Class K's average net assets. FIIOC pays for typesetting, printing and mailing of shareholder reports, except proxy statements.
For the period, transfer agent fees for each class were as follows:
| | Amount | % of
Class-Level Average
Net Assets |
| Dividend Growth | $9,721 | .17 |
| Class K | 803 | .05 |
| | $10,524 | |
Accounting and Security Lending Fees. Fidelity Service Company, Inc. (FSC), an affiliate of the investment adviser, maintains the Fund's accounting records. The accounting fee is based on the level of average net assets for each month. Under a separate contract, FSC administers the security lending program. The security lending fee is based on the number and duration of lending transactions.
Brokerage Commissions. The Fund placed a portion of its portfolio transactions with brokerage firms which are affiliates of the investment adviser. Brokerage commissions are included in net realized gain (loss) and change in net unrealized appreciation (depreciation) in the Statement of Operations. The commissions paid to these affiliated firms were $65 for the period.
Interfund Trades. The Fund may purchase from or sell securities to other Fidelity Funds under procedures adopted by the Board. The procedures have been designed to ensure these interfund trades are executed in accordance with Rule 17a-7 of the 1940 Act. Interfund trades are included within the respective purchases and sales amounts shown in the Purchases and Sales of Investments note.
6. Committed Line of Credit.
The Fund participates with other funds managed by the investment adviser or an affiliate in a $4.25 billion credit facility (the "line of credit") to be utilized for temporary or emergency purposes to fund shareholder redemptions or for other short-term liquidity purposes. The Fund has agreed to pay commitment fees on its pro-rata portion of the line of credit, which amounted to $16 and is reflected in Miscellaneous expenses on the Statement of Operations. During the period, the Fund did not borrow on this line of credit.
7. Security Lending.
The Fund lends portfolio securities through a lending agent from time to time in order to earn additional income. For equity securities, a lending agent is used and may loan securities to certain qualified borrowers, including Fidelity Capital Markets (FCM), a broker-dealer affiliated with the Fund. On the settlement date of the loan, the Fund receives collateral (in the form of U.S. Treasury obligations, letters of credit and/or cash) against the loaned securities and maintains collateral in an amount not less than 100% of the market value of the loaned securities during the period of the loan. The market value of the loaned securities is determined at the close of business of the Fund and any additional required collateral is delivered to the Fund on the next business day. The Fund or borrower may terminate the loan at any time, and if the borrower defaults on its obligation to return the securities loaned because of insolvency or other reasons, the Fund may apply collateral received from the borrower against the obligation. The Fund may experience delays and costs in recovering the securities loaned. Any cash collateral received is invested in the Fidelity Securities Lending Cash Central Fund. The value of loaned securities and cash collateral at period end are disclosed on the Fund's Statement of Assets and Liabilities. Security lending income represents the income earned on investing cash collateral, less rebates paid to borrowers and any lending agent fees associated with the loan, plus any premium payments received for lending certain types of securities. Security lending income is presented in the Statement of Operations as a component of income from Fidelity Central Funds. Total security lending income during the period amounted to $292, including $2 from securities loaned to FCM.
8. Expense Reductions.
Commissions paid to certain brokers with whom the investment adviser, or its affiliates, places trades on behalf of the Fund include an amount in addition to trade execution, which may be rebated back to the Fund to offset certain expenses. This amount totaled $123 for the period. In addition, through arrangements with the Fund's custodian, credits realized as a result of certain uninvested cash balances were used to reduce the Fund's expenses. During the period, these credits reduced the Fund's custody expenses by $1.
In addition, during the period the investment adviser reimbursed and/or waived a portion of fund-level operating expenses in the amount of $56.
9. Distributions to Shareholders.
Distributions to shareholders of each class were as follows:
| | Year ended
July 31, 2016 | Year ended July 31, 2015 |
| From net investment income | | |
| Dividend Growth | $88,523 | $92,079 |
| Class K | 28,359 | 32,054 |
| Total | $116,882 | $124,133 |
| From net realized gain | | |
| Dividend Growth | $440,809 | $962,404 |
| Class K | 130,556 | 305,362 |
| Total | $571,365 | $1,267,766 |
10. Share Transactions.
Share transactions for each class were as follows and may contain automatic conversions between classes or exchanges between affiliated funds:
| | Shares | Shares | Dollars | Dollars |
| | Year ended
July 31, 2016 | Year ended July 31, 2015 | Year ended
July 31, 2016 | Year ended July 31, 2015 |
| Dividend Growth | | | | |
| Shares sold | 8,324 | 10,859 | $252,613 | $370,250 |
| Reinvestment of distributions | 17,089 | 30,298 | 505,767 | 1,009,516 |
| Shares redeemed | (27,683) | (27,183) | (840,281) | (929,933) |
| Net increase (decrease) | (2,270) | 13,974 | $(81,901) | $449,833 |
| Class K | | | | |
| Shares sold | 8,991 | 9,521 | $272,632 | $325,624 |
| Reinvestment of distributions | 5,375 | 10,135 | 158,915 | 337,416 |
| Shares redeemed | (17,065) | (18,467) | (516,359) | (633,706) |
| Net increase (decrease) | (2,699) | 1,189 | $(84,812) | $29,334 |
11. Other.
The Fund's organizational documents provide former and current trustees and officers with a limited indemnification against liabilities arising in connection with the performance of their duties to the Fund. In the normal course of business, the Fund may also enter into contracts that provide general indemnifications. The Fund's maximum exposure under these arrangements is unknown as this would be dependent on future claims that may be made against the Fund. The risk of material loss from such claims is considered remote.
Report of Independent Registered Public Accounting Firm
To the Trustees of Fidelity Securities Fund and Shareholders of Fidelity Dividend Growth Fund:
In our opinion, the accompanying statement of assets and liabilities, including the schedule of investments, and the related statements of operations and of changes in net assets and the financial highlights present fairly, in all material respects, the financial position of Fidelity Dividend Growth Fund (a fund of Fidelity Securities Fund) at July 31, 2016, the results of its operations for the year then ended, the changes in its net assets for each of the two years in the period then ended and the financial highlights for each of the five years in the period then ended, in conformity with accounting principles generally accepted in the United States of America. These financial statements and financial highlights (hereafter referred to as “financial statements”) are the responsibility of the Fidelity Dividend Growth Fund’s management. Our responsibility is to express an opinion on these financial statements based on our audits. We conducted our audits of these financial statements in accordance with the standards of the Public Company Accounting Oversight Board (United States). Those standards require that we plan and perform the audit to obtain reasonable assurance about whether the financial statements are free of material misstatement. An audit includes examining, on a test basis, evidence supporting the amounts and disclosures in the financial statements, assessing the accounting principles used and significant estimates made by management, and evaluating the overall financial statement presentation. We believe that our audits, which included confirmation of securities at July 31, 2016 by correspondence with the custodian and brokers, provide a reasonable basis for our opinion.
PricewaterhouseCoopers LLP
Boston, Massachusetts
September 19, 2016
Trustees and Officers
The Trustees, Members of the Advisory Board (if any), and officers of the trust and fund, as applicable, are listed below. The Board of Trustees governs the fund and is responsible for protecting the interests of shareholders. The Trustees are experienced executives who meet periodically throughout the year to oversee the fund's activities, review contractual arrangements with companies that provide services to the fund, oversee management of the risks associated with such activities and contractual arrangements, and review the fund's performance. Each of the Trustees oversees 170 funds.
The Trustees hold office without limit in time except that (a) any Trustee may resign; (b) any Trustee may be removed by written instrument, signed by at least two-thirds of the number of Trustees prior to such removal; (c) any Trustee who requests to be retired or who has become incapacitated by illness or injury may be retired by written instrument signed by a majority of the other Trustees; and (d) any Trustee may be removed at any special meeting of shareholders by a two-thirds vote of the outstanding voting securities of the trust. Each Trustee who is not an interested person (as defined in the 1940 Act) of the trust and the fund is referred to herein as an Independent Trustee. Each Independent Trustee shall retire not later than the last day of the calendar year in which his or her 75th birthday occurs. The Independent Trustees may waive this mandatory retirement age policy with respect to individual Trustees. Officers and Advisory Board Members hold office without limit in time, except that any officer or Advisory Board Member may resign or may be removed by a vote of a majority of the Trustees at any regular meeting or any special meeting of the Trustees. Except as indicated, each individual has held the office shown or other offices in the same company for the past five years.
The fund’s Statement of Additional Information (SAI) includes more information about the Trustees. To request a free copy, call Fidelity at 1-800-835-5092.
Experience, Skills, Attributes, and Qualifications of the Trustees. The Governance and Nominating Committee has adopted a statement of policy that describes the experience, qualifications, attributes, and skills that are necessary and desirable for potential Independent Trustee candidates (Statement of Policy). The Board believes that each Trustee satisfied at the time he or she was initially elected or appointed a Trustee, and continues to satisfy, the standards contemplated by the Statement of Policy. The Governance and Nominating Committee also engages professional search firms to help identify potential Independent Trustee candidates who have the experience, qualifications, attributes, and skills consistent with the Statement of Policy. From time to time, additional criteria based on the composition and skills of the current Independent Trustees, as well as experience or skills that may be appropriate in light of future changes to board composition, business conditions, and regulatory or other developments, have also been considered by the professional search firms and the Governance and Nominating Committee. In addition, the Board takes into account the Trustees' commitment and participation in Board and committee meetings, as well as their leadership of standing and ad hoc committees throughout their tenure.
In determining that a particular Trustee was and continues to be qualified to serve as a Trustee, the Board has considered a variety of criteria, none of which, in isolation, was controlling. The Board believes that, collectively, the Trustees have balanced and diverse experience, qualifications, attributes, and skills, which allow the Board to operate effectively in governing the fund and protecting the interests of shareholders. Information about the specific experience, skills, attributes, and qualifications of each Trustee, which in each case led to the Board's conclusion that the Trustee should serve (or continue to serve) as a trustee of the fund, is provided below.
Board Structure and Oversight Function. James C. Curvey is an interested person and currently serves as Chairman. The Trustees have determined that an interested Chairman is appropriate and benefits shareholders because an interested Chairman has a personal and professional stake in the quality and continuity of services provided to the fund. Independent Trustees exercise their informed business judgment to appoint an individual of their choosing to serve as Chairman, regardless of whether the Trustee happens to be independent or a member of management. The Independent Trustees have determined that they can act independently and effectively without having an Independent Trustee serve as Chairman and that a key structural component for assuring that they are in a position to do so is for the Independent Trustees to constitute a substantial majority for the Board. The Independent Trustees also regularly meet in executive session. Ned C. Lautenbach serves as Chairman of the Independent Trustees and as such (i) acts as a liaison between the Independent Trustees and management with respect to matters important to the Independent Trustees and (ii) with management prepares agendas for Board meetings.
Fidelity® funds are overseen by different Boards of Trustees. The fund's Board oversees Fidelity's high income and certain equity funds, and other Boards oversee Fidelity's investment-grade bond, money market, asset allocation, and sector funds. The asset allocation funds may invest in Fidelity® funds overseen by the fund's Board. The use of separate Boards, each with its own committee structure, allows the Trustees of each group of Fidelity® funds to focus on the unique issues of the funds they oversee, including common research, investment, and operational issues. On occasion, the separate Boards establish joint committees to address issues of overlapping consequences for the Fidelity® funds overseen by each Board.
The Trustees operate using a system of committees to facilitate the timely and efficient consideration of all matters of importance to the Trustees, the fund, and fund shareholders and to facilitate compliance with legal and regulatory requirements and oversight of the fund's activities and associated risks. The Board, acting through its committees, has charged FMR and its affiliates with (i) identifying events or circumstances the occurrence of which could have demonstrably adverse effects on the fund's business and/or reputation; (ii) implementing processes and controls to lessen the possibility that such events or circumstances occur or to mitigate the effects of such events or circumstances if they do occur; and (iii) creating and maintaining a system designed to evaluate continuously business and market conditions in order to facilitate the identification and implementation processes described in (i) and (ii) above. Because the day-to-day operations and activities of the fund are carried out by or through FMR, its affiliates, and other service providers, the fund's exposure to risks is mitigated but not eliminated by the processes overseen by the Trustees. While each of the Board's committees has responsibility for overseeing different aspects of the fund's activities, oversight is exercised primarily through the Operations, Audit, and Compliance Committees. In addition, the Independent Trustees have worked with FMR to enhance the Board's oversight of investment and financial risks, legal and regulatory risks, technology risks, and operational risks, including the development of additional risk reporting to the Board. For example, a working group comprised of Independent Trustees and FMR has worked and continues to work to review the Fidelity® funds' valuation-related activities, reporting and risk management. Appropriate personnel, including but not limited to the fund's Chief Compliance Officer (CCO), FMR's internal auditor, the independent accountants, the fund's Treasurer and portfolio management personnel, make periodic reports to the Board's committees, as appropriate, including an annual review of Fidelity's risk management program for the Fidelity® funds. The responsibilities of each standing committee, including their oversight responsibilities, are described further under "Standing Committees of the Trustees."
Interested Trustees*:
Correspondence intended for a Trustee who is an interested person may be sent to Fidelity Investments, 245 Summer Street, Boston, Massachusetts 02210.
Name, Year of Birth; Principal Occupations and Other Relevant Experience+
James C. Curvey (1935)
Year of Election or Appointment: 2007
Trustee
Chairman of the Board of Trustees
Mr. Curvey also serves as Trustee of other Fidelity® funds. Mr. Curvey is a Director of Fidelity Research & Analysis Co. (investment adviser firm, 2009-present), and Vice Chairman (2007-present) and Director of FMR LLC (diversified financial services company). In addition, Mr. Curvey serves as an Overseer for the Boston Symphony Orchestra and a member of the board of Artis-Naples, Naples, Florida, and as a Trustee for Brewster Academy, Wolfeboro, New Hampshire. Previously, Mr. Curvey served as a Director of Fidelity Investments Money Management, Inc. (investment adviser firm, 2009-2014) and a Director of FMR and FMR Co., Inc. (investment adviser firms, 2007-2014).
Charles S. Morrison (1960)
Year of Election or Appointment: 2014
Trustee
Mr. Morrison also serves as Trustee of other funds. He serves as a Director of Fidelity Investments Money Management, Inc. (FIMM) (investment adviser firm, 2014-present), Director of Fidelity SelectCo, LLC (investment adviser firm, 2014-present), President, Asset Management (2014-present), and is an employee of Fidelity Investments. Previously, Mr. Morrison served as Vice President of Fidelity's Fixed Income and Asset Allocation Funds (2012-2014), President, Fixed Income (2011-2014), Vice President of Fidelity's Money Market Funds (2005-2009), President, Money Market Group Leader of FMR (investment adviser firm, 2009), and Senior Vice President, Money Market Group of FMR (2004-2009). Mr. Morrison also served as Vice President of Fidelity's Bond Funds (2002-2005), certain Balanced Funds (2002-2005), and certain Asset Allocation Funds (2002-2007), and as Senior Vice President (2002-2005) of Fidelity's Bond Division.
* Determined to be an “Interested Trustee” by virtue of, among other things, his or her affiliation with the trust or various entities under common control with FMR.
+ The information includes the Trustee's principal occupation during the last five years and other information relating to the experience, attributes, and skills relevant to the Trustee's qualifications to serve as a Trustee, which led to the conclusion that the Trustee should serve as a Trustee for the fund.
Independent Trustees:
Correspondence intended for an Independent Trustee may be sent to Fidelity Investments, P.O. Box 55235, Boston, Massachusetts 02205-5235.
Name, Year of Birth; Principal Occupations and Other Relevant Experience+
Dennis J. Dirks (1948)
Year of Election or Appointment: 2005
Trustee
Mr. Dirks also serves as Trustee of other Fidelity® funds. Prior to his retirement in May 2003, Mr. Dirks was Chief Operating Officer and a member of the Board of The Depository Trust & Clearing Corporation (DTCC). He also served as President, Chief Operating Officer, and Board member of The Depository Trust Company (DTC) and President and Board member of the National Securities Clearing Corporation (NSCC). In addition, Mr. Dirks served as Chief Executive Officer and Board member of the Government Securities Clearing Corporation, Chief Executive Officer and Board member of the Mortgage-Backed Securities Clearing Corporation, as a Trustee and a member of the Finance Committee of Manhattan College (2005-2008), as a Trustee and a member of the Finance Committee of AHRC of Nassau County (2006-2008), and as a member of the Independent Directors Council (IDC) Governing Council (2010-2015). Mr. Dirks is a member of the Board of Directors for The Brookville Center for Children's Services, Inc. (2009-present).
Alan J. Lacy (1953)
Year of Election or Appointment: 2008
Trustee
Mr. Lacy also serves as Trustee of other Fidelity® funds. Mr. Lacy serves as Chairman (2014-present) and a member (2010-present) of the Board of Directors of Dave & Buster's Entertainment, Inc. (restaurant and entertainment complexes) and a Director of Bristol-Myers Squibb Company (global pharmaceuticals, 2008-present). He is a Trustee of the California Chapter of The Nature Conservancy (2015-present) and a Director of the Center for Advanced Study in the Behavioral Sciences at Stanford University (2015-present). In addition, Mr. Lacy served as Senior Adviser (2007-2014) of Oak Hill Capital Partners, L.P. (private equity) and also served as Chief Executive Officer (2005) and Vice Chairman (2005-2006) of Sears Holdings Corporation (retail) and Chief Executive Officer and Chairman of the Board of Sears, Roebuck and Co. (retail, 2000-2005). Previously, Mr. Lacy served as Chairman (2008-2011) and a member (2006-2015) of the Board of Trustees of the National Parks Conservation Association and as a member of the Board of Directors for The Western Union Company (global money transfer, 2006-2011), The Hillman Companies, Inc. (hardware wholesalers, 2010-2014), and Earth Fare, Inc. (retail grocery, 2010-2014).
Ned C. Lautenbach (1944)
Year of Election or Appointment: 2000
Trustee
Chairman of the Independent Trustees
Mr. Lautenbach also serves as Trustee of other Fidelity® funds. Mr. Lautenbach currently serves as the Lead Director of the Eaton Corporation Board of Directors (diversified industrial, 1997-present). Mr. Lautenbach is Chairman of the Board of Directors of Artis-Naples in Naples, Florida (2012-present), a member of the Council on Foreign Relations (1994-present), and a member of the Board of Governors, State University System of Florida (2013-present). Previously, Mr. Lautenbach was a Partner/Advisory Partner at Clayton, Dubilier & Rice, LLC (private equity investment, 1998-2010), as well as a Director of Sony Corporation (2006-2007).
Joseph Mauriello (1944)
Year of Election or Appointment: 2008
Trustee
Mr. Mauriello also serves as Trustee of other Fidelity® funds. Prior to his retirement in January 2006, Mr. Mauriello served in numerous senior management positions including Deputy Chairman and Chief Operating Officer (2004-2005), and Vice Chairman of Financial Services (2002-2004) of KPMG LLP US (professional services, 1965-2005). Mr. Mauriello currently serves as a member of the Board of Directors of XL Group plc. (global insurance and re-insurance, 2006-present) and the Independent Directors Council (IDC) Governing Council (2015-present). Previously, Mr. Mauriello served as a Director of the Hamilton Funds of the Bank of New York (2006-2007) and of Arcadia Resources Inc. (health care services and products, 2007-2012).
Robert W. Selander (1950)
Year of Election or Appointment: 2011
Trustee
Mr. Selander also serves as Trustee of other Fidelity® funds. Mr. Selander serves as a Director of The Western Union Company (global money transfer, 2014-present) and a non-executive Chairman of Health Equity, Inc. (health savings custodian, 2015-present). Previously, Mr. Selander served as a Member of the Advisory Board of certain Fidelity® funds (2011), and Executive Vice Chairman (2010), Chief Executive Officer (2009-2010), and President and Chief Executive Officer (1997-2009) of Mastercard, Inc.
Cornelia M. Small (1944)
Year of Election or Appointment: 2005
Trustee
Ms. Small also serves as Trustee of other Fidelity® funds. Ms. Small is a member of the Board of Directors (2009-present) and Chair of the Investment Committee (2010-present) of the Teagle Foundation. Ms. Small also serves on the Investment Committee of the Berkshire Taconic Community Foundation (2008-present). Previously, Ms. Small served as Chairperson (2002-2008) and a member of the Investment Committee and Chairperson (2008-2012) and a member of the Board of Trustees of Smith College. In addition, Ms. Small served as Chief Investment Officer, Director of Global Equity Investments, and a member of the Board of Directors of Scudder, Stevens & Clark and Scudder Kemper Investments.
William S. Stavropoulos (1939)
Year of Election or Appointment: 2002
Trustee
Vice Chairman of the Independent Trustees
Mr. Stavropoulos also serves as Trustee of other Fidelity® funds. Mr. Stavropoulos serves as President and Founder of the Michigan Baseball Foundation, the Great Lakes Loons (2007-present). Mr. Stavropoulos is Chairman Emeritus of the Board of Directors of The Dow Chemical Company, where he previously served in numerous senior management positions, including President, CEO (1995-2000; 2002-2004), Chairman of the Executive Committee (2000-2006), and as a member of the Board of Directors (1990-2006). Currently, Mr. Stavropoulos is Chairman of the Board of Directors of Univar Inc. (global distributor of commodity and specialty chemicals), a Director of Teradata Corporation (data warehousing and technology solutions), and Maersk Inc. (industrial conglomerate), and a member of the Advisory Board for Metalmark Capital LLC (private equity investment, 2005-present). Mr. Stavropoulos is an operating advisor to Clayton, Dubilier & Rice, LLC (private equity investment). In addition, Mr. Stavropoulos is a member of the University of Notre Dame Advisory Council for the College of Science, a Trustee of the Rollin L. Gerstacker Foundation, and a Director of the Naples Philharmonic Center for the Arts. Previously, Mr. Stavropoulos served as a Director of Chemical Financial Corporation (bank holding company, 1993-2012) and Tyco International, Ltd. (multinational manufacturing and services, 2007-2012).
David M. Thomas (1949)
Year of Election or Appointment: 2008
Trustee
Mr. Thomas also serves as Trustee of other Fidelity® funds. Mr. Thomas serves as Non-Executive Chairman of the Board of Directors of Fortune Brands Home and Security (home and security products, 2011-present), as a member of the Board of Directors (2004-present) and Presiding Director (2013-present) of Interpublic Group of Companies, Inc. (marketing communication), and as a member of the Board of Trustees of the University of Florida (2013-present). Previously, Mr. Thomas served as Executive Chairman (2005-2006) and Chairman and Chief Executive Officer (2000-2005) of IMS Health, Inc. (pharmaceutical and healthcare information solutions), and a Director of Fortune Brands, Inc. (consumer products, 2000-2011).
+ The information includes the Trustee's principal occupation during the last five years and other information relating to the experience, attributes, and skills relevant to the Trustee's qualifications to serve as a Trustee, which led to the conclusion that the Trustee should serve as a Trustee for the fund.
Advisory Board Members and Officers:
Correspondence intended for an officer or Peter S. Lynch may be sent to Fidelity Investments, 245 Summer Street, Boston, Massachusetts 02210. Officers appear below in alphabetical order.
Name, Year of Birth; Principal Occupation
Peter S. Lynch (1944)
Year of Election or Appointment: 2003
Member of the Advisory Board
Mr. Lynch also serves as Member of the Advisory Board of other Fidelity® funds. Mr. Lynch is Vice Chairman and a Director of FMR (investment adviser firm) and FMR Co., Inc. (investment adviser firm). In addition, Mr. Lynch serves as a Trustee of Boston College and as the Chairman of the Inner-City Scholarship Fund. Previously, Mr. Lynch served on the Special Olympics International Board of Directors (1997-2006).
Marc R. Bryant (1966)
Year of Election or Appointment: 2015
Secretary and Chief Legal Officer (CLO)
Mr. Bryant also serves as Secretary and CLO of other funds. Mr. Bryant serves as CLO, Secretary, and Senior Vice President of Fidelity Management & Research Company (investment adviser firm, 2015-present) and FMR Co., Inc. (investment adviser firm, 2015-present); Secretary of Fidelity SelectCo, LLC (investment adviser firm, 2015-present) and Fidelity Investments Money Management, Inc. (investment adviser firm, 2015-present); and CLO of Fidelity Management & Research (Hong Kong) Limited and FMR Investment Management (U.K.) Limited (investment adviser firms, 2015-present) and Fidelity Management & Research (Japan) Limited (investment adviser firm, 2016-present). He is Senior Vice President and Deputy General Counsel of FMR LLC (diversified financial services company). Previously, Mr. Bryant served as Secretary and CLO of Fidelity Rutland Square Trust II (2010-2014) and Assistant Secretary of Fidelity's Fixed Income and Asset Allocation Funds (2013-2015). Prior to joining Fidelity Investments, Mr. Bryant served as a Senior Vice President and the Head of Global Retail Legal for AllianceBernstein L.P. (2006-2010), and as the General Counsel for ProFund Advisors LLC (2001-2006).
Jeffrey S. Christian (1961)
Year of Election or Appointment: 2016
Assistant Treasurer
Mr. Christian also serves as Assistant Treasurer of other funds. Mr. Christian is an employee of Fidelity Investments (2003-present).
William C. Coffey (1969)
Year of Election or Appointment: 2009
Assistant Secretary
Mr. Coffey also serves as Assistant Secretary of other funds. He is Senior Vice President and Deputy General Counsel of FMR LLC (diversified financial services company, 2010-present), and is an employee of Fidelity Investments. Previously, Mr. Coffey served as Vice President and Associate General Counsel of FMR LLC (2005-2009).
Jonathan Davis (1968)
Year of Election or Appointment: 2010
Assistant Treasurer
Mr. Davis also serves as Assistant Treasurer of other funds, and is an employee of Fidelity Investments. Previously, Mr. Davis served as Vice President and Associate General Counsel of FMR LLC (diversified financial services company, 2003-2010).
Adrien E. Deberghes (1967)
Year of Election or Appointment: 2016
Assistant Treasurer
Mr. Deberghes also serves as an officer of other funds. He serves as Executive Vice President of Fidelity Investments Money Management, Inc. (FIMM) (investment adviser firm, 2016-present) and is an employee of Fidelity Investments (2008-present). Prior to joining Fidelity Investments, Mr. Deberghes was Senior Vice President of Mutual Fund Administration at State Street Corporation (2007-2008), Senior Director of Mutual Fund Administration at Investors Bank & Trust (2005-2007), and Director of Finance for Dunkin' Brands (2000-2005). Previously, Mr. Deberghes served in other fund officer roles.
Stephanie J. Dorsey (1969)
Year of Election or Appointment: 2010
Assistant Treasurer
Ms. Dorsey also serves as an officer of other funds. She is an employee of Fidelity Investments (2008-present) and has served in other fund officer roles. Prior to joining Fidelity Investments, Ms. Dorsey served as Treasurer (2004-2008) of the JPMorgan Mutual Funds and Vice President (2004-2008) of JPMorgan Chase Bank.
Howard J. Galligan III (1966)
Year of Election or Appointment: 2014
Chief Financial Officer
Mr. Galligan also serves as Chief Financial Officer of other funds. Mr. Galligan serves as President of Fidelity Pricing and Cash Management Services (FPCMS) (2014-present) and as a Director of Strategic Advisers, Inc. (investment adviser firm, 2008-present). Previously, Mr. Galligan served as Chief Administrative Officer of Asset Management (2011-2014) and Chief Operating Officer and Senior Vice President of Investment Support for Strategic Advisers, Inc. (2003-2011).
Scott C. Goebel (1968)
Year of Election or Appointment: 2015
Vice President
Mr. Goebel serves as Vice President of other funds and is an employee of Fidelity Investments (2001-present). Mr. Goebel serves as Senior Vice President of Fidelity Management & Research Company (FMR) (investment adviser firm, 2016-present). Previously, Mr. Goebel served as Secretary of Fidelity SelectCo, LLC (investment adviser firm, 2013-2015), Fidelity Investments Money Management, Inc. (FIMM) (investment adviser firm, 2010-2015), and Fidelity Research and Analysis Company (FRAC) (investment adviser firm, 2010-2015); General Counsel, Secretary, and Senior Vice President of FMR (investment adviser firm, 2008-2015) and FMR Co., Inc. (investment adviser firm, 2008-2015); Assistant Secretary of Fidelity Management & Research (Japan) Limited (investment adviser firm, 2008-2015) and Fidelity Management & Research (U.K.) Inc. (investment adviser firm, 2008-2015); Chief Legal Officer (CLO) of Fidelity Management & Research (Hong Kong) Limited (investment adviser firm, 2008-2015); Secretary and CLO of certain Fidelity® funds (2008-2015); Assistant Secretary of FIMM (2008-2010), FRAC (2008-2010), and certain funds (2007-2008); and as Vice President and Secretary of Fidelity Distributors Corporation (FDC) (2005-2007).
Thomas C. Hense (1964)
Year of Election or Appointment: 2008, 2010, or 2015
Vice President
Mr. Hense serves as Vice President of Fidelity Advisor® Multi-Asset Income Fund (2015) and other funds (High Income (2008), Small Cap (2008), and Value (2010) funds), and is an employee of Fidelity Investments (1993-present). Previously, Mr. Hense served as a portfolio manager for Fidelity's Institutional Money Management Group (Pyramis) (2003-2008).
Brian B. Hogan (1964)
Year of Election or Appointment: 2009
Vice President
Mr. Hogan also serves as Trustee or Vice President of other funds. Mr. Hogan serves as a Director of FMR Investment Management (U.K.) Limited (investment adviser firm, 2015-present) and Fidelity SelectCo, LLC (investment adviser firm, 2014-present) and President of the Equity Division of FMR (investment adviser firm, 2009-present). Previously, Mr. Hogan served as Senior Vice President, Equity Research of FMR (2006-2009) and as a portfolio manager. Mr. Brian B. Hogan is not related to Mr. Colm A. Hogan.
Colm A. Hogan (1973)
Year of Election or Appointment: 2016
Deputy Treasurer
Mr. Hogan also serves as an officer of other funds. Mr. Hogan is an employee of Fidelity Investments (2005-present). Mr. Colm A. Hogan is not related to Mr. Brian B. Hogan.
Chris Maher (1972)
Year of Election or Appointment: 2013
Assistant Treasurer
Mr. Maher serves as Assistant Treasurer of other funds. Mr. Maher is Vice President of Valuation Oversight and is an employee of Fidelity Investments. Previously, Mr. Maher served as Vice President of Asset Management Compliance (2013), Vice President of the Program Management Group of FMR (investment adviser firm, 2010-2013), and Vice President of Valuation Oversight (2008-2010).
John F. Papandrea (1972)
Year of Election or Appointment: 2016
Anti-Money Laundering (AML) Officer
Mr. Papandrea also serves as AML Officer of other funds. Mr. Papandrea is Vice President of FMR LLC (diversified financial services company, 2008-present) and is an employee of Fidelity Investments (2005-present).
Kenneth B. Robins (1969)
Year of Election or Appointment: 2016
Chief Compliance Officer
Mr. Robins also serves as an officer of other funds. Mr. Robins serves as Compliance Officer of Fidelity Management & Research Company and FMR Co., Inc. (investment adviser firms, 2016-present) and is an employee of Fidelity Investments (2004-present). Previously, Mr. Robins served as Executive Vice President of Fidelity Investments Money Management, Inc. (investment adviser firm, 2013-2016) and served in other fund officer roles.
Stacie M. Smith (1974)
Year of Election or Appointment: 2016
President and Treasurer
Ms. Smith also serves as an officer of other funds. She is an employee of Fidelity Investments (2009-present) and has served in other fund officer roles. Prior to joining Fidelity Investments, Ms. Smith served as Senior Audit Manager of Ernst & Young LLP (1996-2009). Previously, Ms. Smith served as Deputy Treasurer of certain Fidelity® funds (2013-2016).
Renee Stagnone (1975)
Year of Election or Appointment: 2016
Assistant Treasurer
Ms. Stagnone also serves as an officer of other funds. Ms. Stagnone is an employee of Fidelity Investments (1997-present). Previously, Ms. Stagnone served as Deputy Treasurer of certain Fidelity® funds (2013-2016).
Shareholder Expense Example
As a shareholder of the Fund, you incur two types of costs: (1) transaction costs, and (2) ongoing costs, including management fees and other Fund expenses. This Example is intended to help you understand your ongoing costs (in dollars) of investing in the Fund and to compare these costs with the ongoing costs of investing in other mutual funds.
The Example is based on an investment of $1,000 invested at the beginning of the period and held for the entire period (February 1, 2016 to July 31, 2016).
Actual Expenses
The first line of the accompanying table for each class of the Fund provides information about actual account values and actual expenses. You may use the information in this line, together with the amount you invested, to estimate the expenses that you paid over the period. Simply divide your account value by $1,000.00 (for example, an $8,600 account value divided by $1,000.00 = 8.6), then multiply the result by the number in the first line for a class of the Fund under the heading entitled "Expenses Paid During Period" to estimate the expenses you paid on your account during this period. A small balance maintenance fee of $12.00 that is charged once a year may apply for certain accounts with a value of less than $2,000. This fee is not included in the table below. If it was, the estimate of expenses you paid during the period would be higher, and your ending account value lower, by this amount. In addition, the Fund, as a shareholder in the underlying Fidelity Central Funds, will indirectly bear its pro-rata share of the fees and expenses incurred by the underlying Fidelity Central Funds. These fees and expenses are not included in the Fund's annualized expense ratio used to calculate the expense estimate in the table below.
Hypothetical Example for Comparison Purposes
The second line of the accompanying table for each class of the Fund provides information about hypothetical account values and hypothetical expenses based on a Class' actual expense ratio and an assumed rate of return of 5% per year before expenses, which is not the Class' actual return. The hypothetical account values and expenses may not be used to estimate the actual ending account balance or expenses you paid for the period. You may use this information to compare the ongoing costs of investing in the Fund and other funds. To do so, compare this 5% hypothetical example with the 5% hypothetical examples that appear in the shareholder reports of the other funds. A small balance maintenance fee of $12.00 that is charged once a year may apply for certain accounts with a value of less than $2,000. This fee is not included in the table below. If it was, the estimate of expenses you paid during the period would be higher, and your ending account value lower, by this amount. In addition, the Fund, as a shareholder in the underlying Fidelity Central Funds, will indirectly bear its pro-rata share of the fees and expenses incurred by the underlying Fidelity Central Funds. These fees and expenses are not included in the Fund's annualized expense ratio used to calculate the expense estimate in the table below.
Please note that the expenses shown in the table are meant to highlight your ongoing costs only and do not reflect any transaction costs. Therefore, the second line of the table is useful in comparing ongoing costs only, and will not help you determine the relative total costs of owning different funds.
| | Annualized Expense Ratio-A | Beginning
Account Value
February 1, 2016 | Ending
Account Value
July 31, 2016 | Expenses Paid
During Period-B
February 1, 2016
to July 31, 2016 |
| Dividend Growth | .59% | | | |
| Actual | | $1,000.00 | $1,095.20 | $3.07 |
| Hypothetical-C | | $1,000.00 | $1,021.93 | $2.97 |
| Class K | .47% | | | |
| Actual | | $1,000.00 | $1,096.00 | $2.45 |
| Hypothetical-C | | $1,000.00 | $1,022.53 | $2.36 |
A Annualized expense ratio reflects expenses net of applicable fee waivers.
B Expenses are equal to each Class' annualized expense ratio, multiplied by the average account value over the period, multiplied by 182/366 (to reflect the one-half year period).
C 5% return per year before expenses
Distributions (Unaudited)
The fund hereby designates as a capital gain dividend with respect to the taxable year ended July 31,2016 $40,762,211, or, if subsequently determined to be different, the net capital gain of such year.
Dividend Growth and Class K designate 100% of the dividends distributed in September and December during the fiscal year as qualifying for the dividends–received deduction for corporate shareholders.
Dividend Growth and Class K designate 100% of the dividends distributed in September and December during the fiscal year as amounts which may be taken into account as a dividend for the purposes of the maximum rate under section 1(h)(11) of the Internal Revenue Code.
The fund will notify shareholders in January 2017 of amounts for use in preparing 2016 income tax returns.
Board Approval of Investment Advisory Contracts and Management Fees
Fidelity Dividend Growth Fund
Each year, the Board of Trustees, including the Independent Trustees (together, the Board), votes on the renewal of the management contract with Fidelity Management & Research Company (FMR) and the sub-advisory agreements (together, the Advisory Contracts) for the fund. The Board, assisted by the advice of fund counsel and Independent Trustees' counsel, requests and considers a broad range of information relevant to the renewal of the Advisory Contracts throughout the year.
The Board meets regularly and, at each of its meetings, covers an extensive agenda of topics and materials and considers factors that are relevant to its annual consideration of the renewal of the fund's Advisory Contracts, including the services and support provided to the fund and its shareholders. The Board has established various standing committees (Committees), each composed of and chaired by Independent Trustees with varying backgrounds, to which the Board has assigned specific subject matter responsibilities in order to enhance effective decision-making by the Board. The Board, acting directly and through its Committees, requests and receives information concerning the annual consideration of the renewal of the fund's Advisory Contracts. The Board also meets as needed to consider matters specifically related to the Board's annual consideration of the renewal of the Advisory Contracts. Members of the Board may also meet with trustees of other Fidelity funds through ad hoc joint committees to discuss certain matters relevant to all of the Fidelity funds.
At its July 2016 meeting, the Board unanimously determined to renew the fund's Advisory Contracts. In reaching its determination, the Board considered all factors it believed relevant, including (i) the nature, extent, and quality of the services to be provided to the fund and its shareholders (including the investment performance of the fund); (ii) the competitiveness of the fund's management fee and total expense ratio relative to peer funds; (iii) the total costs of the services to be provided by and the profits to be realized by Fidelity from its relationships with the fund; and (iv) the extent to which, if any, economies of scale exist and would be realized as the fund grows, and whether any economies of scale are appropriately shared with fund shareholders.
In considering whether to renew the Advisory Contracts for the fund, the Board reached a determination, with the assistance of fund counsel and Independent Trustees' counsel and through the exercise of its business judgment, that the renewal of the Advisory Contracts was in the best interests of the fund and its shareholders and that the compensation payable under the Advisory Contracts was fair and reasonable. The Board's decision to renew the Advisory Contracts was not based on any single factor, but rather was based on a comprehensive consideration of all the information provided to the Board at its meetings throughout the year. The Board, in reaching its determination to renew the Advisory Contracts, was aware that shareholders of the fund have a broad range of investment choices available to them, including a wide choice among funds offered by Fidelity's competitors, and that the fund's shareholders, who have the opportunity to review and weigh the disclosure provided by the fund in its prospectus and other public disclosures, have chosen to invest in this fund, which is part of the Fidelity family of funds.
Nature, Extent, and Quality of Services Provided. The Board considered Fidelity's staffing as it relates to the fund, including the backgrounds of investment personnel of Fidelity, and also considered the fund's investment objective, strategies, and related investment philosophy. The Independent Trustees also had discussions with senior management of Fidelity's investment operations and investment groups. The Board considered the structure of the investment personnel compensation program and whether this structure provides appropriate incentives to act in the best interests of the fund. Additionally, the Board considered the portfolio managers' investments, if any, in the funds that they manage.
Resources Dedicated to Investment Management and Support Services. The Board and the Fund Oversight and Research Committees reviewed the general qualifications and capabilities of Fidelity's investment staff, including its size, education, experience, and resources, as well as Fidelity's approach to recruiting, training, managing, and compensating investment personnel. The Board noted that Fidelity has continued to increase the resources devoted to non-U.S. offices, including expansion of Fidelity's global investment organization. The Board also noted that Fidelity's analysts have extensive resources, tools and capabilities that allow them to conduct sophisticated quantitative and fundamental analysis, as well as credit analysis of issuers, counterparties and guarantors. Further, the Board considered that Fidelity's investment professionals have sufficient access to global information and data so as to provide competitive investment results over time, and that those professionals also have access to sophisticated tools that permit them to assess portfolio construction and risk and performance attribution characteristics continuously, as well as to transmit new information and research conclusions rapidly around the world. Additionally, in its deliberations, the Board considered Fidelity's trading, risk management, compliance, and technology and operations capabilities and resources, which are integral parts of the investment management process.
Shareholder and Administrative Services. The Board considered (i) the nature, extent, quality, and cost of advisory, administrative, and shareholder services performed by FMR, the sub-advisers (together with FMR, the Investment Advisers), and their affiliates under the Advisory Contracts and under separate agreements covering transfer agency, pricing and bookkeeping, and securities lending services for the fund; (ii) the nature and extent of the supervision of third party service providers, principally custodians, subcustodians, and pricing vendors; and (iii) the resources devoted to, and the record of compliance with, the fund's compliance policies and procedures. The Board also reviewed the allocation of fund brokerage, including allocations to brokers affiliated with the Investment Advisers, the use of brokerage commissions to pay fund expenses, and the use of "soft" commission dollars to pay for research services.
The Board noted that the growth of fund assets over time across the complex allows Fidelity to reinvest in the development of services designed to enhance the value or convenience of the Fidelity funds as investment vehicles. These services include 24-hour access to account information and market information through telephone representatives and over the Internet, investor education materials and asset allocation tools, and the expanded availability of Fidelity Investor Centers.
In 2014, the Board formed an ad hoc Committee on Transfer Agency Fees to review the variety of transfer agency fee structures throughout the industry and Fidelity's competitive positioning with respect to industry participants.
Investment in a Large Fund Family. The Board considered the benefits to shareholders of investing in a Fidelity fund, including the benefits of investing in a fund that is part of a large family of funds offering a variety of investment disciplines and providing a large variety of mutual fund investor services. The Board noted that Fidelity had taken, or had made recommendations that resulted in the Fidelity funds taking, a number of actions over the previous year that benefited particular funds, including: (i) continuing to dedicate additional resources to investment research and to the support of the senior management team that oversees asset management; (ii) continuing efforts to enhance Fidelity's global research capabilities; (iii) launching new funds and making other enhancements to meet client needs; (iv) broadening eligibility requirements for certain lower-priced share classes of, and streamlining the fee structure for, certain existing equity index funds; (v) lowering expense caps for certain existing funds and classes to reduce expenses paid by shareholders; (vi) eliminating redemption fees for certain variable insurance product funds and classes; (vii) continuing to launch dedicated lower cost underlying funds to meet portfolio construction needs related to expanding underlying fund options for Fidelity funds of funds, specifically for the Freedom Fund product lines; (viii) launching a lower cost share class for use by the Freedom Index Fund product line; (ix) rationalizing product lines and gaining increased efficiencies through fund mergers and share class consolidations; (x) continuing to develop, acquire and implement systems and technology to improve services to the funds and shareholders, strengthen information security, and increase efficiency; (xi) implementing investment enhancements to further strengthen Fidelity's target date product line to increase investors' probability of success in achieving their goals; (xii) accelerating the conversion of all remaining Class B shares to Class A shares, which have a lower expense structure; and (xiii) implementing changes to Fidelity's money market fund product line in response to recent regulatory reforms.
Investment Performance. The Board considered whether the fund has operated in accordance with its investment objective, as well as its record of compliance with its investment restrictions and its performance history.
The Board took into account discussions with representatives of the Investment Advisers about fund investment performance that occur at Board meetings throughout the year. In this regard the Board noted that as part of regularly scheduled fund reviews and other reports to the Board on fund performance, the Board considers annualized return information for the fund, for different time periods, measured against a securities market index ("benchmark index") and a peer group of funds with similar objectives ("peer group"), if any. In its evaluation of fund investment performance, the Board gave particular attention to information indicating changes in performance of certain Fidelity funds for specific time periods and discussed with the Investment Advisers the reasons for any overperformance or underperformance.
In addition to reviewing absolute and relative fund performance, the Independent Trustees periodically consider the appropriateness of fund performance metrics in evaluating the results achieved. In general, the Independent Trustees believe that fund performance should be evaluated based on net performance (after fees and expenses) of both the highest performing and lowest performing fund share classes, where applicable, compared to appropriate benchmark indices, over appropriate time periods that may include full market cycles, and compared to peer groups, as applicable, over the same periods, taking into account relevant factors including the following: general market conditions; issuer-specific information; and fund cash flows and other factors.
The Independent Trustees recognize that shareholders evaluate performance on a net basis over their own holding periods, for which one-, three-, and five-year periods are often used as a proxy. For this reason, the performance information reviewed by the Board also included net cumulative calendar year total return information for the fund and an appropriate benchmark index and peer group for the most recent one-, three-, and five-year periods, as shown below. Returns are shown compared to the 25th percentile (top of box, 75% beaten) and 75th percentile (bottom of box, 25% beaten) of the peer universe.
Fidelity Dividend Growth Fund
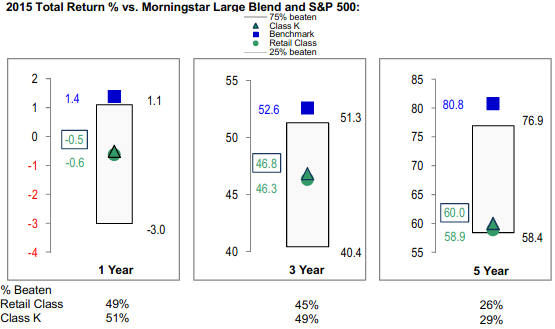
The Board has discussed the fund's performance with FMR, including the fund's underperformance based on more recent periods ended after 2015 (which periods are not shown in the chart above) but prior to the date of the Board's approval of the renewal of the Advisory Contracts, and has engaged with FMR to consider what steps might be taken to remediate the fund's more recent underperformance. The Board noted that there was a portfolio management change for the fund in January 2014.
The Board also considered that the fund's management fee is subject to upward or downward adjustment depending upon whether, and to what extent, the fund's investment performance for the performance period exceeds, or is exceeded by, a securities index, thus leading to a performance adjustment for the same period. The Board noted that the performance adjustment provides FMR with a strong economic incentive to seek to achieve superior performance for the fund's shareholders and helps to more closely align the interests of FMR and the shareholders of the fund.
Based on its review, the Board concluded that the nature, extent, and quality of services provided to the fund under the Advisory Contracts should continue to benefit the shareholders of the fund.
Competitiveness of Management Fee and Total Expense Ratio. The Board considered the fund's management fee and total expense ratio compared to "mapped groups" of competitive funds and classes created for the purpose of facilitating the Trustees' competitive analysis of management fees and total expenses. Fidelity creates "mapped groups" by combining similar Broadridge investment objective categories that have comparable investment mandates. Combining Broadridge investment objective categories aids the Board's management fee and total expense ratio comparisons by broadening the competitive group used for comparison.
Management Fee. The Board considered two proprietary management fee comparisons for the 12-month periods shown in basis points (BP) in the chart below. The group of Broadridge funds used by the Board for management fee comparisons is referred to below as the "Total Mapped Group." The Total Mapped Group comparison focuses on a fund's standing in terms of gross management fees before expense reimbursements or caps, and without giving effect to the fund's performance adjustment, relative to the total universe of funds with comparable investment mandates, regardless of whether their management fee structures also are comparable. Funds with comparable investment mandates offer exposure to similar types of securities. Funds with comparable management fee structures have similar management fee contractual arrangements (
e.g., flat rate charged for advisory services, all-inclusive fee rate,
etc.). "TMG %" represents the percentage of funds in the Total Mapped Group that had management fees that were lower than the fund's. For example, a hypothetical TMG % of 20% would mean that 80% of the funds in the Total Mapped Group had higher, and 20% had lower, management fees than the fund. The fund's actual TMG %s and the number of funds in the Total Mapped Group are in the chart below. The "Asset-Size Peer Group" (ASPG) comparison focuses on a fund's standing relative to a subset of non-Fidelity funds within the Total Mapped Group that are similar in size and management fee structure without taking into account performance adjustments, if any. For example, if a fund is in the first quartile of the ASPG, the fund's management fee ranks in the least expensive or lowest 25% of funds in the ASPG. The ASPG represents at least 15% of the funds in the Total Mapped Group with comparable asset size and management fee structures, subject to a minimum of 50 funds (or all funds in the Total Mapped Group if fewer than 50). Additional information, such as the ASPG quartile in which the fund's management fee rate ranked and the impact of the fund's performance adjustment, is also included in the chart and considered by the Board.
Fidelity Dividend Growth Fund
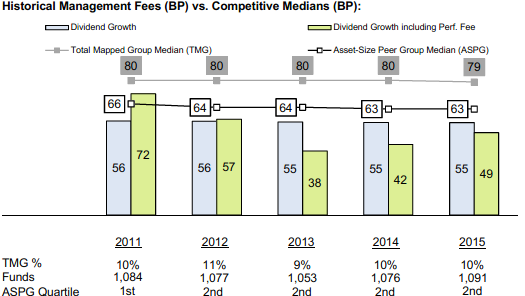
The Board noted that the fund's management fee rate ranked below the median of its Total Mapped Group and below the median of its ASPG for 2015. The Board also noted the effect of the fund's performance adjustment, if any, on the fund's management fee ranking.
The Board noted that, in 2014, the ad hoc Committee on Group Fee was formed by it and the boards of other Fidelity funds to conduct an in-depth review of the "group fee" component of the management fee of funds with such management fee structures. The Committee's focus included the mechanics of the group fee, the competitive landscape of group fee structures, Fidelity funds with no group fee component and investment products not included in group fee assets. The Board also considered that, for funds subject to the group fee, FMR agreed to voluntarily waive fees over a specified period of time in amounts designed to account for assets converted from certain funds to certain collective investment trusts.
The Board also noted that, in 2013, the ad hoc Committee on Management Fees was formed to conduct an in-depth review of the management fee rates of Fidelity's active equity mutual funds. The Committee focused on the following areas: (i) standard fee structures; (ii) research consumption and trading evolution; (iii) management fee competitiveness/profitability by category; and (iv) factors that drive institutional pricing.
Based on its review, the Board concluded that the fund's management fee is fair and reasonable in light of the services that the fund receives and the other factors considered.
Total Expense Ratio. In its review of each class's total expense ratio, the Board considered the fund's management fee rate as well as other fund or class expenses, as applicable, such as transfer agent fees, pricing and bookkeeping fees, and custodial, legal, and audit fees. The Board noted the impact of the fund's performance adjustment. The Board also noted that Fidelity may agree to waive fees and expenses from time to time, and the extent to which, if any, it has done so for the fund. As part of its review, the Board also considered the current and historical total expense ratios of each class of the fund compared to competitive fund median expenses. Each class of the fund is compared to those funds and classes in the Total Mapped Group (used by the Board for management fee comparisons) that have a similar sales load structure.
The Board noted that the total expense ratio of each class ranked below the competitive median for 2015.
Fees Charged to Other Fidelity Clients. The Board also considered Fidelity fee structures and other information with respect to clients of Fidelity, such as other funds advised or subadvised by Fidelity, pension plan clients, and other institutional clients with similar mandates. The Board noted the findings of the 2013 ad hoc joint committee (created with the board of other Fidelity funds), which reviewed and compared Fidelity's institutional investment advisory business with its business of providing services to the Fidelity funds, including the differences in services provided, fees charged, and costs incurred, as well as competition in their respective marketplaces.
Based on its review of total expense ratios and fees charged to other Fidelity clients, the Board concluded that the total expense ratio of each class of the fund was reasonable in light of the services that the fund and its shareholders receive and the other factors considered.
Costs of the Services and Profitability. The Board considered the revenues earned and the expenses incurred by Fidelity in conducting the business of developing, marketing, distributing, managing, administering and servicing the fund and servicing the fund's shareholders. The Board also considered the level of Fidelity's profits in respect of all the Fidelity funds.
On an annual basis, Fidelity presents to the Board information about the profitability of its relationship with the fund. Fidelity calculates profitability information for each fund, as well as aggregate profitability information for groups of Fidelity funds and all Fidelity funds, using a series of detailed revenue and cost allocation methodologies which originate with the books and records of Fidelity on which Fidelity's audited financial statements are based. The Audit Committee of the Board reviews any significant changes from the prior year's methodologies.
PricewaterhouseCoopers LLP (PwC), independent registered public accounting firm and auditor to Fidelity and certain Fidelity funds, has been engaged annually by the Board as part of the Board's assessment of Fidelity's profitability analysis. PwC's engagement includes the review and assessment of the methodologies used by Fidelity in determining the revenues and expenses attributable to Fidelity's mutual fund business, and completion of agreed-upon procedures in respect of the mathematical accuracy of the fund profitability information and its conformity to established allocation methodologies. After considering PwC's reports issued under the engagement and information provided by Fidelity, the Board concluded that while other allocation methods may also be reasonable, Fidelity's profitability methodologies are reasonable in all material respects.
The Board also reviewed Fidelity's non-fund businesses and fall-out benefits related to the mutual fund business as well as cases where Fidelity's affiliates may benefit from or be related to the fund's business.
The Board considered the costs of the services provided by and the profits realized by Fidelity in connection with the operation of the fund and was satisfied that the profitability was not excessive.
Economies of Scale. The Board considered whether there have been economies of scale in respect of the management of the Fidelity funds, whether the Fidelity funds (including the fund) have appropriately benefited from any such economies of scale, and whether there is potential for realization of any further economies of scale. The Board considered the extent to which the fund will benefit from economies of scale as assets grow through increased services to the fund, through waivers or reimbursements, or through fee or expense ratio reductions. The Board also noted that in 2013, it and the boards of other Fidelity funds created an ad hoc committee (the Economies of Scale Committee) to analyze whether Fidelity attains economies of scale in respect of the management and servicing of the Fidelity funds, whether the Fidelity funds have appropriately benefited from such economies of scale, and whether there is potential for realization of any further economies of scale.
The Board recognized that the fund's management contract incorporates a "group fee" structure, which provides for lower group fee rates as total group assets increase, and for higher group fee rates as total group assets decrease (with "group assets" defined to include fund assets under FMR's management plus the assets of sector funds previously under FMR's management). FMR calculates the group fee rates based on a tiered asset "breakpoint" schedule that varies based on asset class. The Board considered that the group fee is designed to deliver the benefits of economies of scale to fund shareholders when total Fidelity fund assets increase, even if assets of any particular fund are unchanged or have declined, because some portion of Fidelity's costs are attributable to services provided to all Fidelity funds, and all funds benefit if those costs can be allocated among more assets. The Board concluded that, given the group fee structure, fund shareholders will benefit from lower management fees as group assets increase at the fund complex level, regardless of whether Fidelity achieves any such economies of scale.
The Board concluded, taking into account the analysis of the Economies of Scale Committee, that economies of scale, if any, are being appropriately shared between fund shareholders and Fidelity.
Additional Information Requested by the Board. In order to develop fully the factual basis for consideration of the Fidelity funds' Advisory Contracts, the Board requested and received additional information on certain topics, including: (i) fund performance trends and Fidelity's long-term strategies for certain funds; (ii) the various share classes employed by Fidelity and the attributes of each class, together with similar information on the distribution and servicing payments made by Fidelity or the funds to third-party participants in the distribution channels; (iii) fund profitability, and fund performance in relation to fund profitability; (iv) the methodology with respect to evaluating competitive fund data and peer group classifications and fee comparisons; (v) annual fund profitability margins; (vi) the realization of fall-out benefits in and attribution of fall-out benefits to certain Fidelity business units; (vii) the appropriateness of certain funds' benchmarks; (viii) the rationalization for certain share classes and expenses; (ix) sub-advisory fee rates for comparable investment mandates; (x) product strategy for certain underperforming funds; and (xi) Fidelity's resources and strategy for cybersecurity.
Based on its evaluation of all of the conclusions noted above, and after considering all factors it believed relevant, the Board concluded that the advisory fee structures are fair and reasonable, and that the fund's Advisory Contracts should be renewed.
Corporate Headquarters
245 Summer St.
Boston, MA 02210
www.fidelity.com
DGF-K-ANN-0916
1.863065.107
Fidelity® Blue Chip Growth Fund
Annual Report July 31, 2016 |
|
Contents
To view a fund's proxy voting guidelines and proxy voting record for the 12-month period ended June 30, visit http://www.fidelity.com/proxyvotingresults or visit the Securities and Exchange Commission's (SEC) web site at http://www.sec.gov.
You may also call 1-800-544-8544 to request a free copy of the proxy voting guidelines.
Standard & Poor's, S&P and S&P 500 are registered service marks of The McGraw-Hill Companies, Inc. and have been licensed for use by Fidelity Distributors Corporation.
Other third-party marks appearing herein are the property of their respective owners.
All other marks appearing herein are registered or unregistered trademarks or service marks of FMR LLC or an affiliated company. © 2016 FMR LLC. All rights reserved.
This report and the financial statements contained herein are submitted for the general information of the shareholders of the Fund. This report is not authorized for distribution to prospective investors in the Fund unless preceded or accompanied by an effective prospectus.
A fund files its complete schedule of portfolio holdings with the SEC for the first and third quarters of each fiscal year on Form N-Q. Forms N-Q are available on the SEC’s web site at http://www.sec.gov. A fund's Forms N-Q may be reviewed and copied at the SEC’s Public Reference Room in Washington, DC. Information regarding the operation of the SEC's Public Reference Room may be obtained by calling 1-800-SEC-0330.
For a complete list of a fund's portfolio holdings, view the most recent holdings listing, semiannual report, or annual report on Fidelity's web site at http://www.fidelity.com, http://www.institutional.fidelity.com, or http://www.401k.com, as applicable.
NOT FDIC INSURED •MAY LOSE VALUE •NO BANK GUARANTEE
Neither the Fund nor Fidelity Distributors Corporation is a bank.
Performance: The Bottom Line
Average annual total return reflects the change in the value of an investment, assuming reinvestment of distributions from dividend income and capital gains (the profits earned upon the sale of securities that have grown in value, if any) and assuming a constant rate of performance each year. The hypothetical investment and the average annual total returns do not reflect the deduction of taxes that a shareholder would pay on fund distributions or the redemption of fund shares. During periods of reimbursement by Fidelity, a fund’s total return will be greater than it would be had the reimbursement not occurred. How a fund did yesterday is no guarantee of how it will do tomorrow.
Average Annual Total Returns
| For the periods ended July 31, 2016 | Past 1 year | Past 5 years | Past 10 years |
| Fidelity® Blue Chip Growth Fund | (2.59)% | 13.11% | 9.89% |
$10,000 Over 10 Years
Let's say hypothetically that $10,000 was invested in Fidelity® Blue Chip Growth Fund, a class of the fund, on July 31, 2006.
The chart shows how the value of your investment would have changed, and also shows how the Russell 1000® Growth Index performed over the same period.

| Period Ending Values |
| $25,675 | Fidelity® Blue Chip Growth Fund |
| $24,772 | Russell 1000® Growth Index |
Management's Discussion of Fund Performance
Market Recap: U.S. equities gained modestly for the year ending July 31, 2016, overcoming persistent concern about global economic growth, uncertainty regarding U.S. monetary policy and the U.K.’s late-June vote to leave the European Union, dubbed Brexit. The S&P 500 index rose 5.61%, with larger-cap, value-oriented stocks and defensive sectors shining brightest. Volatility peaked in the early weeks of 2016, as continued oil-price weakness and U.S.-dollar strength pushed the S&P 500
® to its worst January since 2009. Markets then rose beginning in February amid U.S. job gains, a broad rally in energy and materials markets, global economic stimulus and perceived softening of monetary policy by the U.S. Federal Reserve. The June 23 Brexit vote surprised markets and resulted in a sharp two-day decline for stocks, followed by a rebound as investor sentiment shifted and remained positive through July 31. For the year, dividend-rich telecom services (+26%), utilities (+23%) and consumer staples (+12%) led the way amid strong investor demand for yield. Industrials (+10%) and information technology (+10%) also outperformed, as did materials (+8%), despite a weak commodities environment overall. Conversely, a strong run for real estate stocks couldn’t keep financials (-4%) from losing ground, as low interest rates continued to squeeze bank profits.
Comments from Portfolio Manager Sonu Kalra: For the year, the fund’s share classes returned about -3%, substantially lagging the 4.35% result of the benchmark Russell 1000 Growth Index. Investors tended to favor companies with perceived lower volatility and high dividends, while growth stocks, such as those the fund invests in, largely fell out of favor. Versus the benchmark, weak stock selection overall was the primary detractor, especially in pharmaceuticals, biotechnology & life sciences. A non-index stake in Canada-based Valeant Pharmaceuticals International was our largest individual detractor. The stock plunged in October on allegations of accounting irregularities and a U.S. investigation into the firm's drug pricing, as well its programs to help patients afford its drugs. Shares fell further in mid-March after the company said it may default on its debt and would not meet earnings targets. Allergan was another detractor here, as our investments fell on investor concern about its planned merger with Pfizer. I eliminated both Valeant and Allergan by period end. Conversely, the fund’s stake in Amazon.com, a large portfolio holding, helped most. Shares rose about 42% on the company's strong profits. Google parent Alphabet – the fund's largest holding at period end (combining its Class A and Class C shares) – also contributed, as its stock rose on better-than-expected financial results.
The views expressed above reflect those of the portfolio manager(s) only through the end of the period as stated on the cover of this report and do not necessarily represent the views of Fidelity or any other person in the Fidelity organization. Any such views are subject to change at any time based upon market or other conditions and Fidelity disclaims any responsibility to update such views. These views may not be relied on as investment advice and, because investment decisions for a Fidelity fund are based on numerous factors, may not be relied on as an indication of trading intent on behalf of any Fidelity fund.
Investment Summary (Unaudited)
Top Ten Stocks as of July 31, 2016
| | % of fund's net assets | % of fund's net assets 6 months ago |
| Amazon.com, Inc. | 6.0 | 4.9 |
| Alphabet, Inc. Class A | 5.9 | 5.7 |
| Apple, Inc. | 5.3 | 4.1 |
| Facebook, Inc. Class A | 4.0 | 4.1 |
| Salesforce.com, Inc. | 2.4 | 1.9 |
| Tesla Motors, Inc. | 2.3 | 1.2 |
| Home Depot, Inc. | 2.1 | 2.1 |
| Broadcom Ltd. | 2.0 | 1.5 |
| Visa, Inc. Class A | 1.9 | 2.0 |
| Alphabet, Inc. Class C | 1.8 | 2.4 |
| | 33.7 | |
Top Five Market Sectors as of July 31, 2016
| | % of fund's net assets | % of fund's net assets 6 months ago |
| Information Technology | 37.6 | 37.4 |
| Consumer Discretionary | 26.5 | 26.4 |
| Health Care | 14.4 | 16.1 |
| Consumer Staples | 8.2 | 10.8 |
| Industrials | 4.8 | 4.9 |
Asset Allocation (% of fund's net assets)
| As of July 31, 2016* |
| | Stocks | 97.4% |
| | Convertible Securities | 2.5% |
| | Short-Term Investments and Net Other Assets (Liabilities) | 0.1% |

* Foreign investments - 12.0%
| As of January 31, 2016* |
| | Stocks | 97.6% |
| | Convertible Securities | 2.4% |

* Foreign investments - 12.2%
Investments July 31, 2016
Showing Percentage of Net Assets
| Common Stocks - 97.3% | | | |
| | | Shares | Value (000s) |
| CONSUMER DISCRETIONARY - 26.3% | | | |
| Automobiles - 2.3% | | | |
| BYD Co. Ltd. (H Shares) (a) | | 1,096,500 | $6,953 |
| Tesla Motors, Inc. (a) | | 1,879,033 | 441,178 |
| | | | 448,131 |
| Diversified Consumer Services - 0.2% | | | |
| New Oriental Education & Technology Group, Inc. sponsored ADR | | 520,700 | 22,942 |
| ServiceMaster Global Holdings, Inc. (a) | | 255,300 | 9,658 |
| Weight Watchers International, Inc. (a) | | 129,353 | 1,543 |
| | | | 34,143 |
| Hotels, Restaurants & Leisure - 4.6% | | | |
| Buffalo Wild Wings, Inc. (a) | | 452,209 | 75,953 |
| Chipotle Mexican Grill, Inc.(a) | | 675,370 | 286,350 |
| Darden Restaurants, Inc. | | 91,200 | 5,614 |
| Dave & Buster's Entertainment, Inc. (a) | | 1,775,813 | 79,024 |
| Domino's Pizza, Inc. | | 240,171 | 35,377 |
| Extended Stay America, Inc. unit | | 277,700 | 3,932 |
| Hilton Worldwide Holdings, Inc. | | 853,176 | 19,785 |
| Las Vegas Sands Corp. | | 246,500 | 12,485 |
| McDonald's Corp. | | 566,275 | 66,622 |
| MGM Mirage, Inc. (a) | | 1,350,942 | 32,396 |
| Panera Bread Co. Class A (a) | | 137,600 | 30,178 |
| Starbucks Corp. | | 4,033,247 | 234,130 |
| Texas Roadhouse, Inc. Class A | | 39,800 | 1,879 |
| Wingstop, Inc. (b) | | 152,000 | 3,952 |
| | | | 887,677 |
| Household Durables - 1.2% | | | |
| Mohawk Industries, Inc. (a) | | 11,249 | 2,350 |
| Newell Brands, Inc. | | 1,378,002 | 72,290 |
| Nien Made Enterprise Co. Ltd. | | 437,000 | 4,573 |
| Sony Corp. | | 1,664,300 | 54,634 |
| Sony Corp. sponsored ADR | | 990,975 | 33,108 |
| Whirlpool Corp. | | 335,832 | 64,601 |
| | | | 231,556 |
| Internet & Catalog Retail - 8.0% | | | |
| Amazon.com, Inc. (a) | | 1,524,987 | 1,157,179 |
| Ctrip.com International Ltd. ADR (a) | | 565,533 | 24,697 |
| Expedia, Inc. | | 739,099 | 86,216 |
| Groupon, Inc. Class A (a) | | 1,081,314 | 5,212 |
| Netflix, Inc. (a) | | 1,028,248 | 93,828 |
| Priceline Group, Inc. (a) | | 129,505 | 174,937 |
| The Honest Co., Inc. (a)(c) | | 150,143 | 5,782 |
| | | | 1,547,851 |
| Leisure Products - 0.2% | | | |
| Mattel, Inc. | | 1,142,488 | 38,136 |
| NJOY, Inc. (a)(c) | | 8,088,440 | 324 |
| Spin Master Corp. (a) | | 410,200 | 8,420 |
| | | | 46,880 |
| Media - 0.9% | | | |
| Altice NV Class A (a) | | 2,599,717 | 38,584 |
| Charter Communications, Inc. Class A (a) | | 266,894 | 62,685 |
| Lions Gate Entertainment Corp. (b) | | 719,765 | 14,388 |
| Naspers Ltd. Class N | | 178,100 | 27,948 |
| The Walt Disney Co. | | 355,751 | 34,134 |
| | | | 177,739 |
| Multiline Retail - 1.2% | | | |
| B&M European Value Retail S.A. | | 3,059,462 | 10,418 |
| Dollar Tree, Inc. (a) | | 873,365 | 84,096 |
| JC Penney Corp., Inc. (a)(b) | | 224,366 | 2,167 |
| Kohl's Corp. | | 320,600 | 13,334 |
| Macy's, Inc. | | 596,500 | 21,373 |
| Ollie's Bargain Outlet Holdings, Inc. (a) | | 86,722 | 2,267 |
| Target Corp. | | 1,234,746 | 93,013 |
| | | | 226,668 |
| Specialty Retail - 4.2% | | | |
| Abercrombie & Fitch Co. Class A | | 287,800 | 5,960 |
| Advance Auto Parts, Inc. | | 47,600 | 8,085 |
| AutoZone, Inc. (a) | | 24,177 | 19,679 |
| Dick's Sporting Goods, Inc. | | 152,700 | 7,832 |
| Home Depot, Inc. | | 2,907,124 | 401,881 |
| Inditex SA | | 484,826 | 16,767 |
| L Brands, Inc. | | 1,638,536 | 121,088 |
| Lowe's Companies, Inc. | | 363,500 | 29,909 |
| O'Reilly Automotive, Inc. (a) | | 31,357 | 9,113 |
| Restoration Hardware Holdings, Inc. (a)(b) | | 1,565,274 | 48,226 |
| Ross Stores, Inc. | | 524,749 | 32,445 |
| The Children's Place Retail Stores, Inc. | | 96,100 | 8,032 |
| TJX Companies, Inc. | | 1,292,767 | 105,645 |
| Ulta Salon, Cosmetics & Fragrance, Inc. (a) | | 40,984 | 10,705 |
| | | | 825,367 |
| Textiles, Apparel & Luxury Goods - 3.5% | | | |
| adidas AG | | 1,348,842 | 221,577 |
| Coach, Inc. | | 193,200 | 8,329 |
| G-III Apparel Group Ltd. (a) | | 733,639 | 29,368 |
| Kate Spade & Co. (a) | | 689,202 | 14,949 |
| lululemon athletica, Inc. (a)(b) | | 1,412,372 | 109,671 |
| NIKE, Inc. Class B | | 1,875,344 | 104,082 |
| PVH Corp. | | 606,281 | 61,271 |
| Ralph Lauren Corp. | | 261,000 | 25,601 |
| Regina Miracle International Holdings Ltd. (b) | | 6,143,551 | 6,747 |
| Skechers U.S.A., Inc. Class A (sub. vtg.) (a) | | 1,934,595 | 46,469 |
| Tory Burch LLC unit (c)(d) | | 293,611 | 18,266 |
| Under Armour, Inc. Class C (non-vtg.) | | 1,071,853 | 38,265 |
| | | | 684,595 |
|
| TOTAL CONSUMER DISCRETIONARY | | | 5,110,607 |
|
| CONSUMER STAPLES - 8.0% | | | |
| Beverages - 2.6% | | | |
| Anheuser-Busch InBev SA NV ADR | | 423,474 | 54,814 |
| Constellation Brands, Inc. Class A (sub. vtg.) | | 399,727 | 65,807 |
| Molson Coors Brewing Co. Class B | | 1,056,455 | 107,927 |
| Monster Beverage Corp. (a) | | 1,118,395 | 179,648 |
| The Coca-Cola Co. | | 2,432,765 | 106,142 |
| | | | 514,338 |
| Food & Staples Retailing - 1.4% | | | |
| Costco Wholesale Corp. | | 1,246,497 | 208,439 |
| CVS Health Corp. | | 419,306 | 38,878 |
| Sprouts Farmers Market LLC (a) | | 353,500 | 8,176 |
| United Natural Foods, Inc. (a) | | 116,900 | 5,843 |
| Whole Foods Market, Inc. | | 137,218 | 4,182 |
| | | | 265,518 |
| Food Products - 1.3% | | | |
| Associated British Foods PLC | | 1,057,745 | 37,671 |
| Bunge Ltd. | | 202,000 | 13,300 |
| Edita Food Industries SAE GDR (e) | | 259,200 | 1,581 |
| Mead Johnson Nutrition Co. Class A | | 515,800 | 46,009 |
| Mondelez International, Inc. | | 1,836,833 | 80,784 |
| The Hain Celestial Group, Inc. (a) | | 1,218,771 | 64,339 |
| The J.M. Smucker Co. | | 13,500 | 2,081 |
| TreeHouse Foods, Inc. (a) | | 107,700 | 11,114 |
| | | | 256,879 |
| Household Products - 0.2% | | | |
| Spectrum Brands Holdings, Inc. | | 303,700 | 39,107 |
| Personal Products - 1.8% | | | |
| Coty, Inc. Class A | | 250,800 | 6,739 |
| Estee Lauder Companies, Inc. Class A | | 1,017,472 | 94,523 |
| Herbalife Ltd. (a) | | 1,454,040 | 98,889 |
| Nu Skin Enterprises, Inc. Class A (b) | | 2,665,324 | 142,328 |
| | | | 342,479 |
| Tobacco - 0.7% | | | |
| Imperial Tobacco Group PLC | | 203,133 | 10,709 |
| Reynolds American, Inc. | | 2,394,361 | 119,862 |
| | | | 130,571 |
|
| TOTAL CONSUMER STAPLES | | | 1,548,892 |
|
| ENERGY - 2.4% | | | |
| Energy Equipment & Services - 0.2% | | | |
| Baker Hughes, Inc. | | 533,900 | 25,536 |
| National Oilwell Varco, Inc. | | 235,300 | 7,612 |
| | | | 33,148 |
| Oil, Gas & Consumable Fuels - 2.2% | | | |
| Anadarko Petroleum Corp. | | 1,367,132 | 74,550 |
| Apache Corp. | | 264,100 | 13,865 |
| Cabot Oil & Gas Corp. | | 166,600 | 4,110 |
| Carrizo Oil & Gas, Inc. (a) | | 290,600 | 9,532 |
| Cimarex Energy Co. | | 375,650 | 45,086 |
| Continental Resources, Inc. (a) | | 1,256,841 | 55,364 |
| Devon Energy Corp. | | 922,400 | 35,309 |
| EOG Resources, Inc. | | 631,858 | 51,623 |
| Pioneer Natural Resources Co. | | 374,526 | 60,887 |
| SM Energy Co. | | 943,300 | 25,592 |
| Suncor Energy, Inc. | | 274,100 | 7,377 |
| Targa Resources Corp. | | 200,500 | 7,471 |
| Whiting Petroleum Corp. (a) | | 2,558,600 | 18,857 |
| Williams Partners LP | | 597,600 | 22,314 |
| | | | 431,937 |
|
| TOTAL ENERGY | | | 465,085 |
|
| FINANCIALS - 4.3% | | | |
| Banks - 1.4% | | | |
| Bank of America Corp. | | 4,206,621 | 60,954 |
| Citigroup, Inc. | | 1,342,121 | 58,798 |
| HDFC Bank Ltd. sponsored ADR | | 647,917 | 44,881 |
| JPMorgan Chase & Co. | | 1,577,436 | 100,909 |
| | | | 265,542 |
| Capital Markets - 0.5% | | | |
| BlackRock, Inc. Class A | | 151,664 | 55,547 |
| Charles Schwab Corp. | | 776,741 | 22,075 |
| Fairfax India Holdings Corp. (a) | | 907,400 | 9,128 |
| Goldman Sachs Group, Inc. | | 96,600 | 15,341 |
| | | | 102,091 |
| Diversified Financial Services - 2.2% | | | |
| Bats Global Markets, Inc. | | 603,700 | 15,322 |
| Broadcom Ltd. | | 2,361,859 | 382,574 |
| MSCI, Inc. Class A | | 155,600 | 13,388 |
| WME Entertainment Parent, LLC Class A unit (c)(d) | | 3,718,505 | 7,638 |
| | | | 418,922 |
| Real Estate Investment Trusts - 0.1% | | | |
| Extra Space Storage, Inc. | | 277,987 | 23,912 |
| Real Estate Management & Development - 0.0% | | | |
| Parsvnath Developers Ltd. (a)(f) | | 21,771,340 | 7,823 |
| Thrifts & Mortgage Finance - 0.1% | | | |
| Housing Development Finance Corp. Ltd. | | 697,722 | 14,388 |
|
| TOTAL FINANCIALS | | | 832,678 |
|
| HEALTH CARE - 14.2% | | | |
| Biotechnology - 9.0% | | | |
| ACADIA Pharmaceuticals, Inc. (a) | | 118,500 | 4,389 |
| Acceleron Pharma, Inc. (a) | | 143,443 | 4,866 |
| Agios Pharmaceuticals, Inc. (a)(b) | | 191,678 | 8,670 |
| Aimmune Therapeutics, Inc. (a)(b) | | 397,357 | 4,764 |
| Alexion Pharmaceuticals, Inc. (a) | | 1,079,069 | 138,768 |
| Alkermes PLC (a) | | 1,021,247 | 50,960 |
| Alnylam Pharmaceuticals, Inc. (a) | | 676,140 | 46,032 |
| Amgen, Inc. | | 1,733,286 | 298,177 |
| ARIAD Pharmaceuticals, Inc. (a) | | 434,900 | 4,136 |
| Ascendis Pharma A/S sponsored ADR (a) | | 329,051 | 4,738 |
| BeiGene Ltd. sponsored ADR | | 34,400 | 903 |
| Biogen, Inc. (a) | | 780,690 | 226,345 |
| BioMarin Pharmaceutical, Inc. (a) | | 337,287 | 33,533 |
| bluebird bio, Inc. (a) | | 243,667 | 13,933 |
| Catabasis Pharmaceuticals, Inc. (a)(b) | | 517,993 | 1,989 |
| Celgene Corp. (a) | | 2,302,472 | 258,314 |
| Cellectis SA sponsored ADR (a) | | 66,409 | 1,751 |
| Chiasma, Inc. (a)(b) | | 297,051 | 787 |
| Chiasma, Inc. (e) | | 221,566 | 587 |
| Chiasma, Inc. warrants | | 55,391 | 40 |
| Chimerix, Inc. (a) | | 84,385 | 337 |
| Coherus BioSciences, Inc. (a)(b) | | 556,989 | 14,142 |
| Corvus Pharmaceuticals, Inc. | | 143,500 | 1,887 |
| Corvus Pharmaceuticals, Inc. | | 338,682 | 4,231 |
| CytomX Therapeutics, Inc. | | 164,076 | 1,651 |
| CytomX Therapeutics, Inc. (e) | | 378,621 | 3,809 |
| DBV Technologies SA sponsored ADR (a)(b) | | 106,654 | 3,690 |
| Editas Medicine, Inc. (b) | | 339,400 | 8,729 |
| Editas Medicine, Inc. | | 276,353 | 7,037 |
| Exelixis, Inc. (a)(b) | | 2,789,291 | 25,606 |
| FibroGen, Inc. (a) | | 366,641 | 7,014 |
| GenSight Biologics SA | | 632,364 | 5,656 |
| Gilead Sciences, Inc. | | 561,138 | 44,594 |
| Global Blood Therapeutics, Inc. (a)(b) | | 516,609 | 9,237 |
| Heron Therapeutics, Inc. (a) | | 111,781 | 1,858 |
| Intellia Therapeutics, Inc. | | 191,600 | 3,625 |
| Intellia Therapeutics, Inc. | | 409,999 | 6,981 |
| Intercept Pharmaceuticals, Inc. (a) | | 147,521 | 25,526 |
| Intrexon Corp. (a)(b) | | 470,517 | 11,918 |
| Ionis Pharmaceuticals, Inc. (a) | | 125,129 | 3,653 |
| Ironwood Pharmaceuticals, Inc. Class A (a) | | 1,056,367 | 14,926 |
| Merrimack Pharmaceuticals, Inc. (a)(b) | | 1,562,425 | 9,062 |
| Mirati Therapeutics, Inc. (a) | | 92,632 | 430 |
| Momenta Pharmaceuticals, Inc. (a) | | 96,269 | 1,084 |
| Neurocrine Biosciences, Inc. (a) | | 624,447 | 31,366 |
| Novavax, Inc. (a) | | 436,504 | 3,195 |
| Portola Pharmaceuticals, Inc. (a) | | 299,425 | 7,773 |
| Prothena Corp. PLC (a) | | 102,959 | 5,668 |
| Radius Health, Inc. (a)(b) | | 84,085 | 3,962 |
| Regeneron Pharmaceuticals, Inc. (a) | | 529,608 | 225,147 |
| Sage Therapeutics, Inc. (a) | | 119,267 | 5,350 |
| Seattle Genetics, Inc. (a) | | 400,493 | 19,248 |
| Seres Therapeutics, Inc. (a) | | 48,733 | 533 |
| Spark Therapeutics, Inc. (a) | | 155,019 | 8,982 |
| TESARO, Inc. (a) | | 67,700 | 6,312 |
| Trevena, Inc. (a) | | 1,029,195 | 6,453 |
| Ultragenyx Pharmaceutical, Inc. (a) | | 58,420 | 3,697 |
| Vertex Pharmaceuticals, Inc. (a) | | 1,070,402 | 103,829 |
| Xencor, Inc. (a) | | 109,850 | 2,081 |
| | | | 1,753,961 |
| Health Care Equipment & Supplies - 2.1% | | | |
| Boston Scientific Corp. (a) | | 4,485,838 | 108,916 |
| Danaher Corp. | | 655,159 | 53,356 |
| DexCom, Inc. (a) | | 124,729 | 11,504 |
| Edwards Lifesciences Corp. (a) | | 66,100 | 7,570 |
| Insulet Corp. (a) | | 118,000 | 4,176 |
| Intuitive Surgical, Inc. (a) | | 160,441 | 111,628 |
| Invuity, Inc. (a) | | 604,811 | 6,230 |
| Medtronic PLC | | 739,725 | 64,822 |
| Nevro Corp. (a)(b) | | 490,321 | 40,550 |
| | | | 408,752 |
| Health Care Providers & Services - 0.7% | | | |
| Adeptus Health, Inc. Class A (a)(b) | | 821,468 | 36,613 |
| AmSurg Corp. (a) | | 401,756 | 30,136 |
| Anthem, Inc. | | 113,000 | 14,841 |
| Apollo Hospitals Enterprise Ltd. | | 840,757 | 17,178 |
| Cigna Corp. | | 128,300 | 16,546 |
| Dr Lal Pathlabs Ltd. | | 7,779 | 113 |
| UnitedHealth Group, Inc. | | 83,362 | 11,937 |
| Wellcare Health Plans, Inc. (a) | | 35,000 | 3,738 |
| | | | 131,102 |
| Health Care Technology - 0.1% | | | |
| athenahealth, Inc. (a) | | 74,973 | 9,581 |
| Evolent Health, Inc. (a) | | 240,272 | 5,656 |
| | | | 15,237 |
| Life Sciences Tools & Services - 0.0% | | | |
| Lonza Group AG | | 37,634 | 7,094 |
| Thermo Fisher Scientific, Inc. | | 12,600 | 2,001 |
| | | | 9,095 |
| Pharmaceuticals - 2.3% | | | |
| Achaogen, Inc. (a) | | 324,457 | 1,275 |
| Bristol-Myers Squibb Co. | | 2,066,785 | 154,616 |
| Catalent, Inc. (a) | | 84,400 | 2,156 |
| Cempra, Inc. (a)(b) | | 131,800 | 2,368 |
| Dermira, Inc. (a) | | 323,548 | 10,858 |
| Eli Lilly & Co. | | 233,000 | 19,313 |
| Endo International PLC (a) | | 2,149,856 | 37,322 |
| GW Pharmaceuticals PLC ADR (a) | | 209,696 | 19,779 |
| Intra-Cellular Therapies, Inc. (a) | | 180,557 | 7,367 |
| Jazz Pharmaceuticals PLC (a) | | 230,644 | 34,820 |
| Johnson & Johnson | | 108,100 | 13,537 |
| Pacira Pharmaceuticals, Inc. (a)(b) | | 599,784 | 21,742 |
| Patheon NV | | 266,100 | 6,881 |
| Teva Pharmaceutical Industries Ltd. sponsored ADR | | 1,561,099 | 83,519 |
| The Medicines Company (a) | | 524,924 | 20,530 |
| | | | 436,083 |
|
| TOTAL HEALTH CARE | | | 2,754,230 |
|
| INDUSTRIALS - 4.7% | | | |
| Aerospace & Defense - 0.9% | | | |
| Honeywell International, Inc. | | 835,098 | 97,147 |
| Lockheed Martin Corp. | | 92,097 | 23,276 |
| Northrop Grumman Corp. | | 107,169 | 23,216 |
| Raytheon Co. | | 135,615 | 18,922 |
| Space Exploration Technologies Corp. Class A (a)(c) | | 160,303 | 15,456 |
| Taser International, Inc. (a) | | 68,800 | 1,992 |
| TransDigm Group, Inc. (a) | | 7,000 | 1,957 |
| | | | 181,966 |
| Airlines - 1.8% | | | |
| American Airlines Group, Inc. | | 685,200 | 24,325 |
| Azul-Linhas Aereas Brasileiras warrants (a)(c) | | 165,571 | 0 |
| Delta Air Lines, Inc. | | 2,269,949 | 87,961 |
| InterGlobe Aviation Ltd. (a) | | 257,728 | 3,819 |
| JetBlue Airways Corp. (a) | | 413,000 | 7,570 |
| Southwest Airlines Co. | | 3,392,073 | 125,541 |
| Spirit Airlines, Inc. (a) | | 829,042 | 35,442 |
| United Continental Holdings, Inc. (a) | | 1,119,934 | 52,514 |
| Wizz Air Holdings PLC (a) | | 266,810 | 5,470 |
| | | | 342,642 |
| Building Products - 0.1% | | | |
| Apogee Enterprises, Inc. | | 40,500 | 1,893 |
| Builders FirstSource, Inc. (a) | | 545,200 | 7,028 |
| Masco Corp. | | 298,300 | 10,882 |
| | | | 19,803 |
| Construction & Engineering - 0.4% | | | |
| Dycom Industries, Inc. (a) | | 769,900 | 72,409 |
| Electrical Equipment - 0.5% | | | |
| Acuity Brands, Inc. | | 166,140 | 43,600 |
| AMETEK, Inc. | | 161,800 | 7,609 |
| Emerson Electric Co. | | 136,400 | 7,625 |
| Fortive Corp. (a) | | 366,879 | 17,687 |
| Regal Beloit Corp. | | 193,200 | 11,787 |
| SolarCity Corp. (a) | | 154,000 | 4,112 |
| | | | 92,420 |
| Industrial Conglomerates - 0.1% | | | |
| Koninklijke Philips Electronics NV (depositary receipt) (NY Reg.) | | 649,100 | 17,240 |
| Machinery - 0.5% | | | |
| Allison Transmission Holdings, Inc. | | 597,000 | 17,206 |
| Caterpillar, Inc. | | 176,300 | 14,591 |
| Eicher Motors Ltd. | | 14,288 | 4,815 |
| Ingersoll-Rand PLC | | 175,500 | 11,629 |
| Pentair PLC | | 112,800 | 7,199 |
| Rational AG | | 16,338 | 7,904 |
| Wabtec Corp. | | 319,700 | 21,899 |
| Xylem, Inc. | | 323,700 | 15,476 |
| | | | 100,719 |
| Professional Services - 0.0% | | | |
| Equifax, Inc. | | 42,342 | 5,609 |
| Road & Rail - 0.0% | | | |
| Genesee & Wyoming, Inc. Class A (a) | | 62,400 | 4,040 |
| Trading Companies & Distributors - 0.4% | | | |
| HD Supply Holdings, Inc. (a) | | 1,947,147 | 70,467 |
|
| TOTAL INDUSTRIALS | | | 907,315 |
|
| INFORMATION TECHNOLOGY - 35.7% | | | |
| Communications Equipment - 0.1% | | | |
| Arista Networks, Inc. (a)(b) | | 139,200 | 9,921 |
| Electronic Equipment & Components - 0.2% | | | |
| Fitbit, Inc. (a)(b) | | 1,616,286 | 22,078 |
| Jabil Circuit, Inc. | | 545,800 | 11,107 |
| QLogic Corp. (a) | | 251,500 | 3,903 |
| | | | 37,088 |
| Internet Software & Services - 14.6% | | | |
| 58.com, Inc. ADR (a) | | 394,700 | 20,528 |
| Akamai Technologies, Inc. (a) | | 267,400 | 13,512 |
| Alibaba Group Holding Ltd. sponsored ADR (a) | | 1,727,516 | 142,486 |
| Alphabet, Inc.: | | | |
| Class A | | 1,448,536 | 1,146,284 |
| Class C (a) | | 454,584 | 349,480 |
| Dropbox, Inc. (a)(c) | | 1,003,814 | 11,152 |
| eBay, Inc. (a) | | 5,692,500 | 177,378 |
| Facebook, Inc. Class A (a) | | 6,326,684 | 784,129 |
| GoDaddy, Inc. (a) | | 129,300 | 3,869 |
| Gogo, Inc. (a)(b) | | 1,800,142 | 15,139 |
| MercadoLibre, Inc. | | 43,600 | 6,674 |
| New Relic, Inc. (a) | | 172,881 | 5,954 |
| Rackspace Hosting, Inc. (a) | | 3,301,405 | 77,352 |
| Shopify, Inc. Class A (a) | | 159,300 | 5,459 |
| Tencent Holdings Ltd. | | 2,902,100 | 70,095 |
| Yandex NV (a) | | 406,400 | 8,799 |
| | | | 2,838,290 |
| IT Services - 3.9% | | | |
| Cognizant Technology Solutions Corp. Class A (a) | | 2,618,764 | 150,553 |
| EOH Holdings Ltd. | | 179,100 | 1,828 |
| Global Payments, Inc. | | 52,700 | 3,935 |
| MasterCard, Inc. Class A | | 2,454,783 | 233,794 |
| Vakrangee Ltd. (a) | | 726,776 | 2,032 |
| Visa, Inc. Class A | | 4,764,985 | 371,907 |
| | | | 764,049 |
| Semiconductors & Semiconductor Equipment - 3.9% | | | |
| Applied Materials, Inc. | | 4,240,000 | 111,470 |
| Cavium, Inc. (a) | | 1,131,919 | 52,827 |
| Cirrus Logic, Inc. (a) | | 1,378,327 | 66,973 |
| Lam Research Corp. | | 375,500 | 33,709 |
| Maxim Integrated Products, Inc. | | 51,100 | 2,084 |
| Mellanox Technologies Ltd. (a) | | 237,200 | 10,479 |
| Micron Technology, Inc. (a) | | 624,900 | 8,586 |
| Monolithic Power Systems, Inc. | | 68,935 | 5,013 |
| NVIDIA Corp. | | 2,329,748 | 133,029 |
| NXP Semiconductors NV (a) | | 3,852,058 | 323,920 |
| Qualcomm, Inc. | | 31,400 | 1,965 |
| Semtech Corp. (a) | | 310,700 | 7,898 |
| | | | 757,953 |
| Software - 7.4% | | | |
| Activision Blizzard, Inc. | | 5,852,287 | 235,028 |
| Adobe Systems, Inc. (a) | | 1,044,302 | 102,195 |
| Appirio, Inc. (a)(c) | | 87,529 | 315 |
| Electronic Arts, Inc. (a) | | 2,331,571 | 177,945 |
| HubSpot, Inc. (a) | | 51,829 | 2,829 |
| Microsoft Corp. | | 3,136,901 | 177,800 |
| Mobileye NV (a)(b) | | 1,495,676 | 71,658 |
| Nintendo Co. Ltd. | | 66,500 | 13,803 |
| Paycom Software, Inc. (a)(b) | | 439,065 | 20,728 |
| RealPage, Inc. (a) | | 56,000 | 1,408 |
| Red Hat, Inc. (a) | | 297,011 | 22,362 |
| Salesforce.com, Inc. (a) | | 5,669,941 | 463,801 |
| SAP AG sponsored ADR | | 120,700 | 10,548 |
| Splunk, Inc. (a) | | 163,400 | 10,219 |
| Tableau Software, Inc. (a) | | 563,624 | 31,850 |
| Workday, Inc. Class A (a) | | 827,954 | 69,002 |
| Zendesk, Inc. (a) | | 599,681 | 18,134 |
| | | | 1,429,625 |
| Technology Hardware, Storage & Peripherals - 5.6% | | | |
| Apple, Inc. | | 9,856,726 | 1,027,169 |
| Samsung Electronics Co. Ltd. | | 13,396 | 18,527 |
| Western Digital Corp. | | 771,300 | 36,644 |
| | | | 1,082,340 |
|
| TOTAL INFORMATION TECHNOLOGY | | | 6,919,266 |
|
| MATERIALS - 1.5% | | | |
| Chemicals - 1.5% | | | |
| Albemarle Corp. U.S. | | 529,242 | 44,546 |
| Ashland, Inc. | | 170,900 | 19,353 |
| CF Industries Holdings, Inc. | | 2,696,557 | 66,551 |
| E.I. du Pont de Nemours & Co. | | 140,000 | 9,684 |
| FMC Corp. | | 244,100 | 11,605 |
| Monsanto Co. | | 481,400 | 51,399 |
| Potash Corp. of Saskatchewan, Inc. | | 860,500 | 13,412 |
| PPG Industries, Inc. | | 38,500 | 4,031 |
| Sherwin-Williams Co. | | 42,300 | 12,679 |
| Sociedad Quimica y Minera de Chile SA (PN-B) sponsored ADR | | 443,400 | 10,987 |
| The Dow Chemical Co. | | 485,100 | 26,035 |
| W.R. Grace & Co. | | 51,500 | 3,856 |
| Westlake Chemical Corp. | | 171,900 | 7,863 |
| | | | 282,001 |
| Construction Materials - 0.0% | | | |
| Martin Marietta Materials, Inc. | | 20,600 | 4,175 |
| U.S. Concrete, Inc. (a) | | 31,200 | 2,012 |
| | | | 6,187 |
|
| TOTAL MATERIALS | | | 288,188 |
|
| TELECOMMUNICATION SERVICES - 0.2% | | | |
| Diversified Telecommunication Services - 0.1% | | | |
| Bharti Infratel Ltd. | | 4,836,707 | 28,692 |
| Wireless Telecommunication Services - 0.1% | | | |
| T-Mobile U.S., Inc. (a) | | 254,300 | 11,784 |
|
| TOTAL TELECOMMUNICATION SERVICES | | | 40,476 |
|
| TOTAL COMMON STOCKS | | | |
| (Cost $12,630,919) | | | 18,866,737 |
|
| Preferred Stocks - 2.6% | | | |
| Convertible Preferred Stocks - 2.5% | | | |
| CONSUMER DISCRETIONARY - 0.1% | | | |
| Internet & Catalog Retail - 0.1% | | | |
| The Honest Co., Inc.: | | | |
| Series C (a)(c) | | 350,333 | 13,491 |
| Series D (c) | | 77,448 | 2,982 |
| | | | 16,473 |
| CONSUMER STAPLES - 0.2% | | | |
| Food & Staples Retailing - 0.1% | | | |
| Blue Apron, Inc. Series D (a)(c) | | 780,377 | 12,954 |
| Food Products - 0.1% | | | |
| BLUE BOTTLE Coffee, Inc. Series C (a)(c) | | 632,822 | 10,201 |
| Tobacco - 0.0% | | | |
| PAX Labs, Inc. Series C (a)(c) | | 2,555,833 | 6,722 |
| TOTAL CONSUMER STAPLES | | | 29,877 |
| FINANCIALS - 0.0% | | | |
| Consumer Finance - 0.0% | | | |
| Oportun Finance Corp. Series H (a)(c) | | 3,552,125 | 9,804 |
| HEALTH CARE - 0.2% | | | |
| Biotechnology - 0.1% | | | |
| AC Immune SA Series E (c) | | 603,000 | 5,813 |
| Immunocore Ltd. Series A (c) | | 11,275 | 2,633 |
| Pronutria Biosciences, Inc. Series C (a)(c) | | 545,634 | 9,379 |
| | | | 17,825 |
| Health Care Providers & Services - 0.1% | | | |
| Mulberry Health, Inc. Series A8 (c) | | 2,728,716 | 19,893 |
| TOTAL HEALTH CARE | | | 37,718 |
| INDUSTRIALS - 0.1% | | | |
| Aerospace & Defense - 0.0% | | | |
| Space Exploration Technologies Corp. Series G (a)(c) | | 97,277 | 9,379 |
| Airlines - 0.0% | | | |
| Azul-Linhas Aereas Brasileiras Series B (a)(c) | | 165,571 | 7,660 |
| Professional Services - 0.1% | | | |
| YourPeople, Inc. Series C (a)(c) | | 692,196 | 10,521 |
| TOTAL INDUSTRIALS | | | 27,560 |
| INFORMATION TECHNOLOGY - 1.9% | | | |
| Internet Software & Services - 1.5% | | | |
| Jet.Com, Inc. Series B1 (c) | | 2,928,086 | 25,577 |
| Uber Technologies, Inc.: | | | |
| Series D, 8.00% (a)(c) | | 5,156,948 | 251,516 |
| Series E, 8.00% (a)(c) | | 102,648 | 5,006 |
| | | | 282,099 |
| IT Services - 0.1% | | | |
| AppNexus, Inc. Series E (a)(c) | | 646,522 | 11,133 |
| Nutanix, Inc. Series E (a)(c) | | 482,746 | 7,526 |
| | | | 18,659 |
| Software - 0.3% | | | |
| Appirio, Inc. Series E (a)(c) | | 612,702 | 2,206 |
| Bracket Computing, Inc. Series C (c) | | 1,207,761 | 4,082 |
| Cloudera, Inc. Series F (a)(c) | | 186,078 | 5,439 |
| Cloudflare, Inc. Series D (a)(c) | | 696,025 | 4,336 |
| Dataminr, Inc. Series D (a)(c) | | 277,250 | 1,785 |
| Delphix Corp. Series D (c) | | 675,445 | 3,647 |
| Malwarebytes Corp. Series B (c) | | 1,056,193 | 9,846 |
| Snapchat, Inc. Series F (a)(c) | | 899,719 | 27,639 |
| Taboola.Com Ltd. Series E (a)(c) | | 634,902 | 7,124 |
| | | | 66,104 |
| TOTAL INFORMATION TECHNOLOGY | | | 366,862 |
|
| TOTAL CONVERTIBLE PREFERRED STOCKS | | | 488,294 |
|
| Nonconvertible Preferred Stocks - 0.1% | | | |
| CONSUMER DISCRETIONARY - 0.1% | | | |
| Internet & Catalog Retail - 0.1% | | | |
| China Internet Plus Holdings Ltd. Series A-11 (c) | | 3,163,704 | 12,214 |
| TOTAL PREFERRED STOCKS | | | |
| (Cost $324,406) | | | 500,508 |
|
| Money Market Funds - 0.9% | | | |
| Fidelity Securities Lending Cash Central Fund, 0.45% (g)(h) | | | |
| (Cost $177,355) | | 177,354,712 | 177,355 |
| TOTAL INVESTMENT PORTFOLIO - 100.8% | | | |
| (Cost $13,132,680) | | | 19,544,600 |
| NET OTHER ASSETS (LIABILITIES) - (0.8)% | | | (155,656) |
| NET ASSETS - 100% | | | $19,388,944 |
Values shown as $0 may reflect amounts less than $500.
Legend
(a) Non-income producing
(b) Security or a portion of the security is on loan at period end.
(c) Restricted securities - Investment in securities not registered under the Securities Act of 1933 (excluding 144A issues). At the end of the period, the value of restricted securities (excluding 144A issues) amounted to $559,441,000 or 2.9% of net assets.
(d) Investment is owned by a wholly-owned subsidiary (Subsidiary) that is treated as a corporation for U.S. tax purposes.
(e) Security exempt from registration under Rule 144A of the Securities Act of 1933. These securities may be resold in transactions exempt from registration, normally to qualified institutional buyers. At the end of the period, the value of these securities amounted to $5,977,000 or 0.0% of net assets.
(f) Affiliated company
(g) Affiliated fund that is generally available only to investment companies and other accounts managed by Fidelity Investments. The rate quoted is the annualized seven-day yield of the fund at period end. A complete unaudited listing of the fund's holdings as of its most recent quarter end is available upon request. In addition, each Fidelity Central Fund's financial statements, which are not covered by the Fund's Report of Independent Registered Public Accounting Firm, are available on the SEC's website or upon request.
(h) Investment made with cash collateral received from securities on loan.
Additional information on each restricted holding is as follows:
| Security | Acquisition Date | Acquisition Cost (000s) |
| AC Immune SA Series E | 10/19/15 | $5,811 |
| Appirio, Inc. | 2/12/15 | $625 |
| Appirio, Inc. Series E | 2/12/15 | $4,375 |
| AppNexus, Inc. Series E | 8/1/14 | $12,951 |
| Azul-Linhas Aereas Brasileiras Series B | 12/24/13 | $7,023 |
| Azul-Linhas Aereas Brasileiras warrants | 12/24/13 | $0 |
| Blue Apron, Inc. Series D | 5/18/15 | $10,400 |
| BLUE BOTTLE Coffee, Inc. Series C | 5/29/15 | $21,086 |
| Bracket Computing, Inc. Series C | 9/9/15 | $9,500 |
| China Internet Plus Holdings Ltd. Series A-11 | 1/26/15 | $10,000 |
| Cloudera, Inc. Series F | 2/5/14 | $2,709 |
| Cloudflare, Inc. Series D | 11/5/14 - 6/24/15 | $4,349 |
| Dataminr, Inc. Series D | 3/6/15 | $3,535 |
| Delphix Corp. Series D | 7/10/15 | $6,079 |
| Dropbox, Inc. | 5/2/12 | $9,084 |
| Immunocore Ltd. Series A | 7/27/15 | $2,122 |
| Jet.Com, Inc. Series B1 | 11/24/15 | $14,605 |
| Malwarebytes Corp. Series B | 12/21/15 | $10,958 |
| Mulberry Health, Inc. Series A8 | 1/20/16 | $18,432 |
| NJOY, Inc. | 6/7/13 - 2/14/14 | $16,957 |
| Nutanix, Inc. Series E | 8/26/14 | $6,467 |
| Oportun Finance Corp. Series H | 2/6/15 | $10,114 |
| PAX Labs, Inc. Series C | 5/22/15 | $9,840 |
| Pronutria Biosciences, Inc. Series C | 1/30/15 | $5,500 |
| Snapchat, Inc. Series F | 3/25/15 - 2/12/16 | $27,639 |
| Space Exploration Technologies Corp. Class A | 10/16/15 | $14,267 |
| Space Exploration Technologies Corp. Series G | 1/20/15 | $7,535 |
| Taboola.Com Ltd. Series E | 12/22/14 | $6,619 |
| The Honest Co., Inc. | 8/21/14 | $4,062 |
| The Honest Co., Inc. Series C | 8/21/14 | $9,479 |
| The Honest Co., Inc. Series D | 8/3/15 | $3,544 |
| Tory Burch LLC unit | 5/14/15 | $20,890 |
| Uber Technologies, Inc. Series D, 8.00% | 6/6/14 | $80,000 |
| Uber Technologies, Inc. Series E, 8.00% | 12/5/14 | $3,420 |
| WME Entertainment Parent, LLC Class A unit | 4/13/16 | $7,638 |
| YourPeople, Inc. Series C | 5/1/15 | $10,314 |
Affiliated Central Funds
Information regarding fiscal year to date income earned by the Fund from investments in Fidelity Central Funds is as follows:
| Fund | Income earned |
| | (Amounts in thousands) |
| Fidelity Cash Central Fund | $45 |
| Fidelity Securities Lending Cash Central Fund | 14,459 |
| Total | $14,504 |
Other Affiliated Issuers
An affiliated company is a company in which the Fund has ownership of at least 5% of the voting securities. Fiscal year to date transactions with companies which are or were affiliates are as follows:
| Affiliate (Amounts in thousands) | Value, beginning of period | Purchases | Sales Proceeds* | Dividend Income | Value, end of period |
| Nu Skin Enterprises, Inc. Class A | $134,517 | $38,421 | $58,483 | $4,446 | $-- |
| Parsvnath Developers Ltd. | 6,516 | -- | -- | -- | 7,823 |
| Total | $141,033 | $38,421 | $58,483 | $4,446 | $7,823 |
* Includes the value of securities delivered through in-kind transactions, if applicable.
Investment Valuation
The following is a summary of the inputs used, as of July 31, 2016, involving the Fund's assets and liabilities carried at fair value. The inputs or methodology used for valuing securities may not be an indication of the risk associated with investing in those securities. For more information on valuation inputs, and their aggregation into the levels used below, please refer to the Investment Valuation section in the accompanying Notes to Financial Statements.
| | Valuation Inputs at Reporting Date: |
| Description | Total | Level 1 | Level 2 | Level 3 |
| (Amounts in thousands) | | | | |
| Investments in Securities: | | | | |
| Equities: | | | | |
| Consumer Discretionary | $5,139,294 | $4,765,309 | $320,926 | $53,059 |
| Consumer Staples | 1,578,769 | 1,548,892 | -- | 29,877 |
| Energy | 465,085 | 465,085 | -- | -- |
| Financials | 842,482 | 825,040 | -- | 17,442 |
| Health Care | 2,791,948 | 2,735,941 | 18,289 | 37,718 |
| Industrials | 934,875 | 891,859 | -- | 43,016 |
| Information Technology | 7,286,128 | 6,823,901 | 83,898 | 378,329 |
| Materials | 288,188 | 288,188 | -- | -- |
| Telecommunication Services | 40,476 | 40,476 | -- | -- |
| Money Market Funds | 177,355 | 177,355 | -- | -- |
| Total Investments in Securities: | $19,544,600 | $18,562,046 | $423,113 | $559,441 |
The following is a reconciliation of Investments in Securities for which Level 3 inputs were used in determining value:
| (Amounts in thousands) | |
| Investments in Securities: | |
| Equities - Information Technology | |
| Beginning Balance | $298,720 |
| Net Realized Gain (Loss) on Investment Securities | -- |
| Net Unrealized Gain (Loss) on Investment Securities | 37,219 |
| Cost of Purchases | 42,390 |
| Proceeds of Sales | -- |
| Amortization/Accretion | -- |
| Transfers into Level 3 | -- |
| Transfers out of Level 3 | -- |
| Ending Balance | $378,329 |
| The change in unrealized gain (loss) for the period attributable to Level 3 securities held at July 31, 2016 | $37,219 |
| Equities - Other Investments in Securities | |
| Beginning Balance | $161,801 |
| Net Realized Gain (Loss) on Investment Securities | (3,712) |
| Net Unrealized Gain (Loss) on Investment Securities | (6,036) |
| Cost of Purchases | 67,258 |
| Proceeds of Sales | (38,199) |
| Amortization/Accretion | -- |
| Transfers into Level 3 | -- |
| Transfers out of Level 3 | -- |
| Ending Balance | $181,112 |
| The change in unrealized gain (loss) for the period attributable to Level 3 securities held at July 31, 2016 | $(7,887) |
The information used in the above reconciliations represents fiscal year to date activity for any Investments in Securities identified as using Level 3 inputs at either the beginning or the end of the current fiscal period. Transfers in or out of Level 3 represent the beginning value of any Security or Instrument where a change in the pricing level occurred from the beginning to the end of the period. The cost of purchases and the proceeds of sales may include securities received or delivered through corporate actions or exchanges. Realized and unrealized gains (losses) disclosed in the reconciliations are included in Net Gain (Loss) on the Fund's Statement of Operations.
Other Information
Distribution of investments by country or territory of incorporation, as a percentage of Total Net Assets, is as follows (Unaudited):
| United States of America | 88.0% |
| Netherlands | 2.5% |
| Cayman Islands | 2.0% |
| Singapore | 2.0% |
| Germany | 1.2% |
| Ireland | 1.1% |
| Others (Individually Less Than 1%) | 3.2% |
| | 100.0% |
See accompanying notes which are an integral part of the financial statements.
Financial Statements
Statement of Assets and Liabilities
| Amounts in thousands (except per-share amounts) | | July 31, 2016 |
| Assets | | |
Investment in securities, at value (including securities loaned of $174,467) — See accompanying schedule:
Unaffiliated issuers (cost $12,924,474) | $19,359,422 | |
| Fidelity Central Funds (cost $177,355) | 177,355 | |
| Other affiliated issuers (cost $30,851) | 7,823 | |
| Total Investments (cost $13,132,680) | | $19,544,600 |
| Restricted cash | | 88 |
| Receivable for investments sold | | 334,248 |
| Receivable for fund shares sold | | 8,839 |
| Dividends receivable | | 4,422 |
| Distributions receivable from Fidelity Central Funds | | 210 |
| Other receivables | | 963 |
| Total assets | | 19,893,370 |
| Liabilities | | |
| Payable to custodian bank | $4,852 | |
| Payable for investments purchased | 273,978 | |
| Payable for fund shares redeemed | 37,391 | |
| Accrued management fee | 7,695 | |
| Other affiliated payables | 2,233 | |
| Other payables and accrued expenses | 922 | |
| Collateral on securities loaned, at value | 177,355 | |
| Total liabilities | | 504,426 |
| Net Assets | | $19,388,944 |
| Net Assets consist of: | | |
| Paid in capital | | $12,865,681 |
| Undistributed net investment income | | 29,362 |
| Accumulated undistributed net realized gain (loss) on investments and foreign currency transactions | | 82,002 |
| Net unrealized appreciation (depreciation) on investments and assets and liabilities in foreign currencies | | 6,411,899 |
| Net Assets | | $19,388,944 |
| Blue Chip Growth: | | |
| Net Asset Value, offering price and redemption price per share ($14,230,492 ÷ 204,689 shares) | | $69.52 |
| Class K: | | |
| Net Asset Value, offering price and redemption price per share ($5,158,452 ÷ 74,041 shares) | | $69.67 |
See accompanying notes which are an integral part of the financial statements.
Statement of Operations
| Amounts in thousands | | Year ended July 31, 2016 |
| Investment Income | | |
| Dividends (including $4,446 earned from other affiliated issuers) | | $171,375 |
| Income from Fidelity Central Funds (including $14,459 from security lending) | | 14,504 |
| Total income | | 185,879 |
| Expenses | | |
| Management fee | | |
| Basic fee | $107,928 | |
| Performance adjustment | 17,980 | |
| Transfer agent fees | 26,104 | |
| Accounting and security lending fees | 1,776 | |
| Custodian fees and expenses | 382 | |
| Independent trustees' fees and expenses | 88 | |
| Registration fees | 351 | |
| Audit | 190 | |
| Legal | 56 | |
| Interest | 40 | |
| Miscellaneous | 153 | |
| Total expenses before reductions | 155,048 | |
| Expense reductions | (741) | 154,307 |
| Net investment income (loss) | | 31,572 |
| Realized and Unrealized Gain (Loss) | | |
| Net realized gain (loss) on: | | |
| Investment securities: | | |
| Unaffiliated issuers | 379,021 | |
| Other affiliated issuers | (34,403) | |
| Foreign currency transactions | (586) | |
| Total net realized gain (loss) | | 344,032 |
Change in net unrealized appreciation (depreciation) on:
Investment securities (net of decrease in deferred foreign taxes of $1,459) | (1,020,369) | |
| Assets and liabilities in foreign currencies | (24) | |
| Total change in net unrealized appreciation (depreciation) | | (1,020,393) |
| Net gain (loss) | | (676,361) |
| Net increase (decrease) in net assets resulting from operations | | $(644,789) |
See accompanying notes which are an integral part of the financial statements.
Statement of Changes in Net Assets
| Amounts in thousands | Year ended July 31, 2016 | Year ended July 31, 2015 |
| Increase (Decrease) in Net Assets | | |
| Operations | | |
| Net investment income (loss) | $31,572 | $20,601 |
| Net realized gain (loss) | 344,032 | 1,230,303 |
| Change in net unrealized appreciation (depreciation) | (1,020,393) | 2,175,419 |
| Net increase (decrease) in net assets resulting from operations | (644,789) | 3,426,323 |
| Distributions to shareholders from net investment income | (10,672) | (27,789) |
| Distributions to shareholders from net realized gain | (1,033,010) | (1,011,245) |
| Total distributions | (1,043,682) | (1,039,034) |
| Share transactions - net increase (decrease) | (166,801) | 2,274,956 |
| Total increase (decrease) in net assets | (1,855,272) | 4,662,245 |
| Net Assets | | |
| Beginning of period | 21,244,216 | 16,581,971 |
| End of period | $19,388,944 | $21,244,216 |
| Other Information | | |
| Undistributed net investment income end of period | $29,362 | $9,347 |
See accompanying notes which are an integral part of the financial statements.
Financial Highlights — Fidelity Blue Chip Growth Fund
| Years ended July 31, | 2016 | 2015 | 2014 | 2013 | 2012 |
| Selected Per–Share Data | | | | | |
| Net asset value, beginning of period | $75.25 | $66.72 | $59.65 | $47.38 | $48.17 |
| Income from Investment Operations | | | | | |
| Net investment income (loss)A | .09 | .05 | .15 | .39 | .10 |
| Net realized and unrealized gain (loss) | (2.16) | 12.56 | 11.63 | 12.79 | .75 |
| Total from investment operations | (2.07) | 12.61 | 11.78 | 13.18 | .85 |
| Distributions from net investment income | (.03) | (.09) | (.24) | (.23) | (.04) |
| Distributions from net realized gain | (3.63) | (3.99) | (4.47) | (.68) | (1.60) |
| Total distributions | (3.66) | (4.08) | (4.71) | (.91) | (1.64) |
| Net asset value, end of period | $69.52 | $75.25 | $66.72 | $59.65 | $47.38 |
| Total ReturnB | (2.59)% | 19.72% | 21.07% | 28.25% | 2.27% |
| Ratios to Average Net AssetsC,D | | | | | |
| Expenses before reductions | .82% | .89% | .80% | .76% | .90% |
| Expenses net of fee waivers, if any | .82% | .89% | .80% | .76% | .90% |
| Expenses net of all reductions | .82% | .88% | .80% | .74% | .89% |
| Net investment income (loss) | .13% | .07% | .23% | .75% | .21% |
| Supplemental Data | | | | | |
| Net assets, end of period (in millions) | $14,230 | $15,346 | $11,970 | $12,927 | $10,595 |
| Portfolio turnover rateE | 50%F | 51%F | 57%F | 75% | 95% |
A Calculated based on average shares outstanding during the period.
B Total returns would have been lower if certain expenses had not been reduced during the applicable periods shown.
C Fees and expenses of any underlying Fidelity Central Funds are not included in the Fund's expense ratio. The Fund indirectly bears its proportionate share of the expenses of any underlying Fidelity Central Funds.
D Expense ratios reflect operating expenses of the class. Expenses before reductions do not reflect amounts reimbursed by the investment adviser or reductions from brokerage service arrangements or reductions from other expense offset arrangements and do not represent the amount paid by the class during periods when reimbursements or reductions occur. Expenses net of fee waivers reflect expenses after reimbursement by the investment adviser but prior to reductions from brokerage service arrangements or other expense offset arrangements. Expenses net of all reductions represent the net expenses paid by the class.
E Amount does not include the portfolio activity of any underlying Fidelity Central Funds.
F Portfolio turnover rate excludes securities received or delivered in-kind.
See accompanying notes which are an integral part of the financial statements.
Financial Highlights — Fidelity Blue Chip Growth Fund Class K
| Years ended July 31, | 2016 | 2015 | 2014 | 2013 | 2012 |
| Selected Per–Share Data | | | | | |
| Net asset value, beginning of period | $75.36 | $66.82 | $59.74 | $47.46 | $48.21 |
| Income from Investment Operations | | | | | |
| Net investment income (loss)A | .16 | .13 | .23 | .47 | .17 |
| Net realized and unrealized gain (loss) | (2.15) | 12.57 | 11.64 | 12.79 | .75 |
| Total from investment operations | (1.99) | 12.70 | 11.87 | 13.26 | .92 |
| Distributions from net investment income | (.07) | (.17) | (.33) | (.30) | (.08) |
| Distributions from net realized gain | (3.63) | (3.99) | (4.47) | (.68) | (1.60) |
| Total distributions | (3.70) | (4.16) | (4.79)B | (.98) | (1.67)C |
| Net asset value, end of period | $69.67 | $75.36 | $66.82 | $59.74 | $47.46 |
| Total ReturnD | (2.47)% | 19.84% | 21.23% | 28.42% | 2.43% |
| Ratios to Average Net AssetsE,F | | | | | |
| Expenses before reductions | .70% | .78% | .68% | .61% | .74% |
| Expenses net of fee waivers, if any | .70% | .77% | .68% | .61% | .74% |
| Expenses net of all reductions | .70% | .77% | .67% | .60% | .73% |
| Net investment income (loss) | .25% | .19% | .36% | .89% | .37% |
| Supplemental Data | | | | | |
| Net assets, end of period (in millions) | $5,158 | $5,898 | $4,612 | $3,506 | $2,467 |
| Portfolio turnover rateG | 50%H | 51%H | 57%H | 75% | 95% |
A Calculated based on average shares outstanding during the period.
B Total distributions of $4.79 per share is comprised of distributions from net investment income of $.325 and distributions from net realized gain of $4.466 per share.
C Total distributions of $1.67 per share is comprised of distributions from net investment income of $.076 and distributions from net realized gain of $1.598 per share.
D Total returns would have been lower if certain expenses had not been reduced during the applicable periods shown.
E Fees and expenses of any underlying Fidelity Central Funds are not included in the Fund's expense ratio. The Fund indirectly bears its proportionate share of the expenses of any underlying Fidelity Central Funds.
F Expense ratios reflect operating expenses of the class. Expenses before reductions do not reflect amounts reimbursed by the investment adviser or reductions from brokerage service arrangements or reductions from other expense offset arrangements and do not represent the amount paid by the class during periods when reimbursements or reductions occur. Expenses net of fee waivers reflect expenses after reimbursement by the investment adviser but prior to reductions from brokerage service arrangements or other expense offset arrangements. Expenses net of all reductions represent the net expenses paid by the class.
G Amount does not include the portfolio activity of any underlying Fidelity Central Funds.
H Portfolio turnover rate excludes securities received or delivered in-kind.
See accompanying notes which are an integral part of the financial statements.
Notes to Financial Statements
For the period ended July 31, 2016
(Amounts in thousands except percentages)
1. Organization.
Fidelity Blue Chip Growth Fund (the Fund) is a fund of Fidelity Securities Fund (the Trust) and is authorized to issue an unlimited number of shares. The Trust is registered under the Investment Company Act of 1940, as amended (the 1940 Act), as an open-end management investment company organized as a Massachusetts business trust. The Fund offers Blue Chip Growth and Class K shares, each of which has equal rights as to assets and voting privileges. Each class has exclusive voting rights with respect to matters that affect that class.
2. Investments in Fidelity Central Funds.
The Fund invests in Fidelity Central Funds, which are open-end investment companies generally available only to other investment companies and accounts managed by the investment adviser and its affiliates. The Fund's Schedule of Investments lists each of the Fidelity Central Funds held as of period end, if any, as an investment of the Fund, but does not include the underlying holdings of each Fidelity Central Fund. As an Investing Fund, the Fund indirectly bears its proportionate share of the expenses of the underlying Fidelity Central Funds.
The Money Market Central Funds seek preservation of capital and current income and are managed by Fidelity Investments Money Management, Inc. (FIMM), an affiliate of the investment adviser. Annualized expenses of the Money Market Central Funds as of their most recent shareholder report date are less than .005%.
A complete unaudited list of holdings for each Fidelity Central Fund is available upon request or at the Securities and Exchange Commission (the SEC) website at www.sec.gov. In addition, the financial statements of the Fidelity Central Funds, which are not covered by the Fund's Report of Independent Registered Public Accounting Firm, are available on the SEC website or upon request.
3. Significant Accounting Policies.
The financial statements have been prepared in conformity with accounting principles generally accepted in the United States of America (GAAP), which require management to make certain estimates and assumptions at the date of the financial statements. Actual results could differ from those estimates. Subsequent events, if any, through the date that the financial statements were issued have been evaluated in the preparation of the financial statements. The following summarizes the significant accounting policies of the Fund:
Investment Valuation. Investments are valued as of 4:00 p.m. Eastern time on the last calendar day of the period. The Board of Trustees (the Board) has delegated the day to day responsibility for the valuation of the Fund's investments to the Fidelity Management & Research Company (FMR) Fair Value Committee (the Committee). In accordance with valuation policies and procedures approved by the Board, the Fund attempts to obtain prices from one or more third party pricing vendors or brokers to value its investments. When current market prices, quotations or currency exchange rates are not readily available or reliable, investments will be fair valued in good faith by the Committee, in accordance with procedures adopted by the Board. Factors used in determining fair value vary by investment type and may include market or investment specific events. The frequency with which these procedures are used cannot be predicted and they may be utilized to a significant extent. The Committee oversees the Fund's valuation policies and procedures and reports to the Board on the Committee's activities and fair value determinations. The Board monitors the appropriateness of the procedures used in valuing the Fund's investments and ratifies the fair value determinations of the Committee.
The Fund categorizes the inputs to valuation techniques used to value its investments into a disclosure hierarchy consisting of three levels as shown below:
- Level 1 – quoted prices in active markets for identical investments
- Level 2 – other significant observable inputs (including quoted prices for similar investments, interest rates, prepayment speeds, etc.)
- Level 3 – unobservable inputs (including the Fund's own assumptions based on the best information available)
Valuation techniques used to value the Fund's investments by major category are as follows:
Equity securities, including restricted securities, for which market quotations are readily available, are valued at the last reported sale price or official closing price as reported by a third party pricing vendor on the primary market or exchange on which they are traded and are categorized as Level 1 in the hierarchy. In the event there were no sales during the day or closing prices are not available, securities are valued at the last quoted bid price or may be valued using the last available price and are generally categorized as Level 2 in the hierarchy. For foreign equity securities, when market or security specific events arise, comparisons to the valuation of American Depositary Receipts (ADRs), futures contracts, Exchange-Traded Funds (ETFs) and certain indexes as well as quoted prices for similar securities may be used and would be categorized as Level 2 in the hierarchy. Utilizing these techniques may result in transfers between Level 1 and Level 2. For equity securities, including restricted securities, where observable inputs are limited, assumptions about market activity and risk are used and these securities may be categorized as Level 3 in the hierarchy. Equity securities, including restricted securities, for which observable inputs are not available are valued using alternate valuation approaches, including the market approach and the income approach and are categorized as Level 3 in the hierarchy. The market approach generally consists of using comparable market transactions while the income approach generally consists of using the net present value of estimated future cash flows, adjusted as appropriate for liquidity, credit, market and/or other risk factors.
Investments in open-end mutual funds, including Fidelity Central Funds, are valued at their closing net asset value (NAV) each business day and are categorized as Level 1 in the hierarchy.
The following provides information on Level 3 securities held by the Fund that were valued at period end based on unobservable inputs. These amounts exclude valuations provided by a broker.
| Asset Type | Fair Value at 7/31/16 | Valuation Technique(s) | Unobservable Input | Amount or Range/Weighted Average | Impact to Valuation from an Increase in Input(a) |
| Equities | $559,441 | Discounted cash flow | Discount rate | 15.0% | Decrease |
| | | | Weighted average cost of capital (WACC) | 11.6% | Decrease |
| | | | Discount for lack of marketability | 20.0% - 25.0% / 21.5% | Decrease |
| | | | Growth rate | 2.5% - 3.0% / 2.9% | Increase |
| | | Market approach | Discount rate | 15.0% | Decrease |
| | | | Acquisition terms | $8.74 | Increase |
| | | | Transaction price | $0.00 - $150.00 / $48.45 | Increase |
| | | | Proxy based premium | 21.3% | Increase |
| | | | Premium rate | 15.0% | Increase |
| | | | Put premium | 72.5% | Increase |
| | | Market comparable | Enterprise value/Sales multiple (EV/S) | 0.6 - 15.6 / 4.1 | Increase |
| | | | Discount rate | 0.9% - 30.0% / 10.6% | Decrease |
| | | | Price/Earnings multiple (P/E) | 10.6 - 10.9 / 10.7 | Increase |
| | | | Enterprise value/EBITDA multiple (EV/EBITDA) | 9.9 | Increase |
| | | | Discount for lack of marketability | 10.0% - 25.0% / 14.5% | Decrease |
| | | | Enterprise value/Gross profit multiple (EV/GP) | 4.8 | Increase |
| | | | Premium rate | 1.0% - 235.0% / 35.9% | Increase |
| | | | Recovery rate | 0.0% | Increase |
| | | Recovery value | Liquidation preference | $12.75 - $23.41 / $21.94 | Increase |
(a) Represents the expected directional change in the fair value of the Level 3 investments that would result from an increase in the corresponding input. A decrease to the unobservable input would have the opposite effect. Significant changes in these inputs could result in significantly higher or lower fair value measurements.
Changes in valuation techniques may result in transfers in or out of an assigned level within the disclosure hierarchy. The aggregate value of investments by input level as of July 31, 2016, as well as a roll forward of Level 3 investments, is included at the end of the Fund's Schedule of Investments.
Foreign Currency. The Fund may use foreign currency contracts to facilitate transactions in foreign-denominated securities. Gains and losses from these transactions may arise from changes in the value of the foreign currency or if the counterparties do not perform under the contracts' terms.
Foreign-denominated assets, including investment securities, and liabilities are translated into U.S. dollars at the exchange rates at period end. Purchases and sales of investment securities, income and dividends received and expenses denominated in foreign currencies are translated into U.S. dollars at the exchange rate in effect on the transaction date.
The effects of exchange rate fluctuations on investments are included with the net realized and unrealized gain (loss) on investment securities. Other foreign currency transactions resulting in realized and unrealized gain (loss) are disclosed separately.
Investment Transactions and Income. For financial reporting purposes, the Fund's investment holdings and NAV include trades executed through the end of the last business day of the period. The NAV per share for processing shareholder transactions is calculated as of the close of business of the New York Stock Exchange (NYSE), normally 4:00 p.m. Eastern time and includes trades executed through the end of the prior business day. Gains and losses on securities sold are determined on the basis of identified cost and may include proceeds received from litigation. Dividend income is recorded on the ex-dividend date, except for certain dividends from foreign securities where the ex-dividend date may have passed, which are recorded as soon as the Fund is informed of the ex-dividend date. Non-cash dividends included in dividend income, if any, are recorded at the fair market value of the securities received. Income and capital gain distributions from Fidelity Central Funds, if any, are recorded on the ex-dividend date. Distributions received on securities that represent a return of capital or capital gain are recorded as a reduction of cost of investments and/or as a realized gain. Subsequent to ex-dividend date the Fund determines the components of these distributions, based upon receipt of tax filings or other correspondence relating to the underlying investment. Investment income is recorded net of foreign taxes withheld where recovery of such taxes is uncertain.
Class Allocations and Expenses. Investment income, realized and unrealized capital gains and losses, common expenses of the Fund, and certain fund-level expense reductions, if any, are allocated daily on a pro-rata basis to each class based on the relative net assets of each class to the total net assets of the Fund. Each class differs with respect to transfer agent fees incurred. Certain expense reductions may also differ by class. For the reporting period, the allocated portion of income and expenses to each class as a percent of its average net assets may vary due to the timing of recording these transactions in relation to fluctuating net assets of the classes. Expenses directly attributable to a fund are charged to that fund. Expenses attributable to more than one fund are allocated among the respective funds on the basis of relative net assets or other appropriate methods. Expense estimates are accrued in the period to which they relate and adjustments are made when actual amounts are known.
Deferred Trustee Compensation. Under a Deferred Compensation Plan (the Plan), independent Trustees may elect to defer receipt of a portion of their annual compensation. Deferred amounts are invested in a cross-section of Fidelity funds, are marked-to-market and remain in the Fund until distributed in accordance with the Plan. The investment of deferred amounts and the offsetting payable to the Trustees are included in the accompanying Statement of Assets and Liabilities.
Income Tax Information and Distributions to Shareholders. Each year, the Fund intends to qualify as a regulated investment company under Subchapter M of the Internal Revenue Code, including distributing substantially all of its taxable income and realized gains. As a result, no provision for U.S. Federal income taxes is required. As of July 31, 2016, the Fund did not have any unrecognized tax benefits in the financial statements; nor is the Fund aware of any tax positions for which it is reasonably possible that the total amounts of unrecognized tax benefits will significantly change in the next twelve months. The Fund files a U.S. federal tax return, in addition to state and local tax returns as required. The Fund's federal income tax returns are subject to examination by the Internal Revenue Service (IRS) for a period of three fiscal years after they are filed. State and local tax returns may be subject to examination for an additional fiscal year depending on the jurisdiction. Foreign taxes are provided for based on the Fund's understanding of the tax rules and rates that exist in the foreign markets in which it invests.
Distributions are declared and recorded on the ex-dividend date. Income dividends and capital gain distributions are declared separately for each class. Income and capital gain distributions are determined in accordance with income tax regulations, which may differ from GAAP. In addition, the Fund claimed a portion of the payment made to redeeming shareholders as a distribution for income tax purposes.
Capital accounts within the financial statements are adjusted for permanent book-tax differences. These adjustments have no impact on net assets or the results of operations. Capital accounts are not adjusted for temporary book-tax differences which will reverse in a subsequent period.
Book-tax differences are primarily due to foreign currency transactions, passive foreign investment companies (PFIC), redemptions in kind, security level mergers and exchanges, partnerships, deferred trustees compensation and losses deferred due to wash sales.
The federal tax cost of investment securities and unrealized appreciation (depreciation) as of period end were as follows:
| Gross unrealized appreciation | $6,961,896 |
| Gross unrealized depreciation | (707,075) |
| Net unrealized appreciation (depreciation) on securities | $6,254,821 |
| Tax Cost | $13,289,779 |
The tax-based components of distributable earnings as of period end were as follows:
| Undistributed ordinary income | $30,132 |
| Undistributed long-term capital gain | $239,101 |
| Net unrealized appreciation (depreciation) on securities and other investments | $6,254,800 |
The tax character of distributions paid was as follows:
| | July 31, 2016 | July 31, 2015 |
| Ordinary Income | $10,672 | $ 90,358 |
| Long-term Capital Gains | 1,033,010 | 948,676 |
| Total | $1,043,682 | $ 1,039,034 |
Restricted Securities. The Fund may invest in securities that are subject to legal or contractual restrictions on resale. These securities generally may be resold in transactions exempt from registration or to the public if the securities are registered. Disposal of these securities may involve time-consuming negotiations and expense, and prompt sale at an acceptable price may be difficult. Information regarding restricted securities is included at the end of the Fund's Schedule of Investments.
Consolidated Subsidiary. The Fund invests in certain investments through a wholly-owned subsidiary ("Subsidiary"), which may be subject to federal and state taxes upon disposition.
At period end, investments held through these Subsidiaries were $25,992 representing 0.13% of the Fund's net assets. The financial statements have been consolidated and include accounts of the Fund and each Subsidiary. Accordingly, all inter-company transactions and balances have been eliminated.
Any cash held by the Subsidiaries is restricted as to its use and is presented as Restricted cash in the Statement of Assets and Liabilities.
4. Purchases and Sales of Investments.
Purchases and sales of securities, other than short-term securities and in-kind transactions, aggregated $9,836,124 and $10,767,022, respectively.
Exchanges In-Kind. Cash and investments received in-kind through subscriptions totaled $30,618 in exchange for 494 shares of the Fund. The amount of in-kind exchanges is included in share transactions in the accompanying Statement of Changes in Net Assets as well as Note 11: Share Transactions. The Fund recognized no gain or loss for federal income tax purposes.
Redemptions In-Kind. During the period, 4,038 shares of the Fund held by unaffiliated entities were redeemed in-kind for cash and investments with a value of $271,157. The net realized gain of $132,873 on investments delivered through the in-kind redemptions is included in the accompanying Statement of Operations. The amount of in-kind redemptions is included in share transactions in the accompanying Statement of Changes in Net Assets as well as Note 11: Share Transactions. The Fund recognized no gain or loss for federal income tax purposes.
Prior Fiscal Year Redemptions In-Kind. During the prior period, 1,878 shares of the Fund held by unaffiliated entities were redeemed for cash and investments with a value of $137,687. The Fund had a net realized gain of $67,543 on investments delivered through the in-kind redemption. The amount of in-kind redemptions is included in share transactions in the accompanying Statement of Changes in Net Assets as well as Note 11: Share Transactions. The Fund recognized no gain or loss for federal income tax purposes.
5. Fees and Other Transactions with Affiliates.
Management Fee. Fidelity Management & Research Company (the investment adviser) and its affiliates provide the Fund with investment management related services for which the Fund pays a monthly management fee. The management fee is the sum of an individual fund fee rate that is based on an annual rate of .30% of the Fund's average net assets and an annualized group fee rate that averaged .25% during the period. The group fee rate is based upon the average net assets of all the mutual funds advised by the investment adviser, including any mutual funds previously advised by the investment adviser that are currently advised by Fidelity SelectCo, LLC, an affiliate of the investment adviser. The group fee rate decreases as assets under management increase and increases as assets under management decrease. In addition, the management fee is subject to a performance adjustment (up to a maximum of +/- .20% of the Fund's average net assets over a 36 month performance period). The upward or downward adjustment to the management fee is based on the relative investment performance of Blue Chip Growth as compared to its benchmark index, the Russell 1000 Growth Index, over the same 36 month performance period. For the reporting period, the total annual management fee rate, including the performance adjustment, was .64% of the Fund's average net assets. The performance adjustment included in the management fee rate may be higher or lower than the maximum performance adjustment rate due to the difference between the average net assets for the reporting and performance periods.
Transfer Agent Fees. Fidelity Investments Institutional Operations Company, Inc., (FIIOC), an affiliate of the investment adviser, is the transfer, dividend disbursing and shareholder servicing agent for each class of the Fund. FIIOC receives account fees and asset-based fees that vary according to the account size and type of account of the shareholders of Blue Chip Growth, except for Class K. FIIOC receives an asset-based fee of Class K's average net assets. FIIOC pays for typesetting, printing and mailing of shareholder reports, except proxy statements.
For the period, transfer agent fees for each class were as follows:
| | Amount | % of
Class-Level Average
Net Assets |
| Blue Chip Growth | $23,645 | .16 |
| Class K | 2,459 | .05 |
| | $26,104 | |
Accounting and Security Lending Fees. Fidelity Service Company, Inc. (FSC), an affiliate of the investment adviser, maintains the Fund's accounting records. The accounting fee is based on the level of average net assets for each month. Under a separate contract, FSC administers the security lending program. The security lending fee is based on the number and duration of lending transactions.
Brokerage Commissions. The Fund placed a portion of its portfolio transactions with brokerage firms which are affiliates of the investment adviser. Brokerage commissions are included in net realized gain (loss) and change in net unrealized appreciation (depreciation) in the Statement of Operations. The commissions paid to these affiliated firms were $210 for the period.
Interfund Lending Program. Pursuant to an Exemptive Order issued by the SEC, the Fund, along with other registered investment companies having management contracts with FMR or other affiliated entities of FMR, may participate in an interfund lending program. This program provides an alternative credit facility allowing the funds to borrow from, or lend money to, other participating affiliated funds. At period end, there were no interfund loans outstanding. The Fund's activity in this program during the period for which loans were outstanding was as follows:
| Borrower or Lender | Average Loan Balance | Weighted Average Interest Rate | Interest Expense |
| Borrower | $18,932 | .59% | $37 |
Interfund Trades. The Fund may purchase from or sell securities to other Fidelity Funds under procedures adopted by the Board. The procedures have been designed to ensure these interfund trades are executed in accordance with Rule 17a-7 of the 1940 Act. Interfund trades are included within the respective purchases and sales amounts shown in the Purchases and Sales of Investments note.
6. Committed Line of Credit.
The Fund participates with other funds managed by the investment adviser or an affiliate in a $4.25 billion credit facility (the "line of credit") to be utilized for temporary or emergency purposes to fund shareholder redemptions or for other short-term liquidity purposes. The Fund has agreed to pay commitment fees on its pro-rata portion of the line of credit, which amounted to $40 and is reflected in Miscellaneous expenses on the Statement of Operations. During the period, the Fund did not borrow on this line of credit.
7. Security Lending.
The Fund lends portfolio securities through a lending agent from time to time in order to earn additional income. For equity securities, a lending agent is used and may loan securities to certain qualified borrowers, including Fidelity Capital Markets (FCM), a broker-dealer affiliated with the Fund. On the settlement date of the loan, the Fund receives collateral (in the form of U.S. Treasury obligations, letters of credit and/or cash) against the loaned securities and maintains collateral in an amount not less than 100% of the market value of the loaned securities during the period of the loan. The market value of the loaned securities is determined at the close of business of the Fund and any additional required collateral is delivered to the Fund on the next business day. The Fund or borrower may terminate the loan at any time, and if the borrower defaults on its obligation to return the securities loaned because of insolvency or other reasons, the Fund may apply collateral received from the borrower against the obligation. The Fund may experience delays and costs in recovering the securities loaned. Any cash collateral received is invested in the Fidelity Securities Lending Cash Central Fund. The value of loaned securities and cash collateral at period end are disclosed on the Fund's Statement of Assets and Liabilities. The value of securities loaned to FCM at period end was $17,585. Security lending income represents the income earned on investing cash collateral, less rebates paid to borrowers and any lending agent fees associated with the loan, plus any premium payments received for lending certain types of securities. Security lending income is presented in the Statement of Operations as a component of income from Fidelity Central Funds, and includes $1,464 from securities loaned to FCM.
8. Bank Borrowings.
The Fund is permitted to have bank borrowings for temporary or emergency purposes to fund shareholder redemptions or for other short-term liquidity requirements. The Fund has established borrowing arrangements with certain banks. The interest rate on the borrowings is the bank's base rate, as revised from time to time. The average loan balance during the period for which loans were outstanding amounted to $14,295. The weighted average interest rate was .89%. The interest expense amounted to $3 under the bank borrowing program. At period end, there were no bank borrowings outstanding.
9. Expense Reductions.
Commissions paid to certain brokers with whom the investment adviser, or its affiliates, places trades on behalf of the Fund include an amount in addition to trade execution, which may be rebated back to the Fund to offset certain expenses. This amount totaled $589 for the period. In addition, through arrangements with the Fund's custodian, credits realized as a result of certain uninvested cash balances were used to reduce the Fund's expenses. During the period, these credits reduced the Fund's custody expenses by $1.
In addition, during the period the investment adviser reimbursed and/or waived a portion of fund-level operating expenses in the amount of $151.
10. Distributions to Shareholders.
Distributions to shareholders of each class were as follows:
| | Year ended
July 31, 2016 | Year ended
July 31, 2015 |
| From net investment income | | |
| Blue Chip Growth | $5,376 | $15,581 |
| Class K | 5,296 | 12,208 |
| Total | $10,672 | $27,789 |
| From net realized gain | | |
| Blue Chip Growth | $753,870 | $722,639 |
| Class K | 279,140 | 288,606 |
| Total | $1,033,010 | $1,011,245 |
11. Share Transactions.
Share transactions for each class were as follows and may contain automatic conversions between classes or exchanges between affiliated funds:
| | Shares | Shares | Dollars | Dollars |
| | Year ended
July 31, 2016 | Year ended July 31, 2015 | Year ended
July 31, 2016 | Year ended July 31, 2015 |
| Blue Chip Growth | | | | |
| Shares sold | 44,585 | 45,258 | $2,977,524 | $3,161,935 |
| Reinvestment of distributions | 10,852 | 10,699 | 732,287 | 715,067 |
| Shares redeemed | (54,678) | (31,433) | (3,600,373) | (2,196,025) |
| Net increase (decrease) | 759 | 24,524 | $109,438 | $1,680,977 |
| Class K | | | | |
| Shares sold | 16,845(a) | 26,108 | $1,123,164(a) | $1,808,830 |
| Reinvestment of distributions | 4,210 | 4,497 | 284,436 | 300,814 |
| Shares redeemed | (25,279)(b) | (21,373)(c) | (1,683,839)(b) | (1,515,665)(c) |
| Net increase (decrease) | (4,224) | 9,232 | $(276,239) | $593,979 |
(a) Amount includes in-kind exchanges (see Note 4: Exchanges In-Kind).
(b) Amount includes in-kind redemptions (see Note 4: Redemptions In-Kind).
(c) Amount includes in-kind redemptions (see Note 4: Prior Fiscal Year Redemptions In-Kind).
12. Other.
The Fund's organizational documents provide former and current trustees and officers with a limited indemnification against liabilities arising in connection with the performance of their duties to the Fund. In the normal course of business, the Fund may also enter into contracts that provide general indemnifications. The Fund's maximum exposure under these arrangements is unknown as this would be dependent on future claims that may be made against the Fund. The risk of material loss from such claims is considered remote.
Report of Independent Registered Public Accounting Firm
To the Trustees of Fidelity Securities Fund and Shareholders of Fidelity Blue Chip Growth Fund:
We have audited the accompanying statement of assets and liabilities of Fidelity Blue Chip Growth Fund (the Fund), a fund of Fidelity Securities Fund, including the schedule of investments, as of July 31, 2016, and the related statement of operations for the year then ended, the statement of changes in net assets for each of the two years in the period then ended, and the financial highlights for each of the five years in the period then ended. These financial statements and financial highlights are the responsibility of the Fund's management. Our responsibility is to express an opinion on these financial statements and financial highlights based on our audits.
We conducted our audits in accordance with the standards of the Public Company Accounting Oversight Board (United States). Those standards require that we plan and perform the audit to obtain reasonable assurance about whether the financial statements and financial highlights are free of material misstatement. The Fund is not required to have, nor were we engaged to perform, an audit of its internal control over financial reporting. Our audits included consideration of internal control over financial reporting as a basis for designing audit procedures that are appropriate in the circumstances, but not for the purpose of expressing an opinion on the effectiveness of the Fund's internal control over financial reporting. Accordingly, we express no such opinion. An audit also includes examining, on a test basis, evidence supporting the amounts and disclosures in the financial statements, assessing the accounting principles used and significant estimates made by management, as well as evaluating the overall financial statement presentation. Our procedures included confirmation of securities owned as of July 31, 2016, by correspondence with the custodians and brokers; when replies were not received from brokers, we performed other auditing procedures. We believe that our audits provide a reasonable basis for our opinion.
In our opinion, such financial statements and financial highlights referred to above present fairly, in all material respects, the financial position of Fidelity Blue Chip Growth Fund as of July 31, 2016, the results of its operations for the year then ended, the changes in its net assets for each of the two years in the period then ended, and the financial highlights for each of the five years in the period then ended in conformity with accounting principles generally accepted in the United States of America.
DELOITTE & TOUCHE LLP
Boston, Massachusetts
September 20, 2016
Trustees and Officers
The Trustees, Members of the Advisory Board (if any), and officers of the trust and fund, as applicable, are listed below. The Board of Trustees governs the fund and is responsible for protecting the interests of shareholders. The Trustees are experienced executives who meet periodically throughout the year to oversee the fund's activities, review contractual arrangements with companies that provide services to the fund, oversee management of the risks associated with such activities and contractual arrangements, and review the fund's performance. Each of the Trustees oversees 170 funds.
The Trustees hold office without limit in time except that (a) any Trustee may resign; (b) any Trustee may be removed by written instrument, signed by at least two-thirds of the number of Trustees prior to such removal; (c) any Trustee who requests to be retired or who has become incapacitated by illness or injury may be retired by written instrument signed by a majority of the other Trustees; and (d) any Trustee may be removed at any special meeting of shareholders by a two-thirds vote of the outstanding voting securities of the trust. Each Trustee who is not an interested person (as defined in the 1940 Act) of the trust and the fund is referred to herein as an Independent Trustee. Each Independent Trustee shall retire not later than the last day of the calendar year in which his or her 75th birthday occurs. The Independent Trustees may waive this mandatory retirement age policy with respect to individual Trustees. Officers and Advisory Board Members hold office without limit in time, except that any officer or Advisory Board Member may resign or may be removed by a vote of a majority of the Trustees at any regular meeting or any special meeting of the Trustees. Except as indicated, each individual has held the office shown or other offices in the same company for the past five years.
The fund’s Statement of Additional Information (SAI) includes more information about the Trustees. To request a free copy, call Fidelity at 1-800-544-8544.
Experience, Skills, Attributes, and Qualifications of the Trustees. The Governance and Nominating Committee has adopted a statement of policy that describes the experience, qualifications, attributes, and skills that are necessary and desirable for potential Independent Trustee candidates (Statement of Policy). The Board believes that each Trustee satisfied at the time he or she was initially elected or appointed a Trustee, and continues to satisfy, the standards contemplated by the Statement of Policy. The Governance and Nominating Committee also engages professional search firms to help identify potential Independent Trustee candidates who have the experience, qualifications, attributes, and skills consistent with the Statement of Policy. From time to time, additional criteria based on the composition and skills of the current Independent Trustees, as well as experience or skills that may be appropriate in light of future changes to board composition, business conditions, and regulatory or other developments, have also been considered by the professional search firms and the Governance and Nominating Committee. In addition, the Board takes into account the Trustees' commitment and participation in Board and committee meetings, as well as their leadership of standing and ad hoc committees throughout their tenure.
In determining that a particular Trustee was and continues to be qualified to serve as a Trustee, the Board has considered a variety of criteria, none of which, in isolation, was controlling. The Board believes that, collectively, the Trustees have balanced and diverse experience, qualifications, attributes, and skills, which allow the Board to operate effectively in governing the fund and protecting the interests of shareholders. Information about the specific experience, skills, attributes, and qualifications of each Trustee, which in each case led to the Board's conclusion that the Trustee should serve (or continue to serve) as a trustee of the fund, is provided below.
Board Structure and Oversight Function. James C. Curvey is an interested person and currently serves as Chairman. The Trustees have determined that an interested Chairman is appropriate and benefits shareholders because an interested Chairman has a personal and professional stake in the quality and continuity of services provided to the fund. Independent Trustees exercise their informed business judgment to appoint an individual of their choosing to serve as Chairman, regardless of whether the Trustee happens to be independent or a member of management. The Independent Trustees have determined that they can act independently and effectively without having an Independent Trustee serve as Chairman and that a key structural component for assuring that they are in a position to do so is for the Independent Trustees to constitute a substantial majority for the Board. The Independent Trustees also regularly meet in executive session. Ned C. Lautenbach serves as Chairman of the Independent Trustees and as such (i) acts as a liaison between the Independent Trustees and management with respect to matters important to the Independent Trustees and (ii) with management prepares agendas for Board meetings.
Fidelity® funds are overseen by different Boards of Trustees. The fund's Board oversees Fidelity's high income and certain equity funds, and other Boards oversee Fidelity's investment-grade bond, money market, asset allocation, and sector funds. The asset allocation funds may invest in Fidelity® funds overseen by the fund's Board. The use of separate Boards, each with its own committee structure, allows the Trustees of each group of Fidelity® funds to focus on the unique issues of the funds they oversee, including common research, investment, and operational issues. On occasion, the separate Boards establish joint committees to address issues of overlapping consequences for the Fidelity® funds overseen by each Board.
The Trustees operate using a system of committees to facilitate the timely and efficient consideration of all matters of importance to the Trustees, the fund, and fund shareholders and to facilitate compliance with legal and regulatory requirements and oversight of the fund's activities and associated risks. The Board, acting through its committees, has charged FMR and its affiliates with (i) identifying events or circumstances the occurrence of which could have demonstrably adverse effects on the fund's business and/or reputation; (ii) implementing processes and controls to lessen the possibility that such events or circumstances occur or to mitigate the effects of such events or circumstances if they do occur; and (iii) creating and maintaining a system designed to evaluate continuously business and market conditions in order to facilitate the identification and implementation processes described in (i) and (ii) above. Because the day-to-day operations and activities of the fund are carried out by or through FMR, its affiliates, and other service providers, the fund's exposure to risks is mitigated but not eliminated by the processes overseen by the Trustees. While each of the Board's committees has responsibility for overseeing different aspects of the fund's activities, oversight is exercised primarily through the Operations, Audit, and Compliance Committees. In addition, the Independent Trustees have worked with FMR to enhance the Board's oversight of investment and financial risks, legal and regulatory risks, technology risks, and operational risks, including the development of additional risk reporting to the Board. For example, a working group comprised of Independent Trustees and FMR has worked and continues to work to review the Fidelity® funds' valuation-related activities, reporting and risk management. Appropriate personnel, including but not limited to the fund's Chief Compliance Officer (CCO), FMR's internal auditor, the independent accountants, the fund's Treasurer and portfolio management personnel, make periodic reports to the Board's committees, as appropriate, including an annual review of Fidelity's risk management program for the Fidelity® funds. The responsibilities of each standing committee, including their oversight responsibilities, are described further under "Standing Committees of the Trustees."
Interested Trustees*:
Correspondence intended for a Trustee who is an interested person may be sent to Fidelity Investments, 245 Summer Street, Boston, Massachusetts 02210.
Name, Year of Birth; Principal Occupations and Other Relevant Experience+
James C. Curvey (1935)
Year of Election or Appointment: 2007
Trustee
Chairman of the Board of Trustees
Mr. Curvey also serves as Trustee of other Fidelity® funds. Mr. Curvey is a Director of Fidelity Research & Analysis Co. (investment adviser firm, 2009-present), and Vice Chairman (2007-present) and Director of FMR LLC (diversified financial services company). In addition, Mr. Curvey serves as an Overseer for the Boston Symphony Orchestra and a member of the board of Artis-Naples, Naples, Florida, and as a Trustee for Brewster Academy, Wolfeboro, New Hampshire. Previously, Mr. Curvey served as a Director of Fidelity Investments Money Management, Inc. (investment adviser firm, 2009-2014) and a Director of FMR and FMR Co., Inc. (investment adviser firms, 2007-2014).
Charles S. Morrison (1960)
Year of Election or Appointment: 2014
Trustee
Mr. Morrison also serves as Trustee of other funds. He serves as a Director of Fidelity Investments Money Management, Inc. (FIMM) (investment adviser firm, 2014-present), Director of Fidelity SelectCo, LLC (investment adviser firm, 2014-present), President, Asset Management (2014-present), and is an employee of Fidelity Investments. Previously, Mr. Morrison served as Vice President of Fidelity's Fixed Income and Asset Allocation Funds (2012-2014), President, Fixed Income (2011-2014), Vice President of Fidelity's Money Market Funds (2005-2009), President, Money Market Group Leader of FMR (investment adviser firm, 2009), and Senior Vice President, Money Market Group of FMR (2004-2009). Mr. Morrison also served as Vice President of Fidelity's Bond Funds (2002-2005), certain Balanced Funds (2002-2005), and certain Asset Allocation Funds (2002-2007), and as Senior Vice President (2002-2005) of Fidelity's Bond Division.
* Determined to be an “Interested Trustee” by virtue of, among other things, his or her affiliation with the trust or various entities under common control with FMR.
+ The information includes the Trustee's principal occupation during the last five years and other information relating to the experience, attributes, and skills relevant to the Trustee's qualifications to serve as a Trustee, which led to the conclusion that the Trustee should serve as a Trustee for the fund.
Independent Trustees:
Correspondence intended for an Independent Trustee may be sent to Fidelity Investments, P.O. Box 55235, Boston, Massachusetts 02205-5235.
Name, Year of Birth; Principal Occupations and Other Relevant Experience+
Dennis J. Dirks (1948)
Year of Election or Appointment: 2005
Trustee
Mr. Dirks also serves as Trustee of other Fidelity® funds. Prior to his retirement in May 2003, Mr. Dirks was Chief Operating Officer and a member of the Board of The Depository Trust & Clearing Corporation (DTCC). He also served as President, Chief Operating Officer, and Board member of The Depository Trust Company (DTC) and President and Board member of the National Securities Clearing Corporation (NSCC). In addition, Mr. Dirks served as Chief Executive Officer and Board member of the Government Securities Clearing Corporation, Chief Executive Officer and Board member of the Mortgage-Backed Securities Clearing Corporation, as a Trustee and a member of the Finance Committee of Manhattan College (2005-2008), as a Trustee and a member of the Finance Committee of AHRC of Nassau County (2006-2008), and as a member of the Independent Directors Council (IDC) Governing Council (2010-2015). Mr. Dirks is a member of the Board of Directors for The Brookville Center for Children's Services, Inc. (2009-present).
Alan J. Lacy (1953)
Year of Election or Appointment: 2008
Trustee
Mr. Lacy also serves as Trustee of other Fidelity® funds. Mr. Lacy serves as Chairman (2014-present) and a member (2010-present) of the Board of Directors of Dave & Buster's Entertainment, Inc. (restaurant and entertainment complexes) and a Director of Bristol-Myers Squibb Company (global pharmaceuticals, 2008-present). He is a Trustee of the California Chapter of The Nature Conservancy (2015-present) and a Director of the Center for Advanced Study in the Behavioral Sciences at Stanford University (2015-present). In addition, Mr. Lacy served as Senior Adviser (2007-2014) of Oak Hill Capital Partners, L.P. (private equity) and also served as Chief Executive Officer (2005) and Vice Chairman (2005-2006) of Sears Holdings Corporation (retail) and Chief Executive Officer and Chairman of the Board of Sears, Roebuck and Co. (retail, 2000-2005). Previously, Mr. Lacy served as Chairman (2008-2011) and a member (2006-2015) of the Board of Trustees of the National Parks Conservation Association and as a member of the Board of Directors for The Western Union Company (global money transfer, 2006-2011), The Hillman Companies, Inc. (hardware wholesalers, 2010-2014), and Earth Fare, Inc. (retail grocery, 2010-2014).
Ned C. Lautenbach (1944)
Year of Election or Appointment: 2000
Trustee
Chairman of the Independent Trustees
Mr. Lautenbach also serves as Trustee of other Fidelity® funds. Mr. Lautenbach currently serves as the Lead Director of the Eaton Corporation Board of Directors (diversified industrial, 1997-present). Mr. Lautenbach is Chairman of the Board of Directors of Artis-Naples in Naples, Florida (2012-present), a member of the Council on Foreign Relations (1994-present), and a member of the Board of Governors, State University System of Florida (2013-present). Previously, Mr. Lautenbach was a Partner/Advisory Partner at Clayton, Dubilier & Rice, LLC (private equity investment, 1998-2010), as well as a Director of Sony Corporation (2006-2007).
Joseph Mauriello (1944)
Year of Election or Appointment: 2008
Trustee
Mr. Mauriello also serves as Trustee of other Fidelity® funds. Prior to his retirement in January 2006, Mr. Mauriello served in numerous senior management positions including Deputy Chairman and Chief Operating Officer (2004-2005), and Vice Chairman of Financial Services (2002-2004) of KPMG LLP US (professional services, 1965-2005). Mr. Mauriello currently serves as a member of the Board of Directors of XL Group plc. (global insurance and re-insurance, 2006-present) and the Independent Directors Council (IDC) Governing Council (2015-present). Previously, Mr. Mauriello served as a Director of the Hamilton Funds of the Bank of New York (2006-2007) and of Arcadia Resources Inc. (health care services and products, 2007-2012).
Robert W. Selander (1950)
Year of Election or Appointment: 2011
Trustee
Mr. Selander also serves as Trustee of other Fidelity® funds. Mr. Selander serves as a Director of The Western Union Company (global money transfer, 2014-present) and a non-executive Chairman of Health Equity, Inc. (health savings custodian, 2015-present). Previously, Mr. Selander served as a Member of the Advisory Board of certain Fidelity® funds (2011), and Executive Vice Chairman (2010), Chief Executive Officer (2009-2010), and President and Chief Executive Officer (1997-2009) of Mastercard, Inc.
Cornelia M. Small (1944)
Year of Election or Appointment: 2005
Trustee
Ms. Small also serves as Trustee of other Fidelity® funds. Ms. Small is a member of the Board of Directors (2009-present) and Chair of the Investment Committee (2010-present) of the Teagle Foundation. Ms. Small also serves on the Investment Committee of the Berkshire Taconic Community Foundation (2008-present). Previously, Ms. Small served as Chairperson (2002-2008) and a member of the Investment Committee and Chairperson (2008-2012) and a member of the Board of Trustees of Smith College. In addition, Ms. Small served as Chief Investment Officer, Director of Global Equity Investments, and a member of the Board of Directors of Scudder, Stevens & Clark and Scudder Kemper Investments.
William S. Stavropoulos (1939)
Year of Election or Appointment: 2002
Trustee
Vice Chairman of the Independent Trustees
Mr. Stavropoulos also serves as Trustee of other Fidelity® funds. Mr. Stavropoulos serves as President and Founder of the Michigan Baseball Foundation, the Great Lakes Loons (2007-present). Mr. Stavropoulos is Chairman Emeritus of the Board of Directors of The Dow Chemical Company, where he previously served in numerous senior management positions, including President, CEO (1995-2000; 2002-2004), Chairman of the Executive Committee (2000-2006), and as a member of the Board of Directors (1990-2006). Currently, Mr. Stavropoulos is Chairman of the Board of Directors of Univar Inc. (global distributor of commodity and specialty chemicals), a Director of Teradata Corporation (data warehousing and technology solutions), and Maersk Inc. (industrial conglomerate), and a member of the Advisory Board for Metalmark Capital LLC (private equity investment, 2005-present). Mr. Stavropoulos is an operating advisor to Clayton, Dubilier & Rice, LLC (private equity investment). In addition, Mr. Stavropoulos is a member of the University of Notre Dame Advisory Council for the College of Science, a Trustee of the Rollin L. Gerstacker Foundation, and a Director of the Naples Philharmonic Center for the Arts. Previously, Mr. Stavropoulos served as a Director of Chemical Financial Corporation (bank holding company, 1993-2012) and Tyco International, Ltd. (multinational manufacturing and services, 2007-2012).
David M. Thomas (1949)
Year of Election or Appointment: 2008
Trustee
Mr. Thomas also serves as Trustee of other Fidelity® funds. Mr. Thomas serves as Non-Executive Chairman of the Board of Directors of Fortune Brands Home and Security (home and security products, 2011-present), as a member of the Board of Directors (2004-present) and Presiding Director (2013-present) of Interpublic Group of Companies, Inc. (marketing communication), and as a member of the Board of Trustees of the University of Florida (2013-present). Previously, Mr. Thomas served as Executive Chairman (2005-2006) and Chairman and Chief Executive Officer (2000-2005) of IMS Health, Inc. (pharmaceutical and healthcare information solutions), and a Director of Fortune Brands, Inc. (consumer products, 2000-2011).
+ The information includes the Trustee's principal occupation during the last five years and other information relating to the experience, attributes, and skills relevant to the Trustee's qualifications to serve as a Trustee, which led to the conclusion that the Trustee should serve as a Trustee for the fund.
Advisory Board Members and Officers:
Correspondence intended for an officer or Peter S. Lynch may be sent to Fidelity Investments, 245 Summer Street, Boston, Massachusetts 02210. Officers appear below in alphabetical order.
Name, Year of Birth; Principal Occupation
Peter S. Lynch (1944)
Year of Election or Appointment: 2003
Member of the Advisory Board
Mr. Lynch also serves as Member of the Advisory Board of other Fidelity® funds. Mr. Lynch is Vice Chairman and a Director of FMR (investment adviser firm) and FMR Co., Inc. (investment adviser firm). In addition, Mr. Lynch serves as a Trustee of Boston College and as the Chairman of the Inner-City Scholarship Fund. Previously, Mr. Lynch served on the Special Olympics International Board of Directors (1997-2006).
Marc R. Bryant (1966)
Year of Election or Appointment: 2015
Secretary and Chief Legal Officer (CLO)
Mr. Bryant also serves as Secretary and CLO of other funds. Mr. Bryant serves as CLO, Secretary, and Senior Vice President of Fidelity Management & Research Company (investment adviser firm, 2015-present) and FMR Co., Inc. (investment adviser firm, 2015-present); Secretary of Fidelity SelectCo, LLC (investment adviser firm, 2015-present) and Fidelity Investments Money Management, Inc. (investment adviser firm, 2015-present); and CLO of Fidelity Management & Research (Hong Kong) Limited and FMR Investment Management (U.K.) Limited (investment adviser firms, 2015-present) and Fidelity Management & Research (Japan) Limited (investment adviser firm, 2016-present). He is Senior Vice President and Deputy General Counsel of FMR LLC (diversified financial services company). Previously, Mr. Bryant served as Secretary and CLO of Fidelity Rutland Square Trust II (2010-2014) and Assistant Secretary of Fidelity's Fixed Income and Asset Allocation Funds (2013-2015). Prior to joining Fidelity Investments, Mr. Bryant served as a Senior Vice President and the Head of Global Retail Legal for AllianceBernstein L.P. (2006-2010), and as the General Counsel for ProFund Advisors LLC (2001-2006).
Jeffrey S. Christian (1961)
Year of Election or Appointment: 2016
Assistant Treasurer
Mr. Christian also serves as Assistant Treasurer of other funds. Mr. Christian is an employee of Fidelity Investments (2003-present).
William C. Coffey (1969)
Year of Election or Appointment: 2009
Assistant Secretary
Mr. Coffey also serves as Assistant Secretary of other funds. He is Senior Vice President and Deputy General Counsel of FMR LLC (diversified financial services company, 2010-present), and is an employee of Fidelity Investments. Previously, Mr. Coffey served as Vice President and Associate General Counsel of FMR LLC (2005-2009).
Jonathan Davis (1968)
Year of Election or Appointment: 2010
Assistant Treasurer
Mr. Davis also serves as Assistant Treasurer of other funds, and is an employee of Fidelity Investments. Previously, Mr. Davis served as Vice President and Associate General Counsel of FMR LLC (diversified financial services company, 2003-2010).
Adrien E. Deberghes (1967)
Year of Election or Appointment: 2016
Assistant Treasurer
Mr. Deberghes also serves as an officer of other funds. He serves as Executive Vice President of Fidelity Investments Money Management, Inc. (FIMM) (investment adviser firm, 2016-present) and is an employee of Fidelity Investments (2008-present). Prior to joining Fidelity Investments, Mr. Deberghes was Senior Vice President of Mutual Fund Administration at State Street Corporation (2007-2008), Senior Director of Mutual Fund Administration at Investors Bank & Trust (2005-2007), and Director of Finance for Dunkin' Brands (2000-2005). Previously, Mr. Deberghes served in other fund officer roles.
Stephanie J. Dorsey (1969)
Year of Election or Appointment: 2010
Assistant Treasurer
Ms. Dorsey also serves as an officer of other funds. She is an employee of Fidelity Investments (2008-present) and has served in other fund officer roles. Prior to joining Fidelity Investments, Ms. Dorsey served as Treasurer (2004-2008) of the JPMorgan Mutual Funds and Vice President (2004-2008) of JPMorgan Chase Bank.
Howard J. Galligan III (1966)
Year of Election or Appointment: 2014
Chief Financial Officer
Mr. Galligan also serves as Chief Financial Officer of other funds. Mr. Galligan serves as President of Fidelity Pricing and Cash Management Services (FPCMS) (2014-present) and as a Director of Strategic Advisers, Inc. (investment adviser firm, 2008-present). Previously, Mr. Galligan served as Chief Administrative Officer of Asset Management (2011-2014) and Chief Operating Officer and Senior Vice President of Investment Support for Strategic Advisers, Inc. (2003-2011).
Scott C. Goebel (1968)
Year of Election or Appointment: 2015
Vice President
Mr. Goebel serves as Vice President of other funds and is an employee of Fidelity Investments (2001-present). Mr. Goebel serves as Senior Vice President of Fidelity Management & Research Company (FMR) (investment adviser firm, 2016-present). Previously, Mr. Goebel served as Secretary of Fidelity SelectCo, LLC (investment adviser firm, 2013-2015), Fidelity Investments Money Management, Inc. (FIMM) (investment adviser firm, 2010-2015), and Fidelity Research and Analysis Company (FRAC) (investment adviser firm, 2010-2015); General Counsel, Secretary, and Senior Vice President of FMR (investment adviser firm, 2008-2015) and FMR Co., Inc. (investment adviser firm, 2008-2015); Assistant Secretary of Fidelity Management & Research (Japan) Limited (investment adviser firm, 2008-2015) and Fidelity Management & Research (U.K.) Inc. (investment adviser firm, 2008-2015); Chief Legal Officer (CLO) of Fidelity Management & Research (Hong Kong) Limited (investment adviser firm, 2008-2015); Secretary and CLO of certain Fidelity® funds (2008-2015); Assistant Secretary of FIMM (2008-2010), FRAC (2008-2010), and certain funds (2007-2008); and as Vice President and Secretary of Fidelity Distributors Corporation (FDC) (2005-2007).
Brian B. Hogan (1964)
Year of Election or Appointment: 2009
Vice President
Mr. Hogan also serves as Trustee or Vice President of other funds. Mr. Hogan serves as a Director of FMR Investment Management (U.K.) Limited (investment adviser firm, 2015-present) and Fidelity SelectCo, LLC (investment adviser firm, 2014-present) and President of the Equity Division of FMR (investment adviser firm, 2009-present). Previously, Mr. Hogan served as Senior Vice President, Equity Research of FMR (2006-2009) and as a portfolio manager. Mr. Brian B. Hogan is not related to Mr. Colm A. Hogan.
Colm A. Hogan (1973)
Year of Election or Appointment: 2016
Deputy Treasurer
Mr. Hogan also serves as an officer of other funds. Mr. Hogan is an employee of Fidelity Investments (2005-present). Mr. Colm A. Hogan is not related to Mr. Brian B. Hogan.
Chris Maher (1972)
Year of Election or Appointment: 2013
Assistant Treasurer
Mr. Maher serves as Assistant Treasurer of other funds. Mr. Maher is Vice President of Valuation Oversight and is an employee of Fidelity Investments. Previously, Mr. Maher served as Vice President of Asset Management Compliance (2013), Vice President of the Program Management Group of FMR (investment adviser firm, 2010-2013), and Vice President of Valuation Oversight (2008-2010).
John F. Papandrea (1972)
Year of Election or Appointment: 2016
Anti-Money Laundering (AML) Officer
Mr. Papandrea also serves as AML Officer of other funds. Mr. Papandrea is Vice President of FMR LLC (diversified financial services company, 2008-present) and is an employee of Fidelity Investments (2005-present).
Melissa M. Reilly (1971)
Year of Election or Appointment: 2014
Vice President of certain Equity Funds
Ms. Reilly also serves as Vice President of other funds. Ms. Reilly is an employee of Fidelity Investments (2004-present).
Kenneth B. Robins (1969)
Year of Election or Appointment: 2016
Chief Compliance Officer
Mr. Robins also serves as an officer of other funds. Mr. Robins serves as Compliance Officer of Fidelity Management & Research Company and FMR Co., Inc. (investment adviser firms, 2016-present) and is an employee of Fidelity Investments (2004-present). Previously, Mr. Robins served as Executive Vice President of Fidelity Investments Money Management, Inc. (investment adviser firm, 2013-2016) and served in other fund officer roles.
Stacie M. Smith (1974)
Year of Election or Appointment: 2016
President and Treasurer
Ms. Smith also serves as an officer of other funds. She is an employee of Fidelity Investments (2009-present) and has served in other fund officer roles. Prior to joining Fidelity Investments, Ms. Smith served as Senior Audit Manager of Ernst & Young LLP (1996-2009). Previously, Ms. Smith served as Deputy Treasurer of certain Fidelity® funds (2013-2016).
Renee Stagnone (1975)
Year of Election or Appointment: 2016
Assistant Treasurer
Ms. Stagnone also serves as an officer of other funds. Ms. Stagnone is an employee of Fidelity Investments (1997-present). Previously, Ms. Stagnone served as Deputy Treasurer of certain Fidelity® funds (2013-2016).
Shareholder Expense Example
As a shareholder of the Fund, you incur two types of costs: (1) transaction costs and (2) ongoing costs, including management fees and other Fund expenses. This Example is intended to help you understand your ongoing costs (in dollars) of investing in the Fund and to compare these costs with the ongoing costs of investing in other mutual funds.
The Example is based on an investment of $1,000 invested at the beginning of the period and held for the entire period (February 1, 2016 to July 31, 2016).
Actual Expenses
The first line of the accompanying table for each class of the Fund provides information about actual account values and actual expenses. You may use the information in this line, together with the amount you invested, to estimate the expenses that you paid over the period. Simply divide your account value by $1,000.00 (for example, an $8,600 account value divided by $1,000.00 = 8.6), then multiply the result by the number in the first line for a class of the Fund under the heading entitled "Expenses Paid During Period" to estimate the expenses you paid on your account during this period. A small balance maintenance fee of $12.00 that is charged once a year may apply for certain accounts with a value of less than $2,000. This fee is not included in the table below. If it was, the estimate of expenses you paid during the period would be higher, and your ending account value lower, by this amount. In addition, the Fund, as a shareholder in the underlying Fidelity Central Funds, will indirectly bear its pro-rata share of the fees and expenses incurred by the underlying Fidelity Central Funds. These fees and expenses are not included in the Fund's annualized expense ratio used to calculate the expense estimate in the table below.
Hypothetical Example for Comparison Purposes
The second line of the accompanying table for each class of the Fund provides information about hypothetical account values and hypothetical expenses based on a Class' actual expense ratio and an assumed rate of return of 5% per year before expenses, which is not the Class' actual return. The hypothetical account values and expenses may not be used to estimate the actual ending account balance or expenses you paid for the period. You may use this information to compare the ongoing costs of investing in the Fund and other funds. To do so, compare this 5% hypothetical example with the 5% hypothetical examples that appear in the shareholder reports of the other funds. A small balance maintenance fee of $12.00 that is charged once a year may apply for certain accounts with a value of less than $2,000. This fee is not included in the table below. If it was, the estimate of expenses you paid during the period would be higher, and your ending account value lower, by this amount. In addition, the Fund, as a shareholder in the underlying Fidelity Central Funds, will indirectly bear its pro-rata share of the fees and expenses incurred by the underlying Fidelity Central Funds. These fees and expenses are not included in the Fund's annualized expense ratio used to calculate the expense estimate in the table below.
Please note that the expenses shown in the table are meant to highlight your ongoing costs only and do not reflect any transaction costs. Therefore, the second line of the table is useful in comparing ongoing costs only, and will not help you determine the relative total costs of owning different funds.
| | Annualized Expense Ratio-A | Beginning
Account Value
February 1, 2016 | Ending
Account Value
July 31, 2016 | Expenses Paid
During Period-B
February 1, 2016
to July 31, 2016 |
| Blue Chip Growth | .74% | | | |
| Actual | | $1,000.00 | $1,099.00 | $3.86 |
| Hypothetical-C | | $1,000.00 | $1,021.18 | $3.72 |
| Class K | .62% | | | |
| Actual | | $1,000.00 | $1,099.60 | $3.24 |
| Hypothetical-C | | $1,000.00 | $1,021.78 | $3.12 |
A Annualized expense ratio reflects expenses net of applicable fee waivers.
B Expenses are equal to each Class' annualized expense ratio, multiplied by the average account value over the period, multiplied by 182/366 (to reflect the one-half year period).
C 5% return per year before expenses
Distributions (Unaudited)
The Board of Trustees of Fidelity Blue Chip Growth Fund voted to pay to shareholders of record at the opening of business on record date, the following distributions per share derived from capital gains realized from sales of portfolio securities, and dividends derived from net investment income:
| | Pay Date | Record Date | Dividends | Capital Gains |
| Blue Chip Growth | 09/19/16 | 09/16/16 | $0.090 | $0.873 |
| Class K | 09/19/16 | 09/16/16 | $0.173 | $0.873 |
| | |
The fund hereby designates as a capital gain dividend with respect to the taxable year ended July 31, 2016, $299,746,135, or, if subsequently determined to be different, the net capital gain of such year.
Blue Chip Growth and Class K designate 100% of the dividends distributed during the fiscal year as qualifying for the dividends–received deduction for corporate shareholders.
Blue Chip Growth and Class K designate 100% of the dividends distributed during the fiscal year as amounts which may be taken into account as a dividend for purposes of the maximum rate under section 1(h)(11) of the Internal Revenue Code.
The fund will notify shareholders in January 2017 of amounts for use in preparing 2016 income tax returns.
Board Approval of Investment Advisory Contracts and Management Fees
Fidelity Blue Chip Growth Fund
Each year, the Board of Trustees, including the Independent Trustees (together, the Board), votes on the renewal of the management contract with Fidelity Management & Research Company (FMR) and the sub-advisory agreements (together, the Advisory Contracts) for the fund. The Board, assisted by the advice of fund counsel and Independent Trustees' counsel, requests and considers a broad range of information relevant to the renewal of the Advisory Contracts throughout the year.
The Board meets regularly and, at each of its meetings, covers an extensive agenda of topics and materials and considers factors that are relevant to its annual consideration of the renewal of the fund's Advisory Contracts, including the services and support provided to the fund and its shareholders. The Board has established various standing committees (Committees), each composed of and chaired by Independent Trustees with varying backgrounds, to which the Board has assigned specific subject matter responsibilities in order to enhance effective decision-making by the Board. The Board, acting directly and through its Committees, requests and receives information concerning the annual consideration of the renewal of the fund's Advisory Contracts. The Board also meets as needed to consider matters specifically related to the Board's annual consideration of the renewal of the Advisory Contracts. Members of the Board may also meet with trustees of other Fidelity funds through ad hoc joint committees to discuss certain matters relevant to all of the Fidelity funds.
At its July 2016 meeting, the Board unanimously determined to renew the fund's Advisory Contracts. In reaching its determination, the Board considered all factors it believed relevant, including (i) the nature, extent, and quality of the services to be provided to the fund and its shareholders (including the investment performance of the fund); (ii) the competitiveness of the fund's management fee and total expense ratio relative to peer funds; (iii) the total costs of the services to be provided by and the profits to be realized by Fidelity from its relationships with the fund; and (iv) the extent to which, if any, economies of scale exist and would be realized as the fund grows, and whether any economies of scale are appropriately shared with fund shareholders.
In considering whether to renew the Advisory Contracts for the fund, the Board reached a determination, with the assistance of fund counsel and Independent Trustees' counsel and through the exercise of its business judgment, that the renewal of the Advisory Contracts was in the best interests of the fund and its shareholders and that the compensation payable under the Advisory Contracts was fair and reasonable. The Board's decision to renew the Advisory Contracts was not based on any single factor, but rather was based on a comprehensive consideration of all the information provided to the Board at its meetings throughout the year. The Board, in reaching its determination to renew the Advisory Contracts, was aware that shareholders of the fund have a broad range of investment choices available to them, including a wide choice among funds offered by Fidelity's competitors, and that the fund's shareholders, who have the opportunity to review and weigh the disclosure provided by the fund in its prospectus and other public disclosures, have chosen to invest in this fund, which is part of the Fidelity family of funds.
Nature, Extent, and Quality of Services Provided. The Board considered Fidelity's staffing as it relates to the fund, including the backgrounds of investment personnel of Fidelity, and also considered the fund's investment objective, strategies, and related investment philosophy. The Independent Trustees also had discussions with senior management of Fidelity's investment operations and investment groups. The Board considered the structure of the investment personnel compensation program and whether this structure provides appropriate incentives to act in the best interests of the fund. Additionally, the Board considered the portfolio managers' investments, if any, in the funds that they manage.
Resources Dedicated to Investment Management and Support Services. The Board and the Fund Oversight and Research Committees reviewed the general qualifications and capabilities of Fidelity's investment staff, including its size, education, experience, and resources, as well as Fidelity's approach to recruiting, training, managing, and compensating investment personnel. The Board noted that Fidelity has continued to increase the resources devoted to non-U.S. offices, including expansion of Fidelity's global investment organization. The Board also noted that Fidelity's analysts have extensive resources, tools and capabilities that allow them to conduct sophisticated quantitative and fundamental analysis, as well as credit analysis of issuers, counterparties and guarantors. Further, the Board considered that Fidelity's investment professionals have sufficient access to global information and data so as to provide competitive investment results over time, and that those professionals also have access to sophisticated tools that permit them to assess portfolio construction and risk and performance attribution characteristics continuously, as well as to transmit new information and research conclusions rapidly around the world. Additionally, in its deliberations, the Board considered Fidelity's trading, risk management, compliance, and technology and operations capabilities and resources, which are integral parts of the investment management process.
Shareholder and Administrative Services. The Board considered (i) the nature, extent, quality, and cost of advisory, administrative, and shareholder services performed by FMR, the sub-advisers (together with FMR, the Investment Advisers), and their affiliates under the Advisory Contracts and under separate agreements covering transfer agency, pricing and bookkeeping, and securities lending services for the fund; (ii) the nature and extent of the supervision of third party service providers, principally custodians, subcustodians, and pricing vendors; and (iii) the resources devoted to, and the record of compliance with, the fund's compliance policies and procedures. The Board also reviewed the allocation of fund brokerage, including allocations to brokers affiliated with the Investment Advisers, the use of brokerage commissions to pay fund expenses, and the use of "soft" commission dollars to pay for research services.
The Board noted that the growth of fund assets over time across the complex allows Fidelity to reinvest in the development of services designed to enhance the value or convenience of the Fidelity funds as investment vehicles. These services include 24-hour access to account information and market information through telephone representatives and over the Internet, investor education materials and asset allocation tools, and the expanded availability of Fidelity Investor Centers.
In 2014, the Board formed an ad hoc Committee on Transfer Agency Fees to review the variety of transfer agency fee structures throughout the industry and Fidelity's competitive positioning with respect to industry participants.
Investment in a Large Fund Family. The Board considered the benefits to shareholders of investing in a Fidelity fund, including the benefits of investing in a fund that is part of a large family of funds offering a variety of investment disciplines and providing a large variety of mutual fund investor services. The Board noted that Fidelity had taken, or had made recommendations that resulted in the Fidelity funds taking, a number of actions over the previous year that benefited particular funds, including: (i) continuing to dedicate additional resources to investment research and to the support of the senior management team that oversees asset management; (ii) continuing efforts to enhance Fidelity's global research capabilities; (iii) launching new funds and making other enhancements to meet client needs; (iv) broadening eligibility requirements for certain lower-priced share classes of, and streamlining the fee structure for, certain existing equity index funds; (v) lowering expense caps for certain existing funds and classes to reduce expenses paid by shareholders; (vi) eliminating redemption fees for certain variable insurance product funds and classes; (vii) continuing to launch dedicated lower cost underlying funds to meet portfolio construction needs related to expanding underlying fund options for Fidelity funds of funds, specifically for the Freedom Fund product lines; (viii) launching a lower cost share class for use by the Freedom Index Fund product line; (ix) rationalizing product lines and gaining increased efficiencies through fund mergers and share class consolidations; (x) continuing to develop, acquire and implement systems and technology to improve services to the funds and shareholders, strengthen information security, and increase efficiency; (xi) implementing investment enhancements to further strengthen Fidelity's target date product line to increase investors' probability of success in achieving their goals; (xii) accelerating the conversion of all remaining Class B shares to Class A shares, which have a lower expense structure; and (xiii) implementing changes to Fidelity's money market fund product line in response to recent regulatory reforms.
Investment Performance. The Board considered whether the fund has operated in accordance with its investment objective, as well as its record of compliance with its investment restrictions and its performance history.
The Board took into account discussions with representatives of the Investment Advisers about fund investment performance that occur at Board meetings throughout the year. In this regard the Board noted that as part of regularly scheduled fund reviews and other reports to the Board on fund performance, the Board considers annualized return information for the fund, for different time periods, measured against a securities market index ("benchmark index") and a peer group of funds with similar objectives ("peer group"), if any. In its evaluation of fund investment performance, the Board gave particular attention to information indicating changes in performance of certain Fidelity funds for specific time periods and discussed with the Investment Advisers the reasons for any overperformance or underperformance.
In addition to reviewing absolute and relative fund performance, the Independent Trustees periodically consider the appropriateness of fund performance metrics in evaluating the results achieved. In general, the Independent Trustees believe that fund performance should be evaluated based on net performance (after fees and expenses) of both the highest performing and lowest performing fund share classes, where applicable, compared to appropriate benchmark indices, over appropriate time periods that may include full market cycles, and compared to peer groups, as applicable, over the same periods, taking into account relevant factors including the following: general market conditions; issuer-specific information; and fund cash flows and other factors.
The Independent Trustees recognize that shareholders evaluate performance on a net basis over their own holding periods, for which one-, three-, and five-year periods are often used as a proxy. For this reason, the performance information reviewed by the Board also included net cumulative calendar year total return information for the fund and an appropriate benchmark index and peer group for the most recent one-, three-, and five-year periods, as shown below. Returns are shown compared to the 25th percentile (top of box, 75% beaten) and 75th percentile (bottom of box, 25% beaten) of the peer universe.
Fidelity Blue Chip Growth Fund
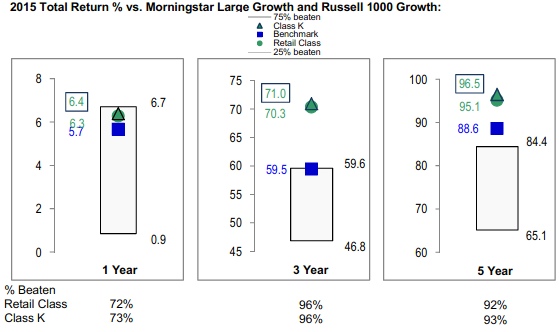
The Board also considered that the fund's management fee is subject to upward or downward adjustment depending upon whether, and to what extent, the fund's investment performance for the performance period exceeds, or is exceeded by, a securities index, thus leading to a performance adjustment for the same period. The Board noted that the performance adjustment provides FMR with a strong economic incentive to seek to achieve superior performance for the fund's shareholders and helps to more closely align the interests of FMR and the shareholders of the fund.
Based on its review, the Board concluded that the nature, extent, and quality of services provided to the fund under the Advisory Contracts should continue to benefit the shareholders of the fund.
Competitiveness of Management Fee and Total Expense Ratio. The Board considered the fund's management fee and total expense ratio compared to "mapped groups" of competitive funds and classes created for the purpose of facilitating the Trustees' competitive analysis of management fees and total expenses. Fidelity creates "mapped groups" by combining similar Broadridge investment objective categories that have comparable investment mandates. Combining Broadridge investment objective categories aids the Board's management fee and total expense ratio comparisons by broadening the competitive group used for comparison.
Management Fee. The Board considered two proprietary management fee comparisons for the 12-month periods shown in basis points (BP) in the chart below. The group of Broadridge funds used by the Board for management fee comparisons is referred to below as the "Total Mapped Group." The Total Mapped Group comparison focuses on a fund's standing in terms of gross management fees before expense reimbursements or caps, and without giving effect to the fund's performance adjustment, relative to the total universe of funds with comparable investment mandates, regardless of whether their management fee structures also are comparable. Funds with comparable investment mandates offer exposure to similar types of securities. Funds with comparable management fee structures have similar management fee contractual arrangements (
e.g., flat rate charged for advisory services, all-inclusive fee rate,
etc.). "TMG %" represents the percentage of funds in the Total Mapped Group that had management fees that were lower than the fund's. For example, a hypothetical TMG % of 20% would mean that 80% of the funds in the Total Mapped Group had higher, and 20% had lower, management fees than the fund. The fund's actual TMG %s and the number of funds in the Total Mapped Group are in the chart below. The "Asset-Size Peer Group" (ASPG) comparison focuses on a fund's standing relative to a subset of non-Fidelity funds within the Total Mapped Group that are similar in size and management fee structure without taking into account performance adjustments, if any. For example, if a fund is in the first quartile of the ASPG, the fund's management fee ranks in the least expensive or lowest 25% of funds in the ASPG. The ASPG represents at least 15% of the funds in the Total Mapped Group with comparable asset size and management fee structures, subject to a minimum of 50 funds (or all funds in the Total Mapped Group if fewer than 50). Additional information, such as the ASPG quartile in which the fund's management fee rate ranked and the impact of the fund's performance adjustment, is also included in the chart and considered by the Board.
Fidelity Blue Chip Growth Fund
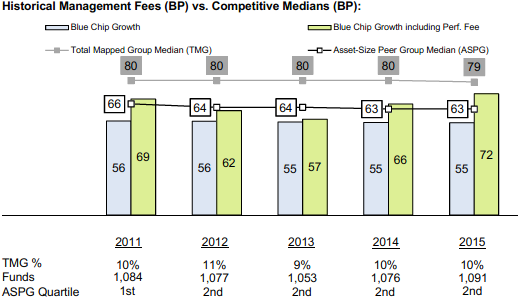
The Board noted that the fund's management fee rate ranked below the median of its Total Mapped Group and below the median of its ASPG for 2015. The Board also noted the effect of the fund's performance adjustment, if any, on the fund's management fee ranking.
The Board noted that, in 2014, the ad hoc Committee on Group Fee was formed by it and the boards of other Fidelity funds to conduct an in-depth review of the "group fee" component of the management fee of funds with such management fee structures. The Committee's focus included the mechanics of the group fee, the competitive landscape of group fee structures, Fidelity funds with no group fee component and investment products not included in group fee assets. The Board also considered that, for funds subject to the group fee, FMR agreed to voluntarily waive fees over a specified period of time in amounts designed to account for assets converted from certain funds to certain collective investment trusts.
The Board also noted that, in 2013, the ad hoc Committee on Management Fees was formed to conduct an in-depth review of the management fee rates of Fidelity's active equity mutual funds. The Committee focused on the following areas: (i) standard fee structures; (ii) research consumption and trading evolution; (iii) management fee competitiveness/profitability by category; and (iv) factors that drive institutional pricing.
Based on its review, the Board concluded that the fund's management fee is fair and reasonable in light of the services that the fund receives and the other factors considered.
Total Expense Ratio. In its review of each class's total expense ratio, the Board considered the fund's management fee rate as well as other fund or class expenses, as applicable, such as transfer agent fees, pricing and bookkeeping fees, and custodial, legal, and audit fees. The Board noted the impact of the fund's performance adjustment. The Board also noted that Fidelity may agree to waive fees and expenses from time to time, and the extent to which, if any, it has done so for the fund. As part of its review, the Board also considered the current and historical total expense ratios of each class of the fund compared to competitive fund median expenses. Each class of the fund is compared to those funds and classes in the Total Mapped Group (used by the Board for management fee comparisons) that have a similar sales load structure.
The Board noted that the total expense ratio of each class ranked below the competitive median for 2015.
Fees Charged to Other Fidelity Clients. The Board also considered Fidelity fee structures and other information with respect to clients of Fidelity, such as other funds advised or subadvised by Fidelity, pension plan clients, and other institutional clients with similar mandates. The Board noted the findings of the 2013 ad hoc joint committee (created with the board of other Fidelity funds), which reviewed and compared Fidelity's institutional investment advisory business with its business of providing services to the Fidelity funds, including the differences in services provided, fees charged, and costs incurred, as well as competition in their respective marketplaces.
Based on its review of total expense ratios and fees charged to other Fidelity clients, the Board concluded that the total expense ratio of each class of the fund was reasonable in light of the services that the fund and its shareholders receive and the other factors considered.
Costs of the Services and Profitability. The Board considered the revenues earned and the expenses incurred by Fidelity in conducting the business of developing, marketing, distributing, managing, administering and servicing the fund and servicing the fund's shareholders. The Board also considered the level of Fidelity's profits in respect of all the Fidelity funds.
On an annual basis, Fidelity presents to the Board information about the profitability of its relationship with the fund. Fidelity calculates profitability information for each fund, as well as aggregate profitability information for groups of Fidelity funds and all Fidelity funds, using a series of detailed revenue and cost allocation methodologies which originate with the books and records of Fidelity on which Fidelity's audited financial statements are based. The Audit Committee of the Board reviews any significant changes from the prior year's methodologies.
PricewaterhouseCoopers LLP (PwC), independent registered public accounting firm and auditor to Fidelity and certain Fidelity funds, has been engaged annually by the Board as part of the Board's assessment of Fidelity's profitability analysis. PwC's engagement includes the review and assessment of the methodologies used by Fidelity in determining the revenues and expenses attributable to Fidelity's mutual fund business, and completion of agreed-upon procedures in respect of the mathematical accuracy of the fund profitability information and its conformity to established allocation methodologies. After considering PwC's reports issued under the engagement and information provided by Fidelity, the Board concluded that while other allocation methods may also be reasonable, Fidelity's profitability methodologies are reasonable in all material respects.
The Board also reviewed Fidelity's non-fund businesses and fall-out benefits related to the mutual fund business as well as cases where Fidelity's affiliates may benefit from or be related to the fund's business.
The Board considered the costs of the services provided by and the profits realized by Fidelity in connection with the operation of the fund and was satisfied that the profitability was not excessive.
Economies of Scale. The Board considered whether there have been economies of scale in respect of the management of the Fidelity funds, whether the Fidelity funds (including the fund) have appropriately benefited from any such economies of scale, and whether there is potential for realization of any further economies of scale. The Board considered the extent to which the fund will benefit from economies of scale as assets grow through increased services to the fund, through waivers or reimbursements, or through fee or expense ratio reductions. The Board also noted that in 2013, it and the boards of other Fidelity funds created an ad hoc committee (the Economies of Scale Committee) to analyze whether Fidelity attains economies of scale in respect of the management and servicing of the Fidelity funds, whether the Fidelity funds have appropriately benefited from such economies of scale, and whether there is potential for realization of any further economies of scale.
The Board recognized that the fund's management contract incorporates a "group fee" structure, which provides for lower group fee rates as total group assets increase, and for higher group fee rates as total group assets decrease (with "group assets" defined to include fund assets under FMR's management plus the assets of sector funds previously under FMR's management). FMR calculates the group fee rates based on a tiered asset "breakpoint" schedule that varies based on asset class. The Board considered that the group fee is designed to deliver the benefits of economies of scale to fund shareholders when total Fidelity fund assets increase, even if assets of any particular fund are unchanged or have declined, because some portion of Fidelity's costs are attributable to services provided to all Fidelity funds, and all funds benefit if those costs can be allocated among more assets. The Board concluded that, given the group fee structure, fund shareholders will benefit from lower management fees as group assets increase at the fund complex level, regardless of whether Fidelity achieves any such economies of scale.
The Board concluded, taking into account the analysis of the Economies of Scale Committee, that economies of scale, if any, are being appropriately shared between fund shareholders and Fidelity.
Additional Information Requested by the Board. In order to develop fully the factual basis for consideration of the Fidelity funds' Advisory Contracts, the Board requested and received additional information on certain topics, including: (i) fund performance trends and Fidelity's long-term strategies for certain funds; (ii) the various share classes employed by Fidelity and the attributes of each class, together with similar information on the distribution and servicing payments made by Fidelity or the funds to third-party participants in the distribution channels; (iii) fund profitability, and fund performance in relation to fund profitability; (iv) the methodology with respect to evaluating competitive fund data and peer group classifications and fee comparisons; (v) annual fund profitability margins; (vi) the realization of fall-out benefits in and attribution of fall-out benefits to certain Fidelity business units; (vii) the appropriateness of certain funds' benchmarks; (viii) the rationalization for certain share classes and expenses; (ix) sub-advisory fee rates for comparable investment mandates; (x) product strategy for certain underperforming funds; and (xi) Fidelity's resources and strategy for cybersecurity.
Based on its evaluation of all of the conclusions noted above, and after considering all factors it believed relevant, the Board concluded that the advisory fee structures are fair and reasonable, and that the fund's Advisory Contracts should be renewed.
Corporate Headquarters
245 Summer St.
Boston, MA 02210
www.fidelity.com
BCF-ANN-0916
1.536058.119
Fidelity® Series Real Estate Equity Fund Fidelity® Series Real Estate Equity Fund
Class F
Annual Report July 31, 2016 |
|
Contents
To view a fund's proxy voting guidelines and proxy voting record for the 12-month period ended June 30, visit http://www.fidelity.com/proxyvotingresults or visit the Securities and Exchange Commission's (SEC) web site at http://www.sec.gov.
You may also call 1-800-544-8544, or for Class F, call 1-800-835-5092, to request a free copy of the proxy voting guidelines.
Standard & Poor's, S&P and S&P 500 are registered service marks of The McGraw-Hill Companies, Inc. and have been licensed for use by Fidelity Distributors Corporation.
Other third-party marks appearing herein are the property of their respective owners.
All other marks appearing herein are registered or unregistered trademarks or service marks of FMR LLC or an affiliated company. © 2016 FMR LLC. All rights reserved.
This report and the financial statements contained herein are submitted for the general information of the shareholders of the Fund. This report is not authorized for distribution to prospective investors in the Fund unless preceded or accompanied by an effective prospectus.
A fund files its complete schedule of portfolio holdings with the SEC for the first and third quarters of each fiscal year on Form N-Q. Forms N-Q are available on the SEC’s web site at http://www.sec.gov. A fund's Forms N-Q may be reviewed and copied at the SEC’s Public Reference Room in Washington, DC. Information regarding the operation of the SEC's Public Reference Room may be obtained by calling 1-800-SEC-0330.
For a complete list of a fund's portfolio holdings, view the most recent holdings listing, semiannual report, or annual report on Fidelity's web site at http://www.fidelity.com, http://www.institutional.fidelity.com, or http://www.401k.com, as applicable.
NOT FDIC INSURED •MAY LOSE VALUE •NO BANK GUARANTEE
Neither the Fund nor Fidelity Distributors Corporation is a bank.
Performance: The Bottom Line
Average annual total return reflects the change in the value of an investment, assuming reinvestment of distributions from dividend income and capital gains (the profits earned upon the sale of securities that have grown in value, if any) and assuming a constant rate of performance each year. The hypothetical investment and the average annual total returns do not reflect the deduction of taxes that a shareholder would pay on fund distributions or the redemption of fund shares. During periods of reimbursement by Fidelity, a fund’s total return will be greater than it would be had the reimbursement not occurred. How a fund did yesterday is no guarantee of how it will do tomorrow.
Average Annual Total Returns
| For the periods ended July 31, 2016 | Past 1 year | Life of fundA |
| Fidelity® Series Real Estate Equity Fund | 18.69% | 15.46% |
| Class F | 18.87% | 15.67% |
A From October 20, 2011
$10,000 Over Life of Fund
Let's say hypothetically that $10,000 was invested in Fidelity® Series Real Estate Equity Fund, a class of the fund, on October 20, 2011, when the fund started.
The chart shows how the value of your investment would have changed, and also shows how the S&P 500® Index performed over the same period.
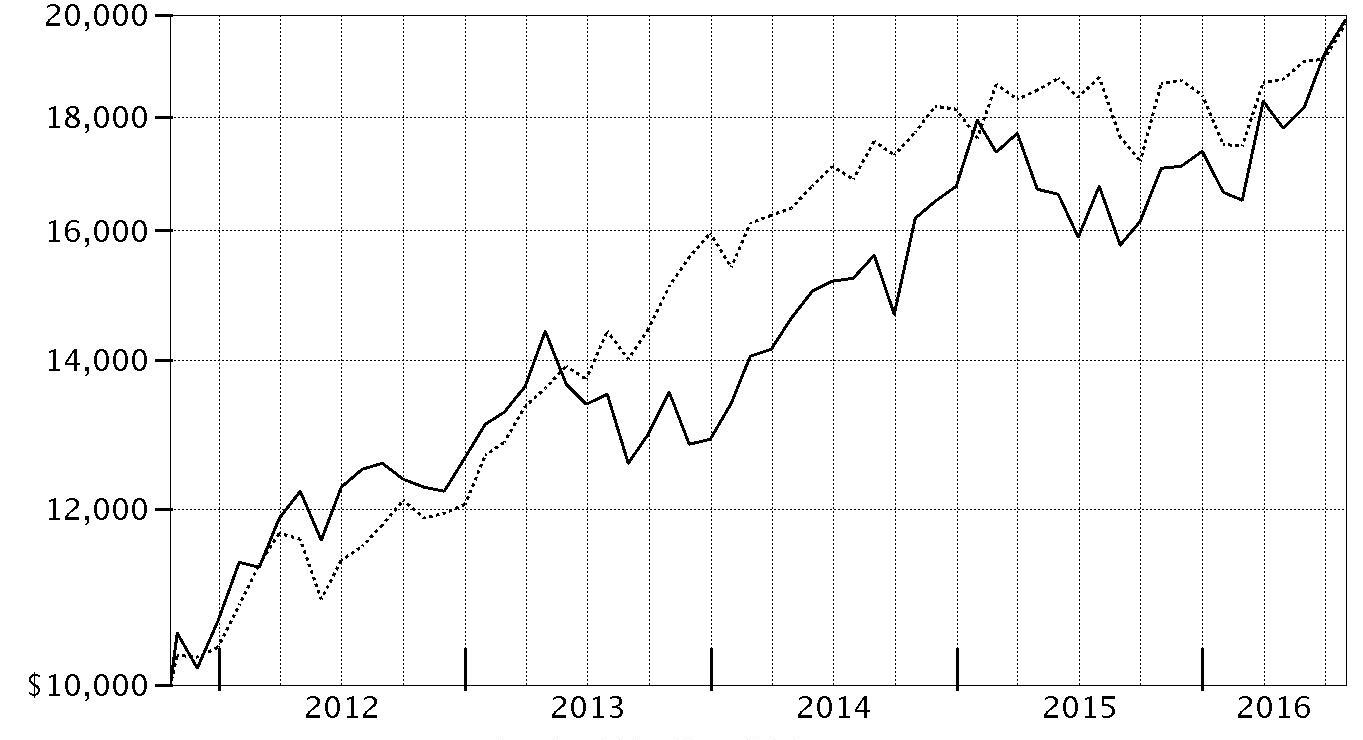
| Period Ending Values |
| $19,889 | Fidelity® Series Real Estate Equity Fund |
| $19,812 | S&P 500® Index |
Management's Discussion of Fund Performance
Market Recap: U.S. equities gained modestly for the year ending July 31, 2016, overcoming persistent concern about global economic growth, uncertainty regarding U.S. monetary policy and the U.K.’s late-June vote to leave the European Union, dubbed Brexit. The S&P 500
® index rose 5.61%, with larger-cap, value-oriented stocks and defensive sectors shining brightest. Volatility peaked in the early weeks of 2016, as continued oil-price weakness and U.S.-dollar strength pushed the S&P 500
® to its worst January since 2009. Markets then rose beginning in February amid U.S. job gains, a broad rally in energy and materials markets, global economic stimulus and perceived softening of monetary policy by the U.S. Federal Reserve. The June 23 Brexit vote surprised markets and resulted in a sharp two-day decline for stocks, followed by a rebound as investor sentiment shifted and remained positive through July 31. For the year, dividend-rich telecom services (+26%), utilities (+23%) and consumer staples (+12%) led the way amid strong investor demand for yield. Industrials (+10%) and information technology (+10%) also outperformed, as did materials (+8%), despite a weak commodities environment overall. Conversely, a strong run for real estate stocks couldn’t keep financials (-4%) from losing ground, as low interest rates continued to squeeze bank profits.
Comments from Portfolio Manager Samuel Wald: For the year, the fund’s share classes returned roughly 19%, lagging the 20.92% gain of the sector benchmark, the Dow Jones U.S. Select Real Estate Securities Index℠ Both the fund and benchmark far outstripped the broader S&P 500
®. Relative to the sector benchmark, the fund was hampered most by subpar stock picking in three categories: industrial/office, residential and hotels. In contrast, stock picking among health care and diversified REITs (real estate investment trusts) added value. The fund’s biggest individual detractor was FelCor Lodging Trust; shares of this hotel REIT returned -30% for the period. Digital Realty Trust also hampered results, although the negative impact from this operator of data-center REITs was more than offset by overweightings in two similarly strong-performing competitors in the fund – DuPont Fabros Technology and CoreSite Realty. The latter was an out-of-index holding, and I sold out of DuPont by period end. In health care, the fund benefited from the strong results of Ventas and Healthcare Realty Trust. Elsewhere, the fund did very well with its position in DCT Industrial Trust, which rose amid strong investor demand for warehouse operators. That said, the fund was hurt by a significant underweighting in another outperforming industrial REIT, ProLogis, whose international property exposure was relatively unappealing to us.
The views expressed above reflect those of the portfolio manager(s) only through the end of the period as stated on the cover of this report and do not necessarily represent the views of Fidelity or any other person in the Fidelity organization. Any such views are subject to change at any time based upon market or other conditions and Fidelity disclaims any responsibility to update such views. These views may not be relied on as investment advice and, because investment decisions for a Fidelity fund are based on numerous factors, may not be relied on as an indication of trading intent on behalf of any Fidelity fund.
Investment Summary (Unaudited)
Top Ten Stocks as of July 31, 2016
| | % of fund's net assets | % of fund's net assets 6 months ago |
| Simon Property Group, Inc. | 11.9 | 11.7 |
| Ventas, Inc. | 5.8 | 4.9 |
| Boston Properties, Inc. | 5.8 | 5.4 |
| AvalonBay Communities, Inc. | 5.2 | 3.0 |
| Public Storage | 4.3 | 5.3 |
| Extra Space Storage, Inc. | 4.1 | 4.7 |
| DCT Industrial Trust, Inc. | 3.4 | 2.9 |
| Mid-America Apartment Communities, Inc. | 3.4 | 3.3 |
| Urban Edge Properties | 3.2 | 3.1 |
| Essex Property Trust, Inc. | 3.2 | 4.6 |
| | 50.3 | |
Top Five REIT Sectors as of July 31, 2016
| | % of fund's net assets | % of fund's net assets 6 months ago |
| REITs - Apartments | 17.2 | 18.2 |
| REITs - Regional Malls | 16.0 | 16.1 |
| REITs - Office Property | 15.4 | 13.0 |
| REITs - Health Care | 11.9 | 10.4 |
| REITs - Shopping Centers | 9.1 | 9.5 |
Asset Allocation (% of fund's net assets)
| As of July 31, 2016 |
| | Stocks | 98.4% |
| | Short-Term Investments and Net Other Assets (Liabilities) | 1.6% |

| As of January 31, 2016 |
| | Stocks | 98.1% |
| | Short-Term Investments and Net Other Assets (Liabilities) | 1.9% |

Investments July 31, 2016
Showing Percentage of Net Assets
| Common Stocks - 98.4% | | | |
| | | Shares | Value |
| Hotels, Restaurants & Leisure - 0.9% | | | |
| Hotels, Resorts & Cruise Lines - 0.9% | | | |
| Hilton Worldwide Holdings, Inc. | | 510,800 | $11,845,452 |
| Real Estate Investment Trusts - 97.5% | | | |
| REITs - Apartments - 17.2% | | | |
| American Homes 4 Rent Class A | | 285,800 | 6,201,860 |
| AvalonBay Communities, Inc. | | 339,335 | 62,997,543 |
| Equity Residential (SBI) | | 420,651 | 28,600,061 |
| Essex Property Trust, Inc. | | 163,967 | 38,348,602 |
| Mid-America Apartment Communities, Inc. | | 387,545 | 41,087,521 |
| Monogram Residential Trust, Inc. | | 79,600 | 852,516 |
| UDR, Inc. | | 828,600 | 30,848,778 |
| | | | 208,936,881 |
| REITs - Diversified - 4.8% | | | |
| Digital Realty Trust, Inc. | | 112,000 | 11,699,520 |
| Forest City Realty Trust, Inc. | | 927,837 | 21,943,345 |
| Liberty Property Trust (SBI) | | 435,808 | 18,033,735 |
| Vornado Realty Trust | | 67,900 | 7,292,460 |
| | | | 58,969,060 |
| REITs - Health Care - 11.9% | | | |
| HCP, Inc. | | 6,400 | 251,072 |
| Healthcare Realty Trust, Inc. | | 954,900 | 34,529,184 |
| Sabra Health Care REIT, Inc. | | 566,213 | 13,538,153 |
| Ventas, Inc. | | 932,563 | 71,023,998 |
| Welltower, Inc. | | 327,680 | 25,994,854 |
| | | | 145,337,261 |
| REITs - Hotels - 4.1% | | | |
| Ashford Hospitality Prime, Inc. | | 234,383 | 3,525,120 |
| Chesapeake Lodging Trust | | 112,100 | 2,832,767 |
| FelCor Lodging Trust, Inc. | | 2,175,313 | 13,813,238 |
| Host Hotels & Resorts, Inc. | | 1,320,700 | 23,429,218 |
| LaSalle Hotel Properties (SBI) | | 204,900 | 5,644,995 |
| | | | 49,245,338 |
| REITs - Management/Investment - 4.1% | | | |
| American Assets Trust, Inc. | | 123,600 | 5,670,768 |
| Coresite Realty Corp. | | 290,023 | 23,935,598 |
| Empire State Realty Trust, Inc. | | 989,900 | 20,778,001 |
| | | | 50,384,367 |
| REITs - Manufactured Homes - 1.0% | | | |
| Equity Lifestyle Properties, Inc. | | 151,400 | 12,451,136 |
| REITs - Office Property - 15.4% | | | |
| Boston Properties, Inc. | | 498,749 | 70,887,195 |
| Douglas Emmett, Inc. | | 611,185 | 23,249,477 |
| Highwoods Properties, Inc. (SBI) | | 344,700 | 19,206,684 |
| Mack-Cali Realty Corp. | | 1,339,778 | 37,781,740 |
| New York (REIT), Inc. | | 316,400 | 3,018,456 |
| SL Green Realty Corp. | | 118,132 | 13,918,312 |
| VEREIT, Inc. | | 1,736,000 | 19,200,160 |
| | | | 187,262,024 |
| REITs - Regional Malls - 16.0% | | | |
| General Growth Properties, Inc. | | 692,618 | 22,129,145 |
| Pennsylvania Real Estate Investment Trust (SBI) | | 557,801 | 14,190,457 |
| Simon Property Group, Inc. | | 637,523 | 144,743,223 |
| Taubman Centers, Inc. | | 164,122 | 13,280,752 |
| | | | 194,343,577 |
| REITs - Shopping Centers - 9.1% | | | |
| Brixmor Property Group, Inc. | | 566,500 | 16,088,600 |
| Cedar Shopping Centers, Inc. | | 1,633,488 | 13,133,244 |
| DDR Corp. | | 114,100 | 2,252,334 |
| Federal Realty Investment Trust (SBI) | | 96,152 | 16,316,994 |
| Kite Realty Group Trust | | 284,767 | 8,659,764 |
| Ramco-Gershenson Properties Trust (SBI) | | 572,821 | 11,364,769 |
| Urban Edge Properties | | 1,289,850 | 38,579,414 |
| WP Glimcher, Inc. | | 338,300 | 4,289,644 |
| | | | 110,684,763 |
| REITs - Storage - 8.4% | | | |
| Extra Space Storage, Inc. | | 586,196 | 50,424,580 |
| Public Storage | | 216,487 | 51,723,074 |
| | | | 102,147,654 |
| REITs - Warehouse/Industrial - 5.5% | | | |
| DCT Industrial Trust, Inc. | | 819,176 | 41,139,019 |
| Prologis, Inc. | | 317,006 | 17,273,657 |
| Terreno Realty Corp. | | 284,667 | 7,927,976 |
| | | | 66,340,652 |
|
| TOTAL REAL ESTATE INVESTMENT TRUSTS | | | 1,186,102,713 |
|
| TOTAL COMMON STOCKS | | | |
| (Cost $872,345,424) | | | 1,197,948,165 |
|
| Money Market Funds - 1.7% | | | |
| Fidelity Cash Central Fund, 0.42% (a) | | | |
| (Cost $20,492,912) | | 20,492,912 | 20,492,912 |
| TOTAL INVESTMENT PORTFOLIO - 100.1% | | | |
| (Cost $892,838,336) | | | 1,218,441,077 |
| NET OTHER ASSETS (LIABILITIES) - (0.1)% | | | (1,807,916) |
| NET ASSETS - 100% | | | $1,216,633,161 |
Legend
(a) Affiliated fund that is generally available only to investment companies and other accounts managed by Fidelity Investments. The rate quoted is the annualized seven-day yield of the fund at period end. A complete unaudited listing of the fund's holdings as of its most recent quarter end is available upon request. In addition, each Fidelity Central Fund's financial statements, which are not covered by the Fund's Report of Independent Registered Public Accounting Firm, are available on the SEC's website or upon request.
Affiliated Central Funds
Information regarding fiscal year to date income earned by the Fund from investments in Fidelity Central Funds is as follows:
| Fund | Income earned |
| Fidelity Cash Central Fund | $62,346 |
| Fidelity Securities Lending Cash Central Fund | 572 |
| Total | $62,918 |
Investment Valuation
All investments are categorized as Level 1 under the Fair Value Hierarchy. The inputs or methodology used for valuing securities may not be an indication of the risk associated with investing in those securities. For more information on valuation inputs please refer to the Investment Valuation section in the accompanying Notes to Financial Statements.
See accompanying notes which are an integral part of the financial statements.
Financial Statements
Statement of Assets and Liabilities
| | | July 31, 2016 |
| Assets | | |
Investment in securities, at value — See accompanying schedule:
Unaffiliated issuers (cost $872,345,424) | $1,197,948,165 | |
| Fidelity Central Funds (cost $20,492,912) | 20,492,912 | |
| Total Investments (cost $892,838,336) | | $1,218,441,077 |
| Receivable for investments sold | | 13,684,521 |
| Receivable for fund shares sold | | 1,357,552 |
| Dividends receivable | | 320,930 |
| Distributions receivable from Fidelity Central Funds | | 5,873 |
| Other receivables | | 27,157 |
| Total assets | | 1,233,837,110 |
| Liabilities | | |
| Payable for investments purchased | $16,358,086 | |
| Payable for fund shares redeemed | 147,544 | |
| Accrued management fee | 545,423 | |
| Other affiliated payables | 105,834 | |
| Other payables and accrued expenses | 47,062 | |
| Total liabilities | | 17,203,949 |
| Net Assets | | $1,216,633,161 |
| Net Assets consist of: | | |
| Paid in capital | | $837,917,803 |
| Undistributed net investment income | | 4,470,009 |
| Accumulated undistributed net realized gain (loss) on investments | | 48,642,608 |
| Net unrealized appreciation (depreciation) on investments | | 325,602,741 |
| Net Assets | | $1,216,633,161 |
| Series Real Estate Equity: | | |
| Net Asset Value, offering price and redemption price per share ($547,137,288 ÷ 35,799,867 shares) | | $15.28 |
| Class F: | | |
| Net Asset Value, offering price and redemption price per share ($669,495,873 ÷ 43,791,400 shares) | | $15.29 |
See accompanying notes which are an integral part of the financial statements.
Statement of Operations
| | | Year ended July 31, 2016 |
| Investment Income | | |
| Dividends | | $32,549,304 |
| Income from Fidelity Central Funds | | 62,918 |
| Total income | | 32,612,222 |
| Expenses | | |
| Management fee | $6,574,466 | |
| Transfer agent fees | 907,652 | |
| Accounting and security lending fees | 386,322 | |
| Custodian fees and expenses | 38,061 | |
| Independent trustees' fees and expenses | 5,283 | |
| Audit | 52,798 | |
| Legal | 3,001 | |
| Interest | 5,335 | |
| Miscellaneous | 8,917 | |
| Total expenses before reductions | 7,981,835 | |
| Expense reductions | (97,563) | 7,884,272 |
| Net investment income (loss) | | 24,727,950 |
| Realized and Unrealized Gain (Loss) | | |
| Net realized gain (loss) on: | | |
| Investment securities: | | |
| Unaffiliated issuers | 51,071,620 | |
| Total net realized gain (loss) | | 51,071,620 |
| Change in net unrealized appreciation (depreciation) on investment securities | | 129,147,130 |
| Net gain (loss) | | 180,218,750 |
| Net increase (decrease) in net assets resulting from operations | | $204,946,700 |
See accompanying notes which are an integral part of the financial statements.
Statement of Changes in Net Assets
| | Year ended July 31, 2016 | Year ended July 31, 2015 |
| Increase (Decrease) in Net Assets | | |
| Operations | | |
| Net investment income (loss) | $24,727,950 | $22,287,763 |
| Net realized gain (loss) | 51,071,620 | 105,851,825 |
| Change in net unrealized appreciation (depreciation) | 129,147,130 | 7,806,315 |
| Net increase (decrease) in net assets resulting from operations | 204,946,700 | 135,945,903 |
| Distributions to shareholders from net investment income | (24,230,680) | (22,136,162) |
| Distributions to shareholders from net realized gain | (87,069,592) | (71,866,191) |
| Total distributions | (111,300,272) | (94,002,353) |
| Share transactions - net increase (decrease) | (106,551,373) | (57,207,882) |
| Total increase (decrease) in net assets | (12,904,945) | (15,264,332) |
| Net Assets | | |
| Beginning of period | 1,229,538,106 | 1,244,802,438 |
| End of period | $1,216,633,161 | $1,229,538,106 |
| Other Information | | |
| Undistributed net investment income end of period | $4,470,009 | $4,163,387 |
See accompanying notes which are an integral part of the financial statements.
Financial Highlights — Fidelity Series Real Estate Equity Fund
| Years ended July 31, | 2016 | 2015 | 2014 | 2013 | 2012 A |
| Selected Per–Share Data | | | | | |
| Net asset value, beginning of period | $14.18 | $13.85 | $12.87 | $12.39 | $10.00 |
| Income from Investment Operations | | | | | |
| Net investment income (loss)B | .27 | .24 | .23 | .18 | .11 |
| Net realized and unrealized gain (loss) | 2.07 | 1.11 | 1.31 | .78 | 2.38 |
| Total from investment operations | 2.34 | 1.35 | 1.54 | .96 | 2.49 |
| Distributions from net investment income | (.26) | (.23) | (.21) | (.17) | (.08) |
| Distributions from net realized gain | (.98) | (.79) | (.35) | (.31) | (.02) |
| Total distributions | (1.24) | (1.02) | (.56) | (.48) | (.10) |
| Net asset value, end of period | $15.28 | $14.18 | $13.85 | $12.87 | $12.39 |
| Total ReturnC,D | 18.69% | 10.04% | 12.72% | 8.06% | 25.03% |
| Ratios to Average Net AssetsE,F | | | | | |
| Expenses before reductions | .76% | .76% | .77% | .79% | .81%G |
| Expenses net of fee waivers, if any | .76% | .75% | .77% | .79% | .81%G |
| Expenses net of all reductions | .75% | .74% | .76% | .78% | .81%G |
| Net investment income (loss) | 1.97% | 1.69% | 1.84% | 1.44% | 1.27%G |
| Supplemental Data | | | | | |
| Net assets, end of period (000 omitted) | $547,137 | $577,786 | $598,298 | $531,188 | $475,392 |
| Portfolio turnover rateH | 64% | 60% | 69% | 48% | 40%G |
A For the period October 20, 2011 (commencement of operations) to July 31, 2012.
B Calculated based on average shares outstanding during the period.
C Total returns for periods of less than one year are not annualized.
D Total returns would have been lower if certain expenses had not been reduced during the applicable periods shown.
E Fees and expenses of any underlying Fidelity Central Funds are not included in the Fund's expense ratio. The Fund indirectly bears its proportionate share of the expenses of any underlying Fidelity Central Funds.
F Expense ratios reflect operating expenses of the class. Expenses before reductions do not reflect amounts reimbursed by the investment adviser or reductions from brokerage service arrangements or reductions from other expense offset arrangements and do not represent the amount paid by the class during periods when reimbursements or reductions occur. Expense ratios before reductions for start-up periods may not be representative of longer-term operating periods. Expenses net of fee waivers reflect expenses after reimbursement by the investment adviser but prior to reductions from brokerage service arrangements or other expense offset arrangements. Expenses net of all reductions represent the net expenses paid by the class.
G Annualized
H Amount does not include the portfolio activity of any underlying Fidelity Central Funds.
See accompanying notes which are an integral part of the financial statements.
Financial Highlights — Fidelity Series Real Estate Equity Fund Class F
| Years ended July 31, | 2016 | 2015 | 2014 | 2013 | 2012 A |
| Selected Per–Share Data | | | | | |
| Net asset value, beginning of period | $14.19 | $13.86 | $12.87 | $12.39 | $10.00 |
| Income from Investment Operations | | | | | |
| Net investment income (loss)B | .29 | .26 | .26 | .21 | .13 |
| Net realized and unrealized gain (loss) | 2.07 | 1.11 | 1.31 | .78 | 2.37 |
| Total from investment operations | 2.36 | 1.37 | 1.57 | .99 | 2.50 |
| Distributions from net investment income | (.28) | (.25) | (.23) | (.20) | (.09) |
| Distributions from net realized gain | (.98) | (.79) | (.35) | (.31) | (.02) |
| Total distributions | (1.26) | (1.04) | (.58) | (.51) | (.11) |
| Net asset value, end of period | $15.29 | $14.19 | $13.86 | $12.87 | $12.39 |
| Total ReturnC,D | 18.87% | 10.23% | 13.01% | 8.27% | 25.16% |
| Ratios to Average Net AssetsE,F | | | | | |
| Expenses before reductions | .59% | .59% | .59% | .60% | .61%G |
| Expenses net of fee waivers, if any | .59% | .59% | .59% | .60% | .61%G |
| Expenses net of all reductions | .58% | .58% | .59% | .59% | .61%G |
| Net investment income (loss) | 2.14% | 1.86% | 2.02% | 1.63% | 1.47%G |
| Supplemental Data | | | | | |
| Net assets, end of period (000 omitted) | $669,496 | $651,752 | $646,504 | $493,761 | $323,523 |
| Portfolio turnover rateH | 64% | 60% | 69% | 48% | 40%G |
A For the period October 20, 2011 (commencement of operations) to July 31, 2012.
B Calculated based on average shares outstanding during the period.
C Total returns for periods of less than one year are not annualized.
D Total returns would have been lower if certain expenses had not been reduced during the applicable periods shown.
E Fees and expenses of any underlying Fidelity Central Funds are not included in the Fund's expense ratio. The Fund indirectly bears its proportionate share of the expenses of any underlying Fidelity Central Funds.
F Expense ratios reflect operating expenses of the class. Expenses before reductions do not reflect amounts reimbursed by the investment adviser or reductions from brokerage service arrangements or reductions from other expense offset arrangements and do not represent the amount paid by the class during periods when reimbursements or reductions occur. Expense ratios before reductions for start-up periods may not be representative of longer-term operating periods. Expenses net of fee waivers reflect expenses after reimbursement by the investment adviser but prior to reductions from brokerage service arrangements or other expense offset arrangements. Expenses net of all reductions represent the net expenses paid by the class.
G Annualized
H Amount does not include the portfolio activity of any underlying Fidelity Central Funds.
See accompanying notes which are an integral part of the financial statements.
Notes to Financial Statements
For the period ended July 31, 2016
1. Organization.
Fidelity Series Real Estate Equity Fund (the Fund) is a non-diversified fund of Fidelity Securities Fund (the Trust) and is authorized to issue an unlimited number of shares. Shares of the Fund are only available for purchase by mutual funds for which Fidelity Management & Research Company (FMR) or an affiliate serves as an investment manager. The Trust is registered under the Investment Company Act of 1940, as amended (the 1940 Act), as an open-end management investment company organized as a Massachusetts business trust. The Fund offers Series Real Estate Equity and Class F shares, each of which has equal rights as to assets and voting privileges. Each class has exclusive voting rights with respect to matters that affect that class.
2. Investments in Fidelity Central Funds.
The Fund invests in Fidelity Central Funds, which are open-end investment companies generally available only to other investment companies and accounts managed by the investment adviser and its affiliates. The Fund's Schedule of Investments lists each of the Fidelity Central Funds held as of period end, if any, as an investment of the Fund, but does not include the underlying holdings of each Fidelity Central Fund. As an Investing Fund, the Fund indirectly bears its proportionate share of the expenses of the underlying Fidelity Central Funds.
The Money Market Central Funds seek preservation of capital and current income and are managed by Fidelity Investments Money Management, Inc. (FIMM), an affiliate of the investment adviser. Annualized expenses of the Money Market Central Funds as of their most recent shareholder report date are less than .005%.
A complete unaudited list of holdings for each Fidelity Central Fund is available upon request or at the Securities and Exchange Commission (the SEC) website at www.sec.gov. In addition, the financial statements of the Fidelity Central Funds, which are not covered by the Fund's Report of Independent Registered Public Accounting Firm, are available on the SEC website or upon request.
3. Significant Accounting Policies.
The financial statements have been prepared in conformity with accounting principles generally accepted in the United States of America (GAAP), which require management to make certain estimates and assumptions at the date of the financial statements. Actual results could differ from those estimates. Subsequent events, if any, through the date that the financial statements were issued have been evaluated in the preparation of the financial statements. The following summarizes the significant accounting policies of the Fund:
Investment Valuation. Investments are valued as of 4:00 p.m. Eastern time on the last calendar day of the period. The Board of Trustees (the Board) has delegated the day to day responsibility for the valuation of the Fund's investments to the FMR Fair Value Committee (the Committee). In accordance with valuation policies and procedures approved by the Board, the Fund attempts to obtain prices from one or more third party pricing vendors or brokers to value its investments. When current market prices, quotations or currency exchange rates are not readily available or reliable, investments will be fair valued in good faith by the Committee, in accordance with procedures adopted by the Board. Factors used in determining fair value vary by investment type and may include market or investment specific events. The frequency with which these procedures are used cannot be predicted and they may be utilized to a significant extent. The Committee oversees the Fund's valuation policies and procedures and reports to the Board on the Committee's activities and fair value determinations. The Board monitors the appropriateness of the procedures used in valuing the Fund's investments and ratifies the fair value determinations of the Committee.
The Fund categorizes the inputs to valuation techniques used to value its investments into a disclosure hierarchy consisting of three levels as shown below:
- Level 1 – quoted prices in active markets for identical investments
- Level 2 – other significant observable inputs (including quoted prices for similar investments, interest rates, prepayment speeds, etc.)
- Level 3 – unobservable inputs (including the Fund's own assumptions based on the best information available)
Valuation techniques used to value the Fund's investments by major category are as follows:
Equity securities, including restricted securities, for which market quotations are readily available, are valued at the last reported sale price or official closing price as reported by a third party pricing vendor on the primary market or exchange on which they are traded and are categorized as Level 1 in the hierarchy. In the event there were no sales during the day or closing prices are not available, securities are valued at the last quoted bid price or may be valued using the last available price and are generally categorized as Level 2 in the hierarchy. For foreign equity securities, when market or security specific events arise, comparisons to the valuation of American Depositary Receipts (ADRs), futures contracts, Exchange-Traded Funds (ETFs) and certain indexes as well as quoted prices for similar securities may be used and would be categorized as Level 2 in the hierarchy. Utilizing these techniques may result in transfers between Level 1 and Level 2. For equity securities, including restricted securities, where observable inputs are limited, assumptions about market activity and risk are used and these securities may be categorized as Level 3 in the hierarchy.
Investments in open-end mutual funds, including the Fidelity Central Funds, are valued at their closing net asset value (NAV) each business day and are categorized as Level 1 in the hierarchy.
Changes in valuation techniques may result in transfers in or out of an assigned level within the disclosure hierarchy.
Investment Transactions and Income. For financial reporting purposes, the Fund's investment holdings and NAV include trades executed through the end of the last business day of the period. The NAV per share for processing shareholder transactions is calculated as of the close of business of the New York Stock Exchange (NYSE), normally 4:00 p.m. Eastern time and includes trades executed through the end of the prior business day. Gains and losses on securities sold are determined on the basis of identified cost. Dividend income is recorded on the ex-dividend date, except for certain dividends from foreign securities where the ex-dividend date may have passed, which are recorded as soon as the Fund is informed of the ex-dividend date. Non-cash dividends included in dividend income, if any, are recorded at the fair market value of the securities received. Income and capital gain distributions from Fidelity Central Funds, if any, are recorded on the ex-dividend date. Distributions received on securities that represent a return of capital or capital gain are recorded as a reduction of cost of investments and/or as a realized gain. Subsequent to ex-dividend date the Fund determines the components of these distributions, based upon receipt of tax filings or other correspondence relating to the underlying investment.
Class Allocations and Expenses. Investment income, realized and unrealized capital gains and losses, common expenses of the Fund, and certain fund-level expense reductions, if any, are allocated daily on a pro-rata basis to each class based on the relative net assets of each class to the total net assets of the Fund. Each class differs with respect to transfer agent fees incurred. Certain expense reductions may also differ by class. For the reporting period, the allocated portion of income and expenses to each class as a percent of its average net assets may vary due to the timing of recording these transactions in relation to fluctuating net assets of the classes. Expenses directly attributable to a fund are charged to that fund. Expenses attributable to more than one fund are allocated among the respective funds on the basis of relative net assets or other appropriate methods. Expense estimates are accrued in the period to which they relate and adjustments are made when actual amounts are known.
Income Tax Information and Distributions to Shareholders. Each year, the Fund intends to qualify as a regulated investment company under Subchapter M of the Internal Revenue Code, including distributing substantially all of its taxable income and realized gains. As a result, no provision for U.S. Federal income taxes is required. As of July 31, 2016, the Fund did not have any unrecognized tax benefits in the financial statements; nor is the Fund aware of any tax positions for which it is reasonably possible that the total amounts of unrecognized tax benefits will significantly change in the next twelve months. The Fund files a U.S. federal tax return, in addition to state and local tax returns as required. The Fund's federal income tax returns are subject to examination by the Internal Revenue Service (IRS) for a period of three fiscal years after they are filed. State and local tax returns may be subject to examination for an additional fiscal year depending on the jurisdiction.
Distributions are declared and recorded on the ex-dividend date. Income dividends and capital gain distributions are declared separately for each class. Income and capital gain distributions are determined in accordance with income tax regulations, which may differ from GAAP.
Capital accounts within the financial statements are adjusted for permanent book-tax differences. These adjustments have no impact on net assets or the results of operations. Capital accounts are not adjusted for temporary book-tax differences which will reverse in a subsequent period.
Book-tax differences are primarily due to losses deferred due to wash sales.
The federal tax cost of investment securities and unrealized appreciation (depreciation) as of period end were as follows:
| Gross unrealized appreciation | $332,571,991 |
| Gross unrealized depreciation | (8,470,197) |
| Net unrealized appreciation (depreciation) on securities | $324,101,794 |
| Tax Cost | $894,339,283 |
The tax-based components of distributable earnings as of period end were as follows:
| Undistributed ordinary income | $4,470,009 |
| Undistributed long-term capital gain | $50,143,555 |
| Net unrealized appreciation (depreciation) on securities and other investments | $324,101,794 |
The tax character of distributions paid was as follows:
| | July 31, 2016 | July 31, 2015 |
| Ordinary Income | $39,288,493 | $ 23,076,953 |
| Long-term Capital Gains | 72,011,779 | 70,925,400 |
| Total | $111,300,272 | $ 94,002,353 |
4. Purchases and Sales of Investments.
Purchases and sales of securities, other than short-term securities, aggregated $750,659,260 and $938,100,571, respectively.
5. Fees and Other Transactions with Affiliates.
Management Fee. Fidelity Management & Research Company (the investment adviser) and its affiliates provide the Fund with investment management related services for which the Fund pays a monthly management fee. The management fee is the sum of an individual fund fee rate that is based on an annual rate of .30% of the Fund's average net assets and an annualized group fee rate that averaged .25% during the period. The group fee rate is based upon the average net assets of all the mutual funds advised by the investment adviser, including any mutual funds previously advised by the investment adviser that are currently advised by Fidelity SelectCo, LLC, an affiliate of the investment adviser. The group fee rate decreases as assets under management increase and increases as assets under management decrease. For the reporting period, the total annual management fee rate was .55% of the Fund's average net assets.
Transfer Agent Fees. Fidelity Investments Institutional Operations Company, Inc., (FIIOC), an affiliate of the investment adviser, is the transfer, dividend disbursing and shareholder servicing agent for each class of the Fund. FIIOC receives account fees and asset-based fees that vary according to the account size and type of account of the shareholders of Series Real Estate Equity. FIIOC receives no fees for providing transfer agency services to Class F. FIIOC pays for typesetting, printing and mailing of shareholder reports, except proxy statements.
For the period, transfer agent fees for each applicable class were as follows:
| | Amount | % of
Class-Level Average
Net Assets |
| Series Real Estate Equity | $907,652 | .17 |
Accounting and Security Lending Fees. Fidelity Service Company, Inc. (FSC), an affiliate of the investment adviser, maintains the Fund's accounting records. The accounting fee is based on the level of average net assets for each month. Under a separate contract, FSC administers the security lending program. The security lending fee is based on the number and duration of lending transactions.
Brokerage Commissions. The Fund placed a portion of its portfolio transactions with brokerage firms which are affiliates of the investment adviser. Brokerage commissions are included in net realized gain (loss) and change in net unrealized appreciation (depreciation) in the Statement of Operations. The commissions paid to these affiliated firms were $6,322 for the period.
Interfund Lending Program. Pursuant to an Exemptive Order issued by the SEC, the Fund, along with other registered investment companies having management contracts with FMR or other affiliated entities of FMR, may participate in an interfund lending program. This program provides an alternative credit facility allowing the funds to borrow from, or lend money to, other participating affiliated funds. At period end, there were no interfund loans outstanding. The Fund's activity in this program during the period for which loans were outstanding was as follows:
| Borrower or Lender | Average Loan Balance | Weighted Average Interest Rate | Interest Expense |
| Borrower | $18,493,944 | .58% | $5,335 |
Interfund Trades. The Fund may purchase from or sell securities to other Fidelity Funds under procedures adopted by the Board. The procedures have been designed to ensure these interfund trades are executed in accordance with Rule 17a-7 of the 1940 Act. Interfund trades are included within the respective purchases and sales amounts shown in the Purchases and Sales of Investments note.
6. Committed Line of Credit.
The Fund participates with other funds managed by the investment adviser or an affiliate in a $4.25 billion credit facility (the "line of credit") to be utilized for temporary or emergency purposes to fund shareholder redemptions or for other short-term liquidity purposes. The Fund has agreed to pay commitment fees on its pro-rata portion of the line of credit, which amounted to $2,464 and is reflected in Miscellaneous expenses on the Statement of Operations. During the period, the Fund did not borrow on this line of credit.
7. Security Lending.
The Fund lends portfolio securities through a lending agent from time to time in order to earn additional income. For equity securities, a lending agent is used and may loan securities to certain qualified borrowers, including Fidelity Capital Markets (FCM), a broker-dealer affiliated with the Fund. On the settlement date of the loan, the Fund receives collateral (in the form of U.S. Treasury obligations, letters of credit and/or cash) against the loaned securities and maintains collateral in an amount not less than 100% of the market value of the loaned securities during the period of the loan. The market value of the loaned securities is determined at the close of business of the Fund and any additional required collateral is delivered to the Fund on the next business day. The Fund or borrower may terminate the loan at any time, and if the borrower defaults on its obligation to return the securities loaned because of insolvency or other reasons, the Fund may apply collateral received from the borrower against the obligation. The Fund may experience delays and costs in recovering the securities loaned. Any cash collateral received is invested in the Fidelity Securities Lending Cash Central Fund. At period end, there were no security loans outstanding. Security lending income represents the income earned on investing cash collateral, less rebates paid to borrowers and any lending agent fees associated with the loan, plus any premium payments received for lending certain types of securities. Security lending income is presented in the Statement of Operations as a component of income from Fidelity Central Funds. Total security lending income during the period amounted to $572. During the period, there were no securities loaned to FCM.
8. Expense Reductions.
Commissions paid to certain brokers with whom the investment adviser, or its affiliates, places trades on behalf of the Fund include an amount in addition to trade execution, which may be rebated back to the Fund to offset certain expenses. This amount totaled $88,715 for the period.
In addition, during the period the investment adviser reimbursed and/or waived a portion of fund-level operating expenses in the amount of $8,848.
9. Distributions to Shareholders.
Distributions to shareholders of each class were as follows:
| | Year ended
July 31, 2016 | Year ended July 31, 2015 |
| From net investment income | | |
| Series Real Estate Equity | $10,614,996 | $9,854,635 |
| Class F | 13,615,684 | 12,281,527 |
| Total | $24,230,680 | $22,136,162 |
| From net realized gain | | |
| Series Real Estate Equity | $40,417,572 | $34,110,116 |
| Class F | 46,652,020 | 37,756,075 |
| Total | $87,069,592 | $71,866,191 |
10. Share Transactions.
Transactions for each class of shares were as follows:
| | Shares | Shares | Dollars | Dollars |
| | Year ended
July 31, 2016 | Year ended July 31, 2015 | Year ended
July 31, 2016 | Year ended July 31, 2015 |
| Series Real Estate Equity | | | | |
| Shares sold | 4,635,791 | 5,563,053 | $62,790,578 | $79,011,834 |
| Reinvestment of distributions | 4,111,997 | 3,171,934 | 51,032,568 | 43,964,751 |
| Shares redeemed | (13,681,136) | (11,198,553) | (185,388,289) | (163,372,510) |
| Net increase (decrease) | (4,933,348) | (2,463,566) | $(71,565,143) | $(40,395,925) |
| Class F | | | | |
| Shares sold | 8,416,961 | 8,500,030 | $114,115,660 | $120,305,866 |
| Reinvestment of distributions | 4,849,300 | 3,607,000 | 60,267,703 | 50,037,602 |
| Shares redeemed | (15,411,336) | (12,831,072) | (209,369,593) | (187,155,425) |
| Net increase (decrease) | (2,145,075) | (724,042) | $(34,986,230) | $(16,811,957) |
11. Other.
The Fund's organizational documents provide former and current trustees and officers with a limited indemnification against liabilities arising in connection with the performance of their duties to the Fund. In the normal course of business, the Fund may also enter into contracts that provide general indemnifications. The Fund's maximum exposure under these arrangements is unknown as this would be dependent on future claims that may be made against the Fund. The risk of material loss from such claims is considered remote.
At the end of the period, mutual funds managed by the investment adviser or its affiliates were the owners of record of all the outstanding shares of the Fund.
Report of Independent Registered Public Accounting Firm
To the Trustees of Fidelity Securities Fund and Shareholders of Fidelity Series Real Estate Equity Fund:
We have audited the accompanying statement of assets and liabilities of Fidelity Series Real Estate Equity Fund (the Fund), a fund of Fidelity Securities Fund, including the schedule of investments, as of July 31, 2016, and the related statement of operations for the year then ended, the statement of changes in net assets for each of the two years in the period then ended, and the financial highlights for each of the periods presented. These financial statements and financial highlights are the responsibility of the Fund's management. Our responsibility is to express an opinion on these financial statements and financial highlights based on our audits.
We conducted our audits in accordance with the standards of the Public Company Accounting Oversight Board (United States). Those standards require that we plan and perform the audit to obtain reasonable assurance about whether the financial statements and financial highlights are free of material misstatement. The Fund is not required to have, nor were we engaged to perform, an audit of its internal control over financial reporting. Our audits included consideration of internal control over financial reporting as a basis for designing audit procedures that are appropriate in the circumstances, but not for the purpose of expressing an opinion on the effectiveness of the Fund's internal control over financial reporting. Accordingly, we express no such opinion. An audit also includes examining, on a test basis, evidence supporting the amounts and disclosures in the financial statements, assessing the accounting principles used and significant estimates made by management, as well as evaluating the overall financial statement presentation. Our procedures included confirmation of securities owned as of July 31, 2016, by correspondence with the custodians and brokers; when replies were not received from brokers, we performed other auditing procedures. We believe that our audits provide a reasonable basis for our opinion.
In our opinion, such financial statements and financial highlights referred to above present fairly, in all material respects, the financial position of Fidelity Series Real Estate Equity Fund as of July 31, 2016, the results of its operations for the year then ended, the changes in its net assets for each of the two years in the period then ended, and the financial highlights for the each of the periods presented in conformity with accounting principles generally accepted in the United States of America.
DELOITTE & TOUCHE LLP
Boston, Massachusetts
September 20, 2016
Trustees and Officers
The Trustees, Members of the Advisory Board (if any), and officers of the trust and fund, as applicable, are listed below. The Board of Trustees governs the fund and is responsible for protecting the interests of shareholders. The Trustees are experienced executives who meet periodically throughout the year to oversee the fund's activities, review contractual arrangements with companies that provide services to the fund, oversee management of the risks associated with such activities and contractual arrangements, and review the fund's performance. Each of the Trustees oversees 170 funds.
The Trustees hold office without limit in time except that (a) any Trustee may resign; (b) any Trustee may be removed by written instrument, signed by at least two-thirds of the number of Trustees prior to such removal; (c) any Trustee who requests to be retired or who has become incapacitated by illness or injury may be retired by written instrument signed by a majority of the other Trustees; and (d) any Trustee may be removed at any special meeting of shareholders by a two-thirds vote of the outstanding voting securities of the trust. Each Trustee who is not an interested person (as defined in the 1940 Act) of the trust and the fund is referred to herein as an Independent Trustee. Each Independent Trustee shall retire not later than the last day of the calendar year in which his or her 75th birthday occurs. The Independent Trustees may waive this mandatory retirement age policy with respect to individual Trustees. Officers and Advisory Board Members hold office without limit in time, except that any officer or Advisory Board Member may resign or may be removed by a vote of a majority of the Trustees at any regular meeting or any special meeting of the Trustees. Except as indicated, each individual has held the office shown or other offices in the same company for the past five years.
The fund’s Statement of Additional Information (SAI) includes more information about the Trustees. To request a free copy, call Fidelity at 1-800-544-8544 for Fidelity® Series Real Estate Equity Fund, or 1-800-835-5092 for Class F.
Experience, Skills, Attributes, and Qualifications of the Trustees. The Governance and Nominating Committee has adopted a statement of policy that describes the experience, qualifications, attributes, and skills that are necessary and desirable for potential Independent Trustee candidates (Statement of Policy). The Board believes that each Trustee satisfied at the time he or she was initially elected or appointed a Trustee, and continues to satisfy, the standards contemplated by the Statement of Policy. The Governance and Nominating Committee also engages professional search firms to help identify potential Independent Trustee candidates who have the experience, qualifications, attributes, and skills consistent with the Statement of Policy. From time to time, additional criteria based on the composition and skills of the current Independent Trustees, as well as experience or skills that may be appropriate in light of future changes to board composition, business conditions, and regulatory or other developments, have also been considered by the professional search firms and the Governance and Nominating Committee. In addition, the Board takes into account the Trustees' commitment and participation in Board and committee meetings, as well as their leadership of standing and ad hoc committees throughout their tenure.
In determining that a particular Trustee was and continues to be qualified to serve as a Trustee, the Board has considered a variety of criteria, none of which, in isolation, was controlling. The Board believes that, collectively, the Trustees have balanced and diverse experience, qualifications, attributes, and skills, which allow the Board to operate effectively in governing the fund and protecting the interests of shareholders. Information about the specific experience, skills, attributes, and qualifications of each Trustee, which in each case led to the Board's conclusion that the Trustee should serve (or continue to serve) as a trustee of the fund, is provided below.
Board Structure and Oversight Function. James C. Curvey is an interested person and currently serves as Chairman. The Trustees have determined that an interested Chairman is appropriate and benefits shareholders because an interested Chairman has a personal and professional stake in the quality and continuity of services provided to the fund. Independent Trustees exercise their informed business judgment to appoint an individual of their choosing to serve as Chairman, regardless of whether the Trustee happens to be independent or a member of management. The Independent Trustees have determined that they can act independently and effectively without having an Independent Trustee serve as Chairman and that a key structural component for assuring that they are in a position to do so is for the Independent Trustees to constitute a substantial majority for the Board. The Independent Trustees also regularly meet in executive session. Ned C. Lautenbach serves as Chairman of the Independent Trustees and as such (i) acts as a liaison between the Independent Trustees and management with respect to matters important to the Independent Trustees and (ii) with management prepares agendas for Board meetings.
Fidelity® funds are overseen by different Boards of Trustees. The fund's Board oversees Fidelity's high income and certain equity funds, and other Boards oversee Fidelity's investment-grade bond, money market, asset allocation, and sector funds. The asset allocation funds may invest in Fidelity® funds overseen by the fund's Board. The use of separate Boards, each with its own committee structure, allows the Trustees of each group of Fidelity® funds to focus on the unique issues of the funds they oversee, including common research, investment, and operational issues. On occasion, the separate Boards establish joint committees to address issues of overlapping consequences for the Fidelity® funds overseen by each Board.
The Trustees operate using a system of committees to facilitate the timely and efficient consideration of all matters of importance to the Trustees, the fund, and fund shareholders and to facilitate compliance with legal and regulatory requirements and oversight of the fund's activities and associated risks. The Board, acting through its committees, has charged FMR and its affiliates with (i) identifying events or circumstances the occurrence of which could have demonstrably adverse effects on the fund's business and/or reputation; (ii) implementing processes and controls to lessen the possibility that such events or circumstances occur or to mitigate the effects of such events or circumstances if they do occur; and (iii) creating and maintaining a system designed to evaluate continuously business and market conditions in order to facilitate the identification and implementation processes described in (i) and (ii) above. Because the day-to-day operations and activities of the fund are carried out by or through FMR, its affiliates, and other service providers, the fund's exposure to risks is mitigated but not eliminated by the processes overseen by the Trustees. While each of the Board's committees has responsibility for overseeing different aspects of the fund's activities, oversight is exercised primarily through the Operations, Audit, and Compliance Committees. In addition, the Independent Trustees have worked with FMR to enhance the Board's oversight of investment and financial risks, legal and regulatory risks, technology risks, and operational risks, including the development of additional risk reporting to the Board. For example, a working group comprised of Independent Trustees and FMR has worked and continues to work to review the Fidelity® funds' valuation-related activities, reporting and risk management. Appropriate personnel, including but not limited to the fund's Chief Compliance Officer (CCO), FMR's internal auditor, the independent accountants, the fund's Treasurer and portfolio management personnel, make periodic reports to the Board's committees, as appropriate, including an annual review of Fidelity's risk management program for the Fidelity® funds. The responsibilities of each standing committee, including their oversight responsibilities, are described further under "Standing Committees of the Trustees."
Interested Trustees*:
Correspondence intended for a Trustee who is an interested person may be sent to Fidelity Investments, 245 Summer Street, Boston, Massachusetts 02210.
Name, Year of Birth; Principal Occupations and Other Relevant Experience+
James C. Curvey (1935)
Year of Election or Appointment: 2007
Trustee
Chairman of the Board of Trustees
Mr. Curvey also serves as Trustee of other Fidelity® funds. Mr. Curvey is a Director of Fidelity Research & Analysis Co. (investment adviser firm, 2009-present), and Vice Chairman (2007-present) and Director of FMR LLC (diversified financial services company). In addition, Mr. Curvey serves as an Overseer for the Boston Symphony Orchestra and a member of the board of Artis-Naples, Naples, Florida, and as a Trustee for Brewster Academy, Wolfeboro, New Hampshire. Previously, Mr. Curvey served as a Director of Fidelity Investments Money Management, Inc. (investment adviser firm, 2009-2014) and a Director of FMR and FMR Co., Inc. (investment adviser firms, 2007-2014).
Charles S. Morrison (1960)
Year of Election or Appointment: 2014
Trustee
Mr. Morrison also serves as Trustee of other funds. He serves as a Director of Fidelity Investments Money Management, Inc. (FIMM) (investment adviser firm, 2014-present), Director of Fidelity SelectCo, LLC (investment adviser firm, 2014-present), President, Asset Management (2014-present), and is an employee of Fidelity Investments. Previously, Mr. Morrison served as Vice President of Fidelity's Fixed Income and Asset Allocation Funds (2012-2014), President, Fixed Income (2011-2014), Vice President of Fidelity's Money Market Funds (2005-2009), President, Money Market Group Leader of FMR (investment adviser firm, 2009), and Senior Vice President, Money Market Group of FMR (2004-2009). Mr. Morrison also served as Vice President of Fidelity's Bond Funds (2002-2005), certain Balanced Funds (2002-2005), and certain Asset Allocation Funds (2002-2007), and as Senior Vice President (2002-2005) of Fidelity's Bond Division.
* Determined to be an “Interested Trustee” by virtue of, among other things, his or her affiliation with the trust or various entities under common control with FMR.
+ The information includes the Trustee's principal occupation during the last five years and other information relating to the experience, attributes, and skills relevant to the Trustee's qualifications to serve as a Trustee, which led to the conclusion that the Trustee should serve as a Trustee for the fund.
Independent Trustees:
Correspondence intended for an Independent Trustee may be sent to Fidelity Investments, P.O. Box 55235, Boston, Massachusetts 02205-5235.
Name, Year of Birth; Principal Occupations and Other Relevant Experience+
Dennis J. Dirks (1948)
Year of Election or Appointment: 2005
Trustee
Mr. Dirks also serves as Trustee of other Fidelity® funds. Prior to his retirement in May 2003, Mr. Dirks was Chief Operating Officer and a member of the Board of The Depository Trust & Clearing Corporation (DTCC). He also served as President, Chief Operating Officer, and Board member of The Depository Trust Company (DTC) and President and Board member of the National Securities Clearing Corporation (NSCC). In addition, Mr. Dirks served as Chief Executive Officer and Board member of the Government Securities Clearing Corporation, Chief Executive Officer and Board member of the Mortgage-Backed Securities Clearing Corporation, as a Trustee and a member of the Finance Committee of Manhattan College (2005-2008), as a Trustee and a member of the Finance Committee of AHRC of Nassau County (2006-2008), and as a member of the Independent Directors Council (IDC) Governing Council (2010-2015). Mr. Dirks is a member of the Board of Directors for The Brookville Center for Children's Services, Inc. (2009-present).
Alan J. Lacy (1953)
Year of Election or Appointment: 2008
Trustee
Mr. Lacy also serves as Trustee of other Fidelity® funds. Mr. Lacy serves as Chairman (2014-present) and a member (2010-present) of the Board of Directors of Dave & Buster's Entertainment, Inc. (restaurant and entertainment complexes) and a Director of Bristol-Myers Squibb Company (global pharmaceuticals, 2008-present). He is a Trustee of the California Chapter of The Nature Conservancy (2015-present) and a Director of the Center for Advanced Study in the Behavioral Sciences at Stanford University (2015-present). In addition, Mr. Lacy served as Senior Adviser (2007-2014) of Oak Hill Capital Partners, L.P. (private equity) and also served as Chief Executive Officer (2005) and Vice Chairman (2005-2006) of Sears Holdings Corporation (retail) and Chief Executive Officer and Chairman of the Board of Sears, Roebuck and Co. (retail, 2000-2005). Previously, Mr. Lacy served as Chairman (2008-2011) and a member (2006-2015) of the Board of Trustees of the National Parks Conservation Association and as a member of the Board of Directors for The Western Union Company (global money transfer, 2006-2011), The Hillman Companies, Inc. (hardware wholesalers, 2010-2014), and Earth Fare, Inc. (retail grocery, 2010-2014).
Ned C. Lautenbach (1944)
Year of Election or Appointment: 2000
Trustee
Chairman of the Independent Trustees
Mr. Lautenbach also serves as Trustee of other Fidelity® funds. Mr. Lautenbach currently serves as the Lead Director of the Eaton Corporation Board of Directors (diversified industrial, 1997-present). Mr. Lautenbach is Chairman of the Board of Directors of Artis-Naples in Naples, Florida (2012-present), a member of the Council on Foreign Relations (1994-present), and a member of the Board of Governors, State University System of Florida (2013-present). Previously, Mr. Lautenbach was a Partner/Advisory Partner at Clayton, Dubilier & Rice, LLC (private equity investment, 1998-2010), as well as a Director of Sony Corporation (2006-2007).
Joseph Mauriello (1944)
Year of Election or Appointment: 2008
Trustee
Mr. Mauriello also serves as Trustee of other Fidelity® funds. Prior to his retirement in January 2006, Mr. Mauriello served in numerous senior management positions including Deputy Chairman and Chief Operating Officer (2004-2005), and Vice Chairman of Financial Services (2002-2004) of KPMG LLP US (professional services, 1965-2005). Mr. Mauriello currently serves as a member of the Board of Directors of XL Group plc. (global insurance and re-insurance, 2006-present) and the Independent Directors Council (IDC) Governing Council (2015-present). Previously, Mr. Mauriello served as a Director of the Hamilton Funds of the Bank of New York (2006-2007) and of Arcadia Resources Inc. (health care services and products, 2007-2012).
Robert W. Selander (1950)
Year of Election or Appointment: 2011
Trustee
Mr. Selander also serves as Trustee of other Fidelity® funds. Mr. Selander serves as a Director of The Western Union Company (global money transfer, 2014-present) and a non-executive Chairman of Health Equity, Inc. (health savings custodian, 2015-present). Previously, Mr. Selander served as a Member of the Advisory Board of certain Fidelity® funds (2011), and Executive Vice Chairman (2010), Chief Executive Officer (2009-2010), and President and Chief Executive Officer (1997-2009) of Mastercard, Inc.
Cornelia M. Small (1944)
Year of Election or Appointment: 2005
Trustee
Ms. Small also serves as Trustee of other Fidelity® funds. Ms. Small is a member of the Board of Directors (2009-present) and Chair of the Investment Committee (2010-present) of the Teagle Foundation. Ms. Small also serves on the Investment Committee of the Berkshire Taconic Community Foundation (2008-present). Previously, Ms. Small served as Chairperson (2002-2008) and a member of the Investment Committee and Chairperson (2008-2012) and a member of the Board of Trustees of Smith College. In addition, Ms. Small served as Chief Investment Officer, Director of Global Equity Investments, and a member of the Board of Directors of Scudder, Stevens & Clark and Scudder Kemper Investments.
William S. Stavropoulos (1939)
Year of Election or Appointment: 2002
Trustee
Vice Chairman of the Independent Trustees
Mr. Stavropoulos also serves as Trustee of other Fidelity® funds. Mr. Stavropoulos serves as President and Founder of the Michigan Baseball Foundation, the Great Lakes Loons (2007-present). Mr. Stavropoulos is Chairman Emeritus of the Board of Directors of The Dow Chemical Company, where he previously served in numerous senior management positions, including President, CEO (1995-2000; 2002-2004), Chairman of the Executive Committee (2000-2006), and as a member of the Board of Directors (1990-2006). Currently, Mr. Stavropoulos is Chairman of the Board of Directors of Univar Inc. (global distributor of commodity and specialty chemicals), a Director of Teradata Corporation (data warehousing and technology solutions), and Maersk Inc. (industrial conglomerate), and a member of the Advisory Board for Metalmark Capital LLC (private equity investment, 2005-present). Mr. Stavropoulos is an operating advisor to Clayton, Dubilier & Rice, LLC (private equity investment). In addition, Mr. Stavropoulos is a member of the University of Notre Dame Advisory Council for the College of Science, a Trustee of the Rollin L. Gerstacker Foundation, and a Director of the Naples Philharmonic Center for the Arts. Previously, Mr. Stavropoulos served as a Director of Chemical Financial Corporation (bank holding company, 1993-2012) and Tyco International, Ltd. (multinational manufacturing and services, 2007-2012).
David M. Thomas (1949)
Year of Election or Appointment: 2008
Trustee
Mr. Thomas also serves as Trustee of other Fidelity® funds. Mr. Thomas serves as Non-Executive Chairman of the Board of Directors of Fortune Brands Home and Security (home and security products, 2011-present), as a member of the Board of Directors (2004-present) and Presiding Director (2013-present) of Interpublic Group of Companies, Inc. (marketing communication), and as a member of the Board of Trustees of the University of Florida (2013-present). Previously, Mr. Thomas served as Executive Chairman (2005-2006) and Chairman and Chief Executive Officer (2000-2005) of IMS Health, Inc. (pharmaceutical and healthcare information solutions), and a Director of Fortune Brands, Inc. (consumer products, 2000-2011).
+ The information includes the Trustee's principal occupation during the last five years and other information relating to the experience, attributes, and skills relevant to the Trustee's qualifications to serve as a Trustee, which led to the conclusion that the Trustee should serve as a Trustee for the fund.
Advisory Board Members and Officers:
Correspondence intended for an officer or Peter S. Lynch may be sent to Fidelity Investments, 245 Summer Street, Boston, Massachusetts 02210. Officers appear below in alphabetical order.
Name, Year of Birth; Principal Occupation
Peter S. Lynch (1944)
Year of Election or Appointment: 2003
Member of the Advisory Board
Mr. Lynch also serves as Member of the Advisory Board of other Fidelity® funds. Mr. Lynch is Vice Chairman and a Director of FMR (investment adviser firm) and FMR Co., Inc. (investment adviser firm). In addition, Mr. Lynch serves as a Trustee of Boston College and as the Chairman of the Inner-City Scholarship Fund. Previously, Mr. Lynch served on the Special Olympics International Board of Directors (1997-2006).
Christopher S. Bartel (1971)
Year of Election or Appointment: 2009
Vice President
Mr. Bartel also serves as Vice President of other funds. Mr. Bartel serves as a Director of Fidelity Management & Research (Japan) Limited (investment adviser firm, 2016-present) and Fidelity Management & Research (Hong Kong) (investment adviser firm, 2012-present) and Head of Global Equity Research (2010-present). Previously, Mr. Bartel served as a Director, President, and Chief Executive Officer of Fidelity Management & Research (Japan) Limited (investment adviser firm, 2012-2016), Senior Vice President of Equity Research (2009-2010), Managing Director of Research (2006-2009), and an analyst and portfolio manager (2000-2006).
Marc R. Bryant (1966)
Year of Election or Appointment: 2015
Secretary and Chief Legal Officer (CLO)
Mr. Bryant also serves as Secretary and CLO of other funds. Mr. Bryant serves as CLO, Secretary, and Senior Vice President of Fidelity Management & Research Company (investment adviser firm, 2015-present) and FMR Co., Inc. (investment adviser firm, 2015-present); Secretary of Fidelity SelectCo, LLC (investment adviser firm, 2015-present) and Fidelity Investments Money Management, Inc. (investment adviser firm, 2015-present); and CLO of Fidelity Management & Research (Hong Kong) Limited and FMR Investment Management (U.K.) Limited (investment adviser firms, 2015-present) and Fidelity Management & Research (Japan) Limited (investment adviser firm, 2016-present). He is Senior Vice President and Deputy General Counsel of FMR LLC (diversified financial services company). Previously, Mr. Bryant served as Secretary and CLO of Fidelity Rutland Square Trust II (2010-2014) and Assistant Secretary of Fidelity's Fixed Income and Asset Allocation Funds (2013-2015). Prior to joining Fidelity Investments, Mr. Bryant served as a Senior Vice President and the Head of Global Retail Legal for AllianceBernstein L.P. (2006-2010), and as the General Counsel for ProFund Advisors LLC (2001-2006).
Jeffrey S. Christian (1961)
Year of Election or Appointment: 2016
Assistant Treasurer
Mr. Christian also serves as Assistant Treasurer of other funds. Mr. Christian is an employee of Fidelity Investments (2003-present).
William C. Coffey (1969)
Year of Election or Appointment: 2009
Assistant Secretary
Mr. Coffey also serves as Assistant Secretary of other funds. He is Senior Vice President and Deputy General Counsel of FMR LLC (diversified financial services company, 2010-present), and is an employee of Fidelity Investments. Previously, Mr. Coffey served as Vice President and Associate General Counsel of FMR LLC (2005-2009).
Jonathan Davis (1968)
Year of Election or Appointment: 2010
Assistant Treasurer
Mr. Davis also serves as Assistant Treasurer of other funds, and is an employee of Fidelity Investments. Previously, Mr. Davis served as Vice President and Associate General Counsel of FMR LLC (diversified financial services company, 2003-2010).
Adrien E. Deberghes (1967)
Year of Election or Appointment: 2016
Assistant Treasurer
Mr. Deberghes also serves as an officer of other funds. He serves as Executive Vice President of Fidelity Investments Money Management, Inc. (FIMM) (investment adviser firm, 2016-present) and is an employee of Fidelity Investments (2008-present). Prior to joining Fidelity Investments, Mr. Deberghes was Senior Vice President of Mutual Fund Administration at State Street Corporation (2007-2008), Senior Director of Mutual Fund Administration at Investors Bank & Trust (2005-2007), and Director of Finance for Dunkin' Brands (2000-2005). Previously, Mr. Deberghes served in other fund officer roles.
Stephanie J. Dorsey (1969)
Year of Election or Appointment: 2010
Assistant Treasurer
Ms. Dorsey also serves as an officer of other funds. She is an employee of Fidelity Investments (2008-present) and has served in other fund officer roles. Prior to joining Fidelity Investments, Ms. Dorsey served as Treasurer (2004-2008) of the JPMorgan Mutual Funds and Vice President (2004-2008) of JPMorgan Chase Bank.
Howard J. Galligan III (1966)
Year of Election or Appointment: 2014
Chief Financial Officer
Mr. Galligan also serves as Chief Financial Officer of other funds. Mr. Galligan serves as President of Fidelity Pricing and Cash Management Services (FPCMS) (2014-present) and as a Director of Strategic Advisers, Inc. (investment adviser firm, 2008-present). Previously, Mr. Galligan served as Chief Administrative Officer of Asset Management (2011-2014) and Chief Operating Officer and Senior Vice President of Investment Support for Strategic Advisers, Inc. (2003-2011).
Scott C. Goebel (1968)
Year of Election or Appointment: 2015
Vice President
Mr. Goebel serves as Vice President of other funds and is an employee of Fidelity Investments (2001-present). Mr. Goebel serves as Senior Vice President of Fidelity Management & Research Company (FMR) (investment adviser firm, 2016-present). Previously, Mr. Goebel served as Secretary of Fidelity SelectCo, LLC (investment adviser firm, 2013-2015), Fidelity Investments Money Management, Inc. (FIMM) (investment adviser firm, 2010-2015), and Fidelity Research and Analysis Company (FRAC) (investment adviser firm, 2010-2015); General Counsel, Secretary, and Senior Vice President of FMR (investment adviser firm, 2008-2015) and FMR Co., Inc. (investment adviser firm, 2008-2015); Assistant Secretary of Fidelity Management & Research (Japan) Limited (investment adviser firm, 2008-2015) and Fidelity Management & Research (U.K.) Inc. (investment adviser firm, 2008-2015); Chief Legal Officer (CLO) of Fidelity Management & Research (Hong Kong) Limited (investment adviser firm, 2008-2015); Secretary and CLO of certain Fidelity® funds (2008-2015); Assistant Secretary of FIMM (2008-2010), FRAC (2008-2010), and certain funds (2007-2008); and as Vice President and Secretary of Fidelity Distributors Corporation (FDC) (2005-2007).
Brian B. Hogan (1964)
Year of Election or Appointment: 2009
Vice President
Mr. Hogan also serves as Trustee or Vice President of other funds. Mr. Hogan serves as a Director of FMR Investment Management (U.K.) Limited (investment adviser firm, 2015-present) and Fidelity SelectCo, LLC (investment adviser firm, 2014-present) and President of the Equity Division of FMR (investment adviser firm, 2009-present). Previously, Mr. Hogan served as Senior Vice President, Equity Research of FMR (2006-2009) and as a portfolio manager. Mr. Brian B. Hogan is not related to Mr. Colm A. Hogan.
Colm A. Hogan (1973)
Year of Election or Appointment: 2016
Deputy Treasurer
Mr. Hogan also serves as an officer of other funds. Mr. Hogan is an employee of Fidelity Investments (2005-present). Mr. Colm A. Hogan is not related to Mr. Brian B. Hogan.
Chris Maher (1972)
Year of Election or Appointment: 2013
Assistant Treasurer
Mr. Maher serves as Assistant Treasurer of other funds. Mr. Maher is Vice President of Valuation Oversight and is an employee of Fidelity Investments. Previously, Mr. Maher served as Vice President of Asset Management Compliance (2013), Vice President of the Program Management Group of FMR (investment adviser firm, 2010-2013), and Vice President of Valuation Oversight (2008-2010).
John F. Papandrea (1972)
Year of Election or Appointment: 2016
Anti-Money Laundering (AML) Officer
Mr. Papandrea also serves as AML Officer of other funds. Mr. Papandrea is Vice President of FMR LLC (diversified financial services company, 2008-present) and is an employee of Fidelity Investments (2005-present).
Kenneth B. Robins (1969)
Year of Election or Appointment: 2016
Chief Compliance Officer
Mr. Robins also serves as an officer of other funds. Mr. Robins serves as Compliance Officer of Fidelity Management & Research Company and FMR Co., Inc. (investment adviser firms, 2016-present) and is an employee of Fidelity Investments (2004-present). Previously, Mr. Robins served as Executive Vice President of Fidelity Investments Money Management, Inc. (investment adviser firm, 2013-2016) and served in other fund officer roles.
Stacie M. Smith (1974)
Year of Election or Appointment: 2016
President and Treasurer
Ms. Smith also serves as an officer of other funds. She is an employee of Fidelity Investments (2009-present) and has served in other fund officer roles. Prior to joining Fidelity Investments, Ms. Smith served as Senior Audit Manager of Ernst & Young LLP (1996-2009). Previously, Ms. Smith served as Deputy Treasurer of certain Fidelity® funds (2013-2016).
Renee Stagnone (1975)
Year of Election or Appointment: 2016
Assistant Treasurer
Ms. Stagnone also serves as an officer of other funds. Ms. Stagnone is an employee of Fidelity Investments (1997-present). Previously, Ms. Stagnone served as Deputy Treasurer of certain Fidelity® funds (2013-2016).
Shareholder Expense Example
As a shareholder of the Fund, you incur two types of costs: (1) transaction costs, and (2) ongoing costs, including management fees and other Fund expenses. This Example is intended to help you understand your ongoing costs (in dollars) of investing in the Fund and to compare these costs with the ongoing costs of investing in other mutual funds.
The Example is based on an investment of $1,000 invested at the beginning of the period and held for the entire period (February 1, 2016 to July 31, 2016).
Actual Expenses
The first line of the accompanying table for each class of the Fund provides information about actual account values and actual expenses. You may use the information in this line, together with the amount you invested, to estimate the expenses that you paid over the period. Simply divide your account value by $1,000.00 (for example, an $8,600 account value divided by $1,000.00 = 8.6), then multiply the result by the number in the first line for a class of the Fund under the heading entitled "Expenses Paid During Period" to estimate the expenses you paid on your account during this period. In addition, the Fund, as a shareholder in the underlying Fidelity Central Funds, will indirectly bear its pro-rata share of the fees and expenses incurred by the underlying Fidelity Central Funds. These fees and expenses are not included in the Fund's annualized expense ratio used to calculate the expense estimate in the table below.
Hypothetical Example for Comparison Purposes
The second line of the accompanying table for each class of the Fund provides information about hypothetical account values and hypothetical expenses based on a Class' actual expense ratio and an assumed rate of return of 5% per year before expenses, which is not the Class' actual return. The hypothetical account values and expenses may not be used to estimate the actual ending account balance or expenses you paid for the period. You may use this information to compare the ongoing costs of investing in the Fund and other funds. To do so, compare this 5% hypothetical example with the 5% hypothetical examples that appear in the shareholder reports of the other funds. In addition, the Fund, as a shareholder in the underlying Fidelity Central Funds, will indirectly bear its pro-rata share of the fees and expenses incurred by the underlying Fidelity Central Funds. These fees and expenses are not included in the Fund's annualized expense ratio used to calculate the expense estimate in the table below.
Please note that the expenses shown in the table are meant to highlight your ongoing costs only and do not reflect any transaction costs. Therefore, the second line of the table is useful in comparing ongoing costs only, and will not help you determine the relative total costs of owning different funds.
| | Annualized Expense Ratio-A | Beginning
Account Value
February 1, 2016 | Ending
Account Value
July 31, 2016 | Expenses Paid
During Period-B
February 1, 2016
to July 31, 2016 |
| Series Real Estate Equity | .76% | | | |
| Actual | | $1,000.00 | $1,194.90 | $4.15 |
| Hypothetical-C | | $1,000.00 | $1,021.08 | $3.82 |
| Class F | .59% | | | |
| Actual | | $1,000.00 | $1,196.50 | $3.22 |
| Hypothetical-C | | $1,000.00 | $1,021.93 | $2.97 |
A Annualized expense ratio reflects expenses net of applicable fee waivers.
B Expenses are equal to each Class' annualized expense ratio, multiplied by the average account value over the period, multiplied by 182/366 (to reflect the one-half year period).
C 5% return per year before expenses
Distributions (Unaudited)
The Board of Trustees of Fidelity Series Real Estate Equity Fund voted to pay to shareholders of record at the opening of business on record date, the following distributions per share derived from capital gains realized from sales of portfolio securities, and dividends derived from net investment income:
| | Pay Date | Record Date | Dividends | Capital Gains |
| | | | | |
| Series Real Estate Equity | 09/12/2016 | 09/09/2016 | $0.065 | $0.630 |
| Class F | 09/12/2016 | 09/09/2016 | $0.071 | $0.630 |
The fund hereby designates as a capital gain dividend with respect to the taxable year ended July 31, 2016, $50,257,986, or, if subsequently determined to be different, the net capital gain of such year.
A total of 0.04% of the dividends distributed during the fiscal year was derived from interest on U.S. Government securities which is generally exempt from state income tax.
The fund will notify shareholders in January 2017 of amounts for use in preparing 2016 income tax returns.
Board Approval of Investment Advisory Contracts and Management Fees
Fidelity Series Real Estate Equity Fund
Each year, the Board of Trustees, including the Independent Trustees (together, the Board), votes on the renewal of the management contract with Fidelity Management & Research Company (FMR) and the sub-advisory agreements (together, the Advisory Contracts) for the fund. The Board, assisted by the advice of fund counsel and Independent Trustees' counsel, requests and considers a broad range of information relevant to the renewal of the Advisory Contracts throughout the year.
The Board meets regularly and, at each of its meetings, covers an extensive agenda of topics and materials and considers factors that are relevant to its annual consideration of the renewal of the fund's Advisory Contracts, including the services and support provided to the fund and its shareholders. The Board has established various standing committees (Committees), each composed of and chaired by Independent Trustees with varying backgrounds, to which the Board has assigned specific subject matter responsibilities in order to enhance effective decision-making by the Board. The Board, acting directly and through its Committees, requests and receives information concerning the annual consideration of the renewal of the fund's Advisory Contracts. The Board also meets as needed to consider matters specifically related to the Board's annual consideration of the renewal of the Advisory Contracts. Members of the Board may also meet with trustees of other Fidelity funds through ad hoc joint committees to discuss certain matters relevant to all of the Fidelity funds.
At its July 2016 meeting, the Board unanimously determined to renew the fund's Advisory Contracts. In reaching its determination, the Board considered all factors it believed relevant, including (i) the nature, extent, and quality of the services to be provided to the fund and its shareholders (including the investment performance of the fund); (ii) the competitiveness of the fund's management fee and total expense ratio relative to peer funds; (iii) the total costs of the services to be provided by and the profits to be realized by Fidelity from its relationships with the fund; and (iv) the extent to which, if any, economies of scale exist and would be realized as the fund grows, and whether any economies of scale are appropriately shared with fund shareholders.
In considering whether to renew the Advisory Contracts for the fund, the Board reached a determination, with the assistance of fund counsel and Independent Trustees' counsel and through the exercise of its business judgment, that the renewal of the Advisory Contracts was in the best interests of the fund and its shareholders and that the compensation payable under the Advisory Contracts was fair and reasonable. The Board's decision to renew the Advisory Contracts was not based on any single factor, but rather was based on a comprehensive consideration of all the information provided to the Board at its meetings throughout the year. The Board, in reaching its determination to renew the Advisory Contracts, was aware that shareholders of the fund have a broad range of investment choices available to them, including a wide choice among funds offered by Fidelity's competitors, and that the fund's shareholders, who have the opportunity to review and weigh the disclosure provided by the fund in its prospectus and other public disclosures, have chosen to invest in this fund, which is part of the Fidelity family of funds.
Nature, Extent, and Quality of Services Provided. The Board considered Fidelity's staffing as it relates to the fund, including the backgrounds of investment personnel of Fidelity, and also considered the fund's investment objective, strategies, and related investment philosophy. The Independent Trustees also had discussions with senior management of Fidelity's investment operations and investment groups. The Board considered the structure of the investment personnel compensation program and whether this structure provides appropriate incentives to act in the best interests of the fund. Additionally, the Board considered the portfolio managers' investments, if any, in the funds that they manage.
Resources Dedicated to Investment Management and Support Services. The Board and the Fund Oversight and Research Committees reviewed the general qualifications and capabilities of Fidelity's investment staff, including its size, education, experience, and resources, as well as Fidelity's approach to recruiting, training, managing, and compensating investment personnel. The Board noted that Fidelity has continued to increase the resources devoted to non-U.S. offices, including expansion of Fidelity's global investment organization. The Board also noted that Fidelity's analysts have extensive resources, tools and capabilities that allow them to conduct sophisticated quantitative and fundamental analysis, as well as credit analysis of issuers, counterparties and guarantors. Further, the Board considered that Fidelity's investment professionals have sufficient access to global information and data so as to provide competitive investment results over time, and that those professionals also have access to sophisticated tools that permit them to assess portfolio construction and risk and performance attribution characteristics continuously, as well as to transmit new information and research conclusions rapidly around the world. Additionally, in its deliberations, the Board considered Fidelity's trading, risk management, compliance, and technology and operations capabilities and resources, which are integral parts of the investment management process.
Shareholder and Administrative Services. The Board considered (i) the nature, extent, quality, and cost of advisory, administrative, and shareholder services performed by FMR, the sub-advisers (together with FMR, the Investment Advisers), and their affiliates under the Advisory Contracts and under separate agreements covering transfer agency, pricing and bookkeeping, and securities lending services for the fund; (ii) the nature and extent of the supervision of third party service providers, principally custodians, subcustodians, and pricing vendors; and (iii) the resources devoted to, and the record of compliance with, the fund's compliance policies and procedures. The Board also reviewed the allocation of fund brokerage, including allocations to brokers affiliated with the Investment Advisers, the use of brokerage commissions to pay fund expenses, and the use of "soft" commission dollars to pay for research services.
The Board noted that the growth of fund assets over time across the complex allows Fidelity to reinvest in the development of services designed to enhance the value or convenience of the Fidelity funds as investment vehicles. These services include 24-hour access to account information and market information through telephone representatives and over the Internet, investor education materials and asset allocation tools, and the expanded availability of Fidelity Investor Centers.
In 2014, the Board formed an ad hoc Committee on Transfer Agency Fees to review the variety of transfer agency fee structures throughout the industry and Fidelity's competitive positioning with respect to industry participants.
Investment in a Large Fund Family. The Board considered the benefits to shareholders of investing in a Fidelity fund, including the benefits of investing in a fund that is part of a large family of funds offering a variety of investment disciplines and providing a large variety of mutual fund investor services. The Board noted that Fidelity had taken, or had made recommendations that resulted in the Fidelity funds taking, a number of actions over the previous year that benefited particular funds, including: (i) continuing to dedicate additional resources to investment research and to the support of the senior management team that oversees asset management; (ii) continuing efforts to enhance Fidelity's global research capabilities; (iii) launching new funds and making other enhancements to meet client needs; (iv) broadening eligibility requirements for certain lower-priced share classes of, and streamlining the fee structure for, certain existing equity index funds; (v) lowering expense caps for certain existing funds and classes to reduce expenses paid by shareholders; (vi) eliminating redemption fees for certain variable insurance product funds and classes; (vii) continuing to launch dedicated lower cost underlying funds to meet portfolio construction needs related to expanding underlying fund options for Fidelity funds of funds, specifically for the Freedom Fund product lines; (viii) launching a lower cost share class for use by the Freedom Index Fund product line; (ix) rationalizing product lines and gaining increased efficiencies through fund mergers and share class consolidations; (x) continuing to develop, acquire and implement systems and technology to improve services to the funds and shareholders, strengthen information security, and increase efficiency; (xi) implementing investment enhancements to further strengthen Fidelity's target date product line to increase investors' probability of success in achieving their goals; (xii) accelerating the conversion of all remaining Class B shares to Class A shares, which have a lower expense structure; and (xiii) implementing changes to Fidelity's money market fund product line in response to recent regulatory reforms.
Investment Performance. The Board considered whether the fund has operated in accordance with its investment objective, as well as its record of compliance with its investment restrictions and its performance history.
The Board took into account discussions with representatives of the Investment Advisers about fund investment performance that occur at Board meetings throughout the year. In this regard the Board noted that as part of regularly scheduled fund reviews and other reports to the Board on fund performance, the Board considers annualized return information for the fund, for different time periods, measured against a securities market index ("benchmark index") and a peer group of funds with similar objectives ("peer group"), if any. In its evaluation of fund investment performance, the Board gave particular attention to information indicating changes in performance of certain Fidelity funds for specific time periods and discussed with the Investment Advisers the reasons for any overperformance or underperformance.
In addition to reviewing absolute and relative fund performance, the Independent Trustees periodically consider the appropriateness of fund performance metrics in evaluating the results achieved. In general, the Independent Trustees believe that fund performance should be evaluated based on net performance (after fees and expenses) of both the highest performing and lowest performing fund share classes, where applicable, compared to appropriate benchmark indices, over appropriate time periods that may include full market cycles, and compared to peer groups, as applicable, over the same periods, taking into account relevant factors including the following: general market conditions; issuer-specific information; and fund cash flows and other factors.
The Independent Trustees recognize that shareholders evaluate performance on a net basis over their own holding periods, for which one-, three-, and five-year periods are often used as a proxy. For this reason, the performance information reviewed by the Board also included net cumulative calendar year total return information for the fund and an appropriate benchmark index for the most recent one- and three-year periods, as shown below. A peer group is not shown below because the fund does not generally utilize a peer group for performance comparison purposes.
Fidelity Series Real Estate Equity Fund
The Board has discussed with FMR the fund's underperformance (based on the December 31, 2015 data presented herein) and has engaged with FMR to consider what steps might be taken to remediate the fund's underperformance. The Board noted that the fund's performance has improved since the period shown.
Based on its review, the Board concluded that the nature, extent, and quality of services provided to the fund under the Advisory Contracts should continue to benefit the shareholders of the fund.
Competitiveness of Management Fee and Total Expense Ratio. The Board considered the fund's management fee and total expense ratio compared to "mapped groups" of competitive funds and classes created for the purpose of facilitating the Trustees' competitive analysis of management fees and total expenses. Fidelity creates "mapped groups" by combining similar Broadridge investment objective categories that have comparable investment mandates. Combining Broadridge investment objective categories aids the Board's management fee and total expense ratio comparisons by broadening the competitive group used for comparison.
Management Fee. The Board considered two proprietary management fee comparisons for the 12-month (or shorter) periods shown in basis points (BP) in the chart below. The group of Broadridge funds used by the Board for management fee comparisons is referred to below as the "Total Mapped Group." The Total Mapped Group comparison focuses on a fund's standing in terms of gross management fees before expense reimbursements or caps relative to the total universe of funds with comparable investment mandates, regardless of whether their management fee structures also are comparable. Funds with comparable investment mandates offer exposure to similar types of securities. Funds with comparable management fee structures have similar management fee contractual arrangements (
e.g., flat rate charged for advisory services, all-inclusive fee rate,
etc.). "TMG %" represents the percentage of funds in the Total Mapped Group that had management fees that were lower than the fund's. For example, a hypothetical TMG % of 20% would mean that 80% of the funds in the Total Mapped Group had higher, and 20% had lower, management fees than the fund. The fund's actual TMG %s and the number of funds in the Total Mapped Group are in the chart below. The "Asset-Size Peer Group" (ASPG) comparison focuses on a fund's standing relative to a subset of non-Fidelity funds within the Total Mapped Group that are similar in size and management fee structure. For example, if a fund is in the first quartile of the ASPG, the fund's management fee ranks in the least expensive or lowest 25% of funds in the ASPG. The ASPG represents at least 15% of the funds in the Total Mapped Group with comparable asset size and management fee structures, subject to a minimum of 50 funds (or all funds in the Total Mapped Group if fewer than 50). Additional information, such as the ASPG quartile in which the fund's management fee rate ranked, is also included in the chart and considered by the Board.
Fidelity Series Real Estate Equity Fund
The Board noted that the fund's management fee rate ranked below the median of its Total Mapped Group and below the median of its ASPG for 2015.
The Board noted that, in 2014, the ad hoc Committee on Group Fee was formed by it and the boards of other Fidelity funds to conduct an in-depth review of the "group fee" component of the management fee of funds with such management fee structures. The Committee's focus included the mechanics of the group fee, the competitive landscape of group fee structures, Fidelity funds with no group fee component and investment products not included in group fee assets. The Board also considered that, for funds subject to the group fee, FMR agreed to voluntarily waive fees over a specified period of time in amounts designed to account for assets converted from certain funds to certain collective investment trusts.
The Board also noted that, in 2013, the ad hoc Committee on Management Fees was formed to conduct an in-depth review of the management fee rates of Fidelity's active equity mutual funds. The Committee focused on the following areas: (i) standard fee structures; (ii) research consumption and trading evolution; (iii) management fee competitiveness/profitability by category; and (iv) factors that drive institutional pricing.
Based on its review, the Board concluded that the fund's management fee is fair and reasonable in light of the services that the fund receives and the other factors considered.
Total Expense Ratio. In its review of each class's total expense ratio, the Board considered the fund's management fee rate as well as other fund or class expenses, as applicable, such as transfer agent fees, pricing and bookkeeping fees, and custodial, legal, and audit fees. The Board also noted that Fidelity may agree to waive fees and expenses from time to time, and the extent to which, if any, it has done so for the fund. As part of its review, the Board also considered the current and historical total expense ratios of each class of the fund compared to competitive fund median expenses. Each class of the fund is compared to those funds and classes in the Total Mapped Group (used by the Board for management fee comparisons) that have a similar sales load structure.
The Board noted that the total expense ratio of each class ranked below the competitive median for 2015.
Fees Charged to Other Fidelity Clients. The Board also considered Fidelity fee structures and other information with respect to clients of Fidelity, such as other funds advised or subadvised by Fidelity, pension plan clients, and other institutional clients with similar mandates. The Board noted the findings of the 2013 ad hoc joint committee (created with the board of other Fidelity funds), which reviewed and compared Fidelity's institutional investment advisory business with its business of providing services to the Fidelity funds, including the differences in services provided, fees charged, and costs incurred, as well as competition in their respective marketplaces.
Based on its review of total expense ratios and fees charged to other Fidelity clients, the Board concluded that the total expense ratio of each class of the fund was reasonable in light of the services that the fund and its shareholders receive and the other factors considered.
Costs of the Services and Profitability. The Board considered the revenues earned and the expenses incurred by Fidelity in conducting the business of developing, marketing, distributing, managing, administering and servicing the fund and servicing the fund's shareholders. The Board also considered the level of Fidelity's profits in respect of all the Fidelity funds.
On an annual basis, Fidelity presents to the Board information about the profitability of its relationship with the fund. Fidelity calculates profitability information for each fund, as well as aggregate profitability information for groups of Fidelity funds and all Fidelity funds, using a series of detailed revenue and cost allocation methodologies which originate with the books and records of Fidelity on which Fidelity's audited financial statements are based. The Audit Committee of the Board reviews any significant changes from the prior year's methodologies.
PricewaterhouseCoopers LLP (PwC), independent registered public accounting firm and auditor to Fidelity and certain Fidelity funds, has been engaged annually by the Board as part of the Board's assessment of Fidelity's profitability analysis. PwC's engagement includes the review and assessment of the methodologies used by Fidelity in determining the revenues and expenses attributable to Fidelity's mutual fund business, and completion of agreed-upon procedures in respect of the mathematical accuracy of the fund profitability information and its conformity to established allocation methodologies. After considering PwC's reports issued under the engagement and information provided by Fidelity, the Board concluded that while other allocation methods may also be reasonable, Fidelity's profitability methodologies are reasonable in all material respects.
The Board also reviewed Fidelity's non-fund businesses and fall-out benefits related to the mutual fund business as well as cases where Fidelity's affiliates may benefit from or be related to the fund's business.
The Board considered the costs of the services provided by and the profits realized by Fidelity in connection with the operation of the fund and was satisfied that the profitability was not excessive.
Economies of Scale. The Board considered whether there have been economies of scale in respect of the management of the Fidelity funds, whether the Fidelity funds (including the fund) have appropriately benefited from any such economies of scale, and whether there is potential for realization of any further economies of scale. The Board considered the extent to which the fund will benefit from economies of scale as assets grow through increased services to the fund, through waivers or reimbursements, or through fee or expense ratio reductions. The Board also noted that in 2013, it and the boards of other Fidelity funds created an ad hoc committee (the Economies of Scale Committee) to analyze whether Fidelity attains economies of scale in respect of the management and servicing of the Fidelity funds, whether the Fidelity funds have appropriately benefited from such economies of scale, and whether there is potential for realization of any further economies of scale.
The Board recognized that the fund's management contract incorporates a "group fee" structure, which provides for lower group fee rates as total group assets increase, and for higher group fee rates as total group assets decrease (with "group assets" defined to include fund assets under FMR's management plus the assets of sector funds previously under FMR's management). FMR calculates the group fee rates based on a tiered asset "breakpoint" schedule that varies based on asset class. The Board considered that the group fee is designed to deliver the benefits of economies of scale to fund shareholders when total Fidelity fund assets increase, even if assets of any particular fund are unchanged or have declined, because some portion of Fidelity's costs are attributable to services provided to all Fidelity funds, and all funds benefit if those costs can be allocated among more assets. The Board also considered that although the fund is offered only to other Fidelity funds, it continues to incur investment management expenses. The Board further noted that the fund may continue to realize benefits from the group fee structure, even though assets may not be expected to grow significantly at the fund level. The Board concluded that, given the group fee structure, fund shareholders will benefit from lower management fees as group assets increase at the fund complex level, regardless of whether Fidelity achieves any such economies of scale.
The Board concluded, taking into account the analysis of the Economies of Scale Committee, that economies of scale, if any, are being appropriately shared between fund shareholders and Fidelity.
Approval of New Advisory Contracts. The Board also voted to approve a new management contract and new sub-advisory agreements for the fund (New Advisory Contracts) that will take effect if the shareholders of certain other Fidelity funds that invest in the fund (referred to herein as Freedom Funds) approve new management contracts for the Freedom Funds. Under the New Advisory Contracts the fund will no longer pay a management fee to FMR. The new sub-advisory agreements provide that FMR or its affiliates will pay the fees based on a portion of the management fees received by an affiliate of FMR under its management contracts with the Freedom Funds. The Board noted the New Advisory Contracts are expected to result in an overall decrease in the fees and expenses payable by the fund. The Board considered that the approval of the New Advisory Contracts will not result in any changes to (i) the investment process or strategies employed in the management of the fund's assets; (ii) the nature, extent and quality of services provided to the fund; or (iii) the day-to-day management of the fund and the personnel primarily responsible for such management. The Board also considered that the New Advisory Contracts provide that FMR or an affiliate undertakes to pay all operating expenses of the fund, except transfer agent fees, 12b-1 fees, Independent Trustee expenses, custodian fees and expenses, expenses related to proxy solicitations, interest, taxes, brokerage expenses, and extraordinary expenses (such as litigation expenses).
Additional Information Requested by the Board. In order to develop fully the factual basis for consideration of the Fidelity funds' Advisory Contracts, the Board requested and received additional information on certain topics, including: (i) fund performance trends and Fidelity's long-term strategies for certain funds; (ii) the various share classes employed by Fidelity and the attributes of each class, together with similar information on the distribution and servicing payments made by Fidelity or the funds to third-party participants in the distribution channels; (iii) fund profitability, and fund performance in relation to fund profitability; (iv) the methodology with respect to evaluating competitive fund data and peer group classifications and fee comparisons; (v) annual fund profitability margins; (vi) the realization of fall-out benefits in and attribution of fall-out benefits to certain Fidelity business units; (vii) the appropriateness of certain funds' benchmarks; (viii) the rationalization for certain share classes and expenses; (ix) sub-advisory fee rates for comparable investment mandates; (x) product strategy for certain underperforming funds; and (xi) Fidelity's resources and strategy for cybersecurity.
Based on its evaluation of all of the conclusions noted above, and after considering all factors it believed relevant, the Board concluded that the advisory fee structures are fair and reasonable, and that the fund's Advisory Contracts should be renewed.
Corporate Headquarters
245 Summer St.
Boston, MA 02210
www.fidelity.com
SLE-ANN-0916
1.930453.104
Fidelity® Blue Chip Value Fund
Annual Report July 31, 2016 |
|
Contents
To view a fund's proxy voting guidelines and proxy voting record for the 12-month period ended June 30, visit http://www.fidelity.com/proxyvotingresults or visit the Securities and Exchange Commission's (SEC) web site at http://www.sec.gov.
You may also call 1-800-544-8544 to request a free copy of the proxy voting guidelines.
Standard & Poor's, S&P and S&P 500 are registered service marks of The McGraw-Hill Companies, Inc. and have been licensed for use by Fidelity Distributors Corporation.
Other third-party marks appearing herein are the property of their respective owners.
All other marks appearing herein are registered or unregistered trademarks or service marks of FMR LLC or an affiliated company. © 2016 FMR LLC. All rights reserved.
This report and the financial statements contained herein are submitted for the general information of the shareholders of the Fund. This report is not authorized for distribution to prospective investors in the Fund unless preceded or accompanied by an effective prospectus.
A fund files its complete schedule of portfolio holdings with the SEC for the first and third quarters of each fiscal year on Form N-Q. Forms N-Q are available on the SEC’s web site at http://www.sec.gov. A fund's Forms N-Q may be reviewed and copied at the SEC’s Public Reference Room in Washington, DC. Information regarding the operation of the SEC's Public Reference Room may be obtained by calling 1-800-SEC-0330.
For a complete list of a fund's portfolio holdings, view the most recent holdings listing, semiannual report, or annual report on Fidelity's web site at http://www.fidelity.com, http://www.institutional.fidelity.com, or http://www.401k.com, as applicable.
NOT FDIC INSURED •MAY LOSE VALUE •NO BANK GUARANTEE
Neither the Fund nor Fidelity Distributors Corporation is a bank.
Performance: The Bottom Line
Average annual total return reflects the change in the value of an investment, assuming reinvestment of distributions from dividend income and capital gains (the profits earned upon the sale of securities that have grown in value, if any) and assuming a constant rate of performance each year. The hypothetical investment and the average annual total returns do not reflect the deduction of taxes that a shareholder would pay on fund distributions or the redemption of fund shares. During periods of reimbursement by Fidelity, a fund’s total return will be greater than it would be had the reimbursement not occurred. How a fund did yesterday is no guarantee of how it will do tomorrow.
Average Annual Total Returns
| For the periods ended July 31, 2016 | Past 1 year | Past 5 years | Past 10 years |
| Fidelity® Blue Chip Value Fund | (2.31)% | 10.11% | 3.93% |
$10,000 Over 10 Years
Let's say hypothetically that $10,000 was invested in Fidelity® Blue Chip Value Fund on July 31, 2006.
The chart shows how the value of your investment would have changed, and also shows how the Russell 1000® Value Index performed over the same period.
| Period Ending Values |
| $14,697 | Fidelity® Blue Chip Value Fund |
| $18,213 | Russell 1000® Value Index |
Management's Discussion of Fund Performance
Market Recap: U.S. equities gained modestly for the year ending July 31, 2016, overcoming persistent concern about global economic growth, uncertainty regarding U.S. monetary policy and the U.K.’s late-June vote to leave the European Union, dubbed Brexit. The S&P 500
® index rose 5.61%, with larger-cap, value-oriented stocks and defensive sectors shining brightest. Volatility peaked in the early weeks of 2016, as continued oil-price weakness and U.S.-dollar strength pushed the S&P 500
® to its worst January since 2009. Markets then rallied beginning in February amid U.S. job gains, a broad rally in energy and materials markets, global economic stimulus and perceived softening of monetary policy by the U.S. Federal Reserve. The June 23 Brexit vote surprised markets and resulted in a sharp two-day decline for stocks, followed by a rebound as investor sentiment shifted and remained positive through July 31. For the year, dividend-rich telecom services (+26%), utilities (+23%) and consumer staples (+12%) led the way amid strong investor demand for yield. Industrials and technology (+10%) also outperformed, as did materials (+8%), despite a weak commodities environment overall. Conversely, a strong period for real estate stocks couldn’t keep the financials sector (-4%) from losing ground, as low interest rates continued to squeeze bank profits.
Comments from Portfolio Manager Sean Gavin: For the year, the fund returned -2.31%, significantly lagging the 5.38% advance of the benchmark Russell 1000
® Value Index. The fund underperformed partly because I underweighted utilities and avoided telecommunication services – two sectors that struck me as unattractively valued, but nevertheless performed well this past year. Poor stock picking also hampered relative results, especially within the materials and health care sectors. Within materials, fertilizer manufacturer CF Industries Holdings was a particularly big detractor. The company faced the twin headwinds of a scuttled merger and a depreciating Chinese currency. In health care, the fund was hurt by positions in drug makers Teva Pharmaceutical Industries, Allergan and Sanofi, the last of which was not in the benchmark. I sold the Sanofi position near period end. On the positive side, overweighting the strong information technology category and underweighting the lagging financials group added value. In financials, our relative results benefited most from not owning Citigroup and Bank of America, two large banks and index members that did not meet my valuation and quality criteria. Elsewhere, an out-of-benchmark stake in Korean electronics giant Samsung also contributed, largely due to a strengthening Korean won.
The views expressed above reflect those of the portfolio manager(s) only through the end of the period as stated on the cover of this report and do not necessarily represent the views of Fidelity or any other person in the Fidelity organization. Any such views are subject to change at any time based upon market or other conditions and Fidelity disclaims any responsibility to update such views. These views may not be relied on as investment advice and, because investment decisions for a Fidelity fund are based on numerous factors, may not be relied on as an indication of trading intent on behalf of any Fidelity fund.
Investment Summary (Unaudited)
Top Ten Stocks as of July 31, 2016
| | % of fund's net assets | % of fund's net assets 6 months ago |
| EMC Corp. | 5.0 | 4.1 |
| Berkshire Hathaway, Inc. Class B | 4.7 | 3.5 |
| Teva Pharmaceutical Industries Ltd. sponsored ADR | 4.0 | 4.3 |
| JPMorgan Chase & Co. | 3.9 | 3.5 |
| Alphabet, Inc. Class A | 3.9 | 3.1 |
| Wells Fargo & Co. | 3.6 | 3.5 |
| Samsung Electronics Co. Ltd. | 3.3 | 2.1 |
| Apple, Inc. | 2.8 | 1.1 |
| Johnson & Johnson | 2.8 | 3.4 |
| Allergan PLC | 2.7 | 2.4 |
| | 36.7 | |
Top Five Market Sectors as of July 31, 2016
| | % of fund's net assets | % of fund's net assets 6 months ago |
| Financials | 29.6 | 25.6 |
| Information Technology | 24.0 | 21.1 |
| Health Care | 15.3 | 17.0 |
| Consumer Discretionary | 9.8 | 10.9 |
| Energy | 6.1 | 9.5 |
Asset Allocation (% of fund's net assets)
| As of July 31, 2016* |
| | Stocks | 99.2% |
| | Short-Term Investments and Net Other Assets (Liabilities) | 0.8% |

* Foreign investments - 25.2%
| As of January 31, 2016* |
| | Stocks | 99.1% |
| | Short-Term Investments and Net Other Assets (Liabilities) | 0.9% |

* Foreign investments - 21.7%
Investments July 31, 2016
Showing Percentage of Net Assets
| Common Stocks - 99.2% | | | |
| | | Shares | Value |
| CONSUMER DISCRETIONARY - 9.8% | | | |
| Media - 7.8% | | | |
| CBS Corp. Class B | | 130,300 | $6,804,266 |
| Discovery Communications, Inc. Class A (a) | | 137,200 | 3,442,348 |
| Starz Series A (a) | | 258,700 | 7,820,501 |
| Twenty-First Century Fox, Inc. Class A | | 324,500 | 8,644,680 |
| Viacom, Inc. Class B (non-vtg.) | | 196,600 | 8,939,402 |
| | | | 35,651,197 |
| Specialty Retail - 0.7% | | | |
| GNC Holdings, Inc. | | 162,300 | 3,312,543 |
| Textiles, Apparel & Luxury Goods - 1.3% | | | |
| PVH Corp. | | 56,800 | 5,740,208 |
|
| TOTAL CONSUMER DISCRETIONARY | | | 44,703,948 |
|
| CONSUMER STAPLES - 2.8% | | | |
| Beverages - 1.8% | | | |
| C&C Group PLC | | 2,092,980 | 8,433,186 |
| Food & Staples Retailing - 1.0% | | | |
| CVS Health Corp. | | 48,300 | 4,478,376 |
| Safeway, Inc.: | | | |
| rights (a) | | 48,800 | 0 |
| rights (a) | | 48,800 | 8,784 |
| | | | 4,487,160 |
|
| TOTAL CONSUMER STAPLES | | | 12,920,346 |
|
| ENERGY - 6.1% | | | |
| Energy Equipment & Services - 0.6% | | | |
| BW Offshore Ltd. (b) | | 94,602,036 | 2,803,140 |
| Oil, Gas & Consumable Fuels - 5.5% | | | |
| Golar LNG Partners LP | | 138,100 | 2,637,710 |
| Phillips 66 Co. | | 46,900 | 3,567,214 |
| Teekay Corp. | | 817,700 | 5,069,740 |
| Teekay LNG Partners LP | | 433,300 | 4,419,660 |
| Teekay Offshore Partners LP | | 1,680,400 | 9,359,828 |
| | | | 25,054,152 |
|
| TOTAL ENERGY | | | 27,857,292 |
|
| FINANCIALS - 29.6% | | | |
| Banks - 9.5% | | | |
| JPMorgan Chase & Co. | | 283,416 | 18,130,122 |
| U.S. Bancorp | | 218,797 | 9,226,669 |
| Wells Fargo & Co. | | 341,098 | 16,362,471 |
| | | | 43,719,262 |
| Capital Markets - 1.6% | | | |
| Goldman Sachs Group, Inc. | | 45,500 | 7,225,855 |
| Consumer Finance - 3.4% | | | |
| Capital One Financial Corp. | | 100,133 | 6,716,922 |
| Discover Financial Services | | 153,700 | 8,736,308 |
| | | | 15,453,230 |
| Diversified Financial Services - 4.7% | | | |
| Berkshire Hathaway, Inc. Class B (a) | | 149,100 | 21,510,657 |
| Insurance - 8.0% | | | |
| Allstate Corp. | | 118,700 | 8,110,771 |
| Chubb Ltd. | | 73,400 | 9,194,084 |
| Prudential PLC | | 489,791 | 8,634,269 |
| The Travelers Companies, Inc. | | 90,300 | 10,494,666 |
| | | | 36,433,790 |
| Real Estate Investment Trusts - 0.7% | | | |
| Annaly Capital Management, Inc. | | 299,000 | 3,283,020 |
| Real Estate Management & Development - 1.7% | | | |
| CBRE Group, Inc. (a) | | 271,900 | 7,735,555 |
|
| TOTAL FINANCIALS | | | 135,361,369 |
|
| HEALTH CARE - 15.3% | | | |
| Biotechnology - 3.8% | | | |
| Amgen, Inc. | | 66,700 | 11,474,401 |
| Dyax Corp. rights 12/31/19 (a) | | 236,600 | 570,206 |
| Shire PLC sponsored ADR | | 26,468 | 5,137,968 |
| | | | 17,182,575 |
| Health Care Providers & Services - 2.0% | | | |
| Cigna Corp. | | 70,700 | 9,117,472 |
| Pharmaceuticals - 9.5% | | | |
| Allergan PLC (a) | | 49,200 | 12,445,140 |
| Johnson & Johnson | | 101,200 | 12,673,276 |
| Teva Pharmaceutical Industries Ltd. sponsored ADR | | 345,900 | 18,505,650 |
| | | | 43,624,066 |
|
| TOTAL HEALTH CARE | | | 69,924,113 |
|
| INDUSTRIALS - 5.6% | | | |
| Aerospace & Defense - 1.2% | | | |
| United Technologies Corp. | | 50,600 | 5,447,090 |
| Machinery - 2.0% | | | |
| Deere & Co. | | 118,900 | 9,239,719 |
| Professional Services - 1.4% | | | |
| Dun & Bradstreet Corp. | | 50,100 | 6,475,425 |
| Trading Companies & Distributors - 1.0% | | | |
| AerCap Holdings NV (a) | | 125,200 | 4,571,052 |
|
| TOTAL INDUSTRIALS | | | 25,733,286 |
|
| INFORMATION TECHNOLOGY - 24.0% | | | |
| Communications Equipment - 4.2% | | | |
| Cisco Systems, Inc. | | 322,585 | 9,848,520 |
| Harris Corp. | | 107,400 | 9,302,988 |
| | | | 19,151,508 |
| Internet Software & Services - 5.6% | | | |
| Alphabet, Inc. Class A | | 22,600 | 17,884,284 |
| eBay, Inc. (a) | | 246,300 | 7,674,708 |
| | | | 25,558,992 |
| IT Services - 1.8% | | | |
| The Western Union Co. | | 404,100 | 8,082,000 |
| Software - 1.3% | | | |
| VMware, Inc. Class A (a)(b) | | 79,800 | 5,823,804 |
| Technology Hardware, Storage & Peripherals - 11.1% | | | |
| Apple, Inc. | | 124,000 | 12,922,040 |
| EMC Corp. | | 810,800 | 22,929,423 |
| Samsung Electronics Co. Ltd. | | 10,882 | 15,049,783 |
| | | | 50,901,246 |
|
| TOTAL INFORMATION TECHNOLOGY | | | 109,517,550 |
|
| MATERIALS - 4.1% | | | |
| Chemicals - 4.1% | | | |
| CF Industries Holdings, Inc. | | 378,700 | 9,346,316 |
| LyondellBasell Industries NV Class A | | 127,700 | 9,610,702 |
| | | | 18,957,018 |
| UTILITIES - 1.9% | | | |
| Electric Utilities - 1.9% | | | |
| Exelon Corp. | | 230,500 | 8,593,040 |
| TOTAL COMMON STOCKS | | | |
| (Cost $441,353,878) | | | 453,567,962 |
|
| Money Market Funds - 2.3% | | | |
| Fidelity Cash Central Fund, 0.42% (c) | | 4,462,105 | 4,462,105 |
| Fidelity Securities Lending Cash Central Fund, 0.45% (c)(d) | | 6,002,650 | 6,002,650 |
| TOTAL MONEY MARKET FUNDS | | | |
| (Cost $10,464,755) | | | 10,464,755 |
| TOTAL INVESTMENT PORTFOLIO - 101.5% | | | |
| (Cost $451,818,633) | | | 464,032,717 |
| NET OTHER ASSETS (LIABILITIES) - (1.5)% | | | (6,855,582) |
| NET ASSETS - 100% | | | $457,177,135 |
Legend
(a) Non-income producing
(b) Security or a portion of the security is on loan at period end.
(c) Affiliated fund that is generally available only to investment companies and other accounts managed by Fidelity Investments. The rate quoted is the annualized seven-day yield of the fund at period end. A complete unaudited listing of the fund's holdings as of its most recent quarter end is available upon request. In addition, each Fidelity Central Fund's financial statements, which are not covered by the Fund's Report of Independent Registered Public Accounting Firm, are available on the SEC's website or upon request.
(d) Investment made with cash collateral received from securities on loan.
Affiliated Central Funds
Information regarding fiscal year to date income earned by the Fund from investments in Fidelity Central Funds is as follows:
| Fund | Income earned |
| Fidelity Cash Central Fund | $46,257 |
| Fidelity Securities Lending Cash Central Fund | 62,337 |
| Total | $108,594 |
Investment Valuation
The following is a summary of the inputs used, as of July 31, 2016, involving the Fund's assets and liabilities carried at fair value. The inputs or methodology used for valuing securities may not be an indication of the risk associated with investing in those securities. For more information on valuation inputs, and their aggregation into the levels used below, please refer to the Investment Valuation section in the accompanying Notes to Financial Statements.
| | Valuation Inputs at Reporting Date: |
| Description | Total | Level 1 | Level 2 | Level 3 |
| Investments in Securities: | | | | |
| Equities: | | | | |
| Consumer Discretionary | $44,703,948 | $44,703,948 | $-- | $-- |
| Consumer Staples | 12,920,346 | 12,911,562 | -- | 8,784 |
| Energy | 27,857,292 | 27,857,292 | -- | -- |
| Financials | 135,361,369 | 126,727,100 | 8,634,269 | -- |
| Health Care | 69,924,113 | 69,353,907 | -- | 570,206 |
| Industrials | 25,733,286 | 25,733,286 | -- | -- |
| Information Technology | 109,517,550 | 109,517,550 | -- | -- |
| Materials | 18,957,018 | 18,957,018 | -- | -- |
| Utilities | 8,593,040 | 8,593,040 | -- | -- |
| Money Market Funds | 10,464,755 | 10,464,755 | -- | -- |
| Total Investments in Securities: | $464,032,717 | $454,819,458 | $8,634,269 | $578,990 |
Other Information
Distribution of investments by country or territory of incorporation, as a percentage of Total Net Assets, is as follows (Unaudited):
| United States of America | 74.8% |
| Marshall Islands | 4.7% |
| Ireland | 4.5% |
| Israel | 4.0% |
| Korea (South) | 3.3% |
| Netherlands | 3.1% |
| Switzerland | 2.0% |
| United Kingdom | 1.9% |
| Bailiwick of Jersey | 1.1% |
| Others (Individually Less Than 1%) | 0.6% |
| | 100.0% |
See accompanying notes which are an integral part of the financial statements.
Financial Statements
Statement of Assets and Liabilities
| | | July 31, 2016 |
| Assets | | |
Investment in securities, at value (including securities loaned of $5,855,091) — See accompanying schedule:
Unaffiliated issuers (cost $441,353,878) | $453,567,962 | |
| Fidelity Central Funds (cost $10,464,755) | 10,464,755 | |
| Total Investments (cost $451,818,633) | | $464,032,717 |
| Cash | | 619,389 |
| Receivable for fund shares sold | | 233,379 |
| Dividends receivable | | 518,188 |
| Distributions receivable from Fidelity Central Funds | | 8,769 |
| Other receivables | | 4,824 |
| Total assets | | 465,417,266 |
| Liabilities | | |
| Payable for investments purchased | $999,357 | |
| Payable for fund shares redeemed | 895,619 | |
| Accrued management fee | 194,398 | |
| Other affiliated payables | 96,282 | |
| Other payables and accrued expenses | 51,825 | |
| Collateral on securities loaned, at value | 6,002,650 | |
| Total liabilities | | 8,240,131 |
| Net Assets | | $457,177,135 |
| Net Assets consist of: | | |
| Paid in capital | | $519,292,250 |
| Undistributed net investment income | | 2,279,667 |
| Accumulated undistributed net realized gain (loss) on investments and foreign currency transactions | | (76,609,155) |
| Net unrealized appreciation (depreciation) on investments and assets and liabilities in foreign currencies | | 12,214,373 |
| Net Assets, for 28,236,131 shares outstanding | | $457,177,135 |
| Net Asset Value, offering price and redemption price per share ($457,177,135 ÷ 28,236,131 shares) | | $16.19 |
See accompanying notes which are an integral part of the financial statements.
Statement of Operations
| | | Year ended July 31, 2016 |
| Investment Income | | |
| Dividends | | $9,932,250 |
| Interest | | 87 |
| Income from Fidelity Central Funds | | 108,594 |
| Total income | | 10,040,931 |
| Expenses | | |
| Management fee | | |
| Basic fee | $2,613,234 | |
| Performance adjustment | 278,334 | |
| Transfer agent fees | 987,722 | |
| Accounting and security lending fees | 186,892 | |
| Custodian fees and expenses | 16,827 | |
| Independent trustees' fees and expenses | 2,067 | |
| Registration fees | 36,316 | |
| Audit | 64,009 | |
| Legal | 3,981 | |
| Miscellaneous | 2,886 | |
| Total expenses before reductions | 4,192,268 | |
| Expense reductions | (19,947) | 4,172,321 |
| Net investment income (loss) | | 5,868,610 |
| Realized and Unrealized Gain (Loss) | | |
| Net realized gain (loss) on: | | |
| Investment securities: | | |
| Unaffiliated issuers | (5,120,738) | |
| Foreign currency transactions | (10,364) | |
| Futures contracts | (814,285) | |
| Total net realized gain (loss) | | (5,945,387) |
Change in net unrealized appreciation (depreciation) on:
Investment securities | (7,336,762) | |
| Assets and liabilities in foreign currencies | 432 | |
| Total change in net unrealized appreciation (depreciation) | | (7,336,330) |
| Net gain (loss) | | (13,281,717) |
| Net increase (decrease) in net assets resulting from operations | | $(7,413,107) |
See accompanying notes which are an integral part of the financial statements.
Statement of Changes in Net Assets
| | Year ended July 31, 2016 | Year ended July 31, 2015 |
| Increase (Decrease) in Net Assets | | |
| Operations | | |
| Net investment income (loss) | $5,868,610 | $7,735,773 |
| Net realized gain (loss) | (5,945,387) | 31,020,802 |
| Change in net unrealized appreciation (depreciation) | (7,336,330) | 2,266,425 |
| Net increase (decrease) in net assets resulting from operations | (7,413,107) | 41,023,000 |
| Distributions to shareholders from net investment income | (8,116,183) | (4,830,518) |
| Distributions to shareholders from net realized gain | (249,078) | – |
| Total distributions | (8,365,261) | (4,830,518) |
| Share transactions | | |
| Proceeds from sales of shares | 207,887,799 | 115,913,276 |
| Reinvestment of distributions | 8,172,884 | 4,701,954 |
| Cost of shares redeemed | (154,073,639) | (75,665,221) |
| Net increase (decrease) in net assets resulting from share transactions | 61,987,044 | 44,950,009 |
| Total increase (decrease) in net assets | 46,208,676 | 81,142,491 |
| Net Assets | | |
| Beginning of period | 410,968,459 | 329,825,968 |
| End of period | $457,177,135 | $410,968,459 |
| Other Information | | |
| Undistributed net investment income end of period | $2,279,667 | $4,925,285 |
| Shares | | |
| Sold | 13,194,488 | 7,061,079 |
| Issued in reinvestment of distributions | 527,295 | 302,238 |
| Redeemed | (9,825,183) | (4,693,685) |
| Net increase (decrease) | 3,896,600 | 2,669,632 |
See accompanying notes which are an integral part of the financial statements.
Financial Highlights — Fidelity Blue Chip Value Fund
| Years ended July 31, | 2016 | 2015 | 2014 | 2013 | 2012 |
| Selected Per–Share Data | | | | | |
| Net asset value, beginning of period | $16.88 | $15.22 | $13.32 | $10.26 | $10.86 |
| Income from Investment Operations | | | | | |
| Net investment income (loss)A | .19 | .35B | .18 | .18 | .18 |
| Net realized and unrealized gain (loss) | (.59) | 1.54 | 1.81 | 3.17 | (.62) |
| Total from investment operations | (.40) | 1.89 | 1.99 | 3.35 | (.44) |
| Distributions from net investment income | (.28) | (.23) | (.09) | (.29) | (.16) |
| Distributions from net realized gain | (.01) | – | – | – | – |
| Total distributions | (.29) | (.23) | (.09) | (.29) | (.16) |
| Net asset value, end of period | $16.19 | $16.88 | $15.22 | $13.32 | $10.26 |
| Total ReturnC | (2.31)% | 12.52% | 14.99% | 33.33% | (3.95)% |
| Ratios to Average Net AssetsD,E | | | | | |
| Expenses before reductions | .88% | .82% | .66% | .64% | .77% |
| Expenses net of fee waivers, if any | .88% | .82% | .66% | .64% | .77% |
| Expenses net of all reductions | .88% | .82% | .66% | .62% | .76% |
| Net investment income (loss) | 1.23% | 2.15%B | 1.28% | 1.58% | 1.76% |
| Supplemental Data | | | | | |
| Net assets, end of period (000 omitted) | $457,177 | $410,968 | $329,826 | $281,860 | $238,132 |
| Portfolio turnover rateF | 54% | 138% | 102%G | 88% | 102% |
A Calculated based on average shares outstanding during the period.
B Net Investment income per share reflects a large, non-recurring dividend which amounted to $.13 per share. Excluding this non-recurring dividend, the ratio of net investment income (loss) to average net assets would have been 1.35%.
C Total returns would have been lower if certain expenses had not been reduced during the applicable periods shown.
D Fees and expenses of any underlying Fidelity Central Funds are not included in the Fund's expense ratio. The Fund indirectly bears its proportionate share of the expenses of any underlying Fidelity Central Funds.
E Expense ratios reflect operating expenses of the Fund. Expenses before reductions do not reflect amounts reimbursed by the investment adviser or reductions from brokerage service arrangements or reductions from other expense offset arrangements and do not represent the amount paid by the Fund during periods when reimbursements or reductions occur. Expenses net of fee waivers reflect expenses after reimbursement by the investment adviser but prior to reductions from brokerage service arrangements or other expense offset arrangements. Expenses net of all reductions represent the net expenses paid by the Fund.
F Amount does not include the portfolio activity of any underlying Fidelity Central Funds.
G Portfolio turnover rate excludes securities received or delivered in-kind.
See accompanying notes which are an integral part of the financial statements.
Notes to Financial Statements
For the period ended July 31, 2016
1. Organization.
Fidelity Blue Chip Value Fund (the Fund) is a fund of Fidelity Securities Fund (the Trust) and is authorized to issue an unlimited number of shares. Share transactions on the Statement of Changes in Net Assets may contain exchanges between affiliated funds. The Trust is registered under the Investment Company Act of 1940, as amended (the 1940 Act), as an open-end management investment company organized as a Massachusetts business trust.
2. Investments in Fidelity Central Funds.
The Fund invests in Fidelity Central Funds, which are open-end investment companies generally available only to other investment companies and accounts managed by the investment adviser and its affiliates. The Fund's Schedule of Investments lists each of the Fidelity Central Funds held as of period end, if any, as an investment of the Fund, but does not include the underlying holdings of each Fidelity Central Fund. As an Investing Fund, the Fund indirectly bears its proportionate share of the expenses of the underlying Fidelity Central Funds.
The Money Market Central Funds seek preservation of capital and current income and are managed by Fidelity Investments Money Management, Inc. (FIMM), an affiliate of the investment adviser. Annualized expenses of the Money Market Central Funds as of their most recent shareholder report date are less than .005%.
A complete unaudited list of holdings for each Fidelity Central Fund is available upon request or at the Securities and Exchange Commission (the SEC) website at www.sec.gov. In addition, the financial statements of the Fidelity Central Funds, which are not covered by the Fund's Report of Independent Registered Public Accounting Firm, are available on the SEC website or upon request.
3. Significant Accounting Policies.
The financial statements have been prepared in conformity with accounting principles generally accepted in the United States of America (GAAP), which require management to make certain estimates and assumptions at the date of the financial statements. Actual results could differ from those estimates. Subsequent events, if any, through the date that the financial statements were issued have been evaluated in the preparation of the financial statements. The following summarizes the significant accounting policies of the Fund:
Investment Valuation. Investments are valued as of 4:00 p.m. Eastern time on the last calendar day of the period. The Board of Trustees (the Board) has delegated the day to day responsibility for the valuation of the Fund's investments to the Fidelity Management & Research Company (FMR) Fair Value Committee (the Committee). In accordance with valuation policies and procedures approved by the Board, the Fund attempts to obtain prices from one or more third party pricing vendors or brokers to value its investments. When current market prices, quotations or currency exchange rates are not readily available or reliable, investments will be fair valued in good faith by the Committee, in accordance with procedures adopted by the Board. Factors used in determining fair value vary by investment type and may include market or investment specific events. The frequency with which these procedures are used cannot be predicted and they may be utilized to a significant extent. The Committee oversees the Fund's valuation policies and procedures and reports to the Board on the Committee's activities and fair value determinations. The Board monitors the appropriateness of the procedures used in valuing the Fund's investments and ratifies the fair value determinations of the Committee.
The Fund categorizes the inputs to valuation techniques used to value its investments into a disclosure hierarchy consisting of three levels as shown below:
- Level 1 – quoted prices in active markets for identical investments
- Level 2 – other significant observable inputs (including quoted prices for similar investments, interest rates, prepayment speeds, etc.)
- Level 3 – unobservable inputs (including the Fund's own assumptions based on the best information available)
Valuation techniques used to value the Fund's investments by major category are as follows:
Equity securities, including restricted securities, for which market quotations are readily available, are valued at the last reported sale price or official closing price as reported by a third party pricing vendor on the primary market or exchange on which they are traded and are categorized as Level 1 in the hierarchy. In the event there were no sales during the day or closing prices are not available, securities are valued at the last quoted bid price or may be valued using the last available price and are generally categorized as Level 2 in the hierarchy. For foreign equity securities, when market or security specific events arise, comparisons to the valuation of American Depositary Receipts (ADRs), futures contracts, Exchange-Traded Funds (ETFs) and certain indexes as well as quoted prices for similar securities may be used and would be categorized as Level 2 in the hierarchy. Utilizing these techniques may result in transfers between Level 1 and Level 2. For equity securities, including restricted securities, where observable inputs are limited, assumptions about market activity and risk are used and these securities may be categorized as Level 3 in the hierarchy.
Investments in open-end mutual funds, including the Fidelity Central Funds, are valued at their closing net asset value (NAV) each business day and are categorized as Level 1 in the hierarchy.
Changes in valuation techniques may result in transfers in or out of an assigned level within the disclosure hierarchy. The aggregate value of investments by input level as of July 31, 2016 is included at the end of the Fund's Schedule of Investments.
Foreign Currency. The Fund may use foreign currency contracts to facilitate transactions in foreign-denominated securities. Gains and losses from these transactions may arise from changes in the value of the foreign currency or if the counterparties do not perform under the contracts' terms.
Foreign-denominated assets, including investment securities, and liabilities are translated into U.S. dollars at the exchange rates at period end. Purchases and sales of investment securities, income and dividends received and expenses denominated in foreign currencies are translated into U.S. dollars at the exchange rate in effect on the transaction date.
The effects of exchange rate fluctuations on investments are included with the net realized and unrealized gain (loss) on investment securities. Other foreign currency transactions resulting in realized and unrealized gain (loss) are disclosed separately.
Investment Transactions and Income. For financial reporting purposes, the Fund's investment holdings and NAV include trades executed through the end of the last business day of the period. The NAV per share for processing shareholder transactions is calculated as of the close of business of the New York Stock Exchange (NYSE), normally 4:00 p.m. Eastern time and includes trades executed through the end of the prior business day. Gains and losses on securities sold are determined on the basis of identified cost and may include proceeds received from litigation. Dividend income is recorded on the ex-dividend date, except for certain dividends from foreign securities where the ex-dividend date may have passed, which are recorded as soon as the Fund is informed of the ex-dividend date. Non-cash dividends included in dividend income, if any, are recorded at the fair market value of the securities received. Income and capital gain distributions from Fidelity Central Funds, if any, are recorded on the ex-dividend date. Distributions received on securities that represent a return of capital or capital gain are recorded as a reduction of cost of investments and/or as a realized gain. Subsequent to ex-dividend date the Fund determines the components of these distributions, based upon receipt of tax filings or other correspondence relating to the underlying investment. Interest income is accrued as earned and includes coupon interest and amortization of premium and accretion of discount on debt securities as applicable. Investment income is recorded net of foreign taxes withheld where recovery of such taxes is uncertain.
Expenses. Expenses directly attributable to a fund are charged to that fund. Expenses attributable to more than one fund are allocated among the respective funds on the basis of relative net assets or other appropriate methods. Expense estimates are accrued in the period to which they relate and adjustments are made when actual amounts are known.
Income Tax Information and Distributions to Shareholders. Each year, the Fund intends to qualify as a regulated investment company under Subchapter M of the Internal Revenue Code, including distributing substantially all of its taxable income and realized gains. As a result, no provision for U.S. Federal income taxes is required. As of July 31, 2016, the Fund did not have any unrecognized tax benefits in the financial statements; nor is the Fund aware of any tax positions for which it is reasonably possible that the total amounts of unrecognized tax benefits will significantly change in the next twelve months. The Fund files a U.S. federal tax return, in addition to state and local tax returns as required. The Fund's federal income tax returns are subject to examination by the Internal Revenue Service (IRS) for a period of three fiscal years after they are filed. State and local tax returns may be subject to examination for an additional fiscal year depending on the jurisdiction. Foreign taxes are provided for based on the Fund's understanding of the tax rules and rates that exist in the foreign markets in which it invests.
Distributions are declared and recorded on the ex-dividend date. Income and capital gain distributions are determined in accordance with income tax regulations, which may differ from GAAP.
Capital accounts within the financial statements are adjusted for permanent book-tax differences. These adjustments have no impact on net assets or the results of operations. Capital accounts are not adjusted for temporary book-tax differences which will reverse in a subsequent period.
Book-tax differences are primarily due to futures contracts, foreign currency transactions, partnerships, capital loss carryforwards and losses deferred due to wash sales.
The federal tax cost of investment securities and unrealized appreciation (depreciation) as of period end were as follows:
| Gross unrealized appreciation | $42,225,321 |
| Gross unrealized depreciation | (33,303,486) |
| Net unrealized appreciation (depreciation) on securities | $8,921,835 |
| Tax Cost | $455,110,882 |
The tax-based components of distributable earnings as of period end were as follows:
| Undistributed ordinary income | $2,279,667 |
| Capital loss carryforward | $(73,316,907) |
| Net unrealized appreciation (depreciation) on securities and other investments | $8,922,124 |
Capital loss carryforwards are only available to offset future capital gains of the Fund to the extent provided by regulations and may be limited. Under the Regulated Investment Company Modernization Act of 2010 (the Act), the Fund is permitted to carryforward capital losses incurred in taxable years beginning after December 22, 2010 for an unlimited period and such capital losses are required to be used prior to any losses that expire. The capital loss carryforward information presented below, including any applicable limitation, is estimated as of fiscal period end and is subject to adjustment.
| Fiscal year of expiration | |
| 2017 | $(12,454,068) |
| 2018 | (55,500,128) |
| Total with expiration | $(67,954,196) |
| No expiration | |
| Long-term | $(5,362,711) |
| Total no expiration | $(5,362,711) |
| Total capital loss carryforward | $(73,316,907) |
The tax character of distributions paid was as follows:
| | July 31, 2016 | July 31, 2015 |
| Ordinary Income | $8,365,261 | $ 4,830,518 |
4. Derivative Instruments.
Risk Exposures and the Use of Derivative Instruments. The Fund's investment objective allows the Fund to enter into various types of derivative contracts, including futures contracts. Derivatives are investments whose value is primarily derived from underlying assets, indices or reference rates and may be transacted on an exchange or over-the-counter (OTC). Derivatives may involve a future commitment to buy or sell a specified asset based on specified terms, to exchange future cash flows at periodic intervals based on a notional principal amount, or for one party to make one or more payments upon the occurrence of specified events in exchange for periodic payments from the other party.
The Fund used derivatives to increase returns and to manage exposure to certain risks as defined below. The success of any strategy involving derivatives depends on analysis of numerous economic factors, and if the strategies for investment do not work as intended, the Fund may not achieve its objectives.
The Fund's use of derivatives increased or decreased its exposure to the following risk:
| Equity Risk | Equity risk relates to the fluctuations in the value of financial instruments as a result of changes in market prices (other than those arising from interest rate risk or foreign exchange risk), whether caused by factors specific to an individual investment, its issuer, or all factors affecting all instruments traded in a market or market segment.
|
The Fund is also exposed to additional risks from investing in derivatives, such as liquidity risk and counterparty credit risk. Liquidity risk is the risk that the Fund will be unable to close out the derivative in the open market in a timely manner. Counterparty credit risk is the risk that the counterparty will not be able to fulfill its obligation to the Fund. Counterparty credit risk related to exchange-traded futures contracts may be mitigated by the protection provided by the exchange on which they trade.
Investing in derivatives may involve greater risks than investing in the underlying assets directly and, to varying degrees, may involve risk of loss in excess of any initial investment and collateral received and amounts recognized in the Statement of Assets and Liabilities. In addition, there may be the risk that the change in value of the derivative contract does not correspond to the change in value of the underlying instrument.
Futures Contracts. A futures contract is an agreement between two parties to buy or sell a specified underlying instrument for a fixed price at a specified future date. The Fund used futures contracts to manage its exposure to the stock market.
Upon entering into a futures contract, a fund is required to deposit either cash or securities (initial margin) with a clearing broker in an amount equal to a certain percentage of the face value of the contract. Futures contracts are marked-to-market daily and subsequent daily payments (variation margin) are made or received by a fund depending on the daily fluctuations in the value of the futures contracts and are recorded as unrealized appreciation or (depreciation). This receivable and/or payable, if any, is included in daily variation margin for derivative instruments in the Statement of Assets and Liabilities. Realized gain or (loss) is recorded upon the expiration or closing of a futures contract.
Any open futures contracts at period end are presented in the Schedule of Investments under the caption "Futures Contracts". The underlying face amount at value reflects each contract's exposure to the underlying instrument or index at period end.
During the period the Fund recognized net realized gain (loss) of $(814,285) related to its investment in futures contracts. This amount is included in the Statement of Operations.
5. Purchases and Sales of Investments.
Purchases and sales of securities, other than short-term securities, aggregated $341,749,554 and $244,995,932, respectively.
6. Fees and Other Transactions with Affiliates.
Management Fee. Fidelity Management & Research Company (the investment adviser) and its affiliates provide the Fund with investment management related services for which the Fund pays a monthly management fee. The management fee is the sum of an individual fund fee rate that is based on an annual rate of .30% of the Fund's average net assets and an annualized group fee rate that averaged .25% during the period. The group fee rate is based upon the average net assets of all the mutual funds advised by the investment adviser, including any mutual funds previously advised by the investment adviser that are currently advised by Fidelity SelectCo, LLC, an affiliate of the investment adviser. The group fee rate decreases as assets under management increase and increases as assets under management decrease. In addition, the management fee is subject to a performance adjustment (up to a maximum of +/- .20% of the Fund's average net assets over a 36 month performance period). The upward or downward adjustment to the management fee is based on the Fund's relative investment performance as compared to its benchmark index, the Russell 1000 Value Index, over the same 36 month performance period. For the reporting period, the total annual management fee rate, including the performance adjustment, was .61% of the Fund's average net assets. The performance adjustment included in the management fee rate may be higher or lower than the maximum performance adjustment rate due to the difference between the average net assets for the reporting and performance periods.
Transfer Agent Fees. Fidelity Investments Institutional Operations Company, Inc. (FIIOC), an affiliate of the investment adviser, is the Fund's transfer, dividend disbursing and shareholder servicing agent. FIIOC receives account fees and asset-based fees that vary according to account size and type of account. FIIOC pays for typesetting, printing and mailing of shareholder reports, except proxy statements. For the period, the transfer agent fees were equivalent to an annual rate of .21% of average net assets.
Accounting and Security Lending Fees. Fidelity Service Company, Inc. (FSC), an affiliate of the investment adviser, maintains the Fund's accounting records. The accounting fee is based on the level of average net assets for each month. Under a separate contract, FSC administers the security lending program. The security lending fee is based on the number and duration of lending transactions.
Brokerage Commissions. The Fund placed a portion of its portfolio transactions with brokerage firms which are affiliates of the investment adviser. Brokerage commissions are included in net realized gain (loss) and change in net unrealized appreciation (depreciation) in the Statement of Operations. The commissions paid to these affiliated firms were $6,827 for the period.
Interfund Trades. The Fund may purchase from or sell securities to other Fidelity Funds under procedures adopted by the Board. The procedures have been designed to ensure these interfund trades are executed in accordance with Rule 17a-7 of the 1940 Act. Interfund trades are included within the respective purchases and sales amounts shown in the Purchases and Sales of Investments note.
7. Committed Line of Credit.
The Fund participates with other funds managed by the investment adviser or an affiliate in a $4.25 billion credit facility (the "line of credit") to be utilized for temporary or emergency purposes to fund shareholder redemptions or for other short-term liquidity purposes. The Fund has agreed to pay commitment fees on its pro-rata portion of the line of credit, which amounted to $986 and is reflected in Miscellaneous expenses on the Statement of Operations. During the period, the Fund did not borrow on this line of credit.
8. Security Lending.
The Fund lends portfolio securities through a lending agent from time to time in order to earn additional income. For equity securities, a lending agent is used and may loan securities to certain qualified borrowers, including Fidelity Capital Markets (FCM), a broker-dealer affiliated with the Fund. On the settlement date of the loan, the Fund receives collateral (in the form of U.S. Treasury obligations, letters of credit and/or cash) against the loaned securities and maintains collateral in an amount not less than 100% of the market value of the loaned securities during the period of the loan. The market value of the loaned securities is determined at the close of business of the Fund and any additional required collateral is delivered to the Fund on the next business day. The Fund or borrower may terminate the loan at any time, and if the borrower defaults on its obligation to return the securities loaned because of insolvency or other reasons, the Fund may apply collateral received from the borrower against the obligation. The Fund may experience delays and costs in recovering the securities loaned. Any cash collateral received is invested in the Fidelity Securities Lending Cash Central Fund. The value of loaned securities and cash collateral at period end are disclosed on the Fund's Statement of Assets and Liabilities. Security lending income represents the income earned on investing cash collateral, less rebates paid to borrowers and any lending agent fees associated with the loan, plus any premium payments received for lending certain types of securities. Security lending income is presented in the Statement of Operations as a component of income from Fidelity Central Funds. Total security lending income during the period amounted to $62,337. During the period, there were no securities loaned to FCM.
9. Expense Reductions.
Commissions paid to certain brokers with whom the investment adviser, or its affiliates, places trades on behalf of the Fund include an amount in addition to trade execution, which may be rebated back to the Fund to offset certain expenses. This amount totaled $16,280 for the period. In addition, through arrangements with the Fund's custodian, credits realized as a result of certain uninvested cash balances were used to reduce the Fund's expenses. During the period, these credits reduced the Fund's custody expenses by $117.
In addition, during the period the investment adviser reimbursed and/or waived a portion of operating expenses in the amount of $3,550.
10. Other.
The Fund's organizational documents provide former and current trustees and officers with a limited indemnification against liabilities arising in connection with the performance of their duties to the Fund. In the normal course of business, the Fund may also enter into contracts that provide general indemnifications. The Fund's maximum exposure under these arrangements is unknown as this would be dependent on future claims that may be made against the Fund. The risk of material loss from such claims is considered remote.
Report of Independent Registered Public Accounting Firm
To the Trustees of Fidelity Securities Fund and Shareholders of Fidelity Blue Chip Value Fund:
In our opinion, the accompanying statement of assets and liabilities, including the schedule of investments, and the related statements of operations and of changes in net assets and the financial highlights present fairly, in all material respects, the financial position of Fidelity Blue Chip Value Fund (a fund of Fidelity Securities Fund) at July 31, 2016, the results of its operations for the year then ended, the changes in its net assets for each of the two years in the period then ended and the financial highlights for each of the five years in the period then ended, in conformity with accounting principles generally accepted in the United States of America. These financial statements and financial highlights (hereafter referred to as “financial statements”) are the responsibility of the Fidelity Blue Chip Value Fund’s management. Our responsibility is to express an opinion on these financial statements based on our audits. We conducted our audits of these financial statements in accordance with the standards of the Public Company Accounting Oversight Board (United States). Those standards require that we plan and perform the audit to obtain reasonable assurance about whether the financial statements are free of material misstatement. An audit includes examining, on a test basis, evidence supporting the amounts and disclosures in the financial statements, assessing the accounting principles used and significant estimates made by management, and evaluating the overall financial statement presentation. We believe that our audits, which included confirmation of securities at July 31, 2016 by correspondence with the custodian and brokers, provide a reasonable basis for our opinion.
PricewaterhouseCoopers LLP
Boston, Massachusetts
September 14, 2016
Trustees and Officers
The Trustees, Members of the Advisory Board (if any), and officers of the trust and fund, as applicable, are listed below. The Board of Trustees governs the fund and is responsible for protecting the interests of shareholders. The Trustees are experienced executives who meet periodically throughout the year to oversee the fund's activities, review contractual arrangements with companies that provide services to the fund, oversee management of the risks associated with such activities and contractual arrangements, and review the fund's performance. Each of the Trustees oversees 170 funds.
The Trustees hold office without limit in time except that (a) any Trustee may resign; (b) any Trustee may be removed by written instrument, signed by at least two-thirds of the number of Trustees prior to such removal; (c) any Trustee who requests to be retired or who has become incapacitated by illness or injury may be retired by written instrument signed by a majority of the other Trustees; and (d) any Trustee may be removed at any special meeting of shareholders by a two-thirds vote of the outstanding voting securities of the trust. Each Trustee who is not an interested person (as defined in the 1940 Act) of the trust and the fund is referred to herein as an Independent Trustee. Each Independent Trustee shall retire not later than the last day of the calendar year in which his or her 75th birthday occurs. The Independent Trustees may waive this mandatory retirement age policy with respect to individual Trustees. Officers and Advisory Board Members hold office without limit in time, except that any officer or Advisory Board Member may resign or may be removed by a vote of a majority of the Trustees at any regular meeting or any special meeting of the Trustees. Except as indicated, each individual has held the office shown or other offices in the same company for the past five years.
The fund’s Statement of Additional Information (SAI) includes more information about the Trustees. To request a free copy, call Fidelity at 1-800-544-8544.
Experience, Skills, Attributes, and Qualifications of the Trustees. The Governance and Nominating Committee has adopted a statement of policy that describes the experience, qualifications, attributes, and skills that are necessary and desirable for potential Independent Trustee candidates (Statement of Policy). The Board believes that each Trustee satisfied at the time he or she was initially elected or appointed a Trustee, and continues to satisfy, the standards contemplated by the Statement of Policy. The Governance and Nominating Committee also engages professional search firms to help identify potential Independent Trustee candidates who have the experience, qualifications, attributes, and skills consistent with the Statement of Policy. From time to time, additional criteria based on the composition and skills of the current Independent Trustees, as well as experience or skills that may be appropriate in light of future changes to board composition, business conditions, and regulatory or other developments, have also been considered by the professional search firms and the Governance and Nominating Committee. In addition, the Board takes into account the Trustees' commitment and participation in Board and committee meetings, as well as their leadership of standing and ad hoc committees throughout their tenure.
In determining that a particular Trustee was and continues to be qualified to serve as a Trustee, the Board has considered a variety of criteria, none of which, in isolation, was controlling. The Board believes that, collectively, the Trustees have balanced and diverse experience, qualifications, attributes, and skills, which allow the Board to operate effectively in governing the fund and protecting the interests of shareholders. Information about the specific experience, skills, attributes, and qualifications of each Trustee, which in each case led to the Board's conclusion that the Trustee should serve (or continue to serve) as a trustee of the fund, is provided below.
Board Structure and Oversight Function. James C. Curvey is an interested person and currently serves as Chairman. The Trustees have determined that an interested Chairman is appropriate and benefits shareholders because an interested Chairman has a personal and professional stake in the quality and continuity of services provided to the fund. Independent Trustees exercise their informed business judgment to appoint an individual of their choosing to serve as Chairman, regardless of whether the Trustee happens to be independent or a member of management. The Independent Trustees have determined that they can act independently and effectively without having an Independent Trustee serve as Chairman and that a key structural component for assuring that they are in a position to do so is for the Independent Trustees to constitute a substantial majority for the Board. The Independent Trustees also regularly meet in executive session. Ned C. Lautenbach serves as Chairman of the Independent Trustees and as such (i) acts as a liaison between the Independent Trustees and management with respect to matters important to the Independent Trustees and (ii) with management prepares agendas for Board meetings.
Fidelity® funds are overseen by different Boards of Trustees. The fund's Board oversees Fidelity's high income and certain equity funds, and other Boards oversee Fidelity's investment-grade bond, money market, asset allocation, and sector funds. The asset allocation funds may invest in Fidelity® funds overseen by the fund's Board. The use of separate Boards, each with its own committee structure, allows the Trustees of each group of Fidelity® funds to focus on the unique issues of the funds they oversee, including common research, investment, and operational issues. On occasion, the separate Boards establish joint committees to address issues of overlapping consequences for the Fidelity® funds overseen by each Board.
The Trustees operate using a system of committees to facilitate the timely and efficient consideration of all matters of importance to the Trustees, the fund, and fund shareholders and to facilitate compliance with legal and regulatory requirements and oversight of the fund's activities and associated risks. The Board, acting through its committees, has charged FMR and its affiliates with (i) identifying events or circumstances the occurrence of which could have demonstrably adverse effects on the fund's business and/or reputation; (ii) implementing processes and controls to lessen the possibility that such events or circumstances occur or to mitigate the effects of such events or circumstances if they do occur; and (iii) creating and maintaining a system designed to evaluate continuously business and market conditions in order to facilitate the identification and implementation processes described in (i) and (ii) above. Because the day-to-day operations and activities of the fund are carried out by or through FMR, its affiliates, and other service providers, the fund's exposure to risks is mitigated but not eliminated by the processes overseen by the Trustees. While each of the Board's committees has responsibility for overseeing different aspects of the fund's activities, oversight is exercised primarily through the Operations, Audit, and Compliance Committees. In addition, the Independent Trustees have worked with FMR to enhance the Board's oversight of investment and financial risks, legal and regulatory risks, technology risks, and operational risks, including the development of additional risk reporting to the Board. For example, a working group comprised of Independent Trustees and FMR has worked and continues to work to review the Fidelity® funds' valuation-related activities, reporting and risk management. Appropriate personnel, including but not limited to the fund's Chief Compliance Officer (CCO), FMR's internal auditor, the independent accountants, the fund's Treasurer and portfolio management personnel, make periodic reports to the Board's committees, as appropriate, including an annual review of Fidelity's risk management program for the Fidelity® funds. The responsibilities of each standing committee, including their oversight responsibilities, are described further under "Standing Committees of the Trustees."
Interested Trustees*:
Correspondence intended for a Trustee who is an interested person may be sent to Fidelity Investments, 245 Summer Street, Boston, Massachusetts 02210.
Name, Year of Birth; Principal Occupations and Other Relevant Experience+
James C. Curvey (1935)
Year of Election or Appointment: 2007
Trustee
Chairman of the Board of Trustees
Mr. Curvey also serves as Trustee of other Fidelity® funds. Mr. Curvey is a Director of Fidelity Research & Analysis Co. (investment adviser firm, 2009-present), and Vice Chairman (2007-present) and Director of FMR LLC (diversified financial services company). In addition, Mr. Curvey serves as an Overseer for the Boston Symphony Orchestra and a member of the board of Artis-Naples, Naples, Florida, and as a Trustee for Brewster Academy, Wolfeboro, New Hampshire. Previously, Mr. Curvey served as a Director of Fidelity Investments Money Management, Inc. (investment adviser firm, 2009-2014) and a Director of FMR and FMR Co., Inc. (investment adviser firms, 2007-2014).
Charles S. Morrison (1960)
Year of Election or Appointment: 2014
Trustee
Mr. Morrison also serves as Trustee of other funds. He serves as a Director of Fidelity Investments Money Management, Inc. (FIMM) (investment adviser firm, 2014-present), Director of Fidelity SelectCo, LLC (investment adviser firm, 2014-present), President, Asset Management (2014-present), and is an employee of Fidelity Investments. Previously, Mr. Morrison served as Vice President of Fidelity's Fixed Income and Asset Allocation Funds (2012-2014), President, Fixed Income (2011-2014), Vice President of Fidelity's Money Market Funds (2005-2009), President, Money Market Group Leader of FMR (investment adviser firm, 2009), and Senior Vice President, Money Market Group of FMR (2004-2009). Mr. Morrison also served as Vice President of Fidelity's Bond Funds (2002-2005), certain Balanced Funds (2002-2005), and certain Asset Allocation Funds (2002-2007), and as Senior Vice President (2002-2005) of Fidelity's Bond Division.
* Determined to be an “Interested Trustee” by virtue of, among other things, his or her affiliation with the trust or various entities under common control with FMR.
+ The information includes the Trustee's principal occupation during the last five years and other information relating to the experience, attributes, and skills relevant to the Trustee's qualifications to serve as a Trustee, which led to the conclusion that the Trustee should serve as a Trustee for the fund.
Independent Trustees:
Correspondence intended for an Independent Trustee may be sent to Fidelity Investments, P.O. Box 55235, Boston, Massachusetts 02205-5235.
Name, Year of Birth; Principal Occupations and Other Relevant Experience+
Dennis J. Dirks (1948)
Year of Election or Appointment: 2005
Trustee
Mr. Dirks also serves as Trustee of other Fidelity® funds. Prior to his retirement in May 2003, Mr. Dirks was Chief Operating Officer and a member of the Board of The Depository Trust & Clearing Corporation (DTCC). He also served as President, Chief Operating Officer, and Board member of The Depository Trust Company (DTC) and President and Board member of the National Securities Clearing Corporation (NSCC). In addition, Mr. Dirks served as Chief Executive Officer and Board member of the Government Securities Clearing Corporation, Chief Executive Officer and Board member of the Mortgage-Backed Securities Clearing Corporation, as a Trustee and a member of the Finance Committee of Manhattan College (2005-2008), as a Trustee and a member of the Finance Committee of AHRC of Nassau County (2006-2008), and as a member of the Independent Directors Council (IDC) Governing Council (2010-2015). Mr. Dirks is a member of the Board of Directors for The Brookville Center for Children's Services, Inc. (2009-present).
Alan J. Lacy (1953)
Year of Election or Appointment: 2008
Trustee
Mr. Lacy also serves as Trustee of other Fidelity® funds. Mr. Lacy serves as Chairman (2014-present) and a member (2010-present) of the Board of Directors of Dave & Buster's Entertainment, Inc. (restaurant and entertainment complexes) and a Director of Bristol-Myers Squibb Company (global pharmaceuticals, 2008-present). He is a Trustee of the California Chapter of The Nature Conservancy (2015-present) and a Director of the Center for Advanced Study in the Behavioral Sciences at Stanford University (2015-present). In addition, Mr. Lacy served as Senior Adviser (2007-2014) of Oak Hill Capital Partners, L.P. (private equity) and also served as Chief Executive Officer (2005) and Vice Chairman (2005-2006) of Sears Holdings Corporation (retail) and Chief Executive Officer and Chairman of the Board of Sears, Roebuck and Co. (retail, 2000-2005). Previously, Mr. Lacy served as Chairman (2008-2011) and a member (2006-2015) of the Board of Trustees of the National Parks Conservation Association and as a member of the Board of Directors for The Western Union Company (global money transfer, 2006-2011), The Hillman Companies, Inc. (hardware wholesalers, 2010-2014), and Earth Fare, Inc. (retail grocery, 2010-2014).
Ned C. Lautenbach (1944)
Year of Election or Appointment: 2000
Trustee
Chairman of the Independent Trustees
Mr. Lautenbach also serves as Trustee of other Fidelity® funds. Mr. Lautenbach currently serves as the Lead Director of the Eaton Corporation Board of Directors (diversified industrial, 1997-present). Mr. Lautenbach is Chairman of the Board of Directors of Artis-Naples in Naples, Florida (2012-present), a member of the Council on Foreign Relations (1994-present), and a member of the Board of Governors, State University System of Florida (2013-present). Previously, Mr. Lautenbach was a Partner/Advisory Partner at Clayton, Dubilier & Rice, LLC (private equity investment, 1998-2010), as well as a Director of Sony Corporation (2006-2007).
Joseph Mauriello (1944)
Year of Election or Appointment: 2008
Trustee
Mr. Mauriello also serves as Trustee of other Fidelity® funds. Prior to his retirement in January 2006, Mr. Mauriello served in numerous senior management positions including Deputy Chairman and Chief Operating Officer (2004-2005), and Vice Chairman of Financial Services (2002-2004) of KPMG LLP US (professional services, 1965-2005). Mr. Mauriello currently serves as a member of the Board of Directors of XL Group plc. (global insurance and re-insurance, 2006-present) and the Independent Directors Council (IDC) Governing Council (2015-present). Previously, Mr. Mauriello served as a Director of the Hamilton Funds of the Bank of New York (2006-2007) and of Arcadia Resources Inc. (health care services and products, 2007-2012).
Robert W. Selander (1950)
Year of Election or Appointment: 2011
Trustee
Mr. Selander also serves as Trustee of other Fidelity® funds. Mr. Selander serves as a Director of The Western Union Company (global money transfer, 2014-present) and a non-executive Chairman of Health Equity, Inc. (health savings custodian, 2015-present). Previously, Mr. Selander served as a Member of the Advisory Board of certain Fidelity® funds (2011), and Executive Vice Chairman (2010), Chief Executive Officer (2009-2010), and President and Chief Executive Officer (1997-2009) of Mastercard, Inc.
Cornelia M. Small (1944)
Year of Election or Appointment: 2005
Trustee
Ms. Small also serves as Trustee of other Fidelity® funds. Ms. Small is a member of the Board of Directors (2009-present) and Chair of the Investment Committee (2010-present) of the Teagle Foundation. Ms. Small also serves on the Investment Committee of the Berkshire Taconic Community Foundation (2008-present). Previously, Ms. Small served as Chairperson (2002-2008) and a member of the Investment Committee and Chairperson (2008-2012) and a member of the Board of Trustees of Smith College. In addition, Ms. Small served as Chief Investment Officer, Director of Global Equity Investments, and a member of the Board of Directors of Scudder, Stevens & Clark and Scudder Kemper Investments.
William S. Stavropoulos (1939)
Year of Election or Appointment: 2002
Trustee
Vice Chairman of the Independent Trustees
Mr. Stavropoulos also serves as Trustee of other Fidelity® funds. Mr. Stavropoulos serves as President and Founder of the Michigan Baseball Foundation, the Great Lakes Loons (2007-present). Mr. Stavropoulos is Chairman Emeritus of the Board of Directors of The Dow Chemical Company, where he previously served in numerous senior management positions, including President, CEO (1995-2000; 2002-2004), Chairman of the Executive Committee (2000-2006), and as a member of the Board of Directors (1990-2006). Currently, Mr. Stavropoulos is Chairman of the Board of Directors of Univar Inc. (global distributor of commodity and specialty chemicals), a Director of Teradata Corporation (data warehousing and technology solutions), and Maersk Inc. (industrial conglomerate), and a member of the Advisory Board for Metalmark Capital LLC (private equity investment, 2005-present). Mr. Stavropoulos is an operating advisor to Clayton, Dubilier & Rice, LLC (private equity investment). In addition, Mr. Stavropoulos is a member of the University of Notre Dame Advisory Council for the College of Science, a Trustee of the Rollin L. Gerstacker Foundation, and a Director of the Naples Philharmonic Center for the Arts. Previously, Mr. Stavropoulos served as a Director of Chemical Financial Corporation (bank holding company, 1993-2012) and Tyco International, Ltd. (multinational manufacturing and services, 2007-2012).
David M. Thomas (1949)
Year of Election or Appointment: 2008
Trustee
Mr. Thomas also serves as Trustee of other Fidelity® funds. Mr. Thomas serves as Non-Executive Chairman of the Board of Directors of Fortune Brands Home and Security (home and security products, 2011-present), as a member of the Board of Directors (2004-present) and Presiding Director (2013-present) of Interpublic Group of Companies, Inc. (marketing communication), and as a member of the Board of Trustees of the University of Florida (2013-present). Previously, Mr. Thomas served as Executive Chairman (2005-2006) and Chairman and Chief Executive Officer (2000-2005) of IMS Health, Inc. (pharmaceutical and healthcare information solutions), and a Director of Fortune Brands, Inc. (consumer products, 2000-2011).
+ The information includes the Trustee's principal occupation during the last five years and other information relating to the experience, attributes, and skills relevant to the Trustee's qualifications to serve as a Trustee, which led to the conclusion that the Trustee should serve as a Trustee for the fund.
Advisory Board Members and Officers:
Correspondence intended for an officer or Peter S. Lynch may be sent to Fidelity Investments, 245 Summer Street, Boston, Massachusetts 02210. Officers appear below in alphabetical order.
Name, Year of Birth; Principal Occupation
Peter S. Lynch (1944)
Year of Election or Appointment: 2003
Member of the Advisory Board
Mr. Lynch also serves as Member of the Advisory Board of other Fidelity® funds. Mr. Lynch is Vice Chairman and a Director of FMR (investment adviser firm) and FMR Co., Inc. (investment adviser firm). In addition, Mr. Lynch serves as a Trustee of Boston College and as the Chairman of the Inner-City Scholarship Fund. Previously, Mr. Lynch served on the Special Olympics International Board of Directors (1997-2006).
Marc R. Bryant (1966)
Year of Election or Appointment: 2015
Secretary and Chief Legal Officer (CLO)
Mr. Bryant also serves as Secretary and CLO of other funds. Mr. Bryant serves as CLO, Secretary, and Senior Vice President of Fidelity Management & Research Company (investment adviser firm, 2015-present) and FMR Co., Inc. (investment adviser firm, 2015-present); Secretary of Fidelity SelectCo, LLC (investment adviser firm, 2015-present) and Fidelity Investments Money Management, Inc. (investment adviser firm, 2015-present); and CLO of Fidelity Management & Research (Hong Kong) Limited and FMR Investment Management (U.K.) Limited (investment adviser firms, 2015-present) and Fidelity Management & Research (Japan) Limited (investment adviser firm, 2016-present). He is Senior Vice President and Deputy General Counsel of FMR LLC (diversified financial services company). Previously, Mr. Bryant served as Secretary and CLO of Fidelity Rutland Square Trust II (2010-2014) and Assistant Secretary of Fidelity's Fixed Income and Asset Allocation Funds (2013-2015). Prior to joining Fidelity Investments, Mr. Bryant served as a Senior Vice President and the Head of Global Retail Legal for AllianceBernstein L.P. (2006-2010), and as the General Counsel for ProFund Advisors LLC (2001-2006).
Jeffrey S. Christian (1961)
Year of Election or Appointment: 2016
Assistant Treasurer
Mr. Christian also serves as Assistant Treasurer of other funds. Mr. Christian is an employee of Fidelity Investments (2003-present).
William C. Coffey (1969)
Year of Election or Appointment: 2009
Assistant Secretary
Mr. Coffey also serves as Assistant Secretary of other funds. He is Senior Vice President and Deputy General Counsel of FMR LLC (diversified financial services company, 2010-present), and is an employee of Fidelity Investments. Previously, Mr. Coffey served as Vice President and Associate General Counsel of FMR LLC (2005-2009).
Jonathan Davis (1968)
Year of Election or Appointment: 2010
Assistant Treasurer
Mr. Davis also serves as Assistant Treasurer of other funds, and is an employee of Fidelity Investments. Previously, Mr. Davis served as Vice President and Associate General Counsel of FMR LLC (diversified financial services company, 2003-2010).
Adrien E. Deberghes (1967)
Year of Election or Appointment: 2016
Assistant Treasurer
Mr. Deberghes also serves as an officer of other funds. He serves as Executive Vice President of Fidelity Investments Money Management, Inc. (FIMM) (investment adviser firm, 2016-present) and is an employee of Fidelity Investments (2008-present). Prior to joining Fidelity Investments, Mr. Deberghes was Senior Vice President of Mutual Fund Administration at State Street Corporation (2007-2008), Senior Director of Mutual Fund Administration at Investors Bank & Trust (2005-2007), and Director of Finance for Dunkin' Brands (2000-2005). Previously, Mr. Deberghes served in other fund officer roles.
Stephanie J. Dorsey (1969)
Year of Election or Appointment: 2010
Assistant Treasurer
Ms. Dorsey also serves as an officer of other funds. She is an employee of Fidelity Investments (2008-present) and has served in other fund officer roles. Prior to joining Fidelity Investments, Ms. Dorsey served as Treasurer (2004-2008) of the JPMorgan Mutual Funds and Vice President (2004-2008) of JPMorgan Chase Bank.
Howard J. Galligan III (1966)
Year of Election or Appointment: 2014
Chief Financial Officer
Mr. Galligan also serves as Chief Financial Officer of other funds. Mr. Galligan serves as President of Fidelity Pricing and Cash Management Services (FPCMS) (2014-present) and as a Director of Strategic Advisers, Inc. (investment adviser firm, 2008-present). Previously, Mr. Galligan served as Chief Administrative Officer of Asset Management (2011-2014) and Chief Operating Officer and Senior Vice President of Investment Support for Strategic Advisers, Inc. (2003-2011).
Scott C. Goebel (1968)
Year of Election or Appointment: 2015
Vice President
Mr. Goebel serves as Vice President of other funds and is an employee of Fidelity Investments (2001-present). Mr. Goebel serves as Senior Vice President of Fidelity Management & Research Company (FMR) (investment adviser firm, 2016-present). Previously, Mr. Goebel served as Secretary of Fidelity SelectCo, LLC (investment adviser firm, 2013-2015), Fidelity Investments Money Management, Inc. (FIMM) (investment adviser firm, 2010-2015), and Fidelity Research and Analysis Company (FRAC) (investment adviser firm, 2010-2015); General Counsel, Secretary, and Senior Vice President of FMR (investment adviser firm, 2008-2015) and FMR Co., Inc. (investment adviser firm, 2008-2015); Assistant Secretary of Fidelity Management & Research (Japan) Limited (investment adviser firm, 2008-2015) and Fidelity Management & Research (U.K.) Inc. (investment adviser firm, 2008-2015); Chief Legal Officer (CLO) of Fidelity Management & Research (Hong Kong) Limited (investment adviser firm, 2008-2015); Secretary and CLO of certain Fidelity® funds (2008-2015); Assistant Secretary of FIMM (2008-2010), FRAC (2008-2010), and certain funds (2007-2008); and as Vice President and Secretary of Fidelity Distributors Corporation (FDC) (2005-2007).
Thomas C. Hense (1964)
Year of Election or Appointment: 2008, 2010, or 2015
Vice President
Mr. Hense serves as Vice President of Fidelity Advisor® Multi-Asset Income Fund (2015) and other funds (High Income (2008), Small Cap (2008), and Value (2010) funds), and is an employee of Fidelity Investments (1993-present). Previously, Mr. Hense served as a portfolio manager for Fidelity's Institutional Money Management Group (Pyramis) (2003-2008).
Brian B. Hogan (1964)
Year of Election or Appointment: 2009
Vice President
Mr. Hogan also serves as Trustee or Vice President of other funds. Mr. Hogan serves as a Director of FMR Investment Management (U.K.) Limited (investment adviser firm, 2015-present) and Fidelity SelectCo, LLC (investment adviser firm, 2014-present) and President of the Equity Division of FMR (investment adviser firm, 2009-present). Previously, Mr. Hogan served as Senior Vice President, Equity Research of FMR (2006-2009) and as a portfolio manager. Mr. Brian B. Hogan is not related to Mr. Colm A. Hogan.
Colm A. Hogan (1973)
Year of Election or Appointment: 2016
Deputy Treasurer
Mr. Hogan also serves as an officer of other funds. Mr. Hogan is an employee of Fidelity Investments (2005-present). Mr. Colm A. Hogan is not related to Mr. Brian B. Hogan.
Chris Maher (1972)
Year of Election or Appointment: 2013
Assistant Treasurer
Mr. Maher serves as Assistant Treasurer of other funds. Mr. Maher is Vice President of Valuation Oversight and is an employee of Fidelity Investments. Previously, Mr. Maher served as Vice President of Asset Management Compliance (2013), Vice President of the Program Management Group of FMR (investment adviser firm, 2010-2013), and Vice President of Valuation Oversight (2008-2010).
John F. Papandrea (1972)
Year of Election or Appointment: 2016
Anti-Money Laundering (AML) Officer
Mr. Papandrea also serves as AML Officer of other funds. Mr. Papandrea is Vice President of FMR LLC (diversified financial services company, 2008-present) and is an employee of Fidelity Investments (2005-present).
Kenneth B. Robins (1969)
Year of Election or Appointment: 2016
Chief Compliance Officer
Mr. Robins also serves as an officer of other funds. Mr. Robins serves as Compliance Officer of Fidelity Management & Research Company and FMR Co., Inc. (investment adviser firms, 2016-present) and is an employee of Fidelity Investments (2004-present). Previously, Mr. Robins served as Executive Vice President of Fidelity Investments Money Management, Inc. (investment adviser firm, 2013-2016) and served in other fund officer roles.
Stacie M. Smith (1974)
Year of Election or Appointment: 2016
President and Treasurer
Ms. Smith also serves as an officer of other funds. She is an employee of Fidelity Investments (2009-present) and has served in other fund officer roles. Prior to joining Fidelity Investments, Ms. Smith served as Senior Audit Manager of Ernst & Young LLP (1996-2009). Previously, Ms. Smith served as Deputy Treasurer of certain Fidelity® funds (2013-2016).
Renee Stagnone (1975)
Year of Election or Appointment: 2016
Assistant Treasurer
Ms. Stagnone also serves as an officer of other funds. Ms. Stagnone is an employee of Fidelity Investments (1997-present). Previously, Ms. Stagnone served as Deputy Treasurer of certain Fidelity® funds (2013-2016).
Shareholder Expense Example
As a shareholder of the Fund, you incur two types of costs: (1) transaction costs, and (2) ongoing costs, including management fees and other Fund expenses. This Example is intended to help you understand your ongoing costs (in dollars) of investing in the Fund and to compare these costs with the ongoing costs of investing in other mutual funds.
The Example is based on an investment of $1,000 invested at the beginning of the period and held for the entire period (February 1, 2016 to July 31, 2016).
Actual Expenses
The first line of the accompanying table provides information about actual account values and actual expenses. You may use the information in this line, together with the amount you invested, to estimate the expenses that you paid over the period. Simply divide your account value by $1,000.00 (for example, an $8,600 account value divided by $1,000.00 = 8.6), then multiply the result by the number in the first line under the heading entitled "Expenses Paid During Period" to estimate the expenses you paid on your account during this period. A small balance maintenance fee of $12.00 that is charged once a year may apply for certain accounts with a value of less than $2,000. This fee is not included in the table below. If it was, the estimate of expenses you paid during the period would be higher, and your ending account value lower, by this amount. In addition, the Fund, as a shareholder in the underlying Fidelity Central Funds, will indirectly bear its pro-rata share of the fees and expenses incurred by the underlying Fidelity Central Funds. These fees and expenses are not included in the Fund's annualized expense ratio used to calculate the expense estimate in the table below.
Hypothetical Example for Comparison Purposes
The second line of the accompanying table provides information about hypothetical account values and hypothetical expenses based on the Fund's actual expense ratio and an assumed rate of return of 5% per year before expenses, which is not the Fund's actual return. The hypothetical account values and expenses may not be used to estimate the actual ending account balance or expenses you paid for the period. You may use this information to compare the ongoing costs of investing in the Fund and other funds. To do so, compare this 5% hypothetical example with the 5% hypothetical examples that appear in the shareholder reports of the other funds. A small balance maintenance fee of $12.00 that is charged once a year may apply for certain accounts with a value of less than $2,000. This fee is not included in the table below. If it was, the estimate of expenses you paid during the period would be higher, and your ending account value lower, by this amount. In addition, the Fund, as a shareholder in the underlying Fidelity Central Funds, will indirectly bear its pro-rata share of the fees and expenses incurred by the underlying Fidelity Central Funds. These fees and expenses are not included in the Fund's annualized expense ratio used to calculate the expense estimate in the table below.
Please note that the expenses shown in the table are meant to highlight your ongoing costs only and do not reflect any transaction costs. Therefore, the second line of the table is useful in comparing ongoing costs only, and will not help you determine the relative total costs of owning different funds.
| | Annualized Expense Ratio-A | Beginning
Account Value
February 1, 2016 | Ending
Account Value
July 31, 2016 | Expenses Paid
During Period-B
February 1, 2016
to July 31, 2016 |
| Actual | .83% | $1,000.00 | $1,080.80 | $4.29 |
| Hypothetical-C | | $1,000.00 | $1,020.74 | $4.17 |
A Annualized expense ratio reflects expenses net of applicable fee waivers.
B Expenses are equal to the Fund's annualized expense ratio, multiplied by the average account value over the period, multiplied by 182/366 (to reflect the one-half year period).
C 5% return per year before expenses
Distributions (Unaudited)
The fund designates 100% and 92% of the dividends distributed in September and December, respectively during the fiscal year as qualifying for the dividends–received deduction for corporate shareholders.
The fund designates 100% of the dividends distributed in September and December during the fiscal year as amounts which may be taken into account as a dividend for the purposes of the maximum rate under section 1(h)(11) of the Internal Revenue Code.
The fund will notify shareholders in January 2017 of amounts for use in preparing 2016 income tax returns.
Board Approval of Investment Advisory Contracts and Management Fees
Fidelity Blue Chip Value Fund
Each year, the Board of Trustees, including the Independent Trustees (together, the Board), votes on the renewal of the management contract with Fidelity Management & Research Company (FMR) and the sub-advisory agreements (together, the Advisory Contracts) for the fund. The Board, assisted by the advice of fund counsel and Independent Trustees' counsel, requests and considers a broad range of information relevant to the renewal of the Advisory Contracts throughout the year.
The Board meets regularly and, at each of its meetings, covers an extensive agenda of topics and materials and considers factors that are relevant to its annual consideration of the renewal of the fund's Advisory Contracts, including the services and support provided to the fund and its shareholders. The Board has established various standing committees (Committees), each composed of and chaired by Independent Trustees with varying backgrounds, to which the Board has assigned specific subject matter responsibilities in order to enhance effective decision-making by the Board. The Board, acting directly and through its Committees, requests and receives information concerning the annual consideration of the renewal of the fund's Advisory Contracts. The Board also meets as needed to consider matters specifically related to the Board's annual consideration of the renewal of the Advisory Contracts. Members of the Board may also meet with trustees of other Fidelity funds through ad hoc joint committees to discuss certain matters relevant to all of the Fidelity funds.
At its July 2016 meeting, the Board unanimously determined to renew the fund's Advisory Contracts. In reaching its determination, the Board considered all factors it believed relevant, including (i) the nature, extent, and quality of the services to be provided to the fund and its shareholders (including the investment performance of the fund); (ii) the competitiveness of the fund's management fee and total expense ratio relative to peer funds; (iii) the total costs of the services to be provided by and the profits to be realized by Fidelity from its relationships with the fund; and (iv) the extent to which, if any, economies of scale exist and would be realized as the fund grows, and whether any economies of scale are appropriately shared with fund shareholders.
In considering whether to renew the Advisory Contracts for the fund, the Board reached a determination, with the assistance of fund counsel and Independent Trustees' counsel and through the exercise of its business judgment, that the renewal of the Advisory Contracts was in the best interests of the fund and its shareholders and that the compensation payable under the Advisory Contracts was fair and reasonable. The Board's decision to renew the Advisory Contracts was not based on any single factor, but rather was based on a comprehensive consideration of all the information provided to the Board at its meetings throughout the year. The Board, in reaching its determination to renew the Advisory Contracts, was aware that shareholders of the fund have a broad range of investment choices available to them, including a wide choice among funds offered by Fidelity's competitors, and that the fund's shareholders, who have the opportunity to review and weigh the disclosure provided by the fund in its prospectus and other public disclosures, have chosen to invest in this fund, which is part of the Fidelity family of funds.
Nature, Extent, and Quality of Services Provided. The Board considered Fidelity's staffing as it relates to the fund, including the backgrounds of investment personnel of Fidelity, and also considered the fund's investment objective, strategies, and related investment philosophy. The Independent Trustees also had discussions with senior management of Fidelity's investment operations and investment groups. The Board considered the structure of the investment personnel compensation program and whether this structure provides appropriate incentives to act in the best interests of the fund. Additionally, the Board considered the portfolio managers' investments, if any, in the funds that they manage.
Resources Dedicated to Investment Management and Support Services. The Board and the Fund Oversight and Research Committees reviewed the general qualifications and capabilities of Fidelity's investment staff, including its size, education, experience, and resources, as well as Fidelity's approach to recruiting, training, managing, and compensating investment personnel. The Board noted that Fidelity has continued to increase the resources devoted to non-U.S. offices, including expansion of Fidelity's global investment organization. The Board also noted that Fidelity's analysts have extensive resources, tools and capabilities that allow them to conduct sophisticated quantitative and fundamental analysis, as well as credit analysis of issuers, counterparties and guarantors. Further, the Board considered that Fidelity's investment professionals have sufficient access to global information and data so as to provide competitive investment results over time, and that those professionals also have access to sophisticated tools that permit them to assess portfolio construction and risk and performance attribution characteristics continuously, as well as to transmit new information and research conclusions rapidly around the world. Additionally, in its deliberations, the Board considered Fidelity's trading, risk management, compliance, and technology and operations capabilities and resources, which are integral parts of the investment management process.
Shareholder and Administrative Services. The Board considered (i) the nature, extent, quality, and cost of advisory, administrative, and shareholder services performed by FMR, the sub-advisers (together with FMR, the Investment Advisers), and their affiliates under the Advisory Contracts and under separate agreements covering transfer agency, pricing and bookkeeping, and securities lending services for the fund; (ii) the nature and extent of the supervision of third party service providers, principally custodians, subcustodians, and pricing vendors; and (iii) the resources devoted to, and the record of compliance with, the fund's compliance policies and procedures. The Board also reviewed the allocation of fund brokerage, including allocations to brokers affiliated with the Investment Advisers, the use of brokerage commissions to pay fund expenses, and the use of "soft" commission dollars to pay for research services.
The Board noted that the growth of fund assets over time across the complex allows Fidelity to reinvest in the development of services designed to enhance the value or convenience of the Fidelity funds as investment vehicles. These services include 24-hour access to account information and market information through telephone representatives and over the Internet, investor education materials and asset allocation tools, and the expanded availability of Fidelity Investor Centers.
In 2014, the Board formed an ad hoc Committee on Transfer Agency Fees to review the variety of transfer agency fee structures throughout the industry and Fidelity's competitive positioning with respect to industry participants.
Investment in a Large Fund Family. The Board considered the benefits to shareholders of investing in a Fidelity fund, including the benefits of investing in a fund that is part of a large family of funds offering a variety of investment disciplines and providing a large variety of mutual fund investor services. The Board noted that Fidelity had taken, or had made recommendations that resulted in the Fidelity funds taking, a number of actions over the previous year that benefited particular funds, including: (i) continuing to dedicate additional resources to investment research and to the support of the senior management team that oversees asset management; (ii) continuing efforts to enhance Fidelity's global research capabilities; (iii) launching new funds and making other enhancements to meet client needs; (iv) broadening eligibility requirements for certain lower-priced share classes of, and streamlining the fee structure for, certain existing equity index funds; (v) lowering expense caps for certain existing funds and classes to reduce expenses paid by shareholders; (vi) eliminating redemption fees for certain variable insurance product funds and classes; (vii) continuing to launch dedicated lower cost underlying funds to meet portfolio construction needs related to expanding underlying fund options for Fidelity funds of funds, specifically for the Freedom Fund product lines; (viii) launching a lower cost share class for use by the Freedom Index Fund product line; (ix) rationalizing product lines and gaining increased efficiencies through fund mergers and share class consolidations; (x) continuing to develop, acquire and implement systems and technology to improve services to the funds and shareholders, strengthen information security, and increase efficiency; (xi) implementing investment enhancements to further strengthen Fidelity's target date product line to increase investors' probability of success in achieving their goals; (xii) accelerating the conversion of all remaining Class B shares to Class A shares, which have a lower expense structure; and (xiii) implementing changes to Fidelity's money market fund product line in response to recent regulatory reforms.
Investment Performance. The Board considered whether the fund has operated in accordance with its investment objective, as well as its record of compliance with its investment restrictions and its performance history. The Board noted that there was a portfolio management change for the fund in September 2014.
The Board took into account discussions with representatives of the Investment Advisers about fund investment performance that occur at Board meetings throughout the year. In this regard the Board noted that as part of regularly scheduled fund reviews and other reports to the Board on fund performance, the Board considers annualized return information for the fund, for different time periods, measured against a securities market index ("benchmark index") and a peer group of funds with similar objectives ("peer group"), if any. In its evaluation of fund investment performance, the Board gave particular attention to information indicating changes in performance of certain Fidelity funds for specific time periods and discussed with the Investment Advisers the reasons for any overperformance or underperformance.
In addition to reviewing absolute and relative fund performance, the Independent Trustees periodically consider the appropriateness of fund performance metrics in evaluating the results achieved. In general, the Independent Trustees believe that fund performance should be evaluated based on net performance (after fees and expenses) of both the highest performing and lowest performing fund share classes, where applicable, compared to appropriate benchmark indices, over appropriate time periods that may include full market cycles, and compared to peer groups, as applicable, over the same periods, taking into account relevant factors including the following: general market conditions; issuer-specific information; and fund cash flows and other factors.
The Independent Trustees recognize that shareholders evaluate performance on a net basis over their own holding periods, for which one-, three-, and five-year periods are often used as a proxy. For this reason, the performance information reviewed by the Board also included net cumulative calendar year total return information for the fund and an appropriate benchmark index and peer group for the most recent one-, three-, and five-year periods, as shown below. Returns are shown compared to the 25th percentile (top of box, 75% beaten) and 75th percentile (bottom of box, 25% beaten) of the peer universe.
Fidelity Blue Chip Value Fund
The Board also considered that the fund's management fee is subject to upward or downward adjustment depending upon whether, and to what extent, the fund's investment performance for the performance period exceeds, or is exceeded by, a securities index, thus leading to a performance adjustment for the same period. The Board noted that the performance adjustment provides FMR with a strong economic incentive to seek to achieve superior performance for the fund's shareholders and helps to more closely align the interests of FMR and the shareholders of the fund.
Based on its review, the Board concluded that the nature, extent, and quality of services provided to the fund under the Advisory Contracts should continue to benefit the shareholders of the fund.
Competitiveness of Management Fee and Total Expense Ratio. The Board considered the fund's management fee and total expense ratio compared to "mapped groups" of competitive funds and classes created for the purpose of facilitating the Trustees' competitive analysis of management fees and total expenses. Fidelity creates "mapped groups" by combining similar Broadridge investment objective categories that have comparable investment mandates. Combining Broadridge investment objective categories aids the Board's management fee and total expense ratio comparisons by broadening the competitive group used for comparison.
Management Fee. The Board considered two proprietary management fee comparisons for the 12-month periods shown in basis points (BP) in the chart below. The group of Broadridge funds used by the Board for management fee comparisons is referred to below as the "Total Mapped Group." The Total Mapped Group comparison focuses on a fund's standing in terms of gross management fees before expense reimbursements or caps, and without giving effect to the fund's performance adjustment, relative to the total universe of funds with comparable investment mandates, regardless of whether their management fee structures also are comparable. Funds with comparable investment mandates offer exposure to similar types of securities. Funds with comparable management fee structures have similar management fee contractual arrangements (
e.g., flat rate charged for advisory services, all-inclusive fee rate,
etc.). "TMG %" represents the percentage of funds in the Total Mapped Group that had management fees that were lower than the fund's. For example, a hypothetical TMG % of 20% would mean that 80% of the funds in the Total Mapped Group had higher, and 20% had lower, management fees than the fund. The fund's actual TMG %s and the number of funds in the Total Mapped Group are in the chart below. The "Asset-Size Peer Group" (ASPG) comparison focuses on a fund's standing relative to a subset of non-Fidelity funds within the Total Mapped Group that are similar in size and management fee structure without taking into account performance adjustments, if any. For example, if a fund is in the first quartile of the ASPG, the fund's management fee ranks in the least expensive or lowest 25% of funds in the ASPG. The ASPG represents at least 15% of the funds in the Total Mapped Group with comparable asset size and management fee structures, subject to a minimum of 50 funds (or all funds in the Total Mapped Group if fewer than 50). Additional information, such as the ASPG quartile in which the fund's management fee rate ranked and the impact of the fund's performance adjustment, is also included in the chart and considered by the Board.
Fidelity Blue Chip Value Fund
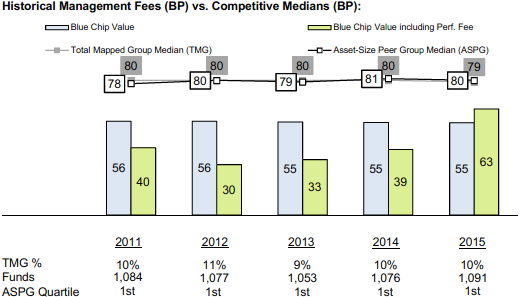
The Board noted that the fund's management fee rate ranked below the median of its Total Mapped Group and below the median of its ASPG for 2015. The Board also noted the effect of the fund's performance adjustment, if any, on the fund's management fee ranking.
The Board noted that, in 2014, the ad hoc Committee on Group Fee was formed by it and the boards of other Fidelity funds to conduct an in-depth review of the "group fee" component of the management fee of funds with such management fee structures. The Committee's focus included the mechanics of the group fee, the competitive landscape of group fee structures, Fidelity funds with no group fee component and investment products not included in group fee assets. The Board also considered that, for funds subject to the group fee, FMR agreed to voluntarily waive fees over a specified period of time in amounts designed to account for assets converted from certain funds to certain collective investment trusts.
The Board also noted that, in 2013, the ad hoc Committee on Management Fees was formed to conduct an in-depth review of the management fee rates of Fidelity's active equity mutual funds. The Committee focused on the following areas: (i) standard fee structures; (ii) research consumption and trading evolution; (iii) management fee competitiveness/profitability by category; and (iv) factors that drive institutional pricing.
Based on its review, the Board concluded that the fund's management fee is fair and reasonable in light of the services that the fund receives and the other factors considered.
Total Expense Ratio. In its review of the fund's total expense ratio, the Board considered the fund's management fee rate as well as other fund expenses, such as transfer agent fees, pricing and bookkeeping fees, and custodial, legal, and audit fees. The Board noted the impact of the fund's performance adjustment. The Board also noted that Fidelity may agree to waive fees and expenses from time to time, and the extent to which, if any, it has done so for the fund. As part of its review, the Board also considered the current and historical total expense ratios of the fund compared to competitive fund median expenses. The fund is compared to those funds and classes in the Total Mapped Group (used by the Board for management fee comparisons) that have a similar sales load structure.
The Board noted that the fund's total expense ratio ranked below the competitive median for 2015.
Fees Charged to Other Fidelity Clients. The Board also considered Fidelity fee structures and other information with respect to clients of Fidelity, such as other funds advised or subadvised by Fidelity, pension plan clients, and other institutional clients with similar mandates. The Board noted the findings of the 2013 ad hoc joint committee (created with the board of other Fidelity funds), which reviewed and compared Fidelity's institutional investment advisory business with its business of providing services to the Fidelity funds, including the differences in services provided, fees charged, and costs incurred, as well as competition in their respective marketplaces.
Based on its review of total expense ratios and fees charged to other Fidelity clients, the Board concluded that the fund's total expense ratio was reasonable in light of the services that the fund and its shareholders receive and the other factors considered.
Costs of the Services and Profitability. The Board considered the revenues earned and the expenses incurred by Fidelity in conducting the business of developing, marketing, distributing, managing, administering and servicing the fund and servicing the fund's shareholders. The Board also considered the level of Fidelity's profits in respect of all the Fidelity funds.
On an annual basis, Fidelity presents to the Board information about the profitability of its relationship with the fund. Fidelity calculates profitability information for each fund, as well as aggregate profitability information for groups of Fidelity funds and all Fidelity funds, using a series of detailed revenue and cost allocation methodologies which originate with the books and records of Fidelity on which Fidelity's audited financial statements are based. The Audit Committee of the Board reviews any significant changes from the prior year's methodologies.
PricewaterhouseCoopers LLP (PwC), independent registered public accounting firm and auditor to Fidelity and certain Fidelity funds, has been engaged annually by the Board as part of the Board's assessment of Fidelity's profitability analysis. PwC's engagement includes the review and assessment of the methodologies used by Fidelity in determining the revenues and expenses attributable to Fidelity's mutual fund business, and completion of agreed-upon procedures in respect of the mathematical accuracy of the fund profitability information and its conformity to established allocation methodologies. After considering PwC's reports issued under the engagement and information provided by Fidelity, the Board concluded that while other allocation methods may also be reasonable, Fidelity's profitability methodologies are reasonable in all material respects.
The Board also reviewed Fidelity's non-fund businesses and fall-out benefits related to the mutual fund business as well as cases where Fidelity's affiliates may benefit from or be related to the fund's business.
The Board considered the costs of the services provided by and the profits realized by Fidelity in connection with the operation of the fund and was satisfied that the profitability was not excessive.
Economies of Scale. The Board considered whether there have been economies of scale in respect of the management of the Fidelity funds, whether the Fidelity funds (including the fund) have appropriately benefited from any such economies of scale, and whether there is potential for realization of any further economies of scale. The Board considered the extent to which the fund will benefit from economies of scale as assets grow through increased services to the fund, through waivers or reimbursements, or through fee or expense ratio reductions. The Board also noted that in 2013, it and the boards of other Fidelity funds created an ad hoc committee (the Economies of Scale Committee) to analyze whether Fidelity attains economies of scale in respect of the management and servicing of the Fidelity funds, whether the Fidelity funds have appropriately benefited from such economies of scale, and whether there is potential for realization of any further economies of scale.
The Board recognized that the fund's management contract incorporates a "group fee" structure, which provides for lower group fee rates as total group assets increase, and for higher group fee rates as total group assets decrease (with "group assets" defined to include fund assets under FMR's management plus the assets of sector funds previously under FMR's management). FMR calculates the group fee rates based on a tiered asset "breakpoint" schedule that varies based on asset class. The Board considered that the group fee is designed to deliver the benefits of economies of scale to fund shareholders when total Fidelity fund assets increase, even if assets of any particular fund are unchanged or have declined, because some portion of Fidelity's costs are attributable to services provided to all Fidelity funds, and all funds benefit if those costs can be allocated among more assets. The Board concluded that, given the group fee structure, fund shareholders will benefit from lower management fees as group assets increase at the fund complex level, regardless of whether Fidelity achieves any such economies of scale.
The Board concluded, taking into account the analysis of the Economies of Scale Committee, that economies of scale, if any, are being appropriately shared between fund shareholders and Fidelity.
Additional Information Requested by the Board. In order to develop fully the factual basis for consideration of the Fidelity funds' Advisory Contracts, the Board requested and received additional information on certain topics, including: (i) fund performance trends and Fidelity's long-term strategies for certain funds; (ii) the various share classes employed by Fidelity and the attributes of each class, together with similar information on the distribution and servicing payments made by Fidelity or the funds to third-party participants in the distribution channels; (iii) fund profitability, and fund performance in relation to fund profitability; (iv) the methodology with respect to evaluating competitive fund data and peer group classifications and fee comparisons; (v) annual fund profitability margins; (vi) the realization of fall-out benefits in and attribution of fall-out benefits to certain Fidelity business units; (vii) the appropriateness of certain funds' benchmarks; (viii) the rationalization for certain share classes and expenses; (ix) sub-advisory fee rates for comparable investment mandates; (x) product strategy for certain underperforming funds; and (xi) Fidelity's resources and strategy for cybersecurity.
Based on its evaluation of all of the conclusions noted above, and after considering all factors it believed relevant, the Board concluded that the advisory fee structures are fair and reasonable, and that the fund's Advisory Contracts should be renewed.
Corporate Headquarters
245 Summer St.
Boston, MA 02210
www.fidelity.com
BCV-ANN-0916
1.788861.113
Fidelity® OTC Portfolio Class K
Annual Report July 31, 2016 |
|
Contents
To view a fund's proxy voting guidelines and proxy voting record for the 12-month period ended June 30, visit http://www.fidelity.com/proxyvotingresults or visit the Securities and Exchange Commission's (SEC) web site at http://www.sec.gov.
You may also call 1-800-835-5092 to request a free copy of the proxy voting guidelines.
Standard & Poor's, S&P and S&P 500 are registered service marks of The McGraw-Hill Companies, Inc. and have been licensed for use by Fidelity Distributors Corporation.
Other third-party marks appearing herein are the property of their respective owners.
All other marks appearing herein are registered or unregistered trademarks or service marks of FMR LLC or an affiliated company. © 2016 FMR LLC. All rights reserved.
This report and the financial statements contained herein are submitted for the general information of the shareholders of the Fund. This report is not authorized for distribution to prospective investors in the Fund unless preceded or accompanied by an effective prospectus.
A fund files its complete schedule of portfolio holdings with the SEC for the first and third quarters of each fiscal year on Form N-Q. Forms N-Q are available on the SEC’s web site at http://www.sec.gov. A fund's Forms N-Q may be reviewed and copied at the SEC’s Public Reference Room in Washington, DC. Information regarding the operation of the SEC's Public Reference Room may be obtained by calling 1-800-SEC-0330.
For a complete list of a fund's portfolio holdings, view the most recent holdings listing, semiannual report, or annual report on Fidelity's web site at http://www.fidelity.com, http://www.institutional.fidelity.com, or http://www.401k.com, as applicable.
NOT FDIC INSURED •MAY LOSE VALUE •NO BANK GUARANTEE
Neither the Fund nor Fidelity Distributors Corporation is a bank.
Performance: The Bottom Line
Average annual total return reflects the change in the value of an investment, assuming reinvestment of distributions from dividend income and capital gains (the profits earned upon the sale of securities that have grown in value, if any) and assuming a constant rate of performance each year. The hypothetical investment and the average annual total returns do not reflect the deduction of taxes that a shareholder would pay on fund distributions or the redemption of fund shares. During periods of reimbursement by Fidelity, a fund’s total return will be greater than it would be had the reimbursement not occurred. How a fund did yesterday is no guarantee of how it will do tomorrow.
Average Annual Total Returns
| For the periods ended July 31, 2016 | Past 1 year | Past 5 years | Past 10 years |
| Class K | 3.80% | 14.86% | 13.13% |
The initial offering of Class K shares took place on May 9, 2008. Returns prior to May 9, 2008 are those of Fidelity® OTC Portfolio, the original class of the fund.
$10,000 Over 10 Years
Let's say hypothetically that $10,000 was invested in Fidelity® OTC Portfolio - Class K on July 31, 2006. The chart shows how the value of your investment would have changed, and also shows how the Nasdaq Composite Index® performed over the same period. See above for additional information regarding the performance of Class K.
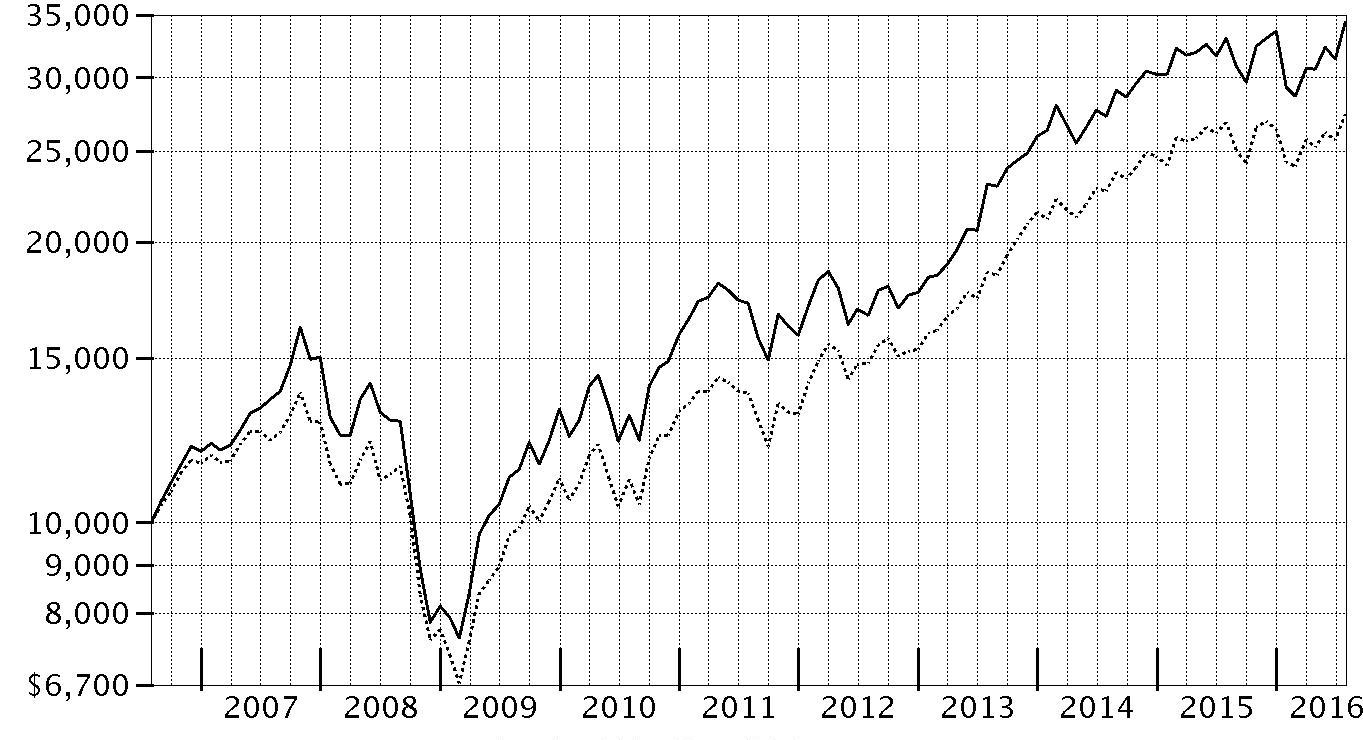
| Period Ending Values |
| $34,346 | Fidelity® OTC Portfolio - Class K |
| $27,394 | Nasdaq Composite Index® |
Management's Discussion of Fund Performance
Market Recap: U.S. equities gained modestly for the year ending July 31, 2016, overcoming persistent concern about global economic growth, uncertainty regarding U.S. monetary policy and the U.K.’s late-June vote to leave the European Union, dubbed Brexit. The S&P 500
® index rose 5.61%, with larger-cap, value-oriented stocks and defensive sectors shining brightest. Volatility peaked in the early weeks of 2016, as continued oil-price weakness and U.S.-dollar strength pushed the S&P 500
® to its worst January since 2009. Markets then rose beginning in February amid U.S. job gains, a broad rally in energy and materials markets, global economic stimulus and perceived softening of monetary policy by the U.S. Federal Reserve. The June 23 Brexit vote surprised markets and resulted in a sharp two-day decline for stocks, followed by a rebound as investor sentiment shifted and remained positive through July 31. For the year, dividend-rich telecom services (+26%), utilities (+23%) and consumer staples (+12%) led the way amid strong investor demand for yield. Industrials (+10%) and information technology (+10%) also outperformed, as did materials (+8%), despite a weak commodities environment overall. Conversely, a strong run for real estate stocks couldn’t keep financials (-4%) from losing ground, as low interest rates continued to squeeze bank profits.
Comments from Portfolio Manager Gavin Baker: For the year, the fund’s share classes outpaced the 1.92% return of the Nasdaq Composite
® Index by about 1.7 percentage points. Versus the benchmark, security selection proved additive, notably in technology and consumer discretionary. Stock picks and an overweighting in health care – particularly the pharmaceuticals, biotechnology & life sciences group – detracted most from relative results. Selections in financials also hurt. The fund's top individual contributor on a relative basis was an overweighting in computer-processor maker NVIDIA, which nearly tripled in value this period; NVIDIA was one of the fund's largest holdings. An out-of-benchmark stake in France-based game developer Ubisoft Entertainment, which more than doubled in value this period, also helped. Conversely, several pharma, biotech & life sciences names detracted, including Clovis Oncology and Alexion Pharmaceuticals. After multiyear, gains the group pulled back amid concerns over drug prices, as well as some earnings and clinical-trial disappointments. Health care weightings generally were kept steady, as the fund increased its share-count in several underperforming names. The fund's biggest detractor, though, was an overweighting in solar-energy system provider SolarCity; its stock lost just over half its value this period, pressured by disappointing quarterly results and guidance.
The views expressed above reflect those of the portfolio manager(s) only through the end of the period as stated on the cover of this report and do not necessarily represent the views of Fidelity or any other person in the Fidelity organization. Any such views are subject to change at any time based upon market or other conditions and Fidelity disclaims any responsibility to update such views. These views may not be relied on as investment advice and, because investment decisions for a Fidelity fund are based on numerous factors, may not be relied on as an indication of trading intent on behalf of any Fidelity fund.
Investment Summary (Unaudited)
Top Ten Stocks as of July 31, 2016
| | % of fund's net assets | % of fund's net assets 6 months ago |
| Apple, Inc. | 7.2 | 5.4 |
| Amazon.com, Inc. | 5.9 | 4.6 |
| Tesla Motors, Inc. | 5.5 | 3.4 |
| Alphabet, Inc. Class A | 5.4 | 5.3 |
| NVIDIA Corp. | 4.3 | 3.0 |
| Activision Blizzard, Inc. | 4.1 | 4.4 |
| Alphabet, Inc. Class C | 3.8 | 4.0 |
| Facebook, Inc. Class A | 3.3 | 4.2 |
| Ubisoft Entertainment SA | 3.1 | 2.3 |
| Microsoft Corp. | 2.8 | 4.0 |
| | 45.4 | |
Top Five Market Sectors as of July 31, 2016
| | % of fund's net assets | % of fund's net assets 6 months ago |
| Information Technology | 48.8 | 50.1 |
| Health Care | 19.9 | 19.8 |
| Consumer Discretionary | 19.2 | 16.6 |
| Financials | 4.7 | 4.7 |
| Consumer Staples | 3.5 | 4.9 |
Asset Allocation (% of fund's net assets)
| As of July 31, 2016 * |
| | Stocks | 96.7% |
| | Convertible Securities | 3.2% |
| | Short-Term Investments and Net Other Assets (Liabilities) | 0.1% |

* Foreign investments - 13.2%
| As of January 31, 2016* |
| | Stocks | 96.6% |
| | Convertible Securities | 3.3% |
| | Short-Term Investments and Net Other Assets (Liabilities) | 0.1% |

* Foreign investments - 7.8%
Investments July 31, 2016
Showing Percentage of Net Assets
| Common Stocks - 96.7% | | | |
| | | Shares | Value (000s) |
| CONSUMER DISCRETIONARY - 18.8% | | | |
| Automobiles - 5.5% | | | |
| Tesla Motors, Inc. (a) | | 3,139,299 | $737,076 |
| Hotels, Restaurants & Leisure - 1.4% | | | |
| Buffalo Wild Wings, Inc. (a) | | 328,300 | 55,141 |
| Chipotle Mexican Grill, Inc. (a) | | 264,100 | 111,976 |
| Intrawest Resorts Holdings, Inc. (a) | | 726,835 | 10,568 |
| Vail Resorts, Inc. | | 85,500 | 12,232 |
| | | | 189,917 |
| Internet & Catalog Retail - 9.1% | | | |
| Amazon.com, Inc. (a) | | 1,044,898 | 792,879 |
| Etsy, Inc. (a) | | 1,870,275 | 18,815 |
| Groupon, Inc. Class A (a)(b)(c) | | 62,409,181 | 300,812 |
| Wayfair LLC Class A (a)(b) | | 2,482,768 | 108,000 |
| | | | 1,220,506 |
| Media - 1.7% | | | |
| Altice NV (a) | | 1,015,500 | 14,603 |
| Charter Communications, Inc. Class A (a) | | 588,182 | 138,146 |
| Liberty Global PLC: | | | |
| Class A (a) | | 1,860,400 | 58,993 |
| LiLAC Class A (a) | | 256,099 | 8,797 |
| | | | 220,539 |
| Specialty Retail - 0.3% | | | |
| Ross Stores, Inc. | | 730,200 | 45,148 |
| Textiles, Apparel & Luxury Goods - 0.8% | | | |
| lululemon athletica, Inc. (a) | | 1,080,546 | 83,904 |
| Ralph Lauren Corp. | | 151,900 | 14,900 |
| | | | 98,804 |
|
| TOTAL CONSUMER DISCRETIONARY | | | 2,511,990 |
|
| CONSUMER STAPLES - 3.4% | | | |
| Beverages - 0.5% | | | |
| Monster Beverage Corp. (a) | | 431,400 | 69,296 |
| Food & Staples Retailing - 1.8% | | | |
| Costco Wholesale Corp. | | 1,421,150 | 237,645 |
| Walgreens Boots Alliance, Inc. | | 1,500 | 119 |
| | | | 237,764 |
| Food Products - 1.1% | | | |
| Mondelez International, Inc. | | 3,337,900 | 146,801 |
|
| TOTAL CONSUMER STAPLES | | | 453,861 |
|
| ENERGY - 0.7% | | | |
| Energy Equipment & Services - 0.1% | | | |
| Oceaneering International, Inc. | | 319,700 | 8,913 |
| Oil, Gas & Consumable Fuels - 0.6% | | | |
| Anadarko Petroleum Corp. | | 1,003,200 | 54,704 |
| Diamondback Energy, Inc. | | 111,100 | 9,753 |
| EOG Resources, Inc. | | 194,900 | 15,923 |
| | | | 80,380 |
|
| TOTAL ENERGY | | | 89,293 |
|
| FINANCIALS - 4.4% | | | |
| Banks - 2.5% | | | |
| Bank of America Corp. | | 3,897,600 | 56,476 |
| Bank of the Ozarks, Inc. | | 545,100 | 19,618 |
| Citigroup, Inc. | | 1,441,200 | 63,139 |
| Commerce Bancshares, Inc. | | 784,189 | 37,084 |
| Fifth Third Bancorp | | 515,900 | 9,792 |
| Huntington Bancshares, Inc. | | 1,784,000 | 16,948 |
| Signature Bank (a) | | 261,300 | 31,419 |
| UMB Financial Corp. | | 531,500 | 29,450 |
| Wells Fargo & Co. | | 1,324,900 | 63,555 |
| | | | 327,481 |
| Capital Markets - 0.4% | | | |
| Carlyle Group LP | | 630,500 | 10,895 |
| Northern Trust Corp. | | 537,600 | 36,336 |
| | | | 47,231 |
| Consumer Finance - 0.7% | | | |
| Capital One Financial Corp. | | 1,407,400 | 94,408 |
| Diversified Financial Services - 0.8% | | | |
| Broadcom Ltd. | | 684,326 | 110,847 |
| Real Estate Management & Development - 0.0% | | | |
| WeWork Companies, Inc. Class A (a)(d) | | 29,911 | 1,501 |
|
| TOTAL FINANCIALS | | | 581,468 |
|
| HEALTH CARE - 19.5% | | | |
| Biotechnology - 12.4% | | | |
| Acceleron Pharma, Inc. (a) | | 262,300 | 8,897 |
| Aduro Biotech, Inc. (e) | | 1,938,567 | 28,458 |
| Advanced Accelerator Applications SA sponsored ADR | | 360,800 | 11,289 |
| Adverum Biotechnologies, Inc. (a) | | 988,352 | 3,578 |
| Alexion Pharmaceuticals, Inc. (a) | | 1,755,789 | 225,794 |
| Alkermes PLC (a) | | 1,115,087 | 55,643 |
| Alnylam Pharmaceuticals, Inc. (a) | | 138,100 | 9,402 |
| Amgen, Inc. | | 913,300 | 157,115 |
| Bellicum Pharmaceuticals, Inc. (a)(b)(c) | | 2,331,847 | 37,030 |
| Biogen, Inc. (a) | | 19,700 | 5,712 |
| BioMarin Pharmaceutical, Inc. (a) | | 1,869,456 | 185,861 |
| bluebird bio, Inc. (a) | | 181,808 | 10,396 |
| Blueprint Medicines Corp. (a) | | 382,300 | 8,453 |
| Celldex Therapeutics, Inc. (a)(b) | | 1,273,285 | 5,883 |
| Cellectis SA sponsored ADR (a) | | 371,100 | 9,786 |
| Chiasma, Inc. (a)(b) | | 402,104 | 1,066 |
| Chimerix, Inc. (a) | | 54,700 | 218 |
| Coherus BioSciences, Inc. (a)(b) | | 877,215 | 22,272 |
| CytomX Therapeutics, Inc. | | 517,300 | 5,204 |
| CytomX Therapeutics, Inc. (e) | | 244,269 | 2,457 |
| Dicerna Pharmaceuticals, Inc. (a) | | 492,107 | 1,580 |
| Editas Medicine, Inc. (b) | | 1,150,400 | 29,588 |
| Editas Medicine, Inc. | | 176,244 | 4,488 |
| Galapagos Genomics NV sponsored ADR (a) | | 554,000 | 30,564 |
| Genocea Biosciences, Inc. (a)(b) | | 845,070 | 3,439 |
| GenSight Biologics SA | | 411,444 | 3,680 |
| Gilead Sciences, Inc. | | 59,799 | 4,752 |
| Heron Therapeutics, Inc. (a) | | 757,077 | 12,583 |
| Intellia Therapeutics, Inc. (b) | | 679,900 | 12,864 |
| Intellia Therapeutics, Inc. | | 260,358 | 4,433 |
| Intercept Pharmaceuticals, Inc. (a) | | 318,619 | 55,131 |
| Ionis Pharmaceuticals, Inc. (a) | | 220,506 | 6,437 |
| Ironwood Pharmaceuticals, Inc. Class A (a) | | 3,015,642 | 42,611 |
| Karyopharm Therapeutics, Inc. (a) | | 614,200 | 4,533 |
| Lion Biotechnologies, Inc. (a)(b) | | 2,913,500 | 25,755 |
| Medivation, Inc. (a) | | 490,000 | 31,355 |
| Neurocrine Biosciences, Inc. (a) | | 976,100 | 49,030 |
| Novavax, Inc. (a)(b) | | 10,970,600 | 80,305 |
| OvaScience, Inc. (a)(b) | | 1,188,097 | 5,988 |
| Portola Pharmaceuticals, Inc. (a) | | 643,275 | 16,699 |
| ProNai Therapeutics, Inc. (a)(b) | | 193,200 | 381 |
| Puma Biotechnology, Inc. (a) | | 743,687 | 37,103 |
| Regeneron Pharmaceuticals, Inc. (a) | | 328,800 | 139,779 |
| Sage Therapeutics, Inc. (a) | | 15,800 | 709 |
| Seattle Genetics, Inc. (a)(b) | | 22,086 | 1,061 |
| Spark Therapeutics, Inc. (a) | | 319,480 | 18,511 |
| TESARO, Inc. (a)(b) | | 1,973,322 | 183,993 |
| Trevena, Inc. (a)(c) | | 3,326,521 | 20,857 |
| Ultragenyx Pharmaceutical, Inc. (a) | | 401,496 | 25,407 |
| uniQure B.V. (a) | | 302,200 | 2,197 |
| Vertex Pharmaceuticals, Inc. (a) | | 5,400 | 524 |
| | | | 1,650,851 |
| Health Care Equipment & Supplies - 0.3% | | | |
| IDEXX Laboratories, Inc. (a) | | 393,804 | 36,935 |
| Insulet Corp. (a) | | 122,700 | 4,342 |
| | | | 41,277 |
| Health Care Providers & Services - 0.2% | | | |
| Accretive Health, Inc. (a)(c) | | 6,962,302 | 13,855 |
| Diplomat Pharmacy, Inc. (a)(b) | | 574,900 | 20,656 |
| | | | 34,511 |
| Health Care Technology - 2.3% | | | |
| athenahealth, Inc. (a)(c) | | 2,409,983 | 307,972 |
| Castlight Health, Inc. Class B (a) | | 63,800 | 238 |
| | | | 308,210 |
| Pharmaceuticals - 4.3% | | | |
| Achaogen, Inc. (a) | | 805,700 | 3,166 |
| Endo International PLC (a)(c) | | 17,919,319 | 311,079�� |
| Flex Pharma, Inc. (a)(b) | | 251,834 | 2,984 |
| GW Pharmaceuticals PLC ADR (a) | | 127,027 | 11,981 |
| Horizon Pharma PLC (a) | | 3,917,200 | 75,563 |
| Innoviva, Inc. | | 78 | 1 |
| Intra-Cellular Therapies, Inc. (a) | | 414,207 | 16,900 |
| Jazz Pharmaceuticals PLC (a) | | 133,600 | 20,170 |
| Relypsa, Inc. (a)(b) | | 518,000 | 16,545 |
| The Medicines Company (a) | | 297,800 | 11,647 |
| Valeant Pharmaceuticals International, Inc. (United States) (a) | | 4,599,200 | 102,562 |
| | | | 572,598 |
|
| TOTAL HEALTH CARE | | | 2,607,447 |
|
| INDUSTRIALS - 3.0% | | | |
| Aerospace & Defense - 0.1% | | | |
| Space Exploration Technologies Corp. Class A (a)(d) | | 110,610 | 10,665 |
| Airlines - 0.9% | | | |
| American Airlines Group, Inc. | | 3,506,300 | 124,474 |
| Wheels Up Partners Holdings LLC Series B unit (d)(f) | | 1,760,377 | 4,119 |
| | | | 128,593 |
| Commercial Services & Supplies - 0.3% | | | |
| Stericycle, Inc. (a) | | 404,300 | 36,496 |
| Electrical Equipment - 1.7% | | | |
| SolarCity Corp. (a)(c) | | 8,686,248 | 231,923 |
| Road & Rail - 0.0% | | | |
| J.B. Hunt Transport Services, Inc. | | 780 | 65 |
|
| TOTAL INDUSTRIALS | | | 407,742 |
|
| INFORMATION TECHNOLOGY - 46.9% | | | |
| Communications Equipment - 0.0% | | | |
| Cisco Systems, Inc. | | 98,400 | 3,004 |
| Electronic Equipment & Components - 0.3% | | | |
| Fitbit, Inc. (a)(b) | | 2,677,728 | 36,578 |
| Internet Software & Services - 16.7% | | | |
| 2U, Inc. (a)(b) | | 1,118,041 | 39,109 |
| Alphabet, Inc.: | | | |
| Class A | | 903,427 | 714,918 |
| Class C (a) | | 651,869 | 501,150 |
| Criteo SA sponsored ADR (a)(b)(c) | | 5,430,471 | 239,973 |
| Dropbox, Inc. (a)(d) | | 331,524 | 3,683 |
| Facebook, Inc. Class A (a) | | 3,536,538 | 438,319 |
| GoDaddy, Inc. (a) | | 1,557,300 | 46,594 |
| New Relic, Inc. (a)(b) | | 1,500,711 | 51,684 |
| Rackspace Hosting, Inc. (a) | | 4,862,230 | 113,922 |
| Shopify, Inc. Class A (a) | | 902,226 | 30,919 |
| Twilio, Inc. (b) | | 167,100 | 6,789 |
| Twilio, Inc. | | 351,811 | 12,865 |
| Wix.com Ltd. (a) | | 923,005 | 32,859 |
| | | | 2,232,784 |
| IT Services - 1.4% | | | |
| Cognizant Technology Solutions Corp. Class A (a) | | 2,118,300 | 121,781 |
| PayPal Holdings, Inc. (a) | | 1,462,800 | 54,475 |
| Sabre Corp. | | 136,900 | 3,991 |
| Square, Inc. (a)(b) | | 483,500 | 4,869 |
| | | | 185,116 |
| Semiconductors & Semiconductor Equipment - 7.0% | | | |
| Cirrus Logic, Inc. (a) | | 676,030 | 32,848 |
| Marvell Technology Group Ltd. | | 5,136,900 | 60,359 |
| Micron Technology, Inc. (a) | | 110,400 | 1,517 |
| NVIDIA Corp. | | 10,020,411 | 572,165 |
| NXP Semiconductors NV (a) | | 1,694,100 | 142,457 |
| Qorvo, Inc.(a) | | 1,070,000 | 67,656 |
| Qualcomm, Inc. | | 178,953 | 11,199 |
| SolarEdge Technologies, Inc. (a)(b)(c) | | 2,437,000 | 43,622 |
| | | | 931,823 |
| Software - 14.3% | | | |
| Activision Blizzard, Inc. | | 13,623,689 | 547,127 |
| Electronic Arts, Inc. (a) | | 481,200 | 36,725 |
| HubSpot, Inc. (a) | | 883,980 | 48,256 |
| Interactive Intelligence Group, Inc. (a) | | 211,287 | 11,399 |
| LINE Corp. sponsored ADR | | 31,555 | 1,159 |
| Microsoft Corp. | | 6,706,239 | 380,110 |
| Paylocity Holding Corp. (a)(b) | | 345,500 | 15,423 |
| Salesforce.com, Inc. (a) | | 2,509,020 | 205,238 |
| Tyler Technologies, Inc. (a) | | 208,400 | 33,973 |
| Ubisoft Entertainment SA (a)(c) | | 10,178,905 | 417,931 |
| Workday, Inc. Class A (a) | | 535,100 | 44,595 |
| Xero Ltd. (a)(b) | | 628,814 | 8,987 |
| Zendesk, Inc. (a)(c) | | 5,252,784 | 158,844 |
| | | | 1,909,767 |
| Technology Hardware, Storage & Peripherals - 7.2% | | | |
| Apple, Inc. | | 9,173,620 | 955,990 |
| Western Digital Corp. | | 42,961 | 2,041 |
| | | | 958,031 |
|
| TOTAL INFORMATION TECHNOLOGY | | | 6,257,103 |
|
| TOTAL COMMON STOCKS | | | |
| (Cost $9,583,282) | | | 12,908,904 |
|
| Convertible Preferred Stocks - 3.2% | | | |
| CONSUMER DISCRETIONARY - 0.4% | | | |
| Diversified Consumer Services - 0.0% | | | |
| Handy Technologies, Inc. Series C (d) | | 415,643 | 2,091 |
| Household Durables - 0.3% | | | |
| Roku, Inc.: | | | |
| Series F, 8.00% (a)(d) | | 16,562,507 | 28,322 |
| Series G, 8.00% (a)(d) | | 3,185,945 | 5,448 |
| Series H (d) | | 1,931,947 | 3,304 |
| | | | 37,074 |
| Internet & Catalog Retail - 0.0% | | | |
| One Kings Lane, Inc. Series E (a)(d) | | 648,635 | 428 |
| The Honest Co., Inc. Series D (d) | | 75,268 | 2,898 |
| | | | 3,326 |
| Media - 0.1% | | | |
| Turn, Inc. Series E (a)(d) | | 1,199,041 | 3,825 |
|
| TOTAL CONSUMER DISCRETIONARY | | | 46,316 |
|
| CONSUMER STAPLES - 0.1% | | | |
| Food & Staples Retailing - 0.1% | | | |
| Blue Apron, Inc. Series D (a)(d) | | 866,669 | 14,387 |
| FINANCIALS - 0.3% | | | |
| Real Estate Management & Development - 0.3% | | | |
| Redfin Corp. Series G (a)(d) | | 6,064,833 | 25,290 |
| WeWork Companies, Inc. Series E (a)(d) | | 269,198 | 13,512 |
| | | | 38,802 |
| HEALTH CARE - 0.4% | | | |
| Biotechnology - 0.2% | | | |
| 23andMe, Inc. Series E (a)(d) | | 1,817,170 | 17,245 |
| Jounce Therapeutics, Inc. Series B (a)(d) | | 2,212,389 | 7,655 |
| Ovid Therapeutics, Inc. Series B (d) | | 314,408 | 1,170 |
| | | | 26,070 |
| Health Care Providers & Services - 0.2% | | | |
| Mulberry Health, Inc. Series A8 (d) | | 4,342,250 | 31,656 |
|
| TOTAL HEALTH CARE | | | 57,726 |
|
| INDUSTRIALS - 0.1% | | | |
| Aerospace & Defense - 0.1% | | | |
| Space Exploration Technologies Corp. Series G (a)(d) | | 62,037 | 5,982 |
| Professional Services - 0.0% | | | |
| YourPeople, Inc. Series C (a)(d) | | 335,546 | 5,100 |
|
| TOTAL INDUSTRIALS | | | 11,082 |
|
| INFORMATION TECHNOLOGY - 1.9% | | | |
| Internet Software & Services - 1.2% | | | |
| Jet.Com, Inc. Series B1 (d) | | 4,896,249 | 42,769 |
| Pinterest, Inc. Series G, 8.00% (a)(d) | | 139,290 | 1,220 |
| Uber Technologies, Inc.: | | | |
| Series D, 8.00% (a)(d) | | 2,256,164 | 110,038 |
| Series E, 8.00% (a)(d) | | 150,072 | 7,319 |
| | | | 161,346 |
| IT Services - 0.2% | | | |
| AppNexus, Inc. Series E (a)(d) | | 1,416,796 | 24,397 |
| Nutanix, Inc. Series E (a)(d) | | 311,503 | 4,856 |
| | | | 29,253 |
| Software - 0.5% | | | |
| Bracket Computing, Inc. Series C (d) | | 1,877,241 | 6,345 |
| Cloudera, Inc. Series F (a)(d) | | 126,709 | 3,704 |
| Cloudflare, Inc. Series D (a)(d) | | 395,787 | 2,466 |
| Dataminr, Inc. Series D (a)(d) | | 2,219,446 | 14,287 |
| Delphix Corp. Series D (d) | | 427,177 | 2,307 |
| Snapchat, Inc. Series F (a)(d) | | 510,029 | 15,668 |
| Taboola.Com Ltd. Series E (a)(d) | | 1,918,392 | 21,524 |
| | | | 66,301 |
|
| TOTAL INFORMATION TECHNOLOGY | | | 256,900 |
|
| TELECOMMUNICATION SERVICES - 0.0% | | | |
| Wireless Telecommunication Services - 0.0% | | | |
| Altiostar Networks, Inc. Series D (a)(d) | | 1,220,504 | 5,956 |
| TOTAL CONVERTIBLE PREFERRED STOCKS | | | |
| (Cost $344,400) | | | 431,169 |
| | | Principal Amount (000s) | Value (000s) |
|
| Convertible Bonds - 0.0% | | | |
| CONSUMER DISCRETIONARY - 0.0% | | | |
| Media - 0.0% | | | |
| Turn, Inc. 1.48% 3/2/23(d) | | | |
| (Cost $373) | | 373 | 373 |
| | | Shares | Value (000s) |
|
| Money Market Funds - 2.7% | | | |
| Fidelity Cash Central Fund, 0.42% (g) | | 14,888,292 | 14,888 |
| Fidelity Securities Lending Cash Central Fund, 0.45% (g)(h) | | 340,289,278 | 340,289 |
| TOTAL MONEY MARKET FUNDS | | | |
| (Cost $355,177) | | | 355,177 |
| TOTAL INVESTMENT PORTFOLIO - 102.6% | | | |
| (Cost $10,283,232) | | | 13,695,623 |
| NET OTHER ASSETS (LIABILITIES) - (2.6)% | | | (341,867) |
| NET ASSETS - 100% | | | $13,353,756 |
Legend
(a) Non-income producing
(b) Security or a portion of the security is on loan at period end.
(c) Affiliated company
(d) Restricted securities - Investment in securities not registered under the Securities Act of 1933 (excluding 144A issues). At the end of the period, the value of restricted securities (excluding 144A issues) amounted to $451,511,000 or 3.4% of net assets.
(e) Security exempt from registration under Rule 144A of the Securities Act of 1933. These securities may be resold in transactions exempt from registration, normally to qualified institutional buyers. At the end of the period, the value of these securities amounted to $30,915,000 or 0.2% of net assets.
(f) Investment is owned by a wholly-owned subsidiary (Subsidiary) that is treated as a corporation for U.S. tax purposes.
(g) Affiliated fund that is generally available only to investment companies and other accounts managed by Fidelity Investments. The rate quoted is the annualized seven-day yield of the fund at period end. A complete unaudited listing of the fund's holdings as of its most recent quarter end is available upon request. In addition, each Fidelity Central Fund's financial statements, which are not covered by the Fund's Report of Independent Registered Public Accounting Firm, are available on the SEC's website or upon request.
(h) Investment made with cash collateral received from securities on loan.
Additional information on each restricted holding is as follows:
| Security | Acquisition Date | Acquisition Cost (000s) |
| 23andMe, Inc. Series E | 6/18/15 | $19,675 |
| Altiostar Networks, Inc. Series D | 1/7/15 | $15,000 |
| AppNexus, Inc. Series E | 8/1/14 - 9/17/14 | $28,382 |
| Blue Apron, Inc. Series D | 5/18/15 | $11,550 |
| Bracket Computing, Inc. Series C | 9/9/15 | $14,766 |
| Cloudera, Inc. Series F | 2/5/14 | $1,845 |
| Cloudflare, Inc. Series D | 11/5/14 | $2,424 |
| Dataminr, Inc. Series D | 2/18/15 - 3/6/15 | $28,298 |
| Delphix Corp. Series D | 7/10/15 | $3,845 |
| Dropbox, Inc. | 5/2/12 | $3,000 |
| Handy Technologies, Inc. Series C | 10/14/15 | $2,436 |
| Jet.Com, Inc. Series B1 | 11/24/15 | $24,422 |
| Jounce Therapeutics, Inc. Series B | 4/17/15 | $5,000 |
| Mulberry Health, Inc. Series A8 | 1/20/16 | $29,331 |
| Nutanix, Inc. Series E | 8/26/14 | $4,173 |
| One Kings Lane, Inc. Series E | 1/29/14 | $429 |
| Ovid Therapeutics, Inc. Series B | 8/10/15 | $1,959 |
| Pinterest, Inc. Series G, 8.00% | 2/27/15 | $1,000 |
| Redfin Corp. Series G | 12/16/14 | $20,000 |
| Roku, Inc. Series F, 8.00% | 5/7/13 | $15,000 |
| Roku, Inc. Series G, 8.00% | 10/1/14 | $4,140 |
| Roku, Inc. Series H | 11/9/15 | $2,954 |
| Snapchat, Inc. Series F | 3/25/15 - 2/12/16 | $15,668 |
| Space Exploration Technologies Corp. Class A | 10/16/15 | $9,844 |
| Space Exploration Technologies Corp. Series G | 1/20/15 | $4,805 |
| Taboola.Com Ltd. Series E | 12/22/14 | $20,000 |
| The Honest Co., Inc. Series D | 8/3/15 | $3,444 |
| Turn, Inc. Series E | 12/30/13 | $10,000 |
| Turn, Inc. 1.48% 3/2/23 | 3/2/16 | $373 |
| Uber Technologies, Inc. Series D, 8.00% | 6/6/14 | $35,000 |
| Uber Technologies, Inc. Series E, 8.00% | 12/5/14 | $5,000 |
| WeWork Companies, Inc. Class A | 6/23/15 | $984 |
| WeWork Companies, Inc. Series E | 6/23/15 | $8,854 |
| Wheels Up Partners Holdings LLC Series B unit | 9/18/15 | $5,000 |
| YourPeople, Inc. Series C | 5/1/15 | $5,000 |
Affiliated Central Funds
Information regarding fiscal year to date income earned by the Fund from investments in Fidelity Central Funds is as follows:
| Fund | Income earned |
| | (Amounts in thousands) |
| Fidelity Cash Central Fund | $46 |
| Fidelity Securities Lending Cash Central Fund | 28,604 |
| Total | $28,650 |
Other Affiliated Issuers
An affiliated company is a company in which the Fund has ownership of at least 5% of the voting securities. Fiscal year to date transactions with companies which are or were affiliates are as follows:
| Affiliate (Amounts in thousands) | Value, beginning of period | Purchases | Sales Proceeds* | Dividend Income | Value, end of period |
| Accretive Health, Inc. | $18,789 | $-- | $703 | $-- | $13,855 |
| athenahealth, Inc. | 327,395 | 13,283 | 3,192 | -- | 307,972 |
| Bellicum Pharmaceuticals, Inc. | 20,012 | 27,012 | 12,571 | -- | 37,030 |
| Criteo SA sponsored ADR | 291,470 | -- | 1,762 | -- | 239,973 |
| Endo International PLC | -- | 285,775 | -- | -- | 311,079 |
| GameLoft SE | 36,312 | -- | 68,556 | -- | -- |
| Groupon, Inc. Class A | 317,266 | -- | 12,726 | -- | 300,812 |
| Lion Biotechnologies, Inc. | 25,788 | -- | 747 | -- | -- |
| Portola Pharmaceuticals, Inc. | 140,217 | 4,896 | 57,458 | -- | -- |
| SolarCity Corp. | 89,259 | 232,675 | 11,228 | -- | 231,923 |
| SolarEdge Technologies, Inc. | -- | 63,165 | -- | -- | 43,622 |
| Synchronoss Technologies, Inc. | 127,356 | 3,746 | 110,002 | -- | -- |
| Trevena, Inc. | 19,522 | -- | 310 | -- | 20,857 |
| Ubisoft Entertainment SA | 204,478 | -- | 9,994 | -- | 417,931 |
| Zendesk, Inc. | 106,272 | 3,035 | 989 | -- | 158,844 |
| Total | $1,724,136 | $633,587 | $290,238 | $-- | $2,083,898 |
* Includes the value of securities delivered through in-kind transactions, if applicable.
Investment Valuation
The following is a summary of the inputs used, as of July 31, 2016, involving the Fund's assets and liabilities carried at fair value. The inputs or methodology used for valuing securities may not be an indication of the risk associated with investing in those securities. For more information on valuation inputs, and their aggregation into the levels used below, please refer to the Investment Valuation section in the accompanying Notes to Financial Statements.
| | Valuation Inputs at Reporting Date: |
| Description | Total | Level 1 | Level 2 | Level 3 |
| (Amounts in thousands) | | | | |
| Investments in Securities: | | | | |
| Equities: | | | | |
| Consumer Discretionary | $2,558,306 | $2,511,990 | $-- | $46,316 |
| Consumer Staples | 468,248 | 453,861 | -- | 14,387 |
| Energy | 89,293 | 89,293 | -- | -- |
| Financials | 620,270 | 579,967 | -- | 40,303 |
| Health Care | 2,665,173 | 2,598,526 | 8,921 | 57,726 |
| Industrials | 418,824 | 392,958 | -- | 25,866 |
| Information Technology | 6,514,003 | 6,240,555 | 12,865 | 260,583 |
| Telecommunication Services | 5,956 | -- | -- | 5,956 |
| Corporate Bonds | 373 | -- | -- | 373 |
| Money Market Funds | 355,177 | 355,177 | -- | -- |
| Total Investments in Securities: | $13,695,623 | $13,222,327 | $21,786 | $451,510 |
The following is a reconciliation of Investments in Securities for which Level 3 inputs were used in determining value:
| (Amounts in thousands) | |
| Investments in Securities: | |
| Equities - Information Technology | |
| Beginning Balance | $203,955 |
| Net Realized Gain (Loss) on Investment Securities | -- |
| Net Unrealized Gain (Loss) on Investment Securities | 8,033 |
| Cost of Purchases | 53,856 |
| Proceeds of Sales | (5,261) |
| Amortization/Accretion | -- |
| Transfers into Level 3 | -- |
| Transfers out of Level 3 | -- |
| Ending Balance | $260,583 |
| The change in unrealized gain (loss) for the period attributable to Level 3 securities held at July 31, 2016 | $10,130 |
| Other Investments in Securities | |
| Beginning Balance | $133,963 |
| Net Realized Gain (Loss) on Investment Securities | (9,169) |
| Net Unrealized Gain (Loss) on Investment Securities | 15,556 |
| Cost of Purchases | 55,771 |
| Proceeds of Sales | (5,194) |
| Amortization/Accretion | -- |
| Transfers into Level 3 | -- |
| Transfers out of Level 3 | -- |
| Ending Balance | $190,927 |
| The change in unrealized gain (loss) for the period attributable to Level 3 securities held at July 31, 2016 | $15,538 |
The information used in the above reconciliations represents fiscal year to date activity for any Investments in Securities identified as using Level 3 inputs at either the beginning or the end of the current fiscal period. Transfers in or out of Level 3 represent the beginning value of any Security or Instrument where a change in the pricing level occurred from the beginning to the end of the period. The cost of purchases and the proceeds of sales may include securities received or delivered through corporate actions or exchanges. Realized and unrealized gains (losses) disclosed in the reconciliations are included in Net Gain (Loss) on the Fund's Statement of Operations.
Other Information
Distribution of investments by country or territory of incorporation, as a percentage of Total Net Assets, is as follows (Unaudited):
| United States of America | 86.8% |
| France | 5.0% |
| Ireland | 3.5% |
| Netherlands | 1.2% |
| Canada | 1.0% |
| Others (Individually Less Than 1%) | 2.5% |
| | 100.0% |
See accompanying notes which are an integral part of the financial statements.
Financial Statements
Statement of Assets and Liabilities
| Amounts in thousands (except per-share amounts) | | July 31, 2016 |
| Assets | | |
Investment in securities, at value (including securities loaned of $330,576) — See accompanying schedule:
Unaffiliated issuers (cost $8,019,372) | $11,256,548 | |
| Fidelity Central Funds (cost $355,177) | 355,177 | |
| Other affiliated issuers (cost $1,908,683) | 2,083,898 | |
| Total Investments (cost $10,283,232) | | $13,695,623 |
| Receivable for investments sold | | 58,828 |
| Receivable for fund shares sold | | 16,630 |
| Dividends receivable | | 338 |
| Interest receivable | | 2 |
| Distributions receivable from Fidelity Central Funds | | 689 |
| Other receivables | | 298 |
| Total assets | | 13,772,408 |
| Liabilities | | |
| Payable to custodian bank | $1,690 | |
| Payable for investments purchased | 53,943 | |
| Payable for fund shares redeemed | 14,579 | |
| Accrued management fee | 6,442 | |
| Other affiliated payables | 1,505 | |
| Other payables and accrued expenses | 204 | |
| Collateral on securities loaned, at value | 340,289 | |
| Total liabilities | | 418,652 |
| Net Assets | | $13,353,756 |
| Net Assets consist of: | | |
| Paid in capital | | $9,996,193 |
| Accumulated net investment loss | | (5,835) |
| Accumulated undistributed net realized gain (loss) on investments and foreign currency transactions | | (48,961) |
| Net unrealized appreciation (depreciation) on investments and assets and liabilities in foreign currencies | | 3,412,359 |
| Net Assets | | $13,353,756 |
| OTC: | | |
| Net Asset Value, offering price and redemption price per share ($9,845,460 ÷ 115,479 shares) | | $85.26 |
| Class K: | | |
| Net Asset Value, offering price and redemption price per share ($3,508,296 ÷ 40,691 shares) | | $86.22 |
See accompanying notes which are an integral part of the financial statements.
Statement of Operations
| Amounts in thousands | | Year ended July 31, 2016 |
| Investment Income | | |
| Dividends | | $76,464 |
| Interest | | 2 |
| Income from Fidelity Central Funds (including $28,604 from security lending) | | 28,650 |
| Total income | | 105,116 |
| Expenses | | |
| Management fee | | |
| Basic fee | $75,511 | |
| Performance adjustment | 15,828 | |
| Transfer agent fees | 16,566 | |
| Accounting and security lending fees | 1,532 | |
| Custodian fees and expenses | 318 | |
| Independent trustees' fees and expenses | 56 | |
| Registration fees | 224 | |
| Audit | 96 | |
| Legal | 45 | |
| Interest | 36 | |
| Miscellaneous | 99 | |
| Total expenses before reductions | 110,311 | |
| Expense reductions | (559) | 109,752 |
| Net investment income (loss) | | (4,636) |
| Realized and Unrealized Gain (Loss) | | |
| Net realized gain (loss) on: | | |
| Investment securities: | | |
| Unaffiliated issuers | 119,969 | |
| Other affiliated issuers | 39,805 | |
| Foreign currency transactions | 29 | |
| Total net realized gain (loss) | | 159,803 |
Change in net unrealized appreciation (depreciation) on:
Investment securities | 263,020 | |
| Assets and liabilities in foreign currencies | (1) | |
| Total change in net unrealized appreciation (depreciation) | | 263,019 |
| Net gain (loss) | | 422,822 |
| Net increase (decrease) in net assets resulting from operations | | $418,186 |
See accompanying notes which are an integral part of the financial statements.
Statement of Changes in Net Assets
| Amounts in thousands | Year ended July 31, 2016 | Year ended July 31, 2015 |
| Increase (Decrease) in Net Assets | | |
| Operations | | |
| Net investment income (loss) | $(4,636) | $(11,952) |
| Net realized gain (loss) | 159,803 | 1,282,162 |
| Change in net unrealized appreciation (depreciation) | 263,019 | 1,068,362 |
| Net increase (decrease) in net assets resulting from operations | 418,186 | 2,338,572 |
| Distributions to shareholders from net realized gain | (704,905) | (1,408,892) |
| Share transactions - net increase (decrease) | 93,627 | 1,841,344 |
| Total increase (decrease) in net assets | (193,092) | 2,771,024 |
| Net Assets | | |
| Beginning of period | 13,546,848 | 10,775,824 |
| End of period | $13,353,756 | $13,546,848 |
| Other Information | | |
| Accumulated net investment loss end of period | $(5,835) | $(135) |
See accompanying notes which are an integral part of the financial statements.
Financial Highlights — Fidelity OTC Portfolio
| Years ended July 31, | 2016 | 2015 | 2014 | 2013 | 2012 |
| Selected Per–Share Data | | | | | |
| Net asset value, beginning of period | $86.98 | $81.23 | $78.98 | $57.53 | $59.28 |
| Income from Investment Operations | | | | | |
| Net investment income (loss)A | (.05) | (.11) | (.06) | .36B | (.08)C |
| Net realized and unrealized gain (loss) | 2.84 | 16.14 | 12.78 | 21.37 | (1.67) |
| Total from investment operations | 2.79 | 16.03 | 12.72 | 21.73 | (1.75) |
| Distributions from net investment income | – | – | (.05) | (.28) | – |
| Distributions from net realized gain | (4.51) | (10.28) | (10.42) | – | – |
| Total distributions | (4.51) | (10.28) | (10.47) | (.28) | – |
| Net asset value, end of period | $85.26 | $86.98 | $81.23 | $78.98 | $57.53 |
| Total ReturnD | 3.68% | 21.34% | 17.96% | 37.93% | (2.95)% |
| Ratios to Average Net AssetsE,F | | | | | |
| Expenses before reductions | .91% | .83% | .77% | .76% | .91% |
| Expenses net of fee waivers, if any | .91% | .83% | .77% | .76% | .91% |
| Expenses net of all reductions | .90% | .83% | .76% | .74% | .90% |
| Net investment income (loss) | (.07)% | (.13)% | (.08)% | .55%B | (.14)%C |
| Supplemental Data | | | | | |
| Net assets, end of period (in millions) | $9,845 | $9,710 | $7,870 | $6,693 | $5,499 |
| Portfolio turnover rateG | 56%H | 66%H | 106% | 116% | 149% |
A Calculated based on average shares outstanding during the period.
B Net Investment income per share reflects a large, non-recurring dividend which amounted to $.10 per share. Excluding this non-recurring dividend, the ratio of net investment income (loss) to average net assets would have been .40%.
C Net Investment income per share reflects a large, non-recurring dividend which amounted to $.03 per share. Excluding this non-recurring dividend, the ratio of net investment income (loss) to average net assets would have been (.20)%.
D Total returns would have been lower if certain expenses had not been reduced during the applicable periods shown.
E Fees and expenses of any underlying Fidelity Central Funds are not included in the Fund's expense ratio. The Fund indirectly bears its proportionate share of the expenses of any underlying Fidelity Central Funds.
F Expense ratios reflect operating expenses of the class. Expenses before reductions do not reflect amounts reimbursed by the investment adviser or reductions from brokerage service arrangements or reductions from other expense offset arrangements and do not represent the amount paid by the class during periods when reimbursements or reductions occur. Expenses net of fee waivers reflect expenses after reimbursement by the investment adviser but prior to reductions from brokerage service arrangements or other expense offset arrangements. Expenses net of all reductions represent the net expenses paid by the class.
G Amount does not include the portfolio activity of any underlying Fidelity Central Funds.
H Portfolio turnover rate excludes securities received or delivered in-kind.
See accompanying notes which are an integral part of the financial statements.
Financial Highlights — Fidelity OTC Portfolio Class K
| Years ended July 31, | 2016 | 2015 | 2014 | 2013 | 2012 |
| Selected Per–Share Data | | | | | |
| Net asset value, beginning of period | $87.87 | $81.96 | $79.60 | $57.94 | $59.61 |
| Income from Investment Operations | | | | | |
| Net investment income (loss)A | .04 | (.01) | .04 | .45B | –C,D |
| Net realized and unrealized gain (loss) | 2.88 | 16.29 | 12.87 | 21.53 | (1.67) |
| Total from investment operations | 2.92 | 16.28 | 12.91 | 21.98 | (1.67) |
| Distributions from net investment income | – | – | (.10) | (.32) | – |
| Distributions from net realized gain | (4.57) | (10.37) | (10.46) | – | – |
| Total distributions | (4.57) | (10.37) | (10.55)E | (.32) | – |
| Net asset value, end of period | $86.22 | $87.87 | $81.96 | $79.60 | $57.94 |
| Total ReturnF | 3.80% | 21.49% | 18.10% | 38.11% | (2.80)% |
| Ratios to Average Net AssetsG,H | | | | | |
| Expenses before reductions | .79% | .72% | .65% | .62% | .77% |
| Expenses net of fee waivers, if any | .79% | .72% | .65% | .62% | .77% |
| Expenses net of all reductions | .79% | .71% | .64% | .60% | .76% |
| Net investment income (loss) | .05% | (.02)% | .05% | .69%B | - %C,I |
| Supplemental Data | | | | | |
| Net assets, end of period (in millions) | $3,508 | $3,836 | $2,906 | $2,260 | $1,644 |
| Portfolio turnover rateJ | 56%K | 66%K | 106% | 116% | 149% |
A Calculated based on average shares outstanding during the period.
B Net Investment income per share reflects a large, non-recurring dividend which amounted to $.10 per share. Excluding this non-recurring dividend, the ratio of net investment income (loss) to average net assets would have been .53%.
C Net Investment income per share reflects a large, non-recurring dividend which amounted to $.03 per share. Excluding this non-recurring dividend, the ratio of net investment income (loss) to average net assets would have been (.06)%.
D Amount represents less than $.005 per share.
E Total distributions of $10.55 per share is comprised of distributions from net investment income of $.098 and distributions from net realized gain of $10.456 per share.
F Total returns would have been lower if certain expenses had not been reduced during the applicable periods shown.
G Fees and expenses of any underlying Fidelity Central Funds are not included in the Fund's expense ratio. The Fund indirectly bears its proportionate share of the expenses of any underlying Fidelity Central Funds.
H Expense ratios reflect operating expenses of the class. Expenses before reductions do not reflect amounts reimbursed by the investment adviser or reductions from brokerage service arrangements or reductions from other expense offset arrangements and do not represent the amount paid by the class during periods when reimbursements or reductions occur. Expenses net of fee waivers reflect expenses after reimbursement by the investment adviser but prior to reductions from brokerage service arrangements or other expense offset arrangements. Expenses net of all reductions represent the net expenses paid by the class.
I Amount represents less than .005%.
J Amount does not include the portfolio activity of any underlying Fidelity Central Funds.
K Portfolio turnover rate excludes securities received or delivered in-kind.
See accompanying notes which are an integral part of the financial statements.
Notes to Financial Statements
For the period ended July 31, 2016
(Amounts in thousands except percentages)
1. Organization.
Fidelity OTC Portfolio (the Fund) is a non-diversified fund of Fidelity Securities Fund (the Trust) and is authorized to issue an unlimited number of shares. The Trust is registered under the Investment Company Act of 1940, as amended (the 1940 Act), as an open-end management investment company organized as a Massachusetts business trust. The Fund offers OTC and Class K shares, each of which has equal rights as to assets and voting privileges. Each class has exclusive voting rights with respect to matters that affect that class.
2. Investments in Fidelity Central Funds.
The Fund invests in Fidelity Central Funds, which are open-end investment companies generally available only to other investment companies and accounts managed by the investment adviser and its affiliates. The Fund's Schedule of Investments lists each of the Fidelity Central Funds held as of period end, if any, as an investment of the Fund, but does not include the underlying holdings of each Fidelity Central Fund. As an Investing Fund, the Fund indirectly bears its proportionate share of the expenses of the underlying Fidelity Central Funds.
The Money Market Central Funds seek preservation of capital and current income and are managed by Fidelity Investments Money Management, Inc. (FIMM), an affiliate of the investment adviser. Annualized expenses of the Money Market Central Funds as of their most recent shareholder report date are less than .005%.
A complete unaudited list of holdings for each Fidelity Central Fund is available upon request or at the Securities and Exchange Commission (the SEC) website at www.sec.gov. In addition, the financial statements of the Fidelity Central Funds, which are not covered by the Fund's Report of Independent Registered Public Accounting Firm, are available on the SEC website or upon request.
3. Significant Accounting Policies.
The financial statements have been prepared in conformity with accounting principles generally accepted in the United States of America (GAAP), which require management to make certain estimates and assumptions at the date of the financial statements. Actual results could differ from those estimates. Subsequent events, if any, through the date that the financial statements were issued have been evaluated in the preparation of the financial statements. The following summarizes the significant accounting policies of the Fund:
Investment Valuation. Investments are valued as of 4:00 p.m. Eastern time on the last calendar day of the period. The Board of Trustees (the Board) has delegated the day to day responsibility for the valuation of the Fund's investments to the Fidelity Management & Research Company (FMR) Fair Value Committee (the Committee). In accordance with valuation policies and procedures approved by the Board, the Fund attempts to obtain prices from one or more third party pricing vendors or brokers to value its investments. When current market prices, quotations or currency exchange rates are not readily available or reliable, investments will be fair valued in good faith by the Committee, in accordance with procedures adopted by the Board. Factors used in determining fair value vary by investment type and may include market or investment specific events, changes in interest rates and credit quality. The frequency with which these procedures are used cannot be predicted and they may be utilized to a significant extent. The Committee oversees the Fund's valuation policies and procedures and reports to the Board on the Committee's activities and fair value determinations. The Board monitors the appropriateness of the procedures used in valuing the Fund's investments and ratifies the fair value determinations of the Committee.
The Fund categorizes the inputs to valuation techniques used to value its investments into a disclosure hierarchy consisting of three levels as shown below:
- Level 1 – quoted prices in active markets for identical investments
- Level 2 – other significant observable inputs (including quoted prices for similar investments, interest rates, prepayment speeds, etc.)
- Level 3 – unobservable inputs (including the Fund's own assumptions based on the best information available)
Valuation techniques used to value the Fund's investments by major category are as follows:
Equity securities, including restricted securities, for which market quotations are readily available, are valued at the last reported sale price or official closing price as reported by a third party pricing vendor on the primary market or exchange on which they are traded and are categorized as Level 1 in the hierarchy. In the event there were no sales during the day or closing prices are not available, securities are valued at the last quoted bid price or may be valued using the last available price and are generally categorized as Level 2 in the hierarchy. For foreign equity securities, when market or security specific events arise, comparisons to the valuation of American Depositary Receipts (ADRs), futures contracts, Exchange-Traded Funds (ETFs) and certain indexes as well as quoted prices for similar securities may be used and would be categorized as Level 2 in the hierarchy. Utilizing these techniques may result in transfers between Level 1 and Level 2. For equity securities, including restricted securities, where observable inputs are limited, assumptions about market activity and risk are used and these securities may be categorized as Level 3 in the hierarchy. Equity securities, including restricted securities, for which observable inputs are not available are valued using alternate valuation approaches, including the market approach and the income approach and are categorized as Level 3 in the hierarchy. The market approach generally consists of using comparable market transactions while the income approach generally consists of using the net present value of estimated future cash flows, adjusted as appropriate for liquidity, credit, market and/or other risk factors.
Debt securities, including restricted securities, are valued based on evaluated prices received from third party pricing vendors or from brokers who make markets in such securities. Corporate bonds are valued by pricing vendors who utilize matrix pricing which considers yield or price of bonds of comparable quality, coupon, maturity and type or by broker-supplied prices. When independent prices are unavailable or unreliable, debt securities may be valued utilizing pricing methodologies which consider similar factors that would be used by third party pricing vendors. Debt securities are generally categorized as Level 2 in the hierarchy but may be Level 3 depending on the circumstances.
Investments in open-end mutual funds, including the Fidelity Central Funds, are valued at their closing net asset value (NAV) each business day and are categorized as Level 1 in the hierarchy.
The following provides information on Level 3 securities held by the Fund that were valued at period end based on unobservable inputs. These amounts exclude valuations provided by a broker.
| Asset Type | Fair Value at 07/31/16 (000s) | Valuation Technique(s) | Unobservable Input | Amount or Range/Weighted Average | Impact to Valuation from an Increase in Input(a) |
| Corporate Bonds | $ 373 | Market approach | Transaction price | $100 | Increase |
| Equities | $ 451,137 | Discounted cash flow | Discount rate | 8.0% - 20.0% / 16.1% | Decrease |
| | | | Weighted average cost of capital (WACC) | 11.6% - 40.0% / 15.3% | Decrease |
| | | | Discount for lack of marketability | 20.0% - 25.0% / 23.0% | Decrease |
| | | | Growth rate | 2.5% - 3.0% / 2.7% | Increase |
| | | Market approach | Acquisition terms | $0.66- $8.74 / $8.65 | Increase |
| | | | Transaction price | $3.46 - $96.42 / $49.55 | Increase |
| | | | Proxy based discount | 40.3% | Decrease |
| | | Market comparable | Enterprise value/Sales multiple (EV/S) | 0.6 - 15.6 / 3.3 | Increase |
| | | | Discount rate | 0.9% - 50.0% / 13.3% | Decrease |
| | | | Price/Earnings multiple (P/E) | 9.1 | Increase |
| | | | Discount for lack of marketability | 10.0% - 25.0% / 16.2% | Decrease |
| | | | Growth rate | 3.0% | Increase |
| | | | Enterprise value/Gross profit multiple (EV/GP) | 4.8 | Increase |
| | | | Premium rate | 4.0% - 235.0% / 27.2% | Increase |
| | | Recovery value | Liquidation preference | $8.34 - $23.41 / $18.47 | Increase |
(a) Represents the expected directional change in the fair value of the Level 3 investments that would result from an increase in the corresponding input. A decrease to the unobservable input would have the opposite effect. Significant changes in these inputs could result in significantly higher or lower fair value measurements.
Changes in valuation techniques may result in transfers in or out of an assigned level within the disclosure hierarchy. The aggregate value of investments by input level as of July 31, 2016, as well as a roll forward of Level 3 investments, is included at the end of the Fund's Schedule of Investments.
Foreign Currency. The Fund may use foreign currency contracts to facilitate transactions in foreign-denominated securities. Gains and losses from these transactions may arise from changes in the value of the foreign currency or if the counterparties do not perform under the contracts' terms.
Foreign-denominated assets, including investment securities, and liabilities are translated into U.S. dollars at the exchange rates at period end. Purchases and sales of investment securities, income and dividends received and expenses denominated in foreign currencies are translated into U.S. dollars at the exchange rate in effect on the transaction date.
The effects of exchange rate fluctuations on investments are included with the net realized and unrealized gain (loss) on investment securities. Other foreign currency transactions resulting in realized and unrealized gain (loss) are disclosed separately.
Investment Transactions and Income. For financial reporting purposes, the Fund's investment holdings and NAV include trades executed through the end of the last business day of the period. The NAV per share for processing shareholder transactions is calculated as of the close of business of the New York Stock Exchange (NYSE), normally 4:00 p.m. Eastern time and includes trades executed through the end of the prior business day. Gains and losses on securities sold are determined on the basis of identified cost and may include proceeds received from litigation. Dividend income is recorded on the ex-dividend date, except for certain dividends from foreign securities where the ex-dividend date may have passed, which are recorded as soon as the Fund is informed of the ex-dividend date. Non-cash dividends included in dividend income, if any, are recorded at the fair market value of the securities received. Income and capital gain distributions from Fidelity Central Funds, if any, are recorded on the ex-dividend date. Distributions received on securities that represent a return of capital or capital gain are recorded as a reduction of cost of investments and/or as a realized gain. Subsequent to ex-dividend date the Fund determines the components of these distributions, based upon receipt of tax filings or other correspondence relating to the underlying investment. Interest income is accrued as earned and includes coupon interest and amortization of premium and accretion of discount on debt securities as applicable. Investment income is recorded net of foreign taxes withheld where recovery of such taxes is uncertain.
Class Allocations and Expenses. Investment income, realized and unrealized capital gains and losses, common expenses of the Fund, and certain fund-level expense reductions, if any, are allocated daily on a pro-rata basis to each class based on the relative net assets of each class to the total net assets of the Fund. Each class differs with respect to transfer agent fees incurred. Certain expense reductions may also differ by class. For the reporting period, the allocated portion of income and expenses to each class as a percent of its average net assets may vary due to the timing of recording these transactions in relation to fluctuating net assets of the classes. Expenses directly attributable to a fund are charged to that fund. Expenses attributable to more than one fund are allocated among the respective funds on the basis of relative net assets or other appropriate methods. Expense estimates are accrued in the period to which they relate and adjustments are made when actual amounts are known.
Deferred Trustee Compensation. Under a Deferred Compensation Plan (the Plan), independent Trustees may elect to defer receipt of a portion of their annual compensation. Deferred amounts are invested in a cross-section of Fidelity funds, are marked-to-market and remain in the Fund until distributed in accordance with the Plan. The investment of deferred amounts and the offsetting payable to the Trustees are included in the accompanying Statement of Assets and Liabilities.
Income Tax Information and Distributions to Shareholders. Each year, the Fund intends to qualify as a regulated investment company under Subchapter M of the Internal Revenue Code, including distributing substantially all of its taxable income and realized gains. As a result, no provision for U.S. Federal income taxes is required. As of July 31, 2016, the Fund did not have any unrecognized tax benefits in the financial statements; nor is the Fund aware of any tax positions for which it is reasonably possible that the total amounts of unrecognized tax benefits will significantly change in the next twelve months. The Fund files a U.S. federal tax return, in addition to state and local tax returns as required. The Fund's federal income tax returns are subject to examination by the Internal Revenue Service (IRS) for a period of three fiscal years after they are filed. State and local tax returns may be subject to examination for an additional fiscal year depending on the jurisdiction. Foreign taxes are provided for based on the Fund's understanding of the tax rules and rates that exist in the foreign markets in which it invests.
Distributions are declared and recorded on the ex-dividend date. Income dividends and capital gain distributions are declared separately for each class. Income and capital gain distributions are determined in accordance with income tax regulations, which may differ from GAAP. In addition, the Fund claimed a portion of the payment made to redeeming shareholders as a distribution for income tax purposes.
Capital accounts within the financial statements are adjusted for permanent book-tax differences. These adjustments have no impact on net assets or the results of operations. Capital accounts are not adjusted for temporary book-tax differences which will reverse in a subsequent period.
Book-tax differences are primarily due to redemptions in-kind, foreign currency transactions, passive foreign investment companies (PFIC), partnerships, deferred trustees compensation and losses deferred due to wash sales and excise tax regulations.
The federal tax cost of investment securities and unrealized appreciation (depreciation) as of period end were as follows:
| Gross unrealized appreciation | $4,383,043 |
| Gross unrealized depreciation | (1,019,613) |
| Net unrealized appreciation (depreciation) on securities | $3,363,430 |
| Tax Cost | $10,332,193 |
The tax-based components of distributable earnings as of period end were as follows:
| Net unrealized appreciation (depreciation) on securities and other investments | $3,363,398 |
The Fund intends to elect to defer to its next fiscal year $5,717 of ordinary losses recognized during the period January 1, 2016 to July 31, 2016.
The tax character of distributions paid was as follows:
| | July 31, 2016 | July 31, 2015 |
| Ordinary Income | $274,436 | $ 637,244 |
| Long-term Capital Gains | 430,469 | 771,648 |
| Total | $704,905 | $ 1,408,892 |
Restricted Securities. The Fund may invest in securities that are subject to legal or contractual restrictions on resale. These securities generally may be resold in transactions exempt from registration or to the public if the securities are registered. Disposal of these securities may involve time-consuming negotiations and expense, and prompt sale at an acceptable price may be difficult. Information regarding restricted securities is included at the end of the Fund's Schedule of Investments.
Consolidated Subsidiary. The Fund invests in certain investments through a wholly-owned subsidiary ("Subsidiary"), which may be subject to federal and state taxes upon disposition.
At period end, investments held through this Subsidiary were $4,119 representing 0.03% of the Fund's net assets. The financial statements have been consolidated and include accounts of the Fund and each Subsidiary. Accordingly, all inter-company transactions and balances have been eliminated.
4. Purchases and Sales of Investments.
Purchases and sales of securities, other than short-term securities and in-kind transactions, aggregated $7,148,000 and $7,557,829, respectively.
Redemptions In-Kind. During the period, 1,292 shares of the Fund held by an unaffiliated entity were redeemed in-kind for cash and investments with a value of $104,098. The net realized gain of $41,724 on investments delivered through the in-kind redemptions is included in the accompanying Statement of Operations. The amount of in-kind redemptions is included in share transactions in the accompanying Statement of Changes in Net Assets as well as Note 11: Share Transactions. The Fund recognized no gain or loss for federal income tax purposes.
Prior Fiscal Year Redemptions In-Kind. During the prior period, 2,605 shares of the Fund held by unaffiliated entities were redeemed for cash and investments with a value of $225,764. The Fund had a net realized gain of $95,853 on investments delivered through the in-kind redemptions. The amount of in-kind redemptions is included in share transactions in the accompanying Statement of Changes in Net Assets as well as Note 11: Share Transactions. The Fund recognized no gain or loss for federal income tax purposes.
5. Fees and Other Transactions with Affiliates.
Management Fee. Fidelity Management & Research Company (the investment adviser) and its affiliates provide the Fund with investment management related services for which the Fund pays a monthly management fee. The management fee is the sum of an individual fund fee rate that is based on an annual rate of .35% of the Fund's average net assets and an annualized group fee rate that averaged .25% during the period. The group fee rate is based upon the average net assets of all the mutual funds advised by the investment adviser, including any mutual funds previously advised by the investment adviser that are currently advised by Fidelity SelectCo, LLC, an affiliate of the investment adviser. The group fee rate decreases as assets under management increase and increases as assets under management decrease. In addition, the management fee is subject to a performance adjustment (up to a maximum of +/- .20% of the Fund's average net assets over a 36 month performance period). The upward or downward adjustment to the management fee is based on the relative investment performance of OTC as compared to its benchmark index, the Nasdaq Composite Index, over the same 36 month performance period. For the reporting period, the total annual management fee rate, including the performance adjustment, was .72% of the Fund's average net assets. The performance adjustment included in the management fee rate may be higher or lower than the maximum performance adjustment rate due to the difference between the average net assets for the reporting and performance periods.
Transfer Agent Fees. Fidelity Investments Institutional Operations Company, Inc., (FIIOC), an affiliate of the investment adviser, is the transfer, dividend disbursing and shareholder servicing agent for each class of the Fund. FIIOC receives account fees and asset-based fees that vary according to the account size and type of account of the shareholders of OTC. FIIOC receives an asset-based fee of Class K's average net assets. FIIOC pays for typesetting, printing and mailing of shareholder reports, except proxy statements.
For the period, transfer agent fees for each class were as follows:
| | Amount | % of
Class-Level Average
Net Assets |
| OTC | $14,944 | .16 |
| Class K | 1,622 | .05 |
| | $ 16,566 | |
Accounting and Security Lending Fees. Fidelity Service Company, Inc. (FSC), an affiliate of the investment adviser, maintains the Fund's accounting records. The accounting fee is based on the level of average net assets for each month. Under a separate contract, FSC administers the security lending program. The security lending fee is based on the number and duration of lending transactions.
Brokerage Commissions. The Fund placed a portion of its portfolio transactions with brokerage firms which are affiliates of the investment adviser. Brokerage commissions are included in net realized gain (loss) and change in net unrealized appreciation (depreciation) in the Statement of Operations. The commissions paid to these affiliated firms were $201 for the period.
Interfund Lending Program. Pursuant to an Exemptive Order issued by the SEC, the Fund, along with other registered investment companies having management contracts with FMR or other affiliated entities of FMR, may participate in an interfund lending program. This program provides an alternative credit facility allowing the funds to borrow from, or lend money to, other participating affiliated funds. At period end, there were no interfund loans outstanding. The Fund's activity in this program during the period for which loans were outstanding was as follows:
| Borrower or Lender | Average Loan Balance | Weighted Average Interest Rate | Interest Expense |
| Borrower | $16,554 | .57% | $34 |
Interfund Trades. The Fund may purchase from or sell securities to other Fidelity Funds under procedures adopted by the Board. The procedures have been designed to ensure these interfund trades are executed in accordance with Rule 17a-7 of the 1940 Act. Interfund trades are included within the respective purchases and sales amounts shown in the Purchases and Sales of Investments note.
6. Committed Line of Credit.
The Fund participates with other funds managed by the investment adviser or an affiliate in a $4.25 billion credit facility (the "line of credit") to be utilized for temporary or emergency purposes to fund shareholder redemptions or for other short-term liquidity purposes. The Fund has agreed to pay commitment fees on its pro-rata portion of the line of credit, which amounted to $26 and is reflected in Miscellaneous expenses on the Statement of Operations. During the period, the Fund did not borrow on this line of credit.
7. Security Lending.
The Fund lends portfolio securities through a lending agent from time to time in order to earn additional income. For equity securities, a lending agent is used and may loan securities to certain qualified borrowers, including Fidelity Capital Markets (FCM), a broker-dealer affiliated with the Fund. On the settlement date of the loan, the Fund receives collateral (in the form of U.S. Treasury obligations, letters of credit and/or cash) against the loaned securities and maintains collateral in an amount not less than 100% of the market value of the loaned securities during the period of the loan. The market value of the loaned securities is determined at the close of business of the Fund and any additional required collateral is delivered to the Fund on the next business day. The Fund or borrower may terminate the loan at any time, and if the borrower defaults on its obligation to return the securities loaned because of insolvency or other reasons, the Fund may apply collateral received from the borrower against the obligation. The Fund may experience delays and costs in recovering the securities loaned. Any cash collateral received is invested in the Fidelity Securities Lending Cash Central Fund. The value of loaned securities and cash collateral at period end are disclosed on the Fund's Statement of Assets and Liabilities. The value of securities loaned to FCM at period end was $26,708. Security lending income represents the income earned on investing cash collateral, less rebates paid to borrowers and any lending agent fees associated with the loan, plus any premium payments received for lending certain types of securities. Security lending income is presented in the Statement of Operations as a component of income from Fidelity Central Funds, and includes $2,706 from securities loaned to FCM.
8. Bank Borrowings.
The Fund is permitted to have bank borrowings for temporary or emergency purposes to fund shareholder redemptions or for other short-term liquidity requirements. The Fund has established borrowing arrangements with certain banks. The interest rate on the borrowings is the bank's base rate, as revised from time to time. The average loan balance during the period for which loans were outstanding amounted to $10,860. The weighted average interest rate was .88%. The interest expense amounted to $2 under the bank borrowing program. At period end, there were no bank borrowings outstanding.
9. Expense Reductions.
Commissions paid to certain brokers with whom the investment adviser, or its affiliates, places trades on behalf of the Fund include an amount in addition to trade execution, which may be rebated back to the Fund to offset certain expenses. This amount totaled $460 for the period. In addition, through arrangements with the Fund's custodian, credits realized as a result of certain uninvested cash balances were used to reduce the Fund's expenses. During the period, these credits reduced the Fund's custody expenses by $1.
In addition, during the period the investment adviser reimbursed and/or waived a portion of fund-level operating expenses in the amount of $98.
10. Distributions to Shareholders.
Distributions to shareholders of each class were as follows:
| | Year ended
July 31, 2016 | Year ended July 31, 2015 |
| From net realized gain | | |
| OTC | $505,475 | $1,012,327 |
| Class K | 199,430 | 396,565 |
| Total | $704,905 | $1,408,892 |
11. Share Transactions.
Share transactions for each class were as follows and may contain automatic conversions between classes or exchanges between affiliated funds:
| | Shares | Shares | Dollars | Dollars |
| | Year ended
July 31, 2016 | Year ended
July 31, 2015 | Year ended
July 31, 2016 | Year ended
July 31, 2015 |
| OTC | | | | |
| Shares sold | 23,178 | 22,946 | $1,818,054 | $1,893,100 |
| Reinvestment of distributions | 6,240 | 12,406 | 491,074 | 985,025 |
| Shares redeemed | (25,573) | (20,601) | (1,979,810) | (1,665,615) |
| Net increase (decrease) | 3,845 | 14,751 | $329,318 | $1,212,510 |
| Class K | | | | |
| Shares sold | 11,562 | 16,984 | $911,130 | $1,383,593 |
| Reinvestment of distributions | 2,509 | 4,953 | 199,430 | 396,565 |
| Shares redeemed | (17,040)(a) | (13,732)(b) | (1,346,251)(a) | (1,151,324)(b) |
| Net increase (decrease) | (2,969) | 8,205 | $(235,691) | $628,834 |
(a) Amount includes in-kind redemptions (see Note 4: Redemptions In-Kind).
(b) Amount includes in-kind redemptions (see Note 4: Prior Fiscal Year Redemptions In-Kind).
12. Other.
The Fund's organizational documents provide former and current trustees and officers with a limited indemnification against liabilities arising in connection with the performance of their duties to the Fund. In the normal course of business, the Fund may also enter into contracts that provide general indemnifications. The Fund's maximum exposure under these arrangements is unknown as this would be dependent on future claims that may be made against the Fund. The risk of material loss from such claims is considered remote.
Report of Independent Registered Public Accounting Firm
To the Trustees of Fidelity Securities Fund and Shareholders of Fidelity OTC Portfolio:
We have audited the accompanying statement of assets and liabilities of Fidelity OTC Portfolio (the Fund), a fund of Fidelity Securities Fund, including the schedule of investments, as of July 31, 2016, and the related statement of operations for the year then ended, the statement of changes in net assets for each of the two years in the period then ended, and the financial highlights for each of the five years in the period then ended. These financial statements and financial highlights are the responsibility of the Fund's management. Our responsibility is to express an opinion on these financial statements and financial highlights based on our audits.
We conducted our audits in accordance with the standards of the Public Company Accounting Oversight Board (United States). Those standards require that we plan and perform the audit to obtain reasonable assurance about whether the financial statements and financial highlights are free of material misstatement. The Fund is not required to have, nor were we engaged to perform, an audit of its internal control over financial reporting. Our audits included consideration of internal control over financial reporting as a basis for designing audit procedures that are appropriate in the circumstances, but not for the purpose of expressing an opinion on the effectiveness of the Fund's internal control over financial reporting. Accordingly, we express no such opinion. An audit also includes examining, on a test basis, evidence supporting the amounts and disclosures in the financial statements, assessing the accounting principles used and significant estimates made by management, as well as evaluating the overall financial statement presentation. Our procedures included confirmation of securities owned as of July 31, 2016, by correspondence with the custodians and brokers; when replies were not received from brokers, we performed other auditing procedures. We believe that our audits provide a reasonable basis for our opinion.
In our opinion, such financial statements and financial highlights referred to above present fairly, in all material respects, the financial position of Fidelity OTC Portfolio as of July 31, 2016, the results of its operations for the year then ended, the changes in its net assets for each of the two years in the period then ended, and the financial highlights for each of the five years in the period then ended in conformity with accounting principles generally accepted in the United States of America.
DELOITTE & TOUCHE LLP
Boston, Massachusetts
September 19, 2016
Trustees and Officers
The Trustees, Members of the Advisory Board (if any), and officers of the trust and fund, as applicable, are listed below. The Board of Trustees governs the fund and is responsible for protecting the interests of shareholders. The Trustees are experienced executives who meet periodically throughout the year to oversee the fund's activities, review contractual arrangements with companies that provide services to the fund, oversee management of the risks associated with such activities and contractual arrangements, and review the fund's performance. Each of the Trustees oversees 170 funds.
The Trustees hold office without limit in time except that (a) any Trustee may resign; (b) any Trustee may be removed by written instrument, signed by at least two-thirds of the number of Trustees prior to such removal; (c) any Trustee who requests to be retired or who has become incapacitated by illness or injury may be retired by written instrument signed by a majority of the other Trustees; and (d) any Trustee may be removed at any special meeting of shareholders by a two-thirds vote of the outstanding voting securities of the trust. Each Trustee who is not an interested person (as defined in the 1940 Act) of the trust and the fund is referred to herein as an Independent Trustee. Each Independent Trustee shall retire not later than the last day of the calendar year in which his or her 75th birthday occurs. The Independent Trustees may waive this mandatory retirement age policy with respect to individual Trustees. Officers and Advisory Board Members hold office without limit in time, except that any officer or Advisory Board Member may resign or may be removed by a vote of a majority of the Trustees at any regular meeting or any special meeting of the Trustees. Except as indicated, each individual has held the office shown or other offices in the same company for the past five years.
The fund’s Statement of Additional Information (SAI) includes more information about the Trustees. To request a free copy, call Fidelity at 1-800-835-5092.
Experience, Skills, Attributes, and Qualifications of the Trustees. The Governance and Nominating Committee has adopted a statement of policy that describes the experience, qualifications, attributes, and skills that are necessary and desirable for potential Independent Trustee candidates (Statement of Policy). The Board believes that each Trustee satisfied at the time he or she was initially elected or appointed a Trustee, and continues to satisfy, the standards contemplated by the Statement of Policy. The Governance and Nominating Committee also engages professional search firms to help identify potential Independent Trustee candidates who have the experience, qualifications, attributes, and skills consistent with the Statement of Policy. From time to time, additional criteria based on the composition and skills of the current Independent Trustees, as well as experience or skills that may be appropriate in light of future changes to board composition, business conditions, and regulatory or other developments, have also been considered by the professional search firms and the Governance and Nominating Committee. In addition, the Board takes into account the Trustees' commitment and participation in Board and committee meetings, as well as their leadership of standing and ad hoc committees throughout their tenure.
In determining that a particular Trustee was and continues to be qualified to serve as a Trustee, the Board has considered a variety of criteria, none of which, in isolation, was controlling. The Board believes that, collectively, the Trustees have balanced and diverse experience, qualifications, attributes, and skills, which allow the Board to operate effectively in governing the fund and protecting the interests of shareholders. Information about the specific experience, skills, attributes, and qualifications of each Trustee, which in each case led to the Board's conclusion that the Trustee should serve (or continue to serve) as a trustee of the fund, is provided below.
Board Structure and Oversight Function. James C. Curvey is an interested person and currently serves as Chairman. The Trustees have determined that an interested Chairman is appropriate and benefits shareholders because an interested Chairman has a personal and professional stake in the quality and continuity of services provided to the fund. Independent Trustees exercise their informed business judgment to appoint an individual of their choosing to serve as Chairman, regardless of whether the Trustee happens to be independent or a member of management. The Independent Trustees have determined that they can act independently and effectively without having an Independent Trustee serve as Chairman and that a key structural component for assuring that they are in a position to do so is for the Independent Trustees to constitute a substantial majority for the Board. The Independent Trustees also regularly meet in executive session. Ned C. Lautenbach serves as Chairman of the Independent Trustees and as such (i) acts as a liaison between the Independent Trustees and management with respect to matters important to the Independent Trustees and (ii) with management prepares agendas for Board meetings.
Fidelity® funds are overseen by different Boards of Trustees. The fund's Board oversees Fidelity's high income and certain equity funds, and other Boards oversee Fidelity's investment-grade bond, money market, asset allocation, and sector funds. The asset allocation funds may invest in Fidelity® funds overseen by the fund's Board. The use of separate Boards, each with its own committee structure, allows the Trustees of each group of Fidelity® funds to focus on the unique issues of the funds they oversee, including common research, investment, and operational issues. On occasion, the separate Boards establish joint committees to address issues of overlapping consequences for the Fidelity® funds overseen by each Board.
The Trustees operate using a system of committees to facilitate the timely and efficient consideration of all matters of importance to the Trustees, the fund, and fund shareholders and to facilitate compliance with legal and regulatory requirements and oversight of the fund's activities and associated risks. The Board, acting through its committees, has charged FMR and its affiliates with (i) identifying events or circumstances the occurrence of which could have demonstrably adverse effects on the fund's business and/or reputation; (ii) implementing processes and controls to lessen the possibility that such events or circumstances occur or to mitigate the effects of such events or circumstances if they do occur; and (iii) creating and maintaining a system designed to evaluate continuously business and market conditions in order to facilitate the identification and implementation processes described in (i) and (ii) above. Because the day-to-day operations and activities of the fund are carried out by or through FMR, its affiliates, and other service providers, the fund's exposure to risks is mitigated but not eliminated by the processes overseen by the Trustees. While each of the Board's committees has responsibility for overseeing different aspects of the fund's activities, oversight is exercised primarily through the Operations, Audit, and Compliance Committees. In addition, the Independent Trustees have worked with FMR to enhance the Board's oversight of investment and financial risks, legal and regulatory risks, technology risks, and operational risks, including the development of additional risk reporting to the Board. For example, a working group comprised of Independent Trustees and FMR has worked and continues to work to review the Fidelity® funds' valuation-related activities, reporting and risk management. Appropriate personnel, including but not limited to the fund's Chief Compliance Officer (CCO), FMR's internal auditor, the independent accountants, the fund's Treasurer and portfolio management personnel, make periodic reports to the Board's committees, as appropriate, including an annual review of Fidelity's risk management program for the Fidelity® funds. The responsibilities of each standing committee, including their oversight responsibilities, are described further under "Standing Committees of the Trustees."
Interested Trustees*:
Correspondence intended for a Trustee who is an interested person may be sent to Fidelity Investments, 245 Summer Street, Boston, Massachusetts 02210.
Name, Year of Birth; Principal Occupations and Other Relevant Experience+
James C. Curvey (1935)
Year of Election or Appointment: 2007
Trustee
Chairman of the Board of Trustees
Mr. Curvey also serves as Trustee of other Fidelity® funds. Mr. Curvey is a Director of Fidelity Research & Analysis Co. (investment adviser firm, 2009-present), and Vice Chairman (2007-present) and Director of FMR LLC (diversified financial services company). In addition, Mr. Curvey serves as an Overseer for the Boston Symphony Orchestra and a member of the board of Artis-Naples, Naples, Florida, and as a Trustee for Brewster Academy, Wolfeboro, New Hampshire. Previously, Mr. Curvey served as a Director of Fidelity Investments Money Management, Inc. (investment adviser firm, 2009-2014) and a Director of FMR and FMR Co., Inc. (investment adviser firms, 2007-2014).
Charles S. Morrison (1960)
Year of Election or Appointment: 2014
Trustee
Mr. Morrison also serves as Trustee of other funds. He serves as a Director of Fidelity Investments Money Management, Inc. (FIMM) (investment adviser firm, 2014-present), Director of Fidelity SelectCo, LLC (investment adviser firm, 2014-present), President, Asset Management (2014-present), and is an employee of Fidelity Investments. Previously, Mr. Morrison served as Vice President of Fidelity's Fixed Income and Asset Allocation Funds (2012-2014), President, Fixed Income (2011-2014), Vice President of Fidelity's Money Market Funds (2005-2009), President, Money Market Group Leader of FMR (investment adviser firm, 2009), and Senior Vice President, Money Market Group of FMR (2004-2009). Mr. Morrison also served as Vice President of Fidelity's Bond Funds (2002-2005), certain Balanced Funds (2002-2005), and certain Asset Allocation Funds (2002-2007), and as Senior Vice President (2002-2005) of Fidelity's Bond Division.
* Determined to be an “Interested Trustee” by virtue of, among other things, his or her affiliation with the trust or various entities under common control with FMR.
+ The information includes the Trustee's principal occupation during the last five years and other information relating to the experience, attributes, and skills relevant to the Trustee's qualifications to serve as a Trustee, which led to the conclusion that the Trustee should serve as a Trustee for the fund.
Independent Trustees:
Correspondence intended for an Independent Trustee may be sent to Fidelity Investments, P.O. Box 55235, Boston, Massachusetts 02205-5235.
Name, Year of Birth; Principal Occupations and Other Relevant Experience+
Dennis J. Dirks (1948)
Year of Election or Appointment: 2005
Trustee
Mr. Dirks also serves as Trustee of other Fidelity® funds. Prior to his retirement in May 2003, Mr. Dirks was Chief Operating Officer and a member of the Board of The Depository Trust & Clearing Corporation (DTCC). He also served as President, Chief Operating Officer, and Board member of The Depository Trust Company (DTC) and President and Board member of the National Securities Clearing Corporation (NSCC). In addition, Mr. Dirks served as Chief Executive Officer and Board member of the Government Securities Clearing Corporation, Chief Executive Officer and Board member of the Mortgage-Backed Securities Clearing Corporation, as a Trustee and a member of the Finance Committee of Manhattan College (2005-2008), as a Trustee and a member of the Finance Committee of AHRC of Nassau County (2006-2008), and as a member of the Independent Directors Council (IDC) Governing Council (2010-2015). Mr. Dirks is a member of the Board of Directors for The Brookville Center for Children's Services, Inc. (2009-present).
Alan J. Lacy (1953)
Year of Election or Appointment: 2008
Trustee
Mr. Lacy also serves as Trustee of other Fidelity® funds. Mr. Lacy serves as Chairman (2014-present) and a member (2010-present) of the Board of Directors of Dave & Buster's Entertainment, Inc. (restaurant and entertainment complexes) and a Director of Bristol-Myers Squibb Company (global pharmaceuticals, 2008-present). He is a Trustee of the California Chapter of The Nature Conservancy (2015-present) and a Director of the Center for Advanced Study in the Behavioral Sciences at Stanford University (2015-present). In addition, Mr. Lacy served as Senior Adviser (2007-2014) of Oak Hill Capital Partners, L.P. (private equity) and also served as Chief Executive Officer (2005) and Vice Chairman (2005-2006) of Sears Holdings Corporation (retail) and Chief Executive Officer and Chairman of the Board of Sears, Roebuck and Co. (retail, 2000-2005). Previously, Mr. Lacy served as Chairman (2008-2011) and a member (2006-2015) of the Board of Trustees of the National Parks Conservation Association and as a member of the Board of Directors for The Western Union Company (global money transfer, 2006-2011), The Hillman Companies, Inc. (hardware wholesalers, 2010-2014), and Earth Fare, Inc. (retail grocery, 2010-2014).
Ned C. Lautenbach (1944)
Year of Election or Appointment: 2000
Trustee
Chairman of the Independent Trustees
Mr. Lautenbach also serves as Trustee of other Fidelity® funds. Mr. Lautenbach currently serves as the Lead Director of the Eaton Corporation Board of Directors (diversified industrial, 1997-present). Mr. Lautenbach is Chairman of the Board of Directors of Artis-Naples in Naples, Florida (2012-present), a member of the Council on Foreign Relations (1994-present), and a member of the Board of Governors, State University System of Florida (2013-present). Previously, Mr. Lautenbach was a Partner/Advisory Partner at Clayton, Dubilier & Rice, LLC (private equity investment, 1998-2010), as well as a Director of Sony Corporation (2006-2007).
Joseph Mauriello (1944)
Year of Election or Appointment: 2008
Trustee
Mr. Mauriello also serves as Trustee of other Fidelity® funds. Prior to his retirement in January 2006, Mr. Mauriello served in numerous senior management positions including Deputy Chairman and Chief Operating Officer (2004-2005), and Vice Chairman of Financial Services (2002-2004) of KPMG LLP US (professional services, 1965-2005). Mr. Mauriello currently serves as a member of the Board of Directors of XL Group plc. (global insurance and re-insurance, 2006-present) and the Independent Directors Council (IDC) Governing Council (2015-present). Previously, Mr. Mauriello served as a Director of the Hamilton Funds of the Bank of New York (2006-2007) and of Arcadia Resources Inc. (health care services and products, 2007-2012).
Robert W. Selander (1950)
Year of Election or Appointment: 2011
Trustee
Mr. Selander also serves as Trustee of other Fidelity® funds. Mr. Selander serves as a Director of The Western Union Company (global money transfer, 2014-present) and a non-executive Chairman of Health Equity, Inc. (health savings custodian, 2015-present). Previously, Mr. Selander served as a Member of the Advisory Board of certain Fidelity® funds (2011), and Executive Vice Chairman (2010), Chief Executive Officer (2009-2010), and President and Chief Executive Officer (1997-2009) of Mastercard, Inc.
Cornelia M. Small (1944)
Year of Election or Appointment: 2005
Trustee
Ms. Small also serves as Trustee of other Fidelity® funds. Ms. Small is a member of the Board of Directors (2009-present) and Chair of the Investment Committee (2010-present) of the Teagle Foundation. Ms. Small also serves on the Investment Committee of the Berkshire Taconic Community Foundation (2008-present). Previously, Ms. Small served as Chairperson (2002-2008) and a member of the Investment Committee and Chairperson (2008-2012) and a member of the Board of Trustees of Smith College. In addition, Ms. Small served as Chief Investment Officer, Director of Global Equity Investments, and a member of the Board of Directors of Scudder, Stevens & Clark and Scudder Kemper Investments.
William S. Stavropoulos (1939)
Year of Election or Appointment: 2002
Trustee
Vice Chairman of the Independent Trustees
Mr. Stavropoulos also serves as Trustee of other Fidelity® funds. Mr. Stavropoulos serves as President and Founder of the Michigan Baseball Foundation, the Great Lakes Loons (2007-present). Mr. Stavropoulos is Chairman Emeritus of the Board of Directors of The Dow Chemical Company, where he previously served in numerous senior management positions, including President, CEO (1995-2000; 2002-2004), Chairman of the Executive Committee (2000-2006), and as a member of the Board of Directors (1990-2006). Currently, Mr. Stavropoulos is Chairman of the Board of Directors of Univar Inc. (global distributor of commodity and specialty chemicals), a Director of Teradata Corporation (data warehousing and technology solutions), and Maersk Inc. (industrial conglomerate), and a member of the Advisory Board for Metalmark Capital LLC (private equity investment, 2005-present). Mr. Stavropoulos is an operating advisor to Clayton, Dubilier & Rice, LLC (private equity investment). In addition, Mr. Stavropoulos is a member of the University of Notre Dame Advisory Council for the College of Science, a Trustee of the Rollin L. Gerstacker Foundation, and a Director of the Naples Philharmonic Center for the Arts. Previously, Mr. Stavropoulos served as a Director of Chemical Financial Corporation (bank holding company, 1993-2012) and Tyco International, Ltd. (multinational manufacturing and services, 2007-2012).
David M. Thomas (1949)
Year of Election or Appointment: 2008
Trustee
Mr. Thomas also serves as Trustee of other Fidelity® funds. Mr. Thomas serves as Non-Executive Chairman of the Board of Directors of Fortune Brands Home and Security (home and security products, 2011-present), as a member of the Board of Directors (2004-present) and Presiding Director (2013-present) of Interpublic Group of Companies, Inc. (marketing communication), and as a member of the Board of Trustees of the University of Florida (2013-present). Previously, Mr. Thomas served as Executive Chairman (2005-2006) and Chairman and Chief Executive Officer (2000-2005) of IMS Health, Inc. (pharmaceutical and healthcare information solutions), and a Director of Fortune Brands, Inc. (consumer products, 2000-2011).
+ The information includes the Trustee's principal occupation during the last five years and other information relating to the experience, attributes, and skills relevant to the Trustee's qualifications to serve as a Trustee, which led to the conclusion that the Trustee should serve as a Trustee for the fund.
Advisory Board Members and Officers:
Correspondence intended for an officer or Peter S. Lynch may be sent to Fidelity Investments, 245 Summer Street, Boston, Massachusetts 02210. Officers appear below in alphabetical order.
Name, Year of Birth; Principal Occupation
Peter S. Lynch (1944)
Year of Election or Appointment: 2003
Member of the Advisory Board
Mr. Lynch also serves as Member of the Advisory Board of other Fidelity® funds. Mr. Lynch is Vice Chairman and a Director of FMR (investment adviser firm) and FMR Co., Inc. (investment adviser firm). In addition, Mr. Lynch serves as a Trustee of Boston College and as the Chairman of the Inner-City Scholarship Fund. Previously, Mr. Lynch served on the Special Olympics International Board of Directors (1997-2006).
Marc R. Bryant (1966)
Year of Election or Appointment: 2015
Secretary and Chief Legal Officer (CLO)
Mr. Bryant also serves as Secretary and CLO of other funds. Mr. Bryant serves as CLO, Secretary, and Senior Vice President of Fidelity Management & Research Company (investment adviser firm, 2015-present) and FMR Co., Inc. (investment adviser firm, 2015-present); Secretary of Fidelity SelectCo, LLC (investment adviser firm, 2015-present) and Fidelity Investments Money Management, Inc. (investment adviser firm, 2015-present); and CLO of Fidelity Management & Research (Hong Kong) Limited and FMR Investment Management (U.K.) Limited (investment adviser firms, 2015-present) and Fidelity Management & Research (Japan) Limited (investment adviser firm, 2016-present). He is Senior Vice President and Deputy General Counsel of FMR LLC (diversified financial services company). Previously, Mr. Bryant served as Secretary and CLO of Fidelity Rutland Square Trust II (2010-2014) and Assistant Secretary of Fidelity's Fixed Income and Asset Allocation Funds (2013-2015). Prior to joining Fidelity Investments, Mr. Bryant served as a Senior Vice President and the Head of Global Retail Legal for AllianceBernstein L.P. (2006-2010), and as the General Counsel for ProFund Advisors LLC (2001-2006).
Jeffrey S. Christian (1961)
Year of Election or Appointment: 2016
Assistant Treasurer
Mr. Christian also serves as Assistant Treasurer of other funds. Mr. Christian is an employee of Fidelity Investments (2003-present).
William C. Coffey (1969)
Year of Election or Appointment: 2009
Assistant Secretary
Mr. Coffey also serves as Assistant Secretary of other funds. He is Senior Vice President and Deputy General Counsel of FMR LLC (diversified financial services company, 2010-present), and is an employee of Fidelity Investments. Previously, Mr. Coffey served as Vice President and Associate General Counsel of FMR LLC (2005-2009).
Jonathan Davis (1968)
Year of Election or Appointment: 2010
Assistant Treasurer
Mr. Davis also serves as Assistant Treasurer of other funds, and is an employee of Fidelity Investments. Previously, Mr. Davis served as Vice President and Associate General Counsel of FMR LLC (diversified financial services company, 2003-2010).
Adrien E. Deberghes (1967)
Year of Election or Appointment: 2016
Assistant Treasurer
Mr. Deberghes also serves as an officer of other funds. He serves as Executive Vice President of Fidelity Investments Money Management, Inc. (FIMM) (investment adviser firm, 2016-present) and is an employee of Fidelity Investments (2008-present). Prior to joining Fidelity Investments, Mr. Deberghes was Senior Vice President of Mutual Fund Administration at State Street Corporation (2007-2008), Senior Director of Mutual Fund Administration at Investors Bank & Trust (2005-2007), and Director of Finance for Dunkin' Brands (2000-2005). Previously, Mr. Deberghes served in other fund officer roles.
Stephanie J. Dorsey (1969)
Year of Election or Appointment: 2010
Assistant Treasurer
Ms. Dorsey also serves as an officer of other funds. She is an employee of Fidelity Investments (2008-present) and has served in other fund officer roles. Prior to joining Fidelity Investments, Ms. Dorsey served as Treasurer (2004-2008) of the JPMorgan Mutual Funds and Vice President (2004-2008) of JPMorgan Chase Bank.
Howard J. Galligan III (1966)
Year of Election or Appointment: 2014
Chief Financial Officer
Mr. Galligan also serves as Chief Financial Officer of other funds. Mr. Galligan serves as President of Fidelity Pricing and Cash Management Services (FPCMS) (2014-present) and as a Director of Strategic Advisers, Inc. (investment adviser firm, 2008-present). Previously, Mr. Galligan served as Chief Administrative Officer of Asset Management (2011-2014) and Chief Operating Officer and Senior Vice President of Investment Support for Strategic Advisers, Inc. (2003-2011).
Scott C. Goebel (1968)
Year of Election or Appointment: 2015
Vice President
Mr. Goebel serves as Vice President of other funds and is an employee of Fidelity Investments (2001-present). Mr. Goebel serves as Senior Vice President of Fidelity Management & Research Company (FMR) (investment adviser firm, 2016-present). Previously, Mr. Goebel served as Secretary of Fidelity SelectCo, LLC (investment adviser firm, 2013-2015), Fidelity Investments Money Management, Inc. (FIMM) (investment adviser firm, 2010-2015), and Fidelity Research and Analysis Company (FRAC) (investment adviser firm, 2010-2015); General Counsel, Secretary, and Senior Vice President of FMR (investment adviser firm, 2008-2015) and FMR Co., Inc. (investment adviser firm, 2008-2015); Assistant Secretary of Fidelity Management & Research (Japan) Limited (investment adviser firm, 2008-2015) and Fidelity Management & Research (U.K.) Inc. (investment adviser firm, 2008-2015); Chief Legal Officer (CLO) of Fidelity Management & Research (Hong Kong) Limited (investment adviser firm, 2008-2015); Secretary and CLO of certain Fidelity® funds (2008-2015); Assistant Secretary of FIMM (2008-2010), FRAC (2008-2010), and certain funds (2007-2008); and as Vice President and Secretary of Fidelity Distributors Corporation (FDC) (2005-2007).
Brian B. Hogan (1964)
Year of Election or Appointment: 2009
Vice President
Mr. Hogan also serves as Trustee or Vice President of other funds. Mr. Hogan serves as a Director of FMR Investment Management (U.K.) Limited (investment adviser firm, 2015-present) and Fidelity SelectCo, LLC (investment adviser firm, 2014-present) and President of the Equity Division of FMR (investment adviser firm, 2009-present). Previously, Mr. Hogan served as Senior Vice President, Equity Research of FMR (2006-2009) and as a portfolio manager. Mr. Brian B. Hogan is not related to Mr. Colm A. Hogan.
Colm A. Hogan (1973)
Year of Election or Appointment: 2016
Deputy Treasurer
Mr. Hogan also serves as an officer of other funds. Mr. Hogan is an employee of Fidelity Investments (2005-present). Mr. Colm A. Hogan is not related to Mr. Brian B. Hogan.
Chris Maher (1972)
Year of Election or Appointment: 2013
Assistant Treasurer
Mr. Maher serves as Assistant Treasurer of other funds. Mr. Maher is Vice President of Valuation Oversight and is an employee of Fidelity Investments. Previously, Mr. Maher served as Vice President of Asset Management Compliance (2013), Vice President of the Program Management Group of FMR (investment adviser firm, 2010-2013), and Vice President of Valuation Oversight (2008-2010).
John F. Papandrea (1972)
Year of Election or Appointment: 2016
Anti-Money Laundering (AML) Officer
Mr. Papandrea also serves as AML Officer of other funds. Mr. Papandrea is Vice President of FMR LLC (diversified financial services company, 2008-present) and is an employee of Fidelity Investments (2005-present).
Melissa M. Reilly (1971)
Year of Election or Appointment: 2014
Vice President of certain Equity Funds
Ms. Reilly also serves as Vice President of other funds. Ms. Reilly is an employee of Fidelity Investments (2004-present).
Kenneth B. Robins (1969)
Year of Election or Appointment: 2016
Chief Compliance Officer
Mr. Robins also serves as an officer of other funds. Mr. Robins serves as Compliance Officer of Fidelity Management & Research Company and FMR Co., Inc. (investment adviser firms, 2016-present) and is an employee of Fidelity Investments (2004-present). Previously, Mr. Robins served as Executive Vice President of Fidelity Investments Money Management, Inc. (investment adviser firm, 2013-2016) and served in other fund officer roles.
Stacie M. Smith (1974)
Year of Election or Appointment: 2016
President and Treasurer
Ms. Smith also serves as an officer of other funds. She is an employee of Fidelity Investments (2009-present) and has served in other fund officer roles. Prior to joining Fidelity Investments, Ms. Smith served as Senior Audit Manager of Ernst & Young LLP (1996-2009). Previously, Ms. Smith served as Deputy Treasurer of certain Fidelity® funds (2013-2016).
Renee Stagnone (1975)
Year of Election or Appointment: 2016
Assistant Treasurer
Ms. Stagnone also serves as an officer of other funds. Ms. Stagnone is an employee of Fidelity Investments (1997-present). Previously, Ms. Stagnone served as Deputy Treasurer of certain Fidelity® funds (2013-2016).
Shareholder Expense Example
As a shareholder of the Fund, you incur two types of costs: (1) transaction costs and (2) ongoing costs, including management fees and other Fund expenses. This Example is intended to help you understand your ongoing costs (in dollars) of investing in the Fund and to compare these costs with the ongoing costs of investing in other mutual funds.
The Example is based on an investment of $1,000 invested at the beginning of the period and held for the entire period (February 1, 2016 to July 31, 2016).
Actual Expenses
The first line of the accompanying table for each class of the Fund provides information about actual account values and actual expenses. You may use the information in this line, together with the amount you invested, to estimate the expenses that you paid over the period. Simply divide your account value by $1,000.00 (for example, an $8,600 account value divided by $1,000.00 = 8.6), then multiply the result by the number in the first line for a class of the Fund under the heading entitled "Expenses Paid During Period" to estimate the expenses you paid on your account during this period. A small balance maintenance fee of $12.00 that is charged once a year may apply for certain accounts with a value of less than $2,000. This fee is not included in the table below. If it was, the estimate of expenses you paid during the period would be higher, and your ending account value lower, by this amount. In addition, the Fund, as a shareholder in the underlying Fidelity Central Funds, will indirectly bear its pro-rata share of the fees and expenses incurred by the underlying Fidelity Central Funds. These fees and expenses are not included in the Fund's annualized expense ratio used to calculate the expense estimate in the table below.
Hypothetical Example for Comparison Purposes
The second line of the accompanying table for each class of the Fund provides information about hypothetical account values and hypothetical expenses based on a Class' actual expense ratio and an assumed rate of return of 5% per year before expenses, which is not the Class' actual return. The hypothetical account values and expenses may not be used to estimate the actual ending account balance or expenses you paid for the period. You may use this information to compare the ongoing costs of investing in the Fund and other funds. To do so, compare this 5% hypothetical example with the 5% hypothetical examples that appear in the shareholder reports of the other funds. A small balance maintenance fee of $12.00 that is charged once a year may apply for certain accounts with a value of less than $2,000. This fee is not included in the table below. If it was, the estimate of expenses you paid during the period would be higher, and your ending account value lower, by this amount. In addition, the Fund, as a shareholder in the underlying Fidelity Central Funds, will indirectly bear its pro-rata share of the fees and expenses incurred by the underlying Fidelity Central Funds. These fees and expenses are not included in the Fund's annualized expense ratio used to calculate the expense estimate in the table below.
Please note that the expenses shown in the table are meant to highlight your ongoing costs only and do not reflect any transaction costs. Therefore, the second line of the table is useful in comparing ongoing costs only, and will not help you determine the relative total costs of owning different funds.
| | Annualized Expense Ratio-A | Beginning
Account Value
February 1, 2016 | Ending
Account Value
July 31, 2016 | Expenses Paid
During Period-B
February 1, 2016
to July 31, 2016 |
| OTC | .87% | | | |
| Actual | | $1,000.00 | $1,171.00 | $4.70 |
| Hypothetical-C | | $1,000.00 | $1,020.54 | $4.37 |
| Class K | .75% | | | |
| Actual | | $1,000.00 | $1,171.60 | $4.05 |
| Hypothetical-C | | $1,000.00 | $1,021.13 | $3.77 |
A Annualized expense ratio reflects expenses net of applicable fee waivers.
B Expenses are equal to each Class' annualized expense ratio, multiplied by the average account value over the period, multiplied by 182/366 (to reflect the one-half year period).
C 5% return per year before expenses
Distributions (Unaudited)
The fund hereby designates as a capital gain dividend with respect to the taxable year ended July 31, 2016, $112,418,165 or, if subsequently determined to be different, the net capital gain of such year.
OTC Portfolio and Class K designates 16% of the dividends distributed during the fiscal year as qualifying for the dividends–received deduction for corporate shareholders.
OTC Portfolio and Class K designates 18% of the dividends distributed during the fiscal year as amounts which may be taken into account as a dividend for purposes of the maximum rate under section 1(h)(11) of the Internal Revenue Code.
The fund will notify shareholders in January 2017 of amounts for use in preparing 2016 income tax returns.
Board Approval of Investment Advisory Contracts and Management Fees
Fidelity OTC Portfolio
Each year, the Board of Trustees, including the Independent Trustees (together, the Board), votes on the renewal of the management contract with Fidelity Management & Research Company (FMR) and the sub-advisory agreements (together, the Advisory Contracts) for the fund. The Board, assisted by the advice of fund counsel and Independent Trustees' counsel, requests and considers a broad range of information relevant to the renewal of the Advisory Contracts throughout the year.
The Board meets regularly and, at each of its meetings, covers an extensive agenda of topics and materials and considers factors that are relevant to its annual consideration of the renewal of the fund's Advisory Contracts, including the services and support provided to the fund and its shareholders. The Board has established various standing committees (Committees), each composed of and chaired by Independent Trustees with varying backgrounds, to which the Board has assigned specific subject matter responsibilities in order to enhance effective decision-making by the Board. The Board, acting directly and through its Committees, requests and receives information concerning the annual consideration of the renewal of the fund's Advisory Contracts. The Board also meets as needed to consider matters specifically related to the Board's annual consideration of the renewal of the Advisory Contracts. Members of the Board may also meet with trustees of other Fidelity funds through ad hoc joint committees to discuss certain matters relevant to all of the Fidelity funds.
At its July 2016 meeting, the Board unanimously determined to renew the fund's Advisory Contracts. In reaching its determination, the Board considered all factors it believed relevant, including (i) the nature, extent, and quality of the services to be provided to the fund and its shareholders (including the investment performance of the fund); (ii) the competitiveness of the fund's management fee and total expense ratio relative to peer funds; (iii) the total costs of the services to be provided by and the profits to be realized by Fidelity from its relationships with the fund; and (iv) the extent to which, if any, economies of scale exist and would be realized as the fund grows, and whether any economies of scale are appropriately shared with fund shareholders.
In considering whether to renew the Advisory Contracts for the fund, the Board reached a determination, with the assistance of fund counsel and Independent Trustees' counsel and through the exercise of its business judgment, that the renewal of the Advisory Contracts was in the best interests of the fund and its shareholders and that the compensation payable under the Advisory Contracts was fair and reasonable. The Board's decision to renew the Advisory Contracts was not based on any single factor, but rather was based on a comprehensive consideration of all the information provided to the Board at its meetings throughout the year. The Board, in reaching its determination to renew the Advisory Contracts, was aware that shareholders of the fund have a broad range of investment choices available to them, including a wide choice among funds offered by Fidelity's competitors, and that the fund's shareholders, who have the opportunity to review and weigh the disclosure provided by the fund in its prospectus and other public disclosures, have chosen to invest in this fund, which is part of the Fidelity family of funds.
Nature, Extent, and Quality of Services Provided. The Board considered Fidelity's staffing as it relates to the fund, including the backgrounds of investment personnel of Fidelity, and also considered the fund's investment objective, strategies, and related investment philosophy. The Independent Trustees also had discussions with senior management of Fidelity's investment operations and investment groups. The Board considered the structure of the investment personnel compensation program and whether this structure provides appropriate incentives to act in the best interests of the fund. Additionally, the Board considered the portfolio managers' investments, if any, in the funds that they manage.
Resources Dedicated to Investment Management and Support Services. The Board and the Fund Oversight and Research Committees reviewed the general qualifications and capabilities of Fidelity's investment staff, including its size, education, experience, and resources, as well as Fidelity's approach to recruiting, training, managing, and compensating investment personnel. The Board noted that Fidelity has continued to increase the resources devoted to non-U.S. offices, including expansion of Fidelity's global investment organization. The Board also noted that Fidelity's analysts have extensive resources, tools and capabilities that allow them to conduct sophisticated quantitative and fundamental analysis, as well as credit analysis of issuers, counterparties and guarantors. Further, the Board considered that Fidelity's investment professionals have sufficient access to global information and data so as to provide competitive investment results over time, and that those professionals also have access to sophisticated tools that permit them to assess portfolio construction and risk and performance attribution characteristics continuously, as well as to transmit new information and research conclusions rapidly around the world. Additionally, in its deliberations, the Board considered Fidelity's trading, risk management, compliance, and technology and operations capabilities and resources, which are integral parts of the investment management process.
Shareholder and Administrative Services. The Board considered (i) the nature, extent, quality, and cost of advisory, administrative, and shareholder services performed by FMR, the sub-advisers (together with FMR, the Investment Advisers), and their affiliates under the Advisory Contracts and under separate agreements covering transfer agency, pricing and bookkeeping, and securities lending services for the fund; (ii) the nature and extent of the supervision of third party service providers, principally custodians, subcustodians, and pricing vendors; and (iii) the resources devoted to, and the record of compliance with, the fund's compliance policies and procedures. The Board also reviewed the allocation of fund brokerage, including allocations to brokers affiliated with the Investment Advisers, the use of brokerage commissions to pay fund expenses, and the use of "soft" commission dollars to pay for research services.
The Board noted that the growth of fund assets over time across the complex allows Fidelity to reinvest in the development of services designed to enhance the value or convenience of the Fidelity funds as investment vehicles. These services include 24-hour access to account information and market information through telephone representatives and over the Internet, investor education materials and asset allocation tools, and the expanded availability of Fidelity Investor Centers.
In 2014, the Board formed an ad hoc Committee on Transfer Agency Fees to review the variety of transfer agency fee structures throughout the industry and Fidelity's competitive positioning with respect to industry participants.
Investment in a Large Fund Family. The Board considered the benefits to shareholders of investing in a Fidelity fund, including the benefits of investing in a fund that is part of a large family of funds offering a variety of investment disciplines and providing a large variety of mutual fund investor services. The Board noted that Fidelity had taken, or had made recommendations that resulted in the Fidelity funds taking, a number of actions over the previous year that benefited particular funds, including: (i) continuing to dedicate additional resources to investment research and to the support of the senior management team that oversees asset management; (ii) continuing efforts to enhance Fidelity's global research capabilities; (iii) launching new funds and making other enhancements to meet client needs; (iv) broadening eligibility requirements for certain lower-priced share classes of, and streamlining the fee structure for, certain existing equity index funds; (v) lowering expense caps for certain existing funds and classes to reduce expenses paid by shareholders; (vi) eliminating redemption fees for certain variable insurance product funds and classes; (vii) continuing to launch dedicated lower cost underlying funds to meet portfolio construction needs related to expanding underlying fund options for Fidelity funds of funds, specifically for the Freedom Fund product lines; (viii) launching a lower cost share class for use by the Freedom Index Fund product line; (ix) rationalizing product lines and gaining increased efficiencies through fund mergers and share class consolidations; (x) continuing to develop, acquire and implement systems and technology to improve services to the funds and shareholders, strengthen information security, and increase efficiency; (xi) implementing investment enhancements to further strengthen Fidelity's target date product line to increase investors' probability of success in achieving their goals; (xii) accelerating the conversion of all remaining Class B shares to Class A shares, which have a lower expense structure; and (xiii) implementing changes to Fidelity's money market fund product line in response to recent regulatory reforms.
Investment Performance. The Board considered whether the fund has operated in accordance with its investment objective, as well as its record of compliance with its investment restrictions and its performance history.
The Board took into account discussions with representatives of the Investment Advisers about fund investment performance that occur at Board meetings throughout the year. In this regard the Board noted that as part of regularly scheduled fund reviews and other reports to the Board on fund performance, the Board considers annualized return information for the fund, for different time periods, measured against a securities market index ("benchmark index") and a peer group of funds with similar objectives ("peer group"), if any. In its evaluation of fund investment performance, the Board gave particular attention to information indicating changes in performance of certain Fidelity funds for specific time periods and discussed with the Investment Advisers the reasons for any overperformance or underperformance.
In addition to reviewing absolute and relative fund performance, the Independent Trustees periodically consider the appropriateness of fund performance metrics in evaluating the results achieved. In general, the Independent Trustees believe that fund performance should be evaluated based on net performance (after fees and expenses) of both the highest performing and lowest performing fund share classes, where applicable, compared to appropriate benchmark indices, over appropriate time periods that may include full market cycles, and compared to peer groups, as applicable, over the same periods, taking into account relevant factors including the following: general market conditions; issuer-specific information; and fund cash flows and other factors.
The Independent Trustees recognize that shareholders evaluate performance on a net basis over their own holding periods, for which one-, three-, and five-year periods are often used as a proxy. For this reason, the performance information reviewed by the Board also included net cumulative calendar year total return information for the fund and an appropriate benchmark index for the most recent one-, three-, and five-year periods, as shown below. A peer group is not shown below because the fund does not generally utilize a peer group for performance comparison purposes.
Fidelity OTC Portfolio
The Board also considered that the fund's management fee is subject to upward or downward adjustment depending upon whether, and to what extent, the fund's investment performance for the performance period exceeds, or is exceeded by, a securities index, thus leading to a performance adjustment for the same period. The Board noted that the performance adjustment provides FMR with a strong economic incentive to seek to achieve superior performance for the fund's shareholders and helps to more closely align the interests of FMR and the shareholders of the fund.
Based on its review, the Board concluded that the nature, extent, and quality of services provided to the fund under the Advisory Contracts should continue to benefit the shareholders of the fund.
Competitiveness of Management Fee and Total Expense Ratio. The Board considered the fund's management fee and total expense ratio compared to "mapped groups" of competitive funds and classes created for the purpose of facilitating the Trustees' competitive analysis of management fees and total expenses. Fidelity creates "mapped groups" by combining similar Broadridge investment objective categories that have comparable investment mandates. Combining Broadridge investment objective categories aids the Board's management fee and total expense ratio comparisons by broadening the competitive group used for comparison.
Management Fee. The Board considered two proprietary management fee comparisons for the 12-month periods shown in basis points (BP) in the chart below. The group of Broadridge funds used by the Board for management fee comparisons is referred to below as the "Total Mapped Group." The Total Mapped Group comparison focuses on a fund's standing in terms of gross management fees before expense reimbursements or caps, and without giving effect to the fund's performance adjustment, relative to the total universe of funds with comparable investment mandates, regardless of whether their management fee structures also are comparable. Funds with comparable investment mandates offer exposure to similar types of securities. Funds with comparable management fee structures have similar management fee contractual arrangements (
e.g., flat rate charged for advisory services, all-inclusive fee rate,
etc.). "TMG %" represents the percentage of funds in the Total Mapped Group that had management fees that were lower than the fund's. For example, a hypothetical TMG % of 20% would mean that 80% of the funds in the Total Mapped Group had higher, and 20% had lower, management fees than the fund. The fund's actual TMG %s and the number of funds in the Total Mapped Group are in the chart below. The "Asset-Size Peer Group" (ASPG) comparison focuses on a fund's standing relative to a subset of non-Fidelity funds within the Total Mapped Group that are similar in size and management fee structure without taking into account performance adjustments, if any. For example, if a fund is in the first quartile of the ASPG, the fund's management fee ranks in the least expensive or lowest 25% of funds in the ASPG. The ASPG represents at least 15% of the funds in the Total Mapped Group with comparable asset size and management fee structures, subject to a minimum of 50 funds (or all funds in the Total Mapped Group if fewer than 50). Additional information, such as the ASPG quartile in which the fund's management fee rate ranked and the impact of the fund's performance adjustment, is also included in the chart and considered by the Board.
Fidelity OTC Portfolio
The Board noted that the fund's management fee rate ranked below the median of its Total Mapped Group and below the median of its ASPG for 2015. The Board also noted the effect of the fund's performance adjustment, if any, on the fund's management fee ranking.
The Board noted that, in 2014, the ad hoc Committee on Group Fee was formed by it and the boards of other Fidelity funds to conduct an in-depth review of the "group fee" component of the management fee of funds with such management fee structures. The Committee's focus included the mechanics of the group fee, the competitive landscape of group fee structures, Fidelity funds with no group fee component and investment products not included in group fee assets. The Board also considered that, for funds subject to the group fee, FMR agreed to voluntarily waive fees over a specified period of time in amounts designed to account for assets converted from certain funds to certain collective investment trusts.
The Board also noted that, in 2013, the ad hoc Committee on Management Fees was formed to conduct an in-depth review of the management fee rates of Fidelity's active equity mutual funds. The Committee focused on the following areas: (i) standard fee structures; (ii) research consumption and trading evolution; (iii) management fee competitiveness/profitability by category; and (iv) factors that drive institutional pricing.
Based on its review, the Board concluded that the fund's management fee is fair and reasonable in light of the services that the fund receives and the other factors considered.
Total Expense Ratio. In its review of each class's total expense ratio, the Board considered the fund's management fee rate as well as other fund or class expenses, as applicable, such as transfer agent fees, pricing and bookkeeping fees, and custodial, legal, and audit fees. The Board noted the impact of the fund's performance adjustment. The Board also noted that Fidelity may agree to waive fees and expenses from time to time, and the extent to which, if any, it has done so for the fund. As part of its review, the Board also considered the current and historical total expense ratios of each class of the fund compared to competitive fund median expenses. Each class of the fund is compared to those funds and classes in the Total Mapped Group (used by the Board for management fee comparisons) that have a similar sales load structure.
The Board noted that the total expense ratio of each class ranked below the competitive median for 2015.
Fees Charged to Other Fidelity Clients. The Board also considered Fidelity fee structures and other information with respect to clients of Fidelity, such as other funds advised or subadvised by Fidelity, pension plan clients, and other institutional clients with similar mandates. The Board noted the findings of the 2013 ad hoc joint committee (created with the board of other Fidelity funds), which reviewed and compared Fidelity's institutional investment advisory business with its business of providing services to the Fidelity funds, including the differences in services provided, fees charged, and costs incurred, as well as competition in their respective marketplaces.
Based on its review of total expense ratios and fees charged to other Fidelity clients, the Board concluded that the total expense ratio of each class of the fund was reasonable in light of the services that the fund and its shareholders receive and the other factors considered.
Costs of the Services and Profitability. The Board considered the revenues earned and the expenses incurred by Fidelity in conducting the business of developing, marketing, distributing, managing, administering and servicing the fund and servicing the fund's shareholders. The Board also considered the level of Fidelity's profits in respect of all the Fidelity funds.
On an annual basis, Fidelity presents to the Board information about the profitability of its relationship with the fund. Fidelity calculates profitability information for each fund, as well as aggregate profitability information for groups of Fidelity funds and all Fidelity funds, using a series of detailed revenue and cost allocation methodologies which originate with the books and records of Fidelity on which Fidelity's audited financial statements are based. The Audit Committee of the Board reviews any significant changes from the prior year's methodologies.
PricewaterhouseCoopers LLP (PwC), independent registered public accounting firm and auditor to Fidelity and certain Fidelity funds, has been engaged annually by the Board as part of the Board's assessment of Fidelity's profitability analysis. PwC's engagement includes the review and assessment of the methodologies used by Fidelity in determining the revenues and expenses attributable to Fidelity's mutual fund business, and completion of agreed-upon procedures in respect of the mathematical accuracy of the fund profitability information and its conformity to established allocation methodologies. After considering PwC's reports issued under the engagement and information provided by Fidelity, the Board concluded that while other allocation methods may also be reasonable, Fidelity's profitability methodologies are reasonable in all material respects.
The Board also reviewed Fidelity's non-fund businesses and fall-out benefits related to the mutual fund business as well as cases where Fidelity's affiliates may benefit from or be related to the fund's business.
The Board considered the costs of the services provided by and the profits realized by Fidelity in connection with the operation of the fund and was satisfied that the profitability was not excessive.
Economies of Scale. The Board considered whether there have been economies of scale in respect of the management of the Fidelity funds, whether the Fidelity funds (including the fund) have appropriately benefited from any such economies of scale, and whether there is potential for realization of any further economies of scale. The Board considered the extent to which the fund will benefit from economies of scale as assets grow through increased services to the fund, through waivers or reimbursements, or through fee or expense ratio reductions. The Board also noted that in 2013, it and the boards of other Fidelity funds created an ad hoc committee (the Economies of Scale Committee) to analyze whether Fidelity attains economies of scale in respect of the management and servicing of the Fidelity funds, whether the Fidelity funds have appropriately benefited from such economies of scale, and whether there is potential for realization of any further economies of scale.
The Board recognized that the fund's management contract incorporates a "group fee" structure, which provides for lower group fee rates as total group assets increase, and for higher group fee rates as total group assets decrease (with "group assets" defined to include fund assets under FMR's management plus the assets of sector funds previously under FMR's management). FMR calculates the group fee rates based on a tiered asset "breakpoint" schedule that varies based on asset class. The Board considered that the group fee is designed to deliver the benefits of economies of scale to fund shareholders when total Fidelity fund assets increase, even if assets of any particular fund are unchanged or have declined, because some portion of Fidelity's costs are attributable to services provided to all Fidelity funds, and all funds benefit if those costs can be allocated among more assets. The Board concluded that, given the group fee structure, fund shareholders will benefit from lower management fees as group assets increase at the fund complex level, regardless of whether Fidelity achieves any such economies of scale.
The Board concluded, taking into account the analysis of the Economies of Scale Committee, that economies of scale, if any, are being appropriately shared between fund shareholders and Fidelity.
Additional Information Requested by the Board. In order to develop fully the factual basis for consideration of the Fidelity funds' Advisory Contracts, the Board requested and received additional information on certain topics, including: (i) fund performance trends and Fidelity's long-term strategies for certain funds; (ii) the various share classes employed by Fidelity and the attributes of each class, together with similar information on the distribution and servicing payments made by Fidelity or the funds to third-party participants in the distribution channels; (iii) fund profitability, and fund performance in relation to fund profitability; (iv) the methodology with respect to evaluating competitive fund data and peer group classifications and fee comparisons; (v) annual fund profitability margins; (vi) the realization of fall-out benefits in and attribution of fall-out benefits to certain Fidelity business units; (vii) the appropriateness of certain funds' benchmarks; (viii) the rationalization for certain share classes and expenses; (ix) sub-advisory fee rates for comparable investment mandates; (x) product strategy for certain underperforming funds; and (xi) Fidelity's resources and strategy for cybersecurity.
Based on its evaluation of all of the conclusions noted above, and after considering all factors it believed relevant, the Board concluded that the advisory fee structures are fair and reasonable, and that the fund's Advisory Contracts should be renewed.
Corporate Headquarters
245 Summer St.
Boston, MA 02210
www.fidelity.com
OTC-K-ANN-0916
1.863306.107
Fidelity® Leveraged Company Stock Fund Class K
Annual Report July 31, 2016 |
|
Contents
To view a fund's proxy voting guidelines and proxy voting record for the 12-month period ended June 30, visit http://www.fidelity.com/proxyvotingresults or visit the Securities and Exchange Commission's (SEC) web site at http://www.sec.gov.
You may also call 1-800-835-5092 to request a free copy of the proxy voting guidelines.
Standard & Poor's, S&P and S&P 500 are registered service marks of The McGraw-Hill Companies, Inc. and have been licensed for use by Fidelity Distributors Corporation.
Other third-party marks appearing herein are the property of their respective owners.
All other marks appearing herein are registered or unregistered trademarks or service marks of FMR LLC or an affiliated company. © 2016 FMR LLC. All rights reserved.
This report and the financial statements contained herein are submitted for the general information of the shareholders of the Fund. This report is not authorized for distribution to prospective investors in the Fund unless preceded or accompanied by an effective prospectus.
A fund files its complete schedule of portfolio holdings with the SEC for the first and third quarters of each fiscal year on Form N-Q. Forms N-Q are available on the SEC’s web site at http://www.sec.gov. A fund's Forms N-Q may be reviewed and copied at the SEC’s Public Reference Room in Washington, DC. Information regarding the operation of the SEC's Public Reference Room may be obtained by calling 1-800-SEC-0330.
For a complete list of a fund's portfolio holdings, view the most recent holdings listing, semiannual report, or annual report on Fidelity's web site at http://www.fidelity.com, http://www.institutional.fidelity.com, or http://www.401k.com, as applicable.
NOT FDIC INSURED •MAY LOSE VALUE •NO BANK GUARANTEE
Neither the Fund nor Fidelity Distributors Corporation is a bank.
Performance: The Bottom Line
Average annual total return reflects the change in the value of an investment, assuming reinvestment of distributions from dividend income and capital gains (the profits earned upon the sale of securities that have grown in value, if any) and assuming a constant rate of performance each year. The hypothetical investment and the average annual total returns do not reflect the deduction of taxes that a shareholder would pay on fund distributions or the redemption of fund shares. During periods of reimbursement by Fidelity, a fund’s total return will be greater than it would be had the reimbursement not occurred. How a fund did yesterday is no guarantee of how it will do tomorrow.
Average Annual Total Returns
| For the periods ended July 31, 2016 | Past 1 year | Past 5 years | Past 10 years |
| Class K | (7.14)% | 9.35% | 6.37% |
The initial offering of Class K shares took place on May 9, 2008. Returns prior to May 9, 2008 are those of Fidelity® Leveraged Company Stock Fund, the original class of the fund.
$10,000 Over 10 Years
Let's say hypothetically that $10,000 was invested in Fidelity® Leveraged Company Stock Fund - Class K on July 31, 2006.
The chart shows how the value of your investment would have changed, and also shows how the S&P 500® Index performed over the same period.
See previous page for additional information regarding the performance of Class K.
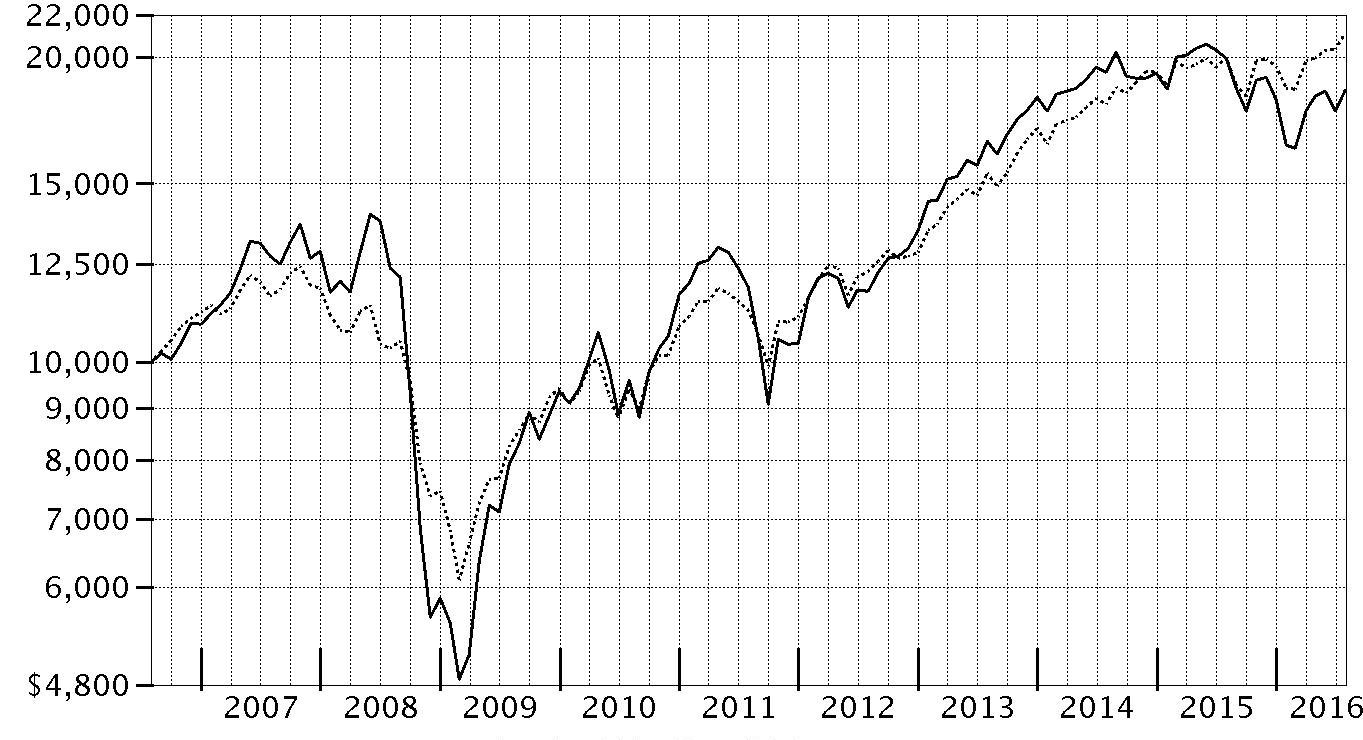
| Period Ending Values |
| $18,536 | Fidelity® Leveraged Company Stock Fund - Class K |
| $21,089 | S&P 500® Index |
Management's Discussion of Fund Performance
Market Recap: U.S. equities gained modestly for the year ending July 31, 2016, overcoming persistent concern about global economic growth, uncertainty regarding U.S. monetary policy and the U.K.’s late-June vote to leave the European Union, dubbed Brexit. The S&P 500 index rose 5.61%, with larger-cap, value-oriented stocks and defensive sectors shining brightest. Volatility peaked in the early weeks of 2016, as continued oil-price weakness and U.S.-dollar strength pushed the S&P 500
® to its worst January since 2009. Markets then rose beginning in February amid U.S. job gains, a broad rally in energy and materials markets, global economic stimulus and perceived softening of monetary policy by the U.S. Federal Reserve. The June 23 Brexit vote surprised markets and resulted in a sharp two-day decline for stocks, followed by a rebound as investor sentiment shifted and remained positive through July 31. For the year, dividend-rich telecom services (+26%), utilities (+23%) and consumer staples (+12%) led the way amid strong investor demand for yield. Industrials (+10%) and information technology (+10%) also outperformed, as did materials (+8%), despite a weak commodities environment overall. Conversely, a strong run for real estate stocks couldn’t keep financials (-4%) from losing ground, as low interest rates continued to squeeze bank profits.
Comments from Portfolio Manager Tom Soviero: For the 12-month period, the fund’s share classes returned about -7%, lagging the gain of the S&P 500
® but topping the -7.98% result of the Credit Suisse Leveraged Equity Index. Security selection accounted for most of the fund’s underperformance of the S&P 500
®, with all 10 sectors detracting. The largest negative impact came from picks in the materials, consumer discretionary, health care, financials and industrials sectors. Our biggest individual disappointment was Netherlands-based LyondellBasell Industries, a multinational plastics, chemicals and refining company that also was our largest position and about 8% of assets this period. Low oil prices and concern that increased ethylene supply would pressure pricing led to the stock’s double-digit decline. In health care, our investments in Community Health Systems and Tenet Healthcare took a beating as investors grew increasingly worried that fewer privately insured patients, a greater number of uninsured patients and rising labor costs could hurt hospital operators’ profits. By contrast, medical supplies and devices company Boston Scientific was our top contributor by a wide margin, benefiting from the launch of new products, expansion overseas, the settlement of a pending lawsuit and ongoing cost reductions.
The views expressed above reflect those of the portfolio manager(s) only through the end of the period as stated on the cover of this report and do not necessarily represent the views of Fidelity or any other person in the Fidelity organization. Any such views are subject to change at any time based upon market or other conditions and Fidelity disclaims any responsibility to update such views. These views may not be relied on as investment advice and, because investment decisions for a Fidelity fund are based on numerous factors, may not be relied on as an indication of trading intent on behalf of any Fidelity fund.
Investment Summary (Unaudited)
Top Ten Stocks as of July 31, 2016
| | % of fund's net assets | % of fund's net assets 6 months ago |
| LyondellBasell Industries NV Class A | 7.8 | 8.1 |
| Service Corp. International | 7.1 | 6.2 |
| Boston Scientific Corp. | 6.0 | 4.3 |
| WestRock Co. | 3.2 | 2.6 |
| General Motors Co. | 3.2 | 2.7 |
| NXP Semiconductors NV | 3.1 | 2.0 |
| Bank of America Corp. | 3.1 | 3.0 |
| Delta Air Lines, Inc. | 2.9 | 3.2 |
| Tenet Healthcare Corp. | 2.6 | 2.3 |
| Comcast Corp. Class A | 2.4 | 2.7 |
| | 41.4 | |
Top Five Market Sectors as of July 31, 2016
| | % of fund's net assets | % of fund's net assets 6 months ago |
| Consumer Discretionary | 23.8 | 24.9 |
| Health Care | 17.4 | 14.8 |
| Materials | 14.6 | 13.9 |
| Financials | 12.1 | 11.6 |
| Industrials | 9.6 | 12.4 |
Asset Allocation (% of fund's net assets)
| As of July 31, 2016* |
| | Stocks | 96.1% |
| | Bonds | 0.7% |
| | Short-Term Investments and Net Other Assets (Liabilities) | 3.2% |

* Foreign investments - 15.9%
| As of January 31, 2016* |
| | Stocks | 97.8% |
| | Bonds | 0.2% |
| | Short-Term Investments and Net Other Assets (Liabilities) | 2.0% |

* Foreign investments - 14.8%
Investments July 31, 2016
Showing Percentage of Net Assets
| Common Stocks - 96.1% | | | |
| | | Shares | Value (000s) |
| CONSUMER DISCRETIONARY - 23.8% | | | |
| Auto Components - 2.6% | | | |
| Delphi Automotive PLC | | 490,700 | $33,279 |
| Hertz Global Holdings, Inc. (a) | | 420,040 | 20,448 |
| Tenneco, Inc. (a) | | 674,800 | 38,140 |
| | | | 91,867 |
| Automobiles - 4.8% | | | |
| Ford Motor Co. | | 3,862,533 | 48,900 |
| General Motors Co. | | 3,448,107 | 108,753 |
| General Motors Co. warrants 7/10/19 (a) | | 482,521 | 6,572 |
| | | | 164,225 |
| Diversified Consumer Services - 7.1% | | | |
| Service Corp. International | | 8,773,727 | 243,208 |
| Hotels, Restaurants & Leisure - 0.7% | | | |
| ARAMARK Holdings Corp. | | 494,844 | 17,740 |
| Penn National Gaming, Inc. (a) | | 360,340 | 5,412 |
| Red Rock Resorts, Inc. | | 5,847 | 128 |
| | | | 23,280 |
| Household Durables - 2.9% | | | |
| Lennar Corp. Class A | | 677,100 | 31,688 |
| Newell Brands, Inc. | | 1,287,247 | 67,529 |
| | | | 99,217 |
| Media - 5.0% | | | |
| Cinemark Holdings, Inc. | | 1,853,345 | 69,686 |
| Comcast Corp. Class A | | 1,223,934 | 82,310 |
| Gray Television, Inc. (a) | | 1,232,064 | 12,197 |
| Nexstar Broadcasting Group, Inc. Class A (b) | | 178,698 | 9,033 |
| | | | 173,226 |
| Specialty Retail - 0.7% | | | |
| Sally Beauty Holdings, Inc. (a) | | 808,000 | 23,699 |
|
| TOTAL CONSUMER DISCRETIONARY | | | 818,722 |
|
| CONSUMER STAPLES - 2.5% | | | |
| Food Products - 2.0% | | | |
| ConAgra Foods, Inc. | | 541,700 | 25,330 |
| Darling International, Inc. (a) | | 2,698,383 | 42,580 |
| | | | 67,910 |
| Personal Products - 0.5% | | | |
| Revlon, Inc. (a) | | 553,261 | 19,635 |
|
| TOTAL CONSUMER STAPLES | | | 87,545 |
|
| ENERGY - 6.0% | | | |
| Energy Equipment & Services - 1.8% | | | |
| Halliburton Co. | | 1,126,593 | 49,187 |
| SAExploration Holdings, Inc. (c) | | 419,175 | 4,611 |
| Schlumberger Ltd. | | 109,400 | 8,809 |
| | | | 62,607 |
| Oil, Gas & Consumable Fuels - 4.2% | | | |
| Continental Resources, Inc. (a) | | 1,184,374 | 52,172 |
| Hess Corp. | | 825,110 | 44,267 |
| QEP Resources, Inc. | | 901,000 | 16,398 |
| Range Resources Corp. (b) | | 465,400 | 18,760 |
| Whiting Petroleum Corp. (a) | | 1,439,895 | 10,612 |
| | | | 142,209 |
|
| TOTAL ENERGY | | | 204,816 |
|
| FINANCIALS - 12.1% | | | |
| Banks - 9.5% | | | |
| Bank of America Corp. | | 7,243,199 | 104,954 |
| Barclays PLC sponsored ADR (b) | | 2,083,121 | 17,165 |
| CIT Group, Inc. | | 229,310 | 7,925 |
| Citigroup, Inc. | | 1,664,147 | 72,906 |
| Huntington Bancshares, Inc. | | 4,806,680 | 45,663 |
| Regions Financial Corp. | | 4,496,280 | 41,231 |
| SunTrust Banks, Inc. | | 895,500 | 37,871 |
| | | | 327,715 |
| Consumer Finance - 1.0% | | | |
| American Express Co. | | 542,948 | 34,998 |
| Insurance - 0.6% | | | |
| Lincoln National Corp. | | 435,700 | 19,027 |
| Real Estate Investment Trusts - 1.0% | | | |
| Gaming & Leisure Properties | | 430,875 | 15,438 |
| Host Hotels & Resorts, Inc. | | 1,016,122 | 18,026 |
| | | | 33,464 |
|
| TOTAL FINANCIALS | | | 415,204 |
|
| HEALTH CARE - 17.4% | | | |
| Health Care Equipment & Supplies - 6.0% | | | |
| Boston Scientific Corp. (a) | | 8,457,056 | 205,337 |
| Health Care Providers & Services - 6.7% | | | |
| Community Health Systems, Inc. (a)(b) | | 1,213,027 | 15,490 |
| DaVita HealthCare Partners, Inc. (a) | | 532,952 | 41,325 |
| HCA Holdings, Inc. (a) | | 532,479 | 41,070 |
| Tenet Healthcare Corp. (a) | | 2,965,644 | 90,778 |
| Universal Health Services, Inc. Class B | | 334,505 | 43,328 |
| | | | 231,991 |
| Life Sciences Tools & Services - 0.9% | | | |
| PRA Health Sciences, Inc. (a) | | 651,400 | 30,212 |
| Pharmaceuticals - 3.8% | | | |
| Merck & Co., Inc. | | 1,390,800 | 81,584 |
| Valeant Pharmaceuticals International, Inc. (Canada) (a) | | 2,200,900 | 49,080 |
| | | | 130,664 |
|
| TOTAL HEALTH CARE | | | 598,204 |
|
| INDUSTRIALS - 9.6% | | | |
| Aerospace & Defense - 1.7% | | | |
| Huntington Ingalls Industries, Inc. | | 210,260 | 36,287 |
| Textron, Inc. | | 602,700 | 23,505 |
| | | | 59,792 |
| Airlines - 3.8% | | | |
| American Airlines Group, Inc. | | 860,580 | 30,551 |
| Delta Air Lines, Inc. | | 2,531,601 | 98,100 |
| | | | 128,651 |
| Building Products - 0.5% | | | |
| Allegion PLC | | 246,500 | 17,844 |
| Commercial Services & Supplies - 0.9% | | | |
| Civeo Corp. (a) | | 540,932 | 741 |
| Deluxe Corp. | | 431,413 | 29,159 |
| | | | 29,900 |
| Electrical Equipment - 0.8% | | | |
| Emerson Electric Co. | | 163,500 | 9,140 |
| Generac Holdings, Inc. (a)(b) | | 490,557 | 18,538 |
| | | | 27,678 |
| Machinery - 1.4% | | | |
| Ingersoll-Rand PLC | | 648,800 | 42,989 |
| Pentair PLC | | 78,757 | 5,026 |
| | | | 48,015 |
| Marine - 0.0% | | | |
| Genco Shipping & Trading Ltd. (a) | | 831 | 5 |
| Trading Companies & Distributors - 0.5% | | | |
| Herc Holdings, Inc. (a) | | 140,013 | 4,949 |
| United Rentals, Inc. (a) | | 147,000 | 11,711 |
| | | | 16,660 |
|
| TOTAL INDUSTRIALS | | | 328,545 |
|
| INFORMATION TECHNOLOGY - 8.5% | | | |
| Electronic Equipment & Components - 2.3% | | | |
| Avnet, Inc. | | 594,313 | 24,426 |
| Belden, Inc. | | 510,764 | 37,393 |
| Corning, Inc. | | 726,800 | 16,149 |
| | | | 77,968 |
| Semiconductors & Semiconductor Equipment - 4.5% | | | |
| Intersil Corp. Class A | | 1,460,387 | 22,315 |
| Micron Technology, Inc. (a) | | 2,079,945 | 28,578 |
| NXP Semiconductors NV (a) | | 1,259,664 | 105,925 |
| | | | 156,818 |
| Software - 0.6% | | | |
| Citrix Systems, Inc. (a) | | 230,899 | 20,580 |
| Technology Hardware, Storage & Peripherals - 1.1% | | | |
| NCR Corp. (a) | | 1,117,931 | 36,858 |
|
| TOTAL INFORMATION TECHNOLOGY | | | 292,224 |
|
| MATERIALS - 14.2% | | | |
| Chemicals - 8.3% | | | |
| Ingevity Corp. (a) | | 431,788 | 16,525 |
| LyondellBasell Industries NV Class A | | 3,565,555 | 268,348 |
| Phosphate Holdings, Inc. (a) | | 307,500 | 2 |
| | | | 284,875 |
| Containers & Packaging - 3.9% | | | |
| Sealed Air Corp. | | 483,434 | 22,808 |
| WestRock Co. | | 2,590,728 | 111,168 |
| | | | 133,976 |
| Metals & Mining - 1.0% | | | |
| Alcoa, Inc. | | 1,432,700 | 15,215 |
| Freeport-McMoRan, Inc. | | 1,514,400 | 19,627 |
| Ormet Corp. (a)(d) | | 1,075,000 | 0 |
| | | | 34,842 |
| Paper & Forest Products - 1.0% | | | |
| Kapstone Paper & Packaging Corp. | | 989,200 | 14,126 |
| Neenah Paper, Inc. | | 266,200 | 20,079 |
| | | | 34,205 |
|
| TOTAL MATERIALS | | | 487,898 |
|
| TELECOMMUNICATION SERVICES - 1.6% | | | |
| Diversified Telecommunication Services - 1.6% | | | |
| Frontier Communications Corp. | | 5,528,256 | 28,747 |
| Level 3 Communications, Inc. (a) | | 514,400 | 26,029 |
| | | | 54,776 |
| UTILITIES - 0.4% | | | |
| Electric Utilities - 0.4% | | | |
| FirstEnergy Corp. | | 421,304 | 14,712 |
| TOTAL COMMON STOCKS | | | |
| (Cost $2,124,443) | | | 3,302,646 |
| | | Principal Amount (000s) | Value (000s) |
|
| Nonconvertible Bonds - 0.7% | | | |
| ENERGY - 0.3% | | | |
| Energy Equipment & Services - 0.1% | | | |
| SAExploration Holdings, Inc. 10% 4/14/19 (c) | | 5,004 | 3,502 |
| Oil, Gas & Consumable Fuels - 0.2% | | | |
| Chesapeake Energy Corp. 8% 12/15/22 (c) | | 7,680 | 6,682 |
|
| TOTAL ENERGY | | | 10,184 |
|
| MATERIALS - 0.4% | | | |
| Metals & Mining - 0.4% | | | |
| Freeport-McMoRan, Inc.: | | | |
| 3.55% 3/1/22 | | 7,675 | 6,562 |
| 3.875% 3/15/23 | | 7,675 | 6,601 |
| | | | 13,163 |
| TOTAL NONCONVERTIBLE BONDS | | | |
| (Cost $16,468) | | | 23,347 |
| | | Shares | Value (000s) |
|
| Money Market Funds - 3.8% | | | |
| Fidelity Cash Central Fund, 0.42% (e) | | 119,437,198 | 119,437 |
| Fidelity Securities Lending Cash Central Fund, 0.45% (e)(f) | | 9,990,000 | 9,990 |
| TOTAL MONEY MARKET FUNDS | | | |
| (Cost $129,427) | | | 129,427 |
| TOTAL INVESTMENT PORTFOLIO - 100.6% | | | |
| (Cost $2,270,338) | | | 3,455,420 |
| NET OTHER ASSETS (LIABILITIES) - (0.6)% | | | (20,677) |
| NET ASSETS - 100% | | | $3,434,743 |
Values shown as $0 may reflect amounts less than $500.
Legend
(a) Non-income producing
(b) Security or a portion of the security is on loan at period end.
(c) Security exempt from registration under Rule 144A of the Securities Act of 1933. These securities may be resold in transactions exempt from registration, normally to qualified institutional buyers. At the end of the period, the value of these securities amounted to $14,795,000 or 0.4% of net assets.
(d) Affiliated company
(e) Affiliated fund that is generally available only to investment companies and other accounts managed by Fidelity Investments. The rate quoted is the annualized seven-day yield of the fund at period end. A complete unaudited listing of the fund's holdings as of its most recent quarter end is available upon request. In addition, each Fidelity Central Fund's financial statements, which are not covered by the Fund's Report of Independent Registered Public Accounting Firm, are available on the SEC's website or upon request.
(f) Investment made with cash collateral received from securities on loan.
Affiliated Central Funds
Information regarding fiscal year to date income earned by the Fund from investments in Fidelity Central Funds is as follows:
| Fund | Income earned |
| | (Amounts in thousands) |
| Fidelity Cash Central Fund | $314 |
| Fidelity Securities Lending Cash Central Fund | 1,199 |
| Total | $1,513 |
Other Affiliated Issuers
An affiliated company is a company in which the Fund has ownership of at least 5% of the voting securities. Fiscal year to date transactions with companies which are or were affiliates are as follows:
| Affiliate (Amounts in thousands) | Value, beginning of period | Purchases | Sales Proceeds | Dividend Income | Value, end of period |
| Gray Television, Inc. | $63,611 | $-- | $30,602 | $-- | $-- |
| OMNOVA Solutions, Inc. | 20,154 | -- | 15,824 | -- | -- |
| Ormet Corp. | 5 | -- | -- | -- | 0 |
| SAExploration Holdings, Inc. | -- | -- | 248 | -- | -- |
| Total | $83,770 | $-- | $46,674 | $-- | $0 |
Investment Valuation
The following is a summary of the inputs used, as of July 31, 2016, involving the Fund's assets and liabilities carried at fair value. The inputs or methodology used for valuing securities may not be an indication of the risk associated with investing in those securities. For more information on valuation inputs, and their aggregation into the levels used below, please refer to the Investment Valuation section in the accompanying Notes to Financial Statements.
| | Valuation Inputs at Reporting Date: |
| Description | Total | Level 1 | Level 2 | Level 3 |
| (Amounts in thousands) | | | | |
| Investments in Securities: | | | | |
| Equities: | | | | |
| Consumer Discretionary | $818,722 | $818,594 | $128 | $-- |
| Consumer Staples | 87,545 | 87,545 | -- | -- |
| Energy | 204,816 | 204,816 | -- | -- |
| Financials | 415,204 | 415,204 | -- | -- |
| Health Care | 598,204 | 598,204 | -- | -- |
| Industrials | 328,545 | 328,545 | -- | -- |
| Information Technology | 292,224 | 292,224 | -- | -- |
| Materials | 487,898 | 487,898 | -- | -- |
| Telecommunication Services | 54,776 | 54,776 | -- | -- |
| Utilities | 14,712 | 14,712 | -- | -- |
| Corporate Bonds | 23,347 | -- | 23,347 | -- |
| Money Market Funds | 129,427 | 129,427 | -- | -- |
| Total Investments in Securities: | $3,455,420 | $3,431,945 | $23,475 | $-- |
Other Information
Distribution of investments by country or territory of incorporation, as a percentage of Total Net Assets, is as follows (Unaudited):
| United States of America | 84.1% |
| Netherlands | 10.9% |
| Ireland | 1.9% |
| Canada | 1.4% |
| Others (Individually Less Than 1%) | 1.7% |
| | 100.0% |
See accompanying notes which are an integral part of the financial statements.
Financial Statements
Statement of Assets and Liabilities
| Amounts in thousands (except per-share amounts) | | July 31, 2016 |
| Assets | | |
Investment in securities, at value (including securities loaned of $9,637) — See accompanying schedule:
Unaffiliated issuers (cost $2,120,355) | $3,325,993 | |
| Fidelity Central Funds (cost $129,427) | 129,427 | |
| Other affiliated issuers (cost $20,556) | 0 | |
| Total Investments (cost $2,270,338) | | $3,455,420 |
| Receivable for fund shares sold | | 885 |
| Dividends receivable | | 1,274 |
| Interest receivable | | 345 |
| Distributions receivable from Fidelity Central Funds | | 55 |
| Other receivables | | 46 |
| Total assets | | 3,458,025 |
| Liabilities | | |
| Payable for fund shares redeemed | $11,009 | |
| Accrued management fee | 1,714 | |
| Other affiliated payables | 508 | |
| Other payables and accrued expenses | 61 | |
| Collateral on securities loaned, at value | 9,990 | |
| Total liabilities | | 23,282 |
| Net Assets | | $3,434,743 |
| Net Assets consist of: | | |
| Paid in capital | | $2,041,379 |
| Undistributed net investment income | | 19,397 |
| Accumulated undistributed net realized gain (loss) on investments and foreign currency transactions | | 188,885 |
| Net unrealized appreciation (depreciation) on investments | | 1,185,082 |
| Net Assets | | $3,434,743 |
| Leveraged Company Stock: | | |
| Net Asset Value, offering price and redemption price per share ($2,861,447 ÷ 70,346 shares) | | $40.68 |
| Class K: | | |
| Net Asset Value, offering price and redemption price per share ($573,296 ÷ 14,065 shares) | | $40.76 |
See accompanying notes which are an integral part of the financial statements.
Statement of Operations
| Amounts in thousands | | Year ended July 31, 2016 |
| Investment Income | | |
| Dividends | | $65,759 |
| Interest | | 2,380 |
| Income from Fidelity Central Funds | | 1,513 |
| Total income | | 69,652 |
| Expenses | | |
| Management fee | $22,785 | |
| Transfer agent fees | 5,511 | |
| Accounting and security lending fees | 1,055 | |
| Custodian fees and expenses | 32 | |
| Independent trustees' fees and expenses | 17 | |
| Registration fees | 51 | |
| Audit | 65 | |
| Legal | 18 | |
| Miscellaneous | 34 | |
| Total expenses before reductions | 29,568 | |
| Expense reductions | (123) | 29,445 |
| Net investment income (loss) | | 40,207 |
| Realized and Unrealized Gain (Loss) | | |
| Net realized gain (loss) on: | | |
| Investment securities: | | |
| Unaffiliated issuers | 300,346 | |
| Other affiliated issuers | (9,340) | |
| Foreign currency transactions | 2 | |
| Total net realized gain (loss) | | 291,008 |
| Change in net unrealized appreciation (depreciation) on investment securities | | (703,593) |
| Net gain (loss) | | (412,585) |
| Net increase (decrease) in net assets resulting from operations | | $(372,378) |
See accompanying notes which are an integral part of the financial statements.
Statement of Changes in Net Assets
| Amounts in thousands | Year ended July 31, 2016 | Year ended July 31, 2015 |
| Increase (Decrease) in Net Assets | | |
| Operations | | |
| Net investment income (loss) | $40,207 | $45,844 |
| Net realized gain (loss) | 291,008 | 235,817 |
| Change in net unrealized appreciation (depreciation) | (703,593) | (131,060) |
| Net increase (decrease) in net assets resulting from operations | (372,378) | 150,601 |
| Distributions to shareholders from net investment income | (39,813) | (41,090) |
| Distributions to shareholders from net realized gain | (240,243) | – |
| Total distributions | (280,056) | (41,090) |
| Share transactions - net increase (decrease) | (659,264) | (743,092) |
| Redemption fees | 156 | 302 |
| Total increase (decrease) in net assets | (1,311,542) | (633,279) |
| Net Assets | | |
| Beginning of period | 4,746,285 | 5,379,564 |
| End of period | $3,434,743 | $4,746,285 |
| Other Information | | |
| Undistributed net investment income end of period | $19,397 | $24,974 |
See accompanying notes which are an integral part of the financial statements.
Financial Highlights — Fidelity Leveraged Company Stock Fund
| Years ended July 31, | 2016 | 2015 | 2014 | 2013 | 2012 |
| Selected Per–Share Data | | | | | |
| Net asset value, beginning of period | $46.90 | $45.82 | $39.44 | $28.22 | $28.85 |
| Income from Investment Operations | | | | | |
| Net investment income (loss)A | .41 | .41 | .34 | .42B | .16 |
| Net realized and unrealized gain (loss) | (3.77) | 1.01 | 6.31 | 10.92 | (.50) |
| Total from investment operations | (3.36) | 1.42 | 6.65 | 11.34 | (.34) |
| Distributions from net investment income | (.40) | (.34) | (.27) | (.12) | (.29) |
| Distributions from net realized gain | (2.46) | – | – | – | – |
| Total distributions | (2.86) | (.34) | (.27) | (.12) | (.29) |
| Redemption fees added to paid in capitalA,C | – | – | – | – | – |
| Net asset value, end of period | $40.68 | $46.90 | $45.82 | $39.44 | $28.22 |
| Total ReturnD | (7.23)% | 3.12% | 16.96% | 40.31% | (1.05)% |
| Ratios to Average Net AssetsE,F | | | | | |
| Expenses before reductions | .80% | .79% | .79% | .82% | .86% |
| Expenses net of fee waivers, if any | .80% | .78% | .79% | .82% | .86% |
| Expenses net of all reductions | .80% | .78% | .79% | .82% | .85% |
| Net investment income (loss) | 1.03% | .87% | .81% | 1.25%B | .60% |
| Supplemental Data | | | | | |
| Net assets, end of period (in millions) | $2,861 | $3,755 | $4,207 | $4,227 | $3,009 |
| Portfolio turnover rateG | 9% | 4% | 10% | 21% | 29% |
A Calculated based on average shares outstanding during the period.
B Net Investment income per share reflects a large, non-recurring dividend which amounted to $.08 per share. Excluding this non-recurring dividend, the ratio of net investment income (loss) to average net assets would have been 1.03%.
C Amount represents less than $.005 per share.
D Total returns would have been lower if certain expenses had not been reduced during the applicable periods shown.
E Fees and expenses of any underlying Fidelity Central Funds are not included in the Fund's expense ratio. The Fund indirectly bears its proportionate share of the expenses of any underlying Fidelity Central Funds.
F Expense ratios reflect operating expenses of the class. Expenses before reductions do not reflect amounts reimbursed by the investment adviser or reductions from brokerage service arrangements or reductions from other expense offset arrangements and do not represent the amount paid by the class during periods when reimbursements or reductions occur. Expenses net of fee waivers reflect expenses after reimbursement by the investment adviser but prior to reductions from brokerage service arrangements or other expense offset arrangements. Expenses net of all reductions represent the net expenses paid by the class.
G Amount does not include the portfolio activity of any underlying Fidelity Central Funds.
See accompanying notes which are an integral part of the financial statements.
Financial Highlights — Fidelity Leveraged Company Stock Fund Class K
| Years ended July 31, | 2016 | 2015 | 2014 | 2013 | 2012 |
| Selected Per–Share Data | | | | | |
| Net asset value, beginning of period | $47.00 | $45.91 | $39.52 | $28.26 | $28.86 |
| Income from Investment Operations | | | | | |
| Net investment income (loss)A | .46 | .46 | .40 | .47B | .20 |
| Net realized and unrealized gain (loss) | (3.79) | 1.03 | 6.31 | 10.93 | (.49) |
| Total from investment operations | (3.33) | 1.49 | 6.71 | 11.40 | (.29) |
| Distributions from net investment income | (.45) | (.40) | (.32) | (.14) | (.31) |
| Distributions from net realized gain | (2.46) | – | – | – | – |
| Total distributions | (2.91) | (.40) | (.32) | (.14) | (.31) |
| Redemption fees added to paid in capitalA,C | – | – | – | – | – |
| Net asset value, end of period | $40.76 | $47.00 | $45.91 | $39.52 | $28.26 |
| Total ReturnD | (7.14)% | 3.26% | 17.10% | 40.47% | (.87)% |
| Ratios to Average Net AssetsE,F | | | | | |
| Expenses before reductions | .68% | .67% | .67% | .69% | .69% |
| Expenses net of fee waivers, if any | .68% | .67% | .67% | .69% | .69% |
| Expenses net of all reductions | .68% | .67% | .67% | .68% | .69% |
| Net investment income (loss) | 1.15% | .99% | .92% | 1.39%B | .76% |
| Supplemental Data | | | | | |
| Net assets, end of period (in millions) | $573 | $991 | $1,173 | $1,053 | $600 |
| Portfolio turnover rateG | 9% | 4% | 10% | 21% | 29% |
A Calculated based on average shares outstanding during the period.
B Net Investment income per share reflects a large, non-recurring dividend which amounted to $.08 per share. Excluding this non-recurring dividend, the ratio of net investment income (loss) to average net assets would have been 1.17%.
C Amount represents less than $.005 per share.
D Total returns would have been lower if certain expenses had not been reduced during the applicable periods shown.
E Fees and expenses of any underlying Fidelity Central Funds are not included in the Fund's expense ratio. The Fund indirectly bears its proportionate share of the expenses of any underlying Fidelity Central Funds.
F Expense ratios reflect operating expenses of the class. Expenses before reductions do not reflect amounts reimbursed by the investment adviser or reductions from brokerage service arrangements or reductions from other expense offset arrangements and do not represent the amount paid by the class during periods when reimbursements or reductions occur. Expenses net of fee waivers reflect expenses after reimbursement by the investment adviser but prior to reductions from brokerage service arrangements or other expense offset arrangements. Expenses net of all reductions represent the net expenses paid by the class.
G Amount does not include the portfolio activity of any underlying Fidelity Central Funds.
See accompanying notes which are an integral part of the financial statements.
Notes to Financial Statements
For the period ended July 31, 2016
(Amounts in thousands except percentages)
1. Organization.
Fidelity Leveraged Company Stock Fund (the Fund) is a fund of Fidelity Securities Fund (the Trust) and is authorized to issue an unlimited number of shares. The Trust is registered under the Investment Company Act of 1940, as amended (the 1940 Act), as an open-end management investment company organized as a Massachusetts business trust. The Fund offers Leveraged Company Stock and Class K shares, each of which has equal rights as to assets and voting privileges. Each class has exclusive voting rights with respect to matters that affect that class.
2. Investments in Fidelity Central Funds.
The Fund invests in Fidelity Central Funds, which are open-end investment companies generally available only to other investment companies and accounts managed by the investment adviser and its affiliates. The Fund's Schedule of Investments lists each of the Fidelity Central Funds held as of period end, if any, as an investment of the Fund, but does not include the underlying holdings of each Fidelity Central Fund. As an Investing Fund, the Fund indirectly bears its proportionate share of the expenses of the underlying Fidelity Central Funds.
The Money Market Central Funds seek preservation of capital and current income and are managed by Fidelity Investments Money Management, Inc. (FIMM), an affiliate of the investment adviser. Annualized expenses of the Money Market Central Funds as of their most recent shareholder report date are less than .005%.
A complete unaudited list of holdings for each Fidelity Central Fund is available upon request or at the Securities and Exchange Commission (the SEC) website at www.sec.gov. In addition, the financial statements of the Fidelity Central Funds, which are not covered by the Fund's Report of Independent Registered Public Accounting Firm, are available on the SEC website or upon request.
3. Significant Accounting Policies.
The financial statements have been prepared in conformity with accounting principles generally accepted in the United States of America (GAAP), which require management to make certain estimates and assumptions at the date of the financial statements. Actual results could differ from those estimates. Subsequent events, if any, through the date that the financial statements were issued have been evaluated in the preparation of the financial statements. The following summarizes the significant accounting policies of the Fund:
Investment Valuation. Investments are valued as of 4:00 p.m. Eastern time on the last calendar day of the period. The Board of Trustees (the Board) has delegated the day to day responsibility for the valuation of the Fund's investments to the Fidelity Management & Research Company (FMR) Fair Value Committee (the Committee). In accordance with valuation policies and procedures approved by the Board, the Fund attempts to obtain prices from one or more third party pricing vendors or brokers to value its investments. When current market prices, quotations or currency exchange rates are not readily available or reliable, investments will be fair valued in good faith by the Committee, in accordance with procedures adopted by the Board. Factors used in determining fair value vary by investment type and may include market or investment specific events, changes in interest rates and credit quality. The frequency with which these procedures are used cannot be predicted and they may be utilized to a significant extent. The Committee oversees the Fund's valuation policies and procedures and reports to the Board on the Committee's activities and fair value determinations. The Board monitors the appropriateness of the procedures used in valuing the Fund's investments and ratifies the fair value determinations of the Committee.
The Fund categorizes the inputs to valuation techniques used to value its investments into a disclosure hierarchy consisting of three levels as shown below:
- Level 1 – quoted prices in active markets for identical investments
- Level 2 – other significant observable inputs (including quoted prices for similar investments, interest rates, prepayment speeds, etc.)
- Level 3 – unobservable inputs (including the Fund's own assumptions based on the best information available)
Valuation techniques used to value the Fund's investments by major category are as follows:
Equity securities, including restricted securities, for which market quotations are readily available, are valued at the last reported sale price or official closing price as reported by a third party pricing vendor on the primary market or exchange on which they are traded and are categorized as Level 1 in the hierarchy. In the event there were no sales during the day or closing prices are not available, securities are valued at the last quoted bid price or may be valued using the last available price and are generally categorized as Level 2 in the hierarchy. For foreign equity securities, when market or security specific events arise, comparisons to the valuation of American Depositary Receipts (ADRs), futures contracts, Exchange-Traded Funds (ETFs) and certain indexes as well as quoted prices for similar securities may be used and would be categorized as Level 2 in the hierarchy. Utilizing these techniques may result in transfers between Level 1 and Level 2. For equity securities, including restricted securities, where observable inputs are limited, assumptions about market activity and risk are used and these securities may be categorized as Level 3 in the hierarchy.
Debt securities, including restricted securities, are valued based on evaluated prices received from third party pricing vendors or from brokers who make markets in such securities. Corporate bonds are valued by pricing vendors who utilize matrix pricing which considers yield or price of bonds of comparable quality, coupon, maturity and type or by broker-supplied prices. When independent prices are unavailable or unreliable, debt securities may be valued utilizing pricing methodologies which consider similar factors that would be used by third party pricing vendors. Debt securities are generally categorized as Level 2 in the hierarchy but may be Level 3 depending on the circumstances.
Investments in open-end mutual funds, including the Fidelity Central Funds, are valued at their closing net asset value (NAV) each business day and are categorized as Level 1 in the hierarchy.
Changes in valuation techniques may result in transfers in or out of an assigned level within the disclosure hierarchy. The aggregate value of investments by input level as of July 31, 2016 is included at the end of the Fund's Schedule of Investments.
Foreign Currency. The Fund may use foreign currency contracts to facilitate transactions in foreign-denominated securities. Gains and losses from these transactions may arise from changes in the value of the foreign currency or if the counterparties do not perform under the contracts' terms.
Foreign-denominated assets, including investment securities, and liabilities are translated into U.S. dollars at the exchange rates at period end. Purchases and sales of investment securities, income and dividends received and expenses denominated in foreign currencies are translated into U.S. dollars at the exchange rate in effect on the transaction date.
The effects of exchange rate fluctuations on investments are included with the net realized and unrealized gain (loss) on investment securities. Other foreign currency transactions resulting in realized and unrealized gain (loss) are disclosed separately.
Investment Transactions and Income. For financial reporting purposes, the Fund's investment holdings and NAV include trades executed through the end of the last business day of the period. The NAV per share for processing shareholder transactions is calculated as of the close of business of the New York Stock Exchange (NYSE), normally 4:00 p.m. Eastern time and includes trades executed through the end of the prior business day. Gains and losses on securities sold are determined on the basis of identified cost and may include proceeds received from litigation. Dividend income is recorded on the ex-dividend date, except for certain dividends from foreign securities where the ex-dividend date may have passed, which are recorded as soon as the Fund is informed of the ex-dividend date. Non-cash dividends included in dividend income, if any, are recorded at the fair market value of the securities received. Income and capital gain distributions from Fidelity Central Funds, if any, are recorded on the ex-dividend date. Distributions received on securities that represent a return of capital or capital gain are recorded as a reduction of cost of investments and/or as a realized gain. Subsequent to ex-dividend date the Fund determines the components of these distributions, based upon receipt of tax filings or other correspondence relating to the underlying investment. Interest income is accrued as earned and includes coupon interest and amortization of premium and accretion of discount on debt securities as applicable. Investment income is recorded net of foreign taxes withheld where recovery of such taxes is uncertain.
Class Allocations and Expenses. Investment income, realized and unrealized capital gains and losses, common expenses of the Fund, and certain fund-level expense reductions, if any, are allocated daily on a pro-rata basis to each class based on the relative net assets of each class to the total net assets of the Fund. Each class differs with respect to transfer agent fees incurred. Certain expense reductions may also differ by class. For the reporting period, the allocated portion of income and expenses to each class as a percent of its average net assets may vary due to the timing of recording these transactions in relation to fluctuating net assets of the classes. Expenses directly attributable to a fund are charged to that fund. Expenses attributable to more than one fund are allocated among the respective funds on the basis of relative net assets or other appropriate methods. Expense estimates are accrued in the period to which they relate and adjustments are made when actual amounts are known.
Income Tax Information and Distributions to Shareholders. Each year, the Fund intends to qualify as a regulated investment company under Subchapter M of the Internal Revenue Code, including distributing substantially all of its taxable income and realized gains. As a result, no provision for U.S. Federal income taxes is required. As of July 31, 2016, the Fund did not have any unrecognized tax benefits in the financial statements; nor is the Fund aware of any tax positions for which it is reasonably possible that the total amounts of unrecognized tax benefits will significantly change in the next twelve months. The Fund files a U.S. federal tax return, in addition to state and local tax returns as required. The Fund's federal income tax returns are subject to examination by the Internal Revenue Service (IRS) for a period of three fiscal years after they are filed. State and local tax returns may be subject to examination for an additional fiscal year depending on the jurisdiction. Foreign taxes are provided for based on the Fund's understanding of the tax rules and rates that exist in the foreign markets in which it invests.
Distributions are declared and recorded on the ex-dividend date. Income dividends and capital gain distributions are declared separately for each class. Income and capital gain distributions are determined in accordance with income tax regulations, which may differ from GAAP. In addition, the Fund claimed a portion of the payment made to redeeming shareholders as a distribution for income tax purposes.
Capital accounts within the financial statements are adjusted for permanent book-tax differences. These adjustments have no impact on net assets or the results of operations. Capital accounts are not adjusted for temporary book-tax differences which will reverse in a subsequent period.
Book-tax differences are primarily due to foreign currency transactions, market discount, equity-debt classifications and losses deferred due to wash sales.
The federal tax cost of investment securities and unrealized appreciation (depreciation) as of period end were as follows:
| Gross unrealized appreciation | $1,367,964 |
| Gross unrealized depreciation | (183,832) |
| Net unrealized appreciation (depreciation) on securities | $1,184,132 |
| Tax Cost | $2,271,288 |
The tax-based components of distributable earnings as of period end were as follows:
| Undistributed ordinary income | $19,014 |
| Undistributed long-term capital gain | $190,218 |
| Net unrealized appreciation (depreciation) on securities and other investments | $1,184,132 |
The tax character of distributions paid was as follows:
| | July 31, 2016 | July 31, 2015 |
| Ordinary Income | $39,813 | $ 41,090 |
| Long-term Capital Gains | 240,243 | – |
| Total | $280,056 | $ 41,090 |
Short-Term Trading (Redemption) Fees. Shares held by investors in the Fund less than 90 days may have been subject to a redemption fee equal to 1.50% of the NAV of shares redeemed All redemption fees, which reduce the proceeds of the shareholder redemption, are retained by the Fund and accounted for as an addition to paid in capital.
Restricted Securities. The Fund may invest in securities that are subject to legal or contractual restrictions on resale. These securities generally may be resold in transactions exempt from registration or to the public if the securities are registered. Disposal of these securities may involve time-consuming negotiations and expense, and prompt sale at an acceptable price may be difficult. Information regarding restricted securities is included at the end of the Fund's Schedule of Investments.
4. Purchases and Sales of Investments.
Purchases and sales of securities, other than short-term securities, aggregated $334,892 and $1,205,664, respectively.
5. Fees and Other Transactions with Affiliates.
Management Fee. Fidelity Management & Research Company (the investment adviser) and its affiliates provide the Fund with investment management related services for which the Fund pays a monthly management fee. The management fee is the sum of an individual fund fee rate that is based on an annual rate of .35% of the Fund's average net assets and an annualized group fee rate that averaged .25% during the period. The group fee rate is based upon the average net assets of all the mutual funds advised by the investment adviser, including any mutual funds previously advised by the investment adviser that are currently advised by Fidelity SelectCo, LLC, an affiliate of the investment adviser. The group fee rate decreases as assets under management increase and increases as assets under management decrease. For the reporting period, the total annual management fee rate was .60% of the Fund's average net assets.
Transfer Agent Fees. Fidelity Investments Institutional Operations Company, Inc., (FIIOC), an affiliate of the investment adviser, is the transfer, dividend disbursing and shareholder servicing agent for each class of the Fund. FIIOC receives account fees and asset-based fees that vary according to the account size and type of account of the shareholders of Leveraged Company Stock, except for Class K. FIIOC receives an asset-based fee of Class K's average net assets. FIIOC pays for typesetting, printing and mailing of shareholder reports, except proxy statements.
For the period, transfer agent fees for each class were as follows:
| | Amount | % of
Class-Level Average
Net Assets |
| Leveraged Company Stock | $5,179 | .17 |
| Class K | 332 | .05 |
| | $5,511 | |
Accounting and Security Lending Fees. Fidelity Service Company, Inc. (FSC), an affiliate of the investment adviser, maintains the Fund's accounting records. The accounting fee is based on the level of average net assets for each month. Under a separate contract, FSC administers the security lending program. The security lending fee is based on the number and duration of lending transactions.
Brokerage Commissions. The Fund placed a portion of its portfolio transactions with brokerage firms which are affiliates of the investment adviser. Brokerage commissions are included in net realized gain (loss) and change in net unrealized appreciation (depreciation) in the Statement of Operations. The commissions paid to these affiliated firms were $20 for the period.
Interfund Trades. The Fund may purchase from or sell securities to other Fidelity Funds under procedures adopted by the Board. The procedures have been designed to ensure these interfund trades are executed in accordance with Rule 17a-7 of the 1940 Act. Interfund trades are included within the respective purchases and sales amounts shown in the Purchases and Sales of Investments note.
Other. During the period, the investment adviser reimbursed the Fund for certain losses in the amount of $3.
6. Committed Line of Credit.
The Fund participates with other funds managed by the investment adviser or an affiliate in a $4.25 billion credit facility (the "line of credit") to be utilized for temporary or emergency purposes to fund shareholder redemptions or for other short-term liquidity purposes. The Fund has agreed to pay commitment fees on its pro-rata portion of the line of credit, which amounted to $8 and is reflected in Miscellaneous expenses on the Statement of Operations. During the period, the Fund did not borrow on this line of credit.
7. Security Lending.
The Fund lends portfolio securities through a lending agent from time to time in order to earn additional income. For equity securities, a lending agent is used and may loan securities to certain qualified borrowers, including Fidelity Capital Markets (FCM), a broker-dealer affiliated with the Fund. On the settlement date of the loan, the Fund receives collateral (in the form of U.S. Treasury obligations, letters of credit and/or cash) against the loaned securities and maintains collateral in an amount not less than 100% of the market value of the loaned securities during the period of the loan. The market value of the loaned securities is determined at the close of business of the Fund and any additional required collateral is delivered to the Fund on the next business day. The Fund or borrower may terminate the loan at any time, and if the borrower defaults on its obligation to return the securities loaned because of insolvency or other reasons, the Fund may apply collateral received from the borrower against the obligation. The Fund may experience delays and costs in recovering the securities loaned. Any cash collateral received is invested in the Fidelity Securities Lending Cash Central Fund. The value of loaned securities and cash collateral at period end are disclosed on the Fund's Statement of Assets and Liabilities. Security lending income represents the income earned on investing cash collateral, less rebates paid to borrowers and any lending agent fees associated with the loan, plus any premium payments received for lending certain types of securities. Security lending income is presented in the Statement of Operations as a component of income from Fidelity Central Funds. Total security lending income during the period amounted to $1,199, including $139 from securities loaned to FCM.
8. Expense Reductions.
Commissions paid to certain brokers with whom the investment adviser, or its affiliates, places trades on behalf of the Fund include an amount in addition to trade execution, which may be rebated back to the Fund to offset certain expenses. This amount totaled $94 for the period.
In addition, during the period the investment adviser reimbursed and/or waived a portion of fund-level operating expenses in the amount of $29.
9. Distributions to Shareholders.
Distributions to shareholders of each class were as follows:
| | Year ended
July 31, 2016 | Year ended July 31, 2015 |
| From net investment income | | |
| Leveraged Company Stock | $31,472 | $30,775 |
| Class K | 8,341 | 10,315 |
| Total | $39,813 | $41,090 |
| From net realized gain | | |
| Leveraged Company Stock | $194,477 | $– |
| Class K | 45,766 | – |
| Total | $240,243 | $– |
10. Share Transactions.
Share transactions for each class were as follows and may contain automatic conversions between classes or exchanges between affiliated funds:
| | Shares | Shares | Dollars | Dollars |
| | Year ended
July 31, 2016 | Year ended July 31, 2015 | Year ended
July 31, 2016 | Year ended July 31, 2015 |
| Leveraged Company Stock | | | | |
| Shares sold | 3,277 | 5,334 | $130,866 | $246,873 |
| Reinvestment of distributions | 5,086 | 626 | 212,362 | 29,028 |
| Shares redeemed | (18,084) | (17,699) | (716,560) | (811,035) |
| Net increase (decrease) | (9,721) | (11,739) | $(373,332) | $(535,134) |
| Class K | | | | |
| Shares sold | 2,482 | 5,815 | $96,640 | $269,619 |
| Reinvestment of distributions | 1,294 | 222 | 54,107 | 10,315 |
| Shares redeemed | (10,794) | (10,500) | (436,679) | (487,892) |
| Net increase (decrease) | (7,018) | (4,463) | $(285,932) | $(207,958) |
11. Other.
The Fund's organizational documents provide former and current trustees and officers with a limited indemnification against liabilities arising in connection with the performance of their duties to the Fund. In the normal course of business, the Fund may also enter into contracts that provide general indemnifications. The Fund's maximum exposure under these arrangements is unknown as this would be dependent on future claims that may be made against the Fund. The risk of material loss from such claims is considered remote.
Report of Independent Registered Public Accounting Firm
To the Trustees of Fidelity Securities Fund and Shareholders of Fidelity Leveraged Company Stock Fund:
In our opinion, the accompanying statement of assets and liabilities, including the schedule of investments, and the related statements of operations and of changes in net assets and the financial highlights present fairly, in all material respects, the financial position of Fidelity Leveraged Company Stock Fund (a fund of Fidelity Securities Fund) at July 31, 2016, the results of its operations for the year then ended, the changes in its net assets for each of the two years in the period then ended and the financial highlights for each of the five years in the period then ended, in conformity with accounting principles generally accepted in the United States of America. These financial statements and financial highlights (hereafter referred to as “financial statements”) are the responsibility of the Fidelity Leveraged Company Stock Fund’s management. Our responsibility is to express an opinion on these financial statements based on our audits. We conducted our audits of these financial statements in accordance with the standards of the Public Company Accounting Oversight Board (United States). Those standards require that we plan and perform the audit to obtain reasonable assurance about whether the financial statements are free of material misstatement. An audit includes examining, on a test basis, evidence supporting the amounts and disclosures in the financial statements, assessing the accounting principles used and significant estimates made by management, and evaluating the overall financial statement presentation. We believe that our audits, which included confirmation of securities at July 31, 2016 by correspondence with the custodian and brokers, provide a reasonable basis for our opinion.
PricewaterhouseCoopers LLP
Boston, Massachusetts
September 20, 2016
Trustees and Officers
The Trustees, Members of the Advisory Board (if any), and officers of the trust and fund, as applicable, are listed below. The Board of Trustees governs the fund and is responsible for protecting the interests of shareholders. The Trustees are experienced executives who meet periodically throughout the year to oversee the fund's activities, review contractual arrangements with companies that provide services to the fund, oversee management of the risks associated with such activities and contractual arrangements, and review the fund's performance. Each of the Trustees oversees 170 funds.
The Trustees hold office without limit in time except that (a) any Trustee may resign; (b) any Trustee may be removed by written instrument, signed by at least two-thirds of the number of Trustees prior to such removal; (c) any Trustee who requests to be retired or who has become incapacitated by illness or injury may be retired by written instrument signed by a majority of the other Trustees; and (d) any Trustee may be removed at any special meeting of shareholders by a two-thirds vote of the outstanding voting securities of the trust. Each Trustee who is not an interested person (as defined in the 1940 Act) of the trust and the fund is referred to herein as an Independent Trustee. Each Independent Trustee shall retire not later than the last day of the calendar year in which his or her 75th birthday occurs. The Independent Trustees may waive this mandatory retirement age policy with respect to individual Trustees. Officers and Advisory Board Members hold office without limit in time, except that any officer or Advisory Board Member may resign or may be removed by a vote of a majority of the Trustees at any regular meeting or any special meeting of the Trustees. Except as indicated, each individual has held the office shown or other offices in the same company for the past five years.
The fund’s Statement of Additional Information (SAI) includes more information about the Trustees. To request a free copy, call Fidelity at 1-800-835-5092.
Experience, Skills, Attributes, and Qualifications of the Trustees. The Governance and Nominating Committee has adopted a statement of policy that describes the experience, qualifications, attributes, and skills that are necessary and desirable for potential Independent Trustee candidates (Statement of Policy). The Board believes that each Trustee satisfied at the time he or she was initially elected or appointed a Trustee, and continues to satisfy, the standards contemplated by the Statement of Policy. The Governance and Nominating Committee also engages professional search firms to help identify potential Independent Trustee candidates who have the experience, qualifications, attributes, and skills consistent with the Statement of Policy. From time to time, additional criteria based on the composition and skills of the current Independent Trustees, as well as experience or skills that may be appropriate in light of future changes to board composition, business conditions, and regulatory or other developments, have also been considered by the professional search firms and the Governance and Nominating Committee. In addition, the Board takes into account the Trustees' commitment and participation in Board and committee meetings, as well as their leadership of standing and ad hoc committees throughout their tenure.
In determining that a particular Trustee was and continues to be qualified to serve as a Trustee, the Board has considered a variety of criteria, none of which, in isolation, was controlling. The Board believes that, collectively, the Trustees have balanced and diverse experience, qualifications, attributes, and skills, which allow the Board to operate effectively in governing the fund and protecting the interests of shareholders. Information about the specific experience, skills, attributes, and qualifications of each Trustee, which in each case led to the Board's conclusion that the Trustee should serve (or continue to serve) as a trustee of the fund, is provided below.
Board Structure and Oversight Function. James C. Curvey is an interested person and currently serves as Chairman. The Trustees have determined that an interested Chairman is appropriate and benefits shareholders because an interested Chairman has a personal and professional stake in the quality and continuity of services provided to the fund. Independent Trustees exercise their informed business judgment to appoint an individual of their choosing to serve as Chairman, regardless of whether the Trustee happens to be independent or a member of management. The Independent Trustees have determined that they can act independently and effectively without having an Independent Trustee serve as Chairman and that a key structural component for assuring that they are in a position to do so is for the Independent Trustees to constitute a substantial majority for the Board. The Independent Trustees also regularly meet in executive session. Ned C. Lautenbach serves as Chairman of the Independent Trustees and as such (i) acts as a liaison between the Independent Trustees and management with respect to matters important to the Independent Trustees and (ii) with management prepares agendas for Board meetings.
Fidelity® funds are overseen by different Boards of Trustees. The fund's Board oversees Fidelity's high income and certain equity funds, and other Boards oversee Fidelity's investment-grade bond, money market, asset allocation, and sector funds. The asset allocation funds may invest in Fidelity® funds overseen by the fund's Board. The use of separate Boards, each with its own committee structure, allows the Trustees of each group of Fidelity® funds to focus on the unique issues of the funds they oversee, including common research, investment, and operational issues. On occasion, the separate Boards establish joint committees to address issues of overlapping consequences for the Fidelity® funds overseen by each Board.
The Trustees operate using a system of committees to facilitate the timely and efficient consideration of all matters of importance to the Trustees, the fund, and fund shareholders and to facilitate compliance with legal and regulatory requirements and oversight of the fund's activities and associated risks. The Board, acting through its committees, has charged FMR and its affiliates with (i) identifying events or circumstances the occurrence of which could have demonstrably adverse effects on the fund's business and/or reputation; (ii) implementing processes and controls to lessen the possibility that such events or circumstances occur or to mitigate the effects of such events or circumstances if they do occur; and (iii) creating and maintaining a system designed to evaluate continuously business and market conditions in order to facilitate the identification and implementation processes described in (i) and (ii) above. Because the day-to-day operations and activities of the fund are carried out by or through FMR, its affiliates, and other service providers, the fund's exposure to risks is mitigated but not eliminated by the processes overseen by the Trustees. While each of the Board's committees has responsibility for overseeing different aspects of the fund's activities, oversight is exercised primarily through the Operations, Audit, and Compliance Committees. In addition, the Independent Trustees have worked with FMR to enhance the Board's oversight of investment and financial risks, legal and regulatory risks, technology risks, and operational risks, including the development of additional risk reporting to the Board. For example, a working group comprised of Independent Trustees and FMR has worked and continues to work to review the Fidelity® funds' valuation-related activities, reporting and risk management. Appropriate personnel, including but not limited to the fund's Chief Compliance Officer (CCO), FMR's internal auditor, the independent accountants, the fund's Treasurer and portfolio management personnel, make periodic reports to the Board's committees, as appropriate, including an annual review of Fidelity's risk management program for the Fidelity® funds. The responsibilities of each standing committee, including their oversight responsibilities, are described further under "Standing Committees of the Trustees."
Interested Trustees*:
Correspondence intended for a Trustee who is an interested person may be sent to Fidelity Investments, 245 Summer Street, Boston, Massachusetts 02210.
Name, Year of Birth; Principal Occupations and Other Relevant Experience+
James C. Curvey (1935)
Year of Election or Appointment: 2007
Trustee
Chairman of the Board of Trustees
Mr. Curvey also serves as Trustee of other Fidelity® funds. Mr. Curvey is a Director of Fidelity Research & Analysis Co. (investment adviser firm, 2009-present), and Vice Chairman (2007-present) and Director of FMR LLC (diversified financial services company). In addition, Mr. Curvey serves as an Overseer for the Boston Symphony Orchestra and a member of the board of Artis-Naples, Naples, Florida, and as a Trustee for Brewster Academy, Wolfeboro, New Hampshire. Previously, Mr. Curvey served as a Director of Fidelity Investments Money Management, Inc. (investment adviser firm, 2009-2014) and a Director of FMR and FMR Co., Inc. (investment adviser firms, 2007-2014).
Charles S. Morrison (1960)
Year of Election or Appointment: 2014
Trustee
Mr. Morrison also serves as Trustee of other funds. He serves as a Director of Fidelity Investments Money Management, Inc. (FIMM) (investment adviser firm, 2014-present), Director of Fidelity SelectCo, LLC (investment adviser firm, 2014-present), President, Asset Management (2014-present), and is an employee of Fidelity Investments. Previously, Mr. Morrison served as Vice President of Fidelity's Fixed Income and Asset Allocation Funds (2012-2014), President, Fixed Income (2011-2014), Vice President of Fidelity's Money Market Funds (2005-2009), President, Money Market Group Leader of FMR (investment adviser firm, 2009), and Senior Vice President, Money Market Group of FMR (2004-2009). Mr. Morrison also served as Vice President of Fidelity's Bond Funds (2002-2005), certain Balanced Funds (2002-2005), and certain Asset Allocation Funds (2002-2007), and as Senior Vice President (2002-2005) of Fidelity's Bond Division.
* Determined to be an “Interested Trustee” by virtue of, among other things, his or her affiliation with the trust or various entities under common control with FMR.
+ The information includes the Trustee's principal occupation during the last five years and other information relating to the experience, attributes, and skills relevant to the Trustee's qualifications to serve as a Trustee, which led to the conclusion that the Trustee should serve as a Trustee for the fund.
Independent Trustees:
Correspondence intended for an Independent Trustee may be sent to Fidelity Investments, P.O. Box 55235, Boston, Massachusetts 02205-5235.
Name, Year of Birth; Principal Occupations and Other Relevant Experience+
Dennis J. Dirks (1948)
Year of Election or Appointment: 2005
Trustee
Mr. Dirks also serves as Trustee of other Fidelity® funds. Prior to his retirement in May 2003, Mr. Dirks was Chief Operating Officer and a member of the Board of The Depository Trust & Clearing Corporation (DTCC). He also served as President, Chief Operating Officer, and Board member of The Depository Trust Company (DTC) and President and Board member of the National Securities Clearing Corporation (NSCC). In addition, Mr. Dirks served as Chief Executive Officer and Board member of the Government Securities Clearing Corporation, Chief Executive Officer and Board member of the Mortgage-Backed Securities Clearing Corporation, as a Trustee and a member of the Finance Committee of Manhattan College (2005-2008), as a Trustee and a member of the Finance Committee of AHRC of Nassau County (2006-2008), and as a member of the Independent Directors Council (IDC) Governing Council (2010-2015). Mr. Dirks is a member of the Board of Directors for The Brookville Center for Children's Services, Inc. (2009-present).
Alan J. Lacy (1953)
Year of Election or Appointment: 2008
Trustee
Mr. Lacy also serves as Trustee of other Fidelity® funds. Mr. Lacy serves as Chairman (2014-present) and a member (2010-present) of the Board of Directors of Dave & Buster's Entertainment, Inc. (restaurant and entertainment complexes) and a Director of Bristol-Myers Squibb Company (global pharmaceuticals, 2008-present). He is a Trustee of the California Chapter of The Nature Conservancy (2015-present) and a Director of the Center for Advanced Study in the Behavioral Sciences at Stanford University (2015-present). In addition, Mr. Lacy served as Senior Adviser (2007-2014) of Oak Hill Capital Partners, L.P. (private equity) and also served as Chief Executive Officer (2005) and Vice Chairman (2005-2006) of Sears Holdings Corporation (retail) and Chief Executive Officer and Chairman of the Board of Sears, Roebuck and Co. (retail, 2000-2005). Previously, Mr. Lacy served as Chairman (2008-2011) and a member (2006-2015) of the Board of Trustees of the National Parks Conservation Association and as a member of the Board of Directors for The Western Union Company (global money transfer, 2006-2011), The Hillman Companies, Inc. (hardware wholesalers, 2010-2014), and Earth Fare, Inc. (retail grocery, 2010-2014).
Ned C. Lautenbach (1944)
Year of Election or Appointment: 2000
Trustee
Chairman of the Independent Trustees
Mr. Lautenbach also serves as Trustee of other Fidelity® funds. Mr. Lautenbach currently serves as the Lead Director of the Eaton Corporation Board of Directors (diversified industrial, 1997-present). Mr. Lautenbach is Chairman of the Board of Directors of Artis-Naples in Naples, Florida (2012-present), a member of the Council on Foreign Relations (1994-present), and a member of the Board of Governors, State University System of Florida (2013-present). Previously, Mr. Lautenbach was a Partner/Advisory Partner at Clayton, Dubilier & Rice, LLC (private equity investment, 1998-2010), as well as a Director of Sony Corporation (2006-2007).
Joseph Mauriello (1944)
Year of Election or Appointment: 2008
Trustee
Mr. Mauriello also serves as Trustee of other Fidelity® funds. Prior to his retirement in January 2006, Mr. Mauriello served in numerous senior management positions including Deputy Chairman and Chief Operating Officer (2004-2005), and Vice Chairman of Financial Services (2002-2004) of KPMG LLP US (professional services, 1965-2005). Mr. Mauriello currently serves as a member of the Board of Directors of XL Group plc. (global insurance and re-insurance, 2006-present) and the Independent Directors Council (IDC) Governing Council (2015-present). Previously, Mr. Mauriello served as a Director of the Hamilton Funds of the Bank of New York (2006-2007) and of Arcadia Resources Inc. (health care services and products, 2007-2012).
Robert W. Selander (1950)
Year of Election or Appointment: 2011
Trustee
Mr. Selander also serves as Trustee of other Fidelity® funds. Mr. Selander serves as a Director of The Western Union Company (global money transfer, 2014-present) and a non-executive Chairman of Health Equity, Inc. (health savings custodian, 2015-present). Previously, Mr. Selander served as a Member of the Advisory Board of certain Fidelity® funds (2011), and Executive Vice Chairman (2010), Chief Executive Officer (2009-2010), and President and Chief Executive Officer (1997-2009) of Mastercard, Inc.
Cornelia M. Small (1944)
Year of Election or Appointment: 2005
Trustee
Ms. Small also serves as Trustee of other Fidelity® funds. Ms. Small is a member of the Board of Directors (2009-present) and Chair of the Investment Committee (2010-present) of the Teagle Foundation. Ms. Small also serves on the Investment Committee of the Berkshire Taconic Community Foundation (2008-present). Previously, Ms. Small served as Chairperson (2002-2008) and a member of the Investment Committee and Chairperson (2008-2012) and a member of the Board of Trustees of Smith College. In addition, Ms. Small served as Chief Investment Officer, Director of Global Equity Investments, and a member of the Board of Directors of Scudder, Stevens & Clark and Scudder Kemper Investments.
William S. Stavropoulos (1939)
Year of Election or Appointment: 2002
Trustee
Vice Chairman of the Independent Trustees
Mr. Stavropoulos also serves as Trustee of other Fidelity® funds. Mr. Stavropoulos serves as President and Founder of the Michigan Baseball Foundation, the Great Lakes Loons (2007-present). Mr. Stavropoulos is Chairman Emeritus of the Board of Directors of The Dow Chemical Company, where he previously served in numerous senior management positions, including President, CEO (1995-2000; 2002-2004), Chairman of the Executive Committee (2000-2006), and as a member of the Board of Directors (1990-2006). Currently, Mr. Stavropoulos is Chairman of the Board of Directors of Univar Inc. (global distributor of commodity and specialty chemicals), a Director of Teradata Corporation (data warehousing and technology solutions), and Maersk Inc. (industrial conglomerate), and a member of the Advisory Board for Metalmark Capital LLC (private equity investment, 2005-present). Mr. Stavropoulos is an operating advisor to Clayton, Dubilier & Rice, LLC (private equity investment). In addition, Mr. Stavropoulos is a member of the University of Notre Dame Advisory Council for the College of Science, a Trustee of the Rollin L. Gerstacker Foundation, and a Director of the Naples Philharmonic Center for the Arts. Previously, Mr. Stavropoulos served as a Director of Chemical Financial Corporation (bank holding company, 1993-2012) and Tyco International, Ltd. (multinational manufacturing and services, 2007-2012).
David M. Thomas (1949)
Year of Election or Appointment: 2008
Trustee
Mr. Thomas also serves as Trustee of other Fidelity® funds. Mr. Thomas serves as Non-Executive Chairman of the Board of Directors of Fortune Brands Home and Security (home and security products, 2011-present), as a member of the Board of Directors (2004-present) and Presiding Director (2013-present) of Interpublic Group of Companies, Inc. (marketing communication), and as a member of the Board of Trustees of the University of Florida (2013-present). Previously, Mr. Thomas served as Executive Chairman (2005-2006) and Chairman and Chief Executive Officer (2000-2005) of IMS Health, Inc. (pharmaceutical and healthcare information solutions), and a Director of Fortune Brands, Inc. (consumer products, 2000-2011).
+ The information includes the Trustee's principal occupation during the last five years and other information relating to the experience, attributes, and skills relevant to the Trustee's qualifications to serve as a Trustee, which led to the conclusion that the Trustee should serve as a Trustee for the fund.
Advisory Board Members and Officers:
Correspondence intended for an officer or Peter S. Lynch may be sent to Fidelity Investments, 245 Summer Street, Boston, Massachusetts 02210. Officers appear below in alphabetical order.
Name, Year of Birth; Principal Occupation
Peter S. Lynch (1944)
Year of Election or Appointment: 2003
Member of the Advisory Board
Mr. Lynch also serves as Member of the Advisory Board of other Fidelity® funds. Mr. Lynch is Vice Chairman and a Director of FMR (investment adviser firm) and FMR Co., Inc. (investment adviser firm). In addition, Mr. Lynch serves as a Trustee of Boston College and as the Chairman of the Inner-City Scholarship Fund. Previously, Mr. Lynch served on the Special Olympics International Board of Directors (1997-2006).
Marc R. Bryant (1966)
Year of Election or Appointment: 2015
Secretary and Chief Legal Officer (CLO)
Mr. Bryant also serves as Secretary and CLO of other funds. Mr. Bryant serves as CLO, Secretary, and Senior Vice President of Fidelity Management & Research Company (investment adviser firm, 2015-present) and FMR Co., Inc. (investment adviser firm, 2015-present); Secretary of Fidelity SelectCo, LLC (investment adviser firm, 2015-present) and Fidelity Investments Money Management, Inc. (investment adviser firm, 2015-present); and CLO of Fidelity Management & Research (Hong Kong) Limited and FMR Investment Management (U.K.) Limited (investment adviser firms, 2015-present) and Fidelity Management & Research (Japan) Limited (investment adviser firm, 2016-present). He is Senior Vice President and Deputy General Counsel of FMR LLC (diversified financial services company). Previously, Mr. Bryant served as Secretary and CLO of Fidelity Rutland Square Trust II (2010-2014) and Assistant Secretary of Fidelity's Fixed Income and Asset Allocation Funds (2013-2015). Prior to joining Fidelity Investments, Mr. Bryant served as a Senior Vice President and the Head of Global Retail Legal for AllianceBernstein L.P. (2006-2010), and as the General Counsel for ProFund Advisors LLC (2001-2006).
Jeffrey S. Christian (1961)
Year of Election or Appointment: 2016
Assistant Treasurer
Mr. Christian also serves as Assistant Treasurer of other funds. Mr. Christian is an employee of Fidelity Investments (2003-present).
William C. Coffey (1969)
Year of Election or Appointment: 2009
Assistant Secretary
Mr. Coffey also serves as Assistant Secretary of other funds. He is Senior Vice President and Deputy General Counsel of FMR LLC (diversified financial services company, 2010-present), and is an employee of Fidelity Investments. Previously, Mr. Coffey served as Vice President and Associate General Counsel of FMR LLC (2005-2009).
Jonathan Davis (1968)
Year of Election or Appointment: 2010
Assistant Treasurer
Mr. Davis also serves as Assistant Treasurer of other funds, and is an employee of Fidelity Investments. Previously, Mr. Davis served as Vice President and Associate General Counsel of FMR LLC (diversified financial services company, 2003-2010).
Adrien E. Deberghes (1967)
Year of Election or Appointment: 2016
Assistant Treasurer
Mr. Deberghes also serves as an officer of other funds. He serves as Executive Vice President of Fidelity Investments Money Management, Inc. (FIMM) (investment adviser firm, 2016-present) and is an employee of Fidelity Investments (2008-present). Prior to joining Fidelity Investments, Mr. Deberghes was Senior Vice President of Mutual Fund Administration at State Street Corporation (2007-2008), Senior Director of Mutual Fund Administration at Investors Bank & Trust (2005-2007), and Director of Finance for Dunkin' Brands (2000-2005). Previously, Mr. Deberghes served in other fund officer roles.
Stephanie J. Dorsey (1969)
Year of Election or Appointment: 2010
Assistant Treasurer
Ms. Dorsey also serves as an officer of other funds. She is an employee of Fidelity Investments (2008-present) and has served in other fund officer roles. Prior to joining Fidelity Investments, Ms. Dorsey served as Treasurer (2004-2008) of the JPMorgan Mutual Funds and Vice President (2004-2008) of JPMorgan Chase Bank.
Howard J. Galligan III (1966)
Year of Election or Appointment: 2014
Chief Financial Officer
Mr. Galligan also serves as Chief Financial Officer of other funds. Mr. Galligan serves as President of Fidelity Pricing and Cash Management Services (FPCMS) (2014-present) and as a Director of Strategic Advisers, Inc. (investment adviser firm, 2008-present). Previously, Mr. Galligan served as Chief Administrative Officer of Asset Management (2011-2014) and Chief Operating Officer and Senior Vice President of Investment Support for Strategic Advisers, Inc. (2003-2011).
Scott C. Goebel (1968)
Year of Election or Appointment: 2015
Vice President
Mr. Goebel serves as Vice President of other funds and is an employee of Fidelity Investments (2001-present). Mr. Goebel serves as Senior Vice President of Fidelity Management & Research Company (FMR) (investment adviser firm, 2016-present). Previously, Mr. Goebel served as Secretary of Fidelity SelectCo, LLC (investment adviser firm, 2013-2015), Fidelity Investments Money Management, Inc. (FIMM) (investment adviser firm, 2010-2015), and Fidelity Research and Analysis Company (FRAC) (investment adviser firm, 2010-2015); General Counsel, Secretary, and Senior Vice President of FMR (investment adviser firm, 2008-2015) and FMR Co., Inc. (investment adviser firm, 2008-2015); Assistant Secretary of Fidelity Management & Research (Japan) Limited (investment adviser firm, 2008-2015) and Fidelity Management & Research (U.K.) Inc. (investment adviser firm, 2008-2015); Chief Legal Officer (CLO) of Fidelity Management & Research (Hong Kong) Limited (investment adviser firm, 2008-2015); Secretary and CLO of certain Fidelity® funds (2008-2015); Assistant Secretary of FIMM (2008-2010), FRAC (2008-2010), and certain funds (2007-2008); and as Vice President and Secretary of Fidelity Distributors Corporation (FDC) (2005-2007).
Thomas C. Hense (1964)
Year of Election or Appointment: 2008, 2010, or 2015
Vice President
Mr. Hense serves as Vice President of Fidelity Advisor® Multi-Asset Income Fund (2015) and other funds (High Income (2008), Small Cap (2008), and Value (2010) funds), and is an employee of Fidelity Investments (1993-present). Previously, Mr. Hense served as a portfolio manager for Fidelity's Institutional Money Management Group (Pyramis) (2003-2008).
Brian B. Hogan (1964)
Year of Election or Appointment: 2009
Vice President
Mr. Hogan also serves as Trustee or Vice President of other funds. Mr. Hogan serves as a Director of FMR Investment Management (U.K.) Limited (investment adviser firm, 2015-present) and Fidelity SelectCo, LLC (investment adviser firm, 2014-present) and President of the Equity Division of FMR (investment adviser firm, 2009-present). Previously, Mr. Hogan served as Senior Vice President, Equity Research of FMR (2006-2009) and as a portfolio manager. Mr. Brian B. Hogan is not related to Mr. Colm A. Hogan.
Colm A. Hogan (1973)
Year of Election or Appointment: 2016
Deputy Treasurer
Mr. Hogan also serves as an officer of other funds. Mr. Hogan is an employee of Fidelity Investments (2005-present). Mr. Colm A. Hogan is not related to Mr. Brian B. Hogan.
Chris Maher (1972)
Year of Election or Appointment: 2013
Assistant Treasurer
Mr. Maher serves as Assistant Treasurer of other funds. Mr. Maher is Vice President of Valuation Oversight and is an employee of Fidelity Investments. Previously, Mr. Maher served as Vice President of Asset Management Compliance (2013), Vice President of the Program Management Group of FMR (investment adviser firm, 2010-2013), and Vice President of Valuation Oversight (2008-2010).
John F. Papandrea (1972)
Year of Election or Appointment: 2016
Anti-Money Laundering (AML) Officer
Mr. Papandrea also serves as AML Officer of other funds. Mr. Papandrea is Vice President of FMR LLC (diversified financial services company, 2008-present) and is an employee of Fidelity Investments (2005-present).
Kenneth B. Robins (1969)
Year of Election or Appointment: 2016
Chief Compliance Officer
Mr. Robins also serves as an officer of other funds. Mr. Robins serves as Compliance Officer of Fidelity Management & Research Company and FMR Co., Inc. (investment adviser firms, 2016-present) and is an employee of Fidelity Investments (2004-present). Previously, Mr. Robins served as Executive Vice President of Fidelity Investments Money Management, Inc. (investment adviser firm, 2013-2016) and served in other fund officer roles.
Stacie M. Smith (1974)
Year of Election or Appointment: 2016
President and Treasurer
Ms. Smith also serves as an officer of other funds. She is an employee of Fidelity Investments (2009-present) and has served in other fund officer roles. Prior to joining Fidelity Investments, Ms. Smith served as Senior Audit Manager of Ernst & Young LLP (1996-2009). Previously, Ms. Smith served as Deputy Treasurer of certain Fidelity® funds (2013-2016).
Renee Stagnone (1975)
Year of Election or Appointment: 2016
Assistant Treasurer
Ms. Stagnone also serves as an officer of other funds. Ms. Stagnone is an employee of Fidelity Investments (1997-present). Previously, Ms. Stagnone served as Deputy Treasurer of certain Fidelity® funds (2013-2016).
Shareholder Expense Example
As a shareholder of the Fund, you incur two types of costs: (1) transaction costs, including redemption fees and (2) ongoing costs, including management fees and other Fund expenses. This Example is intended to help you understand your ongoing costs (in dollars) of investing in the Fund and to compare these costs with the ongoing costs of investing in other mutual funds.
The Example is based on an investment of $1,000 invested at the beginning of the period and held for the entire period (February 1, 2016 to July 31, 2016).
Actual Expenses
The first line of the accompanying table for each class of the Fund provides information about actual account values and actual expenses. You may use the information in this line, together with the amount you invested, to estimate the expenses that you paid over the period. Simply divide your account value by $1,000.00 (for example, an $8,600 account value divided by $1,000.00 = 8.6), then multiply the result by the number in the first line for a class of the Fund under the heading entitled "Expenses Paid During Period" to estimate the expenses you paid on your account during this period. A small balance maintenance fee of $12.00 that is charged once a year may apply for certain accounts with a value of less than $2,000. This fee is not included in the table below. If it was, the estimate of expenses you paid during the period would be higher, and your ending account value lower, by this amount. In addition, the Fund, as a shareholder in the underlying Fidelity Central Funds, will indirectly bear its pro-rata share of the fees and expenses incurred by the underlying Fidelity Central Funds. These fees and expenses are not included in the Fund's annualized expense ratio used to calculate the expense estimate in the table below.
Hypothetical Example for Comparison Purposes
The second line of the accompanying table for each class of the Fund provides information about hypothetical account values and hypothetical expenses based on a Class' actual expense ratio and an assumed rate of return of 5% per year before expenses, which is not the Class' actual return. The hypothetical account values and expenses may not be used to estimate the actual ending account balance or expenses you paid for the period. You may use this information to compare the ongoing costs of investing in the Fund and other funds. To do so, compare this 5% hypothetical example with the 5% hypothetical examples that appear in the shareholder reports of the other funds. A small balance maintenance fee of $12.00 that is charged once a year may apply for certain accounts with a value of less than $2,000. This fee is not included in the table below. If it was, the estimate of expenses you paid during the period would be higher, and your ending account value lower, by this amount. In addition, the Fund, as a shareholder in the underlying Fidelity Central Funds, will indirectly bear its pro-rata share of the fees and expenses incurred by the underlying Fidelity Central Funds. These fees and expenses are not included in the Fund's annualized expense ratio used to calculate the expense estimate in the table below.
Please note that the expenses shown in the table are meant to highlight your ongoing costs only and do not reflect any transaction costs. Therefore, the second line of the table is useful in comparing ongoing costs only, and will not help you determine the relative total costs of owning different funds. In addition, if these transactional costs were included, your costs would have been higher.
| | Annualized Expense Ratio-A | Beginning
Account Value
February 1, 2016 | Ending
Account Value
July 31, 2016 | Expenses Paid
During Period-B
February 1, 2016
to July 31, 2016 |
| Leveraged Company Stock | .80% | | | |
| Actual | | $1,000.00 | $1,132.50 | $4.24 |
| Hypothetical-C | | $1,000.00 | $1,020.89 | $4.02 |
| Class K | .68% | | | |
| Actual | | $1,000.00 | $1,133.20 | $3.61 |
| Hypothetical-C | | $1,000.00 | $1,021.48 | $3.42 |
A Annualized expense ratio reflects expenses net of applicable fee waivers.
B Expenses are equal to each Class' annualized expense ratio, multiplied by the average account value over the period, multiplied by 182/366 (to reflect the one-half year period).
C 5% return per year before expenses
Distributions (Unaudited)
The Board of Trustees of Leveraged Company Stock voted to pay to shareholders of record at the opening of business on record date, the following distributions per share derived from capital gains realized from sales of portfolio securities, and dividends derived from net investment income:
| | Pay Date | Record Date | Dividends | Capital Gains |
| Leveraged Company Stock | 9/19/2016 | 9/16/2016 | $0.230 | $2.327 |
| Class K | 9/19/2016 | 9/16/2016 | $0.258 | $2.327 |
| | |
The fund hereby designates as a capital gain dividend with respect to the taxable year ended July 31, 2016, $295,796,944 or, if subsequently determined to be different, the net capital gain of such year.
Leveraged Company Stock designates 100% and Class K designates 100% of the dividends distributed in September and December, respectively during the fiscal year as qualifying for the dividends–received deduction for corporate shareholders.
Leveraged Company Stock designates 100% and Class K designates 100% of the dividends distributed in September and December, respectively during the fiscal year as amounts which may be taken into account as a dividend for the purposes of the maximum rate under section 1(h)(11) of the Internal Revenue Code.
The fund will notify shareholders in January 2017 of amounts for use in preparing 2016 income tax returns.
Board Approval of Investment Advisory Contracts and Management Fees
Fidelity Leveraged Company Stock Fund
Each year, the Board of Trustees, including the Independent Trustees (together, the Board), votes on the renewal of the management contract with Fidelity Management & Research Company (FMR) and the sub-advisory agreements (together, the Advisory Contracts) for the fund. The Board, assisted by the advice of fund counsel and Independent Trustees' counsel, requests and considers a broad range of information relevant to the renewal of the Advisory Contracts throughout the year.
The Board meets regularly and, at each of its meetings, covers an extensive agenda of topics and materials and considers factors that are relevant to its annual consideration of the renewal of the fund's Advisory Contracts, including the services and support provided to the fund and its shareholders. The Board has established various standing committees (Committees), each composed of and chaired by Independent Trustees with varying backgrounds, to which the Board has assigned specific subject matter responsibilities in order to enhance effective decision-making by the Board. The Board, acting directly and through its Committees, requests and receives information concerning the annual consideration of the renewal of the fund's Advisory Contracts. The Board also meets as needed to consider matters specifically related to the Board's annual consideration of the renewal of the Advisory Contracts. Members of the Board may also meet with trustees of other Fidelity funds through ad hoc joint committees to discuss certain matters relevant to all of the Fidelity funds.
At its July 2016 meeting, the Board unanimously determined to renew the fund's Advisory Contracts. In reaching its determination, the Board considered all factors it believed relevant, including (i) the nature, extent, and quality of the services to be provided to the fund and its shareholders (including the investment performance of the fund); (ii) the competitiveness of the fund's management fee and total expense ratio relative to peer funds; (iii) the total costs of the services to be provided by and the profits to be realized by Fidelity from its relationships with the fund; and (iv) the extent to which, if any, economies of scale exist and would be realized as the fund grows, and whether any economies of scale are appropriately shared with fund shareholders.
In considering whether to renew the Advisory Contracts for the fund, the Board reached a determination, with the assistance of fund counsel and Independent Trustees' counsel and through the exercise of its business judgment, that the renewal of the Advisory Contracts was in the best interests of the fund and its shareholders and that the compensation payable under the Advisory Contracts was fair and reasonable. The Board's decision to renew the Advisory Contracts was not based on any single factor, but rather was based on a comprehensive consideration of all the information provided to the Board at its meetings throughout the year. The Board, in reaching its determination to renew the Advisory Contracts, was aware that shareholders of the fund have a broad range of investment choices available to them, including a wide choice among funds offered by Fidelity's competitors, and that the fund's shareholders, who have the opportunity to review and weigh the disclosure provided by the fund in its prospectus and other public disclosures, have chosen to invest in this fund, which is part of the Fidelity family of funds.
Nature, Extent, and Quality of Services Provided. The Board considered Fidelity's staffing as it relates to the fund, including the backgrounds of investment personnel of Fidelity, and also considered the fund's investment objective, strategies, and related investment philosophy. The Independent Trustees also had discussions with senior management of Fidelity's investment operations and investment groups. The Board considered the structure of the investment personnel compensation program and whether this structure provides appropriate incentives to act in the best interests of the fund. Additionally, the Board considered the portfolio managers' investments, if any, in the funds that they manage.
Resources Dedicated to Investment Management and Support Services. The Board and the Fund Oversight and Research Committees reviewed the general qualifications and capabilities of Fidelity's investment staff, including its size, education, experience, and resources, as well as Fidelity's approach to recruiting, training, managing, and compensating investment personnel. The Board noted that Fidelity has continued to increase the resources devoted to non-U.S. offices, including expansion of Fidelity's global investment organization. The Board also noted that Fidelity's analysts have extensive resources, tools and capabilities that allow them to conduct sophisticated quantitative and fundamental analysis, as well as credit analysis of issuers, counterparties and guarantors. Further, the Board considered that Fidelity's investment professionals have sufficient access to global information and data so as to provide competitive investment results over time, and that those professionals also have access to sophisticated tools that permit them to assess portfolio construction and risk and performance attribution characteristics continuously, as well as to transmit new information and research conclusions rapidly around the world. Additionally, in its deliberations, the Board considered Fidelity's trading, risk management, compliance, and technology and operations capabilities and resources, which are integral parts of the investment management process.
Shareholder and Administrative Services. The Board considered (i) the nature, extent, quality, and cost of advisory, administrative, and shareholder services performed by FMR, the sub-advisers (together with FMR, the Investment Advisers), and their affiliates under the Advisory Contracts and under separate agreements covering transfer agency, pricing and bookkeeping, and securities lending services for the fund; (ii) the nature and extent of the supervision of third party service providers, principally custodians, subcustodians, and pricing vendors; and (iii) the resources devoted to, and the record of compliance with, the fund's compliance policies and procedures. The Board also reviewed the allocation of fund brokerage, including allocations to brokers affiliated with the Investment Advisers, the use of brokerage commissions to pay fund expenses, and the use of "soft" commission dollars to pay for research services.
The Board noted that the growth of fund assets over time across the complex allows Fidelity to reinvest in the development of services designed to enhance the value or convenience of the Fidelity funds as investment vehicles. These services include 24-hour access to account information and market information through telephone representatives and over the Internet, investor education materials and asset allocation tools, and the expanded availability of Fidelity Investor Centers.
In 2014, the Board formed an ad hoc Committee on Transfer Agency Fees to review the variety of transfer agency fee structures throughout the industry and Fidelity's competitive positioning with respect to industry participants.
Investment in a Large Fund Family. The Board considered the benefits to shareholders of investing in a Fidelity fund, including the benefits of investing in a fund that is part of a large family of funds offering a variety of investment disciplines and providing a large variety of mutual fund investor services. The Board noted that Fidelity had taken, or had made recommendations that resulted in the Fidelity funds taking, a number of actions over the previous year that benefited particular funds, including: (i) continuing to dedicate additional resources to investment research and to the support of the senior management team that oversees asset management; (ii) continuing efforts to enhance Fidelity's global research capabilities; (iii) launching new funds and making other enhancements to meet client needs; (iv) broadening eligibility requirements for certain lower-priced share classes of, and streamlining the fee structure for, certain existing equity index funds; (v) lowering expense caps for certain existing funds and classes to reduce expenses paid by shareholders; (vi) eliminating redemption fees for certain variable insurance product funds and classes; (vii) continuing to launch dedicated lower cost underlying funds to meet portfolio construction needs related to expanding underlying fund options for Fidelity funds of funds, specifically for the Freedom Fund product lines; (viii) launching a lower cost share class for use by the Freedom Index Fund product line; (ix) rationalizing product lines and gaining increased efficiencies through fund mergers and share class consolidations; (x) continuing to develop, acquire and implement systems and technology to improve services to the funds and shareholders, strengthen information security, and increase efficiency; (xi) implementing investment enhancements to further strengthen Fidelity's target date product line to increase investors' probability of success in achieving their goals; (xii) accelerating the conversion of all remaining Class B shares to Class A shares, which have a lower expense structure; and (xiii) implementing changes to Fidelity's money market fund product line in response to recent regulatory reforms.
Investment Performance. The Board considered whether the fund has operated in accordance with its investment objective, as well as its record of compliance with its investment restrictions and its performance history.
The Board took into account discussions with representatives of the Investment Advisers about fund investment performance that occur at Board meetings throughout the year. In this regard the Board noted that as part of regularly scheduled fund reviews and other reports to the Board on fund performance, the Board considers annualized return information for the fund, for different time periods, measured against a securities market index ("benchmark index") and a peer group of funds with similar objectives ("peer group"), if any. In its evaluation of fund investment performance, the Board gave particular attention to information indicating changes in performance of certain Fidelity funds for specific time periods and discussed with the Investment Advisers the reasons for any overperformance or underperformance.
In addition to reviewing absolute and relative fund performance, the Independent Trustees periodically consider the appropriateness of fund performance metrics in evaluating the results achieved. In general, the Independent Trustees believe that fund performance should be evaluated based on net performance (after fees and expenses) of both the highest performing and lowest performing fund share classes, where applicable, compared to appropriate benchmark indices, over appropriate time periods that may include full market cycles, and compared to peer groups, as applicable, over the same periods, taking into account relevant factors including the following: general market conditions; issuer-specific information; and fund cash flows and other factors.
The Independent Trustees recognize that shareholders evaluate performance on a net basis over their own holding periods, for which one-, three-, and five-year periods are often used as a proxy. For this reason, the performance information reviewed by the Board also included net cumulative calendar year total return information for the fund and an appropriate benchmark index and peer group for the most recent one-, three-, and five-year periods, as shown below. Returns are shown compared to the 25th percentile (top of box, 75% beaten) and 75th percentile (bottom of box, 25% beaten) of the peer universe.
Fidelity Leveraged Company Stock Fund
Based on its review, the Board concluded that the nature, extent, and quality of services provided to the fund under the Advisory Contracts should continue to benefit the shareholders of the fund.
Competitiveness of Management Fee and Total Expense Ratio. The Board considered the fund's management fee and total expense ratio compared to "mapped groups" of competitive funds and classes created for the purpose of facilitating the Trustees' competitive analysis of management fees and total expenses. Fidelity creates "mapped groups" by combining similar Broadridge investment objective categories that have comparable investment mandates. Combining Broadridge investment objective categories aids the Board's management fee and total expense ratio comparisons by broadening the competitive group used for comparison.
Management Fee. The Board considered two proprietary management fee comparisons for the 12-month periods shown in basis points (BP) in the chart below. The group of Broadridge funds used by the Board for management fee comparisons is referred to below as the "Total Mapped Group." The Total Mapped Group comparison focuses on a fund's standing in terms of gross management fees before expense reimbursements or caps relative to the total universe of funds with comparable investment mandates, regardless of whether their management fee structures also are comparable. Funds with comparable investment mandates offer exposure to similar types of securities. Funds with comparable management fee structures have similar management fee contractual arrangements (
e.g., flat rate charged for advisory services, all-inclusive fee rate,
etc.). "TMG %" represents the percentage of funds in the Total Mapped Group that had management fees that were lower than the fund's. For example, a hypothetical TMG % of 20% would mean that 80% of the funds in the Total Mapped Group had higher, and 20% had lower, management fees than the fund. The fund's actual TMG %s and the number of funds in the Total Mapped Group are in the chart below. The "Asset-Size Peer Group" (ASPG) comparison focuses on a fund's standing relative to a subset of non-Fidelity funds within the Total Mapped Group that are similar in size and management fee structure. For example, if a fund is in the first quartile of the ASPG, the fund's management fee ranks in the least expensive or lowest 25% of funds in the ASPG. The ASPG represents at least 15% of the funds in the Total Mapped Group with comparable asset size and management fee structures, subject to a minimum of 50 funds (or all funds in the Total Mapped Group if fewer than 50). Additional information, such as the ASPG quartile in which the fund's management fee rate ranked, is also included in the chart and considered by the Board.
Fidelity Leveraged Company Stock Fund
The Board noted that the fund's management fee rate ranked below the median of its Total Mapped Group and below the median of its ASPG for 2015.
The Board noted that, in 2014, the ad hoc Committee on Group Fee was formed by it and the boards of other Fidelity funds to conduct an in-depth review of the "group fee" component of the management fee of funds with such management fee structures. The Committee's focus included the mechanics of the group fee, the competitive landscape of group fee structures, Fidelity funds with no group fee component and investment products not included in group fee assets. The Board also considered that, for funds subject to the group fee, FMR agreed to voluntarily waive fees over a specified period of time in amounts designed to account for assets converted from certain funds to certain collective investment trusts.
The Board also noted that, in 2013, the ad hoc Committee on Management Fees was formed to conduct an in-depth review of the management fee rates of Fidelity's active equity mutual funds. The Committee focused on the following areas: (i) standard fee structures; (ii) research consumption and trading evolution; (iii) management fee competitiveness/profitability by category; and (iv) factors that drive institutional pricing.
Based on its review, the Board concluded that the fund's management fee is fair and reasonable in light of the services that the fund receives and the other factors considered.
Total Expense Ratio. In its review of each class's total expense ratio, the Board considered the fund's management fee rate as well as other fund or class expenses, as applicable, such as transfer agent fees, pricing and bookkeeping fees, and custodial, legal, and audit fees. The Board also noted that Fidelity may agree to waive fees and expenses from time to time, and the extent to which, if any, it has done so for the fund. As part of its review, the Board also considered the current and historical total expense ratios of each class of the fund compared to competitive fund median expenses. Each class of the fund is compared to those funds and classes in the Total Mapped Group (used by the Board for management fee comparisons) that have a similar sales load structure.
The Board noted that the total expense ratio of each class ranked below the competitive median for 2015.
Fees Charged to Other Fidelity Clients. The Board also considered Fidelity fee structures and other information with respect to clients of Fidelity, such as other funds advised or subadvised by Fidelity, pension plan clients, and other institutional clients with similar mandates. The Board noted the findings of the 2013 ad hoc joint committee (created with the board of other Fidelity funds), which reviewed and compared Fidelity's institutional investment advisory business with its business of providing services to the Fidelity funds, including the differences in services provided, fees charged, and costs incurred, as well as competition in their respective marketplaces.
Based on its review of total expense ratios and fees charged to other Fidelity clients, the Board concluded that the total expense ratio of each class of the fund was reasonable in light of the services that the fund and its shareholders receive and the other factors considered.
Costs of the Services and Profitability. The Board considered the revenues earned and the expenses incurred by Fidelity in conducting the business of developing, marketing, distributing, managing, administering and servicing the fund and servicing the fund's shareholders. The Board also considered the level of Fidelity's profits in respect of all the Fidelity funds.
On an annual basis, Fidelity presents to the Board information about the profitability of its relationship with the fund. Fidelity calculates profitability information for each fund, as well as aggregate profitability information for groups of Fidelity funds and all Fidelity funds, using a series of detailed revenue and cost allocation methodologies which originate with the books and records of Fidelity on which Fidelity's audited financial statements are based. The Audit Committee of the Board reviews any significant changes from the prior year's methodologies.
PricewaterhouseCoopers LLP (PwC), independent registered public accounting firm and auditor to Fidelity and certain Fidelity funds, has been engaged annually by the Board as part of the Board's assessment of Fidelity's profitability analysis. PwC's engagement includes the review and assessment of the methodologies used by Fidelity in determining the revenues and expenses attributable to Fidelity's mutual fund business, and completion of agreed-upon procedures in respect of the mathematical accuracy of the fund profitability information and its conformity to established allocation methodologies. After considering PwC's reports issued under the engagement and information provided by Fidelity, the Board concluded that while other allocation methods may also be reasonable, Fidelity's profitability methodologies are reasonable in all material respects.
The Board also reviewed Fidelity's non-fund businesses and fall-out benefits related to the mutual fund business as well as cases where Fidelity's affiliates may benefit from or be related to the fund's business.
The Board considered the costs of the services provided by and the profits realized by Fidelity in connection with the operation of the fund and was satisfied that the profitability was not excessive.
Economies of Scale. The Board considered whether there have been economies of scale in respect of the management of the Fidelity funds, whether the Fidelity funds (including the fund) have appropriately benefited from any such economies of scale, and whether there is potential for realization of any further economies of scale. The Board considered the extent to which the fund will benefit from economies of scale as assets grow through increased services to the fund, through waivers or reimbursements, or through fee or expense ratio reductions. The Board also noted that in 2013, it and the boards of other Fidelity funds created an ad hoc committee (the Economies of Scale Committee) to analyze whether Fidelity attains economies of scale in respect of the management and servicing of the Fidelity funds, whether the Fidelity funds have appropriately benefited from such economies of scale, and whether there is potential for realization of any further economies of scale.
The Board recognized that the fund's management contract incorporates a "group fee" structure, which provides for lower group fee rates as total group assets increase, and for higher group fee rates as total group assets decrease (with "group assets" defined to include fund assets under FMR's management plus the assets of sector funds previously under FMR's management). FMR calculates the group fee rates based on a tiered asset "breakpoint" schedule that varies based on asset class. The Board considered that the group fee is designed to deliver the benefits of economies of scale to fund shareholders when total Fidelity fund assets increase, even if assets of any particular fund are unchanged or have declined, because some portion of Fidelity's costs are attributable to services provided to all Fidelity funds, and all funds benefit if those costs can be allocated among more assets. The Board concluded that, given the group fee structure, fund shareholders will benefit from lower management fees as group assets increase at the fund complex level, regardless of whether Fidelity achieves any such economies of scale.
The Board concluded, taking into account the analysis of the Economies of Scale Committee, that economies of scale, if any, are being appropriately shared between fund shareholders and Fidelity.
Additional Information Requested by the Board. In order to develop fully the factual basis for consideration of the Fidelity funds' Advisory Contracts, the Board requested and received additional information on certain topics, including: (i) fund performance trends and Fidelity's long-term strategies for certain funds; (ii) the various share classes employed by Fidelity and the attributes of each class, together with similar information on the distribution and servicing payments made by Fidelity or the funds to third-party participants in the distribution channels; (iii) fund profitability, and fund performance in relation to fund profitability; (iv) the methodology with respect to evaluating competitive fund data and peer group classifications and fee comparisons; (v) annual fund profitability margins; (vi) the realization of fall-out benefits in and attribution of fall-out benefits to certain Fidelity business units; (vii) the appropriateness of certain funds' benchmarks; (viii) the rationalization for certain share classes and expenses; (ix) sub-advisory fee rates for comparable investment mandates; (x) product strategy for certain underperforming funds; and (xi) Fidelity's resources and strategy for cybersecurity.
Based on its evaluation of all of the conclusions noted above, and after considering all factors it believed relevant, the Board concluded that the advisory fee structures are fair and reasonable, and that the fund's Advisory Contracts should be renewed.
Corporate Headquarters
245 Summer St.
Boston, MA 02210
www.fidelity.com
LSF-K-ANN-0916
1.863382.107
Fidelity® Blue Chip Growth Fund Class K
Annual Report July 31, 2016 |
|
Contents
To view a fund's proxy voting guidelines and proxy voting record for the 12-month period ended June 30, visit http://www.fidelity.com/proxyvotingresults or visit the Securities and Exchange Commission's (SEC) web site at http://www.sec.gov.
You may also call 1-800-835-5092 to request a free copy of the proxy voting guidelines.
Standard & Poor's, S&P and S&P 500 are registered service marks of The McGraw-Hill Companies, Inc. and have been licensed for use by Fidelity Distributors Corporation.
Other third-party marks appearing herein are the property of their respective owners.
All other marks appearing herein are registered or unregistered trademarks or service marks of FMR LLC or an affiliated company. © 2016 FMR LLC. All rights reserved.
This report and the financial statements contained herein are submitted for the general information of the shareholders of the Fund. This report is not authorized for distribution to prospective investors in the Fund unless preceded or accompanied by an effective prospectus.
A fund files its complete schedule of portfolio holdings with the SEC for the first and third quarters of each fiscal year on Form N-Q. Forms N-Q are available on the SEC’s web site at http://www.sec.gov. A fund's Forms N-Q may be reviewed and copied at the SEC’s Public Reference Room in Washington, DC. Information regarding the operation of the SEC's Public Reference Room may be obtained by calling 1-800-SEC-0330.
For a complete list of a fund's portfolio holdings, view the most recent holdings listing, semiannual report, or annual report on Fidelity's web site at http://www.fidelity.com, http://www.institutional.fidelity.com, or http://www.401k.com, as applicable.
NOT FDIC INSURED •MAY LOSE VALUE •NO BANK GUARANTEE
Neither the Fund nor Fidelity Distributors Corporation is a bank.
Performance: The Bottom Line
Average annual total return reflects the change in the value of an investment, assuming reinvestment of distributions from dividend income and capital gains (the profits earned upon the sale of securities that have grown in value, if any) and assuming a constant rate of performance each year. The hypothetical investment and the average annual total returns do not reflect the deduction of taxes that a shareholder would pay on fund distributions or the redemption of fund shares. During periods of reimbursement by Fidelity, a fund’s total return will be greater than it would be had the reimbursement not occurred. How a fund did yesterday is no guarantee of how it will do tomorrow.
Average Annual Total Returns
| For the periods ended July 31, 2016 | Past 1 year | Past 5 years | Past 10 years |
| Class K | (2.47)% | 13.26% | 10.03% |
The initial offering of Class K shares took place on May 9, 2008. Returns prior to May 9, 2008 are those of Fidelity® Blue Chip Growth Fund, the original class of the fund.
$10,000 Over 10 Years
Let's say hypothetically that $10,000 was invested in Fidelity® Blue Chip Growth Fund - Class K on July 31, 2006. The chart shows how the value of your investment would have changed, and also shows how the Russell 1000® Growth Index performed over the same period. See above for additional information regarding the performance of Class K.
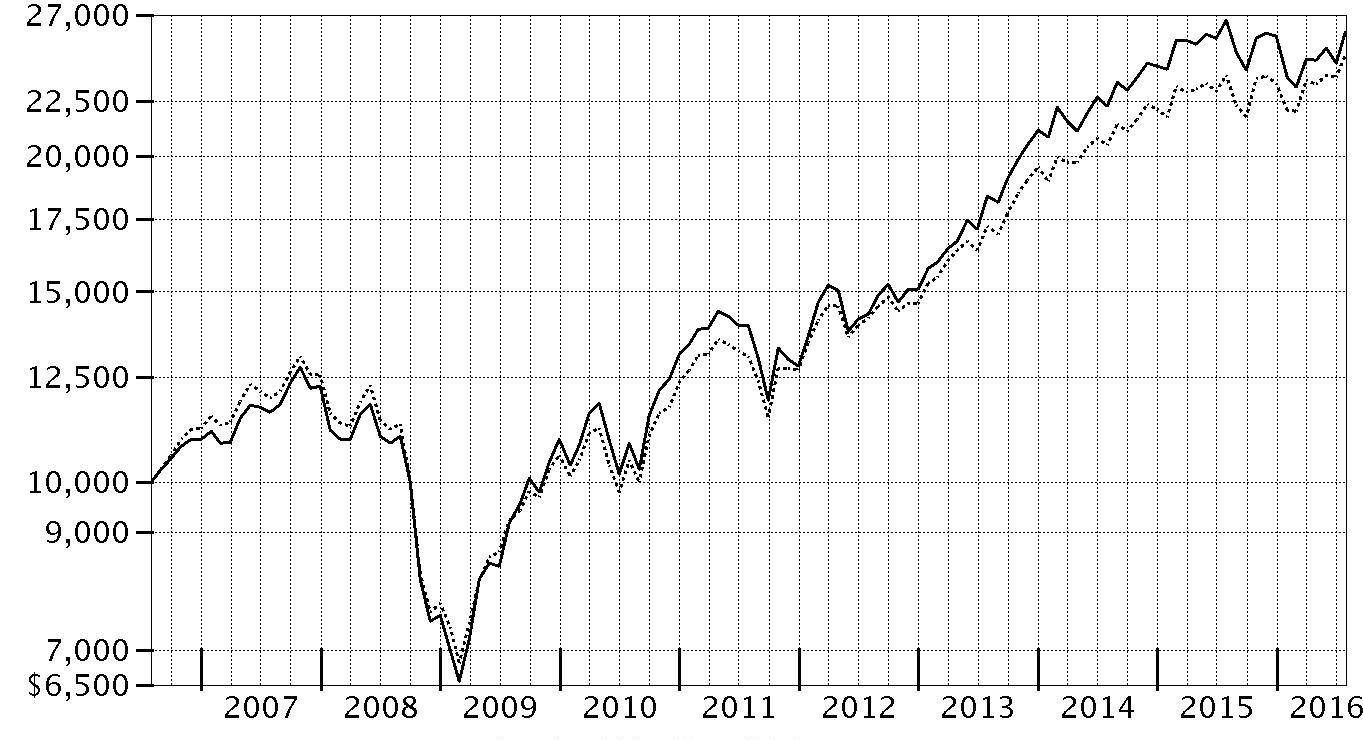
| Period Ending Values |
| $26,013 | Fidelity® Blue Chip Growth Fund - Class K |
| $24,772 | Russell 1000® Growth Index |
Management's Discussion of Fund Performance
Market Recap: U.S. equities gained modestly for the year ending July 31, 2016, overcoming persistent concern about global economic growth, uncertainty regarding U.S. monetary policy and the U.K.’s late-June vote to leave the European Union, dubbed Brexit. The S&P 500 index rose 5.61%, with larger-cap, value-oriented stocks and defensive sectors shining brightest. Volatility peaked in the early weeks of 2016, as continued oil-price weakness and U.S.-dollar strength pushed the S&P 500
® to its worst January since 2009. Markets then rose beginning in February amid U.S. job gains, a broad rally in energy and materials markets, global economic stimulus and perceived softening of monetary policy by the U.S. Federal Reserve. The June 23 Brexit vote surprised markets and resulted in a sharp two-day decline for stocks, followed by a rebound as investor sentiment shifted and remained positive through July 31. For the year, dividend-rich telecom services (+26%), utilities (+23%) and consumer staples (+12%) led the way amid strong investor demand for yield. Industrials (+10%) and information technology (+10%) also outperformed, as did materials (+8%), despite a weak commodities environment overall. Conversely, a strong run for real estate stocks couldn’t keep financials (-4%) from losing ground, as low interest rates continued to squeeze bank profits.
Comments from Portfolio Manager Sonu Kalra: For the year, the fund’s share classes returned about -3%, substantially lagging the 4.35% result of the benchmark Russell 1000 Growth Index. Investors tended to favor companies with perceived lower volatility and high dividends, while growth stocks, such as those the fund invests in, largely fell out of favor. Versus the benchmark, weak stock selection overall was the primary detractor, especially in pharmaceuticals, biotechnology & life sciences. A non-index stake in Canada-based Valeant Pharmaceuticals International was our largest individual detractor. The stock plunged in October on allegations of accounting irregularities and a U.S. investigation into the firm's drug pricing, as well its programs to help patients afford its drugs. Shares fell further in mid-March after the company said it may default on its debt and would not meet earnings targets. Allergan was another detractor here, as our investments fell on investor concern about its planned merger with Pfizer. I eliminated both Valeant and Allergan by period end. Conversely, the fund’s stake in Amazon.com, a large portfolio holding, helped most. Shares rose about 42% on the company's strong profits. Google parent Alphabet – the fund's largest holding at period end (combining its Class A and Class C shares) – also contributed, as its stock rose on better-than-expected financial results.
The views expressed above reflect those of the portfolio manager(s) only through the end of the period as stated on the cover of this report and do not necessarily represent the views of Fidelity or any other person in the Fidelity organization. Any such views are subject to change at any time based upon market or other conditions and Fidelity disclaims any responsibility to update such views. These views may not be relied on as investment advice and, because investment decisions for a Fidelity fund are based on numerous factors, may not be relied on as an indication of trading intent on behalf of any Fidelity fund.
Investment Summary (Unaudited)
Top Ten Stocks as of July 31, 2016
| | % of fund's net assets | % of fund's net assets 6 months ago |
| Amazon.com, Inc. | 6.0 | 4.9 |
| Alphabet, Inc. Class A | 5.9 | 5.7 |
| Apple, Inc. | 5.3 | 4.1 |
| Facebook, Inc. Class A | 4.0 | 4.1 |
| Salesforce.com, Inc. | 2.4 | 1.9 |
| Tesla Motors, Inc. | 2.3 | 1.2 |
| Home Depot, Inc. | 2.1 | 2.1 |
| Broadcom Ltd. | 2.0 | 1.5 |
| Visa, Inc. Class A | 1.9 | 2.0 |
| Alphabet, Inc. Class C | 1.8 | 2.4 |
| | 33.7 | |
Top Five Market Sectors as of July 31, 2016
| | % of fund's net assets | % of fund's net assets 6 months ago |
| Information Technology | 37.6 | 37.4 |
| Consumer Discretionary | 26.5 | 26.4 |
| Health Care | 14.4 | 16.1 |
| Consumer Staples | 8.2 | 10.8 |
| Industrials | 4.8 | 4.9 |
Asset Allocation (% of fund's net assets)
| As of July 31, 2016 * |
| | Stocks | 97.4% |
| | Convertible Securities | 2.5% |
| | Short-Term Investments and Net Other Assets (Liabilities) | 0.1% |

* Foreign investments - 12.0%
| As of January 31, 2016 * |
| | Stocks | 97.6% |
| | Convertible Securities | 2.4% |

* Foreign investments - 12.2%
Investments July 31, 2016
Showing Percentage of Net Assets
| Common Stocks - 97.3% | | | |
| | | Shares | Value (000s) |
| CONSUMER DISCRETIONARY - 26.3% | | | |
| Automobiles - 2.3% | | | |
| BYD Co. Ltd. (H Shares) (a) | | 1,096,500 | $6,953 |
| Tesla Motors, Inc. (a) | | 1,879,033 | 441,178 |
| | | | 448,131 |
| Diversified Consumer Services - 0.2% | | | |
| New Oriental Education & Technology Group, Inc. sponsored ADR | | 520,700 | 22,942 |
| ServiceMaster Global Holdings, Inc. (a) | | 255,300 | 9,658 |
| Weight Watchers International, Inc. (a) | | 129,353 | 1,543 |
| | | | 34,143 |
| Hotels, Restaurants & Leisure - 4.6% | | | |
| Buffalo Wild Wings, Inc. (a) | | 452,209 | 75,953 |
| Chipotle Mexican Grill, Inc.(a) | | 675,370 | 286,350 |
| Darden Restaurants, Inc. | | 91,200 | 5,614 |
| Dave & Buster's Entertainment, Inc. (a) | | 1,775,813 | 79,024 |
| Domino's Pizza, Inc. | | 240,171 | 35,377 |
| Extended Stay America, Inc. unit | | 277,700 | 3,932 |
| Hilton Worldwide Holdings, Inc. | | 853,176 | 19,785 |
| Las Vegas Sands Corp. | | 246,500 | 12,485 |
| McDonald's Corp. | | 566,275 | 66,622 |
| MGM Mirage, Inc. (a) | | 1,350,942 | 32,396 |
| Panera Bread Co. Class A (a) | | 137,600 | 30,178 |
| Starbucks Corp. | | 4,033,247 | 234,130 |
| Texas Roadhouse, Inc. Class A | | 39,800 | 1,879 |
| Wingstop, Inc. (b) | | 152,000 | 3,952 |
| | | | 887,677 |
| Household Durables - 1.2% | | | |
| Mohawk Industries, Inc. (a) | | 11,249 | 2,350 |
| Newell Brands, Inc. | | 1,378,002 | 72,290 |
| Nien Made Enterprise Co. Ltd. | | 437,000 | 4,573 |
| Sony Corp. | | 1,664,300 | 54,634 |
| Sony Corp. sponsored ADR | | 990,975 | 33,108 |
| Whirlpool Corp. | | 335,832 | 64,601 |
| | | | 231,556 |
| Internet & Catalog Retail - 8.0% | | | |
| Amazon.com, Inc. (a) | | 1,524,987 | 1,157,179 |
| Ctrip.com International Ltd. ADR (a) | | 565,533 | 24,697 |
| Expedia, Inc. | | 739,099 | 86,216 |
| Groupon, Inc. Class A (a) | | 1,081,314 | 5,212 |
| Netflix, Inc. (a) | | 1,028,248 | 93,828 |
| Priceline Group, Inc. (a) | | 129,505 | 174,937 |
| The Honest Co., Inc. (a)(c) | | 150,143 | 5,782 |
| | | | 1,547,851 |
| Leisure Products - 0.2% | | | |
| Mattel, Inc. | | 1,142,488 | 38,136 |
| NJOY, Inc. (a)(c) | | 8,088,440 | 324 |
| Spin Master Corp. (a) | | 410,200 | 8,420 |
| | | | 46,880 |
| Media - 0.9% | | | |
| Altice NV Class A (a) | | 2,599,717 | 38,584 |
| Charter Communications, Inc. Class A (a) | | 266,894 | 62,685 |
| Lions Gate Entertainment Corp. (b) | | 719,765 | 14,388 |
| Naspers Ltd. Class N | | 178,100 | 27,948 |
| The Walt Disney Co. | | 355,751 | 34,134 |
| | | | 177,739 |
| Multiline Retail - 1.2% | | | |
| B&M European Value Retail S.A. | | 3,059,462 | 10,418 |
| Dollar Tree, Inc. (a) | | 873,365 | 84,096 |
| JC Penney Corp., Inc. (a)(b) | | 224,366 | 2,167 |
| Kohl's Corp. | | 320,600 | 13,334 |
| Macy's, Inc. | | 596,500 | 21,373 |
| Ollie's Bargain Outlet Holdings, Inc. (a) | | 86,722 | 2,267 |
| Target Corp. | | 1,234,746 | 93,013 |
| | | | 226,668 |
| Specialty Retail - 4.2% | | | |
| Abercrombie & Fitch Co. Class A | | 287,800 | 5,960 |
| Advance Auto Parts, Inc. | | 47,600 | 8,085 |
| AutoZone, Inc. (a) | | 24,177 | 19,679 |
| Dick's Sporting Goods, Inc. | | 152,700 | 7,832 |
| Home Depot, Inc. | | 2,907,124 | 401,881 |
| Inditex SA | | 484,826 | 16,767 |
| L Brands, Inc. | | 1,638,536 | 121,088 |
| Lowe's Companies, Inc. | | 363,500 | 29,909 |
| O'Reilly Automotive, Inc. (a) | | 31,357 | 9,113 |
| Restoration Hardware Holdings, Inc. (a)(b) | | 1,565,274 | 48,226 |
| Ross Stores, Inc. | | 524,749 | 32,445 |
| The Children's Place Retail Stores, Inc. | | 96,100 | 8,032 |
| TJX Companies, Inc. | | 1,292,767 | 105,645 |
| Ulta Salon, Cosmetics & Fragrance, Inc. (a) | | 40,984 | 10,705 |
| | | | 825,367 |
| Textiles, Apparel & Luxury Goods - 3.5% | | | |
| adidas AG | | 1,348,842 | 221,577 |
| Coach, Inc. | | 193,200 | 8,329 |
| G-III Apparel Group Ltd. (a) | | 733,639 | 29,368 |
| Kate Spade & Co. (a) | | 689,202 | 14,949 |
| lululemon athletica, Inc. (a)(b) | | 1,412,372 | 109,671 |
| NIKE, Inc. Class B | | 1,875,344 | 104,082 |
| PVH Corp. | | 606,281 | 61,271 |
| Ralph Lauren Corp. | | 261,000 | 25,601 |
| Regina Miracle International Holdings Ltd. (b) | | 6,143,551 | 6,747 |
| Skechers U.S.A., Inc. Class A (sub. vtg.) (a) | | 1,934,595 | 46,469 |
| Tory Burch LLC unit (c)(d) | | 293,611 | 18,266 |
| Under Armour, Inc. Class C (non-vtg.) | | 1,071,853 | 38,265 |
| | | | 684,595 |
|
| TOTAL CONSUMER DISCRETIONARY | | | 5,110,607 |
|
| CONSUMER STAPLES - 8.0% | | | |
| Beverages - 2.6% | | | |
| Anheuser-Busch InBev SA NV ADR | | 423,474 | 54,814 |
| Constellation Brands, Inc. Class A (sub. vtg.) | | 399,727 | 65,807 |
| Molson Coors Brewing Co. Class B | | 1,056,455 | 107,927 |
| Monster Beverage Corp. (a) | | 1,118,395 | 179,648 |
| The Coca-Cola Co. | | 2,432,765 | 106,142 |
| | | | 514,338 |
| Food & Staples Retailing - 1.4% | | | |
| Costco Wholesale Corp. | | 1,246,497 | 208,439 |
| CVS Health Corp. | | 419,306 | 38,878 |
| Sprouts Farmers Market LLC (a) | | 353,500 | 8,176 |
| United Natural Foods, Inc. (a) | | 116,900 | 5,843 |
| Whole Foods Market, Inc. | | 137,218 | 4,182 |
| | | | 265,518 |
| Food Products - 1.3% | | | |
| Associated British Foods PLC | | 1,057,745 | 37,671 |
| Bunge Ltd. | | 202,000 | 13,300 |
| Edita Food Industries SAE GDR (e) | | 259,200 | 1,581 |
| Mead Johnson Nutrition Co. Class A | | 515,800 | 46,009 |
| Mondelez International, Inc. | | 1,836,833 | 80,784 |
| The Hain Celestial Group, Inc. (a) | | 1,218,771 | 64,339 |
| The J.M. Smucker Co. | | 13,500 | 2,081 |
| TreeHouse Foods, Inc. (a) | | 107,700 | 11,114 |
| | | | 256,879 |
| Household Products - 0.2% | | | |
| Spectrum Brands Holdings, Inc. | | 303,700 | 39,107 |
| Personal Products - 1.8% | | | |
| Coty, Inc. Class A | | 250,800 | 6,739 |
| Estee Lauder Companies, Inc. Class A | | 1,017,472 | 94,523 |
| Herbalife Ltd. (a) | | 1,454,040 | 98,889 |
| Nu Skin Enterprises, Inc. Class A (b) | | 2,665,324 | 142,328 |
| | | | 342,479 |
| Tobacco - 0.7% | | | |
| Imperial Tobacco Group PLC | | 203,133 | 10,709 |
| Reynolds American, Inc. | | 2,394,361 | 119,862 |
| | | | 130,571 |
|
| TOTAL CONSUMER STAPLES | | | 1,548,892 |
|
| ENERGY - 2.4% | | | |
| Energy Equipment & Services - 0.2% | | | |
| Baker Hughes, Inc. | | 533,900 | 25,536 |
| National Oilwell Varco, Inc. | | 235,300 | 7,612 |
| | | | 33,148 |
| Oil, Gas & Consumable Fuels - 2.2% | | | |
| Anadarko Petroleum Corp. | | 1,367,132 | 74,550 |
| Apache Corp. | | 264,100 | 13,865 |
| Cabot Oil & Gas Corp. | | 166,600 | 4,110 |
| Carrizo Oil & Gas, Inc. (a) | | 290,600 | 9,532 |
| Cimarex Energy Co. | | 375,650 | 45,086 |
| Continental Resources, Inc. (a) | | 1,256,841 | 55,364 |
| Devon Energy Corp. | | 922,400 | 35,309 |
| EOG Resources, Inc. | | 631,858 | 51,623 |
| Pioneer Natural Resources Co. | | 374,526 | 60,887 |
| SM Energy Co. | | 943,300 | 25,592 |
| Suncor Energy, Inc. | | 274,100 | 7,377 |
| Targa Resources Corp. | | 200,500 | 7,471 |
| Whiting Petroleum Corp. (a) | | 2,558,600 | 18,857 |
| Williams Partners LP | | 597,600 | 22,314 |
| | | | 431,937 |
|
| TOTAL ENERGY | | | 465,085 |
|
| FINANCIALS - 4.3% | | | |
| Banks - 1.4% | | | |
| Bank of America Corp. | | 4,206,621 | 60,954 |
| Citigroup, Inc. | | 1,342,121 | 58,798 |
| HDFC Bank Ltd. sponsored ADR | | 647,917 | 44,881 |
| JPMorgan Chase & Co. | | 1,577,436 | 100,909 |
| | | | 265,542 |
| Capital Markets - 0.5% | | | |
| BlackRock, Inc. Class A | | 151,664 | 55,547 |
| Charles Schwab Corp. | | 776,741 | 22,075 |
| Fairfax India Holdings Corp. (a) | | 907,400 | 9,128 |
| Goldman Sachs Group, Inc. | | 96,600 | 15,341 |
| | | | 102,091 |
| Diversified Financial Services - 2.2% | | | |
| Bats Global Markets, Inc. | | 603,700 | 15,322 |
| Broadcom Ltd. | | 2,361,859 | 382,574 |
| MSCI, Inc. Class A | | 155,600 | 13,388 |
| WME Entertainment Parent, LLC Class A unit (c)(d) | | 3,718,505 | 7,638 |
| | | | 418,922 |
| Real Estate Investment Trusts - 0.1% | | | |
| Extra Space Storage, Inc. | | 277,987 | 23,912 |
| Real Estate Management & Development - 0.0% | | | |
| Parsvnath Developers Ltd. (a)(f) | | 21,771,340 | 7,823 |
| Thrifts & Mortgage Finance - 0.1% | | | |
| Housing Development Finance Corp. Ltd. | | 697,722 | 14,388 |
|
| TOTAL FINANCIALS | | | 832,678 |
|
| HEALTH CARE - 14.2% | | | |
| Biotechnology - 9.0% | | | |
| ACADIA Pharmaceuticals, Inc. (a) | | 118,500 | 4,389 |
| Acceleron Pharma, Inc. (a) | | 143,443 | 4,866 |
| Agios Pharmaceuticals, Inc. (a)(b) | | 191,678 | 8,670 |
| Aimmune Therapeutics, Inc. (a)(b) | | 397,357 | 4,764 |
| Alexion Pharmaceuticals, Inc. (a) | | 1,079,069 | 138,768 |
| Alkermes PLC (a) | | 1,021,247 | 50,960 |
| Alnylam Pharmaceuticals, Inc. (a) | | 676,140 | 46,032 |
| Amgen, Inc. | | 1,733,286 | 298,177 |
| ARIAD Pharmaceuticals, Inc. (a) | | 434,900 | 4,136 |
| Ascendis Pharma A/S sponsored ADR (a) | | 329,051 | 4,738 |
| BeiGene Ltd. sponsored ADR | | 34,400 | 903 |
| Biogen, Inc. (a) | | 780,690 | 226,345 |
| BioMarin Pharmaceutical, Inc. (a) | | 337,287 | 33,533 |
| bluebird bio, Inc. (a) | | 243,667 | 13,933 |
| Catabasis Pharmaceuticals, Inc. (a)(b) | | 517,993 | 1,989 |
| Celgene Corp. (a) | | 2,302,472 | 258,314 |
| Cellectis SA sponsored ADR (a) | | 66,409 | 1,751 |
| Chiasma, Inc. (a)(b) | | 297,051 | 787 |
| Chiasma, Inc. (e) | | 221,566 | 587 |
| Chiasma, Inc. warrants | | 55,391 | 40 |
| Chimerix, Inc. (a) | | 84,385 | 337 |
| Coherus BioSciences, Inc. (a)(b) | | 556,989 | 14,142 |
| Corvus Pharmaceuticals, Inc. | | 143,500 | 1,887 |
| Corvus Pharmaceuticals, Inc. | | 338,682 | 4,231 |
| CytomX Therapeutics, Inc. | | 164,076 | 1,651 |
| CytomX Therapeutics, Inc. (e) | | 378,621 | 3,809 |
| DBV Technologies SA sponsored ADR (a)(b) | | 106,654 | 3,690 |
| Editas Medicine, Inc. (b) | | 339,400 | 8,729 |
| Editas Medicine, Inc. | | 276,353 | 7,037 |
| Exelixis, Inc. (a)(b) | | 2,789,291 | 25,606 |
| FibroGen, Inc. (a) | | 366,641 | 7,014 |
| GenSight Biologics SA | | 632,364 | 5,656 |
| Gilead Sciences, Inc. | | 561,138 | 44,594 |
| Global Blood Therapeutics, Inc. (a)(b) | | 516,609 | 9,237 |
| Heron Therapeutics, Inc. (a) | | 111,781 | 1,858 |
| Intellia Therapeutics, Inc. | | 191,600 | 3,625 |
| Intellia Therapeutics, Inc. | | 409,999 | 6,981 |
| Intercept Pharmaceuticals, Inc. (a) | | 147,521 | 25,526 |
| Intrexon Corp. (a)(b) | | 470,517 | 11,918 |
| Ionis Pharmaceuticals, Inc. (a) | | 125,129 | 3,653 |
| Ironwood Pharmaceuticals, Inc. Class A (a) | | 1,056,367 | 14,926 |
| Merrimack Pharmaceuticals, Inc. (a)(b) | | 1,562,425 | 9,062 |
| Mirati Therapeutics, Inc. (a) | | 92,632 | 430 |
| Momenta Pharmaceuticals, Inc. (a) | | 96,269 | 1,084 |
| Neurocrine Biosciences, Inc. (a) | | 624,447 | 31,366 |
| Novavax, Inc. (a) | | 436,504 | 3,195 |
| Portola Pharmaceuticals, Inc. (a) | | 299,425 | 7,773 |
| Prothena Corp. PLC (a) | | 102,959 | 5,668 |
| Radius Health, Inc. (a)(b) | | 84,085 | 3,962 |
| Regeneron Pharmaceuticals, Inc. (a) | | 529,608 | 225,147 |
| Sage Therapeutics, Inc. (a) | | 119,267 | 5,350 |
| Seattle Genetics, Inc. (a) | | 400,493 | 19,248 |
| Seres Therapeutics, Inc. (a) | | 48,733 | 533 |
| Spark Therapeutics, Inc. (a) | | 155,019 | 8,982 |
| TESARO, Inc. (a) | | 67,700 | 6,312 |
| Trevena, Inc. (a) | | 1,029,195 | 6,453 |
| Ultragenyx Pharmaceutical, Inc. (a) | | 58,420 | 3,697 |
| Vertex Pharmaceuticals, Inc. (a) | | 1,070,402 | 103,829 |
| Xencor, Inc. (a) | | 109,850 | 2,081 |
| | | | 1,753,961 |
| Health Care Equipment & Supplies - 2.1% | | | |
| Boston Scientific Corp. (a) | | 4,485,838 | 108,916 |
| Danaher Corp. | | 655,159 | 53,356 |
| DexCom, Inc. (a) | | 124,729 | 11,504 |
| Edwards Lifesciences Corp. (a) | | 66,100 | 7,570 |
| Insulet Corp. (a) | | 118,000 | 4,176 |
| Intuitive Surgical, Inc. (a) | | 160,441 | 111,628 |
| Invuity, Inc. (a) | | 604,811 | 6,230 |
| Medtronic PLC | | 739,725 | 64,822 |
| Nevro Corp. (a)(b) | | 490,321 | 40,550 |
| | | | 408,752 |
| Health Care Providers & Services - 0.7% | | | |
| Adeptus Health, Inc. Class A (a)(b) | | 821,468 | 36,613 |
| AmSurg Corp. (a) | | 401,756 | 30,136 |
| Anthem, Inc. | | 113,000 | 14,841 |
| Apollo Hospitals Enterprise Ltd. | | 840,757 | 17,178 |
| Cigna Corp. | | 128,300 | 16,546 |
| Dr Lal Pathlabs Ltd. | | 7,779 | 113 |
| UnitedHealth Group, Inc. | | 83,362 | 11,937 |
| Wellcare Health Plans, Inc. (a) | | 35,000 | 3,738 |
| | | | 131,102 |
| Health Care Technology - 0.1% | | | |
| athenahealth, Inc. (a) | | 74,973 | 9,581 |
| Evolent Health, Inc. (a) | | 240,272 | 5,656 |
| | | | 15,237 |
| Life Sciences Tools & Services - 0.0% | | | |
| Lonza Group AG | | 37,634 | 7,094 |
| Thermo Fisher Scientific, Inc. | | 12,600 | 2,001 |
| | | | 9,095 |
| Pharmaceuticals - 2.3% | | | |
| Achaogen, Inc. (a) | | 324,457 | 1,275 |
| Bristol-Myers Squibb Co. | | 2,066,785 | 154,616 |
| Catalent, Inc. (a) | | 84,400 | 2,156 |
| Cempra, Inc. (a)(b) | | 131,800 | 2,368 |
| Dermira, Inc. (a) | | 323,548 | 10,858 |
| Eli Lilly & Co. | | 233,000 | 19,313 |
| Endo International PLC (a) | | 2,149,856 | 37,322 |
| GW Pharmaceuticals PLC ADR (a) | | 209,696 | 19,779 |
| Intra-Cellular Therapies, Inc. (a) | | 180,557 | 7,367 |
| Jazz Pharmaceuticals PLC (a) | | 230,644 | 34,820 |
| Johnson & Johnson | | 108,100 | 13,537 |
| Pacira Pharmaceuticals, Inc. (a)(b) | | 599,784 | 21,742 |
| Patheon NV | | 266,100 | 6,881 |
| Teva Pharmaceutical Industries Ltd. sponsored ADR | | 1,561,099 | 83,519 |
| The Medicines Company (a) | | 524,924 | 20,530 |
| | | | 436,083 |
|
| TOTAL HEALTH CARE | | | 2,754,230 |
|
| INDUSTRIALS - 4.7% | | | |
| Aerospace & Defense - 0.9% | | | |
| Honeywell International, Inc. | | 835,098 | 97,147 |
| Lockheed Martin Corp. | | 92,097 | 23,276 |
| Northrop Grumman Corp. | | 107,169 | 23,216 |
| Raytheon Co. | | 135,615 | 18,922 |
| Space Exploration Technologies Corp. Class A (a)(c) | | 160,303 | 15,456 |
| Taser International, Inc. (a) | | 68,800 | 1,992 |
| TransDigm Group, Inc. (a) | | 7,000 | 1,957 |
| | | | 181,966 |
| Airlines - 1.8% | | | |
| American Airlines Group, Inc. | | 685,200 | 24,325 |
| Azul-Linhas Aereas Brasileiras warrants (a)(c) | | 165,571 | 0 |
| Delta Air Lines, Inc. | | 2,269,949 | 87,961 |
| InterGlobe Aviation Ltd. (a) | | 257,728 | 3,819 |
| JetBlue Airways Corp. (a) | | 413,000 | 7,570 |
| Southwest Airlines Co. | | 3,392,073 | 125,541 |
| Spirit Airlines, Inc. (a) | | 829,042 | 35,442 |
| United Continental Holdings, Inc. (a) | | 1,119,934 | 52,514 |
| Wizz Air Holdings PLC (a) | | 266,810 | 5,470 |
| | | | 342,642 |
| Building Products - 0.1% | | | |
| Apogee Enterprises, Inc. | | 40,500 | 1,893 |
| Builders FirstSource, Inc. (a) | | 545,200 | 7,028 |
| Masco Corp. | | 298,300 | 10,882 |
| | | | 19,803 |
| Construction & Engineering - 0.4% | | | |
| Dycom Industries, Inc. (a) | | 769,900 | 72,409 |
| Electrical Equipment - 0.5% | | | |
| Acuity Brands, Inc. | | 166,140 | 43,600 |
| AMETEK, Inc. | | 161,800 | 7,609 |
| Emerson Electric Co. | | 136,400 | 7,625 |
| Fortive Corp. (a) | | 366,879 | 17,687 |
| Regal Beloit Corp. | | 193,200 | 11,787 |
| SolarCity Corp. (a) | | 154,000 | 4,112 |
| | | | 92,420 |
| Industrial Conglomerates - 0.1% | | | |
| Koninklijke Philips Electronics NV (depositary receipt) (NY Reg.) | | 649,100 | 17,240 |
| Machinery - 0.5% | | | |
| Allison Transmission Holdings, Inc. | | 597,000 | 17,206 |
| Caterpillar, Inc. | | 176,300 | 14,591 |
| Eicher Motors Ltd. | | 14,288 | 4,815 |
| Ingersoll-Rand PLC | | 175,500 | 11,629 |
| Pentair PLC | | 112,800 | 7,199 |
| Rational AG | | 16,338 | 7,904 |
| Wabtec Corp. | | 319,700 | 21,899 |
| Xylem, Inc. | | 323,700 | 15,476 |
| | | | 100,719 |
| Professional Services - 0.0% | | | |
| Equifax, Inc. | | 42,342 | 5,609 |
| Road & Rail - 0.0% | | | |
| Genesee & Wyoming, Inc. Class A (a) | | 62,400 | 4,040 |
| Trading Companies & Distributors - 0.4% | | | |
| HD Supply Holdings, Inc. (a) | | 1,947,147 | 70,467 |
|
| TOTAL INDUSTRIALS | | | 907,315 |
|
| INFORMATION TECHNOLOGY - 35.7% | | | |
| Communications Equipment - 0.1% | | | |
| Arista Networks, Inc. (a)(b) | | 139,200 | 9,921 |
| Electronic Equipment & Components - 0.2% | | | |
| Fitbit, Inc. (a)(b) | | 1,616,286 | 22,078 |
| Jabil Circuit, Inc. | | 545,800 | 11,107 |
| QLogic Corp. (a) | | 251,500 | 3,903 |
| | | | 37,088 |
| Internet Software & Services - 14.6% | | | |
| 58.com, Inc. ADR (a) | | 394,700 | 20,528 |
| Akamai Technologies, Inc. (a) | | 267,400 | 13,512 |
| Alibaba Group Holding Ltd. sponsored ADR (a) | | 1,727,516 | 142,486 |
| Alphabet, Inc.: | | | |
| Class A | | 1,448,536 | 1,146,284 |
| Class C (a) | | 454,584 | 349,480 |
| Dropbox, Inc. (a)(c) | | 1,003,814 | 11,152 |
| eBay, Inc. (a) | | 5,692,500 | 177,378 |
| Facebook, Inc. Class A (a) | | 6,326,684 | 784,129 |
| GoDaddy, Inc. (a) | | 129,300 | 3,869 |
| Gogo, Inc. (a)(b) | | 1,800,142 | 15,139 |
| MercadoLibre, Inc. | | 43,600 | 6,674 |
| New Relic, Inc. (a) | | 172,881 | 5,954 |
| Rackspace Hosting, Inc. (a) | | 3,301,405 | 77,352 |
| Shopify, Inc. Class A (a) | | 159,300 | 5,459 |
| Tencent Holdings Ltd. | | 2,902,100 | 70,095 |
| Yandex NV (a) | | 406,400 | 8,799 |
| | | | 2,838,290 |
| IT Services - 3.9% | | | |
| Cognizant Technology Solutions Corp. Class A (a) | | 2,618,764 | 150,553 |
| EOH Holdings Ltd. | | 179,100 | 1,828 |
| Global Payments, Inc. | | 52,700 | 3,935 |
| MasterCard, Inc. Class A | | 2,454,783 | 233,794 |
| Vakrangee Ltd. (a) | | 726,776 | 2,032 |
| Visa, Inc. Class A | | 4,764,985 | 371,907 |
| | | | 764,049 |
| Semiconductors & Semiconductor Equipment - 3.9% | | | |
| Applied Materials, Inc. | | 4,240,000 | 111,470 |
| Cavium, Inc. (a) | | 1,131,919 | 52,827 |
| Cirrus Logic, Inc. (a) | | 1,378,327 | 66,973 |
| Lam Research Corp. | | 375,500 | 33,709 |
| Maxim Integrated Products, Inc. | | 51,100 | 2,084 |
| Mellanox Technologies Ltd. (a) | | 237,200 | 10,479 |
| Micron Technology, Inc. (a) | | 624,900 | 8,586 |
| Monolithic Power Systems, Inc. | | 68,935 | 5,013 |
| NVIDIA Corp. | | 2,329,748 | 133,029 |
| NXP Semiconductors NV (a) | | 3,852,058 | 323,920 |
| Qualcomm, Inc. | | 31,400 | 1,965 |
| Semtech Corp. (a) | | 310,700 | 7,898 |
| | | | 757,953 |
| Software - 7.4% | | | |
| Activision Blizzard, Inc. | | 5,852,287 | 235,028 |
| Adobe Systems, Inc. (a) | | 1,044,302 | 102,195 |
| Appirio, Inc. (a)(c) | | 87,529 | 315 |
| Electronic Arts, Inc. (a) | | 2,331,571 | 177,945 |
| HubSpot, Inc. (a) | | 51,829 | 2,829 |
| Microsoft Corp. | | 3,136,901 | 177,800 |
| Mobileye NV (a)(b) | | 1,495,676 | 71,658 |
| Nintendo Co. Ltd. | | 66,500 | 13,803 |
| Paycom Software, Inc. (a)(b) | | 439,065 | 20,728 |
| RealPage, Inc. (a) | | 56,000 | 1,408 |
| Red Hat, Inc. (a) | | 297,011 | 22,362 |
| Salesforce.com, Inc. (a) | | 5,669,941 | 463,801 |
| SAP AG sponsored ADR | | 120,700 | 10,548 |
| Splunk, Inc. (a) | | 163,400 | 10,219 |
| Tableau Software, Inc. (a) | | 563,624 | 31,850 |
| Workday, Inc. Class A (a) | | 827,954 | 69,002 |
| Zendesk, Inc. (a) | | 599,681 | 18,134 |
| | | | 1,429,625 |
| Technology Hardware, Storage & Peripherals - 5.6% | | | |
| Apple, Inc. | | 9,856,726 | 1,027,169 |
| Samsung Electronics Co. Ltd. | | 13,396 | 18,527 |
| Western Digital Corp. | | 771,300 | 36,644 |
| | | | 1,082,340 |
|
| TOTAL INFORMATION TECHNOLOGY | | | 6,919,266 |
|
| MATERIALS - 1.5% | | | |
| Chemicals - 1.5% | | | |
| Albemarle Corp. U.S. | | 529,242 | 44,546 |
| Ashland, Inc. | | 170,900 | 19,353 |
| CF Industries Holdings, Inc. | | 2,696,557 | 66,551 |
| E.I. du Pont de Nemours & Co. | | 140,000 | 9,684 |
| FMC Corp. | | 244,100 | 11,605 |
| Monsanto Co. | | 481,400 | 51,399 |
| Potash Corp. of Saskatchewan, Inc. | | 860,500 | 13,412 |
| PPG Industries, Inc. | | 38,500 | 4,031 |
| Sherwin-Williams Co. | | 42,300 | 12,679 |
| Sociedad Quimica y Minera de Chile SA (PN-B) sponsored ADR | | 443,400 | 10,987 |
| The Dow Chemical Co. | | 485,100 | 26,035 |
| W.R. Grace & Co. | | 51,500 | 3,856 |
| Westlake Chemical Corp. | | 171,900 | 7,863 |
| | | | 282,001 |
| Construction Materials - 0.0% | | | |
| Martin Marietta Materials, Inc. | | 20,600 | 4,175 |
| U.S. Concrete, Inc. (a) | | 31,200 | 2,012 |
| | | | 6,187 |
|
| TOTAL MATERIALS | | | 288,188 |
|
| TELECOMMUNICATION SERVICES - 0.2% | | | |
| Diversified Telecommunication Services - 0.1% | | | |
| Bharti Infratel Ltd. | | 4,836,707 | 28,692 |
| Wireless Telecommunication Services - 0.1% | | | |
| T-Mobile U.S., Inc. (a) | | 254,300 | 11,784 |
|
| TOTAL TELECOMMUNICATION SERVICES | | | 40,476 |
|
| TOTAL COMMON STOCKS | | | |
| (Cost $12,630,919) | | | 18,866,737 |
|
| Preferred Stocks - 2.6% | | | |
| Convertible Preferred Stocks - 2.5% | | | |
| CONSUMER DISCRETIONARY - 0.1% | | | |
| Internet & Catalog Retail - 0.1% | | | |
| The Honest Co., Inc.: | | | |
| Series C (a)(c) | | 350,333 | 13,491 |
| Series D (c) | | 77,448 | 2,982 |
| | | | 16,473 |
| CONSUMER STAPLES - 0.2% | | | |
| Food & Staples Retailing - 0.1% | | | |
| Blue Apron, Inc. Series D (a)(c) | | 780,377 | 12,954 |
| Food Products - 0.1% | | | |
| BLUE BOTTLE Coffee, Inc. Series C (a)(c) | | 632,822 | 10,201 |
| Tobacco - 0.0% | | | |
| PAX Labs, Inc. Series C (a)(c) | | 2,555,833 | 6,722 |
| TOTAL CONSUMER STAPLES | | | 29,877 |
| FINANCIALS - 0.0% | | | |
| Consumer Finance - 0.0% | | | |
| Oportun Finance Corp. Series H (a)(c) | | 3,552,125 | 9,804 |
| HEALTH CARE - 0.2% | | | |
| Biotechnology - 0.1% | | | |
| AC Immune SA Series E (c) | | 603,000 | 5,813 |
| Immunocore Ltd. Series A (c) | | 11,275 | 2,633 |
| Pronutria Biosciences, Inc. Series C (a)(c) | | 545,634 | 9,379 |
| | | | 17,825 |
| Health Care Providers & Services - 0.1% | | | |
| Mulberry Health, Inc. Series A8 (c) | | 2,728,716 | 19,893 |
| TOTAL HEALTH CARE | | | 37,718 |
| INDUSTRIALS - 0.1% | | | |
| Aerospace & Defense - 0.0% | | | |
| Space Exploration Technologies Corp. Series G (a)(c) | | 97,277 | 9,379 |
| Airlines - 0.0% | | | |
| Azul-Linhas Aereas Brasileiras Series B (a)(c) | | 165,571 | 7,660 |
| Professional Services - 0.1% | | | |
| YourPeople, Inc. Series C (a)(c) | | 692,196 | 10,521 |
| TOTAL INDUSTRIALS | | | 27,560 |
| INFORMATION TECHNOLOGY - 1.9% | | | |
| Internet Software & Services - 1.5% | | | |
| Jet.Com, Inc. Series B1 (c) | | 2,928,086 | 25,577 |
| Uber Technologies, Inc.: | | | |
| Series D, 8.00% (a)(c) | | 5,156,948 | 251,516 |
| Series E, 8.00% (a)(c) | | 102,648 | 5,006 |
| | | | 282,099 |
| IT Services - 0.1% | | | |
| AppNexus, Inc. Series E (a)(c) | | 646,522 | 11,133 |
| Nutanix, Inc. Series E (a)(c) | | 482,746 | 7,526 |
| | | | 18,659 |
| Software - 0.3% | | | |
| Appirio, Inc. Series E (a)(c) | | 612,702 | 2,206 |
| Bracket Computing, Inc. Series C (c) | | 1,207,761 | 4,082 |
| Cloudera, Inc. Series F (a)(c) | | 186,078 | 5,439 |
| Cloudflare, Inc. Series D (a)(c) | | 696,025 | 4,336 |
| Dataminr, Inc. Series D (a)(c) | | 277,250 | 1,785 |
| Delphix Corp. Series D (c) | | 675,445 | 3,647 |
| Malwarebytes Corp. Series B (c) | | 1,056,193 | 9,846 |
| Snapchat, Inc. Series F (a)(c) | | 899,719 | 27,639 |
| Taboola.Com Ltd. Series E (a)(c) | | 634,902 | 7,124 |
| | | | 66,104 |
| TOTAL INFORMATION TECHNOLOGY | | | 366,862 |
|
| TOTAL CONVERTIBLE PREFERRED STOCKS | | | 488,294 |
|
| Nonconvertible Preferred Stocks - 0.1% | | | |
| CONSUMER DISCRETIONARY - 0.1% | | | |
| Internet & Catalog Retail - 0.1% | | | |
| China Internet Plus Holdings Ltd. Series A-11 (c) | | 3,163,704 | 12,214 |
| TOTAL PREFERRED STOCKS | | | |
| (Cost $324,406) | | | 500,508 |
|
| Money Market Funds - 0.9% | | | |
| Fidelity Securities Lending Cash Central Fund, 0.45% (g)(h) | | | |
| (Cost $177,355) | | 177,354,712 | 177,355 |
| TOTAL INVESTMENT PORTFOLIO - 100.8% | | | |
| (Cost $13,132,680) | | | 19,544,600 |
| NET OTHER ASSETS (LIABILITIES) - (0.8)% | | | (155,656) |
| NET ASSETS - 100% | | | $19,388,944 |
Values shown as $0 may reflect amounts less than $500.
Legend
(a) Non-income producing
(b) Security or a portion of the security is on loan at period end.
(c) Restricted securities - Investment in securities not registered under the Securities Act of 1933 (excluding 144A issues). At the end of the period, the value of restricted securities (excluding 144A issues) amounted to $559,441,000 or 2.9% of net assets.
(d) Investment is owned by a wholly-owned subsidiary (Subsidiary) that is treated as a corporation for U.S. tax purposes.
(e) Security exempt from registration under Rule 144A of the Securities Act of 1933. These securities may be resold in transactions exempt from registration, normally to qualified institutional buyers. At the end of the period, the value of these securities amounted to $5,977,000 or 0.0% of net assets.
(f) Affiliated company
(g) Affiliated fund that is generally available only to investment companies and other accounts managed by Fidelity Investments. The rate quoted is the annualized seven-day yield of the fund at period end. A complete unaudited listing of the fund's holdings as of its most recent quarter end is available upon request. In addition, each Fidelity Central Fund's financial statements, which are not covered by the Fund's Report of Independent Registered Public Accounting Firm, are available on the SEC's website or upon request.
(h) Investment made with cash collateral received from securities on loan.
Additional information on each restricted holding is as follows:
| Security | Acquisition Date | Acquisition Cost (000s) |
| AC Immune SA Series E | 10/19/15 | $5,811 |
| Appirio, Inc. | 2/12/15 | $625 |
| Appirio, Inc. Series E | 2/12/15 | $4,375 |
| AppNexus, Inc. Series E | 8/1/14 | $12,951 |
| Azul-Linhas Aereas Brasileiras Series B | 12/24/13 | $7,023 |
| Azul-Linhas Aereas Brasileiras warrants | 12/24/13 | $0 |
| Blue Apron, Inc. Series D | 5/18/15 | $10,400 |
| BLUE BOTTLE Coffee, Inc. Series C | 5/29/15 | $21,086 |
| Bracket Computing, Inc. Series C | 9/9/15 | $9,500 |
| China Internet Plus Holdings Ltd. Series A-11 | 1/26/15 | $10,000 |
| Cloudera, Inc. Series F | 2/5/14 | $2,709 |
| Cloudflare, Inc. Series D | 11/5/14 - 6/24/15 | $4,349 |
| Dataminr, Inc. Series D | 3/6/15 | $3,535 |
| Delphix Corp. Series D | 7/10/15 | $6,079 |
| Dropbox, Inc. | 5/2/12 | $9,084 |
| Immunocore Ltd. Series A | 7/27/15 | $2,122 |
| Jet.Com, Inc. Series B1 | 11/24/15 | $14,605 |
| Malwarebytes Corp. Series B | 12/21/15 | $10,958 |
| Mulberry Health, Inc. Series A8 | 1/20/16 | $18,432 |
| NJOY, Inc. | 6/7/13 - 2/14/14 | $16,957 |
| Nutanix, Inc. Series E | 8/26/14 | $6,467 |
| Oportun Finance Corp. Series H | 2/6/15 | $10,114 |
| PAX Labs, Inc. Series C | 5/22/15 | $9,840 |
| Pronutria Biosciences, Inc. Series C | 1/30/15 | $5,500 |
| Snapchat, Inc. Series F | 3/25/15 - 2/12/16 | $27,639 |
| Space Exploration Technologies Corp. Class A | 10/16/15 | $14,267 |
| Space Exploration Technologies Corp. Series G | 1/20/15 | $7,535 |
| Taboola.Com Ltd. Series E | 12/22/14 | $6,619 |
| The Honest Co., Inc. | 8/21/14 | $4,062 |
| The Honest Co., Inc. Series C | 8/21/14 | $9,479 |
| The Honest Co., Inc. Series D | 8/3/15 | $3,544 |
| Tory Burch LLC unit | 5/14/15 | $20,890 |
| Uber Technologies, Inc. Series D, 8.00% | 6/6/14 | $80,000 |
| Uber Technologies, Inc. Series E, 8.00% | 12/5/14 | $3,420 |
| WME Entertainment Parent, LLC Class A unit | 4/13/16 | $7,638 |
| YourPeople, Inc. Series C | 5/1/15 | $10,314 |
Affiliated Central Funds
Information regarding fiscal year to date income earned by the Fund from investments in Fidelity Central Funds is as follows:
| Fund | Income earned |
| | (Amounts in thousands) |
| Fidelity Cash Central Fund | $45 |
| Fidelity Securities Lending Cash Central Fund | 14,459 |
| Total | $14,504 |
Other Affiliated Issuers
An affiliated company is a company in which the Fund has ownership of at least 5% of the voting securities. Fiscal year to date transactions with companies which are or were affiliates are as follows:
| Affiliate (Amounts in thousands) | Value, beginning of period | Purchases | Sales Proceeds* | Dividend Income | Value, end of period |
| Nu Skin Enterprises, Inc. Class A | $134,517 | $38,421 | $58,483 | $4,446 | $-- |
| Parsvnath Developers Ltd. | 6,516 | -- | -- | -- | 7,823 |
| Total | $141,033 | $38,421 | $58,483 | $4,446 | $7,823 |
* Includes the value of securities delivered through in-kind transactions, if applicable.
Investment Valuation
The following is a summary of the inputs used, as of July 31, 2016, involving the Fund's assets and liabilities carried at fair value. The inputs or methodology used for valuing securities may not be an indication of the risk associated with investing in those securities. For more information on valuation inputs, and their aggregation into the levels used below, please refer to the Investment Valuation section in the accompanying Notes to Financial Statements.
| | Valuation Inputs at Reporting Date: |
| Description | Total | Level 1 | Level 2 | Level 3 |
| (Amounts in thousands) | | | | |
| Investments in Securities: | | | | |
| Equities: | | | | |
| Consumer Discretionary | $5,139,294 | $4,765,309 | $320,926 | $53,059 |
| Consumer Staples | 1,578,769 | 1,548,892 | -- | 29,877 |
| Energy | 465,085 | 465,085 | -- | -- |
| Financials | 842,482 | 825,040 | -- | 17,442 |
| Health Care | 2,791,948 | 2,735,941 | 18,289 | 37,718 |
| Industrials | 934,875 | 891,859 | -- | 43,016 |
| Information Technology | 7,286,128 | 6,823,901 | 83,898 | 378,329 |
| Materials | 288,188 | 288,188 | -- | -- |
| Telecommunication Services | 40,476 | 40,476 | -- | -- |
| Money Market Funds | 177,355 | 177,355 | -- | -- |
| Total Investments in Securities: | $19,544,600 | $18,562,046 | $423,113 | $559,441 |
The following is a reconciliation of Investments in Securities for which Level 3 inputs were used in determining value:
| (Amounts in thousands) | |
| Investments in Securities: | |
| Equities - Information Technology | |
| Beginning Balance | $298,720 |
| Net Realized Gain (Loss) on Investment Securities | -- |
| Net Unrealized Gain (Loss) on Investment Securities | 37,219 |
| Cost of Purchases | 42,390 |
| Proceeds of Sales | -- |
| Amortization/Accretion | -- |
| Transfers into Level 3 | -- |
| Transfers out of Level 3 | -- |
| Ending Balance | $378,329 |
| The change in unrealized gain (loss) for the period attributable to Level 3 securities held at July 31, 2016 | $37,219 |
| Equities - Other Investments in Securities | |
| Beginning Balance | $161,801 |
| Net Realized Gain (Loss) on Investment Securities | (3,712) |
| Net Unrealized Gain (Loss) on Investment Securities | (6,036) |
| Cost of Purchases | 67,258 |
| Proceeds of Sales | (38,199) |
| Amortization/Accretion | -- |
| Transfers into Level 3 | -- |
| Transfers out of Level 3 | -- |
| Ending Balance | $181,112 |
| The change in unrealized gain (loss) for the period attributable to Level 3 securities held at July 31, 2016 | $(7,887) |
The information used in the above reconciliations represents fiscal year to date activity for any Investments in Securities identified as using Level 3 inputs at either the beginning or the end of the current fiscal period. Transfers in or out of Level 3 represent the beginning value of any Security or Instrument where a change in the pricing level occurred from the beginning to the end of the period. The cost of purchases and the proceeds of sales may include securities received or delivered through corporate actions or exchanges. Realized and unrealized gains (losses) disclosed in the reconciliations are included in Net Gain (Loss) on the Fund's Statement of Operations.
Other Information
Distribution of investments by country or territory of incorporation, as a percentage of Total Net Assets, is as follows (Unaudited):
| United States of America | 88.0% |
| Netherlands | 2.5% |
| Cayman Islands | 2.0% |
| Singapore | 2.0% |
| Germany | 1.2% |
| Ireland | 1.1% |
| Others (Individually Less Than 1%) | 3.2% |
| | 100.0% |
See accompanying notes which are an integral part of the financial statements.
Financial Statements
Statement of Assets and Liabilities
| Amounts in thousands (except per-share amounts) | | July 31, 2016 |
| Assets | | |
Investment in securities, at value (including securities loaned of $174,467) — See accompanying schedule:
Unaffiliated issuers (cost $12,924,474) | $19,359,422 | |
| Fidelity Central Funds (cost $177,355) | 177,355 | |
| Other affiliated issuers (cost $30,851) | 7,823 | |
| Total Investments (cost $13,132,680) | | $19,544,600 |
| Restricted cash | | 88 |
| Receivable for investments sold | | 334,248 |
| Receivable for fund shares sold | | 8,839 |
| Dividends receivable | | 4,422 |
| Distributions receivable from Fidelity Central Funds | | 210 |
| Other receivables | | 963 |
| Total assets | | 19,893,370 |
| Liabilities | | |
| Payable to custodian bank | $4,852 | |
| Payable for investments purchased | 273,978 | |
| Payable for fund shares redeemed | 37,391 | |
| Accrued management fee | 7,695 | |
| Other affiliated payables | 2,233 | |
| Other payables and accrued expenses | 922 | |
| Collateral on securities loaned, at value | 177,355 | |
| Total liabilities | | 504,426 |
| Net Assets | | $19,388,944 |
| Net Assets consist of: | | |
| Paid in capital | | $12,865,681 |
| Undistributed net investment income | | 29,362 |
| Accumulated undistributed net realized gain (loss) on investments and foreign currency transactions | | 82,002 |
| Net unrealized appreciation (depreciation) on investments and assets and liabilities in foreign currencies | | 6,411,899 |
| Net Assets | | $19,388,944 |
| Blue Chip Growth: | | |
| Net Asset Value, offering price and redemption price per share ($14,230,492 ÷ 204,689 shares) | | $69.52 |
| Class K: | | |
| Net Asset Value, offering price and redemption price per share ($5,158,452 ÷ 74,041 shares) | | $69.67 |
See accompanying notes which are an integral part of the financial statements.
Statement of Operations
| Amounts in thousands | | Year ended July 31, 2016 |
| Investment Income | | |
| Dividends (including $4,446 earned from other affiliated issuers) | | $171,375 |
| Income from Fidelity Central Funds (including $14,459 from security lending) | | 14,504 |
| Total income | | 185,879 |
| Expenses | | |
| Management fee | | |
| Basic fee | $107,928 | |
| Performance adjustment | 17,980 | |
| Transfer agent fees | 26,104 | |
| Accounting and security lending fees | 1,776 | |
| Custodian fees and expenses | 382 | |
| Independent trustees' fees and expenses | 88 | |
| Registration fees | 351 | |
| Audit | 190 | |
| Legal | 56 | |
| Interest | 40 | |
| Miscellaneous | 153 | |
| Total expenses before reductions | 155,048 | |
| Expense reductions | (741) | 154,307 |
| Net investment income (loss) | | 31,572 |
| Realized and Unrealized Gain (Loss) | | |
| Net realized gain (loss) on: | | |
| Investment securities: | | |
| Unaffiliated issuers | 379,021 | |
| Other affiliated issuers | (34,403) | |
| Foreign currency transactions | (586) | |
| Total net realized gain (loss) | | 344,032 |
Change in net unrealized appreciation (depreciation) on:
Investment securities (net of decrease in deferred foreign taxes of $1,459) | (1,020,369) | |
| Assets and liabilities in foreign currencies | (24) | |
| Total change in net unrealized appreciation (depreciation) | | (1,020,393) |
| Net gain (loss) | | (676,361) |
| Net increase (decrease) in net assets resulting from operations | | $(644,789) |
See accompanying notes which are an integral part of the financial statements.
Statement of Changes in Net Assets
| Amounts in thousands | Year ended July 31, 2016 | Year ended July 31, 2015 |
| Increase (Decrease) in Net Assets | | |
| Operations | | |
| Net investment income (loss) | $31,572 | $20,601 |
| Net realized gain (loss) | 344,032 | 1,230,303 |
| Change in net unrealized appreciation (depreciation) | (1,020,393) | 2,175,419 |
| Net increase (decrease) in net assets resulting from operations | (644,789) | 3,426,323 |
| Distributions to shareholders from net investment income | (10,672) | (27,789) |
| Distributions to shareholders from net realized gain | (1,033,010) | (1,011,245) |
| Total distributions | (1,043,682) | (1,039,034) |
| Share transactions - net increase (decrease) | (166,801) | 2,274,956 |
| Total increase (decrease) in net assets | (1,855,272) | 4,662,245 |
| Net Assets | | |
| Beginning of period | 21,244,216 | 16,581,971 |
| End of period | $19,388,944 | $21,244,216 |
| Other Information | | |
| Undistributed net investment income end of period | $29,362 | $9,347 |
See accompanying notes which are an integral part of the financial statements.
Financial Highlights — Fidelity Blue Chip Growth Fund
| Years ended July 31, | 2016 | 2015 | 2014 | 2013 | 2012 |
| Selected Per–Share Data | | | | | |
| Net asset value, beginning of period | $75.25 | $66.72 | $59.65 | $47.38 | $48.17 |
| Income from Investment Operations | | | | | |
| Net investment income (loss)A | .09 | .05 | .15 | .39 | .10 |
| Net realized and unrealized gain (loss) | (2.16) | 12.56 | 11.63 | 12.79 | .75 |
| Total from investment operations | (2.07) | 12.61 | 11.78 | 13.18 | .85 |
| Distributions from net investment income | (.03) | (.09) | (.24) | (.23) | (.04) |
| Distributions from net realized gain | (3.63) | (3.99) | (4.47) | (.68) | (1.60) |
| Total distributions | (3.66) | (4.08) | (4.71) | (.91) | (1.64) |
| Net asset value, end of period | $69.52 | $75.25 | $66.72 | $59.65 | $47.38 |
| Total ReturnB | (2.59)% | 19.72% | 21.07% | 28.25% | 2.27% |
| Ratios to Average Net AssetsC,D | | | | | |
| Expenses before reductions | .82% | .89% | .80% | .76% | .90% |
| Expenses net of fee waivers, if any | .82% | .89% | .80% | .76% | .90% |
| Expenses net of all reductions | .82% | .88% | .80% | .74% | .89% |
| Net investment income (loss) | .13% | .07% | .23% | .75% | .21% |
| Supplemental Data | | | | | |
| Net assets, end of period (in millions) | $14,230 | $15,346 | $11,970 | $12,927 | $10,595 |
| Portfolio turnover rateE | 50%F | 51%F | 57%F | 75% | 95% |
A Calculated based on average shares outstanding during the period.
B Total returns would have been lower if certain expenses had not been reduced during the applicable periods shown.
C Fees and expenses of any underlying Fidelity Central Funds are not included in the Fund's expense ratio. The Fund indirectly bears its proportionate share of the expenses of any underlying Fidelity Central Funds.
D Expense ratios reflect operating expenses of the class. Expenses before reductions do not reflect amounts reimbursed by the investment adviser or reductions from brokerage service arrangements or reductions from other expense offset arrangements and do not represent the amount paid by the class during periods when reimbursements or reductions occur. Expenses net of fee waivers reflect expenses after reimbursement by the investment adviser but prior to reductions from brokerage service arrangements or other expense offset arrangements. Expenses net of all reductions represent the net expenses paid by the class.
E Amount does not include the portfolio activity of any underlying Fidelity Central Funds.
F Portfolio turnover rate excludes securities received or delivered in-kind.
See accompanying notes which are an integral part of the financial statements.
Financial Highlights — Fidelity Blue Chip Growth Fund Class K
| Years ended July 31, | 2016 | 2015 | 2014 | 2013 | 2012 |
| Selected Per–Share Data | | | | | |
| Net asset value, beginning of period | $75.36 | $66.82 | $59.74 | $47.46 | $48.21 |
| Income from Investment Operations | | | | | |
| Net investment income (loss)A | .16 | .13 | .23 | .47 | .17 |
| Net realized and unrealized gain (loss) | (2.15) | 12.57 | 11.64 | 12.79 | .75 |
| Total from investment operations | (1.99) | 12.70 | 11.87 | 13.26 | .92 |
| Distributions from net investment income | (.07) | (.17) | (.33) | (.30) | (.08) |
| Distributions from net realized gain | (3.63) | (3.99) | (4.47) | (.68) | (1.60) |
| Total distributions | (3.70) | (4.16) | (4.79)B | (.98) | (1.67)C |
| Net asset value, end of period | $69.67 | $75.36 | $66.82 | $59.74 | $47.46 |
| Total ReturnD | (2.47)% | 19.84% | 21.23% | 28.42% | 2.43% |
| Ratios to Average Net AssetsE,F | | | | | |
| Expenses before reductions | .70% | .78% | .68% | .61% | .74% |
| Expenses net of fee waivers, if any | .70% | .77% | .68% | .61% | .74% |
| Expenses net of all reductions | .70% | .77% | .67% | .60% | .73% |
| Net investment income (loss) | .25% | .19% | .36% | .89% | .37% |
| Supplemental Data | | | | | |
| Net assets, end of period (in millions) | $5,158 | $5,898 | $4,612 | $3,506 | $2,467 |
| Portfolio turnover rateG | 50%H | 51%H | 57%H | 75% | 95% |
A Calculated based on average shares outstanding during the period.
B Total distributions of $4.79 per share is comprised of distributions from net investment income of $.325 and distributions from net realized gain of $4.466 per share.
C Total distributions of $1.67 per share is comprised of distributions from net investment income of $.076 and distributions from net realized gain of $1.598 per share.
D Total returns would have been lower if certain expenses had not been reduced during the applicable periods shown.
E Fees and expenses of any underlying Fidelity Central Funds are not included in the Fund's expense ratio. The Fund indirectly bears its proportionate share of the expenses of any underlying Fidelity Central Funds.
F Expense ratios reflect operating expenses of the class. Expenses before reductions do not reflect amounts reimbursed by the investment adviser or reductions from brokerage service arrangements or reductions from other expense offset arrangements and do not represent the amount paid by the class during periods when reimbursements or reductions occur. Expenses net of fee waivers reflect expenses after reimbursement by the investment adviser but prior to reductions from brokerage service arrangements or other expense offset arrangements. Expenses net of all reductions represent the net expenses paid by the class.
G Amount does not include the portfolio activity of any underlying Fidelity Central Funds.
H Portfolio turnover rate excludes securities received or delivered in-kind.
See accompanying notes which are an integral part of the financial statements.
Notes to Financial Statements
For the period ended July 31, 2016
(Amounts in thousands except percentages)
1. Organization.
Fidelity Blue Chip Growth Fund (the Fund) is a fund of Fidelity Securities Fund (the Trust) and is authorized to issue an unlimited number of shares. The Trust is registered under the Investment Company Act of 1940, as amended (the 1940 Act), as an open-end management investment company organized as a Massachusetts business trust. The Fund offers Blue Chip Growth and Class K shares, each of which has equal rights as to assets and voting privileges. Each class has exclusive voting rights with respect to matters that affect that class.
2. Investments in Fidelity Central Funds.
The Fund invests in Fidelity Central Funds, which are open-end investment companies generally available only to other investment companies and accounts managed by the investment adviser and its affiliates. The Fund's Schedule of Investments lists each of the Fidelity Central Funds held as of period end, if any, as an investment of the Fund, but does not include the underlying holdings of each Fidelity Central Fund. As an Investing Fund, the Fund indirectly bears its proportionate share of the expenses of the underlying Fidelity Central Funds.
The Money Market Central Funds seek preservation of capital and current income and are managed by Fidelity Investments Money Management, Inc. (FIMM), an affiliate of the investment adviser. Annualized expenses of the Money Market Central Funds as of their most recent shareholder report date are less than .005%.
A complete unaudited list of holdings for each Fidelity Central Fund is available upon request or at the Securities and Exchange Commission (the SEC) website at www.sec.gov. In addition, the financial statements of the Fidelity Central Funds, which are not covered by the Fund's Report of Independent Registered Public Accounting Firm, are available on the SEC website or upon request.
3. Significant Accounting Policies.
The financial statements have been prepared in conformity with accounting principles generally accepted in the United States of America (GAAP), which require management to make certain estimates and assumptions at the date of the financial statements. Actual results could differ from those estimates. Subsequent events, if any, through the date that the financial statements were issued have been evaluated in the preparation of the financial statements. The following summarizes the significant accounting policies of the Fund:
Investment Valuation. Investments are valued as of 4:00 p.m. Eastern time on the last calendar day of the period. The Board of Trustees (the Board) has delegated the day to day responsibility for the valuation of the Fund's investments to the Fidelity Management & Research Company (FMR) Fair Value Committee (the Committee). In accordance with valuation policies and procedures approved by the Board, the Fund attempts to obtain prices from one or more third party pricing vendors or brokers to value its investments. When current market prices, quotations or currency exchange rates are not readily available or reliable, investments will be fair valued in good faith by the Committee, in accordance with procedures adopted by the Board. Factors used in determining fair value vary by investment type and may include market or investment specific events. The frequency with which these procedures are used cannot be predicted and they may be utilized to a significant extent. The Committee oversees the Fund's valuation policies and procedures and reports to the Board on the Committee's activities and fair value determinations. The Board monitors the appropriateness of the procedures used in valuing the Fund's investments and ratifies the fair value determinations of the Committee.
The Fund categorizes the inputs to valuation techniques used to value its investments into a disclosure hierarchy consisting of three levels as shown below:
- Level 1 – quoted prices in active markets for identical investments
- Level 2 – other significant observable inputs (including quoted prices for similar investments, interest rates, prepayment speeds, etc.)
- Level 3 – unobservable inputs (including the Fund's own assumptions based on the best information available)
Valuation techniques used to value the Fund's investments by major category are as follows:
Equity securities, including restricted securities, for which market quotations are readily available, are valued at the last reported sale price or official closing price as reported by a third party pricing vendor on the primary market or exchange on which they are traded and are categorized as Level 1 in the hierarchy. In the event there were no sales during the day or closing prices are not available, securities are valued at the last quoted bid price or may be valued using the last available price and are generally categorized as Level 2 in the hierarchy. For foreign equity securities, when market or security specific events arise, comparisons to the valuation of American Depositary Receipts (ADRs), futures contracts, Exchange-Traded Funds (ETFs) and certain indexes as well as quoted prices for similar securities may be used and would be categorized as Level 2 in the hierarchy. Utilizing these techniques may result in transfers between Level 1 and Level 2. For equity securities, including restricted securities, where observable inputs are limited, assumptions about market activity and risk are used and these securities may be categorized as Level 3 in the hierarchy. Equity securities, including restricted securities, for which observable inputs are not available are valued using alternate valuation approaches, including the market approach and the income approach and are categorized as Level 3 in the hierarchy. The market approach generally consists of using comparable market transactions while the income approach generally consists of using the net present value of estimated future cash flows, adjusted as appropriate for liquidity, credit, market and/or other risk factors.
Investments in open-end mutual funds, including Fidelity Central Funds, are valued at their closing net asset value (NAV) each business day and are categorized as Level 1 in the hierarchy.
The following provides information on Level 3 securities held by the Fund that were valued at period end based on unobservable inputs. These amounts exclude valuations provided by a broker.
| Asset Type | Fair Value at 7/31/16 | Valuation Technique(s) | Unobservable Input | Amount or Range/Weighted Average | Impact to Valuation from an Increase in Input(a) |
| Equities | $559,441 | Discounted cash flow | Discount rate | 15.0% | Decrease |
| | | | Weighted average cost of capital (WACC) | 11.6% | Decrease |
| | | | Discount for lack of marketability | 20.0% - 25.0% / 21.5% | Decrease |
| | | | Growth rate | 2.5% - 3.0% / 2.9% | Increase |
| | | Market approach | Discount rate | 15.0% | Decrease |
| | | | Acquisition terms | $8.74 | Increase |
| | | | Transaction price | $0.00 - $150.00 / $48.45 | Increase |
| | | | Proxy based premium | 21.3% | Increase |
| | | | Premium rate | 15.0% | Increase |
| | | | Put premium | 72.5% | Increase |
| | | Market comparable | Enterprise value/Sales multiple (EV/S) | 0.6 - 15.6 / 4.1 | Increase |
| | | | Discount rate | 0.9% - 30.0% / 10.6% | Decrease |
| | | | Price/Earnings multiple (P/E) | 10.6 - 10.9 / 10.7 | Increase |
| | | | Enterprise value/EBITDA multiple (EV/EBITDA) | 9.9 | Increase |
| | | | Discount for lack of marketability | 10.0% - 25.0% / 14.5% | Decrease |
| | | | Enterprise value/Gross profit multiple (EV/GP) | 4.8 | Increase |
| | | | Premium rate | 1.0% - 235.0% / 35.9% | Increase |
| | | | Recovery rate | 0.0% | Increase |
| | | Recovery value | Liquidation preference | $12.75 - $23.41 / $21.94 | Increase |
(a) Represents the expected directional change in the fair value of the Level 3 investments that would result from an increase in the corresponding input. A decrease to the unobservable input would have the opposite effect. Significant changes in these inputs could result in significantly higher or lower fair value measurements.
Changes in valuation techniques may result in transfers in or out of an assigned level within the disclosure hierarchy. The aggregate value of investments by input level as of July 31, 2016, as well as a roll forward of Level 3 investments, is included at the end of the Fund's Schedule of Investments.
Foreign Currency. The Fund may use foreign currency contracts to facilitate transactions in foreign-denominated securities. Gains and losses from these transactions may arise from changes in the value of the foreign currency or if the counterparties do not perform under the contracts' terms.
Foreign-denominated assets, including investment securities, and liabilities are translated into U.S. dollars at the exchange rates at period end. Purchases and sales of investment securities, income and dividends received and expenses denominated in foreign currencies are translated into U.S. dollars at the exchange rate in effect on the transaction date.
The effects of exchange rate fluctuations on investments are included with the net realized and unrealized gain (loss) on investment securities. Other foreign currency transactions resulting in realized and unrealized gain (loss) are disclosed separately.
Investment Transactions and Income. For financial reporting purposes, the Fund's investment holdings and NAV include trades executed through the end of the last business day of the period. The NAV per share for processing shareholder transactions is calculated as of the close of business of the New York Stock Exchange (NYSE), normally 4:00 p.m. Eastern time and includes trades executed through the end of the prior business day. Gains and losses on securities sold are determined on the basis of identified cost and may include proceeds received from litigation. Dividend income is recorded on the ex-dividend date, except for certain dividends from foreign securities where the ex-dividend date may have passed, which are recorded as soon as the Fund is informed of the ex-dividend date. Non-cash dividends included in dividend income, if any, are recorded at the fair market value of the securities received. Income and capital gain distributions from Fidelity Central Funds, if any, are recorded on the ex-dividend date. Distributions received on securities that represent a return of capital or capital gain are recorded as a reduction of cost of investments and/or as a realized gain. Subsequent to ex-dividend date the Fund determines the components of these distributions, based upon receipt of tax filings or other correspondence relating to the underlying investment. Investment income is recorded net of foreign taxes withheld where recovery of such taxes is uncertain.
Class Allocations and Expenses. Investment income, realized and unrealized capital gains and losses, common expenses of the Fund, and certain fund-level expense reductions, if any, are allocated daily on a pro-rata basis to each class based on the relative net assets of each class to the total net assets of the Fund. Each class differs with respect to transfer agent fees incurred. Certain expense reductions may also differ by class. For the reporting period, the allocated portion of income and expenses to each class as a percent of its average net assets may vary due to the timing of recording these transactions in relation to fluctuating net assets of the classes. Expenses directly attributable to a fund are charged to that fund. Expenses attributable to more than one fund are allocated among the respective funds on the basis of relative net assets or other appropriate methods. Expense estimates are accrued in the period to which they relate and adjustments are made when actual amounts are known.
Deferred Trustee Compensation. Under a Deferred Compensation Plan (the Plan), independent Trustees may elect to defer receipt of a portion of their annual compensation. Deferred amounts are invested in a cross-section of Fidelity funds, are marked-to-market and remain in the Fund until distributed in accordance with the Plan. The investment of deferred amounts and the offsetting payable to the Trustees are included in the accompanying Statement of Assets and Liabilities.
Income Tax Information and Distributions to Shareholders. Each year, the Fund intends to qualify as a regulated investment company under Subchapter M of the Internal Revenue Code, including distributing substantially all of its taxable income and realized gains. As a result, no provision for U.S. Federal income taxes is required. As of July 31, 2016, the Fund did not have any unrecognized tax benefits in the financial statements; nor is the Fund aware of any tax positions for which it is reasonably possible that the total amounts of unrecognized tax benefits will significantly change in the next twelve months. The Fund files a U.S. federal tax return, in addition to state and local tax returns as required. The Fund's federal income tax returns are subject to examination by the Internal Revenue Service (IRS) for a period of three fiscal years after they are filed. State and local tax returns may be subject to examination for an additional fiscal year depending on the jurisdiction. Foreign taxes are provided for based on the Fund's understanding of the tax rules and rates that exist in the foreign markets in which it invests.
Distributions are declared and recorded on the ex-dividend date. Income dividends and capital gain distributions are declared separately for each class. Income and capital gain distributions are determined in accordance with income tax regulations, which may differ from GAAP. In addition, the Fund claimed a portion of the payment made to redeeming shareholders as a distribution for income tax purposes.
Capital accounts within the financial statements are adjusted for permanent book-tax differences. These adjustments have no impact on net assets or the results of operations. Capital accounts are not adjusted for temporary book-tax differences which will reverse in a subsequent period.
Book-tax differences are primarily due to foreign currency transactions, passive foreign investment companies (PFIC), redemptions in kind, security level mergers and exchanges, partnerships, deferred trustees compensation and losses deferred due to wash sales.
The federal tax cost of investment securities and unrealized appreciation (depreciation) as of period end were as follows:
| Gross unrealized appreciation | $6,961,896 |
| Gross unrealized depreciation | (707,075) |
| Net unrealized appreciation (depreciation) on securities | $6,254,821 |
| Tax Cost | $13,289,779 |
The tax-based components of distributable earnings as of period end were as follows:
| Undistributed ordinary income | $30,132 |
| Undistributed long-term capital gain | $239,101 |
| Net unrealized appreciation (depreciation) on securities and other investments | $6,254,800 |
The tax character of distributions paid was as follows:
| | July 31, 2016 | July 31, 2015 |
| Ordinary Income | $10,672 | $ 90,358 |
| Long-term Capital Gains | 1,033,010 | 948,676 |
| Total | $1,043,682 | $ 1,039,034 |
Restricted Securities. The Fund may invest in securities that are subject to legal or contractual restrictions on resale. These securities generally may be resold in transactions exempt from registration or to the public if the securities are registered. Disposal of these securities may involve time-consuming negotiations and expense, and prompt sale at an acceptable price may be difficult. Information regarding restricted securities is included at the end of the Fund's Schedule of Investments.
Consolidated Subsidiary. The Fund invests in certain investments through a wholly-owned subsidiary ("Subsidiary"), which may be subject to federal and state taxes upon disposition.
At period end, investments held through these Subsidiaries were $25,992 representing 0.13% of the Fund's net assets. The financial statements have been consolidated and include accounts of the Fund and each Subsidiary. Accordingly, all inter-company transactions and balances have been eliminated.
Any cash held by the Subsidiaries is restricted as to its use and is presented as Restricted cash in the Statement of Assets and Liabilities.
4. Purchases and Sales of Investments.
Purchases and sales of securities, other than short-term securities and in-kind transactions, aggregated $9,836,124 and $10,767,022, respectively.
Exchanges In-Kind. Cash and investments received in-kind through subscriptions totaled $30,618 in exchange for 494 shares of the Fund. The amount of in-kind exchanges is included in share transactions in the accompanying Statement of Changes in Net Assets as well as Note 11: Share Transactions. The Fund recognized no gain or loss for federal income tax purposes.
Redemptions In-Kind. During the period, 4,038 shares of the Fund held by unaffiliated entities were redeemed in-kind for cash and investments with a value of $271,157. The net realized gain of $132,873 on investments delivered through the in-kind redemptions is included in the accompanying Statement of Operations. The amount of in-kind redemptions is included in share transactions in the accompanying Statement of Changes in Net Assets as well as Note 11: Share Transactions. The Fund recognized no gain or loss for federal income tax purposes.
Prior Fiscal Year Redemptions In-Kind. During the prior period, 1,878 shares of the Fund held by unaffiliated entities were redeemed for cash and investments with a value of $137,687. The Fund had a net realized gain of $67,543 on investments delivered through the in-kind redemption. The amount of in-kind redemptions is included in share transactions in the accompanying Statement of Changes in Net Assets as well as Note 11: Share Transactions. The Fund recognized no gain or loss for federal income tax purposes.
5. Fees and Other Transactions with Affiliates.
Management Fee. Fidelity Management & Research Company (the investment adviser) and its affiliates provide the Fund with investment management related services for which the Fund pays a monthly management fee. The management fee is the sum of an individual fund fee rate that is based on an annual rate of .30% of the Fund's average net assets and an annualized group fee rate that averaged .25% during the period. The group fee rate is based upon the average net assets of all the mutual funds advised by the investment adviser, including any mutual funds previously advised by the investment adviser that are currently advised by Fidelity SelectCo, LLC, an affiliate of the investment adviser. The group fee rate decreases as assets under management increase and increases as assets under management decrease. In addition, the management fee is subject to a performance adjustment (up to a maximum of +/- .20% of the Fund's average net assets over a 36 month performance period). The upward or downward adjustment to the management fee is based on the relative investment performance of Blue Chip Growth as compared to its benchmark index, the Russell 1000 Growth Index, over the same 36 month performance period. For the reporting period, the total annual management fee rate, including the performance adjustment, was .64% of the Fund's average net assets. The performance adjustment included in the management fee rate may be higher or lower than the maximum performance adjustment rate due to the difference between the average net assets for the reporting and performance periods.
Transfer Agent Fees. Fidelity Investments Institutional Operations Company, Inc., (FIIOC), an affiliate of the investment adviser, is the transfer, dividend disbursing and shareholder servicing agent for each class of the Fund. FIIOC receives account fees and asset-based fees that vary according to the account size and type of account of the shareholders of Blue Chip Growth, except for Class K. FIIOC receives an asset-based fee of Class K's average net assets. FIIOC pays for typesetting, printing and mailing of shareholder reports, except proxy statements.
For the period, transfer agent fees for each class were as follows:
| | Amount | % of
Class-Level Average
Net Assets |
| Blue Chip Growth | $23,645 | .16 |
| Class K | 2,459 | .05 |
| | $26,104 | |
Accounting and Security Lending Fees. Fidelity Service Company, Inc. (FSC), an affiliate of the investment adviser, maintains the Fund's accounting records. The accounting fee is based on the level of average net assets for each month. Under a separate contract, FSC administers the security lending program. The security lending fee is based on the number and duration of lending transactions.
Brokerage Commissions. The Fund placed a portion of its portfolio transactions with brokerage firms which are affiliates of the investment adviser. Brokerage commissions are included in net realized gain (loss) and change in net unrealized appreciation (depreciation) in the Statement of Operations. The commissions paid to these affiliated firms were $210 for the period.
Interfund Lending Program. Pursuant to an Exemptive Order issued by the SEC, the Fund, along with other registered investment companies having management contracts with FMR or other affiliated entities of FMR, may participate in an interfund lending program. This program provides an alternative credit facility allowing the funds to borrow from, or lend money to, other participating affiliated funds. At period end, there were no interfund loans outstanding. The Fund's activity in this program during the period for which loans were outstanding was as follows:
| Borrower or Lender | Average Loan Balance | Weighted Average Interest Rate | Interest Expense |
| Borrower | $18,932 | .59% | $37 |
Interfund Trades. The Fund may purchase from or sell securities to other Fidelity Funds under procedures adopted by the Board. The procedures have been designed to ensure these interfund trades are executed in accordance with Rule 17a-7 of the 1940 Act. Interfund trades are included within the respective purchases and sales amounts shown in the Purchases and Sales of Investments note.
6. Committed Line of Credit.
The Fund participates with other funds managed by the investment adviser or an affiliate in a $4.25 billion credit facility (the "line of credit") to be utilized for temporary or emergency purposes to fund shareholder redemptions or for other short-term liquidity purposes. The Fund has agreed to pay commitment fees on its pro-rata portion of the line of credit, which amounted to $40 and is reflected in Miscellaneous expenses on the Statement of Operations. During the period, the Fund did not borrow on this line of credit.
7. Security Lending.
The Fund lends portfolio securities through a lending agent from time to time in order to earn additional income. For equity securities, a lending agent is used and may loan securities to certain qualified borrowers, including Fidelity Capital Markets (FCM), a broker-dealer affiliated with the Fund. On the settlement date of the loan, the Fund receives collateral (in the form of U.S. Treasury obligations, letters of credit and/or cash) against the loaned securities and maintains collateral in an amount not less than 100% of the market value of the loaned securities during the period of the loan. The market value of the loaned securities is determined at the close of business of the Fund and any additional required collateral is delivered to the Fund on the next business day. The Fund or borrower may terminate the loan at any time, and if the borrower defaults on its obligation to return the securities loaned because of insolvency or other reasons, the Fund may apply collateral received from the borrower against the obligation. The Fund may experience delays and costs in recovering the securities loaned. Any cash collateral received is invested in the Fidelity Securities Lending Cash Central Fund. The value of loaned securities and cash collateral at period end are disclosed on the Fund's Statement of Assets and Liabilities. The value of securities loaned to FCM at period end was $17,585. Security lending income represents the income earned on investing cash collateral, less rebates paid to borrowers and any lending agent fees associated with the loan, plus any premium payments received for lending certain types of securities. Security lending income is presented in the Statement of Operations as a component of income from Fidelity Central Funds, and includes $1,464 from securities loaned to FCM.
8. Bank Borrowings.
The Fund is permitted to have bank borrowings for temporary or emergency purposes to fund shareholder redemptions or for other short-term liquidity requirements. The Fund has established borrowing arrangements with certain banks. The interest rate on the borrowings is the bank's base rate, as revised from time to time. The average loan balance during the period for which loans were outstanding amounted to $14,295. The weighted average interest rate was .89%. The interest expense amounted to $3 under the bank borrowing program. At period end, there were no bank borrowings outstanding.
9. Expense Reductions.
Commissions paid to certain brokers with whom the investment adviser, or its affiliates, places trades on behalf of the Fund include an amount in addition to trade execution, which may be rebated back to the Fund to offset certain expenses. This amount totaled $589 for the period. In addition, through arrangements with the Fund's custodian, credits realized as a result of certain uninvested cash balances were used to reduce the Fund's expenses. During the period, these credits reduced the Fund's custody expenses by $1.
In addition, during the period the investment adviser reimbursed and/or waived a portion of fund-level operating expenses in the amount of $151.
10. Distributions to Shareholders.
Distributions to shareholders of each class were as follows:
| | Year ended
July 31, 2016 | Year ended
July 31, 2015 |
| From net investment income | | |
| Blue Chip Growth | $5,376 | $15,581 |
| Class K | 5,296 | 12,208 |
| Total | $10,672 | $27,789 |
| From net realized gain | | |
| Blue Chip Growth | $753,870 | $722,639 |
| Class K | 279,140 | 288,606 |
| Total | $1,033,010 | $1,011,245 |
11. Share Transactions.
Share transactions for each class were as follows and may contain automatic conversions between classes or exchanges between affiliated funds:
| | Shares | Shares | Dollars | Dollars |
| | Year ended
July 31, 2016 | Year ended July 31, 2015 | Year ended
July 31, 2016 | Year ended July 31, 2015 |
| Blue Chip Growth | | | | |
| Shares sold | 44,585 | 45,258 | $2,977,524 | $3,161,935 |
| Reinvestment of distributions | 10,852 | 10,699 | 732,287 | 715,067 |
| Shares redeemed | (54,678) | (31,433) | (3,600,373) | (2,196,025) |
| Net increase (decrease) | 759 | 24,524 | $109,438 | $1,680,977 |
| Class K | | | | |
| Shares sold | 16,845(a) | 26,108 | $1,123,164(a) | $1,808,830 |
| Reinvestment of distributions | 4,210 | 4,497 | 284,436 | 300,814 |
| Shares redeemed | (25,279)(b) | (21,373)(c) | (1,683,839)(b) | (1,515,665)(c) |
| Net increase (decrease) | (4,224) | 9,232 | $(276,239) | $593,979 |
(a) Amount includes in-kind exchanges (see Note 4: Exchanges In-Kind).
(b) Amount includes in-kind redemptions (see Note 4: Redemptions In-Kind).
(c) Amount includes in-kind redemptions (see Note 4: Prior Fiscal Year Redemptions In-Kind).
12. Other.
The Fund's organizational documents provide former and current trustees and officers with a limited indemnification against liabilities arising in connection with the performance of their duties to the Fund. In the normal course of business, the Fund may also enter into contracts that provide general indemnifications. The Fund's maximum exposure under these arrangements is unknown as this would be dependent on future claims that may be made against the Fund. The risk of material loss from such claims is considered remote.
Report of Independent Registered Public Accounting Firm
To the Trustees of Fidelity Securities Fund and Shareholders of Fidelity Blue Chip Growth Fund:
We have audited the accompanying statement of assets and liabilities of Fidelity Blue Chip Growth Fund (the Fund), a fund of Fidelity Securities Fund, including the schedule of investments, as of July 31, 2016, and the related statement of operations for the year then ended, the statement of changes in net assets for each of the two years in the period then ended, and the financial highlights for each of the five years in the period then ended. These financial statements and financial highlights are the responsibility of the Fund's management. Our responsibility is to express an opinion on these financial statements and financial highlights based on our audits.
We conducted our audits in accordance with the standards of the Public Company Accounting Oversight Board (United States). Those standards require that we plan and perform the audit to obtain reasonable assurance about whether the financial statements and financial highlights are free of material misstatement. The Fund is not required to have, nor were we engaged to perform, an audit of its internal control over financial reporting. Our audits included consideration of internal control over financial reporting as a basis for designing audit procedures that are appropriate in the circumstances, but not for the purpose of expressing an opinion on the effectiveness of the Fund's internal control over financial reporting. Accordingly, we express no such opinion. An audit also includes examining, on a test basis, evidence supporting the amounts and disclosures in the financial statements, assessing the accounting principles used and significant estimates made by management, as well as evaluating the overall financial statement presentation. Our procedures included confirmation of securities owned as of July 31, 2016, by correspondence with the custodians and brokers; when replies were not received from brokers, we performed other auditing procedures. We believe that our audits provide a reasonable basis for our opinion.
In our opinion, such financial statements and financial highlights referred to above present fairly, in all material respects, the financial position of Fidelity Blue Chip Growth Fund as of July 31, 2016, the results of its operations for the year then ended, the changes in its net assets for each of the two years in the period then ended, and the financial highlights for the each of the five years in the period then ended in conformity with accounting principles generally accepted in the United States of America.
DELOITTE & TOUCHE LLP
Boston, Massachusetts
September 20, 2016
Trustees and Officers
The Trustees, Members of the Advisory Board (if any), and officers of the trust and fund, as applicable, are listed below. The Board of Trustees governs the fund and is responsible for protecting the interests of shareholders. The Trustees are experienced executives who meet periodically throughout the year to oversee the fund's activities, review contractual arrangements with companies that provide services to the fund, oversee management of the risks associated with such activities and contractual arrangements, and review the fund's performance. Each of the Trustees oversees 170 funds.
The Trustees hold office without limit in time except that (a) any Trustee may resign; (b) any Trustee may be removed by written instrument, signed by at least two-thirds of the number of Trustees prior to such removal; (c) any Trustee who requests to be retired or who has become incapacitated by illness or injury may be retired by written instrument signed by a majority of the other Trustees; and (d) any Trustee may be removed at any special meeting of shareholders by a two-thirds vote of the outstanding voting securities of the trust. Each Trustee who is not an interested person (as defined in the 1940 Act) of the trust and the fund is referred to herein as an Independent Trustee. Each Independent Trustee shall retire not later than the last day of the calendar year in which his or her 75th birthday occurs. The Independent Trustees may waive this mandatory retirement age policy with respect to individual Trustees. Officers and Advisory Board Members hold office without limit in time, except that any officer or Advisory Board Member may resign or may be removed by a vote of a majority of the Trustees at any regular meeting or any special meeting of the Trustees. Except as indicated, each individual has held the office shown or other offices in the same company for the past five years.
The fund’s Statement of Additional Information (SAI) includes more information about the Trustees. To request a free copy, call Fidelity at 1-800-835-5092.
Experience, Skills, Attributes, and Qualifications of the Trustees. The Governance and Nominating Committee has adopted a statement of policy that describes the experience, qualifications, attributes, and skills that are necessary and desirable for potential Independent Trustee candidates (Statement of Policy). The Board believes that each Trustee satisfied at the time he or she was initially elected or appointed a Trustee, and continues to satisfy, the standards contemplated by the Statement of Policy. The Governance and Nominating Committee also engages professional search firms to help identify potential Independent Trustee candidates who have the experience, qualifications, attributes, and skills consistent with the Statement of Policy. From time to time, additional criteria based on the composition and skills of the current Independent Trustees, as well as experience or skills that may be appropriate in light of future changes to board composition, business conditions, and regulatory or other developments, have also been considered by the professional search firms and the Governance and Nominating Committee. In addition, the Board takes into account the Trustees' commitment and participation in Board and committee meetings, as well as their leadership of standing and ad hoc committees throughout their tenure.
In determining that a particular Trustee was and continues to be qualified to serve as a Trustee, the Board has considered a variety of criteria, none of which, in isolation, was controlling. The Board believes that, collectively, the Trustees have balanced and diverse experience, qualifications, attributes, and skills, which allow the Board to operate effectively in governing the fund and protecting the interests of shareholders. Information about the specific experience, skills, attributes, and qualifications of each Trustee, which in each case led to the Board's conclusion that the Trustee should serve (or continue to serve) as a trustee of the fund, is provided below.
Board Structure and Oversight Function. James C. Curvey is an interested person and currently serves as Chairman. The Trustees have determined that an interested Chairman is appropriate and benefits shareholders because an interested Chairman has a personal and professional stake in the quality and continuity of services provided to the fund. Independent Trustees exercise their informed business judgment to appoint an individual of their choosing to serve as Chairman, regardless of whether the Trustee happens to be independent or a member of management. The Independent Trustees have determined that they can act independently and effectively without having an Independent Trustee serve as Chairman and that a key structural component for assuring that they are in a position to do so is for the Independent Trustees to constitute a substantial majority for the Board. The Independent Trustees also regularly meet in executive session. Ned C. Lautenbach serves as Chairman of the Independent Trustees and as such (i) acts as a liaison between the Independent Trustees and management with respect to matters important to the Independent Trustees and (ii) with management prepares agendas for Board meetings.
Fidelity® funds are overseen by different Boards of Trustees. The fund's Board oversees Fidelity's high income and certain equity funds, and other Boards oversee Fidelity's investment-grade bond, money market, asset allocation, and sector funds. The asset allocation funds may invest in Fidelity® funds overseen by the fund's Board. The use of separate Boards, each with its own committee structure, allows the Trustees of each group of Fidelity® funds to focus on the unique issues of the funds they oversee, including common research, investment, and operational issues. On occasion, the separate Boards establish joint committees to address issues of overlapping consequences for the Fidelity® funds overseen by each Board.
The Trustees operate using a system of committees to facilitate the timely and efficient consideration of all matters of importance to the Trustees, the fund, and fund shareholders and to facilitate compliance with legal and regulatory requirements and oversight of the fund's activities and associated risks. The Board, acting through its committees, has charged FMR and its affiliates with (i) identifying events or circumstances the occurrence of which could have demonstrably adverse effects on the fund's business and/or reputation; (ii) implementing processes and controls to lessen the possibility that such events or circumstances occur or to mitigate the effects of such events or circumstances if they do occur; and (iii) creating and maintaining a system designed to evaluate continuously business and market conditions in order to facilitate the identification and implementation processes described in (i) and (ii) above. Because the day-to-day operations and activities of the fund are carried out by or through FMR, its affiliates, and other service providers, the fund's exposure to risks is mitigated but not eliminated by the processes overseen by the Trustees. While each of the Board's committees has responsibility for overseeing different aspects of the fund's activities, oversight is exercised primarily through the Operations, Audit, and Compliance Committees. In addition, the Independent Trustees have worked with FMR to enhance the Board's oversight of investment and financial risks, legal and regulatory risks, technology risks, and operational risks, including the development of additional risk reporting to the Board. For example, a working group comprised of Independent Trustees and FMR has worked and continues to work to review the Fidelity® funds' valuation-related activities, reporting and risk management. Appropriate personnel, including but not limited to the fund's Chief Compliance Officer (CCO), FMR's internal auditor, the independent accountants, the fund's Treasurer and portfolio management personnel, make periodic reports to the Board's committees, as appropriate, including an annual review of Fidelity's risk management program for the Fidelity® funds. The responsibilities of each standing committee, including their oversight responsibilities, are described further under "Standing Committees of the Trustees."
Interested Trustees*:
Correspondence intended for a Trustee who is an interested person may be sent to Fidelity Investments, 245 Summer Street, Boston, Massachusetts 02210.
Name, Year of Birth; Principal Occupations and Other Relevant Experience+
James C. Curvey (1935)
Year of Election or Appointment: 2007
Trustee
Chairman of the Board of Trustees
Mr. Curvey also serves as Trustee of other Fidelity® funds. Mr. Curvey is a Director of Fidelity Research & Analysis Co. (investment adviser firm, 2009-present), and Vice Chairman (2007-present) and Director of FMR LLC (diversified financial services company). In addition, Mr. Curvey serves as an Overseer for the Boston Symphony Orchestra and a member of the board of Artis-Naples, Naples, Florida, and as a Trustee for Brewster Academy, Wolfeboro, New Hampshire. Previously, Mr. Curvey served as a Director of Fidelity Investments Money Management, Inc. (investment adviser firm, 2009-2014) and a Director of FMR and FMR Co., Inc. (investment adviser firms, 2007-2014).
Charles S. Morrison (1960)
Year of Election or Appointment: 2014
Trustee
Mr. Morrison also serves as Trustee of other funds. He serves as a Director of Fidelity Investments Money Management, Inc. (FIMM) (investment adviser firm, 2014-present), Director of Fidelity SelectCo, LLC (investment adviser firm, 2014-present), President, Asset Management (2014-present), and is an employee of Fidelity Investments. Previously, Mr. Morrison served as Vice President of Fidelity's Fixed Income and Asset Allocation Funds (2012-2014), President, Fixed Income (2011-2014), Vice President of Fidelity's Money Market Funds (2005-2009), President, Money Market Group Leader of FMR (investment adviser firm, 2009), and Senior Vice President, Money Market Group of FMR (2004-2009). Mr. Morrison also served as Vice President of Fidelity's Bond Funds (2002-2005), certain Balanced Funds (2002-2005), and certain Asset Allocation Funds (2002-2007), and as Senior Vice President (2002-2005) of Fidelity's Bond Division.
* Determined to be an “Interested Trustee” by virtue of, among other things, his or her affiliation with the trust or various entities under common control with FMR.
+ The information includes the Trustee's principal occupation during the last five years and other information relating to the experience, attributes, and skills relevant to the Trustee's qualifications to serve as a Trustee, which led to the conclusion that the Trustee should serve as a Trustee for the fund.
Independent Trustees:
Correspondence intended for an Independent Trustee may be sent to Fidelity Investments, P.O. Box 55235, Boston, Massachusetts 02205-5235.
Name, Year of Birth; Principal Occupations and Other Relevant Experience+
Dennis J. Dirks (1948)
Year of Election or Appointment: 2005
Trustee
Mr. Dirks also serves as Trustee of other Fidelity® funds. Prior to his retirement in May 2003, Mr. Dirks was Chief Operating Officer and a member of the Board of The Depository Trust & Clearing Corporation (DTCC). He also served as President, Chief Operating Officer, and Board member of The Depository Trust Company (DTC) and President and Board member of the National Securities Clearing Corporation (NSCC). In addition, Mr. Dirks served as Chief Executive Officer and Board member of the Government Securities Clearing Corporation, Chief Executive Officer and Board member of the Mortgage-Backed Securities Clearing Corporation, as a Trustee and a member of the Finance Committee of Manhattan College (2005-2008), as a Trustee and a member of the Finance Committee of AHRC of Nassau County (2006-2008), and as a member of the Independent Directors Council (IDC) Governing Council (2010-2015). Mr. Dirks is a member of the Board of Directors for The Brookville Center for Children's Services, Inc. (2009-present).
Alan J. Lacy (1953)
Year of Election or Appointment: 2008
Trustee
Mr. Lacy also serves as Trustee of other Fidelity® funds. Mr. Lacy serves as Chairman (2014-present) and a member (2010-present) of the Board of Directors of Dave & Buster's Entertainment, Inc. (restaurant and entertainment complexes) and a Director of Bristol-Myers Squibb Company (global pharmaceuticals, 2008-present). He is a Trustee of the California Chapter of The Nature Conservancy (2015-present) and a Director of the Center for Advanced Study in the Behavioral Sciences at Stanford University (2015-present). In addition, Mr. Lacy served as Senior Adviser (2007-2014) of Oak Hill Capital Partners, L.P. (private equity) and also served as Chief Executive Officer (2005) and Vice Chairman (2005-2006) of Sears Holdings Corporation (retail) and Chief Executive Officer and Chairman of the Board of Sears, Roebuck and Co. (retail, 2000-2005). Previously, Mr. Lacy served as Chairman (2008-2011) and a member (2006-2015) of the Board of Trustees of the National Parks Conservation Association and as a member of the Board of Directors for The Western Union Company (global money transfer, 2006-2011), The Hillman Companies, Inc. (hardware wholesalers, 2010-2014), and Earth Fare, Inc. (retail grocery, 2010-2014).
Ned C. Lautenbach (1944)
Year of Election or Appointment: 2000
Trustee
Chairman of the Independent Trustees
Mr. Lautenbach also serves as Trustee of other Fidelity® funds. Mr. Lautenbach currently serves as the Lead Director of the Eaton Corporation Board of Directors (diversified industrial, 1997-present). Mr. Lautenbach is Chairman of the Board of Directors of Artis-Naples in Naples, Florida (2012-present), a member of the Council on Foreign Relations (1994-present), and a member of the Board of Governors, State University System of Florida (2013-present). Previously, Mr. Lautenbach was a Partner/Advisory Partner at Clayton, Dubilier & Rice, LLC (private equity investment, 1998-2010), as well as a Director of Sony Corporation (2006-2007).
Joseph Mauriello (1944)
Year of Election or Appointment: 2008
Trustee
Mr. Mauriello also serves as Trustee of other Fidelity® funds. Prior to his retirement in January 2006, Mr. Mauriello served in numerous senior management positions including Deputy Chairman and Chief Operating Officer (2004-2005), and Vice Chairman of Financial Services (2002-2004) of KPMG LLP US (professional services, 1965-2005). Mr. Mauriello currently serves as a member of the Board of Directors of XL Group plc. (global insurance and re-insurance, 2006-present) and the Independent Directors Council (IDC) Governing Council (2015-present). Previously, Mr. Mauriello served as a Director of the Hamilton Funds of the Bank of New York (2006-2007) and of Arcadia Resources Inc. (health care services and products, 2007-2012).
Robert W. Selander (1950)
Year of Election or Appointment: 2011
Trustee
Mr. Selander also serves as Trustee of other Fidelity® funds. Mr. Selander serves as a Director of The Western Union Company (global money transfer, 2014-present) and a non-executive Chairman of Health Equity, Inc. (health savings custodian, 2015-present). Previously, Mr. Selander served as a Member of the Advisory Board of certain Fidelity® funds (2011), and Executive Vice Chairman (2010), Chief Executive Officer (2009-2010), and President and Chief Executive Officer (1997-2009) of Mastercard, Inc.
Cornelia M. Small (1944)
Year of Election or Appointment: 2005
Trustee
Ms. Small also serves as Trustee of other Fidelity® funds. Ms. Small is a member of the Board of Directors (2009-present) and Chair of the Investment Committee (2010-present) of the Teagle Foundation. Ms. Small also serves on the Investment Committee of the Berkshire Taconic Community Foundation (2008-present). Previously, Ms. Small served as Chairperson (2002-2008) and a member of the Investment Committee and Chairperson (2008-2012) and a member of the Board of Trustees of Smith College. In addition, Ms. Small served as Chief Investment Officer, Director of Global Equity Investments, and a member of the Board of Directors of Scudder, Stevens & Clark and Scudder Kemper Investments.
William S. Stavropoulos (1939)
Year of Election or Appointment: 2002
Trustee
Vice Chairman of the Independent Trustees
Mr. Stavropoulos also serves as Trustee of other Fidelity® funds. Mr. Stavropoulos serves as President and Founder of the Michigan Baseball Foundation, the Great Lakes Loons (2007-present). Mr. Stavropoulos is Chairman Emeritus of the Board of Directors of The Dow Chemical Company, where he previously served in numerous senior management positions, including President, CEO (1995-2000; 2002-2004), Chairman of the Executive Committee (2000-2006), and as a member of the Board of Directors (1990-2006). Currently, Mr. Stavropoulos is Chairman of the Board of Directors of Univar Inc. (global distributor of commodity and specialty chemicals), a Director of Teradata Corporation (data warehousing and technology solutions), and Maersk Inc. (industrial conglomerate), and a member of the Advisory Board for Metalmark Capital LLC (private equity investment, 2005-present). Mr. Stavropoulos is an operating advisor to Clayton, Dubilier & Rice, LLC (private equity investment). In addition, Mr. Stavropoulos is a member of the University of Notre Dame Advisory Council for the College of Science, a Trustee of the Rollin L. Gerstacker Foundation, and a Director of the Naples Philharmonic Center for the Arts. Previously, Mr. Stavropoulos served as a Director of Chemical Financial Corporation (bank holding company, 1993-2012) and Tyco International, Ltd. (multinational manufacturing and services, 2007-2012).
David M. Thomas (1949)
Year of Election or Appointment: 2008
Trustee
Mr. Thomas also serves as Trustee of other Fidelity® funds. Mr. Thomas serves as Non-Executive Chairman of the Board of Directors of Fortune Brands Home and Security (home and security products, 2011-present), as a member of the Board of Directors (2004-present) and Presiding Director (2013-present) of Interpublic Group of Companies, Inc. (marketing communication), and as a member of the Board of Trustees of the University of Florida (2013-present). Previously, Mr. Thomas served as Executive Chairman (2005-2006) and Chairman and Chief Executive Officer (2000-2005) of IMS Health, Inc. (pharmaceutical and healthcare information solutions), and a Director of Fortune Brands, Inc. (consumer products, 2000-2011).
+ The information includes the Trustee's principal occupation during the last five years and other information relating to the experience, attributes, and skills relevant to the Trustee's qualifications to serve as a Trustee, which led to the conclusion that the Trustee should serve as a Trustee for the fund.
Advisory Board Members and Officers:
Correspondence intended for an officer or Peter S. Lynch may be sent to Fidelity Investments, 245 Summer Street, Boston, Massachusetts 02210. Officers appear below in alphabetical order.
Name, Year of Birth; Principal Occupation
Peter S. Lynch (1944)
Year of Election or Appointment: 2003
Member of the Advisory Board
Mr. Lynch also serves as Member of the Advisory Board of other Fidelity® funds. Mr. Lynch is Vice Chairman and a Director of FMR (investment adviser firm) and FMR Co., Inc. (investment adviser firm). In addition, Mr. Lynch serves as a Trustee of Boston College and as the Chairman of the Inner-City Scholarship Fund. Previously, Mr. Lynch served on the Special Olympics International Board of Directors (1997-2006).
Marc R. Bryant (1966)
Year of Election or Appointment: 2015
Secretary and Chief Legal Officer (CLO)
Mr. Bryant also serves as Secretary and CLO of other funds. Mr. Bryant serves as CLO, Secretary, and Senior Vice President of Fidelity Management & Research Company (investment adviser firm, 2015-present) and FMR Co., Inc. (investment adviser firm, 2015-present); Secretary of Fidelity SelectCo, LLC (investment adviser firm, 2015-present) and Fidelity Investments Money Management, Inc. (investment adviser firm, 2015-present); and CLO of Fidelity Management & Research (Hong Kong) Limited and FMR Investment Management (U.K.) Limited (investment adviser firms, 2015-present) and Fidelity Management & Research (Japan) Limited (investment adviser firm, 2016-present). He is Senior Vice President and Deputy General Counsel of FMR LLC (diversified financial services company). Previously, Mr. Bryant served as Secretary and CLO of Fidelity Rutland Square Trust II (2010-2014) and Assistant Secretary of Fidelity's Fixed Income and Asset Allocation Funds (2013-2015). Prior to joining Fidelity Investments, Mr. Bryant served as a Senior Vice President and the Head of Global Retail Legal for AllianceBernstein L.P. (2006-2010), and as the General Counsel for ProFund Advisors LLC (2001-2006).
Jeffrey S. Christian (1961)
Year of Election or Appointment: 2016
Assistant Treasurer
Mr. Christian also serves as Assistant Treasurer of other funds. Mr. Christian is an employee of Fidelity Investments (2003-present).
William C. Coffey (1969)
Year of Election or Appointment: 2009
Assistant Secretary
Mr. Coffey also serves as Assistant Secretary of other funds. He is Senior Vice President and Deputy General Counsel of FMR LLC (diversified financial services company, 2010-present), and is an employee of Fidelity Investments. Previously, Mr. Coffey served as Vice President and Associate General Counsel of FMR LLC (2005-2009).
Jonathan Davis (1968)
Year of Election or Appointment: 2010
Assistant Treasurer
Mr. Davis also serves as Assistant Treasurer of other funds, and is an employee of Fidelity Investments. Previously, Mr. Davis served as Vice President and Associate General Counsel of FMR LLC (diversified financial services company, 2003-2010).
Adrien E. Deberghes (1967)
Year of Election or Appointment: 2016
Assistant Treasurer
Mr. Deberghes also serves as an officer of other funds. He serves as Executive Vice President of Fidelity Investments Money Management, Inc. (FIMM) (investment adviser firm, 2016-present) and is an employee of Fidelity Investments (2008-present). Prior to joining Fidelity Investments, Mr. Deberghes was Senior Vice President of Mutual Fund Administration at State Street Corporation (2007-2008), Senior Director of Mutual Fund Administration at Investors Bank & Trust (2005-2007), and Director of Finance for Dunkin' Brands (2000-2005). Previously, Mr. Deberghes served in other fund officer roles.
Stephanie J. Dorsey (1969)
Year of Election or Appointment: 2010
Assistant Treasurer
Ms. Dorsey also serves as an officer of other funds. She is an employee of Fidelity Investments (2008-present) and has served in other fund officer roles. Prior to joining Fidelity Investments, Ms. Dorsey served as Treasurer (2004-2008) of the JPMorgan Mutual Funds and Vice President (2004-2008) of JPMorgan Chase Bank.
Howard J. Galligan III (1966)
Year of Election or Appointment: 2014
Chief Financial Officer
Mr. Galligan also serves as Chief Financial Officer of other funds. Mr. Galligan serves as President of Fidelity Pricing and Cash Management Services (FPCMS) (2014-present) and as a Director of Strategic Advisers, Inc. (investment adviser firm, 2008-present). Previously, Mr. Galligan served as Chief Administrative Officer of Asset Management (2011-2014) and Chief Operating Officer and Senior Vice President of Investment Support for Strategic Advisers, Inc. (2003-2011).
Scott C. Goebel (1968)
Year of Election or Appointment: 2015
Vice President
Mr. Goebel serves as Vice President of other funds and is an employee of Fidelity Investments (2001-present). Mr. Goebel serves as Senior Vice President of Fidelity Management & Research Company (FMR) (investment adviser firm, 2016-present). Previously, Mr. Goebel served as Secretary of Fidelity SelectCo, LLC (investment adviser firm, 2013-2015), Fidelity Investments Money Management, Inc. (FIMM) (investment adviser firm, 2010-2015), and Fidelity Research and Analysis Company (FRAC) (investment adviser firm, 2010-2015); General Counsel, Secretary, and Senior Vice President of FMR (investment adviser firm, 2008-2015) and FMR Co., Inc. (investment adviser firm, 2008-2015); Assistant Secretary of Fidelity Management & Research (Japan) Limited (investment adviser firm, 2008-2015) and Fidelity Management & Research (U.K.) Inc. (investment adviser firm, 2008-2015); Chief Legal Officer (CLO) of Fidelity Management & Research (Hong Kong) Limited (investment adviser firm, 2008-2015); Secretary and CLO of certain Fidelity® funds (2008-2015); Assistant Secretary of FIMM (2008-2010), FRAC (2008-2010), and certain funds (2007-2008); and as Vice President and Secretary of Fidelity Distributors Corporation (FDC) (2005-2007).
Brian B. Hogan (1964)
Year of Election or Appointment: 2009
Vice President
Mr. Hogan also serves as Trustee or Vice President of other funds. Mr. Hogan serves as a Director of FMR Investment Management (U.K.) Limited (investment adviser firm, 2015-present) and Fidelity SelectCo, LLC (investment adviser firm, 2014-present) and President of the Equity Division of FMR (investment adviser firm, 2009-present). Previously, Mr. Hogan served as Senior Vice President, Equity Research of FMR (2006-2009) and as a portfolio manager. Mr. Brian B. Hogan is not related to Mr. Colm A. Hogan.
Colm A. Hogan (1973)
Year of Election or Appointment: 2016
Deputy Treasurer
Mr. Hogan also serves as an officer of other funds. Mr. Hogan is an employee of Fidelity Investments (2005-present). Mr. Colm A. Hogan is not related to Mr. Brian B. Hogan.
Chris Maher (1972)
Year of Election or Appointment: 2013
Assistant Treasurer
Mr. Maher serves as Assistant Treasurer of other funds. Mr. Maher is Vice President of Valuation Oversight and is an employee of Fidelity Investments. Previously, Mr. Maher served as Vice President of Asset Management Compliance (2013), Vice President of the Program Management Group of FMR (investment adviser firm, 2010-2013), and Vice President of Valuation Oversight (2008-2010).
John F. Papandrea (1972)
Year of Election or Appointment: 2016
Anti-Money Laundering (AML) Officer
Mr. Papandrea also serves as AML Officer of other funds. Mr. Papandrea is Vice President of FMR LLC (diversified financial services company, 2008-present) and is an employee of Fidelity Investments (2005-present).
Melissa M. Reilly (1971)
Year of Election or Appointment: 2014
Vice President of certain Equity Funds
Ms. Reilly also serves as Vice President of other funds. Ms. Reilly is an employee of Fidelity Investments (2004-present).
Kenneth B. Robins (1969)
Year of Election or Appointment: 2016
Chief Compliance Officer
Mr. Robins also serves as an officer of other funds. Mr. Robins serves as Compliance Officer of Fidelity Management & Research Company and FMR Co., Inc. (investment adviser firms, 2016-present) and is an employee of Fidelity Investments (2004-present). Previously, Mr. Robins served as Executive Vice President of Fidelity Investments Money Management, Inc. (investment adviser firm, 2013-2016) and served in other fund officer roles.
Stacie M. Smith (1974)
Year of Election or Appointment: 2016
President and Treasurer
Ms. Smith also serves as an officer of other funds. She is an employee of Fidelity Investments (2009-present) and has served in other fund officer roles. Prior to joining Fidelity Investments, Ms. Smith served as Senior Audit Manager of Ernst & Young LLP (1996-2009). Previously, Ms. Smith served as Deputy Treasurer of certain Fidelity® funds (2013-2016).
Renee Stagnone (1975)
Year of Election or Appointment: 2016
Assistant Treasurer
Ms. Stagnone also serves as an officer of other funds. Ms. Stagnone is an employee of Fidelity Investments (1997-present). Previously, Ms. Stagnone served as Deputy Treasurer of certain Fidelity® funds (2013-2016).
Shareholder Expense Example
As a shareholder of the Fund, you incur two types of costs: (1) transaction costs and (2) ongoing costs, including management fees and other Fund expenses. This Example is intended to help you understand your ongoing costs (in dollars) of investing in the Fund and to compare these costs with the ongoing costs of investing in other mutual funds.
The Example is based on an investment of $1,000 invested at the beginning of the period and held for the entire period (February 1, 2016 to July 31, 2016).
Actual Expenses
The first line of the accompanying table for each class of the Fund provides information about actual account values and actual expenses. You may use the information in this line, together with the amount you invested, to estimate the expenses that you paid over the period. Simply divide your account value by $1,000.00 (for example, an $8,600 account value divided by $1,000.00 = 8.6), then multiply the result by the number in the first line for a class of the Fund under the heading entitled "Expenses Paid During Period" to estimate the expenses you paid on your account during this period. A small balance maintenance fee of $12.00 that is charged once a year may apply for certain accounts with a value of less than $2,000. This fee is not included in the table below. If it was, the estimate of expenses you paid during the period would be higher, and your ending account value lower, by this amount. In addition, the Fund, as a shareholder in the underlying Fidelity Central Funds, will indirectly bear its pro-rata share of the fees and expenses incurred by the underlying Fidelity Central Funds. These fees and expenses are not included in the Fund's annualized expense ratio used to calculate the expense estimate in the table below.
Hypothetical Example for Comparison Purposes
The second line of the accompanying table for each class of the Fund provides information about hypothetical account values and hypothetical expenses based on a Class' actual expense ratio and an assumed rate of return of 5% per year before expenses, which is not the Class' actual return. The hypothetical account values and expenses may not be used to estimate the actual ending account balance or expenses you paid for the period. You may use this information to compare the ongoing costs of investing in the Fund and other funds. To do so, compare this 5% hypothetical example with the 5% hypothetical examples that appear in the shareholder reports of the other funds. A small balance maintenance fee of $12.00 that is charged once a year may apply for certain accounts with a value of less than $2,000. This fee is not included in the table below. If it was, the estimate of expenses you paid during the period would be higher, and your ending account value lower, by this amount. In addition, the Fund, as a shareholder in the underlying Fidelity Central Funds, will indirectly bear its pro-rata share of the fees and expenses incurred by the underlying Fidelity Central Funds. These fees and expenses are not included in the Fund's annualized expense ratio used to calculate the expense estimate in the table below.
Please note that the expenses shown in the table are meant to highlight your ongoing costs only and do not reflect any transaction costs. Therefore, the second line of the table is useful in comparing ongoing costs only, and will not help you determine the relative total costs of owning different funds.
| | Annualized Expense Ratio-A | Beginning
Account Value
February 1, 2016 | Ending
Account Value
July 31, 2016 | Expenses Paid
During Period-B
February 1, 2016
to July 31, 2016 |
| Blue Chip Growth | .74% | | | |
| Actual | | $1,000.00 | $1,099.00 | $3.86 |
| Hypothetical-C | | $1,000.00 | $1,021.18 | $3.72 |
| Class K | .62% | | | |
| Actual | | $1,000.00 | $1,099.60 | $3.24 |
| Hypothetical-C | | $1,000.00 | $1,021.78 | $3.12 |
A Annualized expense ratio reflects expenses net of applicable fee waivers.
B Expenses are equal to each Class' annualized expense ratio, multiplied by the average account value over the period, multiplied by 182/366 (to reflect the one-half year period).
C 5% return per year before expenses
Distributions (Unaudited)
The Board of Trustees of Fidelity Blue Chip Growth Fund voted to pay to shareholders of record at the opening of business on record date, the following distributions per share derived from capital gains realized from sales of portfolio securities, and dividends derived from net investment income:
| | Pay Date | Record Date | Dividends | Capital Gains |
| Blue Chip Growth | 09/19/16 | 09/16/16 | $0.090 | $0.873 |
| Class K | 09/19/16 | 09/16/16 | $0.173 | $0.873 |
| | |
The fund hereby designates as a capital gain dividend with respect to the taxable year ended July 31, 2016, $299,746,135, or, if subsequently determined to be different, the net capital gain of such year.
Blue Chip Growth and Class K designate 100% of the dividends distributed during the fiscal year as qualifying for the dividends–received deduction for corporate shareholders.
Blue Chip Growth and Class K designate 100% of the dividends distributed during the fiscal year as amounts which may be taken into account as a dividend for purposes of the maximum rate under section 1(h)(11) of the Internal Revenue Code.
The fund will notify shareholders in January 2017 of amounts for use in preparing 2016 income tax returns.
Board Approval of Investment Advisory Contracts and Management Fees
Fidelity Blue Chip Growth Fund
Each year, the Board of Trustees, including the Independent Trustees (together, the Board), votes on the renewal of the management contract with Fidelity Management & Research Company (FMR) and the sub-advisory agreements (together, the Advisory Contracts) for the fund. The Board, assisted by the advice of fund counsel and Independent Trustees' counsel, requests and considers a broad range of information relevant to the renewal of the Advisory Contracts throughout the year.
The Board meets regularly and, at each of its meetings, covers an extensive agenda of topics and materials and considers factors that are relevant to its annual consideration of the renewal of the fund's Advisory Contracts, including the services and support provided to the fund and its shareholders. The Board has established various standing committees (Committees), each composed of and chaired by Independent Trustees with varying backgrounds, to which the Board has assigned specific subject matter responsibilities in order to enhance effective decision-making by the Board. The Board, acting directly and through its Committees, requests and receives information concerning the annual consideration of the renewal of the fund's Advisory Contracts. The Board also meets as needed to consider matters specifically related to the Board's annual consideration of the renewal of the Advisory Contracts. Members of the Board may also meet with trustees of other Fidelity funds through ad hoc joint committees to discuss certain matters relevant to all of the Fidelity funds.
At its July 2016 meeting, the Board unanimously determined to renew the fund's Advisory Contracts. In reaching its determination, the Board considered all factors it believed relevant, including (i) the nature, extent, and quality of the services to be provided to the fund and its shareholders (including the investment performance of the fund); (ii) the competitiveness of the fund's management fee and total expense ratio relative to peer funds; (iii) the total costs of the services to be provided by and the profits to be realized by Fidelity from its relationships with the fund; and (iv) the extent to which, if any, economies of scale exist and would be realized as the fund grows, and whether any economies of scale are appropriately shared with fund shareholders.
In considering whether to renew the Advisory Contracts for the fund, the Board reached a determination, with the assistance of fund counsel and Independent Trustees' counsel and through the exercise of its business judgment, that the renewal of the Advisory Contracts was in the best interests of the fund and its shareholders and that the compensation payable under the Advisory Contracts was fair and reasonable. The Board's decision to renew the Advisory Contracts was not based on any single factor, but rather was based on a comprehensive consideration of all the information provided to the Board at its meetings throughout the year. The Board, in reaching its determination to renew the Advisory Contracts, was aware that shareholders of the fund have a broad range of investment choices available to them, including a wide choice among funds offered by Fidelity's competitors, and that the fund's shareholders, who have the opportunity to review and weigh the disclosure provided by the fund in its prospectus and other public disclosures, have chosen to invest in this fund, which is part of the Fidelity family of funds.
Nature, Extent, and Quality of Services Provided. The Board considered Fidelity's staffing as it relates to the fund, including the backgrounds of investment personnel of Fidelity, and also considered the fund's investment objective, strategies, and related investment philosophy. The Independent Trustees also had discussions with senior management of Fidelity's investment operations and investment groups. The Board considered the structure of the investment personnel compensation program and whether this structure provides appropriate incentives to act in the best interests of the fund. Additionally, the Board considered the portfolio managers' investments, if any, in the funds that they manage.
Resources Dedicated to Investment Management and Support Services. The Board and the Fund Oversight and Research Committees reviewed the general qualifications and capabilities of Fidelity's investment staff, including its size, education, experience, and resources, as well as Fidelity's approach to recruiting, training, managing, and compensating investment personnel. The Board noted that Fidelity has continued to increase the resources devoted to non-U.S. offices, including expansion of Fidelity's global investment organization. The Board also noted that Fidelity's analysts have extensive resources, tools and capabilities that allow them to conduct sophisticated quantitative and fundamental analysis, as well as credit analysis of issuers, counterparties and guarantors. Further, the Board considered that Fidelity's investment professionals have sufficient access to global information and data so as to provide competitive investment results over time, and that those professionals also have access to sophisticated tools that permit them to assess portfolio construction and risk and performance attribution characteristics continuously, as well as to transmit new information and research conclusions rapidly around the world. Additionally, in its deliberations, the Board considered Fidelity's trading, risk management, compliance, and technology and operations capabilities and resources, which are integral parts of the investment management process.
Shareholder and Administrative Services. The Board considered (i) the nature, extent, quality, and cost of advisory, administrative, and shareholder services performed by FMR, the sub-advisers (together with FMR, the Investment Advisers), and their affiliates under the Advisory Contracts and under separate agreements covering transfer agency, pricing and bookkeeping, and securities lending services for the fund; (ii) the nature and extent of the supervision of third party service providers, principally custodians, subcustodians, and pricing vendors; and (iii) the resources devoted to, and the record of compliance with, the fund's compliance policies and procedures. The Board also reviewed the allocation of fund brokerage, including allocations to brokers affiliated with the Investment Advisers, the use of brokerage commissions to pay fund expenses, and the use of "soft" commission dollars to pay for research services.
The Board noted that the growth of fund assets over time across the complex allows Fidelity to reinvest in the development of services designed to enhance the value or convenience of the Fidelity funds as investment vehicles. These services include 24-hour access to account information and market information through telephone representatives and over the Internet, investor education materials and asset allocation tools, and the expanded availability of Fidelity Investor Centers.
In 2014, the Board formed an ad hoc Committee on Transfer Agency Fees to review the variety of transfer agency fee structures throughout the industry and Fidelity's competitive positioning with respect to industry participants.
Investment in a Large Fund Family. The Board considered the benefits to shareholders of investing in a Fidelity fund, including the benefits of investing in a fund that is part of a large family of funds offering a variety of investment disciplines and providing a large variety of mutual fund investor services. The Board noted that Fidelity had taken, or had made recommendations that resulted in the Fidelity funds taking, a number of actions over the previous year that benefited particular funds, including: (i) continuing to dedicate additional resources to investment research and to the support of the senior management team that oversees asset management; (ii) continuing efforts to enhance Fidelity's global research capabilities; (iii) launching new funds and making other enhancements to meet client needs; (iv) broadening eligibility requirements for certain lower-priced share classes of, and streamlining the fee structure for, certain existing equity index funds; (v) lowering expense caps for certain existing funds and classes to reduce expenses paid by shareholders; (vi) eliminating redemption fees for certain variable insurance product funds and classes; (vii) continuing to launch dedicated lower cost underlying funds to meet portfolio construction needs related to expanding underlying fund options for Fidelity funds of funds, specifically for the Freedom Fund product lines; (viii) launching a lower cost share class for use by the Freedom Index Fund product line; (ix) rationalizing product lines and gaining increased efficiencies through fund mergers and share class consolidations; (x) continuing to develop, acquire and implement systems and technology to improve services to the funds and shareholders, strengthen information security, and increase efficiency; (xi) implementing investment enhancements to further strengthen Fidelity's target date product line to increase investors' probability of success in achieving their goals; (xii) accelerating the conversion of all remaining Class B shares to Class A shares, which have a lower expense structure; and (xiii) implementing changes to Fidelity's money market fund product line in response to recent regulatory reforms.
Investment Performance. The Board considered whether the fund has operated in accordance with its investment objective, as well as its record of compliance with its investment restrictions and its performance history.
The Board took into account discussions with representatives of the Investment Advisers about fund investment performance that occur at Board meetings throughout the year. In this regard the Board noted that as part of regularly scheduled fund reviews and other reports to the Board on fund performance, the Board considers annualized return information for the fund, for different time periods, measured against a securities market index ("benchmark index") and a peer group of funds with similar objectives ("peer group"), if any. In its evaluation of fund investment performance, the Board gave particular attention to information indicating changes in performance of certain Fidelity funds for specific time periods and discussed with the Investment Advisers the reasons for any overperformance or underperformance.
In addition to reviewing absolute and relative fund performance, the Independent Trustees periodically consider the appropriateness of fund performance metrics in evaluating the results achieved. In general, the Independent Trustees believe that fund performance should be evaluated based on net performance (after fees and expenses) of both the highest performing and lowest performing fund share classes, where applicable, compared to appropriate benchmark indices, over appropriate time periods that may include full market cycles, and compared to peer groups, as applicable, over the same periods, taking into account relevant factors including the following: general market conditions; issuer-specific information; and fund cash flows and other factors.
The Independent Trustees recognize that shareholders evaluate performance on a net basis over their own holding periods, for which one-, three-, and five-year periods are often used as a proxy. For this reason, the performance information reviewed by the Board also included net cumulative calendar year total return information for the fund and an appropriate benchmark index and peer group for the most recent one-, three-, and five-year periods, as shown below. Returns are shown compared to the 25th percentile (top of box, 75% beaten) and 75th percentile (bottom of box, 25% beaten) of the peer universe.
Fidelity Blue Chip Growth Fund
The Board also considered that the fund's management fee is subject to upward or downward adjustment depending upon whether, and to what extent, the fund's investment performance for the performance period exceeds, or is exceeded by, a securities index, thus leading to a performance adjustment for the same period. The Board noted that the performance adjustment provides FMR with a strong economic incentive to seek to achieve superior performance for the fund's shareholders and helps to more closely align the interests of FMR and the shareholders of the fund.
Based on its review, the Board concluded that the nature, extent, and quality of services provided to the fund under the Advisory Contracts should continue to benefit the shareholders of the fund.
Competitiveness of Management Fee and Total Expense Ratio. The Board considered the fund's management fee and total expense ratio compared to "mapped groups" of competitive funds and classes created for the purpose of facilitating the Trustees' competitive analysis of management fees and total expenses. Fidelity creates "mapped groups" by combining similar Broadridge investment objective categories that have comparable investment mandates. Combining Broadridge investment objective categories aids the Board's management fee and total expense ratio comparisons by broadening the competitive group used for comparison.
Management Fee. The Board considered two proprietary management fee comparisons for the 12-month periods shown in basis points (BP) in the chart below. The group of Broadridge funds used by the Board for management fee comparisons is referred to below as the "Total Mapped Group." The Total Mapped Group comparison focuses on a fund's standing in terms of gross management fees before expense reimbursements or caps, and without giving effect to the fund's performance adjustment, relative to the total universe of funds with comparable investment mandates, regardless of whether their management fee structures also are comparable. Funds with comparable investment mandates offer exposure to similar types of securities. Funds with comparable management fee structures have similar management fee contractual arrangements (
e.g., flat rate charged for advisory services, all-inclusive fee rate,
etc.). "TMG %" represents the percentage of funds in the Total Mapped Group that had management fees that were lower than the fund's. For example, a hypothetical TMG % of 20% would mean that 80% of the funds in the Total Mapped Group had higher, and 20% had lower, management fees than the fund. The fund's actual TMG %s and the number of funds in the Total Mapped Group are in the chart below. The "Asset-Size Peer Group" (ASPG) comparison focuses on a fund's standing relative to a subset of non-Fidelity funds within the Total Mapped Group that are similar in size and management fee structure without taking into account performance adjustments, if any. For example, if a fund is in the first quartile of the ASPG, the fund's management fee ranks in the least expensive or lowest 25% of funds in the ASPG. The ASPG represents at least 15% of the funds in the Total Mapped Group with comparable asset size and management fee structures, subject to a minimum of 50 funds (or all funds in the Total Mapped Group if fewer than 50). Additional information, such as the ASPG quartile in which the fund's management fee rate ranked and the impact of the fund's performance adjustment, is also included in the chart and considered by the Board.
Fidelity Blue Chip Growth Fund
The Board noted that the fund's management fee rate ranked below the median of its Total Mapped Group and below the median of its ASPG for 2015. The Board also noted the effect of the fund's performance adjustment, if any, on the fund's management fee ranking.
The Board noted that, in 2014, the ad hoc Committee on Group Fee was formed by it and the boards of other Fidelity funds to conduct an in-depth review of the "group fee" component of the management fee of funds with such management fee structures. The Committee's focus included the mechanics of the group fee, the competitive landscape of group fee structures, Fidelity funds with no group fee component and investment products not included in group fee assets. The Board also considered that, for funds subject to the group fee, FMR agreed to voluntarily waive fees over a specified period of time in amounts designed to account for assets converted from certain funds to certain collective investment trusts.
The Board also noted that, in 2013, the ad hoc Committee on Management Fees was formed to conduct an in-depth review of the management fee rates of Fidelity's active equity mutual funds. The Committee focused on the following areas: (i) standard fee structures; (ii) research consumption and trading evolution; (iii) management fee competitiveness/profitability by category; and (iv) factors that drive institutional pricing.
Based on its review, the Board concluded that the fund's management fee is fair and reasonable in light of the services that the fund receives and the other factors considered.
Total Expense Ratio. In its review of each class's total expense ratio, the Board considered the fund's management fee rate as well as other fund or class expenses, as applicable, such as transfer agent fees, pricing and bookkeeping fees, and custodial, legal, and audit fees. The Board noted the impact of the fund's performance adjustment. The Board also noted that Fidelity may agree to waive fees and expenses from time to time, and the extent to which, if any, it has done so for the fund. As part of its review, the Board also considered the current and historical total expense ratios of each class of the fund compared to competitive fund median expenses. Each class of the fund is compared to those funds and classes in the Total Mapped Group (used by the Board for management fee comparisons) that have a similar sales load structure.
The Board noted that the total expense ratio of each class ranked below the competitive median for 2015.
Fees Charged to Other Fidelity Clients. The Board also considered Fidelity fee structures and other information with respect to clients of Fidelity, such as other funds advised or subadvised by Fidelity, pension plan clients, and other institutional clients with similar mandates. The Board noted the findings of the 2013 ad hoc joint committee (created with the board of other Fidelity funds), which reviewed and compared Fidelity's institutional investment advisory business with its business of providing services to the Fidelity funds, including the differences in services provided, fees charged, and costs incurred, as well as competition in their respective marketplaces.
Based on its review of total expense ratios and fees charged to other Fidelity clients, the Board concluded that the total expense ratio of each class of the fund was reasonable in light of the services that the fund and its shareholders receive and the other factors considered.
Costs of the Services and Profitability. The Board considered the revenues earned and the expenses incurred by Fidelity in conducting the business of developing, marketing, distributing, managing, administering and servicing the fund and servicing the fund's shareholders. The Board also considered the level of Fidelity's profits in respect of all the Fidelity funds.
On an annual basis, Fidelity presents to the Board information about the profitability of its relationship with the fund. Fidelity calculates profitability information for each fund, as well as aggregate profitability information for groups of Fidelity funds and all Fidelity funds, using a series of detailed revenue and cost allocation methodologies which originate with the books and records of Fidelity on which Fidelity's audited financial statements are based. The Audit Committee of the Board reviews any significant changes from the prior year's methodologies.
PricewaterhouseCoopers LLP (PwC), independent registered public accounting firm and auditor to Fidelity and certain Fidelity funds, has been engaged annually by the Board as part of the Board's assessment of Fidelity's profitability analysis. PwC's engagement includes the review and assessment of the methodologies used by Fidelity in determining the revenues and expenses attributable to Fidelity's mutual fund business, and completion of agreed-upon procedures in respect of the mathematical accuracy of the fund profitability information and its conformity to established allocation methodologies. After considering PwC's reports issued under the engagement and information provided by Fidelity, the Board concluded that while other allocation methods may also be reasonable, Fidelity's profitability methodologies are reasonable in all material respects.
The Board also reviewed Fidelity's non-fund businesses and fall-out benefits related to the mutual fund business as well as cases where Fidelity's affiliates may benefit from or be related to the fund's business.
The Board considered the costs of the services provided by and the profits realized by Fidelity in connection with the operation of the fund and was satisfied that the profitability was not excessive.
Economies of Scale. The Board considered whether there have been economies of scale in respect of the management of the Fidelity funds, whether the Fidelity funds (including the fund) have appropriately benefited from any such economies of scale, and whether there is potential for realization of any further economies of scale. The Board considered the extent to which the fund will benefit from economies of scale as assets grow through increased services to the fund, through waivers or reimbursements, or through fee or expense ratio reductions. The Board also noted that in 2013, it and the boards of other Fidelity funds created an ad hoc committee (the Economies of Scale Committee) to analyze whether Fidelity attains economies of scale in respect of the management and servicing of the Fidelity funds, whether the Fidelity funds have appropriately benefited from such economies of scale, and whether there is potential for realization of any further economies of scale.
The Board recognized that the fund's management contract incorporates a "group fee" structure, which provides for lower group fee rates as total group assets increase, and for higher group fee rates as total group assets decrease (with "group assets" defined to include fund assets under FMR's management plus the assets of sector funds previously under FMR's management). FMR calculates the group fee rates based on a tiered asset "breakpoint" schedule that varies based on asset class. The Board considered that the group fee is designed to deliver the benefits of economies of scale to fund shareholders when total Fidelity fund assets increase, even if assets of any particular fund are unchanged or have declined, because some portion of Fidelity's costs are attributable to services provided to all Fidelity funds, and all funds benefit if those costs can be allocated among more assets. The Board concluded that, given the group fee structure, fund shareholders will benefit from lower management fees as group assets increase at the fund complex level, regardless of whether Fidelity achieves any such economies of scale.
The Board concluded, taking into account the analysis of the Economies of Scale Committee, that economies of scale, if any, are being appropriately shared between fund shareholders and Fidelity.
Additional Information Requested by the Board. In order to develop fully the factual basis for consideration of the Fidelity funds' Advisory Contracts, the Board requested and received additional information on certain topics, including: (i) fund performance trends and Fidelity's long-term strategies for certain funds; (ii) the various share classes employed by Fidelity and the attributes of each class, together with similar information on the distribution and servicing payments made by Fidelity or the funds to third-party participants in the distribution channels; (iii) fund profitability, and fund performance in relation to fund profitability; (iv) the methodology with respect to evaluating competitive fund data and peer group classifications and fee comparisons; (v) annual fund profitability margins; (vi) the realization of fall-out benefits in and attribution of fall-out benefits to certain Fidelity business units; (vii) the appropriateness of certain funds' benchmarks; (viii) the rationalization for certain share classes and expenses; (ix) sub-advisory fee rates for comparable investment mandates; (x) product strategy for certain underperforming funds; and (xi) Fidelity's resources and strategy for cybersecurity.
Based on its evaluation of all of the conclusions noted above, and after considering all factors it believed relevant, the Board concluded that the advisory fee structures are fair and reasonable, and that the fund's Advisory Contracts should be renewed.
Corporate Headquarters
245 Summer St.
Boston, MA 02210
www.fidelity.com
BCF-K-ANN-0916
1.863113.107
Fidelity Advisor® Small Cap Growth Fund - Class A, Class T, Class C and Class I
Annual Report July 31, 2016 Class A, Class T, Class C and Class I are classes of Fidelity® Small Cap Growth Fund |
|
Contents
To view a fund's proxy voting guidelines and proxy voting record for the 12-month period ended June 30, visit http://www.fidelity.com/proxyvotingresults or visit the Securities and Exchange Commission's (SEC) web site at http://www.sec.gov.
You may also call 1-877-208-0098 to request a free copy of the proxy voting guidelines.
Standard & Poor's, S&P and S&P 500 are registered service marks of The McGraw-Hill Companies, Inc. and have been licensed for use by Fidelity Distributors Corporation.
Other third-party marks appearing herein are the property of their respective owners.
All other marks appearing herein are registered or unregistered trademarks or service marks of FMR LLC or an affiliated company. © 2016 FMR LLC. All rights reserved.
This report and the financial statements contained herein are submitted for the general information of the shareholders of the Fund. This report is not authorized for distribution to prospective investors in the Fund unless preceded or accompanied by an effective prospectus.
A fund files its complete schedule of portfolio holdings with the SEC for the first and third quarters of each fiscal year on Form N-Q. Forms N-Q are available on the SEC’s web site at http://www.sec.gov. A fund's Forms N-Q may be reviewed and copied at the SEC’s Public Reference Room in Washington, DC. Information regarding the operation of the SEC's Public Reference Room may be obtained by calling 1-800-SEC-0330.
For a complete list of a fund's portfolio holdings, view the most recent holdings listing, semiannual report, or annual report on Fidelity's web site at http://www.fidelity.com, http://www.institutional.fidelity.com, or http://www.401k.com, as applicable.
NOT FDIC INSURED •MAY LOSE VALUE •NO BANK GUARANTEE
Neither the Fund nor Fidelity Distributors Corporation is a bank.
Performance: The Bottom Line
Average annual total return reflects the change in the value of an investment, assuming reinvestment of distributions from dividend income and capital gains (the profits earned upon the sale of securities that have grown in value, if any) and assuming a constant rate of performance each year. The hypothetical investment and the average annual total returns do not reflect the deduction of taxes that a shareholder would pay on fund distributions or the redemption of fund shares. During periods of reimbursement by Fidelity, a fund’s total return will be greater than it would be had the reimbursement not occurred. How a fund did yesterday is no guarantee of how it will do tomorrow.
Average Annual Total Returns
| For the periods ended July 31, 2016 | Past 1 year | Past 5 years | Past 10 years |
| Class A (incl. 5.75% sales charge) | (8.43)% | 10.09% | 8.29% |
| Class T (incl. 3.50% sales charge) | (6.53)% | 10.31% | 8.25% |
| Class C (incl. contingent deferred sales charge) | (4.57)% | 10.54% | 8.10% |
| Class I | (2.62)% | 11.72% | 9.27% |
Class C shares' contingent deferred sales charges included in the past one year, past five years and past ten years total return figures are 1%, 0% and 0%, respectively.
$10,000 Over 10 Years
Let's say hypothetically that $10,000 was invested in Fidelity Advisor® Small Cap Growth Fund - Class A on July 31, 2006, and the current 5.75% sales charge was paid.
The chart shows how the value of your investment would have changed, and also shows how the Russell 2000® Growth Index performed over the same period.
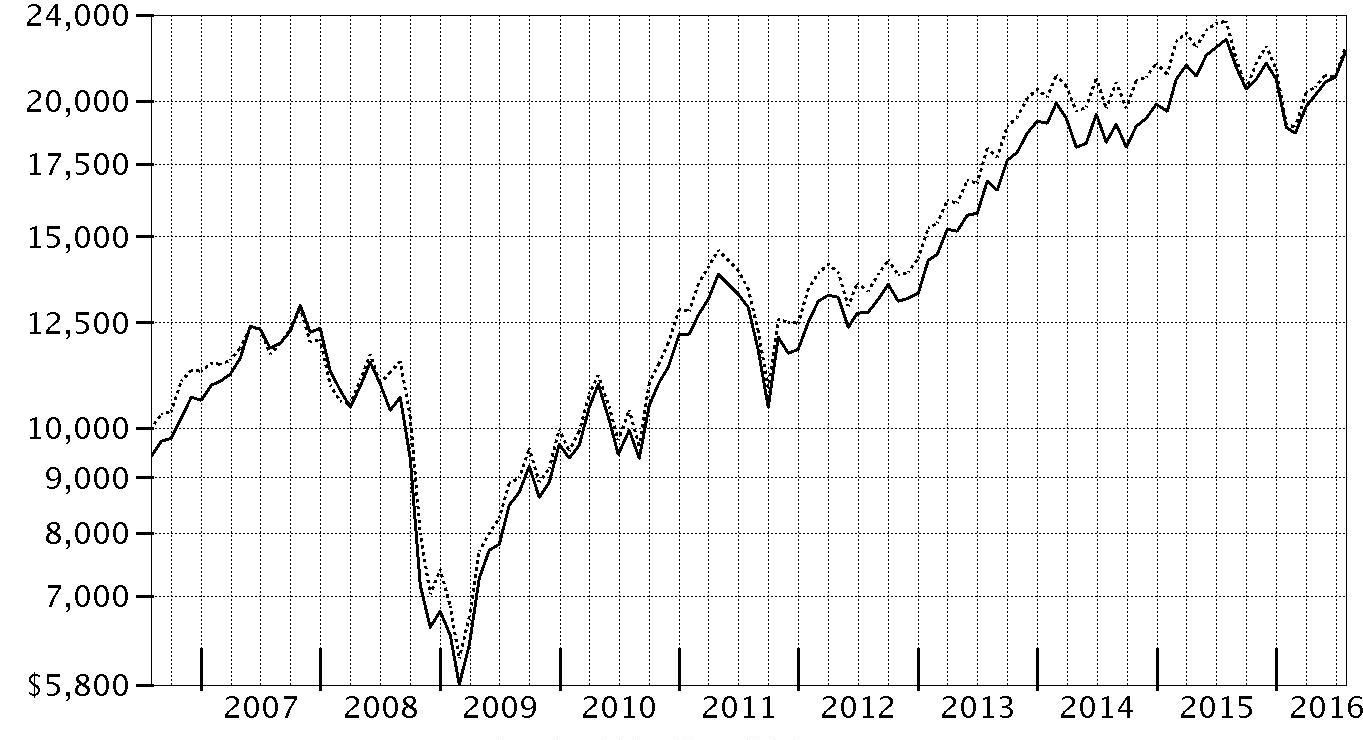
| Period Ending Values |
| $22,168 | Fidelity Advisor® Small Cap Growth Fund - Class A |
| $22,407 | Russell 2000® Growth Index |
Management's Discussion of Fund Performance
Market Recap: U.S. equities gained modestly for the year ending July 31, 2016, overcoming persistent concern about global economic growth, uncertainty regarding U.S. monetary policy and the U.K.’s late-June vote to leave the European Union, dubbed Brexit. The S&P 500 index rose 5.61%, with larger-cap, value-oriented stocks and defensive sectors shining brightest. Volatility peaked in the early weeks of 2016, as continued oil-price weakness and U.S.-dollar strength pushed the S&P 500
® to its worst January since 2009. Markets then rose beginning in February amid U.S. job gains, a broad rally in energy and materials markets, global economic stimulus and perceived softening of monetary policy by the U.S. Federal Reserve. The June 23 Brexit vote surprised markets and resulted in a sharp two-day decline for stocks, followed by a rebound as investor sentiment shifted and remained positive through July 31. For the year, dividend-rich telecom services (+26%), utilities (+23%) and consumer staples (+12%) led the way amid strong investor demand for yield. Industrials (+10%) and information technology (+10%) also outperformed, as did materials (+8%), despite a weak commodities environment overall. Conversely, a strong run for real estate stocks couldn’t keep financials (-4%) from losing ground, as low interest rates continued to squeeze bank profits.
Comments from Portfolio Manager Patrick Venanzi: For the year, the fund’s share classes (excluding sales charges, if applicable) outpaced the -5.30% return of the benchmark Russell 2000
® Growth Index. Strong stock selection drove the fund’s relative outperformance, with picks within the financials, consumer discretionary, industrials and health care sectors helping most. The fund's biggest individual contributor – and also its largest holding – was 2U, which provides cloud-based online campuses and learning platforms for nonprofit colleges and universities. Shares of 2U gained about 9% for the year. In April, the firm announced a 12-year extension on one of its contracts as well as new educational programs. Then, in June, the firm reported strong first-quarter financial results along with solid full-year 2016 guidance. A non-index stake in Global Payments, which offers solutions for credit and debit card transactions, gift cards, and other electronic forms of payment, also helped. We sold Global Payments from the fund by period end. Conversely, sector allocation overall proved a modest drag on relative results. Picks in telecommunication services also hurt. The fund’s biggest relative detractor was G-III Apparel Group, a sizable fund holding. G-III sells outerwear and other clothing under a portfolio of brands including Calvin Klein and Tommy Hilfiger. Sales of key outerwear products suffered due to the mild winter this year, which hurt the stock.
The views expressed above reflect those of the portfolio manager(s) only through the end of the period as stated on the cover of this report and do not necessarily represent the views of Fidelity or any other person in the Fidelity organization. Any such views are subject to change at any time based upon market or other conditions and Fidelity disclaims any responsibility to update such views. These views may not be relied on as investment advice and, because investment decisions for a Fidelity fund are based on numerous factors, may not be relied on as an indication of trading intent on behalf of any Fidelity fund.
Investment Summary (Unaudited)
Top Ten Stocks as of July 31, 2016
| | % of fund's net assets | % of fund's net assets 6 months ago |
| 2U, Inc. | 3.3 | 2.6 |
| NxStage Medical, Inc. | 2.5 | 1.7 |
| Cedar Fair LP (depositary unit) | 1.9 | 0.0 |
| Stamps.com, Inc. | 1.9 | 1.8 |
| Surgical Care Affiliates, Inc. | 1.8 | 1.7 |
| Cirrus Logic, Inc. | 1.5 | 1.0 |
| Store Capital Corp. | 1.4 | 1.1 |
| Integra LifeSciences Holdings Corp. | 1.4 | 0.5 |
| Bright Horizons Family Solutions, Inc. | 1.3 | 1.6 |
| RealPage, Inc. | 1.3 | 0.5 |
| | 18.3 | |
Top Five Market Sectors as of July 31, 2016
| | % of fund's net assets | % of fund's net assets 6 months ago |
| Information Technology | 27.7 | 23.7 |
| Health Care | 26.1 | 22.7 |
| Industrials | 15.3 | 11.9 |
| Consumer Discretionary | 12.3 | 15.7 |
| Financials | 8.1 | 10.0 |
Asset Allocation (% of fund's net assets)
| As of July 31, 2016* |
| | Stocks | 99.9% |
| | Short-Term Investments and Net Other Assets (Liabilities) | 0.1% |

* Foreign investments - 8.4%
| As of January 31, 2016* |
| | Stocks | 92.8% |
| | Other Investments | 2.1% |
| | Short-Term Investments and Net Other Assets (Liabilities) | 5.1% |

* Foreign investments - 5.6%
Percentages shown as 0.0% may reflect amounts less than 0.05%.
Investments July 31, 2016
Showing Percentage of Net Assets
| Common Stocks - 99.9% | | | |
| | | Shares | Value |
| CONSUMER DISCRETIONARY - 12.3% | | | |
| Auto Components - 0.7% | | | |
| Drew Industries, Inc. | | 100,000 | $9,161,000 |
| Visteon Corp. | | 89,100 | 6,245,019 |
| | | | 15,406,019 |
| Automobiles - 0.2% | | | |
| Thor Industries, Inc. | | 48,966 | 3,747,858 |
| Distributors - 1.5% | | | |
| LKQ Corp. (a) | | 400,000 | 13,756,000 |
| Pool Corp. | | 170,000 | 17,387,600 |
| | | | 31,143,600 |
| Diversified Consumer Services - 2.3% | | | |
| Bright Horizons Family Solutions, Inc. (a) | | 402,100 | 26,968,847 |
| Grand Canyon Education, Inc. (a) | | 229,800 | 9,665,388 |
| Service Corp. International | | 342,900 | 9,505,188 |
| | | | 46,139,423 |
| Hotels, Restaurants & Leisure - 3.9% | | | |
| Bojangles', Inc. (a) | | 2,000 | 34,760 |
| Cedar Fair LP (depositary unit) | | 668,129 | 39,553,237 |
| Dave & Buster's Entertainment, Inc. (a) | | 362,800 | 16,144,600 |
| Vail Resorts, Inc. | | 146,000 | 20,888,220 |
| Wingstop, Inc. (b) | | 158,900 | 4,131,400 |
| | | | 80,752,217 |
| Household Durables - 1.2% | | | |
| TopBuild Corp. (a) | | 330,000 | 12,460,800 |
| Universal Electronics, Inc. (a) | | 149,209 | 11,539,824 |
| | | | 24,000,624 |
| Leisure Products - 0.5% | | | |
| Malibu Boats, Inc. Class A (a) | | 279,036 | 3,806,051 |
| Vista Outdoor, Inc. (a) | | 120,000 | 6,006,000 |
| | | | 9,812,051 |
| Specialty Retail - 1.5% | | | |
| Burlington Stores, Inc. (a) | | 230,000 | 17,597,300 |
| Michaels Companies, Inc. (a) | | 250,000 | 6,590,000 |
| Winmark Corp. | | 72,357 | 7,276,943 |
| | | | 31,464,243 |
| Textiles, Apparel & Luxury Goods - 0.5% | | | |
| G-III Apparel Group Ltd. (a) | | 251,800 | 10,079,554 |
|
| TOTAL CONSUMER DISCRETIONARY | | | 252,545,589 |
|
| CONSUMER STAPLES - 4.6% | | | |
| Food & Staples Retailing - 1.5% | | | |
| Casey's General Stores, Inc. | | 105,900 | 14,141,886 |
| United Natural Foods, Inc. (a) | | 314,159 | 15,701,667 |
| | | | 29,843,553 |
| Food Products - 2.0% | | | |
| Darling International, Inc. (a) | | 1,189,300 | 18,767,154 |
| Post Holdings, Inc. (a) | | 120,000 | 10,400,400 |
| TreeHouse Foods, Inc. (a) | | 122,500 | 12,640,775 |
| | | | 41,808,329 |
| Household Products - 1.1% | | | |
| Central Garden & Pet Co. (a)(b) | | 300,000 | 7,278,000 |
| Central Garden & Pet Co. Class A (non-vtg.) (a) | | 300,000 | 6,837,000 |
| Spectrum Brands Holdings, Inc. | | 70,000 | 9,013,900 |
| | | | 23,128,900 |
|
| TOTAL CONSUMER STAPLES | | | 94,780,782 |
|
| ENERGY - 1.9% | | | |
| Energy Equipment & Services - 1.6% | | | |
| Dril-Quip, Inc. (a) | | 83,700 | 4,555,791 |
| Frank's International NV | | 400,000 | 4,928,000 |
| Oil States International, Inc. (a) | | 330,000 | 10,203,600 |
| Superior Drilling Products, Inc. (a) | | 602,986 | 1,006,987 |
| Tesco Corp. | | 722,960 | 4,778,766 |
| Transocean Partners LLC | | 494,705 | 5,402,179 |
| Xtreme Drilling & Coil Services Corp. (a) | | 1,289,000 | 2,379,267 |
| | | | 33,254,590 |
| Oil, Gas & Consumable Fuels - 0.3% | | | |
| StealthGas, Inc. (a) | | 1,414,187 | 5,034,506 |
|
| TOTAL ENERGY | | | 38,289,096 |
|
| FINANCIALS - 8.1% | | | |
| Diversified Financial Services - 1.9% | | | |
| Bats Global Markets, Inc. (b) | | 439,100 | 11,144,358 |
| Cotiviti Holdings, Inc. | | 400,000 | 9,656,000 |
| MSCI, Inc. Class A | | 220,000 | 18,928,800 |
| | | | 39,729,158 |
| Insurance - 2.1% | | | |
| First American Financial Corp. | | 573,000 | 23,957,130 |
| NIB Holdings Ltd. | | 2,500,000 | 8,796,421 |
| ProAssurance Corp. | | 190,000 | 9,815,400 |
| | | | 42,568,951 |
| Real Estate Investment Trusts - 2.5% | | | |
| Coresite Realty Corp. | | 260,000 | 21,457,800 |
| Store Capital Corp. | | 917,300 | 28,610,587 |
| | | | 50,068,387 |
| Thrifts & Mortgage Finance - 1.6% | | | |
| Essent Group Ltd. (a) | | 550,000 | 13,178,000 |
| Meridian Bancorp, Inc. | | 1,326,534 | 19,500,050 |
| | | | 32,678,050 |
|
| TOTAL FINANCIALS | | | 165,044,546 |
|
| HEALTH CARE - 26.1% | | | |
| Biotechnology - 6.4% | | | |
| Alder Biopharmaceuticals, Inc. (a) | | 330,000 | 10,593,000 |
| Amicus Therapeutics, Inc. (a)(b) | | 849,700 | 5,709,984 |
| Ascendis Pharma A/S sponsored ADR (a)(b) | | 365,183 | 5,258,635 |
| Blueprint Medicines Corp. (a)(b) | | 250,000 | 5,527,500 |
| Cellectis SA sponsored ADR (a) | | 129,100 | 3,404,367 |
| Coherus BioSciences, Inc. (a)(b) | | 306,750 | 7,788,383 |
| Curis, Inc. (a) | | 998,200 | 1,676,976 |
| DBV Technologies SA sponsored ADR (a) | | 154,188 | 5,334,905 |
| Dyax Corp. rights 12/31/19 (a) | | 380,400 | 916,764 |
| Dynavax Technologies Corp. (a)(b) | | 251,625 | 3,882,574 |
| Five Prime Therapeutics, Inc. (a) | | 138,100 | 7,000,289 |
| Heron Therapeutics, Inc. (a)(b) | | 262,200 | 4,357,764 |
| Intercept Pharmaceuticals, Inc. (a) | | 31,600 | 5,467,748 |
| La Jolla Pharmaceutical Co. (a) | | 152,622 | 2,594,574 |
| Ligand Pharmaceuticals, Inc. Class B (a) | | 80,000 | 10,790,400 |
| Lion Biotechnologies, Inc. (a) | | 581,930 | 5,144,261 |
| Macrogenics, Inc. (a) | | 280,000 | 8,565,200 |
| Mirati Therapeutics, Inc. (a)(b) | | 53,241 | 247,038 |
| Novavax, Inc. (a) | | 1,717,697 | 12,573,542 |
| Otonomy, Inc. (a) | | 438,029 | 6,290,096 |
| TESARO, Inc. (a) | | 109,200 | 10,181,808 |
| Ultragenyx Pharmaceutical, Inc. (a) | | 110,000 | 6,960,800 |
| | | | 130,266,608 |
| Health Care Equipment & Supplies - 8.4% | | | |
| Cantel Medical Corp. | | 123,096 | 8,241,277 |
| Cerus Corp. (a)(b) | | 1,040,617 | 7,690,160 |
| Cryolife, Inc. | | 283,565 | 4,131,542 |
| Hill-Rom Holdings, Inc. | | 344,000 | 18,379,920 |
| ICU Medical, Inc. (a) | | 102,500 | 11,967,900 |
| Insulet Corp. (a) | | 300,000 | 10,617,000 |
| Integra LifeSciences Holdings Corp. (a) | | 330,000 | 27,809,100 |
| Nevro Corp. (a)(b) | | 171,200 | 14,158,240 |
| NxStage Medical, Inc. (a) | | 2,330,732 | 51,532,485 |
| Wright Medical Group NV (a) | | 772,129 | 16,932,789 |
| | | | 171,460,413 |
| Health Care Providers & Services - 3.9% | | | |
| Amedisys, Inc. (a) | | 260,000 | 13,923,000 |
| LHC Group, Inc. (a) | | 40,684 | 1,841,358 |
| Patterson Companies, Inc. | | 200,000 | 9,872,000 |
| Surgical Care Affiliates, Inc. (a) | | 700,917 | 36,454,693 |
| VCA, Inc. (a) | | 266,500 | 19,012,110 |
| | | | 81,103,161 |
| Health Care Technology - 2.0% | | | |
| athenahealth, Inc. (a) | | 110,557 | 14,128,079 |
| Evolent Health, Inc. (a)(b) | | 300,000 | 7,062,000 |
| Press Ganey Holdings, Inc. (a)(b) | | 190,000 | 7,584,800 |
| Veeva Systems, Inc. Class A (a) | | 352,659 | 13,397,515 |
| | | | 42,172,394 |
| Life Sciences Tools & Services - 1.6% | | | |
| Bruker Corp. | | 271,500 | 6,765,780 |
| Cambrex Corp. (a) | | 250,000 | 13,102,500 |
| Charles River Laboratories International, Inc. (a) | | 140,000 | 12,310,200 |
| | | | 32,178,480 |
| Pharmaceuticals - 3.8% | | | |
| Catalent, Inc. (a) | | 896,600 | 22,899,164 |
| Collegium Pharmaceutical, Inc. (a)(b) | | 220,000 | 2,668,600 |
| GW Pharmaceuticals PLC ADR (a) | | 100,000 | 9,432,000 |
| Patheon NV | | 327,900 | 8,479,494 |
| Prestige Brands Holdings, Inc. (a) | | 304,175 | 16,273,363 |
| SCYNEXIS, Inc. (a) | | 931,989 | 1,882,618 |
| SCYNEXIS, Inc. warrants 6/21/21 (a) | | 168,750 | 109,920 |
| The Medicines Company (a) | | 200,000 | 7,822,000 |
| TherapeuticsMD, Inc. (a) | | 1,019,345 | 7,920,311 |
| | | | 77,487,470 |
|
| TOTAL HEALTH CARE | | | 534,668,526 |
|
| INDUSTRIALS - 15.3% | | | |
| Aerospace & Defense - 3.2% | | | |
| Aerojet Rocketdyne Holdings, Inc. (a) | | 917,491 | 17,303,880 |
| Astronics Corp. (a) | | 27,159 | 1,039,375 |
| BWX Technologies, Inc. | | 411,000 | 15,128,910 |
| Curtiss-Wright Corp. | | 180,000 | 16,018,200 |
| Huntington Ingalls Industries, Inc. | | 95,000 | 16,395,100 |
| | | | 65,885,465 |
| Building Products - 1.5% | | | |
| A.O. Smith Corp. | | 72,000 | 6,688,080 |
| Gibraltar Industries, Inc. (a) | | 564,811 | 19,926,532 |
| Universal Forest Products, Inc. | | 40,000 | 4,324,800 |
| | | | 30,939,412 |
| Commercial Services & Supplies - 2.9% | | | |
| Deluxe Corp. | | 244,039 | 16,494,596 |
| KAR Auction Services, Inc. | | 335,000 | 14,327,950 |
| Knoll, Inc. | | 558,400 | 14,099,600 |
| Matthews International Corp. Class A | | 240,018 | 14,427,482 |
| | | | 59,349,628 |
| Construction & Engineering - 1.2% | | | |
| Dycom Industries, Inc. (a) | | 140,000 | 13,167,000 |
| Granite Construction, Inc. | | 225,000 | 11,200,500 |
| | | | 24,367,500 |
| Electrical Equipment - 1.5% | | | |
| AZZ, Inc. | | 269,991 | 16,761,041 |
| Regal Beloit Corp. | | 217,387 | 13,262,781 |
| | | | 30,023,822 |
| Machinery - 3.0% | | | |
| Allison Transmission Holdings, Inc. | | 484,118 | 13,952,281 |
| Hillenbrand, Inc. | | 110,099 | 3,561,703 |
| John Bean Technologies Corp. | | 265,741 | 17,783,388 |
| Rexnord Corp. (a) | | 192,797 | 4,104,648 |
| Xylem, Inc. | | 470,000 | 22,470,700 |
| | | | 61,872,720 |
| Professional Services - 0.6% | | | |
| CBIZ, Inc. (a) | | 796,100 | 8,605,841 |
| GP Strategies Corp. (a) | | 200,557 | 4,203,675 |
| | | | 12,809,516 |
| Road & Rail - 1.4% | | | |
| Landstar System, Inc. | | 100,000 | 7,049,000 |
| Swift Transporation Co. (a) | | 1,130,000 | 21,752,500 |
| | | | 28,801,500 |
|
| TOTAL INDUSTRIALS | | | 314,049,563 |
|
| INFORMATION TECHNOLOGY - 27.7% | | | |
| Communications Equipment - 1.1% | | | |
| InterDigital, Inc. | | 361,339 | 21,337,068 |
| Electronic Equipment & Components - 3.5% | | | |
| Cardtronics PLC | | 140,883 | 6,197,443 |
| CDW Corp. | | 320,000 | 13,737,600 |
| Coherent, Inc. (a) | | 94,396 | 10,010,696 |
| Fabrinet (a) | | 430,000 | 16,236,800 |
| Jabil Circuit, Inc. | | 438,330 | 8,920,016 |
| Orbotech Ltd. (a) | | 550,000 | 15,691,500 |
| | | | 70,794,055 |
| Internet Software & Services - 7.7% | | | |
| 2U, Inc. (a)(b) | | 1,920,117 | 67,165,690 |
| Benefitfocus, Inc. (a)(b) | | 58,972 | 2,535,796 |
| Cimpress NV (a)(b) | | 125,000 | 11,850,000 |
| Cornerstone OnDemand, Inc. (a) | | 200,000 | 8,638,000 |
| GoDaddy, Inc. (a) | | 730,000 | 21,841,600 |
| Instructure, Inc. (a)(b) | | 334,277 | 7,267,182 |
| Stamps.com, Inc. (a)(b) | | 512,896 | 38,880,081 |
| | | | 158,178,349 |
| IT Services - 5.3% | | | |
| Black Knight Financial Services, Inc. Class A (a) | | 175,000 | 6,798,750 |
| Broadridge Financial Solutions, Inc. | | 200,100 | 13,542,768 |
| Convergys Corp. | | 440,000 | 11,726,000 |
| Euronet Worldwide, Inc. (a) | | 125,000 | 9,532,500 |
| ExlService Holdings, Inc. (a) | | 299,977 | 14,851,861 |
| Gartner, Inc. Class A (a) | | 88,496 | 8,871,724 |
| Genpact Ltd. (a) | | 560,000 | 14,991,200 |
| Perficient, Inc. (a) | | 795,500 | 17,676,010 |
| Planet Payment, Inc. (a) | | 1,500,000 | 7,035,000 |
| WNS Holdings Ltd. sponsored ADR (a) | | 136,262 | 3,824,874 |
| | | | 108,850,687 |
| Semiconductors & Semiconductor Equipment - 2.5% | | | |
| Cirrus Logic, Inc. (a) | | 621,532 | 30,200,240 |
| Entegris, Inc. (a) | | 350,000 | 5,981,500 |
| Monolithic Power Systems, Inc. | | 150,000 | 10,908,000 |
| Silicon Motion Technology Corp. sponsored ADR | | 94,252 | 4,872,828 |
| | | | 51,962,568 |
| Software - 7.6% | | | |
| Blackbaud, Inc. | | 230,410 | 15,402,909 |
| Cadence Design Systems, Inc. (a) | | 796,200 | 19,148,610 |
| Digimarc Corp. (a)(b) | | 72,829 | 2,651,704 |
| Ellie Mae, Inc. (a) | | 155,000 | 14,277,050 |
| Fair Isaac Corp. | | 95,000 | 12,030,800 |
| HubSpot, Inc. (a) | | 448,115 | 24,462,598 |
| Interactive Intelligence Group, Inc. (a) | | 280,930 | 15,156,174 |
| Paycom Software, Inc. (a) | | 290,000 | 13,690,900 |
| RealPage, Inc. (a) | | 1,026,000 | 25,803,900 |
| RingCentral, Inc. (a) | | 300,000 | 6,909,000 |
| Ultimate Software Group, Inc. (a) | | 30,000 | 6,273,000 |
| | | | 155,806,645 |
|
| TOTAL INFORMATION TECHNOLOGY | | | 566,929,372 |
|
| MATERIALS - 2.7% | | | |
| Chemicals - 0.5% | | | |
| Codexis, Inc. (a) | | 683,761 | 2,974,360 |
| Innospec, Inc. | | 149,895 | 7,535,222 |
| | | | 10,509,582 |
| Containers & Packaging - 1.5% | | | |
| Aptargroup, Inc. | | 101,876 | 7,964,666 |
| Berry Plastics Group, Inc. (a) | | 150,000 | 6,150,000 |
| Graphic Packaging Holding Co. | | 1,220,200 | 16,643,528 |
| | | | 30,758,194 |
| Paper & Forest Products - 0.7% | | | |
| Boise Cascade Co. (a) | | 357,000 | 9,699,690 |
| TFS Corp. Ltd. (b) | | 3,693,636 | 4,575,375 |
| | | | 14,275,065 |
|
| TOTAL MATERIALS | | | 55,542,841 |
|
| TELECOMMUNICATION SERVICES - 1.2% | | | |
| Diversified Telecommunication Services - 1.2% | | | |
| 8x8, Inc. (a) | | 850,195 | 11,690,181 |
| Cogent Communications Group, Inc. | | 300,000 | 12,819,000 |
| | | | 24,509,181 |
| TOTAL COMMON STOCKS | | | |
| (Cost $1,780,140,728) | | | 2,046,359,496 |
|
| Money Market Funds - 6.9% | | | |
| Fidelity Cash Central Fund, 0.42% (c) | | 36,661,637 | 36,661,637 |
| Fidelity Securities Lending Cash Central Fund, 0.45% (c)(d) | | 104,549,711 | 104,549,711 |
| TOTAL MONEY MARKET FUNDS | | | |
| (Cost $141,211,348) | | | 141,211,348 |
| TOTAL INVESTMENT PORTFOLIO - 106.8% | | | |
| (Cost $1,921,352,076) | | | 2,187,570,844 |
| NET OTHER ASSETS (LIABILITIES) - (6.8)% | | | (139,444,663) |
| NET ASSETS - 100% | | | $2,048,126,181 |
Legend
(a) Non-income producing
(b) Security or a portion of the security is on loan at period end.
(c) Affiliated fund that is generally available only to investment companies and other accounts managed by Fidelity Investments. The rate quoted is the annualized seven-day yield of the fund at period end. A complete unaudited listing of the fund's holdings as of its most recent quarter end is available upon request. In addition, each Fidelity Central Fund's financial statements, which are not covered by the Fund's Report of Independent Registered Public Accounting Firm, are available on the SEC's website or upon request.
(d) Investment made with cash collateral received from securities on loan.
Affiliated Central Funds
Information regarding fiscal year to date income earned by the Fund from investments in Fidelity Central Funds is as follows:
| Fund | Income earned |
| Fidelity Cash Central Fund | $155,066 |
| Fidelity Securities Lending Cash Central Fund | 2,218,595 |
| Total | $2,373,661 |
Other Affiliated Issuers
An affiliated company is a company in which the Fund has ownership of at least 5% of the voting securities. Fiscal year to date transactions with companies which are or were affiliates are as follows:
| Affiliate | Value, beginning of period | Purchases | Sales Proceeds | Dividend Income | Value, end of period |
| 2U, Inc. | $40,893,251 | $38,591,529 | $26,809,567 | $-- | $-- |
| Mattersight Corp. | 12,150,086 | -- | 7,020,182 | -- | -- |
| Superior Drilling Products, Inc. | 1,928,281 | -- | 855,680 | -- | -- |
| Total | $54,971,618 | $38,591,529 | $34,685,429 | $-- | $-- |
Investment Valuation
The following is a summary of the inputs used, as of July 31, 2016, involving the Fund's assets and liabilities carried at fair value. The inputs or methodology used for valuing securities may not be an indication of the risk associated with investing in those securities. For more information on valuation inputs, and their aggregation into the levels used below, please refer to the Investment Valuation section in the accompanying Notes to Financial Statements.
| | Valuation Inputs at Reporting Date: |
| Description | Total | Level 1 | Level 2 | Level 3 |
| Investments in Securities: | | | | |
| Equities: | | | | |
| Consumer Discretionary | $252,545,589 | $252,545,589 | $-- | $-- |
| Consumer Staples | 94,780,782 | 94,780,782 | -- | -- |
| Energy | 38,289,096 | 38,289,096 | -- | -- |
| Financials | 165,044,546 | 165,044,546 | -- | -- |
| Health Care | 534,668,526 | 533,641,842 | 109,920 | 916,764 |
| Industrials | 314,049,563 | 314,049,563 | -- | -- |
| Information Technology | 566,929,372 | 566,929,372 | -- | -- |
| Materials | 55,542,841 | 55,542,841 | -- | -- |
| Telecommunication Services | 24,509,181 | 24,509,181 | -- | -- |
| Money Market Funds | 141,211,348 | 141,211,348 | -- | -- |
| Total Investments in Securities: | $2,187,570,844 | $2,186,544,160 | $109,920 | $916,764 |
See accompanying notes which are an integral part of the financial statements.
Financial Statements
Statement of Assets and Liabilities
| | | July 31, 2016 |
| Assets | | |
Investment in securities, at value (including securities loaned of $101,860,380) — See accompanying schedule:
Unaffiliated issuers (cost $1,780,140,728) | $2,046,359,496 | |
| Fidelity Central Funds (cost $141,211,348) | 141,211,348 | |
| Total Investments (cost $1,921,352,076) | | $2,187,570,844 |
| Cash | | 48,842 |
| Receivable for investments sold | | 9,064,031 |
| Receivable for fund shares sold | | 2,311,477 |
| Dividends receivable | | 132,380 |
| Distributions receivable from Fidelity Central Funds | | 62,679 |
| Other receivables | | 128,432 |
| Total assets | | 2,199,318,685 |
| Liabilities | | |
| Payable for investments purchased | $42,182,264 | |
| Payable for fund shares redeemed | 2,471,327 | |
| Accrued management fee | 1,387,575 | |
| Distribution and service plan fees payable | 118,277 | |
| Other affiliated payables | 418,845 | |
| Other payables and accrued expenses | 64,505 | |
| Collateral on securities loaned, at value | 104,549,711 | |
| Total liabilities | | 151,192,504 |
| Net Assets | | $2,048,126,181 |
| Net Assets consist of: | | |
| Paid in capital | | $1,832,090,966 |
| Accumulated net investment loss | | (5,012,549) |
| Accumulated undistributed net realized gain (loss) on investments and foreign currency transactions | | (45,170,877) |
| Net unrealized appreciation (depreciation) on investments and assets and liabilities in foreign currencies | | 266,218,641 |
| Net Assets | | $2,048,126,181 |
| Calculation of Maximum Offering Price | | |
| Class A: | | |
| Net Asset Value and redemption price per share ($176,988,140 ÷ 9,232,663 shares) | | $19.17 |
| Maximum offering price per share (100/94.25 of $19.17) | | $20.34 |
| Class T: | | |
| Net Asset Value and redemption price per share ($53,446,960 ÷ 2,859,040 shares) | | $18.69 |
| Maximum offering price per share (100/96.50 of $18.69) | | $19.37 |
| Class C: | | |
| Net Asset Value and offering price per share ($73,731,103 ÷ 4,208,520 shares)(a) | | $17.52 |
| Small Cap Growth: | | |
| Net Asset Value, offering price and redemption price per share ($1,580,264,122 ÷ 79,739,516 shares) | | $19.82 |
| Class I: | | |
| Net Asset Value, offering price and redemption price per share ($163,695,856 ÷ 8,241,362 shares) | | $19.86 |
(a) Redemption price per share is equal to net asset value less any applicable contingent deferred sales charge.
See accompanying notes which are an integral part of the financial statements.
Statement of Operations
| | | Year ended July 31, 2016 |
| Investment Income | | |
| Dividends | | $11,959,790 |
| Interest | | 15 |
| Income from Fidelity Central Funds (including $2,218,595 from security lending) | | 2,373,661 |
| Total income | | 14,333,466 |
| Expenses | | |
| Management fee | | |
| Basic fee | $12,923,135 | |
| Performance adjustment | 2,431,100 | |
| Transfer agent fees | 4,466,925 | |
| Distribution and service plan fees | 1,272,678 | |
| Accounting and security lending fees | 594,395 | |
| Custodian fees and expenses | 62,491 | |
| Independent trustees' fees and expenses | 7,965 | |
| Registration fees | 198,607 | |
| Audit | 62,978 | |
| Legal | 9,443 | |
| Interest | 1,381 | |
| Miscellaneous | 12,316 | |
| Total expenses before reductions | 22,043,414 | |
| Expense reductions | (315,109) | 21,728,305 |
| Net investment income (loss) | | (7,394,839) |
| Realized and Unrealized Gain (Loss) | | |
| Net realized gain (loss) on: | | |
| Investment securities: | | |
| Unaffiliated issuers | (35,795,308) | |
| Other affiliated issuers | (4,513,687) | |
| Foreign currency transactions | 15,036 | |
| Total net realized gain (loss) | | (40,293,959) |
Change in net unrealized appreciation (depreciation) on:
Investment securities | 18,827,749 | |
| Assets and liabilities in foreign currencies | 12,812 | |
| Total change in net unrealized appreciation (depreciation) | | 18,840,561 |
| Net gain (loss) | | (21,453,398) |
| Net increase (decrease) in net assets resulting from operations | | $(28,848,237) |
See accompanying notes which are an integral part of the financial statements.
Statement of Changes in Net Assets
| | Year ended July 31, 2016 | Year ended July 31, 2015 |
| Increase (Decrease) in Net Assets | | |
| Operations | | |
| Net investment income (loss) | $(7,394,839) | $(5,784,041) |
| Net realized gain (loss) | (40,293,959) | 108,754,619 |
| Change in net unrealized appreciation (depreciation) | 18,840,561 | 166,432,213 |
| Net increase (decrease) in net assets resulting from operations | (28,848,237) | 269,402,791 |
| Distributions to shareholders from net realized gain | (71,394,910) | (103,188,484) |
| Share transactions - net increase (decrease) | 469,934,632 | 214,155,809 |
| Redemption fees | 788,555 | 177,411 |
| Total increase (decrease) in net assets | 370,480,040 | 380,547,527 |
| Net Assets | | |
| Beginning of period | 1,677,646,141 | 1,297,098,614 |
| End of period | $2,048,126,181 | $1,677,646,141 |
| Other Information | | |
| Accumulated net investment loss end of period | $(5,012,549) | $– |
See accompanying notes which are an integral part of the financial statements.
Financial Highlights — Fidelity Small Cap Growth Fund Class A
| Years ended July 31, | 2016 | 2015 | 2014 | 2013 | 2012 |
| Selected Per–Share Data | | | | | |
| Net asset value, beginning of period | $20.55 | $17.99 | $19.66 | $15.87 | $16.42 |
| Income from Investment Operations | | | | | |
| Net investment income (loss)A | (.10) | (.13) | (.12) | (.04) | (.07)B |
| Net realized and unrealized gain (loss) | (.51) | 4.23 | 1.69 | 4.87 | (.16) |
| Total from investment operations | (.61) | 4.10 | 1.57 | 4.83 | (.23) |
| Distributions from net realized gain | (.78) | (1.54) | (3.24) | (1.04) | (.32) |
| Redemption fees added to paid in capitalA | .01 | –C | –C | –C | –C |
| Net asset value, end of period | $19.17 | $20.55 | $17.99 | $19.66 | $15.87 |
| Total ReturnD,E | (2.85)% | 24.46% | 8.58% | 32.20% | (1.14)% |
| Ratios to Average Net AssetsF,G | | | | | |
| Expenses before reductions | 1.37% | 1.21% | 1.22% | 1.24% | 1.35% |
| Expenses net of fee waivers, if any | 1.37% | 1.21% | 1.22% | 1.24% | 1.35% |
| Expenses net of all reductions | 1.36% | 1.20% | 1.22% | 1.22% | 1.34% |
| Net investment income (loss) | (.58)% | (.67)% | (.62)% | (.26)% | (.49)%B |
| Supplemental Data | | | | | |
| Net assets, end of period (000 omitted) | $176,988 | $123,370 | $88,822 | $74,978 | $59,684 |
| Portfolio turnover rateH | 143% | 156% | 148%I | 142% | 150% |
A Calculated based on average shares outstanding during the period.
B Net Investment income per share reflects a large, non-recurring dividend which amounted to $.01 per share. Excluding this non-recurring dividend, the ratio of net investment income (loss) to average net assets would have been (.57) %.
C Amount represents less than $.005 per share.
D Total returns would have been lower if certain expenses had not been reduced during the applicable periods shown.
E Total returns do not include the effect of the sales charges.
F Fees and expenses of any underlying Fidelity Central Funds are not included in the Fund's expense ratio. The Fund indirectly bears its proportionate share of the expenses of any underlying Fidelity Central Funds.
G Expense ratios reflect operating expenses of the class. Expenses before reductions do not reflect amounts reimbursed by the investment adviser or reductions from brokerage service arrangements or reductions from other expense offset arrangements and do not represent the amount paid by the class during periods when reimbursements or reductions occur. Expenses net of fee waivers reflect expenses after reimbursement by the investment adviser but prior to reductions from brokerage service arrangements or other expense offset arrangements. Expenses net of all reductions represent the net expenses paid by the class.
H Amount does not include the portfolio activity of any underlying Fidelity Central Funds.
I Portfolio turnover rate excludes securities received or delivered in-kind.
See accompanying notes which are an integral part of the financial statements.
Financial Highlights — Fidelity Small Cap Growth Fund Class T
| Years ended July 31, | 2016 | 2015 | 2014 | 2013 | 2012 |
| Selected Per–Share Data | | | | | |
| Net asset value, beginning of period | $20.08 | $17.66 | $19.38 | $15.68 | $16.27 |
| Income from Investment Operations | | | | | |
| Net investment income (loss)A | (.15) | (.17) | (.16) | (.09) | (.11)B |
| Net realized and unrealized gain (loss) | (.50) | 4.13 | 1.66 | 4.82 | (.16) |
| Total from investment operations | (.65) | 3.96 | 1.50 | 4.73 | (.27) |
| Distributions from net realized gain | (.75) | (1.54) | (3.22) | (1.03) | (.32) |
| Redemption fees added to paid in capitalA | .01 | –C | –C | –C | –C |
| Net asset value, end of period | $18.69 | $20.08 | $17.66 | $19.38 | $15.68 |
| Total ReturnD,E | (3.14)% | 24.10% | 8.30% | 31.87% | (1.41)% |
| Ratios to Average Net AssetsF,G | | | | | |
| Expenses before reductions | 1.66% | 1.49% | 1.50% | 1.49% | 1.61% |
| Expenses net of fee waivers, if any | 1.66% | 1.48% | 1.50% | 1.49% | 1.61% |
| Expenses net of all reductions | 1.64% | 1.47% | 1.49% | 1.48% | 1.60% |
| Net investment income (loss) | (.87)% | (.95)% | (.90)% | (.52)% | (.74)%B |
| Supplemental Data | | | | | |
| Net assets, end of period (000 omitted) | $53,447 | $52,667 | $42,586 | $34,686 | $27,658 |
| Portfolio turnover rateH | 143% | 156% | 148%I | 142% | 150% |
A Calculated based on average shares outstanding during the period.
B Net Investment income per share reflects a large, non-recurring dividend which amounted to $.01 per share. Excluding this non-recurring dividend, the ratio of net investment income (loss) to average net assets would have been (.83) %.
C Amount represents less than $.005 per share.
D Total returns would have been lower if certain expenses had not been reduced during the applicable periods shown.
E Total returns do not include the effect of the sales charges.
F Fees and expenses of any underlying Fidelity Central Funds are not included in the Fund's expense ratio. The Fund indirectly bears its proportionate share of the expenses of any underlying Fidelity Central Funds.
G Expense ratios reflect operating expenses of the class. Expenses before reductions do not reflect amounts reimbursed by the investment adviser or reductions from brokerage service arrangements or reductions from other expense offset arrangements and do not represent the amount paid by the class during periods when reimbursements or reductions occur. Expenses net of fee waivers reflect expenses after reimbursement by the investment adviser but prior to reductions from brokerage service arrangements or other expense offset arrangements. Expenses net of all reductions represent the net expenses paid by the class.
H Amount does not include the portfolio activity of any underlying Fidelity Central Funds.
I Portfolio turnover rate excludes securities received or delivered in-kind.
See accompanying notes which are an integral part of the financial statements.
Financial Highlights — Fidelity Small Cap Growth Fund Class C
| Years ended July 31, | 2016 | 2015 | 2014 | 2013 | 2012 |
| Selected Per–Share Data | | | | | |
| Net asset value, beginning of period | $18.90 | $16.78 | $18.62 | $15.16 | $15.83 |
| Income from Investment Operations | | | | | |
| Net investment income (loss)A | (.22) | (.25) | (.25) | (.16) | (.18)B |
| Net realized and unrealized gain (loss) | (.48) | 3.91 | 1.59 | 4.64 | (.17) |
| Total from investment operations | (.70) | 3.66 | 1.34 | 4.48 | (.35) |
| Distributions from net realized gain | (.69) | (1.54) | (3.18) | (1.02) | (.32) |
| Redemption fees added to paid in capitalA | .01 | –C | –C | –C | –C |
| Net asset value, end of period | $17.52 | $18.90 | $16.78 | $18.62 | $15.16 |
| Total ReturnD,E | (3.64)% | 23.53% | 7.70% | 31.32% | (1.96)% |
| Ratios to Average Net AssetsF,G | | | | | |
| Expenses before reductions | 2.16% | 2.00% | 2.01% | 1.99% | 2.10% |
| Expenses net of fee waivers, if any | 2.16% | 2.00% | 2.00% | 1.99% | 2.10% |
| Expenses net of all reductions | 2.14% | 1.99% | 2.00% | 1.97% | 2.09% |
| Net investment income (loss) | (1.37)% | (1.46)% | (1.41)% | (1.01)% | (1.24)%B |
| Supplemental Data | | | | | |
| Net assets, end of period (000 omitted) | $73,731 | $55,671 | $42,215 | $32,756 | $24,683 |
| Portfolio turnover rateH | 143% | 156% | 148%I | 142% | 150% |
A Calculated based on average shares outstanding during the period.
B Net Investment income per share reflects a large, non-recurring dividend which amounted to $.01 per share. Excluding this non-recurring dividend, the ratio of net investment income (loss) to average net assets would have been (1.32) %.
C Amount represents less than $.005 per share.
D Total returns would have been lower if certain expenses had not been reduced during the applicable periods shown.
E Total returns do not include the effect of the contingent deferred sales charge.
F Fees and expenses of any underlying Fidelity Central Funds are not included in the Fund's expense ratio. The Fund indirectly bears its proportionate share of the expenses of any underlying Fidelity Central Funds.
G Expense ratios reflect operating expenses of the class. Expenses before reductions do not reflect amounts reimbursed by the investment adviser or reductions from brokerage service arrangements or reductions from other expense offset arrangements and do not represent the amount paid by the class during periods when reimbursements or reductions occur. Expenses net of fee waivers reflect expenses after reimbursement by the investment adviser but prior to reductions from brokerage service arrangements or other expense offset arrangements. Expenses net of all reductions represent the net expenses paid by the class.
H Amount does not include the portfolio activity of any underlying Fidelity Central Funds.
I Portfolio turnover rate excludes securities received or delivered in-kind.
See accompanying notes which are an integral part of the financial statements.
Financial Highlights — Fidelity Small Cap Growth Fund
| Years ended July 31, | 2016 | 2015 | 2014 | 2013 | 2012 |
| Selected Per–Share Data | | | | | |
| Net asset value, beginning of period | $21.20 | $18.45 | $20.07 | $16.14 | $16.65 |
| Income from Investment Operations | | | | | |
| Net investment income (loss)A | (.06) | (.07) | (.06) | .01 | (.03)B |
| Net realized and unrealized gain (loss) | (.52) | 4.36 | 1.71 | 4.98 | (.16) |
| Total from investment operations | (.58) | 4.29 | 1.65 | 4.99 | (.19) |
| Distributions from net realized gain | (.81) | (1.54) | (3.27) | (1.06) | (.32) |
| Redemption fees added to paid in capitalA | .01 | –C | –C | –C | –C |
| Net asset value, end of period | $19.82 | $21.20 | $18.45 | $20.07 | $16.14 |
| Total ReturnD | (2.63)% | 24.91% | 8.87% | 32.74% | (.88)% |
| Ratios to Average Net AssetsE,F | | | | | |
| Expenses before reductions | 1.12% | .91% | .91% | .90% | 1.03% |
| Expenses net of fee waivers, if any | 1.12% | .91% | .90% | .90% | 1.03% |
| Expenses net of all reductions | 1.11% | .90% | .90% | .88% | 1.02% |
| Net investment income (loss) | (.33)% | (.37)% | (.31)% | .08% | (.16)%B |
| Supplemental Data | | | | | |
| Net assets, end of period (000 omitted) | $1,580,264 | $1,345,684 | $1,069,105 | $1,315,659 | $1,166,101 |
| Portfolio turnover rateG | 143% | 156% | 148%H | 142% | 150% |
A Calculated based on average shares outstanding during the period.
B Net Investment income per share reflects a large, non-recurring dividend which amounted to $.01 per share. Excluding this non-recurring dividend, the ratio of net investment income (loss) to average net assets would have been (.25) %.
C Amount represents less than $.005 per share.
D Total returns would have been lower if certain expenses had not been reduced during the applicable periods shown.
E Fees and expenses of any underlying Fidelity Central Funds are not included in the Fund's expense ratio. The Fund indirectly bears its proportionate share of the expenses of any underlying Fidelity Central Funds.
F Expense ratios reflect operating expenses of the class. Expenses before reductions do not reflect amounts reimbursed by the investment adviser or reductions from brokerage service arrangements or reductions from other expense offset arrangements and do not represent the amount paid by the class during periods when reimbursements or reductions occur. Expenses net of fee waivers reflect expenses after reimbursement by the investment adviser but prior to reductions from brokerage service arrangements or other expense offset arrangements. Expenses net of all reductions represent the net expenses paid by the class.
G Amount does not include the portfolio activity of any underlying Fidelity Central Funds.
H Portfolio turnover rate excludes securities received or delivered in-kind.
See accompanying notes which are an integral part of the financial statements.
Financial Highlights — Fidelity Small Cap Growth Fund Class I
| Years ended July 31, | 2016 | 2015 | 2014 | 2013 | 2012 |
| Selected Per–Share Data | | | | | |
| Net asset value, beginning of period | $21.24 | $18.49 | $20.10 | $16.17 | $16.68 |
| Income from Investment Operations | | | | | |
| Net investment income (loss)A | (.05) | (.07) | (.06) | .01 | (.03)B |
| Net realized and unrealized gain (loss) | (.53) | 4.36 | 1.72 | 4.98 | (.16) |
| Total from investment operations | (.58) | 4.29 | 1.66 | 4.99 | (.19) |
| Distributions from net realized gain | (.81) | (1.54) | (3.27) | (1.06) | (.32) |
| Redemption fees added to paid in capitalA | .01 | –C | –C | –C | –C |
| Net asset value, end of period | $19.86 | $21.24 | $18.49 | $20.10 | $16.17 |
| Total ReturnD | (2.62)% | 24.85% | 8.89% | 32.65% | (.88)% |
| Ratios to Average Net AssetsE,F | | | | | |
| Expenses before reductions | 1.09% | .93% | .92% | .92% | 1.06% |
| Expenses net of fee waivers, if any | 1.09% | .93% | .92% | .92% | 1.06% |
| Expenses net of all reductions | 1.07% | .91% | .92% | .91% | 1.05% |
| Net investment income (loss) | (.30)% | (.39)% | (.32)% | .06% | (.19)%B |
| Supplemental Data | | | | | |
| Net assets, end of period (000 omitted) | $163,696 | $97,897 | $51,607 | $51,158 | $36,694 |
| Portfolio turnover rateG | 143% | 156% | 148%H | 142% | 150% |
A Calculated based on average shares outstanding during the period.
B Net Investment income per share reflects a large, non-recurring dividend which amounted to $.01 per share. Excluding this non-recurring dividend, the ratio of net investment income (loss) to average net assets would have been (.28) %.
C Amount represents less than $.005 per share.
D Total returns would have been lower if certain expenses had not been reduced during the applicable periods shown.
E Fees and expenses of any underlying Fidelity Central Funds are not included in the Fund's expense ratio. The Fund indirectly bears its proportionate share of the expenses of any underlying Fidelity Central Funds.
F Expense ratios reflect operating expenses of the class. Expenses before reductions do not reflect amounts reimbursed by the investment adviser or reductions from brokerage service arrangements or reductions from other expense offset arrangements and do not represent the amount paid by the class during periods when reimbursements or reductions occur. Expenses net of fee waivers reflect expenses after reimbursement by the investment adviser but prior to reductions from brokerage service arrangements or other expense offset arrangements. Expenses net of all reductions represent the net expenses paid by the class.
G Amount does not include the portfolio activity of any underlying Fidelity Central Funds.
H Portfolio turnover rate excludes securities received or delivered in-kind.
See accompanying notes which are an integral part of the financial statements.
Notes to Financial Statements
For the period ended July 31, 2016
1. Organization.
Fidelity Small Cap Growth Fund (the Fund) is a fund of Fidelity Securities Fund (the Trust) and is authorized to issue an unlimited number of shares. The Trust is registered under the Investment Company Act of 1940, as amended (the 1940 Act), as an open-end management investment company organized as a Massachusetts business trust. The Fund offers Class A, Class T, Class C, Small Cap Growth and Class I shares, each of which has equal rights as to assets and voting privileges. Each class has exclusive voting rights with respect to matters that affect that class.
After the close of business on June 24, 2016, all outstanding Class B shares were converted to Class A shares. All current fiscal period dollar and share amounts for Class B presented in the Notes to Financial Statements are for the period August 1, 2015 through June 24, 2016.
2. Investments in Fidelity Central Funds.
The Fund invests in Fidelity Central Funds, which are open-end investment companies generally available only to other investment companies and accounts managed by the investment adviser and its affiliates. The Fund's Schedule of Investments lists each of the Fidelity Central Funds held as of period end, if any, as an investment of the Fund, but does not include the underlying holdings of each Fidelity Central Fund. As an Investing Fund, the Fund indirectly bears its proportionate share of the expenses of the underlying Fidelity Central Funds.
The Money Market Central Funds seek preservation of capital and current income and are managed by Fidelity Investments Money Management, Inc. (FIMM), an affiliate of the investment adviser. Annualized expenses of the Money Market Central Funds as of their most recent shareholder report date are less than .005%.
A complete unaudited list of holdings for each Fidelity Central Fund is available upon request or at the Securities and Exchange Commission (the SEC) website at www.sec.gov. In addition, the financial statements of the Fidelity Central Funds, which are not covered by the Fund's Report of Independent Registered Public Accounting Firm, are available on the SEC website or upon request.
3. Significant Accounting Policies.
The financial statements have been prepared in conformity with accounting principles generally accepted in the United States of America (GAAP), which require management to make certain estimates and assumptions at the date of the financial statements. Actual results could differ from those estimates. Subsequent events, if any, through the date that the financial statements were issued have been evaluated in the preparation of the financial statements. The following summarizes the significant accounting policies of the Fund:
Investment Valuation. Investments are valued as of 4:00 p.m. Eastern time on the last calendar day of the period. The Board of Trustees (the Board) has delegated the day to day responsibility for the valuation of the Fund's investments to the Fidelity Management & Research Company (FMR) Fair Value Committee (the Committee). In accordance with valuation policies and procedures approved by the Board, the Fund attempts to obtain prices from one or more third party pricing vendors or brokers to value its investments. When current market prices, quotations or currency exchange rates are not readily available or reliable, investments will be fair valued in good faith by the Committee, in accordance with procedures adopted by the Board. Factors used in determining fair value vary by investment type and may include market or investment specific events. The frequency with which these procedures are used cannot be predicted and they may be utilized to a significant extent. The Committee oversees the Fund's valuation policies and procedures and reports to the Board on the Committee's activities and fair value determinations. The Board monitors the appropriateness of the procedures used in valuing the Fund's investments and ratifies the fair value determinations of the Committee.
The Fund categorizes the inputs to valuation techniques used to value its investments into a disclosure hierarchy consisting of three levels as shown below:
- Level 1 – quoted prices in active markets for identical investments
- Level 2 – other significant observable inputs (including quoted prices for similar investments, interest rates, prepayment speeds, etc.)
- Level 3 – unobservable inputs (including the Fund's own assumptions based on the best information available)
Valuation techniques used to value the Fund's investments by major category are as follows:
Equity securities, including restricted securities, for which market quotations are readily available, are valued at the last reported sale price or official closing price as reported by a third party pricing vendor on the primary market or exchange on which they are traded and are categorized as Level 1 in the hierarchy. In the event there were no sales during the day or closing prices are not available, securities are valued at the last quoted bid price or may be valued using the last available price and are generally categorized as Level 2 in the hierarchy. For foreign equity securities, when market or security specific events arise, comparisons to the valuation of American Depositary Receipts (ADRs), futures contracts, Exchange-Traded Funds (ETFs) and certain indexes as well as quoted prices for similar securities may be used and would be categorized as Level 2 in the hierarchy. Utilizing these techniques may result in transfers between Level 1 and Level 2. For equity securities, including restricted securities, where observable inputs are limited, assumptions about market activity and risk are used and these securities may be categorized as Level 3 in the hierarchy.
Investments in open-end mutual funds, including the Fidelity Central Funds, are valued at their closing net asset value (NAV) each business day and are categorized as Level 1 in the hierarchy.
Changes in valuation techniques may result in transfers in or out of an assigned level within the disclosure hierarchy. The aggregate value of investments by input level as of July 31, 2016 is included at the end of the Fund's Schedule of Investments.
Foreign Currency. The Fund may use foreign currency contracts to facilitate transactions in foreign-denominated securities. Gains and losses from these transactions may arise from changes in the value of the foreign currency or if the counterparties do not perform under the contracts' terms.
Foreign-denominated assets, including investment securities, and liabilities are translated into U.S. dollars at the exchange rates at period end. Purchases and sales of investment securities, income and dividends received and expenses denominated in foreign currencies are translated into U.S. dollars at the exchange rate in effect on the transaction date.
The effects of exchange rate fluctuations on investments are included with the net realized and unrealized gain (loss) on investment securities. Other foreign currency transactions resulting in realized and unrealized gain (loss) are disclosed separately.
Investment Transactions and Income. For financial reporting purposes, the Fund's investment holdings and NAV include trades executed through the end of the last business day of the period. The NAV per share for processing shareholder transactions is calculated as of the close of business of the New York Stock Exchange (NYSE), normally 4:00 p.m. Eastern time and includes trades executed through the end of the prior business day. Gains and losses on securities sold are determined on the basis of identified cost and may include proceeds received from litigation. Dividend income is recorded on the ex-dividend date, except for certain dividends from foreign securities where the ex-dividend date may have passed, which are recorded as soon as the Fund is informed of the ex-dividend date. Non-cash dividends included in dividend income, if any, are recorded at the fair market value of the securities received. Income and capital gain distributions from Fidelity Central Funds, if any, are recorded on the ex-dividend date. Distributions received on securities that represent a return of capital or capital gain are recorded as a reduction of cost of investments and/or as a realized gain. Subsequent to ex-dividend date the Fund determines the components of these distributions, based upon receipt of tax filings or other correspondence relating to the underlying investment. Interest income is accrued as earned and includes coupon interest and amortization of premium and accretion of discount on debt securities as applicable. Investment income is recorded net of foreign taxes withheld where recovery of such taxes is uncertain.
Class Allocations and Expenses. Investment income, realized and unrealized capital gains and losses, common expenses of the Fund, and certain fund-level expense reductions, if any, are allocated daily on a pro-rata basis to each class based on the relative net assets of each class to the total net assets of the Fund. Each class differs with respect to transfer agent and distribution and service plan fees incurred. Certain expense reductions may also differ by class. For the reporting period, the allocated portion of income and expenses to each class as a percent of its average net assets may vary due to the timing of recording these transactions in relation to fluctuating net assets of the classes. Expenses directly attributable to a fund are charged to that fund. Expenses attributable to more than one fund are allocated among the respective funds on the basis of relative net assets or other appropriate methods. Expense estimates are accrued in the period to which they relate and adjustments are made when actual amounts are known.
Income Tax Information and Distributions to Shareholders. Each year, the Fund intends to qualify as a regulated investment company under Subchapter M of the Internal Revenue Code, including distributing substantially all of its taxable income and realized gains. As a result, no provision for U.S. Federal income taxes is required. As of July 31, 2016, the Fund did not have any unrecognized tax benefits in the financial statements; nor is the Fund aware of any tax positions for which it is reasonably possible that the total amounts of unrecognized tax benefits will significantly change in the next twelve months. The Fund files a U.S. federal tax return, in addition to state and local tax returns as required. The Fund's federal income tax returns are subject to examination by the Internal Revenue Service (IRS) for a period of three fiscal years after they are filed. State and local tax returns may be subject to examination for an additional fiscal year depending on the jurisdiction. Foreign taxes are provided for based on the Fund's understanding of the tax rules and rates that exist in the foreign markets in which it invests.
Distributions are declared and recorded on the ex-dividend date. Income dividends and capital gain distributions are declared separately for each class. Income and capital gain distributions are determined in accordance with income tax regulations, which may differ from GAAP. In addition, the Fund claimed a portion of the payment made to redeeming shareholders as a distribution for income tax purposes.
Capital accounts within the financial statements are adjusted for permanent book-tax differences. These adjustments have no impact on net assets or the results of operations. Capital accounts are not adjusted for temporary book-tax differences which will reverse in a subsequent period.
Book-tax differences are primarily due to foreign currency transactions, partnerships and losses deferred due to wash sales and excise tax regulations.
The federal tax cost of investment securities and unrealized appreciation (depreciation) as of period end were as follows:
| Gross unrealized appreciation | $323,442,627 |
| Gross unrealized depreciation | (64,359,779) |
| Net unrealized appreciation (depreciation) on securities | $259,082,848 |
| Tax Cost | $1,928,487,996 |
The tax-based components of distributable earnings as of period end were as follows:
| Net unrealized appreciation (depreciation) on securities and other investments | $259,082,721 |
The Fund intends to elect to defer to its next fiscal year $38,034,956 of capital losses recognized during the period November 1, 2015 to July 31, 2016.
The Fund intends to elect to defer to the next fiscal year $5,012,550 of ordinary losses recognized during the period January 1, 2016 to July 31, 2016.
The tax character of distributions paid was as follows:
| | July 31, 2016 | July 31, 2015 |
| Ordinary Income | $18,282,031 | $– |
| Long-term Capital Gains | 53,112,879 | 103,188,484 |
| Total | $71,394,910 | $ 103,188,484 |
Short-Term Trading (Redemption) Fees. Shares held by investors in the Fund less than 90 days may have been subject to a redemption fee equal to 1.50% of the NAV of shares redeemed. All redemption fees, which reduce the proceeds of the shareholder redemption, are retained by the Fund and accounted for as an addition to paid in capital.
4. Purchases and Sales of Investments.
Purchases and sales of securities, other than short-term securities, aggregated $3,025,347,978 and $2,587,110,351, respectively.
5. Fees and Other Transactions with Affiliates.
Management Fee. Fidelity Management & Research Company (the investment adviser) and its affiliates provide the Fund with investment management related services for which the Fund pays a monthly management fee. The management fee is the sum of an individual fund fee rate that is based on an annual rate of .45% of the Fund's average net assets and an annualized group fee rate that averaged .25% during the period. The group fee rate is based upon the average net assets of all the mutual funds advised by the investment adviser, including any mutual funds previously advised by the investment adviser that are currently advised by Fidelity SelectCo, LLC, an affiliate of the investment adviser. The group fee rate decreases as assets under management increase and increases as assets under management decrease. In addition, the management fee is subject to a performance adjustment (up to a maximum of +/- .20% of the Fund's average net assets over a 36 month performance period). The upward or downward adjustment to the management fee is based on the relative investment performance of Small Cap Growth as compared to its benchmark index, the Russell 2000 Growth Index, over the same 36 month performance period. For the reporting period, the total annual management fee rate, including the performance adjustment, was .83% of the Fund's average net assets. The performance adjustment included in the management fee rate may be higher or lower than the maximum performance adjustment rate due to the difference between the average net assets for the reporting and performance periods.
Distribution and Service Plan Fees. In accordance with Rule 12b-1 of the 1940 Act, the Fund has adopted separate Distribution and Service Plans for each class of shares. Certain classes pay Fidelity Distributors Corporation (FDC), an affiliate of the investment adviser, separate Distribution and Service Fees, each of which is based on an annual percentage of each class' average net assets. In addition, FDC may pay financial intermediaries for selling shares of the Fund and providing shareholder support services. For the period, the Distribution and Service Fee rates, total fees and amounts retained by FDC were as follows:
| | Distribution
Fee | Service
Fee | Total Fees | Retained
by FDC |
| Class A | -% | .25% | $370,740 | $1,666 |
| Class T | .25% | .25% | 251,412 | – |
| Class B | .75% | .25% | 14,315 | 10,736 |
| Class C | .75% | .25% | 636,211 | 208,802 |
| | | | $1,272,678 | $ 221,204 |
Sales Load. FDC may receive a front-end sales charge of up to 5.75% for selling Class A shares and 3.50% for selling Class T shares, some of which is paid to financial intermediaries for selling shares of the Fund. Depending on the holding period, FDC may receive contingent deferred sales charges levied on Class A, Class T, Class B, and Class C redemptions. The deferred sales charges range from 5.00% to 1.00% for Class B shares, 1.00% for Class C shares, 1.00% for certain purchases of Class A shares and .25% for certain purchases of Class T shares.
For the period, sales charge amounts retained by FDC were as follows:
| | Retained
by FDC |
| Class A | $121,279 |
| Class T | 14,995 |
| Class B(a) | 196 |
| Class C(a) | 12,653 |
| | $149,123 |
(a) When Class B and Class C shares are initially sold, FDC pays commissions from its own resources to financial intermediaries through which the sales are made.
Transfer Agent Fees. Fidelity Investments Institutional Operations Company, Inc., (FIIOC), an affiliate of the investment adviser, is the transfer, dividend disbursing and shareholder servicing agent for each class of the Fund. FIIOC receives account fees and asset-based fees that vary according to the account size and type of account of the shareholders of the respective classes of the Fund. FIIOC pays for typesetting, printing and mailing of shareholder reports, except proxy statements.
For the period, transfer agent fees for each class were as follows:
| | Amount | % of
Class-Level Average
Net Assets |
| Class A | $359,572 | .24 |
| Class T | 139,267 | .28 |
| Class B | 4,108 | .29 |
| Class C | 175,377 | .28 |
| Small Cap Growth | 3,516,816 | .24 |
| Class I | 271,785 | .21 |
| | $4,466,925 | |
Accounting and Security Lending Fees. Fidelity Service Company, Inc. (FSC), an affiliate of the investment adviser, maintains the Fund's accounting records. The accounting fee is based on the level of average net assets for each month. Under a separate contract, FSC administers the security lending program. The security lending fee is based on the number and duration of lending transactions.
Brokerage Commissions. The Fund placed a portion of its portfolio transactions with brokerage firms which are affiliates of the investment adviser. Brokerage commissions are included in net realized gain (loss) and change in net unrealized appreciation (depreciation) in the Statement of Operations. The commissions paid to these affiliated firms were $100,376 for the period.
Interfund Lending Program. Pursuant to an Exemptive Order issued by the SEC, the Fund, along with other registered investment companies having management contracts with FMR or other affiliated entities of FMR, may participate in an interfund lending program. This program provides an alternative credit facility allowing the funds to borrow from, or lend money to, other participating affiliated funds. At period end, there were no interfund loans outstanding. The Fund's activity in this program during the period for which loans were outstanding was as follows:
| Borrower or Lender | Average Loan Balance | Weighted Average Interest Rate | Interest Expense |
| Borrower | $17,354,600 | .57% | $1,381 |
Interfund Trades. The Fund may purchase from or sell securities to other Fidelity Funds under procedures adopted by the Board. The procedures have been designed to ensure these interfund trades are executed in accordance with Rule 17a-7 of the 1940 Act. Interfund trades are included within the respective purchases and sales amounts shown in the Purchases and Sales of Investments note.
6. Committed Line of Credit.
The Fund participates with other funds managed by the investment adviser or an affiliate in a $4.25 billion credit facility (the "line of credit") to be utilized for temporary or emergency purposes to fund shareholder redemptions or for other short-term liquidity purposes. The Fund has agreed to pay commitment fees on its pro-rata portion of the line of credit, which amounted to $3,792 and is reflected in Miscellaneous expenses on the Statement of Operations. During the period, the Fund did not borrow on this line of credit.
7. Security Lending.
The Fund lends portfolio securities through a lending agent from time to time in order to earn additional income. For equity securities, a lending agent is used and may loan securities to certain qualified borrowers, including Fidelity Capital Markets (FCM), a broker-dealer affiliated with the Fund. On the settlement date of the loan, the Fund receives collateral (in the form of U.S. Treasury obligations, letters of credit and/or cash) against the loaned securities and maintains collateral in an amount not less than 100% of the market value of the loaned securities during the period of the loan. The market value of the loaned securities is determined at the close of business of the Fund and any additional required collateral is delivered to the Fund on the next business day. The Fund or borrower may terminate the loan at any time, and if the borrower defaults on its obligation to return the securities loaned because of insolvency or other reasons, the Fund may apply collateral received from the borrower against the obligation. The Fund may experience delays and costs in recovering the securities loaned. Any cash collateral received is invested in the Fidelity Securities Lending Cash Central Fund. The value of loaned securities and cash collateral at period end are disclosed on the Fund's Statement of Assets and Liabilities. The value of securities loaned to FCM at period end was $1,583,400. Security lending income represents the income earned on investing cash collateral, less rebates paid to borrowers and any lending agent fees associated with the loan, plus any premium payments received for lending certain types of securities. Security lending income is presented in the Statement of Operations as a component of income from Fidelity Central Funds, and includes $239,599 from securities loaned to FCM.
8. Expense Reductions.
Commissions paid to certain brokers with whom the investment adviser, or its affiliates, places trades on behalf of the Fund include an amount in addition to trade execution, which may be rebated back to the Fund to offset certain expenses. This amount totaled $300,569 for the period. In addition, through arrangements with the Fund's custodian, credits realized as a result of certain uninvested cash balances were used to reduce the Fund's expenses. During the period, these credits reduced the Fund's custody expenses by $642.
In addition, during the period the investment adviser reimbursed and/or waived a portion of fund-level operating expenses in the amount of $13,898.
9. Distributions to Shareholders.
Distributions to shareholders of each class were as follows:
| | Year ended
July 31, 2016 | Year ended July 31, 2015 |
| From net realized gain | | |
| Class A | $5,181,395 | $7,463,655 |
| Class T | 2,020,848 | 3,715,268 |
| Class B | 78,117 | 242,938 |
| Class C | 2,268,668 | 3,707,592 |
| Small Cap Growth | 57,632,579 | 83,762,458 |
| Class I | 4,213,303 | 4,296,573 |
| Total | $71,394,910 | $103,188,484 |
10. Share Transactions.
Share transactions for each class were as follows and may contain automatic conversions between classes or exchanges between affiliated funds:
| | Shares | Shares | Dollars | Dollars |
| | Year ended
July 31, 2016 | Year ended July 31, 2015 | Year ended
July 31, 2016 | Year ended July 31, 2015 |
| Class A | | | | |
| Shares sold | 6,059,144 | 2,167,593 | $108,304,433 | $41,925,439 |
| Reinvestment of distributions | 264,882 | 412,446 | 5,002,119 | 7,203,479 |
| Shares redeemed | (3,093,782) | (1,515,208) | (54,332,348) | (27,623,856) |
| Net increase (decrease) | 3,230,244 | 1,064,831 | $58,974,204 | $21,505,062 |
| Class T | | | | |
| Shares sold | 1,018,603 | 659,898 | $17,852,650 | $12,282,234 |
| Reinvestment of distributions | 107,630 | 211,200 | 1,987,314 | 3,613,802 |
| Shares redeemed | (889,426) | (660,724) | (15,500,757) | (11,765,139) |
| Net increase (decrease) | 236,807 | 210,374 | $4,339,207 | $4,130,897 |
| Class B | | | | |
| Shares sold | 7,282 | 11,802 | $117,958 | $209,809 |
| Reinvestment of distributions | 4,376 | 14,482 | 76,516 | 235,501 |
| Shares redeemed | (135,765) | (66,110) | (2,219,722) | (1,127,352) |
| Net increase (decrease) | (124,107) | (39,826) | $(2,025,248) | $(682,042) |
| Class C | | | | |
| Shares sold | 2,069,867 | 992,298 | $34,466,250 | $17,729,436 |
| Reinvestment of distributions | 125,336 | 216,825 | 2,178,654 | 3,508,500 |
| Shares redeemed | (932,892) | (778,826) | (14,941,204) | (13,034,787) |
| Net increase (decrease) | 1,262,311 | 430,297 | $21,703,700 | $8,203,149 |
| Small Cap Growth | | | | |
| Shares sold | 42,088,501 | 23,816,242 | $782,706,842 | $475,203,336 |
| Reinvestment of distributions | 2,848,706 | 4,527,816 | 55,506,569 | 81,276,349 |
| Shares redeemed | (28,683,713) | (22,793,867) | (518,831,831) | (412,013,233) |
| Net increase (decrease) | 16,253,494 | 5,550,191 | $319,381,580 | $144,466,452 |
| Class I | | | | |
| Shares sold | 7,438,237 | 2,387,318 | $136,356,812 | $47,676,724 |
| Reinvestment of distributions | 199,940 | 220,272 | 3,903,639 | 3,963,647 |
| Shares redeemed | (4,006,778) | (789,017) | (72,699,262) | (15,108,080) |
| Net increase (decrease) | 3,631,399 | 1,818,573 | $67,561,189 | $36,532,291 |
11. Other.
The Fund's organizational documents provide former and current trustees and officers with a limited indemnification against liabilities arising in connection with the performance of their duties to the Fund. In the normal course of business, the Fund may also enter into contracts that provide general indemnifications. The Fund's maximum exposure under these arrangements is unknown as this would be dependent on future claims that may be made against the Fund. The risk of material loss from such claims is considered remote.
Report of Independent Registered Public Accounting Firm
To the Trustees of Fidelity Securities Fund and Shareholders of Fidelity Small Cap Growth Fund:
In our opinion, the accompanying statement of assets and liabilities, including the schedule of investments, and the related statements of operations and of changes in net assets and the financial highlights present fairly, in all material respects, the financial position of Fidelity Small Cap Growth Fund (a fund of Fidelity Securities Fund) at July 31, 2016, the results of its operations for the year then ended, the changes in its net assets for each of the two years in the period then ended and the financial highlights for each of the five years in the period then ended, in conformity with accounting principles generally accepted in the United States of America. These financial statements and financial highlights (hereafter referred to as “financial statements”) are the responsibility of the Fidelity Small Cap Growth Fund’s management. Our responsibility is to express an opinion on these financial statements based on our audits. We conducted our audits of these financial statements in accordance with the standards of the Public Company Accounting Oversight Board (United States). Those standards require that we plan and perform the audit to obtain reasonable assurance about whether the financial statements are free of material misstatement. An audit includes examining, on a test basis, evidence supporting the amounts and disclosures in the financial statements, assessing the accounting principles used and significant estimates made by management, and evaluating the overall financial statement presentation. We believe that our audits, which included confirmation of securities at July 31, 2016 by correspondence with the custodian and brokers, provide a reasonable basis for our opinion.
PricewaterhouseCoopers LLP
Boston, Massachusetts
September 16, 2016
Trustees and Officers
The Trustees, Members of the Advisory Board (if any), and officers of the trust and fund, as applicable, are listed below. The Board of Trustees governs the fund and is responsible for protecting the interests of shareholders. The Trustees are experienced executives who meet periodically throughout the year to oversee the fund's activities, review contractual arrangements with companies that provide services to the fund, oversee management of the risks associated with such activities and contractual arrangements, and review the fund's performance. Each of the Trustees oversees 170 funds.
The Trustees hold office without limit in time except that (a) any Trustee may resign; (b) any Trustee may be removed by written instrument, signed by at least two-thirds of the number of Trustees prior to such removal; (c) any Trustee who requests to be retired or who has become incapacitated by illness or injury may be retired by written instrument signed by a majority of the other Trustees; and (d) any Trustee may be removed at any special meeting of shareholders by a two-thirds vote of the outstanding voting securities of the trust. Each Trustee who is not an interested person (as defined in the 1940 Act) of the trust and the fund is referred to herein as an Independent Trustee. Each Independent Trustee shall retire not later than the last day of the calendar year in which his or her 75th birthday occurs. The Independent Trustees may waive this mandatory retirement age policy with respect to individual Trustees. Officers and Advisory Board Members hold office without limit in time, except that any officer or Advisory Board Member may resign or may be removed by a vote of a majority of the Trustees at any regular meeting or any special meeting of the Trustees. Except as indicated, each individual has held the office shown or other offices in the same company for the past five years.
The fund’s Statement of Additional Information (SAI) includes more information about the Trustees. To request a free copy, call Fidelity at 1-877-208-0098.
Experience, Skills, Attributes, and Qualifications of the Trustees. The Governance and Nominating Committee has adopted a statement of policy that describes the experience, qualifications, attributes, and skills that are necessary and desirable for potential Independent Trustee candidates (Statement of Policy). The Board believes that each Trustee satisfied at the time he or she was initially elected or appointed a Trustee, and continues to satisfy, the standards contemplated by the Statement of Policy. The Governance and Nominating Committee also engages professional search firms to help identify potential Independent Trustee candidates who have the experience, qualifications, attributes, and skills consistent with the Statement of Policy. From time to time, additional criteria based on the composition and skills of the current Independent Trustees, as well as experience or skills that may be appropriate in light of future changes to board composition, business conditions, and regulatory or other developments, have also been considered by the professional search firms and the Governance and Nominating Committee. In addition, the Board takes into account the Trustees' commitment and participation in Board and committee meetings, as well as their leadership of standing and ad hoc committees throughout their tenure.
In determining that a particular Trustee was and continues to be qualified to serve as a Trustee, the Board has considered a variety of criteria, none of which, in isolation, was controlling. The Board believes that, collectively, the Trustees have balanced and diverse experience, qualifications, attributes, and skills, which allow the Board to operate effectively in governing the fund and protecting the interests of shareholders. Information about the specific experience, skills, attributes, and qualifications of each Trustee, which in each case led to the Board's conclusion that the Trustee should serve (or continue to serve) as a trustee of the fund, is provided below.
Board Structure and Oversight Function. James C. Curvey is an interested person and currently serves as Chairman. The Trustees have determined that an interested Chairman is appropriate and benefits shareholders because an interested Chairman has a personal and professional stake in the quality and continuity of services provided to the fund. Independent Trustees exercise their informed business judgment to appoint an individual of their choosing to serve as Chairman, regardless of whether the Trustee happens to be independent or a member of management. The Independent Trustees have determined that they can act independently and effectively without having an Independent Trustee serve as Chairman and that a key structural component for assuring that they are in a position to do so is for the Independent Trustees to constitute a substantial majority for the Board. The Independent Trustees also regularly meet in executive session. Ned C. Lautenbach serves as Chairman of the Independent Trustees and as such (i) acts as a liaison between the Independent Trustees and management with respect to matters important to the Independent Trustees and (ii) with management prepares agendas for Board meetings.
Fidelity® funds are overseen by different Boards of Trustees. The fund's Board oversees Fidelity's high income and certain equity funds, and other Boards oversee Fidelity's investment-grade bond, money market, asset allocation, and sector funds. The asset allocation funds may invest in Fidelity® funds overseen by the fund's Board. The use of separate Boards, each with its own committee structure, allows the Trustees of each group of Fidelity® funds to focus on the unique issues of the funds they oversee, including common research, investment, and operational issues. On occasion, the separate Boards establish joint committees to address issues of overlapping consequences for the Fidelity® funds overseen by each Board.
The Trustees operate using a system of committees to facilitate the timely and efficient consideration of all matters of importance to the Trustees, the fund, and fund shareholders and to facilitate compliance with legal and regulatory requirements and oversight of the fund's activities and associated risks. The Board, acting through its committees, has charged FMR and its affiliates with (i) identifying events or circumstances the occurrence of which could have demonstrably adverse effects on the fund's business and/or reputation; (ii) implementing processes and controls to lessen the possibility that such events or circumstances occur or to mitigate the effects of such events or circumstances if they do occur; and (iii) creating and maintaining a system designed to evaluate continuously business and market conditions in order to facilitate the identification and implementation processes described in (i) and (ii) above. Because the day-to-day operations and activities of the fund are carried out by or through FMR, its affiliates, and other service providers, the fund's exposure to risks is mitigated but not eliminated by the processes overseen by the Trustees. While each of the Board's committees has responsibility for overseeing different aspects of the fund's activities, oversight is exercised primarily through the Operations, Audit, and Compliance Committees. In addition, the Independent Trustees have worked with FMR to enhance the Board's oversight of investment and financial risks, legal and regulatory risks, technology risks, and operational risks, including the development of additional risk reporting to the Board. For example, a working group comprised of Independent Trustees and FMR has worked and continues to work to review the Fidelity® funds' valuation-related activities, reporting and risk management. Appropriate personnel, including but not limited to the fund's Chief Compliance Officer (CCO), FMR's internal auditor, the independent accountants, the fund's Treasurer and portfolio management personnel, make periodic reports to the Board's committees, as appropriate, including an annual review of Fidelity's risk management program for the Fidelity® funds. The responsibilities of each standing committee, including their oversight responsibilities, are described further under "Standing Committees of the Trustees."
Interested Trustees*:
Correspondence intended for a Trustee who is an interested person may be sent to Fidelity Investments, 245 Summer Street, Boston, Massachusetts 02210.
Name, Year of Birth; Principal Occupations and Other Relevant Experience+
James C. Curvey (1935)
Year of Election or Appointment: 2007
Trustee
Chairman of the Board of Trustees
Mr. Curvey also serves as Trustee of other Fidelity® funds. Mr. Curvey is a Director of Fidelity Research & Analysis Co. (investment adviser firm, 2009-present), and Vice Chairman (2007-present) and Director of FMR LLC (diversified financial services company). In addition, Mr. Curvey serves as an Overseer for the Boston Symphony Orchestra and a member of the board of Artis-Naples, Naples, Florida, and as a Trustee for Brewster Academy, Wolfeboro, New Hampshire. Previously, Mr. Curvey served as a Director of Fidelity Investments Money Management, Inc. (investment adviser firm, 2009-2014) and a Director of FMR and FMR Co., Inc. (investment adviser firms, 2007-2014).
Charles S. Morrison (1960)
Year of Election or Appointment: 2014
Trustee
Mr. Morrison also serves as Trustee of other funds. He serves as a Director of Fidelity Investments Money Management, Inc. (FIMM) (investment adviser firm, 2014-present), Director of Fidelity SelectCo, LLC (investment adviser firm, 2014-present), President, Asset Management (2014-present), and is an employee of Fidelity Investments. Previously, Mr. Morrison served as Vice President of Fidelity's Fixed Income and Asset Allocation Funds (2012-2014), President, Fixed Income (2011-2014), Vice President of Fidelity's Money Market Funds (2005-2009), President, Money Market Group Leader of FMR (investment adviser firm, 2009), and Senior Vice President, Money Market Group of FMR (2004-2009). Mr. Morrison also served as Vice President of Fidelity's Bond Funds (2002-2005), certain Balanced Funds (2002-2005), and certain Asset Allocation Funds (2002-2007), and as Senior Vice President (2002-2005) of Fidelity's Bond Division.
* Determined to be an “Interested Trustee” by virtue of, among other things, his or her affiliation with the trust or various entities under common control with FMR.
+ The information includes the Trustee's principal occupation during the last five years and other information relating to the experience, attributes, and skills relevant to the Trustee's qualifications to serve as a Trustee, which led to the conclusion that the Trustee should serve as a Trustee for the fund.
Independent Trustees:
Correspondence intended for an Independent Trustee may be sent to Fidelity Investments, P.O. Box 55235, Boston, Massachusetts 02205-5235.
Name, Year of Birth; Principal Occupations and Other Relevant Experience+
Dennis J. Dirks (1948)
Year of Election or Appointment: 2005
Trustee
Mr. Dirks also serves as Trustee of other Fidelity® funds. Prior to his retirement in May 2003, Mr. Dirks was Chief Operating Officer and a member of the Board of The Depository Trust & Clearing Corporation (DTCC). He also served as President, Chief Operating Officer, and Board member of The Depository Trust Company (DTC) and President and Board member of the National Securities Clearing Corporation (NSCC). In addition, Mr. Dirks served as Chief Executive Officer and Board member of the Government Securities Clearing Corporation, Chief Executive Officer and Board member of the Mortgage-Backed Securities Clearing Corporation, as a Trustee and a member of the Finance Committee of Manhattan College (2005-2008), as a Trustee and a member of the Finance Committee of AHRC of Nassau County (2006-2008), and as a member of the Independent Directors Council (IDC) Governing Council (2010-2015). Mr. Dirks is a member of the Board of Directors for The Brookville Center for Children's Services, Inc. (2009-present).
Alan J. Lacy (1953)
Year of Election or Appointment: 2008
Trustee
Mr. Lacy also serves as Trustee of other Fidelity® funds. Mr. Lacy serves as Chairman (2014-present) and a member (2010-present) of the Board of Directors of Dave & Buster's Entertainment, Inc. (restaurant and entertainment complexes) and a Director of Bristol-Myers Squibb Company (global pharmaceuticals, 2008-present). He is a Trustee of the California Chapter of The Nature Conservancy (2015-present) and a Director of the Center for Advanced Study in the Behavioral Sciences at Stanford University (2015-present). In addition, Mr. Lacy served as Senior Adviser (2007-2014) of Oak Hill Capital Partners, L.P. (private equity) and also served as Chief Executive Officer (2005) and Vice Chairman (2005-2006) of Sears Holdings Corporation (retail) and Chief Executive Officer and Chairman of the Board of Sears, Roebuck and Co. (retail, 2000-2005). Previously, Mr. Lacy served as Chairman (2008-2011) and a member (2006-2015) of the Board of Trustees of the National Parks Conservation Association and as a member of the Board of Directors for The Western Union Company (global money transfer, 2006-2011), The Hillman Companies, Inc. (hardware wholesalers, 2010-2014), and Earth Fare, Inc. (retail grocery, 2010-2014).
Ned C. Lautenbach (1944)
Year of Election or Appointment: 2000
Trustee
Chairman of the Independent Trustees
Mr. Lautenbach also serves as Trustee of other Fidelity® funds. Mr. Lautenbach currently serves as the Lead Director of the Eaton Corporation Board of Directors (diversified industrial, 1997-present). Mr. Lautenbach is Chairman of the Board of Directors of Artis-Naples in Naples, Florida (2012-present), a member of the Council on Foreign Relations (1994-present), and a member of the Board of Governors, State University System of Florida (2013-present). Previously, Mr. Lautenbach was a Partner/Advisory Partner at Clayton, Dubilier & Rice, LLC (private equity investment, 1998-2010), as well as a Director of Sony Corporation (2006-2007).
Joseph Mauriello (1944)
Year of Election or Appointment: 2008
Trustee
Mr. Mauriello also serves as Trustee of other Fidelity® funds. Prior to his retirement in January 2006, Mr. Mauriello served in numerous senior management positions including Deputy Chairman and Chief Operating Officer (2004-2005), and Vice Chairman of Financial Services (2002-2004) of KPMG LLP US (professional services, 1965-2005). Mr. Mauriello currently serves as a member of the Board of Directors of XL Group plc. (global insurance and re-insurance, 2006-present) and the Independent Directors Council (IDC) Governing Council (2015-present). Previously, Mr. Mauriello served as a Director of the Hamilton Funds of the Bank of New York (2006-2007) and of Arcadia Resources Inc. (health care services and products, 2007-2012).
Robert W. Selander (1950)
Year of Election or Appointment: 2011
Trustee
Mr. Selander also serves as Trustee of other Fidelity® funds. Mr. Selander serves as a Director of The Western Union Company (global money transfer, 2014-present) and a non-executive Chairman of Health Equity, Inc. (health savings custodian, 2015-present). Previously, Mr. Selander served as a Member of the Advisory Board of certain Fidelity® funds (2011), and Executive Vice Chairman (2010), Chief Executive Officer (2009-2010), and President and Chief Executive Officer (1997-2009) of Mastercard, Inc.
Cornelia M. Small (1944)
Year of Election or Appointment: 2005
Trustee
Ms. Small also serves as Trustee of other Fidelity® funds. Ms. Small is a member of the Board of Directors (2009-present) and Chair of the Investment Committee (2010-present) of the Teagle Foundation. Ms. Small also serves on the Investment Committee of the Berkshire Taconic Community Foundation (2008-present). Previously, Ms. Small served as Chairperson (2002-2008) and a member of the Investment Committee and Chairperson (2008-2012) and a member of the Board of Trustees of Smith College. In addition, Ms. Small served as Chief Investment Officer, Director of Global Equity Investments, and a member of the Board of Directors of Scudder, Stevens & Clark and Scudder Kemper Investments.
William S. Stavropoulos (1939)
Year of Election or Appointment: 2002
Trustee
Vice Chairman of the Independent Trustees
Mr. Stavropoulos also serves as Trustee of other Fidelity® funds. Mr. Stavropoulos serves as President and Founder of the Michigan Baseball Foundation, the Great Lakes Loons (2007-present). Mr. Stavropoulos is Chairman Emeritus of the Board of Directors of The Dow Chemical Company, where he previously served in numerous senior management positions, including President, CEO (1995-2000; 2002-2004), Chairman of the Executive Committee (2000-2006), and as a member of the Board of Directors (1990-2006). Currently, Mr. Stavropoulos is Chairman of the Board of Directors of Univar Inc. (global distributor of commodity and specialty chemicals), a Director of Teradata Corporation (data warehousing and technology solutions), and Maersk Inc. (industrial conglomerate), and a member of the Advisory Board for Metalmark Capital LLC (private equity investment, 2005-present). Mr. Stavropoulos is an operating advisor to Clayton, Dubilier & Rice, LLC (private equity investment). In addition, Mr. Stavropoulos is a member of the University of Notre Dame Advisory Council for the College of Science, a Trustee of the Rollin L. Gerstacker Foundation, and a Director of the Naples Philharmonic Center for the Arts. Previously, Mr. Stavropoulos served as a Director of Chemical Financial Corporation (bank holding company, 1993-2012) and Tyco International, Ltd. (multinational manufacturing and services, 2007-2012).
David M. Thomas (1949)
Year of Election or Appointment: 2008
Trustee
Mr. Thomas also serves as Trustee of other Fidelity® funds. Mr. Thomas serves as Non-Executive Chairman of the Board of Directors of Fortune Brands Home and Security (home and security products, 2011-present), as a member of the Board of Directors (2004-present) and Presiding Director (2013-present) of Interpublic Group of Companies, Inc. (marketing communication), and as a member of the Board of Trustees of the University of Florida (2013-present). Previously, Mr. Thomas served as Executive Chairman (2005-2006) and Chairman and Chief Executive Officer (2000-2005) of IMS Health, Inc. (pharmaceutical and healthcare information solutions), and a Director of Fortune Brands, Inc. (consumer products, 2000-2011).
+ The information includes the Trustee's principal occupation during the last five years and other information relating to the experience, attributes, and skills relevant to the Trustee's qualifications to serve as a Trustee, which led to the conclusion that the Trustee should serve as a Trustee for the fund.
Advisory Board Members and Officers:
Correspondence intended for an officer or Peter S. Lynch may be sent to Fidelity Investments, 245 Summer Street, Boston, Massachusetts 02210. Officers appear below in alphabetical order.
Name, Year of Birth; Principal Occupation
Peter S. Lynch (1944)
Year of Election or Appointment: 2003
Member of the Advisory Board
Mr. Lynch also serves as Member of the Advisory Board of other Fidelity® funds. Mr. Lynch is Vice Chairman and a Director of FMR (investment adviser firm) and FMR Co., Inc. (investment adviser firm). In addition, Mr. Lynch serves as a Trustee of Boston College and as the Chairman of the Inner-City Scholarship Fund. Previously, Mr. Lynch served on the Special Olympics International Board of Directors (1997-2006).
Marc R. Bryant (1966)
Year of Election or Appointment: 2015
Secretary and Chief Legal Officer (CLO)
Mr. Bryant also serves as Secretary and CLO of other funds. Mr. Bryant serves as CLO, Secretary, and Senior Vice President of Fidelity Management & Research Company (investment adviser firm, 2015-present) and FMR Co., Inc. (investment adviser firm, 2015-present); Secretary of Fidelity SelectCo, LLC (investment adviser firm, 2015-present) and Fidelity Investments Money Management, Inc. (investment adviser firm, 2015-present); and CLO of Fidelity Management & Research (Hong Kong) Limited and FMR Investment Management (U.K.) Limited (investment adviser firms, 2015-present) and Fidelity Management & Research (Japan) Limited (investment adviser firm, 2016-present). He is Senior Vice President and Deputy General Counsel of FMR LLC (diversified financial services company). Previously, Mr. Bryant served as Secretary and CLO of Fidelity Rutland Square Trust II (2010-2014) and Assistant Secretary of Fidelity's Fixed Income and Asset Allocation Funds (2013-2015). Prior to joining Fidelity Investments, Mr. Bryant served as a Senior Vice President and the Head of Global Retail Legal for AllianceBernstein L.P. (2006-2010), and as the General Counsel for ProFund Advisors LLC (2001-2006).
Jeffrey S. Christian (1961)
Year of Election or Appointment: 2016
Assistant Treasurer
Mr. Christian also serves as Assistant Treasurer of other funds. Mr. Christian is an employee of Fidelity Investments (2003-present).
William C. Coffey (1969)
Year of Election or Appointment: 2009
Assistant Secretary
Mr. Coffey also serves as Assistant Secretary of other funds. He is Senior Vice President and Deputy General Counsel of FMR LLC (diversified financial services company, 2010-present), and is an employee of Fidelity Investments. Previously, Mr. Coffey served as Vice President and Associate General Counsel of FMR LLC (2005-2009).
Jonathan Davis (1968)
Year of Election or Appointment: 2010
Assistant Treasurer
Mr. Davis also serves as Assistant Treasurer of other funds, and is an employee of Fidelity Investments. Previously, Mr. Davis served as Vice President and Associate General Counsel of FMR LLC (diversified financial services company, 2003-2010).
Adrien E. Deberghes (1967)
Year of Election or Appointment: 2016
Assistant Treasurer
Mr. Deberghes also serves as an officer of other funds. He serves as Executive Vice President of Fidelity Investments Money Management, Inc. (FIMM) (investment adviser firm, 2016-present) and is an employee of Fidelity Investments (2008-present). Prior to joining Fidelity Investments, Mr. Deberghes was Senior Vice President of Mutual Fund Administration at State Street Corporation (2007-2008), Senior Director of Mutual Fund Administration at Investors Bank & Trust (2005-2007), and Director of Finance for Dunkin' Brands (2000-2005). Previously, Mr. Deberghes served in other fund officer roles.
Stephanie J. Dorsey (1969)
Year of Election or Appointment: 2010
Assistant Treasurer
Ms. Dorsey also serves as an officer of other funds. She is an employee of Fidelity Investments (2008-present) and has served in other fund officer roles. Prior to joining Fidelity Investments, Ms. Dorsey served as Treasurer (2004-2008) of the JPMorgan Mutual Funds and Vice President (2004-2008) of JPMorgan Chase Bank.
Howard J. Galligan III (1966)
Year of Election or Appointment: 2014
Chief Financial Officer
Mr. Galligan also serves as Chief Financial Officer of other funds. Mr. Galligan serves as President of Fidelity Pricing and Cash Management Services (FPCMS) (2014-present) and as a Director of Strategic Advisers, Inc. (investment adviser firm, 2008-present). Previously, Mr. Galligan served as Chief Administrative Officer of Asset Management (2011-2014) and Chief Operating Officer and Senior Vice President of Investment Support for Strategic Advisers, Inc. (2003-2011).
Scott C. Goebel (1968)
Year of Election or Appointment: 2015
Vice President
Mr. Goebel serves as Vice President of other funds and is an employee of Fidelity Investments (2001-present). Mr. Goebel serves as Senior Vice President of Fidelity Management & Research Company (FMR) (investment adviser firm, 2016-present). Previously, Mr. Goebel served as Secretary of Fidelity SelectCo, LLC (investment adviser firm, 2013-2015), Fidelity Investments Money Management, Inc. (FIMM) (investment adviser firm, 2010-2015), and Fidelity Research and Analysis Company (FRAC) (investment adviser firm, 2010-2015); General Counsel, Secretary, and Senior Vice President of FMR (investment adviser firm, 2008-2015) and FMR Co., Inc. (investment adviser firm, 2008-2015); Assistant Secretary of Fidelity Management & Research (Japan) Limited (investment adviser firm, 2008-2015) and Fidelity Management & Research (U.K.) Inc. (investment adviser firm, 2008-2015); Chief Legal Officer (CLO) of Fidelity Management & Research (Hong Kong) Limited (investment adviser firm, 2008-2015); Secretary and CLO of certain Fidelity® funds (2008-2015); Assistant Secretary of FIMM (2008-2010), FRAC (2008-2010), and certain funds (2007-2008); and as Vice President and Secretary of Fidelity Distributors Corporation (FDC) (2005-2007).
Thomas C. Hense (1964)
Year of Election or Appointment: 2008, 2010, or 2015
Vice President
Mr. Hense serves as Vice President of Fidelity Advisor® Multi-Asset Income Fund (2015) and other funds (High Income (2008), Small Cap (2008), and Value (2010) funds), and is an employee of Fidelity Investments (1993-present). Previously, Mr. Hense served as a portfolio manager for Fidelity's Institutional Money Management Group (Pyramis) (2003-2008).
Brian B. Hogan (1964)
Year of Election or Appointment: 2009
Vice President
Mr. Hogan also serves as Trustee or Vice President of other funds. Mr. Hogan serves as a Director of FMR Investment Management (U.K.) Limited (investment adviser firm, 2015-present) and Fidelity SelectCo, LLC (investment adviser firm, 2014-present) and President of the Equity Division of FMR (investment adviser firm, 2009-present). Previously, Mr. Hogan served as Senior Vice President, Equity Research of FMR (2006-2009) and as a portfolio manager. Mr. Brian B. Hogan is not related to Mr. Colm A. Hogan.
Colm A. Hogan (1973)
Year of Election or Appointment: 2016
Deputy Treasurer
Mr. Hogan also serves as an officer of other funds. Mr. Hogan is an employee of Fidelity Investments (2005-present). Mr. Colm A. Hogan is not related to Mr. Brian B. Hogan.
Chris Maher (1972)
Year of Election or Appointment: 2013
Assistant Treasurer
Mr. Maher serves as Assistant Treasurer of other funds. Mr. Maher is Vice President of Valuation Oversight and is an employee of Fidelity Investments. Previously, Mr. Maher served as Vice President of Asset Management Compliance (2013), Vice President of the Program Management Group of FMR (investment adviser firm, 2010-2013), and Vice President of Valuation Oversight (2008-2010).
John F. Papandrea (1972)
Year of Election or Appointment: 2016
Anti-Money Laundering (AML) Officer
Mr. Papandrea also serves as AML Officer of other funds. Mr. Papandrea is Vice President of FMR LLC (diversified financial services company, 2008-present) and is an employee of Fidelity Investments (2005-present).
Kenneth B. Robins (1969)
Year of Election or Appointment: 2016
Chief Compliance Officer
Mr. Robins also serves as an officer of other funds. Mr. Robins serves as Compliance Officer of Fidelity Management & Research Company and FMR Co., Inc. (investment adviser firms, 2016-present) and is an employee of Fidelity Investments (2004-present). Previously, Mr. Robins served as Executive Vice President of Fidelity Investments Money Management, Inc. (investment adviser firm, 2013-2016) and served in other fund officer roles.
Stacie M. Smith (1974)
Year of Election or Appointment: 2016
President and Treasurer
Ms. Smith also serves as an officer of other funds. She is an employee of Fidelity Investments (2009-present) and has served in other fund officer roles. Prior to joining Fidelity Investments, Ms. Smith served as Senior Audit Manager of Ernst & Young LLP (1996-2009). Previously, Ms. Smith served as Deputy Treasurer of certain Fidelity® funds (2013-2016).
Renee Stagnone (1975)
Year of Election or Appointment: 2016
Assistant Treasurer
Ms. Stagnone also serves as an officer of other funds. Ms. Stagnone is an employee of Fidelity Investments (1997-present). Previously, Ms. Stagnone served as Deputy Treasurer of certain Fidelity® funds (2013-2016).
Shareholder Expense Example
As a shareholder of the Fund, you incur two types of costs: (1) transaction costs, including sales charges (loads) on purchase payments or redemption proceeds, redemption fees and (2) ongoing costs, including management fees, distribution and/or service (12b-1) fees and other Fund expenses. This Example is intended to help you understand your ongoing costs (in dollars) of investing in the Fund and to compare these costs with the ongoing costs of investing in other mutual funds.
The Example is based on an investment of $1,000 invested at the beginning of the period and held for the entire period (February 1, 2016 to July 31, 2016).
Actual Expenses
The first line of the accompanying table for each class of the Fund provides information about actual account values and actual expenses. You may use the information in this line, together with the amount you invested, to estimate the expenses that you paid over the period. Simply divide your account value by $1,000.00 (for example, an $8,600 account value divided by $1,000.00 = 8.6), then multiply the result by the number in the first line for a class of the Fund under the heading entitled "Expenses Paid During Period" to estimate the expenses you paid on your account during this period. A small balance maintenance fee of $12.00 that is charged once a year may apply for certain accounts with a value of less than $2,000. This fee is not included in the table below. If it was, the estimate of expenses you paid during the period would be higher, and your ending account value lower, by this amount. In addition, the Fund, as a shareholder in the underlying Fidelity Central Funds, will indirectly bear its pro-rata share of the fees and expenses incurred by the underlying Fidelity Central Funds. These fees and expenses are not included in the Fund's annualized expense ratio used to calculate the expense estimate in the table below.
Hypothetical Example for Comparison Purposes
The second line of the accompanying table for each class of the Fund provides information about hypothetical account values and hypothetical expenses based on a Class' actual expense ratio and an assumed rate of return of 5% per year before expenses, which is not the Class' actual return. The hypothetical account values and expenses may not be used to estimate the actual ending account balance or expenses you paid for the period. You may use this information to compare the ongoing costs of investing in the Fund and other funds. To do so, compare this 5% hypothetical example with the 5% hypothetical examples that appear in the shareholder reports of the other funds. A small balance maintenance fee of $12.00 that is charged once a year may apply for certain accounts with a value of less than $2,000. This fee is not included in the table below. If it was, the estimate of expenses you paid during the period would be higher, and your ending account value lower, by this amount. In addition, the Fund, as a shareholder in the underlying Fidelity Central Funds, will indirectly bear its pro-rata share of the fees and expenses incurred by the underlying Fidelity Central Funds. These fees and expenses are not included in the Fund's annualized expense ratio used to calculate the expense estimate in the table below.
Please note that the expenses shown in the table are meant to highlight your ongoing costs only and do not reflect any transaction costs. Therefore, the second line of the table is useful in comparing ongoing costs only, and will not help you determine the relative total costs of owning different funds. In addition, if these transactional costs were included, your costs would have been higher.
| | Annualized Expense Ratio-A | Beginning
Account Value
February 1, 2016 | Ending
Account Value
July 31, 2016 | Expenses Paid
During Period-B
February 1, 2016
to July 31, 2016 |
| Class A | 1.36% | | | |
| Actual | | $1,000.00 | $1,171.80 | $7.34 |
| Hypothetical-C | | $1,000.00 | $1,018.10 | $6.82 |
| Class T | 1.65% | | | |
| Actual | | $1,000.00 | $1,169.60 | $8.90 |
| Hypothetical-C | | $1,000.00 | $1,016.66 | $8.27 |
| Class C | 2.14% | | | |
| Actual | | $1,000.00 | $1,167.20 | $11.53 |
| Hypothetical-C | | $1,000.00 | $1,014.22 | $10.72 |
| Small Cap Growth | 1.11% | | | |
| Actual | | $1,000.00 | $1,172.80 | $6.00 |
| Hypothetical-C | | $1,000.00 | $1,019.34 | $5.57 |
| Class I | 1.08% | | | |
| Actual | | $1,000.00 | $1,173.10 | $5.84 |
| Hypothetical-C | | $1,000.00 | $1,019.49 | $5.42 |
A Annualized expense ratio reflects expenses net of applicable fee waivers.
B Expenses are equal to each Class' annualized expense ratio, multiplied by the average account value over the period, multiplied by 182/366 (to reflect the one-half year period).
C 5% return per year before expenses
Distributions (Unaudited)
The fund hereby designates as a capital gain dividend with respect to the taxable year ended July 31, 2016, $2,803,642, or, if subsequently determined to be different, the net capital gain of such year.
Class A designates 32%, Class B designates 80%, Class C designates 67%, Class T designates 39%, Class I designates 28%, and Small Cap Growth Fund designates 29%, of the dividends distributed in September, 2015 during the fiscal year as qualifying for the dividends–received deduction for corporate shareholders.
Class A designates 34%, Class B designates 84%, Class C designates 70%, Class T designates 41%, Class I designates 30%, and Small Growth Cap Fund designates 30%, of the dividends distributed in September, 2015 during the fiscal year as amounts which may be taken into account as a dividend for purposes of the maximum rate under section 1(h)(11) of the Internal Revenue Code.
The fund will notify shareholders in January 2017 of amounts for use in preparing 2016 income tax returns.
Board Approval of Investment Advisory Contracts and Management Fees
Fidelity Small Cap Growth Fund
Each year, the Board of Trustees, including the Independent Trustees (together, the Board), votes on the renewal of the management contract with Fidelity Management & Research Company (FMR) and the sub-advisory agreements (together, the Advisory Contracts) for the fund. The Board, assisted by the advice of fund counsel and Independent Trustees' counsel, requests and considers a broad range of information relevant to the renewal of the Advisory Contracts throughout the year.
The Board meets regularly and, at each of its meetings, covers an extensive agenda of topics and materials and considers factors that are relevant to its annual consideration of the renewal of the fund's Advisory Contracts, including the services and support provided to the fund and its shareholders. The Board has established various standing committees (Committees), each composed of and chaired by Independent Trustees with varying backgrounds, to which the Board has assigned specific subject matter responsibilities in order to enhance effective decision-making by the Board. The Board, acting directly and through its Committees, requests and receives information concerning the annual consideration of the renewal of the fund's Advisory Contracts. The Board also meets as needed to consider matters specifically related to the Board's annual consideration of the renewal of the Advisory Contracts. Members of the Board may also meet with trustees of other Fidelity funds through ad hoc joint committees to discuss certain matters relevant to all of the Fidelity funds.
At its July 2016 meeting, the Board unanimously determined to renew the fund's Advisory Contracts. In reaching its determination, the Board considered all factors it believed relevant, including (i) the nature, extent, and quality of the services to be provided to the fund and its shareholders (including the investment performance of the fund); (ii) the competitiveness of the fund's management fee and total expense ratio relative to peer funds; (iii) the total costs of the services to be provided by and the profits to be realized by Fidelity from its relationships with the fund; and (iv) the extent to which, if any, economies of scale exist and would be realized as the fund grows, and whether any economies of scale are appropriately shared with fund shareholders.
In considering whether to renew the Advisory Contracts for the fund, the Board reached a determination, with the assistance of fund counsel and Independent Trustees' counsel and through the exercise of its business judgment, that the renewal of the Advisory Contracts was in the best interests of the fund and its shareholders and that the compensation payable under the Advisory Contracts was fair and reasonable. The Board's decision to renew the Advisory Contracts was not based on any single factor, but rather was based on a comprehensive consideration of all the information provided to the Board at its meetings throughout the year. The Board, in reaching its determination to renew the Advisory Contracts, was aware that shareholders of the fund have a broad range of investment choices available to them, including a wide choice among funds offered by Fidelity's competitors, and that the fund's shareholders, who have the opportunity to review and weigh the disclosure provided by the fund in its prospectus and other public disclosures, have chosen to invest in this fund, which is part of the Fidelity family of funds.
Nature, Extent, and Quality of Services Provided. The Board considered Fidelity's staffing as it relates to the fund, including the backgrounds of investment personnel of Fidelity, and also considered the fund's investment objective, strategies, and related investment philosophy. The Independent Trustees also had discussions with senior management of Fidelity's investment operations and investment groups. The Board considered the structure of the investment personnel compensation program and whether this structure provides appropriate incentives to act in the best interests of the fund. Additionally, the Board considered the portfolio managers' investments, if any, in the funds that they manage.
Resources Dedicated to Investment Management and Support Services. The Board and the Fund Oversight and Research Committees reviewed the general qualifications and capabilities of Fidelity's investment staff, including its size, education, experience, and resources, as well as Fidelity's approach to recruiting, training, managing, and compensating investment personnel. The Board noted that Fidelity has continued to increase the resources devoted to non-U.S. offices, including expansion of Fidelity's global investment organization. The Board also noted that Fidelity's analysts have extensive resources, tools and capabilities that allow them to conduct sophisticated quantitative and fundamental analysis, as well as credit analysis of issuers, counterparties and guarantors. Further, the Board considered that Fidelity's investment professionals have sufficient access to global information and data so as to provide competitive investment results over time, and that those professionals also have access to sophisticated tools that permit them to assess portfolio construction and risk and performance attribution characteristics continuously, as well as to transmit new information and research conclusions rapidly around the world. Additionally, in its deliberations, the Board considered Fidelity's trading, risk management, compliance, and technology and operations capabilities and resources, which are integral parts of the investment management process.
Shareholder and Administrative Services. The Board considered (i) the nature, extent, quality, and cost of advisory, administrative, and shareholder services performed by FMR, the sub-advisers (together with FMR, the Investment Advisers), and their affiliates under the Advisory Contracts and under separate agreements covering transfer agency, pricing and bookkeeping, and securities lending services for the fund; (ii) the nature and extent of the supervision of third party service providers, principally custodians, subcustodians, and pricing vendors; and (iii) the resources devoted to, and the record of compliance with, the fund's compliance policies and procedures. The Board also reviewed the allocation of fund brokerage, including allocations to brokers affiliated with the Investment Advisers, the use of brokerage commissions to pay fund expenses, and the use of "soft" commission dollars to pay for research services.
The Board noted that the growth of fund assets over time across the complex allows Fidelity to reinvest in the development of services designed to enhance the value or convenience of the Fidelity funds as investment vehicles. These services include 24-hour access to account information and market information through telephone representatives and over the Internet, investor education materials and asset allocation tools, and the expanded availability of Fidelity Investor Centers.
In 2014, the Board formed an ad hoc Committee on Transfer Agency Fees to review the variety of transfer agency fee structures throughout the industry and Fidelity's competitive positioning with respect to industry participants.
Investment in a Large Fund Family. The Board considered the benefits to shareholders of investing in a Fidelity fund, including the benefits of investing in a fund that is part of a large family of funds offering a variety of investment disciplines and providing a large variety of mutual fund investor services. The Board noted that Fidelity had taken, or had made recommendations that resulted in the Fidelity funds taking, a number of actions over the previous year that benefited particular funds, including: (i) continuing to dedicate additional resources to investment research and to the support of the senior management team that oversees asset management; (ii) continuing efforts to enhance Fidelity's global research capabilities; (iii) launching new funds and making other enhancements to meet client needs; (iv) broadening eligibility requirements for certain lower-priced share classes of, and streamlining the fee structure for, certain existing equity index funds; (v) lowering expense caps for certain existing funds and classes to reduce expenses paid by shareholders; (vi) eliminating redemption fees for certain variable insurance product funds and classes; (vii) continuing to launch dedicated lower cost underlying funds to meet portfolio construction needs related to expanding underlying fund options for Fidelity funds of funds, specifically for the Freedom Fund product lines; (viii) launching a lower cost share class for use by the Freedom Index Fund product line; (ix) rationalizing product lines and gaining increased efficiencies through fund mergers and share class consolidations; (x) continuing to develop, acquire and implement systems and technology to improve services to the funds and shareholders, strengthen information security, and increase efficiency; (xi) implementing investment enhancements to further strengthen Fidelity's target date product line to increase investors' probability of success in achieving their goals; (xii) accelerating the conversion of all remaining Class B shares to Class A shares, which have a lower expense structure; and (xiii) implementing changes to Fidelity's money market fund product line in response to recent regulatory reforms.
Investment Performance. The Board considered whether the fund has operated in accordance with its investment objective, as well as its record of compliance with its investment restrictions and its performance history.
The Board took into account discussions with representatives of the Investment Advisers about fund investment performance that occur at Board meetings throughout the year. In this regard the Board noted that as part of regularly scheduled fund reviews and other reports to the Board on fund performance, the Board considers annualized return information for the fund, for different time periods, measured against a securities market index ("benchmark index") and a peer group of funds with similar objectives ("peer group"), if any. In its evaluation of fund investment performance, the Board gave particular attention to information indicating changes in performance of certain Fidelity funds for specific time periods and discussed with the Investment Advisers the reasons for any overperformance or underperformance.
In addition to reviewing absolute and relative fund performance, the Independent Trustees periodically consider the appropriateness of fund performance metrics in evaluating the results achieved. In general, the Independent Trustees believe that fund performance should be evaluated based on net performance (after fees and expenses) of both the highest performing and lowest performing fund share classes, where applicable, compared to appropriate benchmark indices, over appropriate time periods that may include full market cycles, and compared to peer groups, as applicable, over the same periods, taking into account relevant factors including the following: general market conditions; issuer-specific information; and fund cash flows and other factors.
The Independent Trustees recognize that shareholders evaluate performance on a net basis over their own holding periods, for which one-, three-, and five-year periods are often used as a proxy. For this reason, the performance information reviewed by the Board also included net cumulative calendar year total return information for the fund and an appropriate benchmark index and peer group for the most recent one-, three-, and five-year periods, as shown below. Returns are shown compared to the 25th percentile (top of box, 75% beaten) and 75th percentile (bottom of box, 25% beaten) of the peer universe.
Fidelity Small Cap Growth Fund
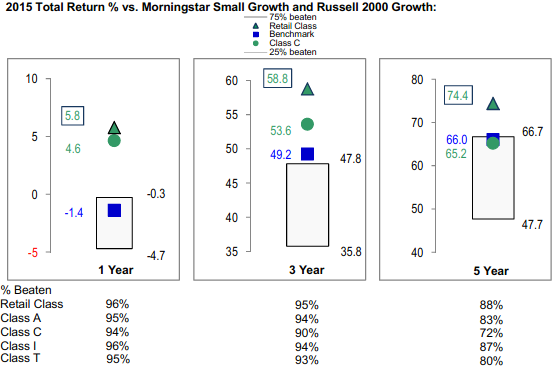
The Board also considered that the fund's management fee is subject to upward or downward adjustment depending upon whether, and to what extent, the fund's investment performance for the performance period exceeds, or is exceeded by, a securities index, thus leading to a performance adjustment for the same period. The Board noted that the performance adjustment provides FMR with a strong economic incentive to seek to achieve superior performance for the fund's shareholders and helps to more closely align the interests of FMR and the shareholders of the fund.
Based on its review, the Board concluded that the nature, extent, and quality of services provided to the fund under the Advisory Contracts should continue to benefit the shareholders of the fund.
Competitiveness of Management Fee and Total Expense Ratio. The Board considered the fund's management fee and total expense ratio compared to "mapped groups" of competitive funds and classes created for the purpose of facilitating the Trustees' competitive analysis of management fees and total expenses. Fidelity creates "mapped groups" by combining similar Broadridge investment objective categories that have comparable investment mandates. Combining Broadridge investment objective categories aids the Board's management fee and total expense ratio comparisons by broadening the competitive group used for comparison.
Management Fee. The Board considered two proprietary management fee comparisons for the 12-month periods shown in basis points (BP) in the chart below. The group of Broadridge funds used by the Board for management fee comparisons is referred to below as the "Total Mapped Group." The Total Mapped Group comparison focuses on a fund's standing in terms of gross management fees before expense reimbursements or caps, and without giving effect to the fund's performance adjustment, relative to the total universe of funds with comparable investment mandates, regardless of whether their management fee structures also are comparable. Funds with comparable investment mandates offer exposure to similar types of securities. Funds with comparable management fee structures have similar management fee contractual arrangements (
e.g., flat rate charged for advisory services, all-inclusive fee rate,
etc.). "TMG %" represents the percentage of funds in the Total Mapped Group that had management fees that were lower than the fund's. For example, a hypothetical TMG % of 20% would mean that 80% of the funds in the Total Mapped Group had higher, and 20% had lower, management fees than the fund. The fund's actual TMG %s and the number of funds in the Total Mapped Group are in the chart below. The "Asset-Size Peer Group" (ASPG) comparison focuses on a fund's standing relative to a subset of non-Fidelity funds within the Total Mapped Group that are similar in size and management fee structure without taking into account performance adjustments, if any. For example, if a fund is in the first quartile of the ASPG, the fund's management fee ranks in the least expensive or lowest 25% of funds in the ASPG. The ASPG represents at least 15% of the funds in the Total Mapped Group with comparable asset size and management fee structures, subject to a minimum of 50 funds (or all funds in the Total Mapped Group if fewer than 50). Additional information, such as the ASPG quartile in which the fund's management fee rate ranked and the impact of the fund's performance adjustment, is also included in the chart and considered by the Board.
Fidelity Small Cap Growth Fund
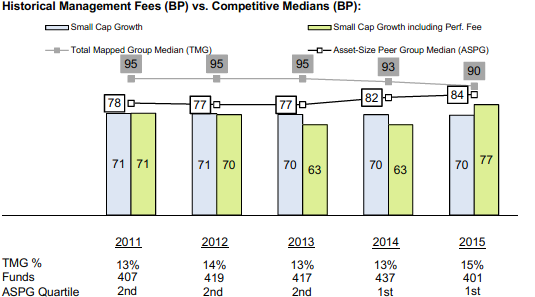
The Board noted that the fund's management fee rate ranked below the median of its Total Mapped Group and below the median of its ASPG for 2015. The Board also noted the effect of the fund's performance adjustment, if any, on the fund's management fee ranking. The Board noted that the comparisons for 2015 reflect a revised Total Mapped Group that no longer includes funds with micro-cap objectives and that FMR believes this Total Mapped Group is a more appropriate comparison because the fund does not have a micro-cap objective.
The Board noted that, in 2014, the ad hoc Committee on Group Fee was formed by it and the boards of other Fidelity funds to conduct an in-depth review of the "group fee" component of the management fee of funds with such management fee structures. The Committee's focus included the mechanics of the group fee, the competitive landscape of group fee structures, Fidelity funds with no group fee component and investment products not included in group fee assets. The Board also considered that, for funds subject to the group fee, FMR agreed to voluntarily waive fees over a specified period of time in amounts designed to account for assets converted from certain funds to certain collective investment trusts.
The Board also noted that, in 2013, the ad hoc Committee on Management Fees was formed to conduct an in-depth review of the management fee rates of Fidelity's active equity mutual funds. The Committee focused on the following areas: (i) standard fee structures; (ii) research consumption and trading evolution; (iii) management fee competitiveness/profitability by category; and (iv) factors that drive institutional pricing.
Based on its review, the Board concluded that the fund's management fee is fair and reasonable in light of the services that the fund receives and the other factors considered.
Total Expense Ratio. In its review of each class's total expense ratio, the Board considered the fund's management fee rate as well as other fund or class expenses, as applicable, such as transfer agent fees, pricing and bookkeeping fees, fund-paid 12b-1 fees, and custodial, legal, and audit fees. The Board noted the impact of the fund's performance adjustment. The Board also noted that Fidelity may agree to waive fees and expenses from time to time, and the extent to which, if any, it has done so for the fund. As part of its review, the Board also considered the current and historical total expense ratios of each class of the fund compared to competitive fund median expenses. Each class of the fund is compared to those funds and classes in the Total Mapped Group (used by the Board for management fee comparisons) that have a similar sales load structure.
The Board noted that the total expense ratio of each of Class A, Class I, and the retail class ranked below the competitive median for 2015 and the total expense ratio of Class T and Class C ranked above the competitive median for 2015. The Board considered that, in general, various factors can affect total expense ratios. The Board noted that the total expense ratio of Class T was above the competitive median primarily because of higher 12b-1 fees on Class T as compared to most competitor funds. Class T has a higher 12b-1 fee, but a lower front-end sales charge, than traditionally priced front-end sales charge classes. The Board considered that Class T is primarily sold load-waived in the retirement plan market where its 0.50% 12b-1 fee is comparable to competing no-load, higher 12b-1 fee classes designed specifically for retirement plans. The Board noted that the fund offers multiple classes, each of which has a different sales load and 12b-1 fee structure, and that the multiple structures are intended to offer a range of pricing options for the intermediary market. The Board also noted that the total expense ratios of the classes vary primarily by the level of their 12b-1 fees, although differences in transfer agent fees may also cause expenses to vary from class to class.
Fees Charged to Other Fidelity Clients. The Board also considered Fidelity fee structures and other information with respect to clients of Fidelity, such as other funds advised or subadvised by Fidelity, pension plan clients, and other institutional clients with similar mandates. The Board noted the findings of the 2013 ad hoc joint committee (created with the board of other Fidelity funds), which reviewed and compared Fidelity's institutional investment advisory business with its business of providing services to the Fidelity funds, including the differences in services provided, fees charged, and costs incurred, as well as competition in their respective marketplaces.
Based on its review of total expense ratios and fees charged to other Fidelity clients, the Board concluded that, although some classes were above the median of the universe presented for comparison, the total expense ratio of each class of the fund was reasonable in light of the services that the fund and its shareholders receive and the other factors considered.
Costs of the Services and Profitability. The Board considered the revenues earned and the expenses incurred by Fidelity in conducting the business of developing, marketing, distributing, managing, administering and servicing the fund and servicing the fund's shareholders. The Board also considered the level of Fidelity's profits in respect of all the Fidelity funds.
On an annual basis, Fidelity presents to the Board information about the profitability of its relationship with the fund. Fidelity calculates profitability information for each fund, as well as aggregate profitability information for groups of Fidelity funds and all Fidelity funds, using a series of detailed revenue and cost allocation methodologies which originate with the books and records of Fidelity on which Fidelity's audited financial statements are based. The Audit Committee of the Board reviews any significant changes from the prior year's methodologies.
PricewaterhouseCoopers LLP (PwC), independent registered public accounting firm and auditor to Fidelity and certain Fidelity funds, has been engaged annually by the Board as part of the Board's assessment of Fidelity's profitability analysis. PwC's engagement includes the review and assessment of the methodologies used by Fidelity in determining the revenues and expenses attributable to Fidelity's mutual fund business, and completion of agreed-upon procedures in respect of the mathematical accuracy of the fund profitability information and its conformity to established allocation methodologies. After considering PwC's reports issued under the engagement and information provided by Fidelity, the Board concluded that while other allocation methods may also be reasonable, Fidelity's profitability methodologies are reasonable in all material respects.
The Board also reviewed Fidelity's non-fund businesses and fall-out benefits related to the mutual fund business as well as cases where Fidelity's affiliates may benefit from or be related to the fund's business.
The Board considered the costs of the services provided by and the profits realized by Fidelity in connection with the operation of the fund and was satisfied that the profitability was not excessive.
Economies of Scale. The Board considered whether there have been economies of scale in respect of the management of the Fidelity funds, whether the Fidelity funds (including the fund) have appropriately benefited from any such economies of scale, and whether there is potential for realization of any further economies of scale. The Board considered the extent to which the fund will benefit from economies of scale as assets grow through increased services to the fund, through waivers or reimbursements, or through fee or expense ratio reductions. The Board also noted that in 2013, it and the boards of other Fidelity funds created an ad hoc committee (the Economies of Scale Committee) to analyze whether Fidelity attains economies of scale in respect of the management and servicing of the Fidelity funds, whether the Fidelity funds have appropriately benefited from such economies of scale, and whether there is potential for realization of any further economies of scale.
The Board recognized that the fund's management contract incorporates a "group fee" structure, which provides for lower group fee rates as total group assets increase, and for higher group fee rates as total group assets decrease (with "group assets" defined to include fund assets under FMR's management plus the assets of sector funds previously under FMR's management). FMR calculates the group fee rates based on a tiered asset "breakpoint" schedule that varies based on asset class. The Board considered that the group fee is designed to deliver the benefits of economies of scale to fund shareholders when total Fidelity fund assets increase, even if assets of any particular fund are unchanged or have declined, because some portion of Fidelity's costs are attributable to services provided to all Fidelity funds, and all funds benefit if those costs can be allocated among more assets. The Board concluded that, given the group fee structure, fund shareholders will benefit from lower management fees as group assets increase at the fund complex level, regardless of whether Fidelity achieves any such economies of scale.
The Board concluded, taking into account the analysis of the Economies of Scale Committee, that economies of scale, if any, are being appropriately shared between fund shareholders and Fidelity.
Additional Information Requested by the Board. In order to develop fully the factual basis for consideration of the Fidelity funds' Advisory Contracts, the Board requested and received additional information on certain topics, including: (i) fund performance trends and Fidelity's long-term strategies for certain funds; (ii) the various share classes employed by Fidelity and the attributes of each class, together with similar information on the distribution and servicing payments made by Fidelity or the funds to third-party participants in the distribution channels; (iii) fund profitability, and fund performance in relation to fund profitability; (iv) the methodology with respect to evaluating competitive fund data and peer group classifications and fee comparisons; (v) annual fund profitability margins; (vi) the realization of fall-out benefits in and attribution of fall-out benefits to certain Fidelity business units; (vii) the appropriateness of certain funds' benchmarks; (viii) the rationalization for certain share classes and expenses; (ix) sub-advisory fee rates for comparable investment mandates; (x) product strategy for certain underperforming funds; and (xi) Fidelity's resources and strategy for cybersecurity.
Based on its evaluation of all of the conclusions noted above, and after considering all factors it believed relevant, the Board concluded that the advisory fee structures are fair and reasonable, and that the fund's Advisory Contracts should be renewed.
ASCP-ANN-0916
1.803714.111
Fidelity Advisor® Real Estate Income Fund - Class A, Class T, Class C and Class I
Annual Report July 31, 2016 Class A, Class T, Class C and Class I are classes of Fidelity® Real Estate Income Fund |
|
Contents
To view a fund's proxy voting guidelines and proxy voting record for the 12-month period ended June 30, visit http://www.fidelity.com/proxyvotingresults or visit the Securities and Exchange Commission's (SEC) web site at http://www.sec.gov.
You may also call 1-877-208-0098 to request a free copy of the proxy voting guidelines.
Standard & Poor's, S&P and S&P 500 are registered service marks of The McGraw-Hill Companies, Inc. and have been licensed for use by Fidelity Distributors Corporation.
Other third-party marks appearing herein are the property of their respective owners.
All other marks appearing herein are registered or unregistered trademarks or service marks of FMR LLC or an affiliated company. © 2016 FMR LLC. All rights reserved.
This report and the financial statements contained herein are submitted for the general information of the shareholders of the Fund. This report is not authorized for distribution to prospective investors in the Fund unless preceded or accompanied by an effective prospectus.
A fund files its complete schedule of portfolio holdings with the SEC for the first and third quarters of each fiscal year on Form N-Q. Forms N-Q are available on the SEC’s web site at http://www.sec.gov. A fund's Forms N-Q may be reviewed and copied at the SEC’s Public Reference Room in Washington, DC. Information regarding the operation of the SEC's Public Reference Room may be obtained by calling 1-800-SEC-0330.
For a complete list of a fund's portfolio holdings, view the most recent holdings listing, semiannual report, or annual report on Fidelity's web site at http://www.fidelity.com, http://www.institutional.fidelity.com, or http://www.401k.com, as applicable.
NOT FDIC INSURED •MAY LOSE VALUE •NO BANK GUARANTEE
Neither the Fund nor Fidelity Distributors Corporation is a bank.
Performance: The Bottom Line
Average annual total return reflects the change in the value of an investment, assuming reinvestment of distributions from dividend income and capital gains (the profits earned upon the sale of securities that have grown in value, if any) and assuming a constant rate of performance each year. The hypothetical investment and the average annual total returns do not reflect the deduction of taxes that a shareholder would pay on fund distributions or the redemption of fund shares. During periods of reimbursement by Fidelity, a fund’s total return will be greater than it would be had the reimbursement not occurred. How a fund did yesterday is no guarantee of how it will do tomorrow.
Average Annual Total Returns
| For the periods ended July 31, 2016 | Past 1 year | Past 5 years | Past 10 years |
| Class A (incl. 4.00% sales charge) | 6.57% | 8.25% | 6.50% |
| Class T (incl. 4.00% sales charge) | 6.62% | 8.26% | 6.48% |
| Class C (incl. contingent deferred sales charge) | 9.29% | 8.36% | 6.43% |
| Class I | 11.30% | 9.44% | 7.11% |
Class A shares bear a 0.25% 12b-1 fee. The initial offering of Class A shares took place on April 14, 2010. Returns prior to April 14, 2010, are those of Fidelity® Real Estate Income Fund, the original class of the fund, which has no 12b-1 fee. Had Class A's 12b-1 fee been reflected, returns prior to April 14, 2010, would have been lower.
Class T shares bear a 0.25% 12b-1 fee. The initial offering of Class T shares took place on April 14, 2010. Returns prior to April 14, 2010, are those of Fidelity® Real Estate Income Fund, the original class of the fund, which has no 12b-1 fee. Had Class T's 12b-1 fee been reflected, returns prior to April 14, 2010, would have been lower.
Class C shares bear a 1.00% 12b-1 fee. The initial offering of Class C shares took place on April 14, 2010. Returns prior to April 14, 2010, are those of Fidelity® Real Estate Income Fund, the original class of the fund, which has no 12b-1 fee. Had Class C's 12b-1 fee been reflected, returns prior to April 14, 2010, would have been lower.
Class C shares' contingent deferred sales charges included in the past one year, past five years and past ten years total return figures are 1%, 0% and 0%, respectively.
The initial offering of Class I shares took place on April 14, 2010. Returns prior to April 14, 2010 are those of Fidelity® Real Estate Income Fund, the original class of the fund.
$10,000 Over 10 Years
Let's say hypothetically that $10,000 was invested in Fidelity Advisor® Real Estate Income Fund - Class A on July 31, 2006, and the current 4.00% sales charge was paid.
The chart shows how the value of your investment would have changed, and also shows how the S&P 500® Index performed over the same period.
See previous page for additional information regarding the performance of Class A.
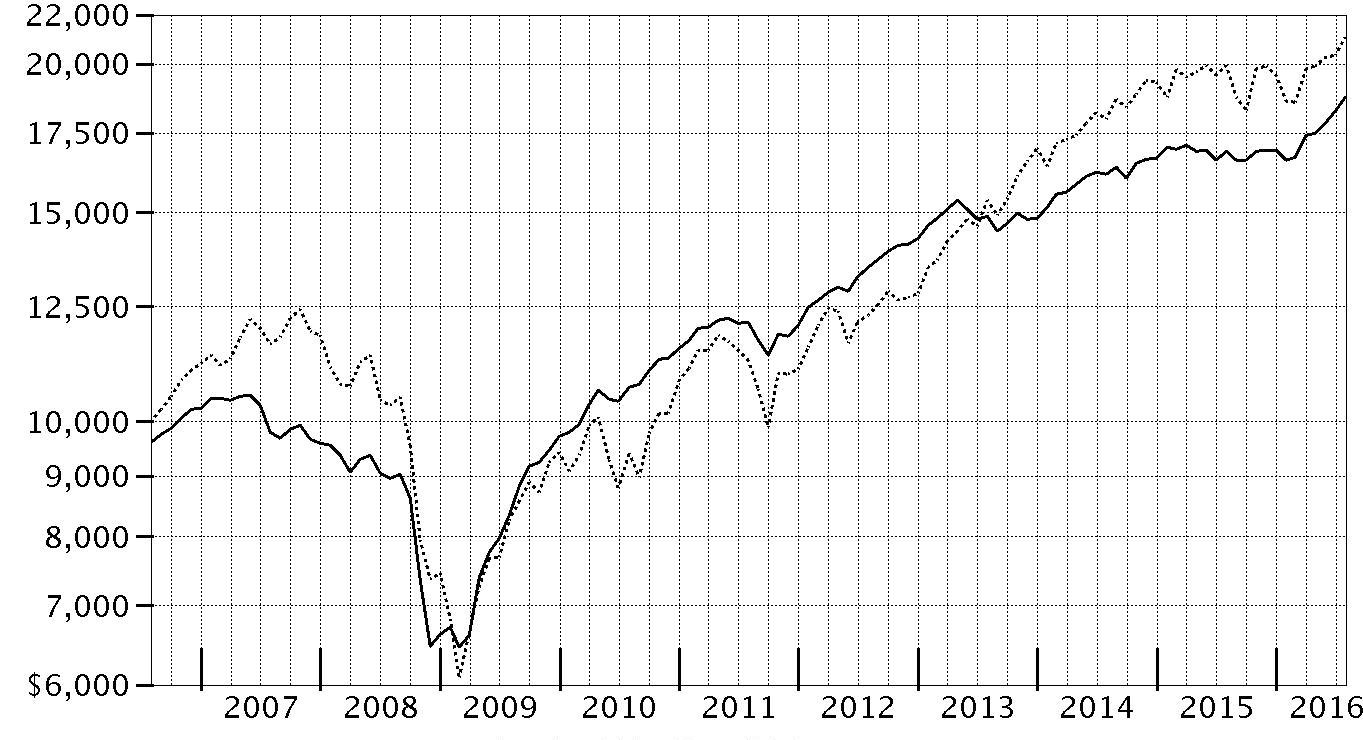
| Period Ending Values |
| $18,765 | Fidelity Advisor® Real Estate Income Fund - Class A |
| $21,089 | S&P 500® Index |
Management's Discussion of Fund Performance
Market Recap: Most types of real estate securities enjoyed a strong result for the 12 months ending July 31, 2016, due partly to investors’ continued search for yield. The fundamental backdrop remained solid across most property types and local markets, with the notable exceptions of hotels and, in certain markets, apartments. Real estate investment trust (REIT) common stocks performed particularly well the past 12 months, with the FTSE
® NAREIT
® All REITs Index gaining 21.53%, overcoming a two-month decline roughly midway through the period. Industrial REITs were particularly strong performers, as warehouse operators benefited from increased demand associated with e-commerce. Meanwhile, REIT preferred stocks, as measured by the MSCI REIT Preferred Index, rose 9.94%. Declining interest rates provided a tailwind for this rate-sensitive segment, as their income offerings became more attractive to investors seeking yield in a lower-rate environment. Looking at fixed-income securities, The BofA Merrill Lynch℠ US Real Estate Index, a market-capitalization-weighted measure of investment-grade corporate debt in the domestic real estate sector, gained 7.88%.
Comments from Portfolio Manager Mark Snyderman: For the year, the fund’s share classes (excluding sales charges, if applicable) posted low-double-digit gains, roughly in line with the 11.50% return of the Fidelity Real Estate Composite Index and well ahead of the broad-market S&P 500
®. In a strong market for real estate securities, the fund’s common stock and preferred equity investments performed particularly well, while most of the fund’s fixed-income holdings nearly kept pace with the overall real estate bond market, despite my continued focus on managing the portfolio’s exposure to interest rates. On the stock side, portfolio holdings in REIT common stocks gained about 24%, well ahead of the approximately 22% return produced by the FTSE
® NAREIT
® All REITs Index. Our preferred stock investments gained 12%, outpacing the MSCI preferred stock index by about two percentage points. The fund’s high-yield and investment-grade real estate bond holdings each lagged the 8% return of the BofA Merrill Lynch index, while our CMBS holdings returned about 3%, reflecting the weaker performance of this segment. Of final note, I maintained a 7% cash allocation, on average. I typically like to hold anywhere from 5% to 10% in cash securities, as it provides flexibility to invest in companies I like at times when others may be forced to sell. With essentially zero yield, however, our cash allocation detracted from results in a strong market.
The views expressed above reflect those of the portfolio manager(s) only through the end of the period as stated on the cover of this report and do not necessarily represent the views of Fidelity or any other person in the Fidelity organization. Any such views are subject to change at any time based upon market or other conditions and Fidelity disclaims any responsibility to update such views. These views may not be relied on as investment advice and, because investment decisions for a Fidelity fund are based on numerous factors, may not be relied on as an indication of trading intent on behalf of any Fidelity fund.
Investment Summary (Unaudited)
Top Five Stocks as of July 31, 2016
| | % of fund's net assets | % of fund's net assets 6 months ago |
| Equity Lifestyle Properties, Inc. | 3.9 | 4.2 |
| Acadia Realty Trust (SBI) | 2.9 | 3.1 |
| MFA Financial, Inc. | 2.7 | 2.8 |
| Ventas, Inc. | 2.4 | 2.0 |
| Apartment Investment & Management Co. Class A | 1.4 | 0.9 |
| | 13.3 | |
Top 5 Bonds as of July 31, 2016
| | % of fund's net assets | % of fund's net assets 6 months ago |
| IAS Operating Partnership LP 5% 3/15/18 | 0.8 | 0.8 |
| RAIT Financial Trust 4% 10/1/33 | 0.8 | 0.7 |
| RWT Holdings, Inc. 5.625% 11/15/19 | 0.8 | 0.6 |
| Senior Housing Properties Trust 4.75% 5/1/24 | 0.7 | 0.1 |
| Kennedy-Wilson, Inc. 5.875% 4/1/24 | 0.7 | 0.2 |
| | 3.8 | |
Top Five REIT Sectors as of July 31, 2016
| | % of fund's net assets | % of fund's net assets 6 months ago |
| REITs - Mortgage | 17.3 | 17.7 |
| REITs - Health Care | 7.9 | 6.4 |
| REITs - Apartments | 5.2 | 5.3 |
| REITs - Diversified | 5.2 | 2.4 |
| REITs - Shopping Centers | 4.6 | 5.7 |
Asset Allocation (% of fund's net assets)
| As of July 31, 2016* |
| | Common Stocks | 32.4% |
| | Preferred Stocks | 17.7% |
| | Bonds | 31.4% |
| | Convertible Securities | 6.5% |
| | Other Investments | 5.3% |
| | Short-Term Investments and Net Other Assets (Liabilities) | 6.7% |

* Foreign investments - 1.1%
| As of January 31, 2016* |
| | Common Stocks | 31.0% |
| | Preferred Stocks | 19.2% |
| | Bonds | 29.5% |
| | Convertible Securities | 5.7% |
| | Other Investments | 6.8% |
| | Short-Term Investments and Net Other Assets (Liabilities) | 7.8% |

* Foreign investments - 0.7%
Investments July 31, 2016
Showing Percentage of Net Assets
| Common Stocks - 32.4% | | | |
| | | Shares | Value |
| CONSUMER DISCRETIONARY - 0.1% | | | |
| Household Durables - 0.1% | | | |
| Stanley Martin Communities LLC Class B (a) | | 4,620 | $5,806,693 |
| FINANCIALS - 32.3% | | | |
| Capital Markets - 0.9% | | | |
| Brookfield Asset Management, Inc. Class A | | 492,000 | 16,990,985 |
| Ellington Financial LLC | | 1,140,284 | 19,635,690 |
| NorthStar Asset Management Group, Inc. | | 545,500 | 6,469,630 |
| | | | 43,096,305 |
| Real Estate Investment Trusts - 31.1% | | | |
| Acadia Realty Trust (SBI) | | 3,799,549 | 143,091,015 |
| AG Mortgage Investment Trust, Inc. | | 849,900 | 12,731,502 |
| American Tower Corp. | | 208,100 | 24,091,737 |
| Annaly Capital Management, Inc. | | 792,728 | 8,704,153 |
| Anworth Mortgage Asset Corp. | | 1,148,310 | 5,649,685 |
| Apartment Investment & Management Co. Class A | | 1,522,900 | 70,007,713 |
| Arbor Realty Trust, Inc. (b) | | 3,058,527 | 21,868,468 |
| AvalonBay Communities, Inc. | | 108,100 | 20,068,765 |
| Boardwalk (REIT) | | 219,500 | 9,429,598 |
| Care Capital Properties, Inc. | | 97,603 | 2,887,097 |
| CBL & Associates Properties, Inc. | | 1,788,353 | 21,978,858 |
| Cedar Shopping Centers, Inc. | | 838,510 | 6,741,620 |
| Chimera Investment Corp. | | 338,200 | 5,674,996 |
| Community Healthcare Trust, Inc. (c) | | 338,862 | 7,790,437 |
| CYS Investments, Inc. | | 827,839 | 7,409,159 |
| Douglas Emmett, Inc. | | 341,200 | 12,979,248 |
| Dynex Capital, Inc. | | 1,668,486 | 11,712,772 |
| Ellington Residential Mortgage REIT | | 260,000 | 3,676,400 |
| Equity Lifestyle Properties, Inc. | | 2,281,560 | 187,635,488 |
| Extra Space Storage, Inc. | | 518,300 | 44,584,166 |
| First Potomac Realty Trust | | 1,476,944 | 14,931,904 |
| Five Oaks Investment Corp. (c) | | 479,100 | 2,802,735 |
| Great Ajax Corp. (b) | | 1,416,687 | 19,621,115 |
| Healthcare Realty Trust, Inc. | | 264,600 | 9,567,936 |
| Invesco Mortgage Capital, Inc. | | 874,600 | 12,594,240 |
| Lexington Corporate Properties Trust | | 4,872,447 | 52,963,499 |
| MFA Financial, Inc. | | 17,592,122 | 132,292,757 |
| Mid-America Apartment Communities, Inc. | | 490,200 | 51,971,004 |
| Monmouth Real Estate Investment Corp. Class A | | 537,573 | 7,429,259 |
| Monogram Residential Trust, Inc. | | 1,980,900 | 21,215,439 |
| National Retail Properties, Inc. | | 179,200 | 9,526,272 |
| New Residential Investment Corp. | | 1,866,600 | 25,516,422 |
| New Senior Investment Group, Inc. | | 1,942,525 | 23,290,875 |
| Newcastle Investment Corp. | | 1,840,830 | 8,725,534 |
| NorthStar Realty Finance Corp. | | 3,591,659 | 48,128,231 |
| Potlatch Corp. | | 1,013,940 | 38,783,205 |
| Public Storage | | 13,600 | 3,249,312 |
| Sabra Health Care REIT, Inc. | | 1,106,003 | 26,444,532 |
| Select Income REIT | | 404,600 | 11,231,696 |
| Senior Housing Properties Trust (SBI) | | 2,994,400 | 66,505,624 |
| Store Capital Corp. | | 1,203,400 | 37,534,046 |
| Terreno Realty Corp. | | 1,654,764 | 46,085,177 |
| Two Harbors Investment Corp. | | 2,742,680 | 23,998,450 |
| Ventas, Inc. | | 1,522,086 | 115,922,070 |
| VEREIT, Inc. | | 1,442,934 | 15,958,850 |
| WP Carey, Inc. | | 791,000 | 57,466,150 |
| | | | 1,512,469,211 |
| Real Estate Management & Development - 0.3% | | | |
| Kennedy-Wilson Holdings, Inc. | | 620,621 | 13,064,072 |
|
| TOTAL FINANCIALS | | | 1,568,629,588 |
|
| TOTAL COMMON STOCKS | | | |
| (Cost $1,222,023,865) | | | 1,574,436,281 |
|
| Preferred Stocks - 18.4% | | | |
| Convertible Preferred Stocks - 0.7% | | | |
| FINANCIALS - 0.7% | | | |
| Real Estate Investment Trusts - 0.7% | | | |
| Alexandria Real Estate Equities, Inc. Series D, 7.00% | | 236,759 | 8,341,020 |
| Equity Commonwealth 6.50% | | 31,237 | 844,024 |
| Lexington Corporate Properties Trust Series C, 6.50% | | 468,742 | 23,741,782 |
| | | | 32,926,826 |
| Nonconvertible Preferred Stocks - 17.7% | | | |
| FINANCIALS - 17.7% | | | |
| Capital Markets - 0.1% | | | |
| Arlington Asset Investment Corp. 6.625% | | 182,517 | 4,143,136 |
| Real Estate Investment Trusts - 17.4% | | | |
| AG Mortgage Investment Trust, Inc.: | | | |
| 8.00% | | 611,662 | 15,218,151 |
| 8.25% | | 38,935 | 994,400 |
| Alexandria Real Estate Equities, Inc. Series E, 6.45% | | 145,913 | 3,793,738 |
| American Capital Agency Corp.: | | | |
| 8.00% | | 200,000 | 5,290,000 |
| Series B, 7.75% | | 427,100 | 11,164,394 |
| American Capital Mortgage Investment Corp. Series A, 8.125% | | 248,636 | 6,352,650 |
| American Home Mortgage Investment Corp.: | | | |
| Series A, 9.75% (d) | | 120,300 | 1 |
| Series B, 9.25% (d) | | 124,100 | 1 |
| American Homes 4 Rent: | | | |
| Series A, 5.00% | | 581,770 | 16,056,852 |
| Series B, 5.00% | | 377,286 | 10,413,094 |
| Series C, 5.50% | | 915,240 | 24,986,052 |
| Series D, 6.50% | | 280,000 | 7,450,800 |
| Series E, 6.35% | | 210,000 | 5,352,900 |
| Annaly Capital Management, Inc.: | | | |
| Series A, 7.875% | | 134,900 | 3,507,400 |
| Series C, 7.625% | | 326,429 | 8,467,568 |
| Series D, 7.50% | | 621,976 | 16,252,233 |
| Series E, 7.625% | | 672,961 | 17,449,879 |
| Anworth Mortgage Asset Corp. Series A, 8.625% | | 309,630 | 7,886,276 |
| Apollo Commercial Real Estate Finance, Inc. Series A, 8.625% | | 375,101 | 9,677,606 |
| Apollo Residential Mortgage, Inc. Series A, 8.00% | | 485,559 | 11,915,618 |
| Arbor Realty Trust, Inc.: | | | |
| 7.375% (b) | | 430,605 | 11,010,570 |
| Series A, 8.25% (b) | | 189,089 | 4,785,843 |
| Series B, 7.75% (b) | | 240,000 | 6,000,000 |
| Series C, 8.50% (b) | | 100,000 | 2,575,000 |
| Armour Residential REIT, Inc. Series B, 7.875% | | 153,654 | 3,587,821 |
| Ashford Hospitality Trust, Inc.: | | | |
| Series D, 8.45% | | 47,000 | 1,199,910 |
| Series E, 9.00% | | 178,291 | 4,494,716 |
| Series F, 7.375% | | 268,000 | 6,673,200 |
| Bluerock Residential Growth (REIT), Inc.: | | | |
| Series A, 8.25% | | 486,775 | 12,953,083 |
| Series C, 7.625% | | 134,300 | 3,511,945 |
| Brandywine Realty Trust Series E, 6.90% | | 95,000 | 2,455,750 |
| Capstead Mortgage Corp. Series E, 7.50% | | 202,984 | 5,153,764 |
| CBL & Associates Properties, Inc.: | | | |
| Series D, 7.375% | | 286,376 | 7,136,490 |
| Series E, 6.625% | | 139,398 | 3,530,951 |
| Cedar Shopping Centers, Inc. Series B, 7.25% | | 415,750 | 10,938,383 |
| Chesapeake Lodging Trust Series A, 7.75% | | 266,916 | 7,049,252 |
| Colony Financial, Inc.: | | | |
| Series A, 8.50% | | 283,920 | 7,404,634 |
| Series B, 7.50% | | 108,867 | 2,768,488 |
| Series C, 7.125% | | 552,328 | 13,642,502 |
| Coresite Realty Corp. Series A, 7.25% | | 369,799 | 9,781,184 |
| Corporate Office Properties Trust Series L, 7.375% | | 167,140 | 4,407,482 |
| CubeSmart Series A, 7.75% | | 40,000 | 1,025,600 |
| CYS Investments, Inc.: | | | |
| Series A, 7.75% | | 118,428 | 2,886,090 |
| Series B, 7.50% | | 496,667 | 11,711,408 |
| DDR Corp.: | | | |
| Series J, 6.50% | | 340,721 | 8,794,009 |
| Series K, 6.25% | | 228,888 | 5,925,910 |
| Digital Realty Trust, Inc.: | | | |
| Series E, 7.00% | | 219,819 | 5,598,790 |
| Series G, 5.875% | | 145,444 | 3,806,269 |
| Series H, 7.375% | | 50,000 | 1,430,000 |
| DuPont Fabros Technology, Inc. Series C, 6.625% | | 84,000 | 2,362,080 |
| Dynex Capital, Inc.: | | | |
| Series A, 8.50% | | 362,932 | 9,236,619 |
| Series B, 7.625% | | 252,120 | 6,151,728 |
| Equity Lifestyle Properties, Inc. Series C, 6.75% | | 950,148 | 24,732,352 |
| Five Oaks Investment Corp. Series A, 8.75% | | 142,000 | 3,109,800 |
| General Growth Properties, Inc. Series A, 6.375% | | 166,463 | 4,411,270 |
| Gladstone Commercial Corp.: | | | |
| Series C, 7.125% | | 81,435 | 2,055,419 |
| Series D, 7.00% | | 200,000 | 5,106,000 |
| Government Properties Income Trust 5.875% | | 202,500 | 5,198,175 |
| Hersha Hospitality Trust: | | | |
| Series C, 6.875% | | 50,000 | 1,263,000 |
| Series D, 6.50% | | 200,000 | 5,058,000 |
| Hospitality Properties Trust Series D, 7.125% | | 40,800 | 1,075,488 |
| Invesco Mortgage Capital, Inc.: | | | |
| Series A, 7.75% | | 123,342 | 3,145,221 |
| Series B, 7.75% | | 844,337 | 21,505,263 |
| Investors Real Estate Trust Series B, 7.95% | | 126,572 | 3,335,172 |
| iStar Financial, Inc.: | | | |
| Series D, 8.00% | | 74,567 | 1,826,892 |
| Series E, 7.875% | | 281,296 | 6,714,536 |
| Series F, 7.80% | | 451,476 | 10,758,673 |
| Series G, 7.65% | | 10,497 | 245,630 |
| Kilroy Realty Corp.: | | | |
| Series G, 6.875% | | 46,760 | 1,201,264 |
| Series H, 6.375% | | 143,296 | 3,676,975 |
| LaSalle Hotel Properties: | | | |
| Series H, 7.50% | | 141,308 | 3,623,137 |
| Series I, 6.375% | | 354,698 | 9,222,148 |
| Series J, 6.30% | | 240,000 | 6,477,600 |
| MFA Financial, Inc.: | | | |
| 8.00% | | 538,930 | 13,812,776 |
| Series B, 7.50% | | 616,232 | 15,843,325 |
| Monmouth Real Estate Investment Corp.: | | | |
| Series A, 7.625% | | 80,000 | 2,160,000 |
| Series B, 7.875% | | 95,000 | 2,534,600 |
| National Retail Properties, Inc.: | | | |
| Series D, 6.625% | | 222,138 | 5,775,588 |
| Series E, 5.70% | | 301,404 | 7,993,234 |
| New York Mortgage Trust, Inc.: | | | |
| Series B, 7.75% | | 254,840 | 6,054,998 |
| Series C, 7.875% | | 244,689 | 5,769,767 |
| Newcastle Investment Corp.: | | | |
| Series B, 9.75% | | 17,942 | 465,954 |
| Series D, 8.375% | | 2,000 | 50,300 |
| NorthStar Realty Finance Corp.: | | | |
| Series A, 8.75% | | 7,890 | 200,722 |
| Series B, 8.25% | | 429,039 | 10,816,073 |
| Series C, 8.875% | | 329,101 | 8,471,060 |
| Series D, 8.50% | | 270,715 | 6,857,211 |
| Series E, 8.75% | | 481,729 | 12,245,551 |
| Pebblebrook Hotel Trust: | | | |
| Series B, 8.00% | | 185,085 | 4,699,308 |
| Series C, 6.50% | | 204,321 | 5,332,778 |
| Series D, 6.375% | | 350,000 | 9,712,500 |
| Pennsylvania (REIT) Series B, 7.375% | | 100,510 | 2,653,464 |
| Prologis, Inc. Series Q, 8.54% | | 94,446 | 6,661,399 |
| PS Business Parks, Inc.: | | | |
| Series S, 6.45% | | 93,809 | 2,451,229 |
| Series T, 6.00% | | 198,899 | 5,187,286 |
| Public Storage Series Y, 6.375% | | 122,000 | 3,447,720 |
| RAIT Financial Trust: | | | |
| 7.125% | | 336,786 | 8,372,500 |
| 7.625% | | 224,590 | 5,257,652 |
| Regency Centers Corp.: | | | |
| Series 6, 6.625% | | 152,661 | 3,956,973 |
| Series 7, 6.00% | | 176,250 | 4,573,688 |
| Resource Capital Corp. 8.625% | | 156,870 | 3,509,182 |
| Retail Properties America, Inc. Series A, 7.00% | | 394,411 | 10,649,097 |
| Sabra Health Care REIT, Inc. Series A, 7.125% | | 318,623 | 8,555,028 |
| Saul Centers, Inc. Series C, 6.875% | | 315,478 | 8,341,238 |
| Stag Industrial, Inc.: | | | |
| Series A, 9.00% | | 280,000 | 7,196,000 |
| Series B, 6.625% | | 80,300 | 2,115,102 |
| Series C, 6.875% | | 83,000 | 2,266,730 |
| Summit Hotel Properties, Inc.: | | | |
| Series A, 9.25% | | 138,340 | 3,583,006 |
| Series B, 7.875% | | 190,173 | 5,085,226 |
| Series C, 7.125% | | 153,212 | 4,037,136 |
| Series D, 6.45% | | 210,000 | 5,439,000 |
| Sun Communities, Inc. Series A, 7.125% | | 375,000 | 9,825,000 |
| Sunstone Hotel Investors, Inc.: | | | |
| Series E, 6.95% | | 42,000 | 1,144,500 |
| Series F, 6.45% | | 84,000 | 2,196,600 |
| Taubman Centers, Inc. Series K, 6.25% | | 157,322 | 4,120,263 |
| Terreno Realty Corp. Series A, 7.75% | | 213,890 | 5,653,113 |
| UMH Properties, Inc.: | | | |
| Series A, 8.25% | | 600,200 | 15,755,250 |
| Series B, 8.00% | | 321,929 | 8,724,276 |
| Urstadt Biddle Properties, Inc.: | | | |
| Series F, 7.125% | | 210,000 | 5,577,600 |
| Series G, 6.75% | | 160,000 | 4,337,600 |
| VEREIT, Inc. Series F, 6.70% | | 2,038,849 | 55,089,700 |
| Wells Fargo Real Estate Investment Corp. Series A, 6.375% | | 137,600 | 3,826,656 |
| Welltower, Inc. 6.50% | | 81,600 | 2,166,480 |
| WP Glimcher, Inc.: | | | |
| Series H, 7.50% | | 198,527 | 5,147,805 |
| Series I, 6.875% | | 256,115 | 6,812,659 |
| | | | 848,473,002 |
| Real Estate Management & Development - 0.2% | | | |
| Kennedy-Wilson, Inc. 7.75% | | 321,574 | 8,444,533 |
| TOTAL FINANCIALS | | | 861,060,671 |
| TOTAL PREFERRED STOCKS | | | |
| (Cost $846,139,860) | | | 893,987,497 |
| | | Principal Amount | Value |
|
| Corporate Bonds - 20.3% | | | |
| Convertible Bonds - 5.8% | | | |
| FINANCIALS - 5.8% | | | |
| Consumer Finance - 0.0% | | | |
| Zais Financial Partners LP 8% 11/15/16 (e) | | 2,000,000 | 1,985,000 |
| Diversified Financial Services - 0.8% | | | |
| RWT Holdings, Inc. 5.625% 11/15/19 | | 36,880,000 | 37,202,700 |
| Real Estate Investment Trusts - 4.1% | | | |
| American Realty Capital Properties, Inc. 3.75% 12/15/20 | | 25,928,000 | 26,252,100 |
| Apollo Commercial Real Estate Finance, Inc. 5.5% 3/15/19 | | 5,600,000 | 5,722,500 |
| Blackstone Mortgage Trust, Inc. 5.25% 12/1/18 | | 4,900,000 | 5,282,813 |
| Colony Financial, Inc.: | | | |
| 3.875% 1/15/21 | | 15,580,000 | 15,161,288 |
| 5% 4/15/23 | | 26,083,000 | 25,675,453 |
| NorthStar Realty Finance LP 7.25% 6/15/27 (e) | | 562,000 | 537,244 |
| PennyMac Corp. 5.375% 5/1/20 | | 28,556,000 | 27,556,540 |
| RAIT Financial Trust 4% 10/1/33 | | 42,310,000 | 38,475,656 |
| Redwood Trust, Inc. 4.625% 4/15/18 | | 14,700,000 | 14,700,000 |
| Resource Capital Corp.: | | | |
| 6% 12/1/18 | | 6,910,000 | 6,668,150 |
| 8% 1/15/20 | | 16,490,000 | 16,292,780 |
| Starwood Property Trust, Inc.: | | | |
| 3.75% 10/15/17 | | 10,750,000 | 10,938,125 |
| 4.55% 3/1/18 | | 3,846,000 | 4,098,394 |
| | | | 197,361,043 |
| Real Estate Management & Development - 0.1% | | | |
| Consolidated-Tomoka Land Co. 4.5% 3/15/20 | | 3,350,000 | 3,230,656 |
| Thrifts & Mortgage Finance - 0.8% | | | |
| IAS Operating Partnership LP 5% 3/15/18 (e) | | 42,350,000 | 41,926,500 |
| TOTAL FINANCIALS | | | 281,705,899 |
| Nonconvertible Bonds - 14.5% | | | |
| CONSUMER DISCRETIONARY - 3.7% | | | |
| Hotels, Restaurants & Leisure - 0.5% | | | |
| ESH Hospitality, Inc. 5.25% 5/1/25 (e) | | 8,040,000 | 7,999,800 |
| FelCor Lodging LP: | | | |
| 5.625% 3/1/23 | | 2,000,000 | 2,050,000 |
| 6% 6/1/25 | | 2,025,000 | 2,090,813 |
| Hilton Worldwide Finance LLC/Hilton Worldwide Finance Corp. 5.625% 10/15/21 | | 4,000,000 | 4,145,160 |
| Times Square Hotel Trust 8.528% 8/1/26 (e) | | 7,508,963 | 8,912,886 |
| | | | 25,198,659 |
| Household Durables - 3.1% | | | |
| Ashton Woods U.S.A. LLC/Ashton Woods Finance Co. 6.875% 2/15/21 (e) | | 13,825,000 | 13,202,875 |
| Brookfield Residential Properties, Inc./Brookfield Residential U.S. Corp. 6.125% 7/1/22 (e) | | 3,725,000 | 3,687,750 |
| Brookfield Residential Properties, Inc.: | | | |
| 6.375% 5/15/25 (e) | | 3,100,000 | 2,991,500 |
| 6.5% 12/15/20 (e) | | 12,085,000 | 12,326,700 |
| CalAtlantic Group, Inc.: | | | |
| 5.875% 11/15/24 | | 3,250,000 | 3,469,375 |
| 8.375% 5/15/18 | | 13,458,000 | 14,803,800 |
| D.R. Horton, Inc.: | | | |
| 4.375% 9/15/22 | | 4,175,000 | 4,404,625 |
| 4.75% 5/15/17 | | 2,000,000 | 2,037,500 |
| 5.75% 8/15/23 | | 2,510,000 | 2,798,650 |
| KB Home: | | | |
| 8% 3/15/20 | | 8,465,000 | 9,353,825 |
| 9.1% 9/15/17 | | 4,985,000 | 5,321,488 |
| Lennar Corp.: | | | |
| 4.125% 12/1/18 | | 5,520,000 | 5,671,800 |
| 4.5% 6/15/19 | | 1,830,000 | 1,916,925 |
| 4.5% 11/15/19 | | 2,000,000 | 2,102,500 |
| M/I Homes, Inc. 6.75% 1/15/21 | | 3,803,000 | 3,917,090 |
| Meritage Homes Corp.: | | | |
| 6% 6/1/25 | | 4,000,000 | 4,167,520 |
| 7% 4/1/22 | | 7,525,000 | 8,258,688 |
| 7.15% 4/15/20 | | 7,060,000 | 7,713,050 |
| Ryland Group, Inc.: | | | |
| 6.625% 5/1/20 | | 1,555,000 | 1,726,050 |
| 8.4% 5/15/17 | | 5,420,000 | 5,677,450 |
| Taylor Morrison Communities, Inc./Monarch Communities, Inc. 5.875% 4/15/23 (e) | | 4,100,000 | 4,223,000 |
| TRI Pointe Homes, Inc. 5.875% 6/15/24 | | 3,890,000 | 4,006,700 |
| WCI Communities, Inc. 6.875% 8/15/21 | | 1,845,000 | 1,895,738 |
| William Lyon Homes, Inc.: | | | |
| 7% 8/15/22 | | 8,180,000 | 8,261,800 |
| 8.5% 11/15/20 | | 15,550,000 | 16,366,375 |
| | | | 150,302,774 |
| Media - 0.0% | | | |
| CBS Outdoor Americas Capital LLC/CBS Outdoor Americas Capital Corp. 5.625% 2/15/24 | | 1,300,000 | 1,371,500 |
| Multiline Retail - 0.1% | | | |
| JC Penney Corp., Inc. 5.875% 7/1/23 (e) | | 3,175,000 | 3,254,693 |
| TOTAL CONSUMER DISCRETIONARY | | | 180,127,626 |
| CONSUMER STAPLES - 0.2% | | | |
| Food & Staples Retailing - 0.2% | | | |
| Ahold Lease Series 2001 A1 pass thru trust certificates 7.82% 1/2/20 | | 428,368 | 465,450 |
| Albertsons Companies LLC/Safeway, Inc./New Albertson's, Inc./Albertson's LLC 6.625% 6/15/24 (e) | | 4,835,000 | 5,137,188 |
| C&S Group Enterprises LLC 5.375% 7/15/22 (e) | | 5,860,000 | 5,625,600 |
| | | | 11,228,238 |
| FINANCIALS - 10.0% | | | |
| Diversified Financial Services - 0.5% | | | |
| Brixmor Operating Partnership LP: | | | |
| 3.85% 2/1/25 | | 8,384,000 | 8,535,994 |
| 4.125% 6/15/26 | | 2,000 | 2,073 |
| Icahn Enterprises LP/Icahn Enterprises Finance Corp.: | | | |
| 5.875% 2/1/22 | | 3,680,000 | 3,514,400 |
| 6% 8/1/20 | | 12,690,000 | 12,658,275 |
| | | | 24,710,742 |
| Real Estate Investment Trusts - 6.9% | | | |
| American Campus Communities Operating Partnership LP 4.125% 7/1/24 | | 2,000,000 | 2,128,240 |
| ARC Properties Operating Partnership LP 4.6% 2/6/24 | | 15,480,000 | 16,176,600 |
| Care Capital Properties LP 5.125% 8/15/26 (e) | | 8,454,000 | 8,563,074 |
| CBL & Associates LP: | | | |
| 4.6% 10/15/24 | | 21,758,000 | 20,538,660 |
| 5.25% 12/1/23 | | 11,500,000 | 11,391,969 |
| Corporate Office Properties LP 3.6% 5/15/23 | | 5,000,000 | 4,978,470 |
| Crown Castle International Corp. 5.25% 1/15/23 | | 4,000,000 | 4,578,640 |
| CTR Partnership LP/CareTrust Capital Corp. 5.875% 6/1/21 | | 12,182,000 | 12,486,550 |
| CubeSmart LP 4.8% 7/15/22 | | 2,000,000 | 2,223,318 |
| DDR Corp.: | | | |
| 7.5% 7/15/18 | | 8,756,000 | 9,632,432 |
| 7.875% 9/1/20 | | 4,637,000 | 5,614,405 |
| DuPont Fabros Technology LP 5.875% 9/15/21 | | 1,000,000 | 1,048,125 |
| HCP, Inc. 4% 6/1/25 | | 1,000,000 | 1,022,949 |
| Health Care Property Investors, Inc.: | | | |
| 5.625% 5/1/17 | | 2,980,000 | 3,072,165 |
| 6% 1/30/17 | | 2,383,000 | 2,436,760 |
| Health Care REIT, Inc.: | | | |
| 4% 6/1/25 | | 1,551,000 | 1,653,941 |
| 4.125% 4/1/19 | | 2,000,000 | 2,111,258 |
| Healthcare Realty Trust, Inc.: | | | |
| 3.75% 4/15/23 | | 4,022,000 | 4,071,310 |
| 5.75% 1/15/21 | | 3,095,000 | 3,498,737 |
| Highwoods/Forsyth LP: | | | |
| 3.625% 1/15/23 | | 1,607,000 | 1,647,377 |
| 5.85% 3/15/17 | | 2,800,000 | 2,872,615 |
| Hospitality Properties Trust: | | | |
| 5% 8/15/22 | | 3,177,000 | 3,442,159 |
| 5.625% 3/15/17 | | 915,000 | 935,903 |
| HRPT Properties Trust: | | | |
| 6.25% 6/15/17 | | 1,055,000 | 1,072,351 |
| 6.65% 1/15/18 | | 4,246,000 | 4,422,778 |
| iStar Financial, Inc.: | | | |
| 4% 11/1/17 | | 27,605,000 | 27,397,963 |
| 5% 7/1/19 | | 24,265,000 | 23,901,025 |
| 5.85% 3/15/17 | | 3,587,000 | 3,622,870 |
| 7.125% 2/15/18 | | 5,725,000 | 5,896,750 |
| 9% 6/1/17 | | 9,175,000 | 9,542,000 |
| MPT Operating Partnership LP/MPT Finance Corp.: | | | |
| 5.25% 8/1/26 | | 4,385,000 | 4,609,731 |
| 6.375% 2/15/22 | | 3,610,000 | 3,790,500 |
| 6.375% 3/1/24 | | 4,000,000 | 4,360,000 |
| 6.875% 5/1/21 | | 2,000,000 | 2,070,600 |
| National Retail Properties, Inc. 3.3% 4/15/23 | | 2,000,000 | 2,046,450 |
| Omega Healthcare Investors, Inc.: | | | |
| 4.5% 4/1/27 | | 2,462,000 | 2,454,949 |
| 4.95% 4/1/24 | | 2,898,000 | 3,012,894 |
| Potlatch Corp. 7.5% 11/1/19 | | 1,000,000 | 1,105,000 |
| Reckson Operating Partnership LP/SL Green Realty Corp./SL Green Operating Partnership LP 7.75% 3/15/20 | | 2,000,000 | 2,327,996 |
| Select Income REIT: | | | |
| 4.15% 2/1/22 | | 6,937,000 | 6,988,306 |
| 4.5% 2/1/25 | | 19,802,000 | 19,656,257 |
| Senior Housing Properties Trust: | | | |
| 3.25% 5/1/19 | | 2,882,000 | 2,909,967 |
| 4.75% 5/1/24 | | 33,918,000 | 34,984,891 |
| 6.75% 4/15/20 | | 13,624,000 | 15,054,983 |
| 6.75% 12/15/21 | | 8,000,000 | 9,224,552 |
| VEREIT Operating Partnership LP 4.875% 6/1/26 | | 10,945,000 | 11,492,250 |
| WP Carey, Inc.: | | | |
| 4% 2/1/25 | | 5,000,000 | 4,965,970 |
| 4.6% 4/1/24 | | 3,355,000 | 3,490,488 |
| | | | 336,527,178 |
| Real Estate Management & Development - 2.3% | | | |
| CBRE Group, Inc.: | | | |
| 5% 3/15/23 | | 6,020,000 | 6,296,065 |
| 5.25% 3/15/25 | | 3,295,000 | 3,523,521 |
| Host Hotels & Resorts LP 5.25% 3/15/22 | | 2,000,000 | 2,212,212 |
| Howard Hughes Corp. 6.875% 10/1/21 (e) | | 23,985,000 | 24,884,438 |
| Hunt Companies, Inc. 9.625% 3/1/21 (e) | | 7,460,000 | 7,571,900 |
| Kennedy-Wilson, Inc. 5.875% 4/1/24 | | 31,370,000 | 31,683,700 |
| Mid-America Apartments LP: | | | |
| 3.75% 6/15/24 | | 1,663,000 | 1,744,439 |
| 6.05% 9/1/16 | | 2,500,000 | 2,508,413 |
| Realogy Group LLC/Realogy Co.-Issuer Corp.: | | | |
| 4.5% 4/15/19 (e) | | 4,805,000 | 4,985,188 |
| 4.875% 6/1/23 (e) | | 3,365,000 | 3,415,475 |
| 5.25% 12/1/21 (e) | | 8,290,000 | 8,663,050 |
| Regency Centers LP 5.875% 6/15/17 | | 300,000 | 310,710 |
| Taylor Morrison Communities, Inc./Monarch Communities, Inc.: | | | |
| 5.25% 4/15/21 (e) | | 7,000,000 | 7,122,500 |
| 5.625% 3/1/24 (e) | | 2,270,000 | 2,304,050 |
| Ventas Realty LP/Ventas Capital Corp. 4% 4/30/19 | | 2,262,000 | 2,386,238 |
| Wells Operating Partnership II LP 5.875% 4/1/18 | | 3,000,000 | 3,178,155 |
| | | | 112,790,054 |
| Thrifts & Mortgage Finance - 0.3% | | | |
| Cantor Commercial Real Estate Co. LP/CCRE Finance Corp. 7.75% 2/15/18 (e) | | 4,755,000 | 4,707,450 |
| Ocwen Financial Corp. 6.625% 5/15/19 | | 14,073,000 | 9,886,283 |
| | | | 14,593,733 |
| TOTAL FINANCIALS | | | 488,621,707 |
| HEALTH CARE - 0.4% | | | |
| Health Care Providers & Services - 0.4% | | | |
| Sabra Health Care LP/Sabra Capital Corp.: | | | |
| 5.375% 6/1/23 | | 5,230,000 | 5,269,225 |
| 5.5% 2/1/21 | | 12,305,000 | 12,827,963 |
| | | | 18,097,188 |
| INDUSTRIALS - 0.1% | | | |
| Industrial Conglomerates - 0.1% | | | |
| Ladder Capital Finance Holdings LLLP/Ladder Capital Finance Corp. 7.375% 10/1/17 | | 3,050,000 | 3,088,125 |
| INFORMATION TECHNOLOGY - 0.1% | | | |
| Internet Software & Services - 0.1% | | | |
| CyrusOne LP/CyrusOne Finance Corp. 6.375% 11/15/22 | | 4,000,000 | 4,190,000 |
|
| TOTAL NONCONVERTIBLE BONDS | | | 705,352,884 |
|
| TOTAL CORPORATE BONDS | | | |
| (Cost $954,512,135) | | | 987,058,783 |
|
| Asset-Backed Securities - 2.3% | | | |
| American Homes 4 Rent: | | | |
| Series 2014-SFR1 Class E, 2.9461% 6/17/31 (e)(f) | | 6,698,000 | 6,408,173 |
| Series 2014-SFR2 Class E, 6.231% 10/17/36 (e) | | 3,000,000 | 3,247,094 |
| Series 2014-SFR3 Class E, 6.418% 12/17/36 (e) | | 9,025,000 | 9,895,200 |
| Series 2015-SFR1: | | | |
| Class E, 5.639% 4/17/52 (e) | | 1,999,310 | 2,079,419 |
| Class F, 5.885% 4/17/52 (e) | | 2,000,000 | 1,963,554 |
| Series 2015-SFR2: | | | |
| Class E, 6.07% 10/17/45 (e) | | 8,259,000 | 8,844,185 |
| Class XS, 0% 10/17/45 (e)(f)(g) | | 4,849,315 | 48 |
| Capital Trust RE CDO Ltd. Series 2005-1A Class D, 1.9866% 3/20/50 (e)(f) | | 2,250,000 | 225 |
| CapLease CDO Ltd. Series 2005-1A Class A, 4.926% 1/29/40 (e) | | 722,850 | 724,803 |
| Conseco Finance Securitizations Corp. Series 2002-2 Class M2, 9.163% 3/1/33 | | 492,032 | 430,987 |
| Crest Clarendon Street Ltd./Crest Clarendon Corp. Series 2002-1A Class D, 9% 12/28/35 (e) | | 278,763 | 82,812 |
| Deutsche Financial Capital Securitization LLC Series 1997-I Class M, 7.275% 9/15/27 | | 4,450,694 | 4,614,236 |
| Green Tree Financial Corp.: | | | |
| Series 1996-4 Class M1, 7.75% 6/15/27 (f) | | 1,307,311 | 1,296,388 |
| Series 1997-3 Class M1, 7.53% 3/15/28 | | 6,658,526 | 6,655,361 |
| Invitation Homes Trust: | | | |
| Series 2013-SFR1 Class F, 4.101% 12/17/30 (e)(f) | | 1,750,000 | 1,713,832 |
| Series 2014-SFR1: | | | |
| Class E, 3.6961% 6/17/31 (e)(f) | | 10,000,000 | 9,877,155 |
| Class F, 4.1961% 6/17/31 (e)(f) | | 9,504,000 | 9,273,725 |
| Series 2014-SFR3: | | | |
| Class E, 4.9461% 12/17/31 (e)(f) | | 4,336,000 | 4,403,042 |
| Class F, 5.4461% 12/17/31 (e)(f) | | 2,215,000 | 2,232,319 |
| Series 2015-SFR2 Class E, 3.5971% 6/17/32 (e)(f) | | 2,450,000 | 2,405,656 |
| Series 2015-SFR3 Class F, 5.1961% 8/17/32 (e)(f) | | 2,000,000 | 2,003,672 |
| Series 2015-SRF1 Class F, 4.7461% 3/17/32 (e)(f) | | 5,500,000 | 5,436,015 |
| Lehman ABS Manufactured Housing Contract Trust Series 2001-B Class M2, 7.17% 4/15/40 | | 912,073 | 639,310 |
| Merit Securities Corp. Series 13 Class M1, 7.8304% 12/28/33 (f) | | 1,923,000 | 2,000,267 |
| Progress Residential Trust: | | | |
| Series 2015-SFR1 Class E, 4.483% 2/17/32 (e)(f) | | 1,500,000 | 1,504,976 |
| Series 2015-SFR3 Class F, 6.643% 11/12/32 (e) | | 2,940,000 | 3,017,104 |
| Series 2016-SFR1 Class F, 5.4821% 9/17/33 (e)(f) | | 8,459,000 | 8,534,903 |
| Starwood Waypoint Residential Trust Series 2014-1 Class F, 4.9961% 1/17/32 (e)(f) | | 4,071,000 | 4,025,785 |
| Taberna Preferred Funding III Ltd. Series 2005-3A Class D, 3.2829% 2/5/36 (e)(f) | | 4,037,577 | 404 |
| VB-S1 Issuer LLC Series 2016-1A Class F, 6.901% 6/15/46 (e) | | 7,797,000 | 7,828,921 |
| Wrightwood Capital Real Estate CDO Ltd. Series 2005-1A: | | | |
| Class A1, 0.9382% 11/21/40 (e)(f) | | 1,990,796 | 1,956,883 |
| Class F, 2.5682% 11/21/40 (e)(f) | | 250,000 | 125,474 |
| TOTAL ASSET-BACKED SECURITIES | | | |
| (Cost $115,474,944) | | | 113,221,928 |
|
| Collateralized Mortgage Obligations - 0.2% | | | |
| Private Sponsor - 0.2% | | | |
| Countrywide Home Loans, Inc.: | | | |
| Series 2002-R2 Class 2B3, 3.7124% 7/25/33 (e)(f) | | 151,839 | 22,338 |
| Series 2003-R3 Class B2, 5.5% 11/25/33 (e) | | 198,868 | 2,655 |
| FREMF Mortgage Trust: | | | |
| Series 2010-K6 Class B, 5.5327% 12/25/46 (e)(f) | | 4,500,000 | 4,911,560 |
| Series 2010-K7 Class B, 5.6244% 4/25/20 (e)(f) | | 3,200,000 | 3,563,855 |
| Merrill Lynch Mortgage Investors Trust Series 1998-C3 Class F, 6% 12/15/30 (e) | | 298,176 | 300,330 |
| RESI Finance LP/RESI Finance DE Corp. floater Series 2003-B Class B9, 12.3953% 6/10/35 (e)(f) | | 86,014 | 65,206 |
| Residential Funding Securities Corp. Series 2002-RM1 Class BI1, 5.5% 12/25/17 (e) | | 5,422 | 5,178 |
| RESIX Finance Ltd. floater: | | | |
| Series 2003-D Class B8, 6.9379% 12/10/35 (e)(f) | | 105,447 | 13,670 |
| Series 2004-A Class B7, 4.6879% 2/10/36 (e)(f) | | 107,029 | 32,465 |
| Series 2004-B Class B7, 4.4379% 2/10/36 (e)(f) | | 132,495 | 36,381 |
|
| TOTAL PRIVATE SPONSOR | | | 8,953,638 |
|
| U.S. Government Agency - 0.0% | | | |
| Fannie Mae REMIC Trust: | | | |
| Series 2001-W3 subordinate REMIC pass thru certificates, Class B3, 7% 9/25/41 (a) | | 53,996 | 4,155 |
| Series 2002-W1 subordinate REMIC pass thru certificates, Class 3B3, 3.2341% 2/25/42 (e)(f) | | 63,841 | 46,007 |
| Series 2003-W1 subordinate REMIC pass thru certificates, Class B3, 4.08% 12/25/42 (a)(f) | | 87,161 | 13,363 |
| Series 2003-W10 subordinate REMIC pass thru certificates, Class 2B3, 3.2087% 6/25/43 (e)(f) | | 101,389 | 67,798 |
| Series 2003-W4 subordinate REMIC pass thru certificates, Class 2B3, 3.1308% 10/25/42 (e)(f) | | 44,538 | 11,334 |
|
| TOTAL U.S. GOVERNMENT AGENCY | | | 142,657 |
|
| TOTAL COLLATERALIZED MORTGAGE OBLIGATIONS | | | |
| (Cost $9,030,796) | | | 9,096,295 |
|
| Commercial Mortgage Securities - 14.4% | | | |
| Americold LLC Trust Series 2010-ARTA Class D, 7.443% 1/14/29 (e) | | 2,000,000 | 2,237,270 |
| Banc of America Commercial Mortgage Trust: | | | |
| Series 2005-1 Class CJ, 5.5273% 11/10/42 (f) | | 642,708 | 642,137 |
| Series 2005-5 Class D, 5.5734% 10/10/45 (f) | | 1,810,745 | 1,810,942 |
| Bank of America Commercial Mortgage Trust Series 2015-UBS7 Class D, 3.167% 9/15/48 | | 1,000,000 | 783,085 |
| Barclays Commercial Mortgage Securities LLC Series 2015-STP: | | | |
| Class E, 4.4272% 9/10/28 (e)(f) | | 8,341,000 | 7,758,640 |
| Class F, 4.4272% 9/10/28 (e)(f) | | 4,074,000 | 3,702,373 |
| Bear Stearns Commercial Mortgage Securities Trust Series 2006-T22 Class B, 5.9067% 4/12/38 (e)(f) | | 2,234,360 | 2,241,131 |
| Bear Stearns Commercial Mortgage Securities Trust, Series 2006-PWR11 Class AJ, 5.5616% 3/11/39 (f) | | 5,700,000 | 5,443,500 |
| BLCP Hotel Trust floater Series 2014-CLRN Class F, 3.5146% 8/15/29 (e)(f) | | 2,500,000 | 2,299,434 |
| CCRESG Commercial Mortgage Trust Series 2016-HEAT: | | | |
| Class E, 5.6712% 4/10/29 (e)(f) | | 4,536,000 | 4,400,670 |
| Class F, 5.6712% 4/10/29 (e)(f) | | 9,710,000 | 8,959,282 |
| CGBAM Commercial Mortgage Trust: | | | |
| floater Series 2014-HD Class E, 3.4421% 2/15/31 (e)(f) | | 5,769,000 | 5,449,450 |
| Series 2015-SMRT: | | | |
| Class E, 3.9121% 4/10/28 (e)(f) | | 3,023,000 | 2,918,551 |
| Class F, 3.9121% 4/10/28 (e)(f) | | 9,911,000 | 9,349,205 |
| CGGS Commercial Mortgage Trust Series 2016-RND Class DFL, 5.1921% 2/15/33 (e)(f) | | 2,100,000 | 2,133,735 |
| Citigroup Commercial Mortgage Trust: | | | |
| Series 2013-GC15 Class D, 5.2737% 9/10/46 (e)(f) | | 5,254,000 | 5,145,853 |
| Series 2015-SHP2 Class E, 4.7921% 7/15/27 (e)(f) | | 2,933,000 | 2,730,187 |
| COMM Mortgage Trust: | | | |
| sequential payer Series 2013-LC6 Class E, 3.5% 1/10/46 (e) | | 7,300,000 | 5,135,185 |
| Series 2012-CR5 Class D, 4.4787% 12/10/45 (e)(f) | | 2,000,000 | 1,984,082 |
| Series 2013-CR10 Class D, 4.9493% 8/10/46 (e)(f) | | 2,000,000 | 1,809,040 |
| Series 2013-CR12 Class D, 5.2531% 10/10/46 (e)(f) | | 4,500,000 | 4,228,567 |
| Series 2013-CR6 Class F, 4.1715% 3/10/46 (e)(f) | | 8,038,000 | 5,165,204 |
| Series 2013-CR9 Class D, 4.3992% 7/10/45 (e)(f) | | 1,404,000 | 1,261,778 |
| Series 2013-LC6 Class D, 4.4274% 1/10/46 (e)(f) | | 6,374,000 | 5,946,210 |
| Series 2014-CR17: | | | |
| Class D, 4.959% 5/10/47 (e)(f) | | 2,500,000 | 2,259,909 |
| Class E, 4.799% 5/10/47 (e)(f) | | 1,575,000 | 1,225,018 |
| Series 2014-UBS2 Class D, 5.1822% 3/10/47 (e)(f) | | 3,713,000 | 3,218,973 |
| Commercial Mortgage Acceptance Corp. Series 1998-C2 Class J, 5.44% 9/15/30 (e) | | 1,423,263 | 1,392,640 |
| Commercial Mortgage Trust pass-thru certificates: | | | |
| Series 2012-CR1: | | | |
| Class C, 5.544% 5/15/45 (f) | | 1,000,000 | 1,119,861 |
| Class D, 5.544% 5/15/45 (e)(f) | | 5,550,000 | 5,768,729 |
| Class G, 2.462% 5/15/45 (e) | | 2,180,000 | 1,354,420 |
| Series 2012-CR2: | | | |
| Class D, 5.0166% 8/15/45 (e)(f) | | 4,500,000 | 4,603,062 |
| Class E, 5.0166% 8/15/45 (e)(f) | | 6,000,000 | 5,772,638 |
| Series 2012-LC4: | | | |
| Class C, 5.8068% 12/10/44 (f) | | 2,000,000 | 2,281,803 |
| Class D, 5.8068% 12/10/44 (e)(f) | | 11,675,000 | 12,181,549 |
| Core Industrial Trust: | | | |
| Series 2015-TEXW Class F, 3.977% 2/10/34 (e)(f) | | 10,746,000 | 9,514,532 |
| Series 2015-WEST Class F, 4.3677% 2/10/37 (e)(f) | | 12,745,000 | 11,161,944 |
| Credit Suisse First Boston Mortgage Securities Corp.: | | | |
| Series 1998-C1 Class F, 6% 5/17/40 (e) | | 790,550 | 814,175 |
| Series 1998-C2 Class F, 6.75% 11/15/30 (e) | | 303,593 | 306,436 |
| CSMC Trust floater Series 2015-DEAL: | | | |
| Class E, 4.481% 4/15/29 (e)(f) | | 2,000,000 | 1,908,528 |
| Class F, 5.231% 4/15/29 (e)(f) | | 5,053,000 | 4,917,330 |
| DBCCRE Mortgage Trust Series 2014-ARCP Class E, 5.099% 1/10/34 (e)(f) | | 10,853,000 | 10,218,352 |
| DBUBS Mortgage Trust: | | | |
| Series 2011-LC1A: | | | |
| Class E, 5.8835% 11/10/46 (e)(f) | | 14,031,000 | 15,375,074 |
| Class G, 4.652% 11/10/46 (e) | | 12,360,000 | 11,032,393 |
| Series 2011-LC3A Class D, 5.5485% 8/10/44 (e)(f) | | 3,945,000 | 4,239,818 |
| Extended Stay America Trust Series 2013-ESH7 Class C7, 3.9017% 12/5/31 (e) | | 500,000 | 503,092 |
| Freddie Mac: | | | |
| pass-thru certificates: | | | |
| Series K011 Class X3, 2.6635% 12/25/43 (f)(g) | | 12,206,096 | 1,218,605 |
| Series K012 Class X3, 2.3286% 1/25/41 (f)(g) | | 20,724,910 | 1,840,670 |
| Series K013 Class X3, 2.8134% 1/25/43 (f)(g) | | 14,360,000 | 1,567,292 |
| Series KAIV Class X2, 3.6147% 6/25/46 (f)(g) | | 7,430,000 | 1,141,408 |
| GAHR Commercial Mortgage Trust Series 2015-NRF: | | | |
| Class EFX, 3.4949% 12/15/34 (e)(f) | | 9,164,000 | 8,970,694 |
| Class FFX, 3.4949% 12/15/34 (e)(f) | | 8,032,000 | 7,620,833 |
| GMAC Commercial Mortgage Securities, Inc. Series 1997-C2 Class G, 6.75% 4/15/29 (f) | | 365,467 | 373,897 |
| GP Portfolio Trust Series 2014-GPP Class E, 4.2921% 2/15/27 (e)(f) | | 2,823,000 | 2,708,801 |
| GS Mortgage Securities Corp. II Series 2010-C1: | | | |
| Class D, 6.2151% 8/10/43 (e)(f) | | 4,000,000 | 4,226,292 |
| Class E, 4% 8/10/43 (e) | | 3,770,000 | 3,534,110 |
| GS Mortgage Securities Trust: | | | |
| Series 2010-C2 Class D, 5.3573% 12/10/43 (e)(f) | | 3,000,000 | 3,082,902 |
| Series 2011-GC5: | | | |
| Class C, 5.5484% 8/10/44 (e)(f) | | 9,000,000 | 9,983,171 |
| Class D, 5.5484% 8/10/44 (e)(f) | | 7,000,000 | 7,213,800 |
| Class E, 5.5484% 8/10/44 (e)(f) | | 4,049,000 | 3,741,910 |
| Class F, 4.5% 8/10/44 (e) | | 4,500,000 | 3,473,609 |
| Series 2012-GC6: | | | |
| Class C, 5.835% 1/10/45 (e)(f) | | 3,600,000 | 4,016,318 |
| Class D, 5.835% 1/10/45 (e)(f) | | 2,000,000 | 1,986,492 |
| Class E, 5% 1/10/45 (e)(f) | | 4,516,000 | 3,735,853 |
| Series 2012-GCJ7: | | | |
| Class C, 5.9132% 5/10/45 (f) | | 6,500,000 | 7,129,964 |
| Class D, 5.9132% 5/10/45 (e)(f) | | 9,205,000 | 9,122,962 |
| Class E, 5% 5/10/45 (e) | | 6,920,000 | 5,576,620 |
| Series 2012-GCJ9 Class D, 5.015% 11/10/45 (e)(f) | | 4,504,000 | 4,242,114 |
| Series 2013-GC14 Class D, 4.9269% 8/10/46 (e)(f) | | 1,680,000 | 1,616,669 |
| Series 2013-GC16: | | | |
| Class D, 5.4973% 11/10/46 (e)(f) | | 3,750,000 | 3,471,068 |
| Class F, 3.5% 11/10/46 (e) | | 7,303,000 | 4,928,221 |
| Series 2014-NEW Class D, 3.79% 1/10/31 (e) | | 2,510,000 | 2,476,813 |
| Series 2016-REMZ Class MZB, 7.727% 2/10/21 (e) | | 29,826,000 | 29,019,893 |
| Series 2016-RENT Class F, 4.2022% 2/10/29 (e)(f) | | 15,890,000 | 14,628,053 |
| Hilton U.S.A. Trust: | | | |
| floater Series 2014-ORL Class E, 3.6921% 7/15/29 (e)(f) | | 7,241,000 | 6,913,990 |
| Series 2013-HLT Class EFX, 4.6017% 11/5/30 (e)(f) | | 5,000,000 | 5,026,275 |
| Invitation Homes Trust floater Series 2013-SFR1 Class E, 3.101% 12/17/30 (e)(f) | | 1,500,000 | 1,465,792 |
| JPMorgan Chase Commercial Mortgage Securities Corp.: | | | |
| Series 2003-C1 Class F, 5.6132% 1/12/37 (e)(f) | | 1,000,000 | 987,796 |
| Series 2009-IWST: | | | |
| Class C, 7.6935% 12/5/27 (e)(f) | | 3,000,000 | 3,436,879 |
| Class D, 7.6935% 12/5/27 (e)(f) | | 9,550,000 | 10,886,424 |
| Series 2010-CNTR: | | | |
| Class D, 6.3899% 8/5/32 (e)(f) | | 4,500,000 | 5,044,717 |
| Class XB, 1.1366% 8/5/32 (e)(f)(g) | | 32,655,000 | 1,134,928 |
| Series 2012-CBX: | | | |
| Class C, 5.3934% 6/15/45 (f) | | 4,530,000 | 4,983,454 |
| Class E, 5.3934% 6/15/45 (e)(f) | | 4,635,000 | 4,737,611 |
| Class F, 4% 6/15/45 (e) | | 8,192,000 | 6,743,404 |
| Class G 4% 6/15/45 (e) | | 4,044,000 | 2,833,566 |
| JPMorgan Chase Commercial Mortgage Securities Trust: | | | |
| floater Series 2014-INN: | | | |
| Class E, 4.081% 6/15/29 (e)(f) | | 10,174,000 | 9,842,189 |
| Class F, 4.481% 6/15/29 (e)(f) | | 9,618,000 | 9,231,917 |
| Series 2011-C3: | | | |
| Class E, 5.8013% 2/15/46 (e)(f) | | 2,705,000 | 2,890,211 |
| Class H, 4.409% 2/15/46 (e)(f) | | 7,077,000 | 5,835,244 |
| Series 2011-C4 Class F, 3.873% 7/15/46 (e) | | 1,400,000 | 1,195,853 |
| Series 2013-LC11: | | | |
| Class C, 3.9582% 4/15/46 (f) | | 848,000 | 882,613 |
| Class D, 4.3786% 4/15/46 (f) | | 7,672,000 | 7,237,848 |
| Class E, 3.25% 4/15/46 (e)(f) | | 472,000 | 337,781 |
| Class F, 3.25% 4/15/46 (e)(f) | | 2,518,000 | 1,498,151 |
| Series 2014-DSTY Class E, 3.9314% 6/10/27 (e)(f) | | 2,752,000 | 2,553,226 |
| Series 2015-UES Class F, 3.7417% 9/5/32 (e)(f) | | 3,500,000 | 3,243,805 |
| JPMorgan Commercial Mortgage Finance Corp. Series 1999-C8 Class H, 6% 7/15/31 (e) | | 617,700 | 548,628 |
| LB-UBS Commercial Mortgage Trust: | | | |
| sequential payer Series 2006-C7 Class AM, 5.378% 11/15/38 | | 2,040,000 | 2,048,421 |
| Series 2006-C4 Class AJ, 5.9912% 6/15/38 (f) | | 691,282 | 690,942 |
| LSTAR Commercial Mortgage Trust Series 2014-2: | | | |
| Class D, 5.0182% 1/20/41 (e)(f) | | 3,000,000 | 2,965,477 |
| Class E, 5.0182% 1/20/41 (e)(f) | | 4,800,000 | 4,400,562 |
| Merrill Lynch Mortgage Trust Series 2006-C1 Class AJ, 5.7424% 5/12/39 (f) | | 19,155,001 | 19,046,260 |
| Mezz Capital Commercial Mortgage Trust Series 2004-C1 Class IO, 9.321% 1/15/37 (e)(f)(g) | | 241,146 | 10,554 |
| Morgan Stanley BAML Trust: | | | |
| Series 2012-C6 Class D, 4.8125% 11/15/45 (e)(f) | | 2,000,000 | 2,026,012 |
| Series 2013-C12 Class D, 4.9246% 10/15/46 (e)(f) | | 3,250,000 | 3,119,944 |
| Series 2013-C13: | | | |
| Class D, 5.0548% 11/15/46 (e)(f) | | 5,221,000 | 5,100,392 |
| Class E, 5.0548% 11/15/46 (e)(f) | | 3,379,000 | 2,684,629 |
| Series 2013-C7 Class E, 4.4312% 2/15/46 (e)(f) | | 1,000,000 | 780,996 |
| Series 2013-C9 Class D, 4.2942% 5/15/46 (e)(f) | | 5,137,000 | 4,640,393 |
| Morgan Stanley Capital I Trust: | | | |
| sequential payer: | | | |
| Series 2006-HQ10 Class AM, 5.36% 11/12/41 | | 8,200,000 | 8,227,910 |
| Series 2012-C4 Class E, 5.7045% 3/15/45 (e)(f) | | 7,294,000 | 7,322,017 |
| Series 1997-RR Class F, 7.4205% 4/30/39 (e)(f) | | 437,133 | 432,723 |
| Series 1998-CF1 Class G, 7.35% 7/15/32 (e) | | 2,229,907 | 2,232,452 |
| Series 2006-IQ12 Class AMFX, 5.37% 12/15/43 | | 7,500,000 | 7,546,523 |
| Series 2011-C1 Class C, 5.6007% 9/15/47 (e)(f) | | 4,000,000 | 4,535,209 |
| Series 2011-C2: | | | |
| Class D, 5.6471% 6/15/44 (e)(f) | | 4,887,000 | 5,234,662 |
| Class E, 5.6471% 6/15/44 (e)(f) | | 9,600,000 | 10,076,873 |
| Class F, 5.6471% 6/15/44 (e)(f) | | 4,440,000 | 4,323,360 |
| Class XB, 0.6038% 6/15/44 (e)(f)(g) | | 63,708,222 | 1,473,093 |
| Series 2011-C3: | | | |
| Class C, 5.3479% 7/15/49 (e)(f) | | 2,000,000 | 2,229,481 |
| Class D, 5.3479% 7/15/49 (e)(f) | | 7,400,000 | 8,019,110 |
| Class E, 5.3479% 7/15/49 (e)(f) | | 832,000 | 867,505 |
| Class G, 5.3479% 7/15/49 (e)(f) | | 3,283,000 | 2,588,889 |
| Series 2012-C4 Class D, 5.7045% 3/15/45 (e)(f) | | 6,310,000 | 6,634,620 |
| Series 2015-UBS8 Class D, 3.25% 12/15/48 (e) | | 5,013,000 | 3,706,867 |
| Motel 6 Trust Series 2015-MTL6: | | | |
| Class E, 5.2785% 2/5/30 (e) | | 8,349,000 | 8,340,763 |
| Class F, 5% 2/5/30 (e) | | 14,325,000 | 13,558,274 |
| MSJP Commercial Securities Mortgage Trust Series 2015-HAUL Class E, 5.0127% 9/5/47 (e)(f) | | 1,500,000 | 1,222,641 |
| Providence Place Group Ltd. Partnership Series 2000-C1 Class A2, 7.75% 7/20/28 (e) | | 4,679,368 | 5,582,018 |
| SCG Trust Series 2013-SRP1 Class D, 3.7764% 11/15/26 (e)(f) | | 4,347,000 | 4,089,027 |
| TIAA Seasoned Commercial Mortgage Trust sequential payer Series 2007-C4 Class AJ, 5.5379% 8/15/39 (f) | | 451,162 | 453,300 |
| UBS Commercial Mortgage Trust Series 2012-C1: | | | |
| Class D, 5.7152% 5/10/45 (e)(f) | | 3,235,000 | 3,331,743 |
| Class E, 5% 5/10/45 (e)(f) | | 4,053,000 | 3,525,031 |
| UBS-Barclays Commercial Mortgage Trust sequential payer Series 2012-C3 Class A1, 0.726% 8/10/49 | | 974,264 | 972,271 |
| UBS-Citigroup Commercial Mortgage Trust Series 2011-C1 Class B, 6.0842% 1/10/45 (e)(f) | | 3,000,000 | 3,477,196 |
| Vornado DP LLC Series 2010-VNO Class D, 6.3555% 9/13/28 (e) | | 2,540,000 | 2,840,395 |
| Wachovia Bank Commercial Mortgage Trust Series 2004-C11 Class D, 5.8847% 1/15/41 (f) | | 4,712,822 | 4,775,705 |
| Wells Fargo Commercial Mortgage Trust: | | | |
| Series 2012-LC5 Class D, 4.9355% 10/15/45 (e)(f) | | 9,999,000 | 9,778,278 |
| Series 2016-C35 Class D, 3.142% 7/15/48 (e) | | 8,358,000 | 5,993,783 |
| WF-RBS Commercial Mortgage Trust: | | | |
| sequential payer Series 2011-C4I Class G, 5% 6/15/44 (e) | | 4,000,000 | 3,161,344 |
| Series 2011-C3: | | | |
| Class C, 5.335% 3/15/44 (e) | | 4,900,000 | 5,346,789 |
| Class D, 5.8071% 3/15/44 (e)(f) | | 1,000,000 | 1,052,505 |
| Class E, 5% 3/15/44 (e) | | 3,000,000 | 2,737,148 |
| Series 2011-C5: | | | |
| Class F, 5.25% 11/15/44 (e)(f) | | 3,000,000 | 2,574,344 |
| Class G, 5.25% 11/15/44 (e)(f) | | 2,000,000 | 1,578,224 |
| Series 2012-C10 Class E, 4.6017% 12/15/45 (e)(f) | | 4,090,000 | 3,322,304 |
| Series 2012-C7: | | | |
| Class D, 4.9916% 6/15/45 (e)(f) | | 2,380,000 | 2,458,015 |
| Class F, 4.5% 6/15/45 (e) | | 2,000,000 | 1,498,030 |
| Series 2013-C11: | | | |
| Class D, 4.3175% 3/15/45 (e)(f) | | 5,830,000 | 5,449,120 |
| Class E, 4.3175% 3/15/45 (e)(f) | | 4,780,000 | 3,607,374 |
| Series 2013-C13 Class D, 4.1386% 5/15/45 (e)(f) | | 4,000,000 | 3,609,846 |
| Series 2013-C16 Class D, 5.1491% 9/15/46 (e)(f) | | 3,728,000 | 3,665,161 |
| Series 2013-UBS1 Class D, 4.7827% 3/15/46 (e)(f) | | 1,668,000 | 1,622,433 |
| WFCG Commercial Mortgage Trust floater Series 2015-BXRP: | | | |
| Class F, 4.1624% 11/15/29 (e)(f) | | 5,152,378 | 4,950,843 |
| Class G, 3.4621% 11/15/29 (e)(f) | | 4,994,505 | 4,605,234 |
| TOTAL COMMERCIAL MORTGAGE SECURITIES | | | |
| (Cost $671,982,193) | | | 698,992,138 |
|
| Bank Loan Obligations - 5.3% | | | |
| CONSUMER DISCRETIONARY - 1.9% | | | |
| Hotels, Restaurants & Leisure - 1.5% | | | |
| Caesars Entertainment Resort Properties LLC Tranche B 1LN, term loan 7% 10/11/20 (f) | | 13,103,706 | 12,782,665 |
| Caesars Growth Properties Holdings, LLC Tranche 1LN, term loan 6.25% 5/8/21 (f) | | 10,091,606 | 9,612,254 |
| Cooper Hotel Group 12% 11/6/17 | | 13,106,661 | 13,237,727 |
| Four Seasons Holdings, Inc.: | | | |
| Tranche 2LN, term loan 7.75% 12/27/20 (f) | | 2,150,000 | 2,150,000 |
| Tranche B 1LN, term loan 5.25% 6/27/20 (f) | | 1,986,701 | 1,987,317 |
| Hilton Worldwide Finance, LLC Tranche B, term loan 3.5% 10/25/20 (f) | | 14,821,555 | 14,855,792 |
| La Quinta Intermediate Holdings LLC Tranche B LN, term loan 3.75% 4/14/21 (f) | | 13,049,903 | 12,935,717 |
| Playa Resorts Holding BV Tranche B, term loan 4% 8/9/19 (f) | | 4,052,685 | 4,032,422 |
| Ryman Hospitality Properties, Inc. Tranche B, term loan 3.5% 1/15/21 (f) | | 2,244,200 | 2,247,566 |
| | | | 73,841,460 |
| Media - 0.2% | | | |
| CBS Outdoor Americas Capital LLC/CBS Outdoor Americas Capital Corp. Tranche B, term loan 3% 1/31/21 (f) | | 7,361,813 | 7,355,702 |
| Multiline Retail - 0.2% | | | |
| JC Penney Corp., Inc. Tranche B, term loan 5.25% 6/23/23 (f) | | 10,115,000 | 10,123,395 |
|
| TOTAL CONSUMER DISCRETIONARY | | | 91,320,557 |
|
| CONSUMER STAPLES - 0.4% | | | |
| Food & Staples Retailing - 0.4% | | | |
| Albertson's LLC: | | | |
| Tranche B 5LN, term loan 4.75% 12/21/22 (f) | | 5,642,488 | 5,669,910 |
| Tranche B 6LN, term loan 4.75% 6/22/23 (f) | | 12,665,000 | 12,741,497 |
| | | | 18,411,407 |
| ENERGY - 0.7% | | | |
| Oil, Gas & Consumable Fuels - 0.7% | | | |
| Moxie Patriot LLC Tranche B, term loan 6.75% 12/19/20 (f) | | 17,393,422 | 16,610,718 |
| Panda Temple Power, LLC term loan 7.25% 4/3/19 (f) | | 8,537,100 | 7,854,132 |
| TPF II Power, LLC Tranche B, term loan 5.5% 10/2/21 (f) | | 8,131,336 | 8,163,861 |
| | | | 32,628,711 |
| FINANCIALS - 1.1% | | | |
| Real Estate Investment Trusts - 0.4% | | | |
| iStar Financial, Inc. Tranche B, term loan 5.5% 7/1/20 (f) | | 8,435,000 | 8,493,033 |
| Starwood Property Trust, Inc. Tranche B, term loan 3.5% 4/17/20 (f) | | 10,712,049 | 10,695,338 |
| | | | 19,188,371 |
| Real Estate Management & Development - 0.6% | | | |
| Americold Realty Operating Partnership LP Tranche B, term loan 5.75% 12/1/22 (f) | | 11,225,640 | 11,337,897 |
| DTZ U.S. Borrower LLC Tranche B 1LN, term loan 4.25% 11/4/21 (f) | | 8,987,406 | 8,923,775 |
| NorthStar Asset Management LP Tranche B 1LN, term loan 4.6265% 1/29/23 (f) | | 4,997,475 | 4,974,587 |
| Realogy Group LLC Tranche B, term loan 3.75% 7/20/22 (f) | | 3,300,000 | 3,316,500 |
| | | | 28,552,759 |
| Thrifts & Mortgage Finance - 0.1% | | | |
| Ocwen Loan Servicing, LLC Tranche B, term loan 5.5% 2/15/18 (f) | | 6,610,838 | 6,511,675 |
|
| TOTAL FINANCIALS | | | 54,252,805 |
|
| HEALTH CARE - 0.1% | | | |
| Health Care Providers & Services - 0.1% | | | |
| Community Health Systems, Inc.: | | | |
| Tranche F, term loan 3.9241% 12/31/18 (f) | | 1,756,471 | 1,739,222 |
| Tranche H, term loan 4% 1/27/21 (f) | | 3,088,463 | 3,048,900 |
| | | | 4,788,122 |
| INDUSTRIALS - 0.3% | | | |
| Commercial Services & Supplies - 0.1% | | | |
| Lineage Logistics Holdings, LLC. Tranche B, term loan 4.5% 4/7/21 (f) | | 3,910,000 | 3,701,480 |
| Pilot Travel Centers LLC Tranche B, term loan 3.2456% 5/25/23 (f) | | 4,178,425 | 4,194,094 |
| | | | 7,895,574 |
| Construction & Engineering - 0.2% | | | |
| Drumm Investors LLC Tranche B, term loan 9.5% 5/4/18 (f) | | 8,531,846 | 8,354,128 |
|
| TOTAL INDUSTRIALS | | | 16,249,702 |
|
| UTILITIES - 0.8% | | | |
| Electric Utilities - 0.4% | | | |
| Calpine Construction Finance Co. LP Tranche B 2LN, term loan 3.25% 1/31/22 (f) | | 7,231,946 | 7,130,699 |
| Dynegy Finance IV, Inc. Tranche C, term loan 5% 6/27/23 (f) | | 4,220,000 | 4,220,000 |
| Essential Power LLC Tranche B, term loan 4.75% 8/8/19 (f) | | 6,683,047 | 6,616,216 |
| Southeast Powergen LLC Tranche B, term loan 4.5% 12/2/21 (f) | | 2,641,888 | 2,546,119 |
| | | | 20,513,034 |
| Independent Power and Renewable Electricity Producers - 0.4% | | | |
| APLP Holdings LP Tranche B, term loan 6% 4/13/23 (f) | | 7,227,165 | 7,245,233 |
| Tempus Public Foundation Generation Holdings LLC Tranche B, term loan 4.75% 12/31/17 (f) | | 11,369,138 | 10,933,359 |
| | | | 18,178,592 |
|
| TOTAL UTILITIES | | | 38,691,626 |
|
| TOTAL BANK LOAN OBLIGATIONS | | | |
| (Cost $258,138,621) | | | 256,342,930 |
|
| Preferred Securities - 0.0% | | | |
| FINANCIALS - 0.0% | | | |
| Diversified Financial Services - 0.0% | | | |
| Crest Dartmouth Street 2003 1 Ltd. Series 2003-1A Class PS, 6/28/38 (e) | | 1,220,000 | 20,679 |
| Thrifts & Mortgage Finance - 0.0% | | | |
| Crest Clarendon Street 2002-1 Ltd. Series 2002-1A Class PS, 12/28/35 (e) | | 500,000 | 247 |
| TOTAL PREFERRED SECURITIES | | | |
| (Cost $1,297,768) | | | 20,926 |
| | | Shares | Value |
|
| Money Market Funds - 6.5% | | | |
| Fidelity Cash Central Fund, 0.42% (h) | | 314,785,413 | 314,785,413 |
| Fidelity Securities Lending Cash Central Fund, 0.45% (h)(i) | | 1,316,700 | 1,316,700 |
| TOTAL MONEY MARKET FUNDS | | | |
| (Cost $316,102,113) | | | 316,102,113 |
| TOTAL INVESTMENT PORTFOLIO - 99.8% | | | |
| (Cost $4,394,702,295) | | | 4,849,258,891 |
| NET OTHER ASSETS (LIABILITIES) - 0.2% | | | 7,945,051 |
| NET ASSETS - 100% | | | $4,857,203,942 |
Legend
(a) Restricted securities - Investment in securities not registered under the Securities Act of 1933 (excluding 144A issues). At the end of the period, the value of restricted securities (excluding 144A issues) amounted to $5,824,211 or 0.1% of net assets.
(b) Affiliated company
(c) Security or a portion of the security is on loan at period end.
(d) Non-income producing
(e) Security exempt from registration under Rule 144A of the Securities Act of 1933. These securities may be resold in transactions exempt from registration, normally to qualified institutional buyers. At the end of the period, the value of these securities amounted to $907,486,670 or 18.7% of net assets.
(f) Coupon rates for floating and adjustable rate securities reflect the rates in effect at period end.
(g) Security represents right to receive monthly interest payments on an underlying pool of mortgages or assets. Principal shown is the outstanding par amount of the pool as of the end of the period.
(h) Affiliated fund that is generally available only to investment companies and other accounts managed by Fidelity Investments. The rate quoted is the annualized seven-day yield of the fund at period end. A complete unaudited listing of the fund's holdings as of its most recent quarter end is available upon request. In addition, each Fidelity Central Fund's financial statements, which are not covered by the Fund's Report of Independent Registered Public Accounting Firm, are available on the SEC's website or upon request.
(i) Investment made with cash collateral received from securities on loan.
Additional information on each restricted holding is as follows:
| Security | Acquisition Date | Acquisition Cost |
| Fannie Mae REMIC Trust Series 2001-W3 subordinate REMIC pass thru certificates, Class B3, 7% 9/25/41 | 5/21/03 | $46,791 |
| Fannie Mae REMIC Trust Series 2003-W1 subordinate REMIC pass thru certificates, Class B3, 4.08% 12/25/42 | 3/25/03 | $51,824 |
| Stanley Martin Communities LLC Class B | 8/3/05 - 3/1/07 | $4,244,623 |
Affiliated Central Funds
Information regarding fiscal year to date income earned by the Fund from investments in Fidelity Central Funds is as follows:
| Fund | Income earned |
| Fidelity Cash Central Fund | $942,575 |
| Fidelity Securities Lending Cash Central Fund | 28,725 |
| Total | $971,300 |
Other Affiliated Issuers
An affiliated company is a company in which the Fund has ownership of at least 5% of the voting securities. Fiscal year to date transactions with companies which are or were affiliates are as follows:
| Affiliate | Value, beginning of period | Purchases | Sales Proceeds | Dividend Income | Value, end of period |
| Acadia Realty Trust (SBI) | $119,299,759 | $3,255,274 | $965,602 | $3,155,180 | $-- |
| Arbor Realty Trust, Inc. | 20,991,789 | -- | 75,982 | 1,838,251 | 21,868,468 |
| Arbor Realty Trust, Inc. 7.375% | 10,597,189 | -- | -- | 793,928 | 11,010,570 |
| Arbor Realty Trust, Inc. Series A, 8.25% | 4,814,206 | -- | -- | 389,996 | 4,785,843 |
| Arbor Realty Trust, Inc. Series B, 7.75% | 5,940,000 | -- | -- | 465,000 | 6,000,000 |
| Arbor Realty Trust, Inc. Series C, 8.50% | 2,578,000 | -- | -- | 212,500 | 2,575,000 |
| Great Ajax Corp. | 7,020,000 | 12,241,285 | -- | 201,403 | 19,621,115 |
| Total | $171,240,943 | $15,496,559 | $1,041,584 | $7,056,258 | $65,860,996 |
Investment Valuation
The following is a summary of the inputs used, as of July 31, 2016, involving the Fund's assets and liabilities carried at fair value. The inputs or methodology used for valuing securities may not be an indication of the risk associated with investing in those securities. For more information on valuation inputs, and their aggregation into the levels used below, please refer to the Investment Valuation section in the accompanying Notes to Financial Statements.
| | Valuation Inputs at Reporting Date: |
| Description | Total | Level 1 | Level 2 | Level 3 |
| Investments in Securities: | | | | |
| Equities: | | | | |
| Consumer Discretionary | $5,806,693 | $-- | $-- | $5,806,693 |
| Financials | 2,462,617,085 | 2,450,757,509 | 11,859,574 | 2 |
| Corporate Bonds | 987,058,783 | -- | 987,058,783 | -- |
| Asset-Backed Securities | 113,221,928 | -- | 112,373,703 | 848,225 |
| Collateralized Mortgage Obligations | 9,096,295 | -- | 8,846,129 | 250,166 |
| Commercial Mortgage Securities | 698,992,138 | -- | 684,740,742 | 14,251,396 |
| Bank Loan Obligations | 256,342,930 | -- | 243,105,203 | 13,237,727 |
| Preferred Securities | 20,926 | -- | -- | 20,926 |
| Money Market Funds | 316,102,113 | 316,102,113 | -- | -- |
| Total Investments in Securities: | $4,849,258,891 | $2,766,859,622 | $2,047,984,134 | $34,415,135 |
Other Information
The composition of credit quality ratings as a percentage of Total Net Assets is as follows (Unaudited):
| U.S. Government and U.S. Government Agency Obligations | 0.1% |
| AAA,AA,A | 2.3% |
| BBB | 9.0% |
| BB | 9.0% |
| B | 10.6% |
| CCC,CC,C | 0.8% |
| D | 0.0% |
| Not Rated | 10.7% |
| Equities | 50.8% |
| Short-Term Investments and Net Other Assets | 6.7% |
| | 100% |
We have used ratings from Moody's Investors Service, Inc. Where Moody's® ratings are not available, we have used S&P® ratings. All ratings are as of the date indicated and do not reflect subsequent changes.
Percentages shown as 0.0% may reflect amounts less than 0.05%.
See accompanying notes which are an integral part of the financial statements.
Financial Statements
Statement of Assets and Liabilities
| | | July 31, 2016 |
| Assets | | |
Investment in securities, at value (including securities loaned of $1,300,873) — See accompanying schedule:
Unaffiliated issuers (cost $4,012,720,751) | $4,467,295,782 | |
| Fidelity Central Funds (cost $316,102,113) | 316,102,113 | |
| Other affiliated issuers (cost $65,879,431) | 65,860,996 | |
| Total Investments (cost $4,394,702,295) | | $4,849,258,891 |
| Cash | | 5,534,808 |
| Receivable for investments sold | | 18,455,612 |
| Receivable for fund shares sold | | 10,387,409 |
| Dividends receivable | | 2,677,994 |
| Interest receivable | | 19,180,238 |
| Distributions receivable from Fidelity Central Funds | | 114,067 |
| Other receivables | | 20,587 |
| Total assets | | 4,905,629,606 |
| Liabilities | | |
| Payable for investments purchased | $39,637,835 | |
| Payable for fund shares redeemed | 3,993,810 | |
| Accrued management fee | 2,181,907 | |
| Distribution and service plan fees payable | 360,628 | |
| Other affiliated payables | 841,801 | |
| Other payables and accrued expenses | 92,983 | |
| Collateral on securities loaned, at value | 1,316,700 | |
| Total liabilities | | 48,425,664 |
| Net Assets | | $4,857,203,942 |
| Net Assets consist of: | | |
| Paid in capital | | $4,339,374,272 |
| Undistributed net investment income | | 37,962,753 |
| Accumulated undistributed net realized gain (loss) on investments and foreign currency transactions | | 25,310,053 |
| Net unrealized appreciation (depreciation) on investments and assets and liabilities in foreign currencies | | 454,556,864 |
| Net Assets | | $4,857,203,942 |
| Calculation of Maximum Offering Price | | |
| Class A: | | |
| Net Asset Value and redemption price per share ($548,648,862 ÷ 44,793,424 shares) | | $12.25 |
| Maximum offering price per share (100/96.00 of $12.25) | | $12.76 |
| Class T: | | |
| Net Asset Value and redemption price per share ($59,787,558 ÷ 4,878,394 shares) | | $12.26 |
| Maximum offering price per share (100/96.00 of $12.26) | | $12.77 |
| Class C: | | |
| Net Asset Value and offering price per share ($289,430,349 ÷ 23,850,410 shares)(a) | | $12.14 |
| Real Estate Income: | | |
| Net Asset Value, offering price and redemption price per share ($2,719,387,305 ÷ 220,913,639 shares) | | $12.31 |
| Class I: | | |
| Net Asset Value, offering price and redemption price per share ($1,239,949,868 ÷ 101,019,583 shares) | | $12.27 |
(a) Redemption price per share is equal to net asset value less any applicable contingent deferred sales charge.
See accompanying notes which are an integral part of the financial statements.
Statement of Operations
| | | Year ended July 31, 2016 |
| Investment Income | | |
| Dividends (including $7,056,258 earned from other affiliated issuers) | | $118,594,202 |
| Interest | | 108,853,784 |
| Income from Fidelity Central Funds | | 971,300 |
| Total income | | 228,419,286 |
| Expenses | | |
| Management fee | $23,555,488 | |
| Transfer agent fees | 8,899,268 | |
| Distribution and service plan fees | 4,148,288 | |
| Accounting and security lending fees | 1,338,246 | |
| Custodian fees and expenses | 44,656 | |
| Independent trustees' fees and expenses | 18,781 | |
| Registration fees | 185,537 | |
| Audit | 198,658 | |
| Legal | 11,016 | |
| Miscellaneous | 32,158 | |
| Total expenses before reductions | 38,432,096 | |
| Expense reductions | (95,724) | 38,336,372 |
| Net investment income (loss) | | 190,082,914 |
| Realized and Unrealized Gain (Loss) | | |
| Net realized gain (loss) on: | | |
| Investment securities: | | |
| Unaffiliated issuers | 44,680,443 | |
| Other affiliated issuers | 1,863,343 | |
| Foreign currency transactions | (105,863) | |
| Total net realized gain (loss) | | 46,437,923 |
Change in net unrealized appreciation (depreciation) on:
Investment securities | 237,758,482 | |
| Assets and liabilities in foreign currencies | 70,248 | |
| Total change in net unrealized appreciation (depreciation) | | 237,828,730 |
| Net gain (loss) | | 284,266,653 |
| Net increase (decrease) in net assets resulting from operations | | $474,349,567 |
See accompanying notes which are an integral part of the financial statements.
Statement of Changes in Net Assets
| | Year ended July 31, 2016 | Year ended July 31, 2015 |
| Increase (Decrease) in Net Assets | | |
| Operations | | |
| Net investment income (loss) | $190,082,914 | $200,528,467 |
| Net realized gain (loss) | 46,437,923 | 54,207,307 |
| Change in net unrealized appreciation (depreciation) | 237,828,730 | (52,184,229) |
| Net increase (decrease) in net assets resulting from operations | 474,349,567 | 202,551,545 |
| Distributions to shareholders from net investment income | (185,109,460) | (199,452,326) |
| Distributions to shareholders from net realized gain | (51,815,852) | (75,677,564) |
| Total distributions | (236,925,312) | (275,129,890) |
| Share transactions - net increase (decrease) | 302,433,412 | 215,193,161 |
| Redemption fees | 329,841 | 424,938 |
| Total increase (decrease) in net assets | 540,187,508 | 143,039,754 |
| Net Assets | | |
| Beginning of period | 4,317,016,434 | 4,173,976,680 |
| End of period | $4,857,203,942 | $4,317,016,434 |
| Other Information | | |
| Undistributed net investment income end of period | $37,962,753 | $34,176,266 |
See accompanying notes which are an integral part of the financial statements.
Financial Highlights — Fidelity Real Estate Income Fund Class A
| Years ended July 31, | 2016 | 2015 | 2014 | 2013 | 2012 |
| Selected Per–Share Data | | | | | |
| Net asset value, beginning of period | $11.66 | $11.86 | $11.67 | $11.26 | $10.73 |
| Income from Investment Operations | | | | | |
| Net investment income (loss)A | .49 | .52 | .49 | .54 | .52 |
| Net realized and unrealized gain (loss) | .73 | .02 | .44 | .60 | .61 |
| Total from investment operations | 1.22 | .54 | .93 | 1.14 | 1.13 |
| Distributions from net investment income | (.48) | (.52) | (.50) | (.53) | (.51) |
| Distributions from net realized gain | (.14) | (.21) | (.24) | (.20) | (.10) |
| Total distributions | (.63)B | (.74)C | (.74) | (.73) | (.60)D |
| Redemption fees added to paid in capitalA,E | – | – | – | – | – |
| Net asset value, end of period | $12.25 | $11.66 | $11.86 | $11.67 | $11.26 |
| Total ReturnF,G | 11.01% | 4.65% | 8.49% | 10.45% | 11.24% |
| Ratios to Average Net AssetsH,I | | | | | |
| Expenses before reductions | 1.03% | 1.04% | 1.06% | 1.08% | 1.12% |
| Expenses net of fee waivers, if any | 1.03% | 1.03% | 1.05% | 1.08% | 1.12% |
| Expenses net of all reductions | 1.03% | 1.03% | 1.05% | 1.07% | 1.11% |
| Net investment income (loss) | 4.29% | 4.40% | 4.28% | 4.62% | 4.89% |
| Supplemental Data | | | | | |
| Net assets, end of period (000 omitted) | $548,649 | $495,462 | $442,271 | $378,269 | $137,352 |
| Portfolio turnover rateJ | 26% | 19% | 29% | 26% | 27% |
A Calculated based on average shares outstanding during the period.
B Total distributions of $.63 per share is comprised of distributions from net investment income of $.483 and distributions from net realized gain of $.142 per share.
C Total distributions of $.74 per share is comprised of distributions from net investment income of $.523 and distributions from net realized gain of $.212 per share.
D Total distributions of $.60 per share is comprised of distributions from net investment income of $.505 and distributions from net realized gain of $.097 per share.
E Amount represents less than $.005 per share.
F Total returns would have been lower if certain expenses had not been reduced during the applicable periods shown.
G Total returns do not include the effect of the sales charges.
H Fees and expenses of any underlying Fidelity Central Funds are not included in the Fund's expense ratio. The Fund indirectly bears its proportionate share of the expenses of any underlying Fidelity Central Funds.
I Expense ratios reflect operating expenses of the class. Expenses before reductions do not reflect amounts reimbursed by the investment adviser or reductions from brokerage service arrangements or reductions from other expense offset arrangements and do not represent the amount paid by the class during periods when reimbursements or reductions occur. Expenses net of fee waivers reflect expenses after reimbursement by the investment adviser but prior to reductions from brokerage service arrangements or other expense offset arrangements. Expenses net of all reductions represent the net expenses paid by the class.
J Amount does not include the portfolio activity of any underlying Fidelity Central Funds.
See accompanying notes which are an integral part of the financial statements.
Financial Highlights — Fidelity Real Estate Income Fund Class T
| Years ended July 31, | 2016 | 2015 | 2014 | 2013 | 2012 |
| Selected Per–Share Data | | | | | |
| Net asset value, beginning of period | $11.66 | $11.86 | $11.67 | $11.26 | $10.72 |
| Income from Investment Operations | | | | | |
| Net investment income (loss)A | .49 | .51 | .49 | .54 | .52 |
| Net realized and unrealized gain (loss) | .73 | .02 | .43 | .60 | .62 |
| Total from investment operations | 1.22 | .53 | .92 | 1.14 | 1.14 |
| Distributions from net investment income | (.48) | (.52) | (.50) | (.53) | (.50) |
| Distributions from net realized gain | (.14) | (.21) | (.24) | (.20) | (.10) |
| Total distributions | (.62) | (.73) | (.73)B | (.73) | (.60) |
| Redemption fees added to paid in capitalA,C | – | – | – | – | – |
| Net asset value, end of period | $12.26 | $11.66 | $11.86 | $11.67 | $11.26 |
| Total ReturnD,E | 11.06% | 4.62% | 8.44% | 10.42% | 11.33% |
| Ratios to Average Net AssetsF,G | | | | | |
| Expenses before reductions | 1.07% | 1.06% | 1.08% | 1.08% | 1.11% |
| Expenses net of fee waivers, if any | 1.07% | 1.06% | 1.08% | 1.08% | 1.11% |
| Expenses net of all reductions | 1.06% | 1.06% | 1.07% | 1.08% | 1.11% |
| Net investment income (loss) | 4.26% | 4.37% | 4.26% | 4.61% | 4.90% |
| Supplemental Data | | | | | |
| Net assets, end of period (000 omitted) | $59,788 | $55,424 | $48,164 | $46,198 | $26,143 |
| Portfolio turnover rateH | 26% | 19% | 29% | 26% | 27% |
A Calculated based on average shares outstanding during the period.
B Total distributions of $.73 per share is comprised of distributions from net investment income of $.496 and distributions from net realized gain of $.236 per share.
C Amount represents less than $.005 per share.
D Total returns would have been lower if certain expenses had not been reduced during the applicable periods shown.
E Total returns do not include the effect of the sales charges.
F Fees and expenses of any underlying Fidelity Central Funds are not included in the Fund's expense ratio. The Fund indirectly bears its proportionate share of the expenses of any underlying Fidelity Central Funds.
G Expense ratios reflect operating expenses of the class. Expenses before reductions do not reflect amounts reimbursed by the investment adviser or reductions from brokerage service arrangements or reductions from other expense offset arrangements and do not represent the amount paid by the class during periods when reimbursements or reductions occur. Expenses net of fee waivers reflect expenses after reimbursement by the investment adviser but prior to reductions from brokerage service arrangements or other expense offset arrangements. Expenses net of all reductions represent the net expenses paid by the class.
H Amount does not include the portfolio activity of any underlying Fidelity Central Funds.
See accompanying notes which are an integral part of the financial statements.
Financial Highlights — Fidelity Real Estate Income Fund Class C
| Years ended July 31, | 2016 | 2015 | 2014 | 2013 | 2012 |
| Selected Per–Share Data | | | | | |
| Net asset value, beginning of period | $11.55 | $11.77 | $11.59 | $11.20 | $10.67 |
| Income from Investment Operations | | | | | |
| Net investment income (loss)A | .40 | .43 | .40 | .45 | .44 |
| Net realized and unrealized gain (loss) | .73 | .01 | .43 | .60 | .62 |
| Total from investment operations | 1.13 | .44 | .83 | 1.05 | 1.06 |
| Distributions from net investment income | (.40) | (.45) | (.42) | (.46) | (.43) |
| Distributions from net realized gain | (.14) | (.21) | (.24) | (.20) | (.10) |
| Total distributions | (.54) | (.66) | (.65)B | (.66) | (.53) |
| Redemption fees added to paid in capitalA,C | – | – | – | – | – |
| Net asset value, end of period | $12.14 | $11.55 | $11.77 | $11.59 | $11.20 |
| Total ReturnD,E | 10.29% | 3.82% | 7.66% | 9.66% | 10.49% |
| Ratios to Average Net AssetsF,G | | | | | |
| Expenses before reductions | 1.79% | 1.79% | 1.79% | 1.81% | 1.87% |
| Expenses net of fee waivers, if any | 1.78% | 1.78% | 1.79% | 1.81% | 1.87% |
| Expenses net of all reductions | 1.78% | 1.78% | 1.79% | 1.81% | 1.87% |
| Net investment income (loss) | 3.54% | 3.65% | 3.54% | 3.88% | 4.14% |
| Supplemental Data | | | | | |
| Net assets, end of period (000 omitted) | $289,430 | $291,387 | $246,306 | $204,012 | $52,780 |
| Portfolio turnover rateH | 26% | 19% | 29% | 26% | 27% |
A Calculated based on average shares outstanding during the period.
B Total distributions of $.65 per share is comprised of distributions from net investment income of $.417 and distributions from net realized gain of $.236 per share.
C Amount represents less than $.005 per share.
D Total returns would have been lower if certain expenses had not been reduced during the applicable periods shown.
E Total returns do not include the effect of the contingent deferred sales charge.
F Fees and expenses of any underlying Fidelity Central Funds are not included in the Fund's expense ratio. The Fund indirectly bears its proportionate share of the expenses of any underlying Fidelity Central Funds.
G Expense ratios reflect operating expenses of the class. Expenses before reductions do not reflect amounts reimbursed by the investment adviser or reductions from brokerage service arrangements or reductions from other expense offset arrangements and do not represent the amount paid by the class during periods when reimbursements or reductions occur. Expenses net of fee waivers reflect expenses after reimbursement by the investment adviser but prior to reductions from brokerage service arrangements or other expense offset arrangements. Expenses net of all reductions represent the net expenses paid by the class.
H Amount does not include the portfolio activity of any underlying Fidelity Central Funds.
See accompanying notes which are an integral part of the financial statements.
Financial Highlights — Fidelity Real Estate Income Fund
| Years ended July 31, | 2016 | 2015 | 2014 | 2013 | 2012 |
| Selected Per–Share Data | | | | | |
| Net asset value, beginning of period | $11.71 | $11.91 | $11.71 | $11.29 | $10.75 |
| Income from Investment Operations | | | | | |
| Net investment income (loss)A | .52 | .54 | .52 | .57 | .54 |
| Net realized and unrealized gain (loss) | .73 | .02 | .44 | .60 | .62 |
| Total from investment operations | 1.25 | .56 | .96 | 1.17 | 1.16 |
| Distributions from net investment income | (.51) | (.55) | (.53) | (.55) | (.52) |
| Distributions from net realized gain | (.14) | (.21) | (.24) | (.20) | (.10) |
| Total distributions | (.65) | (.76) | (.76)B | (.75) | (.62) |
| Redemption fees added to paid in capitalA,C | – | – | – | – | – |
| Net asset value, end of period | $12.31 | $11.71 | $11.91 | $11.71 | $11.29 |
| Total ReturnD | 11.29% | 4.84% | 8.78% | 10.71% | 11.50% |
| Ratios to Average Net AssetsE,F | | | | | |
| Expenses before reductions | .82% | .83% | .83% | .84% | .90% |
| Expenses net of fee waivers, if any | .81% | .82% | .83% | .84% | .89% |
| Expenses net of all reductions | .81% | .82% | .83% | .84% | .89% |
| Net investment income (loss) | 4.51% | 4.61% | 4.50% | 4.85% | 5.12% |
| Supplemental Data | | | | | |
| Net assets, end of period (000 omitted) | $2,719,387 | $2,561,268 | $2,627,382 | $2,884,545 | $2,252,149 |
| Portfolio turnover rateG | 26% | 19% | 29% | 26% | 27% |
A Calculated based on average shares outstanding during the period.
B Total distributions of $.76 per share is comprised of distributions from net investment income of $.525 and distributions from net realized gain of $.236 per share.
C Amount represents less than $.005 per share.
D Total returns would have been lower if certain expenses had not been reduced during the applicable periods shown.
E Fees and expenses of any underlying Fidelity Central Funds are not included in the Fund's expense ratio. The Fund indirectly bears its proportionate share of the expenses of any underlying Fidelity Central Funds.
F Expense ratios reflect operating expenses of the class. Expenses before reductions do not reflect amounts reimbursed by the investment adviser or reductions from brokerage service arrangements or reductions from other expense offset arrangements and do not represent the amount paid by the class during periods when reimbursements or reductions occur. Expenses net of fee waivers reflect expenses after reimbursement by the investment adviser but prior to reductions from brokerage service arrangements or other expense offset arrangements. Expenses net of all reductions represent the net expenses paid by the class.
G Amount does not include the portfolio activity of any underlying Fidelity Central Funds.
See accompanying notes which are an integral part of the financial statements.
Financial Highlights — Fidelity Real Estate Income Fund Class I
| Years ended July 31, | 2016 | 2015 | 2014 | 2013 | 2012 |
| Selected Per–Share Data | | | | | |
| Net asset value, beginning of period | $11.68 | $11.88 | $11.69 | $11.28 | $10.74 |
| Income from Investment Operations | | | | | |
| Net investment income (loss)A | .52 | .55 | .52 | .57 | .55 |
| Net realized and unrealized gain (loss) | .73 | .02 | .44 | .60 | .62 |
| Total from investment operations | 1.25 | .57 | .96 | 1.17 | 1.17 |
| Distributions from net investment income | (.52) | (.55) | (.53) | (.56) | (.53) |
| Distributions from net realized gain | (.14) | (.21) | (.24) | (.20) | (.10) |
| Total distributions | (.66) | (.77)B | (.77) | (.76) | (.63) |
| Redemption fees added to paid in capitalA,C | – | – | – | – | – |
| Net asset value, end of period | $12.27 | $11.68 | $11.88 | $11.69 | $11.28 |
| Total ReturnD | 11.30% | 4.92% | 8.76% | 10.72% | 11.62% |
| Ratios to Average Net AssetsE,F | | | | | |
| Expenses before reductions | .77% | .77% | .78% | .80% | .84% |
| Expenses net of fee waivers, if any | .77% | .77% | .78% | .80% | .84% |
| Expenses net of all reductions | .76% | .77% | .78% | .80% | .84% |
| Net investment income (loss) | 4.56% | 4.66% | 4.55% | 4.89% | 5.17% |
| Supplemental Data | | | | | |
| Net assets, end of period (000 omitted) | $1,239,950 | $913,475 | $809,854 | $610,045 | $217,435 |
| Portfolio turnover rateG | 26% | 19% | 29% | 26% | 27% |
A Calculated based on average shares outstanding during the period.
B Total distributions of $.77 per share is comprised of distributions from net investment income of $.554 and distributions from net realized gain of $.212 per share.
C Amount represents less than $.005 per share.
D Total returns would have been lower if certain expenses had not been reduced during the applicable periods shown.
E Fees and expenses of any underlying Fidelity Central Funds are not included in the Fund's expense ratio. The Fund indirectly bears its proportionate share of the expenses of any underlying Fidelity Central Funds.
F Expense ratios reflect operating expenses of the class. Expenses before reductions do not reflect amounts reimbursed by the investment adviser or reductions from brokerage service arrangements or reductions from other expense offset arrangements and do not represent the amount paid by the class during periods when reimbursements or reductions occur. Expenses net of fee waivers reflect expenses after reimbursement by the investment adviser but prior to reductions from brokerage service arrangements or other expense offset arrangements. Expenses net of all reductions represent the net expenses paid by the class.
G Amount does not include the portfolio activity of any underlying Fidelity Central Funds.
See accompanying notes which are an integral part of the financial statements.
Notes to Financial Statements
For the period ended July 31, 2016
1. Organization.
Fidelity Real Estate Income Fund (the Fund) is a fund of Fidelity Securities Fund (the Trust) and is authorized to issue an unlimited number of shares. The Trust is registered under the Investment Company Act of 1940, as amended (the 1940 Act), as an open-end management investment company organized as a Massachusetts business trust. The Fund offers Class A, Class T, Class C, Real Estate Income and Class I shares, each of which has equal rights as to assets and voting privileges. Each class has exclusive voting rights with respect to matters that affect that class.
2. Investments in Fidelity Central Funds.
The Fund invests in Fidelity Central Funds, which are open-end investment companies generally available only to other investment companies and accounts managed by the investment adviser and its affiliates. The Fund's Schedule of Investments lists each of the Fidelity Central Funds held as of period end, if any, as an investment of the Fund, but does not include the underlying holdings of each Fidelity Central Fund. As an Investing Fund, the Fund indirectly bears its proportionate share of the expenses of the underlying Fidelity Central Funds.
The Money Market Central Funds seek preservation of capital and current income and are managed by Fidelity Investments Money Management, Inc. (FIMM), an affiliate of the investment adviser. Annualized expenses of the Money Market Central Funds as of their most recent shareholder report date are less than .005%.
A complete unaudited list of holdings for each Fidelity Central Fund is available upon request or at the Securities and Exchange Commission (the SEC) website at www.sec.gov. In addition, the financial statements of the Fidelity Central Funds, which are not covered by the Fund's Report of Independent Registered Public Accounting Firm, are available on the SEC website or upon request.
3. Significant Accounting Policies.
The financial statements have been prepared in conformity with accounting principles generally accepted in the United States of America (GAAP), which require management to make certain estimates and assumptions at the date of the financial statements. Actual results could differ from those estimates. Subsequent events, if any, through the date that the financial statements were issued have been evaluated in the preparation of the financial statements. The following summarizes the significant accounting policies of the Fund:
Investment Valuation. Investments are valued as of 4:00 p.m. Eastern time on the last calendar day of the period. The Board of Trustees (the Board) has delegated the day to day responsibility for the valuation of the Fund's investments to the Fidelity Management & Research Company (FMR) Fair Value Committee (the Committee). In accordance with valuation policies and procedures approved by the Board, the Fund attempts to obtain prices from one or more third party pricing vendors or brokers to value its investments. When current market prices, quotations or currency exchange rates are not readily available or reliable, investments will be fair valued in good faith by the Committee, in accordance with procedures adopted by the Board. Factors used in determining fair value vary by investment type and may include market or investment specific events, changes in interest rates and credit quality. The frequency with which these procedures are used cannot be predicted and they may be utilized to a significant extent. The Committee oversees the Fund's valuation policies and procedures and reports to the Board on the Committee's activities and fair value determinations. The Board monitors the appropriateness of the procedures used in valuing the Fund's investments and ratifies the fair value determinations of the Committee.
The Fund categorizes the inputs to valuation techniques used to value its investments into a disclosure hierarchy consisting of three levels as shown below:
- Level 1 – quoted prices in active markets for identical investments
- Level 2 – other significant observable inputs (including quoted prices for similar investments, interest rates, prepayment speeds, etc.)
- Level 3 – unobservable inputs (including the Fund's own assumptions based on the best information available)
Valuation techniques used to value the Fund's investments by major category are as follows:
Equity securities, including restricted securities, for which market quotations are readily available, are valued at the last reported sale price or official closing price as reported by a third party pricing vendor on the primary market or exchange on which they are traded and are categorized as Level 1 in the hierarchy. In the event there were no sales during the day or closing prices are not available, securities are valued at the last quoted bid price or may be valued using the last available price and are generally categorized as Level 2 in the hierarchy. For foreign equity securities, when market or security specific events arise, comparisons to the valuation of American Depositary Receipts (ADRs), futures contracts, Exchange-Traded Funds (ETFs) and certain indexes as well as quoted prices for similar securities may be used and would be categorized as Level 2 in the hierarchy. Utilizing these techniques may result in transfers between Level 1 and Level 2. For equity securities, including restricted securities, where observable inputs are limited, assumptions about market activity and risk are used and these securities may be categorized as Level 3 in the hierarchy.
Debt securities, including restricted securities, are valued based on evaluated prices received from third party pricing vendors or from brokers who make markets in such securities. Corporate bonds, bank loan obligations and preferred securities are valued by pricing vendors who utilize matrix pricing which considers yield or price of bonds of comparable quality, coupon, maturity and type or by broker-supplied prices. Asset backed securities, collateralized mortgage obligations and commercial mortgage securities are valued by pricing vendors who utilize matrix pricing which considers prepayment speed assumptions, attributes of the collateral, yield or price of bonds of comparable quality, coupon, maturity and type or by broker-supplied prices. When independent prices are unavailable or unreliable, debt securities may be valued utilizing pricing methodologies which consider similar factors that would be used by third party pricing vendors. Debt securities are generally categorized as Level 2 in the hierarchy but may be Level 3 depending on the circumstances.
Investments in open-end mutual funds, including the Fidelity Central Funds, are valued at their closing net asset value (NAV) each business day and are categorized as Level 1 in the hierarchy.
Changes in valuation techniques may result in transfers in or out of an assigned level within the disclosure hierarchy. The aggregate value of investments by input level as of July 31, 2016, is included at the end of the Fund's Schedule of Investments.
Foreign Currency. The Fund may use foreign currency contracts to facilitate transactions in foreign-denominated securities. Gains and losses from these transactions may arise from changes in the value of the foreign currency or if the counterparties do not perform under the contracts' terms.
Foreign-denominated assets, including investment securities, and liabilities are translated into U.S. dollars at the exchange rates at period end. Purchases and sales of investment securities, income and dividends received and expenses denominated in foreign currencies are translated into U.S. dollars at the exchange rate in effect on the transaction date.
The effects of exchange rate fluctuations on investments are included with the net realized and unrealized gain (loss) on investment securities. Other foreign currency transactions resulting in realized and unrealized gain (loss) are disclosed separately.
Investment Transactions and Income. For financial reporting purposes, the Fund's investment holdings and NAV include trades executed through the end of the last business day of the period. The NAV per share for processing shareholder transactions is calculated as of the close of business of the New York Stock Exchange (NYSE), normally 4:00 p.m. Eastern time and includes trades executed through the end of the prior business day. Gains and losses on securities sold are determined on the basis of identified cost. Dividend income is recorded on the ex-dividend date, except for certain dividends from foreign securities where the ex-dividend date may have passed, which are recorded as soon as the Fund is informed of the ex-dividend date. Non-cash dividends included in dividend income, if any, are recorded at the fair market value of the securities received. Income and capital gain distributions from Fidelity Central Funds, if any, are recorded on the ex-dividend date. Distributions received on securities that represent a return of capital or capital gain are recorded as a reduction of cost of investments and/or as a realized gain. Subsequent to ex-dividend date the Fund determines the components of these distributions, based upon receipt of tax filings or other correspondence relating to the underlying investment. Interest income is accrued as earned and includes coupon interest and amortization of premium and accretion of discount on debt securities as applicable. For certain lower credit quality securitized assets that have contractual cash flows (for example, asset backed securities, collateralized mortgage obligations and commercial mortgage-backed securities), changes in estimated cash flows are periodically evaluated and the estimated yield is adjusted on a prospective basis, resulting in increases or decreases to Interest Income in the accompanying Statement of Operations. Investment income is recorded net of foreign taxes withheld where recovery of such taxes is uncertain. Debt obligations may be placed on non-accrual status and related interest income may be reduced by ceasing current accruals and writing off interest receivables when the collection of all or a portion of interest has become doubtful based on consistently applied procedures. A debt obligation is removed from non-accrual status when the issuer resumes interest payments or when collectability of interest is reasonably assured.
Class Allocations and Expenses. Investment income, realized and unrealized capital gains and losses, common expenses of the Fund, and certain fund-level expense reductions, if any, are allocated daily on a pro-rata basis to each class based on the relative net assets of each class to the total net assets of the Fund. Each class differs with respect to transfer agent and distribution and service plan fees incurred. Certain expense reductions may also differ by class. For the reporting period, the allocated portion of income and expenses to each class as a percent of its average net assets may vary due to the timing of recording these transactions in relation to fluctuating net assets of the classes. Expenses directly attributable to a fund are charged to that fund. Expenses attributable to more than one fund are allocated among the respective funds on the basis of relative net assets or other appropriate methods. Expense estimates are accrued in the period to which they relate and adjustments are made when actual amounts are known.
Income Tax Information and Distributions to Shareholders. Each year, the Fund intends to qualify as a regulated investment company under Subchapter M of the Internal Revenue Code, including distributing substantially all of its taxable income and realized gains. As a result, no provision for U.S. Federal income taxes is required. As of July 31, 2016, the Fund did not have any unrecognized tax benefits in the financial statements; nor is the Fund aware of any tax positions for which it is reasonably possible that the total amounts of unrecognized tax benefits will significantly change in the next twelve months. The Fund files a U.S. federal tax return, in addition to state and local tax returns as required. The Fund's federal income tax returns are subject to examination by the Internal Revenue Service (IRS) for a period of three fiscal years after they are filed. State and local tax returns may be subject to examination for an additional fiscal year depending on the jurisdiction. Foreign taxes are provided for based on the Fund's understanding of the tax rules and rates that exist in the foreign markets in which it invests.
Distributions are declared and recorded on the ex-dividend date. Income dividends and capital gain distributions are declared separately for each class. Income and capital gain distributions are determined in accordance with income tax regulations, which may differ from GAAP. In addition, the Fund claimed a portion of the payment made to redeeming shareholders as a distribution for income tax purposes.
Capital accounts within the financial statements are adjusted for permanent book-tax differences. These adjustments have no impact on net assets or the results of operations. Capital accounts are not adjusted for temporary book-tax differences which will reverse in a subsequent period.
Book-tax differences are primarily due to foreign currency transactions, passive foreign investment companies (PFIC), market discount, equity-debt classifications, certain conversion ratio adjustments, partnerships and losses deferred due to wash sales.
The federal tax cost of investment securities and unrealized appreciation (depreciation) as of period end were as follows:
| Gross unrealized appreciation | $585,886,559 |
| Gross unrealized depreciation | (135,755,064) |
| Net unrealized appreciation (depreciation) on securities | $450,131,495 |
| Tax Cost | $4,399,127,396 |
The tax-based components of distributable earnings as of period end were as follows:
| Undistributed ordinary income | $40,564,435 |
| Undistributed long-term capital gain | $27,579,151 |
| Net unrealized appreciation (depreciation) on securities and other investments | $450,131,763 |
The tax character of distributions paid was as follows:
| | July 31, 2016 | July 31, 2015 |
| Ordinary Income | $185,109,460 | $ 202,287,403 |
| Long-term Capital Gains | 51,815,852 | 72,842,487 |
| Total | $236,925,312 | $ 275,129,890 |
Short-Term Trading (Redemption) Fees. Shares held by investors in the Fund less than 90 days may have been subject to a redemption fee equal to .75% of the NAV of shares redeemed. All redemption fees, which reduce the proceeds of the shareholder redemption, are retained by the Fund and accounted for as an addition to paid in capital.
Restricted Securities. The Fund may invest in securities that are subject to legal or contractual restrictions on resale. These securities generally may be resold in transactions exempt from registration or to the public if the securities are registered. Disposal of these securities may involve time-consuming negotiations and expense, and prompt sale at an acceptable price may be difficult. Information regarding restricted securities is included at the end of the Fund's Schedule of Investments.
Loans and Other Direct Debt Instruments. The Fund invests in direct debt instruments which are interests in amounts owed to lenders by corporate or other borrowers. These instruments may be in the form of loans, trade claims or other receivables and may include standby financing commitments such as revolving credit facilities that obligate the Fund to supply additional cash to the borrower on demand. Loans may be acquired through assignment or participation. The Fund did not have any unfunded loan commitments, which are contractual obligations for future funding, at period end.
4. Purchases and Sales of Investments.
Purchases and sales of securities, other than short-term securities and U.S. government securities, aggregated $1,246,117,317 and $1,026,796,771, respectively.
5. Fees and Other Transactions with Affiliates.
Management Fee. Fidelity Management & Research Company (the investment adviser) and its affiliates provide the Fund with investment management related services for which the Fund pays a monthly management fee. The management fee is the sum of an individual fund fee rate that is based on an annual rate of .30% of the Fund's average net assets and an annualized group fee rate that averaged .25% during the period. The group fee rate is based upon the average net assets of all the mutual funds advised by the investment adviser, including any mutual funds previously advised by the investment adviser that are currently advised by Fidelity SelectCo, LLC, an affiliate of the investment adviser. The group fee rate decreases as assets under management increase and increases as assets under management decrease. For the reporting period, the total annual management fee rate was .55% of the Fund's average net assets.
Distribution and Service Plan Fees. In accordance with Rule 12b-1 of the 1940 Act, the Fund has adopted separate Distribution and Service Plans for each class of shares. Certain classes pay Fidelity Distributors Corporation (FDC), an affiliate of the investment adviser, separate Distribution and Service Fees, each of which is based on an annual percentage of each class' average net assets. In addition, FDC may pay financial intermediaries for selling shares of the Fund and providing shareholder support services. For the period, the Distribution and Service Fee rates, total fees and amounts retained by FDC were as follows:
| | Distribution
Fee | Service
Fee | Total Fees | Retained
by FDC |
| Class A | -% | .25% | $1,249,583 | $– |
| Class T | -% | .25% | 140,262 | – |
| Class C | .75% | .25% | 2,758,443 | 452,312 |
| | | | $4,148,288 | $452,312 |
Sales Load. FDC may receive a front-end sales charge of up to 4.00% for selling Class A shares and Class T shares, some of which is paid to financial intermediaries for selling shares of the Fund. Depending on the holding period, FDC may receive contingent deferred sales charges levied on Class A, Class T, and Class C redemptions. The deferred sales charges are 1.00% for Class C shares, 1.00% for certain purchases of Class A shares and .25% for certain purchases of Class T shares.
For the period, sales charge amounts retained by FDC were as follows:
| | Retained
by FDC |
| Class A | $77,989 |
| Class T | 9,945 |
| Class C(a) | 33,753 |
| | $121,687 |
(a) When Class C shares are initially sold, FDC pays commissions from its own resources to financial intermediaries through which the sales are made.
Transfer Agent Fees. Fidelity Investments Institutional Operations Company, Inc., (FIIOC), an affiliate of the investment adviser, is the transfer, dividend disbursing and shareholder servicing agent for each class of the Fund. FIIOC receives account fees and asset-based fees that vary according to the account size and type of account of the shareholders of the respective classes of the Fund. FIIOC pays for typesetting, printing and mailing of shareholder reports, except proxy statements.
For the period, transfer agent fees for each class were as follows:
| | Amount | % of
Class-Level Average
Net Assets |
| Class A | $952,659 | .19 |
| Class T | 125,890 | .22 |
| Class C | 534,908 | .19 |
| Real Estate Income | 5,677,459 | .22 |
| Class I | 1,608,352 | .17 |
| | $ 8,899,268 | |
Accounting and Security Lending Fees. Fidelity Service Company, Inc. (FSC), an affiliate of the investment adviser, maintains the Fund's accounting records. The accounting fee is based on the level of average net assets for each month. Under a separate contract, FSC administers the security lending program. The security lending fee is based on the number and duration of lending transactions.
Brokerage Commissions. The Fund placed a portion of its portfolio transactions with brokerage firms which are affiliates of the investment adviser. Brokerage commissions are included in net realized gain (loss) and change in net unrealized appreciation (depreciation) in the Statement of Operations. The commissions paid to these affiliated firms were $14,078 for the period.
Interfund Trades. The Fund may purchase from or sell securities to other Fidelity Funds under procedures adopted by the Board. The procedures have been designed to ensure these interfund trades are executed in accordance with Rule 17a-7 of the 1940 Act. Interfund trades are included within the respective purchases and sales amounts shown in the Purchases and Sales of Investments note.
6. Committed Line of Credit.
The Fund participates with other funds managed by the investment adviser or an affiliate in a $4.25 billion credit facility (the "line of credit") to be utilized for temporary or emergency purposes to fund shareholder redemptions or for other short-term liquidity purposes. The Fund has agreed to pay commitment fees on its pro-rata portion of the line of credit, which amounted to $8,876 and is reflected in Miscellaneous expenses on the Statement of Operations. During the period, the Fund did not borrow on this line of credit.
7. Security Lending.
The Fund lends portfolio securities through a lending agent from time to time in order to earn additional income. For equity securities, a lending agent is used and may loan securities to certain qualified borrowers, including Fidelity Capital Markets (FCM), a broker-dealer affiliated with the Fund. On the settlement date of the loan, the Fund receives collateral (in the form of U.S. Treasury obligations, letters of credit and/or cash) against the loaned securities and maintains collateral in an amount not less than 100% of the market value of the loaned securities during the period of the loan. The market value of the loaned securities is determined at the close of business of the Fund and any additional required collateral is delivered to the Fund on the next business day. The Fund or borrower may terminate the loan at any time, and if the borrower defaults on its obligation to return the securities loaned because of insolvency or other reasons, the Fund may apply collateral received from the borrower against the obligation. The Fund may experience delays and costs in recovering the securities loaned. Any cash collateral received is invested in the Fidelity Securities Lending Cash Central Fund. The value of loaned securities and cash collateral at period end are disclosed on the Fund's Statement of Assets and Liabilities. Security lending income represents the income earned on investing cash collateral, less rebates paid to borrowers and any lending agent fees associated with the loan, plus any premium payments received for lending certain types of securities. Security lending income is presented in the Statement of Operations as a component of income from Fidelity Central Funds. Total security lending income during the period amounted to $28,725. During the period, there were no securities loaned to FCM.
8. Expense Reductions.
Commissions paid to certain brokers with whom the investment adviser, or its affiliates, places trades on behalf of the Fund include an amount in addition to trade execution, which may be rebated back to the Fund to offset certain expenses. This amount totaled $60,649 for the period. In addition, through arrangements with the Fund's custodian and each class' transfer agent, credits realized as a result of certain uninvested cash balances were used to reduce the Fund's expenses. During the period, these credits reduced the Fund's custody expenses by $5,383.
In addition, during the period the investment adviser reimbursed and/or waived a portion of fund-level operating expenses in the amount of $29,692.
9. Distributions to Shareholders.
Distributions to shareholders of each class were as follows:
| | Year ended
July 31, 2016 | Year ended
July 31, 2015 |
| From net investment income | | |
| Class A | $20,776,428 | $21,010,715 |
| Class T | 2,323,930 | 2,305,119 |
| Class C | 9,744,417 | 10,465,476 |
| Real Estate Income | 111,450,147 | 122,206,251 |
| Class I | 40,814,538 | 43,464,765 |
| Total | $185,109,460 | $199,452,326 |
| From net realized gain | | |
| Class A | $6,008,082 | $7,958,848 |
| Class T | 680,042 | 875,220 |
| Class C | 3,527,228 | 4,645,932 |
| Real Estate Income | 30,805,486 | 46,720,433 |
| Class I | 10,795,014 | 15,477,131 |
| Total | $51,815,852 | $75,677,564 |
10. Share Transactions.
Share transactions for each class were as follows and may contain automatic conversions between classes or exchanges between affiliated funds:
| | Shares | Shares | Dollars | Dollars |
| | Year ended
July 31, 2016 | Year ended
July 31, 2015 | Year ended
July 31, 2016 | Year ended
July 31, 2015 |
| Class A | | | | |
| Shares sold | 15,526,418 | 17,614,783 | $176,978,857 | $207,492,435 |
| Reinvestment of distributions | 2,217,782 | 2,253,682 | 24,934,959 | 26,209,333 |
| Shares redeemed | (15,457,212) | (14,664,043) | (176,322,303) | (171,937,484) |
| Net increase (decrease) | 2,286,988 | 5,204,422 | $25,591,513 | $61,764,284 |
| Class T | | | | |
| Shares sold | 1,214,951 | 1,551,308 | $13,936,304 | $18,286,948 |
| Reinvestment of distributions | 246,897 | 251,652 | 2,775,517 | 2,927,374 |
| Shares redeemed | (1,335,803) | (1,110,729) | (15,332,670) | (13,074,996) |
| Net increase (decrease) | 126,045 | 692,231 | $1,379,151 | $8,139,326 |
| Class C | | | | |
| Shares sold | 4,854,016 | 7,875,459 | $55,310,329 | $92,082,413 |
| Reinvestment of distributions | 1,043,618 | 1,105,279 | 11,628,023 | 12,763,694 |
| Shares redeemed | (7,264,769) | (4,690,719) | (81,984,542) | (54,577,835) |
| Net increase (decrease) | (1,367,135) | 4,290,019 | $(15,046,190) | $50,268,272 |
| Real Estate Income | | | | |
| Shares sold | 54,340,979 | 51,184,144 | $625,193,342 | $605,520,317 |
| Reinvestment of distributions | 11,080,986 | 12,742,585 | 125,130,837 | 148,826,128 |
| Shares redeemed | (63,200,104) | (65,882,524) | (728,426,852) | (777,479,294) |
| Net increase (decrease) | 2,221,861 | (1,955,795) | $21,897,327 | $(23,132,849) |
| Class I | | | | |
| Shares sold | 51,672,151 | 38,671,974 | $597,272,677 | $455,469,590 |
| Reinvestment of distributions | 3,437,483 | 3,704,065 | 38,745,091 | 43,129,998 |
| Shares redeemed | (32,289,301) | (32,342,580) | (367,406,157) | (380,445,460) |
| Net increase (decrease) | 22,820,333 | 10,033,459 | $268,611,611 | $118,154,128 |
11. Other.
The Fund's organizational documents provide former and current trustees and officers with a limited indemnification against liabilities arising in connection with the performance of their duties to the Fund. In the normal course of business, the Fund may also enter into contracts that provide general indemnifications. The Fund's maximum exposure under these arrangements is unknown as this would be dependent on future claims that may be made against the Fund. The risk of material loss from such claims is considered remote.
Report of Independent Registered Public Accounting Firm
To the Trustees of Fidelity Securities Fund and Shareholders of Fidelity Real Estate Income Fund:
We have audited the accompanying statement of assets and liabilities of Fidelity Real Estate Income Fund (the Fund), a fund of Fidelity Securities Fund, including the schedule of investments, as of July 31, 2016, and the related statement of operations for the year then ended, the statement of changes in net assets for each of the two years in the period then ended, and the financial highlights for each of the five years in the period then ended. These financial statements and financial highlights are the responsibility of the Fund's management. Our responsibility is to express an opinion on these financial statements and financial highlights based on our audits.
We conducted our audits in accordance with the standards of the Public Company Accounting Oversight Board (United States). Those standards require that we plan and perform the audit to obtain reasonable assurance about whether the financial statements and financial highlights are free of material misstatement. The Fund is not required to have, nor were we engaged to perform, an audit of its internal control over financial reporting. Our audits included consideration of internal control over financial reporting as a basis for designing audit procedures that are appropriate in the circumstances, but not for the purpose of expressing an opinion on the effectiveness of the Fund's internal control over financial reporting. Accordingly, we express no such opinion. An audit also includes examining, on a test basis, evidence supporting the amounts and disclosures in the financial statements, assessing the accounting principles used and significant estimates made by management, as well as evaluating the overall financial statement presentation. Our procedures included confirmation of securities owned as of July 31, 2016, by correspondence with the custodians and brokers; when replies were not received from brokers, we performed other auditing procedures. We believe that our audits provide a reasonable basis for our opinion.
In our opinion, such financial statements and financial highlights referred to above present fairly, in all material respects, the financial position of Fidelity Real Estate Income Fund as of July 31, 2016, the results of its operations for the year then ended, the changes in its net assets for each of the two years in the period then ended, and the financial highlights for each of the five years in the period then ended, in conformity with accounting principles generally accepted in the United States of America.
DELOITTE & TOUCHE LLP
Boston, Massachusetts
September 19, 2016
Trustees and Officers
The Trustees, Members of the Advisory Board (if any), and officers of the trust and fund, as applicable, are listed below. The Board of Trustees governs the fund and is responsible for protecting the interests of shareholders. The Trustees are experienced executives who meet periodically throughout the year to oversee the fund's activities, review contractual arrangements with companies that provide services to the fund, oversee management of the risks associated with such activities and contractual arrangements, and review the fund's performance. Each of the Trustees oversees 170 funds.
The Trustees hold office without limit in time except that (a) any Trustee may resign; (b) any Trustee may be removed by written instrument, signed by at least two-thirds of the number of Trustees prior to such removal; (c) any Trustee who requests to be retired or who has become incapacitated by illness or injury may be retired by written instrument signed by a majority of the other Trustees; and (d) any Trustee may be removed at any special meeting of shareholders by a two-thirds vote of the outstanding voting securities of the trust. Each Trustee who is not an interested person (as defined in the 1940 Act) of the trust and the fund is referred to herein as an Independent Trustee. Each Independent Trustee shall retire not later than the last day of the calendar year in which his or her 75th birthday occurs. The Independent Trustees may waive this mandatory retirement age policy with respect to individual Trustees. Officers and Advisory Board Members hold office without limit in time, except that any officer or Advisory Board Member may resign or may be removed by a vote of a majority of the Trustees at any regular meeting or any special meeting of the Trustees. Except as indicated, each individual has held the office shown or other offices in the same company for the past five years.
The fund’s Statement of Additional Information (SAI) includes more information about the Trustees. To request a free copy, call Fidelity at 1-877-208-0098.
Experience, Skills, Attributes, and Qualifications of the Trustees. The Governance and Nominating Committee has adopted a statement of policy that describes the experience, qualifications, attributes, and skills that are necessary and desirable for potential Independent Trustee candidates (Statement of Policy). The Board believes that each Trustee satisfied at the time he or she was initially elected or appointed a Trustee, and continues to satisfy, the standards contemplated by the Statement of Policy. The Governance and Nominating Committee also engages professional search firms to help identify potential Independent Trustee candidates who have the experience, qualifications, attributes, and skills consistent with the Statement of Policy. From time to time, additional criteria based on the composition and skills of the current Independent Trustees, as well as experience or skills that may be appropriate in light of future changes to board composition, business conditions, and regulatory or other developments, have also been considered by the professional search firms and the Governance and Nominating Committee. In addition, the Board takes into account the Trustees' commitment and participation in Board and committee meetings, as well as their leadership of standing and ad hoc committees throughout their tenure.
In determining that a particular Trustee was and continues to be qualified to serve as a Trustee, the Board has considered a variety of criteria, none of which, in isolation, was controlling. The Board believes that, collectively, the Trustees have balanced and diverse experience, qualifications, attributes, and skills, which allow the Board to operate effectively in governing the fund and protecting the interests of shareholders. Information about the specific experience, skills, attributes, and qualifications of each Trustee, which in each case led to the Board's conclusion that the Trustee should serve (or continue to serve) as a trustee of the fund, is provided below.
Board Structure and Oversight Function. James C. Curvey is an interested person and currently serves as Chairman. The Trustees have determined that an interested Chairman is appropriate and benefits shareholders because an interested Chairman has a personal and professional stake in the quality and continuity of services provided to the fund. Independent Trustees exercise their informed business judgment to appoint an individual of their choosing to serve as Chairman, regardless of whether the Trustee happens to be independent or a member of management. The Independent Trustees have determined that they can act independently and effectively without having an Independent Trustee serve as Chairman and that a key structural component for assuring that they are in a position to do so is for the Independent Trustees to constitute a substantial majority for the Board. The Independent Trustees also regularly meet in executive session. Ned C. Lautenbach serves as Chairman of the Independent Trustees and as such (i) acts as a liaison between the Independent Trustees and management with respect to matters important to the Independent Trustees and (ii) with management prepares agendas for Board meetings.
Fidelity® funds are overseen by different Boards of Trustees. The fund's Board oversees Fidelity's high income and certain equity funds, and other Boards oversee Fidelity's investment-grade bond, money market, asset allocation, and sector funds. The asset allocation funds may invest in Fidelity® funds overseen by the fund's Board. The use of separate Boards, each with its own committee structure, allows the Trustees of each group of Fidelity® funds to focus on the unique issues of the funds they oversee, including common research, investment, and operational issues. On occasion, the separate Boards establish joint committees to address issues of overlapping consequences for the Fidelity® funds overseen by each Board.
The Trustees operate using a system of committees to facilitate the timely and efficient consideration of all matters of importance to the Trustees, the fund, and fund shareholders and to facilitate compliance with legal and regulatory requirements and oversight of the fund's activities and associated risks. The Board, acting through its committees, has charged FMR and its affiliates with (i) identifying events or circumstances the occurrence of which could have demonstrably adverse effects on the fund's business and/or reputation; (ii) implementing processes and controls to lessen the possibility that such events or circumstances occur or to mitigate the effects of such events or circumstances if they do occur; and (iii) creating and maintaining a system designed to evaluate continuously business and market conditions in order to facilitate the identification and implementation processes described in (i) and (ii) above. Because the day-to-day operations and activities of the fund are carried out by or through FMR, its affiliates, and other service providers, the fund's exposure to risks is mitigated but not eliminated by the processes overseen by the Trustees. While each of the Board's committees has responsibility for overseeing different aspects of the fund's activities, oversight is exercised primarily through the Operations, Audit, and Compliance Committees. In addition, the Independent Trustees have worked with FMR to enhance the Board's oversight of investment and financial risks, legal and regulatory risks, technology risks, and operational risks, including the development of additional risk reporting to the Board. For example, a working group comprised of Independent Trustees and FMR has worked and continues to work to review the Fidelity® funds' valuation-related activities, reporting and risk management. Appropriate personnel, including but not limited to the fund's Chief Compliance Officer (CCO), FMR's internal auditor, the independent accountants, the fund's Treasurer and portfolio management personnel, make periodic reports to the Board's committees, as appropriate, including an annual review of Fidelity's risk management program for the Fidelity® funds. The responsibilities of each standing committee, including their oversight responsibilities, are described further under "Standing Committees of the Trustees."
Interested Trustees*:
Correspondence intended for a Trustee who is an interested person may be sent to Fidelity Investments, 245 Summer Street, Boston, Massachusetts 02210.
Name, Year of Birth; Principal Occupations and Other Relevant Experience+
James C. Curvey (1935)
Year of Election or Appointment: 2007
Trustee
Chairman of the Board of Trustees
Mr. Curvey also serves as Trustee of other Fidelity® funds. Mr. Curvey is a Director of Fidelity Research & Analysis Co. (investment adviser firm, 2009-present), and Vice Chairman (2007-present) and Director of FMR LLC (diversified financial services company). In addition, Mr. Curvey serves as an Overseer for the Boston Symphony Orchestra and a member of the board of Artis-Naples, Naples, Florida, and as a Trustee for Brewster Academy, Wolfeboro, New Hampshire. Previously, Mr. Curvey served as a Director of Fidelity Investments Money Management, Inc. (investment adviser firm, 2009-2014) and a Director of FMR and FMR Co., Inc. (investment adviser firms, 2007-2014).
Charles S. Morrison (1960)
Year of Election or Appointment: 2014
Trustee
Mr. Morrison also serves as Trustee of other funds. He serves as a Director of Fidelity Investments Money Management, Inc. (FIMM) (investment adviser firm, 2014-present), Director of Fidelity SelectCo, LLC (investment adviser firm, 2014-present), President, Asset Management (2014-present), and is an employee of Fidelity Investments. Previously, Mr. Morrison served as Vice President of Fidelity's Fixed Income and Asset Allocation Funds (2012-2014), President, Fixed Income (2011-2014), Vice President of Fidelity's Money Market Funds (2005-2009), President, Money Market Group Leader of FMR (investment adviser firm, 2009), and Senior Vice President, Money Market Group of FMR (2004-2009). Mr. Morrison also served as Vice President of Fidelity's Bond Funds (2002-2005), certain Balanced Funds (2002-2005), and certain Asset Allocation Funds (2002-2007), and as Senior Vice President (2002-2005) of Fidelity's Bond Division.
* Determined to be an “Interested Trustee” by virtue of, among other things, his or her affiliation with the trust or various entities under common control with FMR.
+ The information includes the Trustee's principal occupation during the last five years and other information relating to the experience, attributes, and skills relevant to the Trustee's qualifications to serve as a Trustee, which led to the conclusion that the Trustee should serve as a Trustee for the fund.
Independent Trustees:
Correspondence intended for an Independent Trustee may be sent to Fidelity Investments, P.O. Box 55235, Boston, Massachusetts 02205-5235.
Name, Year of Birth; Principal Occupations and Other Relevant Experience+
Dennis J. Dirks (1948)
Year of Election or Appointment: 2005
Trustee
Mr. Dirks also serves as Trustee of other Fidelity® funds. Prior to his retirement in May 2003, Mr. Dirks was Chief Operating Officer and a member of the Board of The Depository Trust & Clearing Corporation (DTCC). He also served as President, Chief Operating Officer, and Board member of The Depository Trust Company (DTC) and President and Board member of the National Securities Clearing Corporation (NSCC). In addition, Mr. Dirks served as Chief Executive Officer and Board member of the Government Securities Clearing Corporation, Chief Executive Officer and Board member of the Mortgage-Backed Securities Clearing Corporation, as a Trustee and a member of the Finance Committee of Manhattan College (2005-2008), as a Trustee and a member of the Finance Committee of AHRC of Nassau County (2006-2008), and as a member of the Independent Directors Council (IDC) Governing Council (2010-2015). Mr. Dirks is a member of the Board of Directors for The Brookville Center for Children's Services, Inc. (2009-present).
Alan J. Lacy (1953)
Year of Election or Appointment: 2008
Trustee
Mr. Lacy also serves as Trustee of other Fidelity® funds. Mr. Lacy serves as Chairman (2014-present) and a member (2010-present) of the Board of Directors of Dave & Buster's Entertainment, Inc. (restaurant and entertainment complexes) and a Director of Bristol-Myers Squibb Company (global pharmaceuticals, 2008-present). He is a Trustee of the California Chapter of The Nature Conservancy (2015-present) and a Director of the Center for Advanced Study in the Behavioral Sciences at Stanford University (2015-present). In addition, Mr. Lacy served as Senior Adviser (2007-2014) of Oak Hill Capital Partners, L.P. (private equity) and also served as Chief Executive Officer (2005) and Vice Chairman (2005-2006) of Sears Holdings Corporation (retail) and Chief Executive Officer and Chairman of the Board of Sears, Roebuck and Co. (retail, 2000-2005). Previously, Mr. Lacy served as Chairman (2008-2011) and a member (2006-2015) of the Board of Trustees of the National Parks Conservation Association and as a member of the Board of Directors for The Western Union Company (global money transfer, 2006-2011), The Hillman Companies, Inc. (hardware wholesalers, 2010-2014), and Earth Fare, Inc. (retail grocery, 2010-2014).
Ned C. Lautenbach (1944)
Year of Election or Appointment: 2000
Trustee
Chairman of the Independent Trustees
Mr. Lautenbach also serves as Trustee of other Fidelity® funds. Mr. Lautenbach currently serves as the Lead Director of the Eaton Corporation Board of Directors (diversified industrial, 1997-present). Mr. Lautenbach is Chairman of the Board of Directors of Artis-Naples in Naples, Florida (2012-present), a member of the Council on Foreign Relations (1994-present), and a member of the Board of Governors, State University System of Florida (2013-present). Previously, Mr. Lautenbach was a Partner/Advisory Partner at Clayton, Dubilier & Rice, LLC (private equity investment, 1998-2010), as well as a Director of Sony Corporation (2006-2007).
Joseph Mauriello (1944)
Year of Election or Appointment: 2008
Trustee
Mr. Mauriello also serves as Trustee of other Fidelity® funds. Prior to his retirement in January 2006, Mr. Mauriello served in numerous senior management positions including Deputy Chairman and Chief Operating Officer (2004-2005), and Vice Chairman of Financial Services (2002-2004) of KPMG LLP US (professional services, 1965-2005). Mr. Mauriello currently serves as a member of the Board of Directors of XL Group plc. (global insurance and re-insurance, 2006-present) and the Independent Directors Council (IDC) Governing Council (2015-present). Previously, Mr. Mauriello served as a Director of the Hamilton Funds of the Bank of New York (2006-2007) and of Arcadia Resources Inc. (health care services and products, 2007-2012).
Robert W. Selander (1950)
Year of Election or Appointment: 2011
Trustee
Mr. Selander also serves as Trustee of other Fidelity® funds. Mr. Selander serves as a Director of The Western Union Company (global money transfer, 2014-present) and a non-executive Chairman of Health Equity, Inc. (health savings custodian, 2015-present). Previously, Mr. Selander served as a Member of the Advisory Board of certain Fidelity® funds (2011), and Executive Vice Chairman (2010), Chief Executive Officer (2009-2010), and President and Chief Executive Officer (1997-2009) of Mastercard, Inc.
Cornelia M. Small (1944)
Year of Election or Appointment: 2005
Trustee
Ms. Small also serves as Trustee of other Fidelity® funds. Ms. Small is a member of the Board of Directors (2009-present) and Chair of the Investment Committee (2010-present) of the Teagle Foundation. Ms. Small also serves on the Investment Committee of the Berkshire Taconic Community Foundation (2008-present). Previously, Ms. Small served as Chairperson (2002-2008) and a member of the Investment Committee and Chairperson (2008-2012) and a member of the Board of Trustees of Smith College. In addition, Ms. Small served as Chief Investment Officer, Director of Global Equity Investments, and a member of the Board of Directors of Scudder, Stevens & Clark and Scudder Kemper Investments.
William S. Stavropoulos (1939)
Year of Election or Appointment: 2002
Trustee
Vice Chairman of the Independent Trustees
Mr. Stavropoulos also serves as Trustee of other Fidelity® funds. Mr. Stavropoulos serves as President and Founder of the Michigan Baseball Foundation, the Great Lakes Loons (2007-present). Mr. Stavropoulos is Chairman Emeritus of the Board of Directors of The Dow Chemical Company, where he previously served in numerous senior management positions, including President, CEO (1995-2000; 2002-2004), Chairman of the Executive Committee (2000-2006), and as a member of the Board of Directors (1990-2006). Currently, Mr. Stavropoulos is Chairman of the Board of Directors of Univar Inc. (global distributor of commodity and specialty chemicals), a Director of Teradata Corporation (data warehousing and technology solutions), and Maersk Inc. (industrial conglomerate), and a member of the Advisory Board for Metalmark Capital LLC (private equity investment, 2005-present). Mr. Stavropoulos is an operating advisor to Clayton, Dubilier & Rice, LLC (private equity investment). In addition, Mr. Stavropoulos is a member of the University of Notre Dame Advisory Council for the College of Science, a Trustee of the Rollin L. Gerstacker Foundation, and a Director of the Naples Philharmonic Center for the Arts. Previously, Mr. Stavropoulos served as a Director of Chemical Financial Corporation (bank holding company, 1993-2012) and Tyco International, Ltd. (multinational manufacturing and services, 2007-2012).
David M. Thomas (1949)
Year of Election or Appointment: 2008
Trustee
Mr. Thomas also serves as Trustee of other Fidelity® funds. Mr. Thomas serves as Non-Executive Chairman of the Board of Directors of Fortune Brands Home and Security (home and security products, 2011-present), as a member of the Board of Directors (2004-present) and Presiding Director (2013-present) of Interpublic Group of Companies, Inc. (marketing communication), and as a member of the Board of Trustees of the University of Florida (2013-present). Previously, Mr. Thomas served as Executive Chairman (2005-2006) and Chairman and Chief Executive Officer (2000-2005) of IMS Health, Inc. (pharmaceutical and healthcare information solutions), and a Director of Fortune Brands, Inc. (consumer products, 2000-2011).
+ The information includes the Trustee's principal occupation during the last five years and other information relating to the experience, attributes, and skills relevant to the Trustee's qualifications to serve as a Trustee, which led to the conclusion that the Trustee should serve as a Trustee for the fund.
Advisory Board Members and Officers:
Correspondence intended for an officer or Peter S. Lynch may be sent to Fidelity Investments, 245 Summer Street, Boston, Massachusetts 02210. Officers appear below in alphabetical order.
Name, Year of Birth; Principal Occupation
Peter S. Lynch (1944)
Year of Election or Appointment: 2003
Member of the Advisory Board
Mr. Lynch also serves as Member of the Advisory Board of other Fidelity® funds. Mr. Lynch is Vice Chairman and a Director of FMR (investment adviser firm) and FMR Co., Inc. (investment adviser firm). In addition, Mr. Lynch serves as a Trustee of Boston College and as the Chairman of the Inner-City Scholarship Fund. Previously, Mr. Lynch served on the Special Olympics International Board of Directors (1997-2006).
Marc R. Bryant (1966)
Year of Election or Appointment: 2015
Secretary and Chief Legal Officer (CLO)
Mr. Bryant also serves as Secretary and CLO of other funds. Mr. Bryant serves as CLO, Secretary, and Senior Vice President of Fidelity Management & Research Company (investment adviser firm, 2015-present) and FMR Co., Inc. (investment adviser firm, 2015-present); Secretary of Fidelity SelectCo, LLC (investment adviser firm, 2015-present) and Fidelity Investments Money Management, Inc. (investment adviser firm, 2015-present); and CLO of Fidelity Management & Research (Hong Kong) Limited and FMR Investment Management (U.K.) Limited (investment adviser firms, 2015-present) and Fidelity Management & Research (Japan) Limited (investment adviser firm, 2016-present). He is Senior Vice President and Deputy General Counsel of FMR LLC (diversified financial services company). Previously, Mr. Bryant served as Secretary and CLO of Fidelity Rutland Square Trust II (2010-2014) and Assistant Secretary of Fidelity's Fixed Income and Asset Allocation Funds (2013-2015). Prior to joining Fidelity Investments, Mr. Bryant served as a Senior Vice President and the Head of Global Retail Legal for AllianceBernstein L.P. (2006-2010), and as the General Counsel for ProFund Advisors LLC (2001-2006).
Jeffrey S. Christian (1961)
Year of Election or Appointment: 2016
Assistant Treasurer
Mr. Christian also serves as Assistant Treasurer of other funds. Mr. Christian is an employee of Fidelity Investments (2003-present).
William C. Coffey (1969)
Year of Election or Appointment: 2009
Assistant Secretary
Mr. Coffey also serves as Assistant Secretary of other funds. He is Senior Vice President and Deputy General Counsel of FMR LLC (diversified financial services company, 2010-present), and is an employee of Fidelity Investments. Previously, Mr. Coffey served as Vice President and Associate General Counsel of FMR LLC (2005-2009).
Jonathan Davis (1968)
Year of Election or Appointment: 2010
Assistant Treasurer
Mr. Davis also serves as Assistant Treasurer of other funds, and is an employee of Fidelity Investments. Previously, Mr. Davis served as Vice President and Associate General Counsel of FMR LLC (diversified financial services company, 2003-2010).
Adrien E. Deberghes (1967)
Year of Election or Appointment: 2016
Assistant Treasurer
Mr. Deberghes also serves as an officer of other funds. He serves as Executive Vice President of Fidelity Investments Money Management, Inc. (FIMM) (investment adviser firm, 2016-present) and is an employee of Fidelity Investments (2008-present). Prior to joining Fidelity Investments, Mr. Deberghes was Senior Vice President of Mutual Fund Administration at State Street Corporation (2007-2008), Senior Director of Mutual Fund Administration at Investors Bank & Trust (2005-2007), and Director of Finance for Dunkin' Brands (2000-2005). Previously, Mr. Deberghes served in other fund officer roles.
Stephanie J. Dorsey (1969)
Year of Election or Appointment: 2010
Assistant Treasurer
Ms. Dorsey also serves as an officer of other funds. She is an employee of Fidelity Investments (2008-present) and has served in other fund officer roles. Prior to joining Fidelity Investments, Ms. Dorsey served as Treasurer (2004-2008) of the JPMorgan Mutual Funds and Vice President (2004-2008) of JPMorgan Chase Bank.
Howard J. Galligan III (1966)
Year of Election or Appointment: 2014
Chief Financial Officer
Mr. Galligan also serves as Chief Financial Officer of other funds. Mr. Galligan serves as President of Fidelity Pricing and Cash Management Services (FPCMS) (2014-present) and as a Director of Strategic Advisers, Inc. (investment adviser firm, 2008-present). Previously, Mr. Galligan served as Chief Administrative Officer of Asset Management (2011-2014) and Chief Operating Officer and Senior Vice President of Investment Support for Strategic Advisers, Inc. (2003-2011).
Scott C. Goebel (1968)
Year of Election or Appointment: 2015
Vice President
Mr. Goebel serves as Vice President of other funds and is an employee of Fidelity Investments (2001-present). Mr. Goebel serves as Senior Vice President of Fidelity Management & Research Company (FMR) (investment adviser firm, 2016-present). Previously, Mr. Goebel served as Secretary of Fidelity SelectCo, LLC (investment adviser firm, 2013-2015), Fidelity Investments Money Management, Inc. (FIMM) (investment adviser firm, 2010-2015), and Fidelity Research and Analysis Company (FRAC) (investment adviser firm, 2010-2015); General Counsel, Secretary, and Senior Vice President of FMR (investment adviser firm, 2008-2015) and FMR Co., Inc. (investment adviser firm, 2008-2015); Assistant Secretary of Fidelity Management & Research (Japan) Limited (investment adviser firm, 2008-2015) and Fidelity Management & Research (U.K.) Inc. (investment adviser firm, 2008-2015); Chief Legal Officer (CLO) of Fidelity Management & Research (Hong Kong) Limited (investment adviser firm, 2008-2015); Secretary and CLO of certain Fidelity® funds (2008-2015); Assistant Secretary of FIMM (2008-2010), FRAC (2008-2010), and certain funds (2007-2008); and as Vice President and Secretary of Fidelity Distributors Corporation (FDC) (2005-2007).
Thomas C. Hense (1964)
Year of Election or Appointment: 2008, 2010, or 2015
Vice President
Mr. Hense serves as Vice President of Fidelity Advisor® Multi-Asset Income Fund (2015) and other funds (High Income (2008), Small Cap (2008), and Value (2010) funds), and is an employee of Fidelity Investments (1993-present). Previously, Mr. Hense served as a portfolio manager for Fidelity's Institutional Money Management Group (Pyramis) (2003-2008).
Brian B. Hogan (1964)
Year of Election or Appointment: 2009
Vice President
Mr. Hogan also serves as Trustee or Vice President of other funds. Mr. Hogan serves as a Director of FMR Investment Management (U.K.) Limited (investment adviser firm, 2015-present) and Fidelity SelectCo, LLC (investment adviser firm, 2014-present) and President of the Equity Division of FMR (investment adviser firm, 2009-present). Previously, Mr. Hogan served as Senior Vice President, Equity Research of FMR (2006-2009) and as a portfolio manager. Mr. Brian B. Hogan is not related to Mr. Colm A. Hogan.
Colm A. Hogan (1973)
Year of Election or Appointment: 2016
Deputy Treasurer
Mr. Hogan also serves as an officer of other funds. Mr. Hogan is an employee of Fidelity Investments (2005-present). Mr. Colm A. Hogan is not related to Mr. Brian B. Hogan.
Chris Maher (1972)
Year of Election or Appointment: 2013
Assistant Treasurer
Mr. Maher serves as Assistant Treasurer of other funds. Mr. Maher is Vice President of Valuation Oversight and is an employee of Fidelity Investments. Previously, Mr. Maher served as Vice President of Asset Management Compliance (2013), Vice President of the Program Management Group of FMR (investment adviser firm, 2010-2013), and Vice President of Valuation Oversight (2008-2010).
John F. Papandrea (1972)
Year of Election or Appointment: 2016
Anti-Money Laundering (AML) Officer
Mr. Papandrea also serves as AML Officer of other funds. Mr. Papandrea is Vice President of FMR LLC (diversified financial services company, 2008-present) and is an employee of Fidelity Investments (2005-present).
Kenneth B. Robins (1969)
Year of Election or Appointment: 2016
Chief Compliance Officer
Mr. Robins also serves as an officer of other funds. Mr. Robins serves as Compliance Officer of Fidelity Management & Research Company and FMR Co., Inc. (investment adviser firms, 2016-present) and is an employee of Fidelity Investments (2004-present). Previously, Mr. Robins served as Executive Vice President of Fidelity Investments Money Management, Inc. (investment adviser firm, 2013-2016) and served in other fund officer roles.
Stacie M. Smith (1974)
Year of Election or Appointment: 2016
President and Treasurer
Ms. Smith also serves as an officer of other funds. She is an employee of Fidelity Investments (2009-present) and has served in other fund officer roles. Prior to joining Fidelity Investments, Ms. Smith served as Senior Audit Manager of Ernst & Young LLP (1996-2009). Previously, Ms. Smith served as Deputy Treasurer of certain Fidelity® funds (2013-2016).
Renee Stagnone (1975)
Year of Election or Appointment: 2016
Assistant Treasurer
Ms. Stagnone also serves as an officer of other funds. Ms. Stagnone is an employee of Fidelity Investments (1997-present). Previously, Ms. Stagnone served as Deputy Treasurer of certain Fidelity® funds (2013-2016).
Shareholder Expense Example
As a shareholder of the Fund, you incur two types of costs: (1) transaction costs, including sales charges (loads) on purchase payments or redemption proceeds, redemption fees and (2) ongoing costs, including management fees, distribution and/or service (12b-1) fees and other Fund expenses. This Example is intended to help you understand your ongoing costs (in dollars) of investing in the Fund and to compare these costs with the ongoing costs of investing in other mutual funds.
The Example is based on an investment of $1,000 invested at the beginning of the period and held for the entire period (February 1, 2016 to July 31, 2016).
Actual Expenses
The first line of the accompanying table for each class of the Fund provides information about actual account values and actual expenses. You may use the information in this line, together with the amount you invested, to estimate the expenses that you paid over the period. Simply divide your account value by $1,000.00 (for example, an $8,600 account value divided by $1,000.00 = 8.6), then multiply the result by the number in the first line for a class of the Fund under the heading entitled "Expenses Paid During Period" to estimate the expenses you paid on your account during this period. A small balance maintenance fee of $12.00 that is charged once a year may apply for certain accounts with a value of less than $2,000. This fee is not included in the table below. If it was, the estimate of expenses you paid during the period would be higher, and your ending account value lower, by this amount. In addition, the Fund, as a shareholder in the underlying Fidelity Central Funds, will indirectly bear its pro-rata share of the fees and expenses incurred by the underlying Fidelity Central Funds. These fees and expenses are not included in the Fund's annualized expense ratio used to calculate the expense estimate in the table below.
Hypothetical Example for Comparison Purposes
The second line of the accompanying table for each class of the Fund provides information about hypothetical account values and hypothetical expenses based on a Class' actual expense ratio and an assumed rate of return of 5% per year before expenses, which is not the Class' actual return. The hypothetical account values and expenses may not be used to estimate the actual ending account balance or expenses you paid for the period. You may use this information to compare the ongoing costs of investing in the Fund and other funds. To do so, compare this 5% hypothetical example with the 5% hypothetical examples that appear in the shareholder reports of the other funds. A small balance maintenance fee of $12.00 that is charged once a year may apply for certain accounts with a value of less than $2,000. This fee is not included in the table below. If it was, the estimate of expenses you paid during the period would be higher, and your ending account value lower, by this amount. In addition, the Fund, as a shareholder in the underlying Fidelity Central Funds, will indirectly bear its pro-rata share of the fees and expenses incurred by the underlying Fidelity Central Funds. These fees and expenses are not included in the Fund's annualized expense ratio used to calculate the expense estimate in the table below.
Please note that the expenses shown in the table are meant to highlight your ongoing costs only and do not reflect any transaction costs. Therefore, the second line of the table is useful in comparing ongoing costs only, and will not help you determine the relative total costs of owning different funds. In addition, if these transactional costs were included, your costs would have been higher.
| | Annualized Expense Ratio-A | Beginning
Account Value
February 1, 2016 | Ending
Account Value
July 31, 2016 | Expenses Paid
During Period-B
February 1, 2016
to July 31, 2016 |
| Class A | 1.03% | | | |
| Actual | | $1,000.00 | $1,129.80 | $5.45 |
| Hypothetical-C | | $1,000.00 | $1,019.74 | $5.17 |
| Class T | 1.06% | | | |
| Actual | | $1,000.00 | $1,129.50 | $5.61 |
| Hypothetical-C | | $1,000.00 | $1,019.59 | $5.32 |
| Class C | 1.78% | | | |
| Actual | | $1,000.00 | $1,125.70 | $9.41 |
| Hypothetical-C | | $1,000.00 | $1,016.01 | $8.92 |
| Real Estate Income | .79% | | | |
| Actual | | $1,000.00 | $1,131.20 | $4.19 |
| Hypothetical-C | | $1,000.00 | $1,020.93 | $3.97 |
| Class I | .76% | | | |
| Actual | | $1,000.00 | $1,130.90 | $4.03 |
| Hypothetical-C | | $1,000.00 | $1,021.08 | $3.82 |
A Annualized expense ratio reflects expenses net of applicable fee waivers.
B Expenses are equal to each Class' annualized expense ratio, multiplied by the average account value over the period, multiplied by 182/366 (to reflect the one-half year period).
C 5% return per year before expenses
Distributions (Unaudited)
The Board of Trustees of Fidelity Real Estate Income Fund voted to pay to shareholders of record at the opening of business on record date, the following distributions per share derived from capital gains realized from sales of portfolio securities, and dividends derived from net investment income:
| | Pay Date | Record Date | Dividends | Capital Gains |
| Class A | 09/12/16 | 09/09/16 | $0.131 | $0.070 |
| Class T | 09/12/16 | 09/09/16 | $0.130 | $0.070 |
| Class C | 09/12/16 | 09/09/16 | $0.115 | $0.070 |
| Class I | 09/12/16 | 09/09/16 | $0.140 | $0.070 |
| Fidelity Real Estate Income | 09/12/16 | 09/09/16 | $0.138 | $0.070 |
| |
The fund hereby designates as a capital gain dividend with respect to the taxable year ended July 31, 2016, $43,043,673, or, if subsequently determined to be different, the net capital gain of such year.
A total of 0.11% of the dividends distributed during the fiscal year was derived from interest on U.S. Government securities which is generally exempt from state income tax.
The fund will notify shareholders in January 2017 of amounts for use in preparing 2016 income tax returns.
Board Approval of Investment Advisory Contracts and Management Fees
Fidelity Real Estate Income Fund
Each year, the Board of Trustees, including the Independent Trustees (together, the Board), votes on the renewal of the management contract with Fidelity Management & Research Company (FMR) and the sub-advisory agreements (together, the Advisory Contracts) for the fund. The Board, assisted by the advice of fund counsel and Independent Trustees' counsel, requests and considers a broad range of information relevant to the renewal of the Advisory Contracts throughout the year.
The Board meets regularly and, at each of its meetings, covers an extensive agenda of topics and materials and considers factors that are relevant to its annual consideration of the renewal of the fund's Advisory Contracts, including the services and support provided to the fund and its shareholders. The Board has established various standing committees (Committees), each composed of and chaired by Independent Trustees with varying backgrounds, to which the Board has assigned specific subject matter responsibilities in order to enhance effective decision-making by the Board. The Board, acting directly and through its Committees, requests and receives information concerning the annual consideration of the renewal of the fund's Advisory Contracts. The Board also meets as needed to consider matters specifically related to the Board's annual consideration of the renewal of the Advisory Contracts. Members of the Board may also meet with trustees of other Fidelity funds through ad hoc joint committees to discuss certain matters relevant to all of the Fidelity funds.
At its July 2016 meeting, the Board unanimously determined to renew the fund's Advisory Contracts. In reaching its determination, the Board considered all factors it believed relevant, including (i) the nature, extent, and quality of the services to be provided to the fund and its shareholders (including the investment performance of the fund); (ii) the competitiveness of the fund's management fee and total expense ratio relative to peer funds; (iii) the total costs of the services to be provided by and the profits to be realized by Fidelity from its relationships with the fund; and (iv) the extent to which, if any, economies of scale exist and would be realized as the fund grows, and whether any economies of scale are appropriately shared with fund shareholders.
In considering whether to renew the Advisory Contracts for the fund, the Board reached a determination, with the assistance of fund counsel and Independent Trustees' counsel and through the exercise of its business judgment, that the renewal of the Advisory Contracts was in the best interests of the fund and its shareholders and that the compensation payable under the Advisory Contracts was fair and reasonable. The Board's decision to renew the Advisory Contracts was not based on any single factor, but rather was based on a comprehensive consideration of all the information provided to the Board at its meetings throughout the year. The Board, in reaching its determination to renew the Advisory Contracts, was aware that shareholders of the fund have a broad range of investment choices available to them, including a wide choice among funds offered by Fidelity's competitors, and that the fund's shareholders, who have the opportunity to review and weigh the disclosure provided by the fund in its prospectus and other public disclosures, have chosen to invest in this fund, which is part of the Fidelity family of funds.
Nature, Extent, and Quality of Services Provided. The Board considered Fidelity's staffing as it relates to the fund, including the backgrounds of investment personnel of Fidelity, and also considered the fund's investment objective, strategies, and related investment philosophy. The Independent Trustees also had discussions with senior management of Fidelity's investment operations and investment groups. The Board considered the structure of the investment personnel compensation program and whether this structure provides appropriate incentives to act in the best interests of the fund. Additionally, the Board considered the portfolio managers' investments, if any, in the funds that they manage.
Resources Dedicated to Investment Management and Support Services. The Board and the Fund Oversight and Research Committees reviewed the general qualifications and capabilities of Fidelity's investment staff, including its size, education, experience, and resources, as well as Fidelity's approach to recruiting, training, managing, and compensating investment personnel. The Board noted that Fidelity has continued to increase the resources devoted to non-U.S. offices, including expansion of Fidelity's global investment organization. The Board also noted that Fidelity's analysts have extensive resources, tools and capabilities that allow them to conduct sophisticated quantitative and fundamental analysis, as well as credit analysis of issuers, counterparties and guarantors. Further, the Board considered that Fidelity's investment professionals have sufficient access to global information and data so as to provide competitive investment results over time, and that those professionals also have access to sophisticated tools that permit them to assess portfolio construction and risk and performance attribution characteristics continuously, as well as to transmit new information and research conclusions rapidly around the world. Additionally, in its deliberations, the Board considered Fidelity's trading, risk management, compliance, and technology and operations capabilities and resources, which are integral parts of the investment management process.
Shareholder and Administrative Services. The Board considered (i) the nature, extent, quality, and cost of advisory, administrative, and shareholder services performed by FMR, the sub-advisers (together with FMR, the Investment Advisers), and their affiliates under the Advisory Contracts and under separate agreements covering transfer agency, pricing and bookkeeping, and securities lending services for the fund; (ii) the nature and extent of the supervision of third party service providers, principally custodians, subcustodians, and pricing vendors; and (iii) the resources devoted to, and the record of compliance with, the fund's compliance policies and procedures. The Board also reviewed the allocation of fund brokerage, including allocations to brokers affiliated with the Investment Advisers, the use of brokerage commissions to pay fund expenses, and the use of "soft" commission dollars to pay for research services.
The Board noted that the growth of fund assets over time across the complex allows Fidelity to reinvest in the development of services designed to enhance the value or convenience of the Fidelity funds as investment vehicles. These services include 24-hour access to account information and market information through telephone representatives and over the Internet, investor education materials and asset allocation tools, and the expanded availability of Fidelity Investor Centers.
In 2014, the Board formed an ad hoc Committee on Transfer Agency Fees to review the variety of transfer agency fee structures throughout the industry and Fidelity's competitive positioning with respect to industry participants.
Investment in a Large Fund Family. The Board considered the benefits to shareholders of investing in a Fidelity fund, including the benefits of investing in a fund that is part of a large family of funds offering a variety of investment disciplines and providing a large variety of mutual fund investor services. The Board noted that Fidelity had taken, or had made recommendations that resulted in the Fidelity funds taking, a number of actions over the previous year that benefited particular funds, including: (i) continuing to dedicate additional resources to investment research and to the support of the senior management team that oversees asset management; (ii) continuing efforts to enhance Fidelity's global research capabilities; (iii) launching new funds and making other enhancements to meet client needs; (iv) broadening eligibility requirements for certain lower-priced share classes of, and streamlining the fee structure for, certain existing equity index funds; (v) lowering expense caps for certain existing funds and classes to reduce expenses paid by shareholders; (vi) eliminating redemption fees for certain variable insurance product funds and classes; (vii) continuing to launch dedicated lower cost underlying funds to meet portfolio construction needs related to expanding underlying fund options for Fidelity funds of funds, specifically for the Freedom Fund product lines; (viii) launching a lower cost share class for use by the Freedom Index Fund product line; (ix) rationalizing product lines and gaining increased efficiencies through fund mergers and share class consolidations; (x) continuing to develop, acquire and implement systems and technology to improve services to the funds and shareholders, strengthen information security, and increase efficiency; (xi) implementing investment enhancements to further strengthen Fidelity's target date product line to increase investors' probability of success in achieving their goals; (xii) accelerating the conversion of all remaining Class B shares to Class A shares, which have a lower expense structure; and (xiii) implementing changes to Fidelity's money market fund product line in response to recent regulatory reforms.
Investment Performance. The Board considered whether the fund has operated in accordance with its investment objective, as well as its record of compliance with its investment restrictions and its performance history.
The Board took into account discussions with representatives of the Investment Advisers about fund investment performance that occur at Board meetings throughout the year. In this regard the Board noted that as part of regularly scheduled fund reviews and other reports to the Board on fund performance, the Board considers annualized return information for the fund, for different time periods, measured against a securities market index ("benchmark index") and a peer group of funds with similar objectives ("peer group"), if any. In its evaluation of fund investment performance, the Board gave particular attention to information indicating changes in performance of certain Fidelity funds for specific time periods and discussed with the Investment Advisers the reasons for any overperformance or underperformance.
In addition to reviewing absolute and relative fund performance, the Independent Trustees periodically consider the appropriateness of fund performance metrics in evaluating the results achieved. In general, the Independent Trustees believe that fund performance should be evaluated based on net performance (after fees and expenses) of both the highest performing and lowest performing fund share classes, where applicable, compared to appropriate benchmark indices, over appropriate time periods that may include full market cycles, and compared to peer groups, as applicable, over the same periods, taking into account relevant factors including the following: general market conditions; issuer-specific information; and fund cash flows and other factors.
The Independent Trustees recognize that shareholders evaluate performance on a net basis over their own holding periods, for which one-, three-, and five-year periods are often used as a proxy. For this reason, the performance information reviewed by the Board also included net cumulative calendar year total return information for the fund and an appropriate benchmark index and peer group for the most recent one-, three-, and five-year periods, as shown below. Returns are shown compared to the 25th percentile (top of box, 75% beaten) and 75th percentile (bottom of box, 25% beaten) of the peer universe.
Fidelity Real Estate Income Fund
The Board has discussed the fund's underperformance with FMR and has engaged with FMR to consider what steps might be taken to remediate the fund's underperformance.
Based on its review, the Board concluded that the nature, extent, and quality of services provided to the fund under the Advisory Contracts should continue to benefit the shareholders of the fund.
Competitiveness of Management Fee and Total Expense Ratio. The Board considered the fund's management fee and total expense ratio compared to "mapped groups" of competitive funds and classes created for the purpose of facilitating the Trustees' competitive analysis of management fees and total expenses. Fidelity creates "mapped groups" by combining similar Broadridge investment objective categories that have comparable investment mandates. Combining Broadridge investment objective categories aids the Board's management fee and total expense ratio comparisons by broadening the competitive group used for comparison.
Management Fee. The Board considered two proprietary management fee comparisons for the 12-month periods shown in basis points (BP) in the chart below. The group of Broadridge funds used by the Board for management fee comparisons is referred to below as the "Total Mapped Group." The Total Mapped Group is broader than the Broadridge peer group used by the Board for performance comparisons because the Total Mapped Group combines several Broadridge investment objective categories while the Broadridge peer group does not. The Total Mapped Group comparison focuses on a fund's standing in terms of gross management fees before expense reimbursements or caps relative to the total universe of funds with comparable investment mandates, regardless of whether their management fee structures also are comparable. Funds with comparable investment mandates offer exposure to similar types of securities. Funds with comparable management fee structures have similar management fee contractual arrangements (
e.g., flat rate charged for advisory services, all-inclusive fee rate,
etc.). "TMG %" represents the percentage of funds in the Total Mapped Group that had management fees that were lower than the fund's. For example, a hypothetical TMG % of 20% would mean that 80% of the funds in the Total Mapped Group had higher, and 20% had lower, management fees than the fund. The fund's actual TMG %s and the number of funds in the Total Mapped Group are in the chart below. The "Asset-Size Peer Group" (ASPG) comparison focuses on a fund's standing relative to a subset of non-Fidelity funds within the Total Mapped Group that are similar in size and management fee structure. For example, if a fund is in the first quartile of the ASPG, the fund's management fee ranks in the least expensive or lowest 25% of funds in the ASPG. The ASPG represents at least 15% of the funds in the Total Mapped Group with comparable asset size and management fee structures, subject to a minimum of 50 funds (or all funds in the Total Mapped Group if fewer than 50). Additional information, such as the ASPG quartile in which the fund's management fee rate ranked, is also included in the chart and considered by the Board.
Fidelity Real Estate Income Fund
The Board noted that the fund's management fee rate ranked below the median of its Total Mapped Group and below the median of its ASPG for 2015.
The Board noted that, in 2014, the ad hoc Committee on Group Fee was formed by it and the boards of other Fidelity funds to conduct an in-depth review of the "group fee" component of the management fee of funds with such management fee structures. The Committee's focus included the mechanics of the group fee, the competitive landscape of group fee structures, Fidelity funds with no group fee component and investment products not included in group fee assets. The Board also considered that, for funds subject to the group fee, FMR agreed to voluntarily waive fees over a specified period of time in amounts designed to account for assets converted from certain funds to certain collective investment trusts.
The Board also noted that, in 2013, the ad hoc Committee on Management Fees was formed to conduct an in-depth review of the management fee rates of Fidelity's active equity mutual funds. The Committee focused on the following areas: (i) standard fee structures; (ii) research consumption and trading evolution; (iii) management fee competitiveness/profitability by category; and (iv) factors that drive institutional pricing.
Based on its review, the Board concluded that the fund's management fee is fair and reasonable in light of the services that the fund receives and the other factors considered.
Total Expense Ratio. In its review of each class's total expense ratio, the Board considered the fund's management fee rate as well as other fund or class expenses, as applicable, such as transfer agent fees, pricing and bookkeeping fees, fund-paid 12b-1 fees, and custodial, legal, and audit fees. The Board also noted that Fidelity may agree to waive fees and expenses from time to time, and the extent to which, if any, it has done so for the fund. As part of its review, the Board also considered the current and historical total expense ratios of each class of the fund compared to competitive fund median expenses. Each class of the fund is compared to those funds and classes in the Total Mapped Group (used by the Board for management fee comparisons) that have a similar sales load structure.
The Board noted that the total expense ratio of each class ranked below the competitive median for 2015.
Fees Charged to Other Fidelity Clients. The Board also considered Fidelity fee structures and other information with respect to clients of Fidelity, such as other funds advised or subadvised by Fidelity, pension plan clients, and other institutional clients with similar mandates. The Board noted the findings of the 2013 ad hoc joint committee (created with the board of other Fidelity funds), which reviewed and compared Fidelity's institutional investment advisory business with its business of providing services to the Fidelity funds, including the differences in services provided, fees charged, and costs incurred, as well as competition in their respective marketplaces.
Based on its review of total expense ratios and fees charged to other Fidelity clients, the Board concluded that the total expense ratio of each class of the fund was reasonable in light of the services that the fund and its shareholders receive and the other factors considered.
Costs of the Services and Profitability. The Board considered the revenues earned and the expenses incurred by Fidelity in conducting the business of developing, marketing, distributing, managing, administering and servicing the fund and servicing the fund's shareholders. The Board also considered the level of Fidelity's profits in respect of all the Fidelity funds.
On an annual basis, Fidelity presents to the Board information about the profitability of its relationship with the fund. Fidelity calculates profitability information for each fund, as well as aggregate profitability information for groups of Fidelity funds and all Fidelity funds, using a series of detailed revenue and cost allocation methodologies which originate with the books and records of Fidelity on which Fidelity's audited financial statements are based. The Audit Committee of the Board reviews any significant changes from the prior year's methodologies.
PricewaterhouseCoopers LLP (PwC), independent registered public accounting firm and auditor to Fidelity and certain Fidelity funds, has been engaged annually by the Board as part of the Board's assessment of Fidelity's profitability analysis. PwC's engagement includes the review and assessment of the methodologies used by Fidelity in determining the revenues and expenses attributable to Fidelity's mutual fund business, and completion of agreed-upon procedures in respect of the mathematical accuracy of the fund profitability information and its conformity to established allocation methodologies. After considering PwC's reports issued under the engagement and information provided by Fidelity, the Board concluded that while other allocation methods may also be reasonable, Fidelity's profitability methodologies are reasonable in all material respects.
The Board also reviewed Fidelity's non-fund businesses and fall-out benefits related to the mutual fund business as well as cases where Fidelity's affiliates may benefit from or be related to the fund's business.
The Board considered the costs of the services provided by and the profits realized by Fidelity in connection with the operation of the fund and was satisfied that the profitability was not excessive.
Economies of Scale. The Board considered whether there have been economies of scale in respect of the management of the Fidelity funds, whether the Fidelity funds (including the fund) have appropriately benefited from any such economies of scale, and whether there is potential for realization of any further economies of scale. The Board considered the extent to which the fund will benefit from economies of scale as assets grow through increased services to the fund, through waivers or reimbursements, or through fee or expense ratio reductions. The Board also noted that in 2013, it and the boards of other Fidelity funds created an ad hoc committee (the Economies of Scale Committee) to analyze whether Fidelity attains economies of scale in respect of the management and servicing of the Fidelity funds, whether the Fidelity funds have appropriately benefited from such economies of scale, and whether there is potential for realization of any further economies of scale.
The Board recognized that the fund's management contract incorporates a "group fee" structure, which provides for lower group fee rates as total group assets increase, and for higher group fee rates as total group assets decrease (with "group assets" defined to include fund assets under FMR's management plus the assets of sector funds previously under FMR's management). FMR calculates the group fee rates based on a tiered asset "breakpoint" schedule that varies based on asset class. The Board considered that the group fee is designed to deliver the benefits of economies of scale to fund shareholders when total Fidelity fund assets increase, even if assets of any particular fund are unchanged or have declined, because some portion of Fidelity's costs are attributable to services provided to all Fidelity funds, and all funds benefit if those costs can be allocated among more assets. The Board concluded that, given the group fee structure, fund shareholders will benefit from lower management fees as group assets increase at the fund complex level, regardless of whether Fidelity achieves any such economies of scale.
The Board concluded, taking into account the analysis of the Economies of Scale Committee, that economies of scale, if any, are being appropriately shared between fund shareholders and Fidelity.
Additional Information Requested by the Board. In order to develop fully the factual basis for consideration of the Fidelity funds' Advisory Contracts, the Board requested and received additional information on certain topics, including: (i) fund performance trends and Fidelity's long-term strategies for certain funds; (ii) the various share classes employed by Fidelity and the attributes of each class, together with similar information on the distribution and servicing payments made by Fidelity or the funds to third-party participants in the distribution channels; (iii) fund profitability, and fund performance in relation to fund profitability; (iv) the methodology with respect to evaluating competitive fund data and peer group classifications and fee comparisons; (v) annual fund profitability margins; (vi) the realization of fall-out benefits in and attribution of fall-out benefits to certain Fidelity business units; (vii) the appropriateness of certain funds' benchmarks; (viii) the rationalization for certain share classes and expenses; (ix) sub-advisory fee rates for comparable investment mandates; (x) product strategy for certain underperforming funds; and (xi) Fidelity's resources and strategy for cybersecurity.
Based on its evaluation of all of the conclusions noted above, and after considering all factors it believed relevant, the Board concluded that the advisory fee structures are fair and reasonable, and that the fund's Advisory Contracts should be renewed.
REIA-ANN-0916
1.907549.106
Fidelity Advisor® Small Cap Value Fund - Class A, Class T, Class C and Class I
Annual Report July 31, 2016 Class A, Class T, Class C and Class I are classes of Fidelity® Small Cap Value Fund |
|
Contents
To view a fund's proxy voting guidelines and proxy voting record for the 12-month period ended June 30, visit http://www.fidelity.com/proxyvotingresults or visit the Securities and Exchange Commission's (SEC) web site at http://www.sec.gov.
You may also call 1-877-208-0098 to request a free copy of the proxy voting guidelines.
Standard & Poor's, S&P and S&P 500 are registered service marks of The McGraw-Hill Companies, Inc. and have been licensed for use by Fidelity Distributors Corporation.
Other third-party marks appearing herein are the property of their respective owners.
All other marks appearing herein are registered or unregistered trademarks or service marks of FMR LLC or an affiliated company. © 2016 FMR LLC. All rights reserved.
This report and the financial statements contained herein are submitted for the general information of the shareholders of the Fund. This report is not authorized for distribution to prospective investors in the Fund unless preceded or accompanied by an effective prospectus.
A fund files its complete schedule of portfolio holdings with the SEC for the first and third quarters of each fiscal year on Form N-Q. Forms N-Q are available on the SEC’s web site at http://www.sec.gov. A fund's Forms N-Q may be reviewed and copied at the SEC’s Public Reference Room in Washington, DC. Information regarding the operation of the SEC's Public Reference Room may be obtained by calling 1-800-SEC-0330.
For a complete list of a fund's portfolio holdings, view the most recent holdings listing, semiannual report, or annual report on Fidelity's web site at http://www.fidelity.com, http://www.institutional.fidelity.com, or http://www.401k.com, as applicable.
NOT FDIC INSURED •MAY LOSE VALUE •NO BANK GUARANTEE
Neither the Fund nor Fidelity Distributors Corporation is a bank.
Performance: The Bottom Line
Average annual total return reflects the change in the value of an investment, assuming reinvestment of distributions from dividend income and capital gains (the profits earned upon the sale of securities that have grown in value, if any) and assuming a constant rate of performance each year. The hypothetical investment and the average annual total returns do not reflect the deduction of taxes that a shareholder would pay on fund distributions or the redemption of fund shares. During periods of reimbursement by Fidelity, a fund’s total return will be greater than it would be had the reimbursement not occurred. How a fund did yesterday is no guarantee of how it will do tomorrow.
Average Annual Total Returns
| For the periods ended July 31, 2016 | Past 1 year | Past 5 years | Past 10 years |
| Class A (incl. 5.75% sales charge) | (1.92)% | 10.97% | 8.37% |
| Class T (incl. 3.50% sales charge) | 0.13% | 11.23% | 8.36% |
| Class C (incl. contingent deferred sales charge) | 2.27% | 11.43% | 8.19% |
| Class I | 4.31% | 12.61% | 9.33% |
Class C shares' contingent deferred sales charges included in the past one year, past five years and past ten years total return figures are 1%, 0% and 0%, respectively.
$10,000 Over 10 Years
Let's say hypothetically that $10,000 was invested in Fidelity Advisor® Small Cap Value Fund - Class A on July 31, 2006, and the current 5.75% sales charge was paid.
The chart shows how the value of your investment would have changed, and also shows how the Russell 2000® Value Index performed over the same period.
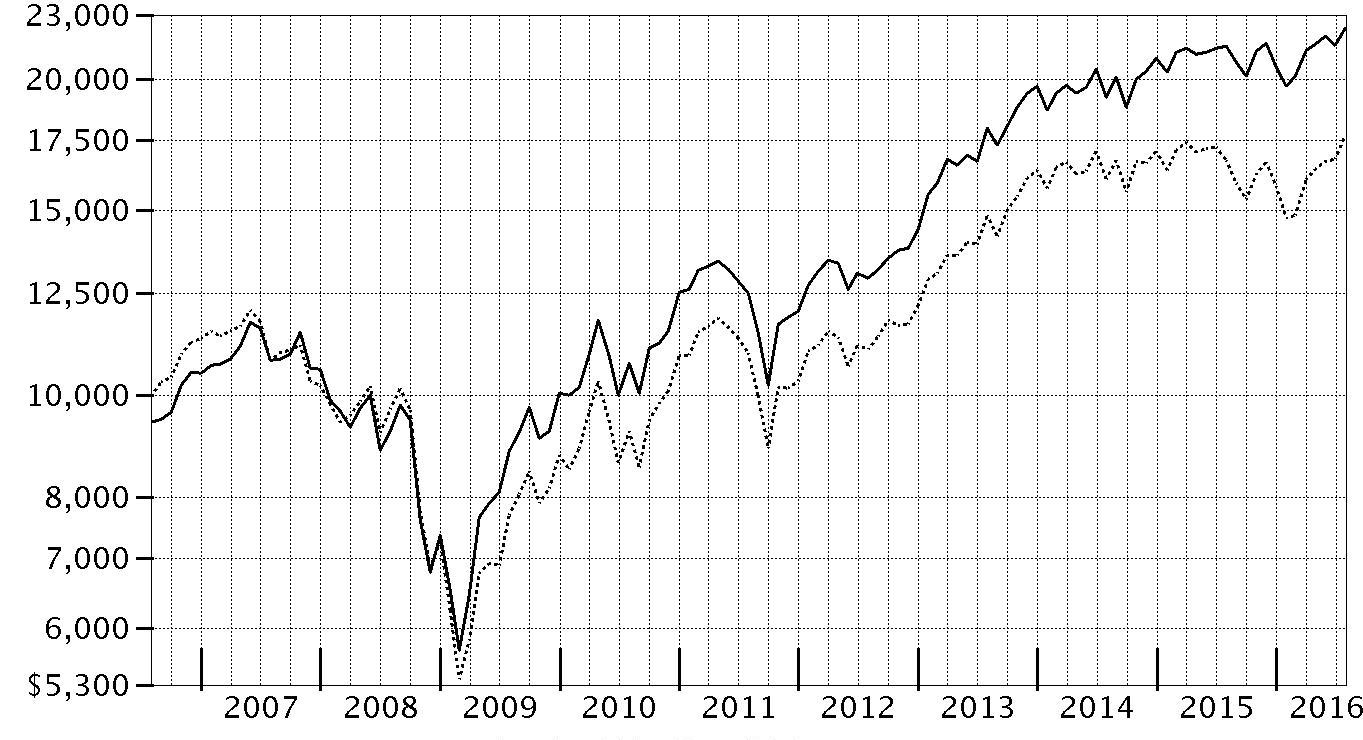
| Period Ending Values |
| $22,336 | Fidelity Advisor® Small Cap Value Fund - Class A |
| $17,661 | Russell 2000® Value Index |
Management's Discussion of Fund Performance
Market Recap: U.S. equities gained modestly for the year ending July 31, 2016, overcoming persistent concern about global economic growth, uncertainty regarding U.S. monetary policy and the U.K.’s late-June vote to leave the European Union, dubbed Brexit. The S&P 500
® index rose 5.61%, with larger-cap, value-oriented stocks and defensive sectors shining brightest. Volatility peaked in the early weeks of 2016, as continued oil-price weakness and U.S.-dollar strength pushed the S&P 500
® to its worst January since 2009. Markets then rose beginning in February amid U.S. job gains, a broad rally in energy and materials markets, global economic stimulus and perceived softening of monetary policy by the U.S. Federal Reserve. The June 23 Brexit vote surprised markets and resulted in a sharp two-day decline for stocks, followed by a rebound as investor sentiment shifted and remained positive through July 31. For the year, dividend-rich telecom services (+26%), utilities (+23%) and consumer staples (+12%) led the way amid strong investor demand for yield. Industrials (+10%) and information technology (+10%) also outperformed, as did materials (+8%), despite a weak commodities environment overall. Conversely, a strong run for real estate stocks couldn’t keep financials (-4%) from losing ground, as low interest rates continued to squeeze bank profits.
Comments from Portfolio Manager Derek Janssen: For the year, most of the fund’s share classes (excluding sales charges, if applicable) trailed the 5.59% return of the benchmark Russell 2000
® Value Index by between 1 and 2 percentage points. Stocks with bond-like characteristics, such as real estate investment trusts (REITs) and utilities, performed exceptionally well, even as many low-quality companies tied to volatile commodity markets gained ground. This created a headwind for the fund, which favors higher-quality, attractively valued firms with good long-term business models. Versus the index, stock picks in materials and industrials hurt results most. In the latter group, workplace products distributor Essendant detracted. Elsewhere, lease-to-own home furnishings provider Aaron’s was the fund's biggest relative detractor. The stock returned -35% amid weak earnings results. Waddell & Reed Financial, a struggling asset manager also hurt results. We eliminated it from the fund in March. Conversely, picks in technology and, to a lesser extent, energy, added value. Tech resellers Ingram Micro – which was not in the index and was sold from the fund early in 2016 – and Tech Data contributed. Elsewhere, Store Capital–benefited from strong business execution and the broad-based strength of REITs.
The views expressed above reflect those of the portfolio manager(s) only through the end of the period as stated on the cover of this report and do not necessarily represent the views of Fidelity or any other person in the Fidelity organization. Any such views are subject to change at any time based upon market or other conditions and Fidelity disclaims any responsibility to update such views. These views may not be relied on as investment advice and, because investment decisions for a Fidelity fund are based on numerous factors, may not be relied on as an indication of trading intent on behalf of any Fidelity fund.
Note to shareholders: On January 1, 2016, Derek Janssen became sole Portfolio Manager of the fund.
Investment Summary (Unaudited)
Top Ten Stocks as of July 31, 2016
| | % of fund's net assets | % of fund's net assets 6 months ago |
| Store Capital Corp. | 3.4 | 3.5 |
| Moog, Inc. Class A | 3.0 | 1.9 |
| Allied World Assurance Co. Holdings AG | 2.8 | 2.4 |
| Potlatch Corp. | 2.7 | 0.2 |
| Genesee & Wyoming, Inc. Class A | 2.6 | 2.4 |
| First American Financial Corp. | 2.6 | 1.8 |
| World Fuel Services Corp. | 2.5 | 2.5 |
| Universal Corp. | 2.4 | 2.7 |
| HSN, Inc. | 2.4 | 0.0 |
| ProAssurance Corp. | 2.4 | 2.8 |
| | 26.8 | |
Top Five Market Sectors as of July 31, 2016
| | % of fund's net assets | % of fund's net assets 6 months ago |
| Financials | 40.3 | 40.4 |
| Industrials | 14.2 | 13.0 |
| Consumer Discretionary | 12.3 | 12.0 |
| Information Technology | 10.4 | 11.3 |
| Health Care | 5.6 | 6.6 |
Asset Allocation (% of fund's net assets)
| As of July 31, 2016* |
| | Stocks | 99.5% |
| | Short-Term Investments and Net Other Assets (Liabilities) | 0.5% |

* Foreign investments - 12.5%
| As of January 31, 2016* |
| | Stocks | 99.4% |
| | Short-Term Investments and Net Other Assets (Liabilities) | 0.6% |

* Foreign investments - 14.2%
Percentages shown as 0.0% may reflect amounts less than 0.05%.
Investments July 31, 2016
Showing Percentage of Net Assets
| Common Stocks - 99.5% | | | |
| | | Shares | Value |
| CONSUMER DISCRETIONARY - 12.3% | | | |
| Auto Components - 1.3% | | | |
| Standard Motor Products, Inc. | | 1,000,000 | $41,940,000 |
| Household Durables - 2.1% | | | |
| Meritage Homes Corp. (a) | | 1,870,962 | 68,084,307 |
| Internet & Catalog Retail - 2.4% | | | |
| HSN, Inc. | | 1,500,000 | 76,740,000 |
| Multiline Retail - 1.9% | | | |
| Dillard's, Inc. Class A | | 900,000 | 60,912,000 |
| Specialty Retail - 4.6% | | | |
| Aarons, Inc. Class A | | 2,045,100 | 48,980,145 |
| Genesco, Inc. (a) | | 595,028 | 41,306,844 |
| Hibbett Sports, Inc. (a)(b)(c) | | 1,625,600 | 56,765,952 |
| | | | 147,052,941 |
|
| TOTAL CONSUMER DISCRETIONARY | | | 394,729,248 |
|
| CONSUMER STAPLES - 3.6% | | | |
| Food & Staples Retailing - 1.2% | | | |
| United Natural Foods, Inc. (a) | | 737,913 | 36,880,892 |
| Tobacco - 2.4% | | | |
| Universal Corp. (c) | | 1,300,000 | 77,103,000 |
|
| TOTAL CONSUMER STAPLES | | | 113,983,892 |
|
| ENERGY - 4.9% | | | |
| Energy Equipment & Services - 2.2% | | | |
| Hornbeck Offshore Services, Inc. (a)(b) | | 1,600,000 | 12,768,000 |
| ShawCor Ltd. Class A | | 2,500,000 | 57,021,407 |
| | | | 69,789,407 |
| Oil, Gas & Consumable Fuels - 2.7% | | | |
| Northern Oil & Gas, Inc. (a)(b) | | 1,958,249 | 7,754,666 |
| World Fuel Services Corp. | | 1,700,000 | 80,920,000 |
| | | | 88,674,666 |
|
| TOTAL ENERGY | | | 158,464,073 |
|
| FINANCIALS - 40.3% | | | |
| Banks - 14.7% | | | |
| Associated Banc-Corp. | | 2,836,935 | 52,766,991 |
| BOK Financial Corp. (b) | | 1,000,000 | 65,230,000 |
| Cullen/Frost Bankers, Inc. (b) | | 1,000,000 | 67,890,000 |
| CVB Financial Corp. | | 4,500,010 | 74,025,165 |
| First Citizen Bancshares, Inc. | | 140,370 | 36,465,319 |
| First Citizen Bancshares, Inc. Class A (a) | | 180,954 | 47,008,230 |
| First Niagara Financial Group, Inc. | | 6,000,000 | 61,080,000 |
| UMB Financial Corp. | | 1,200,000 | 66,492,000 |
| | | | 470,957,705 |
| Capital Markets - 3.3% | | | |
| Federated Investors, Inc. Class B (non-vtg.) | | 2,000,000 | 63,140,000 |
| OM Asset Management Ltd. | | 3,176,901 | 44,476,614 |
| | | | 107,616,614 |
| Insurance - 10.9% | | | |
| Allied World Assurance Co. Holdings AG | | 2,200,000 | 90,178,000 |
| Aspen Insurance Holdings Ltd. | | 971,046 | 44,629,274 |
| Endurance Specialty Holdings Ltd. | | 800,000 | 54,104,000 |
| First American Financial Corp. | | 2,000,000 | 83,620,000 |
| ProAssurance Corp. | | 1,468,200 | 75,847,212 |
| | | | 348,378,486 |
| Real Estate Investment Trusts - 8.0% | | | |
| Potlatch Corp. (c) | | 2,300,000 | 87,975,000 |
| Sabra Health Care REIT, Inc. | | 2,500,000 | 59,775,000 |
| Store Capital Corp. | | 3,500,000 | 109,164,999 |
| | | | 256,914,999 |
| Real Estate Management & Development - 1.6% | | | |
| Kennedy Wilson Europe Real Estate PLC | | 4,000,000 | 52,673,310 |
| Thrifts & Mortgage Finance - 1.8% | | | |
| Washington Federal, Inc. | | 2,274,500 | 56,862,500 |
|
| TOTAL FINANCIALS | | | 1,293,403,614 |
|
| HEALTH CARE - 5.6% | | | |
| Health Care Providers & Services - 3.9% | | | |
| Civitas Solutions, Inc. (a)(c) | | 2,422,110 | 51,905,817 |
| Team Health Holdings, Inc. (a) | | 1,800,000 | 73,512,000 |
| | | | 125,417,817 |
| Health Care Technology - 0.6% | | | |
| Cegedim SA (a) | | 670,247 | 19,587,647 |
| Pharmaceuticals - 1.1% | | | |
| Innoviva, Inc. (b) | | 2,726,753 | 35,093,311 |
|
| TOTAL HEALTH CARE | | | 180,098,775 |
|
| INDUSTRIALS - 14.2% | | | |
| Aerospace & Defense - 3.0% | | | |
| Moog, Inc. Class A (a) | | 1,750,000 | 96,372,500 |
| Commercial Services & Supplies - 0.8% | | | |
| Essendant, Inc. | | 1,235,098 | 24,751,364 |
| Electrical Equipment - 2.9% | | | |
| AZZ, Inc. | | 500,000 | 31,040,000 |
| Regal Beloit Corp. | | 1,000,000 | 61,010,000 |
| | | | 92,050,000 |
| Machinery - 3.2% | | | |
| Hillenbrand, Inc. | | 1,000,000 | 32,350,000 |
| Mueller Industries, Inc. | | 2,100,000 | 71,484,000 |
| | | | 103,834,000 |
| Road & Rail - 2.6% | | | |
| Genesee & Wyoming, Inc. Class A (a) | | 1,300,000 | 84,175,000 |
| Trading Companies & Distributors - 1.7% | | | |
| WESCO International, Inc. (a)(b) | | 960,033 | 53,512,239 |
|
| TOTAL INDUSTRIALS | | | 454,695,103 |
|
| INFORMATION TECHNOLOGY - 10.4% | | | |
| Electronic Equipment & Components - 3.8% | | | |
| Jabil Circuit, Inc. | | 266,445 | 5,422,156 |
| SYNNEX Corp. | | 527,200 | 52,999,416 |
| Tech Data Corp. (a) | | 800,000 | 62,344,000 |
| | | | 120,765,572 |
| Internet Software & Services - 2.9% | | | |
| Cimpress NV (a)(b) | | 400,000 | 37,920,000 |
| j2 Global, Inc. | | 850,000 | 56,814,000 |
| | | | 94,734,000 |
| IT Services - 3.0% | | | |
| CACI International, Inc. Class A (a) | | 250,000 | 23,832,500 |
| Science Applications International Corp. | | 1,200,000 | 72,912,000 |
| | | | 96,744,500 |
| Technology Hardware, Storage & Peripherals - 0.7% | | | |
| Super Micro Computer, Inc. (a) | | 1,000,000 | 21,550,000 |
|
| TOTAL INFORMATION TECHNOLOGY | | | 333,794,072 |
|
| MATERIALS - 4.0% | | | |
| Containers & Packaging - 2.1% | | | |
| Silgan Holdings, Inc. | | 1,370,000 | 67,924,600 |
| Metals & Mining - 1.9% | | | |
| Compass Minerals International, Inc. (b) | | 850,000 | 59,151,500 |
|
| TOTAL MATERIALS | | | 127,076,100 |
|
| UTILITIES - 4.2% | | | |
| Electric Utilities - 4.2% | | | |
| El Paso Electric Co. | | 1,500,000 | 71,520,000 |
| IDACORP, Inc. | | 800,000 | 64,680,000 |
| | | | 136,200,000 |
| TOTAL COMMON STOCKS | | | |
| (Cost $2,790,578,698) | | | 3,192,444,877 |
|
| Money Market Funds - 5.4% | | | |
| Fidelity Cash Central Fund, 0.42% (d) | | 18,841,170 | 18,841,170 |
| Fidelity Securities Lending Cash Central Fund, 0.45% (d)(e) | | 156,054,539 | 156,054,539 |
| TOTAL MONEY MARKET FUNDS | | | |
| (Cost $174,895,709) | | | 174,895,709 |
| TOTAL INVESTMENT PORTFOLIO - 104.9% | | | |
| (Cost $2,965,474,407) | | | 3,367,340,586 |
| NET OTHER ASSETS (LIABILITIES) - (4.9)% | | | (158,766,428) |
| NET ASSETS - 100% | | | $3,208,574,158 |
Legend
(a) Non-income producing
(b) Security or a portion of the security is on loan at period end.
(c) Affiliated company
(d) Affiliated fund that is generally available only to investment companies and other accounts managed by Fidelity Investments. The rate quoted is the annualized seven-day yield of the fund at period end. A complete unaudited listing of the fund's holdings as of its most recent quarter end is available upon request. In addition, each Fidelity Central Fund's financial statements, which are not covered by the Fund's Report of Independent Registered Public Accounting Firm, are available on the SEC's website or upon request.
(e) Investment made with cash collateral received from securities on loan.
Affiliated Central Funds
Information regarding fiscal year to date income earned by the Fund from investments in Fidelity Central Funds is as follows:
| Fund | Income earned |
| Fidelity Cash Central Fund | $81,527 |
| Fidelity Securities Lending Cash Central Fund | 2,179,165 |
| Total | $2,260,692 |
Other Affiliated Issuers
An affiliated company is a company in which the Fund has ownership of at least 5% of the voting securities. Fiscal year to date transactions with companies which are or were affiliates are as follows:
| Affiliate | Value, beginning of period | Purchases | Sales Proceeds | Dividend Income | Value, end of period |
| Civitas Solutions, Inc. | $66,136,343 | $-- | $14,297,008 | $-- | $51,905,817 |
| Hibbett Sports, Inc. | 11,341,950 | 55,985,079 | 2,178,105 | -- | 56,765,952 |
| Potlatch Corp. | -- | 62,383,666 | -- | -- | 87,975,000 |
| Rouse Properties, Inc. | 76,560,000 | -- | 78,563,904 | 438,063 | -- |
| Standard Motor Products, Inc. | 43,273,318 | -- | 6,525,703 | 724,502 | -- |
| Universal Corp. | 68,930,035 | 4,859,141 | 457,179 | 2,756,018 | 77,103,000 |
| Total | $266,241,646 | $123,227,886 | $102,021,899 | $3,918,583 | $273,749,769 |
Investment Valuation
All investments are categorized as Level 1 under the Fair Value Hierarchy. The inputs or methodology used for valuing securities may not be an indication of the risk associated with investing in those securities. For more information on valuation inputs please refer to the Investment Valuation section in the accompanying Notes to Financial Statements.
Other Information
Distribution of investments by country or territory of incorporation, as a percentage of Total Net Assets, is as follows (Unaudited):
| United States of America | 87.5% |
| Bermuda | 3.1% |
| Switzerland | 2.8% |
| Canada | 1.8% |
| Bailiwick of Jersey | 1.6% |
| United Kingdom | 1.4% |
| Netherlands | 1.2% |
| Others (Individually Less Than 1%) | 0.6% |
| | 100.0% |
See accompanying notes which are an integral part of the financial statements.
Financial Statements
Statement of Assets and Liabilities
| | | July 31, 2016 |
| Assets | | |
Investment in securities, at value (including securities loaned of $152,846,977) — See accompanying schedule:
Unaffiliated issuers (cost $2,560,598,307) | $2,918,695,108 | |
| Fidelity Central Funds (cost $174,895,709) | 174,895,709 | |
| Other affiliated issuers (cost $229,980,391) | 273,749,769 | |
| Total Investments (cost $2,965,474,407) | | $3,367,340,586 |
| Receivable for investments sold | | 1,332,481 |
| Receivable for fund shares sold | | 2,151,830 |
| Dividends receivable | | 1,332,543 |
| Distributions receivable from Fidelity Central Funds | | 89,294 |
| Other receivables | | 72,618 |
| Total assets | | 3,372,319,352 |
| Liabilities | | |
| Payable for investments purchased | $2,068,800 | |
| Payable for fund shares redeemed | 2,654,627 | |
| Accrued management fee | 2,149,904 | |
| Distribution and service plan fees payable | 126,751 | |
| Other affiliated payables | 634,078 | |
| Other payables and accrued expenses | 56,495 | |
| Collateral on securities loaned, at value | 156,054,539 | |
| Total liabilities | | 163,745,194 |
| Net Assets | | $3,208,574,158 |
| Net Assets consist of: | | |
| Paid in capital | | $2,613,772,354 |
| Undistributed net investment income | | 6,559,742 |
| Accumulated undistributed net realized gain (loss) on investments and foreign currency transactions | | 186,375,919 |
| Net unrealized appreciation (depreciation) on investments and assets and liabilities in foreign currencies | | 401,866,143 |
| Net Assets | | $3,208,574,158 |
| Calculation of Maximum Offering Price | | |
| Class A: | | |
| Net Asset Value and redemption price per share ($218,363,690÷ 12,188,359 shares) | | $17.92 |
| Maximum offering price per share (100/94.25 of $17.92) | | $19.01 |
| Class T: | | |
| Net Asset Value and redemption price per share ($82,337,095 ÷ 4,694,264 shares) | | $17.54 |
| Maximum offering price per share (100/96.50 of $17.54) | | $18.18 |
| Class C: | | |
| Net Asset Value and offering price per share ($57,231,399 ÷ 3,463,446 shares)(a) | | $16.52 |
| Small Cap Value: | | |
| Net Asset Value, offering price and redemption price per share ($2,460,713,972 ÷ 135,021,784 shares) | | $18.22 |
| Class I: | | |
| Net Asset Value, offering price and redemption price per share ($389,928,002 ÷ 21,387,334 shares) | | $18.23 |
(a) Redemption price per share is equal to net asset value less any applicable contingent deferred sales charge.
See accompanying notes which are an integral part of the financial statements.
Statement of Operations
| | | Year ended July 31, 2016 |
| Investment Income | | |
| Dividends (including $3,918,583 earned from other affiliated issuers) | | $50,583,645 |
| Income from Fidelity Central Funds | | 2,260,692 |
| Total income | | 52,844,337 |
| Expenses | | |
| Management fee | | |
| Basic fee | $20,088,076 | |
| Performance adjustment | 6,058,594 | |
| Transfer agent fees | 6,373,107 | |
| Distribution and service plan fees | 1,565,263 | |
| Accounting and security lending fees | 873,933 | |
| Custodian fees and expenses | 37,866 | |
| Independent trustees' fees and expenses | 12,545 | |
| Registration fees | 119,338 | |
| Audit | 66,034 | |
| Legal | 7,615 | |
| Miscellaneous | 20,661 | |
| Total expenses before reductions | 35,223,032 | |
| Expense reductions | (165,667) | 35,057,365 |
| Net investment income (loss) | | 17,786,972 |
| Realized and Unrealized Gain (Loss) | | |
| Net realized gain (loss) on: | | |
| Investment securities: | | |
| Unaffiliated issuers | 234,199,519 | |
| Other affiliated issuers | 11,952,229 | |
| Foreign currency transactions | (14,975) | |
| Total net realized gain (loss) | | 246,136,773 |
Change in net unrealized appreciation (depreciation) on:
Investment securities | (119,544,677) | |
| Assets and liabilities in foreign currencies | (37) | |
| Total change in net unrealized appreciation (depreciation) | | (119,544,714) |
| Net gain (loss) | | 126,592,059 |
| Net increase (decrease) in net assets resulting from operations | | $144,379,031 |
See accompanying notes which are an integral part of the financial statements.
Statement of Changes in Net Assets
| | Year ended July 31, 2016 | Year ended July 31, 2015 |
| Increase (Decrease) in Net Assets | | |
| Operations | | |
| Net investment income (loss) | $17,786,972 | $20,225,902 |
| Net realized gain (loss) | 246,136,773 | 285,516,597 |
| Change in net unrealized appreciation (depreciation) | (119,544,714) | 14,012,997 |
| Net increase (decrease) in net assets resulting from operations | 144,379,031 | 319,755,496 |
| Distributions to shareholders from net investment income | (21,953,514) | (9,146,893) |
| Distributions to shareholders from net realized gain | (264,173,272) | (322,480,172) |
| Total distributions | (286,126,786) | (331,627,065) |
| Share transactions - net increase (decrease) | 541,183,028 | (16,898,248) |
| Redemption fees | 204,719 | 149,785 |
| Total increase (decrease) in net assets | 399,639,992 | (28,620,032) |
| Net Assets | | |
| Beginning of period | 2,808,934,166 | 2,837,554,198 |
| End of period | $3,208,574,158 | $2,808,934,166 |
| Other Information | | |
| Undistributed net investment income end of period | $6,559,742 | $15,098,491 |
See accompanying notes which are an integral part of the financial statements.
Financial Highlights — Fidelity Small Cap Value Fund Class A
| Years ended July 31, | 2016 | 2015 | 2014 | 2013 | 2012 |
| Selected Per–Share Data | | | | | |
| Net asset value, beginning of period | $19.14 | $19.29 | $19.96 | $14.86 | $15.48 |
| Income from Investment Operations | | | | | |
| Net investment income (loss)A | .07 | .10B | .03 | .07 | .01 |
| Net realized and unrealized gain (loss) | .56 | 2.01 | 1.24 | 5.57 | .30 |
| Total from investment operations | .63 | 2.11 | 1.27 | 5.64 | .31 |
| Distributions from net investment income | (.11) | (.02) | (.01) | (.07) | (.01) |
| Distributions from net realized gain | (1.75) | (2.25) | (1.93) | (.47) | (.93) |
| Total distributions | (1.85)C | (2.26)D | (1.94) | (.54) | (.93)E |
| Redemption fees added to paid in capitalA,F | – | – | – | – | – |
| Net asset value, end of period | $17.92 | $19.14 | $19.29 | $19.96 | $14.86 |
| Total ReturnG,H | 4.07% | 11.86% | 6.83% | 39.09% | 3.24% |
| Ratios to Average Net AssetsI,J | | | | | |
| Expenses before reductions | 1.41% | 1.42% | 1.36% | 1.36% | 1.44% |
| Expenses net of fee waivers, if any | 1.41% | 1.39% | 1.35% | 1.36% | 1.44% |
| Expenses net of all reductions | 1.41% | 1.39% | 1.34% | 1.36% | 1.44% |
| Net investment income (loss) | .43% | .52%B | .13% | .41% | .09% |
| Supplemental Data | | | | | |
| Net assets, end of period (000 omitted) | $218,364 | $235,844 | $258,183 | $275,265 | $150,285 |
| Portfolio turnover rateK | 33% | 34% | 26%L | 29% | 27% |
A Calculated based on average shares outstanding during the period.
B Net Investment income per share reflects a large, non-recurring dividend which amounted to $.05 per share. Excluding this non-recurring dividend, the ratio of net investment income (loss) to average net assets would have been .26%.
C Total distributions of $1.85 per share is comprised of distributions from net investment income of $.105 and distributions from net realized gain of $1.747 per share.
D Total distributions of $2.26 per share is comprised of distributions from net investment income of $.016 and distributions from net realized gain of $2.248 per share.
E Total distributions of $.93 per share is comprised of distributions from net investment income of $.006 and distributions from net realized gain of $.925 per share.
F Amount represents less than $.005 per share.
G Total returns would have been lower if certain expenses had not been reduced during the applicable periods shown.
H Total returns do not include the effect of the sales charges.
I Fees and expenses of any underlying Fidelity Central Funds are not included in the Fund's expense ratio. The Fund indirectly bears its proportionate share of the expenses of any underlying Fidelity Central Funds.
J Expense ratios reflect operating expenses of the class. Expenses before reductions do not reflect amounts reimbursed by the investment adviser or reductions from brokerage service arrangements or reductions from other expense offset arrangements and do not represent the amount paid by the class during periods when reimbursements or reductions occur. Expenses net of fee waivers reflect expenses after reimbursement by the investment adviser but prior to reductions from brokerage service arrangements or other expense offset arrangements. Expenses net of all reductions represent the net expenses paid by the class.
K Amount does not include the portfolio activity of any underlying Fidelity Central Funds.
L Portfolio turnover rate excludes securities received or delivered in-kind.
See accompanying notes which are an integral part of the financial statements.
Financial Highlights — Fidelity Small Cap Value Fund Class T
| Years ended July 31, | 2016 | 2015 | 2014 | 2013 | 2012 |
| Selected Per–Share Data | | | | | |
| Net asset value, beginning of period | $18.78 | $18.98 | $19.70 | $14.70 | $15.34 |
| Income from Investment Operations | | | | | |
| Net investment income (loss)A | .03 | .05B | (.02) | .03 | (.02) |
| Net realized and unrealized gain (loss) | .54 | 1.98 | 1.23 | 5.50 | .31 |
| Total from investment operations | .57 | 2.03 | 1.21 | 5.53 | .29 |
| Distributions from net investment income | (.06) | – | – | (.06) | – |
| Distributions from net realized gain | (1.75) | (2.23) | (1.93) | (.47) | (.93) |
| Total distributions | (1.81) | (2.23) | (1.93) | (.53) | (.93) |
| Redemption fees added to paid in capitalA,C | – | – | – | – | – |
| Net asset value, end of period | $17.54 | $18.78 | $18.98 | $19.70 | $14.70 |
| Total ReturnD,E | 3.76% | 11.58% | 6.58% | 38.70% | 3.08% |
| Ratios to Average Net AssetsF,G | | | | | |
| Expenses before reductions | 1.66% | 1.67% | 1.61% | 1.60% | 1.67% |
| Expenses net of fee waivers, if any | 1.66% | 1.64% | 1.59% | 1.60% | 1.67% |
| Expenses net of all reductions | 1.65% | 1.63% | 1.59% | 1.59% | 1.67% |
| Net investment income (loss) | .19% | .27%B | (.11)% | .18% | (.14)% |
| Supplemental Data | | | | | |
| Net assets, end of period (000 omitted) | $82,337 | $91,716 | $100,975 | $107,444 | $57,514 |
| Portfolio turnover rateH | 33% | 34% | 26%I | 29% | 27% |
A Calculated based on average shares outstanding during the period.
B Net Investment income per share reflects a large, non-recurring dividend which amounted to $.05 per share. Excluding this non-recurring dividend, the ratio of net investment income (loss) to average net assets would have been .01%.
C Amount represents less than $.005 per share.
D Total returns would have been lower if certain expenses had not been reduced during the applicable periods shown.
E Total returns do not include the effect of the sales charges.
F Fees and expenses of any underlying Fidelity Central Funds are not included in the Fund's expense ratio. The Fund indirectly bears its proportionate share of the expenses of any underlying Fidelity Central Funds.
G Expense ratios reflect operating expenses of the class. Expenses before reductions do not reflect amounts reimbursed by the investment adviser or reductions from brokerage service arrangements or reductions from other expense offset arrangements and do not represent the amount paid by the class during periods when reimbursements or reductions occur. Expenses net of fee waivers reflect expenses after reimbursement by the investment adviser but prior to reductions from brokerage service arrangements or other expense offset arrangements. Expenses net of all reductions represent the net expenses paid by the class.
H Amount does not include the portfolio activity of any underlying Fidelity Central Funds.
I Portfolio turnover rate excludes securities received or delivered in-kind.
See accompanying notes which are an integral part of the financial statements.
Financial Highlights — Fidelity Small Cap Value Fund Class C
| Years ended July 31, | 2016 | 2015 | 2014 | 2013 | 2012 |
| Selected Per–Share Data | | | | | |
| Net asset value, beginning of period | $17.82 | $18.19 | $19.06 | $14.28 | $15.01 |
| Income from Investment Operations | | | | | |
| Net investment income (loss)A | (.05) | (.04)B | (.12) | (.06) | (.09) |
| Net realized and unrealized gain (loss) | .50 | 1.90 | 1.18 | 5.34 | .29 |
| Total from investment operations | .45 | 1.86 | 1.06 | 5.28 | .20 |
| Distributions from net investment income | – | – | – | (.03) | – |
| Distributions from net realized gain | (1.75) | (2.23) | (1.93) | (.47) | (.93) |
| Total distributions | (1.75) | (2.23) | (1.93) | (.50) | (.93) |
| Redemption fees added to paid in capitalA,C | – | – | – | – | – |
| Net asset value, end of period | $16.52 | $17.82 | $18.19 | $19.06 | $14.28 |
| Total ReturnD,E | 3.20% | 11.05% | 5.97% | 38.00% | 2.52% |
| Ratios to Average Net AssetsF,G | | | | | |
| Expenses before reductions | 2.18% | 2.19% | 2.12% | 2.13% | 2.19% |
| Expenses net of fee waivers, if any | 2.17% | 2.16% | 2.11% | 2.13% | 2.19% |
| Expenses net of all reductions | 2.17% | 2.15% | 2.10% | 2.12% | 2.19% |
| Net investment income (loss) | (.33)% | (.25)%B | (.63)% | (.35)% | (.66)% |
| Supplemental Data | | | | | |
| Net assets, end of period (000 omitted) | $57,231 | $64,928 | $70,541 | $76,018 | $47,265 |
| Portfolio turnover rateH | 33% | 34% | 26%I | 29% | 27% |
A Calculated based on average shares outstanding during the period.
B Net Investment income per share reflects a large, non-recurring dividend which amounted to $.05 per share. Excluding this non-recurring dividend, the ratio of net investment income (loss) to average net assets would have been (.51) %.
C Amount represents less than $.005 per share.
D Total returns would have been lower if certain expenses had not been reduced during the applicable periods shown.
E Total returns do not include the effect of the contingent deferred sales charge.
F Fees and expenses of any underlying Fidelity Central Funds are not included in the Fund's expense ratio. The Fund indirectly bears its proportionate share of the expenses of any underlying Fidelity Central Funds.
G Expense ratios reflect operating expenses of the class. Expenses before reductions do not reflect amounts reimbursed by the investment adviser or reductions from brokerage service arrangements or reductions from other expense offset arrangements and do not represent the amount paid by the class during periods when reimbursements or reductions occur. Expenses net of fee waivers reflect expenses after reimbursement by the investment adviser but prior to reductions from brokerage service arrangements or other expense offset arrangements. Expenses net of all reductions represent the net expenses paid by the class.
H Amount does not include the portfolio activity of any underlying Fidelity Central Funds.
I Portfolio turnover rate excludes securities received or delivered in-kind.
See accompanying notes which are an integral part of the financial statements.
Financial Highlights — Fidelity Small Cap Value Fund
| Years ended July 31, | 2016 | 2015 | 2014 | 2013 | 2012 |
| Selected Per–Share Data | | | | | |
| Net asset value, beginning of period | $19.45 | $19.57 | $20.22 | $15.05 | $15.62 |
| Income from Investment Operations | | | | | |
| Net investment income (loss)A | .12 | .15B | .08 | .12 | .06 |
| Net realized and unrealized gain (loss) | .55 | 2.05 | 1.26 | 5.63 | .32 |
| Total from investment operations | .67 | 2.20 | 1.34 | 5.75 | .38 |
| Distributions from net investment income | (.15) | (.07) | (.06) | (.11) | (.02) |
| Distributions from net realized gain | (1.75) | (2.25) | (1.93) | (.47) | (.93) |
| Total distributions | (1.90) | (2.32) | (1.99) | (.58) | (.95) |
| Redemption fees added to paid in capitalA,C | – | – | – | – | – |
| Net asset value, end of period | $18.22 | $19.45 | $19.57 | $20.22 | $15.05 |
| Total ReturnD | 4.23% | 12.18% | 7.12% | 39.45% | 3.67% |
| Ratios to Average Net AssetsE,F | | | | | |
| Expenses before reductions | 1.18% | 1.15% | 1.08% | 1.07% | 1.13% |
| Expenses net of fee waivers, if any | 1.18% | 1.12% | 1.06% | 1.07% | 1.13% |
| Expenses net of all reductions | 1.17% | 1.12% | 1.06% | 1.06% | 1.13% |
| Net investment income (loss) | .67% | .78%B | .41% | .71% | .41% |
| Supplemental Data | | | | | |
| Net assets, end of period (000 omitted) | $2,460,714 | $2,036,157 | $2,060,546 | $2,672,854 | $1,756,962 |
| Portfolio turnover rateG | 33% | 34% | 26%H | 29% | 27% |
A Calculated based on average shares outstanding during the period.
B Net Investment income per share reflects a large, non-recurring dividend which amounted to $.05 per share. Excluding this non-recurring dividend, the ratio of net investment income (loss) to average net assets would have been .53%.
C Amount represents less than $.005 per share.
D Total returns would have been lower if certain expenses had not been reduced during the applicable periods shown.
E Fees and expenses of any underlying Fidelity Central Funds are not included in the Fund's expense ratio. The Fund indirectly bears its proportionate share of the expenses of any underlying Fidelity Central Funds.
F Expense ratios reflect operating expenses of the class. Expenses before reductions do not reflect amounts reimbursed by the investment adviser or reductions from brokerage service arrangements or reductions from other expense offset arrangements and do not represent the amount paid by the class during periods when reimbursements or reductions occur. Expenses net of fee waivers reflect expenses after reimbursement by the investment adviser but prior to reductions from brokerage service arrangements or other expense offset arrangements. Expenses net of all reductions represent the net expenses paid by the class.
G Amount does not include the portfolio activity of any underlying Fidelity Central Funds.
H Portfolio turnover rate excludes securities received or delivered in-kind.
See accompanying notes which are an integral part of the financial statements.
Financial Highlights — Fidelity Small Cap Value Fund Class I
| Years ended July 31, | 2016 | 2015 | 2014 | 2013 | 2012 |
| Selected Per–Share Data | | | | | |
| Net asset value, beginning of period | $19.45 | $19.57 | $20.23 | $15.05 | $15.63 |
| Income from Investment Operations | | | | | |
| Net investment income (loss)A | .12 | .15B | .08 | .12 | .06 |
| Net realized and unrealized gain (loss) | .56 | 2.05 | 1.25 | 5.65 | .31 |
| Total from investment operations | .68 | 2.20 | 1.33 | 5.77 | .37 |
| Distributions from net investment income | (.16) | (.07) | (.06) | (.12) | (.02) |
| Distributions from net realized gain | (1.75) | (2.25) | (1.93) | (.47) | (.93) |
| Total distributions | (1.90)C | (2.32) | (1.99) | (.59) | (.95) |
| Redemption fees added to paid in capitalA,D | – | – | – | – | – |
| Net asset value, end of period | $18.23 | $19.45 | $19.57 | $20.23 | $15.05 |
| Total ReturnE | 4.31% | 12.17% | 7.08% | 39.54% | 3.59% |
| Ratios to Average Net AssetsF,G | | | | | |
| Expenses before reductions | 1.14% | 1.15% | 1.09% | 1.07% | 1.14% |
| Expenses net of fee waivers, if any | 1.14% | 1.12% | 1.07% | 1.07% | 1.14% |
| Expenses net of all reductions | 1.14% | 1.12% | 1.07% | 1.06% | 1.14% |
| Net investment income (loss) | .70% | .79%B | .40% | .70% | .39% |
| Supplemental Data | | | | | |
| Net assets, end of period (000 omitted) | $389,928 | $376,817 | $342,500 | $359,582 | $138,981 |
| Portfolio turnover rateH | 33% | 34% | 26%I | 29% | 27% |
A Calculated based on average shares outstanding during the period.
B Net Investment income per share reflects a large, non-recurring dividend which amounted to $.05 per share. Excluding this non-recurring dividend, the ratio of net investment income (loss) to average net assets would have been .53%.
C Total distributions of $1.90 per share is comprised of distributions from net investment income of $.157 and distributions from net realized gain of $1.747 per share.
D Amount represents less than $.005 per share.
E Total returns would have been lower if certain expenses had not been reduced during the applicable periods shown.
F Fees and expenses of any underlying Fidelity Central Funds are not included in the Fund's expense ratio. The Fund indirectly bears its proportionate share of the expenses of any underlying Fidelity Central Funds.
G Expense ratios reflect operating expenses of the class. Expenses before reductions do not reflect amounts reimbursed by the investment adviser or reductions from brokerage service arrangements or reductions from other expense offset arrangements and do not represent the amount paid by the class during periods when reimbursements or reductions occur. Expenses net of fee waivers reflect expenses after reimbursement by the investment adviser but prior to reductions from brokerage service arrangements or other expense offset arrangements. Expenses net of all reductions represent the net expenses paid by the class.
H Amount does not include the portfolio activity of any underlying Fidelity Central Funds.
I Portfolio turnover rate excludes securities received or delivered in-kind.
See accompanying notes which are an integral part of the financial statements.
Notes to Financial Statements
For the period ended July 31, 2016
1. Organization.
Fidelity Small Cap Value Fund (the Fund) is a fund of Fidelity Securities Fund (the Trust) and is authorized to issue an unlimited number of shares. The Trust is registered under the Investment Company Act of 1940, as amended (the 1940 Act), as an open-end management investment company organized as a Massachusetts business trust. The Fund offers Class A, Class T, Class C, Small Cap Value and Class I shares, each of which has equal rights as to assets and voting privileges. The Fund is closed to new accounts with certain exceptions. Each class has exclusive voting rights with respect to matters that affect that class.
After the close of business on June 24, 2016, all outstanding Class B shares were converted to Class A shares. All current fiscal period dollar and share amounts for Class B presented in the Notes to Financial Statements are for the period August 1, 2015 through June 24, 2016.
2. Investments in Fidelity Central Funds.
The Fund invests in Fidelity Central Funds, which are open-end investment companies generally available only to other investment companies and accounts managed by the investment adviser and its affiliates. The Fund's Schedule of Investments lists each of the Fidelity Central Funds held as of period end, if any, as an investment of the Fund, but does not include the underlying holdings of each Fidelity Central Fund. As an Investing Fund, the Fund indirectly bears its proportionate share of the expenses of the underlying Fidelity Central Funds.
The Money Market Central Funds seek preservation of capital and current income and are managed by Fidelity Investments Money Management, Inc. (FIMM), an affiliate of the investment adviser. Annualized expenses of the Money Market Central Funds as of their most recent shareholder report date are less than .01%.
A complete unaudited list of holdings for each Fidelity Central Fund is available upon request or at the Securities and Exchange Commission (the SEC) website at www.sec.gov. In addition, the financial statements of the Fidelity Central Funds, which are not covered by the Fund's Report of Independent Registered Public Accounting Firm, are available on the SEC website or upon request.
3. Significant Accounting Policies.
The financial statements have been prepared in conformity with accounting principles generally accepted in the United States of America (GAAP), which require management to make certain estimates and assumptions at the date of the financial statements. Actual results could differ from those estimates. Subsequent events, if any, through the date that the financial statements were issued have been evaluated in the preparation of the financial statements. The following summarizes the significant accounting policies of the Fund:
Investment Valuation. Investments are valued as of 4:00 p.m. Eastern time on the last calendar day of the period. The Board of Trustees (the Board) has delegated the day to day responsibility for the valuation of the Fund's investments to the Fidelity Management & Research Company (FMR) Fair Value Committee (the Committee). In accordance with valuation policies and procedures approved by the Board, the Fund attempts to obtain prices from one or more third party pricing vendors or brokers to value its investments. When current market prices, quotations or currency exchange rates are not readily available or reliable, investments will be fair valued in good faith by the Committee, in accordance with procedures adopted by the Board. Factors used in determining fair value vary by investment type and may include market or investment specific events. The frequency with which these procedures are used cannot be predicted and they may be utilized to a significant extent. The Committee oversees the Fund's valuation policies and procedures and reports to the Board on the Committee's activities and fair value determinations. The Board monitors the appropriateness of the procedures used in valuing the Fund's investments and ratifies the fair value determinations of the Committee.
The Fund categorizes the inputs to valuation techniques used to value its investments into a disclosure hierarchy consisting of three levels as shown below:
- Level 1 – quoted prices in active markets for identical investments
- Level 2 – other significant observable inputs (including quoted prices for similar investments, interest rates, prepayment speeds, etc.)
- Level 3 – unobservable inputs (including the Fund's own assumptions based on the best information available)
Valuation techniques used to value the Fund's investments by major category are as follows:
Equity securities, including restricted securities, for which market quotations are readily available, are valued at the last reported sale price or official closing price as reported by a third party pricing vendor on the primary market or exchange on which they are traded and are categorized as Level 1 in the hierarchy. In the event there were no sales during the day or closing prices are not available, securities are valued at the last quoted bid price or may be valued using the last available price and are generally categorized as Level 2 in the hierarchy. For foreign equity securities, when market or security specific events arise, comparisons to the valuation of American Depositary Receipts (ADRs), futures contracts, Exchange-Traded Funds (ETFs) and certain indexes as well as quoted prices for similar securities may be used and would be categorized as Level 2 in the hierarchy. Utilizing these techniques may result in transfers between Level 1 and Level 2. For equity securities, including restricted securities, where observable inputs are limited, assumptions about market activity and risk are used and these securities may be categorized as Level 3 in the hierarchy.
Investments in open-end mutual funds, including the Fidelity Central Funds, are valued at their closing net asset value (NAV) each business day and are categorized as Level 1 in the hierarchy.
Changes in valuation techniques may result in transfers in or out of an assigned level within the disclosure hierarchy. The aggregate value of investments by input level as of July 31, 2016, including information on transfers between Levels 1 and 2, is included at the end of the Fund's Schedule of Investments.
Foreign Currency. The Fund may use foreign currency contracts to facilitate transactions in foreign-denominated securities. Gains and losses from these transactions may arise from changes in the value of the foreign currency or if the counterparties do not perform under the contracts' terms.
Foreign-denominated assets, including investment securities, and liabilities are translated into U.S. dollars at the exchange rates at period end. Purchases and sales of investment securities, income and dividends received and expenses denominated in foreign currencies are translated into U.S. dollars at the exchange rate in effect on the transaction date.
The effects of exchange rate fluctuations on investments are included with the net realized and unrealized gain (loss) on investment securities. Other foreign currency transactions resulting in realized and unrealized gain (loss) are disclosed separately.
Investment Transactions and Income. For financial reporting purposes, the Fund's investment holdings and NAV include trades executed through the end of the last business day of the period. The NAV per share for processing shareholder transactions is calculated as of the close of business of the New York Stock Exchange (NYSE), normally 4:00 p.m. Eastern time and includes trades executed through the end of the prior business day. Gains and losses on securities sold are determined on the basis of identified cost and may include proceeds received from litigation. Dividend income is recorded on the ex-dividend date, except for certain dividends from foreign securities where the ex-dividend date may have passed, which are recorded as soon as the Fund is informed of the ex-dividend date. Non-cash dividends included in dividend income, if any, are recorded at the fair market value of the securities received. Income and capital gain distributions from Fidelity Central Funds, if any, are recorded on the ex-dividend date. Distributions received on securities that represent a return of capital or capital gain are recorded as a reduction of cost of investments and/or as a realized gain. Subsequent to ex-dividend date the Fund determines the components of these distributions, based upon receipt of tax filings or other correspondence relating to the underlying investment. Investment income is recorded net of foreign taxes withheld where recovery of such taxes is uncertain.
Class Allocations and Expenses. Investment income, realized and unrealized capital gains and losses, common expenses of the Fund, and certain fund-level expense reductions, if any, are allocated daily on a pro-rata basis to each class based on the relative net assets of each class to the total net assets of the Fund. Each class differs with respect to transfer agent and distribution and service plan fees incurred. Certain expense reductions may also differ by class. For the reporting period, the allocated portion of income and expenses to each class as a percent of its average net assets may vary due to the timing of recording these transactions in relation to fluctuating net assets of the classes. Expenses directly attributable to a fund are charged to that fund. Expenses attributable to more than one fund are allocated among the respective funds on the basis of relative net assets or other appropriate methods. Expense estimates are accrued in the period to which they relate and adjustments are made when actual amounts are known.
Income Tax Information and Distributions to Shareholders. Each year, the Fund intends to qualify as a regulated investment company under Subchapter M of the Internal Revenue Code, including distributing substantially all of its taxable income and realized gains. As a result, no provision for U.S. Federal income taxes is required. As of July 31, 2016, the Fund did not have any unrecognized tax benefits in the financial statements; nor is the Fund aware of any tax positions for which it is reasonably possible that the total amounts of unrecognized tax benefits will significantly change in the next twelve months. The Fund files a U.S. federal tax return, in addition to state and local tax returns as required. The Fund's federal income tax returns are subject to examination by the Internal Revenue Service (IRS) for a period of three fiscal years after they are filed. State and local tax returns may be subject to examination for an additional fiscal year depending on the jurisdiction. Foreign taxes are provided for based on the Fund's understanding of the tax rules and rates that exist in the foreign markets in which it invests.
Distributions are declared and recorded on the ex-dividend date. Income dividends and capital gain distributions are declared separately for each class. Income and capital gain distributions are determined in accordance with income tax regulations, which may differ from GAAP. In addition, the Fund claimed a portion of the payment made to redeeming shareholders as a distribution for income tax purposes.
Capital accounts within the financial statements are adjusted for permanent book-tax differences. These adjustments have no impact on net assets or the results of operations. Capital accounts are not adjusted for temporary book-tax differences which will reverse in a subsequent period.
Book-tax differences are primarily due to foreign currency transactions, passive foreign investment companies (PFIC) and losses deferred due to wash sales.
The federal tax cost of investment securities and unrealized appreciation (depreciation) as of period end were as follows:
| Gross unrealized appreciation | $566,469,122 |
| Gross unrealized depreciation | (164,828,845) |
| Net unrealized appreciation (depreciation) on securities | $401,640,277 |
| Tax Cost | $2,965,700,309 |
The tax-based components of distributable earnings as of period end were as follows:
| Undistributed ordinary income | $6,559,742 |
| Undistributed long-term capital gain | $186,601,784 |
| Net unrealized appreciation (depreciation) on securities and other investments | $401,640,277 |
The tax character of distributions paid was as follows:
| | July 31, 2016 | July 31, 2015 |
| Ordinary Income | $22,268,401 | $ 12,432,052 |
| Long-term Capital Gains | 263,858,385 | 319,195,013 |
| Total | $286,126,786 | $ 331,627,065 |
Short-Term Trading (Redemption) Fees. Shares held by investors in the Fund less than 90 days may have been subject to a redemption fee equal to 1.50% of the NAV of shares redeemed. All redemption fees, which reduce the proceeds of the shareholder redemption, are retained by the Fund and accounted for as an addition to paid in capital.
4. Purchases and Sales of Investments.
Purchases and sales of securities, other than short-term securities, aggregated $1,246,194,550 and $960,674,812, respectively.
5. Fees and Other Transactions with Affiliates.
Management Fee. Fidelity Management & Research Company (the investment adviser) and its affiliates provide the Fund with investment management related services for which the Fund pays a monthly management fee. The management fee is the sum of an individual fund fee rate that is based on an annual rate of .45% of the Fund's average net assets and an annualized group fee rate that averaged .25% during the period. The group fee rate is based upon the average net assets of all the mutual funds advised by the investment adviser, including any mutual funds previously advised by the investment adviser that are currently advised by Fidelity SelectCo, LLC, an affiliate of the investment adviser. The group fee rate decreases as assets under management increase and increases as assets under management decrease. In addition, the management fee is subject to a performance adjustment (up to a maximum of +/- .20% of the Fund's average net assets over a 36 month performance period). The upward or downward adjustment to the management fee is based on the relative investment performance of Small Cap Value as compared to its benchmark index, the Russell 2000 Value Index, over the same 36 month performance period. For the reporting period, the total annual management fee rate, including the performance adjustment, was .91% of the Fund's average net assets. The performance adjustment included in the management fee rate may be higher or lower than the maximum performance adjustment rate due to the difference between the average net assets for the reporting and performance periods.
Distribution and Service Plan Fees. In accordance with Rule 12b-1 of the 1940 Act, the Fund has adopted separate Distribution and Service Plans for each class of shares. Certain classes pay Fidelity Distributors Corporation (FDC), an affiliate of the investment adviser, separate Distribution and Service Fees, each of which is based on an annual percentage of each class' average net assets. In addition, FDC may pay financial intermediaries for selling shares of the Fund and providing shareholder support services. For the period, the Distribution and Service Fee rates, total fees and amounts retained by FDC were as follows:
| | Distribution
Fee | Service
Fee | Total Fees | Retained
by FDC |
| Class A | -% | .25% | $538,756 | $– |
| Class T | .25% | .25% | 416,962 | – |
| Class B | .75% | .25% | 23,452 | 17,589 |
| Class C | .75% | .25% | 586,093 | 7,448 |
| | | | $1,565,263 | $25,037 |
Sales Load. FDC may receive a front-end sales charge of up to 5.75% for selling Class A shares and 3.50% for selling Class T shares, some of which is paid to financial intermediaries for selling shares of the Fund. Depending on the holding period, FDC may receive contingent deferred sales charges levied on Class A, Class T, Class B, and Class C redemptions. The deferred sales charges range from 5.00% to 1.00% for Class B shares, 1.00% for Class C shares, 1.00% for certain purchases of Class A shares and .25% for certain purchases of Class T shares.
For the period, sales charge amounts retained by FDC were as follows:
| | Retained
by FDC |
| Class A | $6,500 |
| Class T | 3,040 |
| Class B(a) | 1,321 |
| Class C(a) | 528 |
| | $11,389 |
(a) When Class B and Class C shares are initially sold, FDC pays commissions from its own resources to financial intermediaries through which the sales are made.
Transfer Agent Fees. Fidelity Investments Institutional Operations Company, Inc., (FIIOC), an affiliate of the investment adviser, is the transfer, dividend disbursing and shareholder servicing agent for each class of the Fund. FIIOC receives account fees and asset-based fees that vary according to the account size and type of account of the shareholders of the respective classes of the Fund. FIIOC pays for typesetting, printing and mailing of shareholder reports, except proxy statements.
For the period, transfer agent fees for each class were as follows:
| | Amount | % of
Class-Level Average
Net Assets |
| Class A | $465,299 | .22 |
| Class T | 174,728 | .21 |
| Class B | 6,732 | .26 |
| Class C | 133,220 | .23 |
| Small Cap Value | 4,897,044 | .23 |
| Class I | 696,084 | .19 |
| | $6,373,107 | |
Accounting and Security Lending Fees. Fidelity Service Company, Inc. (FSC), an affiliate of the investment adviser, maintains the Fund's accounting records. The accounting fee is based on the level of average net assets for each month. Under a separate contract, FSC administers the security lending program. The security lending fee is based on the number and duration of lending transactions.
Brokerage Commissions. The Fund placed a portion of its portfolio transactions with brokerage firms which are affiliates of the investment adviser. Brokerage commissions are included in net realized gain (loss) and change in net unrealized appreciation (depreciation) in the Statement of Operations. The commissions paid to these affiliated firms were $35,267 for the period.
Interfund Trades. The Fund may purchase from or sell securities to other Fidelity Funds under procedures adopted by the Board. The procedures have been designed to ensure these interfund trades are executed in accordance with Rule 17a-7 of the 1940 Act. Interfund trades are included within the respective purchases and sales amounts shown in the Purchases and Sales of Investments note.
6. Committed Line of Credit.
The Fund participates with other funds managed by the investment adviser or an affiliate in a $4.25 billion credit facility (the "line of credit") to be utilized for temporary or emergency purposes to fund shareholder redemptions or for other short-term liquidity purposes. The Fund has agreed to pay commitment fees on its pro-rata portion of the line of credit, which amounted to $5,924 and is reflected in Miscellaneous expenses on the Statement of Operations. During the period, the Fund did not borrow on this line of credit.
7. Security Lending.
The Fund lends portfolio securities through a lending agent from time to time in order to earn additional income. For equity securities, a lending agent is used and may loan securities to certain qualified borrowers, including Fidelity Capital Markets (FCM), a broker-dealer affiliated with the Fund. On the settlement date of the loan, the Fund receives collateral (in the form of U.S. Treasury obligations, letters of credit and/or cash) against the loaned securities and maintains collateral in an amount not less than 100% of the market value of the loaned securities during the period of the loan. The market value of the loaned securities is determined at the close of business of the Fund and any additional required collateral is delivered to the Fund on the next business day. The Fund or borrower may terminate the loan at any time, and if the borrower defaults on its obligation to return the securities loaned because of insolvency or other reasons, the Fund may apply collateral received from the borrower against the obligation. The Fund may experience delays and costs in recovering the securities loaned. Any cash collateral received is the Fidelity Securities Lending Cash Central Fund. The value of loaned securities and cash collateral at period end are disclosed on the Fund's Statement of Assets and Liabilities. The value of securities loaned to FCM at period end was $528,264. Security lending income represents the income earned on investing cash collateral, less rebates paid to borrowers and any lending agent fees associated with the loan, plus any premium payments received for lending certain types of securities. Security lending income is presented in the Statement of Operations as a component of income from Fidelity Central Funds. Total security lending income during the period amounted to $2,179,165, including $9,308 from securities loaned to FCM.
8. Expense Reductions.
Commissions paid to certain brokers with whom the investment adviser, or its affiliates, places trades on behalf of the Fund include an amount in addition to trade execution, which may be rebated back to the Fund to offset certain expenses. This amount totaled $145,552 for the period. In addition, through arrangements with the Fund's custodian, credits realized as a result of certain uninvested cash balances were used to reduce the Fund's expenses. During the period, these credits reduced the Fund's expenses by $417.
In addition, during the period the investment adviser reimbursed and/or waived a portion of fund-level operating expenses in the amount of $19,698.
9. Distributions to Shareholders.
Distributions to shareholders of each class were as follows:
| | Year ended
July 31, 2016 | Year ended July 31, 2015 |
| From net investment income | | |
| Class A | $1,294,370 | $207,059 |
| Class T | 298,011 | – |
| Small Cap Value | 17,252,892 | 7,655,420 |
| Class I | 3,108,241 | 1,284,414 |
| Total | $21,953,514 | $9,146,893 |
| From net realized gain | | |
| Class A | $21,315,531 | $29,002,450 |
| Class T | 8,511,334 | 11,758,984 |
| Class B | 317,311 | 573,044 |
| Class C | 6,297,703 | 8,461,258 |
| Small Cap Value | 193,459,994 | 233,242,234 |
| Class I | 34,271,399 | 39,442,202 |
| Total | $264,173,272 | $322,480,172 |
10. Share Transactions.
Share transactions for each class were as follows and may contain automatic conversions between classes or exchanges between affiliated funds:
| | Shares | Shares | Dollars | Dollars |
| | Year ended
July 31, 2016 | Year ended July 31, 2015 | Year ended
July 31, 2016 | Year ended July 31, 2015 |
| Class A | | | | |
| Shares sold | 2,145,353 | 1,619,679 | $36,585,285 | $30,035,137 |
| Reinvestment of distributions | 1,320,026 | 1,578,405 | 22,234,691 | 28,466,035 |
| Shares redeemed | (3,598,901) | (4,261,712) | (60,922,417) | (79,564,907) |
| Net increase (decrease) | (133,522) | (1,063,628) | $(2,102,441) | $(21,063,735) |
| Class T | | | | |
| Shares sold | 664,517 | 599,331 | $11,103,956 | $10,911,777 |
| Reinvestment of distributions | 527,842 | 655,613 | 8,714,816 | 11,618,861 |
| Shares redeemed | (1,382,867) | (1,691,524) | (22,787,541) | (30,859,052) |
| Net increase (decrease) | (190,508) | (436,580) | $(2,968,769) | $(8,328,414) |
| Class B | | | | |
| Shares sold | 4,363 | 5,056 | $67,145 | $89,676 |
| Reinvestment of distributions | 19,426 | 31,870 | 302,868 | 537,830 |
| Shares redeemed | (219,046) | (106,178) | (3,435,330) | (1,834,363) |
| Net increase (decrease) | (195,257) | (69,252) | $(3,065,317) | $(1,206,857) |
| Class C | | | | |
| Shares sold | 192,093 | 167,565 | $2,998,393 | $2,897,201 |
| Reinvestment of distributions | 367,680 | 447,025 | 5,744,375 | 7,553,140 |
| Shares redeemed | (740,656) | (847,704) | (11,631,361) | (14,671,382) |
| Net increase (decrease) | (180,883) | (233,114) | $(2,888,593) | $(4,221,041) |
| Small Cap Value | | | | |
| Shares sold | 41,988,674 | 13,163,441 | $719,207,580 | $248,872,334 |
| Reinvestment of distributions | 11,458,933 | 12,098,173 | 196,111,327 | 221,448,638 |
| Shares redeemed | (23,136,423) | (25,848,809) | (398,026,994) | (487,056,437) |
| Net increase (decrease) | 30,311,184 | (587,195) | $517,291,913 | $(16,735,465) |
| Class I | | | | |
| Shares sold | 4,744,642 | 4,194,067 | $82,352,801 | $79,803,869 |
| Reinvestment of distributions | 1,907,860 | 1,996,970 | 32,653,194 | 36,554,847 |
| Shares redeemed | (4,639,051) | (4,316,971) | (80,089,760) | (81,701,452) |
| Net increase (decrease) | 2,013,451 | 1,874,066 | $34,916,235 | $34,657,264 |
11. Other.
The Fund's organizational documents provide former and current trustees and officers with a limited indemnification against liabilities arising in connection with the performance of their duties to the Fund. In the normal course of business, the Fund may also enter into contracts that provide general indemnifications. The Fund's maximum exposure under these arrangements is unknown as this would be dependent on future claims that may be made against the Fund. The risk of material loss from such claims is considered remote.
At the end of the period, Strategic Advisers Small-Mid Cap Fund was the owner of record of approximately 11% of the total outstanding shares of the Fund.
Report of Independent Registered Public Accounting Firm
To the Trustees of Fidelity Securities Fund and Shareholders of Fidelity Small Cap Value Fund:
In our opinion, the accompanying statement of assets and liabilities, including the schedule of investments, and the related statements of operations and of changes in net assets and the financial highlights present fairly, in all material respects, the financial position of Fidelity Small Cap Value Fund (a fund of Fidelity Securities Fund) at July 31, 2016, the results of its operations for the year then ended, the changes in its net assets for each of the two years in the period then ended and the financial highlights for each of the five years in the period then ended, in conformity with accounting principles generally accepted in the United States of America. These financial statements and financial highlights (hereafter referred to as “financial statements”) are the responsibility of the Fidelity Small Cap Value Fund’s management. Our responsibility is to express an opinion on these financial statements based on our audits. We conducted our audits of these financial statements in accordance with the standards of the Public Company Accounting Oversight Board (United States). Those standards require that we plan and perform the audit to obtain reasonable assurance about whether the financial statements are free of material misstatement. An audit includes examining, on a test basis, evidence supporting the amounts and disclosures in the financial statements, assessing the accounting principles used and significant estimates made by management, and evaluating the overall financial statement presentation. We believe that our audits, which included confirmation of securities at July 31, 2016 by correspondence with the custodian and brokers, provide a reasonable basis for our opinion.
PricewaterhouseCoopers LLP
Boston, Massachusetts
September 14, 2016
Trustees and Officers
The Trustees, Members of the Advisory Board (if any), and officers of the trust and fund, as applicable, are listed below. The Board of Trustees governs the fund and is responsible for protecting the interests of shareholders. The Trustees are experienced executives who meet periodically throughout the year to oversee the fund's activities, review contractual arrangements with companies that provide services to the fund, oversee management of the risks associated with such activities and contractual arrangements, and review the fund's performance. Each of the Trustees oversees 170 funds.
The Trustees hold office without limit in time except that (a) any Trustee may resign; (b) any Trustee may be removed by written instrument, signed by at least two-thirds of the number of Trustees prior to such removal; (c) any Trustee who requests to be retired or who has become incapacitated by illness or injury may be retired by written instrument signed by a majority of the other Trustees; and (d) any Trustee may be removed at any special meeting of shareholders by a two-thirds vote of the outstanding voting securities of the trust. Each Trustee who is not an interested person (as defined in the 1940 Act) of the trust and the fund is referred to herein as an Independent Trustee. Each Independent Trustee shall retire not later than the last day of the calendar year in which his or her 75th birthday occurs. The Independent Trustees may waive this mandatory retirement age policy with respect to individual Trustees. Officers and Advisory Board Members hold office without limit in time, except that any officer or Advisory Board Member may resign or may be removed by a vote of a majority of the Trustees at any regular meeting or any special meeting of the Trustees. Except as indicated, each individual has held the office shown or other offices in the same company for the past five years.
The fund’s Statement of Additional Information (SAI) includes more information about the Trustees. To request a free copy, call Fidelity at 1-877-208-0098.
Experience, Skills, Attributes, and Qualifications of the Trustees. The Governance and Nominating Committee has adopted a statement of policy that describes the experience, qualifications, attributes, and skills that are necessary and desirable for potential Independent Trustee candidates (Statement of Policy). The Board believes that each Trustee satisfied at the time he or she was initially elected or appointed a Trustee, and continues to satisfy, the standards contemplated by the Statement of Policy. The Governance and Nominating Committee also engages professional search firms to help identify potential Independent Trustee candidates who have the experience, qualifications, attributes, and skills consistent with the Statement of Policy. From time to time, additional criteria based on the composition and skills of the current Independent Trustees, as well as experience or skills that may be appropriate in light of future changes to board composition, business conditions, and regulatory or other developments, have also been considered by the professional search firms and the Governance and Nominating Committee. In addition, the Board takes into account the Trustees' commitment and participation in Board and committee meetings, as well as their leadership of standing and ad hoc committees throughout their tenure.
In determining that a particular Trustee was and continues to be qualified to serve as a Trustee, the Board has considered a variety of criteria, none of which, in isolation, was controlling. The Board believes that, collectively, the Trustees have balanced and diverse experience, qualifications, attributes, and skills, which allow the Board to operate effectively in governing the fund and protecting the interests of shareholders. Information about the specific experience, skills, attributes, and qualifications of each Trustee, which in each case led to the Board's conclusion that the Trustee should serve (or continue to serve) as a trustee of the fund, is provided below.
Board Structure and Oversight Function. James C. Curvey is an interested person and currently serves as Chairman. The Trustees have determined that an interested Chairman is appropriate and benefits shareholders because an interested Chairman has a personal and professional stake in the quality and continuity of services provided to the fund. Independent Trustees exercise their informed business judgment to appoint an individual of their choosing to serve as Chairman, regardless of whether the Trustee happens to be independent or a member of management. The Independent Trustees have determined that they can act independently and effectively without having an Independent Trustee serve as Chairman and that a key structural component for assuring that they are in a position to do so is for the Independent Trustees to constitute a substantial majority for the Board. The Independent Trustees also regularly meet in executive session. Ned C. Lautenbach serves as Chairman of the Independent Trustees and as such (i) acts as a liaison between the Independent Trustees and management with respect to matters important to the Independent Trustees and (ii) with management prepares agendas for Board meetings.
Fidelity® funds are overseen by different Boards of Trustees. The fund's Board oversees Fidelity's high income and certain equity funds, and other Boards oversee Fidelity's investment-grade bond, money market, asset allocation, and sector funds. The asset allocation funds may invest in Fidelity® funds overseen by the fund's Board. The use of separate Boards, each with its own committee structure, allows the Trustees of each group of Fidelity® funds to focus on the unique issues of the funds they oversee, including common research, investment, and operational issues. On occasion, the separate Boards establish joint committees to address issues of overlapping consequences for the Fidelity® funds overseen by each Board.
The Trustees operate using a system of committees to facilitate the timely and efficient consideration of all matters of importance to the Trustees, the fund, and fund shareholders and to facilitate compliance with legal and regulatory requirements and oversight of the fund's activities and associated risks. The Board, acting through its committees, has charged FMR and its affiliates with (i) identifying events or circumstances the occurrence of which could have demonstrably adverse effects on the fund's business and/or reputation; (ii) implementing processes and controls to lessen the possibility that such events or circumstances occur or to mitigate the effects of such events or circumstances if they do occur; and (iii) creating and maintaining a system designed to evaluate continuously business and market conditions in order to facilitate the identification and implementation processes described in (i) and (ii) above. Because the day-to-day operations and activities of the fund are carried out by or through FMR, its affiliates, and other service providers, the fund's exposure to risks is mitigated but not eliminated by the processes overseen by the Trustees. While each of the Board's committees has responsibility for overseeing different aspects of the fund's activities, oversight is exercised primarily through the Operations, Audit, and Compliance Committees. In addition, the Independent Trustees have worked with FMR to enhance the Board's oversight of investment and financial risks, legal and regulatory risks, technology risks, and operational risks, including the development of additional risk reporting to the Board. For example, a working group comprised of Independent Trustees and FMR has worked and continues to work to review the Fidelity® funds' valuation-related activities, reporting and risk management. Appropriate personnel, including but not limited to the fund's Chief Compliance Officer (CCO), FMR's internal auditor, the independent accountants, the fund's Treasurer and portfolio management personnel, make periodic reports to the Board's committees, as appropriate, including an annual review of Fidelity's risk management program for the Fidelity® funds. The responsibilities of each standing committee, including their oversight responsibilities, are described further under "Standing Committees of the Trustees."
Interested Trustees*:
Correspondence intended for a Trustee who is an interested person may be sent to Fidelity Investments, 245 Summer Street, Boston, Massachusetts 02210.
Name, Year of Birth; Principal Occupations and Other Relevant Experience+
James C. Curvey (1935)
Year of Election or Appointment: 2007
Trustee
Chairman of the Board of Trustees
Mr. Curvey also serves as Trustee of other Fidelity® funds. Mr. Curvey is a Director of Fidelity Research & Analysis Co. (investment adviser firm, 2009-present), and Vice Chairman (2007-present) and Director of FMR LLC (diversified financial services company). In addition, Mr. Curvey serves as an Overseer for the Boston Symphony Orchestra and a member of the board of Artis-Naples, Naples, Florida, and as a Trustee for Brewster Academy, Wolfeboro, New Hampshire. Previously, Mr. Curvey served as a Director of Fidelity Investments Money Management, Inc. (investment adviser firm, 2009-2014) and a Director of FMR and FMR Co., Inc. (investment adviser firms, 2007-2014).
Charles S. Morrison (1960)
Year of Election or Appointment: 2014
Trustee
Mr. Morrison also serves as Trustee of other funds. He serves as a Director of Fidelity Investments Money Management, Inc. (FIMM) (investment adviser firm, 2014-present), Director of Fidelity SelectCo, LLC (investment adviser firm, 2014-present), President, Asset Management (2014-present), and is an employee of Fidelity Investments. Previously, Mr. Morrison served as Vice President of Fidelity's Fixed Income and Asset Allocation Funds (2012-2014), President, Fixed Income (2011-2014), Vice President of Fidelity's Money Market Funds (2005-2009), President, Money Market Group Leader of FMR (investment adviser firm, 2009), and Senior Vice President, Money Market Group of FMR (2004-2009). Mr. Morrison also served as Vice President of Fidelity's Bond Funds (2002-2005), certain Balanced Funds (2002-2005), and certain Asset Allocation Funds (2002-2007), and as Senior Vice President (2002-2005) of Fidelity's Bond Division.
* Determined to be an “Interested Trustee” by virtue of, among other things, his or her affiliation with the trust or various entities under common control with FMR.
+ The information includes the Trustee's principal occupation during the last five years and other information relating to the experience, attributes, and skills relevant to the Trustee's qualifications to serve as a Trustee, which led to the conclusion that the Trustee should serve as a Trustee for the fund.
Independent Trustees:
Correspondence intended for an Independent Trustee may be sent to Fidelity Investments, P.O. Box 55235, Boston, Massachusetts 02205-5235.
Name, Year of Birth; Principal Occupations and Other Relevant Experience+
Dennis J. Dirks (1948)
Year of Election or Appointment: 2005
Trustee
Mr. Dirks also serves as Trustee of other Fidelity® funds. Prior to his retirement in May 2003, Mr. Dirks was Chief Operating Officer and a member of the Board of The Depository Trust & Clearing Corporation (DTCC). He also served as President, Chief Operating Officer, and Board member of The Depository Trust Company (DTC) and President and Board member of the National Securities Clearing Corporation (NSCC). In addition, Mr. Dirks served as Chief Executive Officer and Board member of the Government Securities Clearing Corporation, Chief Executive Officer and Board member of the Mortgage-Backed Securities Clearing Corporation, as a Trustee and a member of the Finance Committee of Manhattan College (2005-2008), as a Trustee and a member of the Finance Committee of AHRC of Nassau County (2006-2008), and as a member of the Independent Directors Council (IDC) Governing Council (2010-2015). Mr. Dirks is a member of the Board of Directors for The Brookville Center for Children's Services, Inc. (2009-present).
Alan J. Lacy (1953)
Year of Election or Appointment: 2008
Trustee
Mr. Lacy also serves as Trustee of other Fidelity® funds. Mr. Lacy serves as Chairman (2014-present) and a member (2010-present) of the Board of Directors of Dave & Buster's Entertainment, Inc. (restaurant and entertainment complexes) and a Director of Bristol-Myers Squibb Company (global pharmaceuticals, 2008-present). He is a Trustee of the California Chapter of The Nature Conservancy (2015-present) and a Director of the Center for Advanced Study in the Behavioral Sciences at Stanford University (2015-present). In addition, Mr. Lacy served as Senior Adviser (2007-2014) of Oak Hill Capital Partners, L.P. (private equity) and also served as Chief Executive Officer (2005) and Vice Chairman (2005-2006) of Sears Holdings Corporation (retail) and Chief Executive Officer and Chairman of the Board of Sears, Roebuck and Co. (retail, 2000-2005). Previously, Mr. Lacy served as Chairman (2008-2011) and a member (2006-2015) of the Board of Trustees of the National Parks Conservation Association and as a member of the Board of Directors for The Western Union Company (global money transfer, 2006-2011), The Hillman Companies, Inc. (hardware wholesalers, 2010-2014), and Earth Fare, Inc. (retail grocery, 2010-2014).
Ned C. Lautenbach (1944)
Year of Election or Appointment: 2000
Trustee
Chairman of the Independent Trustees
Mr. Lautenbach also serves as Trustee of other Fidelity® funds. Mr. Lautenbach currently serves as the Lead Director of the Eaton Corporation Board of Directors (diversified industrial, 1997-present). Mr. Lautenbach is Chairman of the Board of Directors of Artis-Naples in Naples, Florida (2012-present), a member of the Council on Foreign Relations (1994-present), and a member of the Board of Governors, State University System of Florida (2013-present). Previously, Mr. Lautenbach was a Partner/Advisory Partner at Clayton, Dubilier & Rice, LLC (private equity investment, 1998-2010), as well as a Director of Sony Corporation (2006-2007).
Joseph Mauriello (1944)
Year of Election or Appointment: 2008
Trustee
Mr. Mauriello also serves as Trustee of other Fidelity® funds. Prior to his retirement in January 2006, Mr. Mauriello served in numerous senior management positions including Deputy Chairman and Chief Operating Officer (2004-2005), and Vice Chairman of Financial Services (2002-2004) of KPMG LLP US (professional services, 1965-2005). Mr. Mauriello currently serves as a member of the Board of Directors of XL Group plc. (global insurance and re-insurance, 2006-present) and the Independent Directors Council (IDC) Governing Council (2015-present). Previously, Mr. Mauriello served as a Director of the Hamilton Funds of the Bank of New York (2006-2007) and of Arcadia Resources Inc. (health care services and products, 2007-2012).
Robert W. Selander (1950)
Year of Election or Appointment: 2011
Trustee
Mr. Selander also serves as Trustee of other Fidelity® funds. Mr. Selander serves as a Director of The Western Union Company (global money transfer, 2014-present) and a non-executive Chairman of Health Equity, Inc. (health savings custodian, 2015-present). Previously, Mr. Selander served as a Member of the Advisory Board of certain Fidelity® funds (2011), and Executive Vice Chairman (2010), Chief Executive Officer (2009-2010), and President and Chief Executive Officer (1997-2009) of Mastercard, Inc.
Cornelia M. Small (1944)
Year of Election or Appointment: 2005
Trustee
Ms. Small also serves as Trustee of other Fidelity® funds. Ms. Small is a member of the Board of Directors (2009-present) and Chair of the Investment Committee (2010-present) of the Teagle Foundation. Ms. Small also serves on the Investment Committee of the Berkshire Taconic Community Foundation (2008-present). Previously, Ms. Small served as Chairperson (2002-2008) and a member of the Investment Committee and Chairperson (2008-2012) and a member of the Board of Trustees of Smith College. In addition, Ms. Small served as Chief Investment Officer, Director of Global Equity Investments, and a member of the Board of Directors of Scudder, Stevens & Clark and Scudder Kemper Investments.
William S. Stavropoulos (1939)
Year of Election or Appointment: 2002
Trustee
Vice Chairman of the Independent Trustees
Mr. Stavropoulos also serves as Trustee of other Fidelity® funds. Mr. Stavropoulos serves as President and Founder of the Michigan Baseball Foundation, the Great Lakes Loons (2007-present). Mr. Stavropoulos is Chairman Emeritus of the Board of Directors of The Dow Chemical Company, where he previously served in numerous senior management positions, including President, CEO (1995-2000; 2002-2004), Chairman of the Executive Committee (2000-2006), and as a member of the Board of Directors (1990-2006). Currently, Mr. Stavropoulos is Chairman of the Board of Directors of Univar Inc. (global distributor of commodity and specialty chemicals), a Director of Teradata Corporation (data warehousing and technology solutions), and Maersk Inc. (industrial conglomerate), and a member of the Advisory Board for Metalmark Capital LLC (private equity investment, 2005-present). Mr. Stavropoulos is an operating advisor to Clayton, Dubilier & Rice, LLC (private equity investment). In addition, Mr. Stavropoulos is a member of the University of Notre Dame Advisory Council for the College of Science, a Trustee of the Rollin L. Gerstacker Foundation, and a Director of the Naples Philharmonic Center for the Arts. Previously, Mr. Stavropoulos served as a Director of Chemical Financial Corporation (bank holding company, 1993-2012) and Tyco International, Ltd. (multinational manufacturing and services, 2007-2012).
David M. Thomas (1949)
Year of Election or Appointment: 2008
Trustee
Mr. Thomas also serves as Trustee of other Fidelity® funds. Mr. Thomas serves as Non-Executive Chairman of the Board of Directors of Fortune Brands Home and Security (home and security products, 2011-present), as a member of the Board of Directors (2004-present) and Presiding Director (2013-present) of Interpublic Group of Companies, Inc. (marketing communication), and as a member of the Board of Trustees of the University of Florida (2013-present). Previously, Mr. Thomas served as Executive Chairman (2005-2006) and Chairman and Chief Executive Officer (2000-2005) of IMS Health, Inc. (pharmaceutical and healthcare information solutions), and a Director of Fortune Brands, Inc. (consumer products, 2000-2011).
+ The information includes the Trustee's principal occupation during the last five years and other information relating to the experience, attributes, and skills relevant to the Trustee's qualifications to serve as a Trustee, which led to the conclusion that the Trustee should serve as a Trustee for the fund.
Advisory Board Members and Officers:
Correspondence intended for an officer or Peter S. Lynch may be sent to Fidelity Investments, 245 Summer Street, Boston, Massachusetts 02210. Officers appear below in alphabetical order.
Name, Year of Birth; Principal Occupation
Peter S. Lynch (1944)
Year of Election or Appointment: 2003
Member of the Advisory Board
Mr. Lynch also serves as Member of the Advisory Board of other Fidelity® funds. Mr. Lynch is Vice Chairman and a Director of FMR (investment adviser firm) and FMR Co., Inc. (investment adviser firm). In addition, Mr. Lynch serves as a Trustee of Boston College and as the Chairman of the Inner-City Scholarship Fund. Previously, Mr. Lynch served on the Special Olympics International Board of Directors (1997-2006).
Marc R. Bryant (1966)
Year of Election or Appointment: 2015
Secretary and Chief Legal Officer (CLO)
Mr. Bryant also serves as Secretary and CLO of other funds. Mr. Bryant serves as CLO, Secretary, and Senior Vice President of Fidelity Management & Research Company (investment adviser firm, 2015-present) and FMR Co., Inc. (investment adviser firm, 2015-present); Secretary of Fidelity SelectCo, LLC (investment adviser firm, 2015-present) and Fidelity Investments Money Management, Inc. (investment adviser firm, 2015-present); and CLO of Fidelity Management & Research (Hong Kong) Limited and FMR Investment Management (U.K.) Limited (investment adviser firms, 2015-present) and Fidelity Management & Research (Japan) Limited (investment adviser firm, 2016-present). He is Senior Vice President and Deputy General Counsel of FMR LLC (diversified financial services company). Previously, Mr. Bryant served as Secretary and CLO of Fidelity Rutland Square Trust II (2010-2014) and Assistant Secretary of Fidelity's Fixed Income and Asset Allocation Funds (2013-2015). Prior to joining Fidelity Investments, Mr. Bryant served as a Senior Vice President and the Head of Global Retail Legal for AllianceBernstein L.P. (2006-2010), and as the General Counsel for ProFund Advisors LLC (2001-2006).
Jeffrey S. Christian (1961)
Year of Election or Appointment: 2016
Assistant Treasurer
Mr. Christian also serves as Assistant Treasurer of other funds. Mr. Christian is an employee of Fidelity Investments (2003-present).
William C. Coffey (1969)
Year of Election or Appointment: 2009
Assistant Secretary
Mr. Coffey also serves as Assistant Secretary of other funds. He is Senior Vice President and Deputy General Counsel of FMR LLC (diversified financial services company, 2010-present), and is an employee of Fidelity Investments. Previously, Mr. Coffey served as Vice President and Associate General Counsel of FMR LLC (2005-2009).
Jonathan Davis (1968)
Year of Election or Appointment: 2010
Assistant Treasurer
Mr. Davis also serves as Assistant Treasurer of other funds, and is an employee of Fidelity Investments. Previously, Mr. Davis served as Vice President and Associate General Counsel of FMR LLC (diversified financial services company, 2003-2010).
Adrien E. Deberghes (1967)
Year of Election or Appointment: 2016
Assistant Treasurer
Mr. Deberghes also serves as an officer of other funds. He serves as Executive Vice President of Fidelity Investments Money Management, Inc. (FIMM) (investment adviser firm, 2016-present) and is an employee of Fidelity Investments (2008-present). Prior to joining Fidelity Investments, Mr. Deberghes was Senior Vice President of Mutual Fund Administration at State Street Corporation (2007-2008), Senior Director of Mutual Fund Administration at Investors Bank & Trust (2005-2007), and Director of Finance for Dunkin' Brands (2000-2005). Previously, Mr. Deberghes served in other fund officer roles.
Stephanie J. Dorsey (1969)
Year of Election or Appointment: 2010
Assistant Treasurer
Ms. Dorsey also serves as an officer of other funds. She is an employee of Fidelity Investments (2008-present) and has served in other fund officer roles. Prior to joining Fidelity Investments, Ms. Dorsey served as Treasurer (2004-2008) of the JPMorgan Mutual Funds and Vice President (2004-2008) of JPMorgan Chase Bank.
Howard J. Galligan III (1966)
Year of Election or Appointment: 2014
Chief Financial Officer
Mr. Galligan also serves as Chief Financial Officer of other funds. Mr. Galligan serves as President of Fidelity Pricing and Cash Management Services (FPCMS) (2014-present) and as a Director of Strategic Advisers, Inc. (investment adviser firm, 2008-present). Previously, Mr. Galligan served as Chief Administrative Officer of Asset Management (2011-2014) and Chief Operating Officer and Senior Vice President of Investment Support for Strategic Advisers, Inc. (2003-2011).
Scott C. Goebel (1968)
Year of Election or Appointment: 2015
Vice President
Mr. Goebel serves as Vice President of other funds and is an employee of Fidelity Investments (2001-present). Mr. Goebel serves as Senior Vice President of Fidelity Management & Research Company (FMR) (investment adviser firm, 2016-present). Previously, Mr. Goebel served as Secretary of Fidelity SelectCo, LLC (investment adviser firm, 2013-2015), Fidelity Investments Money Management, Inc. (FIMM) (investment adviser firm, 2010-2015), and Fidelity Research and Analysis Company (FRAC) (investment adviser firm, 2010-2015); General Counsel, Secretary, and Senior Vice President of FMR (investment adviser firm, 2008-2015) and FMR Co., Inc. (investment adviser firm, 2008-2015); Assistant Secretary of Fidelity Management & Research (Japan) Limited (investment adviser firm, 2008-2015) and Fidelity Management & Research (U.K.) Inc. (investment adviser firm, 2008-2015); Chief Legal Officer (CLO) of Fidelity Management & Research (Hong Kong) Limited (investment adviser firm, 2008-2015); Secretary and CLO of certain Fidelity® funds (2008-2015); Assistant Secretary of FIMM (2008-2010), FRAC (2008-2010), and certain funds (2007-2008); and as Vice President and Secretary of Fidelity Distributors Corporation (FDC) (2005-2007).
Thomas C. Hense (1964)
Year of Election or Appointment: 2008, 2010, or 2015
Vice President
Mr. Hense serves as Vice President of Fidelity Advisor® Multi-Asset Income Fund (2015) and other funds (High Income (2008), Small Cap (2008), and Value (2010) funds), and is an employee of Fidelity Investments (1993-present). Previously, Mr. Hense served as a portfolio manager for Fidelity's Institutional Money Management Group (Pyramis) (2003-2008).
Brian B. Hogan (1964)
Year of Election or Appointment: 2009
Vice President
Mr. Hogan also serves as Trustee or Vice President of other funds. Mr. Hogan serves as a Director of FMR Investment Management (U.K.) Limited (investment adviser firm, 2015-present) and Fidelity SelectCo, LLC (investment adviser firm, 2014-present) and President of the Equity Division of FMR (investment adviser firm, 2009-present). Previously, Mr. Hogan served as Senior Vice President, Equity Research of FMR (2006-2009) and as a portfolio manager. Mr. Brian B. Hogan is not related to Mr. Colm A. Hogan.
Colm A. Hogan (1973)
Year of Election or Appointment: 2016
Deputy Treasurer
Mr. Hogan also serves as an officer of other funds. Mr. Hogan is an employee of Fidelity Investments (2005-present). Mr. Colm A. Hogan is not related to Mr. Brian B. Hogan.
Chris Maher (1972)
Year of Election or Appointment: 2013
Assistant Treasurer
Mr. Maher serves as Assistant Treasurer of other funds. Mr. Maher is Vice President of Valuation Oversight and is an employee of Fidelity Investments. Previously, Mr. Maher served as Vice President of Asset Management Compliance (2013), Vice President of the Program Management Group of FMR (investment adviser firm, 2010-2013), and Vice President of Valuation Oversight (2008-2010).
John F. Papandrea (1972)
Year of Election or Appointment: 2016
Anti-Money Laundering (AML) Officer
Mr. Papandrea also serves as AML Officer of other funds. Mr. Papandrea is Vice President of FMR LLC (diversified financial services company, 2008-present) and is an employee of Fidelity Investments (2005-present).
Kenneth B. Robins (1969)
Year of Election or Appointment: 2016
Chief Compliance Officer
Mr. Robins also serves as an officer of other funds. Mr. Robins serves as Compliance Officer of Fidelity Management & Research Company and FMR Co., Inc. (investment adviser firms, 2016-present) and is an employee of Fidelity Investments (2004-present). Previously, Mr. Robins served as Executive Vice President of Fidelity Investments Money Management, Inc. (investment adviser firm, 2013-2016) and served in other fund officer roles.
Stacie M. Smith (1974)
Year of Election or Appointment: 2016
President and Treasurer
Ms. Smith also serves as an officer of other funds. She is an employee of Fidelity Investments (2009-present) and has served in other fund officer roles. Prior to joining Fidelity Investments, Ms. Smith served as Senior Audit Manager of Ernst & Young LLP (1996-2009). Previously, Ms. Smith served as Deputy Treasurer of certain Fidelity® funds (2013-2016).
Renee Stagnone (1975)
Year of Election or Appointment: 2016
Assistant Treasurer
Ms. Stagnone also serves as an officer of other funds. Ms. Stagnone is an employee of Fidelity Investments (1997-present). Previously, Ms. Stagnone served as Deputy Treasurer of certain Fidelity® funds (2013-2016).
Shareholder Expense Example
As a shareholder of the Fund, you incur two types of costs: (1) transaction costs, including sales charges (loads) on purchase payments or redemption proceeds, redemption fees and (2) ongoing costs, including management fees, distribution and/or service (12b-1) fees and other Fund expenses. This Example is intended to help you understand your ongoing costs (in dollars) of investing in the Fund and to compare these costs with the ongoing costs of investing in other mutual funds.
The Example is based on an investment of $1,000 invested at the beginning of the period and held for the entire period (February 1, 2016 to July 31, 2016).
Actual Expenses
The first line of the accompanying table for each class of the Fund provides information about actual account values and actual expenses. You may use the information in this line, together with the amount you invested, to estimate the expenses that you paid over the period. Simply divide your account value by $1,000.00 (for example, an $8,600 account value divided by $1,000.00 = 8.6), then multiply the result by the number in the first line for a class of the Fund under the heading entitled "Expenses Paid During Period" to estimate the expenses you paid on your account during this period. A small balance maintenance fee of $12.00 that is charged once a year may apply for certain accounts with a value of less than $2,000. This fee is not included in the table below. If it was, the estimate of expenses you paid during the period would be higher, and your ending account value lower, by this amount. In addition, the Fund, as a shareholder in the underlying Fidelity Central Funds, will indirectly bear its pro-rata share of the fees and expenses incurred by the underlying Fidelity Central Funds. These fees and expenses are not included in the Fund's annualized expense ratio used to calculate the expense estimate in the table below.
Hypothetical Example for Comparison Purposes
The second line of the accompanying table for each class of the Fund provides information about hypothetical account values and hypothetical expenses based on a Class' actual expense ratio and an assumed rate of return of 5% per year before expenses, which is not the Class' actual return. The hypothetical account values and expenses may not be used to estimate the actual ending account balance or expenses you paid for the period. You may use this information to compare the ongoing costs of investing in the Fund and other funds. To do so, compare this 5% hypothetical example with the 5% hypothetical examples that appear in the shareholder reports of the other funds. A small balance maintenance fee of $12.00 that is charged once a year may apply for certain accounts with a value of less than $2,000. This fee is not included in the table below. If it was, the estimate of expenses you paid during the period would be higher, and your ending account value lower, by this amount. In addition, the Fund, as a shareholder in the underlying Fidelity Central Funds, will indirectly bear its pro-rata share of the fees and expenses incurred by the underlying Fidelity Central Funds. These fees and expenses are not included in the Fund's annualized expense ratio used to calculate the expense estimate in the table below.
Please note that the expenses shown in the table are meant to highlight your ongoing costs only and do not reflect any transaction costs. Therefore, the second line of the table is useful in comparing ongoing costs only, and will not help you determine the relative total costs of owning different funds. In addition, if these transactional costs were included, your costs would have been higher.
| | Annualized Expense Ratio-A | Beginning
Account Value
February 1, 2016 | Ending
Account Value
July 31, 2016 | Expenses Paid
During Period-B
February 1, 2016
to July 31, 2016 |
| Class A | 1.39% | | | |
| Actual | | $1,000.00 | $1,134.90 | $7.38 |
| Hypothetical-C | | $1,000.00 | $1,017.95 | $6.97 |
| Class T | 1.63% | | | |
| Actual | | $1,000.00 | $1,133.10 | $8.64 |
| Hypothetical-C | | $1,000.00 | $1,016.76 | $8.17 |
| Class C | 2.15% | | | |
| Actual | | $1,000.00 | $1,130.00 | $11.39 |
| Hypothetical-C | | $1,000.00 | $1,014.17 | $10.77 |
| Small Cap Value | 1.15% | | | |
| Actual | | $1,000.00 | $1,135.20 | $6.11 |
| Hypothetical-C | | $1,000.00 | $1,019.14 | $5.77 |
| Class I | 1.12% | | | |
| Actual | | $1,000.00 | $1,135.80 | $5.95 |
| Hypothetical-C | | $1,000.00 | $1,019.29 | $5.62 |
A Annualized expense ratio reflects expenses net of applicable fee waivers.
B Expenses are equal to each Class' annualized expense ratio, multiplied by the average account value over the period, multiplied by 182/366 (to reflect the one-half year period).
C 5% return per year before expenses
Distributions (Unaudited)
The Board of Trustees of Fidelity Small Cap Value Fund voted to pay to shareholders of record at the opening of business on record date, the following distributions per share derived from capital gains realized from sales of portfolio securities, and dividends derived from net investment income:
| | Pay Date | Record Date | Dividends | Capital Gains |
| | | | | |
| Class A | 09/12/16 | 09/09/16 | $0.017 | $1.070 |
| Class T | 09/12/16 | 09/09/16 | $0.000 | $1.070 |
| Class C | 09/12/16 | 09/09/16 | $0.000 | $1.070 |
| Fidelity Small Cap Value | 09/12/16 | 09/09/16 | $0.043 | $1.070 |
| Class I | 09/12/16 | 09/09/16 | $0.046 | $1.070 |
The fund hereby designates as a capital gain dividend with respect to the taxable year ended July 31, 2016, $246,151,748, or, if subsequently determined to be different, the net capital gain of such year.
Class A, Class T, Fidelity Small Cap Value Fund and Class I designate 100% of the dividends distributed in September and December during the fiscal year as qualifying for the dividends–received deduction for corporate shareholders.
Class A, Class T, Fidelity Small Cap Value Fund and Class I designate 100% of the dividends distributed in September and December during the fiscal year as amounts which may be taken into account as a dividend for purposes of the maximum rate under section 1(h)(11) of the Internal Revenue Code.
The fund will notify shareholders in January 2017 of amounts for use in preparing 2016 income tax returns.
Board Approval of Investment Advisory Contracts and Management Fees
Fidelity Small Cap Value Fund
Each year, the Board of Trustees, including the Independent Trustees (together, the Board), votes on the renewal of the management contract with Fidelity Management & Research Company (FMR) and the sub-advisory agreements (together, the Advisory Contracts) for the fund. The Board, assisted by the advice of fund counsel and Independent Trustees' counsel, requests and considers a broad range of information relevant to the renewal of the Advisory Contracts throughout the year.
The Board meets regularly and, at each of its meetings, covers an extensive agenda of topics and materials and considers factors that are relevant to its annual consideration of the renewal of the fund's Advisory Contracts, including the services and support provided to the fund and its shareholders. The Board has established various standing committees (Committees), each composed of and chaired by Independent Trustees with varying backgrounds, to which the Board has assigned specific subject matter responsibilities in order to enhance effective decision-making by the Board. The Board, acting directly and through its Committees, requests and receives information concerning the annual consideration of the renewal of the fund's Advisory Contracts. The Board also meets as needed to consider matters specifically related to the Board's annual consideration of the renewal of the Advisory Contracts. Members of the Board may also meet with trustees of other Fidelity funds through ad hoc joint committees to discuss certain matters relevant to all of the Fidelity funds.
At its July 2016 meeting, the Board unanimously determined to renew the fund's Advisory Contracts. In reaching its determination, the Board considered all factors it believed relevant, including (i) the nature, extent, and quality of the services to be provided to the fund and its shareholders (including the investment performance of the fund); (ii) the competitiveness of the fund's management fee and total expense ratio relative to peer funds; (iii) the total costs of the services to be provided by and the profits to be realized by Fidelity from its relationships with the fund; and (iv) the extent to which, if any, economies of scale exist and would be realized as the fund grows, and whether any economies of scale are appropriately shared with fund shareholders.
In considering whether to renew the Advisory Contracts for the fund, the Board reached a determination, with the assistance of fund counsel and Independent Trustees' counsel and through the exercise of its business judgment, that the renewal of the Advisory Contracts was in the best interests of the fund and its shareholders and that the compensation payable under the Advisory Contracts was fair and reasonable. The Board's decision to renew the Advisory Contracts was not based on any single factor, but rather was based on a comprehensive consideration of all the information provided to the Board at its meetings throughout the year. The Board, in reaching its determination to renew the Advisory Contracts, was aware that shareholders of the fund have a broad range of investment choices available to them, including a wide choice among funds offered by Fidelity's competitors, and that the fund's shareholders, who have the opportunity to review and weigh the disclosure provided by the fund in its prospectus and other public disclosures, have chosen to invest in this fund, which is part of the Fidelity family of funds.
Nature, Extent, and Quality of Services Provided. The Board considered Fidelity's staffing as it relates to the fund, including the backgrounds of investment personnel of Fidelity, and also considered the fund's investment objective, strategies, and related investment philosophy. The Independent Trustees also had discussions with senior management of Fidelity's investment operations and investment groups. The Board considered the structure of the investment personnel compensation program and whether this structure provides appropriate incentives to act in the best interests of the fund. Additionally, the Board considered the portfolio managers' investments, if any, in the funds that they manage.
Resources Dedicated to Investment Management and Support Services. The Board and the Fund Oversight and Research Committees reviewed the general qualifications and capabilities of Fidelity's investment staff, including its size, education, experience, and resources, as well as Fidelity's approach to recruiting, training, managing, and compensating investment personnel. The Board noted that Fidelity has continued to increase the resources devoted to non-U.S. offices, including expansion of Fidelity's global investment organization. The Board also noted that Fidelity's analysts have extensive resources, tools and capabilities that allow them to conduct sophisticated quantitative and fundamental analysis, as well as credit analysis of issuers, counterparties and guarantors. Further, the Board considered that Fidelity's investment professionals have sufficient access to global information and data so as to provide competitive investment results over time, and that those professionals also have access to sophisticated tools that permit them to assess portfolio construction and risk and performance attribution characteristics continuously, as well as to transmit new information and research conclusions rapidly around the world. Additionally, in its deliberations, the Board considered Fidelity's trading, risk management, compliance, and technology and operations capabilities and resources, which are integral parts of the investment management process.
Shareholder and Administrative Services. The Board considered (i) the nature, extent, quality, and cost of advisory, administrative, and shareholder services performed by FMR, the sub-advisers (together with FMR, the Investment Advisers), and their affiliates under the Advisory Contracts and under separate agreements covering transfer agency, pricing and bookkeeping, and securities lending services for the fund; (ii) the nature and extent of the supervision of third party service providers, principally custodians, subcustodians, and pricing vendors; and (iii) the resources devoted to, and the record of compliance with, the fund's compliance policies and procedures. The Board also reviewed the allocation of fund brokerage, including allocations to brokers affiliated with the Investment Advisers, the use of brokerage commissions to pay fund expenses, and the use of "soft" commission dollars to pay for research services.
The Board noted that the growth of fund assets over time across the complex allows Fidelity to reinvest in the development of services designed to enhance the value or convenience of the Fidelity funds as investment vehicles. These services include 24-hour access to account information and market information through telephone representatives and over the Internet, investor education materials and asset allocation tools, and the expanded availability of Fidelity Investor Centers.
In 2014, the Board formed an ad hoc Committee on Transfer Agency Fees to review the variety of transfer agency fee structures throughout the industry and Fidelity's competitive positioning with respect to industry participants.
Investment in a Large Fund Family. The Board considered the benefits to shareholders of investing in a Fidelity fund, including the benefits of investing in a fund that is part of a large family of funds offering a variety of investment disciplines and providing a large variety of mutual fund investor services. The Board noted that Fidelity had taken, or had made recommendations that resulted in the Fidelity funds taking, a number of actions over the previous year that benefited particular funds, including: (i) continuing to dedicate additional resources to investment research and to the support of the senior management team that oversees asset management; (ii) continuing efforts to enhance Fidelity's global research capabilities; (iii) launching new funds and making other enhancements to meet client needs; (iv) broadening eligibility requirements for certain lower-priced share classes of, and streamlining the fee structure for, certain existing equity index funds; (v) lowering expense caps for certain existing funds and classes to reduce expenses paid by shareholders; (vi) eliminating redemption fees for certain variable insurance product funds and classes; (vii) continuing to launch dedicated lower cost underlying funds to meet portfolio construction needs related to expanding underlying fund options for Fidelity funds of funds, specifically for the Freedom Fund product lines; (viii) launching a lower cost share class for use by the Freedom Index Fund product line; (ix) rationalizing product lines and gaining increased efficiencies through fund mergers and share class consolidations; (x) continuing to develop, acquire and implement systems and technology to improve services to the funds and shareholders, strengthen information security, and increase efficiency; (xi) implementing investment enhancements to further strengthen Fidelity's target date product line to increase investors' probability of success in achieving their goals; (xii) accelerating the conversion of all remaining Class B shares to Class A shares, which have a lower expense structure; and (xiii) implementing changes to Fidelity's money market fund product line in response to recent regulatory reforms.
Investment Performance. The Board considered whether the fund has operated in accordance with its investment objective, as well as its record of compliance with its investment restrictions and its performance history. The Board noted that there were portfolio management changes for the fund in August 2013 and January 2016.
The Board took into account discussions with representatives of the Investment Advisers about fund investment performance that occur at Board meetings throughout the year. In this regard the Board noted that as part of regularly scheduled fund reviews and other reports to the Board on fund performance, the Board considers annualized return information for the fund, for different time periods, measured against a securities market index ("benchmark index") and a peer group of funds with similar objectives ("peer group"), if any. In its evaluation of fund investment performance, the Board gave particular attention to information indicating changes in performance of certain Fidelity funds for specific time periods and discussed with the Investment Advisers the reasons for any overperformance or underperformance.
In addition to reviewing absolute and relative fund performance, the Independent Trustees periodically consider the appropriateness of fund performance metrics in evaluating the results achieved. In general, the Independent Trustees believe that fund performance should be evaluated based on net performance (after fees and expenses) of both the highest performing and lowest performing fund share classes, where applicable, compared to appropriate benchmark indices, over appropriate time periods that may include full market cycles, and compared to peer groups, as applicable, over the same periods, taking into account relevant factors including the following: general market conditions; issuer-specific information; and fund cash flows and other factors.
The Independent Trustees recognize that shareholders evaluate performance on a net basis over their own holding periods, for which one-, three-, and five-year periods are often used as a proxy. For this reason, the performance information reviewed by the Board also included net cumulative calendar year total return information for the fund and an appropriate benchmark index and peer group for the most recent one-, three-, and five-year periods, as shown below. Returns are shown compared to the 25th percentile (top of box, 75% beaten) and 75th percentile (bottom of box, 25% beaten) of the peer universe.
Fidelity Small Cap Value Fund
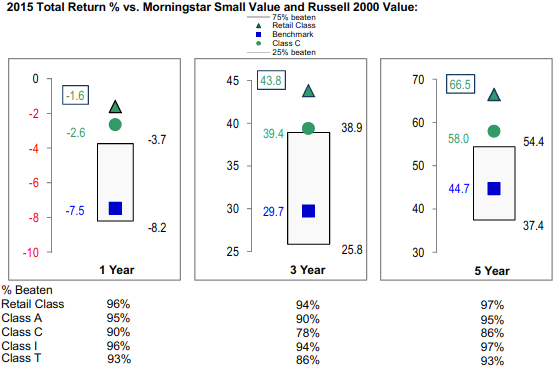
The Board also considered that the fund's management fee is subject to upward or downward adjustment depending upon whether, and to what extent, the fund's investment performance for the performance period exceeds, or is exceeded by, a securities index, thus leading to a performance adjustment for the same period. The Board noted that the performance adjustment provides FMR with a strong economic incentive to seek to achieve superior performance for the fund's shareholders and helps to more closely align the interests of FMR and the shareholders of the fund.
Based on its review, the Board concluded that the nature, extent, and quality of services provided to the fund under the Advisory Contracts should continue to benefit the shareholders of the fund.
Competitiveness of Management Fee and Total Expense Ratio. The Board considered the fund's management fee and total expense ratio compared to "mapped groups" of competitive funds and classes created for the purpose of facilitating the Trustees' competitive analysis of management fees and total expenses. Fidelity creates "mapped groups" by combining similar Broadridge investment objective categories that have comparable investment mandates. Combining Broadridge investment objective categories aids the Board's management fee and total expense ratio comparisons by broadening the competitive group used for comparison.
Management Fee. The Board considered two proprietary management fee comparisons for the 12-month periods shown in basis points (BP) in the chart below. The group of Broadridge funds used by the Board for management fee comparisons is referred to below as the "Total Mapped Group." The Total Mapped Group comparison focuses on a fund's standing in terms of gross management fees before expense reimbursements or caps, and without giving effect to the fund's performance adjustment, relative to the total universe of funds with comparable investment mandates, regardless of whether their management fee structures also are comparable. Funds with comparable investment mandates offer exposure to similar types of securities. Funds with comparable management fee structures have similar management fee contractual arrangements (
e.g., flat rate charged for advisory services, all-inclusive fee rate,
etc.). "TMG %" represents the percentage of funds in the Total Mapped Group that had management fees that were lower than the fund's. For example, a hypothetical TMG % of 20% would mean that 80% of the funds in the Total Mapped Group had higher, and 20% had lower, management fees than the fund. The fund's actual TMG %s and the number of funds in the Total Mapped Group are in the chart below. The "Asset-Size Peer Group" (ASPG) comparison focuses on a fund's standing relative to a subset of non-Fidelity funds within the Total Mapped Group that are similar in size and management fee structure without taking into account performance adjustments, if any. For example, if a fund is in the first quartile of the ASPG, the fund's management fee ranks in the least expensive or lowest 25% of funds in the ASPG. The ASPG represents at least 15% of the funds in the Total Mapped Group with comparable asset size and management fee structures, subject to a minimum of 50 funds (or all funds in the Total Mapped Group if fewer than 50). Additional information, such as the ASPG quartile in which the fund's management fee rate ranked and the impact of the fund's performance adjustment, is also included in the chart and considered by the Board.
Fidelity Small Cap Value Fund

The Board noted that the fund's management fee rate ranked below the median of its Total Mapped Group and below the median of its ASPG for 2015. The Board also noted the effect of the fund's performance adjustment, if any, on the fund's management fee ranking. The Board noted that the comparisons for 2015 reflect a revised Total Mapped Group that no longer includes funds with micro-cap objectives and that FMR believes this Total Mapped Group is a more appropriate comparison because the fund does not have a micro-cap objective.
The Board noted that, in 2014, the ad hoc Committee on Group Fee was formed by it and the boards of other Fidelity funds to conduct an in-depth review of the "group fee" component of the management fee of funds with such management fee structures. The Committee's focus included the mechanics of the group fee, the competitive landscape of group fee structures, Fidelity funds with no group fee component and investment products not included in group fee assets. The Board also considered that, for funds subject to the group fee, FMR agreed to voluntarily waive fees over a specified period of time in amounts designed to account for assets converted from certain funds to certain collective investment trusts.
The Board also noted that, in 2013, the ad hoc Committee on Management Fees was formed to conduct an in-depth review of the management fee rates of Fidelity's active equity mutual funds. The Committee focused on the following areas: (i) standard fee structures; (ii) research consumption and trading evolution; (iii) management fee competitiveness/profitability by category; and (iv) factors that drive institutional pricing.
Based on its review, the Board concluded that the fund's management fee is fair and reasonable in light of the services that the fund receives and the other factors considered.
Total Expense Ratio. In its review of each class's total expense ratio, the Board considered the fund's management fee rate as well as other fund or class expenses, as applicable, such as transfer agent fees, pricing and bookkeeping fees, fund-paid 12b-1 fees, and custodial, legal, and audit fees. The Board noted the impact of the fund's performance adjustment. The Board also noted that Fidelity may agree to waive fees and expenses from time to time, and the extent to which, if any, it has done so for the fund. As part of its review, the Board also considered the current and historical total expense ratios of each class of the fund compared to competitive fund median expenses. Each class of the fund is compared to those funds and classes in the Total Mapped Group (used by the Board for management fee comparisons) that have a similar sales load structure.
The Board noted that the total expense ratio of the retail class ranked below the competitive median for 2015 and the total expense ratio of each of Class A, Class T, Class C, and Class I ranked above the competitive median for 2015. The Board considered that, in general, various factors can affect total expense ratios. The Board noted that the total expense ratio of each of Class A, Class T, Class C, and Class I was above the competitive median because of a positive performance fee adjustment in 2015. The Board noted that the total expense ratio of Class T was also above the competitive median because of higher 12b-1 fees on Class T as compared to most competitor funds. Class T has a higher 12b-1 fee, but a lower front-end sales charge, than traditionally priced front-end sales charge classes. The Board considered that Class T is primarily sold load-waived in the retirement plan market where its 0.50% 12b-1 fee is comparable to competing no-load, higher 12b-1 fee classes designed specifically for retirement plans. The Board noted that the fund offers multiple classes, each of which has a different sales load and 12b-1 fee structure, and that the multiple structures are intended to offer a range of pricing options for the intermediary market. The Board also noted that the total expense ratios of the classes vary primarily by the level of their 12b-1 fees, although differences in transfer agent fees may also cause expenses to vary from class to class.
Fees Charged to Other Fidelity Clients. The Board also considered Fidelity fee structures and other information with respect to clients of Fidelity, such as other funds advised or subadvised by Fidelity, pension plan clients, and other institutional clients with similar mandates. The Board noted the findings of the 2013 ad hoc joint committee (created with the board of other Fidelity funds), which reviewed and compared Fidelity's institutional investment advisory business with its business of providing services to the Fidelity funds, including the differences in services provided, fees charged, and costs incurred, as well as competition in their respective marketplaces.
Based on its review of total expense ratios and fees charged to other Fidelity clients, the Board concluded that, although some classes were above the median of the universe presented for comparison, the total expense ratio of each class of the fund was reasonable in light of the services that the fund and its shareholders receive and the other factors considered.
Costs of the Services and Profitability. The Board considered the revenues earned and the expenses incurred by Fidelity in conducting the business of developing, marketing, distributing, managing, administering and servicing the fund and servicing the fund's shareholders. The Board also considered the level of Fidelity's profits in respect of all the Fidelity funds.
On an annual basis, Fidelity presents to the Board information about the profitability of its relationship with the fund. Fidelity calculates profitability information for each fund, as well as aggregate profitability information for groups of Fidelity funds and all Fidelity funds, using a series of detailed revenue and cost allocation methodologies which originate with the books and records of Fidelity on which Fidelity's audited financial statements are based. The Audit Committee of the Board reviews any significant changes from the prior year's methodologies.
PricewaterhouseCoopers LLP (PwC), independent registered public accounting firm and auditor to Fidelity and certain Fidelity funds, has been engaged annually by the Board as part of the Board's assessment of Fidelity's profitability analysis. PwC's engagement includes the review and assessment of the methodologies used by Fidelity in determining the revenues and expenses attributable to Fidelity's mutual fund business, and completion of agreed-upon procedures in respect of the mathematical accuracy of the fund profitability information and its conformity to established allocation methodologies. After considering PwC's reports issued under the engagement and information provided by Fidelity, the Board concluded that while other allocation methods may also be reasonable, Fidelity's profitability methodologies are reasonable in all material respects.
The Board also reviewed Fidelity's non-fund businesses and fall-out benefits related to the mutual fund business as well as cases where Fidelity's affiliates may benefit from or be related to the fund's business.
The Board considered the costs of the services provided by and the profits realized by Fidelity in connection with the operation of the fund and was satisfied that the profitability was not excessive.
Economies of Scale. The Board considered whether there have been economies of scale in respect of the management of the Fidelity funds, whether the Fidelity funds (including the fund) have appropriately benefited from any such economies of scale, and whether there is potential for realization of any further economies of scale. The Board considered the extent to which the fund will benefit from economies of scale as assets grow through increased services to the fund, through waivers or reimbursements, or through fee or expense ratio reductions. The Board also noted that in 2013, it and the boards of other Fidelity funds created an ad hoc committee (the Economies of Scale Committee) to analyze whether Fidelity attains economies of scale in respect of the management and servicing of the Fidelity funds, whether the Fidelity funds have appropriately benefited from such economies of scale, and whether there is potential for realization of any further economies of scale.
The Board recognized that the fund's management contract incorporates a "group fee" structure, which provides for lower group fee rates as total group assets increase, and for higher group fee rates as total group assets decrease (with "group assets" defined to include fund assets under FMR's management plus the assets of sector funds previously under FMR's management). FMR calculates the group fee rates based on a tiered asset "breakpoint" schedule that varies based on asset class. The Board considered that the group fee is designed to deliver the benefits of economies of scale to fund shareholders when total Fidelity fund assets increase, even if assets of any particular fund are unchanged or have declined, because some portion of Fidelity's costs are attributable to services provided to all Fidelity funds, and all funds benefit if those costs can be allocated among more assets. The Board also considered that although the fund is partially closed to new investors, it continues to incur investment management expenses, and marketing and distribution expenses related to the retention of existing shareholders and assets. The Board further noted that the fund may continue to realize benefits from the group fee structure, even though assets may not be expected to grow significantly at the fund level. The Board concluded that, given the group fee structure, fund shareholders will benefit from lower management fees as group assets increase at the fund complex level, regardless of whether Fidelity achieves any such economies of scale.
The Board concluded, taking into account the analysis of the Economies of Scale Committee, that economies of scale, if any, are being appropriately shared between fund shareholders and Fidelity.
Additional Information Requested by the Board. In order to develop fully the factual basis for consideration of the Fidelity funds' Advisory Contracts, the Board requested and received additional information on certain topics, including: (i) fund performance trends and Fidelity's long-term strategies for certain funds; (ii) the various share classes employed by Fidelity and the attributes of each class, together with similar information on the distribution and servicing payments made by Fidelity or the funds to third-party participants in the distribution channels; (iii) fund profitability, and fund performance in relation to fund profitability; (iv) the methodology with respect to evaluating competitive fund data and peer group classifications and fee comparisons; (v) annual fund profitability margins; (vi) the realization of fall-out benefits in and attribution of fall-out benefits to certain Fidelity business units; (vii) the appropriateness of certain funds' benchmarks; (viii) the rationalization for certain share classes and expenses; (ix) sub-advisory fee rates for comparable investment mandates; (x) product strategy for certain underperforming funds; and (xi) Fidelity's resources and strategy for cybersecurity.
Based on its evaluation of all of the conclusions noted above, and after considering all factors it believed relevant, the Board concluded that the advisory fee structures are fair and reasonable, and that the fund's Advisory Contracts should be renewed.
ASCV-ANN-0916
1.803734.111
Fidelity® Dividend Growth Fund
Annual Report July 31, 2016 |
|
Contents
To view a fund's proxy voting guidelines and proxy voting record for the 12-month period ended June 30, visit http://www.fidelity.com/proxyvotingresults or visit the Securities and Exchange Commission's (SEC) web site at http://www.sec.gov.
You may also call 1-800-544-8544 to request a free copy of the proxy voting guidelines.
Standard & Poor's, S&P and S&P 500 are registered service marks of The McGraw-Hill Companies, Inc. and have been licensed for use by Fidelity Distributors Corporation.
Other third-party marks appearing herein are the property of their respective owners.
All other marks appearing herein are registered or unregistered trademarks or service marks of FMR LLC or an affiliated company. © 2016 FMR LLC. All rights reserved.
This report and the financial statements contained herein are submitted for the general information of the shareholders of the Fund. This report is not authorized for distribution to prospective investors in the Fund unless preceded or accompanied by an effective prospectus.
A fund files its complete schedule of portfolio holdings with the SEC for the first and third quarters of each fiscal year on Form N-Q. Forms N-Q are available on the SEC’s web site at http://www.sec.gov. A fund's Forms N-Q may be reviewed and copied at the SEC’s Public Reference Room in Washington, DC. Information regarding the operation of the SEC's Public Reference Room may be obtained by calling 1-800-SEC-0330.
For a complete list of a fund's portfolio holdings, view the most recent holdings listing, semiannual report, or annual report on Fidelity's web site at http://www.fidelity.com, http://www.institutional.fidelity.com, or http://www.401k.com, as applicable.
NOT FDIC INSURED •MAY LOSE VALUE •NO BANK GUARANTEE
Neither the Fund nor Fidelity Distributors Corporation is a bank.
Performance: The Bottom Line
Average annual total return reflects the change in the value of an investment, assuming reinvestment of distributions from dividend income and capital gains (the profits earned upon the sale of securities that have grown in value, if any) and assuming a constant rate of performance each year. The hypothetical investment and the average annual total returns do not reflect the deduction of taxes that a shareholder would pay on fund distributions or the redemption of fund shares. During periods of reimbursement by Fidelity, a fund’s total return will be greater than it would be had the reimbursement not occurred. How a fund did yesterday is no guarantee of how it will do tomorrow.
Average Annual Total Returns
| For the periods ended July 31, 2016 | Past 1 year | Past 5 years | Past 10 years |
| Fidelity® Dividend Growth Fund | 0.26% | 10.17% | 6.92% |
$10,000 Over 10 Years
Let's say hypothetically that $10,000 was invested in Fidelity® Dividend Growth Fund, a class of the fund, on July 31, 2006.
The chart shows how the value of your investment would have changed, and also shows how the S&P 500® Index performed over the same period.

| Period Ending Values |
| $19,523 | Fidelity® Dividend Growth Fund |
| $21,089 | S&P 500® Index |
Management's Discussion of Fund Performance
Market Recap: U.S. equities gained modestly for the year ending July 31, 2016, overcoming persistent concern about global economic growth, uncertainty regarding U.S. monetary policy and the U.K.’s late-June vote to leave the European Union, dubbed Brexit. The S&P 500
® index rose 5.61%, with larger-cap, value-oriented stocks and defensive sectors shining brightest. Volatility peaked in the early weeks of 2016, as continued oil-price weakness and U.S.-dollar strength pushed the S&P 500
® to its worst January since 2009. Markets then rose beginning in February amid U.S. job gains, a broad rally in energy and materials markets, global economic stimulus and perceived softening of monetary policy by the U.S. Federal Reserve. The June 23 Brexit vote surprised markets and resulted in a sharp two-day decline for stocks, followed by a rebound as investor sentiment shifted and remained positive through July 31. For the year, dividend-rich telecom services (+26%), utilities (+23%) and consumer staples (+12%) led the way amid strong investor demand for yield. Industrials (+10%) and information technology (+10%) also outperformed, as did materials (+8%), despite a weak commodities environment overall. Conversely, a strong run for real estate stocks couldn’t keep financials (-4%) from losing ground, as low interest rates continued to squeeze bank profits.
Comments from Portfolio Manager Ramona Persaud: For the year, the fund’s share classes produced very modest gains, significantly underperforming the 5.61% result of the benchmark S&P 500
® index. Global growth remained slow and unsteady, and late in the period, investors were rewarded for owning more-defensive, higher-quality stocks, while paying little regard to valuation. This hurt the fund, which is focused on both quality and value. From a sector perspective, stock selection in consumer discretionary, consumer staples, materials and financials hampered results versus the benchmark. Our fairly large out-of-index stake in Teva Pharmaceutical Industries was the biggest relative detractor, returning -21% this period. Market fears regarding price deflation for generic drugs and delays in Teva's pending acquisition of Allergan's generics business held back the stock. Elsewhere, an overweighting in fertilizer manufacturer CF Industries Holdings detracted, as did a non-benchmark stake in European telecom and media company Altice. We sold CF Industries from the fund by period end. Conversely, successful positioning in energy and picks in health care were a slight plus. The fund’s largest individual contributor was ASAC II. The limited partnership is an investment vehicle led by video game publisher Activision Blizzard’s CEO and co-chairman. Shares of ASAC II and Activision turned in strong results amid a robust gaming cycle.
The views expressed above reflect those of the portfolio manager(s) only through the end of the period as stated on the cover of this report and do not necessarily represent the views of Fidelity or any other person in the Fidelity organization. Any such views are subject to change at any time based upon market or other conditions and Fidelity disclaims any responsibility to update such views. These views may not be relied on as investment advice and, because investment decisions for a Fidelity fund are based on numerous factors, may not be relied on as an indication of trading intent on behalf of any Fidelity fund.
Investment Summary (Unaudited)
Top Ten Stocks as of July 31, 2016
| | % of fund's net assets | % of fund's net assets 6 months ago |
| Apple, Inc. | 4.3 | 4.2 |
| Johnson & Johnson | 3.3 | 3.4 |
| Microsoft Corp. | 3.1 | 3.5 |
| General Electric Co. | 2.6 | 2.9 |
| Alphabet, Inc. Class C | 2.6 | 2.4 |
| Exxon Mobil Corp. | 2.5 | 2.5 |
| Chevron Corp. | 2.2 | 2.1 |
| AT&T, Inc. | 2.2 | 1.9 |
| JPMorgan Chase & Co. | 2.1 | 2.5 |
| Wells Fargo & Co. | 2.1 | 2.5 |
| | 27.0 | |
Top Five Market Sectors as of July 31, 2016
| | % of fund's net assets | % of fund's net assets 6 months ago |
| Information Technology | 21.6 | 23.0 |
| Financials | 15.3 | 15.7 |
| Consumer Staples | 14.0 | 14.9 |
| Health Care | 12.2 | 13.4 |
| Industrials | 9.1 | 9.6 |
Asset Allocation (% of fund's net assets)
| As of July 31, 2016* |
| | Stocks | 94.0% |
| | Convertible Securities | 0.1% |
| | Short-Term Investments and Net Other Assets (Liabilities) | 5.9% |

* Foreign investments - 12.8%
| As of January 31, 2016* |
| | Stocks | 96.7% |
| | Convertible Securities | 0.1% |
| | Short-Term Investments and Net Other Assets (Liabilities) | 3.2% |

* Foreign investments - 15.9%
Investments July 31, 2016
Showing Percentage of Net Assets
| Common Stocks - 94.0% | | | |
| | | Shares | Value (000s) |
| CONSUMER DISCRETIONARY - 8.5% | | | |
| Diversified Consumer Services - 0.6% | | | |
| H&R Block, Inc. | | 1,609,650 | $38,294 |
| ServiceMaster Global Holdings, Inc. (a) | | 208,000 | 7,869 |
| | | | 46,163 |
| Hotels, Restaurants & Leisure - 2.2% | | | |
| Las Vegas Sands Corp. | | 717,200 | 36,326 |
| McDonald's Corp. | | 537,600 | 63,249 |
| Wyndham Worldwide Corp. | | 992,291 | 70,473 |
| | | | 170,048 |
| Internet & Catalog Retail - 0.1% | | | |
| Liberty Interactive Corp. QVC Group Series A (a) | | 264,900 | 7,102 |
| Leisure Products - 0.1% | | | |
| Vista Outdoor, Inc. (a) | | 153,900 | 7,703 |
| Media - 1.6% | | | |
| Altice NV Class A (a) | | 631,339 | 9,370 |
| Comcast Corp. Class A | | 1,650,996 | 111,029 |
| | | | 120,399 |
| Multiline Retail - 1.3% | | | |
| Dillard's, Inc. Class A | | 162,100 | 10,971 |
| Target Corp. | | 1,206,500 | 90,886 |
| | | | 101,857 |
| Specialty Retail - 2.3% | | | |
| AutoZone, Inc. (a) | | 79,200 | 64,466 |
| Foot Locker, Inc. | | 1,077,879 | 64,263 |
| L Brands, Inc. | | 311,700 | 23,035 |
| Ross Stores, Inc. | | 309,200 | 19,118 |
| | | | 170,882 |
| Textiles, Apparel & Luxury Goods - 0.3% | | | |
| VF Corp. | | 334,700 | 20,895 |
|
| TOTAL CONSUMER DISCRETIONARY | | | 645,049 |
|
| CONSUMER STAPLES - 14.0% | | | |
| Beverages - 5.7% | | | |
| Constellation Brands, Inc. Class A (sub. vtg.) | | 438,200 | 72,141 |
| Dr. Pepper Snapple Group, Inc. | | 609,208 | 60,013 |
| Molson Coors Brewing Co. Class B | | 369,300 | 37,728 |
| PepsiCo, Inc. | | 1,233,600 | 134,364 |
| The Coca-Cola Co. | | 2,936,038 | 128,099 |
| | | | 432,345 |
| Food & Staples Retailing - 3.4% | | | |
| CVS Health Corp. | | 1,344,200 | 124,634 |
| Kroger Co. | | 840,418 | 28,734 |
| Rami Levi Chain Stores Hashikma Marketing 2006 Ltd. | | 557,501 | 21,580 |
| Rite Aid Corp. (a) | | 662,300 | 4,636 |
| Walgreens Boots Alliance, Inc. | | 920,436 | 72,945 |
| | | | 252,529 |
| Food Products - 0.6% | | | |
| Greencore Group PLC | | 7,318,277 | 31,729 |
| Hilton Food Group PLC | | 1,951,505 | 15,419 |
| | | | 47,148 |
| Household Products - 2.1% | | | |
| Procter & Gamble Co. | | 1,812,600 | 155,140 |
| Tobacco - 2.2% | | | |
| British American Tobacco PLC (United Kingdom) | | 737,803 | 47,090 |
| Imperial Tobacco Group PLC | | 689,702 | 36,361 |
| Reynolds American, Inc. | | 1,638,300 | 82,013 |
| | | | 165,464 |
|
| TOTAL CONSUMER STAPLES | | | 1,052,626 |
|
| ENERGY - 7.7% | | | |
| Energy Equipment & Services - 0.3% | | | |
| Baker Hughes, Inc. | | 441,600 | 21,122 |
| Oil, Gas & Consumable Fuels - 7.4% | | | |
| Chevron Corp. | | 1,640,800 | 168,149 |
| ConocoPhillips Co. | | 966,300 | 39,444 |
| Exxon Mobil Corp. | | 2,107,097 | 187,426 |
| Imperial Oil Ltd. | | 1,899,100 | 58,428 |
| Kinder Morgan, Inc. | | 1,191,500 | 24,223 |
| Northern Oil & Gas, Inc. (a)(b) | | 1,037,290 | 4,108 |
| PrairieSky Royalty Ltd. (b) | | 971,100 | 18,899 |
| Suncor Energy, Inc. | | 2,209,100 | 59,455 |
| | | | 560,132 |
|
| TOTAL ENERGY | | | 581,254 |
|
| FINANCIALS - 15.3% | | | |
| Banks - 9.8% | | | |
| Bank of America Corp. | | 8,479,217 | 122,864 |
| Citigroup, Inc. | | 2,158,161 | 94,549 |
| JPMorgan Chase & Co. | | 2,531,435 | 161,936 |
| PacWest Bancorp | | 1,236,200 | 51,117 |
| SunTrust Banks, Inc. | | 1,238,400 | 52,372 |
| U.S. Bancorp | | 2,318,369 | 97,766 |
| Wells Fargo & Co. | | 3,251,193 | 155,960 |
| | | | 736,564 |
| Capital Markets - 0.5% | | | |
| Diamond Hill Investment Group, Inc. | | 77,538 | 14,809 |
| Franklin Resources, Inc. | | 646,900 | 23,411 |
| | | | 38,220 |
| Consumer Finance - 0.0% | | | |
| Imperial Holdings, Inc. warrants 4/11/19 (a) | | 48,012 | 2 |
| Diversified Financial Services - 2.8% | | | |
| Berkshire Hathaway, Inc. Class B (a) | | 494,600 | 71,356 |
| McGraw Hill Financial, Inc. | | 768,527 | 93,914 |
| MSCI, Inc. Class A | | 536,900 | 46,195 |
| | | | 211,465 |
| Insurance - 1.3% | | | |
| Chubb Ltd. | | 632,000 | 79,164 |
| MetLife, Inc. | | 537,200 | 22,960 |
| | | | 102,124 |
| Real Estate Investment Trusts - 0.9% | | | |
| American Tower Corp. | | 576,800 | 66,776 |
|
| TOTAL FINANCIALS | | | 1,155,151 |
|
| HEALTH CARE - 12.2% | | | |
| Biotechnology - 2.0% | | | |
| AbbVie, Inc. | | 740,700 | 49,057 |
| Amgen, Inc. | | 579,010 | 99,607 |
| Gilead Sciences, Inc. | | 39,700 | 3,155 |
| United Therapeutics Corp. (a) | | 8,800 | 1,065 |
| | | | 152,884 |
| Health Care Equipment & Supplies - 2.8% | | | |
| Danaher Corp. | | 1,275,892 | 103,909 |
| Medtronic PLC | | 1,228,603 | 107,662 |
| | | | 211,571 |
| Health Care Providers & Services - 0.6% | | | |
| HealthSouth Corp. warrants 1/17/17 (a) | | 12,959 | 44 |
| McKesson Corp. | | 230,858 | 44,916 |
| | | | 44,960 |
| Health Care Technology - 0.3% | | | |
| CompuGroup Medical AG | | 552,022 | 23,835 |
| Pharmaceuticals - 6.5% | | | |
| Allergan PLC (a) | | 257,000 | 65,008 |
| Astellas Pharma, Inc. | | 1,933,100 | 32,209 |
| GlaxoSmithKline PLC | | 527,400 | 11,778 |
| Johnson & Johnson | | 1,999,343 | 250,378 |
| Sanofi SA sponsored ADR | | 912,600 | 38,904 |
| Teva Pharmaceutical Industries Ltd. sponsored ADR | | 1,617,200 | 86,520 |
| | | | 484,797 |
|
| TOTAL HEALTH CARE | | | 918,047 |
|
| INDUSTRIALS - 9.1% | | | |
| Aerospace & Defense - 3.2% | | | |
| BWX Technologies, Inc. | | 1,156,800 | 42,582 |
| General Dynamics Corp. | | 304,700 | 44,757 |
| Honeywell International, Inc. | | 419,600 | 48,812 |
| The Boeing Co. | | 276,000 | 36,890 |
| United Technologies Corp. | | 662,500 | 71,318 |
| | | | 244,359 |
| Air Freight & Logistics - 0.2% | | | |
| C.H. Robinson Worldwide, Inc. | | 230,000 | 16,013 |
| Commercial Services & Supplies - 0.2% | | | |
| Deluxe Corp. | | 238,500 | 16,120 |
| Construction & Engineering - 0.1% | | | |
| Astaldi SpA | | 1,100,200 | 4,812 |
| Electrical Equipment - 1.2% | | | |
| AMETEK, Inc. | | 1,240,200 | 58,327 |
| Fortive Corp. (a) | | 637,946 | 30,755 |
| | | | 89,082 |
| Industrial Conglomerates - 4.0% | | | |
| General Electric Co. | | 6,189,700 | 192,747 |
| Roper Technologies, Inc. | | 617,144 | 105,137 |
| | | | 297,884 |
| Machinery - 0.2% | | | |
| Wabtec Corp. | | 240,100 | 16,447 |
|
| TOTAL INDUSTRIALS | | | 684,717 |
|
| INFORMATION TECHNOLOGY - 21.6% | | | |
| Communications Equipment - 1.8% | | | |
| Cisco Systems, Inc. | | 4,458,986 | 136,133 |
| Internet Software & Services - 2.6% | | | |
| Alphabet, Inc. Class C (a) | | 249,706 | 191,971 |
| IT Services - 3.8% | | | |
| Accenture PLC Class A | | 1,067,500 | 120,425 |
| ASAC II LP (a)(c) | | 2,514,134 | 422 |
| Fidelity National Information Services, Inc. | | 411,850 | 32,754 |
| IBM Corp. | | 498,100 | 80,005 |
| Sabre Corp. | | 264,900 | 7,722 |
| Total System Services, Inc. | | 802,900 | 40,884 |
| | | | 282,212 |
| Semiconductors & Semiconductor Equipment - 1.0% | | | |
| Qualcomm, Inc. | | 1,229,483 | 76,941 |
| Software - 6.6% | | | |
| Activision Blizzard, Inc. | | 3,412,922 | 137,063 |
| Micro Focus International PLC | | 1,907,363 | 48,870 |
| Microsoft Corp. | | 4,076,216 | 231,040 |
| Oracle Corp. | | 1,989,760 | 81,660 |
| | | | 498,633 |
| Technology Hardware, Storage & Peripherals - 5.8% | | | |
| Apple, Inc. | | 3,127,618 | 325,929 |
| EMC Corp. | | 4,023,500 | 113,785 |
| | | | 439,714 |
|
| TOTAL INFORMATION TECHNOLOGY | | | 1,625,604 |
|
| MATERIALS - 3.4% | | | |
| Chemicals - 3.0% | | | |
| E.I. du Pont de Nemours & Co. | | 1,163,900 | 80,507 |
| LyondellBasell Industries NV Class A | | 709,500 | 53,397 |
| Monsanto Co. | | 331,200 | 35,362 |
| The Dow Chemical Co. | | 750,800 | 40,295 |
| W.R. Grace & Co. | | 194,300 | 14,547 |
| | | | 224,108 |
| Containers & Packaging - 0.4% | | | |
| Ball Corp. | | 488,100 | 34,494 |
|
| TOTAL MATERIALS | | | 258,602 |
|
| TELECOMMUNICATION SERVICES - 2.2% | | | |
| Diversified Telecommunication Services - 2.2% | | | |
| AT&T, Inc. | | 3,831,300 | 165,857 |
| TOTAL COMMON STOCKS | | | |
| (Cost $5,669,302) | | | 7,086,907 |
| | | Principal Amount (000s) | Value (000s) |
|
| Convertible Bonds - 0.1% | | | |
| ENERGY - 0.1% | | | |
| Oil, Gas & Consumable Fuels - 0.1% | | | |
Amyris, Inc. 3% 2/27/17
(Cost $7,356) | | 7,356 | 7,035 |
| | | Shares | Value (000s) |
|
| Money Market Funds - 6.1% | | | |
| Fidelity Cash Central Fund, 0.42% (d) | | 449,185,364 | 449,185 |
| Fidelity Securities Lending Cash Central Fund, 0.45% (d)(e) | | 11,379,095 | 11,379 |
| TOTAL MONEY MARKET FUNDS | | | |
| (Cost $460,564) | | | 460,564 |
| TOTAL INVESTMENT PORTFOLIO - 100.2% | | | |
| (Cost $6,137,222) | | | 7,554,506 |
| NET OTHER ASSETS (LIABILITIES) - (0.2)% | | | (15,214) |
| NET ASSETS - 100% | | | $7,539,292 |
Legend
(a) Non-income producing
(b) Security or a portion of the security is on loan at period end.
(c) Restricted securities - Investment in securities not registered under the Securities Act of 1933 (excluding 144A issues). At the end of the period, the value of restricted securities (excluding 144A issues) amounted to $422,000 or 0.0% of net assets.
(d) Affiliated fund that is generally available only to investment companies and other accounts managed by Fidelity Investments. The rate quoted is the annualized seven-day yield of the fund at period end. A complete unaudited listing of the fund's holdings as of its most recent quarter end is available upon request. In addition, each Fidelity Central Fund's financial statements, which are not covered by the Fund's Report of Independent Registered Public Accounting Firm, are available on the SEC's website or upon request.
(e) Investment made with cash collateral received from securities on loan.
Additional information on each restricted holding is as follows:
| Security | Acquisition Date | Acquisition Cost (000s) |
| ASAC II LP | 10/10/13 | $25,141 |
Affiliated Central Funds
Information regarding fiscal year to date income earned by the Fund from investments in Fidelity Central Funds is as follows:
| Fund | Income earned |
| | (Amounts in thousands) |
| Fidelity Cash Central Fund | $781 |
| Fidelity Securities Lending Cash Central Fund | 292 |
| Total | $1,073 |
Investment Valuation
The following is a summary of the inputs used, as of July 31, 2016, involving the Fund's assets and liabilities carried at fair value. The inputs or methodology used for valuing securities may not be an indication of the risk associated with investing in those securities. For more information on valuation inputs, and their aggregation into the levels used below, please refer to the Investment Valuation section in the accompanying Notes to Financial Statements.
| | Valuation Inputs at Reporting Date: |
| Description | Total | Level 1 | Level 2 | Level 3 |
| (Amounts in thousands) | | | | |
| Investments in Securities: | | | | |
| Equities: | | | | |
| Consumer Discretionary | $645,049 | $645,049 | $-- | $-- |
| Consumer Staples | 1,052,626 | 1,005,536 | 47,090 | -- |
| Energy | 581,254 | 581,254 | -- | -- |
| Financials | 1,155,151 | 1,155,149 | 2 | -- |
| Health Care | 918,047 | 874,060 | 43,987 | -- |
| Industrials | 684,717 | 684,717 | -- | -- |
| Information Technology | 1,625,604 | 1,625,182 | -- | 422 |
| Materials | 258,602 | 258,602 | -- | -- |
| Telecommunication Services | 165,857 | 165,857 | -- | -- |
| Corporate Bonds | 7,035 | -- | 7,035 | -- |
| Money Market Funds | 460,564 | 460,564 | -- | -- |
| Total Investments in Securities: | $7,554,506 | $7,455,970 | $98,114 | $422 |
Other Information
Distribution of investments by country or territory of incorporation, as a percentage of Total Net Assets, is as follows (Unaudited):
| United States of America | 87.2% |
| Ireland | 4.3% |
| United Kingdom | 2.1% |
| Canada | 1.8% |
| Israel | 1.5% |
| Switzerland | 1.0% |
| Others (Individually Less Than 1%) | 2.1% |
| | 100.0% |
See accompanying notes which are an integral part of the financial statements.
Financial Statements
Statement of Assets and Liabilities
| Amounts in thousands (except per-share amounts) | | July 31, 2016 |
| Assets | | |
Investment in securities, at value (including securities loaned of $11,104) — See accompanying schedule:
Unaffiliated issuers (cost $5,676,658) | $7,093,942 | |
| Fidelity Central Funds (cost $460,564) | 460,564 | |
| Total Investments (cost $6,137,222) | | $7,554,506 |
| Receivable for fund shares sold | | 2,446 |
| Dividends receivable | | 6,673 |
| Interest receivable | | 94 |
| Distributions receivable from Fidelity Central Funds | | 140 |
| Other receivables | | 501 |
| Total assets | | 7,564,360 |
| Liabilities | | |
| Payable for investments purchased | $4,104 | |
| Payable for fund shares redeemed | 5,823 | |
| Accrued management fee | 2,269 | |
| Other affiliated payables | 951 | |
| Other payables and accrued expenses | 542 | |
| Collateral on securities loaned, at value | 11,379 | |
| Total liabilities | | 25,068 |
| Net Assets | | $7,539,292 |
| Net Assets consist of: | | |
| Paid in capital | | $6,189,409 |
| Undistributed net investment income | | 64,469 |
| Accumulated undistributed net realized gain (loss) on investments and foreign currency transactions | | (131,844) |
| Net unrealized appreciation (depreciation) on investments and assets and liabilities in foreign currencies | | 1,417,258 |
| Net Assets | | $7,539,292 |
| Dividend Growth: | | |
| Net Asset Value, offering price and redemption price per share ($5,848,558 ÷ 185,589 shares) | | $31.51 |
| Class K: | | |
| Net Asset Value, offering price and redemption price per share ($1,690,734 ÷ 53,675 shares) | | $31.50 |
See accompanying notes which are an integral part of the financial statements.
Statement of Operations
| Amounts in thousands | | Year ended July 31, 2016 |
| Investment Income | | |
| Dividends | | $165,431 |
| Interest | | 221 |
| Income from Fidelity Central Funds | | 1,073 |
| Total income | | 166,725 |
| Expenses | | |
| Management fee | | |
| Basic fee | $41,571 | |
| Performance adjustment | (9,103) | |
| Transfer agent fees | 10,524 | |
| Accounting and security lending fees | 1,195 | |
| Custodian fees and expenses | 114 | |
| Independent trustees' fees and expenses | 34 | |
| Registration fees | 62 | |
| Audit | 85 | |
| Legal | 30 | |
| Miscellaneous | 62 | |
| Total expenses before reductions | 44,574 | |
| Expense reductions | (180) | 44,394 |
| Net investment income (loss) | | 122,331 |
| Realized and Unrealized Gain (Loss) | | |
| Net realized gain (loss) on: | | |
| Investment securities: | | |
| Unaffiliated issuers | (82,793) | |
| Foreign currency transactions | (34) | |
| Total net realized gain (loss) | | (82,827) |
Change in net unrealized appreciation (depreciation) on:
Investment securities | (61,631) | |
| Assets and liabilities in foreign currencies | (6) | |
| Total change in net unrealized appreciation (depreciation) | | (61,637) |
| Net gain (loss) | | (144,464) |
| Net increase (decrease) in net assets resulting from operations | | $(22,133) |
See accompanying notes which are an integral part of the financial statements.
Statement of Changes in Net Assets
| Amounts in thousands | Year ended July 31, 2016 | Year ended July 31, 2015 |
| Increase (Decrease) in Net Assets | | |
| Operations | | |
| Net investment income (loss) | $122,331 | $125,774 |
| Net realized gain (loss) | (82,827) | 767,929 |
| Change in net unrealized appreciation (depreciation) | (61,637) | (102,174) |
| Net increase (decrease) in net assets resulting from operations | (22,133) | 791,529 |
| Distributions to shareholders from net investment income | (116,882) | (124,133) |
| Distributions to shareholders from net realized gain | (571,365) | (1,267,766) |
| Total distributions | (688,247) | (1,391,899) |
| Share transactions - net increase (decrease) | (166,713) | 479,167 |
| Total increase (decrease) in net assets | (877,093) | (121,203) |
| Net Assets | | |
| Beginning of period | 8,416,385 | 8,537,588 |
| End of period | $7,539,292 | $8,416,385 |
| Other Information | | |
| Undistributed net investment income end of period | $64,469 | $65,329 |
See accompanying notes which are an integral part of the financial statements.
Financial Highlights — Fidelity Dividend Growth Fund
| Years ended July 31, | 2016 | 2015 | 2014 | 2013 | 2012 |
| Selected Per–Share Data | | | | | |
| Net asset value, beginning of period | $34.46 | $37.27 | $35.33 | $28.61 | $28.96 |
| Income from Investment Operations | | | | | |
| Net investment income (loss)A | .48 | .49 | .56 | .40 | .20 |
| Net realized and unrealized gain (loss) | (.61)B | 2.71 | 4.98 | 7.12 | (.41) |
| Total from investment operations | (.13) | 3.20 | 5.54 | 7.52 | (.21) |
| Distributions from net investment income | (.47) | (.51) | (.37) | (.30) | (.12) |
| Distributions from net realized gain | (2.36) | (5.49) | (3.23) | (.50) | (.02) |
| Total distributions | (2.82)C | (6.01)D | (3.60) | (.80) | (.14) |
| Net asset value, end of period | $31.51 | $34.46 | $37.27 | $35.33 | $28.61 |
| Total ReturnB,E | .26%B | 9.54% | 17.30% | 26.83% | (.67)% |
| Ratios to Average Net AssetsF,G | | | | | |
| Expenses before reductions | .62% | .69% | .56% | .63% | .91% |
| Expenses net of fee waivers, if any | .61% | .68% | .56% | .63% | .91% |
| Expenses net of all reductions | .61% | .68% | .56% | .62% | .91% |
| Net investment income (loss) | 1.59% | 1.43% | 1.58% | 1.26% | .75% |
| Supplemental Data | | | | | |
| Net assets, end of period (in millions) | $5,849 | $6,474 | $6,481 | $6,633 | $5,905 |
| Portfolio turnover rateH | 30% | 64% | 99% | 69% | 63%I |
A Calculated based on average shares outstanding during the period.
B Net realized and unrealized gain (loss) per share reflects proceeds received from litigation which amounted to $.01 per share. Excluding these litigation proceeds, the total return would have been .22%
C Total distributions of $2.82 per share is comprised of distributions from net investment income of $.465 and distributions from net realized gain of $2.358 per share.
D Total distributions of $6.01 per share is comprised of distributions from net investment income of $.512 and distributions from net realized gain of $5.493 per share.
E Total returns would have been lower if certain expenses had not been reduced during the applicable periods shown.
F Fees and expenses of any underlying Fidelity Central Funds are not included in the Fund's expense ratio. The Fund indirectly bears its proportionate share of the expenses of any underlying Fidelity Central Funds.
G Expense ratios reflect operating expenses of the class. Expenses before reductions do not reflect amounts reimbursed by the investment adviser or reductions from brokerage service arrangements or reductions from other expense offset arrangements and do not represent the amount paid by the class during periods when reimbursements or reductions occur. Expenses net of fee waivers reflect expenses after reimbursement by the investment adviser but prior to reductions from brokerage service arrangements or other expense offset arrangements. Expenses net of all reductions represent the net expenses paid by the class.
H Amount does not include the portfolio activity of any underlying Fidelity Central Funds.
I Portfolio turnover rate excludes securities received or delivered in-kind.
See accompanying notes which are an integral part of the financial statements.
Financial Highlights — Fidelity Dividend Growth Fund Class K
| Years ended July 31, | 2016 | 2015 | 2014 | 2013 | 2012 |
| Selected Per–Share Data | | | | | |
| Net asset value, beginning of period | $34.45 | $37.27 | $35.34 | $28.62 | $28.98 |
| Income from Investment Operations | | | | | |
| Net investment income (loss)A | .52 | .53 | .60 | .45 | .25 |
| Net realized and unrealized gain (loss) | (.61)B | 2.70 | 4.97 | 7.12 | (.43) |
| Total from investment operations | (.09) | 3.23 | 5.57 | 7.57 | (.18) |
| Distributions from net investment income | (.50) | (.56) | (.42) | (.35) | (.17) |
| Distributions from net realized gain | (2.36) | (5.49) | (3.23) | (.50) | (.02) |
| Total distributions | (2.86) | (6.05) | (3.64)C | (.85) | (.18)D |
| Net asset value, end of period | $31.50 | $34.45 | $37.27 | $35.34 | $28.62 |
| Total ReturnB,E | .39%B | 9.65% | 17.44% | 27.04% | (.52)% |
| Ratios to Average Net AssetsF,G | | | | | |
| Expenses before reductions | .50% | .57% | .44% | .48% | .75% |
| Expenses net of fee waivers, if any | .50% | .57% | .43% | .48% | .75% |
| Expenses net of all reductions | .49% | .57% | .43% | .47% | .75% |
| Net investment income (loss) | 1.71% | 1.54% | 1.70% | 1.41% | .91% |
| Supplemental Data | | | | | |
| Net assets, end of period (in millions) | $1,691 | $1,942 | $2,057 | $1,639 | $1,221 |
| Portfolio turnover rateH | 30% | 64% | 99% | 69% | 63%I |
A Calculated based on average shares outstanding during the period.
B Net realized and unrealized gain (loss) per share reflects proceeds received from litigation which amounted to $.01 per share. Excluding these litigation proceeds, the total return would have been .35%
C Total distributions of $3.64 per share is comprised of distributions from net investment income of $.419 and distributions from net realized gain of $3.225 per share.
D Total distributions of $.18 per share is comprised of distributions from net investment income of $.169 and distributions from net realized gain of $.015 per share.
E Total returns would have been lower if certain expenses had not been reduced during the applicable periods shown.
F Fees and expenses of any underlying Fidelity Central Funds are not included in the Fund's expense ratio. The Fund indirectly bears its proportionate share of the expenses of any underlying Fidelity Central Funds.
G Expense ratios reflect operating expenses of the class. Expenses before reductions do not reflect amounts reimbursed by the investment adviser or reductions from brokerage service arrangements or reductions from other expense offset arrangements and do not represent the amount paid by the class during periods when reimbursements or reductions occur. Expenses net of fee waivers reflect expenses after reimbursement by the investment adviser but prior to reductions from brokerage service arrangements or other expense offset arrangements. Expenses net of all reductions represent the net expenses paid by the class.
H Amount does not include the portfolio activity of any underlying Fidelity Central Funds.
I Portfolio turnover rate excludes securities received or delivered in-kind.
See accompanying notes which are an integral part of the financial statements.
Notes to Financial Statements
For the period ended July 31, 2016
(Amounts in thousands except percentages)
1. Organization.
Fidelity Dividend Growth Fund (the Fund) is a fund of Fidelity Securities Fund (the Trust) and is authorized to issue an unlimited number of shares. The Trust is registered under the Investment Company Act of 1940, as amended (the 1940 Act), as an open-end management investment company organized as a Massachusetts business trust. The Fund offers Dividend Growth and Class K shares, each of which has equal rights as to assets and voting privileges. Each class has exclusive voting rights with respect to matters that affect that class.
2. Investments in Fidelity Central Funds.
The Fund invests in Fidelity Central Funds, which are open-end investment companies generally available only to other investment companies and accounts managed by the investment adviser and its affiliates. The Fund's Schedule of Investments lists each of the Fidelity Central Funds held as of period end, if any, as an investment of the Fund, but does not include the underlying holdings of each Fidelity Central Fund. As an Investing Fund, the Fund indirectly bears its proportionate share of the expenses of the underlying Fidelity Central Funds.
The Money Market Central Funds seek preservation of capital and current income and are managed by Fidelity Investments Money Management, Inc. (FIMM), an affiliate of the investment adviser. Annualized expenses of the Money Market Central Funds as of their most recent shareholder report date are less than .005%.
A complete unaudited list of holdings for each Fidelity Central Fund is available upon request or at the Securities and Exchange Commission (the SEC) website at www.sec.gov. In addition, the financial statements of the Fidelity Central Funds, which are not covered by the Fund's Report of Independent Registered Public Accounting Firm, are available on the SEC website or upon request.
3. Significant Accounting Policies.
The financial statements have been prepared in conformity with accounting principles generally accepted in the United States of America (GAAP), which require management to make certain estimates and assumptions at the date of the financial statements. Actual results could differ from those estimates. Subsequent events, if any, through the date that the financial statements were issued have been evaluated in the preparation of the financial statements. The following summarizes the significant accounting policies of the Fund:
Investment Valuation. Investments are valued as of 4:00 p.m. Eastern time on the last calendar day of the period. The Board of Trustees (the Board) has delegated the day to day responsibility for the valuation of the Fund's investments to the Fidelity Management & Research Company (FMR) Fair Value Committee (the Committee). In accordance with valuation policies and procedures approved by the Board, the Fund attempts to obtain prices from one or more third party pricing vendors or brokers to value its investments. When current market prices, quotations or currency exchange rates are not readily available or reliable, investments will be fair valued in good faith by the Committee, in accordance with procedures adopted by the Board. Factors used in determining fair value vary by investment type and may include market or investment specific events, changes in interest rates and credit quality. The frequency with which these procedures are used cannot be predicted and they may be utilized to a significant extent. The Committee oversees the Fund's valuation policies and procedures and reports to the Board on the Committee's activities and fair value determinations. The Board monitors the appropriateness of the procedures used in valuing the Fund's investments and ratifies the fair value determinations of the Committee.
The Fund categorizes the inputs to valuation techniques used to value its investments into a disclosure hierarchy consisting of three levels as shown below:
- Level 1 – quoted prices in active markets for identical investments
- Level 2 – other significant observable inputs (including quoted prices for similar investments, interest rates, prepayment speeds, etc.)
- Level 3 – unobservable inputs (including the Fund's own assumptions based on the best information available)
Valuation techniques used to value the Fund's investments by major category are as follows:
Equity securities, including restricted securities, for which market quotations are readily available, are valued at the last reported sale price or official closing price as reported by a third party pricing vendor on the primary market or exchange on which they are traded and are categorized as Level 1 in the hierarchy. In the event there were no sales during the day or closing prices are not available, securities are valued at the last quoted bid price or may be valued using the last available price and are generally categorized as Level 2 in the hierarchy. For foreign equity securities, when market or security specific events arise, comparisons to the valuation of American Depositary Receipts (ADRs), futures contracts, Exchange-Traded Funds (ETFs) and certain indexes as well as quoted prices for similar securities may be used and would be categorized as Level 2 in the hierarchy. Utilizing these techniques may result in transfers between Level 1 and Level 2. For equity securities, including restricted securities, where observable inputs are limited, assumptions about market activity and risk are used and these securities may be categorized as Level 3 in the hierarchy.
Debt securities, including restricted securities, are valued based on evaluated prices received from third party pricing vendors or from brokers who make markets in such securities. Corporate bonds are valued by pricing vendors who utilize matrix pricing which considers yield or price of bonds of comparable quality, coupon, maturity and type or by broker-supplied prices. When independent prices are unavailable or unreliable, debt securities may be valued utilizing pricing methodologies which consider similar factors that would be used by third party pricing vendors. Debt securities are generally categorized as Level 2 in the hierarchy but may be Level 3 depending on the circumstances.
Investments in open-end mutual funds, including the Fidelity Central Funds, are valued at their closing net asset value (NAV) each business day and are categorized as Level 1 in the hierarchy.
Changes in valuation techniques may result in transfers in or out of an assigned level within the disclosure hierarchy. The aggregate value of investments by input level as of July 31, 2016 is included at the end of the Fund's Schedule of Investments.
Foreign Currency. The Fund may use foreign currency contracts to facilitate transactions in foreign-denominated securities. Gains and losses from these transactions may arise from changes in the value of the foreign currency or if the counterparties do not perform under the contracts' terms.
Foreign-denominated assets, including investment securities, and liabilities are translated into U.S. dollars at the exchange rates at period end. Purchases and sales of investment securities, income and dividends received and expenses denominated in foreign currencies are translated into U.S. dollars at the exchange rate in effect on the transaction date.
The effects of exchange rate fluctuations on investments are included with the net realized and unrealized gain (loss) on investment securities. Other foreign currency transactions resulting in realized and unrealized gain (loss) are disclosed separately.
Investment Transactions and Income. For financial reporting purposes, the Fund's investment holdings and NAV include trades executed through the end of the last business day of the period. The NAV per share for processing shareholder transactions is calculated as of the close of business of the New York Stock Exchange (NYSE), normally 4:00 p.m. Eastern time and includes trades executed through the end of the prior business day. Gains and losses on securities sold are determined on the basis of identified cost and may include proceeds received from litigation. Dividend income is recorded on the ex-dividend date, except for certain dividends from foreign securities where the ex-dividend date may have passed, which are recorded as soon as the Fund is informed of the ex-dividend date. Non-cash dividends included in dividend income, if any, are recorded at the fair market value of the securities received. Income and capital gain distributions from Fidelity Central Funds, if any, are recorded on the ex-dividend date. Distributions received on securities that represent a return of capital or capital gain are recorded as a reduction of cost of investments and/or as a realized gain. Subsequent to ex-dividend date the Fund determines the components of these distributions, based upon receipt of tax filings or other correspondence relating to the underlying investment. Interest income is accrued as earned and includes coupon interest and amortization of premium and accretion of discount on debt securities as applicable. Investment income is recorded net of foreign taxes withheld where recovery of such taxes is uncertain.
Class Allocations and Expenses. Investment income, realized and unrealized capital gains and losses, common expenses of the Fund, and certain fund-level expense reductions, if any, are allocated daily on a pro-rata basis to each class based on the relative net assets of each class to the total net assets of the Fund. Each class differs with respect to transfer agent fees incurred. Certain expense reductions may also differ by class. For the reporting period, the allocated portion of income and expenses to each class as a percent of its average net assets may vary due to the timing of recording these transactions in relation to fluctuating net assets of the classes. Expenses directly attributable to a fund are charged to that fund. Expenses attributable to more than one fund are allocated among the respective funds on the basis of relative net assets or other appropriate methods. Expense estimates are accrued in the period to which they relate and adjustments are made when actual amounts are known.
Deferred Trustee Compensation. Under a Deferred Compensation Plan (the Plan), independent Trustees may elect to defer receipt of a portion of their annual compensation. Deferred amounts are invested in a cross-section of Fidelity funds, are marked-to-market and remain in the Fund until distributed in accordance with the Plan. The investment of deferred amounts and the offsetting payable to the Trustees are included in the accompanying Statement of Assets and Liabilities.
Income Tax Information and Distributions to Shareholders. Each year, the Fund intends to qualify as a regulated investment company under Subchapter M of the Internal Revenue Code, including distributing substantially all of its taxable income and realized gains. As a result, no provision for U.S. Federal income taxes is required. As of July 31, 2016, the Fund did not have any unrecognized tax benefits in the financial statements; nor is the Fund aware of any tax positions for which it is reasonably possible that the total amounts of unrecognized tax benefits will significantly change in the next twelve months. The Fund files a U.S. federal tax return, in addition to state and local tax returns as required. The Fund's federal income tax returns are subject to examination by the Internal Revenue Service (IRS) for a period of three fiscal years after they are filed. State and local tax returns may be subject to examination for an additional fiscal year depending on the jurisdiction. Foreign taxes are provided for based on the Fund's understanding of the tax rules and rates that exist in the foreign markets in which it invests.
Distributions are declared and recorded on the ex-dividend date. Income dividends and capital gain distributions are declared separately for each class. Income and capital gain distributions are determined in accordance with income tax regulations, which may differ from GAAP. In addition, the Fund claimed a portion of the payment made to redeeming shareholders as a distribution for income tax purposes.
Capital accounts within the financial statements are adjusted for permanent book-tax differences. These adjustments have no impact on net assets or the results of operations. Capital accounts are not adjusted for temporary book-tax differences which will reverse in a subsequent period.
Book-tax differences are primarily due to foreign currency transactions, partnerships, deferred trustees compensation and losses deferred due to wash sales and excise tax regulations.
The federal tax cost of investment securities and unrealized appreciation (depreciation) as of period end were as follows:
| Gross unrealized appreciation | $1,606,185 |
| Gross unrealized depreciation | (195,351) |
| Net unrealized appreciation (depreciation) on securities | $1,410,834 |
| Tax Cost | $6,143,672 |
The tax-based components of distributable earnings as of period end were as follows:
| Undistributed ordinary income | $64,926 |
| Net unrealized appreciation (depreciation) on securities and other investments | $1,410,808 |
The tax character of distributions paid was as follows:
| | July 31, 2016 | July 31, 2015 |
| Ordinary Income | $124,272 | $ 247,357 |
| Long-term Capital Gains | 563,975 | 1,144,542 |
| Total | $688,247 | $ 1,391,899 |
The Fund intends to elect to defer to its next fiscal year $125,394,187 of capital losses recognized during the period November 1, 2015 to July 31, 2016.
Restricted Securities. The Fund may invest in securities that are subject to legal or contractual restrictions on resale. These securities generally may be resold in transactions exempt from registration or to the public if the securities are registered. Disposal of these securities may involve time-consuming negotiations and expense, and prompt sale at an acceptable price may be difficult. Information regarding restricted securities is included at the end of the Fund's Schedule of Investments.
4. Purchases and Sales of Investments.
Purchases and sales of securities, other than short-term securities, aggregated $2,174,142 and $3,145,373, respectively.
5. Fees and Other Transactions with Affiliates.
Management Fee. Fidelity Management & Research Company (the investment adviser) and its affiliates provide the Fund with investment management related services for which the Fund pays a monthly management fee. The management fee is the sum of an individual fund fee rate that is based on an annual rate of .30% of the Fund's average net assets and an annualized group fee rate that averaged .25% during the period. The group fee rate is based upon the average net assets of all the mutual funds advised by the investment adviser, including any mutual funds previously advised by the investment adviser that are currently advised by Fidelity SelectCo, LLC, an affiliate of the investment adviser. The group fee rate decreases as assets under management increase and increases as assets under management decrease. In addition, the management fee is subject to a performance adjustment (up to a maximum of +/- .20% of the Fund's average net assets over a 36 month performance period). The upward or downward adjustment to the management fee is based on the relative investment performance of Dividend Growth as compared to its benchmark index, the S&P 500 Index, over the same 36 month performance period. For the reporting period, the total annual management fee rate, including the performance adjustment, was .43% of the Fund's average net assets. The performance adjustment included in the management fee rate may be higher or lower than the maximum performance adjustment rate due to the difference between the average net assets for the reporting and performance periods.
Transfer Agent Fees. Fidelity Investments Institutional Operations Company, Inc., (FIIOC), an affiliate of the investment adviser, is the transfer, dividend disbursing and shareholder servicing agent for each class of the Fund. FIIOC receives account fees and asset-based fees that vary according to the account size and type of account of the shareholders of Dividend Growth, except for Class K. FIIOC receives an asset-based fee of Class K's average net assets. FIIOC pays for typesetting, printing and mailing of shareholder reports, except proxy statements.
For the period, transfer agent fees for each class were as follows:
| | Amount | % of
Class-Level Average
Net Assets |
| Dividend Growth | $9,721 | .17 |
| Class K | 803 | .05 |
| | $10,524 | |
Accounting and Security Lending Fees. Fidelity Service Company, Inc. (FSC), an affiliate of the investment adviser, maintains the Fund's accounting records. The accounting fee is based on the level of average net assets for each month. Under a separate contract, FSC administers the security lending program. The security lending fee is based on the number and duration of lending transactions.
Brokerage Commissions. The Fund placed a portion of its portfolio transactions with brokerage firms which are affiliates of the investment adviser. Brokerage commissions are included in net realized gain (loss) and change in net unrealized appreciation (depreciation) in the Statement of Operations. The commissions paid to these affiliated firms were $65 for the period.
Interfund Trades. The Fund may purchase from or sell securities to other Fidelity Funds under procedures adopted by the Board. The procedures have been designed to ensure these interfund trades are executed in accordance with Rule 17a-7 of the 1940 Act. Interfund trades are included within the respective purchases and sales amounts shown in the Purchases and Sales of Investments note.
6. Committed Line of Credit.
The Fund participates with other funds managed by the investment adviser or an affiliate in a $4.25 billion credit facility (the "line of credit") to be utilized for temporary or emergency purposes to fund shareholder redemptions or for other short-term liquidity purposes. The Fund has agreed to pay commitment fees on its pro-rata portion of the line of credit, which amounted to $16 and is reflected in Miscellaneous expenses on the Statement of Operations. During the period, the Fund did not borrow on this line of credit.
7. Security Lending.
The Fund lends portfolio securities through a lending agent from time to time in order to earn additional income. For equity securities, a lending agent is used and may loan securities to certain qualified borrowers, including Fidelity Capital Markets (FCM), a broker-dealer affiliated with the Fund. On the settlement date of the loan, the Fund receives collateral (in the form of U.S. Treasury obligations, letters of credit and/or cash) against the loaned securities and maintains collateral in an amount not less than 100% of the market value of the loaned securities during the period of the loan. The market value of the loaned securities is determined at the close of business of the Fund and any additional required collateral is delivered to the Fund on the next business day. The Fund or borrower may terminate the loan at any time, and if the borrower defaults on its obligation to return the securities loaned because of insolvency or other reasons, the Fund may apply collateral received from the borrower against the obligation. The Fund may experience delays and costs in recovering the securities loaned. Any cash collateral received is invested in the Fidelity Securities Lending Cash Central Fund. The value of loaned securities and cash collateral at period end are disclosed on the Fund's Statement of Assets and Liabilities. Security lending income represents the income earned on investing cash collateral, less rebates paid to borrowers and any lending agent fees associated with the loan, plus any premium payments received for lending certain types of securities. Security lending income is presented in the Statement of Operations as a component of income from Fidelity Central Funds. Total security lending income during the period amounted to $292, including $2 from securities loaned to FCM.
8. Expense Reductions.
Commissions paid to certain brokers with whom the investment adviser, or its affiliates, places trades on behalf of the Fund include an amount in addition to trade execution, which may be rebated back to the Fund to offset certain expenses. This amount totaled $123 for the period. In addition, through arrangements with the Fund's custodian, credits realized as a result of certain uninvested cash balances were used to reduce the Fund's expenses. During the period, these credits reduced the Fund's custody expenses by $1.
In addition, during the period the investment adviser reimbursed and/or waived a portion of fund-level operating expenses in the amount of $56.
9. Distributions to Shareholders.
Distributions to shareholders of each class were as follows:
| | Year ended
July 31, 2016 | Year ended July 31, 2015 |
| From net investment income | | |
| Dividend Growth | $88,523 | $92,079 |
| Class K | 28,359 | 32,054 |
| Total | $116,882 | $124,133 |
| From net realized gain | | |
| Dividend Growth | $440,809 | $962,404 |
| Class K | 130,556 | 305,362 |
| Total | $571,365 | $1,267,766 |
10. Share Transactions.
Share transactions for each class were as follows and may contain automatic conversions between classes or exchanges between affiliated funds:
| | Shares | Shares | Dollars | Dollars |
| | Year ended
July 31, 2016 | Year ended July 31, 2015 | Year ended
July 31, 2016 | Year ended July 31, 2015 |
| Dividend Growth | | | | |
| Shares sold | 8,324 | 10,859 | $252,613 | $370,250 |
| Reinvestment of distributions | 17,089 | 30,298 | 505,767 | 1,009,516 |
| Shares redeemed | (27,683) | (27,183) | (840,281) | (929,933) |
| Net increase (decrease) | (2,270) | 13,974 | $(81,901) | $449,833 |
| Class K | | | | |
| Shares sold | 8,991 | 9,521 | $272,632 | $325,624 |
| Reinvestment of distributions | 5,375 | 10,135 | 158,915 | 337,416 |
| Shares redeemed | (17,065) | (18,467) | (516,359) | (633,706) |
| Net increase (decrease) | (2,699) | 1,189 | $(84,812) | $29,334 |
11. Other.
The Fund's organizational documents provide former and current trustees and officers with a limited indemnification against liabilities arising in connection with the performance of their duties to the Fund. In the normal course of business, the Fund may also enter into contracts that provide general indemnifications. The Fund's maximum exposure under these arrangements is unknown as this would be dependent on future claims that may be made against the Fund. The risk of material loss from such claims is considered remote.
Report of Independent Registered Public Accounting Firm
To the Trustees of Fidelity Securities Fund and Shareholders of Fidelity Dividend Growth Fund:
In our opinion, the accompanying statement of assets and liabilities, including the schedule of investments, and the related statements of operations and of changes in net assets and the financial highlights present fairly, in all material respects, the financial position of Fidelity Dividend Growth Fund (a fund of Fidelity Securities Fund) at July 31, 2016, the results of its operations for the year then ended, the changes in its net assets for each of the two years in the period then ended and the financial highlights for each of the five years in the period then ended, in conformity with accounting principles generally accepted in the United States of America. These financial statements and financial highlights (hereafter referred to as “financial statements”) are the responsibility of the Fidelity Dividend Growth Fund’s management. Our responsibility is to express an opinion on these financial statements based on our audits. We conducted our audits of these financial statements in accordance with the standards of the Public Company Accounting Oversight Board (United States). Those standards require that we plan and perform the audit to obtain reasonable assurance about whether the financial statements are free of material misstatement. An audit includes examining, on a test basis, evidence supporting the amounts and disclosures in the financial statements, assessing the accounting principles used and significant estimates made by management, and evaluating the overall financial statement presentation. We believe that our audits, which included confirmation of securities at July 31, 2016 by correspondence with the custodian and brokers, provide a reasonable basis for our opinion.
PricewaterhouseCoopers LLP
Boston, Massachusetts
September 19, 2016
Trustees and Officers
The Trustees, Members of the Advisory Board (if any), and officers of the trust and fund, as applicable, are listed below. The Board of Trustees governs the fund and is responsible for protecting the interests of shareholders. The Trustees are experienced executives who meet periodically throughout the year to oversee the fund's activities, review contractual arrangements with companies that provide services to the fund, oversee management of the risks associated with such activities and contractual arrangements, and review the fund's performance. Each of the Trustees oversees 170 funds.
The Trustees hold office without limit in time except that (a) any Trustee may resign; (b) any Trustee may be removed by written instrument, signed by at least two-thirds of the number of Trustees prior to such removal; (c) any Trustee who requests to be retired or who has become incapacitated by illness or injury may be retired by written instrument signed by a majority of the other Trustees; and (d) any Trustee may be removed at any special meeting of shareholders by a two-thirds vote of the outstanding voting securities of the trust. Each Trustee who is not an interested person (as defined in the 1940 Act) of the trust and the fund is referred to herein as an Independent Trustee. Each Independent Trustee shall retire not later than the last day of the calendar year in which his or her 75th birthday occurs. The Independent Trustees may waive this mandatory retirement age policy with respect to individual Trustees. Officers and Advisory Board Members hold office without limit in time, except that any officer or Advisory Board Member may resign or may be removed by a vote of a majority of the Trustees at any regular meeting or any special meeting of the Trustees. Except as indicated, each individual has held the office shown or other offices in the same company for the past five years.
The fund’s Statement of Additional Information (SAI) includes more information about the Trustees. To request a free copy, call Fidelity at 1-800-544-8544.
Experience, Skills, Attributes, and Qualifications of the Trustees. The Governance and Nominating Committee has adopted a statement of policy that describes the experience, qualifications, attributes, and skills that are necessary and desirable for potential Independent Trustee candidates (Statement of Policy). The Board believes that each Trustee satisfied at the time he or she was initially elected or appointed a Trustee, and continues to satisfy, the standards contemplated by the Statement of Policy. The Governance and Nominating Committee also engages professional search firms to help identify potential Independent Trustee candidates who have the experience, qualifications, attributes, and skills consistent with the Statement of Policy. From time to time, additional criteria based on the composition and skills of the current Independent Trustees, as well as experience or skills that may be appropriate in light of future changes to board composition, business conditions, and regulatory or other developments, have also been considered by the professional search firms and the Governance and Nominating Committee. In addition, the Board takes into account the Trustees' commitment and participation in Board and committee meetings, as well as their leadership of standing and ad hoc committees throughout their tenure.
In determining that a particular Trustee was and continues to be qualified to serve as a Trustee, the Board has considered a variety of criteria, none of which, in isolation, was controlling. The Board believes that, collectively, the Trustees have balanced and diverse experience, qualifications, attributes, and skills, which allow the Board to operate effectively in governing the fund and protecting the interests of shareholders. Information about the specific experience, skills, attributes, and qualifications of each Trustee, which in each case led to the Board's conclusion that the Trustee should serve (or continue to serve) as a trustee of the fund, is provided below.
Board Structure and Oversight Function. James C. Curvey is an interested person and currently serves as Chairman. The Trustees have determined that an interested Chairman is appropriate and benefits shareholders because an interested Chairman has a personal and professional stake in the quality and continuity of services provided to the fund. Independent Trustees exercise their informed business judgment to appoint an individual of their choosing to serve as Chairman, regardless of whether the Trustee happens to be independent or a member of management. The Independent Trustees have determined that they can act independently and effectively without having an Independent Trustee serve as Chairman and that a key structural component for assuring that they are in a position to do so is for the Independent Trustees to constitute a substantial majority for the Board. The Independent Trustees also regularly meet in executive session. Ned C. Lautenbach serves as Chairman of the Independent Trustees and as such (i) acts as a liaison between the Independent Trustees and management with respect to matters important to the Independent Trustees and (ii) with management prepares agendas for Board meetings.
Fidelity® funds are overseen by different Boards of Trustees. The fund's Board oversees Fidelity's high income and certain equity funds, and other Boards oversee Fidelity's investment-grade bond, money market, asset allocation, and sector funds. The asset allocation funds may invest in Fidelity® funds overseen by the fund's Board. The use of separate Boards, each with its own committee structure, allows the Trustees of each group of Fidelity® funds to focus on the unique issues of the funds they oversee, including common research, investment, and operational issues. On occasion, the separate Boards establish joint committees to address issues of overlapping consequences for the Fidelity® funds overseen by each Board.
The Trustees operate using a system of committees to facilitate the timely and efficient consideration of all matters of importance to the Trustees, the fund, and fund shareholders and to facilitate compliance with legal and regulatory requirements and oversight of the fund's activities and associated risks. The Board, acting through its committees, has charged FMR and its affiliates with (i) identifying events or circumstances the occurrence of which could have demonstrably adverse effects on the fund's business and/or reputation; (ii) implementing processes and controls to lessen the possibility that such events or circumstances occur or to mitigate the effects of such events or circumstances if they do occur; and (iii) creating and maintaining a system designed to evaluate continuously business and market conditions in order to facilitate the identification and implementation processes described in (i) and (ii) above. Because the day-to-day operations and activities of the fund are carried out by or through FMR, its affiliates, and other service providers, the fund's exposure to risks is mitigated but not eliminated by the processes overseen by the Trustees. While each of the Board's committees has responsibility for overseeing different aspects of the fund's activities, oversight is exercised primarily through the Operations, Audit, and Compliance Committees. In addition, the Independent Trustees have worked with FMR to enhance the Board's oversight of investment and financial risks, legal and regulatory risks, technology risks, and operational risks, including the development of additional risk reporting to the Board. For example, a working group comprised of Independent Trustees and FMR has worked and continues to work to review the Fidelity® funds' valuation-related activities, reporting and risk management. Appropriate personnel, including but not limited to the fund's Chief Compliance Officer (CCO), FMR's internal auditor, the independent accountants, the fund's Treasurer and portfolio management personnel, make periodic reports to the Board's committees, as appropriate, including an annual review of Fidelity's risk management program for the Fidelity® funds. The responsibilities of each standing committee, including their oversight responsibilities, are described further under "Standing Committees of the Trustees."
Interested Trustees*:
Correspondence intended for a Trustee who is an interested person may be sent to Fidelity Investments, 245 Summer Street, Boston, Massachusetts 02210.
Name, Year of Birth; Principal Occupations and Other Relevant Experience+
James C. Curvey (1935)
Year of Election or Appointment: 2007
Trustee
Chairman of the Board of Trustees
Mr. Curvey also serves as Trustee of other Fidelity® funds. Mr. Curvey is a Director of Fidelity Research & Analysis Co. (investment adviser firm, 2009-present), and Vice Chairman (2007-present) and Director of FMR LLC (diversified financial services company). In addition, Mr. Curvey serves as an Overseer for the Boston Symphony Orchestra and a member of the board of Artis-Naples, Naples, Florida, and as a Trustee for Brewster Academy, Wolfeboro, New Hampshire. Previously, Mr. Curvey served as a Director of Fidelity Investments Money Management, Inc. (investment adviser firm, 2009-2014) and a Director of FMR and FMR Co., Inc. (investment adviser firms, 2007-2014).
Charles S. Morrison (1960)
Year of Election or Appointment: 2014
Trustee
Mr. Morrison also serves as Trustee of other funds. He serves as a Director of Fidelity Investments Money Management, Inc. (FIMM) (investment adviser firm, 2014-present), Director of Fidelity SelectCo, LLC (investment adviser firm, 2014-present), President, Asset Management (2014-present), and is an employee of Fidelity Investments. Previously, Mr. Morrison served as Vice President of Fidelity's Fixed Income and Asset Allocation Funds (2012-2014), President, Fixed Income (2011-2014), Vice President of Fidelity's Money Market Funds (2005-2009), President, Money Market Group Leader of FMR (investment adviser firm, 2009), and Senior Vice President, Money Market Group of FMR (2004-2009). Mr. Morrison also served as Vice President of Fidelity's Bond Funds (2002-2005), certain Balanced Funds (2002-2005), and certain Asset Allocation Funds (2002-2007), and as Senior Vice President (2002-2005) of Fidelity's Bond Division.
* Determined to be an “Interested Trustee” by virtue of, among other things, his or her affiliation with the trust or various entities under common control with FMR.
+ The information includes the Trustee's principal occupation during the last five years and other information relating to the experience, attributes, and skills relevant to the Trustee's qualifications to serve as a Trustee, which led to the conclusion that the Trustee should serve as a Trustee for the fund.
Independent Trustees:
Correspondence intended for an Independent Trustee may be sent to Fidelity Investments, P.O. Box 55235, Boston, Massachusetts 02205-5235.
Name, Year of Birth; Principal Occupations and Other Relevant Experience+
Dennis J. Dirks (1948)
Year of Election or Appointment: 2005
Trustee
Mr. Dirks also serves as Trustee of other Fidelity® funds. Prior to his retirement in May 2003, Mr. Dirks was Chief Operating Officer and a member of the Board of The Depository Trust & Clearing Corporation (DTCC). He also served as President, Chief Operating Officer, and Board member of The Depository Trust Company (DTC) and President and Board member of the National Securities Clearing Corporation (NSCC). In addition, Mr. Dirks served as Chief Executive Officer and Board member of the Government Securities Clearing Corporation, Chief Executive Officer and Board member of the Mortgage-Backed Securities Clearing Corporation, as a Trustee and a member of the Finance Committee of Manhattan College (2005-2008), as a Trustee and a member of the Finance Committee of AHRC of Nassau County (2006-2008), and as a member of the Independent Directors Council (IDC) Governing Council (2010-2015). Mr. Dirks is a member of the Board of Directors for The Brookville Center for Children's Services, Inc. (2009-present).
Alan J. Lacy (1953)
Year of Election or Appointment: 2008
Trustee
Mr. Lacy also serves as Trustee of other Fidelity® funds. Mr. Lacy serves as Chairman (2014-present) and a member (2010-present) of the Board of Directors of Dave & Buster's Entertainment, Inc. (restaurant and entertainment complexes) and a Director of Bristol-Myers Squibb Company (global pharmaceuticals, 2008-present). He is a Trustee of the California Chapter of The Nature Conservancy (2015-present) and a Director of the Center for Advanced Study in the Behavioral Sciences at Stanford University (2015-present). In addition, Mr. Lacy served as Senior Adviser (2007-2014) of Oak Hill Capital Partners, L.P. (private equity) and also served as Chief Executive Officer (2005) and Vice Chairman (2005-2006) of Sears Holdings Corporation (retail) and Chief Executive Officer and Chairman of the Board of Sears, Roebuck and Co. (retail, 2000-2005). Previously, Mr. Lacy served as Chairman (2008-2011) and a member (2006-2015) of the Board of Trustees of the National Parks Conservation Association and as a member of the Board of Directors for The Western Union Company (global money transfer, 2006-2011), The Hillman Companies, Inc. (hardware wholesalers, 2010-2014), and Earth Fare, Inc. (retail grocery, 2010-2014).
Ned C. Lautenbach (1944)
Year of Election or Appointment: 2000
Trustee
Chairman of the Independent Trustees
Mr. Lautenbach also serves as Trustee of other Fidelity® funds. Mr. Lautenbach currently serves as the Lead Director of the Eaton Corporation Board of Directors (diversified industrial, 1997-present). Mr. Lautenbach is Chairman of the Board of Directors of Artis-Naples in Naples, Florida (2012-present), a member of the Council on Foreign Relations (1994-present), and a member of the Board of Governors, State University System of Florida (2013-present). Previously, Mr. Lautenbach was a Partner/Advisory Partner at Clayton, Dubilier & Rice, LLC (private equity investment, 1998-2010), as well as a Director of Sony Corporation (2006-2007).
Joseph Mauriello (1944)
Year of Election or Appointment: 2008
Trustee
Mr. Mauriello also serves as Trustee of other Fidelity® funds. Prior to his retirement in January 2006, Mr. Mauriello served in numerous senior management positions including Deputy Chairman and Chief Operating Officer (2004-2005), and Vice Chairman of Financial Services (2002-2004) of KPMG LLP US (professional services, 1965-2005). Mr. Mauriello currently serves as a member of the Board of Directors of XL Group plc. (global insurance and re-insurance, 2006-present) and the Independent Directors Council (IDC) Governing Council (2015-present). Previously, Mr. Mauriello served as a Director of the Hamilton Funds of the Bank of New York (2006-2007) and of Arcadia Resources Inc. (health care services and products, 2007-2012).
Robert W. Selander (1950)
Year of Election or Appointment: 2011
Trustee
Mr. Selander also serves as Trustee of other Fidelity® funds. Mr. Selander serves as a Director of The Western Union Company (global money transfer, 2014-present) and a non-executive Chairman of Health Equity, Inc. (health savings custodian, 2015-present). Previously, Mr. Selander served as a Member of the Advisory Board of certain Fidelity® funds (2011), and Executive Vice Chairman (2010), Chief Executive Officer (2009-2010), and President and Chief Executive Officer (1997-2009) of Mastercard, Inc.
Cornelia M. Small (1944)
Year of Election or Appointment: 2005
Trustee
Ms. Small also serves as Trustee of other Fidelity® funds. Ms. Small is a member of the Board of Directors (2009-present) and Chair of the Investment Committee (2010-present) of the Teagle Foundation. Ms. Small also serves on the Investment Committee of the Berkshire Taconic Community Foundation (2008-present). Previously, Ms. Small served as Chairperson (2002-2008) and a member of the Investment Committee and Chairperson (2008-2012) and a member of the Board of Trustees of Smith College. In addition, Ms. Small served as Chief Investment Officer, Director of Global Equity Investments, and a member of the Board of Directors of Scudder, Stevens & Clark and Scudder Kemper Investments.
William S. Stavropoulos (1939)
Year of Election or Appointment: 2002
Trustee
Vice Chairman of the Independent Trustees
Mr. Stavropoulos also serves as Trustee of other Fidelity® funds. Mr. Stavropoulos serves as President and Founder of the Michigan Baseball Foundation, the Great Lakes Loons (2007-present). Mr. Stavropoulos is Chairman Emeritus of the Board of Directors of The Dow Chemical Company, where he previously served in numerous senior management positions, including President, CEO (1995-2000; 2002-2004), Chairman of the Executive Committee (2000-2006), and as a member of the Board of Directors (1990-2006). Currently, Mr. Stavropoulos is Chairman of the Board of Directors of Univar Inc. (global distributor of commodity and specialty chemicals), a Director of Teradata Corporation (data warehousing and technology solutions), and Maersk Inc. (industrial conglomerate), and a member of the Advisory Board for Metalmark Capital LLC (private equity investment, 2005-present). Mr. Stavropoulos is an operating advisor to Clayton, Dubilier & Rice, LLC (private equity investment). In addition, Mr. Stavropoulos is a member of the University of Notre Dame Advisory Council for the College of Science, a Trustee of the Rollin L. Gerstacker Foundation, and a Director of the Naples Philharmonic Center for the Arts. Previously, Mr. Stavropoulos served as a Director of Chemical Financial Corporation (bank holding company, 1993-2012) and Tyco International, Ltd. (multinational manufacturing and services, 2007-2012).
David M. Thomas (1949)
Year of Election or Appointment: 2008
Trustee
Mr. Thomas also serves as Trustee of other Fidelity® funds. Mr. Thomas serves as Non-Executive Chairman of the Board of Directors of Fortune Brands Home and Security (home and security products, 2011-present), as a member of the Board of Directors (2004-present) and Presiding Director (2013-present) of Interpublic Group of Companies, Inc. (marketing communication), and as a member of the Board of Trustees of the University of Florida (2013-present). Previously, Mr. Thomas served as Executive Chairman (2005-2006) and Chairman and Chief Executive Officer (2000-2005) of IMS Health, Inc. (pharmaceutical and healthcare information solutions), and a Director of Fortune Brands, Inc. (consumer products, 2000-2011).
+ The information includes the Trustee's principal occupation during the last five years and other information relating to the experience, attributes, and skills relevant to the Trustee's qualifications to serve as a Trustee, which led to the conclusion that the Trustee should serve as a Trustee for the fund.
Advisory Board Members and Officers:
Correspondence intended for an officer or Peter S. Lynch may be sent to Fidelity Investments, 245 Summer Street, Boston, Massachusetts 02210. Officers appear below in alphabetical order.
Name, Year of Birth; Principal Occupation
Peter S. Lynch (1944)
Year of Election or Appointment: 2003
Member of the Advisory Board
Mr. Lynch also serves as Member of the Advisory Board of other Fidelity® funds. Mr. Lynch is Vice Chairman and a Director of FMR (investment adviser firm) and FMR Co., Inc. (investment adviser firm). In addition, Mr. Lynch serves as a Trustee of Boston College and as the Chairman of the Inner-City Scholarship Fund. Previously, Mr. Lynch served on the Special Olympics International Board of Directors (1997-2006).
Marc R. Bryant (1966)
Year of Election or Appointment: 2015
Secretary and Chief Legal Officer (CLO)
Mr. Bryant also serves as Secretary and CLO of other funds. Mr. Bryant serves as CLO, Secretary, and Senior Vice President of Fidelity Management & Research Company (investment adviser firm, 2015-present) and FMR Co., Inc. (investment adviser firm, 2015-present); Secretary of Fidelity SelectCo, LLC (investment adviser firm, 2015-present) and Fidelity Investments Money Management, Inc. (investment adviser firm, 2015-present); and CLO of Fidelity Management & Research (Hong Kong) Limited and FMR Investment Management (U.K.) Limited (investment adviser firms, 2015-present) and Fidelity Management & Research (Japan) Limited (investment adviser firm, 2016-present). He is Senior Vice President and Deputy General Counsel of FMR LLC (diversified financial services company). Previously, Mr. Bryant served as Secretary and CLO of Fidelity Rutland Square Trust II (2010-2014) and Assistant Secretary of Fidelity's Fixed Income and Asset Allocation Funds (2013-2015). Prior to joining Fidelity Investments, Mr. Bryant served as a Senior Vice President and the Head of Global Retail Legal for AllianceBernstein L.P. (2006-2010), and as the General Counsel for ProFund Advisors LLC (2001-2006).
Jeffrey S. Christian (1961)
Year of Election or Appointment: 2016
Assistant Treasurer
Mr. Christian also serves as Assistant Treasurer of other funds. Mr. Christian is an employee of Fidelity Investments (2003-present).
William C. Coffey (1969)
Year of Election or Appointment: 2009
Assistant Secretary
Mr. Coffey also serves as Assistant Secretary of other funds. He is Senior Vice President and Deputy General Counsel of FMR LLC (diversified financial services company, 2010-present), and is an employee of Fidelity Investments. Previously, Mr. Coffey served as Vice President and Associate General Counsel of FMR LLC (2005-2009).
Jonathan Davis (1968)
Year of Election or Appointment: 2010
Assistant Treasurer
Mr. Davis also serves as Assistant Treasurer of other funds, and is an employee of Fidelity Investments. Previously, Mr. Davis served as Vice President and Associate General Counsel of FMR LLC (diversified financial services company, 2003-2010).
Adrien E. Deberghes (1967)
Year of Election or Appointment: 2016
Assistant Treasurer
Mr. Deberghes also serves as an officer of other funds. He serves as Executive Vice President of Fidelity Investments Money Management, Inc. (FIMM) (investment adviser firm, 2016-present) and is an employee of Fidelity Investments (2008-present). Prior to joining Fidelity Investments, Mr. Deberghes was Senior Vice President of Mutual Fund Administration at State Street Corporation (2007-2008), Senior Director of Mutual Fund Administration at Investors Bank & Trust (2005-2007), and Director of Finance for Dunkin' Brands (2000-2005). Previously, Mr. Deberghes served in other fund officer roles.
Stephanie J. Dorsey (1969)
Year of Election or Appointment: 2010
Assistant Treasurer
Ms. Dorsey also serves as an officer of other funds. She is an employee of Fidelity Investments (2008-present) and has served in other fund officer roles. Prior to joining Fidelity Investments, Ms. Dorsey served as Treasurer (2004-2008) of the JPMorgan Mutual Funds and Vice President (2004-2008) of JPMorgan Chase Bank.
Howard J. Galligan III (1966)
Year of Election or Appointment: 2014
Chief Financial Officer
Mr. Galligan also serves as Chief Financial Officer of other funds. Mr. Galligan serves as President of Fidelity Pricing and Cash Management Services (FPCMS) (2014-present) and as a Director of Strategic Advisers, Inc. (investment adviser firm, 2008-present). Previously, Mr. Galligan served as Chief Administrative Officer of Asset Management (2011-2014) and Chief Operating Officer and Senior Vice President of Investment Support for Strategic Advisers, Inc. (2003-2011).
Scott C. Goebel (1968)
Year of Election or Appointment: 2015
Vice President
Mr. Goebel serves as Vice President of other funds and is an employee of Fidelity Investments (2001-present). Mr. Goebel serves as Senior Vice President of Fidelity Management & Research Company (FMR) (investment adviser firm, 2016-present). Previously, Mr. Goebel served as Secretary of Fidelity SelectCo, LLC (investment adviser firm, 2013-2015), Fidelity Investments Money Management, Inc. (FIMM) (investment adviser firm, 2010-2015), and Fidelity Research and Analysis Company (FRAC) (investment adviser firm, 2010-2015); General Counsel, Secretary, and Senior Vice President of FMR (investment adviser firm, 2008-2015) and FMR Co., Inc. (investment adviser firm, 2008-2015); Assistant Secretary of Fidelity Management & Research (Japan) Limited (investment adviser firm, 2008-2015) and Fidelity Management & Research (U.K.) Inc. (investment adviser firm, 2008-2015); Chief Legal Officer (CLO) of Fidelity Management & Research (Hong Kong) Limited (investment adviser firm, 2008-2015); Secretary and CLO of certain Fidelity® funds (2008-2015); Assistant Secretary of FIMM (2008-2010), FRAC (2008-2010), and certain funds (2007-2008); and as Vice President and Secretary of Fidelity Distributors Corporation (FDC) (2005-2007).
Thomas C. Hense (1964)
Year of Election or Appointment: 2008, 2010, or 2015
Vice President
Mr. Hense serves as Vice President of Fidelity Advisor® Multi-Asset Income Fund (2015) and other funds (High Income (2008), Small Cap (2008), and Value (2010) funds), and is an employee of Fidelity Investments (1993-present). Previously, Mr. Hense served as a portfolio manager for Fidelity's Institutional Money Management Group (Pyramis) (2003-2008).
Brian B. Hogan (1964)
Year of Election or Appointment: 2009
Vice President
Mr. Hogan also serves as Trustee or Vice President of other funds. Mr. Hogan serves as a Director of FMR Investment Management (U.K.) Limited (investment adviser firm, 2015-present) and Fidelity SelectCo, LLC (investment adviser firm, 2014-present) and President of the Equity Division of FMR (investment adviser firm, 2009-present). Previously, Mr. Hogan served as Senior Vice President, Equity Research of FMR (2006-2009) and as a portfolio manager. Mr. Brian B. Hogan is not related to Mr. Colm A. Hogan.
Colm A. Hogan (1973)
Year of Election or Appointment: 2016
Deputy Treasurer
Mr. Hogan also serves as an officer of other funds. Mr. Hogan is an employee of Fidelity Investments (2005-present). Mr. Colm A. Hogan is not related to Mr. Brian B. Hogan.
Chris Maher (1972)
Year of Election or Appointment: 2013
Assistant Treasurer
Mr. Maher serves as Assistant Treasurer of other funds. Mr. Maher is Vice President of Valuation Oversight and is an employee of Fidelity Investments. Previously, Mr. Maher served as Vice President of Asset Management Compliance (2013), Vice President of the Program Management Group of FMR (investment adviser firm, 2010-2013), and Vice President of Valuation Oversight (2008-2010).
John F. Papandrea (1972)
Year of Election or Appointment: 2016
Anti-Money Laundering (AML) Officer
Mr. Papandrea also serves as AML Officer of other funds. Mr. Papandrea is Vice President of FMR LLC (diversified financial services company, 2008-present) and is an employee of Fidelity Investments (2005-present).
Kenneth B. Robins (1969)
Year of Election or Appointment: 2016
Chief Compliance Officer
Mr. Robins also serves as an officer of other funds. Mr. Robins serves as Compliance Officer of Fidelity Management & Research Company and FMR Co., Inc. (investment adviser firms, 2016-present) and is an employee of Fidelity Investments (2004-present). Previously, Mr. Robins served as Executive Vice President of Fidelity Investments Money Management, Inc. (investment adviser firm, 2013-2016) and served in other fund officer roles.
Stacie M. Smith (1974)
Year of Election or Appointment: 2016
President and Treasurer
Ms. Smith also serves as an officer of other funds. She is an employee of Fidelity Investments (2009-present) and has served in other fund officer roles. Prior to joining Fidelity Investments, Ms. Smith served as Senior Audit Manager of Ernst & Young LLP (1996-2009). Previously, Ms. Smith served as Deputy Treasurer of certain Fidelity® funds (2013-2016).
Renee Stagnone (1975)
Year of Election or Appointment: 2016
Assistant Treasurer
Ms. Stagnone also serves as an officer of other funds. Ms. Stagnone is an employee of Fidelity Investments (1997-present). Previously, Ms. Stagnone served as Deputy Treasurer of certain Fidelity® funds (2013-2016).
Shareholder Expense Example
As a shareholder of the Fund, you incur two types of costs: (1) transaction costs, and (2) ongoing costs, including management fees and other Fund expenses. This Example is intended to help you understand your ongoing costs (in dollars) of investing in the Fund and to compare these costs with the ongoing costs of investing in other mutual funds.
The Example is based on an investment of $1,000 invested at the beginning of the period and held for the entire period (February 1, 2016 to July 31, 2016).
Actual Expenses
The first line of the accompanying table for each class of the Fund provides information about actual account values and actual expenses. You may use the information in this line, together with the amount you invested, to estimate the expenses that you paid over the period. Simply divide your account value by $1,000.00 (for example, an $8,600 account value divided by $1,000.00 = 8.6), then multiply the result by the number in the first line for a class of the Fund under the heading entitled "Expenses Paid During Period" to estimate the expenses you paid on your account during this period. A small balance maintenance fee of $12.00 that is charged once a year may apply for certain accounts with a value of less than $2,000. This fee is not included in the table below. If it was, the estimate of expenses you paid during the period would be higher, and your ending account value lower, by this amount. In addition, the Fund, as a shareholder in the underlying Fidelity Central Funds, will indirectly bear its pro-rata share of the fees and expenses incurred by the underlying Fidelity Central Funds. These fees and expenses are not included in the Fund's annualized expense ratio used to calculate the expense estimate in the table below.
Hypothetical Example for Comparison Purposes
The second line of the accompanying table for each class of the Fund provides information about hypothetical account values and hypothetical expenses based on a Class' actual expense ratio and an assumed rate of return of 5% per year before expenses, which is not the Class' actual return. The hypothetical account values and expenses may not be used to estimate the actual ending account balance or expenses you paid for the period. You may use this information to compare the ongoing costs of investing in the Fund and other funds. To do so, compare this 5% hypothetical example with the 5% hypothetical examples that appear in the shareholder reports of the other funds. A small balance maintenance fee of $12.00 that is charged once a year may apply for certain accounts with a value of less than $2,000. This fee is not included in the table below. If it was, the estimate of expenses you paid during the period would be higher, and your ending account value lower, by this amount. In addition, the Fund, as a shareholder in the underlying Fidelity Central Funds, will indirectly bear its pro-rata share of the fees and expenses incurred by the underlying Fidelity Central Funds. These fees and expenses are not included in the Fund's annualized expense ratio used to calculate the expense estimate in the table below.
Please note that the expenses shown in the table are meant to highlight your ongoing costs only and do not reflect any transaction costs. Therefore, the second line of the table is useful in comparing ongoing costs only, and will not help you determine the relative total costs of owning different funds.
| | Annualized Expense Ratio-A | Beginning
Account Value
February 1, 2016 | Ending
Account Value
July 31, 2016 | Expenses Paid
During Period-B
February 1, 2016
to July 31, 2016 |
| Dividend Growth | .59% | | | |
| Actual | | $1,000.00 | $1,095.20 | $3.07 |
| Hypothetical-C | | $1,000.00 | $1,021.93 | $2.97 |
| Class K | .47% | | | |
| Actual | | $1,000.00 | $1,096.00 | $2.45 |
| Hypothetical-C | | $1,000.00 | $1,022.53 | $2.36 |
A Annualized expense ratio reflects expenses net of applicable fee waivers.
B Expenses are equal to each Class' annualized expense ratio, multiplied by the average account value over the period, multiplied by 182/366 (to reflect the one-half year period).
C 5% return per year before expenses
Distributions (Unaudited)
The fund hereby designates as a capital gain dividend with respect to the taxable year ended July 31,2016 $40,762,211, or, if subsequently determined to be different, the net capital gain of such year.
Dividend Growth and Class K designate 100% of the dividends distributed in September and December during the fiscal year as qualifying for the dividends–received deduction for corporate shareholders.
Dividend Growth and Class K designate 100% of the dividends distributed in September and December during the fiscal year as amounts which may be taken into account as a dividend for the purposes of the maximum rate under section 1(h)(11) of the Internal Revenue Code.
The fund will notify shareholders in January 2017 of amounts for use in preparing 2016 income tax returns.
Board Approval of Investment Advisory Contracts and Management Fees
Fidelity Dividend Growth Fund
Each year, the Board of Trustees, including the Independent Trustees (together, the Board), votes on the renewal of the management contract with Fidelity Management & Research Company (FMR) and the sub-advisory agreements (together, the Advisory Contracts) for the fund. The Board, assisted by the advice of fund counsel and Independent Trustees' counsel, requests and considers a broad range of information relevant to the renewal of the Advisory Contracts throughout the year.
The Board meets regularly and, at each of its meetings, covers an extensive agenda of topics and materials and considers factors that are relevant to its annual consideration of the renewal of the fund's Advisory Contracts, including the services and support provided to the fund and its shareholders. The Board has established various standing committees (Committees), each composed of and chaired by Independent Trustees with varying backgrounds, to which the Board has assigned specific subject matter responsibilities in order to enhance effective decision-making by the Board. The Board, acting directly and through its Committees, requests and receives information concerning the annual consideration of the renewal of the fund's Advisory Contracts. The Board also meets as needed to consider matters specifically related to the Board's annual consideration of the renewal of the Advisory Contracts. Members of the Board may also meet with trustees of other Fidelity funds through ad hoc joint committees to discuss certain matters relevant to all of the Fidelity funds.
At its July 2016 meeting, the Board unanimously determined to renew the fund's Advisory Contracts. In reaching its determination, the Board considered all factors it believed relevant, including (i) the nature, extent, and quality of the services to be provided to the fund and its shareholders (including the investment performance of the fund); (ii) the competitiveness of the fund's management fee and total expense ratio relative to peer funds; (iii) the total costs of the services to be provided by and the profits to be realized by Fidelity from its relationships with the fund; and (iv) the extent to which, if any, economies of scale exist and would be realized as the fund grows, and whether any economies of scale are appropriately shared with fund shareholders.
In considering whether to renew the Advisory Contracts for the fund, the Board reached a determination, with the assistance of fund counsel and Independent Trustees' counsel and through the exercise of its business judgment, that the renewal of the Advisory Contracts was in the best interests of the fund and its shareholders and that the compensation payable under the Advisory Contracts was fair and reasonable. The Board's decision to renew the Advisory Contracts was not based on any single factor, but rather was based on a comprehensive consideration of all the information provided to the Board at its meetings throughout the year. The Board, in reaching its determination to renew the Advisory Contracts, was aware that shareholders of the fund have a broad range of investment choices available to them, including a wide choice among funds offered by Fidelity's competitors, and that the fund's shareholders, who have the opportunity to review and weigh the disclosure provided by the fund in its prospectus and other public disclosures, have chosen to invest in this fund, which is part of the Fidelity family of funds.
Nature, Extent, and Quality of Services Provided. The Board considered Fidelity's staffing as it relates to the fund, including the backgrounds of investment personnel of Fidelity, and also considered the fund's investment objective, strategies, and related investment philosophy. The Independent Trustees also had discussions with senior management of Fidelity's investment operations and investment groups. The Board considered the structure of the investment personnel compensation program and whether this structure provides appropriate incentives to act in the best interests of the fund. Additionally, the Board considered the portfolio managers' investments, if any, in the funds that they manage.
Resources Dedicated to Investment Management and Support Services. The Board and the Fund Oversight and Research Committees reviewed the general qualifications and capabilities of Fidelity's investment staff, including its size, education, experience, and resources, as well as Fidelity's approach to recruiting, training, managing, and compensating investment personnel. The Board noted that Fidelity has continued to increase the resources devoted to non-U.S. offices, including expansion of Fidelity's global investment organization. The Board also noted that Fidelity's analysts have extensive resources, tools and capabilities that allow them to conduct sophisticated quantitative and fundamental analysis, as well as credit analysis of issuers, counterparties and guarantors. Further, the Board considered that Fidelity's investment professionals have sufficient access to global information and data so as to provide competitive investment results over time, and that those professionals also have access to sophisticated tools that permit them to assess portfolio construction and risk and performance attribution characteristics continuously, as well as to transmit new information and research conclusions rapidly around the world. Additionally, in its deliberations, the Board considered Fidelity's trading, risk management, compliance, and technology and operations capabilities and resources, which are integral parts of the investment management process.
Shareholder and Administrative Services. The Board considered (i) the nature, extent, quality, and cost of advisory, administrative, and shareholder services performed by FMR, the sub-advisers (together with FMR, the Investment Advisers), and their affiliates under the Advisory Contracts and under separate agreements covering transfer agency, pricing and bookkeeping, and securities lending services for the fund; (ii) the nature and extent of the supervision of third party service providers, principally custodians, subcustodians, and pricing vendors; and (iii) the resources devoted to, and the record of compliance with, the fund's compliance policies and procedures. The Board also reviewed the allocation of fund brokerage, including allocations to brokers affiliated with the Investment Advisers, the use of brokerage commissions to pay fund expenses, and the use of "soft" commission dollars to pay for research services.
The Board noted that the growth of fund assets over time across the complex allows Fidelity to reinvest in the development of services designed to enhance the value or convenience of the Fidelity funds as investment vehicles. These services include 24-hour access to account information and market information through telephone representatives and over the Internet, investor education materials and asset allocation tools, and the expanded availability of Fidelity Investor Centers.
In 2014, the Board formed an ad hoc Committee on Transfer Agency Fees to review the variety of transfer agency fee structures throughout the industry and Fidelity's competitive positioning with respect to industry participants.
Investment in a Large Fund Family. The Board considered the benefits to shareholders of investing in a Fidelity fund, including the benefits of investing in a fund that is part of a large family of funds offering a variety of investment disciplines and providing a large variety of mutual fund investor services. The Board noted that Fidelity had taken, or had made recommendations that resulted in the Fidelity funds taking, a number of actions over the previous year that benefited particular funds, including: (i) continuing to dedicate additional resources to investment research and to the support of the senior management team that oversees asset management; (ii) continuing efforts to enhance Fidelity's global research capabilities; (iii) launching new funds and making other enhancements to meet client needs; (iv) broadening eligibility requirements for certain lower-priced share classes of, and streamlining the fee structure for, certain existing equity index funds; (v) lowering expense caps for certain existing funds and classes to reduce expenses paid by shareholders; (vi) eliminating redemption fees for certain variable insurance product funds and classes; (vii) continuing to launch dedicated lower cost underlying funds to meet portfolio construction needs related to expanding underlying fund options for Fidelity funds of funds, specifically for the Freedom Fund product lines; (viii) launching a lower cost share class for use by the Freedom Index Fund product line; (ix) rationalizing product lines and gaining increased efficiencies through fund mergers and share class consolidations; (x) continuing to develop, acquire and implement systems and technology to improve services to the funds and shareholders, strengthen information security, and increase efficiency; (xi) implementing investment enhancements to further strengthen Fidelity's target date product line to increase investors' probability of success in achieving their goals; (xii) accelerating the conversion of all remaining Class B shares to Class A shares, which have a lower expense structure; and (xiii) implementing changes to Fidelity's money market fund product line in response to recent regulatory reforms.
Investment Performance. The Board considered whether the fund has operated in accordance with its investment objective, as well as its record of compliance with its investment restrictions and its performance history.
The Board took into account discussions with representatives of the Investment Advisers about fund investment performance that occur at Board meetings throughout the year. In this regard the Board noted that as part of regularly scheduled fund reviews and other reports to the Board on fund performance, the Board considers annualized return information for the fund, for different time periods, measured against a securities market index ("benchmark index") and a peer group of funds with similar objectives ("peer group"), if any. In its evaluation of fund investment performance, the Board gave particular attention to information indicating changes in performance of certain Fidelity funds for specific time periods and discussed with the Investment Advisers the reasons for any overperformance or underperformance.
In addition to reviewing absolute and relative fund performance, the Independent Trustees periodically consider the appropriateness of fund performance metrics in evaluating the results achieved. In general, the Independent Trustees believe that fund performance should be evaluated based on net performance (after fees and expenses) of both the highest performing and lowest performing fund share classes, where applicable, compared to appropriate benchmark indices, over appropriate time periods that may include full market cycles, and compared to peer groups, as applicable, over the same periods, taking into account relevant factors including the following: general market conditions; issuer-specific information; and fund cash flows and other factors.
The Independent Trustees recognize that shareholders evaluate performance on a net basis over their own holding periods, for which one-, three-, and five-year periods are often used as a proxy. For this reason, the performance information reviewed by the Board also included net cumulative calendar year total return information for the fund and an appropriate benchmark index and peer group for the most recent one-, three-, and five-year periods, as shown below. Returns are shown compared to the 25th percentile (top of box, 75% beaten) and 75th percentile (bottom of box, 25% beaten) of the peer universe.
Fidelity Dividend Growth Fund
The Board has discussed the fund's performance with FMR, including the fund's underperformance based on more recent periods ended after 2015 (which periods are not shown in the chart above) but prior to the date of the Board's approval of the renewal of the Advisory Contracts, and has engaged with FMR to consider what steps might be taken to remediate the fund's more recent underperformance. The Board noted that there was a portfolio management change for the fund in January 2014.
The Board also considered that the fund's management fee is subject to upward or downward adjustment depending upon whether, and to what extent, the fund's investment performance for the performance period exceeds, or is exceeded by, a securities index, thus leading to a performance adjustment for the same period. The Board noted that the performance adjustment provides FMR with a strong economic incentive to seek to achieve superior performance for the fund's shareholders and helps to more closely align the interests of FMR and the shareholders of the fund.
Based on its review, the Board concluded that the nature, extent, and quality of services provided to the fund under the Advisory Contracts should continue to benefit the shareholders of the fund.
Competitiveness of Management Fee and Total Expense Ratio. The Board considered the fund's management fee and total expense ratio compared to "mapped groups" of competitive funds and classes created for the purpose of facilitating the Trustees' competitive analysis of management fees and total expenses. Fidelity creates "mapped groups" by combining similar Broadridge investment objective categories that have comparable investment mandates. Combining Broadridge investment objective categories aids the Board's management fee and total expense ratio comparisons by broadening the competitive group used for comparison.
Management Fee. The Board considered two proprietary management fee comparisons for the 12-month periods shown in basis points (BP) in the chart below. The group of Broadridge funds used by the Board for management fee comparisons is referred to below as the "Total Mapped Group." The Total Mapped Group comparison focuses on a fund's standing in terms of gross management fees before expense reimbursements or caps, and without giving effect to the fund's performance adjustment, relative to the total universe of funds with comparable investment mandates, regardless of whether their management fee structures also are comparable. Funds with comparable investment mandates offer exposure to similar types of securities. Funds with comparable management fee structures have similar management fee contractual arrangements (
e.g., flat rate charged for advisory services, all-inclusive fee rate,
etc.). "TMG %" represents the percentage of funds in the Total Mapped Group that had management fees that were lower than the fund's. For example, a hypothetical TMG % of 20% would mean that 80% of the funds in the Total Mapped Group had higher, and 20% had lower, management fees than the fund. The fund's actual TMG %s and the number of funds in the Total Mapped Group are in the chart below. The "Asset-Size Peer Group" (ASPG) comparison focuses on a fund's standing relative to a subset of non-Fidelity funds within the Total Mapped Group that are similar in size and management fee structure without taking into account performance adjustments, if any. For example, if a fund is in the first quartile of the ASPG, the fund's management fee ranks in the least expensive or lowest 25% of funds in the ASPG. The ASPG represents at least 15% of the funds in the Total Mapped Group with comparable asset size and management fee structures, subject to a minimum of 50 funds (or all funds in the Total Mapped Group if fewer than 50). Additional information, such as the ASPG quartile in which the fund's management fee rate ranked and the impact of the fund's performance adjustment, is also included in the chart and considered by the Board.
Fidelity Dividend Growth Fund
The Board noted that the fund's management fee rate ranked below the median of its Total Mapped Group and below the median of its ASPG for 2015. The Board also noted the effect of the fund's performance adjustment, if any, on the fund's management fee ranking.
The Board noted that, in 2014, the ad hoc Committee on Group Fee was formed by it and the boards of other Fidelity funds to conduct an in-depth review of the "group fee" component of the management fee of funds with such management fee structures. The Committee's focus included the mechanics of the group fee, the competitive landscape of group fee structures, Fidelity funds with no group fee component and investment products not included in group fee assets. The Board also considered that, for funds subject to the group fee, FMR agreed to voluntarily waive fees over a specified period of time in amounts designed to account for assets converted from certain funds to certain collective investment trusts.
The Board also noted that, in 2013, the ad hoc Committee on Management Fees was formed to conduct an in-depth review of the management fee rates of Fidelity's active equity mutual funds. The Committee focused on the following areas: (i) standard fee structures; (ii) research consumption and trading evolution; (iii) management fee competitiveness/profitability by category; and (iv) factors that drive institutional pricing.
Based on its review, the Board concluded that the fund's management fee is fair and reasonable in light of the services that the fund receives and the other factors considered.
Total Expense Ratio. In its review of each class's total expense ratio, the Board considered the fund's management fee rate as well as other fund or class expenses, as applicable, such as transfer agent fees, pricing and bookkeeping fees, and custodial, legal, and audit fees. The Board noted the impact of the fund's performance adjustment. The Board also noted that Fidelity may agree to waive fees and expenses from time to time, and the extent to which, if any, it has done so for the fund. As part of its review, the Board also considered the current and historical total expense ratios of each class of the fund compared to competitive fund median expenses. Each class of the fund is compared to those funds and classes in the Total Mapped Group (used by the Board for management fee comparisons) that have a similar sales load structure.
The Board noted that the total expense ratio of each class ranked below the competitive median for 2015.
Fees Charged to Other Fidelity Clients. The Board also considered Fidelity fee structures and other information with respect to clients of Fidelity, such as other funds advised or subadvised by Fidelity, pension plan clients, and other institutional clients with similar mandates. The Board noted the findings of the 2013 ad hoc joint committee (created with the board of other Fidelity funds), which reviewed and compared Fidelity's institutional investment advisory business with its business of providing services to the Fidelity funds, including the differences in services provided, fees charged, and costs incurred, as well as competition in their respective marketplaces.
Based on its review of total expense ratios and fees charged to other Fidelity clients, the Board concluded that the total expense ratio of each class of the fund was reasonable in light of the services that the fund and its shareholders receive and the other factors considered.
Costs of the Services and Profitability. The Board considered the revenues earned and the expenses incurred by Fidelity in conducting the business of developing, marketing, distributing, managing, administering and servicing the fund and servicing the fund's shareholders. The Board also considered the level of Fidelity's profits in respect of all the Fidelity funds.
On an annual basis, Fidelity presents to the Board information about the profitability of its relationship with the fund. Fidelity calculates profitability information for each fund, as well as aggregate profitability information for groups of Fidelity funds and all Fidelity funds, using a series of detailed revenue and cost allocation methodologies which originate with the books and records of Fidelity on which Fidelity's audited financial statements are based. The Audit Committee of the Board reviews any significant changes from the prior year's methodologies.
PricewaterhouseCoopers LLP (PwC), independent registered public accounting firm and auditor to Fidelity and certain Fidelity funds, has been engaged annually by the Board as part of the Board's assessment of Fidelity's profitability analysis. PwC's engagement includes the review and assessment of the methodologies used by Fidelity in determining the revenues and expenses attributable to Fidelity's mutual fund business, and completion of agreed-upon procedures in respect of the mathematical accuracy of the fund profitability information and its conformity to established allocation methodologies. After considering PwC's reports issued under the engagement and information provided by Fidelity, the Board concluded that while other allocation methods may also be reasonable, Fidelity's profitability methodologies are reasonable in all material respects.
The Board also reviewed Fidelity's non-fund businesses and fall-out benefits related to the mutual fund business as well as cases where Fidelity's affiliates may benefit from or be related to the fund's business.
The Board considered the costs of the services provided by and the profits realized by Fidelity in connection with the operation of the fund and was satisfied that the profitability was not excessive.
Economies of Scale. The Board considered whether there have been economies of scale in respect of the management of the Fidelity funds, whether the Fidelity funds (including the fund) have appropriately benefited from any such economies of scale, and whether there is potential for realization of any further economies of scale. The Board considered the extent to which the fund will benefit from economies of scale as assets grow through increased services to the fund, through waivers or reimbursements, or through fee or expense ratio reductions. The Board also noted that in 2013, it and the boards of other Fidelity funds created an ad hoc committee (the Economies of Scale Committee) to analyze whether Fidelity attains economies of scale in respect of the management and servicing of the Fidelity funds, whether the Fidelity funds have appropriately benefited from such economies of scale, and whether there is potential for realization of any further economies of scale.
The Board recognized that the fund's management contract incorporates a "group fee" structure, which provides for lower group fee rates as total group assets increase, and for higher group fee rates as total group assets decrease (with "group assets" defined to include fund assets under FMR's management plus the assets of sector funds previously under FMR's management). FMR calculates the group fee rates based on a tiered asset "breakpoint" schedule that varies based on asset class. The Board considered that the group fee is designed to deliver the benefits of economies of scale to fund shareholders when total Fidelity fund assets increase, even if assets of any particular fund are unchanged or have declined, because some portion of Fidelity's costs are attributable to services provided to all Fidelity funds, and all funds benefit if those costs can be allocated among more assets. The Board concluded that, given the group fee structure, fund shareholders will benefit from lower management fees as group assets increase at the fund complex level, regardless of whether Fidelity achieves any such economies of scale.
The Board concluded, taking into account the analysis of the Economies of Scale Committee, that economies of scale, if any, are being appropriately shared between fund shareholders and Fidelity.
Additional Information Requested by the Board. In order to develop fully the factual basis for consideration of the Fidelity funds' Advisory Contracts, the Board requested and received additional information on certain topics, including: (i) fund performance trends and Fidelity's long-term strategies for certain funds; (ii) the various share classes employed by Fidelity and the attributes of each class, together with similar information on the distribution and servicing payments made by Fidelity or the funds to third-party participants in the distribution channels; (iii) fund profitability, and fund performance in relation to fund profitability; (iv) the methodology with respect to evaluating competitive fund data and peer group classifications and fee comparisons; (v) annual fund profitability margins; (vi) the realization of fall-out benefits in and attribution of fall-out benefits to certain Fidelity business units; (vii) the appropriateness of certain funds' benchmarks; (viii) the rationalization for certain share classes and expenses; (ix) sub-advisory fee rates for comparable investment mandates; (x) product strategy for certain underperforming funds; and (xi) Fidelity's resources and strategy for cybersecurity.
Based on its evaluation of all of the conclusions noted above, and after considering all factors it believed relevant, the Board concluded that the advisory fee structures are fair and reasonable, and that the fund's Advisory Contracts should be renewed.
Corporate Headquarters
245 Summer St.
Boston, MA 02210
www.fidelity.com
DGF-ANN-0916
1.536090.119
Fidelity® Series Real Estate Income Fund Fidelity® Series Real Estate Income Fund
Class F
Annual Report July 31, 2016 |
|
Contents
To view a fund's proxy voting guidelines and proxy voting record for the 12-month period ended June 30, visit http://www.fidelity.com/proxyvotingresults or visit the Securities and Exchange Commission's (SEC) web site at http://www.sec.gov.
You may also call 1-800-544-8544, or for Class F, call 1-800-835-5092, to request a free copy of the proxy voting guidelines.
Standard & Poor's, S&P and S&P 500 are registered service marks of The McGraw-Hill Companies, Inc. and have been licensed for use by Fidelity Distributors Corporation.
Other third-party marks appearing herein are the property of their respective owners.
All other marks appearing herein are registered or unregistered trademarks or service marks of FMR LLC or an affiliated company. © 2016 FMR LLC. All rights reserved.
This report and the financial statements contained herein are submitted for the general information of the shareholders of the Fund. This report is not authorized for distribution to prospective investors in the Fund unless preceded or accompanied by an effective prospectus.
A fund files its complete schedule of portfolio holdings with the SEC for the first and third quarters of each fiscal year on Form N-Q. Forms N-Q are available on the SEC’s web site at http://www.sec.gov. A fund's Forms N-Q may be reviewed and copied at the SEC’s Public Reference Room in Washington, DC. Information regarding the operation of the SEC's Public Reference Room may be obtained by calling 1-800-SEC-0330.
For a complete list of a fund's portfolio holdings, view the most recent holdings listing, semiannual report, or annual report on Fidelity's web site at http://www.fidelity.com, http://www.institutional.fidelity.com, or http://www.401k.com, as applicable.
NOT FDIC INSURED •MAY LOSE VALUE •NO BANK GUARANTEE
Neither the Fund nor Fidelity Distributors Corporation is a bank.
Performance: The Bottom Line
Average annual total return reflects the change in the value of an investment, assuming reinvestment of distributions from dividend income and capital gains (the profits earned upon the sale of securities that have grown in value, if any) and assuming a constant rate of performance each year. The hypothetical investment and the average annual total returns do not reflect the deduction of taxes that a shareholder would pay on fund distributions or the redemption of fund shares. During periods of reimbursement by Fidelity, a fund’s total return will be greater than it would be had the reimbursement not occurred. How a fund did yesterday is no guarantee of how it will do tomorrow.
Average Annual Total Returns
| For the periods ended July 31, 2016 | Past 1 year | Life of fundA |
| Fidelity® Series Real Estate Income Fund | 8.93% | 9.90% |
| Class F | 8.99% | 10.07% |
A From October 20, 2011
$10,000 Over Life of Fund
Let's say hypothetically that $10,000 was invested in Fidelity® Series Real Estate Income Fund, a class of the fund, on October 20, 2011, when the fund started.
The chart shows how the value of your investment would have changed, and also shows how the S&P 500® Index performed over the same period.
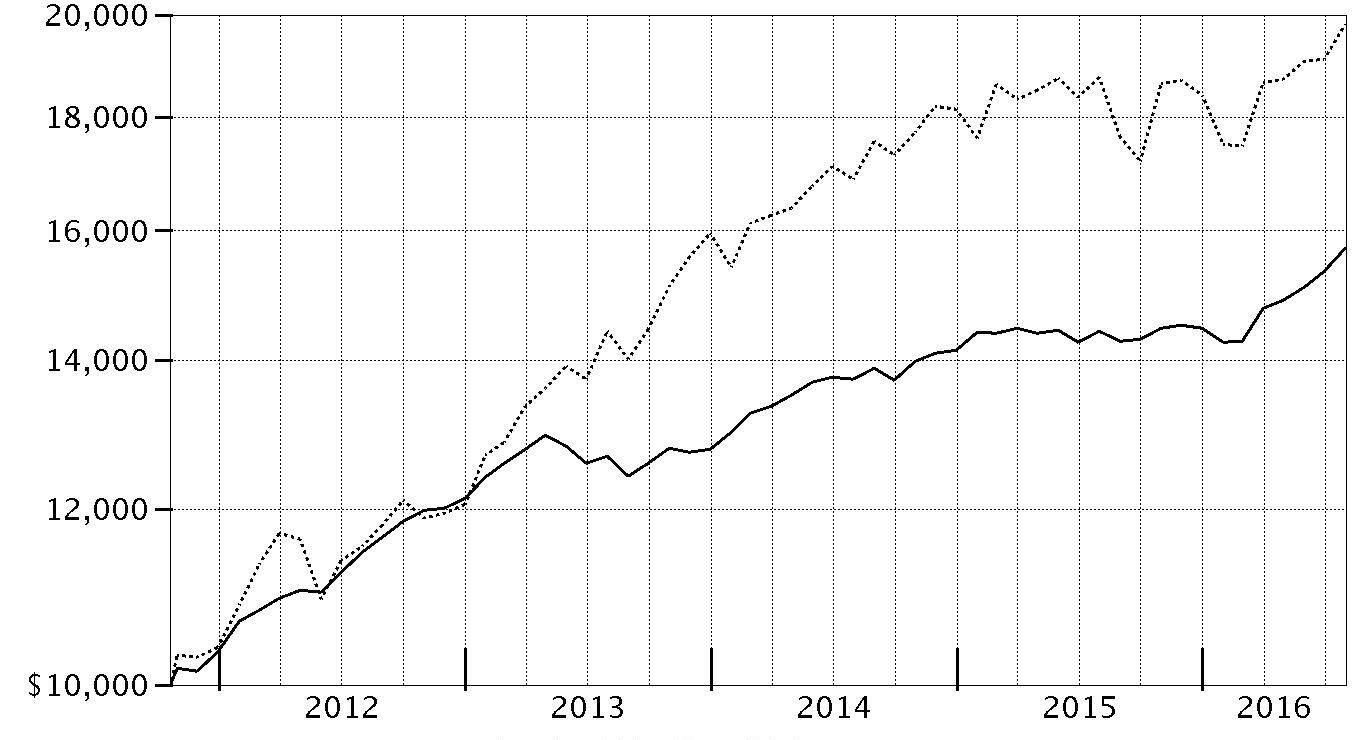
| Period Ending Values |
| $15,706 | Fidelity® Series Real Estate Income Fund |
| $19,812 | S&P 500® Index |
Management's Discussion of Fund Performance
Market Recap: Most types of real estate securities enjoyed a strong result for the 12 months ending July 31, 2016, due partly to investors’ continued search for yield. The fundamental backdrop remained solid across most property types and local markets, with the notable exceptions of hotels and, in certain markets, apartments. Real estate investment trust (REIT) common stocks performed particularly well the past 12 months, with the FTSE NAREIT All REITs Index gaining 21.53%, overcoming a two-month decline roughly midway through the period. Industrial REITs were particularly strong performers, as warehouse operators benefited from increased demand associated with e-commerce. Meanwhile, REIT preferred stocks, as measured by the MSCI REIT Preferred Index, rose 9.94%. Declining interest rates provided a tailwind for this rate-sensitive segment, as their income offerings became more attractive to investors seeking yield in a lower-rate environment. Looking at fixed-income securities, The BofA Merrill Lynch US Real Estate Index, a market-capitalization-weighted measure of investment-grade corporate debt in the domestic real estate sector, gained 7.88%.
Comments from Portfolio Manager Mark Snyderman: For the year, the fund’s share classes posted high single-digit gains, trailing the 10.12% advance of the Fidelity Series Real Estate Income Composite Index but well ahead of the broad equity market, as represented by the S&P 500
®, which returned 5.61%. The fund’s common stock and preferred equity investments performed well in a strong market for real estate securities. The fund's holdings in REIT common stocks gained about 25%, ahead of the roughly 22% gain produced by the FTSE NAREIT All REITs Index. Meanwhile, the fund's preferred stock investments advanced 11%, compared with 10% for the MSCI REIT Preferred Index. In aggregate, the fund's bond holdings did not fare as well and detracted from relative results. The fund’s high-yield and investment-grade real estate bond holdings each lagged the 8% gain of The BofA Merrill Lynch US Real Estate Index, while its CMBS holdings rose just 4%, reflecting the weaker performance of that asset class. I maintained a cash allocation of roughly 5%, on average. I typically like to hold anywhere from 5% to 10% in cash securities, as it provides flexibility to invest in companies I like at times when others may be forced to sell. With essentially zero yield, however, our cash allocation detracted from relative results.
The views expressed above reflect those of the portfolio manager(s) only through the end of the period as stated on the cover of this report and do not necessarily represent the views of Fidelity or any other person in the Fidelity organization. Any such views are subject to change at any time based upon market or other conditions and Fidelity disclaims any responsibility to update such views. These views may not be relied on as investment advice and, because investment decisions for a Fidelity fund are based on numerous factors, may not be relied on as an indication of trading intent on behalf of any Fidelity fund.
Investment Summary (Unaudited)
Top Five Stocks as of July 31, 2016
| | % of fund's net assets | % of fund's net assets 6 months ago |
| Acadia Realty Trust (SBI) | 1.9 | 1.9 |
| Equity Lifestyle Properties, Inc. | 1.9 | 2.3 |
| MFA Financial, Inc. | 1.4 | 1.4 |
| Ventas, Inc. | 1.2 | 1.0 |
| Stag Industrial, Inc. Series A, 9.00% | 0.8 | 0.9 |
| | 7.2 | |
Top 5 Bonds as of July 31, 2016
| | % of fund's net assets | % of fund's net assets 6 months ago |
| RWT Holdings, Inc. 5.625% 11/15/19 | 1.3 | 1.2 |
| Senior Housing Properties Trust 4.75% 5/1/24 | 1.2 | 0.1 |
| American Realty Capital Properties, Inc. 3.75% 12/15/20 | 1.2 | 0.2 |
| IAS Operating Partnership LP 5% 3/15/18 | 0.9 | 0.8 |
| RAIT Financial Trust 4% 10/1/33 | 0.8 | 0.7 |
| | 5.4 | |
Top Five REIT Sectors as of July 31, 2016
| | % of fund's net assets | % of fund's net assets 6 months ago |
| REITs - Mortgage | 17.1 | 16.7 |
| REITs - Health Care | 6.6 | 4.6 |
| REITs - Office Property | 4.5 | 4.5 |
| REITs - Diversified | 4.1 | 1.5 |
| REITs - Apartments | 3.9 | 4.1 |
Asset Allocation (% of fund's net assets)
| As of July 31, 2016* |
| | Common Stocks | 16.4% |
| | Bonds | 44.2% |
| | Convertible Securities | 8.1% |
| | Other Investments | 5.1% |
| | Short-Term Investments and Net Other Assets (Liabilities) | 3.5% |

* Foreign investments - 0.6%
| As of January 31, 2016* |
| | Common Stocks | 15.2% |
| | Preferred Stocks | 24.2% |
| | Bonds | 41.0% |
| | Convertible Securities | 7.2% |
| | Other Investments | 6.2% |
| | Short-Term Investments and Net Other Assets (Liabilities) | 6.2% |

* Foreign investments - 0.3%
Investments July 31, 2016
Showing Percentage of Net Assets
| Common Stocks - 16.4% | | | |
| | | Shares | Value |
| FINANCIALS - 16.4% | | | |
| Capital Markets - 0.2% | | | |
| Ellington Financial LLC | | 61,200 | $1,053,864 |
| NorthStar Asset Management Group, Inc. | | 49,800 | 590,628 |
| | | | 1,644,492 |
| Real Estate Investment Trusts - 16.0% | | | |
| Acadia Realty Trust (SBI) | | 451,900 | 17,018,543 |
| AG Mortgage Investment Trust, Inc. | | 12,800 | 191,744 |
| American Tower Corp. | | 18,700 | 2,164,899 |
| Annaly Capital Management, Inc. | | 61,604 | 676,412 |
| Anworth Mortgage Asset Corp. | | 191,300 | 941,196 |
| Apartment Investment & Management Co. Class A | | 135,200 | 6,215,144 |
| Arbor Realty Trust, Inc. | | 223,500 | 1,598,025 |
| AvalonBay Communities, Inc. | | 10,100 | 1,875,065 |
| Care Capital Properties, Inc. | | 8,200 | 242,556 |
| CBL & Associates Properties, Inc. | | 162,900 | 2,002,041 |
| Cedar Shopping Centers, Inc. | | 43,300 | 348,132 |
| Chimera Investment Corp. | | 28,700 | 481,586 |
| Community Healthcare Trust, Inc. | | 40,400 | 928,796 |
| CYS Investments, Inc. | | 73,600 | 658,720 |
| Douglas Emmett, Inc. | | 30,500 | 1,160,220 |
| Dynex Capital, Inc. | | 166,400 | 1,168,128 |
| Equity Lifestyle Properties, Inc. | | 206,881 | 17,013,893 |
| Extra Space Storage, Inc. | | 47,000 | 4,042,940 |
| First Potomac Realty Trust | | 134,300 | 1,357,773 |
| Five Oaks Investment Corp. | | 15,700 | 91,845 |
| Great Ajax Corp. | | 118,726 | 1,644,355 |
| Healthcare Realty Trust, Inc. | | 24,500 | 885,920 |
| Invesco Mortgage Capital, Inc. | | 85,800 | 1,235,520 |
| Lexington Corporate Properties Trust | | 440,800 | 4,791,496 |
| MFA Financial, Inc. | | 1,639,600 | 12,329,792 |
| Mid-America Apartment Communities, Inc. | | 47,700 | 5,057,154 |
| Monmouth Real Estate Investment Corp. Class A | | 47,100 | 650,922 |
| Monogram Residential Trust, Inc. | | 170,000 | 1,820,700 |
| National Retail Properties, Inc. | | 16,400 | 871,824 |
| New Residential Investment Corp. | | 175,000 | 2,392,250 |
| New Senior Investment Group, Inc. | | 182,599 | 2,189,362 |
| Newcastle Investment Corp. | | 153,599 | 728,059 |
| NorthStar Realty Finance Corp. | | 318,950 | 4,273,930 |
| Potlatch Corp. | | 93,500 | 3,576,375 |
| Public Storage | | 1,100 | 262,812 |
| Sabra Health Care REIT, Inc. | | 105,500 | 2,522,505 |
| Select Income REIT | | 36,000 | 999,360 |
| Senior Housing Properties Trust (SBI) | | 286,400 | 6,360,944 |
| Store Capital Corp. | | 113,200 | 3,530,708 |
| Terreno Realty Corp. | | 167,361 | 4,661,004 |
| Two Harbors Investment Corp. | | 248,000 | 2,170,000 |
| Ventas, Inc. | | 141,600 | 10,784,256 |
| VEREIT, Inc. | | 134,200 | 1,484,252 |
| WP Carey, Inc. | | 71,200 | 5,172,680 |
| | | | 140,573,838 |
| Real Estate Management & Development - 0.2% | | | |
| Kennedy-Wilson Holdings, Inc. | | 63,894 | 1,344,969 |
|
| TOTAL FINANCIALS | | | 143,563,299 |
|
| HEALTH CARE - 0.0% | | | |
| Health Care Providers & Services - 0.0% | | | |
| Chartwell Retirement Residence (a)(b) | | 14,700 | 178,564 |
| TOTAL COMMON STOCKS | | | |
| (Cost $103,737,935) | | | 143,741,863 |
|
| Preferred Stocks - 23.2% | | | |
| Convertible Preferred Stocks - 0.5% | | | |
| FINANCIALS - 0.5% | | | |
| Real Estate Investment Trusts - 0.5% | | | |
| Alexandria Real Estate Equities, Inc. Series D, 7.00% | | 8,241 | 290,330 |
| FelCor Lodging Trust, Inc. Series A, 1.95% | | 32,600 | 818,260 |
| Lexington Corporate Properties Trust Series C, 6.50% | | 70,019 | 3,546,462 |
| | | | 4,655,052 |
| Nonconvertible Preferred Stocks - 22.7% | | | |
| FINANCIALS - 22.7% | | | |
| Capital Markets - 0.1% | | | |
| Arlington Asset Investment Corp. 6.625% | | 31,528 | 715,686 |
| Real Estate Investment Trusts - 22.4% | | | |
| AG Mortgage Investment Trust, Inc.: | | | |
| 8.00% | | 136,534 | 3,396,966 |
| 8.25% | | 1,300 | 33,202 |
| Alexandria Real Estate Equities, Inc. Series E, 6.45% | | 24,001 | 624,026 |
| American Capital Agency Corp.: | | | |
| 8.00% | | 120,000 | 3,174,000 |
| Series B, 7.75% | | 29,100 | 760,674 |
| American Capital Mortgage Investment Corp. Series A, 8.125% | | 33,100 | 845,705 |
| American Homes 4 Rent: | | | |
| Series A, 5.00% | | 239,119 | 6,599,684 |
| Series B, 5.00% | | 135,263 | 3,733,259 |
| Series C, 5.50% | | 141,510 | 3,863,223 |
| Series D, 6.50% | | 40,000 | 1,064,400 |
| Series E, 6.35% | | 40,000 | 1,019,600 |
| Annaly Capital Management, Inc.: | | | |
| Series A, 7.875% | | 150,300 | 3,907,800 |
| Series C, 7.625% | | 25,139 | 652,106 |
| Series D, 7.50% | | 83,513 | 2,182,195 |
| Series E, 7.625% | | 118,588 | 3,074,987 |
| Anworth Mortgage Asset Corp. Series A, 8.625% | | 178,800 | 4,554,036 |
| Apollo Commercial Real Estate Finance, Inc. Series A, 8.625% | | 61,725 | 1,592,505 |
| Apollo Residential Mortgage, Inc. Series A, 8.00% | | 89,058 | 2,185,483 |
| Arbor Realty Trust, Inc.: | | | |
| 7.375% | | 20,000 | 511,400 |
| Series A, 8.25% | | 41,922 | 1,061,046 |
| Series B, 7.75% | | 40,000 | 1,000,000 |
| Series C, 8.50% | | 15,000 | 386,250 |
| Armour Residential REIT, Inc. Series B, 7.875% | | 25,701 | 600,118 |
| Ashford Hospitality Trust, Inc.: | | | |
| Series D, 8.45% | | 51,709 | 1,320,131 |
| Series E, 9.00% | | 43,100 | 1,086,551 |
| Series F, 7.375% | | 52,000 | 1,294,800 |
| Bluerock Residential Growth (REIT), Inc.: | | | |
| Series A, 8.25% | | 102,400 | 2,724,864 |
| Series C, 7.625% | | 24,700 | 645,905 |
| Brandywine Realty Trust Series E, 6.90% | | 21,000 | 542,850 |
| Capstead Mortgage Corp. Series E, 7.50% | | 37,016 | 939,836 |
| CBL & Associates Properties, Inc.: | | | |
| Series D, 7.375% | | 66,029 | 1,645,443 |
| Series E, 6.625% | | 28,126 | 712,432 |
| Cedar Shopping Centers, Inc. Series B, 7.25% | | 113,018 | 2,973,504 |
| Chesapeake Lodging Trust Series A, 7.75% | | 64,034 | 1,691,138 |
| Colony Financial, Inc.: | | | |
| Series A, 8.50% | | 77,829 | 2,029,780 |
| Series B, 7.50% | | 4,300 | 109,349 |
| Series C, 7.125% | | 107,128 | 2,646,062 |
| Coresite Realty Corp. Series A, 7.25% | | 42,600 | 1,126,770 |
| Corporate Office Properties Trust Series L, 7.375% | | 136,869 | 3,609,236 |
| CubeSmart Series A, 7.75% | | 40,000 | 1,025,600 |
| CYS Investments, Inc.: | | | |
| Series A, 7.75% | | 10,314 | 251,352 |
| Series B, 7.50% | | 113,333 | 2,672,392 |
| DDR Corp.: | | | |
| Series J, 6.50% | | 70,181 | 1,811,372 |
| Series K, 6.25% | | 25,489 | 659,910 |
| Digital Realty Trust, Inc.: | | | |
| Series E, 7.00% | | 40,181 | 1,023,410 |
| Series F, 6.625% | | 20,000 | 524,600 |
| Series G, 5.875% | | 28,270 | 739,826 |
| Series H, 7.375% | | 10,000 | 286,000 |
| DuPont Fabros Technology, Inc. Series C, 6.625% | | 16,000 | 449,920 |
| Dynex Capital, Inc.: | | | |
| Series A, 8.50% | | 96,313 | 2,451,166 |
| Series B, 7.625% | | 47,335 | 1,154,974 |
| Equity Lifestyle Properties, Inc. Series C, 6.75% | | 182,313 | 4,745,607 |
| Five Oaks Investment Corp. Series A, 8.75% | | 48,000 | 1,051,200 |
| General Growth Properties, Inc. Series A, 6.375% | | 34,690 | 919,285 |
| Gladstone Commercial Corp.: | | | |
| Series C, 7.125% | | 23,760 | 599,702 |
| Series D, 7.00% | | 40,000 | 1,021,200 |
| Government Properties Income Trust 5.875% | | 37,500 | 962,625 |
| Hersha Hospitality Trust Series D, 6.50% | | 40,000 | 1,011,600 |
| Hospitality Properties Trust Series D, 7.125% | | 40,200 | 1,059,672 |
| Invesco Mortgage Capital, Inc.: | | | |
| Series A, 7.75% | | 30,151 | 768,851 |
| Series B, 7.75% | | 178,398 | 4,543,797 |
| Investors Real Estate Trust Series B, 7.95% | | 33,428 | 880,828 |
| iStar Financial, Inc.: | | | |
| Series D, 8.00% | | 15,810 | 387,345 |
| Series E, 7.875% | | 43,106 | 1,028,940 |
| Series F, 7.80% | | 137,664 | 3,280,533 |
| Series G, 7.65% | | 84,000 | 1,965,600 |
| Kilroy Realty Corp.: | | | |
| Series G, 6.875% | | 20,300 | 521,507 |
| Series H, 6.375% | | 31,704 | 813,525 |
| LaSalle Hotel Properties: | | | |
| Series H, 7.50% | | 37,192 | 953,603 |
| Series I, 6.375% | | 47,339 | 1,230,814 |
| Series J, 6.30% | | 40,000 | 1,079,600 |
| MFA Financial, Inc.: | | | |
| 8.00% | | 108,747 | 2,787,186 |
| Series B, 7.50% | | 188,749 | 4,852,737 |
| Monmouth Real Estate Investment Corp. Series B, 7.875% | | 30,000 | 800,400 |
| National Retail Properties, Inc.: | | | |
| Series D, 6.625% | | 46,667 | 1,213,342 |
| Series E, 5.70% | | 46,124 | 1,223,208 |
| New York Mortgage Trust, Inc.: | | | |
| Series B, 7.75% | | 72,900 | 1,732,104 |
| Series C, 7.875% | | 111,185 | 2,621,742 |
| Newcastle Investment Corp.: | | | |
| Series B, 9.75% | | 3,602 | 93,544 |
| Series D, 8.375% | | 900 | 22,635 |
| NorthStar Realty Finance Corp.: | | | |
| Series A, 8.75% | | 1,500 | 38,160 |
| Series B, 8.25% | | 87,603 | 2,208,472 |
| Series C, 8.875% | | 115,595 | 2,975,415 |
| Series D, 8.50% | | 51,335 | 1,300,316 |
| Series E, 8.75% | | 93,516 | 2,377,177 |
| Pebblebrook Hotel Trust: | | | |
| Series B, 8.00% | | 37,400 | 949,586 |
| Series C, 6.50% | | 71,026 | 1,853,779 |
| Series D, 6.375% | | 50,000 | 1,387,500 |
| Pennsylvania (REIT) Series B, 7.375% | | 55,408 | 1,462,771 |
| Prologis, Inc. Series Q, 8.54% | | 15,800 | 1,114,395 |
| PS Business Parks, Inc.: | | | |
| Series S, 6.45% | | 5,665 | 148,026 |
| Series T, 6.00% | | 26,000 | 678,080 |
| Series U, 5.75% | | 102,483 | 2,664,558 |
| Public Storage Series Y, 6.375% | | 24,000 | 678,240 |
| RAIT Financial Trust: | | | |
| 7.125% | | 82,863 | 2,059,974 |
| 7.625% | | 46,080 | 1,078,733 |
| Regency Centers Corp.: | | | |
| Series 6, 6.625% | | 31,239 | 809,715 |
| Series 7, 6.00% | | 32,000 | 830,400 |
| Retail Properties America, Inc. Series A, 7.00% | | 83,617 | 2,257,659 |
| Sabra Health Care REIT, Inc. Series A, 7.125% | | 99,665 | 2,676,005 |
| Saul Centers, Inc. Series C, 6.875% | | 69,596 | 1,840,118 |
| Stag Industrial, Inc.: | | | |
| Series A, 9.00% | | 280,000 | 7,196,000 |
| Series B, 6.625% | | 10,000 | 263,400 |
| Series C, 6.875% | | 17,000 | 464,270 |
| Summit Hotel Properties, Inc.: | | | |
| Series A, 9.25% | | 173,700 | 4,498,830 |
| Series D, 6.45% | | 40,000 | 1,036,000 |
| Sun Communities, Inc. Series A, 7.125% | | 59,000 | 1,545,800 |
| Sunstone Hotel Investors, Inc.: | | | |
| Series E, 6.95% | | 8,000 | 218,000 |
| Series F, 6.45% | | 16,000 | 418,400 |
| Taubman Centers, Inc. Series K, 6.25% | | 19,561 | 512,303 |
| Terreno Realty Corp. Series A, 7.75% | | 81,048 | 2,142,099 |
| UMH Properties, Inc.: | | | |
| Series A, 8.25% | | 97,931 | 2,570,689 |
| Series B, 8.00% | | 151,800 | 4,113,780 |
| Urstadt Biddle Properties, Inc.: | | | |
| Series F, 7.125% | | 30,000 | 796,800 |
| Series G, 6.75% | | 33,500 | 908,185 |
| VEREIT, Inc. Series F, 6.70% | | 265,083 | 7,162,543 |
| Wells Fargo Real Estate Investment Corp. Series A, 6.375% | | 23,000 | 639,630 |
| Welltower, Inc. 6.50% | | 33,400 | 886,770 |
| WP Glimcher, Inc.: | | | |
| Series H, 7.50% | | 53,575 | 1,389,200 |
| Series I, 6.875% | | 3,183 | 84,668 |
| | | | 197,381,016 |
| Real Estate Management & Development - 0.2% | | | |
| Kennedy-Wilson, Inc. 7.75% | | 55,054 | 1,445,718 |
| TOTAL FINANCIALS | | | 199,542,420 |
| TOTAL PREFERRED STOCKS | | | |
| (Cost $192,766,291) | | | 204,197,472 |
| | | Principal Amount | Value |
|
| Corporate Bonds - 27.3% | | | |
| Convertible Bonds - 7.6% | | | |
| FINANCIALS - 7.6% | | | |
| Consumer Finance - 0.3% | | | |
| Zais Financial Partners LP 8% 11/15/16 (b) | | 3,000,000 | 2,977,500 |
| Diversified Financial Services - 1.3% | | | |
| RWT Holdings, Inc. 5.625% 11/15/19 | | 11,250,000 | 11,348,438 |
| Real Estate Investment Trusts - 5.0% | | | |
| American Realty Capital Properties, Inc. 3.75% 12/15/20 | | 10,060,000 | 10,185,750 |
| Apollo Commercial Real Estate Finance, Inc. 5.5% 3/15/19 | | 1,180,000 | 1,205,813 |
| Blackstone Mortgage Trust, Inc. 5.25% 12/1/18 | | 5,100,000 | 5,498,438 |
| Colony Financial, Inc.: | | | |
| 3.875% 1/15/21 | | 2,920,000 | 2,841,525 |
| 5% 4/15/23 | | 3,395,000 | 3,341,953 |
| PennyMac Corp. 5.375% 5/1/20 | | 6,434,000 | 6,208,810 |
| RAIT Financial Trust 4% 10/1/33 | | 7,750,000 | 7,047,656 |
| Redwood Trust, Inc. 4.625% 4/15/18 | | 2,200,000 | 2,200,000 |
| Resource Capital Corp.: | | | |
| 6% 12/1/18 | | 1,270,000 | 1,225,550 |
| 8% 1/15/20 | | 2,150,000 | 2,124,286 |
| Starwood Property Trust, Inc.: | | | |
| 3.75% 10/15/17 | | 1,130,000 | 1,149,775 |
| 4.55% 3/1/18 | | 780,000 | 831,188 |
| | | | 43,860,744 |
| Real Estate Management & Development - 0.1% | | | |
| Consolidated-Tomoka Land Co. 4.5% 3/15/20 | | 650,000 | 626,844 |
| Thrifts & Mortgage Finance - 0.9% | | | |
| IAS Operating Partnership LP 5% 3/15/18 (b) | | 8,160,000 | 8,078,400 |
| TOTAL FINANCIALS | | | 66,891,926 |
| Nonconvertible Bonds - 19.7% | | | |
| CONSUMER DISCRETIONARY - 5.1% | | | |
| Hotels, Restaurants & Leisure - 1.0% | | | |
| ESH Hospitality, Inc. 5.25% 5/1/25 (b) | | 2,960,000 | 2,945,200 |
| FelCor Lodging LP 6% 6/1/25 | | 1,380,000 | 1,424,850 |
| Hilton Worldwide Finance LLC/Hilton Worldwide Finance Corp. 5.625% 10/15/21 | | 1,555,000 | 1,611,431 |
| Times Square Hotel Trust 8.528% 8/1/26 (b) | | 2,334,309 | 2,770,746 |
| | | | 8,752,227 |
| Household Durables - 4.0% | | | |
| Ashton Woods U.S.A. LLC/Ashton Woods Finance Co. 6.875% 2/15/21 (b) | | 2,420,000 | 2,311,100 |
| Brookfield Residential Properties, Inc./Brookfield Residential U.S. Corp. 6.125% 7/1/22 (b) | | 1,060,000 | 1,049,400 |
| Brookfield Residential Properties, Inc.: | | | |
| 6.375% 5/15/25 (b) | | 2,000,000 | 1,930,000 |
| 6.5% 12/15/20 (b) | | 2,425,000 | 2,473,500 |
| CalAtlantic Group, Inc.: | | | |
| 5.875% 11/15/24 | | 630,000 | 672,525 |
| 8.375% 5/15/18 | | 3,737,000 | 4,110,700 |
| D.R. Horton, Inc.: | | | |
| 4.375% 9/15/22 | | 825,000 | 870,375 |
| 5.75% 8/15/23 | | 490,000 | 546,350 |
| KB Home: | | | |
| 8% 3/15/20 | | 2,395,000 | 2,646,475 |
| 9.1% 9/15/17 | | 1,185,000 | 1,264,988 |
| Lennar Corp.: | | | |
| 4.125% 12/1/18 | | 1,220,000 | 1,253,550 |
| 4.5% 6/15/19 | | 400,000 | 419,000 |
| M/I Homes, Inc. 6.75% 1/15/21 | | 735,000 | 757,050 |
| Meritage Homes Corp.: | | | |
| 6% 6/1/25 | | 2,085,000 | 2,172,320 |
| 7% 4/1/22 | | 2,005,000 | 2,200,488 |
| 7.15% 4/15/20 | | 1,940,000 | 2,119,450 |
| Ryland Group, Inc.: | | | |
| 6.625% 5/1/20 | | 445,000 | 493,950 |
| 8.4% 5/15/17 | | 1,446,000 | 1,514,685 |
| Taylor Morrison Communities, Inc./Monarch Communities, Inc. 5.875% 4/15/23 (b) | | 760,000 | 782,800 |
| William Lyon Homes, Inc.: | | | |
| 7% 8/15/22 | | 1,245,000 | 1,257,450 |
| 8.5% 11/15/20 | | 4,320,000 | 4,546,800 |
| | | | 35,392,956 |
| Media - 0.0% | | | |
| CBS Outdoor Americas Capital LLC/CBS Outdoor Americas Capital Corp. 5.625% 2/15/24 | | 240,000 | 253,200 |
| Multiline Retail - 0.1% | | | |
| JC Penney Corp., Inc. 5.875% 7/1/23 (b) | | 590,000 | 604,809 |
| TOTAL CONSUMER DISCRETIONARY | | | 45,003,192 |
| CONSUMER STAPLES - 0.3% | | | |
| Food & Staples Retailing - 0.3% | | | |
| Albertsons Companies LLC/Safeway, Inc./New Albertson's, Inc./Albertson's LLC 6.625% 6/15/24 (b) | | 915,000 | 972,188 |
| C&S Group Enterprises LLC 5.375% 7/15/22 (b) | | 1,140,000 | 1,094,400 |
| | | | 2,066,588 |
| FINANCIALS - 13.1% | | | |
| Diversified Financial Services - 0.7% | | | |
| Brixmor Operating Partnership LP 3.85% 2/1/25 | | 1,659,000 | 1,689,076 |
| Icahn Enterprises LP/Icahn Enterprises Finance Corp.: | | | |
| 5.875% 2/1/22 | | 820,000 | 783,100 |
| 6% 8/1/20 | | 3,810,000 | 3,800,475 |
| | | | 6,272,651 |
| Real Estate Investment Trusts - 9.6% | | | |
| American Campus Communities Operating Partnership LP 4.125% 7/1/24 | | 1,000,000 | 1,064,120 |
| ARC Properties Operating Partnership LP 4.6% 2/6/24 | | 1,640,000 | 1,713,800 |
| Care Capital Properties LP 5.125% 8/15/26 (b) | | 1,546,000 | 1,565,946 |
| CBL & Associates LP: | | | |
| 4.6% 10/15/24 | | 5,401,000 | 5,098,323 |
| 5.25% 12/1/23 | | 3,500,000 | 3,467,121 |
| Crown Castle International Corp. 5.25% 1/15/23 | | 1,500,000 | 1,716,990 |
| CTR Partnership LP/CareTrust Capital Corp. 5.875% 6/1/21 | | 3,015,000 | 3,090,375 |
| CubeSmart LP 4.8% 7/15/22 | | 1,000,000 | 1,111,659 |
| DCT Industrial Operating Partnership LP 4.5% 10/15/23 | | 2,000,000 | 2,126,786 |
| DDR Corp. 7.5% 7/15/18 | | 2,407,000 | 2,647,929 |
| DuPont Fabros Technology LP 5.875% 9/15/21 | | 2,000,000 | 2,096,250 |
| HCP, Inc. 4% 6/1/25 | | 2,000,000 | 2,045,898 |
| Health Care Property Investors, Inc. 6.3% 9/15/16 | | 3,850,000 | 3,871,240 |
| Health Care REIT, Inc.: | | | |
| 4% 6/1/25 | | 1,010,000 | 1,077,035 |
| 4.125% 4/1/19 | | 1,000,000 | 1,055,629 |
| Healthcare Realty Trust, Inc. 3.75% 4/15/23 | | 801,000 | 810,820 |
| Highwoods/Forsyth LP: | | | |
| 3.625% 1/15/23 | | 393,000 | 402,875 |
| 5.85% 3/15/17 | | 2,593,000 | 2,660,247 |
| Hospitality Properties Trust: | | | |
| 5% 8/15/22 | | 823,000 | 891,689 |
| 5.625% 3/15/17 | | 1,248,000 | 1,276,511 |
| 6.7% 1/15/18 | | 811,000 | 846,401 |
| iStar Financial, Inc.: | | | |
| 4% 11/1/17 | | 5,595,000 | 5,553,038 |
| 5% 7/1/19 | | 4,235,000 | 4,171,475 |
| 5.85% 3/15/17 | | 825,000 | 833,250 |
| 7.125% 2/15/18 | | 1,010,000 | 1,040,300 |
| 9% 6/1/17 | | 2,430,000 | 2,527,200 |
| Lexington Corporate Properties Trust 4.25% 6/15/23 | | 2,500,000 | 2,559,700 |
| MPT Operating Partnership LP/MPT Finance Corp.: | | | |
| 5.25% 8/1/26 | | 795,000 | 835,744 |
| 6.375% 2/15/22 | | 1,685,000 | 1,769,250 |
| 6.375% 3/1/24 | | 790,000 | 861,100 |
| Omega Healthcare Investors, Inc.: | | | |
| 4.5% 4/1/27 | | 455,000 | 453,697 |
| 4.95% 4/1/24 | | 627,000 | 651,858 |
| Potlatch Corp. 7.5% 11/1/19 | | 811,000 | 896,155 |
| Reckson Operating Partnership LP/SL Green Realty Corp./SL Green Operating Partnership LP 7.75% 3/15/20 | | 811,000 | 944,002 |
| Select Income REIT: | | | |
| 4.15% 2/1/22 | | 1,288,000 | 1,297,526 |
| 4.5% 2/1/25 | | 3,199,000 | 3,175,455 |
| Senior Housing Properties Trust: | | | |
| 4.75% 5/1/24 | | 10,025,000 | 10,340,336 |
| 6.75% 4/15/20 | | 576,000 | 636,500 |
| 6.75% 12/15/21 | | 2,000,000 | 2,306,138 |
| VEREIT Operating Partnership LP 4.875% 6/1/26 | | 2,055,000 | 2,157,750 |
| WP Carey, Inc. 4.6% 4/1/24 | | 645,000 | 671,048 |
| | | | 84,319,166 |
| Real Estate Management & Development - 2.5% | | | |
| CBRE Group, Inc.: | | | |
| 5% 3/15/23 | | 1,225,000 | 1,281,176 |
| 5.25% 3/15/25 | | 625,000 | 668,346 |
| Host Hotels & Resorts LP 6% 10/1/21 | | 485,000 | 552,462 |
| Howard Hughes Corp. 6.875% 10/1/21 (b) | | 5,295,000 | 5,493,563 |
| Hunt Companies, Inc. 9.625% 3/1/21 (b) | | 1,540,000 | 1,563,100 |
| Kennedy-Wilson, Inc. 5.875% 4/1/24 | | 5,500,000 | 5,555,000 |
| Mid-America Apartments LP: | | | |
| 3.75% 6/15/24 | | 337,000 | 353,503 |
| 6.05% 9/1/16 | | 1,216,000 | 1,220,092 |
| Realogy Group LLC/Realogy Co.-Issuer Corp.: | | | |
| 4.5% 4/15/19 (b) | | 1,005,000 | 1,042,688 |
| 4.875% 6/1/23 (b) | | 635,000 | 644,525 |
| 5.25% 12/1/21 (b) | | 1,610,000 | 1,682,450 |
| Regency Centers LP 5.875% 6/15/17 | | 364,000 | 376,994 |
| Taylor Morrison Communities, Inc./Monarch Communities, Inc. 5.625% 3/1/24 (b) | | 495,000 | 502,425 |
| Ventas Realty LP/Ventas Capital Corp. 4% 4/30/19 | | 597,000 | 629,790 |
| | | | 21,566,114 |
| Thrifts & Mortgage Finance - 0.3% | | | |
| Cantor Commercial Real Estate Co. LP/CCRE Finance Corp. 7.75% 2/15/18 (b) | | 1,025,000 | 1,014,750 |
| Ocwen Financial Corp. 6.625% 5/15/19 | | 2,840,000 | 1,995,100 |
| | | | 3,009,850 |
| TOTAL FINANCIALS | | | 115,167,781 |
| HEALTH CARE - 1.0% | | | |
| Health Care Providers & Services - 1.0% | | | |
| Sabra Health Care LP/Sabra Capital Corp.: | | | |
| 5.375% 6/1/23 | | 3,960,000 | 3,989,700 |
| 5.5% 2/1/21 | | 4,450,000 | 4,639,125 |
| | | | 8,628,825 |
| INDUSTRIALS - 0.1% | | | |
| Industrial Conglomerates - 0.1% | | | |
| Ladder Capital Finance Holdings LLLP/Ladder Capital Finance Corp. 7.375% 10/1/17 | | 785,000 | 794,813 |
| INFORMATION TECHNOLOGY - 0.1% | | | |
| Internet Software & Services - 0.1% | | | |
| CyrusOne LP/CyrusOne Finance Corp. 6.375% 11/15/22 | | 1,000,000 | 1,047,500 |
|
| TOTAL NONCONVERTIBLE BONDS | | | 172,708,699 |
|
| TOTAL CORPORATE BONDS | | | |
| (Cost $231,202,678) | | | 239,600,625 |
|
| Asset-Backed Securities - 2.7% | | | |
| American Homes 4 Rent: | | | |
| Series 2014-SFR1 Class E, 2.9461% 6/17/31 (b)(c) | | 1,302,000 | 1,245,662 |
| Series 2014-SFR3 Class E, 6.418% 12/17/36 (b) | | 1,740,000 | 1,907,773 |
| Series 2015-SFR1 Class E, 5.639% 4/17/52 (b) | | 1,354,586 | 1,408,862 |
| Series 2015-SFR2: | | | |
| Class E, 6.07% 10/17/45 (b) | | 1,624,000 | 1,739,067 |
| Class XS, 0% 10/17/45 (b)(c)(d) | | 959,560 | 10 |
| Colony American Homes Series 2014-2A Class F, 3.801% 7/17/31 (b)(c) | | 1,090,000 | 1,023,599 |
| Conseco Finance Securitizations Corp.: | | | |
| Series 2002-1 Class M2, 9.546% 12/1/33 | | 1,216,000 | 1,128,335 |
| Series 2002-2 Class M2, 9.163% 3/1/33 | | 1,993,712 | 1,746,359 |
| Deutsche Financial Capital Securitization LLC Series 1997-I Class M, 7.275% 9/15/27 | | 762,240 | 790,249 |
| Invitation Homes Trust: | | | |
| Series 2013-SFR1 Class F, 4.101% 12/17/30 (b)(c) | | 1,750,000 | 1,713,832 |
| Series 2014-SFR1 Class F, 4.1961% 6/17/31 (b)(c) | | 756,000 | 737,683 |
| Series 2014-SFR3: | | | |
| Class E, 4.9461% 12/17/31 (b)(c) | | 842,000 | 855,019 |
| Class F, 5.4461% 12/17/31 (b)(c) | | 426,000 | 429,331 |
| Series 2015-SFR2 Class E, 3.5971% 6/17/32 (b)(c) | | 450,000 | 441,855 |
| Series 2015-SFR3 Class F, 5.1961% 8/17/32 (b)(c) | | 2,000,000 | 2,003,672 |
| Lehman ABS Manufactured Housing Contract Trust Series 2001-B Class M2, 7.17% 4/15/40 | | 3,068,215 | 2,150,638 |
| Progress Residential Trust: | | | |
| Series 2015-SFR3 Class F, 6.643% 11/12/32 (b) | | 588,000 | 603,421 |
| Series 2016-SFR1 Class F, 5.4821% 9/17/33 (b)(c) | | 1,541,000 | 1,554,828 |
| Residential Asset Securities Corp. Series 2003-KS10 Class MI3, 6.41% 12/25/33 | | 211,372 | 169,669 |
| Starwood Waypoint Residential Trust Series 2014-1 Class F, 4.9961% 1/17/32 (b)(c) | | 780,000 | 771,337 |
| VB-S1 Issuer LLC Series 2016-1A Class F, 6.901% 6/15/46 (b) | | 1,453,000 | 1,458,949 |
| TOTAL ASSET-BACKED SECURITIES | | | |
| (Cost $22,830,312) | | | 23,880,150 |
|
| Collateralized Mortgage Obligations - 0.4% | | | |
| Private Sponsor - 0.4% | | | |
| FREMF Mortgage Trust: | | | |
| Series 2010-K6 Class B, 5.5327% 12/25/46 (b)(c) | | 811,000 | 885,172 |
| Series 2010-K7 Class B, 5.6244% 4/25/20 (b)(c) | | 2,605,000 | 2,901,201 |
| Merrill Lynch Mortgage Investors Trust Series 1998-C3 Class F, 6% 12/15/30 (b) | | 33,964 | 34,209 |
| TOTAL COLLATERALIZED MORTGAGE OBLIGATIONS | | | |
| (Cost $3,344,406) | | | 3,820,582 |
|
| Commercial Mortgage Securities - 21.4% | | | |
| Aventura Mall Trust Series 2013-AVM Class E, 3.8674% 12/5/32(b)(c) | | 2,000,000 | 2,031,846 |
| Banc of America Commercial Mortgage Trust Series 2005-1 Class CJ, 5.5273% 11/10/42 (c) | | 210,945 | 210,757 |
| Bank of America Commercial Mortgage Trust Series 2015-UBS7 Class D, 3.167% 9/15/48 | | 500,000 | 391,543 |
| Barclays Commercial Mortgage Securities LLC Series 2015-STP: | | | |
| Class E, 4.4272% 9/10/28 (b)(c) | | 1,613,000 | 1,500,382 |
| Class F, 4.4272% 9/10/28 (b)(c) | | 800,000 | 727,025 |
| Bear Stearns Commercial Mortgage Securities Trust, Series 2006-PWR11 Class AJ, 5.5616% 3/11/39 (c) | | 2,432,000 | 2,322,560 |
| BLCP Hotel Trust floater Series 2014-CLRN Class F, 3.5146% 8/15/29 (b)(c) | | 500,000 | 459,887 |
| CCRESG Commercial Mortgage Trust Series 2016-HEAT: | | | |
| Class E, 5.6712% 4/10/29 (b)(c) | | 806,000 | 781,953 |
| Class F, 5.6712% 4/10/29 (b)(c) | | 1,890,000 | 1,743,877 |
| CGBAM Commercial Mortgage Trust Series 2015-SMRT: | | | |
| Class E, 3.9121% 4/10/28 (b)(c) | | 561,000 | 541,617 |
| Class F, 3.9121% 4/10/28 (b)(c) | | 1,882,000 | 1,775,321 |
| CGGS Commercial Mortgage Trust Series 2016-RND Class DFL, 5.1921% 2/15/33 (b)(c) | | 400,000 | 406,426 |
| Chase Commercial Mortgage Securities Corp. Series 1998-1 Class H, 6.34% 5/18/30 (b) | | 1,593,026 | 1,654,266 |
| Citigroup Commercial Mortgage Trust: | | | |
| Series 2013-GC15 Class D, 5.2737% 9/10/46 (b)(c) | | 2,496,000 | 2,444,623 |
| Series 2015-SHP2 Class E, 4.7921% 7/15/27 (b)(c) | | 567,000 | 527,793 |
| COMM Mortgage Trust: | | | |
| sequential payer Series 2013-LC6 Class E, 3.5% 1/10/46 (b) | | 2,000,000 | 1,406,900 |
| Series 2013-CR10 Class D, 4.9493% 8/10/46 (b)(c) | | 1,300,000 | 1,175,876 |
| Series 2013-CR12 Class D, 5.2531% 10/10/46 (b)(c) | | 2,900,000 | 2,725,077 |
| Series 2013-CR6 Class F, 4.1715% 3/10/46 (b)(c) | | 1,459,000 | 937,551 |
| Series 2013-CR9 Class D, 4.3992% 7/10/45 (b)(c) | | 790,000 | 709,975 |
| Series 2013-LC6 Class D, 4.4274% 1/10/46 (b)(c) | | 2,397,000 | 2,236,126 |
| Series 2014-UBS2 Class D, 5.1822% 3/10/47 (b)(c) | | 537,000 | 465,550 |
| COMM Mortgage Trust pass-thru certificates Series 2005-LP5 Class F, 4.9948% 5/10/43 (b)(c) | | 2,000,000 | 1,997,333 |
| Commercial Mortgage Acceptance Corp. Series 1998-C2 Class J, 5.44% 9/15/30 (b) | | 948,842 | 928,427 |
| Commercial Mortgage Trust pass-thru certificates: | | | |
| Series 2012-CR1: | | | |
| Class C, 5.544% 5/15/45 (c) | | 3,000,000 | 3,359,583 |
| Class D, 5.544% 5/15/45 (b)(c) | | 1,917,000 | 1,992,550 |
| Class G, 2.462% 5/15/45 (b) | | 399,000 | 247,896 |
| Series 2012-CR2 Class D, 5.0166% 8/15/45 (b)(c) | | 500,000 | 511,451 |
| Series 2012-LC4: | | | |
| Class C, 5.8068% 12/10/44 (c) | | 780,000 | 889,903 |
| Class D, 5.8068% 12/10/44 (b)(c) | | 3,532,000 | 3,685,245 |
| Core Industrial Trust: | | | |
| Series 2015-TEXW Class F, 3.977% 2/10/34 (b)(c) | | 2,031,000 | 1,798,252 |
| Series 2015-WEST Class F, 4.3677% 2/10/37 (b)(c) | | 2,496,000 | 2,185,972 |
| Credit Suisse First Boston Mortgage Securities Corp. Series 1998-C2 Class F, 6.75% 11/15/30 (b) | | 82,071 | 82,840 |
| CSMC Trust floater Series 2015-DEAL: | | | |
| Class E, 4.481% 4/15/29 (b)(c) | | 2,000,000 | 1,908,528 |
| Class F, 5.231% 4/15/29 (b)(c) | | 2,947,000 | 2,867,875 |
| DBCCRE Mortgage Trust Series 2014-ARCP Class E, 5.099% 1/10/34 (b)(c) | | 2,047,000 | 1,927,298 |
| DBUBS Mortgage Trust: | | | |
| Series 2011-LC1A: | | | |
| Class E, 5.8835% 11/10/46 (b)(c) | | 2,745,000 | 3,007,952 |
| Class G, 4.652% 11/10/46 (b) | | 2,640,000 | 2,356,433 |
| Series 2011-LC3A Class D, 5.5485% 8/10/44 (b)(c) | | 728,000 | 782,405 |
| Extended Stay America Trust Series 2013-ESH7 Class C7, 3.9017% 12/5/31 (b) | | 2,000,000 | 2,012,368 |
| Freddie Mac pass-thru certificates: | | | |
| Series K011 Class X3, 2.6635% 12/25/43 (c)(d) | | 4,947,000 | 493,888 |
| Series K012 Class X3, 2.3286% 1/25/41 (c)(d) | | 2,799,987 | 248,679 |
| Series K013 Class X3, 2.8134% 1/25/43 (c)(d) | | 4,806,000 | 524,541 |
| GAHR Commercial Mortgage Trust Series 2015-NRF: | | | |
| Class EFX, 3.4949% 12/15/34 (b)(c) | | 2,947,000 | 2,884,836 |
| Class FFX, 3.4949% 12/15/34 (b)(c) | | 1,478,000 | 1,402,340 |
| GMAC Commercial Mortgage Securities, Inc. Series 1997-C2 Class G, 6.75% 4/15/29 (c) | | 320,441 | 327,833 |
| GP Portfolio Trust Series 2014-GPP Class E, 4.2921% 2/15/27 (b)(c) | | 1,615,000 | 1,549,668 |
| GS Mortgage Securities Trust: | | | |
| Series 2010-C2 Class D, 5.3573% 12/10/43 (b)(c) | | 2,000,000 | 2,055,268 |
| Series 2011-GC5 Class D, 5.5484% 8/10/44 (b)(c) | | 857,000 | 883,175 |
| Series 2012-GC6: | | | |
| Class C, 5.835% 1/10/45 (b)(c) | | 2,400,000 | 2,677,545 |
| Class D, 5.835% 1/10/45 (b)(c) | | 1,786,000 | 1,773,937 |
| Class E, 5% 1/10/45 (b)(c) | | 831,000 | 687,443 |
| Series 2012-GCJ7: | | | |
| Class C, 5.9132% 5/10/45 (c) | | 3,500,000 | 3,839,211 |
| Class D, 5.9132% 5/10/45 (b)(c) | | 3,425,000 | 3,394,475 |
| Class E, 5% 5/10/45 (b) | | 1,760,000 | 1,418,331 |
| Series 2012-GCJ9 Class D, 5.015% 11/10/45 (b)(c) | | 1,339,000 | 1,261,143 |
| Series 2013-GC14 Class D, 4.9269% 8/10/46 (b)(c) | | 320,000 | 307,937 |
| Series 2013-GC16: | | | |
| Class D, 5.4973% 11/10/46 (b)(c) | | 3,250,000 | 3,008,259 |
| Class F, 3.5% 11/10/46 (b) | | 1,428,000 | 963,645 |
| Series 2014-NEW Class D, 3.79% 1/10/31 (b) | | 490,000 | 483,521 |
| Series 2016-REMZ Class MZB, 7.727% 2/10/21 (b) | | 5,523,000 | 5,373,730 |
| Series 2016-RENT Class F, 4.2022% 2/10/29 (b)(c) | | 3,110,000 | 2,863,011 |
| Hilton U.S.A. Trust: | | | |
| floater Series 2014-ORL Class E, 3.6921% 7/15/29 (b)(c) | | 639,000 | 610,142 |
| Series 2013-HLT Class EFX, 4.6017% 11/5/30 (b)(c) | | 4,250,000 | 4,272,334 |
| Invitation Homes Trust floater Series 2013-SFR1 Class E, 3.101% 12/17/30 (b)(c) | | 1,500,000 | 1,465,792 |
| JPMorgan Chase Commercial Mortgage Securities Corp.: | | | |
| Series 2003-C1 Class F, 5.6132% 1/12/37 (b)(c) | | 756,000 | 746,774 |
| Series 2009-IWST Class D, 7.6935% 12/5/27 (b)(c) | | 2,779,000 | 3,167,892 |
| Series 2010-CNTR Class D, 6.3899% 8/5/32 (b)(c) | | 1,216,000 | 1,363,195 |
| Series 2012-CBX: | | | |
| Class C, 5.3934% 6/15/45 (c) | | 1,240,000 | 1,364,124 |
| Class E, 5.3934% 6/15/45 (b)(c) | | 865,000 | 884,150 |
| Class G 4% 6/15/45 (b) | | 805,000 | 564,051 |
| JPMorgan Chase Commercial Mortgage Securities Trust: | | | |
| floater Series 2014-INN: | | | |
| Class E, 4.081% 6/15/29 (b)(c) | | 1,059,000 | 1,024,462 |
| Class F, 4.481% 6/15/29 (b)(c) | | 1,255,000 | 1,204,622 |
| Series 2005-LDP2 Class C, 4.911% 7/15/42 (c) | | 4,000,000 | 3,995,840 |
| Series 2011-C3: | | | |
| Class E, 5.8013% 2/15/46 (b)(c) | | 526,000 | 562,015 |
| Class H, 4.409% 2/15/46 (b)(c) | | 1,320,000 | 1,088,388 |
| Series 2011-C4 Class E, 5.7148% 7/15/46 (b)(c) | | 1,390,000 | 1,454,986 |
| Series 2013-LC11: | | | |
| Class D, 4.3786% 4/15/46 (c) | | 500,000 | 471,705 |
| Class F, 3.25% 4/15/46 (b)(c) | | 482,000 | 286,779 |
| Series 2015-UES Class F, 3.7417% 9/5/32 (b)(c) | | 1,500,000 | 1,390,202 |
| LB-UBS Commercial Mortgage Trust Series 2006-C4 Class AJ, 5.9912% 6/15/38 (c) | | 247,796 | 247,674 |
| Merrill Lynch Mortgage Trust Series 2006-C1 Class AJ, 5.7424% 5/12/39 (c) | | 3,586,273 | 3,565,914 |
| Morgan Stanley BAML Trust: | | | |
| Series 2012-C6 Class D, 4.8125% 11/15/45 (b)(c) | | 2,000,000 | 2,026,012 |
| Series 2013-C12 Class D, 4.9246% 10/15/46 (b)(c) | | 1,500,000 | 1,439,974 |
| Series 2013-C13: | | | |
| Class D, 5.0548% 11/15/46 (b)(c) | | 2,879,000 | 2,812,494 |
| Class E, 5.0548% 11/15/46 (b)(c) | | 621,000 | 493,387 |
| Series 2013-C7 Class E, 4.4312% 2/15/46 (b)(c) | | 1,490,000 | 1,163,684 |
| Morgan Stanley Capital I Trust: | | | |
| sequential payer: | | | |
| Series 2006-HQ10 Class AM, 5.36% 11/12/41 | | 3,769,000 | 3,781,828 |
| Series 2012-C4 Class E, 5.7045% 3/15/45 (b)(c) | | 2,586,000 | 2,595,933 |
| Series 1997-RR Class F, 7.4205% 4/30/39 (b)(c) | | 93,074 | 92,135 |
| Series 1998-CF1 Class G, 7.35% 7/15/32 (b) | | 1,519,912 | 1,521,647 |
| Series 2006-IQ12 Class AMFX, 5.37% 12/15/43 | | 3,242,000 | 3,262,110 |
| Series 2011-C1 Class C, 5.6007% 9/15/47 (b)(c) | | 2,000,000 | 2,267,605 |
| Series 2011-C2: | | | |
| Class D, 5.6471% 6/15/44 (b)(c) | | 1,586,000 | 1,698,828 |
| Class E, 5.6471% 6/15/44 (b)(c) | | 1,946,000 | 2,042,666 |
| Class F, 5.6471% 6/15/44 (b)(c) | | 1,467,000 | 1,428,461 |
| Class XB, 0.6038% 6/15/44 (b)(c)(d) | | 51,641,000 | 1,194,069 |
| Series 2011-C3: | | | |
| Class C, 5.3479% 7/15/49 (b)(c) | | 2,000,000 | 2,229,481 |
| Class E, 5.3479% 7/15/49 (b)(c) | | 168,000 | 175,169 |
| Class G, 5.3479% 7/15/49 (b)(c) | | 606,000 | 477,876 |
| Series 2012-C4 Class D, 5.7045% 3/15/45 (b)(c) | | 1,640,000 | 1,724,370 |
| Series 2015-UBS8 Class D, 3.25% 12/15/48 (b) | | 987,000 | 729,838 |
| Motel 6 Trust Series 2015-MTL6: | | | |
| Class E, 5.2785% 2/5/30 (b) | | 5,094,000 | 5,088,974 |
| Class F, 5% 2/5/30 (b) | | 2,551,000 | 2,414,461 |
| MSJP Commercial Securities Mortgage Trust Series 2015-HAUL Class E, 5.0127% 9/5/47 (b)(c) | | 1,000,000 | 815,094 |
| Providence Place Group Ltd. Partnership Series 2000-C1 Class A2, 7.75% 7/20/28 (b) | | 1,285,266 | 1,533,194 |
| SCG Trust Series 2013-SRP1 Class D, 3.7764% 11/15/26 (b)(c) | | 2,153,000 | 2,025,230 |
| UBS Commercial Mortgage Trust Series 2012-C1: | | | |
| Class D, 5.7152% 5/10/45 (b)(c) | | 645,000 | 664,289 |
| Class E, 5% 5/10/45 (b)(c) | | 756,000 | 657,519 |
| UBS-BAMLL Trust Series 12-WRM Class D, 4.3793% 6/10/30 (b)(c) | | 1,460,000 | 1,423,755 |
| Wells Fargo Commercial Mortgage Trust Series 2016-C35 Class D, 3.142% 7/15/48 (b) | | 1,521,000 | 1,090,757 |
| WF-RBS Commercial Mortgage Trust: | | | |
| Series 2011-C3: | | | |
| Class C, 5.335% 3/15/44 (b) | | 2,100,000 | 2,291,481 |
| Class D, 5.8071% 3/15/44 (b)(c) | | 1,000,000 | 1,052,505 |
| Series 2011-C5: | | | |
| Class C, 5.8471% 11/15/44 (b)(c) | | 1,250,000 | 1,396,824 |
| Class F, 5.25% 11/15/44 (b)(c) | | 2,000,000 | 1,716,229 |
| Class G, 5.25% 11/15/44 (b)(c) | | 1,000,000 | 789,112 |
| Series 2012-C10 Class E, 4.6017% 12/15/45 (b)(c) | | 910,000 | 739,192 |
| Series 2012-C7 Class D, 4.9916% 6/15/45 (b)(c) | | 620,000 | 640,323 |
| Series 2013-C16 Class D, 5.1491% 9/15/46 (b)(c) | | 673,000 | 661,656 |
| Series 2013-UBS1 Class D, 4.7827% 3/15/46 (b)(c) | | 332,000 | 322,930 |
| WFCG Commercial Mortgage Trust floater Series 2015-BXRP: | | | |
| Class F, 4.1624% 11/15/29 (b)(c) | | 952,061 | 914,821 |
| Class G, 3.4621% 11/15/29 (b)(c) | | 927,958 | 855,633 |
| TOTAL COMMERCIAL MORTGAGE SECURITIES | | | |
| (Cost $178,191,908) | | | 188,124,245 |
|
| Bank Loan Obligations - 5.1% | | | |
| CONSUMER DISCRETIONARY - 1.9% | | | |
| Hotels, Restaurants & Leisure - 1.5% | | | |
| Caesars Entertainment Resort Properties LLC Tranche B 1LN, term loan 7% 10/11/20 (c) | | 3,168,750 | 3,091,116 |
| Caesars Growth Properties Holdings, LLC Tranche 1LN, term loan 6.25% 5/8/21 (c) | | 2,511,306 | 2,392,019 |
| Cooper Hotel Group 12% 11/6/17 | | 2,293,666 | 2,316,602 |
| Four Seasons Holdings, Inc. Tranche 2LN, term loan 7.75% 12/27/20 (c) | | 405,000 | 405,000 |
| Hilton Worldwide Finance, LLC Tranche B, term loan 3.5% 10/25/20 (c) | | 2,780,455 | 2,786,878 |
| La Quinta Intermediate Holdings LLC Tranche B LN, term loan 3.75% 4/14/21 (c) | | 2,013,107 | 1,995,492 |
| Playa Resorts Holding BV Tranche B, term loan 4% 8/9/19 (c) | | 235,164 | 233,988 |
| | | | 13,221,095 |
| Media - 0.2% | | | |
| CBS Outdoor Americas Capital LLC/CBS Outdoor Americas Capital Corp. Tranche B, term loan 3% 1/31/21 (c) | | 1,513,188 | 1,511,932 |
| Multiline Retail - 0.2% | | | |
| JC Penney Corp., Inc. Tranche B, term loan 5.25% 6/23/23 (c) | | 1,885,000 | 1,886,565 |
|
| TOTAL CONSUMER DISCRETIONARY | | | 16,619,592 |
|
| CONSUMER STAPLES - 0.4% | | | |
| Food & Staples Retailing - 0.4% | | | |
| Albertson's LLC: | | | |
| Tranche B 5LN, term loan 4.75% 12/21/22 (c) | | 1,117,513 | 1,122,944 |
| Tranche B 6LN, term loan 4.75% 6/22/23 (c) | | 2,375,000 | 2,389,345 |
| | | | 3,512,289 |
| ENERGY - 0.5% | | | |
| Oil, Gas & Consumable Fuels - 0.5% | | | |
| Moxie Patriot LLC Tranche B, term loan 6.75% 12/19/20 (c) | | 3,213,735 | 3,069,117 |
| TPF II Power, LLC Tranche B, term loan 5.5% 10/2/21 (c) | | 1,574,129 | 1,580,426 |
| | | | 4,649,543 |
| FINANCIALS - 1.0% | | | |
| Real Estate Investment Trusts - 0.5% | | | |
| iStar Financial, Inc. Tranche B, term loan 5.5% 7/1/20 (c) | | 1,565,000 | 1,575,767 |
| Starwood Property Trust, Inc. Tranche B, term loan 3.5% 4/17/20 (c) | | 2,424,812 | 2,421,029 |
| | | | 3,996,796 |
| Real Estate Management & Development - 0.4% | | | |
| Americold Realty Operating Partnership LP Tranche B, term loan 5.75% 12/1/22 (c) | | 2,205,610 | 2,227,666 |
| NorthStar Asset Management LP Tranche B 1LN, term loan 4.6265% 1/29/23 (c) | | 987,525 | 983,002 |
| Realogy Group LLC Tranche B, term loan 3.75% 7/20/22 (c) | | 600,000 | 603,000 |
| | | | 3,813,668 |
| Thrifts & Mortgage Finance - 0.1% | | | |
| Ocwen Loan Servicing, LLC Tranche B, term loan 5.5% 2/15/18 (c) | | 1,137,490 | 1,120,428 |
|
| TOTAL FINANCIALS | | | 8,930,892 |
|
| HEALTH CARE - 0.3% | | | |
| Health Care Providers & Services - 0.3% | | | |
| Community Health Systems, Inc.: | | | |
| Tranche F, term loan 3.9241% 12/31/18 (c) | | 878,235 | 869,611 |
| Tranche H, term loan 4% 1/27/21 (c) | | 1,544,232 | 1,524,450 |
| | | | 2,394,061 |
| INDUSTRIALS - 0.3% | | | |
| Commercial Services & Supplies - 0.1% | | | |
| Pilot Travel Centers LLC Tranche B, term loan 3.2456% 5/25/23 (c) | | 784,075 | 787,015 |
| Construction & Engineering - 0.2% | | | |
| Drumm Investors LLC Tranche B, term loan 9.5% 5/4/18 (c) | | 1,489,763 | 1,458,731 |
|
| TOTAL INDUSTRIALS | | | 2,245,746 |
|
| UTILITIES - 0.7% | | | |
| Electric Utilities - 0.4% | | | |
| Calpine Construction Finance Co. LP Tranche B 2LN, term loan 3.25% 1/31/22 (c) | | 974,948 | 961,299 |
| Dynegy Finance IV, Inc. Tranche C, term loan 5% 6/27/23 (c) | | 780,000 | 780,000 |
| Essential Power LLC Tranche B, term loan 4.75% 8/8/19 (c) | | 1,607,390 | 1,591,316 |
| Southeast Powergen LLC Tranche B, term loan 4.5% 12/2/21 (c) | | 510,256 | 491,759 |
| | | | 3,824,374 |
| Independent Power and Renewable Electricity Producers - 0.3% | | | |
| APLP Holdings LP Tranche B, term loan 6% 4/13/23 (c) | | 1,373,847 | 1,377,281 |
| Tempus Public Foundation Generation Holdings LLC Tranche B, term loan 4.75% 12/31/17 (c) | | 1,280,154 | 1,231,085 |
| | | | 2,608,366 |
|
| TOTAL UTILITIES | | | 6,432,740 |
|
| TOTAL BANK LOAN OBLIGATIONS | | | |
| (Cost $44,912,129) | | | 44,784,863 |
| | | Shares | Value |
|
| Money Market Funds - 3.0% | | | |
| Fidelity Cash Central Fund, 0.42% (e) | | | |
| (Cost $26,354,309) | | 26,354,309 | 26,354,309 |
| TOTAL INVESTMENT PORTFOLIO - 99.5% | | | |
| (Cost $803,339,968) | | | 874,504,109 |
| NET OTHER ASSETS (LIABILITIES) - 0.5% | | | 4,447,406 |
| NET ASSETS - 100% | | | $878,951,515 |
Legend
(a) Non-income producing
(b) Security exempt from registration under Rule 144A of the Securities Act of 1933. These securities may be resold in transactions exempt from registration, normally to qualified institutional buyers. At the end of the period, the value of these securities amounted to $222,220,088 or 25.3% of net assets.
(c) Coupon rates for floating and adjustable rate securities reflect the rates in effect at period end.
(d) Security represents right to receive monthly interest payments on an underlying pool of mortgages or assets. Principal shown is the outstanding par amount of the pool as of the end of the period.
(e) Affiliated fund that is generally available only to investment companies and other accounts managed by Fidelity Investments. The rate quoted is the annualized seven-day yield of the fund at period end. A complete unaudited listing of the fund's holdings as of its most recent quarter end is available upon request. In addition, each Fidelity Central Fund's financial statements, which are not covered by the Fund's Report of Independent Registered Public Accounting Firm, are available on the SEC's website or upon request.
Affiliated Central Funds
Information regarding fiscal year to date income earned by the Fund from investments in Fidelity Central Funds is as follows:
| Fund | Income earned |
| Fidelity Cash Central Fund | $135,244 |
| Total | $135,244 |
Investment Valuation
The following is a summary of the inputs used, as of July 31, 2016, involving the Fund's assets and liabilities carried at fair value. The inputs or methodology used for valuing securities may not be an indication of the risk associated with investing in those securities. For more information on valuation inputs, and their aggregation into the levels used below, please refer to the Investment Valuation section in the accompanying Notes to Financial Statements.
| | Valuation Inputs at Reporting Date: |
| Description | Total | Level 1 | Level 2 | Level 3 |
| Investments in Securities: | | | | |
| Equities: | | | | |
| Financials | $347,760,771 | $345,683,751 | $2,077,020 | $-- |
| Health Care | 178,564 | 178,564 | -- | -- |
| Corporate Bonds | 239,600,625 | -- | 239,600,625 | -- |
| Asset-Backed Securities | 23,880,150 | -- | 21,559,843 | 2,320,307 |
| Collateralized Mortgage Obligations | 3,820,582 | -- | 3,820,582 | -- |
| Commercial Mortgage Securities | 188,124,245 | -- | 183,818,980 | 4,305,265 |
| Bank Loan Obligations | 44,784,863 | -- | 42,468,261 | 2,316,602 |
| Money Market Funds | 26,354,309 | 26,354,309 | -- | -- |
| Total Investments in Securities: | $874,504,109 | $372,216,624 | $493,345,311 | $8,942,174 |
The following is a reconciliation of Investments in Securities for which Level 3 inputs were used in determining value:
| Investments in Securities: | |
| Beginning Balance | $4,880,158 |
| Net Realized Gain (Loss) on Investment Securities | 17,905 |
| Net Unrealized Gain (Loss) on Investment Securities | (165,014) |
| Cost of Purchases | 48,693 |
| Proceeds of Sales | (392,112) |
| Amortization/Accretion | 184,661 |
| Transfers into Level 3 | 4,773,896 |
| Transfers out of Level 3 | (406,013) |
| Ending Balance | $8,942,174 |
| The change in unrealized gain (loss) for the period attributable to Level 3 securities held at July 31, 2016 | $(164,287) |
The information used in the above reconciliation represents fiscal year to date activity for any Investments in Securities identified as using Level 3 inputs at either the beginning or the end of the current fiscal period. Transfers in or out of Level 3 represent the beginning value of any Security or Instrument where a change in the pricing level occurred from the beginning to the end of the period. The cost of purchases and the proceeds of sales may include securities received or delivered through corporate actions or exchanges. Realized and unrealized gains (losses) disclosed in the reconciliation are included in Net Gain (Loss) on the Fund's Statement of Operations.
Other Information
The composition of credit quality ratings as a percentage of Total Net Assets is as follows (Unaudited):
| U.S. Government and U.S. Government Agency Obligations | 0.5% |
| AAA,AA,A | 5.2% |
| BBB | 13.0% |
| BB | 12.2% |
| B | 10.9% |
| CCC,CC,C | 1.4% |
| Not Rated | 13.7% |
| Equities | 39.6% |
| Short-Term Investments and Net Other Assets | 3.5% |
We have used ratings from Moody's Investors Service, Inc. Where Moody's® ratings are not available, we have used S&P® ratings. All ratings are as of the date indicated and do not reflect subsequent changes.
See accompanying notes which are an integral part of the financial statements.
Financial Statements
Statement of Assets and Liabilities
| | | July 31, 2016 |
| Assets | | |
Investment in securities, at value — See accompanying schedule:
Unaffiliated issuers (cost $776,985,659) | $848,149,800 | |
| Fidelity Central Funds (cost $26,354,309) | 26,354,309 | |
| Total Investments (cost $803,339,968) | | $874,504,109 |
| Cash | | 119,679 |
| Receivable for investments sold | | 3,543,386 |
| Receivable for fund shares sold | | 722,386 |
| Dividends receivable | | 293,657 |
| Interest receivable | | 4,612,976 |
| Distributions receivable from Fidelity Central Funds | | 8,710 |
| Other receivables | | 2,509 |
| Total assets | | 883,807,412 |
| Liabilities | | |
| Payable for investments purchased | $4,177,680 | |
| Payable for fund shares redeemed | 118,225 | |
| Accrued management fee | 396,546 | |
| Other affiliated payables | 84,685 | |
| Other payables and accrued expenses | 78,761 | |
| Total liabilities | | 4,855,897 |
| Net Assets | | $878,951,515 |
| Net Assets consist of: | | |
| Paid in capital | | $789,591,146 |
| Undistributed net investment income | | 7,560,289 |
| Accumulated undistributed net realized gain (loss) on investments and foreign currency transactions | | 10,635,935 |
| Net unrealized appreciation (depreciation) on investments and assets and liabilities in foreign currencies | | 71,164,145 |
| Net Assets | | $878,951,515 |
| Series Real Estate Income: | | |
| Net Asset Value, offering price and redemption price per share ($411,102,468 ÷ 35,971,965 shares) | | $11.43 |
| Class F: | | |
| Net Asset Value, offering price and redemption price per share ($467,849,047 ÷ 40,920,062 shares) | | $11.43 |
See accompanying notes which are an integral part of the financial statements.
Statement of Operations
| | | Year ended July 31, 2016 |
| Investment Income | | |
| Dividends | | $18,845,685 |
| Interest | | 27,430,214 |
| Income from Fidelity Central Funds | | 135,244 |
| Total income | | 46,411,143 |
| Expenses | | |
| Management fee | $4,568,622 | |
| Transfer agent fees | 636,129 | |
| Accounting fees and expenses | 363,215 | |
| Custodian fees and expenses | 15,143 | |
| Independent trustees' fees and expenses | 3,657 | |
| Audit | 98,394 | |
| Legal | 2,081 | |
| Miscellaneous | 6,226 | |
| Total expenses before reductions | 5,693,467 | |
| Expense reductions | (14,369) | 5,679,098 |
| Net investment income (loss) | | 40,732,045 |
| Realized and Unrealized Gain (Loss) | | |
| Net realized gain (loss) on: | | |
| Investment securities: | | |
| Unaffiliated issuers | 12,176,033 | |
| Foreign currency transactions | (16) | |
| Total net realized gain (loss) | | 12,176,017 |
Change in net unrealized appreciation (depreciation) on:
Investment securities | 20,087,431 | |
| Assets and liabilities in foreign currencies | 9 | |
| Total change in net unrealized appreciation (depreciation) | | 20,087,440 |
| Net gain (loss) | | 32,263,457 |
| Net increase (decrease) in net assets resulting from operations | | $72,995,502 |
See accompanying notes which are an integral part of the financial statements.
Statement of Changes in Net Assets
| | Year ended July 31, 2016 | Year ended July 31, 2015 |
| Increase (Decrease) in Net Assets | | |
| Operations | | |
| Net investment income (loss) | $40,732,045 | $42,892,013 |
| Net realized gain (loss) | 12,176,017 | 10,015,807 |
| Change in net unrealized appreciation (depreciation) | 20,087,440 | (10,965,973) |
| Net increase (decrease) in net assets resulting from operations | 72,995,502 | 41,941,847 |
| Distributions to shareholders from net investment income | (41,006,599) | (45,472,455) |
| Distributions to shareholders from net realized gain | (8,001,126) | (20,829,892) |
| Total distributions | (49,007,725) | (66,302,347) |
| Share transactions - net increase (decrease) | 25,779,137 | 24,549,288 |
| Total increase (decrease) in net assets | 49,766,914 | 188,788 |
| Net Assets | | |
| Beginning of period | 829,184,601 | 828,995,813 |
| End of period | $878,951,515 | $829,184,601 |
| Other Information | | |
| Undistributed net investment income end of period | $7,560,289 | $7,902,882 |
See accompanying notes which are an integral part of the financial statements.
Financial Highlights — Fidelity Series Real Estate Income Fund
| Years ended July 31, | 2016 | 2015 | 2014 | 2013 | 2012 A |
| Selected Per–Share Data | | | | | |
| Net asset value, beginning of period | $11.13 | $11.47 | $11.41 | $11.10 | $10.00 |
| Income from Investment Operations | | | | | |
| Net investment income (loss)B | .52 | .56 | .58 | .67 | .47 |
| Net realized and unrealized gain (loss) | .42 | (.01) | .31 | .46 | .97 |
| Total from investment operations | .94 | .55 | .89 | 1.13 | 1.44 |
| Distributions from net investment income | (.53) | (.61) | (.59) | (.66) | (.33) |
| Distributions from net realized gain | (.11) | (.29) | (.24) | (.16) | (.01) |
| Total distributions | (.64) | (.89)C | (.83) | (.82) | (.34) |
| Net asset value, end of period | $11.43 | $11.13 | $11.47 | $11.41 | $11.10 |
| Total ReturnD,E | 8.93% | 5.05% | 8.33% | 10.50% | 14.67% |
| Ratios to Average Net AssetsF,G | | | | | |
| Expenses before reductions | .77% | .77% | .77% | .79% | .80%H |
| Expenses net of fee waivers, if any | .77% | .77% | .77% | .79% | .80%H |
| Expenses net of all reductions | .77% | .77% | .77% | .79% | .80%H |
| Net investment income (loss) | 4.81% | 5.03% | 5.15% | 5.85% | 5.70%H |
| Supplemental Data | | | | | |
| Net assets, end of period (000 omitted) | $411,102 | $401,861 | $409,084 | $415,192 | $416,151 |
| Portfolio turnover rateI | 24% | 19% | 33% | 25% | 29%H |
A For the period October 20, 2011 (commencement of operations) to July 31, 2012.
B Calculated based on average shares outstanding during the period.
C Total distributions of $.89 per share is comprised of distributions from net investment income of $.606 and distributions from net realized gain of $.288 per share.
D Total returns for periods of less than one year are not annualized.
E Total returns would have been lower if certain expenses had not been reduced during the applicable periods shown.
F Fees and expenses of any underlying Fidelity Central Funds are not included in the Fund's expense ratio. The Fund indirectly bears its proportionate share of the expenses of any underlying Fidelity Central Funds.
G Expense ratios reflect operating expenses of the class. Expenses before reductions do not reflect amounts reimbursed by the investment adviser or reductions from brokerage service arrangements or reductions from other expense offset arrangements and do not represent the amount paid by the class during periods when reimbursements or reductions occur. Expense ratios before reductions for start-up periods may not be representative of longer-term operating periods. Expenses net of fee waivers reflect expenses after reimbursement by the investment adviser but prior to reductions from brokerage service arrangements or other expense offset arrangements. Expenses net of all reductions represent the net expenses paid by the class.
H Annualized
I Amount does not include the portfolio activity of any underlying Fidelity Central Funds.
See accompanying notes which are an integral part of the financial statements.
Financial Highlights — Fidelity Series Real Estate Income Fund Class F
| Years ended July 31, | 2016 | 2015 | 2014 | 2013 | 2012 A |
| Selected Per–Share Data | | | | | |
| Net asset value, beginning of period | $11.14 | $11.48 | $11.41 | $11.11 | $10.00 |
| Income from Investment Operations | | | | | |
| Net investment income (loss)B | .54 | .58 | .60 | .69 | .48 |
| Net realized and unrealized gain (loss) | .41 | (.01) | .32 | .45 | .98 |
| Total from investment operations | .95 | .57 | .92 | 1.14 | 1.46 |
| Distributions from net investment income | (.55) | (.62) | (.60) | (.68) | (.34) |
| Distributions from net realized gain | (.11) | (.29) | (.24) | (.16) | (.01) |
| Total distributions | (.66) | (.91) | (.85)C | (.84) | (.35) |
| Net asset value, end of period | $11.43 | $11.14 | $11.48 | $11.41 | $11.11 |
| Total ReturnD,E | 8.99% | 5.22% | 8.60% | 10.60% | 14.89% |
| Ratios to Average Net AssetsF,G | | | | | |
| Expenses before reductions | .61% | .61% | .61% | .61% | .62%H |
| Expenses net of fee waivers, if any | .61% | .61% | .61% | .61% | .62%H |
| Expenses net of all reductions | .61% | .61% | .61% | .61% | .62%H |
| Net investment income (loss) | 4.97% | 5.19% | 5.32% | 6.02% | 5.88%H |
| Supplemental Data | | | | | |
| Net assets, end of period (000 omitted) | $467,849 | $427,323 | $419,911 | $391,490 | $286,854 |
| Portfolio turnover rateI | 24% | 19% | 33% | 25% | 29%H |
A For the period October 20, 2011 (commencement of operations) to July 31, 2012.
B Calculated based on average shares outstanding during the period.
C Total distributions of $.85 per share is comprised of distributions from net investment income of $.604 and distributions from net realized gain of $.242 per share.
D Total returns for periods of less than one year are not annualized.
E Total returns would have been lower if certain expenses had not been reduced during the applicable periods shown.
F Fees and expenses of any underlying Fidelity Central Funds are not included in the Fund's expense ratio. The Fund indirectly bears its proportionate share of the expenses of any underlying Fidelity Central Funds.
G Expense ratios reflect operating expenses of the class. Expenses before reductions do not reflect amounts reimbursed by the investment adviser or reductions from brokerage service arrangements or reductions from other expense offset arrangements and do not represent the amount paid by the class during periods when reimbursements or reductions occur. Expense ratios before reductions for start-up periods may not be representative of longer-term operating periods. Expenses net of fee waivers reflect expenses after reimbursement by the investment adviser but prior to reductions from brokerage service arrangements or other expense offset arrangements. Expenses net of all reductions represent the net expenses paid by the class.
H Annualized
I Amount does not include the portfolio activity of any underlying Fidelity Central Funds.
See accompanying notes which are an integral part of the financial statements.
Notes to Financial Statements
For the period ended July 31, 2016
1. Organization.
Fidelity Series Real Estate Income Fund (the Fund) is a fund of Fidelity Securities Fund (the Trust) and is authorized to issue an unlimited number of shares. Shares of the Fund are only available for purchase by mutual funds for which Fidelity Management & Research Company (FMR) or an affiliate serves as an investment manager. The Trust is registered under the Investment Company Act of 1940, as amended (the 1940 Act), as an open-end management investment company organized as a Massachusetts business trust. The Fund offers Series Real Estate Income and Class F shares, each of which has equal rights as to assets and voting privileges. Each class has exclusive voting rights with respect to matters that affect that class.
2. Investments in Fidelity Central Funds.
The Fund invests in Fidelity Central Funds, which are open-end investment companies generally available only to other investment companies and accounts managed by the investment adviser and its affiliates. The Fund's Schedule of Investments lists each of the Fidelity Central Funds held as of period end, if any, as an investment of the Fund, but does not include the underlying holdings of each Fidelity Central Fund. As an Investing Fund, the Fund indirectly bears its proportionate share of the expenses of the underlying Fidelity Central Funds.
The Money Market Central Funds seek preservation of capital and current income and are managed by Fidelity Investments Money Management, Inc. (FIMM), an affiliate of the investment adviser. Annualized expenses of the Money Market Central Funds as of their most recent shareholder report date are less than .005%.
A complete unaudited list of holdings for each Fidelity Central Fund is available upon request or at the Securities and Exchange Commission (the SEC) website at www.sec.gov. In addition, the financial statements of the Fidelity Central Funds, which are not covered by the Fund's Report of Independent Registered Public Accounting Firm, are available on the SEC website or upon request.
3. Significant Accounting Policies.
The financial statements have been prepared in conformity with accounting principles generally accepted in the United States of America (GAAP), which require management to make certain estimates and assumptions at the date of the financial statements. Actual results could differ from those estimates. Subsequent events, if any, through the date that the financial statements were issued have been evaluated in the preparation of the financial statements. The following summarizes the significant accounting policies of the Fund:
Investment Valuation. Investments are valued as of 4:00 p.m. Eastern time on the last calendar day of the period. The Board of Trustees (the Board) has delegated the day to day responsibility for the valuation of the Fund's investments to the FMR Fair Value Committee (the Committee). In accordance with valuation policies and procedures approved by the Board, the Fund attempts to obtain prices from one or more third party pricing vendors or brokers to value its investments. When current market prices, quotations or currency exchange rates are not readily available or reliable, investments will be fair valued in good faith by the Committee, in accordance with procedures adopted by the Board. Factors used in determining fair value vary by investment type and may include market or investment specific events, changes in interest rates and credit quality. The frequency with which these procedures are used cannot be predicted and they may be utilized to a significant extent. The Committee oversees the Fund's valuation policies and procedures and reports to the Board on the Committee's activities and fair value determinations. The Board monitors the appropriateness of the procedures used in valuing the Fund's investments and ratifies the fair value determinations of the Committee.
The Fund categorizes the inputs to valuation techniques used to value its investments into a disclosure hierarchy consisting of three levels as shown below:
- Level 1 – quoted prices in active markets for identical investments
- Level 2 – other significant observable inputs (including quoted prices for similar investments, interest rates, prepayment speeds, etc.)
- Level 3 – unobservable inputs (including the Fund's own assumptions based on the best information available)
Valuation techniques used to value the Fund's investments by major category are as follows:
Equity securities, including restricted securities, for which market quotations are readily available, are valued at the last reported sale price or official closing price as reported by a third party pricing vendor on the primary market or exchange on which they are traded and are categorized as Level 1 in the hierarchy. In the event there were no sales during the day or closing prices are not available, securities are valued at the last quoted bid price or may be valued using the last available price and are generally categorized as Level 2 in the hierarchy. For foreign equity securities, when market or security specific events arise, comparisons to the valuation of American Depositary Receipts (ADRs), futures contracts, Exchange-Traded Funds (ETFs) and certain indexes as well as quoted prices for similar securities may be used and would be categorized as Level 2 in the hierarchy. Utilizing these techniques may result in transfers between Level 1 and Level 2. For equity securities, including restricted securities, where observable inputs are limited, assumptions about market activity and risk are used and these securities may be categorized as Level 3 in the hierarchy.
Debt securities, including restricted securities, are valued based on evaluated prices received from third party pricing vendors or from brokers who make markets in such securities. Corporate bonds and bank loan obligations are valued by pricing vendors who utilize matrix pricing which considers yield or price of bonds of comparable quality, coupon, maturity and type or by broker-supplied prices. Asset backed securities, collateralized mortgage obligations and commercial mortgage securities are valued by pricing vendors who utilize matrix pricing which considers prepayment speed assumptions, attributes of the collateral, yield or price of bonds of comparable quality, coupon, maturity and type or by broker-supplied prices. When independent prices are unavailable or unreliable, debt securities may be valued utilizing pricing methodologies which consider similar factors that would be used by third party pricing vendors. Debt securities are generally categorized as Level 2 in the hierarchy but may be Level 3 depending on the circumstances. The Fund invests a significant portion of its assets in below investment grade securities. The value of these securities can be more volatile due to changes in the credit quality of the issuer and is sensitive to changes in economic, market and regulatory conditions.
Investments in open-end mutual funds, including the Fidelity Central Funds, are valued at their closing net asset value (NAV) each business day and are categorized as Level 1 in the hierarchy.
The following provides information on Level 3 securities held by the Fund that were valued at period end based on unobservable inputs. These amounts exclude valuations provided by a broker.
| Asset Type | Fair Value at 07/31/16 | Valuation Technique(s) | Unobservable Input | Amount or Range/Weighted Average | Impact to Valuation from an Increase in Input(a) |
| Asset-Backed Securities | $2,320,307 | Discounted cash flow | Yield | 7.5% | Decrease |
| | | | Spread | 4.5% | Decrease |
| Commercial Mortgage Securities | $4,305,265 | Discounted cash flow | Yield | 9.9% - 12.3% / 10.5% | Decrease |
| | | | Spread | 6.3% | Decrease |
| | | Market observation | Evaluated bid | $119.29 | Increase |
| Bank Loan Obligations | $2,316,602 | Discounted cash flow | Yield | 11.0% | Decrease |
(a) Represents the expected directional change in the fair value of the Level 3 investments that would result from an increase in the corresponding input. A decrease to the unobservable input would have the opposite effect. Significant changes in these inputs could result in significantly higher or lower fair value measurements.
Changes in valuation techniques may result in transfers in or out of an assigned level within the disclosure hierarchy. The aggregate value of investments by input level as of July 31, 2016, as well as a roll forward of Level 3 investments, is included at the end of the Fund's Schedule of Investments.
Foreign Currency. The Fund may use foreign currency contracts to facilitate transactions in foreign-denominated securities. Gains and losses from these transactions may arise from changes in the value of the foreign currency or if the counterparties do not perform under the contracts' terms.
Foreign-denominated assets, including investment securities, and liabilities are translated into U.S. dollars at the exchange rates at period end. Purchases and sales of investment securities, income and dividends received and expenses denominated in foreign currencies are translated into U.S. dollars at the exchange rate in effect on the transaction date.
The effects of exchange rate fluctuations on investments are included with the net realized and unrealized gain (loss) on investment securities. Other foreign currency transactions resulting in realized and unrealized gain (loss) are disclosed separately.
Investment Transactions and Income. For financial reporting purposes, the Fund's investment holdings and NAV include trades executed through the end of the last business day of the period. The NAV per share for processing shareholder transactions is calculated as of the close of business of the New York Stock Exchange (NYSE), normally 4:00 p.m. Eastern time and includes trades executed through the end of the prior business day. Gains and losses on securities sold are determined on the basis of identified cost. Dividend income is recorded on the ex-dividend date, except for certain dividends from foreign securities where the ex-dividend date may have passed, which are recorded as soon as the Fund is informed of the ex-dividend date. Non-cash dividends included in dividend income, if any, are recorded at the fair market value of the securities received. Income and capital gain distributions from Fidelity Central Funds, if any, are recorded on the ex-dividend date. Distributions received on securities that represent a return of capital or capital gain are recorded as a reduction of cost of investments and/or as a realized gain. Subsequent to ex-dividend date the Fund determines the components of these distributions, based upon receipt of tax filings or other correspondence relating to the underlying investment. Interest income is accrued as earned and includes coupon interest and amortization of premium and accretion of discount on debt securities as applicable. Investment income is recorded net of foreign taxes withheld where recovery of such taxes is uncertain. Debt obligations may be placed on non-accrual status and related interest income may be reduced by ceasing current accruals and writing off interest receivables when the collection of all or a portion of interest has become doubtful based on consistently applied procedures. A debt obligation is removed from non-accrual status when the issuer resumes interest payments or when collectability of interest is reasonably assured.
Class Allocations and Expenses. Investment income, realized and unrealized capital gains and losses, common expenses of the Fund, and certain fund-level expense reductions, if any, are allocated daily on a pro-rata basis to each class based on the relative net assets of each class to the total net assets of the Fund. Each class differs with respect to transfer agent fees incurred. Certain expense reductions may also differ by class. For the reporting period, the allocated portion of income and expenses to each class as a percent of its average net assets may vary due to the timing of recording these transactions in relation to fluctuating net assets of the classes. Expenses directly attributable to a fund are charged to that fund. Expenses attributable to more than one fund are allocated among the respective funds on the basis of relative net assets or other appropriate methods. Expense estimates are accrued in the period to which they relate and adjustments are made when actual amounts are known.
Income Tax Information and Distributions to Shareholders. Each year, the Fund intends to qualify as a regulated investment company under Subchapter M of the Internal Revenue Code, including distributing substantially all of its taxable income and realized gains. As a result, no provision for U.S. Federal income taxes is required. As of July 31, 2016, the Fund did not have any unrecognized tax benefits in the financial statements; nor is the Fund aware of any tax positions for which it is reasonably possible that the total amounts of unrecognized tax benefits will significantly change in the next twelve months. The Fund files a U.S. federal tax return, in addition to state and local tax returns as required. The Fund's federal income tax returns are subject to examination by the Internal Revenue Service (IRS) for a period of three fiscal years after they are filed. State and local tax returns may be subject to examination for an additional fiscal year depending on the jurisdiction. Foreign taxes are provided for based on the Fund's understanding of the tax rules and rates that exist in the foreign markets in which it invests.
Distributions are declared and recorded on the ex-dividend date. Income dividends and capital gain distributions are declared separately for each class. Income and capital gain distributions are determined in accordance with income tax regulations, which may differ from GAAP.
Capital accounts within the financial statements are adjusted for permanent book-tax differences. These adjustments have no impact on net assets or the results of operations. Capital accounts are not adjusted for temporary book-tax differences which will reverse in a subsequent period.
Book-tax differences are primarily due to foreign currency transactions, equity-debt classifications, certain conversion ratio adjustments, partnerships and losses deferred due to wash sales.
The federal tax cost of investment securities and unrealized appreciation (depreciation) as of period end were as follows:
| Gross unrealized appreciation | $81,772,674 |
| Gross unrealized depreciation | (11,175,504) |
| Net unrealized appreciation (depreciation) on securities | $70,597,170 |
| Tax Cost | $803,906,939 |
The tax-based components of distributable earnings as of period end were as follows:
| Undistributed ordinary income | $8,518,281 |
| Undistributed long-term capital gain | $10,334,202 |
| Net unrealized appreciation (depreciation) on securities and other investments | $70,597,174 |
The tax character of distributions paid was as follows:
| | July 31, 2016 | July 31, 2015 |
| Ordinary Income | $41,304,592 | $ 49,227,807 |
| Long-term Capital Gains | 7,703,133 | 17,074,540 |
| Total | $49,007,725 | $ 66,302,347 |
Restricted Securities. The Fund may invest in securities that are subject to legal or contractual restrictions on resale. These securities generally may be resold in transactions exempt from registration or to the public if the securities are registered. Disposal of these securities may involve time-consuming negotiations and expense, and prompt sale at an acceptable price may be difficult. Information regarding restricted securities is included at the end of the Fund's Schedule of Investments.
Loans and Other Direct Debt Instruments. The Fund invests in direct debt instruments which are interests in amounts owed to lenders by corporate or other borrowers. These instruments may be in the form of loans, trade claims or other receivables and may include standby financing commitments such as revolving credit facilities that obligate the Fund to supply additional cash to the borrower on demand. Loans may be acquired through assignment or participation. The Fund did not have any unfunded loan commitments, which are contractual obligations for future funding, at period end.
4. Purchases and Sales of Investments.
Purchases and sales of securities, other than short-term securities, aggregated $226,491,741 and $189,550,041, respectively.
5. Fees and Other Transactions with Affiliates.
Management Fee. Fidelity Management & Research Company (the investment adviser) and its affiliates provide the Fund with investment management related services for which the Fund pays a monthly management fee. The management fee is the sum of an individual fund fee rate that is based on an annual rate of .30% of the Fund's average net assets and an annualized group fee rate that averaged .25% during the period. The group fee rate is based upon the average net assets of all the mutual funds advised by the investment adviser, including any mutual funds previously advised by the investment adviser that are currently advised by Fidelity SelectCo, LLC, an affiliate of the investment adviser. The group fee rate decreases as assets under management increase and increases as assets under management decrease. For the reporting period, the total annual management fee rate was .55% of the Fund's average net assets.
Transfer Agent Fees. Fidelity Investments Institutional Operations Company, Inc., (FIIOC), an affiliate of the investment adviser, is the transfer, dividend disbursing and shareholder servicing agent for each class of the Fund. FIIOC receives account fees and asset-based fees that vary according to the account size and type of account of the shareholders of Series Real Estate Income. FIIOC receives no fees for providing transfer agency services to Class F. FIIOC pays for typesetting, printing and mailing of shareholder reports, except proxy statements.
For the period, transfer agent fees for each applicable class were as follows:
| | Amount | % of
Class-Level Average
Net Assets |
| Series Real Estate Income | $636,129 | .16 |
Accounting Fees. Fidelity Service Company, Inc. (FSC), an affiliate of the investment adviser, maintains the Fund's accounting records. The fee is based on the level of average net assets for each month.
Brokerage Commissions. The Fund placed a portion of its portfolio transactions with brokerage firms which are affiliates of the investment adviser. Brokerage commissions are included in net realized gain (loss) and change in net unrealized appreciation (depreciation) in the Statement of Operations. The commissions paid to these affiliated firms were $1,375 for the period.
Interfund Trades. The Fund may purchase from or sell securities to other Fidelity Funds under procedures adopted by the Board. The procedures have been designed to ensure these interfund trades are executed in accordance with Rule 17a-7 of the 1940 Act. Interfund trades are included within the respective purchases and sales amounts shown in the Purchases and Sales of Investments note.
6. Committed Line of Credit.
The Fund participates with other funds managed by the investment adviser or an affiliate in a $4.25 billion credit facility (the "line of credit") to be utilized for temporary or emergency purposes to fund shareholder redemptions or for other short-term liquidity purposes. The Fund has agreed to pay commitment fees on its pro-rata portion of the line of credit, which amounted to $1,722 and is reflected in Miscellaneous expenses on the Statement of Operations. During the period, the Fund did not borrow on this line of credit.
7. Expense Reductions.
Commissions paid to certain brokers with whom the investment adviser, or its affiliates, places trades on behalf of the Fund include an amount in addition to trade execution, which may be rebated back to the Fund to offset certain expenses. This amount totaled $7,294 for the period. In addition, through arrangements with the Fund's custodian, credits realized as a result of certain uninvested cash balances were used to reduce the Fund's expenses. During the period, these credits reduced the Fund's custody expenses by $1,162.
In addition, during the period the investment adviser reimbursed and/or waived a portion of fund-level operating expenses in the amount of $5,913.
8. Distributions to Shareholders.
Distributions to shareholders of each class were as follows:
| | Year ended
July 31, 2016 | Year ended
July 31, 2015 |
| From net investment income | | |
| Series Real Estate Income | $19,151,665 | $21,727,712 |
| Class F | 21,854,934 | 23,744,743 |
| Total | $41,006,599 | $45,472,455 |
| From net realized gain | | |
| Series Real Estate Income | $3,833,583 | $10,207,221 |
| Class F | 4,167,543 | 10,622,671 |
| Total | $8,001,126 | $20,829,892 |
9. Share Transactions.
Transactions for each class of shares were as follows:
| | Shares | Shares | Dollars | Dollars |
| | Year ended
July 31, 2016 | Year ended July 31, 2015 | Year ended
July 31, 2016 | Year ended July 31, 2015 |
| Series Real Estate Income | | | | |
| Shares sold | 1,707,748 | 2,035,991 | $18,516,525 | $22,922,397 |
| Reinvestment of distributions | 2,135,197 | 2,871,749 | 22,985,248 | 31,934,933 |
| Shares redeemed | (3,965,877) | (4,463,283) | (43,229,220) | (50,201,779) |
| Net increase (decrease) | (122,932) | 444,457 | $(1,727,447) | $4,655,551 |
| Class F | | | | |
| Shares sold | 4,237,248 | 4,231,772 | $46,086,274 | $47,649,383 |
| Reinvestment of distributions | 2,417,168 | 3,090,749 | 26,022,477 | 34,367,414 |
| Shares redeemed | (4,106,119) | (5,535,580) | (44,602,167) | (62,123,060) |
| Net increase (decrease) | 2,548,297 | 1,786,941 | $27,506,584 | $19,893,737 |
10. Other.
The Fund's organizational documents provide former and current trustees and officers with a limited indemnification against liabilities arising in connection with the performance of their duties to the Fund. In the normal course of business, the Fund may also enter into contracts that provide general indemnifications. The Fund's maximum exposure under these arrangements is unknown as this would be dependent on future claims that may be made against the Fund. The risk of material loss from such claims is considered remote.
At the end of the period, mutual funds managed by the investment adviser or its affiliates were the owners of record of all of the outstanding shares of the Fund.
Report of Independent Registered Public Accounting Firm
To the Trustees of Fidelity Securities Fund and Shareholders of Fidelity Series Real Estate Income Fund:
We have audited the accompanying statement of assets and liabilities of Fidelity Series Real Estate Income Fund (the Fund), a fund of Fidelity Securities Fund, including the schedule of investments, as of July 31, 2016, and the related statement of operations for the year then ended, the statement of changes in net assets for each of the two years in the period then ended, and the financial highlights for each of the periods presented. These financial statements and financial highlights are the responsibility of the Fund's management. Our responsibility is to express an opinion on these financial statements and financial highlights based on our audits.
We conducted our audits in accordance with the standards of the Public Company Accounting Oversight Board (United States). Those standards require that we plan and perform the audit to obtain reasonable assurance about whether the financial statements and financial highlights are free of material misstatement. The Fund is not required to have, nor were we engaged to perform, an audit of its internal control over financial reporting. Our audits included consideration of internal control over financial reporting as a basis for designing audit procedures that are appropriate in the circumstances, but not for the purpose of expressing an opinion on the effectiveness of the Fund's internal control over financial reporting. Accordingly, we express no such opinion. An audit also includes examining, on a test basis, evidence supporting the amounts and disclosures in the financial statements, assessing the accounting principles used and significant estimates made by management, as well as evaluating the overall financial statement presentation. Our procedures included confirmation of securities owned as of July 31, 2016, by correspondence with the custodians and brokers; when replies were not received from brokers, we performed other auditing procedures. We believe that our audits provide a reasonable basis for our opinion.
In our opinion, such financial statements and financial highlights referred to above present fairly, in all material respects, the financial position of Fidelity Series Real Estate Income Fund as of July 31, 2016, the results of its operations for the year then ended, the changes in its net assets for each of the two years in the period then ended, and the financial highlights for each of the periods presented, in conformity with accounting principles generally accepted in the United States of America.
DELOITTE & TOUCHE LLP
Boston, Massachusetts
September 20, 2016
Trustees and Officers
The Trustees, Members of the Advisory Board (if any), and officers of the trust and fund, as applicable, are listed below. The Board of Trustees governs the fund and is responsible for protecting the interests of shareholders. The Trustees are experienced executives who meet periodically throughout the year to oversee the fund's activities, review contractual arrangements with companies that provide services to the fund, oversee management of the risks associated with such activities and contractual arrangements, and review the fund's performance. Each of the Trustees oversees 170 funds.
The Trustees hold office without limit in time except that (a) any Trustee may resign; (b) any Trustee may be removed by written instrument, signed by at least two-thirds of the number of Trustees prior to such removal; (c) any Trustee who requests to be retired or who has become incapacitated by illness or injury may be retired by written instrument signed by a majority of the other Trustees; and (d) any Trustee may be removed at any special meeting of shareholders by a two-thirds vote of the outstanding voting securities of the trust. Each Trustee who is not an interested person (as defined in the 1940 Act) of the trust and the fund is referred to herein as an Independent Trustee. Each Independent Trustee shall retire not later than the last day of the calendar year in which his or her 75th birthday occurs. The Independent Trustees may waive this mandatory retirement age policy with respect to individual Trustees. Officers and Advisory Board Members hold office without limit in time, except that any officer or Advisory Board Member may resign or may be removed by a vote of a majority of the Trustees at any regular meeting or any special meeting of the Trustees. Except as indicated, each individual has held the office shown or other offices in the same company for the past five years.
The fund’s Statement of Additional Information (SAI) includes more information about the Trustees. To request a free copy, call Fidelity at 1-800-544-8544 for Fidelity® Series Real Estate Income Fund, or 1-800-835-5092 for Class F.
Experience, Skills, Attributes, and Qualifications of the Trustees. The Governance and Nominating Committee has adopted a statement of policy that describes the experience, qualifications, attributes, and skills that are necessary and desirable for potential Independent Trustee candidates (Statement of Policy). The Board believes that each Trustee satisfied at the time he or she was initially elected or appointed a Trustee, and continues to satisfy, the standards contemplated by the Statement of Policy. The Governance and Nominating Committee also engages professional search firms to help identify potential Independent Trustee candidates who have the experience, qualifications, attributes, and skills consistent with the Statement of Policy. From time to time, additional criteria based on the composition and skills of the current Independent Trustees, as well as experience or skills that may be appropriate in light of future changes to board composition, business conditions, and regulatory or other developments, have also been considered by the professional search firms and the Governance and Nominating Committee. In addition, the Board takes into account the Trustees' commitment and participation in Board and committee meetings, as well as their leadership of standing and ad hoc committees throughout their tenure.
In determining that a particular Trustee was and continues to be qualified to serve as a Trustee, the Board has considered a variety of criteria, none of which, in isolation, was controlling. The Board believes that, collectively, the Trustees have balanced and diverse experience, qualifications, attributes, and skills, which allow the Board to operate effectively in governing the fund and protecting the interests of shareholders. Information about the specific experience, skills, attributes, and qualifications of each Trustee, which in each case led to the Board's conclusion that the Trustee should serve (or continue to serve) as a trustee of the fund, is provided below.
Board Structure and Oversight Function. James C. Curvey is an interested person and currently serves as Chairman. The Trustees have determined that an interested Chairman is appropriate and benefits shareholders because an interested Chairman has a personal and professional stake in the quality and continuity of services provided to the fund. Independent Trustees exercise their informed business judgment to appoint an individual of their choosing to serve as Chairman, regardless of whether the Trustee happens to be independent or a member of management. The Independent Trustees have determined that they can act independently and effectively without having an Independent Trustee serve as Chairman and that a key structural component for assuring that they are in a position to do so is for the Independent Trustees to constitute a substantial majority for the Board. The Independent Trustees also regularly meet in executive session. Ned C. Lautenbach serves as Chairman of the Independent Trustees and as such (i) acts as a liaison between the Independent Trustees and management with respect to matters important to the Independent Trustees and (ii) with management prepares agendas for Board meetings.
Fidelity® funds are overseen by different Boards of Trustees. The fund's Board oversees Fidelity's high income and certain equity funds, and other Boards oversee Fidelity's investment-grade bond, money market, asset allocation, and sector funds. The asset allocation funds may invest in Fidelity® funds overseen by the fund's Board. The use of separate Boards, each with its own committee structure, allows the Trustees of each group of Fidelity® funds to focus on the unique issues of the funds they oversee, including common research, investment, and operational issues. On occasion, the separate Boards establish joint committees to address issues of overlapping consequences for the Fidelity® funds overseen by each Board.
The Trustees operate using a system of committees to facilitate the timely and efficient consideration of all matters of importance to the Trustees, the fund, and fund shareholders and to facilitate compliance with legal and regulatory requirements and oversight of the fund's activities and associated risks. The Board, acting through its committees, has charged FMR and its affiliates with (i) identifying events or circumstances the occurrence of which could have demonstrably adverse effects on the fund's business and/or reputation; (ii) implementing processes and controls to lessen the possibility that such events or circumstances occur or to mitigate the effects of such events or circumstances if they do occur; and (iii) creating and maintaining a system designed to evaluate continuously business and market conditions in order to facilitate the identification and implementation processes described in (i) and (ii) above. Because the day-to-day operations and activities of the fund are carried out by or through FMR, its affiliates, and other service providers, the fund's exposure to risks is mitigated but not eliminated by the processes overseen by the Trustees. While each of the Board's committees has responsibility for overseeing different aspects of the fund's activities, oversight is exercised primarily through the Operations, Audit, and Compliance Committees. In addition, the Independent Trustees have worked with FMR to enhance the Board's oversight of investment and financial risks, legal and regulatory risks, technology risks, and operational risks, including the development of additional risk reporting to the Board. For example, a working group comprised of Independent Trustees and FMR has worked and continues to work to review the Fidelity® funds' valuation-related activities, reporting and risk management. Appropriate personnel, including but not limited to the fund's Chief Compliance Officer (CCO), FMR's internal auditor, the independent accountants, the fund's Treasurer and portfolio management personnel, make periodic reports to the Board's committees, as appropriate, including an annual review of Fidelity's risk management program for the Fidelity® funds. The responsibilities of each standing committee, including their oversight responsibilities, are described further under "Standing Committees of the Trustees."
Interested Trustees*:
Correspondence intended for a Trustee who is an interested person may be sent to Fidelity Investments, 245 Summer Street, Boston, Massachusetts 02210.
Name, Year of Birth; Principal Occupations and Other Relevant Experience+
James C. Curvey (1935)
Year of Election or Appointment: 2007
Trustee
Chairman of the Board of Trustees
Mr. Curvey also serves as Trustee of other Fidelity® funds. Mr. Curvey is a Director of Fidelity Research & Analysis Co. (investment adviser firm, 2009-present), and Vice Chairman (2007-present) and Director of FMR LLC (diversified financial services company). In addition, Mr. Curvey serves as an Overseer for the Boston Symphony Orchestra and a member of the board of Artis-Naples, Naples, Florida, and as a Trustee for Brewster Academy, Wolfeboro, New Hampshire. Previously, Mr. Curvey served as a Director of Fidelity Investments Money Management, Inc. (investment adviser firm, 2009-2014) and a Director of FMR and FMR Co., Inc. (investment adviser firms, 2007-2014).
Charles S. Morrison (1960)
Year of Election or Appointment: 2014
Trustee
Mr. Morrison also serves as Trustee of other funds. He serves as a Director of Fidelity Investments Money Management, Inc. (FIMM) (investment adviser firm, 2014-present), Director of Fidelity SelectCo, LLC (investment adviser firm, 2014-present), President, Asset Management (2014-present), and is an employee of Fidelity Investments. Previously, Mr. Morrison served as Vice President of Fidelity's Fixed Income and Asset Allocation Funds (2012-2014), President, Fixed Income (2011-2014), Vice President of Fidelity's Money Market Funds (2005-2009), President, Money Market Group Leader of FMR (investment adviser firm, 2009), and Senior Vice President, Money Market Group of FMR (2004-2009). Mr. Morrison also served as Vice President of Fidelity's Bond Funds (2002-2005), certain Balanced Funds (2002-2005), and certain Asset Allocation Funds (2002-2007), and as Senior Vice President (2002-2005) of Fidelity's Bond Division.
* Determined to be an “Interested Trustee” by virtue of, among other things, his or her affiliation with the trust or various entities under common control with FMR.
+ The information includes the Trustee's principal occupation during the last five years and other information relating to the experience, attributes, and skills relevant to the Trustee's qualifications to serve as a Trustee, which led to the conclusion that the Trustee should serve as a Trustee for the fund.
Independent Trustees:
Correspondence intended for an Independent Trustee may be sent to Fidelity Investments, P.O. Box 55235, Boston, Massachusetts 02205-5235.
Name, Year of Birth; Principal Occupations and Other Relevant Experience+
Dennis J. Dirks (1948)
Year of Election or Appointment: 2005
Trustee
Mr. Dirks also serves as Trustee of other Fidelity® funds. Prior to his retirement in May 2003, Mr. Dirks was Chief Operating Officer and a member of the Board of The Depository Trust & Clearing Corporation (DTCC). He also served as President, Chief Operating Officer, and Board member of The Depository Trust Company (DTC) and President and Board member of the National Securities Clearing Corporation (NSCC). In addition, Mr. Dirks served as Chief Executive Officer and Board member of the Government Securities Clearing Corporation, Chief Executive Officer and Board member of the Mortgage-Backed Securities Clearing Corporation, as a Trustee and a member of the Finance Committee of Manhattan College (2005-2008), as a Trustee and a member of the Finance Committee of AHRC of Nassau County (2006-2008), and as a member of the Independent Directors Council (IDC) Governing Council (2010-2015). Mr. Dirks is a member of the Board of Directors for The Brookville Center for Children's Services, Inc. (2009-present).
Alan J. Lacy (1953)
Year of Election or Appointment: 2008
Trustee
Mr. Lacy also serves as Trustee of other Fidelity® funds. Mr. Lacy serves as Chairman (2014-present) and a member (2010-present) of the Board of Directors of Dave & Buster's Entertainment, Inc. (restaurant and entertainment complexes) and a Director of Bristol-Myers Squibb Company (global pharmaceuticals, 2008-present). He is a Trustee of the California Chapter of The Nature Conservancy (2015-present) and a Director of the Center for Advanced Study in the Behavioral Sciences at Stanford University (2015-present). In addition, Mr. Lacy served as Senior Adviser (2007-2014) of Oak Hill Capital Partners, L.P. (private equity) and also served as Chief Executive Officer (2005) and Vice Chairman (2005-2006) of Sears Holdings Corporation (retail) and Chief Executive Officer and Chairman of the Board of Sears, Roebuck and Co. (retail, 2000-2005). Previously, Mr. Lacy served as Chairman (2008-2011) and a member (2006-2015) of the Board of Trustees of the National Parks Conservation Association and as a member of the Board of Directors for The Western Union Company (global money transfer, 2006-2011), The Hillman Companies, Inc. (hardware wholesalers, 2010-2014), and Earth Fare, Inc. (retail grocery, 2010-2014).
Ned C. Lautenbach (1944)
Year of Election or Appointment: 2000
Trustee
Chairman of the Independent Trustees
Mr. Lautenbach also serves as Trustee of other Fidelity® funds. Mr. Lautenbach currently serves as the Lead Director of the Eaton Corporation Board of Directors (diversified industrial, 1997-present). Mr. Lautenbach is Chairman of the Board of Directors of Artis-Naples in Naples, Florida (2012-present), a member of the Council on Foreign Relations (1994-present), and a member of the Board of Governors, State University System of Florida (2013-present). Previously, Mr. Lautenbach was a Partner/Advisory Partner at Clayton, Dubilier & Rice, LLC (private equity investment, 1998-2010), as well as a Director of Sony Corporation (2006-2007).
Joseph Mauriello (1944)
Year of Election or Appointment: 2008
Trustee
Mr. Mauriello also serves as Trustee of other Fidelity® funds. Prior to his retirement in January 2006, Mr. Mauriello served in numerous senior management positions including Deputy Chairman and Chief Operating Officer (2004-2005), and Vice Chairman of Financial Services (2002-2004) of KPMG LLP US (professional services, 1965-2005). Mr. Mauriello currently serves as a member of the Board of Directors of XL Group plc. (global insurance and re-insurance, 2006-present) and the Independent Directors Council (IDC) Governing Council (2015-present). Previously, Mr. Mauriello served as a Director of the Hamilton Funds of the Bank of New York (2006-2007) and of Arcadia Resources Inc. (health care services and products, 2007-2012).
Robert W. Selander (1950)
Year of Election or Appointment: 2011
Trustee
Mr. Selander also serves as Trustee of other Fidelity® funds. Mr. Selander serves as a Director of The Western Union Company (global money transfer, 2014-present) and a non-executive Chairman of Health Equity, Inc. (health savings custodian, 2015-present). Previously, Mr. Selander served as a Member of the Advisory Board of certain Fidelity® funds (2011), and Executive Vice Chairman (2010), Chief Executive Officer (2009-2010), and President and Chief Executive Officer (1997-2009) of Mastercard, Inc.
Cornelia M. Small (1944)
Year of Election or Appointment: 2005
Trustee
Ms. Small also serves as Trustee of other Fidelity® funds. Ms. Small is a member of the Board of Directors (2009-present) and Chair of the Investment Committee (2010-present) of the Teagle Foundation. Ms. Small also serves on the Investment Committee of the Berkshire Taconic Community Foundation (2008-present). Previously, Ms. Small served as Chairperson (2002-2008) and a member of the Investment Committee and Chairperson (2008-2012) and a member of the Board of Trustees of Smith College. In addition, Ms. Small served as Chief Investment Officer, Director of Global Equity Investments, and a member of the Board of Directors of Scudder, Stevens & Clark and Scudder Kemper Investments.
William S. Stavropoulos (1939)
Year of Election or Appointment: 2002
Trustee
Vice Chairman of the Independent Trustees
Mr. Stavropoulos also serves as Trustee of other Fidelity® funds. Mr. Stavropoulos serves as President and Founder of the Michigan Baseball Foundation, the Great Lakes Loons (2007-present). Mr. Stavropoulos is Chairman Emeritus of the Board of Directors of The Dow Chemical Company, where he previously served in numerous senior management positions, including President, CEO (1995-2000; 2002-2004), Chairman of the Executive Committee (2000-2006), and as a member of the Board of Directors (1990-2006). Currently, Mr. Stavropoulos is Chairman of the Board of Directors of Univar Inc. (global distributor of commodity and specialty chemicals), a Director of Teradata Corporation (data warehousing and technology solutions), and Maersk Inc. (industrial conglomerate), and a member of the Advisory Board for Metalmark Capital LLC (private equity investment, 2005-present). Mr. Stavropoulos is an operating advisor to Clayton, Dubilier & Rice, LLC (private equity investment). In addition, Mr. Stavropoulos is a member of the University of Notre Dame Advisory Council for the College of Science, a Trustee of the Rollin L. Gerstacker Foundation, and a Director of the Naples Philharmonic Center for the Arts. Previously, Mr. Stavropoulos served as a Director of Chemical Financial Corporation (bank holding company, 1993-2012) and Tyco International, Ltd. (multinational manufacturing and services, 2007-2012).
David M. Thomas (1949)
Year of Election or Appointment: 2008
Trustee
Mr. Thomas also serves as Trustee of other Fidelity® funds. Mr. Thomas serves as Non-Executive Chairman of the Board of Directors of Fortune Brands Home and Security (home and security products, 2011-present), as a member of the Board of Directors (2004-present) and Presiding Director (2013-present) of Interpublic Group of Companies, Inc. (marketing communication), and as a member of the Board of Trustees of the University of Florida (2013-present). Previously, Mr. Thomas served as Executive Chairman (2005-2006) and Chairman and Chief Executive Officer (2000-2005) of IMS Health, Inc. (pharmaceutical and healthcare information solutions), and a Director of Fortune Brands, Inc. (consumer products, 2000-2011).
+ The information includes the Trustee's principal occupation during the last five years and other information relating to the experience, attributes, and skills relevant to the Trustee's qualifications to serve as a Trustee, which led to the conclusion that the Trustee should serve as a Trustee for the fund.
Advisory Board Members and Officers:
Correspondence intended for an officer or Peter S. Lynch may be sent to Fidelity Investments, 245 Summer Street, Boston, Massachusetts 02210. Officers appear below in alphabetical order.
Name, Year of Birth; Principal Occupation
Peter S. Lynch (1944)
Year of Election or Appointment: 2003
Member of the Advisory Board
Mr. Lynch also serves as Member of the Advisory Board of other Fidelity® funds. Mr. Lynch is Vice Chairman and a Director of FMR (investment adviser firm) and FMR Co., Inc. (investment adviser firm). In addition, Mr. Lynch serves as a Trustee of Boston College and as the Chairman of the Inner-City Scholarship Fund. Previously, Mr. Lynch served on the Special Olympics International Board of Directors (1997-2006).
Marc R. Bryant (1966)
Year of Election or Appointment: 2015
Secretary and Chief Legal Officer (CLO)
Mr. Bryant also serves as Secretary and CLO of other funds. Mr. Bryant serves as CLO, Secretary, and Senior Vice President of Fidelity Management & Research Company (investment adviser firm, 2015-present) and FMR Co., Inc. (investment adviser firm, 2015-present); Secretary of Fidelity SelectCo, LLC (investment adviser firm, 2015-present) and Fidelity Investments Money Management, Inc. (investment adviser firm, 2015-present); and CLO of Fidelity Management & Research (Hong Kong) Limited and FMR Investment Management (U.K.) Limited (investment adviser firms, 2015-present) and Fidelity Management & Research (Japan) Limited (investment adviser firm, 2016-present). He is Senior Vice President and Deputy General Counsel of FMR LLC (diversified financial services company). Previously, Mr. Bryant served as Secretary and CLO of Fidelity Rutland Square Trust II (2010-2014) and Assistant Secretary of Fidelity's Fixed Income and Asset Allocation Funds (2013-2015). Prior to joining Fidelity Investments, Mr. Bryant served as a Senior Vice President and the Head of Global Retail Legal for AllianceBernstein L.P. (2006-2010), and as the General Counsel for ProFund Advisors LLC (2001-2006).
Jeffrey S. Christian (1961)
Year of Election or Appointment: 2016
Assistant Treasurer
Mr. Christian also serves as Assistant Treasurer of other funds. Mr. Christian is an employee of Fidelity Investments (2003-present).
William C. Coffey (1969)
Year of Election or Appointment: 2009
Assistant Secretary
Mr. Coffey also serves as Assistant Secretary of other funds. He is Senior Vice President and Deputy General Counsel of FMR LLC (diversified financial services company, 2010-present), and is an employee of Fidelity Investments. Previously, Mr. Coffey served as Vice President and Associate General Counsel of FMR LLC (2005-2009).
Jonathan Davis (1968)
Year of Election or Appointment: 2010
Assistant Treasurer
Mr. Davis also serves as Assistant Treasurer of other funds, and is an employee of Fidelity Investments. Previously, Mr. Davis served as Vice President and Associate General Counsel of FMR LLC (diversified financial services company, 2003-2010).
Adrien E. Deberghes (1967)
Year of Election or Appointment: 2016
Assistant Treasurer
Mr. Deberghes also serves as an officer of other funds. He serves as Executive Vice President of Fidelity Investments Money Management, Inc. (FIMM) (investment adviser firm, 2016-present) and is an employee of Fidelity Investments (2008-present). Prior to joining Fidelity Investments, Mr. Deberghes was Senior Vice President of Mutual Fund Administration at State Street Corporation (2007-2008), Senior Director of Mutual Fund Administration at Investors Bank & Trust (2005-2007), and Director of Finance for Dunkin' Brands (2000-2005). Previously, Mr. Deberghes served in other fund officer roles.
Stephanie J. Dorsey (1969)
Year of Election or Appointment: 2010
Assistant Treasurer
Ms. Dorsey also serves as an officer of other funds. She is an employee of Fidelity Investments (2008-present) and has served in other fund officer roles. Prior to joining Fidelity Investments, Ms. Dorsey served as Treasurer (2004-2008) of the JPMorgan Mutual Funds and Vice President (2004-2008) of JPMorgan Chase Bank.
Howard J. Galligan III (1966)
Year of Election or Appointment: 2014
Chief Financial Officer
Mr. Galligan also serves as Chief Financial Officer of other funds. Mr. Galligan serves as President of Fidelity Pricing and Cash Management Services (FPCMS) (2014-present) and as a Director of Strategic Advisers, Inc. (investment adviser firm, 2008-present). Previously, Mr. Galligan served as Chief Administrative Officer of Asset Management (2011-2014) and Chief Operating Officer and Senior Vice President of Investment Support for Strategic Advisers, Inc. (2003-2011).
Scott C. Goebel (1968)
Year of Election or Appointment: 2015
Vice President
Mr. Goebel serves as Vice President of other funds and is an employee of Fidelity Investments (2001-present). Mr. Goebel serves as Senior Vice President of Fidelity Management & Research Company (FMR) (investment adviser firm, 2016-present). Previously, Mr. Goebel served as Secretary of Fidelity SelectCo, LLC (investment adviser firm, 2013-2015), Fidelity Investments Money Management, Inc. (FIMM) (investment adviser firm, 2010-2015), and Fidelity Research and Analysis Company (FRAC) (investment adviser firm, 2010-2015); General Counsel, Secretary, and Senior Vice President of FMR (investment adviser firm, 2008-2015) and FMR Co., Inc. (investment adviser firm, 2008-2015); Assistant Secretary of Fidelity Management & Research (Japan) Limited (investment adviser firm, 2008-2015) and Fidelity Management & Research (U.K.) Inc. (investment adviser firm, 2008-2015); Chief Legal Officer (CLO) of Fidelity Management & Research (Hong Kong) Limited (investment adviser firm, 2008-2015); Secretary and CLO of certain Fidelity® funds (2008-2015); Assistant Secretary of FIMM (2008-2010), FRAC (2008-2010), and certain funds (2007-2008); and as Vice President and Secretary of Fidelity Distributors Corporation (FDC) (2005-2007).
Thomas C. Hense (1964)
Year of Election or Appointment: 2008, 2010, or 2015
Vice President
Mr. Hense serves as Vice President of Fidelity Advisor® Multi-Asset Income Fund (2015) and other funds (High Income (2008), Small Cap (2008), and Value (2010) funds), and is an employee of Fidelity Investments (1993-present). Previously, Mr. Hense served as a portfolio manager for Fidelity's Institutional Money Management Group (Pyramis) (2003-2008).
Brian B. Hogan (1964)
Year of Election or Appointment: 2009
Vice President
Mr. Hogan also serves as Trustee or Vice President of other funds. Mr. Hogan serves as a Director of FMR Investment Management (U.K.) Limited (investment adviser firm, 2015-present) and Fidelity SelectCo, LLC (investment adviser firm, 2014-present) and President of the Equity Division of FMR (investment adviser firm, 2009-present). Previously, Mr. Hogan served as Senior Vice President, Equity Research of FMR (2006-2009) and as a portfolio manager. Mr. Brian B. Hogan is not related to Mr. Colm A. Hogan.
Colm A. Hogan (1973)
Year of Election or Appointment: 2016
Deputy Treasurer
Mr. Hogan also serves as an officer of other funds. Mr. Hogan is an employee of Fidelity Investments (2005-present). Mr. Colm A. Hogan is not related to Mr. Brian B. Hogan.
Chris Maher (1972)
Year of Election or Appointment: 2013
Assistant Treasurer
Mr. Maher serves as Assistant Treasurer of other funds. Mr. Maher is Vice President of Valuation Oversight and is an employee of Fidelity Investments. Previously, Mr. Maher served as Vice President of Asset Management Compliance (2013), Vice President of the Program Management Group of FMR (investment adviser firm, 2010-2013), and Vice President of Valuation Oversight (2008-2010).
John F. Papandrea (1972)
Year of Election or Appointment: 2016
Anti-Money Laundering (AML) Officer
Mr. Papandrea also serves as AML Officer of other funds. Mr. Papandrea is Vice President of FMR LLC (diversified financial services company, 2008-present) and is an employee of Fidelity Investments (2005-present).
Kenneth B. Robins (1969)
Year of Election or Appointment: 2016
Chief Compliance Officer
Mr. Robins also serves as an officer of other funds. Mr. Robins serves as Compliance Officer of Fidelity Management & Research Company and FMR Co., Inc. (investment adviser firms, 2016-present) and is an employee of Fidelity Investments (2004-present). Previously, Mr. Robins served as Executive Vice President of Fidelity Investments Money Management, Inc. (investment adviser firm, 2013-2016) and served in other fund officer roles.
Stacie M. Smith (1974)
Year of Election or Appointment: 2016
President and Treasurer
Ms. Smith also serves as an officer of other funds. She is an employee of Fidelity Investments (2009-present) and has served in other fund officer roles. Prior to joining Fidelity Investments, Ms. Smith served as Senior Audit Manager of Ernst & Young LLP (1996-2009). Previously, Ms. Smith served as Deputy Treasurer of certain Fidelity® funds (2013-2016).
Renee Stagnone (1975)
Year of Election or Appointment: 2016
Assistant Treasurer
Ms. Stagnone also serves as an officer of other funds. Ms. Stagnone is an employee of Fidelity Investments (1997-present). Previously, Ms. Stagnone served as Deputy Treasurer of certain Fidelity® funds (2013-2016).
Shareholder Expense Example
As a shareholder of the Fund, you incur two types of costs: (1) transaction costs, and (2) ongoing costs, including management fees and other Fund expenses. This Example is intended to help you understand your ongoing costs (in dollars) of investing in the Fund and to compare these costs with the ongoing costs of investing in other mutual funds.
The Example is based on an investment of $1,000 invested at the beginning of the period and held for the entire period (February 1, 2016 to July 31, 2016).
Actual Expenses
The first line of the accompanying table for each class of the Fund provides information about actual account values and actual expenses. You may use the information in this line, together with the amount you invested, to estimate the expenses that you paid over the period. Simply divide your account value by $1,000.00 (for example, an $8,600 account value divided by $1,000.00 = 8.6), then multiply the result by the number in the first line for a class of the Fund under the heading entitled "Expenses Paid During Period" to estimate the expenses you paid on your account during this period. In addition, the Fund, as a shareholder in the underlying Fidelity Central Funds, will indirectly bear its pro-rata share of the fees and expenses incurred by the underlying Fidelity Central Funds. These fees and expenses are not included in the Fund's annualized expense ratio used to calculate the expense estimate in the table below.
Hypothetical Example for Comparison Purposes
The second line of the accompanying table for each class of the Fund provides information about hypothetical account values and hypothetical expenses based on a Class' actual expense ratio and an assumed rate of return of 5% per year before expenses, which is not the Class' actual return. The hypothetical account values and expenses may not be used to estimate the actual ending account balance or expenses you paid for the period. You may use this information to compare the ongoing costs of investing in the Fund and other funds. To do so, compare this 5% hypothetical example with the 5% hypothetical examples that appear in the shareholder reports of the other funds. In addition, the Fund, as a shareholder in the underlying Fidelity Central Funds, will indirectly bear its pro-rata share of the fees and expenses incurred by the underlying Fidelity Central Funds. These fees and expenses are not included in the Fund's annualized expense ratio used to calculate the expense estimate in the table below.
Please note that the expenses shown in the table are meant to highlight your ongoing costs only and do not reflect any transaction costs. Therefore, the second line of the table is useful in comparing ongoing costs only, and will not help you determine the relative total costs of owning different funds.
| | Annualized Expense Ratio-A | Beginning
Account Value
February 1, 2016 | Ending
Account Value
July 31, 2016 | Expenses Paid
During Period-B
February 1, 2016
to July 31, 2016 |
| Series Real Estate Income | .77% | | | |
| Actual | | $1,000.00 | $1,101.40 | $4.02 |
| Hypothetical-C | | $1,000.00 | $1,021.03 | $3.87 |
| Class F | .61% | | | |
| Actual | | $1,000.00 | $1,101.00 | $3.19 |
| Hypothetical-C | | $1,000.00 | $1,021.83 | $3.07 |
A Annualized expense ratio reflects expenses net of applicable fee waivers.
B Expenses are equal to each Class' annualized expense ratio, multiplied by the average account value over the period, multiplied by 182/366 (to reflect the one-half year period).
C 5% return per year before expenses
Distributions (Unaudited)
The Board of Trustees of Fidelity Series Real Estate Income Fund voted to pay to shareholders of record at the opening of business on record date, the following distributions per share derived from capital gains realized from sales of portfolio securities, and dividends derived from net investment income:
| | Pay Date | Record Date | Dividends | Capital Gains |
| Real Estate Income | 09/12/16 | 09/09/16 | $0.141 | $0.142 |
| Class F | 09/12/16 | 09/09/16 | $0.146 | $0.142 |
| | |
The fund hereby designates as a capital gain dividend with respect to the taxable year ended July 31, 2016, $11,931,168, or, if subsequently determined to be different, the net capital gain of such year.
A total of 0.08% of the dividends distributed during the fiscal year was derived from interest on U.S. Government securities which is generally exempt from state income tax.
The fund will notify shareholders in January 2017 of amounts for use in preparing 2016 income tax returns.
Board Approval of Investment Advisory Contracts and Management Fees
Fidelity Series Real Estate Income Fund
Each year, the Board of Trustees, including the Independent Trustees (together, the Board), votes on the renewal of the management contract with Fidelity Management & Research Company (FMR) and the sub-advisory agreements (together, the Advisory Contracts) for the fund. The Board, assisted by the advice of fund counsel and Independent Trustees' counsel, requests and considers a broad range of information relevant to the renewal of the Advisory Contracts throughout the year.
The Board meets regularly and, at each of its meetings, covers an extensive agenda of topics and materials and considers factors that are relevant to its annual consideration of the renewal of the fund's Advisory Contracts, including the services and support provided to the fund and its shareholders. The Board has established various standing committees (Committees), each composed of and chaired by Independent Trustees with varying backgrounds, to which the Board has assigned specific subject matter responsibilities in order to enhance effective decision-making by the Board. The Board, acting directly and through its Committees, requests and receives information concerning the annual consideration of the renewal of the fund's Advisory Contracts. The Board also meets as needed to consider matters specifically related to the Board's annual consideration of the renewal of the Advisory Contracts. Members of the Board may also meet with trustees of other Fidelity funds through ad hoc joint committees to discuss certain matters relevant to all of the Fidelity funds.
At its July 2016 meeting, the Board unanimously determined to renew the fund's Advisory Contracts. In reaching its determination, the Board considered all factors it believed relevant, including (i) the nature, extent, and quality of the services to be provided to the fund and its shareholders (including the investment performance of the fund); (ii) the competitiveness of the fund's management fee and total expense ratio relative to peer funds; (iii) the total costs of the services to be provided by and the profits to be realized by Fidelity from its relationships with the fund; and (iv) the extent to which, if any, economies of scale exist and would be realized as the fund grows, and whether any economies of scale are appropriately shared with fund shareholders.
In considering whether to renew the Advisory Contracts for the fund, the Board reached a determination, with the assistance of fund counsel and Independent Trustees' counsel and through the exercise of its business judgment, that the renewal of the Advisory Contracts was in the best interests of the fund and its shareholders and that the compensation payable under the Advisory Contracts was fair and reasonable. The Board's decision to renew the Advisory Contracts was not based on any single factor, but rather was based on a comprehensive consideration of all the information provided to the Board at its meetings throughout the year. The Board, in reaching its determination to renew the Advisory Contracts, was aware that shareholders of the fund have a broad range of investment choices available to them, including a wide choice among funds offered by Fidelity's competitors, and that the fund's shareholders, who have the opportunity to review and weigh the disclosure provided by the fund in its prospectus and other public disclosures, have chosen to invest in this fund, which is part of the Fidelity family of funds.
Nature, Extent, and Quality of Services Provided. The Board considered Fidelity's staffing as it relates to the fund, including the backgrounds of investment personnel of Fidelity, and also considered the fund's investment objective, strategies, and related investment philosophy. The Independent Trustees also had discussions with senior management of Fidelity's investment operations and investment groups. The Board considered the structure of the investment personnel compensation program and whether this structure provides appropriate incentives to act in the best interests of the fund. Additionally, the Board considered the portfolio managers' investments, if any, in the funds that they manage.
Resources Dedicated to Investment Management and Support Services. The Board and the Fund Oversight and Research Committees reviewed the general qualifications and capabilities of Fidelity's investment staff, including its size, education, experience, and resources, as well as Fidelity's approach to recruiting, training, managing, and compensating investment personnel. The Board noted that Fidelity has continued to increase the resources devoted to non-U.S. offices, including expansion of Fidelity's global investment organization. The Board also noted that Fidelity's analysts have extensive resources, tools and capabilities that allow them to conduct sophisticated quantitative and fundamental analysis, as well as credit analysis of issuers, counterparties and guarantors. Further, the Board considered that Fidelity's investment professionals have sufficient access to global information and data so as to provide competitive investment results over time, and that those professionals also have access to sophisticated tools that permit them to assess portfolio construction and risk and performance attribution characteristics continuously, as well as to transmit new information and research conclusions rapidly around the world. Additionally, in its deliberations, the Board considered Fidelity's trading, risk management, compliance, and technology and operations capabilities and resources, which are integral parts of the investment management process.
Shareholder and Administrative Services. The Board considered (i) the nature, extent, quality, and cost of advisory, administrative, and shareholder services performed by FMR, the sub-advisers (together with FMR, the Investment Advisers), and their affiliates under the Advisory Contracts and under separate agreements covering transfer agency, pricing and bookkeeping, and securities lending services for the fund; (ii) the nature and extent of the supervision of third party service providers, principally custodians, subcustodians, and pricing vendors; and (iii) the resources devoted to, and the record of compliance with, the fund's compliance policies and procedures. The Board also reviewed the allocation of fund brokerage, including allocations to brokers affiliated with the Investment Advisers, the use of brokerage commissions to pay fund expenses, and the use of "soft" commission dollars to pay for research services.
The Board noted that the growth of fund assets over time across the complex allows Fidelity to reinvest in the development of services designed to enhance the value or convenience of the Fidelity funds as investment vehicles. These services include 24-hour access to account information and market information through telephone representatives and over the Internet, investor education materials and asset allocation tools, and the expanded availability of Fidelity Investor Centers.
In 2014, the Board formed an ad hoc Committee on Transfer Agency Fees to review the variety of transfer agency fee structures throughout the industry and Fidelity's competitive positioning with respect to industry participants.
Investment in a Large Fund Family. The Board considered the benefits to shareholders of investing in a Fidelity fund, including the benefits of investing in a fund that is part of a large family of funds offering a variety of investment disciplines and providing a large variety of mutual fund investor services. The Board noted that Fidelity had taken, or had made recommendations that resulted in the Fidelity funds taking, a number of actions over the previous year that benefited particular funds, including: (i) continuing to dedicate additional resources to investment research and to the support of the senior management team that oversees asset management; (ii) continuing efforts to enhance Fidelity's global research capabilities; (iii) launching new funds and making other enhancements to meet client needs; (iv) broadening eligibility requirements for certain lower-priced share classes of, and streamlining the fee structure for, certain existing equity index funds; (v) lowering expense caps for certain existing funds and classes to reduce expenses paid by shareholders; (vi) eliminating redemption fees for certain variable insurance product funds and classes; (vii) continuing to launch dedicated lower cost underlying funds to meet portfolio construction needs related to expanding underlying fund options for Fidelity funds of funds, specifically for the Freedom Fund product lines; (viii) launching a lower cost share class for use by the Freedom Index Fund product line; (ix) rationalizing product lines and gaining increased efficiencies through fund mergers and share class consolidations; (x) continuing to develop, acquire and implement systems and technology to improve services to the funds and shareholders, strengthen information security, and increase efficiency; (xi) implementing investment enhancements to further strengthen Fidelity's target date product line to increase investors' probability of success in achieving their goals; (xii) accelerating the conversion of all remaining Class B shares to Class A shares, which have a lower expense structure; and (xiii) implementing changes to Fidelity's money market fund product line in response to recent regulatory reforms.
Investment Performance. The Board considered whether the fund has operated in accordance with its investment objective, as well as its record of compliance with its investment restrictions and its performance history.
The Board took into account discussions with representatives of the Investment Advisers about fund investment performance that occur at Board meetings throughout the year. In this regard the Board noted that as part of regularly scheduled fund reviews and other reports to the Board on fund performance, the Board considers annualized return information for the fund, for different time periods, measured against a securities market index ("benchmark index") and a peer group of funds with similar objectives ("peer group"), if any. In its evaluation of fund investment performance, the Board gave particular attention to information indicating changes in performance of certain Fidelity funds for specific time periods and discussed with the Investment Advisers the reasons for any overperformance or underperformance.
In addition to reviewing absolute and relative fund performance, the Independent Trustees periodically consider the appropriateness of fund performance metrics in evaluating the results achieved. In general, the Independent Trustees believe that fund performance should be evaluated based on net performance (after fees and expenses) of both the highest performing and lowest performing fund share classes, where applicable, compared to appropriate benchmark indices, over appropriate time periods that may include full market cycles, and compared to peer groups, as applicable, over the same periods, taking into account relevant factors including the following: general market conditions; issuer-specific information; and fund cash flows and other factors.
The Independent Trustees recognize that shareholders evaluate performance on a net basis over their own holding periods, for which one-, three-, and five-year periods are often used as a proxy. For this reason, the performance information reviewed by the Board also included net cumulative calendar year total return information for the fund and an appropriate benchmark index and peer group for the most recent one- and three-year periods, as shown below. Returns are shown compared to the 25th percentile (top of box, 75% beaten) and 75th percentile (bottom of box, 25% beaten) of the peer universe.
Fidelity Series Real Estate Income Fund
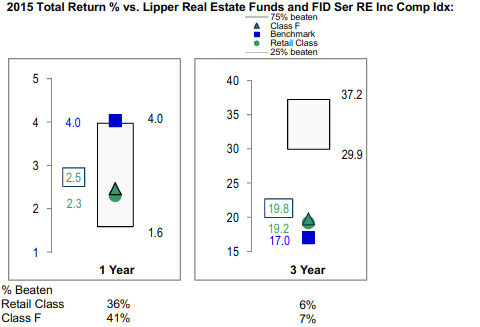
The Board has discussed the fund's performance with FMR, including the fund's underperformance based on more recent periods ended after 2015 (which periods are not shown in the chart above) but prior to the date of the Board's approval of the renewal of the Advisory Contracts, and has engaged with FMR to consider what steps might be taken to remediate the fund's more recent underperformance.
Based on its review, the Board concluded that the nature, extent, and quality of services provided to the fund under the Advisory Contracts should continue to benefit the shareholders of the fund.
Competitiveness of Management Fee and Total Expense Ratio. The Board considered the fund's management fee and total expense ratio compared to "mapped groups" of competitive funds and classes created for the purpose of facilitating the Trustees' competitive analysis of management fees and total expenses. Fidelity creates "mapped groups" by combining similar Broadridge investment objective categories that have comparable investment mandates. Combining Broadridge investment objective categories aids the Board's management fee and total expense ratio comparisons by broadening the competitive group used for comparison.
Management Fee. The Board considered two proprietary management fee comparisons for the 12-month (or shorter) periods shown in basis points (BP) in the chart below. The group of Broadridge funds used by the Board for management fee comparisons is referred to below as the "Total Mapped Group." The Total Mapped Group is broader than the Broadridge peer group used by the Board for performance comparisons because the Total Mapped Group combines several Broadridge investment objective categories while the Broadridge peer group does not. The Total Mapped Group comparison focuses on a fund's standing in terms of gross management fees before expense reimbursements or caps relative to the total universe of funds with comparable investment mandates, regardless of whether their management fee structures also are comparable. Funds with comparable investment mandates offer exposure to similar types of securities. Funds with comparable management fee structures have similar management fee contractual arrangements (
e.g., flat rate charged for advisory services, all-inclusive fee rate,
etc.). "TMG %" represents the percentage of funds in the Total Mapped Group that had management fees that were lower than the fund's. For example, a hypothetical TMG % of 20% would mean that 80% of the funds in the Total Mapped Group had higher, and 20% had lower, management fees than the fund. The fund's actual TMG %s and the number of funds in the Total Mapped Group are in the chart below. The "Asset-Size Peer Group" (ASPG) comparison focuses on a fund's standing relative to a subset of non-Fidelity funds within the Total Mapped Group that are similar in size and management fee structure. For example, if a fund is in the first quartile of the ASPG, the fund's management fee ranks in the least expensive or lowest 25% of funds in the ASPG. The ASPG represents at least 15% of the funds in the Total Mapped Group with comparable asset size and management fee structures, subject to a minimum of 50 funds (or all funds in the Total Mapped Group if fewer than 50). Additional information, such as the ASPG quartile in which the fund's management fee rate ranked, is also included in the chart and considered by the Board.
Fidelity Series Real Estate Income Fund
The Board noted that the fund's management fee rate ranked below the median of its Total Mapped Group and below the median of its ASPG for 2015.
The Board noted that, in 2014, the ad hoc Committee on Group Fee was formed by it and the boards of other Fidelity funds to conduct an in-depth review of the "group fee" component of the management fee of funds with such management fee structures. The Committee's focus included the mechanics of the group fee, the competitive landscape of group fee structures, Fidelity funds with no group fee component and investment products not included in group fee assets. The Board also considered that, for funds subject to the group fee, FMR agreed to voluntarily waive fees over a specified period of time in amounts designed to account for assets converted from certain funds to certain collective investment trusts.
The Board also noted that, in 2013, the ad hoc Committee on Management Fees was formed to conduct an in-depth review of the management fee rates of Fidelity's active equity mutual funds. The Committee focused on the following areas: (i) standard fee structures; (ii) research consumption and trading evolution; (iii) management fee competitiveness/profitability by category; and (iv) factors that drive institutional pricing.
Based on its review, the Board concluded that the fund's management fee is fair and reasonable in light of the services that the fund receives and the other factors considered.
Total Expense Ratio. In its review of each class's total expense ratio, the Board considered the fund's management fee rate as well as other fund or class expenses, as applicable, such as transfer agent fees, pricing and bookkeeping fees, and custodial, legal, and audit fees. The Board also noted that Fidelity may agree to waive fees and expenses from time to time, and the extent to which, if any, it has done so for the fund. As part of its review, the Board also considered the current and historical total expense ratios of each class of the fund compared to competitive fund median expenses. Each class of the fund is compared to those funds and classes in the Total Mapped Group (used by the Board for management fee comparisons) that have a similar sales load structure.
The Board noted that the total expense ratio of each class ranked below the competitive median for 2015.
Fees Charged to Other Fidelity Clients. The Board also considered Fidelity fee structures and other information with respect to clients of Fidelity, such as other funds advised or subadvised by Fidelity, pension plan clients, and other institutional clients with similar mandates. The Board noted the findings of the 2013 ad hoc joint committee (created with the board of other Fidelity funds), which reviewed and compared Fidelity's institutional investment advisory business with its business of providing services to the Fidelity funds, including the differences in services provided, fees charged, and costs incurred, as well as competition in their respective marketplaces.
Based on its review of total expense ratios and fees charged to other Fidelity clients, the Board concluded that the total expense ratio of each class of the fund was reasonable in light of the services that the fund and its shareholders receive and the other factors considered.
Costs of the Services and Profitability. The Board considered the revenues earned and the expenses incurred by Fidelity in conducting the business of developing, marketing, distributing, managing, administering and servicing the fund and servicing the fund's shareholders. The Board also considered the level of Fidelity's profits in respect of all the Fidelity funds.
On an annual basis, Fidelity presents to the Board information about the profitability of its relationship with the fund. Fidelity calculates profitability information for each fund, as well as aggregate profitability information for groups of Fidelity funds and all Fidelity funds, using a series of detailed revenue and cost allocation methodologies which originate with the books and records of Fidelity on which Fidelity's audited financial statements are based. The Audit Committee of the Board reviews any significant changes from the prior year's methodologies.
PricewaterhouseCoopers LLP (PwC), independent registered public accounting firm and auditor to Fidelity and certain Fidelity funds, has been engaged annually by the Board as part of the Board's assessment of Fidelity's profitability analysis. PwC's engagement includes the review and assessment of the methodologies used by Fidelity in determining the revenues and expenses attributable to Fidelity's mutual fund business, and completion of agreed-upon procedures in respect of the mathematical accuracy of the fund profitability information and its conformity to established allocation methodologies. After considering PwC's reports issued under the engagement and information provided by Fidelity, the Board concluded that while other allocation methods may also be reasonable, Fidelity's profitability methodologies are reasonable in all material respects.
The Board also reviewed Fidelity's non-fund businesses and fall-out benefits related to the mutual fund business as well as cases where Fidelity's affiliates may benefit from or be related to the fund's business.
The Board considered the costs of the services provided by and the profits realized by Fidelity in connection with the operation of the fund and was satisfied that the profitability was not excessive.
Economies of Scale. The Board considered whether there have been economies of scale in respect of the management of the Fidelity funds, whether the Fidelity funds (including the fund) have appropriately benefited from any such economies of scale, and whether there is potential for realization of any further economies of scale. The Board considered the extent to which the fund will benefit from economies of scale as assets grow through increased services to the fund, through waivers or reimbursements, or through fee or expense ratio reductions. The Board also noted that in 2013, it and the boards of other Fidelity funds created an ad hoc committee (the Economies of Scale Committee) to analyze whether Fidelity attains economies of scale in respect of the management and servicing of the Fidelity funds, whether the Fidelity funds have appropriately benefited from such economies of scale, and whether there is potential for realization of any further economies of scale.
The Board recognized that the fund's management contract incorporates a "group fee" structure, which provides for lower group fee rates as total group assets increase, and for higher group fee rates as total group assets decrease (with "group assets" defined to include fund assets under FMR's management plus the assets of sector funds previously under FMR's management). FMR calculates the group fee rates based on a tiered asset "breakpoint" schedule that varies based on asset class. The Board considered that the group fee is designed to deliver the benefits of economies of scale to fund shareholders when total Fidelity fund assets increase, even if assets of any particular fund are unchanged or have declined, because some portion of Fidelity's costs are attributable to services provided to all Fidelity funds, and all funds benefit if those costs can be allocated among more assets. The Board also considered that although the fund is offered only to other Fidelity funds, it continues to incur investment management expenses. The Board further noted that the fund may continue to realize benefits from the group fee structure, even though assets may not be expected to grow significantly at the fund level. The Board concluded that, given the group fee structure, fund shareholders will benefit from lower management fees as group assets increase at the fund complex level, regardless of whether Fidelity achieves any such economies of scale.
The Board concluded, taking into account the analysis of the Economies of Scale Committee, that economies of scale, if any, are being appropriately shared between fund shareholders and Fidelity.
Approval of New Advisory Contracts. The Board also voted to approve a new management contract and new sub-advisory agreements for the fund (New Advisory Contracts) that will take effect if the shareholders of certain other Fidelity funds that invest in the fund (referred to herein as Freedom Funds) approve new management contracts for the Freedom Funds. Under the New Advisory Contracts the fund will no longer pay a management fee to FMR. The new sub-advisory agreements provide that FMR or its affiliates will pay the fees based on a portion of the management fees received by an affiliate of FMR under its management contracts with the Freedom Funds. The Board noted the New Advisory Contracts are expected to result in an overall decrease in the fees and expenses payable by the fund. The Board considered that the approval of the New Advisory Contracts will not result in any changes to (i) the investment process or strategies employed in the management of the fund's assets; (ii) the nature, extent and quality of services provided to the fund; or (iii) the day-to-day management of the fund and the personnel primarily responsible for such management. The Board also considered that the New Advisory Contracts provide that FMR or an affiliate undertakes to pay all operating expenses of the fund, except transfer agent fees, 12b-1 fees, Independent Trustee expenses, custodian fees and expenses, expenses related to proxy solicitations, interest, taxes, brokerage expenses, and extraordinary expenses (such as litigation expenses).
Additional Information Requested by the Board. In order to develop fully the factual basis for consideration of the Fidelity funds' Advisory Contracts, the Board requested and received additional information on certain topics, including: (i) fund performance trends and Fidelity's long-term strategies for certain funds; (ii) the various share classes employed by Fidelity and the attributes of each class, together with similar information on the distribution and servicing payments made by Fidelity or the funds to third-party participants in the distribution channels; (iii) fund profitability, and fund performance in relation to fund profitability; (iv) the methodology with respect to evaluating competitive fund data and peer group classifications and fee comparisons; (v) annual fund profitability margins; (vi) the realization of fall-out benefits in and attribution of fall-out benefits to certain Fidelity business units; (vii) the appropriateness of certain funds' benchmarks; (viii) the rationalization for certain share classes and expenses; (ix) sub-advisory fee rates for comparable investment mandates; (x) product strategy for certain underperforming funds; and (xi) Fidelity's resources and strategy for cybersecurity.
Based on its evaluation of all of the conclusions noted above, and after considering all factors it believed relevant, the Board concluded that the advisory fee structures are fair and reasonable, and that the fund's Advisory Contracts should be renewed.
Corporate Headquarters
245 Summer St.
Boston, MA 02210
www.fidelity.com
SRE-ANN-0916
1.924310.104
Fidelity® Small Cap Growth Fund
Annual Report July 31, 2016 |
|
Contents
To view a fund's proxy voting guidelines and proxy voting record for the 12-month period ended June 30, visit http://www.fidelity.com/proxyvotingresults or visit the Securities and Exchange Commission's (SEC) web site at http://www.sec.gov.
You may also call 1-800-544-8544 to request a free copy of the proxy voting guidelines.
Standard & Poor's, S&P and S&P 500 are registered service marks of The McGraw-Hill Companies, Inc. and have been licensed for use by Fidelity Distributors Corporation.
Other third-party marks appearing herein are the property of their respective owners.
All other marks appearing herein are registered or unregistered trademarks or service marks of FMR LLC or an affiliated company. © 2016 FMR LLC. All rights reserved.
This report and the financial statements contained herein are submitted for the general information of the shareholders of the Fund. This report is not authorized for distribution to prospective investors in the Fund unless preceded or accompanied by an effective prospectus.
A fund files its complete schedule of portfolio holdings with the SEC for the first and third quarters of each fiscal year on Form N-Q. Forms N-Q are available on the SEC’s web site at http://www.sec.gov. A fund's Forms N-Q may be reviewed and copied at the SEC’s Public Reference Room in Washington, DC. Information regarding the operation of the SEC's Public Reference Room may be obtained by calling 1-800-SEC-0330.
For a complete list of a fund's portfolio holdings, view the most recent holdings listing, semiannual report, or annual report on Fidelity's web site at http://www.fidelity.com, http://www.institutional.fidelity.com, or http://www.401k.com, as applicable.
NOT FDIC INSURED •MAY LOSE VALUE •NO BANK GUARANTEE
Neither the Fund nor Fidelity Distributors Corporation is a bank.
Performance: The Bottom Line
Average annual total return reflects the change in the value of an investment, assuming reinvestment of distributions from dividend income and capital gains (the profits earned upon the sale of securities that have grown in value, if any) and assuming a constant rate of performance each year. The hypothetical investment and the average annual total returns do not reflect the deduction of taxes that a shareholder would pay on fund distributions or the redemption of fund shares. During periods of reimbursement by Fidelity, a fund’s total return will be greater than it would be had the reimbursement not occurred. How a fund did yesterday is no guarantee of how it will do tomorrow.
Average Annual Total Returns
| For the periods ended July 31, 2016 | Past 1 year | Past 5 years | Past 10 years |
| Fidelity® Small Cap Growth Fund | (2.63)% | 11.74% | 9.25% |
$10,000 Over 10 Years
Let's say hypothetically that $10,000 was invested in Fidelity® Small Cap Growth Fund, a class of the fund, on July 31, 2006.
The chart shows how the value of your investment would have changed, and also shows how the Russell 2000® Growth Index performed over the same period.
| Period Ending Values |
| $24,216 | Fidelity® Small Cap Growth Fund |
| $22,407 | Russell 2000® Growth Index |
Management's Discussion of Fund Performance
Market Recap: U.S. equities gained modestly for the year ending July 31, 2016, overcoming persistent concern about global economic growth, uncertainty regarding U.S. monetary policy and the U.K.’s late-June vote to leave the European Union, dubbed Brexit. The S&P 500 index rose 5.61%, with larger-cap, value-oriented stocks and defensive sectors shining brightest. Volatility peaked in the early weeks of 2016, as continued oil-price weakness and U.S.-dollar strength pushed the S&P 500
® to its worst January since 2009. Markets then rose beginning in February amid U.S. job gains, a broad rally in energy and materials markets, global economic stimulus and perceived softening of monetary policy by the U.S. Federal Reserve. The June 23 Brexit vote surprised markets and resulted in a sharp two-day decline for stocks, followed by a rebound as investor sentiment shifted and remained positive through July 31. For the year, dividend-rich telecom services (+26%), utilities (+23%) and consumer staples (+12%) led the way amid strong investor demand for yield. Industrials (+10%) and information technology (+10%) also outperformed, as did materials (+8%), despite a weak commodities environment overall. Conversely, a strong run for real estate stocks couldn’t keep financials (-4%) from losing ground, as low interest rates continued to squeeze bank profits.
Comments from Portfolio Manager Patrick Venanzi: For the year, the fund’s share classes (excluding sales charges, if applicable) outpaced the -5.30% return of the benchmark Russell 2000
® Growth Index. Strong stock selection drove the fund’s relative outperformance, with picks within the financials, consumer discretionary, industrials and health care sectors helping most. The fund's biggest individual contributor – and also its largest holding – was 2U, which provides cloud-based online campuses and learning platforms for nonprofit colleges and universities. Shares of 2U gained about 9% for the year. In April, the firm announced a 12-year extension on one of its contracts as well as new educational programs. Then, in June, the firm reported strong first-quarter financial results along with solid full-year 2016 guidance. A non-index stake in Global Payments, which offers solutions for credit and debit card transactions, gift cards, and other electronic forms of payment, also helped. We sold Global Payments from the fund by period end. Conversely, sector allocation overall proved a modest drag on relative results. Picks in telecommunication services also hurt. The fund’s biggest relative detractor was G-III Apparel Group, a sizable fund holding. G-III sells outerwear and other clothing under a portfolio of brands including Calvin Klein and Tommy Hilfiger. Sales of key outerwear products suffered due to the mild winter this year, which hurt the stock.
The views expressed above reflect those of the portfolio manager(s) only through the end of the period as stated on the cover of this report and do not necessarily represent the views of Fidelity or any other person in the Fidelity organization. Any such views are subject to change at any time based upon market or other conditions and Fidelity disclaims any responsibility to update such views. These views may not be relied on as investment advice and, because investment decisions for a Fidelity fund are based on numerous factors, may not be relied on as an indication of trading intent on behalf of any Fidelity fund.
Investment Summary (Unaudited)
Top Ten Stocks as of July 31, 2016
| | % of fund's net assets | % of fund's net assets 6 months ago |
| 2U, Inc. | 3.3 | 2.6 |
| NxStage Medical, Inc. | 2.5 | 1.7 |
| Cedar Fair LP (depositary unit) | 1.9 | 0.0 |
| Stamps.com, Inc. | 1.9 | 1.8 |
| Surgical Care Affiliates, Inc. | 1.8 | 1.7 |
| Cirrus Logic, Inc. | 1.5 | 1.0 |
| Store Capital Corp. | 1.4 | 1.1 |
| Integra LifeSciences Holdings Corp. | 1.4 | 0.5 |
| Bright Horizons Family Solutions, Inc. | 1.3 | 1.6 |
| RealPage, Inc. | 1.3 | 0.5 |
| | 18.3 | |
Top Five Market Sectors as of July 31, 2016
| | % of fund's net assets | % of fund's net assets 6 months ago |
| Information Technology | 27.7 | 23.7 |
| Health Care | 26.1 | 22.7 |
| Industrials | 15.3 | 11.9 |
| Consumer Discretionary | 12.3 | 15.7 |
| Financials | 8.1 | 10.0 |
Asset Allocation (% of fund's net assets)
| As of July 31, 2016* |
| | Stocks | 99.9% |
| | Short-Term Investments and Net Other Assets (Liabilities) | 0.1% |

* Foreign investments - 8.4%
| As of January 31, 2016* |
| | Stocks | 92.8% |
| | Other Investments | 2.1% |
| | Short-Term Investments and Net Other Assets (Liabilities) | 5.1% |

* Foreign investments - 5.6%
Percentages shown as 0.0% may reflect amounts less than 0.05%.
Investments July 31, 2016
Showing Percentage of Net Assets
| Common Stocks - 99.9% | | | |
| | | Shares | Value |
| CONSUMER DISCRETIONARY - 12.3% | | | |
| Auto Components - 0.7% | | | |
| Drew Industries, Inc. | | 100,000 | $9,161,000 |
| Visteon Corp. | | 89,100 | 6,245,019 |
| | | | 15,406,019 |
| Automobiles - 0.2% | | | |
| Thor Industries, Inc. | | 48,966 | 3,747,858 |
| Distributors - 1.5% | | | |
| LKQ Corp. (a) | | 400,000 | 13,756,000 |
| Pool Corp. | | 170,000 | 17,387,600 |
| | | | 31,143,600 |
| Diversified Consumer Services - 2.3% | | | |
| Bright Horizons Family Solutions, Inc. (a) | | 402,100 | 26,968,847 |
| Grand Canyon Education, Inc. (a) | | 229,800 | 9,665,388 |
| Service Corp. International | | 342,900 | 9,505,188 |
| | | | 46,139,423 |
| Hotels, Restaurants & Leisure - 3.9% | | | |
| Bojangles', Inc. (a) | | 2,000 | 34,760 |
| Cedar Fair LP (depositary unit) | | 668,129 | 39,553,237 |
| Dave & Buster's Entertainment, Inc. (a) | | 362,800 | 16,144,600 |
| Vail Resorts, Inc. | | 146,000 | 20,888,220 |
| Wingstop, Inc. (b) | | 158,900 | 4,131,400 |
| | | | 80,752,217 |
| Household Durables - 1.2% | | | |
| TopBuild Corp. (a) | | 330,000 | 12,460,800 |
| Universal Electronics, Inc. (a) | | 149,209 | 11,539,824 |
| | | | 24,000,624 |
| Leisure Products - 0.5% | | | |
| Malibu Boats, Inc. Class A (a) | | 279,036 | 3,806,051 |
| Vista Outdoor, Inc. (a) | | 120,000 | 6,006,000 |
| | | | 9,812,051 |
| Specialty Retail - 1.5% | | | |
| Burlington Stores, Inc. (a) | | 230,000 | 17,597,300 |
| Michaels Companies, Inc. (a) | | 250,000 | 6,590,000 |
| Winmark Corp. | | 72,357 | 7,276,943 |
| | | | 31,464,243 |
| Textiles, Apparel & Luxury Goods - 0.5% | | | |
| G-III Apparel Group Ltd. (a) | | 251,800 | 10,079,554 |
|
| TOTAL CONSUMER DISCRETIONARY | | | 252,545,589 |
|
| CONSUMER STAPLES - 4.6% | | | |
| Food & Staples Retailing - 1.5% | | | |
| Casey's General Stores, Inc. | | 105,900 | 14,141,886 |
| United Natural Foods, Inc. (a) | | 314,159 | 15,701,667 |
| | | | 29,843,553 |
| Food Products - 2.0% | | | |
| Darling International, Inc. (a) | | 1,189,300 | 18,767,154 |
| Post Holdings, Inc. (a) | | 120,000 | 10,400,400 |
| TreeHouse Foods, Inc. (a) | | 122,500 | 12,640,775 |
| | | | 41,808,329 |
| Household Products - 1.1% | | | |
| Central Garden & Pet Co. (a)(b) | | 300,000 | 7,278,000 |
| Central Garden & Pet Co. Class A (non-vtg.) (a) | | 300,000 | 6,837,000 |
| Spectrum Brands Holdings, Inc. | | 70,000 | 9,013,900 |
| | | | 23,128,900 |
|
| TOTAL CONSUMER STAPLES | | | 94,780,782 |
|
| ENERGY - 1.9% | | | |
| Energy Equipment & Services - 1.6% | | | |
| Dril-Quip, Inc. (a) | | 83,700 | 4,555,791 |
| Frank's International NV | | 400,000 | 4,928,000 |
| Oil States International, Inc. (a) | | 330,000 | 10,203,600 |
| Superior Drilling Products, Inc. (a) | | 602,986 | 1,006,987 |
| Tesco Corp. | | 722,960 | 4,778,766 |
| Transocean Partners LLC | | 494,705 | 5,402,179 |
| Xtreme Drilling & Coil Services Corp. (a) | | 1,289,000 | 2,379,267 |
| | | | 33,254,590 |
| Oil, Gas & Consumable Fuels - 0.3% | | | |
| StealthGas, Inc. (a) | | 1,414,187 | 5,034,506 |
|
| TOTAL ENERGY | | | 38,289,096 |
|
| FINANCIALS - 8.1% | | | |
| Diversified Financial Services - 1.9% | | | |
| Bats Global Markets, Inc. (b) | | 439,100 | 11,144,358 |
| Cotiviti Holdings, Inc. | | 400,000 | 9,656,000 |
| MSCI, Inc. Class A | | 220,000 | 18,928,800 |
| | | | 39,729,158 |
| Insurance - 2.1% | | | |
| First American Financial Corp. | | 573,000 | 23,957,130 |
| NIB Holdings Ltd. | | 2,500,000 | 8,796,421 |
| ProAssurance Corp. | | 190,000 | 9,815,400 |
| | | | 42,568,951 |
| Real Estate Investment Trusts - 2.5% | | | |
| Coresite Realty Corp. | | 260,000 | 21,457,800 |
| Store Capital Corp. | | 917,300 | 28,610,587 |
| | | | 50,068,387 |
| Thrifts & Mortgage Finance - 1.6% | | | |
| Essent Group Ltd. (a) | | 550,000 | 13,178,000 |
| Meridian Bancorp, Inc. | | 1,326,534 | 19,500,050 |
| | | | 32,678,050 |
|
| TOTAL FINANCIALS | | | 165,044,546 |
|
| HEALTH CARE - 26.1% | | | |
| Biotechnology - 6.4% | | | |
| Alder Biopharmaceuticals, Inc. (a) | | 330,000 | 10,593,000 |
| Amicus Therapeutics, Inc. (a)(b) | | 849,700 | 5,709,984 |
| Ascendis Pharma A/S sponsored ADR (a)(b) | | 365,183 | 5,258,635 |
| Blueprint Medicines Corp. (a)(b) | | 250,000 | 5,527,500 |
| Cellectis SA sponsored ADR (a) | | 129,100 | 3,404,367 |
| Coherus BioSciences, Inc. (a)(b) | | 306,750 | 7,788,383 |
| Curis, Inc. (a) | | 998,200 | 1,676,976 |
| DBV Technologies SA sponsored ADR (a) | | 154,188 | 5,334,905 |
| Dyax Corp. rights 12/31/19 (a) | | 380,400 | 916,764 |
| Dynavax Technologies Corp. (a)(b) | | 251,625 | 3,882,574 |
| Five Prime Therapeutics, Inc. (a) | | 138,100 | 7,000,289 |
| Heron Therapeutics, Inc. (a)(b) | | 262,200 | 4,357,764 |
| Intercept Pharmaceuticals, Inc. (a) | | 31,600 | 5,467,748 |
| La Jolla Pharmaceutical Co. (a) | | 152,622 | 2,594,574 |
| Ligand Pharmaceuticals, Inc. Class B (a) | | 80,000 | 10,790,400 |
| Lion Biotechnologies, Inc. (a) | | 581,930 | 5,144,261 |
| Macrogenics, Inc. (a) | | 280,000 | 8,565,200 |
| Mirati Therapeutics, Inc. (a)(b) | | 53,241 | 247,038 |
| Novavax, Inc. (a) | | 1,717,697 | 12,573,542 |
| Otonomy, Inc. (a) | | 438,029 | 6,290,096 |
| TESARO, Inc. (a) | | 109,200 | 10,181,808 |
| Ultragenyx Pharmaceutical, Inc. (a) | | 110,000 | 6,960,800 |
| | | | 130,266,608 |
| Health Care Equipment & Supplies - 8.4% | | | |
| Cantel Medical Corp. | | 123,096 | 8,241,277 |
| Cerus Corp. (a)(b) | | 1,040,617 | 7,690,160 |
| Cryolife, Inc. | | 283,565 | 4,131,542 |
| Hill-Rom Holdings, Inc. | | 344,000 | 18,379,920 |
| ICU Medical, Inc. (a) | | 102,500 | 11,967,900 |
| Insulet Corp. (a) | | 300,000 | 10,617,000 |
| Integra LifeSciences Holdings Corp. (a) | | 330,000 | 27,809,100 |
| Nevro Corp. (a)(b) | | 171,200 | 14,158,240 |
| NxStage Medical, Inc. (a) | | 2,330,732 | 51,532,485 |
| Wright Medical Group NV (a) | | 772,129 | 16,932,789 |
| | | | 171,460,413 |
| Health Care Providers & Services - 3.9% | | | |
| Amedisys, Inc. (a) | | 260,000 | 13,923,000 |
| LHC Group, Inc. (a) | | 40,684 | 1,841,358 |
| Patterson Companies, Inc. | | 200,000 | 9,872,000 |
| Surgical Care Affiliates, Inc. (a) | | 700,917 | 36,454,693 |
| VCA, Inc. (a) | | 266,500 | 19,012,110 |
| | | | 81,103,161 |
| Health Care Technology - 2.0% | | | |
| athenahealth, Inc. (a) | | 110,557 | 14,128,079 |
| Evolent Health, Inc. (a)(b) | | 300,000 | 7,062,000 |
| Press Ganey Holdings, Inc. (a)(b) | | 190,000 | 7,584,800 |
| Veeva Systems, Inc. Class A (a) | | 352,659 | 13,397,515 |
| | | | 42,172,394 |
| Life Sciences Tools & Services - 1.6% | | | |
| Bruker Corp. | | 271,500 | 6,765,780 |
| Cambrex Corp. (a) | | 250,000 | 13,102,500 |
| Charles River Laboratories International, Inc. (a) | | 140,000 | 12,310,200 |
| | | | 32,178,480 |
| Pharmaceuticals - 3.8% | | | |
| Catalent, Inc. (a) | | 896,600 | 22,899,164 |
| Collegium Pharmaceutical, Inc. (a)(b) | | 220,000 | 2,668,600 |
| GW Pharmaceuticals PLC ADR (a) | | 100,000 | 9,432,000 |
| Patheon NV | | 327,900 | 8,479,494 |
| Prestige Brands Holdings, Inc. (a) | | 304,175 | 16,273,363 |
| SCYNEXIS, Inc. (a) | | 931,989 | 1,882,618 |
| SCYNEXIS, Inc. warrants 6/21/21 (a) | | 168,750 | 109,920 |
| The Medicines Company (a) | | 200,000 | 7,822,000 |
| TherapeuticsMD, Inc. (a) | | 1,019,345 | 7,920,311 |
| | | | 77,487,470 |
|
| TOTAL HEALTH CARE | | | 534,668,526 |
|
| INDUSTRIALS - 15.3% | | | |
| Aerospace & Defense - 3.2% | | | |
| Aerojet Rocketdyne Holdings, Inc. (a) | | 917,491 | 17,303,880 |
| Astronics Corp. (a) | | 27,159 | 1,039,375 |
| BWX Technologies, Inc. | | 411,000 | 15,128,910 |
| Curtiss-Wright Corp. | | 180,000 | 16,018,200 |
| Huntington Ingalls Industries, Inc. | | 95,000 | 16,395,100 |
| | | | 65,885,465 |
| Building Products - 1.5% | | | |
| A.O. Smith Corp. | | 72,000 | 6,688,080 |
| Gibraltar Industries, Inc. (a) | | 564,811 | 19,926,532 |
| Universal Forest Products, Inc. | | 40,000 | 4,324,800 |
| | | | 30,939,412 |
| Commercial Services & Supplies - 2.9% | | | |
| Deluxe Corp. | | 244,039 | 16,494,596 |
| KAR Auction Services, Inc. | | 335,000 | 14,327,950 |
| Knoll, Inc. | | 558,400 | 14,099,600 |
| Matthews International Corp. Class A | | 240,018 | 14,427,482 |
| | | | 59,349,628 |
| Construction & Engineering - 1.2% | | | |
| Dycom Industries, Inc. (a) | | 140,000 | 13,167,000 |
| Granite Construction, Inc. | | 225,000 | 11,200,500 |
| | | | 24,367,500 |
| Electrical Equipment - 1.5% | | | |
| AZZ, Inc. | | 269,991 | 16,761,041 |
| Regal Beloit Corp. | | 217,387 | 13,262,781 |
| | | | 30,023,822 |
| Machinery - 3.0% | | | |
| Allison Transmission Holdings, Inc. | | 484,118 | 13,952,281 |
| Hillenbrand, Inc. | | 110,099 | 3,561,703 |
| John Bean Technologies Corp. | | 265,741 | 17,783,388 |
| Rexnord Corp. (a) | | 192,797 | 4,104,648 |
| Xylem, Inc. | | 470,000 | 22,470,700 |
| | | | 61,872,720 |
| Professional Services - 0.6% | | | |
| CBIZ, Inc. (a) | | 796,100 | 8,605,841 |
| GP Strategies Corp. (a) | | 200,557 | 4,203,675 |
| | | | 12,809,516 |
| Road & Rail - 1.4% | | | |
| Landstar System, Inc. | | 100,000 | 7,049,000 |
| Swift Transporation Co. (a) | | 1,130,000 | 21,752,500 |
| | | | 28,801,500 |
|
| TOTAL INDUSTRIALS | | | 314,049,563 |
|
| INFORMATION TECHNOLOGY - 27.7% | | | |
| Communications Equipment - 1.1% | | | |
| InterDigital, Inc. | | 361,339 | 21,337,068 |
| Electronic Equipment & Components - 3.5% | | | |
| Cardtronics PLC | | 140,883 | 6,197,443 |
| CDW Corp. | | 320,000 | 13,737,600 |
| Coherent, Inc. (a) | | 94,396 | 10,010,696 |
| Fabrinet (a) | | 430,000 | 16,236,800 |
| Jabil Circuit, Inc. | | 438,330 | 8,920,016 |
| Orbotech Ltd. (a) | | 550,000 | 15,691,500 |
| | | | 70,794,055 |
| Internet Software & Services - 7.7% | | | |
| 2U, Inc. (a)(b) | | 1,920,117 | 67,165,690 |
| Benefitfocus, Inc. (a)(b) | | 58,972 | 2,535,796 |
| Cimpress NV (a)(b) | | 125,000 | 11,850,000 |
| Cornerstone OnDemand, Inc. (a) | | 200,000 | 8,638,000 |
| GoDaddy, Inc. (a) | | 730,000 | 21,841,600 |
| Instructure, Inc. (a)(b) | | 334,277 | 7,267,182 |
| Stamps.com, Inc. (a)(b) | | 512,896 | 38,880,081 |
| | | | 158,178,349 |
| IT Services - 5.3% | | | |
| Black Knight Financial Services, Inc. Class A (a) | | 175,000 | 6,798,750 |
| Broadridge Financial Solutions, Inc. | | 200,100 | 13,542,768 |
| Convergys Corp. | | 440,000 | 11,726,000 |
| Euronet Worldwide, Inc. (a) | | 125,000 | 9,532,500 |
| ExlService Holdings, Inc. (a) | | 299,977 | 14,851,861 |
| Gartner, Inc. Class A (a) | | 88,496 | 8,871,724 |
| Genpact Ltd. (a) | | 560,000 | 14,991,200 |
| Perficient, Inc. (a) | | 795,500 | 17,676,010 |
| Planet Payment, Inc. (a) | | 1,500,000 | 7,035,000 |
| WNS Holdings Ltd. sponsored ADR (a) | | 136,262 | 3,824,874 |
| | | | 108,850,687 |
| Semiconductors & Semiconductor Equipment - 2.5% | | | |
| Cirrus Logic, Inc. (a) | | 621,532 | 30,200,240 |
| Entegris, Inc. (a) | | 350,000 | 5,981,500 |
| Monolithic Power Systems, Inc. | | 150,000 | 10,908,000 |
| Silicon Motion Technology Corp. sponsored ADR | | 94,252 | 4,872,828 |
| | | | 51,962,568 |
| Software - 7.6% | | | |
| Blackbaud, Inc. | | 230,410 | 15,402,909 |
| Cadence Design Systems, Inc. (a) | | 796,200 | 19,148,610 |
| Digimarc Corp. (a)(b) | | 72,829 | 2,651,704 |
| Ellie Mae, Inc. (a) | | 155,000 | 14,277,050 |
| Fair Isaac Corp. | | 95,000 | 12,030,800 |
| HubSpot, Inc. (a) | | 448,115 | 24,462,598 |
| Interactive Intelligence Group, Inc. (a) | | 280,930 | 15,156,174 |
| Paycom Software, Inc. (a) | | 290,000 | 13,690,900 |
| RealPage, Inc. (a) | | 1,026,000 | 25,803,900 |
| RingCentral, Inc. (a) | | 300,000 | 6,909,000 |
| Ultimate Software Group, Inc. (a) | | 30,000 | 6,273,000 |
| | | | 155,806,645 |
|
| TOTAL INFORMATION TECHNOLOGY | | | 566,929,372 |
|
| MATERIALS - 2.7% | | | |
| Chemicals - 0.5% | | | |
| Codexis, Inc. (a) | | 683,761 | 2,974,360 |
| Innospec, Inc. | | 149,895 | 7,535,222 |
| | | | 10,509,582 |
| Containers & Packaging - 1.5% | | | |
| Aptargroup, Inc. | | 101,876 | 7,964,666 |
| Berry Plastics Group, Inc. (a) | | 150,000 | 6,150,000 |
| Graphic Packaging Holding Co. | | 1,220,200 | 16,643,528 |
| | | | 30,758,194 |
| Paper & Forest Products - 0.7% | | | |
| Boise Cascade Co. (a) | | 357,000 | 9,699,690 |
| TFS Corp. Ltd. (b) | | 3,693,636 | 4,575,375 |
| | | | 14,275,065 |
|
| TOTAL MATERIALS | | | 55,542,841 |
|
| TELECOMMUNICATION SERVICES - 1.2% | | | |
| Diversified Telecommunication Services - 1.2% | | | |
| 8x8, Inc. (a) | | 850,195 | 11,690,181 |
| Cogent Communications Group, Inc. | | 300,000 | 12,819,000 |
| | | | 24,509,181 |
| TOTAL COMMON STOCKS | | | |
| (Cost $1,780,140,728) | | | 2,046,359,496 |
|
| Money Market Funds - 6.9% | | | |
| Fidelity Cash Central Fund, 0.42% (c) | | 36,661,637 | 36,661,637 |
| Fidelity Securities Lending Cash Central Fund, 0.45% (c)(d) | | 104,549,711 | 104,549,711 |
| TOTAL MONEY MARKET FUNDS | | | |
| (Cost $141,211,348) | | | 141,211,348 |
| TOTAL INVESTMENT PORTFOLIO - 106.8% | | | |
| (Cost $1,921,352,076) | | | 2,187,570,844 |
| NET OTHER ASSETS (LIABILITIES) - (6.8)% | | | (139,444,663) |
| NET ASSETS - 100% | | | $2,048,126,181 |
Legend
(a) Non-income producing
(b) Security or a portion of the security is on loan at period end.
(c) Affiliated fund that is generally available only to investment companies and other accounts managed by Fidelity Investments. The rate quoted is the annualized seven-day yield of the fund at period end. A complete unaudited listing of the fund's holdings as of its most recent quarter end is available upon request. In addition, each Fidelity Central Fund's financial statements, which are not covered by the Fund's Report of Independent Registered Public Accounting Firm, are available on the SEC's website or upon request.
(d) Investment made with cash collateral received from securities on loan.
Affiliated Central Funds
Information regarding fiscal year to date income earned by the Fund from investments in Fidelity Central Funds is as follows:
| Fund | Income earned |
| Fidelity Cash Central Fund | $155,066 |
| Fidelity Securities Lending Cash Central Fund | 2,218,595 |
| Total | $2,373,661 |
Other Affiliated Issuers
An affiliated company is a company in which the Fund has ownership of at least 5% of the voting securities. Fiscal year to date transactions with companies which are or were affiliates are as follows:
| Affiliate | Value, beginning of period | Purchases | Sales Proceeds | Dividend Income | Value, end of period |
| 2U, Inc. | $40,893,251 | $38,591,529 | $26,809,567 | $-- | $-- |
| Mattersight Corp. | 12,150,086 | -- | 7,020,182 | -- | -- |
| Superior Drilling Products, Inc. | 1,928,281 | -- | 855,680 | -- | -- |
| Total | $54,971,618 | $38,591,529 | $34,685,429 | $-- | $-- |
Investment Valuation
The following is a summary of the inputs used, as of July 31, 2016, involving the Fund's assets and liabilities carried at fair value. The inputs or methodology used for valuing securities may not be an indication of the risk associated with investing in those securities. For more information on valuation inputs, and their aggregation into the levels used below, please refer to the Investment Valuation section in the accompanying Notes to Financial Statements.
| | Valuation Inputs at Reporting Date: |
| Description | Total | Level 1 | Level 2 | Level 3 |
| Investments in Securities: | | | | |
| Equities: | | | | |
| Consumer Discretionary | $252,545,589 | $252,545,589 | $-- | $-- |
| Consumer Staples | 94,780,782 | 94,780,782 | -- | -- |
| Energy | 38,289,096 | 38,289,096 | -- | -- |
| Financials | 165,044,546 | 165,044,546 | -- | -- |
| Health Care | 534,668,526 | 533,641,842 | 109,920 | 916,764 |
| Industrials | 314,049,563 | 314,049,563 | -- | -- |
| Information Technology | 566,929,372 | 566,929,372 | -- | -- |
| Materials | 55,542,841 | 55,542,841 | -- | -- |
| Telecommunication Services | 24,509,181 | 24,509,181 | -- | -- |
| Money Market Funds | 141,211,348 | 141,211,348 | -- | -- |
| Total Investments in Securities: | $2,187,570,844 | $2,186,544,160 | $109,920 | $916,764 |
See accompanying notes which are an integral part of the financial statements.
Financial Statements
Statement of Assets and Liabilities
| | | July 31, 2016 |
| Assets | | |
Investment in securities, at value (including securities loaned of $101,860,380) — See accompanying schedule:
Unaffiliated issuers (cost $1,780,140,728) | $2,046,359,496 | |
| Fidelity Central Funds (cost $141,211,348) | 141,211,348 | |
| Total Investments (cost $1,921,352,076) | | $2,187,570,844 |
| Cash | | 48,842 |
| Receivable for investments sold | | 9,064,031 |
| Receivable for fund shares sold | | 2,311,477 |
| Dividends receivable | | 132,380 |
| Distributions receivable from Fidelity Central Funds | | 62,679 |
| Other receivables | | 128,432 |
| Total assets | | 2,199,318,685 |
| Liabilities | | |
| Payable for investments purchased | $42,182,264 | |
| Payable for fund shares redeemed | 2,471,327 | |
| Accrued management fee | 1,387,575 | |
| Distribution and service plan fees payable | 118,277 | |
| Other affiliated payables | 418,845 | |
| Other payables and accrued expenses | 64,505 | |
| Collateral on securities loaned, at value | 104,549,711 | |
| Total liabilities | | 151,192,504 |
| Net Assets | | $2,048,126,181 |
| Net Assets consist of: | | |
| Paid in capital | | $1,832,090,966 |
| Accumulated net investment loss | | (5,012,549) |
| Accumulated undistributed net realized gain (loss) on investments and foreign currency transactions | | (45,170,877) |
| Net unrealized appreciation (depreciation) on investments and assets and liabilities in foreign currencies | | 266,218,641 |
| Net Assets | | $2,048,126,181 |
| Calculation of Maximum Offering Price | | |
| Class A: | | |
| Net Asset Value and redemption price per share ($176,988,140 ÷ 9,232,663 shares) | | $19.17 |
| Maximum offering price per share (100/94.25 of $19.17) | | $20.34 |
| Class T: | | |
| Net Asset Value and redemption price per share ($53,446,960 ÷ 2,859,040 shares) | | $18.69 |
| Maximum offering price per share (100/96.50 of $18.69) | | $19.37 |
| Class C: | | |
| Net Asset Value and offering price per share ($73,731,103 ÷ 4,208,520 shares)(a) | | $17.52 |
| Small Cap Growth: | | |
| Net Asset Value, offering price and redemption price per share ($1,580,264,122 ÷ 79,739,516 shares) | | $19.82 |
| Class I: | | |
| Net Asset Value, offering price and redemption price per share ($163,695,856 ÷ 8,241,362 shares) | | $19.86 |
(a) Redemption price per share is equal to net asset value less any applicable contingent deferred sales charge.
See accompanying notes which are an integral part of the financial statements.
Statement of Operations
| | | Year ended July 31, 2016 |
| Investment Income | | |
| Dividends | | $11,959,790 |
| Interest | | 15 |
| Income from Fidelity Central Funds (including $2,218,595 from security lending) | | 2,373,661 |
| Total income | | 14,333,466 |
| Expenses | | |
| Management fee | | |
| Basic fee | $12,923,135 | |
| Performance adjustment | 2,431,100 | |
| Transfer agent fees | 4,466,925 | |
| Distribution and service plan fees | 1,272,678 | |
| Accounting and security lending fees | 594,395 | |
| Custodian fees and expenses | 62,491 | |
| Independent trustees' fees and expenses | 7,965 | |
| Registration fees | 198,607 | |
| Audit | 62,978 | |
| Legal | 9,443 | |
| Interest | 1,381 | |
| Miscellaneous | 12,316 | |
| Total expenses before reductions | 22,043,414 | |
| Expense reductions | (315,109) | 21,728,305 |
| Net investment income (loss) | | (7,394,839) |
| Realized and Unrealized Gain (Loss) | | |
| Net realized gain (loss) on: | | |
| Investment securities: | | |
| Unaffiliated issuers | (35,795,308) | |
| Other affiliated issuers | (4,513,687) | |
| Foreign currency transactions | 15,036 | |
| Total net realized gain (loss) | | (40,293,959) |
Change in net unrealized appreciation (depreciation) on:
Investment securities | 18,827,749 | |
| Assets and liabilities in foreign currencies | 12,812 | |
| Total change in net unrealized appreciation (depreciation) | | 18,840,561 |
| Net gain (loss) | | (21,453,398) |
| Net increase (decrease) in net assets resulting from operations | | $(28,848,237) |
See accompanying notes which are an integral part of the financial statements.
Statement of Changes in Net Assets
| | Year ended July 31, 2016 | Year ended July 31, 2015 |
| Increase (Decrease) in Net Assets | | |
| Operations | | |
| Net investment income (loss) | $(7,394,839) | $(5,784,041) |
| Net realized gain (loss) | (40,293,959) | 108,754,619 |
| Change in net unrealized appreciation (depreciation) | 18,840,561 | 166,432,213 |
| Net increase (decrease) in net assets resulting from operations | (28,848,237) | 269,402,791 |
| Distributions to shareholders from net realized gain | (71,394,910) | (103,188,484) |
| Share transactions - net increase (decrease) | 469,934,632 | 214,155,809 |
| Redemption fees | 788,555 | 177,411 |
| Total increase (decrease) in net assets | 370,480,040 | 380,547,527 |
| Net Assets | | |
| Beginning of period | 1,677,646,141 | 1,297,098,614 |
| End of period | $2,048,126,181 | $1,677,646,141 |
| Other Information | | |
| Accumulated net investment loss end of period | $(5,012,549) | $– |
See accompanying notes which are an integral part of the financial statements.
Financial Highlights — Fidelity Small Cap Growth Fund Class A
| Years ended July 31, | 2016 | 2015 | 2014 | 2013 | 2012 |
| Selected Per–Share Data | | | | | |
| Net asset value, beginning of period | $20.55 | $17.99 | $19.66 | $15.87 | $16.42 |
| Income from Investment Operations | | | | | |
| Net investment income (loss)A | (.10) | (.13) | (.12) | (.04) | (.07)B |
| Net realized and unrealized gain (loss) | (.51) | 4.23 | 1.69 | 4.87 | (.16) |
| Total from investment operations | (.61) | 4.10 | 1.57 | 4.83 | (.23) |
| Distributions from net realized gain | (.78) | (1.54) | (3.24) | (1.04) | (.32) |
| Redemption fees added to paid in capitalA | .01 | –C | –C | –C | –C |
| Net asset value, end of period | $19.17 | $20.55 | $17.99 | $19.66 | $15.87 |
| Total ReturnD,E | (2.85)% | 24.46% | 8.58% | 32.20% | (1.14)% |
| Ratios to Average Net AssetsF,G | | | | | |
| Expenses before reductions | 1.37% | 1.21% | 1.22% | 1.24% | 1.35% |
| Expenses net of fee waivers, if any | 1.37% | 1.21% | 1.22% | 1.24% | 1.35% |
| Expenses net of all reductions | 1.36% | 1.20% | 1.22% | 1.22% | 1.34% |
| Net investment income (loss) | (.58)% | (.67)% | (.62)% | (.26)% | (.49)%B |
| Supplemental Data | | | | | |
| Net assets, end of period (000 omitted) | $176,988 | $123,370 | $88,822 | $74,978 | $59,684 |
| Portfolio turnover rateH | 143% | 156% | 148%I | 142% | 150% |
A Calculated based on average shares outstanding during the period.
B Net Investment income per share reflects a large, non-recurring dividend which amounted to $.01 per share. Excluding this non-recurring dividend, the ratio of net investment income (loss) to average net assets would have been (.57) %.
C Amount represents less than $.005 per share.
D Total returns would have been lower if certain expenses had not been reduced during the applicable periods shown.
E Total returns do not include the effect of the sales charges.
F Fees and expenses of any underlying Fidelity Central Funds are not included in the Fund's expense ratio. The Fund indirectly bears its proportionate share of the expenses of any underlying Fidelity Central Funds.
G Expense ratios reflect operating expenses of the class. Expenses before reductions do not reflect amounts reimbursed by the investment adviser or reductions from brokerage service arrangements or reductions from other expense offset arrangements and do not represent the amount paid by the class during periods when reimbursements or reductions occur. Expenses net of fee waivers reflect expenses after reimbursement by the investment adviser but prior to reductions from brokerage service arrangements or other expense offset arrangements. Expenses net of all reductions represent the net expenses paid by the class.
H Amount does not include the portfolio activity of any underlying Fidelity Central Funds.
I Portfolio turnover rate excludes securities received or delivered in-kind.
See accompanying notes which are an integral part of the financial statements.
Financial Highlights — Fidelity Small Cap Growth Fund Class T
| Years ended July 31, | 2016 | 2015 | 2014 | 2013 | 2012 |
| Selected Per–Share Data | | | | | |
| Net asset value, beginning of period | $20.08 | $17.66 | $19.38 | $15.68 | $16.27 |
| Income from Investment Operations | | | | | |
| Net investment income (loss)A | (.15) | (.17) | (.16) | (.09) | (.11)B |
| Net realized and unrealized gain (loss) | (.50) | 4.13 | 1.66 | 4.82 | (.16) |
| Total from investment operations | (.65) | 3.96 | 1.50 | 4.73 | (.27) |
| Distributions from net realized gain | (.75) | (1.54) | (3.22) | (1.03) | (.32) |
| Redemption fees added to paid in capitalA | .01 | –C | –C | –C | –C |
| Net asset value, end of period | $18.69 | $20.08 | $17.66 | $19.38 | $15.68 |
| Total ReturnD,E | (3.14)% | 24.10% | 8.30% | 31.87% | (1.41)% |
| Ratios to Average Net AssetsF,G | | | | | |
| Expenses before reductions | 1.66% | 1.49% | 1.50% | 1.49% | 1.61% |
| Expenses net of fee waivers, if any | 1.66% | 1.48% | 1.50% | 1.49% | 1.61% |
| Expenses net of all reductions | 1.64% | 1.47% | 1.49% | 1.48% | 1.60% |
| Net investment income (loss) | (.87)% | (.95)% | (.90)% | (.52)% | (.74)%B |
| Supplemental Data | | | | | |
| Net assets, end of period (000 omitted) | $53,447 | $52,667 | $42,586 | $34,686 | $27,658 |
| Portfolio turnover rateH | 143% | 156% | 148%I | 142% | 150% |
A Calculated based on average shares outstanding during the period.
B Net Investment income per share reflects a large, non-recurring dividend which amounted to $.01 per share. Excluding this non-recurring dividend, the ratio of net investment income (loss) to average net assets would have been (.83) %.
C Amount represents less than $.005 per share.
D Total returns would have been lower if certain expenses had not been reduced during the applicable periods shown.
E Total returns do not include the effect of the sales charges.
F Fees and expenses of any underlying Fidelity Central Funds are not included in the Fund's expense ratio. The Fund indirectly bears its proportionate share of the expenses of any underlying Fidelity Central Funds.
G Expense ratios reflect operating expenses of the class. Expenses before reductions do not reflect amounts reimbursed by the investment adviser or reductions from brokerage service arrangements or reductions from other expense offset arrangements and do not represent the amount paid by the class during periods when reimbursements or reductions occur. Expenses net of fee waivers reflect expenses after reimbursement by the investment adviser but prior to reductions from brokerage service arrangements or other expense offset arrangements. Expenses net of all reductions represent the net expenses paid by the class.
H Amount does not include the portfolio activity of any underlying Fidelity Central Funds.
I Portfolio turnover rate excludes securities received or delivered in-kind.
See accompanying notes which are an integral part of the financial statements.
Financial Highlights — Fidelity Small Cap Growth Fund Class C
| Years ended July 31, | 2016 | 2015 | 2014 | 2013 | 2012 |
| Selected Per–Share Data | | | | | |
| Net asset value, beginning of period | $18.90 | $16.78 | $18.62 | $15.16 | $15.83 |
| Income from Investment Operations | | | | | |
| Net investment income (loss)A | (.22) | (.25) | (.25) | (.16) | (.18)B |
| Net realized and unrealized gain (loss) | (.48) | 3.91 | 1.59 | 4.64 | (.17) |
| Total from investment operations | (.70) | 3.66 | 1.34 | 4.48 | (.35) |
| Distributions from net realized gain | (.69) | (1.54) | (3.18) | (1.02) | (.32) |
| Redemption fees added to paid in capitalA | .01 | –C | –C | –C | –C |
| Net asset value, end of period | $17.52 | $18.90 | $16.78 | $18.62 | $15.16 |
| Total ReturnD,E | (3.64)% | 23.53% | 7.70% | 31.32% | (1.96)% |
| Ratios to Average Net AssetsF,G | | | | | |
| Expenses before reductions | 2.16% | 2.00% | 2.01% | 1.99% | 2.10% |
| Expenses net of fee waivers, if any | 2.16% | 2.00% | 2.00% | 1.99% | 2.10% |
| Expenses net of all reductions | 2.14% | 1.99% | 2.00% | 1.97% | 2.09% |
| Net investment income (loss) | (1.37)% | (1.46)% | (1.41)% | (1.01)% | (1.24)%B |
| Supplemental Data | | | | | |
| Net assets, end of period (000 omitted) | $73,731 | $55,671 | $42,215 | $32,756 | $24,683 |
| Portfolio turnover rateH | 143% | 156% | 148%I | 142% | 150% |
A Calculated based on average shares outstanding during the period.
B Net Investment income per share reflects a large, non-recurring dividend which amounted to $.01 per share. Excluding this non-recurring dividend, the ratio of net investment income (loss) to average net assets would have been (1.32) %.
C Amount represents less than $.005 per share.
D Total returns would have been lower if certain expenses had not been reduced during the applicable periods shown.
E Total returns do not include the effect of the contingent deferred sales charge.
F Fees and expenses of any underlying Fidelity Central Funds are not included in the Fund's expense ratio. The Fund indirectly bears its proportionate share of the expenses of any underlying Fidelity Central Funds.
G Expense ratios reflect operating expenses of the class. Expenses before reductions do not reflect amounts reimbursed by the investment adviser or reductions from brokerage service arrangements or reductions from other expense offset arrangements and do not represent the amount paid by the class during periods when reimbursements or reductions occur. Expenses net of fee waivers reflect expenses after reimbursement by the investment adviser but prior to reductions from brokerage service arrangements or other expense offset arrangements. Expenses net of all reductions represent the net expenses paid by the class.
H Amount does not include the portfolio activity of any underlying Fidelity Central Funds.
I Portfolio turnover rate excludes securities received or delivered in-kind.
See accompanying notes which are an integral part of the financial statements.
Financial Highlights — Fidelity Small Cap Growth Fund
| Years ended July 31, | 2016 | 2015 | 2014 | 2013 | 2012 |
| Selected Per–Share Data | | | | | |
| Net asset value, beginning of period | $21.20 | $18.45 | $20.07 | $16.14 | $16.65 |
| Income from Investment Operations | | | | | |
| Net investment income (loss)A | (.06) | (.07) | (.06) | .01 | (.03)B |
| Net realized and unrealized gain (loss) | (.52) | 4.36 | 1.71 | 4.98 | (.16) |
| Total from investment operations | (.58) | 4.29 | 1.65 | 4.99 | (.19) |
| Distributions from net realized gain | (.81) | (1.54) | (3.27) | (1.06) | (.32) |
| Redemption fees added to paid in capitalA | .01 | –C | –C | –C | –C |
| Net asset value, end of period | $19.82 | $21.20 | $18.45 | $20.07 | $16.14 |
| Total ReturnD | (2.63)% | 24.91% | 8.87% | 32.74% | (.88)% |
| Ratios to Average Net AssetsE,F | | | | | |
| Expenses before reductions | 1.12% | .91% | .91% | .90% | 1.03% |
| Expenses net of fee waivers, if any | 1.12% | .91% | .90% | .90% | 1.03% |
| Expenses net of all reductions | 1.11% | .90% | .90% | .88% | 1.02% |
| Net investment income (loss) | (.33)% | (.37)% | (.31)% | .08% | (.16)%B |
| Supplemental Data | | | | | |
| Net assets, end of period (000 omitted) | $1,580,264 | $1,345,684 | $1,069,105 | $1,315,659 | $1,166,101 |
| Portfolio turnover rateG | 143% | 156% | 148%H | 142% | 150% |
A Calculated based on average shares outstanding during the period.
B Net Investment income per share reflects a large, non-recurring dividend which amounted to $.01 per share. Excluding this non-recurring dividend, the ratio of net investment income (loss) to average net assets would have been (.25) %.
C Amount represents less than $.005 per share.
D Total returns would have been lower if certain expenses had not been reduced during the applicable periods shown.
E Fees and expenses of any underlying Fidelity Central Funds are not included in the Fund's expense ratio. The Fund indirectly bears its proportionate share of the expenses of any underlying Fidelity Central Funds.
F Expense ratios reflect operating expenses of the class. Expenses before reductions do not reflect amounts reimbursed by the investment adviser or reductions from brokerage service arrangements or reductions from other expense offset arrangements and do not represent the amount paid by the class during periods when reimbursements or reductions occur. Expenses net of fee waivers reflect expenses after reimbursement by the investment adviser but prior to reductions from brokerage service arrangements or other expense offset arrangements. Expenses net of all reductions represent the net expenses paid by the class.
G Amount does not include the portfolio activity of any underlying Fidelity Central Funds.
H Portfolio turnover rate excludes securities received or delivered in-kind.
See accompanying notes which are an integral part of the financial statements.
Financial Highlights — Fidelity Small Cap Growth Fund Class I
| Years ended July 31, | 2016 | 2015 | 2014 | 2013 | 2012 |
| Selected Per–Share Data | | | | | |
| Net asset value, beginning of period | $21.24 | $18.49 | $20.10 | $16.17 | $16.68 |
| Income from Investment Operations | | | | | |
| Net investment income (loss)A | (.05) | (.07) | (.06) | .01 | (.03)B |
| Net realized and unrealized gain (loss) | (.53) | 4.36 | 1.72 | 4.98 | (.16) |
| Total from investment operations | (.58) | 4.29 | 1.66 | 4.99 | (.19) |
| Distributions from net realized gain | (.81) | (1.54) | (3.27) | (1.06) | (.32) |
| Redemption fees added to paid in capitalA | .01 | –C | –C | –C | –C |
| Net asset value, end of period | $19.86 | $21.24 | $18.49 | $20.10 | $16.17 |
| Total ReturnD | (2.62)% | 24.85% | 8.89% | 32.65% | (.88)% |
| Ratios to Average Net AssetsE,F | | | | | |
| Expenses before reductions | 1.09% | .93% | .92% | .92% | 1.06% |
| Expenses net of fee waivers, if any | 1.09% | .93% | .92% | .92% | 1.06% |
| Expenses net of all reductions | 1.07% | .91% | .92% | .91% | 1.05% |
| Net investment income (loss) | (.30)% | (.39)% | (.32)% | .06% | (.19)%B |
| Supplemental Data | | | | | |
| Net assets, end of period (000 omitted) | $163,696 | $97,897 | $51,607 | $51,158 | $36,694 |
| Portfolio turnover rateG | 143% | 156% | 148%H | 142% | 150% |
A Calculated based on average shares outstanding during the period.
B Net Investment income per share reflects a large, non-recurring dividend which amounted to $.01 per share. Excluding this non-recurring dividend, the ratio of net investment income (loss) to average net assets would have been (.28) %.
C Amount represents less than $.005 per share.
D Total returns would have been lower if certain expenses had not been reduced during the applicable periods shown.
E Fees and expenses of any underlying Fidelity Central Funds are not included in the Fund's expense ratio. The Fund indirectly bears its proportionate share of the expenses of any underlying Fidelity Central Funds.
F Expense ratios reflect operating expenses of the class. Expenses before reductions do not reflect amounts reimbursed by the investment adviser or reductions from brokerage service arrangements or reductions from other expense offset arrangements and do not represent the amount paid by the class during periods when reimbursements or reductions occur. Expenses net of fee waivers reflect expenses after reimbursement by the investment adviser but prior to reductions from brokerage service arrangements or other expense offset arrangements. Expenses net of all reductions represent the net expenses paid by the class.
G Amount does not include the portfolio activity of any underlying Fidelity Central Funds.
H Portfolio turnover rate excludes securities received or delivered in-kind.
See accompanying notes which are an integral part of the financial statements.
Notes to Financial Statements
For the period ended July 31, 2016
1. Organization.
Fidelity Small Cap Growth Fund (the Fund) is a fund of Fidelity Securities Fund (the Trust) and is authorized to issue an unlimited number of shares. The Trust is registered under the Investment Company Act of 1940, as amended (the 1940 Act), as an open-end management investment company organized as a Massachusetts business trust. The Fund offers Class A, Class T, Class C, Small Cap Growth and Class I shares, each of which has equal rights as to assets and voting privileges. Each class has exclusive voting rights with respect to matters that affect that class.
After the close of business on June 24, 2016, all outstanding Class B shares were converted to Class A shares. All current fiscal period dollar and share amounts for Class B presented in the Notes to Financial Statements are for the period August 1, 2015 through June 24, 2016.
2. Investments in Fidelity Central Funds.
The Fund invests in Fidelity Central Funds, which are open-end investment companies generally available only to other investment companies and accounts managed by the investment adviser and its affiliates. The Fund's Schedule of Investments lists each of the Fidelity Central Funds held as of period end, if any, as an investment of the Fund, but does not include the underlying holdings of each Fidelity Central Fund. As an Investing Fund, the Fund indirectly bears its proportionate share of the expenses of the underlying Fidelity Central Funds.
The Money Market Central Funds seek preservation of capital and current income and are managed by Fidelity Investments Money Management, Inc. (FIMM), an affiliate of the investment adviser. Annualized expenses of the Money Market Central Funds as of their most recent shareholder report date are less than .005%.
A complete unaudited list of holdings for each Fidelity Central Fund is available upon request or at the Securities and Exchange Commission (the SEC) website at www.sec.gov. In addition, the financial statements of the Fidelity Central Funds, which are not covered by the Fund's Report of Independent Registered Public Accounting Firm, are available on the SEC website or upon request.
3. Significant Accounting Policies.
The financial statements have been prepared in conformity with accounting principles generally accepted in the United States of America (GAAP), which require management to make certain estimates and assumptions at the date of the financial statements. Actual results could differ from those estimates. Subsequent events, if any, through the date that the financial statements were issued have been evaluated in the preparation of the financial statements. The following summarizes the significant accounting policies of the Fund:
Investment Valuation. Investments are valued as of 4:00 p.m. Eastern time on the last calendar day of the period. The Board of Trustees (the Board) has delegated the day to day responsibility for the valuation of the Fund's investments to the Fidelity Management & Research Company (FMR) Fair Value Committee (the Committee). In accordance with valuation policies and procedures approved by the Board, the Fund attempts to obtain prices from one or more third party pricing vendors or brokers to value its investments. When current market prices, quotations or currency exchange rates are not readily available or reliable, investments will be fair valued in good faith by the Committee, in accordance with procedures adopted by the Board. Factors used in determining fair value vary by investment type and may include market or investment specific events. The frequency with which these procedures are used cannot be predicted and they may be utilized to a significant extent. The Committee oversees the Fund's valuation policies and procedures and reports to the Board on the Committee's activities and fair value determinations. The Board monitors the appropriateness of the procedures used in valuing the Fund's investments and ratifies the fair value determinations of the Committee.
The Fund categorizes the inputs to valuation techniques used to value its investments into a disclosure hierarchy consisting of three levels as shown below:
- Level 1 – quoted prices in active markets for identical investments
- Level 2 – other significant observable inputs (including quoted prices for similar investments, interest rates, prepayment speeds, etc.)
- Level 3 – unobservable inputs (including the Fund's own assumptions based on the best information available)
Valuation techniques used to value the Fund's investments by major category are as follows:
Equity securities, including restricted securities, for which market quotations are readily available, are valued at the last reported sale price or official closing price as reported by a third party pricing vendor on the primary market or exchange on which they are traded and are categorized as Level 1 in the hierarchy. In the event there were no sales during the day or closing prices are not available, securities are valued at the last quoted bid price or may be valued using the last available price and are generally categorized as Level 2 in the hierarchy. For foreign equity securities, when market or security specific events arise, comparisons to the valuation of American Depositary Receipts (ADRs), futures contracts, Exchange-Traded Funds (ETFs) and certain indexes as well as quoted prices for similar securities may be used and would be categorized as Level 2 in the hierarchy. Utilizing these techniques may result in transfers between Level 1 and Level 2. For equity securities, including restricted securities, where observable inputs are limited, assumptions about market activity and risk are used and these securities may be categorized as Level 3 in the hierarchy.
Investments in open-end mutual funds, including the Fidelity Central Funds, are valued at their closing net asset value (NAV) each business day and are categorized as Level 1 in the hierarchy.
Changes in valuation techniques may result in transfers in or out of an assigned level within the disclosure hierarchy. The aggregate value of investments by input level as of July 31, 2016 is included at the end of the Fund's Schedule of Investments.
Foreign Currency. The Fund may use foreign currency contracts to facilitate transactions in foreign-denominated securities. Gains and losses from these transactions may arise from changes in the value of the foreign currency or if the counterparties do not perform under the contracts' terms.
Foreign-denominated assets, including investment securities, and liabilities are translated into U.S. dollars at the exchange rates at period end. Purchases and sales of investment securities, income and dividends received and expenses denominated in foreign currencies are translated into U.S. dollars at the exchange rate in effect on the transaction date.
The effects of exchange rate fluctuations on investments are included with the net realized and unrealized gain (loss) on investment securities. Other foreign currency transactions resulting in realized and unrealized gain (loss) are disclosed separately.
Investment Transactions and Income. For financial reporting purposes, the Fund's investment holdings and NAV include trades executed through the end of the last business day of the period. The NAV per share for processing shareholder transactions is calculated as of the close of business of the New York Stock Exchange (NYSE), normally 4:00 p.m. Eastern time and includes trades executed through the end of the prior business day. Gains and losses on securities sold are determined on the basis of identified cost and may include proceeds received from litigation. Dividend income is recorded on the ex-dividend date, except for certain dividends from foreign securities where the ex-dividend date may have passed, which are recorded as soon as the Fund is informed of the ex-dividend date. Non-cash dividends included in dividend income, if any, are recorded at the fair market value of the securities received. Income and capital gain distributions from Fidelity Central Funds, if any, are recorded on the ex-dividend date. Distributions received on securities that represent a return of capital or capital gain are recorded as a reduction of cost of investments and/or as a realized gain. Subsequent to ex-dividend date the Fund determines the components of these distributions, based upon receipt of tax filings or other correspondence relating to the underlying investment. Interest income is accrued as earned and includes coupon interest and amortization of premium and accretion of discount on debt securities as applicable. Investment income is recorded net of foreign taxes withheld where recovery of such taxes is uncertain.
Class Allocations and Expenses. Investment income, realized and unrealized capital gains and losses, common expenses of the Fund, and certain fund-level expense reductions, if any, are allocated daily on a pro-rata basis to each class based on the relative net assets of each class to the total net assets of the Fund. Each class differs with respect to transfer agent and distribution and service plan fees incurred. Certain expense reductions may also differ by class. For the reporting period, the allocated portion of income and expenses to each class as a percent of its average net assets may vary due to the timing of recording these transactions in relation to fluctuating net assets of the classes. Expenses directly attributable to a fund are charged to that fund. Expenses attributable to more than one fund are allocated among the respective funds on the basis of relative net assets or other appropriate methods. Expense estimates are accrued in the period to which they relate and adjustments are made when actual amounts are known.
Income Tax Information and Distributions to Shareholders. Each year, the Fund intends to qualify as a regulated investment company under Subchapter M of the Internal Revenue Code, including distributing substantially all of its taxable income and realized gains. As a result, no provision for U.S. Federal income taxes is required. As of July 31, 2016, the Fund did not have any unrecognized tax benefits in the financial statements; nor is the Fund aware of any tax positions for which it is reasonably possible that the total amounts of unrecognized tax benefits will significantly change in the next twelve months. The Fund files a U.S. federal tax return, in addition to state and local tax returns as required. The Fund's federal income tax returns are subject to examination by the Internal Revenue Service (IRS) for a period of three fiscal years after they are filed. State and local tax returns may be subject to examination for an additional fiscal year depending on the jurisdiction. Foreign taxes are provided for based on the Fund's understanding of the tax rules and rates that exist in the foreign markets in which it invests.
Distributions are declared and recorded on the ex-dividend date. Income dividends and capital gain distributions are declared separately for each class. Income and capital gain distributions are determined in accordance with income tax regulations, which may differ from GAAP. In addition, the Fund claimed a portion of the payment made to redeeming shareholders as a distribution for income tax purposes.
Capital accounts within the financial statements are adjusted for permanent book-tax differences. These adjustments have no impact on net assets or the results of operations. Capital accounts are not adjusted for temporary book-tax differences which will reverse in a subsequent period.
Book-tax differences are primarily due to foreign currency transactions, partnerships and losses deferred due to wash sales and excise tax regulations.
The federal tax cost of investment securities and unrealized appreciation (depreciation) as of period end were as follows:
| Gross unrealized appreciation | $323,442,627 |
| Gross unrealized depreciation | (64,359,779) |
| Net unrealized appreciation (depreciation) on securities | $259,082,848 |
| Tax Cost | $1,928,487,996 |
The tax-based components of distributable earnings as of period end were as follows:
| Net unrealized appreciation (depreciation) on securities and other investments | $259,082,721 |
The Fund intends to elect to defer to its next fiscal year $38,034,956 of capital losses recognized during the period November 1, 2015 to July 31, 2016.
The Fund intends to elect to defer to the next fiscal year $5,012,550 of ordinary losses recognized during the period January 1, 2016 to July 31, 2016.
The tax character of distributions paid was as follows:
| | July 31, 2016 | July 31, 2015 |
| Ordinary Income | $18,282,031 | $– |
| Long-term Capital Gains | 53,112,879 | 103,188,484 |
| Total | $71,394,910 | $ 103,188,484 |
Short-Term Trading (Redemption) Fees. Shares held by investors in the Fund less than 90 days may have been subject to a redemption fee equal to 1.50% of the NAV of shares redeemed. All redemption fees, which reduce the proceeds of the shareholder redemption, are retained by the Fund and accounted for as an addition to paid in capital.
4. Purchases and Sales of Investments.
Purchases and sales of securities, other than short-term securities, aggregated $3,025,347,978 and $2,587,110,351, respectively.
5. Fees and Other Transactions with Affiliates.
Management Fee. Fidelity Management & Research Company (the investment adviser) and its affiliates provide the Fund with investment management related services for which the Fund pays a monthly management fee. The management fee is the sum of an individual fund fee rate that is based on an annual rate of .45% of the Fund's average net assets and an annualized group fee rate that averaged .25% during the period. The group fee rate is based upon the average net assets of all the mutual funds advised by the investment adviser, including any mutual funds previously advised by the investment adviser that are currently advised by Fidelity SelectCo, LLC, an affiliate of the investment adviser. The group fee rate decreases as assets under management increase and increases as assets under management decrease. In addition, the management fee is subject to a performance adjustment (up to a maximum of +/- .20% of the Fund's average net assets over a 36 month performance period). The upward or downward adjustment to the management fee is based on the relative investment performance of Small Cap Growth as compared to its benchmark index, the Russell 2000 Growth Index, over the same 36 month performance period. For the reporting period, the total annual management fee rate, including the performance adjustment, was .83% of the Fund's average net assets. The performance adjustment included in the management fee rate may be higher or lower than the maximum performance adjustment rate due to the difference between the average net assets for the reporting and performance periods.
Distribution and Service Plan Fees. In accordance with Rule 12b-1 of the 1940 Act, the Fund has adopted separate Distribution and Service Plans for each class of shares. Certain classes pay Fidelity Distributors Corporation (FDC), an affiliate of the investment adviser, separate Distribution and Service Fees, each of which is based on an annual percentage of each class' average net assets. In addition, FDC may pay financial intermediaries for selling shares of the Fund and providing shareholder support services. For the period, the Distribution and Service Fee rates, total fees and amounts retained by FDC were as follows:
| | Distribution
Fee | Service
Fee | Total Fees | Retained
by FDC |
| Class A | -% | .25% | $370,740 | $1,666 |
| Class T | .25% | .25% | 251,412 | – |
| Class B | .75% | .25% | 14,315 | 10,736 |
| Class C | .75% | .25% | 636,211 | 208,802 |
| | | | $1,272,678 | $ 221,204 |
Sales Load. FDC may receive a front-end sales charge of up to 5.75% for selling Class A shares and 3.50% for selling Class T shares, some of which is paid to financial intermediaries for selling shares of the Fund. Depending on the holding period, FDC may receive contingent deferred sales charges levied on Class A, Class T, Class B, and Class C redemptions. The deferred sales charges range from 5.00% to 1.00% for Class B shares, 1.00% for Class C shares, 1.00% for certain purchases of Class A shares and .25% for certain purchases of Class T shares.
For the period, sales charge amounts retained by FDC were as follows:
| | Retained
by FDC |
| Class A | $121,279 |
| Class T | 14,995 |
| Class B(a) | 196 |
| Class C(a) | 12,653 |
| | $149,123 |
(a) When Class B and Class C shares are initially sold, FDC pays commissions from its own resources to financial intermediaries through which the sales are made.
Transfer Agent Fees. Fidelity Investments Institutional Operations Company, Inc., (FIIOC), an affiliate of the investment adviser, is the transfer, dividend disbursing and shareholder servicing agent for each class of the Fund. FIIOC receives account fees and asset-based fees that vary according to the account size and type of account of the shareholders of the respective classes of the Fund. FIIOC pays for typesetting, printing and mailing of shareholder reports, except proxy statements.
For the period, transfer agent fees for each class were as follows:
| | Amount | % of
Class-Level Average
Net Assets |
| Class A | $359,572 | .24 |
| Class T | 139,267 | .28 |
| Class B | 4,108 | .29 |
| Class C | 175,377 | .28 |
| Small Cap Growth | 3,516,816 | .24 |
| Class I | 271,785 | .21 |
| | $4,466,925 | |
Accounting and Security Lending Fees. Fidelity Service Company, Inc. (FSC), an affiliate of the investment adviser, maintains the Fund's accounting records. The accounting fee is based on the level of average net assets for each month. Under a separate contract, FSC administers the security lending program. The security lending fee is based on the number and duration of lending transactions.
Brokerage Commissions. The Fund placed a portion of its portfolio transactions with brokerage firms which are affiliates of the investment adviser. Brokerage commissions are included in net realized gain (loss) and change in net unrealized appreciation (depreciation) in the Statement of Operations. The commissions paid to these affiliated firms were $100,376 for the period.
Interfund Lending Program. Pursuant to an Exemptive Order issued by the SEC, the Fund, along with other registered investment companies having management contracts with FMR or other affiliated entities of FMR, may participate in an interfund lending program. This program provides an alternative credit facility allowing the funds to borrow from, or lend money to, other participating affiliated funds. At period end, there were no interfund loans outstanding. The Fund's activity in this program during the period for which loans were outstanding was as follows:
| Borrower or Lender | Average Loan Balance | Weighted Average Interest Rate | Interest Expense |
| Borrower | $17,354,600 | .57% | $1,381 |
Interfund Trades. The Fund may purchase from or sell securities to other Fidelity Funds under procedures adopted by the Board. The procedures have been designed to ensure these interfund trades are executed in accordance with Rule 17a-7 of the 1940 Act. Interfund trades are included within the respective purchases and sales amounts shown in the Purchases and Sales of Investments note.
6. Committed Line of Credit.
The Fund participates with other funds managed by the investment adviser or an affiliate in a $4.25 billion credit facility (the "line of credit") to be utilized for temporary or emergency purposes to fund shareholder redemptions or for other short-term liquidity purposes. The Fund has agreed to pay commitment fees on its pro-rata portion of the line of credit, which amounted to $3,792 and is reflected in Miscellaneous expenses on the Statement of Operations. During the period, the Fund did not borrow on this line of credit.
7. Security Lending.
The Fund lends portfolio securities through a lending agent from time to time in order to earn additional income. For equity securities, a lending agent is used and may loan securities to certain qualified borrowers, including Fidelity Capital Markets (FCM), a broker-dealer affiliated with the Fund. On the settlement date of the loan, the Fund receives collateral (in the form of U.S. Treasury obligations, letters of credit and/or cash) against the loaned securities and maintains collateral in an amount not less than 100% of the market value of the loaned securities during the period of the loan. The market value of the loaned securities is determined at the close of business of the Fund and any additional required collateral is delivered to the Fund on the next business day. The Fund or borrower may terminate the loan at any time, and if the borrower defaults on its obligation to return the securities loaned because of insolvency or other reasons, the Fund may apply collateral received from the borrower against the obligation. The Fund may experience delays and costs in recovering the securities loaned. Any cash collateral received is invested in the Fidelity Securities Lending Cash Central Fund. The value of loaned securities and cash collateral at period end are disclosed on the Fund's Statement of Assets and Liabilities. The value of securities loaned to FCM at period end was $1,583,400. Security lending income represents the income earned on investing cash collateral, less rebates paid to borrowers and any lending agent fees associated with the loan, plus any premium payments received for lending certain types of securities. Security lending income is presented in the Statement of Operations as a component of income from Fidelity Central Funds, and includes $239,599 from securities loaned to FCM.
8. Expense Reductions.
Commissions paid to certain brokers with whom the investment adviser, or its affiliates, places trades on behalf of the Fund include an amount in addition to trade execution, which may be rebated back to the Fund to offset certain expenses. This amount totaled $300,569 for the period. In addition, through arrangements with the Fund's custodian, credits realized as a result of certain uninvested cash balances were used to reduce the Fund's expenses. During the period, these credits reduced the Fund's custody expenses by $642.
In addition, during the period the investment adviser reimbursed and/or waived a portion of fund-level operating expenses in the amount of $13,898.
9. Distributions to Shareholders.
Distributions to shareholders of each class were as follows:
| | Year ended
July 31, 2016 | Year ended July 31, 2015 |
| From net realized gain | | |
| Class A | $5,181,395 | $7,463,655 |
| Class T | 2,020,848 | 3,715,268 |
| Class B | 78,117 | 242,938 |
| Class C | 2,268,668 | 3,707,592 |
| Small Cap Growth | 57,632,579 | 83,762,458 |
| Class I | 4,213,303 | 4,296,573 |
| Total | $71,394,910 | $103,188,484 |
10. Share Transactions.
Share transactions for each class were as follows and may contain automatic conversions between classes or exchanges between affiliated funds:
| | Shares | Shares | Dollars | Dollars |
| | Year ended
July 31, 2016 | Year ended July 31, 2015 | Year ended
July 31, 2016 | Year ended July 31, 2015 |
| Class A | | | | |
| Shares sold | 6,059,144 | 2,167,593 | $108,304,433 | $41,925,439 |
| Reinvestment of distributions | 264,882 | 412,446 | 5,002,119 | 7,203,479 |
| Shares redeemed | (3,093,782) | (1,515,208) | (54,332,348) | (27,623,856) |
| Net increase (decrease) | 3,230,244 | 1,064,831 | $58,974,204 | $21,505,062 |
| Class T | | | | |
| Shares sold | 1,018,603 | 659,898 | $17,852,650 | $12,282,234 |
| Reinvestment of distributions | 107,630 | 211,200 | 1,987,314 | 3,613,802 |
| Shares redeemed | (889,426) | (660,724) | (15,500,757) | (11,765,139) |
| Net increase (decrease) | 236,807 | 210,374 | $4,339,207 | $4,130,897 |
| Class B | | | | |
| Shares sold | 7,282 | 11,802 | $117,958 | $209,809 |
| Reinvestment of distributions | 4,376 | 14,482 | 76,516 | 235,501 |
| Shares redeemed | (135,765) | (66,110) | (2,219,722) | (1,127,352) |
| Net increase (decrease) | (124,107) | (39,826) | $(2,025,248) | $(682,042) |
| Class C | | | | |
| Shares sold | 2,069,867 | 992,298 | $34,466,250 | $17,729,436 |
| Reinvestment of distributions | 125,336 | 216,825 | 2,178,654 | 3,508,500 |
| Shares redeemed | (932,892) | (778,826) | (14,941,204) | (13,034,787) |
| Net increase (decrease) | 1,262,311 | 430,297 | $21,703,700 | $8,203,149 |
| Small Cap Growth | | | | |
| Shares sold | 42,088,501 | 23,816,242 | $782,706,842 | $475,203,336 |
| Reinvestment of distributions | 2,848,706 | 4,527,816 | 55,506,569 | 81,276,349 |
| Shares redeemed | (28,683,713) | (22,793,867) | (518,831,831) | (412,013,233) |
| Net increase (decrease) | 16,253,494 | 5,550,191 | $319,381,580 | $144,466,452 |
| Class I | | | | |
| Shares sold | 7,438,237 | 2,387,318 | $136,356,812 | $47,676,724 |
| Reinvestment of distributions | 199,940 | 220,272 | 3,903,639 | 3,963,647 |
| Shares redeemed | (4,006,778) | (789,017) | (72,699,262) | (15,108,080) |
| Net increase (decrease) | 3,631,399 | 1,818,573 | $67,561,189 | $36,532,291 |
11. Other.
The Fund's organizational documents provide former and current trustees and officers with a limited indemnification against liabilities arising in connection with the performance of their duties to the Fund. In the normal course of business, the Fund may also enter into contracts that provide general indemnifications. The Fund's maximum exposure under these arrangements is unknown as this would be dependent on future claims that may be made against the Fund. The risk of material loss from such claims is considered remote.
Report of Independent Registered Public Accounting Firm
To the Trustees of Fidelity Securities Fund and Shareholders of Fidelity Small Cap Growth Fund:
In our opinion, the accompanying statement of assets and liabilities, including the schedule of investments, and the related statements of operations and of changes in net assets and the financial highlights present fairly, in all material respects, the financial position of Fidelity Small Cap Growth Fund (a fund of Fidelity Securities Fund) at July 31, 2016, the results of its operations for the year then ended, the changes in its net assets for each of the two years in the period then ended and the financial highlights for each of the five years in the period then ended, in conformity with accounting principles generally accepted in the United States of America. These financial statements and financial highlights (hereafter referred to as “financial statements”) are the responsibility of the Fidelity Small Cap Growth Fund’s management. Our responsibility is to express an opinion on these financial statements based on our audits. We conducted our audits of these financial statements in accordance with the standards of the Public Company Accounting Oversight Board (United States). Those standards require that we plan and perform the audit to obtain reasonable assurance about whether the financial statements are free of material misstatement. An audit includes examining, on a test basis, evidence supporting the amounts and disclosures in the financial statements, assessing the accounting principles used and significant estimates made by management, and evaluating the overall financial statement presentation. We believe that our audits, which included confirmation of securities at July 31, 2016 by correspondence with the custodian and brokers, provide a reasonable basis for our opinion.
PricewaterhouseCoopers LLP
Boston, Massachusetts
September 16, 2016
Trustees and Officers
The Trustees, Members of the Advisory Board (if any), and officers of the trust and fund, as applicable, are listed below. The Board of Trustees governs the fund and is responsible for protecting the interests of shareholders. The Trustees are experienced executives who meet periodically throughout the year to oversee the fund's activities, review contractual arrangements with companies that provide services to the fund, oversee management of the risks associated with such activities and contractual arrangements, and review the fund's performance. Each of the Trustees oversees 170 funds.
The Trustees hold office without limit in time except that (a) any Trustee may resign; (b) any Trustee may be removed by written instrument, signed by at least two-thirds of the number of Trustees prior to such removal; (c) any Trustee who requests to be retired or who has become incapacitated by illness or injury may be retired by written instrument signed by a majority of the other Trustees; and (d) any Trustee may be removed at any special meeting of shareholders by a two-thirds vote of the outstanding voting securities of the trust. Each Trustee who is not an interested person (as defined in the 1940 Act) of the trust and the fund is referred to herein as an Independent Trustee. Each Independent Trustee shall retire not later than the last day of the calendar year in which his or her 75th birthday occurs. The Independent Trustees may waive this mandatory retirement age policy with respect to individual Trustees. Officers and Advisory Board Members hold office without limit in time, except that any officer or Advisory Board Member may resign or may be removed by a vote of a majority of the Trustees at any regular meeting or any special meeting of the Trustees. Except as indicated, each individual has held the office shown or other offices in the same company for the past five years.
The fund’s Statement of Additional Information (SAI) includes more information about the Trustees. To request a free copy, call Fidelity at 1-800-544-8544.
Experience, Skills, Attributes, and Qualifications of the Trustees. The Governance and Nominating Committee has adopted a statement of policy that describes the experience, qualifications, attributes, and skills that are necessary and desirable for potential Independent Trustee candidates (Statement of Policy). The Board believes that each Trustee satisfied at the time he or she was initially elected or appointed a Trustee, and continues to satisfy, the standards contemplated by the Statement of Policy. The Governance and Nominating Committee also engages professional search firms to help identify potential Independent Trustee candidates who have the experience, qualifications, attributes, and skills consistent with the Statement of Policy. From time to time, additional criteria based on the composition and skills of the current Independent Trustees, as well as experience or skills that may be appropriate in light of future changes to board composition, business conditions, and regulatory or other developments, have also been considered by the professional search firms and the Governance and Nominating Committee. In addition, the Board takes into account the Trustees' commitment and participation in Board and committee meetings, as well as their leadership of standing and ad hoc committees throughout their tenure.
In determining that a particular Trustee was and continues to be qualified to serve as a Trustee, the Board has considered a variety of criteria, none of which, in isolation, was controlling. The Board believes that, collectively, the Trustees have balanced and diverse experience, qualifications, attributes, and skills, which allow the Board to operate effectively in governing the fund and protecting the interests of shareholders. Information about the specific experience, skills, attributes, and qualifications of each Trustee, which in each case led to the Board's conclusion that the Trustee should serve (or continue to serve) as a trustee of the fund, is provided below.
Board Structure and Oversight Function. James C. Curvey is an interested person and currently serves as Chairman. The Trustees have determined that an interested Chairman is appropriate and benefits shareholders because an interested Chairman has a personal and professional stake in the quality and continuity of services provided to the fund. Independent Trustees exercise their informed business judgment to appoint an individual of their choosing to serve as Chairman, regardless of whether the Trustee happens to be independent or a member of management. The Independent Trustees have determined that they can act independently and effectively without having an Independent Trustee serve as Chairman and that a key structural component for assuring that they are in a position to do so is for the Independent Trustees to constitute a substantial majority for the Board. The Independent Trustees also regularly meet in executive session. Ned C. Lautenbach serves as Chairman of the Independent Trustees and as such (i) acts as a liaison between the Independent Trustees and management with respect to matters important to the Independent Trustees and (ii) with management prepares agendas for Board meetings.
Fidelity® funds are overseen by different Boards of Trustees. The fund's Board oversees Fidelity's high income and certain equity funds, and other Boards oversee Fidelity's investment-grade bond, money market, asset allocation, and sector funds. The asset allocation funds may invest in Fidelity® funds overseen by the fund's Board. The use of separate Boards, each with its own committee structure, allows the Trustees of each group of Fidelity® funds to focus on the unique issues of the funds they oversee, including common research, investment, and operational issues. On occasion, the separate Boards establish joint committees to address issues of overlapping consequences for the Fidelity® funds overseen by each Board.
The Trustees operate using a system of committees to facilitate the timely and efficient consideration of all matters of importance to the Trustees, the fund, and fund shareholders and to facilitate compliance with legal and regulatory requirements and oversight of the fund's activities and associated risks. The Board, acting through its committees, has charged FMR and its affiliates with (i) identifying events or circumstances the occurrence of which could have demonstrably adverse effects on the fund's business and/or reputation; (ii) implementing processes and controls to lessen the possibility that such events or circumstances occur or to mitigate the effects of such events or circumstances if they do occur; and (iii) creating and maintaining a system designed to evaluate continuously business and market conditions in order to facilitate the identification and implementation processes described in (i) and (ii) above. Because the day-to-day operations and activities of the fund are carried out by or through FMR, its affiliates, and other service providers, the fund's exposure to risks is mitigated but not eliminated by the processes overseen by the Trustees. While each of the Board's committees has responsibility for overseeing different aspects of the fund's activities, oversight is exercised primarily through the Operations, Audit, and Compliance Committees. In addition, the Independent Trustees have worked with FMR to enhance the Board's oversight of investment and financial risks, legal and regulatory risks, technology risks, and operational risks, including the development of additional risk reporting to the Board. For example, a working group comprised of Independent Trustees and FMR has worked and continues to work to review the Fidelity® funds' valuation-related activities, reporting and risk management. Appropriate personnel, including but not limited to the fund's Chief Compliance Officer (CCO), FMR's internal auditor, the independent accountants, the fund's Treasurer and portfolio management personnel, make periodic reports to the Board's committees, as appropriate, including an annual review of Fidelity's risk management program for the Fidelity® funds. The responsibilities of each standing committee, including their oversight responsibilities, are described further under "Standing Committees of the Trustees."
Interested Trustees*:
Correspondence intended for a Trustee who is an interested person may be sent to Fidelity Investments, 245 Summer Street, Boston, Massachusetts 02210.
Name, Year of Birth; Principal Occupations and Other Relevant Experience+
James C. Curvey (1935)
Year of Election or Appointment: 2007
Trustee
Chairman of the Board of Trustees
Mr. Curvey also serves as Trustee of other Fidelity® funds. Mr. Curvey is a Director of Fidelity Research & Analysis Co. (investment adviser firm, 2009-present), and Vice Chairman (2007-present) and Director of FMR LLC (diversified financial services company). In addition, Mr. Curvey serves as an Overseer for the Boston Symphony Orchestra and a member of the board of Artis-Naples, Naples, Florida, and as a Trustee for Brewster Academy, Wolfeboro, New Hampshire. Previously, Mr. Curvey served as a Director of Fidelity Investments Money Management, Inc. (investment adviser firm, 2009-2014) and a Director of FMR and FMR Co., Inc. (investment adviser firms, 2007-2014).
Charles S. Morrison (1960)
Year of Election or Appointment: 2014
Trustee
Mr. Morrison also serves as Trustee of other funds. He serves as a Director of Fidelity Investments Money Management, Inc. (FIMM) (investment adviser firm, 2014-present), Director of Fidelity SelectCo, LLC (investment adviser firm, 2014-present), President, Asset Management (2014-present), and is an employee of Fidelity Investments. Previously, Mr. Morrison served as Vice President of Fidelity's Fixed Income and Asset Allocation Funds (2012-2014), President, Fixed Income (2011-2014), Vice President of Fidelity's Money Market Funds (2005-2009), President, Money Market Group Leader of FMR (investment adviser firm, 2009), and Senior Vice President, Money Market Group of FMR (2004-2009). Mr. Morrison also served as Vice President of Fidelity's Bond Funds (2002-2005), certain Balanced Funds (2002-2005), and certain Asset Allocation Funds (2002-2007), and as Senior Vice President (2002-2005) of Fidelity's Bond Division.
* Determined to be an “Interested Trustee” by virtue of, among other things, his or her affiliation with the trust or various entities under common control with FMR.
+ The information includes the Trustee's principal occupation during the last five years and other information relating to the experience, attributes, and skills relevant to the Trustee's qualifications to serve as a Trustee, which led to the conclusion that the Trustee should serve as a Trustee for the fund.
Independent Trustees:
Correspondence intended for an Independent Trustee may be sent to Fidelity Investments, P.O. Box 55235, Boston, Massachusetts 02205-5235.
Name, Year of Birth; Principal Occupations and Other Relevant Experience+
Dennis J. Dirks (1948)
Year of Election or Appointment: 2005
Trustee
Mr. Dirks also serves as Trustee of other Fidelity® funds. Prior to his retirement in May 2003, Mr. Dirks was Chief Operating Officer and a member of the Board of The Depository Trust & Clearing Corporation (DTCC). He also served as President, Chief Operating Officer, and Board member of The Depository Trust Company (DTC) and President and Board member of the National Securities Clearing Corporation (NSCC). In addition, Mr. Dirks served as Chief Executive Officer and Board member of the Government Securities Clearing Corporation, Chief Executive Officer and Board member of the Mortgage-Backed Securities Clearing Corporation, as a Trustee and a member of the Finance Committee of Manhattan College (2005-2008), as a Trustee and a member of the Finance Committee of AHRC of Nassau County (2006-2008), and as a member of the Independent Directors Council (IDC) Governing Council (2010-2015). Mr. Dirks is a member of the Board of Directors for The Brookville Center for Children's Services, Inc. (2009-present).
Alan J. Lacy (1953)
Year of Election or Appointment: 2008
Trustee
Mr. Lacy also serves as Trustee of other Fidelity® funds. Mr. Lacy serves as Chairman (2014-present) and a member (2010-present) of the Board of Directors of Dave & Buster's Entertainment, Inc. (restaurant and entertainment complexes) and a Director of Bristol-Myers Squibb Company (global pharmaceuticals, 2008-present). He is a Trustee of the California Chapter of The Nature Conservancy (2015-present) and a Director of the Center for Advanced Study in the Behavioral Sciences at Stanford University (2015-present). In addition, Mr. Lacy served as Senior Adviser (2007-2014) of Oak Hill Capital Partners, L.P. (private equity) and also served as Chief Executive Officer (2005) and Vice Chairman (2005-2006) of Sears Holdings Corporation (retail) and Chief Executive Officer and Chairman of the Board of Sears, Roebuck and Co. (retail, 2000-2005). Previously, Mr. Lacy served as Chairman (2008-2011) and a member (2006-2015) of the Board of Trustees of the National Parks Conservation Association and as a member of the Board of Directors for The Western Union Company (global money transfer, 2006-2011), The Hillman Companies, Inc. (hardware wholesalers, 2010-2014), and Earth Fare, Inc. (retail grocery, 2010-2014).
Ned C. Lautenbach (1944)
Year of Election or Appointment: 2000
Trustee
Chairman of the Independent Trustees
Mr. Lautenbach also serves as Trustee of other Fidelity® funds. Mr. Lautenbach currently serves as the Lead Director of the Eaton Corporation Board of Directors (diversified industrial, 1997-present). Mr. Lautenbach is Chairman of the Board of Directors of Artis-Naples in Naples, Florida (2012-present), a member of the Council on Foreign Relations (1994-present), and a member of the Board of Governors, State University System of Florida (2013-present). Previously, Mr. Lautenbach was a Partner/Advisory Partner at Clayton, Dubilier & Rice, LLC (private equity investment, 1998-2010), as well as a Director of Sony Corporation (2006-2007).
Joseph Mauriello (1944)
Year of Election or Appointment: 2008
Trustee
Mr. Mauriello also serves as Trustee of other Fidelity® funds. Prior to his retirement in January 2006, Mr. Mauriello served in numerous senior management positions including Deputy Chairman and Chief Operating Officer (2004-2005), and Vice Chairman of Financial Services (2002-2004) of KPMG LLP US (professional services, 1965-2005). Mr. Mauriello currently serves as a member of the Board of Directors of XL Group plc. (global insurance and re-insurance, 2006-present) and the Independent Directors Council (IDC) Governing Council (2015-present). Previously, Mr. Mauriello served as a Director of the Hamilton Funds of the Bank of New York (2006-2007) and of Arcadia Resources Inc. (health care services and products, 2007-2012).
Robert W. Selander (1950)
Year of Election or Appointment: 2011
Trustee
Mr. Selander also serves as Trustee of other Fidelity® funds. Mr. Selander serves as a Director of The Western Union Company (global money transfer, 2014-present) and a non-executive Chairman of Health Equity, Inc. (health savings custodian, 2015-present). Previously, Mr. Selander served as a Member of the Advisory Board of certain Fidelity® funds (2011), and Executive Vice Chairman (2010), Chief Executive Officer (2009-2010), and President and Chief Executive Officer (1997-2009) of Mastercard, Inc.
Cornelia M. Small (1944)
Year of Election or Appointment: 2005
Trustee
Ms. Small also serves as Trustee of other Fidelity® funds. Ms. Small is a member of the Board of Directors (2009-present) and Chair of the Investment Committee (2010-present) of the Teagle Foundation. Ms. Small also serves on the Investment Committee of the Berkshire Taconic Community Foundation (2008-present). Previously, Ms. Small served as Chairperson (2002-2008) and a member of the Investment Committee and Chairperson (2008-2012) and a member of the Board of Trustees of Smith College. In addition, Ms. Small served as Chief Investment Officer, Director of Global Equity Investments, and a member of the Board of Directors of Scudder, Stevens & Clark and Scudder Kemper Investments.
William S. Stavropoulos (1939)
Year of Election or Appointment: 2002
Trustee
Vice Chairman of the Independent Trustees
Mr. Stavropoulos also serves as Trustee of other Fidelity® funds. Mr. Stavropoulos serves as President and Founder of the Michigan Baseball Foundation, the Great Lakes Loons (2007-present). Mr. Stavropoulos is Chairman Emeritus of the Board of Directors of The Dow Chemical Company, where he previously served in numerous senior management positions, including President, CEO (1995-2000; 2002-2004), Chairman of the Executive Committee (2000-2006), and as a member of the Board of Directors (1990-2006). Currently, Mr. Stavropoulos is Chairman of the Board of Directors of Univar Inc. (global distributor of commodity and specialty chemicals), a Director of Teradata Corporation (data warehousing and technology solutions), and Maersk Inc. (industrial conglomerate), and a member of the Advisory Board for Metalmark Capital LLC (private equity investment, 2005-present). Mr. Stavropoulos is an operating advisor to Clayton, Dubilier & Rice, LLC (private equity investment). In addition, Mr. Stavropoulos is a member of the University of Notre Dame Advisory Council for the College of Science, a Trustee of the Rollin L. Gerstacker Foundation, and a Director of the Naples Philharmonic Center for the Arts. Previously, Mr. Stavropoulos served as a Director of Chemical Financial Corporation (bank holding company, 1993-2012) and Tyco International, Ltd. (multinational manufacturing and services, 2007-2012).
David M. Thomas (1949)
Year of Election or Appointment: 2008
Trustee
Mr. Thomas also serves as Trustee of other Fidelity® funds. Mr. Thomas serves as Non-Executive Chairman of the Board of Directors of Fortune Brands Home and Security (home and security products, 2011-present), as a member of the Board of Directors (2004-present) and Presiding Director (2013-present) of Interpublic Group of Companies, Inc. (marketing communication), and as a member of the Board of Trustees of the University of Florida (2013-present). Previously, Mr. Thomas served as Executive Chairman (2005-2006) and Chairman and Chief Executive Officer (2000-2005) of IMS Health, Inc. (pharmaceutical and healthcare information solutions), and a Director of Fortune Brands, Inc. (consumer products, 2000-2011).
+ The information includes the Trustee's principal occupation during the last five years and other information relating to the experience, attributes, and skills relevant to the Trustee's qualifications to serve as a Trustee, which led to the conclusion that the Trustee should serve as a Trustee for the fund.
Advisory Board Members and Officers:
Correspondence intended for an officer or Peter S. Lynch may be sent to Fidelity Investments, 245 Summer Street, Boston, Massachusetts 02210. Officers appear below in alphabetical order.
Name, Year of Birth; Principal Occupation
Peter S. Lynch (1944)
Year of Election or Appointment: 2003
Member of the Advisory Board
Mr. Lynch also serves as Member of the Advisory Board of other Fidelity® funds. Mr. Lynch is Vice Chairman and a Director of FMR (investment adviser firm) and FMR Co., Inc. (investment adviser firm). In addition, Mr. Lynch serves as a Trustee of Boston College and as the Chairman of the Inner-City Scholarship Fund. Previously, Mr. Lynch served on the Special Olympics International Board of Directors (1997-2006).
Marc R. Bryant (1966)
Year of Election or Appointment: 2015
Secretary and Chief Legal Officer (CLO)
Mr. Bryant also serves as Secretary and CLO of other funds. Mr. Bryant serves as CLO, Secretary, and Senior Vice President of Fidelity Management & Research Company (investment adviser firm, 2015-present) and FMR Co., Inc. (investment adviser firm, 2015-present); Secretary of Fidelity SelectCo, LLC (investment adviser firm, 2015-present) and Fidelity Investments Money Management, Inc. (investment adviser firm, 2015-present); and CLO of Fidelity Management & Research (Hong Kong) Limited and FMR Investment Management (U.K.) Limited (investment adviser firms, 2015-present) and Fidelity Management & Research (Japan) Limited (investment adviser firm, 2016-present). He is Senior Vice President and Deputy General Counsel of FMR LLC (diversified financial services company). Previously, Mr. Bryant served as Secretary and CLO of Fidelity Rutland Square Trust II (2010-2014) and Assistant Secretary of Fidelity's Fixed Income and Asset Allocation Funds (2013-2015). Prior to joining Fidelity Investments, Mr. Bryant served as a Senior Vice President and the Head of Global Retail Legal for AllianceBernstein L.P. (2006-2010), and as the General Counsel for ProFund Advisors LLC (2001-2006).
Jeffrey S. Christian (1961)
Year of Election or Appointment: 2016
Assistant Treasurer
Mr. Christian also serves as Assistant Treasurer of other funds. Mr. Christian is an employee of Fidelity Investments (2003-present).
William C. Coffey (1969)
Year of Election or Appointment: 2009
Assistant Secretary
Mr. Coffey also serves as Assistant Secretary of other funds. He is Senior Vice President and Deputy General Counsel of FMR LLC (diversified financial services company, 2010-present), and is an employee of Fidelity Investments. Previously, Mr. Coffey served as Vice President and Associate General Counsel of FMR LLC (2005-2009).
Jonathan Davis (1968)
Year of Election or Appointment: 2010
Assistant Treasurer
Mr. Davis also serves as Assistant Treasurer of other funds, and is an employee of Fidelity Investments. Previously, Mr. Davis served as Vice President and Associate General Counsel of FMR LLC (diversified financial services company, 2003-2010).
Adrien E. Deberghes (1967)
Year of Election or Appointment: 2016
Assistant Treasurer
Mr. Deberghes also serves as an officer of other funds. He serves as Executive Vice President of Fidelity Investments Money Management, Inc. (FIMM) (investment adviser firm, 2016-present) and is an employee of Fidelity Investments (2008-present). Prior to joining Fidelity Investments, Mr. Deberghes was Senior Vice President of Mutual Fund Administration at State Street Corporation (2007-2008), Senior Director of Mutual Fund Administration at Investors Bank & Trust (2005-2007), and Director of Finance for Dunkin' Brands (2000-2005). Previously, Mr. Deberghes served in other fund officer roles.
Stephanie J. Dorsey (1969)
Year of Election or Appointment: 2010
Assistant Treasurer
Ms. Dorsey also serves as an officer of other funds. She is an employee of Fidelity Investments (2008-present) and has served in other fund officer roles. Prior to joining Fidelity Investments, Ms. Dorsey served as Treasurer (2004-2008) of the JPMorgan Mutual Funds and Vice President (2004-2008) of JPMorgan Chase Bank.
Howard J. Galligan III (1966)
Year of Election or Appointment: 2014
Chief Financial Officer
Mr. Galligan also serves as Chief Financial Officer of other funds. Mr. Galligan serves as President of Fidelity Pricing and Cash Management Services (FPCMS) (2014-present) and as a Director of Strategic Advisers, Inc. (investment adviser firm, 2008-present). Previously, Mr. Galligan served as Chief Administrative Officer of Asset Management (2011-2014) and Chief Operating Officer and Senior Vice President of Investment Support for Strategic Advisers, Inc. (2003-2011).
Scott C. Goebel (1968)
Year of Election or Appointment: 2015
Vice President
Mr. Goebel serves as Vice President of other funds and is an employee of Fidelity Investments (2001-present). Mr. Goebel serves as Senior Vice President of Fidelity Management & Research Company (FMR) (investment adviser firm, 2016-present). Previously, Mr. Goebel served as Secretary of Fidelity SelectCo, LLC (investment adviser firm, 2013-2015), Fidelity Investments Money Management, Inc. (FIMM) (investment adviser firm, 2010-2015), and Fidelity Research and Analysis Company (FRAC) (investment adviser firm, 2010-2015); General Counsel, Secretary, and Senior Vice President of FMR (investment adviser firm, 2008-2015) and FMR Co., Inc. (investment adviser firm, 2008-2015); Assistant Secretary of Fidelity Management & Research (Japan) Limited (investment adviser firm, 2008-2015) and Fidelity Management & Research (U.K.) Inc. (investment adviser firm, 2008-2015); Chief Legal Officer (CLO) of Fidelity Management & Research (Hong Kong) Limited (investment adviser firm, 2008-2015); Secretary and CLO of certain Fidelity® funds (2008-2015); Assistant Secretary of FIMM (2008-2010), FRAC (2008-2010), and certain funds (2007-2008); and as Vice President and Secretary of Fidelity Distributors Corporation (FDC) (2005-2007).
Thomas C. Hense (1964)
Year of Election or Appointment: 2008, 2010, or 2015
Vice President
Mr. Hense serves as Vice President of Fidelity Advisor® Multi-Asset Income Fund (2015) and other funds (High Income (2008), Small Cap (2008), and Value (2010) funds), and is an employee of Fidelity Investments (1993-present). Previously, Mr. Hense served as a portfolio manager for Fidelity's Institutional Money Management Group (Pyramis) (2003-2008).
Brian B. Hogan (1964)
Year of Election or Appointment: 2009
Vice President
Mr. Hogan also serves as Trustee or Vice President of other funds. Mr. Hogan serves as a Director of FMR Investment Management (U.K.) Limited (investment adviser firm, 2015-present) and Fidelity SelectCo, LLC (investment adviser firm, 2014-present) and President of the Equity Division of FMR (investment adviser firm, 2009-present). Previously, Mr. Hogan served as Senior Vice President, Equity Research of FMR (2006-2009) and as a portfolio manager. Mr. Brian B. Hogan is not related to Mr. Colm A. Hogan.
Colm A. Hogan (1973)
Year of Election or Appointment: 2016
Deputy Treasurer
Mr. Hogan also serves as an officer of other funds. Mr. Hogan is an employee of Fidelity Investments (2005-present). Mr. Colm A. Hogan is not related to Mr. Brian B. Hogan.
Chris Maher (1972)
Year of Election or Appointment: 2013
Assistant Treasurer
Mr. Maher serves as Assistant Treasurer of other funds. Mr. Maher is Vice President of Valuation Oversight and is an employee of Fidelity Investments. Previously, Mr. Maher served as Vice President of Asset Management Compliance (2013), Vice President of the Program Management Group of FMR (investment adviser firm, 2010-2013), and Vice President of Valuation Oversight (2008-2010).
John F. Papandrea (1972)
Year of Election or Appointment: 2016
Anti-Money Laundering (AML) Officer
Mr. Papandrea also serves as AML Officer of other funds. Mr. Papandrea is Vice President of FMR LLC (diversified financial services company, 2008-present) and is an employee of Fidelity Investments (2005-present).
Kenneth B. Robins (1969)
Year of Election or Appointment: 2016
Chief Compliance Officer
Mr. Robins also serves as an officer of other funds. Mr. Robins serves as Compliance Officer of Fidelity Management & Research Company and FMR Co., Inc. (investment adviser firms, 2016-present) and is an employee of Fidelity Investments (2004-present). Previously, Mr. Robins served as Executive Vice President of Fidelity Investments Money Management, Inc. (investment adviser firm, 2013-2016) and served in other fund officer roles.
Stacie M. Smith (1974)
Year of Election or Appointment: 2016
President and Treasurer
Ms. Smith also serves as an officer of other funds. She is an employee of Fidelity Investments (2009-present) and has served in other fund officer roles. Prior to joining Fidelity Investments, Ms. Smith served as Senior Audit Manager of Ernst & Young LLP (1996-2009). Previously, Ms. Smith served as Deputy Treasurer of certain Fidelity® funds (2013-2016).
Renee Stagnone (1975)
Year of Election or Appointment: 2016
Assistant Treasurer
Ms. Stagnone also serves as an officer of other funds. Ms. Stagnone is an employee of Fidelity Investments (1997-present). Previously, Ms. Stagnone served as Deputy Treasurer of certain Fidelity® funds (2013-2016).
Shareholder Expense Example
As a shareholder of the Fund, you incur two types of costs: (1) transaction costs, including sales charges (loads) on purchase payments or redemption proceeds, redemption fees and (2) ongoing costs, including management fees, distribution and/or service (12b-1) fees and other Fund expenses. This Example is intended to help you understand your ongoing costs (in dollars) of investing in the Fund and to compare these costs with the ongoing costs of investing in other mutual funds.
The Example is based on an investment of $1,000 invested at the beginning of the period and held for the entire period (February 1, 2016 to July 31, 2016).
Actual Expenses
The first line of the accompanying table for each class of the Fund provides information about actual account values and actual expenses. You may use the information in this line, together with the amount you invested, to estimate the expenses that you paid over the period. Simply divide your account value by $1,000.00 (for example, an $8,600 account value divided by $1,000.00 = 8.6), then multiply the result by the number in the first line for a class of the Fund under the heading entitled "Expenses Paid During Period" to estimate the expenses you paid on your account during this period. A small balance maintenance fee of $12.00 that is charged once a year may apply for certain accounts with a value of less than $2,000. This fee is not included in the table below. If it was, the estimate of expenses you paid during the period would be higher, and your ending account value lower, by this amount. In addition, the Fund, as a shareholder in the underlying Fidelity Central Funds, will indirectly bear its pro-rata share of the fees and expenses incurred by the underlying Fidelity Central Funds. These fees and expenses are not included in the Fund's annualized expense ratio used to calculate the expense estimate in the table below.
Hypothetical Example for Comparison Purposes
The second line of the accompanying table for each class of the Fund provides information about hypothetical account values and hypothetical expenses based on a Class' actual expense ratio and an assumed rate of return of 5% per year before expenses, which is not the Class' actual return. The hypothetical account values and expenses may not be used to estimate the actual ending account balance or expenses you paid for the period. You may use this information to compare the ongoing costs of investing in the Fund and other funds. To do so, compare this 5% hypothetical example with the 5% hypothetical examples that appear in the shareholder reports of the other funds. A small balance maintenance fee of $12.00 that is charged once a year may apply for certain accounts with a value of less than $2,000. This fee is not included in the table below. If it was, the estimate of expenses you paid during the period would be higher, and your ending account value lower, by this amount. In addition, the Fund, as a shareholder in the underlying Fidelity Central Funds, will indirectly bear its pro-rata share of the fees and expenses incurred by the underlying Fidelity Central Funds. These fees and expenses are not included in the Fund's annualized expense ratio used to calculate the expense estimate in the table below.
Please note that the expenses shown in the table are meant to highlight your ongoing costs only and do not reflect any transaction costs. Therefore, the second line of the table is useful in comparing ongoing costs only, and will not help you determine the relative total costs of owning different funds. In addition, if these transactional costs were included, your costs would have been higher.
| | Annualized Expense Ratio-A | Beginning
Account Value
February 1, 2016 | Ending
Account Value
July 31, 2016 | Expenses Paid
During Period-B
February 1, 2016
to July 31, 2016 |
| Class A | 1.36% | | | |
| Actual | | $1,000.00 | $1,171.80 | $7.34 |
| Hypothetical-C | | $1,000.00 | $1,018.10 | $6.82 |
| Class T | 1.65% | | | |
| Actual | | $1,000.00 | $1,169.60 | $8.90 |
| Hypothetical-C | | $1,000.00 | $1,016.66 | $8.27 |
| Class C | 2.14% | | | |
| Actual | | $1,000.00 | $1,167.20 | $11.53 |
| Hypothetical-C | | $1,000.00 | $1,014.22 | $10.72 |
| Small Cap Growth | 1.11% | | | |
| Actual | | $1,000.00 | $1,172.80 | $6.00 |
| Hypothetical-C | | $1,000.00 | $1,019.34 | $5.57 |
| Class I | 1.08% | | | |
| Actual | | $1,000.00 | $1,173.10 | $5.84 |
| Hypothetical-C | | $1,000.00 | $1,019.49 | $5.42 |
A Annualized expense ratio reflects expenses net of applicable fee waivers.
B Expenses are equal to each Class' annualized expense ratio, multiplied by the average account value over the period, multiplied by 182/366 (to reflect the one-half year period).
C 5% return per year before expenses
Distributions (Unaudited)
The fund hereby designates as a capital gain dividend with respect to the taxable year ended July 31, 2016, $2,803,642, or, if subsequently determined to be different, the net capital gain of such year.
Class A designates 32%, Class B designates 80%, Class C designates 67%, Class T designates 39%, Class I designates 28%, and Small Cap Growth Fund designates 29%, of the dividends distributed in September, 2015 during the fiscal year as qualifying for the dividends–received deduction for corporate shareholders.
Class A designates 34%, Class B designates 84%, Class C designates 70%, Class T designates 41%, Class I designates 30%, and Small Growth Cap Fund designates 30%, of the dividends distributed in September, 2015 during the fiscal year as amounts which may be taken into account as a dividend for purposes of the maximum rate under section 1(h)(11) of the Internal Revenue Code.
The fund will notify shareholders in January 2017 of amounts for use in preparing 2016 income tax returns.
Board Approval of Investment Advisory Contracts and Management Fees
Fidelity Small Cap Growth Fund
Each year, the Board of Trustees, including the Independent Trustees (together, the Board), votes on the renewal of the management contract with Fidelity Management & Research Company (FMR) and the sub-advisory agreements (together, the Advisory Contracts) for the fund. The Board, assisted by the advice of fund counsel and Independent Trustees' counsel, requests and considers a broad range of information relevant to the renewal of the Advisory Contracts throughout the year.
The Board meets regularly and, at each of its meetings, covers an extensive agenda of topics and materials and considers factors that are relevant to its annual consideration of the renewal of the fund's Advisory Contracts, including the services and support provided to the fund and its shareholders. The Board has established various standing committees (Committees), each composed of and chaired by Independent Trustees with varying backgrounds, to which the Board has assigned specific subject matter responsibilities in order to enhance effective decision-making by the Board. The Board, acting directly and through its Committees, requests and receives information concerning the annual consideration of the renewal of the fund's Advisory Contracts. The Board also meets as needed to consider matters specifically related to the Board's annual consideration of the renewal of the Advisory Contracts. Members of the Board may also meet with trustees of other Fidelity funds through ad hoc joint committees to discuss certain matters relevant to all of the Fidelity funds.
At its July 2016 meeting, the Board unanimously determined to renew the fund's Advisory Contracts. In reaching its determination, the Board considered all factors it believed relevant, including (i) the nature, extent, and quality of the services to be provided to the fund and its shareholders (including the investment performance of the fund); (ii) the competitiveness of the fund's management fee and total expense ratio relative to peer funds; (iii) the total costs of the services to be provided by and the profits to be realized by Fidelity from its relationships with the fund; and (iv) the extent to which, if any, economies of scale exist and would be realized as the fund grows, and whether any economies of scale are appropriately shared with fund shareholders.
In considering whether to renew the Advisory Contracts for the fund, the Board reached a determination, with the assistance of fund counsel and Independent Trustees' counsel and through the exercise of its business judgment, that the renewal of the Advisory Contracts was in the best interests of the fund and its shareholders and that the compensation payable under the Advisory Contracts was fair and reasonable. The Board's decision to renew the Advisory Contracts was not based on any single factor, but rather was based on a comprehensive consideration of all the information provided to the Board at its meetings throughout the year. The Board, in reaching its determination to renew the Advisory Contracts, was aware that shareholders of the fund have a broad range of investment choices available to them, including a wide choice among funds offered by Fidelity's competitors, and that the fund's shareholders, who have the opportunity to review and weigh the disclosure provided by the fund in its prospectus and other public disclosures, have chosen to invest in this fund, which is part of the Fidelity family of funds.
Nature, Extent, and Quality of Services Provided. The Board considered Fidelity's staffing as it relates to the fund, including the backgrounds of investment personnel of Fidelity, and also considered the fund's investment objective, strategies, and related investment philosophy. The Independent Trustees also had discussions with senior management of Fidelity's investment operations and investment groups. The Board considered the structure of the investment personnel compensation program and whether this structure provides appropriate incentives to act in the best interests of the fund. Additionally, the Board considered the portfolio managers' investments, if any, in the funds that they manage.
Resources Dedicated to Investment Management and Support Services. The Board and the Fund Oversight and Research Committees reviewed the general qualifications and capabilities of Fidelity's investment staff, including its size, education, experience, and resources, as well as Fidelity's approach to recruiting, training, managing, and compensating investment personnel. The Board noted that Fidelity has continued to increase the resources devoted to non-U.S. offices, including expansion of Fidelity's global investment organization. The Board also noted that Fidelity's analysts have extensive resources, tools and capabilities that allow them to conduct sophisticated quantitative and fundamental analysis, as well as credit analysis of issuers, counterparties and guarantors. Further, the Board considered that Fidelity's investment professionals have sufficient access to global information and data so as to provide competitive investment results over time, and that those professionals also have access to sophisticated tools that permit them to assess portfolio construction and risk and performance attribution characteristics continuously, as well as to transmit new information and research conclusions rapidly around the world. Additionally, in its deliberations, the Board considered Fidelity's trading, risk management, compliance, and technology and operations capabilities and resources, which are integral parts of the investment management process.
Shareholder and Administrative Services. The Board considered (i) the nature, extent, quality, and cost of advisory, administrative, and shareholder services performed by FMR, the sub-advisers (together with FMR, the Investment Advisers), and their affiliates under the Advisory Contracts and under separate agreements covering transfer agency, pricing and bookkeeping, and securities lending services for the fund; (ii) the nature and extent of the supervision of third party service providers, principally custodians, subcustodians, and pricing vendors; and (iii) the resources devoted to, and the record of compliance with, the fund's compliance policies and procedures. The Board also reviewed the allocation of fund brokerage, including allocations to brokers affiliated with the Investment Advisers, the use of brokerage commissions to pay fund expenses, and the use of "soft" commission dollars to pay for research services.
The Board noted that the growth of fund assets over time across the complex allows Fidelity to reinvest in the development of services designed to enhance the value or convenience of the Fidelity funds as investment vehicles. These services include 24-hour access to account information and market information through telephone representatives and over the Internet, investor education materials and asset allocation tools, and the expanded availability of Fidelity Investor Centers.
In 2014, the Board formed an ad hoc Committee on Transfer Agency Fees to review the variety of transfer agency fee structures throughout the industry and Fidelity's competitive positioning with respect to industry participants.
Investment in a Large Fund Family. The Board considered the benefits to shareholders of investing in a Fidelity fund, including the benefits of investing in a fund that is part of a large family of funds offering a variety of investment disciplines and providing a large variety of mutual fund investor services. The Board noted that Fidelity had taken, or had made recommendations that resulted in the Fidelity funds taking, a number of actions over the previous year that benefited particular funds, including: (i) continuing to dedicate additional resources to investment research and to the support of the senior management team that oversees asset management; (ii) continuing efforts to enhance Fidelity's global research capabilities; (iii) launching new funds and making other enhancements to meet client needs; (iv) broadening eligibility requirements for certain lower-priced share classes of, and streamlining the fee structure for, certain existing equity index funds; (v) lowering expense caps for certain existing funds and classes to reduce expenses paid by shareholders; (vi) eliminating redemption fees for certain variable insurance product funds and classes; (vii) continuing to launch dedicated lower cost underlying funds to meet portfolio construction needs related to expanding underlying fund options for Fidelity funds of funds, specifically for the Freedom Fund product lines; (viii) launching a lower cost share class for use by the Freedom Index Fund product line; (ix) rationalizing product lines and gaining increased efficiencies through fund mergers and share class consolidations; (x) continuing to develop, acquire and implement systems and technology to improve services to the funds and shareholders, strengthen information security, and increase efficiency; (xi) implementing investment enhancements to further strengthen Fidelity's target date product line to increase investors' probability of success in achieving their goals; (xii) accelerating the conversion of all remaining Class B shares to Class A shares, which have a lower expense structure; and (xiii) implementing changes to Fidelity's money market fund product line in response to recent regulatory reforms.
Investment Performance. The Board considered whether the fund has operated in accordance with its investment objective, as well as its record of compliance with its investment restrictions and its performance history.
The Board took into account discussions with representatives of the Investment Advisers about fund investment performance that occur at Board meetings throughout the year. In this regard the Board noted that as part of regularly scheduled fund reviews and other reports to the Board on fund performance, the Board considers annualized return information for the fund, for different time periods, measured against a securities market index ("benchmark index") and a peer group of funds with similar objectives ("peer group"), if any. In its evaluation of fund investment performance, the Board gave particular attention to information indicating changes in performance of certain Fidelity funds for specific time periods and discussed with the Investment Advisers the reasons for any overperformance or underperformance.
In addition to reviewing absolute and relative fund performance, the Independent Trustees periodically consider the appropriateness of fund performance metrics in evaluating the results achieved. In general, the Independent Trustees believe that fund performance should be evaluated based on net performance (after fees and expenses) of both the highest performing and lowest performing fund share classes, where applicable, compared to appropriate benchmark indices, over appropriate time periods that may include full market cycles, and compared to peer groups, as applicable, over the same periods, taking into account relevant factors including the following: general market conditions; issuer-specific information; and fund cash flows and other factors.
The Independent Trustees recognize that shareholders evaluate performance on a net basis over their own holding periods, for which one-, three-, and five-year periods are often used as a proxy. For this reason, the performance information reviewed by the Board also included net cumulative calendar year total return information for the fund and an appropriate benchmark index and peer group for the most recent one-, three-, and five-year periods, as shown below. Returns are shown compared to the 25th percentile (top of box, 75% beaten) and 75th percentile (bottom of box, 25% beaten) of the peer universe.
Fidelity Small Cap Growth Fund
The Board also considered that the fund's management fee is subject to upward or downward adjustment depending upon whether, and to what extent, the fund's investment performance for the performance period exceeds, or is exceeded by, a securities index, thus leading to a performance adjustment for the same period. The Board noted that the performance adjustment provides FMR with a strong economic incentive to seek to achieve superior performance for the fund's shareholders and helps to more closely align the interests of FMR and the shareholders of the fund.
Based on its review, the Board concluded that the nature, extent, and quality of services provided to the fund under the Advisory Contracts should continue to benefit the shareholders of the fund.
Competitiveness of Management Fee and Total Expense Ratio. The Board considered the fund's management fee and total expense ratio compared to "mapped groups" of competitive funds and classes created for the purpose of facilitating the Trustees' competitive analysis of management fees and total expenses. Fidelity creates "mapped groups" by combining similar Broadridge investment objective categories that have comparable investment mandates. Combining Broadridge investment objective categories aids the Board's management fee and total expense ratio comparisons by broadening the competitive group used for comparison.
Management Fee. The Board considered two proprietary management fee comparisons for the 12-month periods shown in basis points (BP) in the chart below. The group of Broadridge funds used by the Board for management fee comparisons is referred to below as the "Total Mapped Group." The Total Mapped Group comparison focuses on a fund's standing in terms of gross management fees before expense reimbursements or caps, and without giving effect to the fund's performance adjustment, relative to the total universe of funds with comparable investment mandates, regardless of whether their management fee structures also are comparable. Funds with comparable investment mandates offer exposure to similar types of securities. Funds with comparable management fee structures have similar management fee contractual arrangements (
e.g., flat rate charged for advisory services, all-inclusive fee rate,
etc.). "TMG %" represents the percentage of funds in the Total Mapped Group that had management fees that were lower than the fund's. For example, a hypothetical TMG % of 20% would mean that 80% of the funds in the Total Mapped Group had higher, and 20% had lower, management fees than the fund. The fund's actual TMG %s and the number of funds in the Total Mapped Group are in the chart below. The "Asset-Size Peer Group" (ASPG) comparison focuses on a fund's standing relative to a subset of non-Fidelity funds within the Total Mapped Group that are similar in size and management fee structure without taking into account performance adjustments, if any. For example, if a fund is in the first quartile of the ASPG, the fund's management fee ranks in the least expensive or lowest 25% of funds in the ASPG. The ASPG represents at least 15% of the funds in the Total Mapped Group with comparable asset size and management fee structures, subject to a minimum of 50 funds (or all funds in the Total Mapped Group if fewer than 50). Additional information, such as the ASPG quartile in which the fund's management fee rate ranked and the impact of the fund's performance adjustment, is also included in the chart and considered by the Board.
Fidelity Small Cap Growth Fund
The Board noted that the fund's management fee rate ranked below the median of its Total Mapped Group and below the median of its ASPG for 2015. The Board also noted the effect of the fund's performance adjustment, if any, on the fund's management fee ranking. The Board noted that the comparisons for 2015 reflect a revised Total Mapped Group that no longer includes funds with micro-cap objectives and that FMR believes this Total Mapped Group is a more appropriate comparison because the fund does not have a micro-cap objective.
The Board noted that, in 2014, the ad hoc Committee on Group Fee was formed by it and the boards of other Fidelity funds to conduct an in-depth review of the "group fee" component of the management fee of funds with such management fee structures. The Committee's focus included the mechanics of the group fee, the competitive landscape of group fee structures, Fidelity funds with no group fee component and investment products not included in group fee assets. The Board also considered that, for funds subject to the group fee, FMR agreed to voluntarily waive fees over a specified period of time in amounts designed to account for assets converted from certain funds to certain collective investment trusts.
The Board also noted that, in 2013, the ad hoc Committee on Management Fees was formed to conduct an in-depth review of the management fee rates of Fidelity's active equity mutual funds. The Committee focused on the following areas: (i) standard fee structures; (ii) research consumption and trading evolution; (iii) management fee competitiveness/profitability by category; and (iv) factors that drive institutional pricing.
Based on its review, the Board concluded that the fund's management fee is fair and reasonable in light of the services that the fund receives and the other factors considered.
Total Expense Ratio. In its review of each class's total expense ratio, the Board considered the fund's management fee rate as well as other fund or class expenses, as applicable, such as transfer agent fees, pricing and bookkeeping fees, fund-paid 12b-1 fees, and custodial, legal, and audit fees. The Board noted the impact of the fund's performance adjustment. The Board also noted that Fidelity may agree to waive fees and expenses from time to time, and the extent to which, if any, it has done so for the fund. As part of its review, the Board also considered the current and historical total expense ratios of each class of the fund compared to competitive fund median expenses. Each class of the fund is compared to those funds and classes in the Total Mapped Group (used by the Board for management fee comparisons) that have a similar sales load structure.
The Board noted that the total expense ratio of each of Class A, Class I, and the retail class ranked below the competitive median for 2015 and the total expense ratio of Class T and Class C ranked above the competitive median for 2015. The Board considered that, in general, various factors can affect total expense ratios. The Board noted that the total expense ratio of Class T was above the competitive median primarily because of higher 12b-1 fees on Class T as compared to most competitor funds. Class T has a higher 12b-1 fee, but a lower front-end sales charge, than traditionally priced front-end sales charge classes. The Board considered that Class T is primarily sold load-waived in the retirement plan market where its 0.50% 12b-1 fee is comparable to competing no-load, higher 12b-1 fee classes designed specifically for retirement plans. The Board noted that the fund offers multiple classes, each of which has a different sales load and 12b-1 fee structure, and that the multiple structures are intended to offer a range of pricing options for the intermediary market. The Board also noted that the total expense ratios of the classes vary primarily by the level of their 12b-1 fees, although differences in transfer agent fees may also cause expenses to vary from class to class.
Fees Charged to Other Fidelity Clients. The Board also considered Fidelity fee structures and other information with respect to clients of Fidelity, such as other funds advised or subadvised by Fidelity, pension plan clients, and other institutional clients with similar mandates. The Board noted the findings of the 2013 ad hoc joint committee (created with the board of other Fidelity funds), which reviewed and compared Fidelity's institutional investment advisory business with its business of providing services to the Fidelity funds, including the differences in services provided, fees charged, and costs incurred, as well as competition in their respective marketplaces.
Based on its review of total expense ratios and fees charged to other Fidelity clients, the Board concluded that, although some classes were above the median of the universe presented for comparison, the total expense ratio of each class of the fund was reasonable in light of the services that the fund and its shareholders receive and the other factors considered.
Costs of the Services and Profitability. The Board considered the revenues earned and the expenses incurred by Fidelity in conducting the business of developing, marketing, distributing, managing, administering and servicing the fund and servicing the fund's shareholders. The Board also considered the level of Fidelity's profits in respect of all the Fidelity funds.
On an annual basis, Fidelity presents to the Board information about the profitability of its relationship with the fund. Fidelity calculates profitability information for each fund, as well as aggregate profitability information for groups of Fidelity funds and all Fidelity funds, using a series of detailed revenue and cost allocation methodologies which originate with the books and records of Fidelity on which Fidelity's audited financial statements are based. The Audit Committee of the Board reviews any significant changes from the prior year's methodologies.
PricewaterhouseCoopers LLP (PwC), independent registered public accounting firm and auditor to Fidelity and certain Fidelity funds, has been engaged annually by the Board as part of the Board's assessment of Fidelity's profitability analysis. PwC's engagement includes the review and assessment of the methodologies used by Fidelity in determining the revenues and expenses attributable to Fidelity's mutual fund business, and completion of agreed-upon procedures in respect of the mathematical accuracy of the fund profitability information and its conformity to established allocation methodologies. After considering PwC's reports issued under the engagement and information provided by Fidelity, the Board concluded that while other allocation methods may also be reasonable, Fidelity's profitability methodologies are reasonable in all material respects.
The Board also reviewed Fidelity's non-fund businesses and fall-out benefits related to the mutual fund business as well as cases where Fidelity's affiliates may benefit from or be related to the fund's business.
The Board considered the costs of the services provided by and the profits realized by Fidelity in connection with the operation of the fund and was satisfied that the profitability was not excessive.
Economies of Scale. The Board considered whether there have been economies of scale in respect of the management of the Fidelity funds, whether the Fidelity funds (including the fund) have appropriately benefited from any such economies of scale, and whether there is potential for realization of any further economies of scale. The Board considered the extent to which the fund will benefit from economies of scale as assets grow through increased services to the fund, through waivers or reimbursements, or through fee or expense ratio reductions. The Board also noted that in 2013, it and the boards of other Fidelity funds created an ad hoc committee (the Economies of Scale Committee) to analyze whether Fidelity attains economies of scale in respect of the management and servicing of the Fidelity funds, whether the Fidelity funds have appropriately benefited from such economies of scale, and whether there is potential for realization of any further economies of scale.
The Board recognized that the fund's management contract incorporates a "group fee" structure, which provides for lower group fee rates as total group assets increase, and for higher group fee rates as total group assets decrease (with "group assets" defined to include fund assets under FMR's management plus the assets of sector funds previously under FMR's management). FMR calculates the group fee rates based on a tiered asset "breakpoint" schedule that varies based on asset class. The Board considered that the group fee is designed to deliver the benefits of economies of scale to fund shareholders when total Fidelity fund assets increase, even if assets of any particular fund are unchanged or have declined, because some portion of Fidelity's costs are attributable to services provided to all Fidelity funds, and all funds benefit if those costs can be allocated among more assets. The Board concluded that, given the group fee structure, fund shareholders will benefit from lower management fees as group assets increase at the fund complex level, regardless of whether Fidelity achieves any such economies of scale.
The Board concluded, taking into account the analysis of the Economies of Scale Committee, that economies of scale, if any, are being appropriately shared between fund shareholders and Fidelity.
Additional Information Requested by the Board. In order to develop fully the factual basis for consideration of the Fidelity funds' Advisory Contracts, the Board requested and received additional information on certain topics, including: (i) fund performance trends and Fidelity's long-term strategies for certain funds; (ii) the various share classes employed by Fidelity and the attributes of each class, together with similar information on the distribution and servicing payments made by Fidelity or the funds to third-party participants in the distribution channels; (iii) fund profitability, and fund performance in relation to fund profitability; (iv) the methodology with respect to evaluating competitive fund data and peer group classifications and fee comparisons; (v) annual fund profitability margins; (vi) the realization of fall-out benefits in and attribution of fall-out benefits to certain Fidelity business units; (vii) the appropriateness of certain funds' benchmarks; (viii) the rationalization for certain share classes and expenses; (ix) sub-advisory fee rates for comparable investment mandates; (x) product strategy for certain underperforming funds; and (xi) Fidelity's resources and strategy for cybersecurity.
Based on its evaluation of all of the conclusions noted above, and after considering all factors it believed relevant, the Board concluded that the advisory fee structures are fair and reasonable, and that the fund's Advisory Contracts should be renewed.
Corporate Headquarters
245 Summer St.
Boston, MA 02210
www.fidelity.com
SCP-ANN-0916
1.803695.111
Fidelity® Growth & Income Portfolio
Annual Report July 31, 2016 |
|
Contents
To view a fund's proxy voting guidelines and proxy voting record for the 12-month period ended June 30, visit http://www.fidelity.com/proxyvotingresults or visit the Securities and Exchange Commission's (SEC) web site at http://www.sec.gov.
You may also call 1-800-544-8544 to request a free copy of the proxy voting guidelines.
Standard & Poor's, S&P and S&P 500 are registered service marks of The McGraw-Hill Companies, Inc. and have been licensed for use by Fidelity Distributors Corporation.
Other third-party marks appearing herein are the property of their respective owners.
All other marks appearing herein are registered or unregistered trademarks or service marks of FMR LLC or an affiliated company. © 2016 FMR LLC. All rights reserved.
This report and the financial statements contained herein are submitted for the general information of the shareholders of the Fund. This report is not authorized for distribution to prospective investors in the Fund unless preceded or accompanied by an effective prospectus.
A fund files its complete schedule of portfolio holdings with the SEC for the first and third quarters of each fiscal year on Form N-Q. Forms N-Q are available on the SEC’s web site at http://www.sec.gov. A fund's Forms N-Q may be reviewed and copied at the SEC’s Public Reference Room in Washington, DC. Information regarding the operation of the SEC's Public Reference Room may be obtained by calling 1-800-SEC-0330.
For a complete list of a fund's portfolio holdings, view the most recent holdings listing, semiannual report, or annual report on Fidelity's web site at http://www.fidelity.com, http://www.institutional.fidelity.com, or http://www.401k.com, as applicable.
NOT FDIC INSURED •MAY LOSE VALUE •NO BANK GUARANTEE
Neither the Fund nor Fidelity Distributors Corporation is a bank.
Performance: The Bottom Line
Average annual total return reflects the change in the value of an investment, assuming reinvestment of distributions from dividend income and capital gains (the profits earned upon the sale of securities that have grown in value, if any) and assuming a constant rate of performance each year. The hypothetical investment and the average annual total returns do not reflect the deduction of taxes that a shareholder would pay on fund distributions or the redemption of fund shares. During periods of reimbursement by Fidelity, a fund’s total return will be greater than it would be had the reimbursement not occurred. How a fund did yesterday is no guarantee of how it will do tomorrow.
Average Annual Total Returns
| For the periods ended July 31, 2016 | Past 1 year | Past 5 years | Past 10 years |
| Fidelity® Growth & Income Portfolio | 0.88% | 12.57% | 3.65% |
$10,000 Over 10 Years
Let's say hypothetically that $10,000 was invested in Fidelity® Growth & Income Portfolio, a class of the fund, on July 31, 2006.
The chart shows how the value of your investment would have changed, and also shows how the S&P 500® Index performed over the same period.
| Period Ending Values |
| $14,309 | Fidelity® Growth & Income Portfolio |
| $21,089 | S&P 500® Index |
Management's Discussion of Fund Performance
Market Recap: U.S. equities gained modestly for the year ending July 31, 2016, overcoming persistent concern about global economic growth, uncertainty regarding U.S. monetary policy and the U.K.’s late-June vote to leave the European Union, dubbed Brexit. The S&P 500
® index rose 5.61%, with larger-cap, value-oriented stocks and defensive sectors shining brightest. Volatility peaked in the early weeks of 2016, as continued oil-price weakness and U.S.-dollar strength pushed the S&P 500
® to its worst January since 2009. Markets then rallied beginning in February amid U.S. job gains, a broad rally in energy and materials markets, global economic stimulus and perceived softening of monetary policy by the U.S. Federal Reserve. The June 23 Brexit vote surprised markets and resulted in a sharp two-day decline for stocks, followed by a rebound as investor sentiment shifted and remained positive through July 31. For the year, dividend-rich telecom services (+26%), utilities (+23%) and consumer staples (+12%) led the way amid strong investor demand for yield. Industrials and technology (+10%) also outperformed, as did materials (+8%), despite a weak commodities environment overall. Conversely, a strong period for real estate stocks couldn’t keep the financials sector (-4%) from losing ground, as low interest rates continued to squeeze bank profits.
Comments from Portfolio Manager Matthew Fruhan: For the year, the fund’s share classes (excluding sales charges, if applicable) posted modest gains, significantly trailing the 5.61% advance of the benchmark S&P 500
® index. The fund’s disappointing result mostly was due to poor security selection, especially within financials and energy. In financials, which I continued to overweight, many companies from the banking industry struggled, including Citigroup, Bank of America, JPMorgan Chase and Morgan Stanley. In energy, several stocks detracted, especially natural gas transporters Golar LNG and MarkWest Energy Partners, the latter of which was acquired for stock by MPLX. The fund did have success with other names in the group, including pipeline operator Williams Partners and integrated energy producer Chevron. My picks in information technology also detracted. On the positive side, the fund was well positioned in the health care sector, as we benefited from good stock selection and a helpful underweight in this lagging category. Here, largely avoiding biotech firm Gilead Sciences (-31%) in favor of other firms that fit my criteria much better was a good call. The fund’s biggest individual contributor was industrial conglomerate General Electric, whose stock gained ground as the company continued to focus on its core industrial businesses – a move rewarded by investors.
The views expressed above reflect those of the portfolio manager(s) only through the end of the period as stated on the cover of this report and do not necessarily represent the views of Fidelity or any other person in the Fidelity organization. Any such views are subject to change at any time based upon market or other conditions and Fidelity disclaims any responsibility to update such views. These views may not be relied on as investment advice and, because investment decisions for a Fidelity fund are based on numerous factors, may not be relied on as an indication of trading intent on behalf of any Fidelity fund.
Investment Summary (Unaudited)
Top Ten Stocks as of July 31, 2016
| | % of fund's net assets | % of fund's net assets 6 months ago |
| JPMorgan Chase & Co.(a) | 3.5 | 4.0 |
| Microsoft Corp.(a) | 3.3 | 3.6 |
| General Electric Co.(a) | 3.0 | 3.5 |
| Bank of America Corp. | 2.7 | 2.8 |
| Apple, Inc. | 2.7 | 2.9 |
| Chevron Corp. | 2.3 | 2.3 |
| Citigroup, Inc. | 2.3 | 2.3�� |
| Qualcomm, Inc. | 2.1 | 1.9 |
| Johnson & Johnson(a) | 2.0 | 2.3 |
| GlaxoSmithKline PLC sponsored ADR | 1.8 | 1.7 |
| | 25.7 | |
(a) Security or a portion of the security is pledged as collateral for call options written.
Top Five Market Sectors as of July 31, 2016
| | % of fund's net assets | % of fund's net assets 6 months ago |
| Financials | 21.2 | 21.0 |
| Information Technology | 20.7 | 21.2 |
| Health Care | 14.2 | 12.6 |
| Industrials | 12.5 | 12.8 |
| Energy | 12.0 | 10.1 |
Asset Allocation (% of fund's net assets)
| As of July 31, 2016 *,** |
| | Stocks | 98.4% |
| | Convertible Securities | 1.4% |
| | Short-Term Investments and Net Other Assets (Liabilities) | 0.2% |

* Foreign investments - 11.7%
** Written Options - (0.1)%
| As of January 31, 2016 *,** |
| | Stocks | 98.8% |
| | Convertible Securities | 1.2% |

* Foreign investments - 12.0%
** Written Options - (0.0)%
Percentages shown as 0.0% may reflect amounts less than 0.05%.
Investments July 31, 2016
Showing Percentage of Net Assets
| Common Stocks - 98.4% | | | |
| | | Shares | Value (000s) |
| CONSUMER DISCRETIONARY - 8.5% | | | |
| Auto Components - 0.3% | | | |
| BorgWarner, Inc. | | 329,200 | $10,923 |
| Johnson Controls, Inc. | | 127,700 | 5,864 |
| | | | 16,787 |
| Automobiles - 0.2% | | | |
| General Motors Co. | | 320,000 | 10,093 |
| Harley-Davidson, Inc. (a) | | 80,600 | 4,265 |
| | | | 14,358 |
| Diversified Consumer Services - 0.0% | | | |
| H&R Block, Inc. | | 104,200 | 2,479 |
| Hotels, Restaurants & Leisure - 0.7% | | | |
| Cedar Fair LP (depositary unit) | | 26,700 | 1,581 |
| Dunkin' Brands Group, Inc. | | 160,300 | 7,263 |
| Las Vegas Sands Corp. | | 208,800 | 10,576 |
| Whitbread PLC | | 88,424 | 4,516 |
| Wingstop, Inc. (a) | | 125,500 | 3,263 |
| Yum! Brands, Inc. | | 163,244 | 14,597 |
| | | | 41,796 |
| Leisure Products - 0.2% | | | |
| NJOY, Inc. (b)(c) | | 671,364 | 27 |
| Polaris Industries, Inc. | | 95,800 | 9,460 |
| | | | 9,487 |
| Media - 4.3% | | | |
| Comcast Corp. Class A (d) | | 1,641,400 | 110,384 |
| Scripps Networks Interactive, Inc. Class A | | 511,789 | 33,809 |
| Sinclair Broadcast Group, Inc. Class A | | 318,761 | 8,868 |
| Time Warner, Inc. | | 1,038,417 | 79,595 |
| Viacom, Inc. Class B (non-vtg.) | | 773,400 | 35,166 |
| | | | 267,822 |
| Multiline Retail - 1.4% | | | |
| Target Corp. | | 1,176,675 | 88,639 |
| Specialty Retail - 1.3% | | | |
| Foot Locker, Inc. | | 122,000 | 7,274 |
| L Brands, Inc. | | 128,700 | 9,511 |
| Lowe's Companies, Inc. (d) | | 801,979 | 65,987 |
| | | | 82,772 |
| Textiles, Apparel & Luxury Goods - 0.1% | | | |
| Ralph Lauren Corp. | | 84,800 | 8,318 |
|
| TOTAL CONSUMER DISCRETIONARY | | | 532,458 |
|
| CONSUMER STAPLES - 6.0% | | | |
| Beverages - 2.1% | | | |
| Britvic PLC | | 169,500 | 1,402 |
| Diageo PLC | | 913,839 | 26,188 |
| PepsiCo, Inc. | | 177,414 | 19,324 |
| The Coca-Cola Co. | | 1,888,303 | 82,387 |
| | | | 129,301 |
| Food & Staples Retailing - 1.0% | | | |
| CVS Health Corp. | | 518,104 | 48,039 |
| Walgreens Boots Alliance, Inc. | | 213,684 | 16,934 |
| | | | 64,973 |
| Food Products - 0.2% | | | |
| Mead Johnson Nutrition Co. Class A | | 160,900 | 14,352 |
| Household Products - 1.8% | | | |
| Procter & Gamble Co. | | 1,304,815 | 111,679 |
| Personal Products - 0.1% | | | |
| Edgewell Personal Care Co. (b) | | 99,800 | 8,444 |
| Tobacco - 0.8% | | | |
| British American Tobacco PLC sponsored ADR | | 61,323 | 7,830 |
| Imperial Tobacco Group PLC | | 113,852 | 6,002 |
| Philip Morris International, Inc. | | 324,971 | 32,582 |
| | | | 46,414 |
|
| TOTAL CONSUMER STAPLES | | | 375,163 |
|
| ENERGY - 11.9% | | | |
| Energy Equipment & Services - 1.2% | | | |
| Baker Hughes, Inc. | | 316,700 | 15,148 |
| Helmerich & Payne, Inc. (a) | | 121,900 | 7,554 |
| National Oilwell Varco, Inc. | | 584,500 | 18,909 |
| Oceaneering International, Inc. | | 654,000 | 18,234 |
| Schlumberger Ltd. | | 201,532 | 16,227 |
| | | | 76,072 |
| Oil, Gas & Consumable Fuels - 10.7% | | | |
| Amyris, Inc. (a)(b) | | 233,157 | 82 |
| Anadarko Petroleum Corp. | | 126,700 | 6,909 |
| Apache Corp. | | 778,668 | 40,880 |
| Cabot Oil & Gas Corp. | | 216,900 | 5,351 |
| Cenovus Energy, Inc. | | 2,608,300 | 37,337 |
| Chevron Corp. | | 1,415,796 | 145,091 |
| ConocoPhillips Co. | | 1,612,400 | 65,818 |
| EQT Midstream Partners LP | | 50,502 | 4,031 |
| Golar LNG Ltd. (a) | | 559,200 | 9,484 |
| Imperial Oil Ltd. | | 1,431,500 | 44,042 |
| Kinder Morgan, Inc. | | 2,858,200 | 58,107 |
| Legacy Reserves LP | | 1,050,368 | 1,817 |
| MPLX LP | | 142,847 | 4,635 |
| PrairieSky Royalty Ltd. (a) | | 690,973 | 13,447 |
| Suncor Energy, Inc. | | 3,342,150 | 89,950 |
| Teekay LNG Partners LP | | 477,300 | 4,868 |
| The Williams Companies, Inc. | | 3,121,972 | 74,834 |
| Williams Partners LP | | 1,820,985 | 67,996 |
| | | | 674,679 |
|
| TOTAL ENERGY | | | 750,751 |
|
| FINANCIALS - 21.2% | | | |
| Banks - 13.8% | | | |
| Bank of America Corp. | | 11,908,856 | 172,559 |
| Citigroup, Inc. | | 3,302,130 | 144,666 |
| Citizens Financial Group, Inc. | | 61,700 | 1,378 |
| Comerica, Inc. | | 699,400 | 31,641 |
| Cullen/Frost Bankers, Inc. | | 73,600 | 4,997 |
| Fifth Third Bancorp | | 424,400 | 8,055 |
| JPMorgan Chase & Co. (d) | | 3,427,392 | 219,248 |
| Lloyds Banking Group PLC | | 1,623,900 | 1,142 |
| M&T Bank Corp. | | 248,900 | 28,514 |
| PNC Financial Services Group, Inc. | | 337,454 | 27,891 |
| Regions Financial Corp. | | 4,361,000 | 39,990 |
| Standard Chartered PLC (United Kingdom) | | 1,300,646 | 10,407 |
| SunTrust Banks, Inc. | | 1,732,366 | 73,262 |
| U.S. Bancorp | | 1,804,573 | 76,099 |
| Wells Fargo & Co. | | 626,741 | 30,065 |
| | | | 869,914 |
| Capital Markets - 5.4% | | | |
| Apollo Global Management LLC Class A | | 618,000 | 10,599 |
| Ashmore Group PLC | | 1,126,300 | 4,964 |
| Charles Schwab Corp. | | 1,143,543 | 32,499 |
| Franklin Resources, Inc. | | 87,400 | 3,163 |
| Goldman Sachs Group, Inc. | | 21,600 | 3,430 |
| Invesco Ltd. | | 444,643 | 12,975 |
| KKR & Co. LP | | 2,308,743 | 33,338 |
| Morgan Stanley | | 1,443,997 | 41,486 |
| Northern Trust Corp. | | 917,864 | 62,038 |
| Oaktree Capital Group LLC Class A | | 238,400 | 11,067 |
| State Street Corp. | | 1,402,327 | 92,245 |
| The Blackstone Group LP | | 1,269,300 | 34,068 |
| | | | 341,872 |
| Diversified Financial Services - 0.4% | | | |
| FactSet Research Systems, Inc. | | 18,400 | 3,164 |
| McGraw Hill Financial, Inc. | | 180,100 | 22,008 |
| | | | 25,172 |
| Insurance - 0.9% | | | |
| Marsh & McLennan Companies, Inc. | | 368,407 | 24,223 |
| MetLife, Inc. | | 392,340 | 16,769 |
| Principal Financial Group, Inc. | | 249,400 | 11,630 |
| | | | 52,622 |
| Real Estate Investment Trusts - 0.5% | | | |
| American Tower Corp. | | 78,900 | 9,134 |
| Crown Castle International Corp. | | 177,900 | 17,262 |
| First Potomac Realty Trust | | 55,018 | 556 |
| Sabra Health Care REIT, Inc. | | 183,900 | 4,397 |
| | | | 31,349 |
| Thrifts & Mortgage Finance - 0.2% | | | |
| Radian Group, Inc. | | 1,062,368 | 13,705 |
|
| TOTAL FINANCIALS | | | 1,334,634 |
|
| HEALTH CARE - 13.3% | | | |
| Biotechnology - 2.9% | | | |
| AbbVie, Inc. | | 634,500 | 42,023 |
| Amgen, Inc. | | 318,503 | 54,792 |
| Biogen, Inc. (b) | | 147,800 | 42,852 |
| Celgene Corp. (b) | | 15,800 | 1,773 |
| Gilead Sciences, Inc. | | 175,400 | 13,939 |
| Intercept Pharmaceuticals, Inc. (b) | | 39,826 | 6,891 |
| Shire PLC sponsored ADR | | 113,000 | 21,936 |
| | | | 184,206 |
| Health Care Equipment & Supplies - 2.4% | | | |
| Abbott Laboratories | | 752,404 | 33,670 |
| Ansell Ltd. | | 453,462 | 6,675 |
| Becton, Dickinson & Co. | | 26,400 | 4,646 |
| Medtronic PLC | | 848,830 | 74,383 |
| Zimmer Biomet Holdings, Inc. | | 261,110 | 34,242 |
| | | | 153,616 |
| Health Care Providers & Services - 1.5% | | | |
| Anthem, Inc. | | 15,800 | 2,075 |
| Cigna Corp. | | 134,600 | 17,358 |
| McKesson Corp. | | 299,687 | 58,307 |
| Patterson Companies, Inc. | | 308,670 | 15,236 |
| | | | 92,976 |
| Life Sciences Tools & Services - 0.5% | | | |
| Agilent Technologies, Inc. | | 596,300 | 28,688 |
| Pharmaceuticals - 6.0% | | | |
| AstraZeneca PLC sponsored ADR (a) | | 399,700 | 13,646 |
| Bristol-Myers Squibb Co. | | 205,100 | 15,344 |
| GlaxoSmithKline PLC sponsored ADR | | 2,496,422 | 112,514 |
| Innoviva, Inc.(a) | | 278,400 | 3,583 |
| Johnson & Johnson (d) | | 1,018,969 | 127,605 |
| Novartis AG sponsored ADR | | 27,544 | 2,293 |
| Sanofi SA | | 250,497 | 21,336 |
| Teva Pharmaceutical Industries Ltd. sponsored ADR | | 1,478,520 | 79,101 |
| | | | 375,422 |
|
| TOTAL HEALTH CARE | | | 834,908 |
|
| INDUSTRIALS - 12.3% | | | |
| Aerospace & Defense - 2.4% | | | |
| General Dynamics Corp. | | 83,100 | 12,207 |
| Meggitt PLC | | 245,568 | 1,424 |
| Rolls-Royce Group PLC | | 1,111,000 | 11,625 |
| The Boeing Co. | | 516,589 | 69,047 |
| United Technologies Corp. | | 507,682 | 54,652 |
| | | | 148,955 |
| Air Freight & Logistics - 1.9% | | | |
| C.H. Robinson Worldwide, Inc. | | 216,200 | 15,052 |
| PostNL NV (b) | | 4,627,900 | 17,778 |
| United Parcel Service, Inc. Class B (d) | | 810,204 | 87,583 |
| | | | 120,413 |
| Airlines - 0.2% | | | |
| Copa Holdings SA Class A | | 227,154 | 15,219 |
| Building Products - 0.0% | | | |
| Lennox International, Inc. | | 19,900 | 3,120 |
| Commercial Services & Supplies - 0.1% | | | |
| KAR Auction Services, Inc. | | 178,900 | 7,652 |
| Electrical Equipment - 1.0% | | | |
| AMETEK, Inc. | | 149,800 | 7,045 |
| Eaton Corp. PLC | | 94,700 | 6,005 |
| Emerson Electric Co. | | 559,700 | 31,287 |
| Hubbell, Inc. Class B | | 197,039 | 21,247 |
| | | | 65,584 |
| Industrial Conglomerates - 3.0% | | | |
| General Electric Co. (d) | | 5,979,680 | 186,207 |
| Machinery - 0.8% | | | |
| Caterpillar, Inc. | | 20,600 | 1,705 |
| CLARCOR, Inc. | | 24,600 | 1,532 |
| Deere & Co. | | 216,900 | 16,855 |
| Donaldson Co., Inc. | | 273,700 | 9,889 |
| IMI PLC | | 78,200 | 1,109 |
| Pentair PLC | | 32,700 | 2,087 |
| Wabtec Corp. | | 119,000 | 8,152 |
| Xylem, Inc. | | 129,400 | 6,187 |
| | | | 47,516 |
| Professional Services - 0.1% | | | |
| Nielsen Holdings PLC | | 97,300 | 5,241 |
| Road & Rail - 2.3% | | | |
| CSX Corp. | | 1,705,120 | 48,306 |
| J.B. Hunt Transport Services, Inc. | | 527,340 | 43,838 |
| Kansas City Southern | | 191,200 | 18,376 |
| Norfolk Southern Corp. | | 183,999 | 16,519 |
| Union Pacific Corp. | | 158,000 | 14,702 |
| | | | 141,741 |
| Trading Companies & Distributors - 0.5% | | | |
| MSC Industrial Direct Co., Inc. Class A (a) | | 66,200 | 4,755 |
| W.W. Grainger, Inc. (a) | | 17,000 | 3,720 |
| Watsco, Inc. | | 165,692 | 23,866 |
| | | | 32,341 |
|
| TOTAL INDUSTRIALS | | | 773,989 |
|
| INFORMATION TECHNOLOGY - 20.6% | | | |
| Communications Equipment - 1.7% | | | |
| Cisco Systems, Inc. | | 3,486,852 | 106,454 |
| Internet Software & Services - 3.1% | | | |
| Alphabet, Inc.: | | | |
| Class A | | 134,107 | 106,124 |
| Class C (b) | | 115,346 | 88,677 |
| | | | 194,801 |
| IT Services - 5.2% | | | |
| First Data Corp. Class A (b) | | 1,927,110 | 23,896 |
| IBM Corp. | | 400,604 | 64,345 |
| MasterCard, Inc. Class A | | 653,500 | 62,239 |
| Paychex, Inc. (d) | | 1,151,652 | 68,270 |
| Sabre Corp. | | 165,400 | 4,821 |
| Unisys Corp. (a)(b) | | 973,600 | 9,648 |
| Visa, Inc. Class A | | 1,164,784 | 90,911 |
| | | | 324,130 |
| Semiconductors & Semiconductor Equipment - 2.7% | | | |
| Maxim Integrated Products, Inc. | | 538,400 | 21,956 |
| Qualcomm, Inc. | | 2,139,946 | 133,918 |
| Xilinx, Inc. | | 256,700 | 13,112 |
| | | | 168,986 |
| Software - 3.7% | | | |
| Microsoft Corp. (d) | | 3,626,199 | 205,533 |
| Oracle Corp. | | 472,153 | 19,377 |
| SS&C Technologies Holdings, Inc. | | 307,000 | 9,892 |
| | | | 234,802 |
| Technology Hardware, Storage & Peripherals - 4.2% | | | |
| Apple, Inc. | | 1,626,594 | 169,507 |
| EMC Corp. | | 2,376,900 | 67,219 |
| Western Digital Corp. | | 623,600 | 29,627 |
| | | | 266,353 |
|
| TOTAL INFORMATION TECHNOLOGY | | | 1,295,526 |
|
| MATERIALS - 2.9% | | | |
| Chemicals - 2.4% | | | |
| CF Industries Holdings, Inc. | | 392,400 | 9,684 |
| E.I. du Pont de Nemours & Co. | | 342,346 | 23,680 |
| Johnson Matthey PLC | | 16,600 | 720 |
| LyondellBasell Industries NV Class A | | 193,000 | 14,525 |
| Monsanto Co. | | 719,915 | 76,865 |
| Potash Corp. of Saskatchewan, Inc. | | 1,556,400 | 24,258 |
| W.R. Grace & Co. | | 40,900 | 3,062 |
| | | | 152,794 |
| Containers & Packaging - 0.5% | | | |
| Ball Corp. | | 65,300 | 4,615 |
| Graphic Packaging Holding Co. | | 45,800 | 625 |
| International Paper Co. | | 26,600 | 1,219 |
| Packaging Corp. of America | | 67,200 | 5,019 |
| WestRock Co. | | 471,800 | 20,245 |
| | | | 31,723 |
|
| TOTAL MATERIALS | | | 184,517 |
|
| TELECOMMUNICATION SERVICES - 0.9% | | | |
| Diversified Telecommunication Services - 0.9% | | | |
| Verizon Communications, Inc. | | 1,007,674 | 55,835 |
| UTILITIES - 0.8% | | | |
| Electric Utilities - 0.8% | | | |
| Exelon Corp. | | 1,433,900 | 53,456 |
| PPL Corp. | | 7,900 | 298 |
| | | | 53,754 |
| Multi-Utilities - 0.0% | | | |
| Sempra Energy | | 400 | 45 |
|
| TOTAL UTILITIES | | | 53,799 |
|
| TOTAL COMMON STOCKS | | | |
| (Cost $5,578,182) | | | 6,191,580 |
|
| Preferred Stocks - 1.1% | | | |
| Convertible Preferred Stocks - 1.1% | | | |
| HEALTH CARE - 0.9% | | | |
| Health Care Equipment & Supplies - 0.9% | | | |
| Alere, Inc. 3.00% | | 174,173 | 54,647 |
| INDUSTRIALS - 0.2% | | | |
| Commercial Services & Supplies - 0.2% | | | |
| Stericycle, Inc. 2.25% | | 133,700 | 9,973 |
| UTILITIES - 0.0% | | | |
| Independent Power and Renewable Electricity Producers - 0.0% | | | |
| Dynegy, Inc. 7.00% (b) | | 32,800 | 3,200 |
|
| TOTAL CONVERTIBLE PREFERRED STOCKS | | | 67,820 |
|
| Nonconvertible Preferred Stocks - 0.0% | | | |
| INDUSTRIALS - 0.0% | | | |
| Aerospace & Defense - 0.0% | | | |
| Rolls-Royce Group PLC | | 72,121,800 | 95 |
| Rolls-Royce Group PLC (C Shares) | | 32,482,080 | 43 |
| | | | 138 |
| TOTAL PREFERRED STOCKS | | | |
| (Cost $59,373) | | | 67,958 |
| | | Principal Amount (000s) | Value (000s) |
|
| Convertible Bonds - 0.3% | | | |
| CONSUMER DISCRETIONARY - 0.1% | | | |
| Automobiles - 0.1% | | | |
| Tesla Motors, Inc. 1.25% 3/1/21 | | 5,570 | 4,891 |
| ENERGY - 0.1% | | | |
| Oil, Gas & Consumable Fuels - 0.1% | | | |
| Amyris, Inc.: | | | |
| 5% 10/15/18 pay-in-kind (c)(e) | | 3,173 | 2,799 |
| 9.5% 4/15/19 pay-in-kind (e)(f) | | 5,075 | 2,204 |
| Peabody Energy Corp. 4.75% 12/15/41 (g) | | 7,660 | 48 |
| | | | 5,051 |
| INFORMATION TECHNOLOGY - 0.1% | | | |
| Internet Software & Services - 0.1% | | | |
| Twitter, Inc. 0.25% 9/15/19 | | 9,490 | 8,760 |
| TOTAL CONVERTIBLE BONDS | | | |
| (Cost $27,748) | | | 18,702 |
| | | Shares | Value (000s) |
|
| Money Market Funds - 0.8% | | | |
| Fidelity Cash Central Fund, 0.42% (h) | | 21,729,129 | 21,729 |
| Fidelity Securities Lending Cash Central Fund, 0.45% (h)(i) | | 29,496,798 | 29,497 |
| TOTAL MONEY MARKET FUNDS | | | |
| (Cost $51,226) | | | 51,226 |
| TOTAL INVESTMENT PORTFOLIO - 100.6% | | | |
| (Cost $5,716,529) | | | 6,329,466 |
| NET OTHER ASSETS (LIABILITIES) - (0.6)% | | | (36,396) |
| NET ASSETS - 100% | | | $6,293,070 |
| Written Options | | | | |
| | Expiration Date/Exercise Price | Number of Contracts | Premium (000s) | Value (000s) |
| Call Options | | | | |
| Comcast Corp. Class A | 10/21/16 - $67.50 | 2,500 | $230 | $(476) |
| General Electric Co. | 10/21/16 - $34.00 | 6,282 | 157 | (63) |
| Johnson & Johnson | 10/21/16 - $125.00 | 1,053 | 217 | (284) |
| JPMorgan Chase & Co. | 10/21/16 - $67.50 | 5,134 | 474 | (424) |
| Lowe's Companies, Inc. | 10/21/16 - $87.50 | 1,185 | 85 | (87) |
| Microsoft Corp. | 11/18/16 - $60.00 | 3,626 | 327 | (330) |
| Paychex, Inc. | 9/16/16 - $57.50 | 3,893 | 288 | (944) |
| Paychex, Inc. | 9/16/16 - $62.50 | 2,417 | 70 | (48) |
| United Parcel Service, Inc. Class B | 10/21/16 - $105.00 | 1,294 | 551 | (563) |
| TOTAL WRITTEN OPTIONS | | | $2,399 | $(3,219) |
Legend
(a) Security or a portion of the security is on loan at period end.
(b) Non-income producing
(c) Restricted securities - Investment in securities not registered under the Securities Act of 1933 (excluding 144A issues). At the end of the period, the value of restricted securities (excluding 144A issues) amounted to $2,826,000 or 0.0% of net assets.
(d) Security or a portion of the security is pledged as collateral for call options written. At period end, the value of securities pledged amounted to $164,100,000.
(e) Coupon rates for floating and adjustable rate securities reflect the rates in effect at period end.
(f) Security exempt from registration under Rule 144A of the Securities Act of 1933. These securities may be resold in transactions exempt from registration, normally to qualified institutional buyers. At the end of the period, the value of these securities amounted to $2,204,000 or 0.0% of net assets.
(g) Non-income producing - Security is in default.
(h) Affiliated fund that is generally available only to investment companies and other accounts managed by Fidelity Investments. The rate quoted is the annualized seven-day yield of the fund at period end. A complete unaudited listing of the fund's holdings as of its most recent quarter end is available upon request. In addition, each Fidelity Central Fund's financial statements, which are not covered by the Fund's Report of Independent Registered Public Accounting Firm, are available on the SEC's website or upon request.
(i) Investment made with cash collateral received from securities on loan.
Additional information on each restricted holding is as follows:
| Security | Acquisition Date | Acquisition Cost (000s) |
| Amyris, Inc. 5% 10/15/18 | 10/16/13 | $2,800 |
| NJOY, Inc. | 2/14/14 | $1,164 |
Affiliated Central Funds
Information regarding fiscal year to date income earned by the Fund from investments in Fidelity Central Funds is as follows:
| Fund | Income earned |
| | (Amounts in thousands) |
| Fidelity Cash Central Fund | $21 |
| Fidelity Securities Lending Cash Central Fund | 681 |
| Total | $702 |
Investment Valuation
The following is a summary of the inputs used, as of July 31, 2016, involving the Fund's assets and liabilities carried at fair value. The inputs or methodology used for valuing securities may not be an indication of the risk associated with investing in those securities. For more information on valuation inputs, and their aggregation into the levels used below, please refer to the Investment Valuation section in the accompanying Notes to Financial Statements.
| | Valuation Inputs at Reporting Date: |
| Description | Total | Level 1 | Level 2 | Level 3 |
| (Amounts in thousands) | | | | |
| Investments in Securities: | | | | |
| Equities: | | | | |
| Consumer Discretionary | $532,458 | $532,431 | $-- | $27 |
| Consumer Staples | 375,163 | 348,975 | 26,188 | -- |
| Energy | 750,751 | 750,751 | -- | -- |
| Financials | 1,334,634 | 1,333,492 | 1,142 | -- |
| Health Care | 889,555 | 813,572 | 75,983 | -- |
| Industrials | 784,100 | 772,475 | 11,625 | -- |
| Information Technology | 1,295,526 | 1,295,526 | -- | -- |
| Materials | 184,517 | 184,517 | -- | -- |
| Telecommunication Services | 55,835 | 55,835 | -- | -- |
| Utilities | 56,999 | 56,999 | -- | -- |
| Corporate Bonds | 18,702 | -- | 18,702 | -- |
| Money Market Funds | 51,226 | 51,226 | -- | -- |
| Total Investments in Securities: | $6,329,466 | $6,195,799 | $133,640 | $27 |
| Derivative Instruments: | | | | |
| Liabilities | | | | |
| Written Options | $(3,219) | $(3,219) | $-- | $-- |
| Total Liabilities | $(3,219) | $(3,219) | $-- | $-- |
| Total Derivative Instruments: | $(3,219) | $(3,219) | $-- | $-- |
The following is a summary of transfers between Level 1 and Level 2 for the period ended July 31, 2016. Transfers are assumed to have occurred at the beginning of the period, and are primarily attributable to the valuation techniques used for foreign equity securities, as discussed in the accompanying Notes to Financial Statements:
| Transfers | Total (000s) |
| Level 1 to Level 2 | $63,359 |
| Level 2 to Level 1 | $0 |
Value of Derivative Instruments
The following table is a summary of the Fund's value of derivative instruments by primary risk exposure as of July 31, 2016. For additional information on derivative instruments, please refer to the Derivative Instruments section in the accompanying Notes to Financial Statements.
| Primary Risk Exposure / Derivative Type | Value (000s) |
| | Asset | Liability |
| Equity Risk | | |
| Written Options(a) | $0 | $(3,219) |
| Total Equity Risk | 0 | (3,219) |
| Total Value of Derivatives | $0 | $(3,219) |
(a) Gross value is presented in the Statement of Assets and Liabilities in the written options, at value line item.
Other Information
Distribution of investments by country or territory of incorporation, as a percentage of Total Net Assets, is as follows (Unaudited):
| United States of America | 88.3% |
| United Kingdom | 3.5% |
| Canada | 3.3% |
| Ireland | 1.4% |
| Israel | 1.3% |
| Others (Individually Less Than 1%) | 2.2% |
| | 100.0% |
See accompanying notes which are an integral part of the financial statements.
Financial Statements
Statement of Assets and Liabilities
| Amounts in thousands (except per-share amounts) | | July 31, 2016 |
| Assets | | |
Investment in securities, at value (including securities loaned of $28,993) — See accompanying schedule:
Unaffiliated issuers (cost $5,665,303) | $6,278,240 | |
| Fidelity Central Funds (cost $51,226) | 51,226 | |
| Total Investments (cost $5,716,529) | | $6,329,466 |
| Receivable for investments sold | | 20,760 |
| Receivable for fund shares sold | | 778 |
| Dividends receivable | | 8,758 |
| Interest receivable | | 227 |
| Distributions receivable from Fidelity Central Funds | | 47 |
| Other receivables | | 714 |
| Total assets | | 6,360,750 |
| Liabilities | | |
| Payable for investments purchased | $26,792 | |
| Payable for fund shares redeemed | 4,220 | |
| Accrued management fee | 2,316 | |
| Written options, at value (premium received $2,399) | 3,219 | |
| Other affiliated payables | 893 | |
| Other payables and accrued expenses | 743 | |
| Collateral on securities loaned, at value | 29,497 | |
| Total liabilities | | 67,680 |
| Net Assets | | $6,293,070 |
| Net Assets consist of: | | |
| Paid in capital | | $7,948,801 |
| Distributions in excess of net investment income | | (6,075) |
| Accumulated undistributed net realized gain (loss) on investments and foreign currency transactions | | (2,261,738) |
| Net unrealized appreciation (depreciation) on investments and assets and liabilities in foreign currencies | | 612,082 |
| Net Assets | | $6,293,070 |
| Growth and Income: | | |
| Net Asset Value, offering price and redemption price per share ($5,528,555 ÷ 181,356 shares) | | $30.48 |
| Class K: | | |
| Net Asset Value, offering price and redemption price per share ($764,515 ÷ 25,100 shares) | | $30.46 |
See accompanying notes which are an integral part of the financial statements.
Statement of Operations
| Amounts in thousands | | Year ended July 31, 2016 |
| Investment Income | | |
| Dividends | | $167,951 |
| Interest | | 1,177 |
| Income from Fidelity Central Funds | | 702 |
| Total income | | 169,830 |
| Expenses | | |
| Management fee | $28,329 | |
| Transfer agent fees | 9,791 | |
| Accounting and security lending fees | 1,147 | |
| Custodian fees and expenses | 152 | |
| Independent trustees' fees and expenses | 29 | |
| Registration fees | 58 | |
| Audit | 95 | |
| Legal | 30 | |
| Interest | 10 | |
| Miscellaneous | 53 | |
| Total expenses before reductions | 39,694 | |
| Expense reductions | (204) | 39,490 |
| Net investment income (loss) | | 130,340 |
| Realized and Unrealized Gain (Loss) | | |
| Net realized gain (loss) on: | | |
| Investment securities: | | |
| Unaffiliated issuers | 403,857 | |
| Foreign currency transactions | (102) | |
| Written options | 5,815 | |
| Total net realized gain (loss) | | 409,570 |
Change in net unrealized appreciation (depreciation) on:
Investment securities | (566,115) | |
| Assets and liabilities in foreign currencies | (5) | |
| Written options | (820) | |
| Total change in net unrealized appreciation (depreciation) | | (566,940) |
| Net gain (loss) | | (157,370) |
| Net increase (decrease) in net assets resulting from operations | | $(27,030) |
See accompanying notes which are an integral part of the financial statements.
Statement of Changes in Net Assets
| Amounts in thousands | Year ended July 31, 2016 | Year ended July 31, 2015 |
| Increase (Decrease) in Net Assets | | |
| Operations | | |
| Net investment income (loss) | $130,340 | $140,160 |
| Net realized gain (loss) | 409,570 | 743,260 |
| Change in net unrealized appreciation (depreciation) | (566,940) | (281,519) |
| Net increase (decrease) in net assets resulting from operations | (27,030) | 601,901 |
| Distributions to shareholders from net investment income | (127,549) | (135,475) |
| Distributions to shareholders from net realized gain | (2,644) | – |
| Total distributions | (130,193) | (135,475) |
| Share transactions - net increase (decrease) | (973,902) | (551,906) |
| Total increase (decrease) in net assets | (1,131,125) | (85,480) |
| Net Assets | | |
| Beginning of period | 7,424,195 | 7,509,675 |
| End of period | $6,293,070 | $7,424,195 |
| Other Information | | |
| Distributions in excess of net investment income end of period | $(6,075) | $(722) |
See accompanying notes which are an integral part of the financial statements.
Financial Highlights — Fidelity Growth & Income Portfolio
| Years ended July 31, | 2016 | 2015 | 2014 | 2013 | 2012 |
| Selected Per–Share Data | | | | | |
| Net asset value, beginning of period | $30.85 | $29.02 | $25.66 | $20.13 | $18.58 |
| Income from Investment Operations | | | | | |
| Net investment income (loss)A | .59 | .55 | .51 | .46 | .36 |
| Net realized and unrealized gain (loss) | (.37) | 1.82B | 3.35 | 5.54 | 1.55 |
| Total from investment operations | .22 | 2.37 | 3.86 | 6.00 | 1.91 |
| Distributions from net investment income | (.58) | (.54) | (.50) | (.44) | (.35) |
| Distributions from net realized gain | (.01) | – | (.01) | (.03) | (.01) |
| Total distributions | (.59) | (.54) | (.50)C | (.47) | (.36) |
| Net asset value, end of period | $30.48 | $30.85 | $29.02 | $25.66 | $20.13 |
| Total ReturnD | .88% | 8.23%B | 15.16% | 30.15% | 10.45% |
| Ratios to Average Net AssetsE,F | | | | | |
| Expenses before reductions | .64% | .64% | .65% | .68% | .71% |
| Expenses net of fee waivers, if any | .64% | .63% | .65% | .68% | .71% |
| Expenses net of all reductions | .64% | .63% | .65% | .67% | .71% |
| Net investment income (loss) | 2.05% | 1.83% | 1.86% | 2.04% | 1.95% |
| Supplemental Data | | | | | |
| Net assets, end of period (in millions) | $5,529 | $6,563 | $6,550 | $6,060 | $4,863 |
| Portfolio turnover rateG | 29% | 35% | 41%H | 49% | 62% |
A Calculated based on average shares outstanding during the period.
B Net realized and unrealized gain (loss) per share reflects proceeds received from litigation which amounted to $.06 per share. Excluding these litigation proceeds, the total return would have been 8.03%.
C Total distributions of $.50 per share is comprised of distributions from net investment income of $.495 and distributions from net realized gain of $.006 per share.
D Total returns would have been lower if certain expenses had not been reduced during the applicable periods shown.
E Fees and expenses of any underlying Fidelity Central Funds are not included in the Fund's expense ratio. The Fund indirectly bears its proportionate share of the expenses of any underlying Fidelity Central Funds.
F Expense ratios reflect operating expenses of the class. Expenses before reductions do not reflect amounts reimbursed by the investment adviser or reductions from brokerage service arrangements or reductions from other expense offset arrangements and do not represent the amount paid by the class during periods when reimbursements or reductions occur. Expenses net of fee waivers reflect expenses after reimbursement by the investment adviser but prior to reductions from brokerage service arrangements or other expense offset arrangements. Expenses net of all reductions represent the net expenses paid by the class.
G Amount does not include the portfolio activity of any underlying Fidelity Central Funds.
H Portfolio turnover rate excludes securities received or delivered in-kind.
See accompanying notes which are an integral part of the financial statements.
Financial Highlights — Fidelity Growth & Income Portfolio Class K
| | 2016 | 2015 | 2014 | 2013 | 2012 |
| Selected Per–Share Data | | | | | |
| Net asset value, beginning of period | $30.82 | $29.00 | $25.64 | $20.12 | $18.57 |
| Income from Investment Operations | | | | | |
| Net investment income (loss)A | .62 | .59 | .54 | .50 | .40 |
| Net realized and unrealized gain (loss) | (.35) | 1.81B | 3.36 | 5.52 | 1.54 |
| Total from investment operations | .27 | 2.40 | 3.90 | 6.02 | 1.94 |
| Distributions from net investment income | (.62) | (.58) | (.53) | (.47) | (.38) |
| Distributions from net realized gain | (.01) | – | (.01) | (.03) | (.01) |
| Total distributions | (.63) | (.58) | (.54) | (.50) | (.39) |
| Net asset value, end of period | $30.46 | $30.82 | $29.00 | $25.64 | $20.12 |
| Total ReturnC | 1.04% | 8.34%B | 15.32% | 30.28% | 10.66% |
| Ratios to Average Net AssetsD,E | | | | | |
| Expenses before reductions | .52% | .52% | .52% | .53% | .54% |
| Expenses net of fee waivers, if any | .52% | .52% | .52% | .53% | .54% |
| Expenses net of all reductions | .52% | .52% | .52% | .52% | .54% |
| Net investment income (loss) | 2.17% | 1.95% | 1.99% | 2.19% | 2.13% |
| Supplemental Data | | | | | |
| Net assets, end of period (in millions) | $765 | $862 | $960 | $1,016 | $752 |
| Portfolio turnover rateF | 29% | 35% | 41%G | 49% | 62% |
A Calculated based on average shares outstanding during the period.
B Net realized and unrealized gain (loss) per share reflects proceeds received from litigation which amounted to $.06 per share. Excluding these litigation proceeds, the total return would have been 8.14%
C Total returns would have been lower if certain expenses had not been reduced during the applicable periods shown.
D Fees and expenses of any underlying Fidelity Central Funds are not included in the Fund's expense ratio. The Fund indirectly bears its proportionate share of the expenses of any underlying Fidelity Central Funds.
E Expense ratios reflect operating expenses of the class. Expenses before reductions do not reflect amounts reimbursed by the investment adviser or reductions from brokerage service arrangements or reductions from other expense offset arrangements and do not represent the amount paid by the class during periods when reimbursements or reductions occur. Expenses net of fee waivers reflect expenses after reimbursement by the investment adviser but prior to reductions from brokerage service arrangements or other expense offset arrangements. Expenses net of all reductions represent the net expenses paid by the class.
F Amount does not include the portfolio activity of any underlying Fidelity Central Funds.
G Portfolio turnover rate excludes securities received or delivered in-kind.
See accompanying notes which are an integral part of the financial statements.
Notes to Financial Statements
For the period ended July 31, 2016
(Amounts in thousands except percentages)
1. Organization.
Fidelity Growth & Income Portfolio (the Fund) is a fund of Fidelity Securities Fund (the Trust) and is authorized to issue an unlimited number of shares. The Trust is registered under the Investment Company Act of 1940, as amended (the 1940 Act), as an open-end management investment company organized as a Massachusetts business trust. The Fund offers Growth & Income, and Class K shares, each of which has equal rights as to assets and voting privileges. Each class has exclusive voting rights with respect to matters that affect that class.
2. Investments in Fidelity Central Funds.
The Fund invests in Fidelity Central Funds, which are open-end investment companies generally available only to other investment companies and accounts managed by the investment adviser and its affiliates. The Fund's Schedule of Investments lists each of the Fidelity Central Funds held as of period end, if any, as an investment of the Fund, but does not include the underlying holdings of each Fidelity Central Fund. As an Investing Fund, the Fund indirectly bears its proportionate share of the expenses of the underlying Fidelity Central Funds.
The Money Market Central Funds seek preservation of capital and current income and are managed by Fidelity Investments Money Management, Inc. (FIMM), an affiliate of the investment adviser. Annualized expenses of the Money Market Central Funds as of their most recent shareholder report date are less than .005%.
A complete unaudited list of holdings for each Fidelity Central Fund is available upon request or at the Securities and Exchange Commission (the SEC) website at www.sec.gov. In addition, the financial statements of the Fidelity Central Funds, which are not covered by the Fund's Report of Independent Registered Public Accounting Firm, are available on the SEC website or upon request.
3. Significant Accounting Policies.
The financial statements have been prepared in conformity with accounting principles generally accepted in the United States of America (GAAP), which require management to make certain estimates and assumptions at the date of the financial statements. Actual results could differ from those estimates. Subsequent events, if any, through the date that the financial statements were issued have been evaluated in the preparation of the financial statements. The following summarizes the significant accounting policies of the Fund:
Investment Valuation. Investments are valued as of 4:00 p.m. Eastern time on the last calendar day of the period. The Board of Trustees (the Board) has delegated the day to day responsibility for the valuation of the Fund's investments to the Fidelity Management & Research Company (FMR) Fair Value Committee (the Committee). In accordance with valuation policies and procedures approved by the Board, the Fund attempts to obtain prices from one or more third party pricing vendors or brokers to value its investments. When current market prices, quotations or currency exchange rates are not readily available or reliable, investments will be fair valued in good faith by the Committee, in accordance with procedures adopted by the Board. Factors used in determining fair value vary by investment type and may include market or investment specific events, changes in interest rates and credit quality. The frequency with which these procedures are used cannot be predicted and they may be utilized to a significant extent. The Committee oversees the Fund's valuation policies and procedures and reports to the Board on the Committee's activities and fair value determinations. The Board monitors the appropriateness of the procedures used in valuing the Fund's investments and ratifies the fair value determinations of the Committee.
The Fund categorizes the inputs to valuation techniques used to value its investments into a disclosure hierarchy consisting of three levels as shown below:
- Level 1 – quoted prices in active markets for identical investments
- Level 2 – other significant observable inputs (including quoted prices for similar investments, interest rates, prepayment speeds, etc.)
- Level 3 – unobservable inputs (including the Fund's own assumptions based on the best information available)
Valuation techniques used to value the Fund's investments by major category are as follows:
Equity securities, including restricted securities, for which market quotations are readily available, are valued at the last reported sale price or official closing price as reported by a third party pricing vendor on the primary market or exchange on which they are traded and are categorized as Level 1 in the hierarchy. In the event there were no sales during the day or closing prices are not available, securities are valued at the last quoted bid price or may be valued using the last available price and are generally categorized as Level 2 in the hierarchy. For foreign equity securities, when market or security specific events arise, comparisons to the valuation of American Depositary Receipts (ADRs), futures contracts, Exchange-Traded Funds (ETFs) and certain indexes as well as quoted prices for similar securities may be used and would be categorized as Level 2 in the hierarchy. Utilizing these techniques may result in transfers between Level 1 and Level 2. For equity securities, including restricted securities, where observable inputs are limited, assumptions about market activity and risk are used and these securities may be categorized as Level 3 in the hierarchy.
Debt securities, including restricted securities, are valued based on evaluated prices received from third party pricing vendors or from brokers who make markets in such securities. Corporate bonds are valued by pricing vendors who utilize matrix pricing which considers yield or price of bonds of comparable quality, coupon, maturity and type or by broker-supplied prices. When independent prices are unavailable or unreliable, debt securities may be valued utilizing pricing methodologies which consider similar factors that would be used by third party pricing vendors. Debt securities are generally categorized as Level 2 in the hierarchy but may be Level 3 depending on the circumstances.
Exchange-traded options are valued using the last sale price or, in the absence of a sale, the last offering price and are categorized as Level 1 in the hierarchy. Investments in open-end mutual funds, including the Fidelity Central Funds, are valued at their closing net asset value (NAV) each business day and are categorized as Level 1 in the hierarchy.
Changes in valuation techniques may result in transfers in or out of an assigned level within the disclosure hierarchy. The aggregate value of investments by input level as of July 31, 2016, including information on transfers between Levels 1 and 2, is included at the end of the Fund's Schedule of Investments.
Foreign Currency. The Fund may use foreign currency contracts to facilitate transactions in foreign-denominated securities. Gains and losses from these transactions may arise from changes in the value of the foreign currency or if the counterparties do not perform under the contracts' terms.
Foreign-denominated assets, including investment securities, and liabilities are translated into U.S. dollars at the exchange rates at period end. Purchases and sales of investment securities, income and dividends received and expenses denominated in foreign currencies are translated into U.S. dollars at the exchange rate in effect on the transaction date.
The effects of exchange rate fluctuations on investments are included with the net realized and unrealized gain (loss) on investment securities. Other foreign currency transactions resulting in realized and unrealized gain (loss) are disclosed separately.
Investment Transactions and Income. For financial reporting purposes, the Fund's investment holdings and NAV include trades executed through the end of the last business day of the period. The NAV per share for processing shareholder transactions is calculated as of the close of business of the New York Stock Exchange (NYSE), normally 4:00 p.m. Eastern time and includes trades executed through the end of the prior business day. Gains and losses on securities sold are determined on the basis of identified cost and may include proceeds received from litigation. Dividend income is recorded on the ex-dividend date, except for certain dividends from foreign securities where the ex-dividend date may have passed, which are recorded as soon as the Fund is informed of the ex-dividend date. Non-cash dividends included in dividend income, if any, are recorded at the fair market value of the securities received. Income and capital gain distributions from Fidelity Central Funds, if any, are recorded on the ex-dividend date. Distributions received on securities that represent a return of capital or capital gain are recorded as a reduction of cost of investments and/or as a realized gain. Subsequent to ex-dividend date the Fund determines the components of these distributions, based upon receipt of tax filings or other correspondence relating to the underlying investment. Interest income is accrued as earned and includes coupon interest and amortization of premium and accretion of discount on debt securities as applicable. Investment income is recorded net of foreign taxes withheld where recovery of such taxes is uncertain. Debt obligations may be placed on non-accrual status and related interest income may be reduced by ceasing current accruals and writing off interest receivables when the collection of all or a portion of interest has become doubtful based on consistently applied procedures. A debt obligation is removed from non-accrual status when the issuer resumes interest payments or when collectability of interest is reasonably assured.
Class Allocations and Expenses. Investment income, realized and unrealized capital gains and losses, common expenses of the Fund, and certain fund-level expense reductions, if any, are allocated daily on a pro-rata basis to each class based on the relative net assets of each class to the total net assets of the Fund. Each class differs with respect to transfer agent fees incurred. Certain expense reductions may also differ by class. For the reporting period, the allocated portion of income and expenses to each class as a percent of its average net assets may vary due to the timing of recording these transactions in relation to fluctuating net assets of the classes. Expenses directly attributable to a fund are charged to that fund. Expenses attributable to more than one fund are allocated among the respective funds on the basis of relative net assets or other appropriate methods. Expense estimates are accrued in the period to which they relate and adjustments are made when actual amounts are known.
Deferred Trustee Compensation. Under a Deferred Compensation Plan (the Plan), independent Trustees may elect to defer receipt of a portion of their annual compensation. Deferred amounts are invested in a cross-section of Fidelity funds, are marked-to-market and remain in the Fund until distributed in accordance with the Plan. The investment of deferred amounts and the offsetting payable to the Trustees are included in the accompanying Statement of Assets and Liabilities.
Income Tax Information and Distributions to Shareholders. Each year, the Fund intends to qualify as a regulated investment company under Subchapter M of the Internal Revenue Code, including distributing substantially all of its taxable income and realized gains. As a result, no provision for U.S. Federal income taxes is required. As of July 31, 2016, the Fund did not have any unrecognized tax benefits in the financial statements; nor is the Fund aware of any tax positions for which it is reasonably possible that the total amounts of unrecognized tax benefits will significantly change in the next twelve months. The Fund files a U.S. federal tax return, in addition to state and local tax returns as required. The Fund's federal income tax returns are subject to examination by the Internal Revenue Service (IRS) for a period of three fiscal years after they are filed. State and local tax returns may be subject to examination for an additional fiscal year depending on the jurisdiction. Foreign taxes are provided for based on the Fund's understanding of the tax rules and rates that exist in the foreign markets in which it invests.
Distributions are declared and recorded on the ex-dividend date. Income dividends and capital gain distributions are declared separately for each class. Income and capital gain distributions are determined in accordance with income tax regulations, which may differ from GAAP.
Capital accounts within the financial statements are adjusted for permanent book-tax differences. These adjustments have no impact on net assets or the results of operations. Capital accounts are not adjusted for temporary book-tax differences which will reverse in a subsequent period.
Book-tax differences are primarily due to foreign currency transactions, passive foreign investment companies (PFIC), market discount, equity-debt classifications, partnerships, deferred trustees compensation, certain conversion ratio adjustments, capital loss carryforward and losses deferred due to wash sales.
The federal tax cost of investment securities and unrealized appreciation (depreciation) as of period end were as follows:
| Gross unrealized appreciation | $1,050,243 |
| Gross unrealized depreciation | (431,497) |
| Net unrealized appreciation (depreciation) on securities | $618,746 |
| Tax Cost | $5,710,720 |
The tax-based components of distributable earnings as of period end were as follows:
| Undistributed ordinary income | $17,714 |
| Capital loss carryforward | $(2,267,080) |
| Net unrealized appreciation (depreciation) on securities and other investments | $617,876 |
Capital loss carryforwards are only available to offset future capital gains of the Fund to the extent provided by regulations and may be limited. Under the Regulated Investment Company Modernization Act of 2010 (the Act), the Fund is permitted to carry forward capital losses incurred in taxable years beginning after December 22, 2010 for an unlimited period and such capital losses are required to be used prior to any losses that expire. The capital loss carryforward information presented below, including any applicable limitation, is estimated as of fiscal period end and is subject to adjustment.
| Fiscal year of expiration | |
| 2018 | $(2,267,080) |
The tax character of distributions paid was as follows:
| | July 31, 2016 | July 31, 2015 |
| Ordinary Income | $ 130,193 | $ 135,475 |
Restricted Securities. The Fund may invest in securities that are subject to legal or contractual restrictions on resale. These securities generally may be resold in transactions exempt from registration or to the public if the securities are registered. Disposal of these securities may involve time-consuming negotiations and expense, and prompt sale at an acceptable price may be difficult. Information regarding restricted securities is included at the end of the Fund's Schedule of Investments.
4. Derivative Instruments.
Risk Exposures and the Use of Derivative Instruments. The Fund's investment objective allows the Fund to enter into various types of derivative contracts, including options. Derivatives are investments whose value is primarily derived from underlying assets, indices or reference rates and may be transacted on an exchange or over-the-counter (OTC). Derivatives may involve a future commitment to buy or sell a specified asset based on specified terms, to exchange future cash flows at periodic intervals based on a notional principal amount, or for one party to make one or more payments upon the occurrence of specified events in exchange for periodic payments from the other party.
The Fund used derivatives to increase returns and to manage exposure to certain risks as defined below. The success of any strategy involving derivatives depends on analysis of numerous economic factors, and if the strategies for investment do not work as intended, the Fund may not achieve its objectives.
The Fund's use of derivatives increased or decreased its exposure to the following risk:
| Equity Risk | Equity risk relates to the fluctuations in the value of financial instruments as a result of changes in market prices (other than those arising from interest rate risk or foreign exchange risk), whether caused by factors specific to an individual investment, its issuer, or all factors affecting all instruments traded in a market or market segment.
|
The Fund is also exposed to additional risks from investing in derivatives, such as liquidity risk and counterparty credit risk. Liquidity risk is the risk that the Fund will be unable to close out the derivative in the open market in a timely manner. Counterparty credit risk is the risk that the counterparty will not be able to fulfill its obligation to the Fund. Counterparty credit risk related to exchange-traded options may be mitigated by the protection provided by the exchange on which they trade.
Investing in derivatives may involve greater risks than investing in the underlying assets directly and, to varying degrees, may involve risk of loss in excess of any initial investment and collateral received and amounts recognized in the Statement of Assets and Liabilities. In addition, there may be the risk that the change in value of the derivative contract does not correspond to the change in value of the underlying instrument.
Options. Options give the purchaser the right, but not the obligation, to buy (call) or sell (put) an underlying security or financial instrument at an agreed exercise or strike price between or on certain dates. Options obligate the seller (writer) to buy (put) or sell (call) an underlying instrument at the exercise or strike price or cash settle an underlying derivative instrument if the holder exercises the option on or before the expiration date.
The Fund used exchange-traded written covered call options to manage its exposure to the market. When the Fund writes a covered call option, the Fund holds the underlying instrument which must be delivered to the holder upon the exercise of the option.
Upon entering into a written options contract, the Fund will receive a premium. Premiums received are reflected as a liability on the Statement of Assets and Liabilities. Options are valued daily and any unrealized appreciation (depreciation) is reflected on the Statement of Assets and Liabilities. When a written option is exercised, the premium is added to the proceeds from the sale of the underlying instrument in determining the gain or loss realized on that investment. When an option is closed the Fund will realize a gain or loss depending on whether the proceeds or amount paid for the closing sale transaction are greater or less than the premium received. When an option expires, gains and losses are realized to the extent of premiums received. The net realized gain (loss) on closed and expired written options and the change in net unrealized appreciation (depreciation) on written options are reflected separately on the Statement of Operations.
Writing call options tends to decrease exposure to the underlying instrument and risk of loss is the change in value in excess of the premium received.
Any open options at period end are presented in the Schedule of Investments under the caption "Written Options".
During the period, the Fund recognized net realized gain (loss) of $5,815 and a change in net unrealized appreciation (depreciation) of $(820) related to its investment in written options. This amount is included in the Statement of Operations.
The following is a summary of the Fund's written options activity:
| | Number of Contracts | Amount of Premiums |
| Outstanding at beginning of period | - | $ - |
| Options Opened | 153 | 10,381 |
| Options Exercised | (20) | (1,392) |
| Options Closed | (64) | (3,063) |
| Options Expired | (42) | (3,527) |
| Outstanding at end of period | 27 | $2,399 |
5. Purchases and Sales of Investments.
Purchases and sales of securities, other than short-term securities, aggregated $1,858,687 and $2,835,428, respectively.
6. Fees and Other Transactions with Affiliates.
Management Fee. Fidelity Management & Research Company (the investment adviser) and its affiliates provide the Fund with investment management related services for which the Fund pays a monthly management fee. The management fee is the sum of an individual fund fee rate that is based on an annual rate of .20% of the Fund's average net assets and an annualized group fee rate that averaged .25% during the period. The group fee rate is based upon the average net assets of all the mutual funds advised by the investment adviser, including any mutual funds previously advised by the investment adviser that are currently advised by Fidelity SelectCo, LLC, an affiliate of the investment adviser. The group fee rate decreases as assets under management increase and increases as assets under management decrease. For the reporting period, the total annual management fee rate was .45% of the Fund's average net assets.
Transfer Agent Fees. Fidelity Investments Institutional Operations Company, Inc., (FIIOC), an affiliate of the investment adviser, is the transfer, dividend disbursing and shareholder servicing agent for each class of the Fund. FIIOC receives account fees and asset-based fees that vary according to the account size and type of account of the shareholders of Growth & Income, except for Class K. FIIOC receives an asset-based fee of Class K's average net assets. FIIOC pays for typesetting, printing and mailing of shareholder reports, except proxy statements.
For the period, transfer agent fees for each applicable class were as follows:
| | Amount | % of
Class-Level Average
Net Assets |
| Growth and Income | $9,428 | .17 |
| Class K | 363 | .05 |
| | $ 9,791 | |
Accounting and Security Lending Fees. Fidelity Service Company, Inc. (FSC), an affiliate of the investment adviser, maintains the Fund's accounting records. The accounting fee is based on the level of average net assets for each month. Under a separate contract, FSC administers the security lending program. The security lending fee is based on the number and duration of lending transactions.
Brokerage Commissions. The Fund placed a portion of its portfolio transactions with brokerage firms which are affiliates of the investment adviser. Brokerage commissions are included in net realized gain (loss) and change in net unrealized appreciation (depreciation) in the Statement of Operations. The commissions paid to these affiliated firms were $49 for the period.
Interfund Lending Program. Pursuant to an Exemptive Order issued by the SEC, the Fund, along with other registered investment companies having management contracts with FMR or other affiliated entities of FMR, may participate in an interfund lending program. This program provides an alternative credit facility allowing the funds to borrow from, or lend money to, other participating affiliated funds. At period end, there were no interfund loans outstanding. The Fund's activity in this program during the period for which loans were outstanding was as follows:
| Borrower or Lender | Average Loan Balance | Weighted Average Interest Rate | Interest Expense |
| Borrower | $5,799 | .46% | $8 |
Interfund Trades. The Fund may purchase from or sell securities to other Fidelity Funds under procedures adopted by the Board. The procedures have been designed to ensure these interfund trades are executed in accordance with Rule 17a-7 of the 1940 Act. Interfund trades are included within the respective purchases and sales amounts shown in the Purchases and Sales of Investments note.
Other. During the period, the investment adviser reimbursed the Fund for certain losses in the amount of $71.
7. Committed Line of Credit.
The Fund participates with other funds managed by the investment adviser or an affiliate in a $4.25 billion credit facility (the "line of credit") to be utilized for temporary or emergency purposes to fund shareholder redemptions or for other short-term liquidity purposes. The Fund has agreed to pay commitment fees on its pro-rata portion of the line of credit, which amounted to $13 and is reflected in Miscellaneous expenses on the Statement of Operations. During the period, the Fund did not borrow on this line of credit.
8. Security Lending.
The Fund lends portfolio securities through a lending agent from time to time in order to earn additional income. For equity securities, a lending agent is used and may loan securities to certain qualified borrowers, including Fidelity Capital Markets (FCM), a broker-dealer affiliated with the Fund. On the settlement date of the loan, the Fund receives collateral (in the form of U.S. Treasury obligations, letters of credit and/or cash) against the loaned securities and maintains collateral in an amount not less than 100% of the market value of the loaned securities during the period of the loan. The market value of the loaned securities is determined at the close of business of the Fund and any additional required collateral is delivered to the Fund on the next business day. The Fund or borrower may terminate the loan at any time, and if the borrower defaults on its obligation to return the securities loaned because of insolvency or other reasons, the Fund may apply collateral received from the borrower against the obligation. The Fund may experience delays and costs in recovering the securities loaned. Any cash collateral received is invested in the Fidelity Securities Lending Cash Central Fund. The value of loaned securities and cash collateral at period end are disclosed on the Fund's Statement of Assets and Liabilities. The value of securities loaned to FCM at period end was $827. Security lending income represents the income earned on investing cash collateral, less rebates paid to borrowers and any lending agent fees associated with the loan, plus any premium payments received for lending certain types of securities. Security lending income is presented in the Statement of Operations as a component of income from Fidelity Central Funds. Total security lending income during the period amounted to $681, including an amount of less than five hundred dollars from securities loaned to FCM.
9. Bank Borrowings.
The Fund is permitted to have bank borrowings for temporary or emergency purposes to fund shareholder redemptions or for other short-term liquidity requirements. The Fund has established borrowing arrangements with certain banks. The interest rate on the borrowings is the bank's base rate, as revised from time to time. The average loan balance during the period for which loans were outstanding amounted to $4,931. The weighted average interest rate was .69%. The interest expense amounted to $2 under the bank borrowing program. At period end, there were no bank borrowings outstanding.
10. Expense Reductions.
Commissions paid to certain brokers with whom the investment adviser, or its affiliates, places trades on behalf of the Fund include an amount in addition to trade execution, which may be rebated back to the Fund to offset certain expenses. This amount totaled $158 for the period.
In addition, during the period the investment adviser reimbursed and/or waived a portion of fund-level operating expenses in the amount of $46.
11. Distributions to Shareholders.
Distributions to shareholders of each class were as follows:
| | Year ended
July 31, 2016 | Year ended July 31, 2015 |
| From net investment income | | |
| Growth and Income | $110,877 | $117,218 |
| Class K | 16,672 | 18,257 |
| Total | $127,549 | $135,475 |
| From net realized gain | | |
| Growth and Income | $2,314 | $– |
| Class K | 330 | – |
| Total | $2,644 | $– |
12. Share Transactions.
Share transactions for each class were as follows and may contain automatic conversions between classes or exchanges between affiliated funds:
| | Shares | Shares | Dollars | Dollars |
| | Year ended
July 31, 2016 | Year ended July 31, 2015 | Year ended
July 31, 2016 | Year ended July 31, 2015 |
| Growth and Income | | | | |
| Shares sold | 4,968 | 12,118 | $141,986 | $365,420 |
| Reinvestment of distributions | 3,798 | 3,750 | 107,836 | 111,890 |
| Shares redeemed | (40,154) | (28,824) | (1,140,777) | (872,624) |
| Net increase (decrease) | (31,388) | (12,956) | $(890,955) | $(395,314) |
| Class K | | | | |
| Shares sold | 3,725 | 4,866 | $105,617 | $146,512 |
| Reinvestment of distributions | 599 | 612 | 17,002 | 18,257 |
| Shares redeemed | (7,177) | (10,609) | (205,566) | (321,361) |
| Net increase (decrease) | (2,853) | (5,131) | $(82,947) | $(156,592) |
13. Other.
The Fund's organizational documents provide former and current trustees and officers with a limited indemnification against liabilities arising in connection with the performance of their duties to the Fund. In the normal course of business, the Fund may also enter into contracts that provide general indemnifications. The Fund's maximum exposure under these arrangements is unknown as this would be dependent on future claims that may be made against the Fund. The risk of material loss from such claims is considered remote.
Report of Independent Registered Public Accounting Firm
To the Trustees of Fidelity Securities Fund and Shareholders of Fidelity Growth & Income Portfolio:
In our opinion, the accompanying statement of assets and liabilities, including the schedule of investments, and the related statements of operations and of changes in net assets and the financial highlights present fairly, in all material respects, the financial position of Fidelity Growth & Income Portfolio (a fund of Fidelity Securities Fund) at July 31, 2016, the results of its operations for the year then ended, the changes in its net assets for each of the two years in the period then ended and the financial highlights for each of the five years in the period then ended, in conformity with accounting principles generally accepted in the United States of America. These financial statements and financial highlights (hereafter referred to as “financial statements”) are the responsibility of the Fidelity Growth & Income Portfolio’s management. Our responsibility is to express an opinion on these financial statements based on our audits. We conducted our audits of these financial statements in accordance with the standards of the Public Company Accounting Oversight Board (United States). Those standards require that we plan and perform the audit to obtain reasonable assurance about whether the financial statements are free of material misstatement. An audit includes examining, on a test basis, evidence supporting the amounts and disclosures in the financial statements, assessing the accounting principles used and significant estimates made by management, and evaluating the overall financial statement presentation. We believe that our audits, which included confirmation of securities at July 31, 2016 by correspondence with the custodian and brokers, provide a reasonable basis for our opinion.
PricewaterhouseCoopers LLP
Boston, Massachusetts
September 14, 2016
Trustees and Officers
The Trustees, Members of the Advisory Board (if any), and officers of the trust and fund, as applicable, are listed below. The Board of Trustees governs the fund and is responsible for protecting the interests of shareholders. The Trustees are experienced executives who meet periodically throughout the year to oversee the fund's activities, review contractual arrangements with companies that provide services to the fund, oversee management of the risks associated with such activities and contractual arrangements, and review the fund's performance. Each of the Trustees oversees 170 funds.
The Trustees hold office without limit in time except that (a) any Trustee may resign; (b) any Trustee may be removed by written instrument, signed by at least two-thirds of the number of Trustees prior to such removal; (c) any Trustee who requests to be retired or who has become incapacitated by illness or injury may be retired by written instrument signed by a majority of the other Trustees; and (d) any Trustee may be removed at any special meeting of shareholders by a two-thirds vote of the outstanding voting securities of the trust. Each Trustee who is not an interested person (as defined in the 1940 Act) of the trust and the fund is referred to herein as an Independent Trustee. Each Independent Trustee shall retire not later than the last day of the calendar year in which his or her 75th birthday occurs. The Independent Trustees may waive this mandatory retirement age policy with respect to individual Trustees. Officers and Advisory Board Members hold office without limit in time, except that any officer or Advisory Board Member may resign or may be removed by a vote of a majority of the Trustees at any regular meeting or any special meeting of the Trustees. Except as indicated, each individual has held the office shown or other offices in the same company for the past five years.
The fund’s Statement of Additional Information (SAI) includes more information about the Trustees. To request a free copy, call Fidelity at 1-800-544-8544.
Experience, Skills, Attributes, and Qualifications of the Trustees. The Governance and Nominating Committee has adopted a statement of policy that describes the experience, qualifications, attributes, and skills that are necessary and desirable for potential Independent Trustee candidates (Statement of Policy). The Board believes that each Trustee satisfied at the time he or she was initially elected or appointed a Trustee, and continues to satisfy, the standards contemplated by the Statement of Policy. The Governance and Nominating Committee also engages professional search firms to help identify potential Independent Trustee candidates who have the experience, qualifications, attributes, and skills consistent with the Statement of Policy. From time to time, additional criteria based on the composition and skills of the current Independent Trustees, as well as experience or skills that may be appropriate in light of future changes to board composition, business conditions, and regulatory or other developments, have also been considered by the professional search firms and the Governance and Nominating Committee. In addition, the Board takes into account the Trustees' commitment and participation in Board and committee meetings, as well as their leadership of standing and ad hoc committees throughout their tenure.
In determining that a particular Trustee was and continues to be qualified to serve as a Trustee, the Board has considered a variety of criteria, none of which, in isolation, was controlling. The Board believes that, collectively, the Trustees have balanced and diverse experience, qualifications, attributes, and skills, which allow the Board to operate effectively in governing the fund and protecting the interests of shareholders. Information about the specific experience, skills, attributes, and qualifications of each Trustee, which in each case led to the Board's conclusion that the Trustee should serve (or continue to serve) as a trustee of the fund, is provided below.
Board Structure and Oversight Function. James C. Curvey is an interested person and currently serves as Chairman. The Trustees have determined that an interested Chairman is appropriate and benefits shareholders because an interested Chairman has a personal and professional stake in the quality and continuity of services provided to the fund. Independent Trustees exercise their informed business judgment to appoint an individual of their choosing to serve as Chairman, regardless of whether the Trustee happens to be independent or a member of management. The Independent Trustees have determined that they can act independently and effectively without having an Independent Trustee serve as Chairman and that a key structural component for assuring that they are in a position to do so is for the Independent Trustees to constitute a substantial majority for the Board. The Independent Trustees also regularly meet in executive session. Ned C. Lautenbach serves as Chairman of the Independent Trustees and as such (i) acts as a liaison between the Independent Trustees and management with respect to matters important to the Independent Trustees and (ii) with management prepares agendas for Board meetings.
Fidelity® funds are overseen by different Boards of Trustees. The fund's Board oversees Fidelity's high income and certain equity funds, and other Boards oversee Fidelity's investment-grade bond, money market, asset allocation, and sector funds. The asset allocation funds may invest in Fidelity® funds overseen by the fund's Board. The use of separate Boards, each with its own committee structure, allows the Trustees of each group of Fidelity® funds to focus on the unique issues of the funds they oversee, including common research, investment, and operational issues. On occasion, the separate Boards establish joint committees to address issues of overlapping consequences for the Fidelity® funds overseen by each Board.
The Trustees operate using a system of committees to facilitate the timely and efficient consideration of all matters of importance to the Trustees, the fund, and fund shareholders and to facilitate compliance with legal and regulatory requirements and oversight of the fund's activities and associated risks. The Board, acting through its committees, has charged FMR and its affiliates with (i) identifying events or circumstances the occurrence of which could have demonstrably adverse effects on the fund's business and/or reputation; (ii) implementing processes and controls to lessen the possibility that such events or circumstances occur or to mitigate the effects of such events or circumstances if they do occur; and (iii) creating and maintaining a system designed to evaluate continuously business and market conditions in order to facilitate the identification and implementation processes described in (i) and (ii) above. Because the day-to-day operations and activities of the fund are carried out by or through FMR, its affiliates, and other service providers, the fund's exposure to risks is mitigated but not eliminated by the processes overseen by the Trustees. While each of the Board's committees has responsibility for overseeing different aspects of the fund's activities, oversight is exercised primarily through the Operations, Audit, and Compliance Committees. In addition, the Independent Trustees have worked with FMR to enhance the Board's oversight of investment and financial risks, legal and regulatory risks, technology risks, and operational risks, including the development of additional risk reporting to the Board. For example, a working group comprised of Independent Trustees and FMR has worked and continues to work to review the Fidelity® funds' valuation-related activities, reporting and risk management. Appropriate personnel, including but not limited to the fund's Chief Compliance Officer (CCO), FMR's internal auditor, the independent accountants, the fund's Treasurer and portfolio management personnel, make periodic reports to the Board's committees, as appropriate, including an annual review of Fidelity's risk management program for the Fidelity® funds. The responsibilities of each standing committee, including their oversight responsibilities, are described further under "Standing Committees of the Trustees."
Interested Trustees*:
Correspondence intended for a Trustee who is an interested person may be sent to Fidelity Investments, 245 Summer Street, Boston, Massachusetts 02210.
Name, Year of Birth; Principal Occupations and Other Relevant Experience+
James C. Curvey (1935)
Year of Election or Appointment: 2007
Trustee
Chairman of the Board of Trustees
Mr. Curvey also serves as Trustee of other Fidelity® funds. Mr. Curvey is a Director of Fidelity Research & Analysis Co. (investment adviser firm, 2009-present), and Vice Chairman (2007-present) and Director of FMR LLC (diversified financial services company). In addition, Mr. Curvey serves as an Overseer for the Boston Symphony Orchestra and a member of the board of Artis-Naples, Naples, Florida, and as a Trustee for Brewster Academy, Wolfeboro, New Hampshire. Previously, Mr. Curvey served as a Director of Fidelity Investments Money Management, Inc. (investment adviser firm, 2009-2014) and a Director of FMR and FMR Co., Inc. (investment adviser firms, 2007-2014).
Charles S. Morrison (1960)
Year of Election or Appointment: 2014
Trustee
Mr. Morrison also serves as Trustee of other funds. He serves as a Director of Fidelity Investments Money Management, Inc. (FIMM) (investment adviser firm, 2014-present), Director of Fidelity SelectCo, LLC (investment adviser firm, 2014-present), President, Asset Management (2014-present), and is an employee of Fidelity Investments. Previously, Mr. Morrison served as Vice President of Fidelity's Fixed Income and Asset Allocation Funds (2012-2014), President, Fixed Income (2011-2014), Vice President of Fidelity's Money Market Funds (2005-2009), President, Money Market Group Leader of FMR (investment adviser firm, 2009), and Senior Vice President, Money Market Group of FMR (2004-2009). Mr. Morrison also served as Vice President of Fidelity's Bond Funds (2002-2005), certain Balanced Funds (2002-2005), and certain Asset Allocation Funds (2002-2007), and as Senior Vice President (2002-2005) of Fidelity's Bond Division.
* Determined to be an “Interested Trustee” by virtue of, among other things, his or her affiliation with the trust or various entities under common control with FMR.
+ The information includes the Trustee's principal occupation during the last five years and other information relating to the experience, attributes, and skills relevant to the Trustee's qualifications to serve as a Trustee, which led to the conclusion that the Trustee should serve as a Trustee for the fund.
Independent Trustees:
Correspondence intended for an Independent Trustee may be sent to Fidelity Investments, P.O. Box 55235, Boston, Massachusetts 02205-5235.
Name, Year of Birth; Principal Occupations and Other Relevant Experience+
Dennis J. Dirks (1948)
Year of Election or Appointment: 2005
Trustee
Mr. Dirks also serves as Trustee of other Fidelity® funds. Prior to his retirement in May 2003, Mr. Dirks was Chief Operating Officer and a member of the Board of The Depository Trust & Clearing Corporation (DTCC). He also served as President, Chief Operating Officer, and Board member of The Depository Trust Company (DTC) and President and Board member of the National Securities Clearing Corporation (NSCC). In addition, Mr. Dirks served as Chief Executive Officer and Board member of the Government Securities Clearing Corporation, Chief Executive Officer and Board member of the Mortgage-Backed Securities Clearing Corporation, as a Trustee and a member of the Finance Committee of Manhattan College (2005-2008), as a Trustee and a member of the Finance Committee of AHRC of Nassau County (2006-2008), and as a member of the Independent Directors Council (IDC) Governing Council (2010-2015). Mr. Dirks is a member of the Board of Directors for The Brookville Center for Children's Services, Inc. (2009-present).
Alan J. Lacy (1953)
Year of Election or Appointment: 2008
Trustee
Mr. Lacy also serves as Trustee of other Fidelity® funds. Mr. Lacy serves as Chairman (2014-present) and a member (2010-present) of the Board of Directors of Dave & Buster's Entertainment, Inc. (restaurant and entertainment complexes) and a Director of Bristol-Myers Squibb Company (global pharmaceuticals, 2008-present). He is a Trustee of the California Chapter of The Nature Conservancy (2015-present) and a Director of the Center for Advanced Study in the Behavioral Sciences at Stanford University (2015-present). In addition, Mr. Lacy served as Senior Adviser (2007-2014) of Oak Hill Capital Partners, L.P. (private equity) and also served as Chief Executive Officer (2005) and Vice Chairman (2005-2006) of Sears Holdings Corporation (retail) and Chief Executive Officer and Chairman of the Board of Sears, Roebuck and Co. (retail, 2000-2005). Previously, Mr. Lacy served as Chairman (2008-2011) and a member (2006-2015) of the Board of Trustees of the National Parks Conservation Association and as a member of the Board of Directors for The Western Union Company (global money transfer, 2006-2011), The Hillman Companies, Inc. (hardware wholesalers, 2010-2014), and Earth Fare, Inc. (retail grocery, 2010-2014).
Ned C. Lautenbach (1944)
Year of Election or Appointment: 2000
Trustee
Chairman of the Independent Trustees
Mr. Lautenbach also serves as Trustee of other Fidelity® funds. Mr. Lautenbach currently serves as the Lead Director of the Eaton Corporation Board of Directors (diversified industrial, 1997-present). Mr. Lautenbach is Chairman of the Board of Directors of Artis-Naples in Naples, Florida (2012-present), a member of the Council on Foreign Relations (1994-present), and a member of the Board of Governors, State University System of Florida (2013-present). Previously, Mr. Lautenbach was a Partner/Advisory Partner at Clayton, Dubilier & Rice, LLC (private equity investment, 1998-2010), as well as a Director of Sony Corporation (2006-2007).
Joseph Mauriello (1944)
Year of Election or Appointment: 2008
Trustee
Mr. Mauriello also serves as Trustee of other Fidelity® funds. Prior to his retirement in January 2006, Mr. Mauriello served in numerous senior management positions including Deputy Chairman and Chief Operating Officer (2004-2005), and Vice Chairman of Financial Services (2002-2004) of KPMG LLP US (professional services, 1965-2005). Mr. Mauriello currently serves as a member of the Board of Directors of XL Group plc. (global insurance and re-insurance, 2006-present) and the Independent Directors Council (IDC) Governing Council (2015-present). Previously, Mr. Mauriello served as a Director of the Hamilton Funds of the Bank of New York (2006-2007) and of Arcadia Resources Inc. (health care services and products, 2007-2012).
Robert W. Selander (1950)
Year of Election or Appointment: 2011
Trustee
Mr. Selander also serves as Trustee of other Fidelity® funds. Mr. Selander serves as a Director of The Western Union Company (global money transfer, 2014-present) and a non-executive Chairman of Health Equity, Inc. (health savings custodian, 2015-present). Previously, Mr. Selander served as a Member of the Advisory Board of certain Fidelity® funds (2011), and Executive Vice Chairman (2010), Chief Executive Officer (2009-2010), and President and Chief Executive Officer (1997-2009) of Mastercard, Inc.
Cornelia M. Small (1944)
Year of Election or Appointment: 2005
Trustee
Ms. Small also serves as Trustee of other Fidelity® funds. Ms. Small is a member of the Board of Directors (2009-present) and Chair of the Investment Committee (2010-present) of the Teagle Foundation. Ms. Small also serves on the Investment Committee of the Berkshire Taconic Community Foundation (2008-present). Previously, Ms. Small served as Chairperson (2002-2008) and a member of the Investment Committee and Chairperson (2008-2012) and a member of the Board of Trustees of Smith College. In addition, Ms. Small served as Chief Investment Officer, Director of Global Equity Investments, and a member of the Board of Directors of Scudder, Stevens & Clark and Scudder Kemper Investments.
William S. Stavropoulos (1939)
Year of Election or Appointment: 2002
Trustee
Vice Chairman of the Independent Trustees
Mr. Stavropoulos also serves as Trustee of other Fidelity® funds. Mr. Stavropoulos serves as President and Founder of the Michigan Baseball Foundation, the Great Lakes Loons (2007-present). Mr. Stavropoulos is Chairman Emeritus of the Board of Directors of The Dow Chemical Company, where he previously served in numerous senior management positions, including President, CEO (1995-2000; 2002-2004), Chairman of the Executive Committee (2000-2006), and as a member of the Board of Directors (1990-2006). Currently, Mr. Stavropoulos is Chairman of the Board of Directors of Univar Inc. (global distributor of commodity and specialty chemicals), a Director of Teradata Corporation (data warehousing and technology solutions), and Maersk Inc. (industrial conglomerate), and a member of the Advisory Board for Metalmark Capital LLC (private equity investment, 2005-present). Mr. Stavropoulos is an operating advisor to Clayton, Dubilier & Rice, LLC (private equity investment). In addition, Mr. Stavropoulos is a member of the University of Notre Dame Advisory Council for the College of Science, a Trustee of the Rollin L. Gerstacker Foundation, and a Director of the Naples Philharmonic Center for the Arts. Previously, Mr. Stavropoulos served as a Director of Chemical Financial Corporation (bank holding company, 1993-2012) and Tyco International, Ltd. (multinational manufacturing and services, 2007-2012).
David M. Thomas (1949)
Year of Election or Appointment: 2008
Trustee
Mr. Thomas also serves as Trustee of other Fidelity® funds. Mr. Thomas serves as Non-Executive Chairman of the Board of Directors of Fortune Brands Home and Security (home and security products, 2011-present), as a member of the Board of Directors (2004-present) and Presiding Director (2013-present) of Interpublic Group of Companies, Inc. (marketing communication), and as a member of the Board of Trustees of the University of Florida (2013-present). Previously, Mr. Thomas served as Executive Chairman (2005-2006) and Chairman and Chief Executive Officer (2000-2005) of IMS Health, Inc. (pharmaceutical and healthcare information solutions), and a Director of Fortune Brands, Inc. (consumer products, 2000-2011).
+ The information includes the Trustee's principal occupation during the last five years and other information relating to the experience, attributes, and skills relevant to the Trustee's qualifications to serve as a Trustee, which led to the conclusion that the Trustee should serve as a Trustee for the fund.
Advisory Board Members and Officers:
Correspondence intended for an officer or Peter S. Lynch may be sent to Fidelity Investments, 245 Summer Street, Boston, Massachusetts 02210. Officers appear below in alphabetical order.
Name, Year of Birth; Principal Occupation
Peter S. Lynch (1944)
Year of Election or Appointment: 2003
Member of the Advisory Board
Mr. Lynch also serves as Member of the Advisory Board of other Fidelity® funds. Mr. Lynch is Vice Chairman and a Director of FMR (investment adviser firm) and FMR Co., Inc. (investment adviser firm). In addition, Mr. Lynch serves as a Trustee of Boston College and as the Chairman of the Inner-City Scholarship Fund. Previously, Mr. Lynch served on the Special Olympics International Board of Directors (1997-2006).
Marc R. Bryant (1966)
Year of Election or Appointment: 2015
Secretary and Chief Legal Officer (CLO)
Mr. Bryant also serves as Secretary and CLO of other funds. Mr. Bryant serves as CLO, Secretary, and Senior Vice President of Fidelity Management & Research Company (investment adviser firm, 2015-present) and FMR Co., Inc. (investment adviser firm, 2015-present); Secretary of Fidelity SelectCo, LLC (investment adviser firm, 2015-present) and Fidelity Investments Money Management, Inc. (investment adviser firm, 2015-present); and CLO of Fidelity Management & Research (Hong Kong) Limited and FMR Investment Management (U.K.) Limited (investment adviser firms, 2015-present) and Fidelity Management & Research (Japan) Limited (investment adviser firm, 2016-present). He is Senior Vice President and Deputy General Counsel of FMR LLC (diversified financial services company). Previously, Mr. Bryant served as Secretary and CLO of Fidelity Rutland Square Trust II (2010-2014) and Assistant Secretary of Fidelity's Fixed Income and Asset Allocation Funds (2013-2015). Prior to joining Fidelity Investments, Mr. Bryant served as a Senior Vice President and the Head of Global Retail Legal for AllianceBernstein L.P. (2006-2010), and as the General Counsel for ProFund Advisors LLC (2001-2006).
Jeffrey S. Christian (1961)
Year of Election or Appointment: 2016
Assistant Treasurer
Mr. Christian also serves as Assistant Treasurer of other funds. Mr. Christian is an employee of Fidelity Investments (2003-present).
William C. Coffey (1969)
Year of Election or Appointment: 2009
Assistant Secretary
Mr. Coffey also serves as Assistant Secretary of other funds. He is Senior Vice President and Deputy General Counsel of FMR LLC (diversified financial services company, 2010-present), and is an employee of Fidelity Investments. Previously, Mr. Coffey served as Vice President and Associate General Counsel of FMR LLC (2005-2009).
Jonathan Davis (1968)
Year of Election or Appointment: 2010
Assistant Treasurer
Mr. Davis also serves as Assistant Treasurer of other funds, and is an employee of Fidelity Investments. Previously, Mr. Davis served as Vice President and Associate General Counsel of FMR LLC (diversified financial services company, 2003-2010).
Adrien E. Deberghes (1967)
Year of Election or Appointment: 2016
Assistant Treasurer
Mr. Deberghes also serves as an officer of other funds. He serves as Executive Vice President of Fidelity Investments Money Management, Inc. (FIMM) (investment adviser firm, 2016-present) and is an employee of Fidelity Investments (2008-present). Prior to joining Fidelity Investments, Mr. Deberghes was Senior Vice President of Mutual Fund Administration at State Street Corporation (2007-2008), Senior Director of Mutual Fund Administration at Investors Bank & Trust (2005-2007), and Director of Finance for Dunkin' Brands (2000-2005). Previously, Mr. Deberghes served in other fund officer roles.
Stephanie J. Dorsey (1969)
Year of Election or Appointment: 2010
Assistant Treasurer
Ms. Dorsey also serves as an officer of other funds. She is an employee of Fidelity Investments (2008-present) and has served in other fund officer roles. Prior to joining Fidelity Investments, Ms. Dorsey served as Treasurer (2004-2008) of the JPMorgan Mutual Funds and Vice President (2004-2008) of JPMorgan Chase Bank.
Howard J. Galligan III (1966)
Year of Election or Appointment: 2014
Chief Financial Officer
Mr. Galligan also serves as Chief Financial Officer of other funds. Mr. Galligan serves as President of Fidelity Pricing and Cash Management Services (FPCMS) (2014-present) and as a Director of Strategic Advisers, Inc. (investment adviser firm, 2008-present). Previously, Mr. Galligan served as Chief Administrative Officer of Asset Management (2011-2014) and Chief Operating Officer and Senior Vice President of Investment Support for Strategic Advisers, Inc. (2003-2011).
Scott C. Goebel (1968)
Year of Election or Appointment: 2015
Vice President
Mr. Goebel serves as Vice President of other funds and is an employee of Fidelity Investments (2001-present). Mr. Goebel serves as Senior Vice President of Fidelity Management & Research Company (FMR) (investment adviser firm, 2016-present). Previously, Mr. Goebel served as Secretary of Fidelity SelectCo, LLC (investment adviser firm, 2013-2015), Fidelity Investments Money Management, Inc. (FIMM) (investment adviser firm, 2010-2015), and Fidelity Research and Analysis Company (FRAC) (investment adviser firm, 2010-2015); General Counsel, Secretary, and Senior Vice President of FMR (investment adviser firm, 2008-2015) and FMR Co., Inc. (investment adviser firm, 2008-2015); Assistant Secretary of Fidelity Management & Research (Japan) Limited (investment adviser firm, 2008-2015) and Fidelity Management & Research (U.K.) Inc. (investment adviser firm, 2008-2015); Chief Legal Officer (CLO) of Fidelity Management & Research (Hong Kong) Limited (investment adviser firm, 2008-2015); Secretary and CLO of certain Fidelity® funds (2008-2015); Assistant Secretary of FIMM (2008-2010), FRAC (2008-2010), and certain funds (2007-2008); and as Vice President and Secretary of Fidelity Distributors Corporation (FDC) (2005-2007).
Thomas C. Hense (1964)
Year of Election or Appointment: 2008, 2010, or 2015
Vice President
Mr. Hense serves as Vice President of Fidelity Advisor® Multi-Asset Income Fund (2015) and other funds (High Income (2008), Small Cap (2008), and Value (2010) funds), and is an employee of Fidelity Investments (1993-present). Previously, Mr. Hense served as a portfolio manager for Fidelity's Institutional Money Management Group (Pyramis) (2003-2008).
Brian B. Hogan (1964)
Year of Election or Appointment: 2009
Vice President
Mr. Hogan also serves as Trustee or Vice President of other funds. Mr. Hogan serves as a Director of FMR Investment Management (U.K.) Limited (investment adviser firm, 2015-present) and Fidelity SelectCo, LLC (investment adviser firm, 2014-present) and President of the Equity Division of FMR (investment adviser firm, 2009-present). Previously, Mr. Hogan served as Senior Vice President, Equity Research of FMR (2006-2009) and as a portfolio manager. Mr. Brian B. Hogan is not related to Mr. Colm A. Hogan.
Colm A. Hogan (1973)
Year of Election or Appointment: 2016
Deputy Treasurer
Mr. Hogan also serves as an officer of other funds. Mr. Hogan is an employee of Fidelity Investments (2005-present). Mr. Colm A. Hogan is not related to Mr. Brian B. Hogan.
Chris Maher (1972)
Year of Election or Appointment: 2013
Assistant Treasurer
Mr. Maher serves as Assistant Treasurer of other funds. Mr. Maher is Vice President of Valuation Oversight and is an employee of Fidelity Investments. Previously, Mr. Maher served as Vice President of Asset Management Compliance (2013), Vice President of the Program Management Group of FMR (investment adviser firm, 2010-2013), and Vice President of Valuation Oversight (2008-2010).
John F. Papandrea (1972)
Year of Election or Appointment: 2016
Anti-Money Laundering (AML) Officer
Mr. Papandrea also serves as AML Officer of other funds. Mr. Papandrea is Vice President of FMR LLC (diversified financial services company, 2008-present) and is an employee of Fidelity Investments (2005-present).
Kenneth B. Robins (1969)
Year of Election or Appointment: 2016
Chief Compliance Officer
Mr. Robins also serves as an officer of other funds. Mr. Robins serves as Compliance Officer of Fidelity Management & Research Company and FMR Co., Inc. (investment adviser firms, 2016-present) and is an employee of Fidelity Investments (2004-present). Previously, Mr. Robins served as Executive Vice President of Fidelity Investments Money Management, Inc. (investment adviser firm, 2013-2016) and served in other fund officer roles.
Stacie M. Smith (1974)
Year of Election or Appointment: 2016
President and Treasurer
Ms. Smith also serves as an officer of other funds. She is an employee of Fidelity Investments (2009-present) and has served in other fund officer roles. Prior to joining Fidelity Investments, Ms. Smith served as Senior Audit Manager of Ernst & Young LLP (1996-2009). Previously, Ms. Smith served as Deputy Treasurer of certain Fidelity® funds (2013-2016).
Renee Stagnone (1975)
Year of Election or Appointment: 2016
Assistant Treasurer
Ms. Stagnone also serves as an officer of other funds. Ms. Stagnone is an employee of Fidelity Investments (1997-present). Previously, Ms. Stagnone served as Deputy Treasurer of certain Fidelity® funds (2013-2016).
Shareholder Expense Example
As a shareholder of the Fund, you incur two types of costs: (1) transaction costs, and (2) ongoing costs, including management fees and other Fund expenses. This Example is intended to help you understand your ongoing costs (in dollars) of investing in the Fund and to compare these costs with the ongoing costs of investing in other mutual funds.
The Example is based on an investment of $1,000 invested at the beginning of the period and held for the entire period (February 1, 2016 to July 31, 2016).
Actual Expenses
The first line of the accompanying table for each class of the Fund provides information about actual account values and actual expenses. You may use the information in this line, together with the amount you invested, to estimate the expenses that you paid over the period. Simply divide your account value by $1,000.00 (for example, an $8,600 account value divided by $1,000.00 = 8.6), then multiply the result by the number in the first line for a class of the Fund under the heading entitled "Expenses Paid During Period" to estimate the expenses you paid on your account during this period. A small balance maintenance fee of $12.00 that is charged once a year may apply for certain accounts with a value of less than $2,000. This fee is not included in the table below. If it was, the estimate of expenses you paid during the period would be higher, and your ending account value lower, by this amount. In addition, the Fund, as a shareholder in the underlying Fidelity Central Funds, will indirectly bear its pro-rata share of the fees and expenses incurred by the underlying Fidelity Central Funds. These fees and expenses are not included in the Fund's annualized expense ratio used to calculate the expense estimate in the table below.
Hypothetical Example for Comparison Purposes
The second line of the accompanying table for each class of the Fund provides information about hypothetical account values and hypothetical expenses based on a Class' actual expense ratio and an assumed rate of return of 5% per year before expenses, which is not the Class' actual return. The hypothetical account values and expenses may not be used to estimate the actual ending account balance or expenses you paid for the period. You may use this information to compare the ongoing costs of investing in the Fund and other funds. To do so, compare this 5% hypothetical example with the 5% hypothetical examples that appear in the shareholder reports of the other funds. A small balance maintenance fee of $12.00 that is charged once a year may apply for certain accounts with a value of less than $2,000. This fee is not included in the table below. If it was, the estimate of expenses you paid during the period would be higher, and your ending account value lower, by this amount. In addition, the Fund, as a shareholder in the underlying Fidelity Central Funds, will indirectly bear its pro-rata share of the fees and expenses incurred by the underlying Fidelity Central Funds. These fees and expenses are not included in the Fund's annualized expense ratio used to calculate the expense estimate in the table below.
Please note that the expenses shown in the table are meant to highlight your ongoing costs only and do not reflect any transaction costs. Therefore, the second line of the table is useful in comparing ongoing costs only, and will not help you determine the relative total costs of owning different funds.
| | Annualized Expense Ratio-A | Beginning
Account Value
February 1, 2016 | Ending
Account Value
July 31, 2016 | Expenses Paid
During Period-B
February 1, 2016
to July 31, 2016 |
| Growth and Income | .64% | | | |
| Actual | | $1,000.00 | $1,138.70 | $3.40 |
| Hypothetical-C | | $1,000.00 | $1,021.68 | $3.22 |
| Class K | .52% | | | |
| Actual | | $1,000.00 | $1,139.50 | $2.77 |
| Hypothetical-C | | $1,000.00 | $1,022.28 | $2.61 |
A Annualized expense ratio reflects expenses net of applicable fee waivers.
B Expenses are equal to each Class' annualized expense ratio, multiplied by the average account value over the period, multiplied by 182/366 (to reflect the one-half year period).
C 5% return per year before expenses
Distributions (Unaudited)
Growth and Income designates 97%, 95%, 100%, and 100%, and Class K designates 91%, 90%, 100%, and 100%; of the dividends distributed in October 2015, December 2015, April 2016 and July 2016, respectively during the fiscal year as qualifying for the dividends–received deduction for corporate shareholders.
Growth and Income and Class K designate 100% of each dividend distributed in October 2015, December 2015, April 2016 and July 2016, respectively during the fiscal year as amounts which may be taken into account as a dividend for purposes of the maximum rate under section 1(h)(11) of the Internal Revenue Code.
The fund will notify shareholders in January 2017 of amounts for use in preparing 2016 income tax returns.
Board Approval of Investment Advisory Contracts and Management Fees
Fidelity Growth & Income Portfolio
Each year, the Board of Trustees, including the Independent Trustees (together, the Board), votes on the renewal of the management contract with Fidelity Management & Research Company (FMR) and the sub-advisory agreements (together, the Advisory Contracts) for the fund. The Board, assisted by the advice of fund counsel and Independent Trustees' counsel, requests and considers a broad range of information relevant to the renewal of the Advisory Contracts throughout the year.
The Board meets regularly and, at each of its meetings, covers an extensive agenda of topics and materials and considers factors that are relevant to its annual consideration of the renewal of the fund's Advisory Contracts, including the services and support provided to the fund and its shareholders. The Board has established various standing committees (Committees), each composed of and chaired by Independent Trustees with varying backgrounds, to which the Board has assigned specific subject matter responsibilities in order to enhance effective decision-making by the Board. The Board, acting directly and through its Committees, requests and receives information concerning the annual consideration of the renewal of the fund's Advisory Contracts. The Board also meets as needed to consider matters specifically related to the Board's annual consideration of the renewal of the Advisory Contracts. Members of the Board may also meet with trustees of other Fidelity funds through ad hoc joint committees to discuss certain matters relevant to all of the Fidelity funds.
At its July 2016 meeting, the Board unanimously determined to renew the fund's Advisory Contracts. In reaching its determination, the Board considered all factors it believed relevant, including (i) the nature, extent, and quality of the services to be provided to the fund and its shareholders (including the investment performance of the fund); (ii) the competitiveness of the fund's management fee and total expense ratio relative to peer funds; (iii) the total costs of the services to be provided by and the profits to be realized by Fidelity from its relationships with the fund; and (iv) the extent to which, if any, economies of scale exist and would be realized as the fund grows, and whether any economies of scale are appropriately shared with fund shareholders.
In considering whether to renew the Advisory Contracts for the fund, the Board reached a determination, with the assistance of fund counsel and Independent Trustees' counsel and through the exercise of its business judgment, that the renewal of the Advisory Contracts was in the best interests of the fund and its shareholders and that the compensation payable under the Advisory Contracts was fair and reasonable. The Board's decision to renew the Advisory Contracts was not based on any single factor, but rather was based on a comprehensive consideration of all the information provided to the Board at its meetings throughout the year. The Board, in reaching its determination to renew the Advisory Contracts, was aware that shareholders of the fund have a broad range of investment choices available to them, including a wide choice among funds offered by Fidelity's competitors, and that the fund's shareholders, who have the opportunity to review and weigh the disclosure provided by the fund in its prospectus and other public disclosures, have chosen to invest in this fund, which is part of the Fidelity family of funds.
Nature, Extent, and Quality of Services Provided. The Board considered Fidelity's staffing as it relates to the fund, including the backgrounds of investment personnel of Fidelity, and also considered the fund's investment objective, strategies, and related investment philosophy. The Independent Trustees also had discussions with senior management of Fidelity's investment operations and investment groups. The Board considered the structure of the investment personnel compensation program and whether this structure provides appropriate incentives to act in the best interests of the fund. Additionally, the Board considered the portfolio managers' investments, if any, in the funds that they manage.
Resources Dedicated to Investment Management and Support Services. The Board and the Fund Oversight and Research Committees reviewed the general qualifications and capabilities of Fidelity's investment staff, including its size, education, experience, and resources, as well as Fidelity's approach to recruiting, training, managing, and compensating investment personnel. The Board noted that Fidelity has continued to increase the resources devoted to non-U.S. offices, including expansion of Fidelity's global investment organization. The Board also noted that Fidelity's analysts have extensive resources, tools and capabilities that allow them to conduct sophisticated quantitative and fundamental analysis, as well as credit analysis of issuers, counterparties and guarantors. Further, the Board considered that Fidelity's investment professionals have sufficient access to global information and data so as to provide competitive investment results over time, and that those professionals also have access to sophisticated tools that permit them to assess portfolio construction and risk and performance attribution characteristics continuously, as well as to transmit new information and research conclusions rapidly around the world. Additionally, in its deliberations, the Board considered Fidelity's trading, risk management, compliance, and technology and operations capabilities and resources, which are integral parts of the investment management process.
Shareholder and Administrative Services. The Board considered (i) the nature, extent, quality, and cost of advisory, administrative, and shareholder services performed by FMR, the sub-advisers (together with FMR, the Investment Advisers), and their affiliates under the Advisory Contracts and under separate agreements covering transfer agency, pricing and bookkeeping, and securities lending services for the fund; (ii) the nature and extent of the supervision of third party service providers, principally custodians, subcustodians, and pricing vendors; and (iii) the resources devoted to, and the record of compliance with, the fund's compliance policies and procedures. The Board also reviewed the allocation of fund brokerage, including allocations to brokers affiliated with the Investment Advisers, the use of brokerage commissions to pay fund expenses, and the use of "soft" commission dollars to pay for research services.
The Board noted that the growth of fund assets over time across the complex allows Fidelity to reinvest in the development of services designed to enhance the value or convenience of the Fidelity funds as investment vehicles. These services include 24-hour access to account information and market information through telephone representatives and over the Internet, investor education materials and asset allocation tools, and the expanded availability of Fidelity Investor Centers.
In 2014, the Board formed an ad hoc Committee on Transfer Agency Fees to review the variety of transfer agency fee structures throughout the industry and Fidelity's competitive positioning with respect to industry participants.
Investment in a Large Fund Family. The Board considered the benefits to shareholders of investing in a Fidelity fund, including the benefits of investing in a fund that is part of a large family of funds offering a variety of investment disciplines and providing a large variety of mutual fund investor services. The Board noted that Fidelity had taken, or had made recommendations that resulted in the Fidelity funds taking, a number of actions over the previous year that benefited particular funds, including: (i) continuing to dedicate additional resources to investment research and to the support of the senior management team that oversees asset management; (ii) continuing efforts to enhance Fidelity's global research capabilities; (iii) launching new funds and making other enhancements to meet client needs; (iv) broadening eligibility requirements for certain lower-priced share classes of, and streamlining the fee structure for, certain existing equity index funds; (v) lowering expense caps for certain existing funds and classes to reduce expenses paid by shareholders; (vi) eliminating redemption fees for certain variable insurance product funds and classes; (vii) continuing to launch dedicated lower cost underlying funds to meet portfolio construction needs related to expanding underlying fund options for Fidelity funds of funds, specifically for the Freedom Fund product lines; (viii) launching a lower cost share class for use by the Freedom Index Fund product line; (ix) rationalizing product lines and gaining increased efficiencies through fund mergers and share class consolidations; (x) continuing to develop, acquire and implement systems and technology to improve services to the funds and shareholders, strengthen information security, and increase efficiency; (xi) implementing investment enhancements to further strengthen Fidelity's target date product line to increase investors' probability of success in achieving their goals; (xii) accelerating the conversion of all remaining Class B shares to Class A shares, which have a lower expense structure; and (xiii) implementing changes to Fidelity's money market fund product line in response to recent regulatory reforms.
Investment Performance. The Board considered whether the fund has operated in accordance with its investment objective, as well as its record of compliance with its investment restrictions and its performance history.
The Board took into account discussions with representatives of the Investment Advisers about fund investment performance that occur at Board meetings throughout the year. In this regard the Board noted that as part of regularly scheduled fund reviews and other reports to the Board on fund performance, the Board considers annualized return information for the fund, for different time periods, measured against a securities market index ("benchmark index") and a peer group of funds with similar objectives ("peer group"), if any. In its evaluation of fund investment performance, the Board gave particular attention to information indicating changes in performance of certain Fidelity funds for specific time periods and discussed with the Investment Advisers the reasons for any overperformance or underperformance.
In addition to reviewing absolute and relative fund performance, the Independent Trustees periodically consider the appropriateness of fund performance metrics in evaluating the results achieved. In general, the Independent Trustees believe that fund performance should be evaluated based on net performance (after fees and expenses) of both the highest performing and lowest performing fund share classes, where applicable, compared to appropriate benchmark indices, over appropriate time periods that may include full market cycles, and compared to peer groups, as applicable, over the same periods, taking into account relevant factors including the following: general market conditions; issuer-specific information; and fund cash flows and other factors.
The Independent Trustees recognize that shareholders evaluate performance on a net basis over their own holding periods, for which one-, three-, and five-year periods are often used as a proxy. For this reason, the performance information reviewed by the Board also included net cumulative calendar year total return information for the fund and an appropriate benchmark index and peer group for the most recent one-, three-, and five-year periods, as shown below. Returns are shown compared to the 25th percentile (top of box, 75% beaten) and 75th percentile (bottom of box, 25% beaten) of the peer universe.
Fidelity Growth & Income Portfolio
The Board has discussed the fund's underperformance with FMR and has engaged with FMR to consider what steps might be taken to remediate the fund's underperformance.
Based on its review, the Board concluded that the nature, extent, and quality of services provided to the fund under the Advisory Contracts should continue to benefit the shareholders of the fund.
Competitiveness of Management Fee and Total Expense Ratio. The Board considered the fund's management fee and total expense ratio compared to "mapped groups" of competitive funds and classes created for the purpose of facilitating the Trustees' competitive analysis of management fees and total expenses. Fidelity creates "mapped groups" by combining similar Broadridge investment objective categories that have comparable investment mandates. Combining Broadridge investment objective categories aids the Board's management fee and total expense ratio comparisons by broadening the competitive group used for comparison.
Management Fee. The Board considered two proprietary management fee comparisons for the 12-month periods shown in basis points (BP) in the chart below. The group of Broadridge funds used by the Board for management fee comparisons is referred to below as the "Total Mapped Group." The Total Mapped Group comparison focuses on a fund's standing in terms of gross management fees before expense reimbursements or caps relative to the total universe of funds with comparable investment mandates, regardless of whether their management fee structures also are comparable. Funds with comparable investment mandates offer exposure to similar types of securities. Funds with comparable management fee structures have similar management fee contractual arrangements (
e.g., flat rate charged for advisory services, all-inclusive fee rate,
etc.). "TMG %" represents the percentage of funds in the Total Mapped Group that had management fees that were lower than the fund's. For example, a hypothetical TMG % of 20% would mean that 80% of the funds in the Total Mapped Group had higher, and 20% had lower, management fees than the fund. The fund's actual TMG %s and the number of funds in the Total Mapped Group are in the chart below. The "Asset-Size Peer Group" (ASPG) comparison focuses on a fund's standing relative to a subset of non-Fidelity funds within the Total Mapped Group that are similar in size and management fee structure. For example, if a fund is in the first quartile of the ASPG, the fund's management fee ranks in the least expensive or lowest 25% of funds in the ASPG. The ASPG represents at least 15% of the funds in the Total Mapped Group with comparable asset size and management fee structures, subject to a minimum of 50 funds (or all funds in the Total Mapped Group if fewer than 50). Additional information, such as the ASPG quartile in which the fund's management fee rate ranked, is also included in the chart and considered by the Board.
Fidelity Growth & Income Portfolio
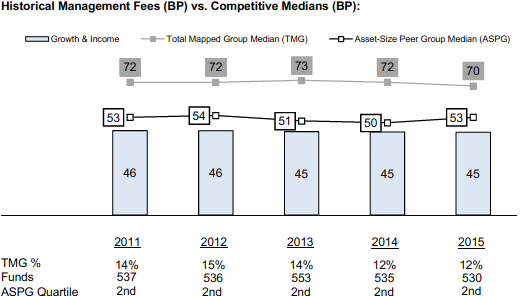
The Board noted that the fund's management fee rate ranked below the median of its Total Mapped Group and below the median of its ASPG for 2015.
The Board noted that, in 2014, the ad hoc Committee on Group Fee was formed by it and the boards of other Fidelity funds to conduct an in-depth review of the "group fee" component of the management fee of funds with such management fee structures. The Committee's focus included the mechanics of the group fee, the competitive landscape of group fee structures, Fidelity funds with no group fee component and investment products not included in group fee assets. The Board also considered that, for funds subject to the group fee, FMR agreed to voluntarily waive fees over a specified period of time in amounts designed to account for assets converted from certain funds to certain collective investment trusts.
The Board also noted that, in 2013, the ad hoc Committee on Management Fees was formed to conduct an in-depth review of the management fee rates of Fidelity's active equity mutual funds. The Committee focused on the following areas: (i) standard fee structures; (ii) research consumption and trading evolution; (iii) management fee competitiveness/profitability by category; and (iv) factors that drive institutional pricing.
Based on its review, the Board concluded that the fund's management fee is fair and reasonable in light of the services that the fund receives and the other factors considered.
Total Expense Ratio. In its review of each class's total expense ratio, the Board considered the fund's management fee rate as well as other fund or class expenses, as applicable, such as transfer agent fees, pricing and bookkeeping fees, and custodial, legal, and audit fees. The Board also noted that Fidelity may agree to waive fees and expenses from time to time, and the extent to which, if any, it has done so for the fund. As part of its review, the Board also considered the current and historical total expense ratios of each class of the fund compared to competitive fund median expenses. Each class of the fund is compared to those funds and classes in the Total Mapped Group (used by the Board for management fee comparisons) that have a similar sales load structure.
The Board noted that the total expense ratio of each class ranked below the competitive median for 2015.
Fees Charged to Other Fidelity Clients. The Board also considered Fidelity fee structures and other information with respect to clients of Fidelity, such as other funds advised or subadvised by Fidelity, pension plan clients, and other institutional clients with similar mandates. The Board noted the findings of the 2013 ad hoc joint committee (created with the board of other Fidelity funds), which reviewed and compared Fidelity's institutional investment advisory business with its business of providing services to the Fidelity funds, including the differences in services provided, fees charged, and costs incurred, as well as competition in their respective marketplaces.
Based on its review of total expense ratios and fees charged to other Fidelity clients, the Board concluded that the total expense ratio of each class of the fund was reasonable in light of the services that the fund and its shareholders receive and the other factors considered.
Costs of the Services and Profitability. The Board considered the revenues earned and the expenses incurred by Fidelity in conducting the business of developing, marketing, distributing, managing, administering and servicing the fund and servicing the fund's shareholders. The Board also considered the level of Fidelity's profits in respect of all the Fidelity funds.
On an annual basis, Fidelity presents to the Board information about the profitability of its relationship with the fund. Fidelity calculates profitability information for each fund, as well as aggregate profitability information for groups of Fidelity funds and all Fidelity funds, using a series of detailed revenue and cost allocation methodologies which originate with the books and records of Fidelity on which Fidelity's audited financial statements are based. The Audit Committee of the Board reviews any significant changes from the prior year's methodologies.
PricewaterhouseCoopers LLP (PwC), independent registered public accounting firm and auditor to Fidelity and certain Fidelity funds, has been engaged annually by the Board as part of the Board's assessment of Fidelity's profitability analysis. PwC's engagement includes the review and assessment of the methodologies used by Fidelity in determining the revenues and expenses attributable to Fidelity's mutual fund business, and completion of agreed-upon procedures in respect of the mathematical accuracy of the fund profitability information and its conformity to established allocation methodologies. After considering PwC's reports issued under the engagement and information provided by Fidelity, the Board concluded that while other allocation methods may also be reasonable, Fidelity's profitability methodologies are reasonable in all material respects.
The Board also reviewed Fidelity's non-fund businesses and fall-out benefits related to the mutual fund business as well as cases where Fidelity's affiliates may benefit from or be related to the fund's business.
The Board considered the costs of the services provided by and the profits realized by Fidelity in connection with the operation of the fund and was satisfied that the profitability was not excessive.
Economies of Scale. The Board considered whether there have been economies of scale in respect of the management of the Fidelity funds, whether the Fidelity funds (including the fund) have appropriately benefited from any such economies of scale, and whether there is potential for realization of any further economies of scale. The Board considered the extent to which the fund will benefit from economies of scale as assets grow through increased services to the fund, through waivers or reimbursements, or through fee or expense ratio reductions. The Board also noted that in 2013, it and the boards of other Fidelity funds created an ad hoc committee (the Economies of Scale Committee) to analyze whether Fidelity attains economies of scale in respect of the management and servicing of the Fidelity funds, whether the Fidelity funds have appropriately benefited from such economies of scale, and whether there is potential for realization of any further economies of scale.
The Board recognized that the fund's management contract incorporates a "group fee" structure, which provides for lower group fee rates as total group assets increase, and for higher group fee rates as total group assets decrease (with "group assets" defined to include fund assets under FMR's management plus the assets of sector funds previously under FMR's management). FMR calculates the group fee rates based on a tiered asset "breakpoint" schedule that varies based on asset class. The Board considered that the group fee is designed to deliver the benefits of economies of scale to fund shareholders when total Fidelity fund assets increase, even if assets of any particular fund are unchanged or have declined, because some portion of Fidelity's costs are attributable to services provided to all Fidelity funds, and all funds benefit if those costs can be allocated among more assets. The Board concluded that, given the group fee structure, fund shareholders will benefit from lower management fees as group assets increase at the fund complex level, regardless of whether Fidelity achieves any such economies of scale.
The Board concluded, taking into account the analysis of the Economies of Scale Committee, that economies of scale, if any, are being appropriately shared between fund shareholders and Fidelity.
Additional Information Requested by the Board. In order to develop fully the factual basis for consideration of the Fidelity funds' Advisory Contracts, the Board requested and received additional information on certain topics, including: (i) fund performance trends and Fidelity's long-term strategies for certain funds; (ii) the various share classes employed by Fidelity and the attributes of each class, together with similar information on the distribution and servicing payments made by Fidelity or the funds to third-party participants in the distribution channels; (iii) fund profitability, and fund performance in relation to fund profitability; (iv) the methodology with respect to evaluating competitive fund data and peer group classifications and fee comparisons; (v) annual fund profitability margins; (vi) the realization of fall-out benefits in and attribution of fall-out benefits to certain Fidelity business units; (vii) the appropriateness of certain funds' benchmarks; (viii) the rationalization for certain share classes and expenses; (ix) sub-advisory fee rates for comparable investment mandates; (x) product strategy for certain underperforming funds; and (xi) Fidelity's resources and strategy for cybersecurity.
Based on its evaluation of all of the conclusions noted above, and after considering all factors it believed relevant, the Board concluded that the advisory fee structures are fair and reasonable, and that the fund's Advisory Contracts should be renewed.
Corporate Headquarters
245 Summer St.
Boston, MA 02210
www.fidelity.com
GAI-ANN-0916
1.536189.119
Fidelity® Small Cap Value Fund
Annual Report July 31, 2016 |
|
Contents
To view a fund's proxy voting guidelines and proxy voting record for the 12-month period ended June 30, visit http://www.fidelity.com/proxyvotingresults or visit the Securities and Exchange Commission's (SEC) web site at http://www.sec.gov.
You may also call 1-800-544-8544 to request a free copy of the proxy voting guidelines.
Standard & Poor's, S&P and S&P 500 are registered service marks of The McGraw-Hill Companies, Inc. and have been licensed for use by Fidelity Distributors Corporation.
Other third-party marks appearing herein are the property of their respective owners.
All other marks appearing herein are registered or unregistered trademarks or service marks of FMR LLC or an affiliated company. © 2016 FMR LLC. All rights reserved.
This report and the financial statements contained herein are submitted for the general information of the shareholders of the Fund. This report is not authorized for distribution to prospective investors in the Fund unless preceded or accompanied by an effective prospectus.
A fund files its complete schedule of portfolio holdings with the SEC for the first and third quarters of each fiscal year on Form N-Q. Forms N-Q are available on the SEC’s web site at http://www.sec.gov. A fund's Forms N-Q may be reviewed and copied at the SEC’s Public Reference Room in Washington, DC. Information regarding the operation of the SEC's Public Reference Room may be obtained by calling 1-800-SEC-0330.
For a complete list of a fund's portfolio holdings, view the most recent holdings listing, semiannual report, or annual report on Fidelity's web site at http://www.fidelity.com, http://www.institutional.fidelity.com, or http://www.401k.com, as applicable.
NOT FDIC INSURED •MAY LOSE VALUE •NO BANK GUARANTEE
Neither the Fund nor Fidelity Distributors Corporation is a bank.
Performance: The Bottom Line
Average annual total return reflects the change in the value of an investment, assuming reinvestment of distributions from dividend income and capital gains (the profits earned upon the sale of securities that have grown in value, if any) and assuming a constant rate of performance each year. The hypothetical investment and the average annual total returns do not reflect the deduction of taxes that a shareholder would pay on fund distributions or the redemption of fund shares. During periods of reimbursement by Fidelity, a fund’s total return will be greater than it would be had the reimbursement not occurred. How a fund did yesterday is no guarantee of how it will do tomorrow.
Average Annual Total Returns
| For the periods ended July 31, 2016 | Past 1 year | Past 5 years | Past 10 years |
| Fidelity® Small Cap Value Fund | 4.23% | 12.61% | 9.30% |
$10,000 Over 10 Years
Let's say hypothetically that $10,000 was invested in Fidelity® Small Cap Value Fund, a class of the fund, on July 31, 2006.
The chart shows how the value of your investment would have changed, and also shows how the Russell 2000® Value Index performed over the same period.
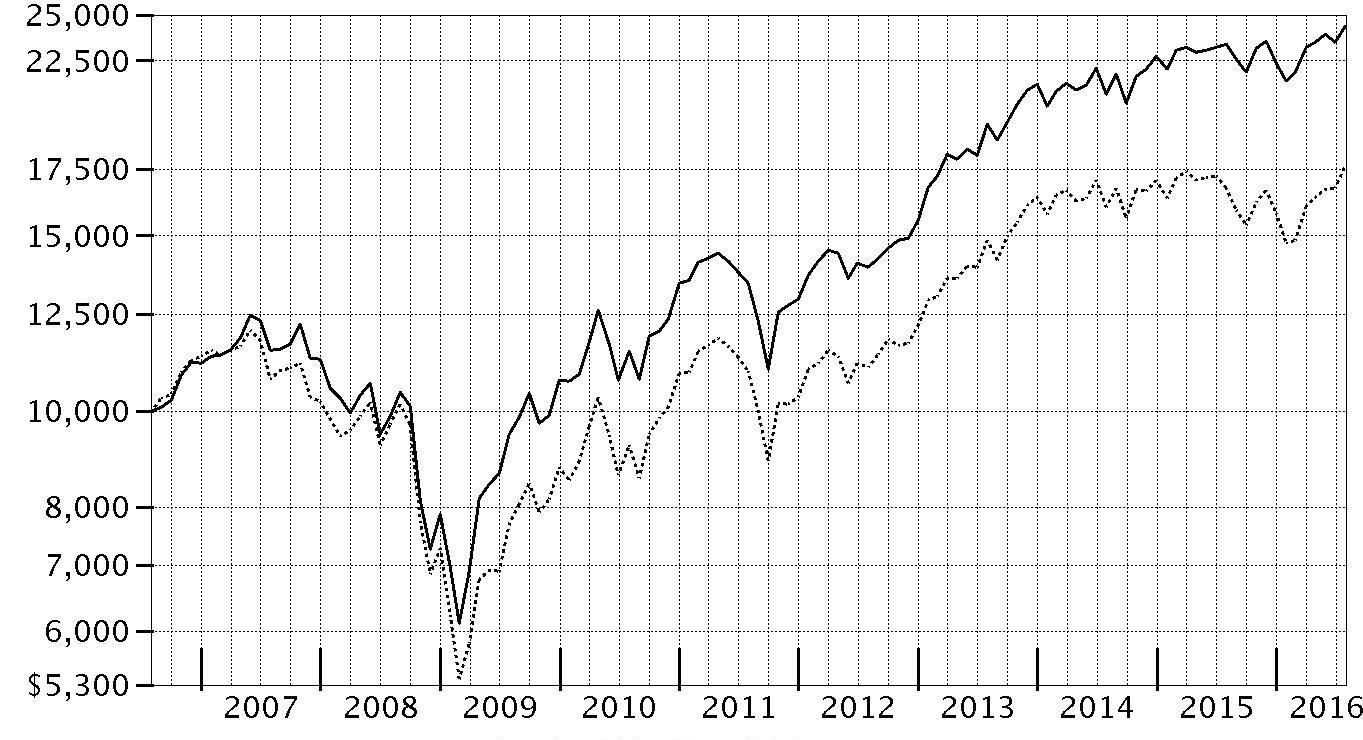
| Period Ending Values |
| $24,335 | Fidelity® Small Cap Value Fund |
| $17,661 | Russell 2000® Value Index |
Management's Discussion of Fund Performance
Market Recap: U.S. equities gained modestly for the year ending July 31, 2016, overcoming persistent concern about global economic growth, uncertainty regarding U.S. monetary policy and the U.K.’s late-June vote to leave the European Union, dubbed Brexit. The S&P 500
® index rose 5.61%, with larger-cap, value-oriented stocks and defensive sectors shining brightest. Volatility peaked in the early weeks of 2016, as continued oil-price weakness and U.S.-dollar strength pushed the S&P 500
® to its worst January since 2009. Markets then rose beginning in February amid U.S. job gains, a broad rally in energy and materials markets, global economic stimulus and perceived softening of monetary policy by the U.S. Federal Reserve. The June 23 Brexit vote surprised markets and resulted in a sharp two-day decline for stocks, followed by a rebound as investor sentiment shifted and remained positive through July 31. For the year, dividend-rich telecom services (+26%), utilities (+23%) and consumer staples (+12%) led the way amid strong investor demand for yield. Industrials (+10%) and information technology (+10%) also outperformed, as did materials (+8%), despite a weak commodities environment overall. Conversely, a strong run for real estate stocks couldn’t keep financials (-4%) from losing ground, as low interest rates continued to squeeze bank profits.
Comments from Portfolio Manager Derek Janssen: For the year, most of the fund’s share classes (excluding sales charges, if applicable) trailed the 5.59% return of the benchmark Russell 2000
® Value Index by between 1 and 2 percentage points. Stocks with bond-like characteristics, such as real estate investment trusts (REITs) and utilities, performed exceptionally well, even as many low-quality companies tied to volatile commodity markets gained ground. This created a headwind for the fund, which favors higher-quality, attractively valued firms with good long-term business models. Versus the index, stock picks in materials and industrials hurt results most. In the latter group, workplace products distributor Essendant detracted. Elsewhere, lease-to-own home furnishings provider Aaron’s was the fund's biggest relative detractor. The stock returned -35% amid weak earnings results. Waddell & Reed Financial, a struggling asset manager also hurt results. We eliminated it from the fund in March. Conversely, picks in technology and, to a lesser extent, energy, added value. Tech resellers Ingram Micro – which was not in the index and was sold from the fund early in 2016 – and Tech Data contributed. Elsewhere, Store Capital–benefited from strong business execution and the broad-based strength of REITs.
The views expressed above reflect those of the portfolio manager(s) only through the end of the period as stated on the cover of this report and do not necessarily represent the views of Fidelity or any other person in the Fidelity organization. Any such views are subject to change at any time based upon market or other conditions and Fidelity disclaims any responsibility to update such views. These views may not be relied on as investment advice and, because investment decisions for a Fidelity fund are based on numerous factors, may not be relied on as an indication of trading intent on behalf of any Fidelity fund.
Note to shareholders: On January 1, 2016, Derek Janssen became sole Portfolio Manager of the fund.
Investment Summary (Unaudited)
Top Ten Stocks as of July 31, 2016
| | % of fund's net assets | % of fund's net assets 6 months ago |
| Store Capital Corp. | 3.4 | 3.5 |
| Moog, Inc. Class A | 3.0 | 1.9 |
| Allied World Assurance Co. Holdings AG | 2.8 | 2.4 |
| Potlatch Corp. | 2.7 | 0.2 |
| Genesee & Wyoming, Inc. Class A | 2.6 | 2.4 |
| First American Financial Corp. | 2.6 | 1.8 |
| World Fuel Services Corp. | 2.5 | 2.5 |
| Universal Corp. | 2.4 | 2.7 |
| HSN, Inc. | 2.4 | 0.0 |
| ProAssurance Corp. | 2.4 | 2.8 |
| | 26.8 | |
Top Five Market Sectors as of July 31, 2016
| | % of fund's net assets | % of fund's net assets 6 months ago |
| Financials | 40.3 | 40.4 |
| Industrials | 14.2 | 13.0 |
| Consumer Discretionary | 12.3 | 12.0 |
| Information Technology | 10.4 | 11.3 |
| Health Care | 5.6 | 6.6 |
Asset Allocation (% of fund's net assets)
| As of July 31, 2016* |
| | Stocks | 99.5% |
| | Short-Term Investments and Net Other Assets (Liabilities) | 0.5% |

* Foreign investments - 12.5%
| As of January 31, 2016* |
| | Stocks | 99.4% |
| | Short-Term Investments and Net Other Assets (Liabilities) | 0.6% |

* Foreign investments - 14.2%
Percentages shown as 0.0% may reflect amounts less than 0.05%.
Investments July 31, 2016
Showing Percentage of Net Assets
| Common Stocks - 99.5% | | | |
| | | Shares | Value |
| CONSUMER DISCRETIONARY - 12.3% | | | |
| Auto Components - 1.3% | | | |
| Standard Motor Products, Inc. | | 1,000,000 | $41,940,000 |
| Household Durables - 2.1% | | | |
| Meritage Homes Corp. (a) | | 1,870,962 | 68,084,307 |
| Internet & Catalog Retail - 2.4% | | | |
| HSN, Inc. | | 1,500,000 | 76,740,000 |
| Multiline Retail - 1.9% | | | |
| Dillard's, Inc. Class A | | 900,000 | 60,912,000 |
| Specialty Retail - 4.6% | | | |
| Aarons, Inc. Class A | | 2,045,100 | 48,980,145 |
| Genesco, Inc. (a) | | 595,028 | 41,306,844 |
| Hibbett Sports, Inc. (a)(b)(c) | | 1,625,600 | 56,765,952 |
| | | | 147,052,941 |
|
| TOTAL CONSUMER DISCRETIONARY | | | 394,729,248 |
|
| CONSUMER STAPLES - 3.6% | | | |
| Food & Staples Retailing - 1.2% | | | |
| United Natural Foods, Inc. (a) | | 737,913 | 36,880,892 |
| Tobacco - 2.4% | | | |
| Universal Corp. (c) | | 1,300,000 | 77,103,000 |
|
| TOTAL CONSUMER STAPLES | | | 113,983,892 |
|
| ENERGY - 4.9% | | | |
| Energy Equipment & Services - 2.2% | | | |
| Hornbeck Offshore Services, Inc. (a)(b) | | 1,600,000 | 12,768,000 |
| ShawCor Ltd. Class A | | 2,500,000 | 57,021,407 |
| | | | 69,789,407 |
| Oil, Gas & Consumable Fuels - 2.7% | | | |
| Northern Oil & Gas, Inc. (a)(b) | | 1,958,249 | 7,754,666 |
| World Fuel Services Corp. | | 1,700,000 | 80,920,000 |
| | | | 88,674,666 |
|
| TOTAL ENERGY | | | 158,464,073 |
|
| FINANCIALS - 40.3% | | | |
| Banks - 14.7% | | | |
| Associated Banc-Corp. | | 2,836,935 | 52,766,991 |
| BOK Financial Corp. (b) | | 1,000,000 | 65,230,000 |
| Cullen/Frost Bankers, Inc. (b) | | 1,000,000 | 67,890,000 |
| CVB Financial Corp. | | 4,500,010 | 74,025,165 |
| First Citizen Bancshares, Inc. | | 140,370 | 36,465,319 |
| First Citizen Bancshares, Inc. Class A (a) | | 180,954 | 47,008,230 |
| First Niagara Financial Group, Inc. | | 6,000,000 | 61,080,000 |
| UMB Financial Corp. | | 1,200,000 | 66,492,000 |
| | | | 470,957,705 |
| Capital Markets - 3.3% | | | |
| Federated Investors, Inc. Class B (non-vtg.) | | 2,000,000 | 63,140,000 |
| OM Asset Management Ltd. | | 3,176,901 | 44,476,614 |
| | | | 107,616,614 |
| Insurance - 10.9% | | | |
| Allied World Assurance Co. Holdings AG | | 2,200,000 | 90,178,000 |
| Aspen Insurance Holdings Ltd. | | 971,046 | 44,629,274 |
| Endurance Specialty Holdings Ltd. | | 800,000 | 54,104,000 |
| First American Financial Corp. | | 2,000,000 | 83,620,000 |
| ProAssurance Corp. | | 1,468,200 | 75,847,212 |
| | | | 348,378,486 |
| Real Estate Investment Trusts - 8.0% | | | |
| Potlatch Corp. (c) | | 2,300,000 | 87,975,000 |
| Sabra Health Care REIT, Inc. | | 2,500,000 | 59,775,000 |
| Store Capital Corp. | | 3,500,000 | 109,164,999 |
| | | | 256,914,999 |
| Real Estate Management & Development - 1.6% | | | |
| Kennedy Wilson Europe Real Estate PLC | | 4,000,000 | 52,673,310 |
| Thrifts & Mortgage Finance - 1.8% | | | |
| Washington Federal, Inc. | | 2,274,500 | 56,862,500 |
|
| TOTAL FINANCIALS | | | 1,293,403,614 |
|
| HEALTH CARE - 5.6% | | | |
| Health Care Providers & Services - 3.9% | | | |
| Civitas Solutions, Inc. (a)(c) | | 2,422,110 | 51,905,817 |
| Team Health Holdings, Inc. (a) | | 1,800,000 | 73,512,000 |
| | | | 125,417,817 |
| Health Care Technology - 0.6% | | | |
| Cegedim SA (a) | | 670,247 | 19,587,647 |
| Pharmaceuticals - 1.1% | | | |
| Innoviva, Inc. (b) | | 2,726,753 | 35,093,311 |
|
| TOTAL HEALTH CARE | | | 180,098,775 |
|
| INDUSTRIALS - 14.2% | | | |
| Aerospace & Defense - 3.0% | | | |
| Moog, Inc. Class A (a) | | 1,750,000 | 96,372,500 |
| Commercial Services & Supplies - 0.8% | | | |
| Essendant, Inc. | | 1,235,098 | 24,751,364 |
| Electrical Equipment - 2.9% | | | |
| AZZ, Inc. | | 500,000 | 31,040,000 |
| Regal Beloit Corp. | | 1,000,000 | 61,010,000 |
| | | | 92,050,000 |
| Machinery - 3.2% | | | |
| Hillenbrand, Inc. | | 1,000,000 | 32,350,000 |
| Mueller Industries, Inc. | | 2,100,000 | 71,484,000 |
| | | | 103,834,000 |
| Road & Rail - 2.6% | | | |
| Genesee & Wyoming, Inc. Class A (a) | | 1,300,000 | 84,175,000 |
| Trading Companies & Distributors - 1.7% | | | |
| WESCO International, Inc. (a)(b) | | 960,033 | 53,512,239 |
|
| TOTAL INDUSTRIALS | | | 454,695,103 |
|
| INFORMATION TECHNOLOGY - 10.4% | | | |
| Electronic Equipment & Components - 3.8% | | | |
| Jabil Circuit, Inc. | | 266,445 | 5,422,156 |
| SYNNEX Corp. | | 527,200 | 52,999,416 |
| Tech Data Corp. (a) | | 800,000 | 62,344,000 |
| | | | 120,765,572 |
| Internet Software & Services - 2.9% | | | |
| Cimpress NV (a)(b) | | 400,000 | 37,920,000 |
| j2 Global, Inc. | | 850,000 | 56,814,000 |
| | | | 94,734,000 |
| IT Services - 3.0% | | | |
| CACI International, Inc. Class A (a) | | 250,000 | 23,832,500 |
| Science Applications International Corp. | | 1,200,000 | 72,912,000 |
| | | | 96,744,500 |
| Technology Hardware, Storage & Peripherals - 0.7% | | | |
| Super Micro Computer, Inc. (a) | | 1,000,000 | 21,550,000 |
|
| TOTAL INFORMATION TECHNOLOGY | | | 333,794,072 |
|
| MATERIALS - 4.0% | | | |
| Containers & Packaging - 2.1% | | | |
| Silgan Holdings, Inc. | | 1,370,000 | 67,924,600 |
| Metals & Mining - 1.9% | | | |
| Compass Minerals International, Inc. (b) | | 850,000 | 59,151,500 |
|
| TOTAL MATERIALS | | | 127,076,100 |
|
| UTILITIES - 4.2% | | | |
| Electric Utilities - 4.2% | | | |
| El Paso Electric Co. | | 1,500,000 | 71,520,000 |
| IDACORP, Inc. | | 800,000 | 64,680,000 |
| | | | 136,200,000 |
| TOTAL COMMON STOCKS | | | |
| (Cost $2,790,578,698) | | | 3,192,444,877 |
|
| Money Market Funds - 5.4% | | | |
| Fidelity Cash Central Fund, 0.42% (d) | | 18,841,170 | 18,841,170 |
| Fidelity Securities Lending Cash Central Fund, 0.45% (d)(e) | | 156,054,539 | 156,054,539 |
| TOTAL MONEY MARKET FUNDS | | | |
| (Cost $174,895,709) | | | 174,895,709 |
| TOTAL INVESTMENT PORTFOLIO - 104.9% | | | |
| (Cost $2,965,474,407) | | | 3,367,340,586 |
| NET OTHER ASSETS (LIABILITIES) - (4.9)% | | | (158,766,428) |
| NET ASSETS - 100% | | | $3,208,574,158 |
Legend
(a) Non-income producing
(b) Security or a portion of the security is on loan at period end.
(c) Affiliated company
(d) Affiliated fund that is generally available only to investment companies and other accounts managed by Fidelity Investments. The rate quoted is the annualized seven-day yield of the fund at period end. A complete unaudited listing of the fund's holdings as of its most recent quarter end is available upon request. In addition, each Fidelity Central Fund's financial statements, which are not covered by the Fund's Report of Independent Registered Public Accounting Firm, are available on the SEC's website or upon request.
(e) Investment made with cash collateral received from securities on loan.
Affiliated Central Funds
Information regarding fiscal year to date income earned by the Fund from investments in Fidelity Central Funds is as follows:
| Fund | Income earned |
| Fidelity Cash Central Fund | $81,527 |
| Fidelity Securities Lending Cash Central Fund | 2,179,165 |
| Total | $2,260,692 |
Other Affiliated Issuers
An affiliated company is a company in which the Fund has ownership of at least 5% of the voting securities. Fiscal year to date transactions with companies which are or were affiliates are as follows:
| Affiliate | Value, beginning of period | Purchases | Sales Proceeds | Dividend Income | Value, end of period |
| Civitas Solutions, Inc. | $66,136,343 | $-- | $14,297,008 | $-- | $51,905,817 |
| Hibbett Sports, Inc. | 11,341,950 | 55,985,079 | 2,178,105 | -- | 56,765,952 |
| Potlatch Corp. | -- | 62,383,666 | -- | -- | 87,975,000 |
| Rouse Properties, Inc. | 76,560,000 | -- | 78,563,904 | 438,063 | -- |
| Standard Motor Products, Inc. | 43,273,318 | -- | 6,525,703 | 724,502 | -- |
| Universal Corp. | 68,930,035 | 4,859,141 | 457,179 | 2,756,018 | 77,103,000 |
| Total | $266,241,646 | $123,227,886 | $102,021,899 | $3,918,583 | $273,749,769 |
Investment Valuation
All investments are categorized as Level 1 under the Fair Value Hierarchy. The inputs or methodology used for valuing securities may not be an indication of the risk associated with investing in those securities. For more information on valuation inputs please refer to the Investment Valuation section in the accompanying Notes to Financial Statements.
Other Information
Distribution of investments by country or territory of incorporation, as a percentage of Total Net Assets, is as follows (Unaudited):
| United States of America | 87.5% |
| Bermuda | 3.1% |
| Switzerland | 2.8% |
| Canada | 1.8% |
| Bailiwick of Jersey | 1.6% |
| United Kingdom | 1.4% |
| Netherlands | 1.2% |
| Others (Individually Less Than 1%) | 0.6% |
| | 100.0% |
See accompanying notes which are an integral part of the financial statements.
Financial Statements
Statement of Assets and Liabilities
| | | July 31, 2016 |
| Assets | | |
Investment in securities, at value (including securities loaned of $152,846,977) — See accompanying schedule:
Unaffiliated issuers (cost $2,560,598,307) | $2,918,695,108 | |
| Fidelity Central Funds (cost $174,895,709) | 174,895,709 | |
| Other affiliated issuers (cost $229,980,391) | 273,749,769 | |
| Total Investments (cost $2,965,474,407) | | $3,367,340,586 |
| Receivable for investments sold | | 1,332,481 |
| Receivable for fund shares sold | | 2,151,830 |
| Dividends receivable | | 1,332,543 |
| Distributions receivable from Fidelity Central Funds | | 89,294 |
| Other receivables | | 72,618 |
| Total assets | | 3,372,319,352 |
| Liabilities | | |
| Payable for investments purchased | $2,068,800 | |
| Payable for fund shares redeemed | 2,654,627 | |
| Accrued management fee | 2,149,904 | |
| Distribution and service plan fees payable | 126,751 | |
| Other affiliated payables | 634,078 | |
| Other payables and accrued expenses | 56,495 | |
| Collateral on securities loaned, at value | 156,054,539 | |
| Total liabilities | | 163,745,194 |
| Net Assets | | $3,208,574,158 |
| Net Assets consist of: | | |
| Paid in capital | | $2,613,772,354 |
| Undistributed net investment income | | 6,559,742 |
| Accumulated undistributed net realized gain (loss) on investments and foreign currency transactions | | 186,375,919 |
| Net unrealized appreciation (depreciation) on investments and assets and liabilities in foreign currencies | | 401,866,143 |
| Net Assets | | $3,208,574,158 |
| Calculation of Maximum Offering Price | | |
| Class A: | | |
| Net Asset Value and redemption price per share ($218,363,690÷ 12,188,359 shares) | | $17.92 |
| Maximum offering price per share (100/94.25 of $17.92) | | $19.01 |
| Class T: | | |
| Net Asset Value and redemption price per share ($82,337,095 ÷ 4,694,264 shares) | | $17.54 |
| Maximum offering price per share (100/96.50 of $17.54) | | $18.18 |
| Class C: | | |
| Net Asset Value and offering price per share ($57,231,399 ÷ 3,463,446 shares)(a) | | $16.52 |
| Small Cap Value: | | |
| Net Asset Value, offering price and redemption price per share ($2,460,713,972 ÷ 135,021,784 shares) | | $18.22 |
| Class I: | | |
| Net Asset Value, offering price and redemption price per share ($389,928,002 ÷ 21,387,334 shares) | | $18.23 |
(a) Redemption price per share is equal to net asset value less any applicable contingent deferred sales charge.
See accompanying notes which are an integral part of the financial statements.
Statement of Operations
| | | Year ended July 31, 2016 |
| Investment Income | | |
| Dividends (including $3,918,583 earned from other affiliated issuers) | | $50,583,645 |
| Income from Fidelity Central Funds | | 2,260,692 |
| Total income | | 52,844,337 |
| Expenses | | |
| Management fee | | |
| Basic fee | $20,088,076 | |
| Performance adjustment | 6,058,594 | |
| Transfer agent fees | 6,373,107 | |
| Distribution and service plan fees | 1,565,263 | |
| Accounting and security lending fees | 873,933 | |
| Custodian fees and expenses | 37,866 | |
| Independent trustees' fees and expenses | 12,545 | |
| Registration fees | 119,338 | |
| Audit | 66,034 | |
| Legal | 7,615 | |
| Miscellaneous | 20,661 | |
| Total expenses before reductions | 35,223,032 | |
| Expense reductions | (165,667) | 35,057,365 |
| Net investment income (loss) | | 17,786,972 |
| Realized and Unrealized Gain (Loss) | | |
| Net realized gain (loss) on: | | |
| Investment securities: | | |
| Unaffiliated issuers | 234,199,519 | |
| Other affiliated issuers | 11,952,229 | |
| Foreign currency transactions | (14,975) | |
| Total net realized gain (loss) | | 246,136,773 |
Change in net unrealized appreciation (depreciation) on:
Investment securities | (119,544,677) | |
| Assets and liabilities in foreign currencies | (37) | |
| Total change in net unrealized appreciation (depreciation) | | (119,544,714) |
| Net gain (loss) | | 126,592,059 |
| Net increase (decrease) in net assets resulting from operations | | $144,379,031 |
See accompanying notes which are an integral part of the financial statements.
Statement of Changes in Net Assets
| | Year ended July 31, 2016 | Year ended July 31, 2015 |
| Increase (Decrease) in Net Assets | | |
| Operations | | |
| Net investment income (loss) | $17,786,972 | $20,225,902 |
| Net realized gain (loss) | 246,136,773 | 285,516,597 |
| Change in net unrealized appreciation (depreciation) | (119,544,714) | 14,012,997 |
| Net increase (decrease) in net assets resulting from operations | 144,379,031 | 319,755,496 |
| Distributions to shareholders from net investment income | (21,953,514) | (9,146,893) |
| Distributions to shareholders from net realized gain | (264,173,272) | (322,480,172) |
| Total distributions | (286,126,786) | (331,627,065) |
| Share transactions - net increase (decrease) | 541,183,028 | (16,898,248) |
| Redemption fees | 204,719 | 149,785 |
| Total increase (decrease) in net assets | 399,639,992 | (28,620,032) |
| Net Assets | | |
| Beginning of period | 2,808,934,166 | 2,837,554,198 |
| End of period | $3,208,574,158 | $2,808,934,166 |
| Other Information | | |
| Undistributed net investment income end of period | $6,559,742 | $15,098,491 |
See accompanying notes which are an integral part of the financial statements.
Financial Highlights — Fidelity Small Cap Value Fund Class A
| Years ended July 31, | 2016 | 2015 | 2014 | 2013 | 2012 |
| Selected Per–Share Data | | | | | |
| Net asset value, beginning of period | $19.14 | $19.29 | $19.96 | $14.86 | $15.48 |
| Income from Investment Operations | | | | | |
| Net investment income (loss)A | .07 | .10B | .03 | .07 | .01 |
| Net realized and unrealized gain (loss) | .56 | 2.01 | 1.24 | 5.57 | .30 |
| Total from investment operations | .63 | 2.11 | 1.27 | 5.64 | .31 |
| Distributions from net investment income | (.11) | (.02) | (.01) | (.07) | (.01) |
| Distributions from net realized gain | (1.75) | (2.25) | (1.93) | (.47) | (.93) |
| Total distributions | (1.85)C | (2.26)D | (1.94) | (.54) | (.93)E |
| Redemption fees added to paid in capitalA,F | – | – | – | – | – |
| Net asset value, end of period | $17.92 | $19.14 | $19.29 | $19.96 | $14.86 |
| Total ReturnG,H | 4.07% | 11.86% | 6.83% | 39.09% | 3.24% |
| Ratios to Average Net AssetsI,J | | | | | |
| Expenses before reductions | 1.41% | 1.42% | 1.36% | 1.36% | 1.44% |
| Expenses net of fee waivers, if any | 1.41% | 1.39% | 1.35% | 1.36% | 1.44% |
| Expenses net of all reductions | 1.41% | 1.39% | 1.34% | 1.36% | 1.44% |
| Net investment income (loss) | .43% | .52%B | .13% | .41% | .09% |
| Supplemental Data | | | | | |
| Net assets, end of period (000 omitted) | $218,364 | $235,844 | $258,183 | $275,265 | $150,285 |
| Portfolio turnover rateK | 33% | 34% | 26%L | 29% | 27% |
A Calculated based on average shares outstanding during the period.
B Net Investment income per share reflects a large, non-recurring dividend which amounted to $.05 per share. Excluding this non-recurring dividend, the ratio of net investment income (loss) to average net assets would have been .26%.
C Total distributions of $1.85 per share is comprised of distributions from net investment income of $.105 and distributions from net realized gain of $1.747 per share.
D Total distributions of $2.26 per share is comprised of distributions from net investment income of $.016 and distributions from net realized gain of $2.248 per share.
E Total distributions of $.93 per share is comprised of distributions from net investment income of $.006 and distributions from net realized gain of $.925 per share.
F Amount represents less than $.005 per share.
G Total returns would have been lower if certain expenses had not been reduced during the applicable periods shown.
H Total returns do not include the effect of the sales charges.
I Fees and expenses of any underlying Fidelity Central Funds are not included in the Fund's expense ratio. The Fund indirectly bears its proportionate share of the expenses of any underlying Fidelity Central Funds.
J Expense ratios reflect operating expenses of the class. Expenses before reductions do not reflect amounts reimbursed by the investment adviser or reductions from brokerage service arrangements or reductions from other expense offset arrangements and do not represent the amount paid by the class during periods when reimbursements or reductions occur. Expenses net of fee waivers reflect expenses after reimbursement by the investment adviser but prior to reductions from brokerage service arrangements or other expense offset arrangements. Expenses net of all reductions represent the net expenses paid by the class.
K Amount does not include the portfolio activity of any underlying Fidelity Central Funds.
L Portfolio turnover rate excludes securities received or delivered in-kind.
See accompanying notes which are an integral part of the financial statements.
Financial Highlights — Fidelity Small Cap Value Fund Class T
| Years ended July 31, | 2016 | 2015 | 2014 | 2013 | 2012 |
| Selected Per–Share Data | | | | | |
| Net asset value, beginning of period | $18.78 | $18.98 | $19.70 | $14.70 | $15.34 |
| Income from Investment Operations | | | | | |
| Net investment income (loss)A | .03 | .05B | (.02) | .03 | (.02) |
| Net realized and unrealized gain (loss) | .54 | 1.98 | 1.23 | 5.50 | .31 |
| Total from investment operations | .57 | 2.03 | 1.21 | 5.53 | .29 |
| Distributions from net investment income | (.06) | – | – | (.06) | – |
| Distributions from net realized gain | (1.75) | (2.23) | (1.93) | (.47) | (.93) |
| Total distributions | (1.81) | (2.23) | (1.93) | (.53) | (.93) |
| Redemption fees added to paid in capitalA,C | – | – | – | – | – |
| Net asset value, end of period | $17.54 | $18.78 | $18.98 | $19.70 | $14.70 |
| Total ReturnD,E | 3.76% | 11.58% | 6.58% | 38.70% | 3.08% |
| Ratios to Average Net AssetsF,G | | | | | |
| Expenses before reductions | 1.66% | 1.67% | 1.61% | 1.60% | 1.67% |
| Expenses net of fee waivers, if any | 1.66% | 1.64% | 1.59% | 1.60% | 1.67% |
| Expenses net of all reductions | 1.65% | 1.63% | 1.59% | 1.59% | 1.67% |
| Net investment income (loss) | .19% | .27%B | (.11)% | .18% | (.14)% |
| Supplemental Data | | | | | |
| Net assets, end of period (000 omitted) | $82,337 | $91,716 | $100,975 | $107,444 | $57,514 |
| Portfolio turnover rateH | 33% | 34% | 26%I | 29% | 27% |
A Calculated based on average shares outstanding during the period.
B Net Investment income per share reflects a large, non-recurring dividend which amounted to $.05 per share. Excluding this non-recurring dividend, the ratio of net investment income (loss) to average net assets would have been .01%.
C Amount represents less than $.005 per share.
D Total returns would have been lower if certain expenses had not been reduced during the applicable periods shown.
E Total returns do not include the effect of the sales charges.
F Fees and expenses of any underlying Fidelity Central Funds are not included in the Fund's expense ratio. The Fund indirectly bears its proportionate share of the expenses of any underlying Fidelity Central Funds.
G Expense ratios reflect operating expenses of the class. Expenses before reductions do not reflect amounts reimbursed by the investment adviser or reductions from brokerage service arrangements or reductions from other expense offset arrangements and do not represent the amount paid by the class during periods when reimbursements or reductions occur. Expenses net of fee waivers reflect expenses after reimbursement by the investment adviser but prior to reductions from brokerage service arrangements or other expense offset arrangements. Expenses net of all reductions represent the net expenses paid by the class.
H Amount does not include the portfolio activity of any underlying Fidelity Central Funds.
I Portfolio turnover rate excludes securities received or delivered in-kind.
See accompanying notes which are an integral part of the financial statements.
Financial Highlights — Fidelity Small Cap Value Fund Class C
| Years ended July 31, | 2016 | 2015 | 2014 | 2013 | 2012 |
| Selected Per–Share Data | | | | | |
| Net asset value, beginning of period | $17.82 | $18.19 | $19.06 | $14.28 | $15.01 |
| Income from Investment Operations | | | | | |
| Net investment income (loss)A | (.05) | (.04)B | (.12) | (.06) | (.09) |
| Net realized and unrealized gain (loss) | .50 | 1.90 | 1.18 | 5.34 | .29 |
| Total from investment operations | .45 | 1.86 | 1.06 | 5.28 | .20 |
| Distributions from net investment income | – | – | – | (.03) | – |
| Distributions from net realized gain | (1.75) | (2.23) | (1.93) | (.47) | (.93) |
| Total distributions | (1.75) | (2.23) | (1.93) | (.50) | (.93) |
| Redemption fees added to paid in capitalA,C | – | – | – | – | – |
| Net asset value, end of period | $16.52 | $17.82 | $18.19 | $19.06 | $14.28 |
| Total ReturnD,E | 3.20% | 11.05% | 5.97% | 38.00% | 2.52% |
| Ratios to Average Net AssetsF,G | | | | | |
| Expenses before reductions | 2.18% | 2.19% | 2.12% | 2.13% | 2.19% |
| Expenses net of fee waivers, if any | 2.17% | 2.16% | 2.11% | 2.13% | 2.19% |
| Expenses net of all reductions | 2.17% | 2.15% | 2.10% | 2.12% | 2.19% |
| Net investment income (loss) | (.33)% | (.25)%B | (.63)% | (.35)% | (.66)% |
| Supplemental Data | | | | | |
| Net assets, end of period (000 omitted) | $57,231 | $64,928 | $70,541 | $76,018 | $47,265 |
| Portfolio turnover rateH | 33% | 34% | 26%I | 29% | 27% |
A Calculated based on average shares outstanding during the period.
B Net Investment income per share reflects a large, non-recurring dividend which amounted to $.05 per share. Excluding this non-recurring dividend, the ratio of net investment income (loss) to average net assets would have been (.51) %.
C Amount represents less than $.005 per share.
D Total returns would have been lower if certain expenses had not been reduced during the applicable periods shown.
E Total returns do not include the effect of the contingent deferred sales charge.
F Fees and expenses of any underlying Fidelity Central Funds are not included in the Fund's expense ratio. The Fund indirectly bears its proportionate share of the expenses of any underlying Fidelity Central Funds.
G Expense ratios reflect operating expenses of the class. Expenses before reductions do not reflect amounts reimbursed by the investment adviser or reductions from brokerage service arrangements or reductions from other expense offset arrangements and do not represent the amount paid by the class during periods when reimbursements or reductions occur. Expenses net of fee waivers reflect expenses after reimbursement by the investment adviser but prior to reductions from brokerage service arrangements or other expense offset arrangements. Expenses net of all reductions represent the net expenses paid by the class.
H Amount does not include the portfolio activity of any underlying Fidelity Central Funds.
I Portfolio turnover rate excludes securities received or delivered in-kind.
See accompanying notes which are an integral part of the financial statements.
Financial Highlights — Fidelity Small Cap Value Fund
| Years ended July 31, | 2016 | 2015 | 2014 | 2013 | 2012 |
| Selected Per–Share Data | | | | | |
| Net asset value, beginning of period | $19.45 | $19.57 | $20.22 | $15.05 | $15.62 |
| Income from Investment Operations | | | | | |
| Net investment income (loss)A | .12 | .15B | .08 | .12 | .06 |
| Net realized and unrealized gain (loss) | .55 | 2.05 | 1.26 | 5.63 | .32 |
| Total from investment operations | .67 | 2.20 | 1.34 | 5.75 | .38 |
| Distributions from net investment income | (.15) | (.07) | (.06) | (.11) | (.02) |
| Distributions from net realized gain | (1.75) | (2.25) | (1.93) | (.47) | (.93) |
| Total distributions | (1.90) | (2.32) | (1.99) | (.58) | (.95) |
| Redemption fees added to paid in capitalA,C | – | – | – | – | – |
| Net asset value, end of period | $18.22 | $19.45 | $19.57 | $20.22 | $15.05 |
| Total ReturnD | 4.23% | 12.18% | 7.12% | 39.45% | 3.67% |
| Ratios to Average Net AssetsE,F | | | | | |
| Expenses before reductions | 1.18% | 1.15% | 1.08% | 1.07% | 1.13% |
| Expenses net of fee waivers, if any | 1.18% | 1.12% | 1.06% | 1.07% | 1.13% |
| Expenses net of all reductions | 1.17% | 1.12% | 1.06% | 1.06% | 1.13% |
| Net investment income (loss) | .67% | .78%B | .41% | .71% | .41% |
| Supplemental Data | | | | | |
| Net assets, end of period (000 omitted) | $2,460,714 | $2,036,157 | $2,060,546 | $2,672,854 | $1,756,962 |
| Portfolio turnover rateG | 33% | 34% | 26%H | 29% | 27% |
A Calculated based on average shares outstanding during the period.
B Net Investment income per share reflects a large, non-recurring dividend which amounted to $.05 per share. Excluding this non-recurring dividend, the ratio of net investment income (loss) to average net assets would have been .53%.
C Amount represents less than $.005 per share.
D Total returns would have been lower if certain expenses had not been reduced during the applicable periods shown.
E Fees and expenses of any underlying Fidelity Central Funds are not included in the Fund's expense ratio. The Fund indirectly bears its proportionate share of the expenses of any underlying Fidelity Central Funds.
F Expense ratios reflect operating expenses of the class. Expenses before reductions do not reflect amounts reimbursed by the investment adviser or reductions from brokerage service arrangements or reductions from other expense offset arrangements and do not represent the amount paid by the class during periods when reimbursements or reductions occur. Expenses net of fee waivers reflect expenses after reimbursement by the investment adviser but prior to reductions from brokerage service arrangements or other expense offset arrangements. Expenses net of all reductions represent the net expenses paid by the class.
G Amount does not include the portfolio activity of any underlying Fidelity Central Funds.
H Portfolio turnover rate excludes securities received or delivered in-kind.
See accompanying notes which are an integral part of the financial statements.
Financial Highlights — Fidelity Small Cap Value Fund Class I
| Years ended July 31, | 2016 | 2015 | 2014 | 2013 | 2012 |
| Selected Per–Share Data | | | | | |
| Net asset value, beginning of period | $19.45 | $19.57 | $20.23 | $15.05 | $15.63 |
| Income from Investment Operations | | | | | |
| Net investment income (loss)A | .12 | .15B | .08 | .12 | .06 |
| Net realized and unrealized gain (loss) | .56 | 2.05 | 1.25 | 5.65 | .31 |
| Total from investment operations | .68 | 2.20 | 1.33 | 5.77 | .37 |
| Distributions from net investment income | (.16) | (.07) | (.06) | (.12) | (.02) |
| Distributions from net realized gain | (1.75) | (2.25) | (1.93) | (.47) | (.93) |
| Total distributions | (1.90)C | (2.32) | (1.99) | (.59) | (.95) |
| Redemption fees added to paid in capitalA,D | – | – | – | – | – |
| Net asset value, end of period | $18.23 | $19.45 | $19.57 | $20.23 | $15.05 |
| Total ReturnE | 4.31% | 12.17% | 7.08% | 39.54% | 3.59% |
| Ratios to Average Net AssetsF,G | | | | | |
| Expenses before reductions | 1.14% | 1.15% | 1.09% | 1.07% | 1.14% |
| Expenses net of fee waivers, if any | 1.14% | 1.12% | 1.07% | 1.07% | 1.14% |
| Expenses net of all reductions | 1.14% | 1.12% | 1.07% | 1.06% | 1.14% |
| Net investment income (loss) | .70% | .79%B | .40% | .70% | .39% |
| Supplemental Data | | | | | |
| Net assets, end of period (000 omitted) | $389,928 | $376,817 | $342,500 | $359,582 | $138,981 |
| Portfolio turnover rateH | 33% | 34% | 26%I | 29% | 27% |
A Calculated based on average shares outstanding during the period.
B Net Investment income per share reflects a large, non-recurring dividend which amounted to $.05 per share. Excluding this non-recurring dividend, the ratio of net investment income (loss) to average net assets would have been .53%.
C Total distributions of $1.90 per share is comprised of distributions from net investment income of $.157 and distributions from net realized gain of $1.747 per share.
D Amount represents less than $.005 per share.
E Total returns would have been lower if certain expenses had not been reduced during the applicable periods shown.
F Fees and expenses of any underlying Fidelity Central Funds are not included in the Fund's expense ratio. The Fund indirectly bears its proportionate share of the expenses of any underlying Fidelity Central Funds.
G Expense ratios reflect operating expenses of the class. Expenses before reductions do not reflect amounts reimbursed by the investment adviser or reductions from brokerage service arrangements or reductions from other expense offset arrangements and do not represent the amount paid by the class during periods when reimbursements or reductions occur. Expenses net of fee waivers reflect expenses after reimbursement by the investment adviser but prior to reductions from brokerage service arrangements or other expense offset arrangements. Expenses net of all reductions represent the net expenses paid by the class.
H Amount does not include the portfolio activity of any underlying Fidelity Central Funds.
I Portfolio turnover rate excludes securities received or delivered in-kind.
See accompanying notes which are an integral part of the financial statements.
Notes to Financial Statements
For the period ended July 31, 2016
1. Organization.
Fidelity Small Cap Value Fund (the Fund) is a fund of Fidelity Securities Fund (the Trust) and is authorized to issue an unlimited number of shares. The Trust is registered under the Investment Company Act of 1940, as amended (the 1940 Act), as an open-end management investment company organized as a Massachusetts business trust. The Fund offers Class A, Class T, Class C, Small Cap Value and Class I shares, each of which has equal rights as to assets and voting privileges. The Fund is closed to new accounts with certain exceptions. Each class has exclusive voting rights with respect to matters that affect that class.
After the close of business on June 24, 2016, all outstanding Class B shares were converted to Class A shares. All current fiscal period dollar and share amounts for Class B presented in the Notes to Financial Statements are for the period August 1, 2015 through June 24, 2016.
2. Investments in Fidelity Central Funds.
The Fund invests in Fidelity Central Funds, which are open-end investment companies generally available only to other investment companies and accounts managed by the investment adviser and its affiliates. The Fund's Schedule of Investments lists each of the Fidelity Central Funds held as of period end, if any, as an investment of the Fund, but does not include the underlying holdings of each Fidelity Central Fund. As an Investing Fund, the Fund indirectly bears its proportionate share of the expenses of the underlying Fidelity Central Funds.
The Money Market Central Funds seek preservation of capital and current income and are managed by Fidelity Investments Money Management, Inc. (FIMM), an affiliate of the investment adviser. Annualized expenses of the Money Market Central Funds as of their most recent shareholder report date are less than .01%.
A complete unaudited list of holdings for each Fidelity Central Fund is available upon request or at the Securities and Exchange Commission (the SEC) website at www.sec.gov. In addition, the financial statements of the Fidelity Central Funds, which are not covered by the Fund's Report of Independent Registered Public Accounting Firm, are available on the SEC website or upon request.
3. Significant Accounting Policies.
The financial statements have been prepared in conformity with accounting principles generally accepted in the United States of America (GAAP), which require management to make certain estimates and assumptions at the date of the financial statements. Actual results could differ from those estimates. Subsequent events, if any, through the date that the financial statements were issued have been evaluated in the preparation of the financial statements. The following summarizes the significant accounting policies of the Fund:
Investment Valuation. Investments are valued as of 4:00 p.m. Eastern time on the last calendar day of the period. The Board of Trustees (the Board) has delegated the day to day responsibility for the valuation of the Fund's investments to the Fidelity Management & Research Company (FMR) Fair Value Committee (the Committee). In accordance with valuation policies and procedures approved by the Board, the Fund attempts to obtain prices from one or more third party pricing vendors or brokers to value its investments. When current market prices, quotations or currency exchange rates are not readily available or reliable, investments will be fair valued in good faith by the Committee, in accordance with procedures adopted by the Board. Factors used in determining fair value vary by investment type and may include market or investment specific events. The frequency with which these procedures are used cannot be predicted and they may be utilized to a significant extent. The Committee oversees the Fund's valuation policies and procedures and reports to the Board on the Committee's activities and fair value determinations. The Board monitors the appropriateness of the procedures used in valuing the Fund's investments and ratifies the fair value determinations of the Committee.
The Fund categorizes the inputs to valuation techniques used to value its investments into a disclosure hierarchy consisting of three levels as shown below:
- Level 1 – quoted prices in active markets for identical investments
- Level 2 – other significant observable inputs (including quoted prices for similar investments, interest rates, prepayment speeds, etc.)
- Level 3 – unobservable inputs (including the Fund's own assumptions based on the best information available)
Valuation techniques used to value the Fund's investments by major category are as follows:
Equity securities, including restricted securities, for which market quotations are readily available, are valued at the last reported sale price or official closing price as reported by a third party pricing vendor on the primary market or exchange on which they are traded and are categorized as Level 1 in the hierarchy. In the event there were no sales during the day or closing prices are not available, securities are valued at the last quoted bid price or may be valued using the last available price and are generally categorized as Level 2 in the hierarchy. For foreign equity securities, when market or security specific events arise, comparisons to the valuation of American Depositary Receipts (ADRs), futures contracts, Exchange-Traded Funds (ETFs) and certain indexes as well as quoted prices for similar securities may be used and would be categorized as Level 2 in the hierarchy. Utilizing these techniques may result in transfers between Level 1 and Level 2. For equity securities, including restricted securities, where observable inputs are limited, assumptions about market activity and risk are used and these securities may be categorized as Level 3 in the hierarchy.
Investments in open-end mutual funds, including the Fidelity Central Funds, are valued at their closing net asset value (NAV) each business day and are categorized as Level 1 in the hierarchy.
Changes in valuation techniques may result in transfers in or out of an assigned level within the disclosure hierarchy. The aggregate value of investments by input level as of July 31, 2016, including information on transfers between Levels 1 and 2, is included at the end of the Fund's Schedule of Investments.
Foreign Currency. The Fund may use foreign currency contracts to facilitate transactions in foreign-denominated securities. Gains and losses from these transactions may arise from changes in the value of the foreign currency or if the counterparties do not perform under the contracts' terms.
Foreign-denominated assets, including investment securities, and liabilities are translated into U.S. dollars at the exchange rates at period end. Purchases and sales of investment securities, income and dividends received and expenses denominated in foreign currencies are translated into U.S. dollars at the exchange rate in effect on the transaction date.
The effects of exchange rate fluctuations on investments are included with the net realized and unrealized gain (loss) on investment securities. Other foreign currency transactions resulting in realized and unrealized gain (loss) are disclosed separately.
Investment Transactions and Income. For financial reporting purposes, the Fund's investment holdings and NAV include trades executed through the end of the last business day of the period. The NAV per share for processing shareholder transactions is calculated as of the close of business of the New York Stock Exchange (NYSE), normally 4:00 p.m. Eastern time and includes trades executed through the end of the prior business day. Gains and losses on securities sold are determined on the basis of identified cost and may include proceeds received from litigation. Dividend income is recorded on the ex-dividend date, except for certain dividends from foreign securities where the ex-dividend date may have passed, which are recorded as soon as the Fund is informed of the ex-dividend date. Non-cash dividends included in dividend income, if any, are recorded at the fair market value of the securities received. Income and capital gain distributions from Fidelity Central Funds, if any, are recorded on the ex-dividend date. Distributions received on securities that represent a return of capital or capital gain are recorded as a reduction of cost of investments and/or as a realized gain. Subsequent to ex-dividend date the Fund determines the components of these distributions, based upon receipt of tax filings or other correspondence relating to the underlying investment. Investment income is recorded net of foreign taxes withheld where recovery of such taxes is uncertain.
Class Allocations and Expenses. Investment income, realized and unrealized capital gains and losses, common expenses of the Fund, and certain fund-level expense reductions, if any, are allocated daily on a pro-rata basis to each class based on the relative net assets of each class to the total net assets of the Fund. Each class differs with respect to transfer agent and distribution and service plan fees incurred. Certain expense reductions may also differ by class. For the reporting period, the allocated portion of income and expenses to each class as a percent of its average net assets may vary due to the timing of recording these transactions in relation to fluctuating net assets of the classes. Expenses directly attributable to a fund are charged to that fund. Expenses attributable to more than one fund are allocated among the respective funds on the basis of relative net assets or other appropriate methods. Expense estimates are accrued in the period to which they relate and adjustments are made when actual amounts are known.
Income Tax Information and Distributions to Shareholders. Each year, the Fund intends to qualify as a regulated investment company under Subchapter M of the Internal Revenue Code, including distributing substantially all of its taxable income and realized gains. As a result, no provision for U.S. Federal income taxes is required. As of July 31, 2016, the Fund did not have any unrecognized tax benefits in the financial statements; nor is the Fund aware of any tax positions for which it is reasonably possible that the total amounts of unrecognized tax benefits will significantly change in the next twelve months. The Fund files a U.S. federal tax return, in addition to state and local tax returns as required. The Fund's federal income tax returns are subject to examination by the Internal Revenue Service (IRS) for a period of three fiscal years after they are filed. State and local tax returns may be subject to examination for an additional fiscal year depending on the jurisdiction. Foreign taxes are provided for based on the Fund's understanding of the tax rules and rates that exist in the foreign markets in which it invests.
Distributions are declared and recorded on the ex-dividend date. Income dividends and capital gain distributions are declared separately for each class. Income and capital gain distributions are determined in accordance with income tax regulations, which may differ from GAAP. In addition, the Fund claimed a portion of the payment made to redeeming shareholders as a distribution for income tax purposes.
Capital accounts within the financial statements are adjusted for permanent book-tax differences. These adjustments have no impact on net assets or the results of operations. Capital accounts are not adjusted for temporary book-tax differences which will reverse in a subsequent period.
Book-tax differences are primarily due to foreign currency transactions, passive foreign investment companies (PFIC) and losses deferred due to wash sales.
The federal tax cost of investment securities and unrealized appreciation (depreciation) as of period end were as follows:
| Gross unrealized appreciation | $566,469,122 |
| Gross unrealized depreciation | (164,828,845) |
| Net unrealized appreciation (depreciation) on securities | $401,640,277 |
| Tax Cost | $2,965,700,309 |
The tax-based components of distributable earnings as of period end were as follows:
| Undistributed ordinary income | $6,559,742 |
| Undistributed long-term capital gain | $186,601,784 |
| Net unrealized appreciation (depreciation) on securities and other investments | $401,640,277 |
The tax character of distributions paid was as follows:
| | July 31, 2016 | July 31, 2015 |
| Ordinary Income | $22,268,401 | $ 12,432,052 |
| Long-term Capital Gains | 263,858,385 | 319,195,013 |
| Total | $286,126,786 | $ 331,627,065 |
Short-Term Trading (Redemption) Fees. Shares held by investors in the Fund less than 90 days may have been subject to a redemption fee equal to 1.50% of the NAV of shares redeemed. All redemption fees, which reduce the proceeds of the shareholder redemption, are retained by the Fund and accounted for as an addition to paid in capital.
4. Purchases and Sales of Investments.
Purchases and sales of securities, other than short-term securities, aggregated $1,246,194,550 and $960,674,812, respectively.
5. Fees and Other Transactions with Affiliates.
Management Fee. Fidelity Management & Research Company (the investment adviser) and its affiliates provide the Fund with investment management related services for which the Fund pays a monthly management fee. The management fee is the sum of an individual fund fee rate that is based on an annual rate of .45% of the Fund's average net assets and an annualized group fee rate that averaged .25% during the period. The group fee rate is based upon the average net assets of all the mutual funds advised by the investment adviser, including any mutual funds previously advised by the investment adviser that are currently advised by Fidelity SelectCo, LLC, an affiliate of the investment adviser. The group fee rate decreases as assets under management increase and increases as assets under management decrease. In addition, the management fee is subject to a performance adjustment (up to a maximum of +/- .20% of the Fund's average net assets over a 36 month performance period). The upward or downward adjustment to the management fee is based on the relative investment performance of Small Cap Value as compared to its benchmark index, the Russell 2000 Value Index, over the same 36 month performance period. For the reporting period, the total annual management fee rate, including the performance adjustment, was .91% of the Fund's average net assets. The performance adjustment included in the management fee rate may be higher or lower than the maximum performance adjustment rate due to the difference between the average net assets for the reporting and performance periods.
Distribution and Service Plan Fees. In accordance with Rule 12b-1 of the 1940 Act, the Fund has adopted separate Distribution and Service Plans for each class of shares. Certain classes pay Fidelity Distributors Corporation (FDC), an affiliate of the investment adviser, separate Distribution and Service Fees, each of which is based on an annual percentage of each class' average net assets. In addition, FDC may pay financial intermediaries for selling shares of the Fund and providing shareholder support services. For the period, the Distribution and Service Fee rates, total fees and amounts retained by FDC were as follows:
| | Distribution
Fee | Service
Fee | Total Fees | Retained
by FDC |
| Class A | -% | .25% | $538,756 | $– |
| Class T | .25% | .25% | 416,962 | – |
| Class B | .75% | .25% | 23,452 | 17,589 |
| Class C | .75% | .25% | 586,093 | 7,448 |
| | | | $1,565,263 | $25,037 |
Sales Load. FDC may receive a front-end sales charge of up to 5.75% for selling Class A shares and 3.50% for selling Class T shares, some of which is paid to financial intermediaries for selling shares of the Fund. Depending on the holding period, FDC may receive contingent deferred sales charges levied on Class A, Class T, Class B, and Class C redemptions. The deferred sales charges range from 5.00% to 1.00% for Class B shares, 1.00% for Class C shares, 1.00% for certain purchases of Class A shares and .25% for certain purchases of Class T shares.
For the period, sales charge amounts retained by FDC were as follows:
| | Retained
by FDC |
| Class A | $6,500 |
| Class T | 3,040 |
| Class B(a) | 1,321 |
| Class C(a) | 528 |
| | $11,389 |
(a) When Class B and Class C shares are initially sold, FDC pays commissions from its own resources to financial intermediaries through which the sales are made.
Transfer Agent Fees. Fidelity Investments Institutional Operations Company, Inc., (FIIOC), an affiliate of the investment adviser, is the transfer, dividend disbursing and shareholder servicing agent for each class of the Fund. FIIOC receives account fees and asset-based fees that vary according to the account size and type of account of the shareholders of the respective classes of the Fund. FIIOC pays for typesetting, printing and mailing of shareholder reports, except proxy statements.
For the period, transfer agent fees for each class were as follows:
| | Amount | % of
Class-Level Average
Net Assets |
| Class A | $465,299 | .22 |
| Class T | 174,728 | .21 |
| Class B | 6,732 | .26 |
| Class C | 133,220 | .23 |
| Small Cap Value | 4,897,044 | .23 |
| Class I | 696,084 | .19 |
| | $6,373,107 | |
Accounting and Security Lending Fees. Fidelity Service Company, Inc. (FSC), an affiliate of the investment adviser, maintains the Fund's accounting records. The accounting fee is based on the level of average net assets for each month. Under a separate contract, FSC administers the security lending program. The security lending fee is based on the number and duration of lending transactions.
Brokerage Commissions. The Fund placed a portion of its portfolio transactions with brokerage firms which are affiliates of the investment adviser. Brokerage commissions are included in net realized gain (loss) and change in net unrealized appreciation (depreciation) in the Statement of Operations. The commissions paid to these affiliated firms were $35,267 for the period.
Interfund Trades. The Fund may purchase from or sell securities to other Fidelity Funds under procedures adopted by the Board. The procedures have been designed to ensure these interfund trades are executed in accordance with Rule 17a-7 of the 1940 Act. Interfund trades are included within the respective purchases and sales amounts shown in the Purchases and Sales of Investments note.
6. Committed Line of Credit.
The Fund participates with other funds managed by the investment adviser or an affiliate in a $4.25 billion credit facility (the "line of credit") to be utilized for temporary or emergency purposes to fund shareholder redemptions or for other short-term liquidity purposes. The Fund has agreed to pay commitment fees on its pro-rata portion of the line of credit, which amounted to $5,924 and is reflected in Miscellaneous expenses on the Statement of Operations. During the period, the Fund did not borrow on this line of credit.
7. Security Lending.
The Fund lends portfolio securities through a lending agent from time to time in order to earn additional income. For equity securities, a lending agent is used and may loan securities to certain qualified borrowers, including Fidelity Capital Markets (FCM), a broker-dealer affiliated with the Fund. On the settlement date of the loan, the Fund receives collateral (in the form of U.S. Treasury obligations, letters of credit and/or cash) against the loaned securities and maintains collateral in an amount not less than 100% of the market value of the loaned securities during the period of the loan. The market value of the loaned securities is determined at the close of business of the Fund and any additional required collateral is delivered to the Fund on the next business day. The Fund or borrower may terminate the loan at any time, and if the borrower defaults on its obligation to return the securities loaned because of insolvency or other reasons, the Fund may apply collateral received from the borrower against the obligation. The Fund may experience delays and costs in recovering the securities loaned. Any cash collateral received is the Fidelity Securities Lending Cash Central Fund. The value of loaned securities and cash collateral at period end are disclosed on the Fund's Statement of Assets and Liabilities. The value of securities loaned to FCM at period end was $528,264. Security lending income represents the income earned on investing cash collateral, less rebates paid to borrowers and any lending agent fees associated with the loan, plus any premium payments received for lending certain types of securities. Security lending income is presented in the Statement of Operations as a component of income from Fidelity Central Funds. Total security lending income during the period amounted to $2,179,165, including $9,308 from securities loaned to FCM.
8. Expense Reductions.
Commissions paid to certain brokers with whom the investment adviser, or its affiliates, places trades on behalf of the Fund include an amount in addition to trade execution, which may be rebated back to the Fund to offset certain expenses. This amount totaled $145,552 for the period. In addition, through arrangements with the Fund's custodian, credits realized as a result of certain uninvested cash balances were used to reduce the Fund's expenses. During the period, these credits reduced the Fund's expenses by $417.
In addition, during the period the investment adviser reimbursed and/or waived a portion of fund-level operating expenses in the amount of $19,698.
9. Distributions to Shareholders.
Distributions to shareholders of each class were as follows:
| | Year ended
July 31, 2016 | Year ended July 31, 2015 |
| From net investment income | | |
| Class A | $1,294,370 | $207,059 |
| Class T | 298,011 | – |
| Small Cap Value | 17,252,892 | 7,655,420 |
| Class I | 3,108,241 | 1,284,414 |
| Total | $21,953,514 | $9,146,893 |
| From net realized gain | | |
| Class A | $21,315,531 | $29,002,450 |
| Class T | 8,511,334 | 11,758,984 |
| Class B | 317,311 | 573,044 |
| Class C | 6,297,703 | 8,461,258 |
| Small Cap Value | 193,459,994 | 233,242,234 |
| Class I | 34,271,399 | 39,442,202 |
| Total | $264,173,272 | $322,480,172 |
10. Share Transactions.
Share transactions for each class were as follows and may contain automatic conversions between classes or exchanges between affiliated funds:
| | Shares | Shares | Dollars | Dollars |
| | Year ended
July 31, 2016 | Year ended July 31, 2015 | Year ended
July 31, 2016 | Year ended July 31, 2015 |
| Class A | | | | |
| Shares sold | 2,145,353 | 1,619,679 | $36,585,285 | $30,035,137 |
| Reinvestment of distributions | 1,320,026 | 1,578,405 | 22,234,691 | 28,466,035 |
| Shares redeemed | (3,598,901) | (4,261,712) | (60,922,417) | (79,564,907) |
| Net increase (decrease) | (133,522) | (1,063,628) | $(2,102,441) | $(21,063,735) |
| Class T | | | | |
| Shares sold | 664,517 | 599,331 | $11,103,956 | $10,911,777 |
| Reinvestment of distributions | 527,842 | 655,613 | 8,714,816 | 11,618,861 |
| Shares redeemed | (1,382,867) | (1,691,524) | (22,787,541) | (30,859,052) |
| Net increase (decrease) | (190,508) | (436,580) | $(2,968,769) | $(8,328,414) |
| Class B | | | | |
| Shares sold | 4,363 | 5,056 | $67,145 | $89,676 |
| Reinvestment of distributions | 19,426 | 31,870 | 302,868 | 537,830 |
| Shares redeemed | (219,046) | (106,178) | (3,435,330) | (1,834,363) |
| Net increase (decrease) | (195,257) | (69,252) | $(3,065,317) | $(1,206,857) |
| Class C | | | | |
| Shares sold | 192,093 | 167,565 | $2,998,393 | $2,897,201 |
| Reinvestment of distributions | 367,680 | 447,025 | 5,744,375 | 7,553,140 |
| Shares redeemed | (740,656) | (847,704) | (11,631,361) | (14,671,382) |
| Net increase (decrease) | (180,883) | (233,114) | $(2,888,593) | $(4,221,041) |
| Small Cap Value | | | | |
| Shares sold | 41,988,674 | 13,163,441 | $719,207,580 | $248,872,334 |
| Reinvestment of distributions | 11,458,933 | 12,098,173 | 196,111,327 | 221,448,638 |
| Shares redeemed | (23,136,423) | (25,848,809) | (398,026,994) | (487,056,437) |
| Net increase (decrease) | 30,311,184 | (587,195) | $517,291,913 | $(16,735,465) |
| Class I | | | | |
| Shares sold | 4,744,642 | 4,194,067 | $82,352,801 | $79,803,869 |
| Reinvestment of distributions | 1,907,860 | 1,996,970 | 32,653,194 | 36,554,847 |
| Shares redeemed | (4,639,051) | (4,316,971) | (80,089,760) | (81,701,452) |
| Net increase (decrease) | 2,013,451 | 1,874,066 | $34,916,235 | $34,657,264 |
11. Other.
The Fund's organizational documents provide former and current trustees and officers with a limited indemnification against liabilities arising in connection with the performance of their duties to the Fund. In the normal course of business, the Fund may also enter into contracts that provide general indemnifications. The Fund's maximum exposure under these arrangements is unknown as this would be dependent on future claims that may be made against the Fund. The risk of material loss from such claims is considered remote.
At the end of the period, Strategic Advisers Small-Mid Cap Fund was the owner of record of approximately 11% of the total outstanding shares of the Fund.
Report of Independent Registered Public Accounting Firm
To the Trustees of Fidelity Securities Fund and Shareholders of Fidelity Small Cap Value Fund:
In our opinion, the accompanying statement of assets and liabilities, including the schedule of investments, and the related statements of operations and of changes in net assets and the financial highlights present fairly, in all material respects, the financial position of Fidelity Small Cap Value Fund (a fund of Fidelity Securities Fund) at July 31, 2016, the results of its operations for the year then ended, the changes in its net assets for each of the two years in the period then ended and the financial highlights for each of the five years in the period then ended, in conformity with accounting principles generally accepted in the United States of America. These financial statements and financial highlights (hereafter referred to as “financial statements”) are the responsibility of the Fidelity Small Cap Value Fund’s management. Our responsibility is to express an opinion on these financial statements based on our audits. We conducted our audits of these financial statements in accordance with the standards of the Public Company Accounting Oversight Board (United States). Those standards require that we plan and perform the audit to obtain reasonable assurance about whether the financial statements are free of material misstatement. An audit includes examining, on a test basis, evidence supporting the amounts and disclosures in the financial statements, assessing the accounting principles used and significant estimates made by management, and evaluating the overall financial statement presentation. We believe that our audits, which included confirmation of securities at July 31, 2016 by correspondence with the custodian and brokers, provide a reasonable basis for our opinion.
PricewaterhouseCoopers LLP
Boston, Massachusetts
September 14, 2016
Trustees and Officers
The Trustees, Members of the Advisory Board (if any), and officers of the trust and fund, as applicable, are listed below. The Board of Trustees governs the fund and is responsible for protecting the interests of shareholders. The Trustees are experienced executives who meet periodically throughout the year to oversee the fund's activities, review contractual arrangements with companies that provide services to the fund, oversee management of the risks associated with such activities and contractual arrangements, and review the fund's performance. Each of the Trustees oversees 170 funds.
The Trustees hold office without limit in time except that (a) any Trustee may resign; (b) any Trustee may be removed by written instrument, signed by at least two-thirds of the number of Trustees prior to such removal; (c) any Trustee who requests to be retired or who has become incapacitated by illness or injury may be retired by written instrument signed by a majority of the other Trustees; and (d) any Trustee may be removed at any special meeting of shareholders by a two-thirds vote of the outstanding voting securities of the trust. Each Trustee who is not an interested person (as defined in the 1940 Act) of the trust and the fund is referred to herein as an Independent Trustee. Each Independent Trustee shall retire not later than the last day of the calendar year in which his or her 75th birthday occurs. The Independent Trustees may waive this mandatory retirement age policy with respect to individual Trustees. Officers and Advisory Board Members hold office without limit in time, except that any officer or Advisory Board Member may resign or may be removed by a vote of a majority of the Trustees at any regular meeting or any special meeting of the Trustees. Except as indicated, each individual has held the office shown or other offices in the same company for the past five years.
The fund’s Statement of Additional Information (SAI) includes more information about the Trustees. To request a free copy, call Fidelity at 1-800-544-8544.
Experience, Skills, Attributes, and Qualifications of the Trustees. The Governance and Nominating Committee has adopted a statement of policy that describes the experience, qualifications, attributes, and skills that are necessary and desirable for potential Independent Trustee candidates (Statement of Policy). The Board believes that each Trustee satisfied at the time he or she was initially elected or appointed a Trustee, and continues to satisfy, the standards contemplated by the Statement of Policy. The Governance and Nominating Committee also engages professional search firms to help identify potential Independent Trustee candidates who have the experience, qualifications, attributes, and skills consistent with the Statement of Policy. From time to time, additional criteria based on the composition and skills of the current Independent Trustees, as well as experience or skills that may be appropriate in light of future changes to board composition, business conditions, and regulatory or other developments, have also been considered by the professional search firms and the Governance and Nominating Committee. In addition, the Board takes into account the Trustees' commitment and participation in Board and committee meetings, as well as their leadership of standing and ad hoc committees throughout their tenure.
In determining that a particular Trustee was and continues to be qualified to serve as a Trustee, the Board has considered a variety of criteria, none of which, in isolation, was controlling. The Board believes that, collectively, the Trustees have balanced and diverse experience, qualifications, attributes, and skills, which allow the Board to operate effectively in governing the fund and protecting the interests of shareholders. Information about the specific experience, skills, attributes, and qualifications of each Trustee, which in each case led to the Board's conclusion that the Trustee should serve (or continue to serve) as a trustee of the fund, is provided below.
Board Structure and Oversight Function. James C. Curvey is an interested person and currently serves as Chairman. The Trustees have determined that an interested Chairman is appropriate and benefits shareholders because an interested Chairman has a personal and professional stake in the quality and continuity of services provided to the fund. Independent Trustees exercise their informed business judgment to appoint an individual of their choosing to serve as Chairman, regardless of whether the Trustee happens to be independent or a member of management. The Independent Trustees have determined that they can act independently and effectively without having an Independent Trustee serve as Chairman and that a key structural component for assuring that they are in a position to do so is for the Independent Trustees to constitute a substantial majority for the Board. The Independent Trustees also regularly meet in executive session. Ned C. Lautenbach serves as Chairman of the Independent Trustees and as such (i) acts as a liaison between the Independent Trustees and management with respect to matters important to the Independent Trustees and (ii) with management prepares agendas for Board meetings.
Fidelity® funds are overseen by different Boards of Trustees. The fund's Board oversees Fidelity's high income and certain equity funds, and other Boards oversee Fidelity's investment-grade bond, money market, asset allocation, and sector funds. The asset allocation funds may invest in Fidelity® funds overseen by the fund's Board. The use of separate Boards, each with its own committee structure, allows the Trustees of each group of Fidelity® funds to focus on the unique issues of the funds they oversee, including common research, investment, and operational issues. On occasion, the separate Boards establish joint committees to address issues of overlapping consequences for the Fidelity® funds overseen by each Board.
The Trustees operate using a system of committees to facilitate the timely and efficient consideration of all matters of importance to the Trustees, the fund, and fund shareholders and to facilitate compliance with legal and regulatory requirements and oversight of the fund's activities and associated risks. The Board, acting through its committees, has charged FMR and its affiliates with (i) identifying events or circumstances the occurrence of which could have demonstrably adverse effects on the fund's business and/or reputation; (ii) implementing processes and controls to lessen the possibility that such events or circumstances occur or to mitigate the effects of such events or circumstances if they do occur; and (iii) creating and maintaining a system designed to evaluate continuously business and market conditions in order to facilitate the identification and implementation processes described in (i) and (ii) above. Because the day-to-day operations and activities of the fund are carried out by or through FMR, its affiliates, and other service providers, the fund's exposure to risks is mitigated but not eliminated by the processes overseen by the Trustees. While each of the Board's committees has responsibility for overseeing different aspects of the fund's activities, oversight is exercised primarily through the Operations, Audit, and Compliance Committees. In addition, the Independent Trustees have worked with FMR to enhance the Board's oversight of investment and financial risks, legal and regulatory risks, technology risks, and operational risks, including the development of additional risk reporting to the Board. For example, a working group comprised of Independent Trustees and FMR has worked and continues to work to review the Fidelity® funds' valuation-related activities, reporting and risk management. Appropriate personnel, including but not limited to the fund's Chief Compliance Officer (CCO), FMR's internal auditor, the independent accountants, the fund's Treasurer and portfolio management personnel, make periodic reports to the Board's committees, as appropriate, including an annual review of Fidelity's risk management program for the Fidelity® funds. The responsibilities of each standing committee, including their oversight responsibilities, are described further under "Standing Committees of the Trustees."
Interested Trustees*:
Correspondence intended for a Trustee who is an interested person may be sent to Fidelity Investments, 245 Summer Street, Boston, Massachusetts 02210.
Name, Year of Birth; Principal Occupations and Other Relevant Experience+
James C. Curvey (1935)
Year of Election or Appointment: 2007
Trustee
Chairman of the Board of Trustees
Mr. Curvey also serves as Trustee of other Fidelity® funds. Mr. Curvey is a Director of Fidelity Research & Analysis Co. (investment adviser firm, 2009-present), and Vice Chairman (2007-present) and Director of FMR LLC (diversified financial services company). In addition, Mr. Curvey serves as an Overseer for the Boston Symphony Orchestra and a member of the board of Artis-Naples, Naples, Florida, and as a Trustee for Brewster Academy, Wolfeboro, New Hampshire. Previously, Mr. Curvey served as a Director of Fidelity Investments Money Management, Inc. (investment adviser firm, 2009-2014) and a Director of FMR and FMR Co., Inc. (investment adviser firms, 2007-2014).
Charles S. Morrison (1960)
Year of Election or Appointment: 2014
Trustee
Mr. Morrison also serves as Trustee of other funds. He serves as a Director of Fidelity Investments Money Management, Inc. (FIMM) (investment adviser firm, 2014-present), Director of Fidelity SelectCo, LLC (investment adviser firm, 2014-present), President, Asset Management (2014-present), and is an employee of Fidelity Investments. Previously, Mr. Morrison served as Vice President of Fidelity's Fixed Income and Asset Allocation Funds (2012-2014), President, Fixed Income (2011-2014), Vice President of Fidelity's Money Market Funds (2005-2009), President, Money Market Group Leader of FMR (investment adviser firm, 2009), and Senior Vice President, Money Market Group of FMR (2004-2009). Mr. Morrison also served as Vice President of Fidelity's Bond Funds (2002-2005), certain Balanced Funds (2002-2005), and certain Asset Allocation Funds (2002-2007), and as Senior Vice President (2002-2005) of Fidelity's Bond Division.
* Determined to be an “Interested Trustee” by virtue of, among other things, his or her affiliation with the trust or various entities under common control with FMR.
+ The information includes the Trustee's principal occupation during the last five years and other information relating to the experience, attributes, and skills relevant to the Trustee's qualifications to serve as a Trustee, which led to the conclusion that the Trustee should serve as a Trustee for the fund.
Independent Trustees:
Correspondence intended for an Independent Trustee may be sent to Fidelity Investments, P.O. Box 55235, Boston, Massachusetts 02205-5235.
Name, Year of Birth; Principal Occupations and Other Relevant Experience+
Dennis J. Dirks (1948)
Year of Election or Appointment: 2005
Trustee
Mr. Dirks also serves as Trustee of other Fidelity® funds. Prior to his retirement in May 2003, Mr. Dirks was Chief Operating Officer and a member of the Board of The Depository Trust & Clearing Corporation (DTCC). He also served as President, Chief Operating Officer, and Board member of The Depository Trust Company (DTC) and President and Board member of the National Securities Clearing Corporation (NSCC). In addition, Mr. Dirks served as Chief Executive Officer and Board member of the Government Securities Clearing Corporation, Chief Executive Officer and Board member of the Mortgage-Backed Securities Clearing Corporation, as a Trustee and a member of the Finance Committee of Manhattan College (2005-2008), as a Trustee and a member of the Finance Committee of AHRC of Nassau County (2006-2008), and as a member of the Independent Directors Council (IDC) Governing Council (2010-2015). Mr. Dirks is a member of the Board of Directors for The Brookville Center for Children's Services, Inc. (2009-present).
Alan J. Lacy (1953)
Year of Election or Appointment: 2008
Trustee
Mr. Lacy also serves as Trustee of other Fidelity® funds. Mr. Lacy serves as Chairman (2014-present) and a member (2010-present) of the Board of Directors of Dave & Buster's Entertainment, Inc. (restaurant and entertainment complexes) and a Director of Bristol-Myers Squibb Company (global pharmaceuticals, 2008-present). He is a Trustee of the California Chapter of The Nature Conservancy (2015-present) and a Director of the Center for Advanced Study in the Behavioral Sciences at Stanford University (2015-present). In addition, Mr. Lacy served as Senior Adviser (2007-2014) of Oak Hill Capital Partners, L.P. (private equity) and also served as Chief Executive Officer (2005) and Vice Chairman (2005-2006) of Sears Holdings Corporation (retail) and Chief Executive Officer and Chairman of the Board of Sears, Roebuck and Co. (retail, 2000-2005). Previously, Mr. Lacy served as Chairman (2008-2011) and a member (2006-2015) of the Board of Trustees of the National Parks Conservation Association and as a member of the Board of Directors for The Western Union Company (global money transfer, 2006-2011), The Hillman Companies, Inc. (hardware wholesalers, 2010-2014), and Earth Fare, Inc. (retail grocery, 2010-2014).
Ned C. Lautenbach (1944)
Year of Election or Appointment: 2000
Trustee
Chairman of the Independent Trustees
Mr. Lautenbach also serves as Trustee of other Fidelity® funds. Mr. Lautenbach currently serves as the Lead Director of the Eaton Corporation Board of Directors (diversified industrial, 1997-present). Mr. Lautenbach is Chairman of the Board of Directors of Artis-Naples in Naples, Florida (2012-present), a member of the Council on Foreign Relations (1994-present), and a member of the Board of Governors, State University System of Florida (2013-present). Previously, Mr. Lautenbach was a Partner/Advisory Partner at Clayton, Dubilier & Rice, LLC (private equity investment, 1998-2010), as well as a Director of Sony Corporation (2006-2007).
Joseph Mauriello (1944)
Year of Election or Appointment: 2008
Trustee
Mr. Mauriello also serves as Trustee of other Fidelity® funds. Prior to his retirement in January 2006, Mr. Mauriello served in numerous senior management positions including Deputy Chairman and Chief Operating Officer (2004-2005), and Vice Chairman of Financial Services (2002-2004) of KPMG LLP US (professional services, 1965-2005). Mr. Mauriello currently serves as a member of the Board of Directors of XL Group plc. (global insurance and re-insurance, 2006-present) and the Independent Directors Council (IDC) Governing Council (2015-present). Previously, Mr. Mauriello served as a Director of the Hamilton Funds of the Bank of New York (2006-2007) and of Arcadia Resources Inc. (health care services and products, 2007-2012).
Robert W. Selander (1950)
Year of Election or Appointment: 2011
Trustee
Mr. Selander also serves as Trustee of other Fidelity® funds. Mr. Selander serves as a Director of The Western Union Company (global money transfer, 2014-present) and a non-executive Chairman of Health Equity, Inc. (health savings custodian, 2015-present). Previously, Mr. Selander served as a Member of the Advisory Board of certain Fidelity® funds (2011), and Executive Vice Chairman (2010), Chief Executive Officer (2009-2010), and President and Chief Executive Officer (1997-2009) of Mastercard, Inc.
Cornelia M. Small (1944)
Year of Election or Appointment: 2005
Trustee
Ms. Small also serves as Trustee of other Fidelity® funds. Ms. Small is a member of the Board of Directors (2009-present) and Chair of the Investment Committee (2010-present) of the Teagle Foundation. Ms. Small also serves on the Investment Committee of the Berkshire Taconic Community Foundation (2008-present). Previously, Ms. Small served as Chairperson (2002-2008) and a member of the Investment Committee and Chairperson (2008-2012) and a member of the Board of Trustees of Smith College. In addition, Ms. Small served as Chief Investment Officer, Director of Global Equity Investments, and a member of the Board of Directors of Scudder, Stevens & Clark and Scudder Kemper Investments.
William S. Stavropoulos (1939)
Year of Election or Appointment: 2002
Trustee
Vice Chairman of the Independent Trustees
Mr. Stavropoulos also serves as Trustee of other Fidelity® funds. Mr. Stavropoulos serves as President and Founder of the Michigan Baseball Foundation, the Great Lakes Loons (2007-present). Mr. Stavropoulos is Chairman Emeritus of the Board of Directors of The Dow Chemical Company, where he previously served in numerous senior management positions, including President, CEO (1995-2000; 2002-2004), Chairman of the Executive Committee (2000-2006), and as a member of the Board of Directors (1990-2006). Currently, Mr. Stavropoulos is Chairman of the Board of Directors of Univar Inc. (global distributor of commodity and specialty chemicals), a Director of Teradata Corporation (data warehousing and technology solutions), and Maersk Inc. (industrial conglomerate), and a member of the Advisory Board for Metalmark Capital LLC (private equity investment, 2005-present). Mr. Stavropoulos is an operating advisor to Clayton, Dubilier & Rice, LLC (private equity investment). In addition, Mr. Stavropoulos is a member of the University of Notre Dame Advisory Council for the College of Science, a Trustee of the Rollin L. Gerstacker Foundation, and a Director of the Naples Philharmonic Center for the Arts. Previously, Mr. Stavropoulos served as a Director of Chemical Financial Corporation (bank holding company, 1993-2012) and Tyco International, Ltd. (multinational manufacturing and services, 2007-2012).
David M. Thomas (1949)
Year of Election or Appointment: 2008
Trustee
Mr. Thomas also serves as Trustee of other Fidelity® funds. Mr. Thomas serves as Non-Executive Chairman of the Board of Directors of Fortune Brands Home and Security (home and security products, 2011-present), as a member of the Board of Directors (2004-present) and Presiding Director (2013-present) of Interpublic Group of Companies, Inc. (marketing communication), and as a member of the Board of Trustees of the University of Florida (2013-present). Previously, Mr. Thomas served as Executive Chairman (2005-2006) and Chairman and Chief Executive Officer (2000-2005) of IMS Health, Inc. (pharmaceutical and healthcare information solutions), and a Director of Fortune Brands, Inc. (consumer products, 2000-2011).
+ The information includes the Trustee's principal occupation during the last five years and other information relating to the experience, attributes, and skills relevant to the Trustee's qualifications to serve as a Trustee, which led to the conclusion that the Trustee should serve as a Trustee for the fund.
Advisory Board Members and Officers:
Correspondence intended for an officer or Peter S. Lynch may be sent to Fidelity Investments, 245 Summer Street, Boston, Massachusetts 02210. Officers appear below in alphabetical order.
Name, Year of Birth; Principal Occupation
Peter S. Lynch (1944)
Year of Election or Appointment: 2003
Member of the Advisory Board
Mr. Lynch also serves as Member of the Advisory Board of other Fidelity® funds. Mr. Lynch is Vice Chairman and a Director of FMR (investment adviser firm) and FMR Co., Inc. (investment adviser firm). In addition, Mr. Lynch serves as a Trustee of Boston College and as the Chairman of the Inner-City Scholarship Fund. Previously, Mr. Lynch served on the Special Olympics International Board of Directors (1997-2006).
Marc R. Bryant (1966)
Year of Election or Appointment: 2015
Secretary and Chief Legal Officer (CLO)
Mr. Bryant also serves as Secretary and CLO of other funds. Mr. Bryant serves as CLO, Secretary, and Senior Vice President of Fidelity Management & Research Company (investment adviser firm, 2015-present) and FMR Co., Inc. (investment adviser firm, 2015-present); Secretary of Fidelity SelectCo, LLC (investment adviser firm, 2015-present) and Fidelity Investments Money Management, Inc. (investment adviser firm, 2015-present); and CLO of Fidelity Management & Research (Hong Kong) Limited and FMR Investment Management (U.K.) Limited (investment adviser firms, 2015-present) and Fidelity Management & Research (Japan) Limited (investment adviser firm, 2016-present). He is Senior Vice President and Deputy General Counsel of FMR LLC (diversified financial services company). Previously, Mr. Bryant served as Secretary and CLO of Fidelity Rutland Square Trust II (2010-2014) and Assistant Secretary of Fidelity's Fixed Income and Asset Allocation Funds (2013-2015). Prior to joining Fidelity Investments, Mr. Bryant served as a Senior Vice President and the Head of Global Retail Legal for AllianceBernstein L.P. (2006-2010), and as the General Counsel for ProFund Advisors LLC (2001-2006).
Jeffrey S. Christian (1961)
Year of Election or Appointment: 2016
Assistant Treasurer
Mr. Christian also serves as Assistant Treasurer of other funds. Mr. Christian is an employee of Fidelity Investments (2003-present).
William C. Coffey (1969)
Year of Election or Appointment: 2009
Assistant Secretary
Mr. Coffey also serves as Assistant Secretary of other funds. He is Senior Vice President and Deputy General Counsel of FMR LLC (diversified financial services company, 2010-present), and is an employee of Fidelity Investments. Previously, Mr. Coffey served as Vice President and Associate General Counsel of FMR LLC (2005-2009).
Jonathan Davis (1968)
Year of Election or Appointment: 2010
Assistant Treasurer
Mr. Davis also serves as Assistant Treasurer of other funds, and is an employee of Fidelity Investments. Previously, Mr. Davis served as Vice President and Associate General Counsel of FMR LLC (diversified financial services company, 2003-2010).
Adrien E. Deberghes (1967)
Year of Election or Appointment: 2016
Assistant Treasurer
Mr. Deberghes also serves as an officer of other funds. He serves as Executive Vice President of Fidelity Investments Money Management, Inc. (FIMM) (investment adviser firm, 2016-present) and is an employee of Fidelity Investments (2008-present). Prior to joining Fidelity Investments, Mr. Deberghes was Senior Vice President of Mutual Fund Administration at State Street Corporation (2007-2008), Senior Director of Mutual Fund Administration at Investors Bank & Trust (2005-2007), and Director of Finance for Dunkin' Brands (2000-2005). Previously, Mr. Deberghes served in other fund officer roles.
Stephanie J. Dorsey (1969)
Year of Election or Appointment: 2010
Assistant Treasurer
Ms. Dorsey also serves as an officer of other funds. She is an employee of Fidelity Investments (2008-present) and has served in other fund officer roles. Prior to joining Fidelity Investments, Ms. Dorsey served as Treasurer (2004-2008) of the JPMorgan Mutual Funds and Vice President (2004-2008) of JPMorgan Chase Bank.
Howard J. Galligan III (1966)
Year of Election or Appointment: 2014
Chief Financial Officer
Mr. Galligan also serves as Chief Financial Officer of other funds. Mr. Galligan serves as President of Fidelity Pricing and Cash Management Services (FPCMS) (2014-present) and as a Director of Strategic Advisers, Inc. (investment adviser firm, 2008-present). Previously, Mr. Galligan served as Chief Administrative Officer of Asset Management (2011-2014) and Chief Operating Officer and Senior Vice President of Investment Support for Strategic Advisers, Inc. (2003-2011).
Scott C. Goebel (1968)
Year of Election or Appointment: 2015
Vice President
Mr. Goebel serves as Vice President of other funds and is an employee of Fidelity Investments (2001-present). Mr. Goebel serves as Senior Vice President of Fidelity Management & Research Company (FMR) (investment adviser firm, 2016-present). Previously, Mr. Goebel served as Secretary of Fidelity SelectCo, LLC (investment adviser firm, 2013-2015), Fidelity Investments Money Management, Inc. (FIMM) (investment adviser firm, 2010-2015), and Fidelity Research and Analysis Company (FRAC) (investment adviser firm, 2010-2015); General Counsel, Secretary, and Senior Vice President of FMR (investment adviser firm, 2008-2015) and FMR Co., Inc. (investment adviser firm, 2008-2015); Assistant Secretary of Fidelity Management & Research (Japan) Limited (investment adviser firm, 2008-2015) and Fidelity Management & Research (U.K.) Inc. (investment adviser firm, 2008-2015); Chief Legal Officer (CLO) of Fidelity Management & Research (Hong Kong) Limited (investment adviser firm, 2008-2015); Secretary and CLO of certain Fidelity® funds (2008-2015); Assistant Secretary of FIMM (2008-2010), FRAC (2008-2010), and certain funds (2007-2008); and as Vice President and Secretary of Fidelity Distributors Corporation (FDC) (2005-2007).
Thomas C. Hense (1964)
Year of Election or Appointment: 2008, 2010, or 2015
Vice President
Mr. Hense serves as Vice President of Fidelity Advisor® Multi-Asset Income Fund (2015) and other funds (High Income (2008), Small Cap (2008), and Value (2010) funds), and is an employee of Fidelity Investments (1993-present). Previously, Mr. Hense served as a portfolio manager for Fidelity's Institutional Money Management Group (Pyramis) (2003-2008).
Brian B. Hogan (1964)
Year of Election or Appointment: 2009
Vice President
Mr. Hogan also serves as Trustee or Vice President of other funds. Mr. Hogan serves as a Director of FMR Investment Management (U.K.) Limited (investment adviser firm, 2015-present) and Fidelity SelectCo, LLC (investment adviser firm, 2014-present) and President of the Equity Division of FMR (investment adviser firm, 2009-present). Previously, Mr. Hogan served as Senior Vice President, Equity Research of FMR (2006-2009) and as a portfolio manager. Mr. Brian B. Hogan is not related to Mr. Colm A. Hogan.
Colm A. Hogan (1973)
Year of Election or Appointment: 2016
Deputy Treasurer
Mr. Hogan also serves as an officer of other funds. Mr. Hogan is an employee of Fidelity Investments (2005-present). Mr. Colm A. Hogan is not related to Mr. Brian B. Hogan.
Chris Maher (1972)
Year of Election or Appointment: 2013
Assistant Treasurer
Mr. Maher serves as Assistant Treasurer of other funds. Mr. Maher is Vice President of Valuation Oversight and is an employee of Fidelity Investments. Previously, Mr. Maher served as Vice President of Asset Management Compliance (2013), Vice President of the Program Management Group of FMR (investment adviser firm, 2010-2013), and Vice President of Valuation Oversight (2008-2010).
John F. Papandrea (1972)
Year of Election or Appointment: 2016
Anti-Money Laundering (AML) Officer
Mr. Papandrea also serves as AML Officer of other funds. Mr. Papandrea is Vice President of FMR LLC (diversified financial services company, 2008-present) and is an employee of Fidelity Investments (2005-present).
Kenneth B. Robins (1969)
Year of Election or Appointment: 2016
Chief Compliance Officer
Mr. Robins also serves as an officer of other funds. Mr. Robins serves as Compliance Officer of Fidelity Management & Research Company and FMR Co., Inc. (investment adviser firms, 2016-present) and is an employee of Fidelity Investments (2004-present). Previously, Mr. Robins served as Executive Vice President of Fidelity Investments Money Management, Inc. (investment adviser firm, 2013-2016) and served in other fund officer roles.
Stacie M. Smith (1974)
Year of Election or Appointment: 2016
President and Treasurer
Ms. Smith also serves as an officer of other funds. She is an employee of Fidelity Investments (2009-present) and has served in other fund officer roles. Prior to joining Fidelity Investments, Ms. Smith served as Senior Audit Manager of Ernst & Young LLP (1996-2009). Previously, Ms. Smith served as Deputy Treasurer of certain Fidelity® funds (2013-2016).
Renee Stagnone (1975)
Year of Election or Appointment: 2016
Assistant Treasurer
Ms. Stagnone also serves as an officer of other funds. Ms. Stagnone is an employee of Fidelity Investments (1997-present). Previously, Ms. Stagnone served as Deputy Treasurer of certain Fidelity® funds (2013-2016).
Shareholder Expense Example
As a shareholder of the Fund, you incur two types of costs: (1) transaction costs, including sales charges (loads) on purchase payments or redemption proceeds, redemption fees and (2) ongoing costs, including management fees, distribution and/or service (12b-1) fees and other Fund expenses. This Example is intended to help you understand your ongoing costs (in dollars) of investing in the Fund and to compare these costs with the ongoing costs of investing in other mutual funds.
The Example is based on an investment of $1,000 invested at the beginning of the period and held for the entire period (February 1, 2016 to July 31, 2016).
Actual Expenses
The first line of the accompanying table for each class of the Fund provides information about actual account values and actual expenses. You may use the information in this line, together with the amount you invested, to estimate the expenses that you paid over the period. Simply divide your account value by $1,000.00 (for example, an $8,600 account value divided by $1,000.00 = 8.6), then multiply the result by the number in the first line for a class of the Fund under the heading entitled "Expenses Paid During Period" to estimate the expenses you paid on your account during this period. A small balance maintenance fee of $12.00 that is charged once a year may apply for certain accounts with a value of less than $2,000. This fee is not included in the table below. If it was, the estimate of expenses you paid during the period would be higher, and your ending account value lower, by this amount. In addition, the Fund, as a shareholder in the underlying Fidelity Central Funds, will indirectly bear its pro-rata share of the fees and expenses incurred by the underlying Fidelity Central Funds. These fees and expenses are not included in the Fund's annualized expense ratio used to calculate the expense estimate in the table below.
Hypothetical Example for Comparison Purposes
The second line of the accompanying table for each class of the Fund provides information about hypothetical account values and hypothetical expenses based on a Class' actual expense ratio and an assumed rate of return of 5% per year before expenses, which is not the Class' actual return. The hypothetical account values and expenses may not be used to estimate the actual ending account balance or expenses you paid for the period. You may use this information to compare the ongoing costs of investing in the Fund and other funds. To do so, compare this 5% hypothetical example with the 5% hypothetical examples that appear in the shareholder reports of the other funds. A small balance maintenance fee of $12.00 that is charged once a year may apply for certain accounts with a value of less than $2,000. This fee is not included in the table below. If it was, the estimate of expenses you paid during the period would be higher, and your ending account value lower, by this amount. In addition, the Fund, as a shareholder in the underlying Fidelity Central Funds, will indirectly bear its pro-rata share of the fees and expenses incurred by the underlying Fidelity Central Funds. These fees and expenses are not included in the Fund's annualized expense ratio used to calculate the expense estimate in the table below.
Please note that the expenses shown in the table are meant to highlight your ongoing costs only and do not reflect any transaction costs. Therefore, the second line of the table is useful in comparing ongoing costs only, and will not help you determine the relative total costs of owning different funds. In addition, if these transactional costs were included, your costs would have been higher.
| | Annualized Expense Ratio-A | Beginning
Account Value
February 1, 2016 | Ending
Account Value
July 31, 2016 | Expenses Paid
During Period-B
February 1, 2016
to July 31, 2016 |
| Class A | 1.39% | | | |
| Actual | | $1,000.00 | $1,134.90 | $7.38 |
| Hypothetical-C | | $1,000.00 | $1,017.95 | $6.97 |
| Class T | 1.63% | | | |
| Actual | | $1,000.00 | $1,133.10 | $8.64 |
| Hypothetical-C | | $1,000.00 | $1,016.76 | $8.17 |
| Class C | 2.15% | | | |
| Actual | | $1,000.00 | $1,130.00 | $11.39 |
| Hypothetical-C | | $1,000.00 | $1,014.17 | $10.77 |
| Small Cap Value | 1.15% | | | |
| Actual | | $1,000.00 | $1,135.20 | $6.11 |
| Hypothetical-C | | $1,000.00 | $1,019.14 | $5.77 |
| Class I | 1.12% | | | |
| Actual | | $1,000.00 | $1,135.80 | $5.95 |
| Hypothetical-C | | $1,000.00 | $1,019.29 | $5.62 |
A Annualized expense ratio reflects expenses net of applicable fee waivers.
B Expenses are equal to each Class' annualized expense ratio, multiplied by the average account value over the period, multiplied by 182/366 (to reflect the one-half year period).
C 5% return per year before expenses
Distributions (Unaudited)
The Board of Trustees of Fidelity Small Cap Value Fund voted to pay to shareholders of record at the opening of business on record date, the following distributions per share derived from capital gains realized from sales of portfolio securities, and dividends derived from net investment income:
| | Pay Date | Record Date | Dividends | Capital Gains |
| | | | | |
| Class A | 09/12/16 | 09/09/16 | $0.017 | $1.070 |
| Class T | 09/12/16 | 09/09/16 | $0.000 | $1.070 |
| Class C | 09/12/16 | 09/09/16 | $0.000 | $1.070 |
| Fidelity Small Cap Value | 09/12/16 | 09/09/16 | $0.043 | $1.070 |
| Class I | 09/12/16 | 09/09/16 | $0.046 | $1.070 |
The fund hereby designates as a capital gain dividend with respect to the taxable year ended July 31, 2016, $246,151,748, or, if subsequently determined to be different, the net capital gain of such year.
Class A, Class T, Fidelity Small Cap Value Fund and Class I designate 100% of the dividends distributed in September and December during the fiscal year as qualifying for the dividends–received deduction for corporate shareholders.
Class A, Class T, Fidelity Small Cap Value Fund and Class I designate 100% of the dividends distributed in September and December during the fiscal year as amounts which may be taken into account as a dividend for purposes of the maximum rate under section 1(h)(11) of the Internal Revenue Code.
The fund will notify shareholders in January 2017 of amounts for use in preparing 2016 income tax returns.
Board Approval of Investment Advisory Contracts and Management Fees
Fidelity Small Cap Value Fund
Each year, the Board of Trustees, including the Independent Trustees (together, the Board), votes on the renewal of the management contract with Fidelity Management & Research Company (FMR) and the sub-advisory agreements (together, the Advisory Contracts) for the fund. The Board, assisted by the advice of fund counsel and Independent Trustees' counsel, requests and considers a broad range of information relevant to the renewal of the Advisory Contracts throughout the year.
The Board meets regularly and, at each of its meetings, covers an extensive agenda of topics and materials and considers factors that are relevant to its annual consideration of the renewal of the fund's Advisory Contracts, including the services and support provided to the fund and its shareholders. The Board has established various standing committees (Committees), each composed of and chaired by Independent Trustees with varying backgrounds, to which the Board has assigned specific subject matter responsibilities in order to enhance effective decision-making by the Board. The Board, acting directly and through its Committees, requests and receives information concerning the annual consideration of the renewal of the fund's Advisory Contracts. The Board also meets as needed to consider matters specifically related to the Board's annual consideration of the renewal of the Advisory Contracts. Members of the Board may also meet with trustees of other Fidelity funds through ad hoc joint committees to discuss certain matters relevant to all of the Fidelity funds.
At its July 2016 meeting, the Board unanimously determined to renew the fund's Advisory Contracts. In reaching its determination, the Board considered all factors it believed relevant, including (i) the nature, extent, and quality of the services to be provided to the fund and its shareholders (including the investment performance of the fund); (ii) the competitiveness of the fund's management fee and total expense ratio relative to peer funds; (iii) the total costs of the services to be provided by and the profits to be realized by Fidelity from its relationships with the fund; and (iv) the extent to which, if any, economies of scale exist and would be realized as the fund grows, and whether any economies of scale are appropriately shared with fund shareholders.
In considering whether to renew the Advisory Contracts for the fund, the Board reached a determination, with the assistance of fund counsel and Independent Trustees' counsel and through the exercise of its business judgment, that the renewal of the Advisory Contracts was in the best interests of the fund and its shareholders and that the compensation payable under the Advisory Contracts was fair and reasonable. The Board's decision to renew the Advisory Contracts was not based on any single factor, but rather was based on a comprehensive consideration of all the information provided to the Board at its meetings throughout the year. The Board, in reaching its determination to renew the Advisory Contracts, was aware that shareholders of the fund have a broad range of investment choices available to them, including a wide choice among funds offered by Fidelity's competitors, and that the fund's shareholders, who have the opportunity to review and weigh the disclosure provided by the fund in its prospectus and other public disclosures, have chosen to invest in this fund, which is part of the Fidelity family of funds.
Nature, Extent, and Quality of Services Provided. The Board considered Fidelity's staffing as it relates to the fund, including the backgrounds of investment personnel of Fidelity, and also considered the fund's investment objective, strategies, and related investment philosophy. The Independent Trustees also had discussions with senior management of Fidelity's investment operations and investment groups. The Board considered the structure of the investment personnel compensation program and whether this structure provides appropriate incentives to act in the best interests of the fund. Additionally, the Board considered the portfolio managers' investments, if any, in the funds that they manage.
Resources Dedicated to Investment Management and Support Services. The Board and the Fund Oversight and Research Committees reviewed the general qualifications and capabilities of Fidelity's investment staff, including its size, education, experience, and resources, as well as Fidelity's approach to recruiting, training, managing, and compensating investment personnel. The Board noted that Fidelity has continued to increase the resources devoted to non-U.S. offices, including expansion of Fidelity's global investment organization. The Board also noted that Fidelity's analysts have extensive resources, tools and capabilities that allow them to conduct sophisticated quantitative and fundamental analysis, as well as credit analysis of issuers, counterparties and guarantors. Further, the Board considered that Fidelity's investment professionals have sufficient access to global information and data so as to provide competitive investment results over time, and that those professionals also have access to sophisticated tools that permit them to assess portfolio construction and risk and performance attribution characteristics continuously, as well as to transmit new information and research conclusions rapidly around the world. Additionally, in its deliberations, the Board considered Fidelity's trading, risk management, compliance, and technology and operations capabilities and resources, which are integral parts of the investment management process.
Shareholder and Administrative Services. The Board considered (i) the nature, extent, quality, and cost of advisory, administrative, and shareholder services performed by FMR, the sub-advisers (together with FMR, the Investment Advisers), and their affiliates under the Advisory Contracts and under separate agreements covering transfer agency, pricing and bookkeeping, and securities lending services for the fund; (ii) the nature and extent of the supervision of third party service providers, principally custodians, subcustodians, and pricing vendors; and (iii) the resources devoted to, and the record of compliance with, the fund's compliance policies and procedures. The Board also reviewed the allocation of fund brokerage, including allocations to brokers affiliated with the Investment Advisers, the use of brokerage commissions to pay fund expenses, and the use of "soft" commission dollars to pay for research services.
The Board noted that the growth of fund assets over time across the complex allows Fidelity to reinvest in the development of services designed to enhance the value or convenience of the Fidelity funds as investment vehicles. These services include 24-hour access to account information and market information through telephone representatives and over the Internet, investor education materials and asset allocation tools, and the expanded availability of Fidelity Investor Centers.
In 2014, the Board formed an ad hoc Committee on Transfer Agency Fees to review the variety of transfer agency fee structures throughout the industry and Fidelity's competitive positioning with respect to industry participants.
Investment in a Large Fund Family. The Board considered the benefits to shareholders of investing in a Fidelity fund, including the benefits of investing in a fund that is part of a large family of funds offering a variety of investment disciplines and providing a large variety of mutual fund investor services. The Board noted that Fidelity had taken, or had made recommendations that resulted in the Fidelity funds taking, a number of actions over the previous year that benefited particular funds, including: (i) continuing to dedicate additional resources to investment research and to the support of the senior management team that oversees asset management; (ii) continuing efforts to enhance Fidelity's global research capabilities; (iii) launching new funds and making other enhancements to meet client needs; (iv) broadening eligibility requirements for certain lower-priced share classes of, and streamlining the fee structure for, certain existing equity index funds; (v) lowering expense caps for certain existing funds and classes to reduce expenses paid by shareholders; (vi) eliminating redemption fees for certain variable insurance product funds and classes; (vii) continuing to launch dedicated lower cost underlying funds to meet portfolio construction needs related to expanding underlying fund options for Fidelity funds of funds, specifically for the Freedom Fund product lines; (viii) launching a lower cost share class for use by the Freedom Index Fund product line; (ix) rationalizing product lines and gaining increased efficiencies through fund mergers and share class consolidations; (x) continuing to develop, acquire and implement systems and technology to improve services to the funds and shareholders, strengthen information security, and increase efficiency; (xi) implementing investment enhancements to further strengthen Fidelity's target date product line to increase investors' probability of success in achieving their goals; (xii) accelerating the conversion of all remaining Class B shares to Class A shares, which have a lower expense structure; and (xiii) implementing changes to Fidelity's money market fund product line in response to recent regulatory reforms.
Investment Performance. The Board considered whether the fund has operated in accordance with its investment objective, as well as its record of compliance with its investment restrictions and its performance history. The Board noted that there were portfolio management changes for the fund in August 2013 and January 2016.
The Board took into account discussions with representatives of the Investment Advisers about fund investment performance that occur at Board meetings throughout the year. In this regard the Board noted that as part of regularly scheduled fund reviews and other reports to the Board on fund performance, the Board considers annualized return information for the fund, for different time periods, measured against a securities market index ("benchmark index") and a peer group of funds with similar objectives ("peer group"), if any. In its evaluation of fund investment performance, the Board gave particular attention to information indicating changes in performance of certain Fidelity funds for specific time periods and discussed with the Investment Advisers the reasons for any overperformance or underperformance.
In addition to reviewing absolute and relative fund performance, the Independent Trustees periodically consider the appropriateness of fund performance metrics in evaluating the results achieved. In general, the Independent Trustees believe that fund performance should be evaluated based on net performance (after fees and expenses) of both the highest performing and lowest performing fund share classes, where applicable, compared to appropriate benchmark indices, over appropriate time periods that may include full market cycles, and compared to peer groups, as applicable, over the same periods, taking into account relevant factors including the following: general market conditions; issuer-specific information; and fund cash flows and other factors.
The Independent Trustees recognize that shareholders evaluate performance on a net basis over their own holding periods, for which one-, three-, and five-year periods are often used as a proxy. For this reason, the performance information reviewed by the Board also included net cumulative calendar year total return information for the fund and an appropriate benchmark index and peer group for the most recent one-, three-, and five-year periods, as shown below. Returns are shown compared to the 25th percentile (top of box, 75% beaten) and 75th percentile (bottom of box, 25% beaten) of the peer universe.
Fidelity Small Cap Value Fund
The Board also considered that the fund's management fee is subject to upward or downward adjustment depending upon whether, and to what extent, the fund's investment performance for the performance period exceeds, or is exceeded by, a securities index, thus leading to a performance adjustment for the same period. The Board noted that the performance adjustment provides FMR with a strong economic incentive to seek to achieve superior performance for the fund's shareholders and helps to more closely align the interests of FMR and the shareholders of the fund.
Based on its review, the Board concluded that the nature, extent, and quality of services provided to the fund under the Advisory Contracts should continue to benefit the shareholders of the fund.
Competitiveness of Management Fee and Total Expense Ratio. The Board considered the fund's management fee and total expense ratio compared to "mapped groups" of competitive funds and classes created for the purpose of facilitating the Trustees' competitive analysis of management fees and total expenses. Fidelity creates "mapped groups" by combining similar Broadridge investment objective categories that have comparable investment mandates. Combining Broadridge investment objective categories aids the Board's management fee and total expense ratio comparisons by broadening the competitive group used for comparison.
Management Fee. The Board considered two proprietary management fee comparisons for the 12-month periods shown in basis points (BP) in the chart below. The group of Broadridge funds used by the Board for management fee comparisons is referred to below as the "Total Mapped Group." The Total Mapped Group comparison focuses on a fund's standing in terms of gross management fees before expense reimbursements or caps, and without giving effect to the fund's performance adjustment, relative to the total universe of funds with comparable investment mandates, regardless of whether their management fee structures also are comparable. Funds with comparable investment mandates offer exposure to similar types of securities. Funds with comparable management fee structures have similar management fee contractual arrangements (
e.g., flat rate charged for advisory services, all-inclusive fee rate,
etc.). "TMG %" represents the percentage of funds in the Total Mapped Group that had management fees that were lower than the fund's. For example, a hypothetical TMG % of 20% would mean that 80% of the funds in the Total Mapped Group had higher, and 20% had lower, management fees than the fund. The fund's actual TMG %s and the number of funds in the Total Mapped Group are in the chart below. The "Asset-Size Peer Group" (ASPG) comparison focuses on a fund's standing relative to a subset of non-Fidelity funds within the Total Mapped Group that are similar in size and management fee structure without taking into account performance adjustments, if any. For example, if a fund is in the first quartile of the ASPG, the fund's management fee ranks in the least expensive or lowest 25% of funds in the ASPG. The ASPG represents at least 15% of the funds in the Total Mapped Group with comparable asset size and management fee structures, subject to a minimum of 50 funds (or all funds in the Total Mapped Group if fewer than 50). Additional information, such as the ASPG quartile in which the fund's management fee rate ranked and the impact of the fund's performance adjustment, is also included in the chart and considered by the Board.
Fidelity Small Cap Value Fund
The Board noted that the fund's management fee rate ranked below the median of its Total Mapped Group and below the median of its ASPG for 2015. The Board also noted the effect of the fund's performance adjustment, if any, on the fund's management fee ranking. The Board noted that the comparisons for 2015 reflect a revised Total Mapped Group that no longer includes funds with micro-cap objectives and that FMR believes this Total Mapped Group is a more appropriate comparison because the fund does not have a micro-cap objective.
The Board noted that, in 2014, the ad hoc Committee on Group Fee was formed by it and the boards of other Fidelity funds to conduct an in-depth review of the "group fee" component of the management fee of funds with such management fee structures. The Committee's focus included the mechanics of the group fee, the competitive landscape of group fee structures, Fidelity funds with no group fee component and investment products not included in group fee assets. The Board also considered that, for funds subject to the group fee, FMR agreed to voluntarily waive fees over a specified period of time in amounts designed to account for assets converted from certain funds to certain collective investment trusts.
The Board also noted that, in 2013, the ad hoc Committee on Management Fees was formed to conduct an in-depth review of the management fee rates of Fidelity's active equity mutual funds. The Committee focused on the following areas: (i) standard fee structures; (ii) research consumption and trading evolution; (iii) management fee competitiveness/profitability by category; and (iv) factors that drive institutional pricing.
Based on its review, the Board concluded that the fund's management fee is fair and reasonable in light of the services that the fund receives and the other factors considered.
Total Expense Ratio. In its review of each class's total expense ratio, the Board considered the fund's management fee rate as well as other fund or class expenses, as applicable, such as transfer agent fees, pricing and bookkeeping fees, fund-paid 12b-1 fees, and custodial, legal, and audit fees. The Board noted the impact of the fund's performance adjustment. The Board also noted that Fidelity may agree to waive fees and expenses from time to time, and the extent to which, if any, it has done so for the fund. As part of its review, the Board also considered the current and historical total expense ratios of each class of the fund compared to competitive fund median expenses. Each class of the fund is compared to those funds and classes in the Total Mapped Group (used by the Board for management fee comparisons) that have a similar sales load structure.
The Board noted that the total expense ratio of the retail class ranked below the competitive median for 2015 and the total expense ratio of each of Class A, Class T, Class C, and Class I ranked above the competitive median for 2015. The Board considered that, in general, various factors can affect total expense ratios. The Board noted that the total expense ratio of each of Class A, Class T, Class C, and Class I was above the competitive median because of a positive performance fee adjustment in 2015. The Board noted that the total expense ratio of Class T was also above the competitive median because of higher 12b-1 fees on Class T as compared to most competitor funds. Class T has a higher 12b-1 fee, but a lower front-end sales charge, than traditionally priced front-end sales charge classes. The Board considered that Class T is primarily sold load-waived in the retirement plan market where its 0.50% 12b-1 fee is comparable to competing no-load, higher 12b-1 fee classes designed specifically for retirement plans. The Board noted that the fund offers multiple classes, each of which has a different sales load and 12b-1 fee structure, and that the multiple structures are intended to offer a range of pricing options for the intermediary market. The Board also noted that the total expense ratios of the classes vary primarily by the level of their 12b-1 fees, although differences in transfer agent fees may also cause expenses to vary from class to class.
Fees Charged to Other Fidelity Clients. The Board also considered Fidelity fee structures and other information with respect to clients of Fidelity, such as other funds advised or subadvised by Fidelity, pension plan clients, and other institutional clients with similar mandates. The Board noted the findings of the 2013 ad hoc joint committee (created with the board of other Fidelity funds), which reviewed and compared Fidelity's institutional investment advisory business with its business of providing services to the Fidelity funds, including the differences in services provided, fees charged, and costs incurred, as well as competition in their respective marketplaces.
Based on its review of total expense ratios and fees charged to other Fidelity clients, the Board concluded that, although some classes were above the median of the universe presented for comparison, the total expense ratio of each class of the fund was reasonable in light of the services that the fund and its shareholders receive and the other factors considered.
Costs of the Services and Profitability. The Board considered the revenues earned and the expenses incurred by Fidelity in conducting the business of developing, marketing, distributing, managing, administering and servicing the fund and servicing the fund's shareholders. The Board also considered the level of Fidelity's profits in respect of all the Fidelity funds.
On an annual basis, Fidelity presents to the Board information about the profitability of its relationship with the fund. Fidelity calculates profitability information for each fund, as well as aggregate profitability information for groups of Fidelity funds and all Fidelity funds, using a series of detailed revenue and cost allocation methodologies which originate with the books and records of Fidelity on which Fidelity's audited financial statements are based. The Audit Committee of the Board reviews any significant changes from the prior year's methodologies.
PricewaterhouseCoopers LLP (PwC), independent registered public accounting firm and auditor to Fidelity and certain Fidelity funds, has been engaged annually by the Board as part of the Board's assessment of Fidelity's profitability analysis. PwC's engagement includes the review and assessment of the methodologies used by Fidelity in determining the revenues and expenses attributable to Fidelity's mutual fund business, and completion of agreed-upon procedures in respect of the mathematical accuracy of the fund profitability information and its conformity to established allocation methodologies. After considering PwC's reports issued under the engagement and information provided by Fidelity, the Board concluded that while other allocation methods may also be reasonable, Fidelity's profitability methodologies are reasonable in all material respects.
The Board also reviewed Fidelity's non-fund businesses and fall-out benefits related to the mutual fund business as well as cases where Fidelity's affiliates may benefit from or be related to the fund's business.
The Board considered the costs of the services provided by and the profits realized by Fidelity in connection with the operation of the fund and was satisfied that the profitability was not excessive.
Economies of Scale. The Board considered whether there have been economies of scale in respect of the management of the Fidelity funds, whether the Fidelity funds (including the fund) have appropriately benefited from any such economies of scale, and whether there is potential for realization of any further economies of scale. The Board considered the extent to which the fund will benefit from economies of scale as assets grow through increased services to the fund, through waivers or reimbursements, or through fee or expense ratio reductions. The Board also noted that in 2013, it and the boards of other Fidelity funds created an ad hoc committee (the Economies of Scale Committee) to analyze whether Fidelity attains economies of scale in respect of the management and servicing of the Fidelity funds, whether the Fidelity funds have appropriately benefited from such economies of scale, and whether there is potential for realization of any further economies of scale.
The Board recognized that the fund's management contract incorporates a "group fee" structure, which provides for lower group fee rates as total group assets increase, and for higher group fee rates as total group assets decrease (with "group assets" defined to include fund assets under FMR's management plus the assets of sector funds previously under FMR's management). FMR calculates the group fee rates based on a tiered asset "breakpoint" schedule that varies based on asset class. The Board considered that the group fee is designed to deliver the benefits of economies of scale to fund shareholders when total Fidelity fund assets increase, even if assets of any particular fund are unchanged or have declined, because some portion of Fidelity's costs are attributable to services provided to all Fidelity funds, and all funds benefit if those costs can be allocated among more assets. The Board also considered that although the fund is partially closed to new investors, it continues to incur investment management expenses, and marketing and distribution expenses related to the retention of existing shareholders and assets. The Board further noted that the fund may continue to realize benefits from the group fee structure, even though assets may not be expected to grow significantly at the fund level. The Board concluded that, given the group fee structure, fund shareholders will benefit from lower management fees as group assets increase at the fund complex level, regardless of whether Fidelity achieves any such economies of scale.
The Board concluded, taking into account the analysis of the Economies of Scale Committee, that economies of scale, if any, are being appropriately shared between fund shareholders and Fidelity.
Additional Information Requested by the Board. In order to develop fully the factual basis for consideration of the Fidelity funds' Advisory Contracts, the Board requested and received additional information on certain topics, including: (i) fund performance trends and Fidelity's long-term strategies for certain funds; (ii) the various share classes employed by Fidelity and the attributes of each class, together with similar information on the distribution and servicing payments made by Fidelity or the funds to third-party participants in the distribution channels; (iii) fund profitability, and fund performance in relation to fund profitability; (iv) the methodology with respect to evaluating competitive fund data and peer group classifications and fee comparisons; (v) annual fund profitability margins; (vi) the realization of fall-out benefits in and attribution of fall-out benefits to certain Fidelity business units; (vii) the appropriateness of certain funds' benchmarks; (viii) the rationalization for certain share classes and expenses; (ix) sub-advisory fee rates for comparable investment mandates; (x) product strategy for certain underperforming funds; and (xi) Fidelity's resources and strategy for cybersecurity.
Based on its evaluation of all of the conclusions noted above, and after considering all factors it believed relevant, the Board concluded that the advisory fee structures are fair and reasonable, and that the fund's Advisory Contracts should be renewed.
Corporate Headquarters
245 Summer St.
Boston, MA 02210
www.fidelity.com
SCV-ANN-0916
1.803706.111
Fidelity® Growth & Income Portfolio Class K
Annual Report July 31, 2016 |
|
Contents
To view a fund's proxy voting guidelines and proxy voting record for the 12-month period ended June 30, visit http://www.fidelity.com/proxyvotingresults or visit the Securities and Exchange Commission's (SEC) web site at http://www.sec.gov.
You may also call 1-800-835-5092 to request a free copy of the proxy voting guidelines.
Standard & Poor's, S&P and S&P 500 are registered service marks of The McGraw-Hill Companies, Inc. and have been licensed for use by Fidelity Distributors Corporation.
Other third-party marks appearing herein are the property of their respective owners.
All other marks appearing herein are registered or unregistered trademarks or service marks of FMR LLC or an affiliated company. © 2016 FMR LLC. All rights reserved.
This report and the financial statements contained herein are submitted for the general information of the shareholders of the Fund. This report is not authorized for distribution to prospective investors in the Fund unless preceded or accompanied by an effective prospectus.
A fund files its complete schedule of portfolio holdings with the SEC for the first and third quarters of each fiscal year on Form N-Q. Forms N-Q are available on the SEC’s web site at http://www.sec.gov. A fund's Forms N-Q may be reviewed and copied at the SEC’s Public Reference Room in Washington, DC. Information regarding the operation of the SEC's Public Reference Room may be obtained by calling 1-800-SEC-0330.
For a complete list of a fund's portfolio holdings, view the most recent holdings listing, semiannual report, or annual report on Fidelity's web site at http://www.fidelity.com, http://www.institutional.fidelity.com, or http://www.401k.com, as applicable.
NOT FDIC INSURED •MAY LOSE VALUE •NO BANK GUARANTEE
Neither the Fund nor Fidelity Distributors Corporation is a bank.
Performance: The Bottom Line
Average annual total return reflects the change in the value of an investment, assuming reinvestment of distributions from dividend income and capital gains (the profits earned upon the sale of securities that have grown in value, if any) and assuming a constant rate of performance each year. The hypothetical investment and the average annual total returns do not reflect the deduction of taxes that a shareholder would pay on fund distributions or the redemption of fund shares. During periods of reimbursement by Fidelity, a fund’s total return will be greater than it would be had the reimbursement not occurred. How a fund did yesterday is no guarantee of how it will do tomorrow.
Average Annual Total Returns
| For the periods ended July 31, 2016 | Past 1 year | Past 5 years | Past 10 years |
| Class K | 1.04% | 12.72% | 3.79% |
The initial offering of Class K shares took place on May 9, 2008. Returns prior to May 9, 2008 are those of Fidelity® Growth & Income Portfolio, the original class of the fund.
$10,000 Over 10 Years
Let's say hypothetically that $10,000 was invested in Fidelity® Growth & Income Portfolio - Class K on July 31, 2006. The chart shows how the value of your investment would have changed, and also shows how the S&P 500® Index performed over the same period. See above for additional information regarding the performance of Class K.
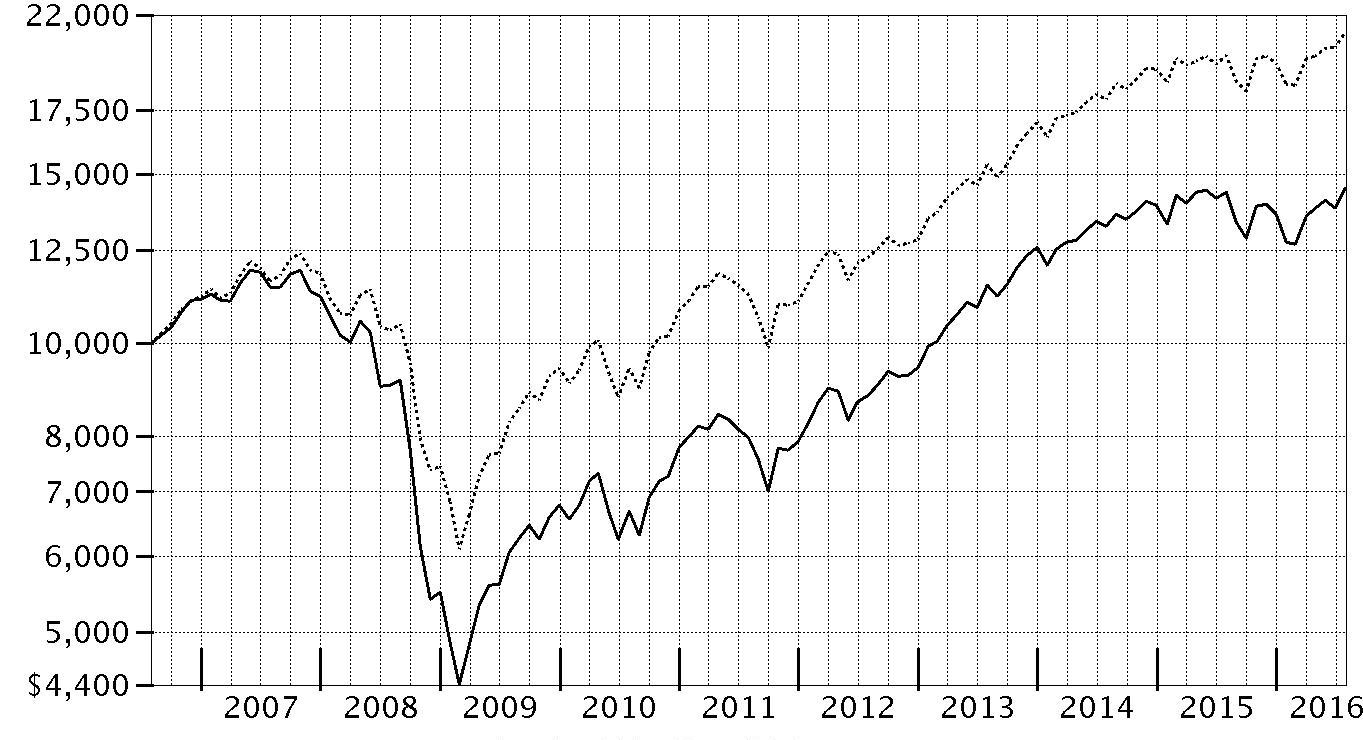
| Period Ending Values |
| $14,506 | Fidelity® Growth & Income Portfolio - Class K |
| $21,089 | S&P 500® Index |
Management's Discussion of Fund Performance
Market Recap: U.S. equities gained modestly for the year ending July 31, 2016, overcoming persistent concern about global economic growth, uncertainty regarding U.S. monetary policy and the U.K.’s late-June vote to leave the European Union, dubbed Brexit. The S&P 500
® index rose 5.61%, with larger-cap, value-oriented stocks and defensive sectors shining brightest. Volatility peaked in the early weeks of 2016, as continued oil-price weakness and U.S.-dollar strength pushed the S&P 500
® to its worst January since 2009. Markets then rallied beginning in February amid U.S. job gains, a broad rally in energy and materials markets, global economic stimulus and perceived softening of monetary policy by the U.S. Federal Reserve. The June 23 Brexit vote surprised markets and resulted in a sharp two-day decline for stocks, followed by a rebound as investor sentiment shifted and remained positive through July 31. For the year, dividend-rich telecom services (+26%), utilities (+23%) and consumer staples (+12%) led the way amid strong investor demand for yield. Industrials and technology (+10%) also outperformed, as did materials (+8%), despite a weak commodities environment overall. Conversely, a strong period for real estate stocks couldn’t keep the financials sector (-4%) from losing ground, as low interest rates continued to squeeze bank profits.
Comments from Portfolio Manager Matthew Fruhan: For the year, the fund’s share classes (excluding sales charges, if applicable) posted modest gains, significantly trailing the 5.61% advance of the benchmark S&P 500
® index. The fund’s disappointing result mostly was due to poor security selection, especially within financials and energy. In financials, which I continued to overweight, many companies from the banking industry struggled, including Citigroup, Bank of America, JPMorgan Chase and Morgan Stanley. In energy, several stocks detracted, especially natural gas transporters Golar LNG and MarkWest Energy Partners, the latter of which was acquired for stock by MPLX. The fund did have success with other names in the group, including pipeline operator Williams Partners and integrated energy producer Chevron. My picks in information technology also detracted. On the positive side, the fund was well positioned in the health care sector, as we benefited from good stock selection and a helpful underweight in this lagging category. Here, largely avoiding biotech firm Gilead Sciences (-31%) in favor of other firms that fit my criteria much better was a good call. The fund’s biggest individual contributor was industrial conglomerate General Electric, whose stock gained ground as the company continued to focus on its core industrial businesses – a move rewarded by investors.
The views expressed above reflect those of the portfolio manager(s) only through the end of the period as stated on the cover of this report and do not necessarily represent the views of Fidelity or any other person in the Fidelity organization. Any such views are subject to change at any time based upon market or other conditions and Fidelity disclaims any responsibility to update such views. These views may not be relied on as investment advice and, because investment decisions for a Fidelity fund are based on numerous factors, may not be relied on as an indication of trading intent on behalf of any Fidelity fund.
Investment Summary (Unaudited)
Top Ten Stocks as of July 31, 2016
| | % of fund's net assets | % of fund's net assets 6 months ago |
| JPMorgan Chase & Co.(a) | 3.5 | 4.0 |
| Microsoft Corp.(a) | 3.3 | 3.6 |
| General Electric Co.(a) | 3.0 | 3.5 |
| Bank of America Corp. | 2.7 | 2.8 |
| Apple, Inc. | 2.7 | 2.9 |
| Chevron Corp. | 2.3 | 2.3 |
| Citigroup, Inc. | 2.3 | 2.3 |
| Qualcomm, Inc. | 2.1 | 1.9 |
| Johnson & Johnson(a) | 2.0 | 2.3 |
| GlaxoSmithKline PLC sponsored ADR | 1.8 | 1.7 |
| | 25.7 | |
(a) Security or a portion of the security is pledged as collateral for call options written.
Top Five Market Sectors as of July 31, 2016
| | % of fund's net assets | % of fund's net assets 6 months ago |
| Financials | 21.2 | 21.0 |
| Information Technology | 20.7 | 21.2 |
| Health Care | 14.2 | 12.6 |
| Industrials | 12.5 | 12.8 |
| Energy | 12.0 | 10.1 |
Asset Allocation (% of fund's net assets)
| As of July 31, 2016 *,** |
| | Stocks | 98.4% |
| | Convertible Securities | 1.4% |
| | Short-Term Investments and Net Other Assets (Liabilities) | 0.2% |

* Foreign investments - 11.7%
** Written Options - (0.1)%
| As of January 31, 2016 *,** |
| | Stocks | 98.8% |
| | Convertible Securities | 1.2% |

* Foreign investments - 12.0%
** Written Options - (0.0)%
Percentages shown as 0.0% may reflect amounts less than 0.05%.
Investments July 31, 2016
Showing Percentage of Net Assets
| Common Stocks - 98.4% | | | |
| | | Shares | Value (000s) |
| CONSUMER DISCRETIONARY - 8.5% | | | |
| Auto Components - 0.3% | | | |
| BorgWarner, Inc. | | 329,200 | $10,923 |
| Johnson Controls, Inc. | | 127,700 | 5,864 |
| | | | 16,787 |
| Automobiles - 0.2% | | | |
| General Motors Co. | | 320,000 | 10,093 |
| Harley-Davidson, Inc. (a) | | 80,600 | 4,265 |
| | | | 14,358 |
| Diversified Consumer Services - 0.0% | | | |
| H&R Block, Inc. | | 104,200 | 2,479 |
| Hotels, Restaurants & Leisure - 0.7% | | | |
| Cedar Fair LP (depositary unit) | | 26,700 | 1,581 |
| Dunkin' Brands Group, Inc. | | 160,300 | 7,263 |
| Las Vegas Sands Corp. | | 208,800 | 10,576 |
| Whitbread PLC | | 88,424 | 4,516 |
| Wingstop, Inc. (a) | | 125,500 | 3,263 |
| Yum! Brands, Inc. | | 163,244 | 14,597 |
| | | | 41,796 |
| Leisure Products - 0.2% | | | |
| NJOY, Inc. (b)(c) | | 671,364 | 27 |
| Polaris Industries, Inc. | | 95,800 | 9,460 |
| | | | 9,487 |
| Media - 4.3% | | | |
| Comcast Corp. Class A (d) | | 1,641,400 | 110,384 |
| Scripps Networks Interactive, Inc. Class A | | 511,789 | 33,809 |
| Sinclair Broadcast Group, Inc. Class A | | 318,761 | 8,868 |
| Time Warner, Inc. | | 1,038,417 | 79,595 |
| Viacom, Inc. Class B (non-vtg.) | | 773,400 | 35,166 |
| | | | 267,822 |
| Multiline Retail - 1.4% | | | |
| Target Corp. | | 1,176,675 | 88,639 |
| Specialty Retail - 1.3% | | | |
| Foot Locker, Inc. | | 122,000 | 7,274 |
| L Brands, Inc. | | 128,700 | 9,511 |
| Lowe's Companies, Inc. (d) | | 801,979 | 65,987 |
| | | | 82,772 |
| Textiles, Apparel & Luxury Goods - 0.1% | | | |
| Ralph Lauren Corp. | | 84,800 | 8,318 |
|
| TOTAL CONSUMER DISCRETIONARY | | | 532,458 |
|
| CONSUMER STAPLES - 6.0% | | | |
| Beverages - 2.1% | | | |
| Britvic PLC | | 169,500 | 1,402 |
| Diageo PLC | | 913,839 | 26,188 |
| PepsiCo, Inc. | | 177,414 | 19,324 |
| The Coca-Cola Co. | | 1,888,303 | 82,387 |
| | | | 129,301 |
| Food & Staples Retailing - 1.0% | | | |
| CVS Health Corp. | | 518,104 | 48,039 |
| Walgreens Boots Alliance, Inc. | | 213,684 | 16,934 |
| | | | 64,973 |
| Food Products - 0.2% | | | |
| Mead Johnson Nutrition Co. Class A | | 160,900 | 14,352 |
| Household Products - 1.8% | | | |
| Procter & Gamble Co. | | 1,304,815 | 111,679 |
| Personal Products - 0.1% | | | |
| Edgewell Personal Care Co. (b) | | 99,800 | 8,444 |
| Tobacco - 0.8% | | | |
| British American Tobacco PLC sponsored ADR | | 61,323 | 7,830 |
| Imperial Tobacco Group PLC | | 113,852 | 6,002 |
| Philip Morris International, Inc. | | 324,971 | 32,582 |
| | | | 46,414 |
|
| TOTAL CONSUMER STAPLES | | | 375,163 |
|
| ENERGY - 11.9% | | | |
| Energy Equipment & Services - 1.2% | | | |
| Baker Hughes, Inc. | | 316,700 | 15,148 |
| Helmerich & Payne, Inc. (a) | | 121,900 | 7,554 |
| National Oilwell Varco, Inc. | | 584,500 | 18,909 |
| Oceaneering International, Inc. | | 654,000 | 18,234 |
| Schlumberger Ltd. | | 201,532 | 16,227 |
| | | | 76,072 |
| Oil, Gas & Consumable Fuels - 10.7% | | | |
| Amyris, Inc. (a)(b) | | 233,157 | 82 |
| Anadarko Petroleum Corp. | | 126,700 | 6,909 |
| Apache Corp. | | 778,668 | 40,880 |
| Cabot Oil & Gas Corp. | | 216,900 | 5,351 |
| Cenovus Energy, Inc. | | 2,608,300 | 37,337 |
| Chevron Corp. | | 1,415,796 | 145,091 |
| ConocoPhillips Co. | | 1,612,400 | 65,818 |
| EQT Midstream Partners LP | | 50,502 | 4,031 |
| Golar LNG Ltd. (a) | | 559,200 | 9,484 |
| Imperial Oil Ltd. | | 1,431,500 | 44,042 |
| Kinder Morgan, Inc. | | 2,858,200 | 58,107 |
| Legacy Reserves LP | | 1,050,368 | 1,817 |
| MPLX LP | | 142,847 | 4,635 |
| PrairieSky Royalty Ltd. (a) | | 690,973 | 13,447 |
| Suncor Energy, Inc. | | 3,342,150 | 89,950 |
| Teekay LNG Partners LP | | 477,300 | 4,868 |
| The Williams Companies, Inc. | | 3,121,972 | 74,834 |
| Williams Partners LP | | 1,820,985 | 67,996 |
| | | | 674,679 |
|
| TOTAL ENERGY | | | 750,751 |
|
| FINANCIALS - 21.2% | | | |
| Banks - 13.8% | | | |
| Bank of America Corp. | | 11,908,856 | 172,559 |
| Citigroup, Inc. | | 3,302,130 | 144,666 |
| Citizens Financial Group, Inc. | | 61,700 | 1,378 |
| Comerica, Inc. | | 699,400 | 31,641 |
| Cullen/Frost Bankers, Inc. | | 73,600 | 4,997 |
| Fifth Third Bancorp | | 424,400 | 8,055 |
| JPMorgan Chase & Co. (d) | | 3,427,392 | 219,248 |
| Lloyds Banking Group PLC | | 1,623,900 | 1,142 |
| M&T Bank Corp. | | 248,900 | 28,514 |
| PNC Financial Services Group, Inc. | | 337,454 | 27,891 |
| Regions Financial Corp. | | 4,361,000 | 39,990 |
| Standard Chartered PLC (United Kingdom) | | 1,300,646 | 10,407 |
| SunTrust Banks, Inc. | | 1,732,366 | 73,262 |
| U.S. Bancorp | | 1,804,573 | 76,099 |
| Wells Fargo & Co. | | 626,741 | 30,065 |
| | | | 869,914 |
| Capital Markets - 5.4% | | | |
| Apollo Global Management LLC Class A | | 618,000 | 10,599 |
| Ashmore Group PLC | | 1,126,300 | 4,964 |
| Charles Schwab Corp. | | 1,143,543 | 32,499 |
| Franklin Resources, Inc. | | 87,400 | 3,163 |
| Goldman Sachs Group, Inc. | | 21,600 | 3,430 |
| Invesco Ltd. | | 444,643 | 12,975 |
| KKR & Co. LP | | 2,308,743 | 33,338 |
| Morgan Stanley | | 1,443,997 | 41,486 |
| Northern Trust Corp. | | 917,864 | 62,038 |
| Oaktree Capital Group LLC Class A | | 238,400 | 11,067 |
| State Street Corp. | | 1,402,327 | 92,245 |
| The Blackstone Group LP | | 1,269,300 | 34,068 |
| | | | 341,872 |
| Diversified Financial Services - 0.4% | | | |
| FactSet Research Systems, Inc. | | 18,400 | 3,164 |
| McGraw Hill Financial, Inc. | | 180,100 | 22,008 |
| | | | 25,172 |
| Insurance - 0.9% | | | |
| Marsh & McLennan Companies, Inc. | | 368,407 | 24,223 |
| MetLife, Inc. | | 392,340 | 16,769 |
| Principal Financial Group, Inc. | | 249,400 | 11,630 |
| | | | 52,622 |
| Real Estate Investment Trusts - 0.5% | | | |
| American Tower Corp. | | 78,900 | 9,134 |
| Crown Castle International Corp. | | 177,900 | 17,262 |
| First Potomac Realty Trust | | 55,018 | 556 |
| Sabra Health Care REIT, Inc. | | 183,900 | 4,397 |
| | | | 31,349 |
| Thrifts & Mortgage Finance - 0.2% | | | |
| Radian Group, Inc. | | 1,062,368 | 13,705 |
|
| TOTAL FINANCIALS | | | 1,334,634 |
|
| HEALTH CARE - 13.3% | | | |
| Biotechnology - 2.9% | | | |
| AbbVie, Inc. | | 634,500 | 42,023 |
| Amgen, Inc. | | 318,503 | 54,792 |
| Biogen, Inc. (b) | | 147,800 | 42,852 |
| Celgene Corp. (b) | | 15,800 | 1,773 |
| Gilead Sciences, Inc. | | 175,400 | 13,939 |
| Intercept Pharmaceuticals, Inc. (b) | | 39,826 | 6,891 |
| Shire PLC sponsored ADR | | 113,000 | 21,936 |
| | | | 184,206 |
| Health Care Equipment & Supplies - 2.4% | | | |
| Abbott Laboratories | | 752,404 | 33,670 |
| Ansell Ltd. | | 453,462 | 6,675 |
| Becton, Dickinson & Co. | | 26,400 | 4,646 |
| Medtronic PLC | | 848,830 | 74,383 |
| Zimmer Biomet Holdings, Inc. | | 261,110 | 34,242 |
| | | | 153,616 |
| Health Care Providers & Services - 1.5% | | | |
| Anthem, Inc. | | 15,800 | 2,075 |
| Cigna Corp. | | 134,600 | 17,358 |
| McKesson Corp. | | 299,687 | 58,307 |
| Patterson Companies, Inc. | | 308,670 | 15,236 |
| | | | 92,976 |
| Life Sciences Tools & Services - 0.5% | | | |
| Agilent Technologies, Inc. | | 596,300 | 28,688 |
| Pharmaceuticals - 6.0% | | | |
| AstraZeneca PLC sponsored ADR (a) | | 399,700 | 13,646 |
| Bristol-Myers Squibb Co. | | 205,100 | 15,344 |
| GlaxoSmithKline PLC sponsored ADR | | 2,496,422 | 112,514 |
| Innoviva, Inc.(a) | | 278,400 | 3,583 |
| Johnson & Johnson (d) | | 1,018,969 | 127,605 |
| Novartis AG sponsored ADR | | 27,544 | 2,293 |
| Sanofi SA | | 250,497 | 21,336 |
| Teva Pharmaceutical Industries Ltd. sponsored ADR | | 1,478,520 | 79,101 |
| | | | 375,422 |
|
| TOTAL HEALTH CARE | | | 834,908 |
|
| INDUSTRIALS - 12.3% | | | |
| Aerospace & Defense - 2.4% | | | |
| General Dynamics Corp. | | 83,100 | 12,207 |
| Meggitt PLC | | 245,568 | 1,424 |
| Rolls-Royce Group PLC | | 1,111,000 | 11,625 |
| The Boeing Co. | | 516,589 | 69,047 |
| United Technologies Corp. | | 507,682 | 54,652 |
| | | | 148,955 |
| Air Freight & Logistics - 1.9% | | | |
| C.H. Robinson Worldwide, Inc. | | 216,200 | 15,052 |
| PostNL NV (b) | | 4,627,900 | 17,778 |
| United Parcel Service, Inc. Class B (d) | | 810,204 | 87,583 |
| | | | 120,413 |
| Airlines - 0.2% | | | |
| Copa Holdings SA Class A | | 227,154 | 15,219 |
| Building Products - 0.0% | | | |
| Lennox International, Inc. | | 19,900 | 3,120 |
| Commercial Services & Supplies - 0.1% | | | |
| KAR Auction Services, Inc. | | 178,900 | 7,652 |
| Electrical Equipment - 1.0% | | | |
| AMETEK, Inc. | | 149,800 | 7,045 |
| Eaton Corp. PLC | | 94,700 | 6,005 |
| Emerson Electric Co. | | 559,700 | 31,287 |
| Hubbell, Inc. Class B | | 197,039 | 21,247 |
| | | | 65,584 |
| Industrial Conglomerates - 3.0% | | | |
| General Electric Co. (d) | | 5,979,680 | 186,207 |
| Machinery - 0.8% | | | |
| Caterpillar, Inc. | | 20,600 | 1,705 |
| CLARCOR, Inc. | | 24,600 | 1,532 |
| Deere & Co. | | 216,900 | 16,855 |
| Donaldson Co., Inc. | | 273,700 | 9,889 |
| IMI PLC | | 78,200 | 1,109 |
| Pentair PLC | | 32,700 | 2,087 |
| Wabtec Corp. | | 119,000 | 8,152 |
| Xylem, Inc. | | 129,400 | 6,187 |
| | | | 47,516 |
| Professional Services - 0.1% | | | |
| Nielsen Holdings PLC | | 97,300 | 5,241 |
| Road & Rail - 2.3% | | | |
| CSX Corp. | | 1,705,120 | 48,306 |
| J.B. Hunt Transport Services, Inc. | | 527,340 | 43,838 |
| Kansas City Southern | | 191,200 | 18,376 |
| Norfolk Southern Corp. | | 183,999 | 16,519 |
| Union Pacific Corp. | | 158,000 | 14,702 |
| | | | 141,741 |
| Trading Companies & Distributors - 0.5% | | | |
| MSC Industrial Direct Co., Inc. Class A (a) | | 66,200 | 4,755 |
| W.W. Grainger, Inc. (a) | | 17,000 | 3,720 |
| Watsco, Inc. | | 165,692 | 23,866 |
| | | | 32,341 |
|
| TOTAL INDUSTRIALS | | | 773,989 |
|
| INFORMATION TECHNOLOGY - 20.6% | | | |
| Communications Equipment - 1.7% | | | |
| Cisco Systems, Inc. | | 3,486,852 | 106,454 |
| Internet Software & Services - 3.1% | | | |
| Alphabet, Inc.: | | | |
| Class A | | 134,107 | 106,124 |
| Class C (b) | | 115,346 | 88,677 |
| | | | 194,801 |
| IT Services - 5.2% | | | |
| First Data Corp. Class A (b) | | 1,927,110 | 23,896 |
| IBM Corp. | | 400,604 | 64,345 |
| MasterCard, Inc. Class A | | 653,500 | 62,239 |
| Paychex, Inc. (d) | | 1,151,652 | 68,270 |
| Sabre Corp. | | 165,400 | 4,821 |
| Unisys Corp. (a)(b) | | 973,600 | 9,648 |
| Visa, Inc. Class A | | 1,164,784 | 90,911 |
| | | | 324,130 |
| Semiconductors & Semiconductor Equipment - 2.7% | | | |
| Maxim Integrated Products, Inc. | | 538,400 | 21,956 |
| Qualcomm, Inc. | | 2,139,946 | 133,918 |
| Xilinx, Inc. | | 256,700 | 13,112 |
| | | | 168,986 |
| Software - 3.7% | | | |
| Microsoft Corp. (d) | | 3,626,199 | 205,533 |
| Oracle Corp. | | 472,153 | 19,377 |
| SS&C Technologies Holdings, Inc. | | 307,000 | 9,892 |
| | | | 234,802 |
| Technology Hardware, Storage & Peripherals - 4.2% | | | |
| Apple, Inc. | | 1,626,594 | 169,507 |
| EMC Corp. | | 2,376,900 | 67,219 |
| Western Digital Corp. | | 623,600 | 29,627 |
| | | | 266,353 |
|
| TOTAL INFORMATION TECHNOLOGY | | | 1,295,526 |
|
| MATERIALS - 2.9% | | | |
| Chemicals - 2.4% | | | |
| CF Industries Holdings, Inc. | | 392,400 | 9,684 |
| E.I. du Pont de Nemours & Co. | | 342,346 | 23,680 |
| Johnson Matthey PLC | | 16,600 | 720 |
| LyondellBasell Industries NV Class A | | 193,000 | 14,525 |
| Monsanto Co. | | 719,915 | 76,865 |
| Potash Corp. of Saskatchewan, Inc. | | 1,556,400 | 24,258 |
| W.R. Grace & Co. | | 40,900 | 3,062 |
| | | | 152,794 |
| Containers & Packaging - 0.5% | | | |
| Ball Corp. | | 65,300 | 4,615 |
| Graphic Packaging Holding Co. | | 45,800 | 625 |
| International Paper Co. | | 26,600 | 1,219 |
| Packaging Corp. of America | | 67,200 | 5,019 |
| WestRock Co. | | 471,800 | 20,245 |
| | | | 31,723 |
|
| TOTAL MATERIALS | | | 184,517 |
|
| TELECOMMUNICATION SERVICES - 0.9% | | | |
| Diversified Telecommunication Services - 0.9% | | | |
| Verizon Communications, Inc. | | 1,007,674 | 55,835 |
| UTILITIES - 0.8% | | | |
| Electric Utilities - 0.8% | | | |
| Exelon Corp. | | 1,433,900 | 53,456 |
| PPL Corp. | | 7,900 | 298 |
| | | | 53,754 |
| Multi-Utilities - 0.0% | | | |
| Sempra Energy | | 400 | 45 |
|
| TOTAL UTILITIES | | | 53,799 |
|
| TOTAL COMMON STOCKS | | | |
| (Cost $5,578,182) | | | 6,191,580 |
|
| Preferred Stocks - 1.1% | | | |
| Convertible Preferred Stocks - 1.1% | | | |
| HEALTH CARE - 0.9% | | | |
| Health Care Equipment & Supplies - 0.9% | | | |
| Alere, Inc. 3.00% | | 174,173 | 54,647 |
| INDUSTRIALS - 0.2% | | | |
| Commercial Services & Supplies - 0.2% | | | |
| Stericycle, Inc. 2.25% | | 133,700 | 9,973 |
| UTILITIES - 0.0% | | | |
| Independent Power and Renewable Electricity Producers - 0.0% | | | |
| Dynegy, Inc. 7.00% (b) | | 32,800 | 3,200 |
|
| TOTAL CONVERTIBLE PREFERRED STOCKS | | | 67,820 |
|
| Nonconvertible Preferred Stocks - 0.0% | | | |
| INDUSTRIALS - 0.0% | | | |
| Aerospace & Defense - 0.0% | | | |
| Rolls-Royce Group PLC | | 72,121,800 | 95 |
| Rolls-Royce Group PLC (C Shares) | | 32,482,080 | 43 |
| | | | 138 |
| TOTAL PREFERRED STOCKS | | | |
| (Cost $59,373) | | | 67,958 |
| | | Principal Amount (000s) | Value (000s) |
|
| Convertible Bonds - 0.3% | | | |
| CONSUMER DISCRETIONARY - 0.1% | | | |
| Automobiles - 0.1% | | | |
| Tesla Motors, Inc. 1.25% 3/1/21 | | 5,570 | 4,891 |
| ENERGY - 0.1% | | | |
| Oil, Gas & Consumable Fuels - 0.1% | | | |
| Amyris, Inc.: | | | |
| 5% 10/15/18 pay-in-kind (c)(e) | | 3,173 | 2,799 |
| 9.5% 4/15/19 pay-in-kind (e)(f) | | 5,075 | 2,204 |
| Peabody Energy Corp. 4.75% 12/15/41 (g) | | 7,660 | 48 |
| | | | 5,051 |
| INFORMATION TECHNOLOGY - 0.1% | | | |
| Internet Software & Services - 0.1% | | | |
| Twitter, Inc. 0.25% 9/15/19 | | 9,490 | 8,760 |
| TOTAL CONVERTIBLE BONDS | | | |
| (Cost $27,748) | | | 18,702 |
| | | Shares | Value (000s) |
|
| Money Market Funds - 0.8% | | | |
| Fidelity Cash Central Fund, 0.42% (h) | | 21,729,129 | 21,729 |
| Fidelity Securities Lending Cash Central Fund, 0.45% (h)(i) | | 29,496,798 | 29,497 |
| TOTAL MONEY MARKET FUNDS | | | |
| (Cost $51,226) | | | 51,226 |
| TOTAL INVESTMENT PORTFOLIO - 100.6% | | | |
| (Cost $5,716,529) | | | 6,329,466 |
| NET OTHER ASSETS (LIABILITIES) - (0.6)% | | | (36,396) |
| NET ASSETS - 100% | | | $6,293,070 |
| Written Options | | | | |
| | Expiration Date/Exercise Price | Number of Contracts | Premium (000s) | Value (000s) |
| Call Options | | | | |
| Comcast Corp. Class A | 10/21/16 - $67.50 | 2,500 | $230 | $(476) |
| General Electric Co. | 10/21/16 - $34.00 | 6,282 | 157 | (63) |
| Johnson & Johnson | 10/21/16 - $125.00 | 1,053 | 217 | (284) |
| JPMorgan Chase & Co. | 10/21/16 - $67.50 | 5,134 | 474 | (424) |
| Lowe's Companies, Inc. | 10/21/16 - $87.50 | 1,185 | 85 | (87) |
| Microsoft Corp. | 11/18/16 - $60.00 | 3,626 | 327 | (330) |
| Paychex, Inc. | 9/16/16 - $57.50 | 3,893 | 288 | (944) |
| Paychex, Inc. | 9/16/16 - $62.50 | 2,417 | 70 | (48) |
| United Parcel Service, Inc. Class B | 10/21/16 - $105.00 | 1,294 | 551 | (563) |
| TOTAL WRITTEN OPTIONS | | | $2,399 | $(3,219) |
Legend
(a) Security or a portion of the security is on loan at period end.
(b) Non-income producing
(c) Restricted securities - Investment in securities not registered under the Securities Act of 1933 (excluding 144A issues). At the end of the period, the value of restricted securities (excluding 144A issues) amounted to $2,826,000 or 0.0% of net assets.
(d) Security or a portion of the security is pledged as collateral for call options written. At period end, the value of securities pledged amounted to $164,100,000.
(e) Coupon rates for floating and adjustable rate securities reflect the rates in effect at period end.
(f) Security exempt from registration under Rule 144A of the Securities Act of 1933. These securities may be resold in transactions exempt from registration, normally to qualified institutional buyers. At the end of the period, the value of these securities amounted to $2,204,000 or 0.0% of net assets.
(g) Non-income producing - Security is in default.
(h) Affiliated fund that is generally available only to investment companies and other accounts managed by Fidelity Investments. The rate quoted is the annualized seven-day yield of the fund at period end. A complete unaudited listing of the fund's holdings as of its most recent quarter end is available upon request. In addition, each Fidelity Central Fund's financial statements, which are not covered by the Fund's Report of Independent Registered Public Accounting Firm, are available on the SEC's website or upon request.
(i) Investment made with cash collateral received from securities on loan.
Additional information on each restricted holding is as follows:
| Security | Acquisition Date | Acquisition Cost (000s) |
| Amyris, Inc. 5% 10/15/18 | 10/16/13 | $2,800 |
| NJOY, Inc. | 2/14/14 | $1,164 |
Affiliated Central Funds
Information regarding fiscal year to date income earned by the Fund from investments in Fidelity Central Funds is as follows:
| Fund | Income earned |
| | (Amounts in thousands) |
| Fidelity Cash Central Fund | $21 |
| Fidelity Securities Lending Cash Central Fund | 681 |
| Total | $702 |
Investment Valuation
The following is a summary of the inputs used, as of July 31, 2016, involving the Fund's assets and liabilities carried at fair value. The inputs or methodology used for valuing securities may not be an indication of the risk associated with investing in those securities. For more information on valuation inputs, and their aggregation into the levels used below, please refer to the Investment Valuation section in the accompanying Notes to Financial Statements.
| | Valuation Inputs at Reporting Date: |
| Description | Total | Level 1 | Level 2 | Level 3 |
| (Amounts in thousands) | | | | |
| Investments in Securities: | | | | |
| Equities: | | | | |
| Consumer Discretionary | $532,458 | $532,431 | $-- | $27 |
| Consumer Staples | 375,163 | 348,975 | 26,188 | -- |
| Energy | 750,751 | 750,751 | -- | -- |
| Financials | 1,334,634 | 1,333,492 | 1,142 | -- |
| Health Care | 889,555 | 813,572 | 75,983 | -- |
| Industrials | 784,100 | 772,475 | 11,625 | -- |
| Information Technology | 1,295,526 | 1,295,526 | -- | -- |
| Materials | 184,517 | 184,517 | -- | -- |
| Telecommunication Services | 55,835 | 55,835 | -- | -- |
| Utilities | 56,999 | 56,999 | -- | -- |
| Corporate Bonds | 18,702 | -- | 18,702 | -- |
| Money Market Funds | 51,226 | 51,226 | -- | -- |
| Total Investments in Securities: | $6,329,466 | $6,195,799 | $133,640 | $27 |
| Derivative Instruments: | | | | |
| Liabilities | | | | |
| Written Options | $(3,219) | $(3,219) | $-- | $-- |
| Total Liabilities | $(3,219) | $(3,219) | $-- | $-- |
| Total Derivative Instruments: | $(3,219) | $(3,219) | $-- | $-- |
The following is a summary of transfers between Level 1 and Level 2 for the period ended July 31, 2016. Transfers are assumed to have occurred at the beginning of the period, and are primarily attributable to the valuation techniques used for foreign equity securities, as discussed in the accompanying Notes to Financial Statements:
| Transfers | Total (000s) |
| Level 1 to Level 2 | $63,359 |
| Level 2 to Level 1 | $0 |
Value of Derivative Instruments
The following table is a summary of the Fund's value of derivative instruments by primary risk exposure as of July 31, 2016. For additional information on derivative instruments, please refer to the Derivative Instruments section in the accompanying Notes to Financial Statements.
| Primary Risk Exposure / Derivative Type | Value (000s) |
| | Asset | Liability |
| Equity Risk | | |
| Written Options(a) | $0 | $(3,219) |
| Total Equity Risk | 0 | (3,219) |
| Total Value of Derivatives | $0 | $(3,219) |
(a) Gross value is presented in the Statement of Assets and Liabilities in the written options, at value line item.
Other Information
Distribution of investments by country or territory of incorporation, as a percentage of Total Net Assets, is as follows (Unaudited):
| United States of America | 88.3% |
| United Kingdom | 3.5% |
| Canada | 3.3% |
| Ireland | 1.4% |
| Israel | 1.3% |
| Others (Individually Less Than 1%) | 2.2% |
| | 100.0% |
See accompanying notes which are an integral part of the financial statements.
Financial Statements
Statement of Assets and Liabilities
| Amounts in thousands (except per-share amounts) | | July 31, 2016 |
| Assets | | |
Investment in securities, at value (including securities loaned of $28,993) — See accompanying schedule:
Unaffiliated issuers (cost $5,665,303) | $6,278,240 | |
| Fidelity Central Funds (cost $51,226) | 51,226 | |
| Total Investments (cost $5,716,529) | | $6,329,466 |
| Receivable for investments sold | | 20,760 |
| Receivable for fund shares sold | | 778 |
| Dividends receivable | | 8,758 |
| Interest receivable | | 227 |
| Distributions receivable from Fidelity Central Funds | | 47 |
| Other receivables | | 714 |
| Total assets | | 6,360,750 |
| Liabilities | | |
| Payable for investments purchased | $26,792 | |
| Payable for fund shares redeemed | 4,220 | |
| Accrued management fee | 2,316 | |
| Written options, at value (premium received $2,399) | 3,219 | |
| Other affiliated payables | 893 | |
| Other payables and accrued expenses | 743 | |
| Collateral on securities loaned, at value | 29,497 | |
| Total liabilities | | 67,680 |
| Net Assets | | $6,293,070 |
| Net Assets consist of: | | |
| Paid in capital | | $7,948,801 |
| Distributions in excess of net investment income | | (6,075) |
| Accumulated undistributed net realized gain (loss) on investments and foreign currency transactions | | (2,261,738) |
| Net unrealized appreciation (depreciation) on investments and assets and liabilities in foreign currencies | | 612,082 |
| Net Assets | | $6,293,070 |
| Growth and Income: | | |
| Net Asset Value, offering price and redemption price per share ($5,528,555 ÷ 181,356 shares) | | $30.48 |
| Class K: | | |
| Net Asset Value, offering price and redemption price per share ($764,515 ÷ 25,100 shares) | | $30.46 |
See accompanying notes which are an integral part of the financial statements.
Statement of Operations
| Amounts in thousands | | Year ended July 31, 2016 |
| Investment Income | | |
| Dividends | | $167,951 |
| Interest | | 1,177 |
| Income from Fidelity Central Funds | | 702 |
| Total income | | 169,830 |
| Expenses | | |
| Management fee | $28,329 | |
| Transfer agent fees | 9,791 | |
| Accounting and security lending fees | 1,147 | |
| Custodian fees and expenses | 152 | |
| Independent trustees' fees and expenses | 29 | |
| Registration fees | 58 | |
| Audit | 95 | |
| Legal | 30 | |
| Interest | 10 | |
| Miscellaneous | 53 | |
| Total expenses before reductions | 39,694 | |
| Expense reductions | (204) | 39,490 |
| Net investment income (loss) | | 130,340 |
| Realized and Unrealized Gain (Loss) | | |
| Net realized gain (loss) on: | | |
| Investment securities: | | |
| Unaffiliated issuers | 403,857 | |
| Foreign currency transactions | (102) | |
| Written options | 5,815 | |
| Total net realized gain (loss) | | 409,570 |
Change in net unrealized appreciation (depreciation) on:
Investment securities | (566,115) | |
| Assets and liabilities in foreign currencies | (5) | |
| Written options | (820) | |
| Total change in net unrealized appreciation (depreciation) | | (566,940) |
| Net gain (loss) | | (157,370) |
| Net increase (decrease) in net assets resulting from operations | | $(27,030) |
See accompanying notes which are an integral part of the financial statements.
Statement of Changes in Net Assets
| Amounts in thousands | Year ended July 31, 2016 | Year ended July 31, 2015 |
| Increase (Decrease) in Net Assets | | |
| Operations | | |
| Net investment income (loss) | $130,340 | $140,160 |
| Net realized gain (loss) | 409,570 | 743,260 |
| Change in net unrealized appreciation (depreciation) | (566,940) | (281,519) |
| Net increase (decrease) in net assets resulting from operations | (27,030) | 601,901 |
| Distributions to shareholders from net investment income | (127,549) | (135,475) |
| Distributions to shareholders from net realized gain | (2,644) | – |
| Total distributions | (130,193) | (135,475) |
| Share transactions - net increase (decrease) | (973,902) | (551,906) |
| Total increase (decrease) in net assets | (1,131,125) | (85,480) |
| Net Assets | | |
| Beginning of period | 7,424,195 | 7,509,675 |
| End of period | $6,293,070 | $7,424,195 |
| Other Information | | |
| Distributions in excess of net investment income end of period | $(6,075) | $(722) |
See accompanying notes which are an integral part of the financial statements.
Financial Highlights — Fidelity Growth & Income Portfolio
| Years ended July 31, | 2016 | 2015 | 2014 | 2013 | 2012 |
| Selected Per–Share Data | | | | | |
| Net asset value, beginning of period | $30.85 | $29.02 | $25.66 | $20.13 | $18.58 |
| Income from Investment Operations | | | | | |
| Net investment income (loss)A | .59 | .55 | .51 | .46 | .36 |
| Net realized and unrealized gain (loss) | (.37) | 1.82B | 3.35 | 5.54 | 1.55 |
| Total from investment operations | .22 | 2.37 | 3.86 | 6.00 | 1.91 |
| Distributions from net investment income | (.58) | (.54) | (.50) | (.44) | (.35) |
| Distributions from net realized gain | (.01) | – | (.01) | (.03) | (.01) |
| Total distributions | (.59) | (.54) | (.50)C | (.47) | (.36) |
| Net asset value, end of period | $30.48 | $30.85 | $29.02 | $25.66 | $20.13 |
| Total ReturnD | .88% | 8.23%B | 15.16% | 30.15% | 10.45% |
| Ratios to Average Net AssetsE,F | | | | | |
| Expenses before reductions | .64% | .64% | .65% | .68% | .71% |
| Expenses net of fee waivers, if any | .64% | .63% | .65% | .68% | .71% |
| Expenses net of all reductions | .64% | .63% | .65% | .67% | .71% |
| Net investment income (loss) | 2.05% | 1.83% | 1.86% | 2.04% | 1.95% |
| Supplemental Data | | | | | |
| Net assets, end of period (in millions) | $5,529 | $6,563 | $6,550 | $6,060 | $4,863 |
| Portfolio turnover rateG | 29% | 35% | 41%H | 49% | 62% |
A Calculated based on average shares outstanding during the period.
B Net realized and unrealized gain (loss) per share reflects proceeds received from litigation which amounted to $.06 per share. Excluding these litigation proceeds, the total return would have been 8.03%.
C Total distributions of $.50 per share is comprised of distributions from net investment income of $.495 and distributions from net realized gain of $.006 per share.
D Total returns would have been lower if certain expenses had not been reduced during the applicable periods shown.
E Fees and expenses of any underlying Fidelity Central Funds are not included in the Fund's expense ratio. The Fund indirectly bears its proportionate share of the expenses of any underlying Fidelity Central Funds.
F Expense ratios reflect operating expenses of the class. Expenses before reductions do not reflect amounts reimbursed by the investment adviser or reductions from brokerage service arrangements or reductions from other expense offset arrangements and do not represent the amount paid by the class during periods when reimbursements or reductions occur. Expenses net of fee waivers reflect expenses after reimbursement by the investment adviser but prior to reductions from brokerage service arrangements or other expense offset arrangements. Expenses net of all reductions represent the net expenses paid by the class.
G Amount does not include the portfolio activity of any underlying Fidelity Central Funds.
H Portfolio turnover rate excludes securities received or delivered in-kind.
See accompanying notes which are an integral part of the financial statements.
Financial Highlights — Fidelity Growth & Income Portfolio Class K
| | 2016 | 2015 | 2014 | 2013 | 2012 |
| Selected Per–Share Data | | | | | |
| Net asset value, beginning of period | $30.82 | $29.00 | $25.64 | $20.12 | $18.57 |
| Income from Investment Operations | | | | | |
| Net investment income (loss)A | .62 | .59 | .54 | .50 | .40 |
| Net realized and unrealized gain (loss) | (.35) | 1.81B | 3.36 | 5.52 | 1.54 |
| Total from investment operations | .27 | 2.40 | 3.90 | 6.02 | 1.94 |
| Distributions from net investment income | (.62) | (.58) | (.53) | (.47) | (.38) |
| Distributions from net realized gain | (.01) | – | (.01) | (.03) | (.01) |
| Total distributions | (.63) | (.58) | (.54) | (.50) | (.39) |
| Net asset value, end of period | $30.46 | $30.82 | $29.00 | $25.64 | $20.12 |
| Total ReturnC | 1.04% | 8.34%B | 15.32% | 30.28% | 10.66% |
| Ratios to Average Net AssetsD,E | | | | | |
| Expenses before reductions | .52% | .52% | .52% | .53% | .54% |
| Expenses net of fee waivers, if any | .52% | .52% | .52% | .53% | .54% |
| Expenses net of all reductions | .52% | .52% | .52% | .52% | .54% |
| Net investment income (loss) | 2.17% | 1.95% | 1.99% | 2.19% | 2.13% |
| Supplemental Data | | | | | |
| Net assets, end of period (in millions) | $765 | $862 | $960 | $1,016 | $752 |
| Portfolio turnover rateF | 29% | 35% | 41%G | 49% | 62% |
A Calculated based on average shares outstanding during the period.
B Net realized and unrealized gain (loss) per share reflects proceeds received from litigation which amounted to $.06 per share. Excluding these litigation proceeds, the total return would have been 8.14%
C Total returns would have been lower if certain expenses had not been reduced during the applicable periods shown.
D Fees and expenses of any underlying Fidelity Central Funds are not included in the Fund's expense ratio. The Fund indirectly bears its proportionate share of the expenses of any underlying Fidelity Central Funds.
E Expense ratios reflect operating expenses of the class. Expenses before reductions do not reflect amounts reimbursed by the investment adviser or reductions from brokerage service arrangements or reductions from other expense offset arrangements and do not represent the amount paid by the class during periods when reimbursements or reductions occur. Expenses net of fee waivers reflect expenses after reimbursement by the investment adviser but prior to reductions from brokerage service arrangements or other expense offset arrangements. Expenses net of all reductions represent the net expenses paid by the class.
F Amount does not include the portfolio activity of any underlying Fidelity Central Funds.
G Portfolio turnover rate excludes securities received or delivered in-kind.
See accompanying notes which are an integral part of the financial statements.
Notes to Financial Statements
For the period ended July 31, 2016
(Amounts in thousands except percentages)
1. Organization.
Fidelity Growth & Income Portfolio (the Fund) is a fund of Fidelity Securities Fund (the Trust) and is authorized to issue an unlimited number of shares. The Trust is registered under the Investment Company Act of 1940, as amended (the 1940 Act), as an open-end management investment company organized as a Massachusetts business trust. The Fund offers Growth & Income, and Class K shares, each of which has equal rights as to assets and voting privileges. Each class has exclusive voting rights with respect to matters that affect that class.
2. Investments in Fidelity Central Funds.
The Fund invests in Fidelity Central Funds, which are open-end investment companies generally available only to other investment companies and accounts managed by the investment adviser and its affiliates. The Fund's Schedule of Investments lists each of the Fidelity Central Funds held as of period end, if any, as an investment of the Fund, but does not include the underlying holdings of each Fidelity Central Fund. As an Investing Fund, the Fund indirectly bears its proportionate share of the expenses of the underlying Fidelity Central Funds.
The Money Market Central Funds seek preservation of capital and current income and are managed by Fidelity Investments Money Management, Inc. (FIMM), an affiliate of the investment adviser. Annualized expenses of the Money Market Central Funds as of their most recent shareholder report date are less than .005%.
A complete unaudited list of holdings for each Fidelity Central Fund is available upon request or at the Securities and Exchange Commission (the SEC) website at www.sec.gov. In addition, the financial statements of the Fidelity Central Funds, which are not covered by the Fund's Report of Independent Registered Public Accounting Firm, are available on the SEC website or upon request.
3. Significant Accounting Policies.
The financial statements have been prepared in conformity with accounting principles generally accepted in the United States of America (GAAP), which require management to make certain estimates and assumptions at the date of the financial statements. Actual results could differ from those estimates. Subsequent events, if any, through the date that the financial statements were issued have been evaluated in the preparation of the financial statements. The following summarizes the significant accounting policies of the Fund:
Investment Valuation. Investments are valued as of 4:00 p.m. Eastern time on the last calendar day of the period. The Board of Trustees (the Board) has delegated the day to day responsibility for the valuation of the Fund's investments to the Fidelity Management & Research Company (FMR) Fair Value Committee (the Committee). In accordance with valuation policies and procedures approved by the Board, the Fund attempts to obtain prices from one or more third party pricing vendors or brokers to value its investments. When current market prices, quotations or currency exchange rates are not readily available or reliable, investments will be fair valued in good faith by the Committee, in accordance with procedures adopted by the Board. Factors used in determining fair value vary by investment type and may include market or investment specific events, changes in interest rates and credit quality. The frequency with which these procedures are used cannot be predicted and they may be utilized to a significant extent. The Committee oversees the Fund's valuation policies and procedures and reports to the Board on the Committee's activities and fair value determinations. The Board monitors the appropriateness of the procedures used in valuing the Fund's investments and ratifies the fair value determinations of the Committee.
The Fund categorizes the inputs to valuation techniques used to value its investments into a disclosure hierarchy consisting of three levels as shown below:
- Level 1 – quoted prices in active markets for identical investments
- Level 2 – other significant observable inputs (including quoted prices for similar investments, interest rates, prepayment speeds, etc.)
- Level 3 – unobservable inputs (including the Fund's own assumptions based on the best information available)
Valuation techniques used to value the Fund's investments by major category are as follows:
Equity securities, including restricted securities, for which market quotations are readily available, are valued at the last reported sale price or official closing price as reported by a third party pricing vendor on the primary market or exchange on which they are traded and are categorized as Level 1 in the hierarchy. In the event there were no sales during the day or closing prices are not available, securities are valued at the last quoted bid price or may be valued using the last available price and are generally categorized as Level 2 in the hierarchy. For foreign equity securities, when market or security specific events arise, comparisons to the valuation of American Depositary Receipts (ADRs), futures contracts, Exchange-Traded Funds (ETFs) and certain indexes as well as quoted prices for similar securities may be used and would be categorized as Level 2 in the hierarchy. Utilizing these techniques may result in transfers between Level 1 and Level 2. For equity securities, including restricted securities, where observable inputs are limited, assumptions about market activity and risk are used and these securities may be categorized as Level 3 in the hierarchy.
Debt securities, including restricted securities, are valued based on evaluated prices received from third party pricing vendors or from brokers who make markets in such securities. Corporate bonds are valued by pricing vendors who utilize matrix pricing which considers yield or price of bonds of comparable quality, coupon, maturity and type or by broker-supplied prices. When independent prices are unavailable or unreliable, debt securities may be valued utilizing pricing methodologies which consider similar factors that would be used by third party pricing vendors. Debt securities are generally categorized as Level 2 in the hierarchy but may be Level 3 depending on the circumstances.
Exchange-traded options are valued using the last sale price or, in the absence of a sale, the last offering price and are categorized as Level 1 in the hierarchy. Investments in open-end mutual funds, including the Fidelity Central Funds, are valued at their closing net asset value (NAV) each business day and are categorized as Level 1 in the hierarchy.
Changes in valuation techniques may result in transfers in or out of an assigned level within the disclosure hierarchy. The aggregate value of investments by input level as of July 31, 2016, including information on transfers between Levels 1 and 2, is included at the end of the Fund's Schedule of Investments.
Foreign Currency. The Fund may use foreign currency contracts to facilitate transactions in foreign-denominated securities. Gains and losses from these transactions may arise from changes in the value of the foreign currency or if the counterparties do not perform under the contracts' terms.
Foreign-denominated assets, including investment securities, and liabilities are translated into U.S. dollars at the exchange rates at period end. Purchases and sales of investment securities, income and dividends received and expenses denominated in foreign currencies are translated into U.S. dollars at the exchange rate in effect on the transaction date.
The effects of exchange rate fluctuations on investments are included with the net realized and unrealized gain (loss) on investment securities. Other foreign currency transactions resulting in realized and unrealized gain (loss) are disclosed separately.
Investment Transactions and Income. For financial reporting purposes, the Fund's investment holdings and NAV include trades executed through the end of the last business day of the period. The NAV per share for processing shareholder transactions is calculated as of the close of business of the New York Stock Exchange (NYSE), normally 4:00 p.m. Eastern time and includes trades executed through the end of the prior business day. Gains and losses on securities sold are determined on the basis of identified cost and may include proceeds received from litigation. Dividend income is recorded on the ex-dividend date, except for certain dividends from foreign securities where the ex-dividend date may have passed, which are recorded as soon as the Fund is informed of the ex-dividend date. Non-cash dividends included in dividend income, if any, are recorded at the fair market value of the securities received. Income and capital gain distributions from Fidelity Central Funds, if any, are recorded on the ex-dividend date. Distributions received on securities that represent a return of capital or capital gain are recorded as a reduction of cost of investments and/or as a realized gain. Subsequent to ex-dividend date the Fund determines the components of these distributions, based upon receipt of tax filings or other correspondence relating to the underlying investment. Interest income is accrued as earned and includes coupon interest and amortization of premium and accretion of discount on debt securities as applicable. Investment income is recorded net of foreign taxes withheld where recovery of such taxes is uncertain. Debt obligations may be placed on non-accrual status and related interest income may be reduced by ceasing current accruals and writing off interest receivables when the collection of all or a portion of interest has become doubtful based on consistently applied procedures. A debt obligation is removed from non-accrual status when the issuer resumes interest payments or when collectability of interest is reasonably assured.
Class Allocations and Expenses. Investment income, realized and unrealized capital gains and losses, common expenses of the Fund, and certain fund-level expense reductions, if any, are allocated daily on a pro-rata basis to each class based on the relative net assets of each class to the total net assets of the Fund. Each class differs with respect to transfer agent fees incurred. Certain expense reductions may also differ by class. For the reporting period, the allocated portion of income and expenses to each class as a percent of its average net assets may vary due to the timing of recording these transactions in relation to fluctuating net assets of the classes. Expenses directly attributable to a fund are charged to that fund. Expenses attributable to more than one fund are allocated among the respective funds on the basis of relative net assets or other appropriate methods. Expense estimates are accrued in the period to which they relate and adjustments are made when actual amounts are known.
Deferred Trustee Compensation. Under a Deferred Compensation Plan (the Plan), independent Trustees may elect to defer receipt of a portion of their annual compensation. Deferred amounts are invested in a cross-section of Fidelity funds, are marked-to-market and remain in the Fund until distributed in accordance with the Plan. The investment of deferred amounts and the offsetting payable to the Trustees are included in the accompanying Statement of Assets and Liabilities.
Income Tax Information and Distributions to Shareholders. Each year, the Fund intends to qualify as a regulated investment company under Subchapter M of the Internal Revenue Code, including distributing substantially all of its taxable income and realized gains. As a result, no provision for U.S. Federal income taxes is required. As of July 31, 2016, the Fund did not have any unrecognized tax benefits in the financial statements; nor is the Fund aware of any tax positions for which it is reasonably possible that the total amounts of unrecognized tax benefits will significantly change in the next twelve months. The Fund files a U.S. federal tax return, in addition to state and local tax returns as required. The Fund's federal income tax returns are subject to examination by the Internal Revenue Service (IRS) for a period of three fiscal years after they are filed. State and local tax returns may be subject to examination for an additional fiscal year depending on the jurisdiction. Foreign taxes are provided for based on the Fund's understanding of the tax rules and rates that exist in the foreign markets in which it invests.
Distributions are declared and recorded on the ex-dividend date. Income dividends and capital gain distributions are declared separately for each class. Income and capital gain distributions are determined in accordance with income tax regulations, which may differ from GAAP.
Capital accounts within the financial statements are adjusted for permanent book-tax differences. These adjustments have no impact on net assets or the results of operations. Capital accounts are not adjusted for temporary book-tax differences which will reverse in a subsequent period.
Book-tax differences are primarily due to foreign currency transactions, passive foreign investment companies (PFIC), market discount, equity-debt classifications, partnerships, deferred trustees compensation, certain conversion ratio adjustments, capital loss carryforward and losses deferred due to wash sales.
The federal tax cost of investment securities and unrealized appreciation (depreciation) as of period end were as follows:
| Gross unrealized appreciation | $1,050,243 |
| Gross unrealized depreciation | (431,497) |
| Net unrealized appreciation (depreciation) on securities | $618,746 |
| Tax Cost | $5,710,720 |
The tax-based components of distributable earnings as of period end were as follows:
| Undistributed ordinary income | $17,714 |
| Capital loss carryforward | $(2,267,080) |
| Net unrealized appreciation (depreciation) on securities and other investments | $617,876 |
Capital loss carryforwards are only available to offset future capital gains of the Fund to the extent provided by regulations and may be limited. Under the Regulated Investment Company Modernization Act of 2010 (the Act), the Fund is permitted to carry forward capital losses incurred in taxable years beginning after December 22, 2010 for an unlimited period and such capital losses are required to be used prior to any losses that expire. The capital loss carryforward information presented below, including any applicable limitation, is estimated as of fiscal period end and is subject to adjustment.
| Fiscal year of expiration | |
| 2018 | $(2,267,080) |
The tax character of distributions paid was as follows:
| | July 31, 2016 | July 31, 2015 |
| Ordinary Income | $ 130,193 | $ 135,475 |
Restricted Securities. The Fund may invest in securities that are subject to legal or contractual restrictions on resale. These securities generally may be resold in transactions exempt from registration or to the public if the securities are registered. Disposal of these securities may involve time-consuming negotiations and expense, and prompt sale at an acceptable price may be difficult. Information regarding restricted securities is included at the end of the Fund's Schedule of Investments.
4. Derivative Instruments.
Risk Exposures and the Use of Derivative Instruments. The Fund's investment objective allows the Fund to enter into various types of derivative contracts, including options. Derivatives are investments whose value is primarily derived from underlying assets, indices or reference rates and may be transacted on an exchange or over-the-counter (OTC). Derivatives may involve a future commitment to buy or sell a specified asset based on specified terms, to exchange future cash flows at periodic intervals based on a notional principal amount, or for one party to make one or more payments upon the occurrence of specified events in exchange for periodic payments from the other party.
The Fund used derivatives to increase returns and to manage exposure to certain risks as defined below. The success of any strategy involving derivatives depends on analysis of numerous economic factors, and if the strategies for investment do not work as intended, the Fund may not achieve its objectives.
The Fund's use of derivatives increased or decreased its exposure to the following risk:
| Equity Risk | Equity risk relates to the fluctuations in the value of financial instruments as a result of changes in market prices (other than those arising from interest rate risk or foreign exchange risk), whether caused by factors specific to an individual investment, its issuer, or all factors affecting all instruments traded in a market or market segment.
|
The Fund is also exposed to additional risks from investing in derivatives, such as liquidity risk and counterparty credit risk. Liquidity risk is the risk that the Fund will be unable to close out the derivative in the open market in a timely manner. Counterparty credit risk is the risk that the counterparty will not be able to fulfill its obligation to the Fund. Counterparty credit risk related to exchange-traded options may be mitigated by the protection provided by the exchange on which they trade.
Investing in derivatives may involve greater risks than investing in the underlying assets directly and, to varying degrees, may involve risk of loss in excess of any initial investment and collateral received and amounts recognized in the Statement of Assets and Liabilities. In addition, there may be the risk that the change in value of the derivative contract does not correspond to the change in value of the underlying instrument.
Options. Options give the purchaser the right, but not the obligation, to buy (call) or sell (put) an underlying security or financial instrument at an agreed exercise or strike price between or on certain dates. Options obligate the seller (writer) to buy (put) or sell (call) an underlying instrument at the exercise or strike price or cash settle an underlying derivative instrument if the holder exercises the option on or before the expiration date.
The Fund used exchange-traded written covered call options to manage its exposure to the market. When the Fund writes a covered call option, the Fund holds the underlying instrument which must be delivered to the holder upon the exercise of the option.
Upon entering into a written options contract, the Fund will receive a premium. Premiums received are reflected as a liability on the Statement of Assets and Liabilities. Options are valued daily and any unrealized appreciation (depreciation) is reflected on the Statement of Assets and Liabilities. When a written option is exercised, the premium is added to the proceeds from the sale of the underlying instrument in determining the gain or loss realized on that investment. When an option is closed the Fund will realize a gain or loss depending on whether the proceeds or amount paid for the closing sale transaction are greater or less than the premium received. When an option expires, gains and losses are realized to the extent of premiums received. The net realized gain (loss) on closed and expired written options and the change in net unrealized appreciation (depreciation) on written options are reflected separately on the Statement of Operations.
Writing call options tends to decrease exposure to the underlying instrument and risk of loss is the change in value in excess of the premium received.
Any open options at period end are presented in the Schedule of Investments under the caption "Written Options".
During the period, the Fund recognized net realized gain (loss) of $5,815 and a change in net unrealized appreciation (depreciation) of $(820) related to its investment in written options. This amount is included in the Statement of Operations.
The following is a summary of the Fund's written options activity:
| | Number of Contracts | Amount of Premiums |
| Outstanding at beginning of period | - | $ - |
| Options Opened | 153 | 10,381 |
| Options Exercised | (20) | (1,392) |
| Options Closed | (64) | (3,063) |
| Options Expired | (42) | (3,527) |
| Outstanding at end of period | 27 | $2,399 |
5. Purchases and Sales of Investments.
Purchases and sales of securities, other than short-term securities, aggregated $1,858,687 and $2,835,428, respectively.
6. Fees and Other Transactions with Affiliates.
Management Fee. Fidelity Management & Research Company (the investment adviser) and its affiliates provide the Fund with investment management related services for which the Fund pays a monthly management fee. The management fee is the sum of an individual fund fee rate that is based on an annual rate of .20% of the Fund's average net assets and an annualized group fee rate that averaged .25% during the period. The group fee rate is based upon the average net assets of all the mutual funds advised by the investment adviser, including any mutual funds previously advised by the investment adviser that are currently advised by Fidelity SelectCo, LLC, an affiliate of the investment adviser. The group fee rate decreases as assets under management increase and increases as assets under management decrease. For the reporting period, the total annual management fee rate was .45% of the Fund's average net assets.
Transfer Agent Fees. Fidelity Investments Institutional Operations Company, Inc., (FIIOC), an affiliate of the investment adviser, is the transfer, dividend disbursing and shareholder servicing agent for each class of the Fund. FIIOC receives account fees and asset-based fees that vary according to the account size and type of account of the shareholders of Growth & Income, except for Class K. FIIOC receives an asset-based fee of Class K's average net assets. FIIOC pays for typesetting, printing and mailing of shareholder reports, except proxy statements.
For the period, transfer agent fees for each applicable class were as follows:
| | Amount | % of
Class-Level Average
Net Assets |
| Growth and Income | $9,428 | .17 |
| Class K | 363 | .05 |
| | $ 9,791 | |
Accounting and Security Lending Fees. Fidelity Service Company, Inc. (FSC), an affiliate of the investment adviser, maintains the Fund's accounting records. The accounting fee is based on the level of average net assets for each month. Under a separate contract, FSC administers the security lending program. The security lending fee is based on the number and duration of lending transactions.
Brokerage Commissions. The Fund placed a portion of its portfolio transactions with brokerage firms which are affiliates of the investment adviser. Brokerage commissions are included in net realized gain (loss) and change in net unrealized appreciation (depreciation) in the Statement of Operations. The commissions paid to these affiliated firms were $49 for the period.
Interfund Lending Program. Pursuant to an Exemptive Order issued by the SEC, the Fund, along with other registered investment companies having management contracts with FMR or other affiliated entities of FMR, may participate in an interfund lending program. This program provides an alternative credit facility allowing the funds to borrow from, or lend money to, other participating affiliated funds. At period end, there were no interfund loans outstanding. The Fund's activity in this program during the period for which loans were outstanding was as follows:
| Borrower or Lender | Average Loan Balance | Weighted Average Interest Rate | Interest Expense |
| Borrower | $5,799 | .46% | $8 |
Interfund Trades. The Fund may purchase from or sell securities to other Fidelity Funds under procedures adopted by the Board. The procedures have been designed to ensure these interfund trades are executed in accordance with Rule 17a-7 of the 1940 Act. Interfund trades are included within the respective purchases and sales amounts shown in the Purchases and Sales of Investments note.
Other. During the period, the investment adviser reimbursed the Fund for certain losses in the amount of $71.
7. Committed Line of Credit.
The Fund participates with other funds managed by the investment adviser or an affiliate in a $4.25 billion credit facility (the "line of credit") to be utilized for temporary or emergency purposes to fund shareholder redemptions or for other short-term liquidity purposes. The Fund has agreed to pay commitment fees on its pro-rata portion of the line of credit, which amounted to $13 and is reflected in Miscellaneous expenses on the Statement of Operations. During the period, the Fund did not borrow on this line of credit.
8. Security Lending.
The Fund lends portfolio securities through a lending agent from time to time in order to earn additional income. For equity securities, a lending agent is used and may loan securities to certain qualified borrowers, including Fidelity Capital Markets (FCM), a broker-dealer affiliated with the Fund. On the settlement date of the loan, the Fund receives collateral (in the form of U.S. Treasury obligations, letters of credit and/or cash) against the loaned securities and maintains collateral in an amount not less than 100% of the market value of the loaned securities during the period of the loan. The market value of the loaned securities is determined at the close of business of the Fund and any additional required collateral is delivered to the Fund on the next business day. The Fund or borrower may terminate the loan at any time, and if the borrower defaults on its obligation to return the securities loaned because of insolvency or other reasons, the Fund may apply collateral received from the borrower against the obligation. The Fund may experience delays and costs in recovering the securities loaned. Any cash collateral received is invested in the Fidelity Securities Lending Cash Central Fund. The value of loaned securities and cash collateral at period end are disclosed on the Fund's Statement of Assets and Liabilities. The value of securities loaned to FCM at period end was $827. Security lending income represents the income earned on investing cash collateral, less rebates paid to borrowers and any lending agent fees associated with the loan, plus any premium payments received for lending certain types of securities. Security lending income is presented in the Statement of Operations as a component of income from Fidelity Central Funds. Total security lending income during the period amounted to $681, including an amount of less than five hundred dollars from securities loaned to FCM.
9. Bank Borrowings.
The Fund is permitted to have bank borrowings for temporary or emergency purposes to fund shareholder redemptions or for other short-term liquidity requirements. The Fund has established borrowing arrangements with certain banks. The interest rate on the borrowings is the bank's base rate, as revised from time to time. The average loan balance during the period for which loans were outstanding amounted to $4,931. The weighted average interest rate was .69%. The interest expense amounted to $2 under the bank borrowing program. At period end, there were no bank borrowings outstanding.
10. Expense Reductions.
Commissions paid to certain brokers with whom the investment adviser, or its affiliates, places trades on behalf of the Fund include an amount in addition to trade execution, which may be rebated back to the Fund to offset certain expenses. This amount totaled $158 for the period.
In addition, during the period the investment adviser reimbursed and/or waived a portion of fund-level operating expenses in the amount of $46.
11. Distributions to Shareholders.
Distributions to shareholders of each class were as follows:
| | Year ended
July 31, 2016 | Year ended July 31, 2015 |
| From net investment income | | |
| Growth and Income | $110,877 | $117,218 |
| Class K | 16,672 | 18,257 |
| Total | $127,549 | $135,475 |
| From net realized gain | | |
| Growth and Income | $2,314 | $– |
| Class K | 330 | – |
| Total | $2,644 | $– |
12. Share Transactions.
Share transactions for each class were as follows and may contain automatic conversions between classes or exchanges between affiliated funds:
| | Shares | Shares | Dollars | Dollars |
| | Year ended
July 31, 2016 | Year ended July 31, 2015 | Year ended
July 31, 2016 | Year ended July 31, 2015 |
| Growth and Income | | | | |
| Shares sold | 4,968 | 12,118 | $141,986 | $365,420 |
| Reinvestment of distributions | 3,798 | 3,750 | 107,836 | 111,890 |
| Shares redeemed | (40,154) | (28,824) | (1,140,777) | (872,624) |
| Net increase (decrease) | (31,388) | (12,956) | $(890,955) | $(395,314) |
| Class K | | | | |
| Shares sold | 3,725 | 4,866 | $105,617 | $146,512 |
| Reinvestment of distributions | 599 | 612 | 17,002 | 18,257 |
| Shares redeemed | (7,177) | (10,609) | (205,566) | (321,361) |
| Net increase (decrease) | (2,853) | (5,131) | $(82,947) | $(156,592) |
13. Other.
The Fund's organizational documents provide former and current trustees and officers with a limited indemnification against liabilities arising in connection with the performance of their duties to the Fund. In the normal course of business, the Fund may also enter into contracts that provide general indemnifications. The Fund's maximum exposure under these arrangements is unknown as this would be dependent on future claims that may be made against the Fund. The risk of material loss from such claims is considered remote.
Report of Independent Registered Public Accounting Firm
To the Trustees of Fidelity Securities Fund and Shareholders of Fidelity Growth & Income Portfolio:
In our opinion, the accompanying statement of assets and liabilities, including the schedule of investments, and the related statements of operations and of changes in net assets and the financial highlights present fairly, in all material respects, the financial position of Fidelity Growth & Income Portfolio (a fund of Fidelity Securities Fund) at July 31, 2016, the results of its operations for the year then ended, the changes in its net assets for each of the two years in the period then ended and the financial highlights for each of the five years in the period then ended, in conformity with accounting principles generally accepted in the United States of America. These financial statements and financial highlights (hereafter referred to as “financial statements”) are the responsibility of the Fidelity Growth & Income Portfolio’s management. Our responsibility is to express an opinion on these financial statements based on our audits. We conducted our audits of these financial statements in accordance with the standards of the Public Company Accounting Oversight Board (United States). Those standards require that we plan and perform the audit to obtain reasonable assurance about whether the financial statements are free of material misstatement. An audit includes examining, on a test basis, evidence supporting the amounts and disclosures in the financial statements, assessing the accounting principles used and significant estimates made by management, and evaluating the overall financial statement presentation. We believe that our audits, which included confirmation of securities at July 31, 2016 by correspondence with the custodian and brokers, provide a reasonable basis for our opinion.
PricewaterhouseCoopers LLP
Boston, Massachusetts
September 14, 2016
Trustees and Officers
The Trustees, Members of the Advisory Board (if any), and officers of the trust and fund, as applicable, are listed below. The Board of Trustees governs the fund and is responsible for protecting the interests of shareholders. The Trustees are experienced executives who meet periodically throughout the year to oversee the fund's activities, review contractual arrangements with companies that provide services to the fund, oversee management of the risks associated with such activities and contractual arrangements, and review the fund's performance. Each of the Trustees oversees 170 funds.
The Trustees hold office without limit in time except that (a) any Trustee may resign; (b) any Trustee may be removed by written instrument, signed by at least two-thirds of the number of Trustees prior to such removal; (c) any Trustee who requests to be retired or who has become incapacitated by illness or injury may be retired by written instrument signed by a majority of the other Trustees; and (d) any Trustee may be removed at any special meeting of shareholders by a two-thirds vote of the outstanding voting securities of the trust. Each Trustee who is not an interested person (as defined in the 1940 Act) of the trust and the fund is referred to herein as an Independent Trustee. Each Independent Trustee shall retire not later than the last day of the calendar year in which his or her 75th birthday occurs. The Independent Trustees may waive this mandatory retirement age policy with respect to individual Trustees. Officers and Advisory Board Members hold office without limit in time, except that any officer or Advisory Board Member may resign or may be removed by a vote of a majority of the Trustees at any regular meeting or any special meeting of the Trustees. Except as indicated, each individual has held the office shown or other offices in the same company for the past five years.
The fund’s Statement of Additional Information (SAI) includes more information about the Trustees. To request a free copy, call Fidelity at 1-800-835-5092.
Experience, Skills, Attributes, and Qualifications of the Trustees. The Governance and Nominating Committee has adopted a statement of policy that describes the experience, qualifications, attributes, and skills that are necessary and desirable for potential Independent Trustee candidates (Statement of Policy). The Board believes that each Trustee satisfied at the time he or she was initially elected or appointed a Trustee, and continues to satisfy, the standards contemplated by the Statement of Policy. The Governance and Nominating Committee also engages professional search firms to help identify potential Independent Trustee candidates who have the experience, qualifications, attributes, and skills consistent with the Statement of Policy. From time to time, additional criteria based on the composition and skills of the current Independent Trustees, as well as experience or skills that may be appropriate in light of future changes to board composition, business conditions, and regulatory or other developments, have also been considered by the professional search firms and the Governance and Nominating Committee. In addition, the Board takes into account the Trustees' commitment and participation in Board and committee meetings, as well as their leadership of standing and ad hoc committees throughout their tenure.
In determining that a particular Trustee was and continues to be qualified to serve as a Trustee, the Board has considered a variety of criteria, none of which, in isolation, was controlling. The Board believes that, collectively, the Trustees have balanced and diverse experience, qualifications, attributes, and skills, which allow the Board to operate effectively in governing the fund and protecting the interests of shareholders. Information about the specific experience, skills, attributes, and qualifications of each Trustee, which in each case led to the Board's conclusion that the Trustee should serve (or continue to serve) as a trustee of the fund, is provided below.
Board Structure and Oversight Function. James C. Curvey is an interested person and currently serves as Chairman. The Trustees have determined that an interested Chairman is appropriate and benefits shareholders because an interested Chairman has a personal and professional stake in the quality and continuity of services provided to the fund. Independent Trustees exercise their informed business judgment to appoint an individual of their choosing to serve as Chairman, regardless of whether the Trustee happens to be independent or a member of management. The Independent Trustees have determined that they can act independently and effectively without having an Independent Trustee serve as Chairman and that a key structural component for assuring that they are in a position to do so is for the Independent Trustees to constitute a substantial majority for the Board. The Independent Trustees also regularly meet in executive session. Ned C. Lautenbach serves as Chairman of the Independent Trustees and as such (i) acts as a liaison between the Independent Trustees and management with respect to matters important to the Independent Trustees and (ii) with management prepares agendas for Board meetings.
Fidelity® funds are overseen by different Boards of Trustees. The fund's Board oversees Fidelity's high income and certain equity funds, and other Boards oversee Fidelity's investment-grade bond, money market, asset allocation, and sector funds. The asset allocation funds may invest in Fidelity® funds overseen by the fund's Board. The use of separate Boards, each with its own committee structure, allows the Trustees of each group of Fidelity® funds to focus on the unique issues of the funds they oversee, including common research, investment, and operational issues. On occasion, the separate Boards establish joint committees to address issues of overlapping consequences for the Fidelity® funds overseen by each Board.
The Trustees operate using a system of committees to facilitate the timely and efficient consideration of all matters of importance to the Trustees, the fund, and fund shareholders and to facilitate compliance with legal and regulatory requirements and oversight of the fund's activities and associated risks. The Board, acting through its committees, has charged FMR and its affiliates with (i) identifying events or circumstances the occurrence of which could have demonstrably adverse effects on the fund's business and/or reputation; (ii) implementing processes and controls to lessen the possibility that such events or circumstances occur or to mitigate the effects of such events or circumstances if they do occur; and (iii) creating and maintaining a system designed to evaluate continuously business and market conditions in order to facilitate the identification and implementation processes described in (i) and (ii) above. Because the day-to-day operations and activities of the fund are carried out by or through FMR, its affiliates, and other service providers, the fund's exposure to risks is mitigated but not eliminated by the processes overseen by the Trustees. While each of the Board's committees has responsibility for overseeing different aspects of the fund's activities, oversight is exercised primarily through the Operations, Audit, and Compliance Committees. In addition, the Independent Trustees have worked with FMR to enhance the Board's oversight of investment and financial risks, legal and regulatory risks, technology risks, and operational risks, including the development of additional risk reporting to the Board. For example, a working group comprised of Independent Trustees and FMR has worked and continues to work to review the Fidelity® funds' valuation-related activities, reporting and risk management. Appropriate personnel, including but not limited to the fund's Chief Compliance Officer (CCO), FMR's internal auditor, the independent accountants, the fund's Treasurer and portfolio management personnel, make periodic reports to the Board's committees, as appropriate, including an annual review of Fidelity's risk management program for the Fidelity® funds. The responsibilities of each standing committee, including their oversight responsibilities, are described further under "Standing Committees of the Trustees."
Interested Trustees*:
Correspondence intended for a Trustee who is an interested person may be sent to Fidelity Investments, 245 Summer Street, Boston, Massachusetts 02210.
Name, Year of Birth; Principal Occupations and Other Relevant Experience+
James C. Curvey (1935)
Year of Election or Appointment: 2007
Trustee
Chairman of the Board of Trustees
Mr. Curvey also serves as Trustee of other Fidelity® funds. Mr. Curvey is a Director of Fidelity Research & Analysis Co. (investment adviser firm, 2009-present), and Vice Chairman (2007-present) and Director of FMR LLC (diversified financial services company). In addition, Mr. Curvey serves as an Overseer for the Boston Symphony Orchestra and a member of the board of Artis-Naples, Naples, Florida, and as a Trustee for Brewster Academy, Wolfeboro, New Hampshire. Previously, Mr. Curvey served as a Director of Fidelity Investments Money Management, Inc. (investment adviser firm, 2009-2014) and a Director of FMR and FMR Co., Inc. (investment adviser firms, 2007-2014).
Charles S. Morrison (1960)
Year of Election or Appointment: 2014
Trustee
Mr. Morrison also serves as Trustee of other funds. He serves as a Director of Fidelity Investments Money Management, Inc. (FIMM) (investment adviser firm, 2014-present), Director of Fidelity SelectCo, LLC (investment adviser firm, 2014-present), President, Asset Management (2014-present), and is an employee of Fidelity Investments. Previously, Mr. Morrison served as Vice President of Fidelity's Fixed Income and Asset Allocation Funds (2012-2014), President, Fixed Income (2011-2014), Vice President of Fidelity's Money Market Funds (2005-2009), President, Money Market Group Leader of FMR (investment adviser firm, 2009), and Senior Vice President, Money Market Group of FMR (2004-2009). Mr. Morrison also served as Vice President of Fidelity's Bond Funds (2002-2005), certain Balanced Funds (2002-2005), and certain Asset Allocation Funds (2002-2007), and as Senior Vice President (2002-2005) of Fidelity's Bond Division.
* Determined to be an “Interested Trustee” by virtue of, among other things, his or her affiliation with the trust or various entities under common control with FMR.
+ The information includes the Trustee's principal occupation during the last five years and other information relating to the experience, attributes, and skills relevant to the Trustee's qualifications to serve as a Trustee, which led to the conclusion that the Trustee should serve as a Trustee for the fund.
Independent Trustees:
Correspondence intended for an Independent Trustee may be sent to Fidelity Investments, P.O. Box 55235, Boston, Massachusetts 02205-5235.
Name, Year of Birth; Principal Occupations and Other Relevant Experience+
Dennis J. Dirks (1948)
Year of Election or Appointment: 2005
Trustee
Mr. Dirks also serves as Trustee of other Fidelity® funds. Prior to his retirement in May 2003, Mr. Dirks was Chief Operating Officer and a member of the Board of The Depository Trust & Clearing Corporation (DTCC). He also served as President, Chief Operating Officer, and Board member of The Depository Trust Company (DTC) and President and Board member of the National Securities Clearing Corporation (NSCC). In addition, Mr. Dirks served as Chief Executive Officer and Board member of the Government Securities Clearing Corporation, Chief Executive Officer and Board member of the Mortgage-Backed Securities Clearing Corporation, as a Trustee and a member of the Finance Committee of Manhattan College (2005-2008), as a Trustee and a member of the Finance Committee of AHRC of Nassau County (2006-2008), and as a member of the Independent Directors Council (IDC) Governing Council (2010-2015). Mr. Dirks is a member of the Board of Directors for The Brookville Center for Children's Services, Inc. (2009-present).
Alan J. Lacy (1953)
Year of Election or Appointment: 2008
Trustee
Mr. Lacy also serves as Trustee of other Fidelity® funds. Mr. Lacy serves as Chairman (2014-present) and a member (2010-present) of the Board of Directors of Dave & Buster's Entertainment, Inc. (restaurant and entertainment complexes) and a Director of Bristol-Myers Squibb Company (global pharmaceuticals, 2008-present). He is a Trustee of the California Chapter of The Nature Conservancy (2015-present) and a Director of the Center for Advanced Study in the Behavioral Sciences at Stanford University (2015-present). In addition, Mr. Lacy served as Senior Adviser (2007-2014) of Oak Hill Capital Partners, L.P. (private equity) and also served as Chief Executive Officer (2005) and Vice Chairman (2005-2006) of Sears Holdings Corporation (retail) and Chief Executive Officer and Chairman of the Board of Sears, Roebuck and Co. (retail, 2000-2005). Previously, Mr. Lacy served as Chairman (2008-2011) and a member (2006-2015) of the Board of Trustees of the National Parks Conservation Association and as a member of the Board of Directors for The Western Union Company (global money transfer, 2006-2011), The Hillman Companies, Inc. (hardware wholesalers, 2010-2014), and Earth Fare, Inc. (retail grocery, 2010-2014).
Ned C. Lautenbach (1944)
Year of Election or Appointment: 2000
Trustee
Chairman of the Independent Trustees
Mr. Lautenbach also serves as Trustee of other Fidelity® funds. Mr. Lautenbach currently serves as the Lead Director of the Eaton Corporation Board of Directors (diversified industrial, 1997-present). Mr. Lautenbach is Chairman of the Board of Directors of Artis-Naples in Naples, Florida (2012-present), a member of the Council on Foreign Relations (1994-present), and a member of the Board of Governors, State University System of Florida (2013-present). Previously, Mr. Lautenbach was a Partner/Advisory Partner at Clayton, Dubilier & Rice, LLC (private equity investment, 1998-2010), as well as a Director of Sony Corporation (2006-2007).
Joseph Mauriello (1944)
Year of Election or Appointment: 2008
Trustee
Mr. Mauriello also serves as Trustee of other Fidelity® funds. Prior to his retirement in January 2006, Mr. Mauriello served in numerous senior management positions including Deputy Chairman and Chief Operating Officer (2004-2005), and Vice Chairman of Financial Services (2002-2004) of KPMG LLP US (professional services, 1965-2005). Mr. Mauriello currently serves as a member of the Board of Directors of XL Group plc. (global insurance and re-insurance, 2006-present) and the Independent Directors Council (IDC) Governing Council (2015-present). Previously, Mr. Mauriello served as a Director of the Hamilton Funds of the Bank of New York (2006-2007) and of Arcadia Resources Inc. (health care services and products, 2007-2012).
Robert W. Selander (1950)
Year of Election or Appointment: 2011
Trustee
Mr. Selander also serves as Trustee of other Fidelity® funds. Mr. Selander serves as a Director of The Western Union Company (global money transfer, 2014-present) and a non-executive Chairman of Health Equity, Inc. (health savings custodian, 2015-present). Previously, Mr. Selander served as a Member of the Advisory Board of certain Fidelity® funds (2011), and Executive Vice Chairman (2010), Chief Executive Officer (2009-2010), and President and Chief Executive Officer (1997-2009) of Mastercard, Inc.
Cornelia M. Small (1944)
Year of Election or Appointment: 2005
Trustee
Ms. Small also serves as Trustee of other Fidelity® funds. Ms. Small is a member of the Board of Directors (2009-present) and Chair of the Investment Committee (2010-present) of the Teagle Foundation. Ms. Small also serves on the Investment Committee of the Berkshire Taconic Community Foundation (2008-present). Previously, Ms. Small served as Chairperson (2002-2008) and a member of the Investment Committee and Chairperson (2008-2012) and a member of the Board of Trustees of Smith College. In addition, Ms. Small served as Chief Investment Officer, Director of Global Equity Investments, and a member of the Board of Directors of Scudder, Stevens & Clark and Scudder Kemper Investments.
William S. Stavropoulos (1939)
Year of Election or Appointment: 2002
Trustee
Vice Chairman of the Independent Trustees
Mr. Stavropoulos also serves as Trustee of other Fidelity® funds. Mr. Stavropoulos serves as President and Founder of the Michigan Baseball Foundation, the Great Lakes Loons (2007-present). Mr. Stavropoulos is Chairman Emeritus of the Board of Directors of The Dow Chemical Company, where he previously served in numerous senior management positions, including President, CEO (1995-2000; 2002-2004), Chairman of the Executive Committee (2000-2006), and as a member of the Board of Directors (1990-2006). Currently, Mr. Stavropoulos is Chairman of the Board of Directors of Univar Inc. (global distributor of commodity and specialty chemicals), a Director of Teradata Corporation (data warehousing and technology solutions), and Maersk Inc. (industrial conglomerate), and a member of the Advisory Board for Metalmark Capital LLC (private equity investment, 2005-present). Mr. Stavropoulos is an operating advisor to Clayton, Dubilier & Rice, LLC (private equity investment). In addition, Mr. Stavropoulos is a member of the University of Notre Dame Advisory Council for the College of Science, a Trustee of the Rollin L. Gerstacker Foundation, and a Director of the Naples Philharmonic Center for the Arts. Previously, Mr. Stavropoulos served as a Director of Chemical Financial Corporation (bank holding company, 1993-2012) and Tyco International, Ltd. (multinational manufacturing and services, 2007-2012).
David M. Thomas (1949)
Year of Election or Appointment: 2008
Trustee
Mr. Thomas also serves as Trustee of other Fidelity® funds. Mr. Thomas serves as Non-Executive Chairman of the Board of Directors of Fortune Brands Home and Security (home and security products, 2011-present), as a member of the Board of Directors (2004-present) and Presiding Director (2013-present) of Interpublic Group of Companies, Inc. (marketing communication), and as a member of the Board of Trustees of the University of Florida (2013-present). Previously, Mr. Thomas served as Executive Chairman (2005-2006) and Chairman and Chief Executive Officer (2000-2005) of IMS Health, Inc. (pharmaceutical and healthcare information solutions), and a Director of Fortune Brands, Inc. (consumer products, 2000-2011).
+ The information includes the Trustee's principal occupation during the last five years and other information relating to the experience, attributes, and skills relevant to the Trustee's qualifications to serve as a Trustee, which led to the conclusion that the Trustee should serve as a Trustee for the fund.
Advisory Board Members and Officers:
Correspondence intended for an officer or Peter S. Lynch may be sent to Fidelity Investments, 245 Summer Street, Boston, Massachusetts 02210. Officers appear below in alphabetical order.
Name, Year of Birth; Principal Occupation
Peter S. Lynch (1944)
Year of Election or Appointment: 2003
Member of the Advisory Board
Mr. Lynch also serves as Member of the Advisory Board of other Fidelity® funds. Mr. Lynch is Vice Chairman and a Director of FMR (investment adviser firm) and FMR Co., Inc. (investment adviser firm). In addition, Mr. Lynch serves as a Trustee of Boston College and as the Chairman of the Inner-City Scholarship Fund. Previously, Mr. Lynch served on the Special Olympics International Board of Directors (1997-2006).
Marc R. Bryant (1966)
Year of Election or Appointment: 2015
Secretary and Chief Legal Officer (CLO)
Mr. Bryant also serves as Secretary and CLO of other funds. Mr. Bryant serves as CLO, Secretary, and Senior Vice President of Fidelity Management & Research Company (investment adviser firm, 2015-present) and FMR Co., Inc. (investment adviser firm, 2015-present); Secretary of Fidelity SelectCo, LLC (investment adviser firm, 2015-present) and Fidelity Investments Money Management, Inc. (investment adviser firm, 2015-present); and CLO of Fidelity Management & Research (Hong Kong) Limited and FMR Investment Management (U.K.) Limited (investment adviser firms, 2015-present) and Fidelity Management & Research (Japan) Limited (investment adviser firm, 2016-present). He is Senior Vice President and Deputy General Counsel of FMR LLC (diversified financial services company). Previously, Mr. Bryant served as Secretary and CLO of Fidelity Rutland Square Trust II (2010-2014) and Assistant Secretary of Fidelity's Fixed Income and Asset Allocation Funds (2013-2015). Prior to joining Fidelity Investments, Mr. Bryant served as a Senior Vice President and the Head of Global Retail Legal for AllianceBernstein L.P. (2006-2010), and as the General Counsel for ProFund Advisors LLC (2001-2006).
Jeffrey S. Christian (1961)
Year of Election or Appointment: 2016
Assistant Treasurer
Mr. Christian also serves as Assistant Treasurer of other funds. Mr. Christian is an employee of Fidelity Investments (2003-present).
William C. Coffey (1969)
Year of Election or Appointment: 2009
Assistant Secretary
Mr. Coffey also serves as Assistant Secretary of other funds. He is Senior Vice President and Deputy General Counsel of FMR LLC (diversified financial services company, 2010-present), and is an employee of Fidelity Investments. Previously, Mr. Coffey served as Vice President and Associate General Counsel of FMR LLC (2005-2009).
Jonathan Davis (1968)
Year of Election or Appointment: 2010
Assistant Treasurer
Mr. Davis also serves as Assistant Treasurer of other funds, and is an employee of Fidelity Investments. Previously, Mr. Davis served as Vice President and Associate General Counsel of FMR LLC (diversified financial services company, 2003-2010).
Adrien E. Deberghes (1967)
Year of Election or Appointment: 2016
Assistant Treasurer
Mr. Deberghes also serves as an officer of other funds. He serves as Executive Vice President of Fidelity Investments Money Management, Inc. (FIMM) (investment adviser firm, 2016-present) and is an employee of Fidelity Investments (2008-present). Prior to joining Fidelity Investments, Mr. Deberghes was Senior Vice President of Mutual Fund Administration at State Street Corporation (2007-2008), Senior Director of Mutual Fund Administration at Investors Bank & Trust (2005-2007), and Director of Finance for Dunkin' Brands (2000-2005). Previously, Mr. Deberghes served in other fund officer roles.
Stephanie J. Dorsey (1969)
Year of Election or Appointment: 2010
Assistant Treasurer
Ms. Dorsey also serves as an officer of other funds. She is an employee of Fidelity Investments (2008-present) and has served in other fund officer roles. Prior to joining Fidelity Investments, Ms. Dorsey served as Treasurer (2004-2008) of the JPMorgan Mutual Funds and Vice President (2004-2008) of JPMorgan Chase Bank.
Howard J. Galligan III (1966)
Year of Election or Appointment: 2014
Chief Financial Officer
Mr. Galligan also serves as Chief Financial Officer of other funds. Mr. Galligan serves as President of Fidelity Pricing and Cash Management Services (FPCMS) (2014-present) and as a Director of Strategic Advisers, Inc. (investment adviser firm, 2008-present). Previously, Mr. Galligan served as Chief Administrative Officer of Asset Management (2011-2014) and Chief Operating Officer and Senior Vice President of Investment Support for Strategic Advisers, Inc. (2003-2011).
Scott C. Goebel (1968)
Year of Election or Appointment: 2015
Vice President
Mr. Goebel serves as Vice President of other funds and is an employee of Fidelity Investments (2001-present). Mr. Goebel serves as Senior Vice President of Fidelity Management & Research Company (FMR) (investment adviser firm, 2016-present). Previously, Mr. Goebel served as Secretary of Fidelity SelectCo, LLC (investment adviser firm, 2013-2015), Fidelity Investments Money Management, Inc. (FIMM) (investment adviser firm, 2010-2015), and Fidelity Research and Analysis Company (FRAC) (investment adviser firm, 2010-2015); General Counsel, Secretary, and Senior Vice President of FMR (investment adviser firm, 2008-2015) and FMR Co., Inc. (investment adviser firm, 2008-2015); Assistant Secretary of Fidelity Management & Research (Japan) Limited (investment adviser firm, 2008-2015) and Fidelity Management & Research (U.K.) Inc. (investment adviser firm, 2008-2015); Chief Legal Officer (CLO) of Fidelity Management & Research (Hong Kong) Limited (investment adviser firm, 2008-2015); Secretary and CLO of certain Fidelity® funds (2008-2015); Assistant Secretary of FIMM (2008-2010), FRAC (2008-2010), and certain funds (2007-2008); and as Vice President and Secretary of Fidelity Distributors Corporation (FDC) (2005-2007).
Thomas C. Hense (1964)
Year of Election or Appointment: 2008, 2010, or 2015
Vice President
Mr. Hense serves as Vice President of Fidelity Advisor® Multi-Asset Income Fund (2015) and other funds (High Income (2008), Small Cap (2008), and Value (2010) funds), and is an employee of Fidelity Investments (1993-present). Previously, Mr. Hense served as a portfolio manager for Fidelity's Institutional Money Management Group (Pyramis) (2003-2008).
Brian B. Hogan (1964)
Year of Election or Appointment: 2009
Vice President
Mr. Hogan also serves as Trustee or Vice President of other funds. Mr. Hogan serves as a Director of FMR Investment Management (U.K.) Limited (investment adviser firm, 2015-present) and Fidelity SelectCo, LLC (investment adviser firm, 2014-present) and President of the Equity Division of FMR (investment adviser firm, 2009-present). Previously, Mr. Hogan served as Senior Vice President, Equity Research of FMR (2006-2009) and as a portfolio manager. Mr. Brian B. Hogan is not related to Mr. Colm A. Hogan.
Colm A. Hogan (1973)
Year of Election or Appointment: 2016
Deputy Treasurer
Mr. Hogan also serves as an officer of other funds. Mr. Hogan is an employee of Fidelity Investments (2005-present). Mr. Colm A. Hogan is not related to Mr. Brian B. Hogan.
Chris Maher (1972)
Year of Election or Appointment: 2013
Assistant Treasurer
Mr. Maher serves as Assistant Treasurer of other funds. Mr. Maher is Vice President of Valuation Oversight and is an employee of Fidelity Investments. Previously, Mr. Maher served as Vice President of Asset Management Compliance (2013), Vice President of the Program Management Group of FMR (investment adviser firm, 2010-2013), and Vice President of Valuation Oversight (2008-2010).
John F. Papandrea (1972)
Year of Election or Appointment: 2016
Anti-Money Laundering (AML) Officer
Mr. Papandrea also serves as AML Officer of other funds. Mr. Papandrea is Vice President of FMR LLC (diversified financial services company, 2008-present) and is an employee of Fidelity Investments (2005-present).
Kenneth B. Robins (1969)
Year of Election or Appointment: 2016
Chief Compliance Officer
Mr. Robins also serves as an officer of other funds. Mr. Robins serves as Compliance Officer of Fidelity Management & Research Company and FMR Co., Inc. (investment adviser firms, 2016-present) and is an employee of Fidelity Investments (2004-present). Previously, Mr. Robins served as Executive Vice President of Fidelity Investments Money Management, Inc. (investment adviser firm, 2013-2016) and served in other fund officer roles.
Stacie M. Smith (1974)
Year of Election or Appointment: 2016
President and Treasurer
Ms. Smith also serves as an officer of other funds. She is an employee of Fidelity Investments (2009-present) and has served in other fund officer roles. Prior to joining Fidelity Investments, Ms. Smith served as Senior Audit Manager of Ernst & Young LLP (1996-2009). Previously, Ms. Smith served as Deputy Treasurer of certain Fidelity® funds (2013-2016).
Renee Stagnone (1975)
Year of Election or Appointment: 2016
Assistant Treasurer
Ms. Stagnone also serves as an officer of other funds. Ms. Stagnone is an employee of Fidelity Investments (1997-present). Previously, Ms. Stagnone served as Deputy Treasurer of certain Fidelity® funds (2013-2016).
Shareholder Expense Example
As a shareholder of the Fund, you incur two types of costs: (1) transaction costs, and (2) ongoing costs, including management fees and other Fund expenses. This Example is intended to help you understand your ongoing costs (in dollars) of investing in the Fund and to compare these costs with the ongoing costs of investing in other mutual funds.
The Example is based on an investment of $1,000 invested at the beginning of the period and held for the entire period (February 1, 2016 to July 31, 2016).
Actual Expenses
The first line of the accompanying table for each class of the Fund provides information about actual account values and actual expenses. You may use the information in this line, together with the amount you invested, to estimate the expenses that you paid over the period. Simply divide your account value by $1,000.00 (for example, an $8,600 account value divided by $1,000.00 = 8.6), then multiply the result by the number in the first line for a class of the Fund under the heading entitled "Expenses Paid During Period" to estimate the expenses you paid on your account during this period. A small balance maintenance fee of $12.00 that is charged once a year may apply for certain accounts with a value of less than $2,000. This fee is not included in the table below. If it was, the estimate of expenses you paid during the period would be higher, and your ending account value lower, by this amount. In addition, the Fund, as a shareholder in the underlying Fidelity Central Funds, will indirectly bear its pro-rata share of the fees and expenses incurred by the underlying Fidelity Central Funds. These fees and expenses are not included in the Fund's annualized expense ratio used to calculate the expense estimate in the table below.
Hypothetical Example for Comparison Purposes
The second line of the accompanying table for each class of the Fund provides information about hypothetical account values and hypothetical expenses based on a Class' actual expense ratio and an assumed rate of return of 5% per year before expenses, which is not the Class' actual return. The hypothetical account values and expenses may not be used to estimate the actual ending account balance or expenses you paid for the period. You may use this information to compare the ongoing costs of investing in the Fund and other funds. To do so, compare this 5% hypothetical example with the 5% hypothetical examples that appear in the shareholder reports of the other funds. A small balance maintenance fee of $12.00 that is charged once a year may apply for certain accounts with a value of less than $2,000. This fee is not included in the table below. If it was, the estimate of expenses you paid during the period would be higher, and your ending account value lower, by this amount. In addition, the Fund, as a shareholder in the underlying Fidelity Central Funds, will indirectly bear its pro-rata share of the fees and expenses incurred by the underlying Fidelity Central Funds. These fees and expenses are not included in the Fund's annualized expense ratio used to calculate the expense estimate in the table below.
Please note that the expenses shown in the table are meant to highlight your ongoing costs only and do not reflect any transaction costs. Therefore, the second line of the table is useful in comparing ongoing costs only, and will not help you determine the relative total costs of owning different funds.
| | Annualized Expense Ratio-A | Beginning
Account Value
February 1, 2016 | Ending
Account Value
July 31, 2016 | Expenses Paid
During Period-B
February 1, 2016
to July 31, 2016 |
| Growth and Income | .64% | | | |
| Actual | | $1,000.00 | $1,138.70 | $3.40 |
| Hypothetical-C | | $1,000.00 | $1,021.68 | $3.22 |
| Class K | .52% | | | |
| Actual | | $1,000.00 | $1,139.50 | $2.77 |
| Hypothetical-C | | $1,000.00 | $1,022.28 | $2.61 |
A Annualized expense ratio reflects expenses net of applicable fee waivers.
B Expenses are equal to each Class' annualized expense ratio, multiplied by the average account value over the period, multiplied by 182/366 (to reflect the one-half year period).
C 5% return per year before expenses
Distributions (Unaudited)
Growth and Income designates 97%, 95%, 100%, and 100%, and Class K designates 91%, 90%, 100%, and 100%; of the dividends distributed in October 2015, December 2015, April 2016 and July 2016, respectively during the fiscal year as qualifying for the dividends–received deduction for corporate shareholders.
Growth and Income and Class K designate 100% of each dividend distributed in October 2015, December 2015, April 2016 and July 2016, respectively during the fiscal year as amounts which may be taken into account as a dividend for purposes of the maximum rate under section 1(h)(11) of the Internal Revenue Code.
The fund will notify shareholders in January 2017 of amounts for use in preparing 2016 income tax returns.
Board Approval of Investment Advisory Contracts and Management Fees
Fidelity Growth & Income Portfolio
Each year, the Board of Trustees, including the Independent Trustees (together, the Board), votes on the renewal of the management contract with Fidelity Management & Research Company (FMR) and the sub-advisory agreements (together, the Advisory Contracts) for the fund. The Board, assisted by the advice of fund counsel and Independent Trustees' counsel, requests and considers a broad range of information relevant to the renewal of the Advisory Contracts throughout the year.
The Board meets regularly and, at each of its meetings, covers an extensive agenda of topics and materials and considers factors that are relevant to its annual consideration of the renewal of the fund's Advisory Contracts, including the services and support provided to the fund and its shareholders. The Board has established various standing committees (Committees), each composed of and chaired by Independent Trustees with varying backgrounds, to which the Board has assigned specific subject matter responsibilities in order to enhance effective decision-making by the Board. The Board, acting directly and through its Committees, requests and receives information concerning the annual consideration of the renewal of the fund's Advisory Contracts. The Board also meets as needed to consider matters specifically related to the Board's annual consideration of the renewal of the Advisory Contracts. Members of the Board may also meet with trustees of other Fidelity funds through ad hoc joint committees to discuss certain matters relevant to all of the Fidelity funds.
At its July 2016 meeting, the Board unanimously determined to renew the fund's Advisory Contracts. In reaching its determination, the Board considered all factors it believed relevant, including (i) the nature, extent, and quality of the services to be provided to the fund and its shareholders (including the investment performance of the fund); (ii) the competitiveness of the fund's management fee and total expense ratio relative to peer funds; (iii) the total costs of the services to be provided by and the profits to be realized by Fidelity from its relationships with the fund; and (iv) the extent to which, if any, economies of scale exist and would be realized as the fund grows, and whether any economies of scale are appropriately shared with fund shareholders.
In considering whether to renew the Advisory Contracts for the fund, the Board reached a determination, with the assistance of fund counsel and Independent Trustees' counsel and through the exercise of its business judgment, that the renewal of the Advisory Contracts was in the best interests of the fund and its shareholders and that the compensation payable under the Advisory Contracts was fair and reasonable. The Board's decision to renew the Advisory Contracts was not based on any single factor, but rather was based on a comprehensive consideration of all the information provided to the Board at its meetings throughout the year. The Board, in reaching its determination to renew the Advisory Contracts, was aware that shareholders of the fund have a broad range of investment choices available to them, including a wide choice among funds offered by Fidelity's competitors, and that the fund's shareholders, who have the opportunity to review and weigh the disclosure provided by the fund in its prospectus and other public disclosures, have chosen to invest in this fund, which is part of the Fidelity family of funds.
Nature, Extent, and Quality of Services Provided. The Board considered Fidelity's staffing as it relates to the fund, including the backgrounds of investment personnel of Fidelity, and also considered the fund's investment objective, strategies, and related investment philosophy. The Independent Trustees also had discussions with senior management of Fidelity's investment operations and investment groups. The Board considered the structure of the investment personnel compensation program and whether this structure provides appropriate incentives to act in the best interests of the fund. Additionally, the Board considered the portfolio managers' investments, if any, in the funds that they manage.
Resources Dedicated to Investment Management and Support Services. The Board and the Fund Oversight and Research Committees reviewed the general qualifications and capabilities of Fidelity's investment staff, including its size, education, experience, and resources, as well as Fidelity's approach to recruiting, training, managing, and compensating investment personnel. The Board noted that Fidelity has continued to increase the resources devoted to non-U.S. offices, including expansion of Fidelity's global investment organization. The Board also noted that Fidelity's analysts have extensive resources, tools and capabilities that allow them to conduct sophisticated quantitative and fundamental analysis, as well as credit analysis of issuers, counterparties and guarantors. Further, the Board considered that Fidelity's investment professionals have sufficient access to global information and data so as to provide competitive investment results over time, and that those professionals also have access to sophisticated tools that permit them to assess portfolio construction and risk and performance attribution characteristics continuously, as well as to transmit new information and research conclusions rapidly around the world. Additionally, in its deliberations, the Board considered Fidelity's trading, risk management, compliance, and technology and operations capabilities and resources, which are integral parts of the investment management process.
Shareholder and Administrative Services. The Board considered (i) the nature, extent, quality, and cost of advisory, administrative, and shareholder services performed by FMR, the sub-advisers (together with FMR, the Investment Advisers), and their affiliates under the Advisory Contracts and under separate agreements covering transfer agency, pricing and bookkeeping, and securities lending services for the fund; (ii) the nature and extent of the supervision of third party service providers, principally custodians, subcustodians, and pricing vendors; and (iii) the resources devoted to, and the record of compliance with, the fund's compliance policies and procedures. The Board also reviewed the allocation of fund brokerage, including allocations to brokers affiliated with the Investment Advisers, the use of brokerage commissions to pay fund expenses, and the use of "soft" commission dollars to pay for research services.
The Board noted that the growth of fund assets over time across the complex allows Fidelity to reinvest in the development of services designed to enhance the value or convenience of the Fidelity funds as investment vehicles. These services include 24-hour access to account information and market information through telephone representatives and over the Internet, investor education materials and asset allocation tools, and the expanded availability of Fidelity Investor Centers.
In 2014, the Board formed an ad hoc Committee on Transfer Agency Fees to review the variety of transfer agency fee structures throughout the industry and Fidelity's competitive positioning with respect to industry participants.
Investment in a Large Fund Family. The Board considered the benefits to shareholders of investing in a Fidelity fund, including the benefits of investing in a fund that is part of a large family of funds offering a variety of investment disciplines and providing a large variety of mutual fund investor services. The Board noted that Fidelity had taken, or had made recommendations that resulted in the Fidelity funds taking, a number of actions over the previous year that benefited particular funds, including: (i) continuing to dedicate additional resources to investment research and to the support of the senior management team that oversees asset management; (ii) continuing efforts to enhance Fidelity's global research capabilities; (iii) launching new funds and making other enhancements to meet client needs; (iv) broadening eligibility requirements for certain lower-priced share classes of, and streamlining the fee structure for, certain existing equity index funds; (v) lowering expense caps for certain existing funds and classes to reduce expenses paid by shareholders; (vi) eliminating redemption fees for certain variable insurance product funds and classes; (vii) continuing to launch dedicated lower cost underlying funds to meet portfolio construction needs related to expanding underlying fund options for Fidelity funds of funds, specifically for the Freedom Fund product lines; (viii) launching a lower cost share class for use by the Freedom Index Fund product line; (ix) rationalizing product lines and gaining increased efficiencies through fund mergers and share class consolidations; (x) continuing to develop, acquire and implement systems and technology to improve services to the funds and shareholders, strengthen information security, and increase efficiency; (xi) implementing investment enhancements to further strengthen Fidelity's target date product line to increase investors' probability of success in achieving their goals; (xii) accelerating the conversion of all remaining Class B shares to Class A shares, which have a lower expense structure; and (xiii) implementing changes to Fidelity's money market fund product line in response to recent regulatory reforms.
Investment Performance. The Board considered whether the fund has operated in accordance with its investment objective, as well as its record of compliance with its investment restrictions and its performance history.
The Board took into account discussions with representatives of the Investment Advisers about fund investment performance that occur at Board meetings throughout the year. In this regard the Board noted that as part of regularly scheduled fund reviews and other reports to the Board on fund performance, the Board considers annualized return information for the fund, for different time periods, measured against a securities market index ("benchmark index") and a peer group of funds with similar objectives ("peer group"), if any. In its evaluation of fund investment performance, the Board gave particular attention to information indicating changes in performance of certain Fidelity funds for specific time periods and discussed with the Investment Advisers the reasons for any overperformance or underperformance.
In addition to reviewing absolute and relative fund performance, the Independent Trustees periodically consider the appropriateness of fund performance metrics in evaluating the results achieved. In general, the Independent Trustees believe that fund performance should be evaluated based on net performance (after fees and expenses) of both the highest performing and lowest performing fund share classes, where applicable, compared to appropriate benchmark indices, over appropriate time periods that may include full market cycles, and compared to peer groups, as applicable, over the same periods, taking into account relevant factors including the following: general market conditions; issuer-specific information; and fund cash flows and other factors.
The Independent Trustees recognize that shareholders evaluate performance on a net basis over their own holding periods, for which one-, three-, and five-year periods are often used as a proxy. For this reason, the performance information reviewed by the Board also included net cumulative calendar year total return information for the fund and an appropriate benchmark index and peer group for the most recent one-, three-, and five-year periods, as shown below. Returns are shown compared to the 25th percentile (top of box, 75% beaten) and 75th percentile (bottom of box, 25% beaten) of the peer universe.
Fidelity Growth & Income Portfolio
The Board has discussed the fund's underperformance with FMR and has engaged with FMR to consider what steps might be taken to remediate the fund's underperformance.
Based on its review, the Board concluded that the nature, extent, and quality of services provided to the fund under the Advisory Contracts should continue to benefit the shareholders of the fund.
Competitiveness of Management Fee and Total Expense Ratio. The Board considered the fund's management fee and total expense ratio compared to "mapped groups" of competitive funds and classes created for the purpose of facilitating the Trustees' competitive analysis of management fees and total expenses. Fidelity creates "mapped groups" by combining similar Broadridge investment objective categories that have comparable investment mandates. Combining Broadridge investment objective categories aids the Board's management fee and total expense ratio comparisons by broadening the competitive group used for comparison.
Management Fee. The Board considered two proprietary management fee comparisons for the 12-month periods shown in basis points (BP) in the chart below. The group of Broadridge funds used by the Board for management fee comparisons is referred to below as the "Total Mapped Group." The Total Mapped Group comparison focuses on a fund's standing in terms of gross management fees before expense reimbursements or caps relative to the total universe of funds with comparable investment mandates, regardless of whether their management fee structures also are comparable. Funds with comparable investment mandates offer exposure to similar types of securities. Funds with comparable management fee structures have similar management fee contractual arrangements (
e.g., flat rate charged for advisory services, all-inclusive fee rate,
etc.). "TMG %" represents the percentage of funds in the Total Mapped Group that had management fees that were lower than the fund's. For example, a hypothetical TMG % of 20% would mean that 80% of the funds in the Total Mapped Group had higher, and 20% had lower, management fees than the fund. The fund's actual TMG %s and the number of funds in the Total Mapped Group are in the chart below. The "Asset-Size Peer Group" (ASPG) comparison focuses on a fund's standing relative to a subset of non-Fidelity funds within the Total Mapped Group that are similar in size and management fee structure. For example, if a fund is in the first quartile of the ASPG, the fund's management fee ranks in the least expensive or lowest 25% of funds in the ASPG. The ASPG represents at least 15% of the funds in the Total Mapped Group with comparable asset size and management fee structures, subject to a minimum of 50 funds (or all funds in the Total Mapped Group if fewer than 50). Additional information, such as the ASPG quartile in which the fund's management fee rate ranked, is also included in the chart and considered by the Board.
Fidelity Growth & Income Portfolio
The Board noted that the fund's management fee rate ranked below the median of its Total Mapped Group and below the median of its ASPG for 2015.
The Board noted that, in 2014, the ad hoc Committee on Group Fee was formed by it and the boards of other Fidelity funds to conduct an in-depth review of the "group fee" component of the management fee of funds with such management fee structures. The Committee's focus included the mechanics of the group fee, the competitive landscape of group fee structures, Fidelity funds with no group fee component and investment products not included in group fee assets. The Board also considered that, for funds subject to the group fee, FMR agreed to voluntarily waive fees over a specified period of time in amounts designed to account for assets converted from certain funds to certain collective investment trusts.
The Board also noted that, in 2013, the ad hoc Committee on Management Fees was formed to conduct an in-depth review of the management fee rates of Fidelity's active equity mutual funds. The Committee focused on the following areas: (i) standard fee structures; (ii) research consumption and trading evolution; (iii) management fee competitiveness/profitability by category; and (iv) factors that drive institutional pricing.
Based on its review, the Board concluded that the fund's management fee is fair and reasonable in light of the services that the fund receives and the other factors considered.
Total Expense Ratio. In its review of each class's total expense ratio, the Board considered the fund's management fee rate as well as other fund or class expenses, as applicable, such as transfer agent fees, pricing and bookkeeping fees, and custodial, legal, and audit fees. The Board also noted that Fidelity may agree to waive fees and expenses from time to time, and the extent to which, if any, it has done so for the fund. As part of its review, the Board also considered the current and historical total expense ratios of each class of the fund compared to competitive fund median expenses. Each class of the fund is compared to those funds and classes in the Total Mapped Group (used by the Board for management fee comparisons) that have a similar sales load structure.
The Board noted that the total expense ratio of each class ranked below the competitive median for 2015.
Fees Charged to Other Fidelity Clients. The Board also considered Fidelity fee structures and other information with respect to clients of Fidelity, such as other funds advised or subadvised by Fidelity, pension plan clients, and other institutional clients with similar mandates. The Board noted the findings of the 2013 ad hoc joint committee (created with the board of other Fidelity funds), which reviewed and compared Fidelity's institutional investment advisory business with its business of providing services to the Fidelity funds, including the differences in services provided, fees charged, and costs incurred, as well as competition in their respective marketplaces.
Based on its review of total expense ratios and fees charged to other Fidelity clients, the Board concluded that the total expense ratio of each class of the fund was reasonable in light of the services that the fund and its shareholders receive and the other factors considered.
Costs of the Services and Profitability. The Board considered the revenues earned and the expenses incurred by Fidelity in conducting the business of developing, marketing, distributing, managing, administering and servicing the fund and servicing the fund's shareholders. The Board also considered the level of Fidelity's profits in respect of all the Fidelity funds.
On an annual basis, Fidelity presents to the Board information about the profitability of its relationship with the fund. Fidelity calculates profitability information for each fund, as well as aggregate profitability information for groups of Fidelity funds and all Fidelity funds, using a series of detailed revenue and cost allocation methodologies which originate with the books and records of Fidelity on which Fidelity's audited financial statements are based. The Audit Committee of the Board reviews any significant changes from the prior year's methodologies.
PricewaterhouseCoopers LLP (PwC), independent registered public accounting firm and auditor to Fidelity and certain Fidelity funds, has been engaged annually by the Board as part of the Board's assessment of Fidelity's profitability analysis. PwC's engagement includes the review and assessment of the methodologies used by Fidelity in determining the revenues and expenses attributable to Fidelity's mutual fund business, and completion of agreed-upon procedures in respect of the mathematical accuracy of the fund profitability information and its conformity to established allocation methodologies. After considering PwC's reports issued under the engagement and information provided by Fidelity, the Board concluded that while other allocation methods may also be reasonable, Fidelity's profitability methodologies are reasonable in all material respects.
The Board also reviewed Fidelity's non-fund businesses and fall-out benefits related to the mutual fund business as well as cases where Fidelity's affiliates may benefit from or be related to the fund's business.
The Board considered the costs of the services provided by and the profits realized by Fidelity in connection with the operation of the fund and was satisfied that the profitability was not excessive.
Economies of Scale. The Board considered whether there have been economies of scale in respect of the management of the Fidelity funds, whether the Fidelity funds (including the fund) have appropriately benefited from any such economies of scale, and whether there is potential for realization of any further economies of scale. The Board considered the extent to which the fund will benefit from economies of scale as assets grow through increased services to the fund, through waivers or reimbursements, or through fee or expense ratio reductions. The Board also noted that in 2013, it and the boards of other Fidelity funds created an ad hoc committee (the Economies of Scale Committee) to analyze whether Fidelity attains economies of scale in respect of the management and servicing of the Fidelity funds, whether the Fidelity funds have appropriately benefited from such economies of scale, and whether there is potential for realization of any further economies of scale.
The Board recognized that the fund's management contract incorporates a "group fee" structure, which provides for lower group fee rates as total group assets increase, and for higher group fee rates as total group assets decrease (with "group assets" defined to include fund assets under FMR's management plus the assets of sector funds previously under FMR's management). FMR calculates the group fee rates based on a tiered asset "breakpoint" schedule that varies based on asset class. The Board considered that the group fee is designed to deliver the benefits of economies of scale to fund shareholders when total Fidelity fund assets increase, even if assets of any particular fund are unchanged or have declined, because some portion of Fidelity's costs are attributable to services provided to all Fidelity funds, and all funds benefit if those costs can be allocated among more assets. The Board concluded that, given the group fee structure, fund shareholders will benefit from lower management fees as group assets increase at the fund complex level, regardless of whether Fidelity achieves any such economies of scale.
The Board concluded, taking into account the analysis of the Economies of Scale Committee, that economies of scale, if any, are being appropriately shared between fund shareholders and Fidelity.
Additional Information Requested by the Board. In order to develop fully the factual basis for consideration of the Fidelity funds' Advisory Contracts, the Board requested and received additional information on certain topics, including: (i) fund performance trends and Fidelity's long-term strategies for certain funds; (ii) the various share classes employed by Fidelity and the attributes of each class, together with similar information on the distribution and servicing payments made by Fidelity or the funds to third-party participants in the distribution channels; (iii) fund profitability, and fund performance in relation to fund profitability; (iv) the methodology with respect to evaluating competitive fund data and peer group classifications and fee comparisons; (v) annual fund profitability margins; (vi) the realization of fall-out benefits in and attribution of fall-out benefits to certain Fidelity business units; (vii) the appropriateness of certain funds' benchmarks; (viii) the rationalization for certain share classes and expenses; (ix) sub-advisory fee rates for comparable investment mandates; (x) product strategy for certain underperforming funds; and (xi) Fidelity's resources and strategy for cybersecurity.
Based on its evaluation of all of the conclusions noted above, and after considering all factors it believed relevant, the Board concluded that the advisory fee structures are fair and reasonable, and that the fund's Advisory Contracts should be renewed.
Corporate Headquarters
245 Summer St.
Boston, MA 02210
www.fidelity.com
GAI-K-ANN-0916
1.863230.107
Item 2.
Code of Ethics
As of the end of the period, July 31, 2016, Fidelity Securities Fund (the trust) has adopted a code of ethics, as defined in Item 2 of Form N-CSR, that applies to its President and Treasurer and its Chief Financial Officer. A copy of the code of ethics is filed as an exhibit to this Form N-CSR.
Item 3.
Audit Committee Financial Expert
The Board of Trustees of the trust has determined that Joseph Mauriello is an audit committee financial expert, as defined in Item 3 of Form N-CSR. Mr. Mauriello is independent for purposes of Item 3 of Form N-CSR.
Item 4.
Principal Accountant Fees and Services
Fees and Services
The following table presents fees billed by Deloitte & Touche LLP, the member firms of Deloitte Touche Tohmatsu, and their respective affiliates (collectively, “Deloitte Entities”) in each of the last two fiscal years for services rendered to Fidelity Blue Chip Growth Fund, Fidelity OTC Portfolio, Fidelity Real Estate Income Fund, Fidelity Series Blue Chip Growth Fund, Fidelity Series Real Estate Equity Fund, Fidelity Series Real Estate Income Fund, and Fidelity Series Small Cap Opportunities Fund (the “Funds”):
Services Billed by Deloitte Entities
July 31, 2016 FeesA
| | | | |
| Audit Fees | Audit-Related Fees | Tax Fees | All Other Fees |
Fidelity Blue Chip Growth Fund | $154,000 | $- | $5,200 | $3,900 |
Fidelity OTC Portfolio | $74,000 | $- | $6,200 | $2,300 |
Fidelity Real Estate Income Fund | $173,000 | $- | $7,000 | $3,300 |
Fidelity Series Blue Chip Growth Fund | $70,000 | $- | $5,900 | $1,700 |
Fidelity Series Real Estate Equity Fund | $40,000 | $- | $6,100 | $1,100 |
Fidelity Series Real Estate Income Fund | $81,000 | $- | $6,500 | $1,600 |
Fidelity Series Small Cap Opportunities Fund | $50,000 | $- | $5,500 | $1,600 |
| | | | |
| Audit Fees | Audit-Related Fees | Tax Fees | All Other Fees |
Fidelity Blue Chip Growth Fund | $51,000 | $- | $5,300 | $4,700 |
Fidelity OTC Portfolio | $47,000 | $- | $5,800 | $3,300 |
Fidelity Real Estate Income Fund | $160,000 | $- | $7,600 | $1,600 |
Fidelity Series Blue Chip Growth Fund | $48,000 | $- | $6,800 | $2,400 |
Fidelity Series Real Estate Equity Fund | $39,000 | $- | $5,800 | $900 |
Fidelity Series Real Estate Income Fund | $76,000 | $- | $6,300 | $800 |
Fidelity Series Small Cap Opportunities Fund | $59,000 | $- | $5,900 | $1,800 |
A Amounts may reflect rounding.
The following table presents fees billed by PricewaterhouseCoopers LLP (“PwC”) in each of the last two fiscal years for services rendered to Fidelity Blue Chip Value Fund, Fidelity Dividend Growth Fund, Fidelity Growth & Income Portfolio, Fidelity Leveraged Company Stock Fund, Fidelity Small Cap Growth Fund, and Fidelity Small Cap Value Fund (the “Funds”):
Services Billed by PwC
July 31, 2016 FeesA
| | | | |
| Audit Fees | Audit-Related Fees | Tax Fees | All Other Fees |
Fidelity Blue Chip Value Fund | $55,000 | $- | $5,900 | $2,300 |
Fidelity Dividend Growth Fund | $67,000 | $- | $3,700 | $3,600 |
Fidelity Growth & Income Portfolio | $77,000 | $- | $6,200 | $3,700 |
Fidelity Leveraged Company Stock Fund | $57,000 | $- | $4,600 | $2,900 |
Fidelity Small Cap Growth Fund | $55,000 | $- | $3,700 | $2,400 |
Fidelity Small Cap Value Fund | $56,000 | $- | $5,300 | $2,600 |
| | | | |
| Audit Fees | Audit-Related Fees | Tax Fees | All Other Fees |
Fidelity Blue Chip Value Fund | $52,000 | $- | $5,800 | $1,800 |
Fidelity Dividend Growth Fund | $67,000 | $- | $5,000 | $4,700 |
Fidelity Growth & Income Portfolio | $74,000 | $- | $11,100 | $4,400 |
Fidelity Leveraged Company Stock Fund | $56,000 | $- | $4,400 | $3,500 |
Fidelity Small Cap Growth Fund | $52,000 | $- | $6,000 | $2,100 |
Fidelity Small Cap Value Fund | $54,000 | $- | $6,400 | $2,700 |
A Amounts may reflect rounding.
The following table presents fees billed by PwC and Deloitte Entities that were required to be approved by the Audit Committee for services that relate directly to the operations and financial reporting of the Funds and that are rendered on behalf of Fidelity Management & Research Company (“FMR”) and entities controlling, controlled by, or under common control with FMR (not including any sub-adviser whose role is primarily portfolio management and is subcontracted with or overseen by another investment adviser) that provide ongoing services to the Funds (“Fund Service Providers”):
Services Billed by Deloitte Entities
| | |
| July 31, 2016A | July 31, 2015A |
Audit-Related Fees | $35,000 | $- |
Tax Fees | $10,000 | $- |
All Other Fees | $- | $175,000 |
A Amounts may reflect rounding.
Services Billed by PwC
| | |
| July 31, 2016A | July 31, 2015A |
Audit-Related Fees | $6,005,000 | $4,480,000 |
Tax Fees | $- | $- |
All Other Fees | $- | $- |
A Amounts may reflect rounding.
“Audit-Related Fees” represent fees billed for assurance and related services that are reasonably related to the performance of the fund audit or the review of the fund's financial statements and that are not reported under Audit Fees.
“Tax Fees” represent fees billed for tax compliance, tax advice or tax planning that relate directly to the operations and financial reporting of the fund.
“All Other Fees” represent fees billed for services provided to the fund or Fund Service Provider, a significant portion of which are assurance related, that relate directly to the operations and financial reporting of the fund, excluding those services that are reported under Audit Fees, Audit-Related Fees or Tax Fees.
Assurance services must be performed by an independent public accountant.
* * *
The aggregate non-audit fees billed by PwC and Deloitte Entities for services rendered to the Funds, FMR (not including any sub-adviser whose role is primarily portfolio management and is subcontracted with or overseen by another investment adviser), and any Fund Service Provider for each of the last two fiscal years of the Funds are as follows:
| | |
Billed By | July 31, 2016 A | July 31, 2015 A |
PwC | $6,810,000 | $5,815,000 |
Deloitte Entities | $135,000 | $595,000 |
A Amounts may reflect rounding.
The trust's Audit Committee has considered non-audit services that were not pre-approved that were provided by PwC and Deloitte Entities to Fund Service Providers to be compatible with maintaining the independence of PwC and Deloitte Entities in their audits of the Funds, taking into account representations from PwC and Deloitte Entities, in accordance with Public Company Accounting Oversight Board rules, regarding their independence from the Funds and their related entities and FMR’s review of the appropriateness and permissibility under applicable law of such non-audit services prior to their provision to the Fund Service Providers.
Audit Committee Pre-Approval Policies and Procedures
The trust’s Audit Committee must pre-approve all audit and non-audit services provided by a fund’s independent registered public accounting firm relating to the operations or financial reporting of the fund. Prior to the commencement of any audit or non-audit services to a fund, the Audit Committee reviews the services to determine whether they are appropriate and permissible under applicable law.
The Audit Committee has adopted policies and procedures to, among other purposes, provide a framework for the Committee’s consideration of non-audit services by the audit firms that audit the Fidelity funds. The policies and procedures require that any non-audit service provided by a fund audit firm to a Fidelity fund and any non-audit service provided by a fund auditor to a Fund Service Provider that relates directly to the operations and financial reporting of a Fidelity fund (“Covered Service”) are subject to approval by the Audit Committee before such service is provided.
All Covered Services must be approved in advance of provision of the service either: (i) by formal resolution of the Audit Committee, or (ii) by oral or written approval of the service by the Chair of the Audit Committee (or if the Chair is unavailable, such other member of the Audit Committee as may be designated by the Chair to act in the Chair’s absence). The approval contemplated by (ii) above is permitted where the Treasurer determines that action on such an engagement is necessary before the next meeting of the Audit Committee.
Non-audit services provided by a fund audit firm to a Fund Service Provider that do not relate directly to the operations and financial reporting of a Fidelity fund are reported to the Audit Committee on a periodic basis.
Non-Audit Services Approved Pursuant to Rule 2-01(c)(7)(i)(C) and (ii) of Regulation S-X (“De Minimis Exception”)
There were no non-audit services approved or required to be approved by the Audit Committee pursuant to the De Minimis Exception during the Funds’ last two fiscal years relating to services provided to (i) the Funds or (ii) any Fund Service Provider that relate directly to the operations and financial reporting of the Funds.
Item 5.
Audit Committee of Listed Registrants
Not applicable.
Item 6.
Investments
(a)
Not applicable.
(b)
Not applicable
Item 7.
Disclosure of Proxy Voting Policies and Procedures for Closed-End Management Investment Companies
Not applicable.
Item 8.
Portfolio Managers of Closed-End Management Investment Companies
Not applicable.
Item 9.
Purchase of Equity Securities by Closed-End Management Investment Company and Affiliated Purchasers
Not applicable.
Item 10.
Submission of Matters to a Vote of Security Holders
There were no material changes to the procedures by which shareholders may recommend nominees to the trust’s Board of Trustees.
Item 11.
Controls and Procedures
(a)(i) The President and Treasurer and the Chief Financial Officer have concluded that the trust’s disclosure controls and procedures (as defined in Rule 30a-3(c) under the Investment Company Act) provide reasonable assurances that material information relating to the trust is made known to them by the appropriate persons, based on their evaluation of these controls and procedures as of a date within 90 days of the filing date of this report.
(a)(ii) There was no change in the trust’s internal control over financial reporting (as defined in Rule 30a-3(d) under the Investment Company Act) that occurred during the second fiscal quarter of the period covered by this report that has materially affected, or is reasonably likely to materially affect, the trust’s internal control over financial reporting.
Item 12.
Exhibits
| | |
(a) | (1) | Code of Ethics pursuant to Item 2 of Form N-CSR is filed and attached hereto as EX-99.CODE ETH. |
(a) | (2) | Certification pursuant to Rule 30a-2(a) under the Investment Company Act of 1940 (17 CFR 270.30a-2(a)) is filed and attached hereto as Exhibit 99.CERT. |
(a) | (3) | Not applicable. |
(b) | | Certification pursuant to Rule 30a-2(b) under the Investment Company Act of 1940 (17 CFR 270.30a-2(b)) is furnished and attached hereto as Exhibit 99.906CERT. |
SIGNATURES
Pursuant to the requirements of the Securities Exchange Act of 1934 and the Investment Company Act of 1940, the registrant has duly caused this report to be signed on its behalf by the undersigned, thereunto duly authorized.
Fidelity Securities Fund
| |
By: | /s/ Stacie M. Smith |
| Stacie M. Smith |
| President and Treasurer |
| |
Date: | September 27, 2016 |
Pursuant to the requirements of the Securities Exchange Act of 1934 and the Investment Company Act of 1940, this report has been signed below by the following persons on behalf of the registrant and in the capacities and on the dates indicated.
| |
By: | /s/Stacie M. Smith |
| Stacie M. Smith |
| President and Treasurer |
| |
Date: | September 27, 2016 |
| |
By: | /s/Howard J. Galligan III |
| Howard J. Galligan III |
| Chief Financial Officer |
| |
Date: | September 27, 2016 |