Item 1: Report to Shareholders| High Yield Fund | November 30, 2005 |
The views and opinions in this report were current as of November 30, 2005. They are not guarantees of performance or investment results and should not be taken as investment advice. Investment decisions reflect a variety of factors, and the managers reserve the right to change their views about individual stocks, sectors, and the markets at any time. As a result, the views expressed should not be relied upon as a forecast of the fund’s future investment intent. The report is certified under the Sarbanes-Oxley Act of 2002, which requires mutual funds and other public companies to affirm that, to the best of their knowledge, the information in their financial reports is fairly and accurately stated in all material respects.
REPORTS ON THE WEB
Sign up for our E-mail Program, and you can begin to receive updated fund reports and prospectuses online rather than through the mail. Log in to your account at troweprice.com for more information.
Fellow Shareholders
High-yield bonds were far and away the best-performing domestic fixed-income asset class for the past six months, although absolute returns for the period and the year have been significantly less than the fund’s longer-term averages. The volatility we referenced in our last letter to you continued in the current period. Since May, lower-quality junk bonds (CCC rated and below) underperformed higher-quality B and BB rated issues. This reversal favored our investing style, helping us outperform our benchmark and the peer group average.
PORTFOLIO PERFORMANCE AND MARKET ENVIRONMENT
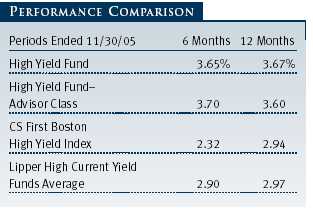
Your fund’s returns outperformed the CS First Boston High Yield Index and the Lipper average of comparable funds for the past six and 12 months. Advisor Class results were similar but reflected their different fee structure. The major reasons for our good relative results were security selection and our risk control philosophy, which emphasizes broad diversification, balanced sector allocation, and a focus on the middle and upper tiers of the high-yield market.
One year ago we wrote, “We believe there is a very real possibility that the Fed will raise the fed funds rate at each of its FOMC meetings in 2005, and that would put the fed funds rate at about 4.25% by the end of next year...We believe the next 12 to 18 months could be challenging for fixed-income managers and investors. Therefore, we intend to maintain a defensive posture for the foreseeable future.” The Fed has raised rates at each meeting this year and, as of December 13 (two weeks after the end of our reporting period), the fed funds rate stood at 4.25%. The fund’s results benefited from our defensive posturing in the face of these increases.
Over the past six months high-yield bonds have been volatile, which created investor concern about the long-term direction of our market. The long run of low-quality junk outperformance seems to have come to an end, and some of the riskier names trended sharply lower. We resisted the temptation to overload the portfolio with CCC and other lower-rated credits, and this helped our relative returns. Despite the volatility, a number of measures show that the general state of the corporate credit market is positive—balance sheet quality has improved, debt as a percent of cash flow is at manageable levels, and the default rate is near an eight-year low.
PORTFOLIO STRATEGY AND REVIEW
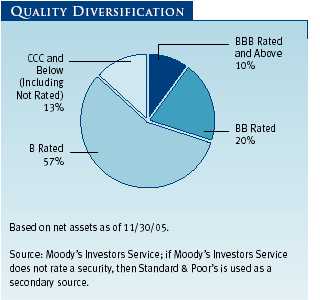
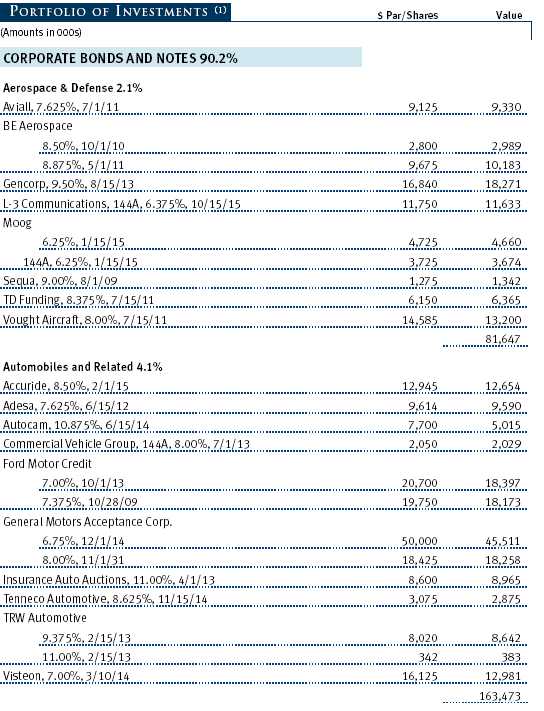
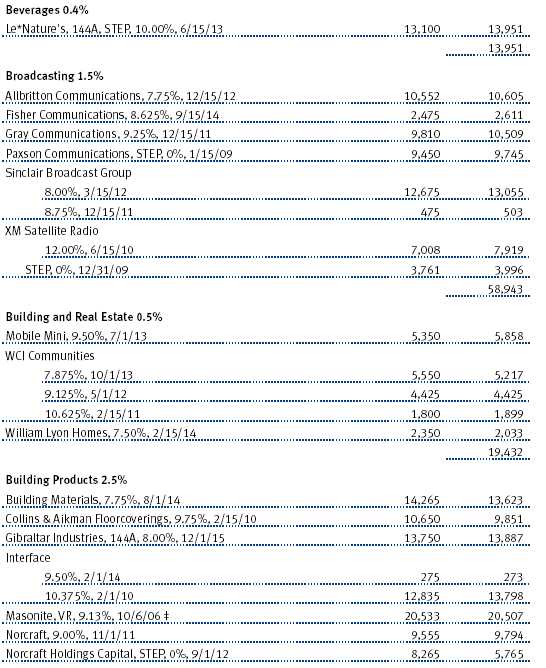
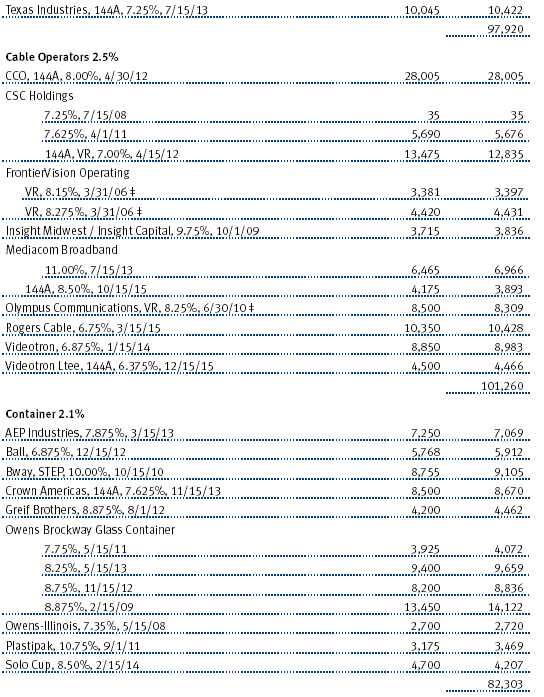
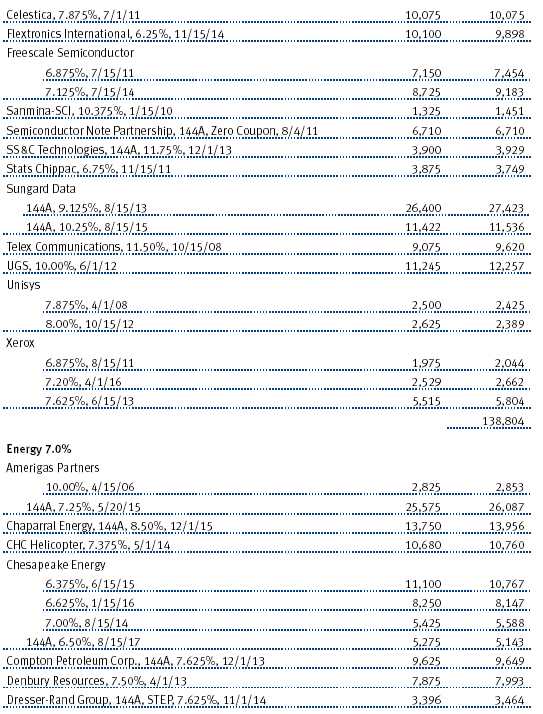
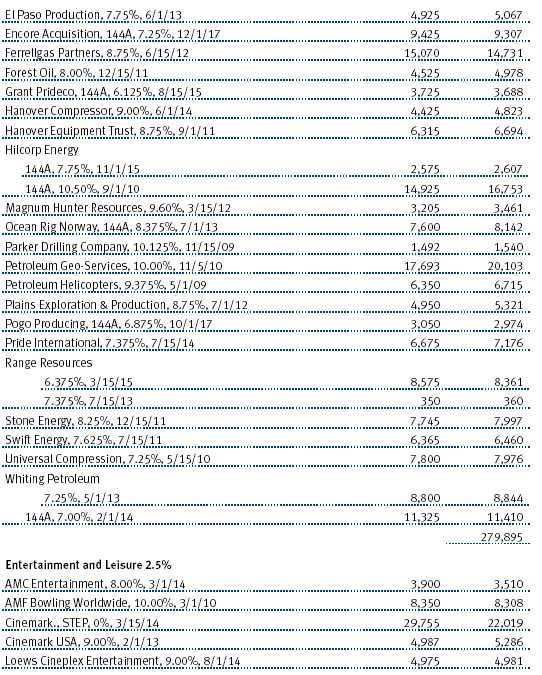
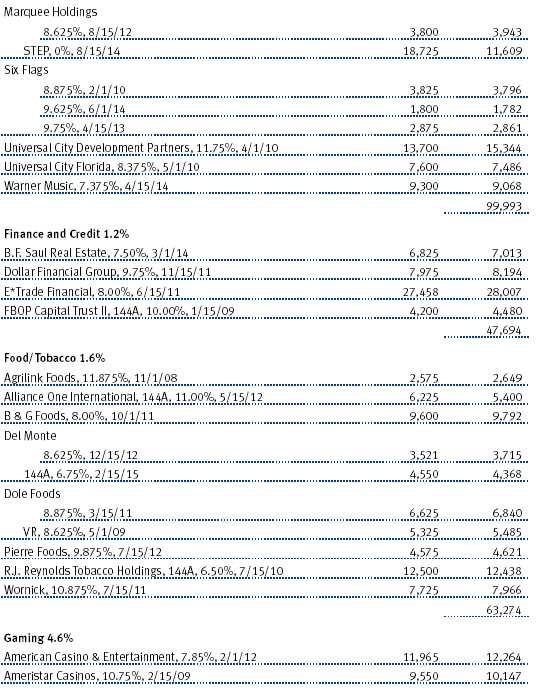
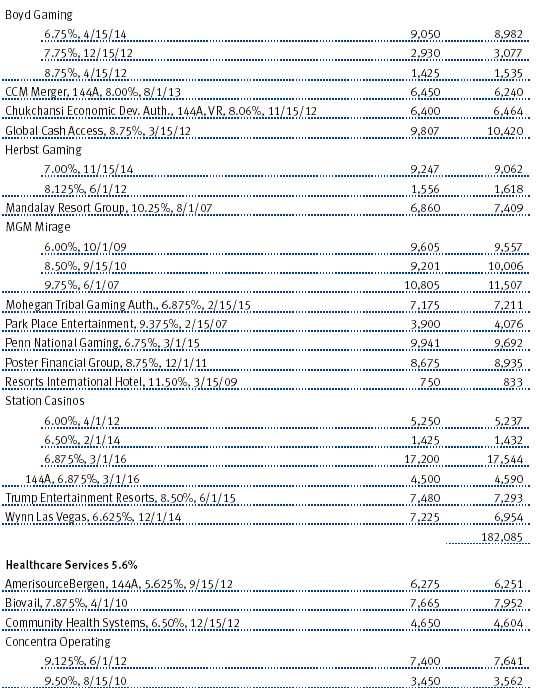
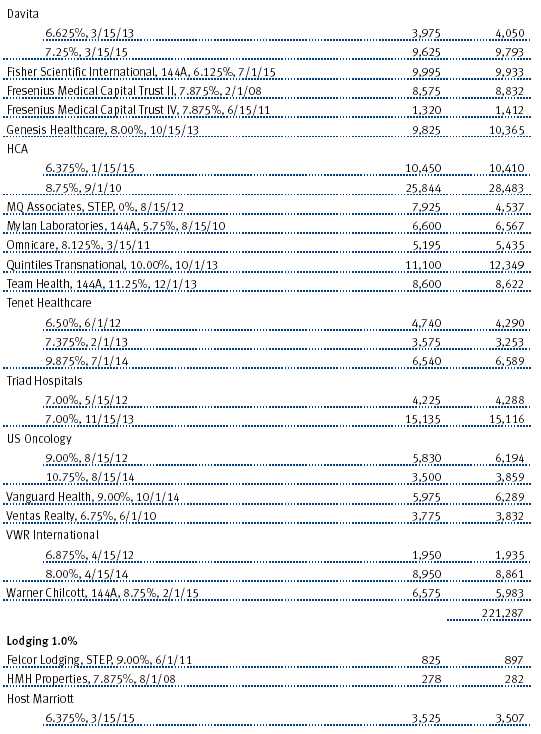
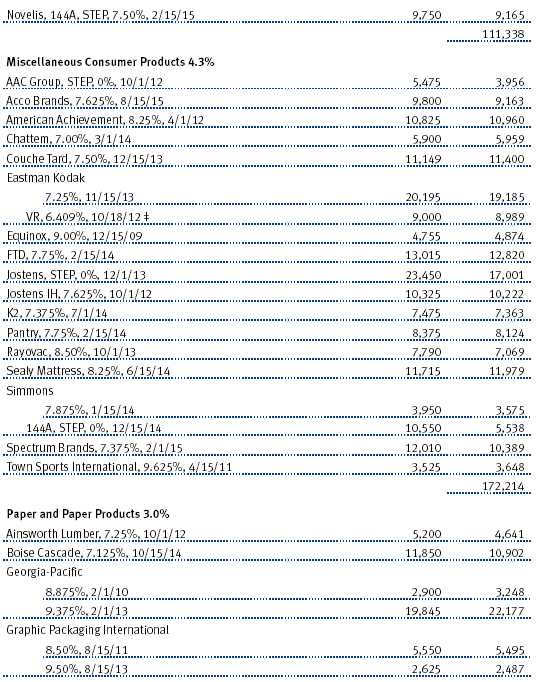
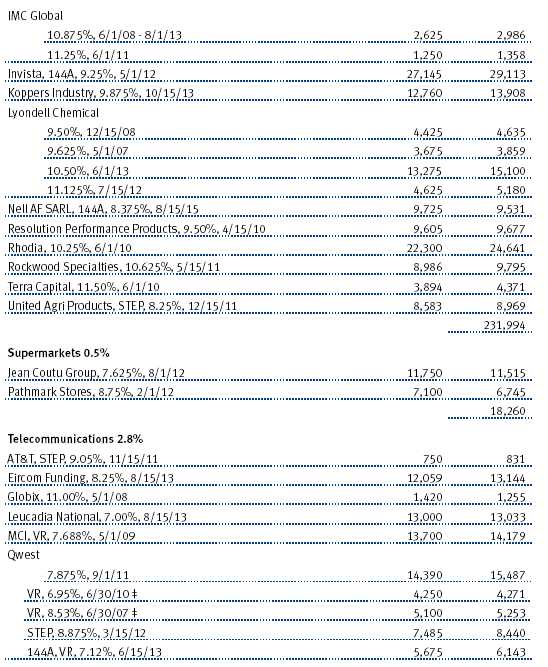
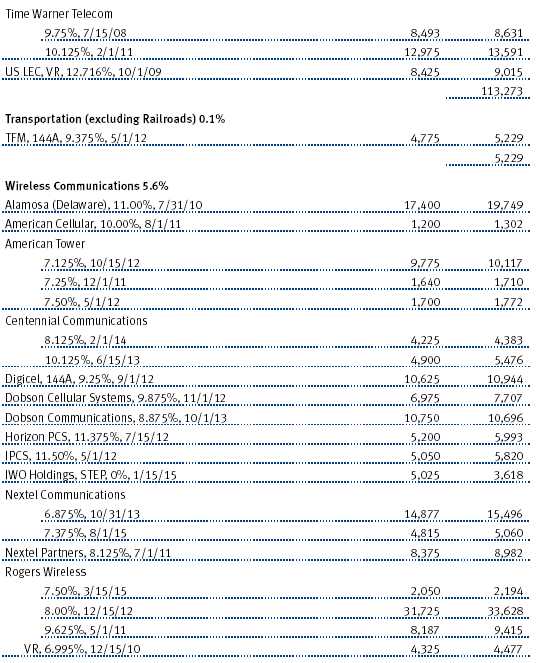
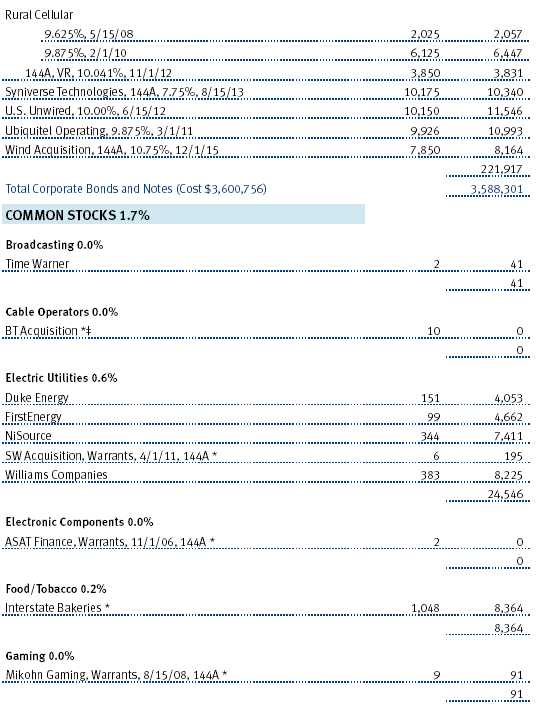
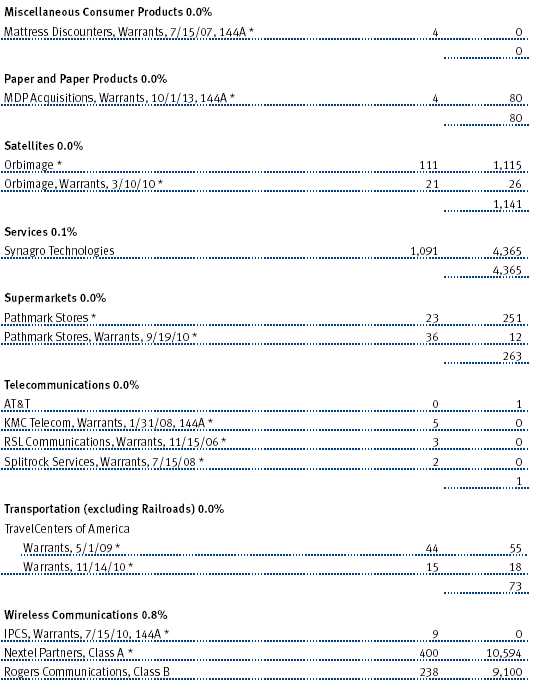
Within the context of individual security selection, we managed the portfolio with several overriding themes. The first was upgrading the portfolio’s quality, which over the past 12 months helped us make up some ground on the CS First Boston High Yield Index. At the end of the reporting period, the portfolio had a significantly lower allocation in credits with a below B rating than the benchmark’s 23.1% weighting. We have systematically avoided the riskiest securities, forsaking the short-term yield benefit. For example, we did not own Calpine bonds, which plunged during the period, and although we owned a small position in Charter Communications, we held the firm’s highest-quality issues, which held up relatively well. (Please refer to our portfolio of investments for a complete listing of the fund’s holdings and the amount each represents of the portfolio.)
 As you can see in this chart, we have gradually upgraded the portfolio’s quality. Our below [single] B rated credit allocation is currently about three percentage points lower than 12 months ago and our above B rated bond allocation is up more than eight percentage points. As always, the lion’s share of the portfolio is invested in B rated issues. At the end of the current period, the balance of the portfolio (8.7% of total net assets) was invested in cash, short-term holdings, and equity-linked securities.
FALLEN ANGELS
The second major investing theme, one that we have addressed in prior letters, is our focus on “fallen angels”—former blue chip companies that have had their investment-grade bonds downgraded to junk status. We have been exceptionally successful in investing in this arena over the past decade, and turnarounds continued to be a primary focus over the past six months. Our most significant investment in this category, and the portfolio’s largest single issuer at the end of the period, is General Motors Acceptance Corporation (GMAC), the GM subsidiary that provides car loans and other financial services.
We think that there is a high probability that GM will sell a piece of GMAC. GM realizes that it has to shore up its financials, and it has stated its willingness to part with either a minority or majority stake to a well-heeled buyer or possibly a consortium of financial services companies. However, as you can see in the chart, the benchmark GMAC bond has been extremely volatile. The fundamentals of the auto industry continue to deteriorate, and these bonds—somewhat reflective of the entire industry—have moved sharply as each new piece of information hits the headlines. We think GMAC is a world-class operation and could be a good asset for a strategic buyer. We own GMAC bonds because they should appreciate substantially if a transaction occurs, which we think could happen in the next three to six months.

In the past six months, we purchased a large position in bonds and bank debt of Eastman Kodak, another fallen angel, because we believe the company will effectively transition away from its dependence on film and into the digital era. We are also seeing more aggressive posturing from American corporations that will impact not only our market, but the investment-grade universe as well. For example, large shareholders are pressuring BBB rated Time Warner to boost its stock price by buying back stock and selling assets, which are credit-negative actions. Other notable fallen angels that have rewarded us handsomely include telecommunications providers AT&T, Lucent, and MCI/WorldCom, in addition to industrial companies, such as Tyco International, Bombardier, and U.S. Steel.
MERGER AND ACQUISITION ACTIVITY SURGES
The third major theme that is driving our investment decisions and high-yield market performance is the resurgence of merger and acquisition (M&A) activity. Private equity shops including Kohlberg Kravis Roberts (KKR), Blackstone Group, and Apollo have taken a number of companies private this year, such as Hertz, Toys R Us, and Neiman-Marcus. Strategic buyers are flush with cash and accelerating the pace of their purchases because corporate balance sheets are very healthy and liquid, and managements are shifting their focus from balance sheet repair to enhancing value for equity shareholders. The volume of deal-making is having a significant impact on our market.
M&A activity affected several of our positions in the past six months. Some of the deals were positive for the portfolio. Georgia-Pacific, one of the largest paper companies in the U.S., was purchased by Koch Industries (a large, rather secretive, Kansas-based conglomerate), and our bonds will be retired at the conclusion of the deal for a nice profit. Sprint acquired Alamosa Delaware, a wireless services provider, which was another big gainer thanks to the upgrade of Alamosa’s bonds. Two utilities, NRG Energy and Texas Genco, are merging and the market viewed it positively, sending both issuers' bonds significantly higher. La Quinta Properties, a lodging company we have owned for years, is being taken private by Blackstone Group, which will retire the debt we hold.

The fund participated in the SunGard Data leveraged buyout (LBO) this summer. It was one of the largest deals of its kind ever completed—an $11 billion LBO with an equity investment of $3.5 billion, which required a consortium of LBO shops to work together to write the check. We took a sizable position in this solid technology company and it is performing well, as has the entire tech industry for the past six months. T. Rowe Price had been a substantial stockholder in the company for many years. It is a firm that our analysts have followed and known quite well for a long time, and that increased our confidence in the deal.
However, there were also several negative M&A surprises. Cablevision Systems, after a failed LBO attempt, decided to pay a large dividend to its shareholders, which will add debt to the balance sheet and weaken the creditworthiness of its existing bonds. Two of our satellite credits, Panamsat and Intelsat, are merging. The market views the transaction, which involves one LBO sponsor selling to another, as a negative for bondholders because the companies will take on additional leverage. Dex Media and R.H. Donnelley, a pair of yellow pages companies, are also merging. The deal creates more debt, deteriorating the creditworthiness of our bonds.
Many investment funds are moving into alternative investments including hedge funds and private equity shops, and some of them have generated very good performance. These sponsors have been able to raise a large amount of new cash, and we expect the volume of leveraged buyout activity to increase dramatically in 2006. The alternative investors used to do deals alone, but now they are partnering to buy bigger and bigger companies. This is a major trend that we believe will significantly impact our market for years. Evaluating these deals and our security selection process will be critical in generating good long-term performance.
OUTLOOK
We have enjoyed a great run in the high-yield market, but we see the three-year bull market losing some steam. Bond market volatility is picking up, and there is a measure of disagreement among fixed-income professionals about the direction of interest rates. Clearly the direction for short-term rates is up, as the Fed does its work, but there is ample room for debate about whether long-term rates will move much higher. Our risk-aware investing strategy has led us to a defensive posture. We’re minimizing the portfolio’s interest rate sensitivity by avoiding lower-coupon and longer-maturity securities in favor of shorter-maturity and higher-coupon issues. This is getting harder to do because there aren’t many higher-coupon bonds left.
Companies are still in solid financial shape but are exhibiting more aggressive strategic behavior—a willingness to take on debt to make acquisitions and buy back stock. We need to be vigilant for signs of speculative activity on the part of managements and pockets of weakness in the economy due to higher energy prices, which have particularly hurt the airline and forest products industries in the second half of the year.
We think that spreads (the yield differential between high-yield credits and Treasuries) could widen somewhat over the next six months. However, we do not expect a drastic move that results in significant capital depreciation for the portfolio. We expect a more traditional type of high-yield environment where dividends generate the bulk of returns. Overall, the environment remains positive for the economy and the majority of our holdings. Although the next six months could be choppy and volatile, we think the high-yield market holds promising prospects for fixed-income investors for the intermediate term.
Respectfully submitted,

| Mark J. Vaselkiv |
| Chairman of the fund’s Investment Advisory Committee |
| |
| December 16, 2005 |
| |
| The committee chairman has day-to-day responsibility for managing the |
| portfolio and works with committee members in developing and executing |
| the fund’s investment program. |
RISKS OF BOND INVESTING
Bonds are subject to interest rate risk, the decline in bond prices that usually accompanies a rise in interest rates, and credit risk, the chance that any fund holding could have its credit rating downgraded, or that a bond issuer will default (fail to make timely payments of interest or principal), potentially reducing the fund’s income level and share price. High-yield corporate bonds could have greater price declines than funds that invest primarily in high-quality bonds. Companies issuing high-yield bonds are not as strong financially as those with higher credit ratings, so the bonds are usually considered speculative investments.
GLOSSARY
Average maturity: The weighted average of the stated maturity dates of the portfolio’s securities. In general, the longer the average maturity, the greater the fund’s sensitivity to interest rate changes. A shorter average maturity usually means less interest rate sensitivity and therefore a less volatile portfolio.
CS First Boston High Yield Index: Tracks the performance of domestic noninvestment-grade corporate bonds.
Duration: A measure of a bond or bond fund’s sensitivity to changes in interest rates. For example, a fund with a four-year duration would fall about 4% in response to a one-percentage-point rise in interest rates, and vice versa.
Federal funds rate: The interest rate charged on overnight loans of reserves by one financial institution to another in the United States. The Federal Reserve sets a target federal funds rate to affect the direction of interest rates.
Lehman Brothers U.S. Aggregate Index: An unmanaged index that tracks domestic investment-grade bonds, including corporate, government, and mortgage-backed securities.
Lipper averages: Consist of all mutual funds in a particular category as tracked by Lipper Inc.

This chart shows the value of a hypothetical $10,000 investment in the fund over the past 10 fiscal year periods or since inception (for funds lacking 10-year records). The result is compared with benchmarks, which may include a broad-based market index and a peer group average or index. Market indexes do not include expenses, which are deducted from fund returns as well as mutual fund averages and indexes.

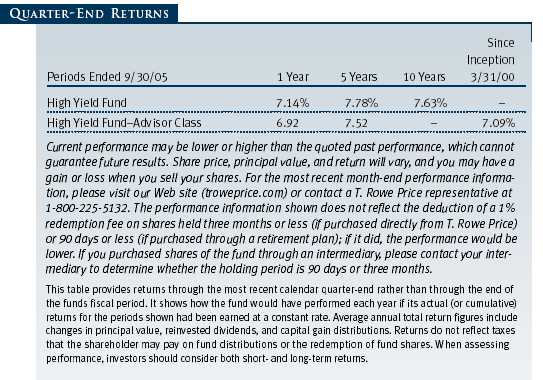
| AVERAGE ANNUAL COMPOUND TOTAL RETURN |
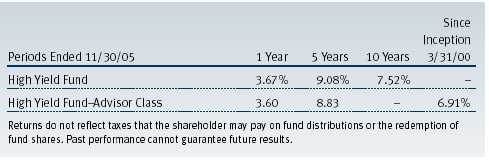
This table shows how the fund would have performed each year if its actual (or cumulative) returns for the periods shown had been earned at a constant rate.
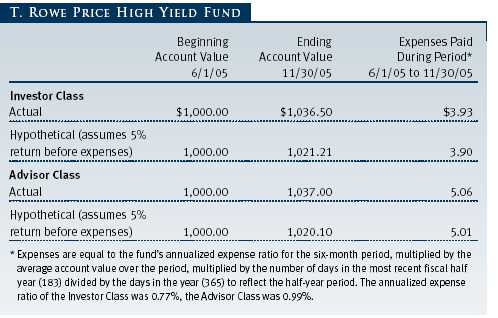
As a mutual fund shareholder, you may incur two types of costs: (1) transaction costs such as redemption fees or sales loads and (2) ongoing costs, including management fees, distribution and service (12b-1) fees, and other fund expenses. The following example is intended to help you understand your ongoing costs (in dollars) of investing in the fund and to compare these costs with the ongoing costs of investing in other mutual funds. The example is based on an investment of $1,000 invested at the beginning of the most recent six-month period and held for the entire period.
Please note that the fund has two share classes: The original share class (“investor class”) charges no distribution and service (12b-1) fee. Advisor Class shares are offered only through unaffiliated brokers and other financial intermediaries and charge a 0.25% 12b-1 fee. Each share class is presented separately in the table.
Actual Expenses
The first line of the following table (“Actual”) provides information about actual account values and expenses based on the fund’s actual returns. You may use the information in this line, together with your account balance, to estimate the expenses that you paid over the period. Simply divide your account value by $1,000 (for example, an $8,600 account value divided by $1,000 = 8.6), then multiply the result by the number in the first line under the heading “Expenses Paid During Period” to estimate the expenses you paid on your account during this period.
Hypothetical Example for Comparison Purposes
The information on the second line of the table (“Hypothetical”) is based on hypothetical account values and expenses derived from the fund’s actual expense ratio and an assumed 5% per year rate of return before expenses (not the fund’s actual return). You may compare the ongoing costs of investing in the fund with other funds by contrasting this 5% hypothetical example and the 5% hypothetical examples that appear in the shareholder reports of the other funds. The hypothetical account values and expenses may not be used to estimate the actual ending account balance or expenses you paid for the period.
Note: T. Rowe Price charges an annual small-account maintenance fee of $10, generally for accounts with less than $2,000 ($500 for UGMA/UTMA). The fee is waived for any investor whose T. Rowe Price mutual fund accounts total $25,000 or more, accounts employing automatic investing, and IRAs and other retirement plan accounts that utilize a prototype plan sponsored by T. Rowe Price (although a separate custodial or administrative fee may apply to such accounts). This fee is not included in the accompanying table. If you are subject to the fee, keep it in mind when you are estimating the ongoing expenses of investing in the fund and when comparing the expenses of this fund with other funds.
You should also be aware that the expenses shown in the table highlight only your ongoing costs and do not reflect any transaction costs, such as redemption fees or sales loads. Therefore, the second line of the table is useful in comparing ongoing costs only and will not help you determine the relative total costs of owning different funds. To the extent a fund charges transaction costs, however, the total cost of owning that fund is higher.
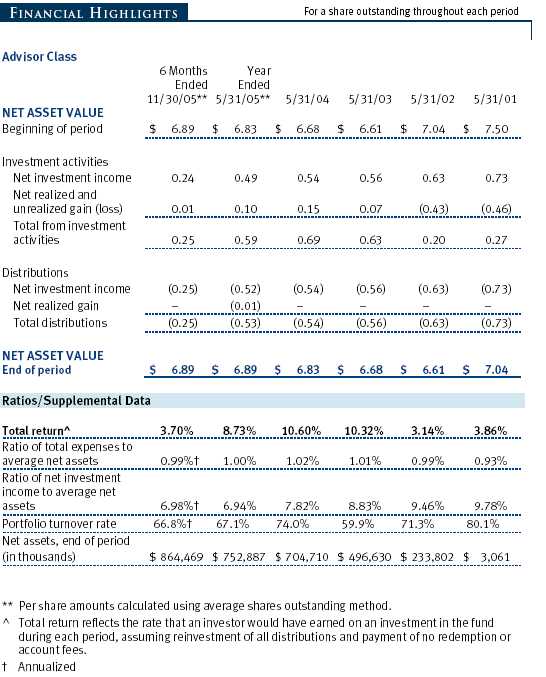
Unaudited
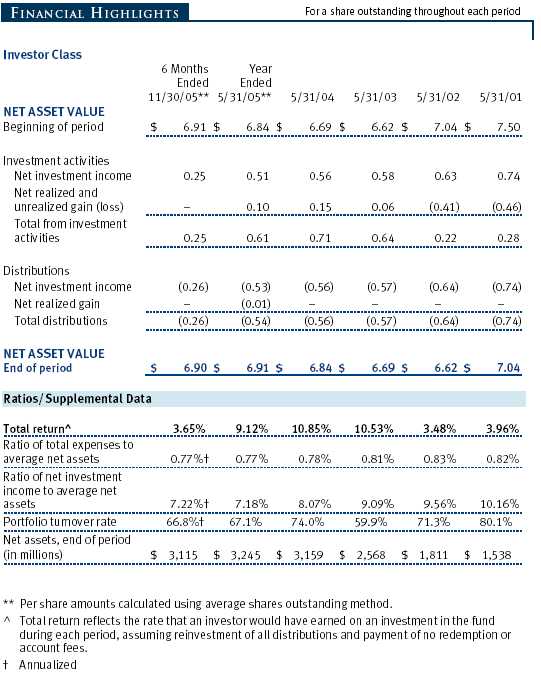
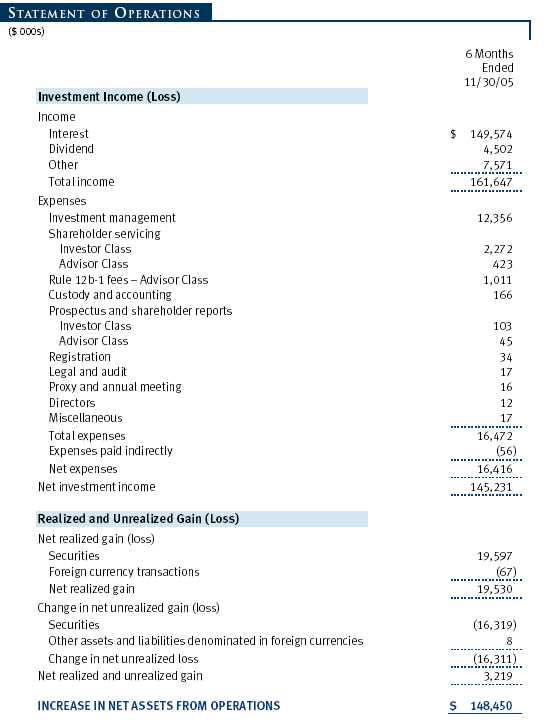
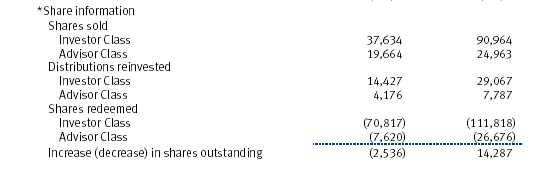
The accompanying notes are an integral part of these financial statements.
Unaudited
The accompanying notes are an integral part of these financial statements.
Unaudited


The accompanying notes are an integral part of these financial statements.
Unaudited

The accompanying notes are an integral part of these financial statements.
Unaudited
The accompanying notes are an integral part of these financial statements.
Unaudited

The accompanying notes are an integral part of these financial statements.
Unaudited
| NOTES TO FINANCIAL STATEMENTS |
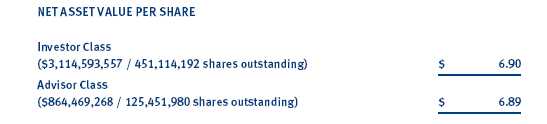
NOTE 1 - SIGNIFICANT ACCOUNTING POLICIEST. Rowe Price High Yield Fund, Inc. (the fund) is registered under the Investment Company Act of 1940 (the 1940 Act) as a diversified, open-end management investment company. The fund seeks high current income and, secondarily, capital appreciation. The fund has two classes of shares: the High Yield Fund original share class, referred to in this report as the Investor Class, offered since December 31, 1984, and High Yield Fund—Advisor Class (Advisor Class), offered since March 31, 2000. Advisor Class shares are sold only through unaffiliated brokers and other unaffiliated financial intermediaries that are compensated by the class for distribution, shareholder servicing, and/or certain administrative services under a Board-approved Rule 12b-1 plan. Each class has exclusive voting rights on matters related solely to that class, separate voting rights on matters that relate to both classes, and, in all other respects, the same rights and obligations as the other class.
The accompanying financial statements were prepared in accordance with accounting principles generally accepted in the United States of America, which require the use of estimates made by fund management. Fund management believes that estimates and security valuations are appropriate; however actual results may differ from those estimates, and the security valuations reflected in the financial statements may differ from the value the fund ultimately realizes upon sale of the securities.
Valuation The fund values its investments and computes its net asset value per share at the close of the New York Stock Exchange (NYSE), normally 4 p.m. ET, each day that the NYSE is open for business. Debt securities are generally traded in the over-the-counter market. Securities with original maturities of one year or more are valued at prices furnished by dealers who make markets in such securities or by an independent pricing service, which considers yield or price of bonds of comparable quality, coupon, maturity, and type, as well as prices quoted by dealers who make markets in such securities. Securities with original maturities of less than one year are stated at fair value, which is determined by using a matrix system that establishes a value for each security based on bid-side money market yields.
Equity securities listed or regularly traded on a securities exchange or in the over-the-counter market are valued at the last quoted sale price or, for certain markets, the official closing price at the time the valuations are made, except for OTC Bulletin Board securities, which are valued at the mean of the latest bid and asked prices. A security that is listed or traded on more than one exchange is valued at the quotation on the exchange determined to be the primary market for such security. Listed securities not traded on a particular day are valued at the mean of the latest bid and asked prices for domestic securities and the last quoted sale price for international securities.
Investments in mutual funds are valued at the mutual fund’s closing net asset value per share on the day of valuation.
Other investments, including restricted securities, and those for which the above valuation procedures are inappropriate or are deemed not to reflect fair value are stated at fair value as determined in good faith by the T. Rowe Price Valuation Committee, established by the fund’s Board of Directors.
Most foreign markets close before the close of trading on the NYSE. If the fund determines that developments between the close of a foreign market and the close of the NYSE will, in its judgment, materially affect the value of some or all of its portfolio securities, which in turn will affect the fund’s share price, the fund will adjust the previous closing prices to reflect the fair value of the securities as of the close of the NYSE, as determined in good faith by the T. Rowe Price Valuation Committee, established by the fund’s Board of Directors. A fund may also fair value securities in other situations, such as when a particular foreign market is closed but the fund is open. In deciding whether to make fair value adjustments, the fund reviews a variety of factors, including developments in foreign markets, the performance of U.S. securities markets, and the performance of instruments trading in U. S. markets that represent foreign securities and baskets of foreign securitie s. The fund uses outside pricing services to provide it with closing market prices and information used for adjusting those prices. The fund cannot predict when and how often it will use closing prices and when it will adjust those prices to reflect fair value. As a means of evaluating its fair value process, the fund routinely compares closing market prices, the next day’s opening prices in the same markets, and adjusted prices.
Currency Translation Assets, including investments, and liabilities denominated in foreign currencies are translated into U.S. dollar values each day at the prevailing exchange rate, using the mean of the bid and asked prices of such currencies against U.S. dollars as quoted by a major bank. Purchases and sales of securities, income, and expenses are translated into U.S. dollars at the prevailing exchange rate on the date of the transaction. The effect of changes in foreign currency exchange rates on realized and unrealized security gains and losses is reflected as a component of security gains and losses.
Class Accounting The Advisor Class pays distribution, shareholder servicing, and/or certain administrative expenses in the form of Rule 12b-1 fees, in an amount not exceeding 0.25% of the class’s average daily net assets. Shareholder servicing, prospectus, and shareholder report expenses incurred by each class are charged directly to the class to which they relate. Expenses common to both classes and investment income are allocated to the classes based upon the relative daily net assets of each class’s settled shares; realized and unrealized gains and losses are allocated based upon the relative daily net assets of each class’s outstanding shares.
Credits The fund earns credits on temporarily uninvested cash balances at the custodian that reduce the fund’s custody charges. Custody expense in the accompanying financial statements is presented before reduction for credits, which are reflected as expenses paid indirectly.
Redemption Fees A 1% fee is assessed on redemptions of Investor Class and Advisor Class shares held less than 90 days / 3 months to deter short-term trading and protect the interests of long-term shareholders. Redemption fees are withheld from proceeds that shareholders receive from the sale or exchange of fund shares. The fees are paid to the fund, and are recorded as an increase to paid-in capital. The fees may cause the redemption price per share to differ from the net asset value per share.
In-Kind Redemptions In certain circumstances, the fund may distribute portfolio securities rather than cash as payment for a redemption of fund shares (in-kind redemption). For financial reporting purposes, the fund recognizes a gain on in-kind redemptions to the extent the value of the distributed securities on the date of redemption exceeds the cost of those securities. Gains and losses realized on in-kind redemptions are not recognized for tax purposes, and are reclassified from undistributed realized gain (loss) to paid-in capital. During the six months ended November 30, 2005, the fund realized $3,430,000 of net gain on $158,304,000 of in-kind redemptions.
Investment Transactions, Investment Income, and Distributions Income and expenses are recorded on the accrual basis. Premiums and discounts on debt securities are amortized for financial reporting purposes. Dividends received from mutual fund investments are reflected as dividend income; capital gain distributions are reflected as realized gain/loss. Dividend income and capital gain distributions are recorded on the ex-dividend date. Investment transactions are accounted for on the trade date. Realized gains and losses are reported on the identified cost basis. Distributions to shareholders are recorded on the ex-dividend date. Income distributions are declared by each class on a daily basis and paid monthly. Capital gain distributions, if any, are declared and paid by the fund, typically on an annual basis.
NOTE 2 - INVESTMENT TRANSACTIONS
Consistent with its investment objective, the fund engages in the following practices to manage exposure to certain risks or enhance performance. The investment objective, policies, program, and risk factors of the fund are described more fully in the fund’s prospectus and Statement of Additional Information.
Noninvestment-Grade Debt Securities At November 30, 2005, approximately 89% of the fund’s net assets were invested in noninvestment-grade debt securities, commonly referred to as “high-yield” or “junk” bonds. A real or perceived economic downturn or higher interest rates could adversely affect the liquidity or value, or both, of such securities because such events could lessen the ability of issuers to make principal and interest payments.
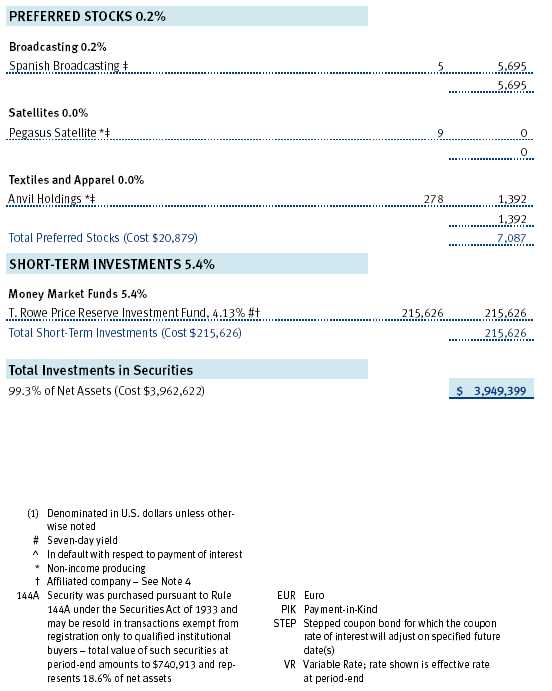
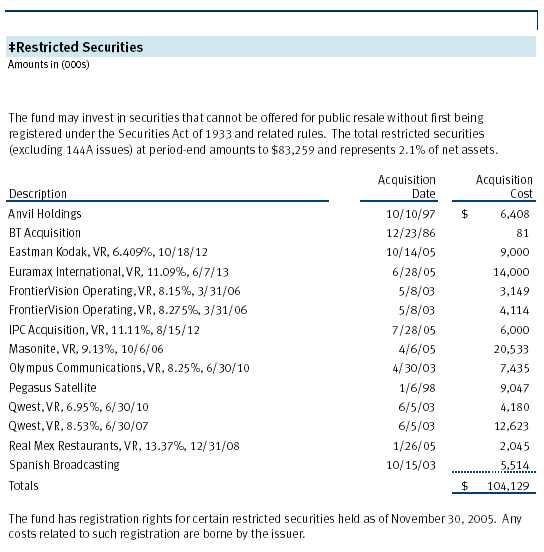
Restricted Securities The fund may invest in securities that are subject to legal or contractual restrictions on resale. Although certain of these securities may be readily sold, for example, under Rule 144A, others may be illiquid, their sale may involve substantial delays and additional costs, and prompt sale at an acceptable price may be difficult.
Other Purchases and sales of portfolio securities, other than short-term securities, aggregated $1,285,569,000 and $1,382,464,000, respectively, for the six months ended November 30, 2005.
NOTE 3 - FEDERAL INCOME TAXES
No provision for federal income taxes is required since the fund intends to continue to qualify as a regulated investment company under Subchapter M of the Internal Revenue Code and distribute to shareholders all of its taxable income and gains. Federal income tax regulations differ from generally accepted accounting principles; therefore, distributions determined in accordance with tax regulations may differ in amount or character from net investment income and realized gains for financial reporting purposes. Financial reporting records are adjusted for permanent book/tax differences to reflect tax character. Financial records are not adjusted for temporary differences. The amount and character of tax-basis distributions and composition of net assets are finalized at fiscal year-end; accordingly, tax-basis balances have not been determined as of November 30, 2005.
The fund intends to retain realized gains to the extent of available capital loss carryforwards. As of May 31, 2005 the fund had $312,251,000 of unused capital loss carryforwards, of which $10,843,000 expire in fiscal 2008, $55,075,000 expire in fiscal 2009, and $246,333,000 expire thereafter through fiscal 2011.
At November 30, 2005, the cost of investments for federal income tax purposes was $3,976,889,000. Net unrealized loss aggregated $27,490,000 at period-end, of which $74,102,000 related to appreciated investments and $101,592,000 related to depreciated investments.
NOTE 4 - RELATED PARTY TRANSACTIONS
The fund is managed by T. Rowe Price Associates, Inc. (the manager or Price Associates), a wholly owned subsidiary of T. Rowe Price Group, Inc. The investment management agreement between the fund and the manager provides for an annual investment management fee, which is computed daily and paid monthly. The fee consists of an individual fund fee, equal to 0.30% of the fund’s average daily net assets, and a group fee. The group fee rate is calculated based on the combined net assets of certain mutual funds sponsored by Price Associates (the group) applied to a graduated fee schedule, with rates ranging from 0.48% for the first $1 billion of assets to 0.29% for assets in excess of $160 billion. The fund’s group fee is determined by applying the group fee rate to the fund’s average daily net assets. At November 30, 2005, the effective annual group fee rate was 0.31%.
In addition, the fund has entered into service agreements with Price Associates and two wholly owned subsidiaries of Price Associates (collectively, Price). Price Associates computes the daily share prices and maintains the financial records of the fund. T. Rowe Price Services, Inc., provides shareholder and administrative services in its capacity as the fund’s transfer and dividend disbursing agent. T. Rowe Price Retirement Plan Services, Inc., provides subaccounting and recordkeeping services for certain retirement accounts invested in the Investor Class. For the six months ended November 30, 2005, expenses incurred pursuant to these service agreements were $67,000 for Price Associates, $542,000 for T. Rowe Price Services, Inc., and $105,000 for T. Rowe Price Retirement Plan Services, Inc. The total amount payable at period end pursuant to these service agreements is reflected as Due to Affiliates in the accompanying financial statements.
The fund is also one of several mutual funds sponsored by Price Associates (underlying Price funds) in which the T. Rowe Price Spectrum Funds (Spectrum Funds) and T. Rowe Price Retirement Funds (Retirement Funds) may invest. Neither the Spectrum Funds nor the Retirement Funds invest in the underlying Price funds for the purpose of exercising management or control. Pursuant to separate, special servicing agreements, expenses associated with the operation of the Spectrum and Retirement Funds are borne by each underlying Price fund to the extent of estimated savings to it and in proportion to the average daily value of its shares owned by the Spectrum and Retirement Funds, respectively. Expenses allocated under these agreements are reflected as shareholder servicing expenses in the accompanying financial statements. For the six months ended November 30, 2005, the fund was allocated $667,000 of Spectrum Funds’ expenses and $550,000 of Retirement Funds’ expenses. Of these amounts, $828,000 related to services provided by Price. The amount payable at period end pursuant to this agreement is reflected as a component of Due to Affiliates in the accompanying financial statements. At November 30, 2005 approximately 21% of the outstanding shares of the Investor Class were held by the Spectrum Funds and 14% were held by the Retirement Funds.
The fund may invest in the T. Rowe Price Reserve Investment Fund and the T. Rowe Price Government Reserve Investment Fund (collectively, the T. Rowe Price Reserve Funds), open-end management investment companies managed by Price Associates and affiliates of the fund. The T. Rowe Price Reserve Funds are offered as cash management options to mutual funds, trusts, and other accounts managed by Price Associates and/or its affiliates, and are not available for direct purchase by members of the public. The T. Rowe Price Reserve Funds pay no investment management fees. During the six months ended November 30, 2005, dividend income from the T. Rowe Price Reserve Funds totaled $2,264,000, and the value of shares of the T. Rowe Price Reserve Funds held at November 30, 2005 and May 31, 2005 was $215,626,000 and $105,729,000, respectively.
| INFORMATION ON PROXY VOTING POLICIES, PROCEDURES, AND RECORDS |
A description of the policies and procedures used by T. Rowe Price funds and portfolios to determine how to vote proxies relating to portfolio securities is available in each fund’s Statement of Additional Information, which you may request by calling 1-800-225-5132 or by accessing the SEC’s Web site, www.sec.gov. The description of our proxy voting policies and procedures is also available on our Web site, www.troweprice.com. To access it, click on the words “Company Info” at the top of our homepage for individual investors. Then, in the window that appears, click on the “Proxy Voting Policy” navigation button in the top left corner.
Each fund’s most recent annual proxy voting record is available on our Web site and through the SEC’s Web site. To access it through our Web site, follow the directions above, then click on the words “Proxy Voting Record” at the bottom of the Proxy Voting Policy page.
| HOW TO OBTAIN QUARTERLY PORTFOLIO HOLDINGS |
The fund files a complete schedule of portfolio holdings with the Securities and Exchange Commission for the first and third quarters of each fiscal year on Form N-Q. The fund’s Form N-Q is available electronically on the SEC’s Web site (www.sec.gov); hard copies may be reviewed and copied at the SEC’s Public Reference Room, 450 Fifth St. N.W., Washington, DC 20549. For more information on the Public Reference Room, call 1-800-SEC-0330.
A code of ethics, as defined in Item 2 of Form N-CSR, applicable to its principal executive officer, principal financial officer, principal accounting officer or controller, or persons performing similar functions is filed as an exhibit to the registrant’s annual Form N-CSR. No substantive amendments were approved or waivers were granted to this code of ethics during the registrant’s most recent fiscal half-year.
Disclosure required in registrant’s annual Form N-CSR.
Disclosure required in registrant’s annual Form N-CSR.
Not applicable.
Not applicable. The complete schedule of investments is included in Item 1 of this Form N-CSR.
Not applicable.
Not applicable.
Not applicable.
Not applicable.
(a) The registrant’s principal executive officer and principal financial officer have evaluated the registrant’s disclosure controls and procedures within 90 days of this filing and have concluded that the registrant’s disclosure controls and procedures were effective, as of that date, in ensuring that information required to be disclosed by the registrant in this Form N-CSR was recorded, processed, summarized, and reported timely.
(b) The registrant’s principal executive officer and principal financial officer are aware of no change in the registrant’s internal control over financial reporting that occurred during the registrant’s second fiscal quarter covered by this report that has materially affected, or is reasonably likely to materially affect, the registrant’s internal control over financial reporting.
(a)(1) The registrant’s code of ethics pursuant to Item 2 of Form N-CSR is filed with the registrant’s annual Form N-CSR.
(2) Separate certifications by the registrant's principal executive officer and principal financial officer, pursuant to Section 302 of the Sarbanes-Oxley Act of 2002 and required by Rule 30a-2(a) under the Investment Company Act of 1940, are attached.
(3) Written solicitation to repurchase securities issued by closed-end companies: not applicable.
(b) A certification by the registrant's principal executive officer and principal financial officer, pursuant to Section 906 of the Sarbanes-Oxley Act of 2002 and required by Rule 30a-2(b) under the Investment Company Act of 1940, is attached.