| UNITED STATES |
| SECURITIES AND EXCHANGE COMMISSION |
| Washington, D.C. 20549 |
| |
FORM N-CSR |
| |
CERTIFIED SHAREHOLDER REPORT OF REGISTERED |
MANAGEMENT INVESTMENT COMPANIES |
| |
| |
| |
| Investment Company Act File Number: 811-4119 |
|
| |
| T. Rowe Price High Yield Fund, Inc. |
|
| (Exact name of registrant as specified in charter) |
| |
| 100 East Pratt Street, Baltimore, MD 21202 |
|
| (Address of principal executive offices) |
| |
| David Oestreicher |
| 100 East Pratt Street, Baltimore, MD 21202 |
|
| (Name and address of agent for service) |
| |
| |
| Registrant’s telephone number, including area code: (410) 345-2000 |
| |
| |
| Date of fiscal year end: May 31 |
| |
| |
| Date of reporting period: November 30, 2010 |
Item 1: Report to Shareholders| High Yield Fund | November 30, 2010 |
The views and opinions in this report were current as of November 30, 2010. They are not guarantees of performance or investment results and should not be taken as investment advice. Investment decisions reflect a variety of factors, and the managers reserve the right to change their views about individual stocks, sectors, and the markets at any time. As a result, the views expressed should not be relied upon as a forecast of the fund’s future investment intent. The report is certified under the Sarbanes-Oxley Act, which requires mutual funds and other public companies to affirm that, to the best of their knowledge, the information in their financial reports is fairly and accurately stated in all material respects.
REPORTS ON THE WEB
Sign up for our E-mail Program, and you can begin to receive updated fund reports and prospectuses online rather than through the mail. Log in to your account at troweprice.com for more information.
Manager’s Letter
Fellow Shareholders
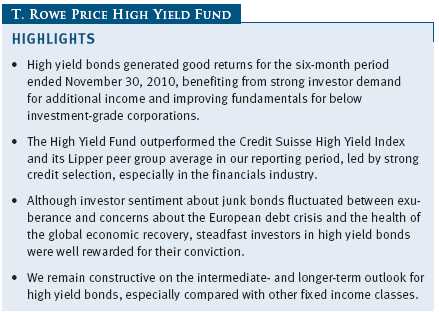
The high yield market generated strong gains during the past six months. The overall environment for below investment-grade companies remained favorable thanks to moderating default expectations, abundant liquidity, improving corporate balance sheets, and rising profitability due to effective cost-cutting initiatives. High yield bond prices moved higher through most of the period, although momentum in the asset class waned in November as Treasury yields rose and the sovereign debt crisis in Europe worsened. The companies in our asset class continue to perform well and remain fundamentally strong. However, investors became more cautious as the quantity of new deals increased and the quality of new high yield bond issuance deteriorated late in the period.
PORTFOLIO PERFORMANCE
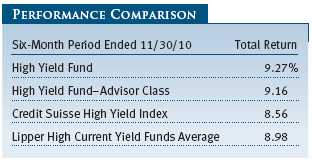
The High Yield Fund posted good absolute and relative returns during the first half of our fiscal year ended November 30, 2010. Despite market weakness at the end of the reporting period, high yield bonds were one of the best-performing domestic fixed income asset classes. We outperformed our Lipper peer group average and the Credit Suisse High Yield Index due to credit selection, which was particularly strong in financials, autos, broadcasting, and technology. Results for the Advisor Class varied slightly, reflecting its different fee structure.
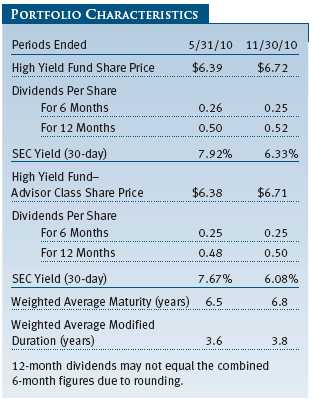
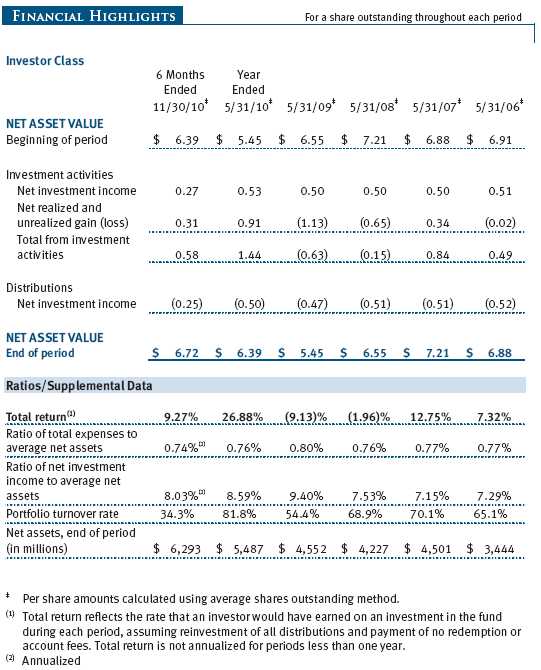
The fund’s share price advanced $0.33 over the past six months, to $6.72 from $6.39. Capital appreciation contributed more than half of the fund’s total return in the period. The portfolio also generated $0.25 of dividend income, and at the end of the period the 30-day SEC yield was 6.33%. (See the glossary for definitions of these terms.) Our longer-term returns are shown in the table on page 13.
The returns of the T. Rowe Price High Yield Fund compare favorably with those of its peer group, especially over longer time periods. Lipper ranked the fund in the top 16% of its high current yield funds universe for the 10-year period and in the top 20% of its category for the five years ended November 30, 2010. (Based on cumulative total return, Lipper ranked the High Yield Fund 175 of 486, 93 of 422, 71 of 359, and 37 of 234 funds in the high current yield bond funds category for the 1-, 3-, 5-, and 10-year periods ended November 30, 2010, respectively. Results will vary for other periods. Past performance cannot guarantee future results.)
HIGH YIELD MARKET ENVIRONMENT
The high yield market has been exceptionally strong, posting its best two-year result in the history of the asset class. After advancing more than 50% in 2009, we witnessed three distinct performance periods in 2010. In the first four months of the year, the market continued the rally that began in late 2008—led by lower-quality issues—a period we refer to as “pedal to the metal.” We witnessed bouts of investor angst relating to sovereign debt concerns, but the market pulled out of them unscathed, and your fund generated excellent returns. The asset class benefited from huge investor cash inflows, positive sentiment, and significant price appreciation as the economy improved and default expectations waned. Investors clamored for yields that were double or triple those of comparable-maturity Treasuries.
In May, the high yield market was rattled by the European sovereign debt crisis. The combination of concern about contagion from the weakest European nations and the potential impact on the U.S. economy hurt all asset classes perceived as risky. We refer to this phase as “back to basics” because investors in high yield pared back risk, fearing losses after the huge gains posted by the lower-quality tiers of the market. Investors rotated out of lower-quality issues and into higher-quality B and BB rated credits. During the summer, investors realized that the economy was in better shape than some had feared, which spurred a rejuvenated rally in both equities and high yield bonds. By the end of October, the high yield market had rallied to a year-to-date gain of about 15%.
We believe that the end of October marked the start of a new phase, which we call “curb your enthusiasm,” given our increasingly cautious take on the prospects for the high yield market. While most of the companies in our universe remain fundamentally stable and are generating strong earnings, it appears that the market’s deal makers have lost some of their discipline. High yield bond deals continued to come to market at a record pace. In November, for example, more than $30 billion of high yield bonds were sold. The total for the first 11 months of the year stands at $277 billion—already 50% higher than last year’s record issuance of about $181 billion.
As the reporting period progressed, we started to see an increase in lower-quality and aggressively leveraged buyout deals, which led us to question whether the market will be able to absorb the volume of lower-quality new supply. Year-to-date through October, about 6.5% of all the new issuance was rated CCC, but in November approximately 10.4% of the new deals were rated CCC or lower. However, unlike 2007 (prior to the junk bond market collapse in 2008), much of the new issue volume in lower-rated credits has been used to refinance existing debt. We now see more deals with lower coupons, less-attractive pricing, and greater concessions, and that has kept us on the sidelines. We have curbed our enthusiasm. We are unwilling to compromise our credit quality standards in an effort to capture a minimal amount of incremental yield.
While we are not turning bearish on the market, because there are still many attractive deals, investors need to be realistic about their expectations for future gains. For the first time in two years, we have recommended to the T. Rowe Price Asset Allocation Committee that our funds with high yield bond exposure should start slightly trimming their high yield allocation. Some of our concern stems from our belief that the multi-decade bull market in bonds may be waning and that the next major trend for interest rates is higher.
Although the yield advantage in the high yield market is still attractive versus Treasuries and investment-grade corporates, our asset class is beginning to look somewhat pricey. We have just come through the best period for high yield ever. That does not mean that the market will correct next year, but we want to be clear that the potential for these kinds of outsized gains has passed. The market has benefited from falling interest rates, and there just isn’t much room for that to continue. We believe that the tailwind of falling rates and the potential for double-digit returns fueled by capital appreciation is fading.
PORTFOLIO REVIEW
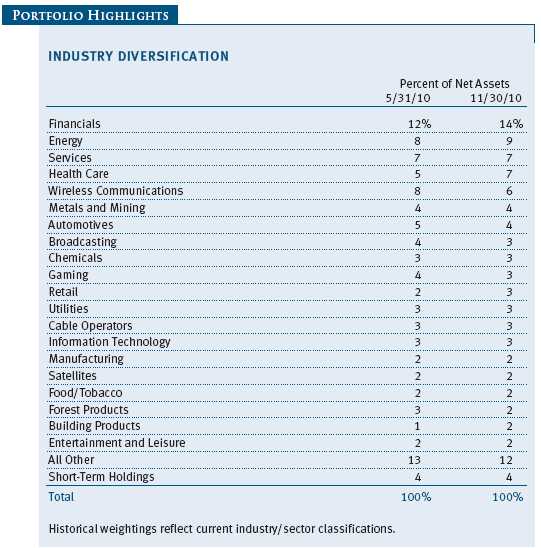
The fund’s strongest contributors in outperforming our Credit Suisse benchmark were holdings in financials, autos, broadcasting, and technology. Overall, we did not make any huge shifts in these industry allocations, and each generated double-digit results over the last six months. However, we have added to and remain significantly overweight in financials. Over the past two years, several large investment-grade financial companies were downgraded, increasing the sector’s weighting in the benchmark. In addition to financials, the fund’s core holdings remain in stable sectors, such as wireless communications, services, health care, and energy.
Although the period was very good for the high yield market, we made a few missteps. Our poorest-performing holding, and the only industry to post negative absolute results, was supermarkets. However, supermarkets represented less than 1% of the fund. The fund’s utilities holdings also underperformed, as did our small positions in real estate investment trusts and transportation, although each of these segments generated better than 6% gains over the past six months.
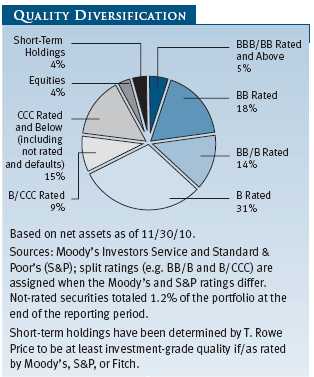
After positioning the portfolio aggressively in the early months of 2010, we have trimmed our exposure to the lowest credit quality tiers and increased our exposure in higher-quality bonds. For example, in the last six months, we systematically reduced our holdings in the CCC and below and B/CCC quality categories to 24% of the fund from 35%. Concurrently, we increased our exposure in higher-rated credit tiers (BBB/BB and above, BB, and BB/B) to 37% from 26% of the portfolio. We trimmed our equity exposure to 3% of the portfolio six months ago, but thanks to a few attractive initial public offerings, our allocation to common and preferred stock edged up to 4% at the end of the reporting period. We intend to selectively add to our equity exposure and bank loan holdings when we see attractive opportunities.
FINANCIALS POWER OUTPERFORMANCE
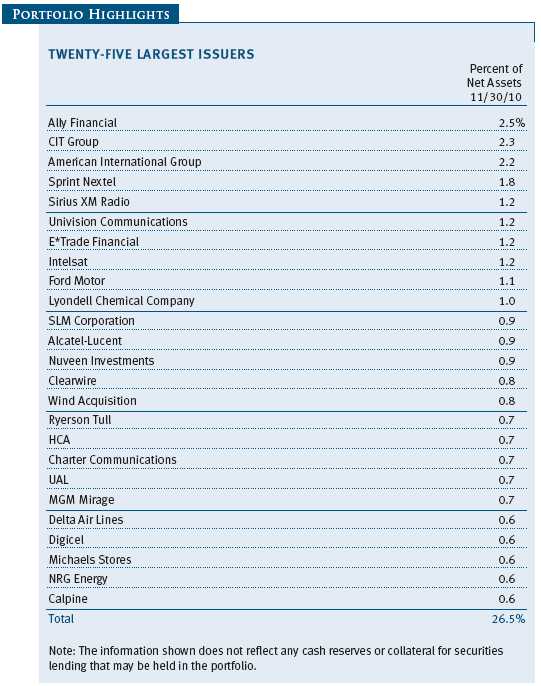
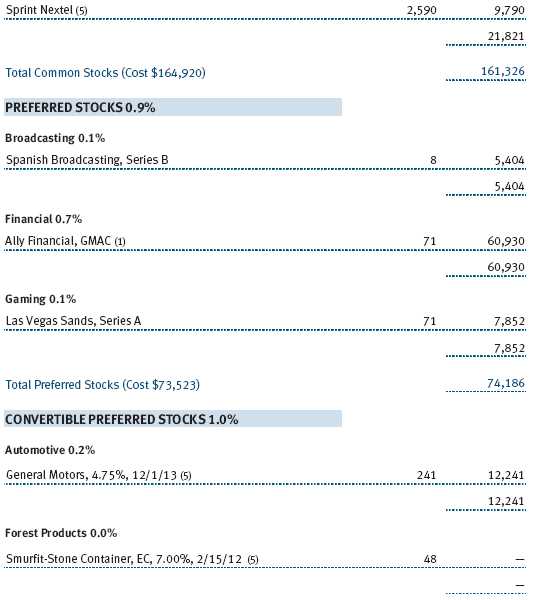
At the end of the reporting period, five financial institutions stood among our 15 largest positions. In addition to being our leading allocation, the group was also the top contributor to the fund’s six-month results and included five of our top 10 contributors. Ally Financial (formerly known as GMAC) was the portfolio’s best contributor. The company was formerly the financial services arm and a wholly owned subsidiary of General Motors. It has been a large high yield market issuer for quite some time and has taken the serious measures needed to stem losses in an effort to return to investment-grade status. The company is refocused on traditional banking and auto lending, and its bonds performed well. (Please refer to the fund’s portfolio of investments for a complete listing of holdings and the amount each represents in the portfolio.)
We wrote about CIT Group and American International Group in our last shareholder report. The portfolio’s second- and third-largest holdings, respectively, were top performance contributors in the past six months. Both of these financial services companies, and Ally to an extent, are benefiting from the improving economic environment and have a good deal of economic sensitivity. We have emphasized financials because we expect upgrades across the group that can lead to significant appreciation. Other financials holdings that performed well over the period included Citigroup, Bank of America, and SLM Corporation (Sallie Mae). Sallie Mae bonds, for example, are BBB/BB rated, which is right on the cusp of investment grade, and pay out an effective yield of almost 10% based on our purchase price.
THE AUTOMOTIVE SECTOR CONTINUES TO DRIVE GOOD GAINS
General Motors (GM) and Ford were strong performers over the last six months. We bought GM’s bonds at 15% of par value after it emerged from bankruptcy. We think it is a solid company with improving fundamentals, and our GM bonds have generated good performance since our initial investment. We like the company’s prospects enough to invest in its common stock, and we recently participated in GM’s initial public offering.
We also added to our positions in Ford bonds, anticipating that the company will be upgraded to investment-grade status in the not-too-distant future. We have been willing to pay more than par value for some of the credits with large coupons. For example, we paid a premium for Ford’s 12% bonds due in 2015 because we think the bonds can go higher should the company get upgraded. However, bonds, unlike stocks, have a limited upside to prices because at maturity they are redeemed at par value. Right now, the 2015 Ford bond trades at a yield to maturity of 5.9%. Although you have to pay a steep premium to buy the bonds, they are still yielding about 400 basis points (4%) more than similar-maturity Treasury bonds. If Ford gets upgraded to investment grade, the spread could tighten further as the bonds appreciate. We wrestle with when to sell highly appreciated bonds, and we continually review the risk/reward trade-off across all of our holdings.
We view the prospects for the auto sector favorably. We locked in good gains on several truck suppliers such as American Axle. We bought American Axle bonds at 73% of par, and they traded up more than 50% before we sold in October. We also invested in Tenneco, the muffler company, when its bonds were at a steep discount to their face value and locked in our profit when the bonds traded above par value in September. We continue to own Goodyear Tire & Rubber, which we like because of its conservative management and because we see a strong replacement cycle in tires. Overall, the sector generated outstanding results over the past six months.
OTHER CONTRIBUTORS AND DETRACTORS
Our wireless communications industry holdings were solid contributors. Sprint Nextel, the portfolio’s fourth-largest holding, and Clearwire, which is a wireless broadband spectrum provider, were strong performers for the past six months. Sprint’s 4G WiMax network (Xohm) merged with Clearwire’s existing WiMax broadband network in May, and Sprint now owns a majority stake in the company. We like the current yield from Clearwire’s 12% bonds due to mature in 2015. Sprint was the first carrier to launch a 4G phone, which has Internet, video, and many attractive available options, through its affiliation with Clearwire. We value the technology, and both companies are positioned to perform well.
Sirius XM Radio was also among the portfolio’s best contributors during the reporting period. Although we sold our position in the company’s convertible bonds for a nice profit, Sirius bonds remain our fifth-largest holding. Part of the company’s success is tied to the recovery of the auto industry, as many new cars come with an installed Sirius system. We believe that over the next 12 to 18 months the company’s cash flow will continue to improve significantly.
Only one industry lost money for the portfolio on an absolute basis—supermarkets—and that was almost entirely because of an ill-timed investment in Great Atlantic & Pacific Tea, the operator of the A&P and Pathmark supermarket chains. We exited our largest and riskiest position in the group in the summer at a loss. The company suffered from competitive pricing pressures and a loss of customers. We made our purchase when we thought the company was in the process of successfully restructuring its business, but management made some poor business decisions, which hurt from a pricing and merchandising standpoint, and the bonds suffered. We dodged a bullet as the company filed for bankruptcy shortly after the end of our reporting period (in mid-December).
From a relative performance standpoint, the energy and service industries were detractors over the six-month reporting period due to credit selection. However, both industries contributed about 9% to absolute results. Despite a few missteps, the portfolio’s overall credit selection was very good, and it led us to outperform the benchmark since the end of May.
OUTLOOK
We think the high yield market can continue to generate decent gains, but returns are likely to be closer to our long-term results than the exceptional returns we have enjoyed over the past two years. Upgrade potential exists for many of our bonds, several of which are marching toward investment-grade status, and that could mean more spread tightening. At the end of the reporting period, the high yield market traded at about 644 basis points (6.44%) above the 1.42% yield on five-year Treasuries. That is about the historical spread for the high yield market over the long term, but we are heading into an ultra-low default environment. The long-term average default rate has been about 4% per year, and next year most high yield analysts agree that the default rate will be closer to 1%. That leads us to believe the market should be trading tighter than its historical average. At this point, after posting great gains for the past two years, we will not argue that our market is cheap. However, given the strong fundamentals and the historically low default expectations, the market can and should trade at 500 basis points over Treasuries.
The 800-pound gorilla in the room is interest rates. At some point the 20-year bull market in bonds will end and interest rates across the spectrum will move higher. High yield bonds will decline because they are not immune to a rising rate trend, but it is almost certain that they will not decline as much as long-duration, high-quality credits. We expect high yield bond returns to be below the results we have enjoyed over the last two years, but we also believe that their shorter-duration profile and high income will enable them to deliver better results than high-quality bonds.
We think that bank loans are likely to become more of a focus for us in 2011. Loans look attractive because they have a floating rate feature that ratchets up with rising rates every 90 days, so if and when interest rates move higher, their yield will also rise. Additionally, they are a more defensive asset class—higher in the capital structure than bonds. We will continue our commitment to research and diversification, which we believe is prudent for a fund that invests in a riskier area of the bond market. As always, our aim is to deliver high current income and attractive total returns over time while seeking to cushion the volatility inherent in this market.
Thank you for investing with T. Rowe Price.
Respectfully submitted,
Mark J. Vaselkiv
Chairman of the fund’s Investment Advisory Committee
December 16, 2010
The committee chairman has day-to-day responsibility for managing the portfolio and works with committee members in developing and executing the fund’s investment program.
RISKS OF BOND INVESTING
Bonds are subject to interest rate risk, the decline in bond prices that usually accompanies a rise in interest rates, and credit risk, the chance that any fund holding could have its credit rating downgraded or that a bond issuer will default (fail to make timely payments of interest or principal), potentially reducing the fund’s income level and share price. High yield corporate bonds could have greater price declines than funds that invest primarily in high-quality bonds. Companies issuing high yield bonds are not as strong financially as those with higher credit ratings, so the bonds are usually considered speculative investments.
GLOSSARY
Credit Suisse High Yield Index: Tracks the performance of domestic noninvestment-grade corporate bonds.
Duration: The average time (expressed in years) needed for an investor to receive the present value of the future cash flows on a fixed income investment. It is used to measure a bond or bond fund’s sensitivity to interest rate changes. For example, a fund with a three-year duration would fall about 3% in price in response to a one-percentage-point increase in interest rates, and vice versa. Modified duration provides a more accurate estimate of the fund’s price sensitivity based solely on changes in real interest rates.
Lipper averages: Consist of all mutual funds in a particular category as tracked by Lipper Inc.
SEC yield (30-day): A method of calculating a fund’s yield that assumes all portfolio securities are held until maturity. Yield will vary and is not guaranteed.
Weighted average maturity: In general, the longer the average maturity, the greater the fund’s sensitivity to interest rate changes. The weighted average maturity may take into account the interest rate readjustment dates for certain securities.
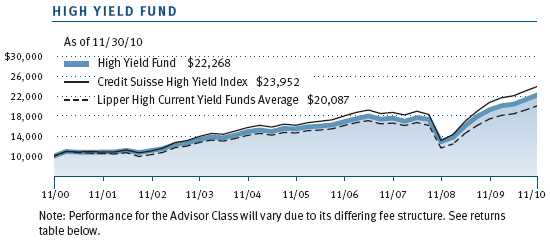
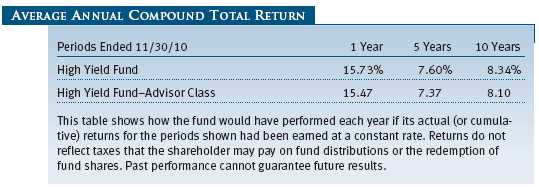
Performance and Expenses
This chart shows the value of a hypothetical $10,000 investment in the fund over the past 10 fiscal year periods or since inception (for funds lacking 10-year records). The result is compared with benchmarks, which may include a broad-based market index and a peer group average or index. Market indexes do not include expenses, which are deducted from fund returns as well as mutual fund averages and indexes.
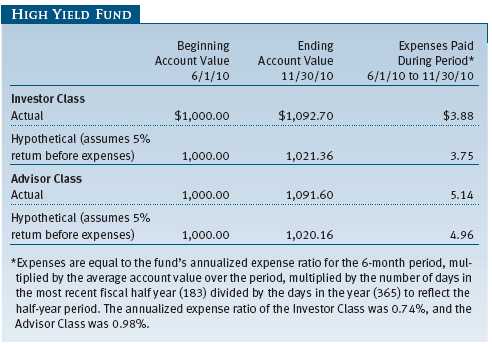
As a mutual fund shareholder, you may incur two types of costs: (1) transaction costs, such as redemption fees or sales loads, and (2) ongoing costs, including management fees, distribution and service (12b-1) fees, and other fund expenses. The following example is intended to help you understand your ongoing costs (in dollars) of investing in the fund and to compare these costs with the ongoing costs of investing in other mutual funds. The example is based on an investment of $1,000 invested at the beginning of the most recent six-month period and held for the entire period.
Actual Expenses
The first line of the following table (“Actual”) provides information about actual account values and expenses based on the fund’s actual returns. You may use the information in this line, together with your account balance, to estimate the expenses that you paid over the period. Simply divide your account value by $1,000 (for example, an $8,600 account value divided by $1,000 = 8.6), then multiply the result by the number in the first line under the heading “Expenses Paid During Period” to estimate the expenses you paid on your account during this period.
Hypothetical Example for Comparison Purposes
The information on the second line of the table (“Hypothetical”) is based on hypothetical account values and expenses derived from the fund’s actual expense ratio and an assumed 5% per year rate of return before expenses (not the fund’s actual return). You may compare the ongoing costs of investing in the fund with other funds by contrasting this 5% hypothetical example and the 5% hypothetical examples that appear in the shareholder reports of the other funds. The hypothetical account values and expenses may not be used to estimate the actual ending account balance or expenses you paid for the period.
Note: T. Rowe Price charges an annual small-account maintenance fee of $10, generally for accounts with less than $2,000 ($500 for UGMA/UTMA). The fee is waived for any investor whose T. Rowe Price mutual fund accounts total $25,000 or more, accounts employing automatic investing, and IRAs and other retirement plan accounts that utilize a prototype plan sponsored by T. Rowe Price (although a separate custodial or administrative fee may apply to such accounts). This fee is not included in the accompanying table. If you are subject to the fee, keep it in mind when you are estimating the ongoing expenses of investing in the fund and when comparing the expenses of this fund with other funds.
You should also be aware that the expenses shown in the table highlight only your ongoing costs and do not reflect any transaction costs, such as redemption fees or sales loads. Therefore, the second line of the table is useful in comparing ongoing costs only and will not help you determine the relative total costs of owning different funds. To the extent a fund charges transaction costs, however, the total cost of owning that fund is higher.
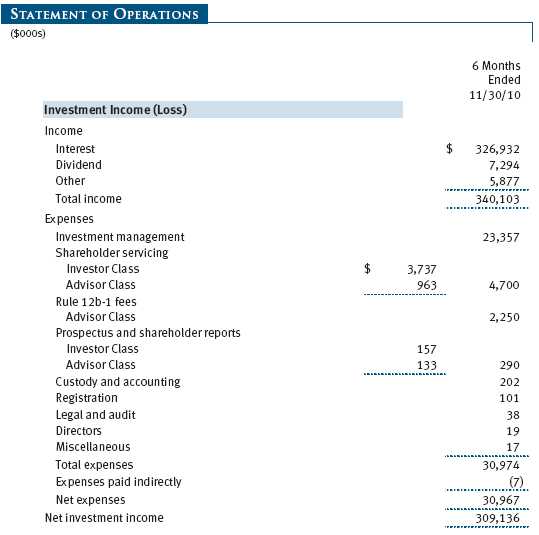
Unaudited
The accompanying notes are an integral part of these financial statements.
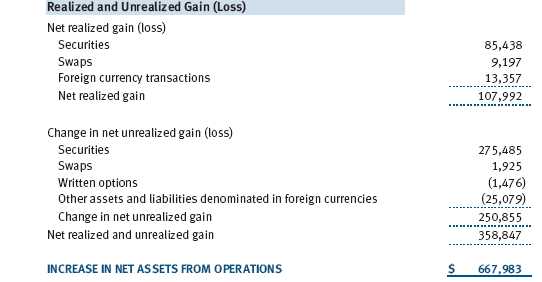
Unaudited

The accompanying notes are an integral part of these financial statements.
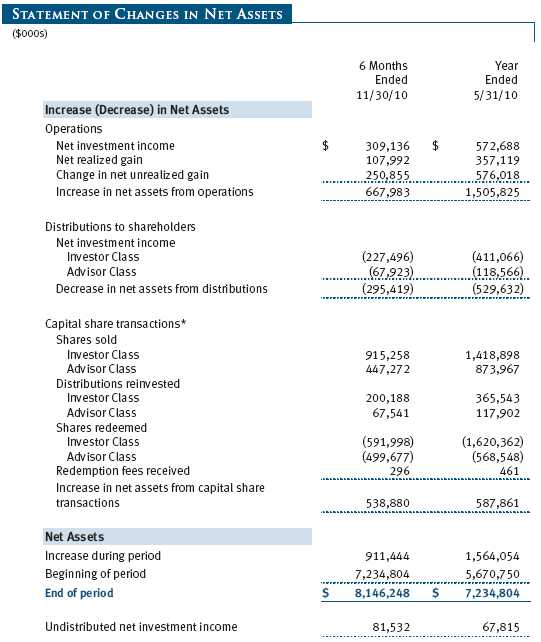
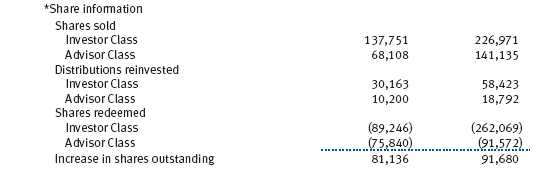
Unaudited


The accompanying notes are an integral part of these financial statements.
Unaudited
The accompanying notes are an integral part of these financial statements.
Unaudited
The accompanying notes are an integral part of these financial statements.
Unaudited
The accompanying notes are an integral part of these financial statements.
Unaudited
| NOTES TO FINANCIAL STATEMENTS |
T. Rowe Price High Yield Fund, Inc. (the fund), is registered under the Investment Company Act of 1940 (the 1940 Act) as a diversified, open-end management investment company. The fund seeks high current income and, secondarily, capital appreciation. The fund has two classes of shares: the High Yield Fund original share class, referred to in this report as the Investor Class, offered since December 31, 1984, and the High Yield Fund – Advisor Class (Advisor Class), offered since March 31, 2000. Advisor Class shares are sold only through unaffiliated brokers and other unaffiliated financial intermediaries that are compensated by the class for distribution, shareholder servicing, and/or certain administrative services under a Board-approved Rule 12b-1 plan. Each class has exclusive voting rights on matters related solely to that class; separate voting rights on matters that relate to both classes; and, in all other respects, the same rights and obligations as the other class.
NOTE 1 - SIGNIFICANT ACCOUNTING POLICIES
Basis of Preparation The accompanying financial statements were prepared in accordance with accounting principles generally accepted in the United States of America (GAAP), which require the use of estimates made by fund management. Fund management believes that estimates and valuations are appropriate; however, actual results may differ from those estimates, and the valuations reflected in the accompanying financial statements may differ from the value ultimately realized upon sale or maturity.
Investment Transactions, Investment Income, and Distributions Income and expenses are recorded on the accrual basis. Premiums and discounts on debt securities are amortized for financial reporting purposes. Paydown gains and losses are recorded as an adjustment to interest income. Dividends received from mutual fund investments are reflected as dividend income; capital gain distributions are reflected as realized gain/loss. Dividend income and capital gain distributions are recorded on the ex-dividend date. Income tax-related interest and penalties, if incurred, would be recorded as income tax expense. Investment transactions are accounted for on the trade date. Realized gains and losses are reported on the identified cost basis. Distributions to shareholders are recorded on the ex-dividend date. Income distributions are declared by each class daily and paid monthly. Capital gain distributions, if any, are generally declared and paid by the fund annually.
Currency Translation Assets, including investments, and liabilities denominated in foreign currencies are translated into U.S. dollar values each day at the prevailing exchange rate, using the mean of the bid and asked prices of such currencies against U.S. dollars as quoted by a major bank. Purchases and sales of securities, income, and expenses are translated into U.S. dollars at the prevailing exchange rate on the date of the transaction. The effect of changes in foreign currency exchange rates on realized and unrealized security gains and losses is reflected as a component of security gains and losses.
Class Accounting The Advisor Class pays distribution, shareholder servicing, and/or certain administrative expenses in the form of Rule 12b-1 fees, in an amount not exceeding 0.25% of the class’s average daily net assets. Shareholder servicing, prospectus, and shareholder report expenses incurred by each class are charged directly to the class to which they relate. Expenses common to both classes and investment income are allocated to the classes based upon the relative daily net assets of each class’s settled shares; realized and unrealized gains and losses are allocated based upon the relative daily net assets of each class’s outstanding shares.
Credits The fund earns credits on temporarily uninvested cash balances held at the custodian, which reduce the fund’s custody charges. Custody expense in the accompanying financial statements is presented before reduction for credits, which are reflected as expenses paid indirectly.
Redemption Fees A 1% fee is assessed on redemptions of fund shares held for 90 days or less to deter short-term trading and to protect the interests of long-term shareholders. Redemption fees are withheld from proceeds that shareholders receive from the sale or exchange of fund shares. The fees are paid to the fund and are recorded as an increase to paid-in capital. The fees may cause the redemption price per share to differ from the net asset value per share.
New Accounting Pronouncement On June 1, 2010, the fund adopted new accounting guidance that requires enhanced disclosures about fair value measurements in the financial statements. Adoption of this guidance had no impact on the fund’s net assets or results of operations.
NOTE 2 - VALUATION
The fund’s financial instruments are reported at fair value as defined by GAAP. The fund determines the values of its assets and liabilities and computes each class’s net asset value per share at the close of the New York Stock Exchange (NYSE), normally 4 p.m. ET, each day that the NYSE is open for business.
Valuation Methods Debt securities are generally traded in the over-the-counter (OTC) market. Securities with remaining maturities of one year or more at the time of acquisition are valued at prices furnished by dealers who make markets in such securities or by an independent pricing service, which considers the yield or price of bonds of comparable quality, coupon, maturity, and type, as well as prices quoted by dealers who make markets in such securities. Securities with remaining maturities of less than one year at the time of acquisition generally use amortized cost in local currency to approximate fair value. However, if amortized cost is deemed not to reflect fair value or the fund holds a significant amount of such securities with remaining maturities of more than 60 days, the securities are valued at prices furnished by dealers who make markets in such securities or by an independent pricing service.
Equity securities listed or regularly traded on a securities exchange or in the OTC market are valued at the last quoted sale price or, for certain markets, the official closing price at the time the valuations are made, except for OTC Bulletin Board securities, which are valued at the mean of the latest bid and asked prices. A security that is listed or traded on more than one exchange is valued at the quotation on the exchange determined to be the primary market for such security. Listed securities not traded on a particular day are valued at the mean of the latest bid and asked prices for domestic securities and the last quoted sale price for international securities.
Investments in mutual funds are valued at the mutual fund’s closing net asset value per share on the day of valuation. Purchased and written options are valued at the mean of the closing bid and asked prices. Forward currency exchange contracts are valued using the prevailing forward exchange rate. Swaps are valued at prices furnished by independent swap dealers or by an independent pricing service.
Other investments, including restricted securities, and those financial instruments for which the above valuation procedures are inappropriate or are deemed not to reflect fair value are stated at fair value as determined in good faith by the T. Rowe Price Valuation Committee, established by the fund’s Board of Directors.
For valuation purposes, the last quoted prices of non-U.S. equity securities may be adjusted under the circumstances described below. If the fund determines that developments between the close of a foreign market and the close of the NYSE will, in its judgment, materially affect the value of some or all of its portfolio securities, the fund will adjust the previous closing prices to reflect what it believes to be the fair value of the securities as of the close of the NYSE. In deciding whether it is necessary to adjust closing prices to reflect fair value, the fund reviews a variety of factors, including developments in foreign markets, the performance of U.S. securities markets, and the performance of instruments trading in U.S. markets that represent foreign securities and baskets of foreign securities. A fund may also fair value securities in other situations, such as when a particular foreign market is closed but the fund is open. The fund uses outside pricing services to provide it with closing prices and information to evaluate and/or adjust those prices. The fund cannot predict how often it will use closing prices and how often it will determine it necessary to adjust those prices to reflect fair value. As a means of evaluating its security valuation process, the fund routinely compares closing prices, the next day’s opening prices in the same markets, and adjusted prices.
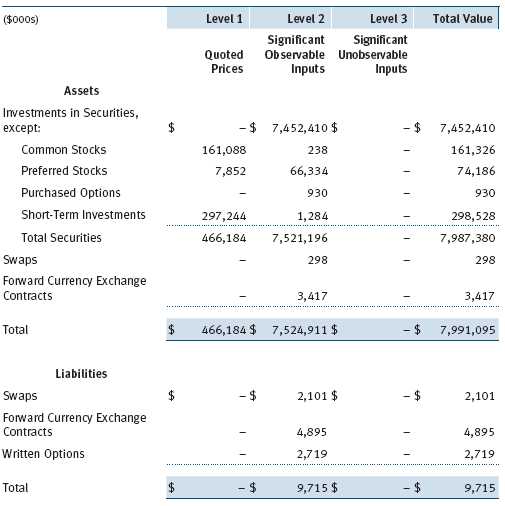
Valuation Inputs Various inputs are used to determine the value of the fund’s financial instruments. These inputs are summarized in the three broad levels listed below:
Level 1 – quoted prices in active markets for identical financial instruments
Level 2 – observable inputs other than Level 1 quoted prices (including, but not limited to, quoted prices for similar financial instruments, interest rates, prepayment speeds, and credit risk)
Level 3 – unobservable inputs
Observable inputs are those based on market data obtained from sources independent of the fund, and unobservable inputs reflect the fund’s own assumptions based on the best information available. The input levels are not necessarily an indication of the risk or liquidity associated with financial instruments at that level. For example, non-U.S. equity securities actively traded in foreign markets generally are reflected in Level 2 despite the availability of closing prices because the fund evaluates and determines whether those closing prices reflect fair value at the close of the NYSE or require adjustment, as described above. The following table summarizes the fund’s financial instruments, based on the inputs used to determine their values on November 30, 2010:
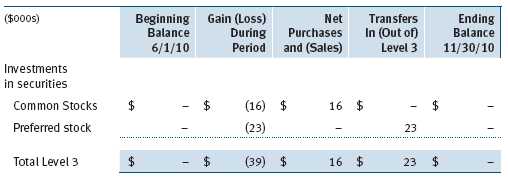
Following is a reconciliation of the fund’s Level 3 holdings for the six months ended November 30, 2010. Transfers into and out of Level 3 are reflected at the value of the financial instrument at the beginning of the period. Gain (loss) reflects both realized and change in unrealized gain (loss) on Level 3 holdings during the period, if any, and is included on the accompanying Statement of Operations. The change in unrealized gain (loss) on Level 3 instruments held at November 30, 2010, totaled $(39,000) for the six months ended November 30, 2010.
NOTE 3 - DERIVATIVE INSTRUMENTS
During the six months ended November 30, 2010, the fund invested in derivative instruments. As defined by GAAP, a derivative is a financial instrument whose value is derived from an underlying security price, foreign exchange rate, interest rate, index of prices or rates, or other variable; it requires little or no initial investment and permits or requires net settlement. The fund invests in derivatives only if the expected risks and rewards are consistent with its investment objectives, policies, and overall risk profile, as described in its prospectus and Statement of Additional Information. The fund may use derivatives for a variety of purposes, such as seeking to hedge against declines in principal value, increase yield, invest in an asset with greater efficiency and at a lower cost than is possible through direct investment, or to adjust portfolio duration and credit exposure. The risks associated with the use of derivatives are different from, and potentially much greater than, the risks associated with investing directly in the instruments on which the derivatives are based. Investments in derivatives can magnify returns positively or negatively; however, the fund at all times maintains sufficient cash reserves, liquid assets, or other SEC-permitted asset types to cover the settlement obligations under its open derivative contracts.
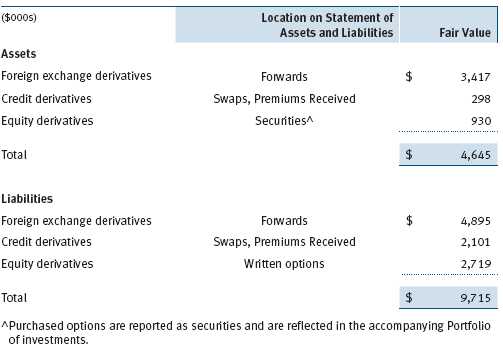
The fund values its derivatives at fair value, as described below and in Note 2, and recognizes changes in fair value currently in its results of operations. Accordingly, the fund does not follow hedge accounting, even for derivatives employed as economic hedges. The fund does not offset the fair value of derivative instruments against the right to reclaim or obligation to return collateral. The following table summarizes the fair value of the fund’s derivative instruments held as of November 30, 2010, and the related location on the accompanying Statement of Assets and Liabilities, presented by primary underlying risk exposure:
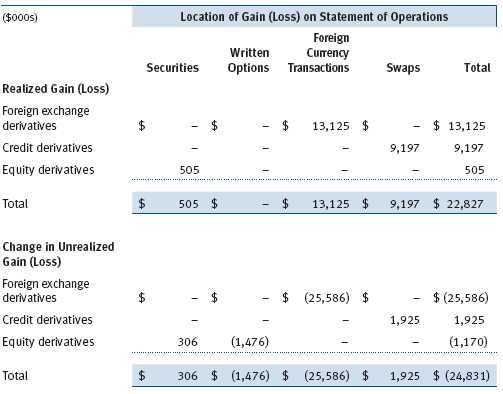
Additionally, the amount of gains and losses on derivative instruments recognized in fund earnings during the six months ended November 30, 2010, and the related location on the accompanying Statement of Operations is summarized in the following table by primary underlying risk exposure:
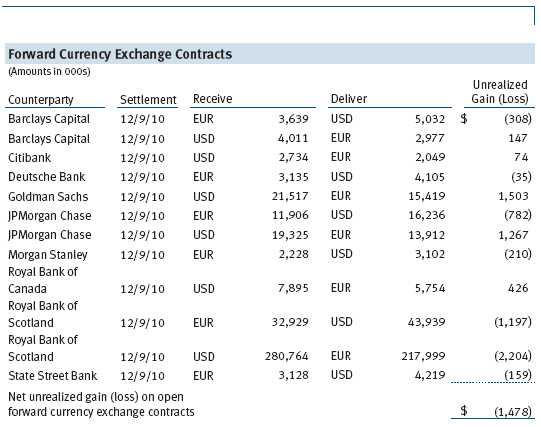
Forward Currency Exchange Contracts The fund is subject to foreign currency exchange rate risk in the normal course of pursuing its investment objectives. It uses forward currency exchange contracts (forwards) primarily to protect its non-U.S. dollar-denominated securities from adverse currency movements relative to the U.S. dollar. A forward involves an obligation to purchase or sell a fixed amount of a specific currency on a future date at a price set at the time of the contract. Although certain forwards may be settled by exchanging only the net gain or loss on the contract, most forwards are settled with the exchange of the underlying currencies in accordance with the specified terms. Forwards are valued at the unrealized gain or loss on the contract, which reflects the net amount the fund either is entitled to receive or obligated to deliver, as measured by the difference between the forward exchange rates at the date of entry into the contract and the forward rates at the reporting date. Appreciated forwards are reflected as assets, and depreciated forwards are reflected as liabilities on the accompanying Statement of Assets and Liabilities. Risks related to the use of forwards include the possible failure of counterparties to meet the terms of the agreements; that anticipated currency movements will not occur, thereby reducing the fund’s total return; and the potential for losses in excess of the fund’s initial investment. During the six months ended November 30, 2010, the fund’s exposure to forwards, based on underlying notional amounts, was generally between 2% and 4% of net assets.
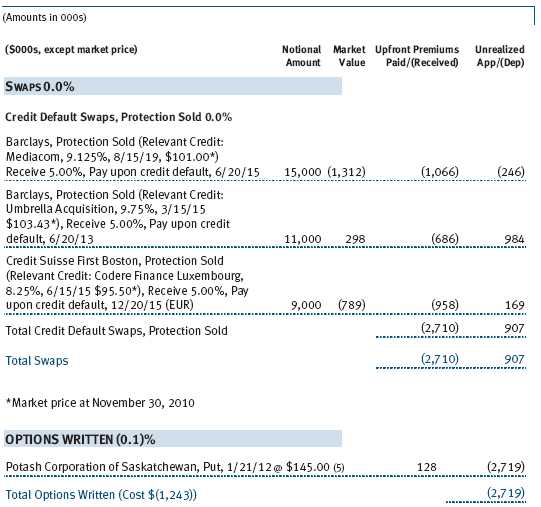
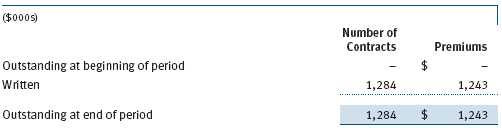
Options The fund is subject to equity price risk in the normal course of pursuing its investment objectives and uses options to help manage such risk. The fund may use call and put options to manage exposure to interest rates, security prices, foreign currencies, and credit quality; as an efficient means of adjusting exposure to all or a part of a target market; to enhance income; as a cash management tool; and/or to adjust portfolio duration and credit exposure. Call and put options give the holder the right, in return for a premium paid, to purchase or sell, respectively, a security at a specified exercise price at any time during the period of the option. Options are included in net assets at fair value; purchased options are included in Investments in Securities; and written options are separately reflected as a liability on the accompanying Statement of Assets and Liabilities. Premiums on unexercised, expired options are recorded as realized gains or losses; premiums on exercised options are recorded as an adjustment to the proceeds from the sale or cost of the purchase. The difference between the premium and the amount received or paid in a closing transaction is also treated as realized gain or loss. Risks related to the use of options include possible illiquidity of the options markets; trading restrictions imposed by an exchange; movements in underlying security values; and for written options, potential losses in excess of the fund’s initial investment. During the six months ended November 30, 2010, the fund’s exposure to options, based on underlying notional amounts, was generally between 0% and 1% of net assets. Transactions in written options and related premiums received during the six months ended November 30, 2010, were as follows:
Credit Default Swaps The fund is subject to credit risk in the normal course of pursuing its investment objectives and uses swap contracts to help manage such risk. The fund may use swaps in an effort to manage exposure to changes in interest rates and credit quality, to adjust overall exposure to certain markets, to enhance total return or protect the value of portfolio securities, to serve as a cash management tool, and/or to adjust portfolio duration or credit exposure. Credit default swaps are agreements where one party (the protection buyer) agrees to make periodic payments to another party (the protection seller) in exchange for protection against specified credit events, such as certain defaults and bankruptcies related to an underlying credit instrument, index, or issuer thereof. Upon occurrence of a specified credit event, the protection seller is required to pay the buyer the difference between the notional amount of the swap and the value of the underlying credit, either in the form of a net cash settlement or by paying the gross notional amount and accepting delivery of the relevant underlying credit. Generally, the payment risk for the seller of protection is inversely related to the current market price of the underlying credit; therefore, the payment risk increases as the price of the relevant underlying credit declines due to market valuations of credit quality. As of November 30, 2010, the notional amount of protection sold by the fund totaled $35,000,000 (0.4% of net assets), which reflects the maximum potential amount the fund could be required to pay under such contracts. The value of a swap included in net assets is the unrealized gain or loss on the contract plus or minus any unamortized premiums paid or received, respectively. Appreciated swaps and premiums paid are reflected as assets, and depreciated swaps and premiums received are reflected as liabilities on the accompanying Statement of Assets and Liabilities. Net periodic receipts or payments required by swaps are accrued daily and are recorded as realized gain or loss for financial reporting purposes; fluctuations in the fair value of swaps are reflected in the change in net unrealized gain or loss and are reclassified to realized gain or loss upon termination prior to maturity or cash settlement. Risks related to the use of credit default swaps include the possible inability of the fund to accurately assess the current and future creditworthiness of underlying issuers, the possible failure of a counterparty to perform in accordance with the terms of the swap agreements, potential government regulation that could adversely affect the fund’s swap investments, and potential losses in excess of the fund’s initial investment. During the six months ended November 30, 2010, the fund’s exposure to swaps, based on underlying notional amounts, was generally between 0% and 1% of net assets.
NOTE 4 - OTHER INVESTMENT TRANSACTIONS
Consistent with its investment objective, the fund engages in the following practices to manage exposure to certain risks and/or to enhance performance. The investment objective, policies, program, and risk factors of the fund are described more fully in the fund’s prospectus and Statement of Additional Information.
Noninvestment-Grade Debt Securities At November 30, 2010, approximately 88% of the fund’s net assets were invested, either directly or through its investment in T. Rowe Price institutional funds, in noninvestment-grade debt securities, commonly referred to as “high yield” or “junk” bonds. The noninvestment-grade bond market may experience sudden and sharp price swings due to a variety of factors, including changes in economic forecasts, stock market activity, large sustained sales by major investors, a high-profile default, or a change in the market’s psychology. These events may decrease the ability of issuers to make principal and interest payments and adversely affect the liquidity or value, or both, of such securities.
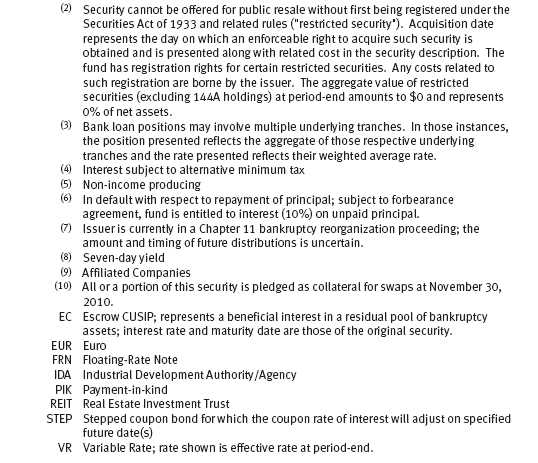
Restricted Securities The fund may invest in securities that are subject to legal or contractual restrictions on resale. Prompt sale of such securities at an acceptable price may be difficult and may involve substantial delays and additional costs.
Bank Loans The fund may invest in bank loans, which represent an interest in amounts owed by a borrower to a syndication of lenders. Bank loans may involve multiple loans with the same borrower under a single credit agreement (each loan, a tranche) and each tranche may have different terms and associated risks. A bank or other financial institution typically acts as the agent and administers a bank loan in accordance with the associated credit agreement. Bank loans are generally noninvestment grade and often involve borrowers whose financial condition is troubled or uncertain and companies that are highly leveraged. The fund may buy and sell bank loans in the form of either loan assignments or loan participations. A loan assignment transfers all legal, beneficial, and economic rights to the buyer. Although loan assignments continue to be administered by the agent, the buyer acquires direct rights against the borrower. In many cases, a loan assignment requires the consent of both the borrower and the agent. In contrast, a loan participation generally entitles the buyer to receive the cash flows from principal, interest, and any fee payments that the seller is entitled to receive from the borrower; however, the seller continues to hold legal title to the loan. As a result, with loan participations, the buyer generally has no right to enforce compliance with the terms of the credit agreement against the borrower, and the buyer is subject to the credit risk of both the borrower and the seller. Bank loans often have extended settlement periods, during which the fund is subject to nonperformance by the counterparty. A portion of the fund’s bank loans may require additional principal to be funded at the borrowers’ discretion at a later date (unfunded commitments) and bank loans usually may be repaid at any time at the option of the borrower. The fund reflects both the funded portion of the bank loan as well as any unfunded commitment on the loan in the Portfolio of Investments.
Counterparty Risk and Collateral The fund has entered into collateral agreements with certain counterparties to mitigate counterparty risk associated with certain over-the-counter (OTC) financial instruments, including swaps, forward currency exchange contracts, and TBA purchase commitments (collectively, covered OTC instruments). Subject to certain minimum exposure requirements (which typically range from $100,000 to $500,000), collateral requirements generally are determined and transfers made based on the net aggregate unrealized gain or loss on all OTC instruments covered by a particular collateral agreement with a specified counterparty. Collateral, both pledged by the fund to a counterparty and pledged by a counterparty to the fund, is held in a segregated account by a third-party agent and can be in the form of cash or debt securities issued by the U.S. government or related agencies. Securities posted as collateral by the fund to a counterparty are so noted in the accompanying Portfolio of Investments and remain in the fund’s net assets. As of November 30, 2010, securities valued at $1,284,000 had been posted by the fund to counterparties. In accordance with GAAP, cash pledged by counterparties to the fund is included in the fund’s net assets; however, securities pledged by counterparties to the fund are not recorded by the fund. As of November 30, 2010, collateral pledged by counterparties to the fund consisted of securities valued at $1,214,000.
At any point in time, the fund’s risk of loss from counterparty credit risk on covered OTC instruments in excess of collateral, if any, pledged by the counterparty to the fund. Counterparty risk related to exchange-traded futures and options contracts is minimal because the exchange’s clearinghouse provides protection against counterparty defaults. In accordance with the terms of the relevant derivatives agreements, counterparties to OTC derivatives may be able to terminate derivative contracts prior to maturity after the occurrence of certain stated events, such as a decline in net assets above a certain percentage or a failure by the fund to perform its obligations under the contract. Upon termination, all transactions would typically be liquidated and a net amount would be owed by or payable to the fund. Generally, for exchange-traded derivatives such as futures and options, each broker, in its sole discretion, may change margin requirements applicable to the fund.
Other Purchases and sales of portfolio securities other than short-term securities aggregated $3,051,919,000 and $2,511,023,000, respectively, for the six months ended November 30, 2010.
NOTE 5 - FEDERAL INCOME TAXES
No provision for federal income taxes is required since the fund intends to continue to qualify as a regulated investment company under Subchapter M of the Internal Revenue Code and distribute to shareholders all of its taxable income and gains. Distributions determined in accordance with federal income tax regulations may differ in amount or character from net investment income and realized gains for financial reporting purposes. Financial reporting records are adjusted for permanent book/tax differences to reflect tax character but are not adjusted for temporary differences. The amount and character of tax-basis distributions and composition of net assets are finalized at fiscal year-end; accordingly, tax-basis balances have not been determined as of the date of this report.
The fund intends to retain realized gains to the extent of available capital loss carryforwards. As of May 31, 2010, the fund had $543,937,000 of unused capital loss carryforwards, which expire: $108,310,000 in fiscal 2011, $20,540,000 in fiscal 2016, $347,984,000 in fiscal 2017, and $67,103,000 in fiscal 2018.
At November 30, 2010, the cost of investments for federal income tax purposes was $7,560,704,000. Net unrealized gain aggregated $424,444,000 at period-end, of which $515,050,000 related to appreciated investments and $90,606,000 related to depreciated investments.
NOTE 6 - RELATED PARTY TRANSACTIONS
The fund is managed by T. Rowe Price Associates, Inc. (the manager or Price Associates), a wholly owned subsidiary of T. Rowe Price Group, Inc. The investment management agreement between the fund and the manager provides for an annual investment management fee, which is computed daily and paid monthly. The fee consists of an individual fund fee, equal to 0.30% of the fund’s average daily net assets, and a group fee. The group fee rate is calculated based on the combined net assets of certain mutual funds sponsored by Price Associates (the group) applied to a graduated fee schedule, with rates ranging from 0.48% for the first $1 billion of assets to 0.285% for assets in excess of $220 billion. The fund’s group fee is determined by applying the group fee rate to the fund’s average daily net assets. At November 30, 2010, the effective annual group fee rate was 0.30%.
In addition, the fund has entered into service agreements with Price Associates and two wholly owned subsidiaries of Price Associates (collectively, Price). Price Associates computes the daily share prices and provides certain other administrative services to the fund. T. Rowe Price Services, Inc., provides shareholder and administrative services in its capacity as the fund’s transfer and dividend disbursing agent. T. Rowe Price Retirement Plan Services, Inc., provides subaccounting and recordkeeping services for certain retirement accounts invested in the Investor Class. For the six months ended November 30, 2010, expenses incurred pursuant to these service agreements were $99,000 for Price Associates; $632,000 for T. Rowe Price Services, Inc.; and $178,000 for T. Rowe Price Retirement Plan Services, Inc. The total amount payable at period-end pursuant to these service agreements is reflected as Due to Affiliates in the accompanying financial statements.
The fund is also one of several mutual funds sponsored by Price Associates (underlying Price funds) in which the T. Rowe Price Spectrum Funds (Spectrum Funds) and T. Rowe Price Retirement Funds (Retirement Funds) may invest. Neither the Spectrum Funds nor the Retirement Funds invest in the underlying Price funds for the purpose of exercising management or control. Pursuant to separate special servicing agreements, expenses associated with the operation of the Spectrum and Retirement Funds are borne by each underlying Price fund to the extent of estimated savings to it and in proportion to the average daily value of its shares owned by the Spectrum and Retirement Funds, respectively. Expenses allocated under these agreements are reflected as shareholder servicing expenses in the accompanying financial statements. For the six months ended November 30, 2010, the fund was allocated $867,000 of Spectrum Funds’ expenses and $1,130,000 of Retirement Funds’ expenses. Of these amounts, $1,292,000 related to services provided by Price. The amount payable at period-end pursuant to this agreement is reflected as Due to Affiliates in the accompanying financial statements. At November 30, 2010, approximately 19% of the outstanding shares of the Investor Class were held by the Spectrum Funds and 22% were held by the Retirement Funds.
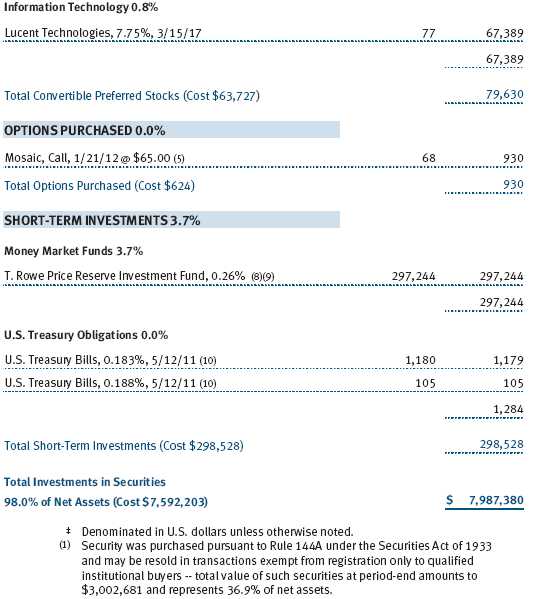
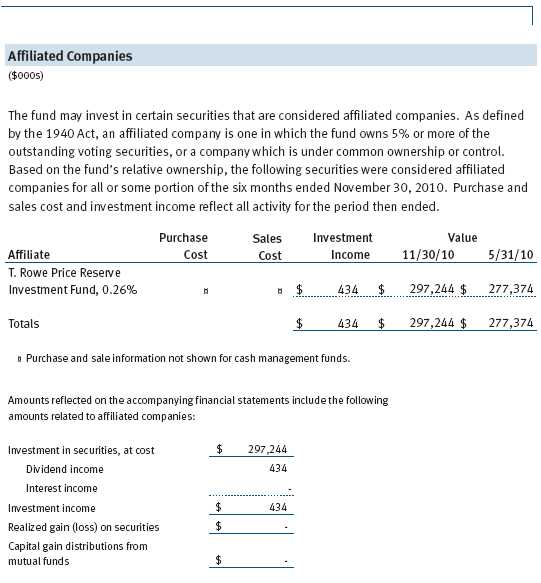
The fund may invest in the T. Rowe Price Reserve Investment Fund and the T. Rowe Price Government Reserve Investment Fund (collectively, the T. Rowe Price Reserve Investment Funds), open-end management investment companies managed by Price Associates and considered affiliates of the fund. The T. Rowe Price Reserve Investment Funds are offered as cash management options to mutual funds, trusts, and other accounts managed by Price Associates and/or its affiliates and are not available for direct purchase by members of the public. The T. Rowe Price Reserve Investment Funds pay no investment management fees.
| INFORMATION ON PROXY VOTING POLICIES, PROCEDURES, AND RECORDS |
A description of the policies and procedures used by T. Rowe Price funds and portfolios to determine how to vote proxies relating to portfolio securities is available in each fund’s Statement of Additional Information, which you may request by calling 1-800-225-5132 or by accessing the SEC’s website, sec.gov. The description of our proxy voting policies and procedures is also available on our website, troweprice.com. To access it, click on the words “Our Company” at the top of our corporate homepage. Then, when the next page appears, click on the words “Proxy Voting Policies” on the left side of the page.
Each fund’s most recent annual proxy voting record is available on our website and through the SEC’s website. To access it through our website, follow the directions above, then click on the words “Proxy Voting Records” on the right side of the Proxy Voting Policies page.
| HOW TO OBTAIN QUARTERLY PORTFOLIO HOLDINGS |
The fund files a complete schedule of portfolio holdings with the Securities and Exchange Commission for the first and third quarters of each fiscal year on Form N-Q. The fund’s Form N-Q is available electronically on the SEC’s website (sec.gov); hard copies may be reviewed and copied at the SEC’s Public Reference Room, 450 Fifth St. N.W., Washington, DC 20549. For more information on the Public Reference Room, call 1-800-SEC-0330.
Item 2. Code of Ethics.
A code of ethics, as defined in Item 2 of Form N-CSR, applicable to its principal executive officer, principal financial officer, principal accounting officer or controller, or persons performing similar functions is filed as an exhibit to the registrant’s annual Form N-CSR. No substantive amendments were approved or waivers were granted to this code of ethics during the registrant’s most recent fiscal half-year.
Item 3. Audit Committee Financial Expert.
Disclosure required in registrant’s annual Form N-CSR.
Item 4. Principal Accountant Fees and Services.
Disclosure required in registrant’s annual Form N-CSR.
Item 5. Audit Committee of Listed Registrants.
Not applicable.
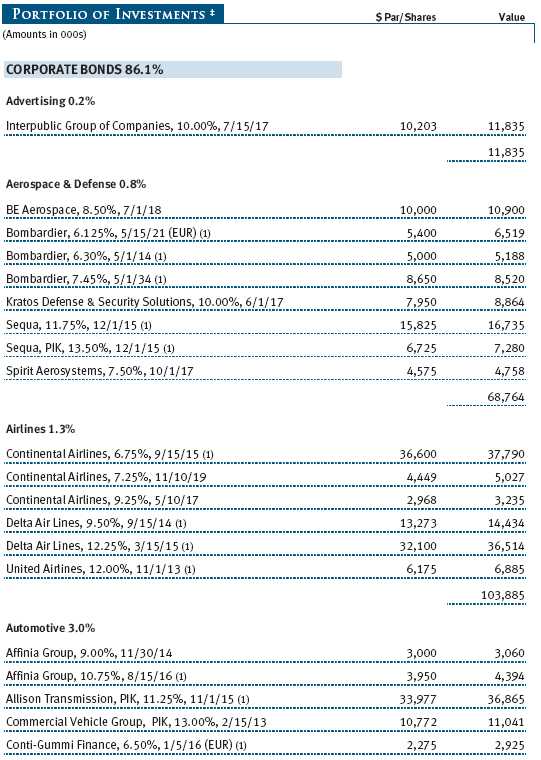
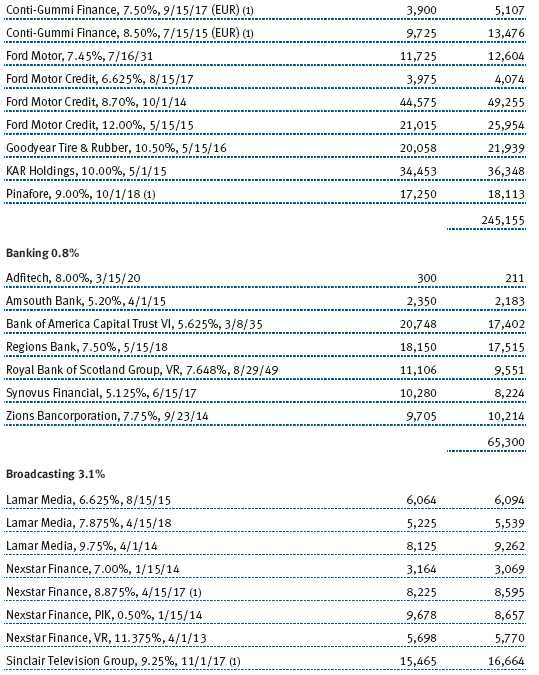
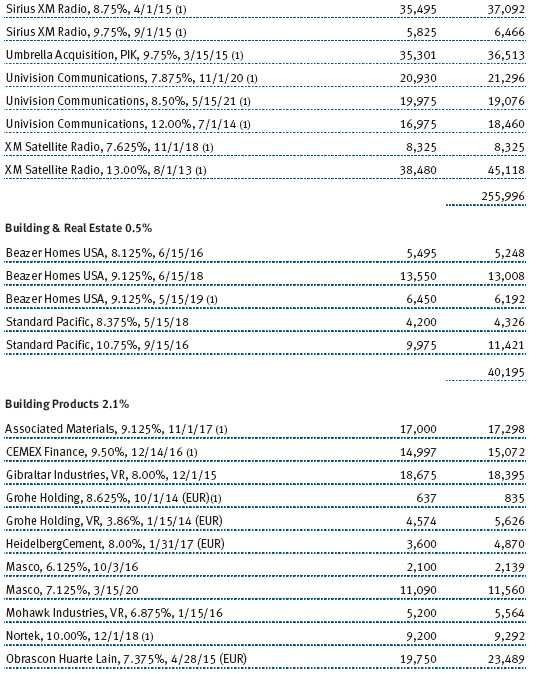
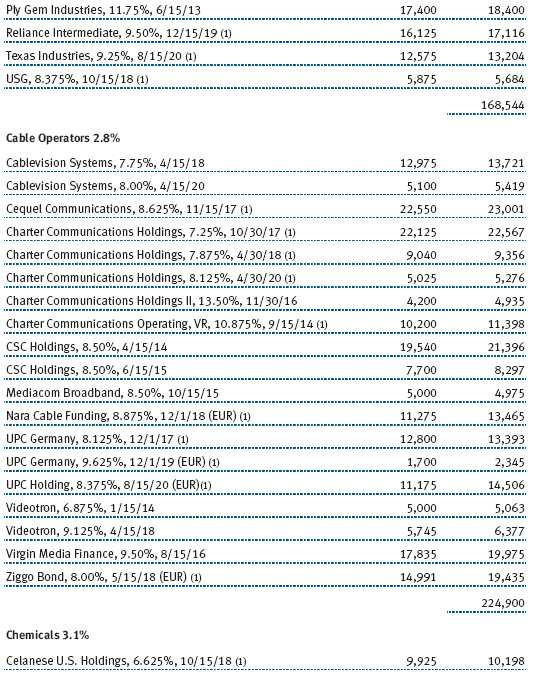
Item 6. Investments.
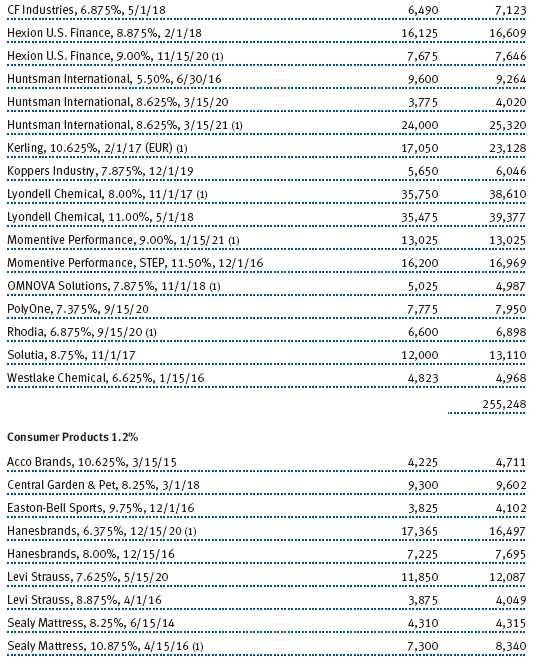
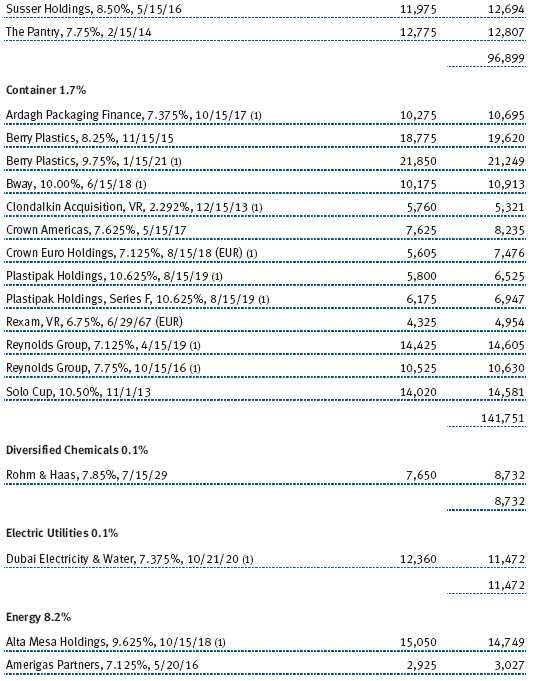
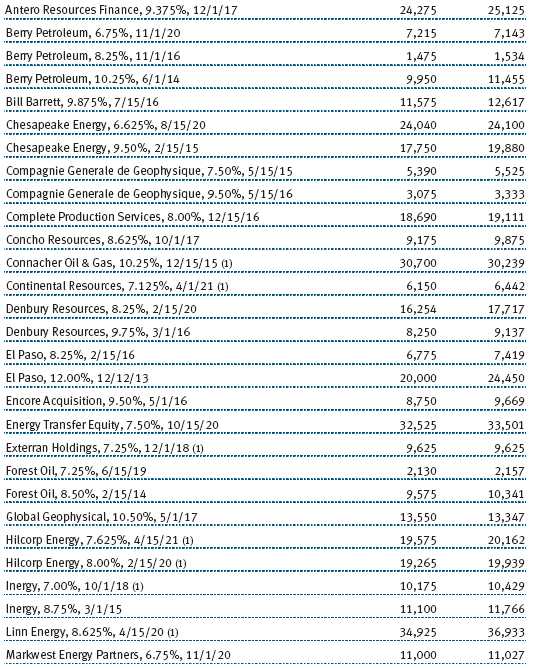
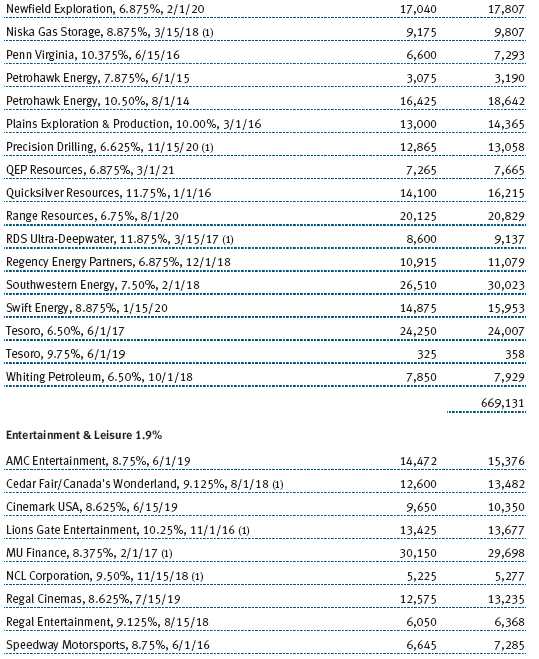
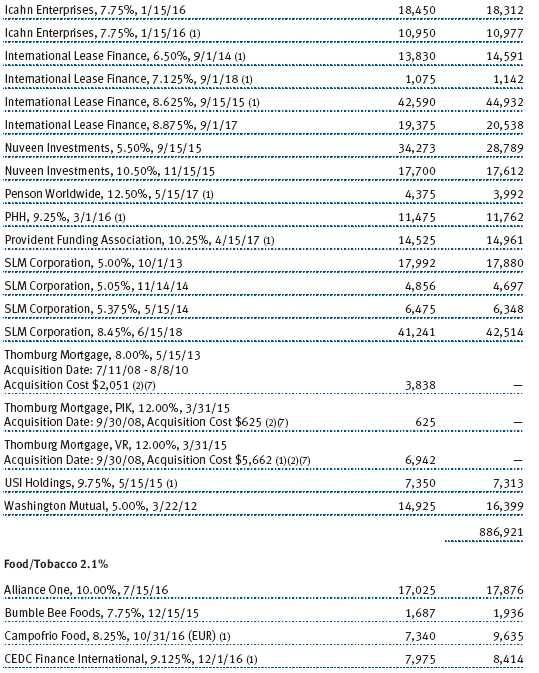
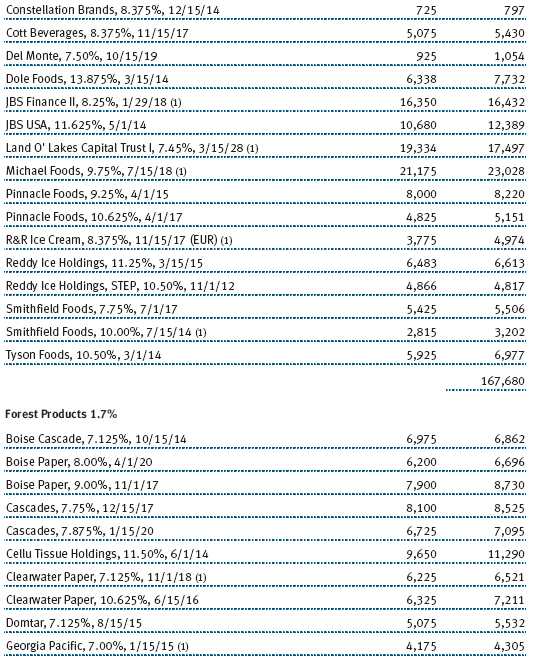
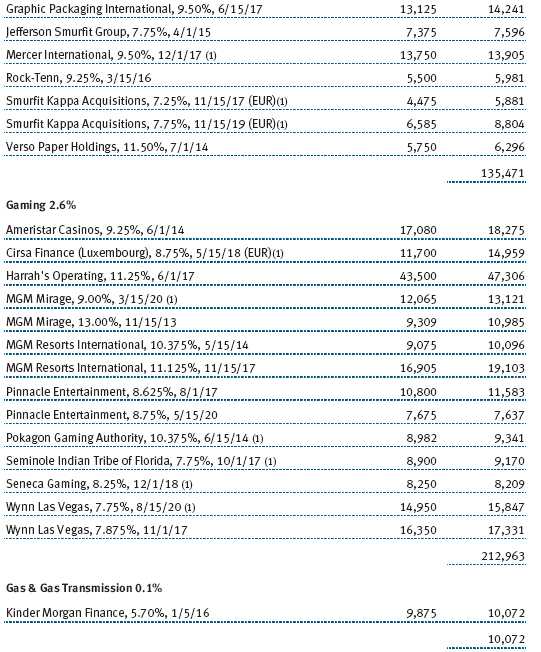
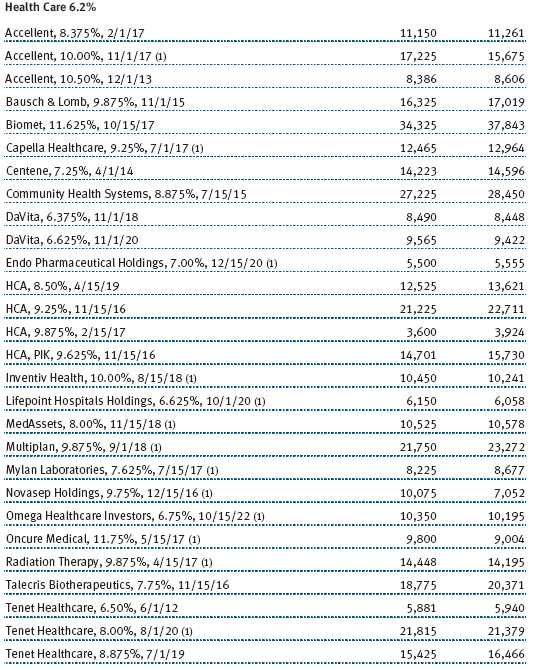
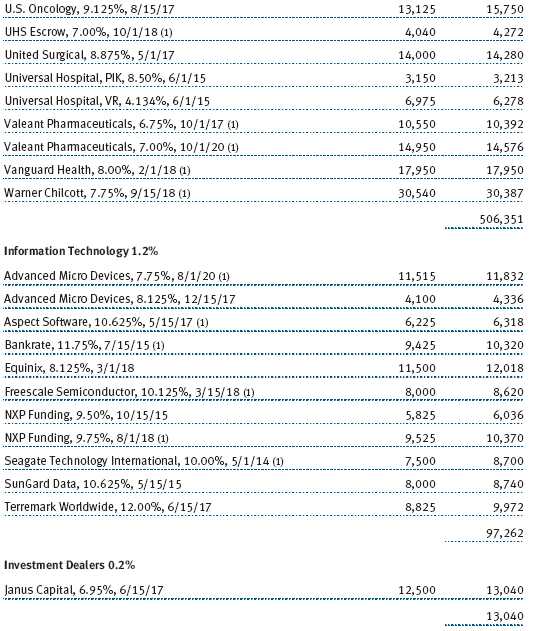
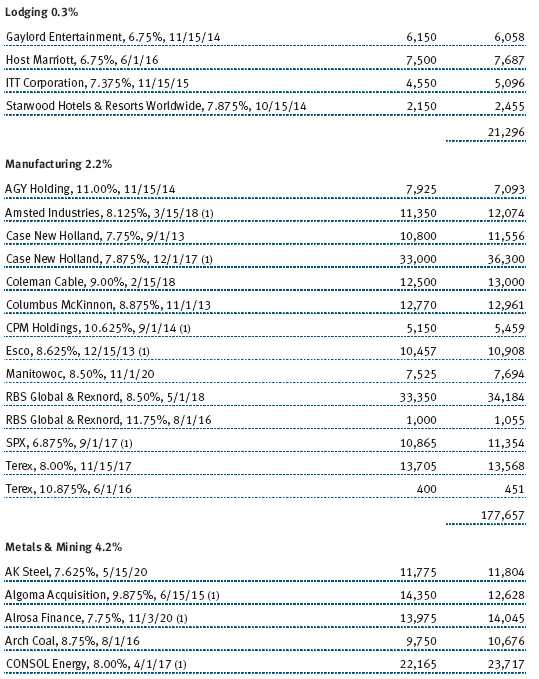
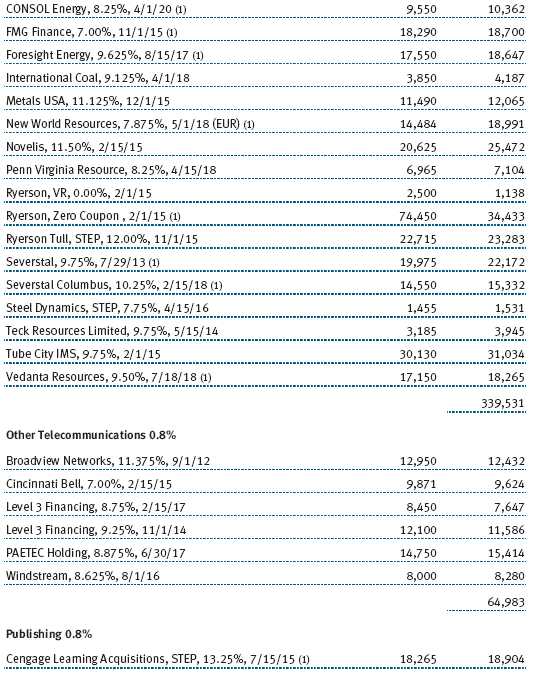
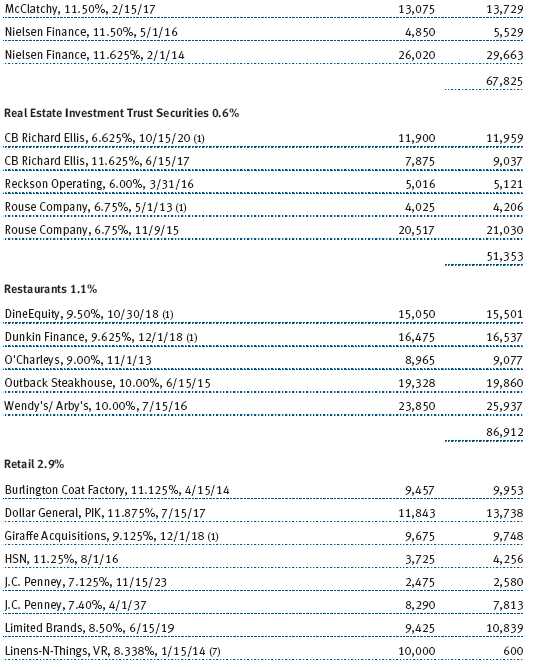
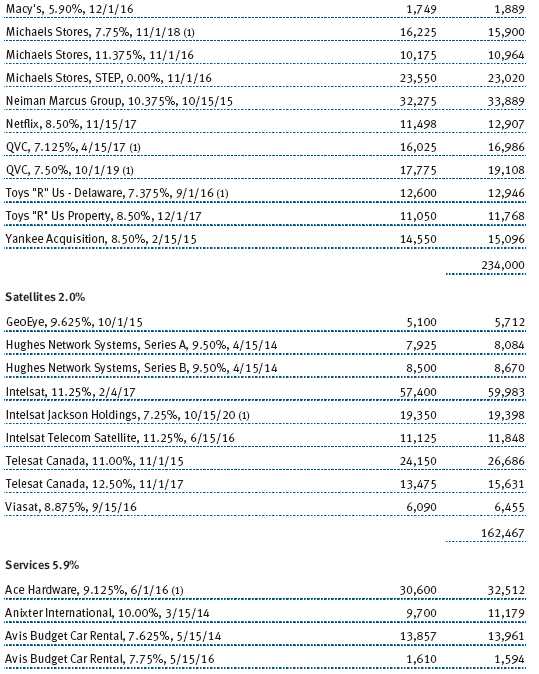
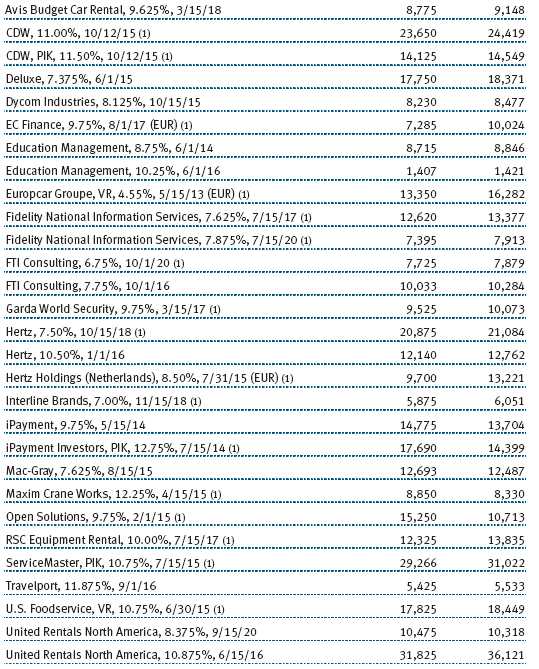
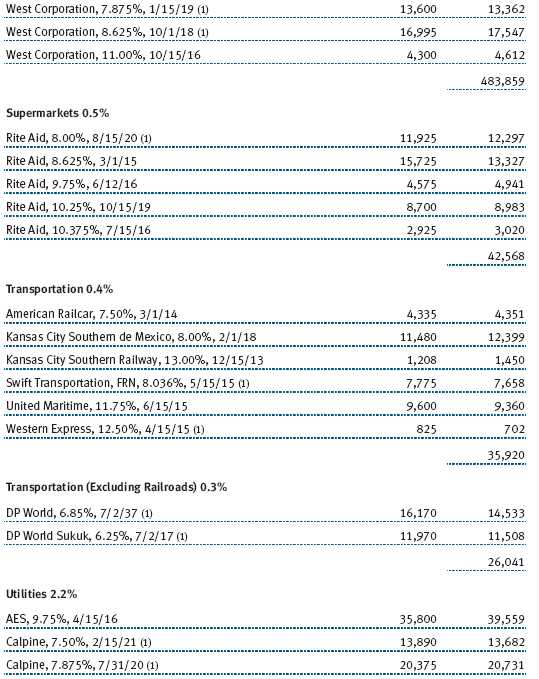
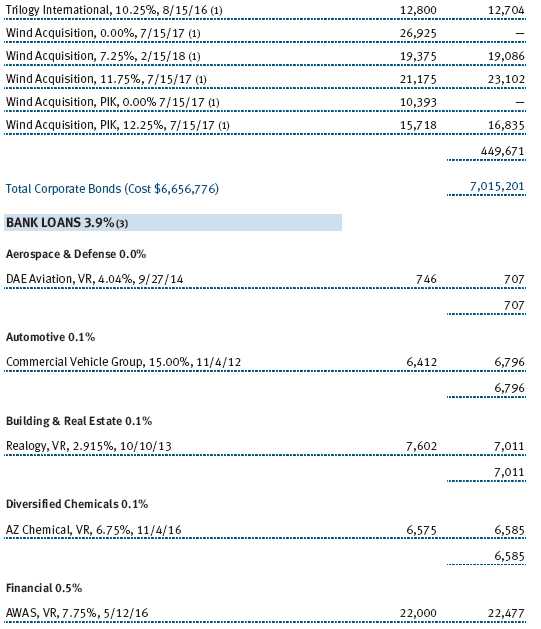
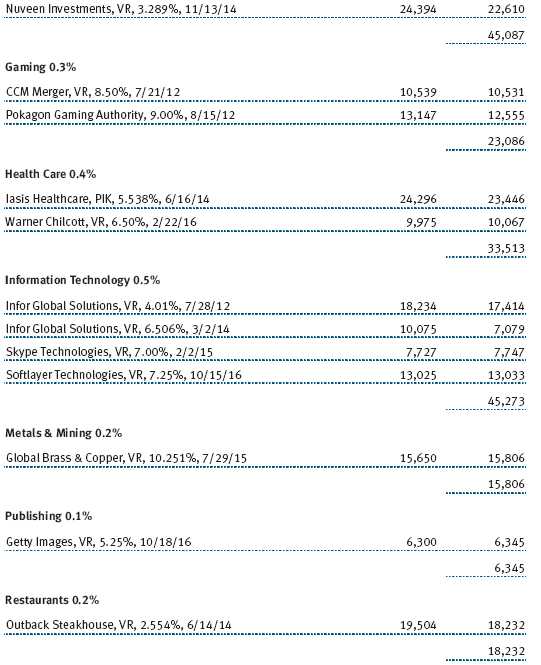
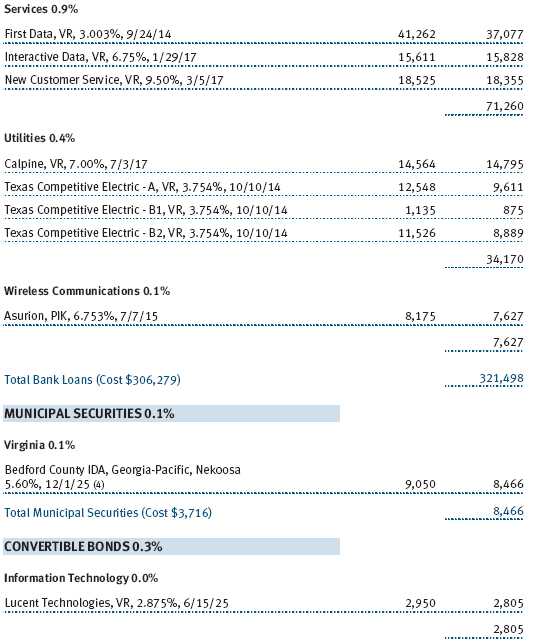
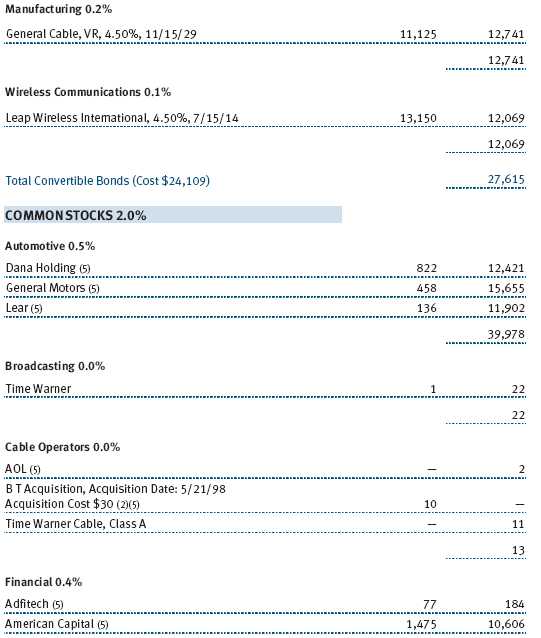
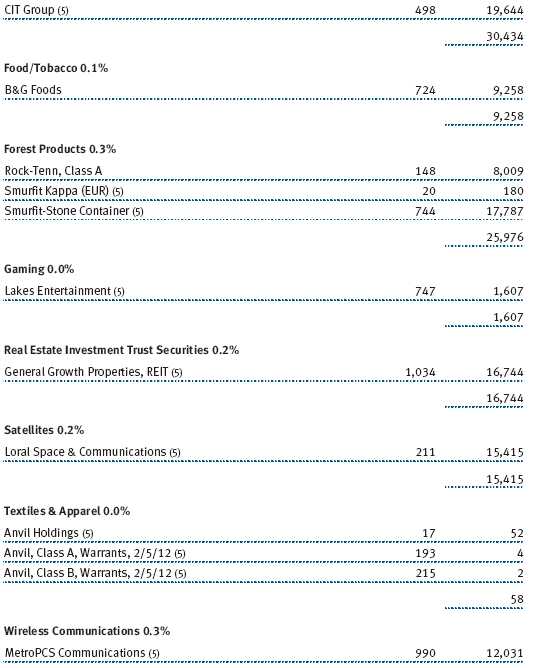
(a) Not applicable. The complete schedule of investments is included in Item 1 of this Form N-CSR.
(b) Not applicable.
Item 7. Disclosure of Proxy Voting Policies and Procedures for Closed-End Management Investment Companies.
Not applicable.
Item 8. Portfolio Managers of Closed-End Management Investment Companies.
Not applicable.
Item 9. Purchases of Equity Securities by Closed-End Management Investment Company and Affiliated Purchasers.
Not applicable.
Item 10. Submission of Matters to a Vote of Security Holders.
Not applicable.
Item 11. Controls and Procedures.
(a) The registrant’s principal executive officer and principal financial officer have evaluated the registrant’s disclosure controls and procedures within 90 days of this filing and have concluded that the registrant’s disclosure controls and procedures were effective, as of that date, in ensuring that information required to be disclosed by the registrant in this Form N-CSR was recorded, processed, summarized, and reported timely.
(b) The registrant’s principal executive officer and principal financial officer are aware of no change in the registrant’s internal control over financial reporting that occurred during the registrant’s second fiscal quarter covered by this report that has materially affected, or is reasonably likely to materially affect, the registrant’s internal control over financial reporting.
Item 12. Exhibits.
(a)(1) The registrant’s code of ethics pursuant to Item 2 of Form N-CSR is filed with the registrant’s annual Form N-CSR.
(2) Separate certifications by the registrant's principal executive officer and principal financial officer, pursuant to Section 302 of the Sarbanes-Oxley Act of 2002 and required by Rule 30a-2(a) under the Investment Company Act of 1940, are attached.
(3) Written solicitation to repurchase securities issued by closed-end companies: not applicable.
(b) A certification by the registrant's principal executive officer and principal financial officer, pursuant to Section 906 of the Sarbanes-Oxley Act of 2002 and required by Rule 30a-2(b) under the Investment Company Act of 1940, is attached.
| | |
SIGNATURES |
| |
| | Pursuant to the requirements of the Securities Exchange Act of 1934 and the Investment |
| Company Act of 1940, the registrant has duly caused this report to be signed on its behalf by the |
| undersigned, thereunto duly authorized. |
| |
| T. Rowe Price High Yield Fund, Inc. |
| |
| |
| By | /s/ Edward C. Bernard |
| | Edward C. Bernard |
| | Principal Executive Officer |
| |
| Date | January 21, 2011 |
| |
| |
| |
| | Pursuant to the requirements of the Securities Exchange Act of 1934 and the Investment |
| Company Act of 1940, this report has been signed below by the following persons on behalf of |
| the registrant and in the capacities and on the dates indicated. |
| |
| |
| By | /s/ Edward C. Bernard |
| | Edward C. Bernard |
| | Principal Executive Officer |
| |
| Date | January 21, 2011 |
| |
| |
| |
| By | /s/ Gregory K. Hinkle |
| | Gregory K. Hinkle |
| | Principal Financial Officer |
| |
| Date | January 21, 2011 |