| UNITED STATES |
| SECURITIES AND EXCHANGE COMMISSION |
| Washington, D.C. 20549 |
| |
FORM N-CSR |
| |
CERTIFIED SHAREHOLDER REPORT OF REGISTERED |
MANAGEMENT INVESTMENT COMPANIES |
| |
| |
| |
| Investment Company Act File Number: 811-4119 |
|
| |
| T. Rowe Price High Yield Fund, Inc. |
|
| (Exact name of registrant as specified in charter) |
| |
| 100 East Pratt Street, Baltimore, MD 21202 |
|
| (Address of principal executive offices) |
| |
| David Oestreicher |
| 100 East Pratt Street, Baltimore, MD 21202 |
|
| (Name and address of agent for service) |
| |
| |
| Registrant’s telephone number, including area code: (410) 345-2000 |
| |
| |
| Date of fiscal year end: May 31 |
| |
| |
| Date of reporting period: November 30, 2009 |
Item 1: Report to Shareholders| High Yield Fund | November 30, 2009 |
The views and opinions in this report were current as of November 30, 2009. They are not guarantees of performance or investment results and should not be taken as investment advice. Investment decisions reflect a variety of factors, and the managers reserve the right to change their views about individual stocks, sectors, and the markets at any time. As a result, the views expressed should not be relied upon as a forecast of the fund’s future investment intent. The report is certified under the Sarbanes-Oxley Act, which requires mutual funds and other public companies to affirm that, to the best of their knowledge, the information in their financial reports is fairly and accurately stated in all material respects.
REPORTS ON THE WEB
Sign up for our E-mail Program, and you can begin to receive updated fund reports and prospectuses online rather than through the mail. Log in to your account at troweprice.com for more information.
Manager’s Letter
Fellow Shareholders
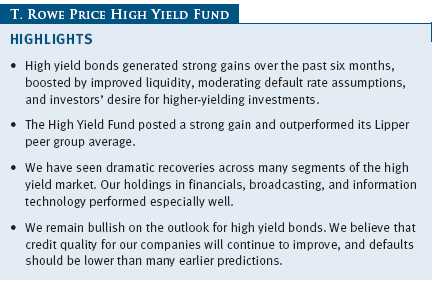
The environment for high yield bonds was especially strong in the last six months. As the U.S. economy emerged from its longest and deepest recession since the Great Depression, junk bonds surged, generating a powerful combination of capital appreciation and dividend income. We remain optimistic about the prospects for our asset class because the typical bull market cycle in high yield bonds has historically lasted for several years.
PORTFOLIO PERFORMANCE
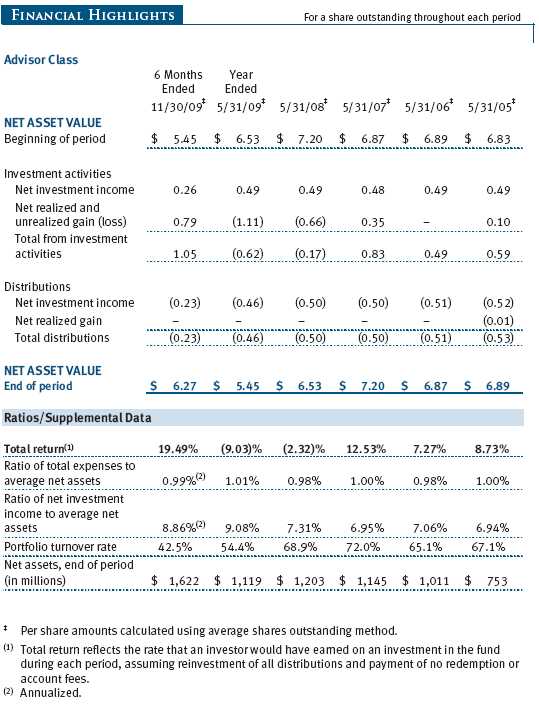
The high yield market generated remarkable performance during the last six months. The average high yield fund, as measured by Lipper, gained almost 20% in the first half of our fiscal year (June 1 through November 30, 2009), and your fund performed modestly better. We trailed the Credit Suisse High Yield Index for the last six months due to the torrid gains in defaulted bonds and the lowest-rated credits in the index—your fund’s focus is on higher-quality B and BB bonds. Results for Advisor Class shares varied slightly, reflecting their different fee structure.
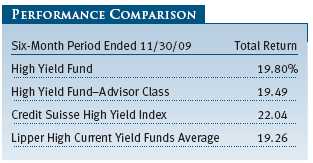
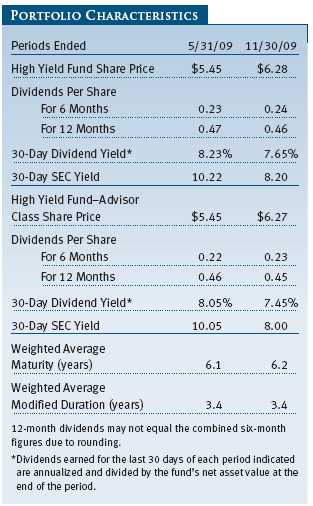
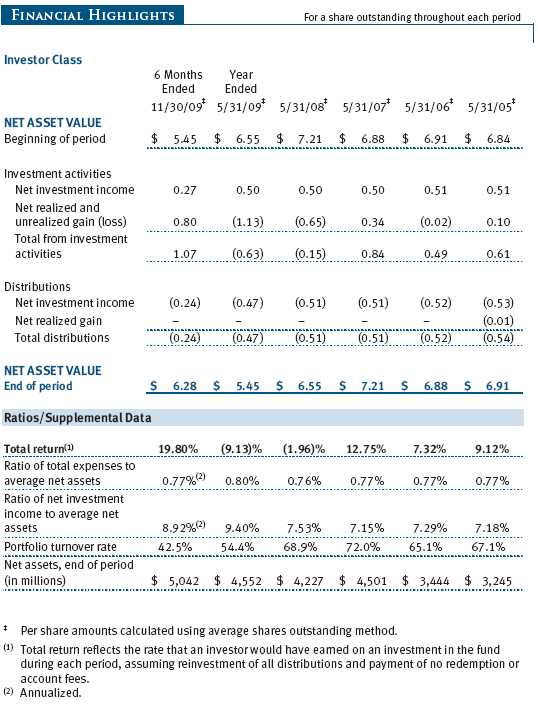
The fund’s share price advanced $0.83 over the past six months to $6.28 from $5.45. During the period, the portfolio also generated $0.24 of dividend income for a 19.80% gain. Capital appreciation accounted for about three-quarters of the fund’s total return over the past six months. Because of the sharp gain in the fund’s share price and the lower yields available in our market, the 30-day dividend yield at the end of the reporting period fell to 7.65% from 8.23% six months ago.
The T. Rowe Price High Yield Fund compared favorably with its peer group. Lipper ranked the fund in the top 11% of its high current yield bond funds universe for the 10-year period and in the top quintile of its category for the five-year period ended November 30, 2009. (Based on cumulative total return, Lipper ranked the High Yield Fund 259 out of 458, 62 out of 334, and 22 out of 207 funds in the high current yield bond funds category for the 1-, 5-, and 10-year periods ended November 30, 2009, respectively. Results will vary for other periods. Past performance cannot guarantee future results.)
THE ENVIRONMENT WAS GOOD, REALLY GOOD
The primary reason high yield bonds did so well was the improving default picture for next year. At the beginning of 2009, most high yield analysts forecast a double-digit default rate for 2010. However, by the end of our reporting period, most agree that the 2010 default rate likely will be about 4%, which is the long-term historical average. The improvement in the outlook for the companies in our market this year has generated huge capital gains, albeit from extremely depressed levels.
For calendar year 2009, we believe the default rate will be about 11%, which is a record high. However, many companies have managed debt-for-debt exchanges outside of the formal bankruptcy process. If those were added in, the market’s “effective” default rate would have been closer to 16%. Although we are writing this letter a bit before year-end, we are confident that your fund will have about a 1% default rate across its holdings in 2009. We managed to avoid defaults this year, thanks to our exhaustive research efforts, and that meant that our shareholders received almost all of the income we accrued.
High yield market cycles tend to be enduring, lasting three to five years. We enjoyed a historic rally this year that began after a horrendous loss. The spread, or yield advantage for junk bonds over Treasuries, reached its all-time high at 19.26% (1,926 basis points) on December 15, 2008. The spread is now about 750 basis points. We think there is room for spreads to fall further, but if the market continues to rally, we will have to reevaluate the longevity of this cycle. Nevertheless, we think that we still have a good cushion and that the market can continue to perform well in 2010.
PORTFOLIO REVIEW
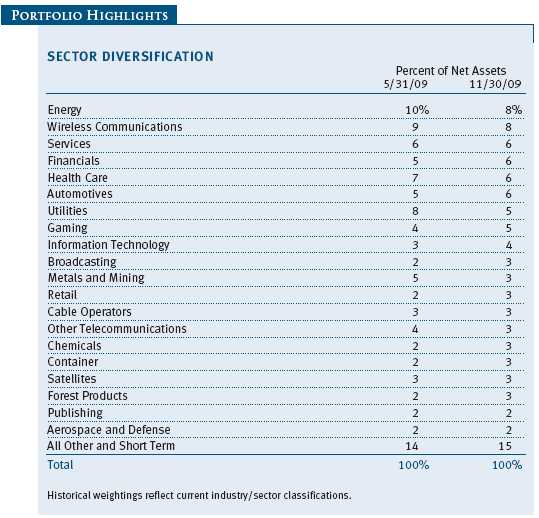
We made a few big sector calls early in the year that helped returns. We generated outstanding results in financials, broadcasting, information technology, energy, and autos. Retailing is another segment that we have increased in the portfolio. Retailers have improved their balance sheets, which should allow them to weather the slowdown in consumer spending. However, the fund’s core holdings are “anchored to windward” and invested in stable sectors, such as wireless communications, services, and health care. The wireless segment, for example, was one of very few industries that actually produced earnings growth in 2009, but because of its defensive characteristics it did not perform as well as many of the more speculative segments. We think the group has good long-term growth potential as more and more people let their land lines go and rely more on cell phones.
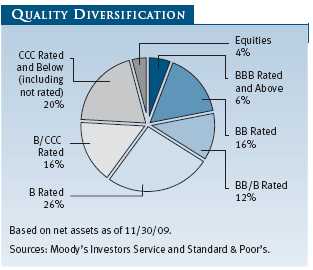
After playing defense in late 2008 and early 2009, we saw the environment improve radically, leading us to trim our exposure to bank loans and our highest-rated bonds. In the last six months, we’ve favored convertible bonds and lower-quality credits. CCC and defaulted issues were far and away the best performers in our market during the reporting period.
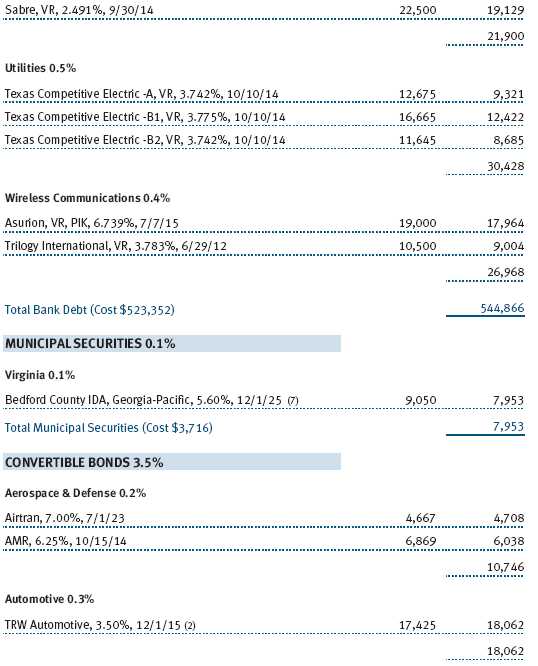
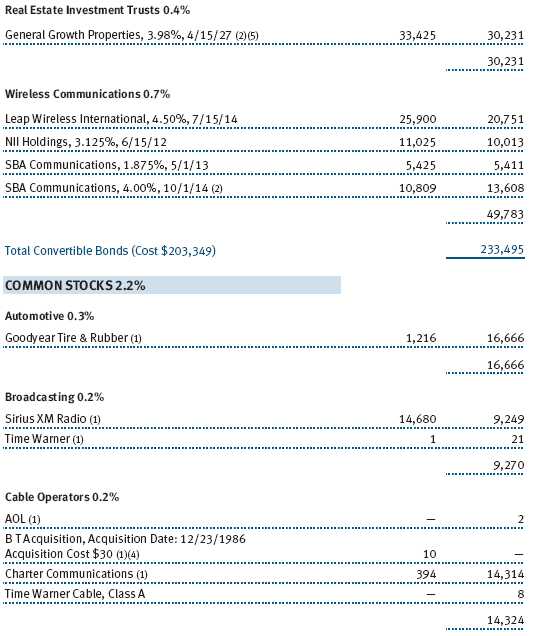
We purchased several defaulted bonds for their higher yield and appreciation potential, but we still hold significantly fewer default bonds than the benchmark index. A couple of our holdings are in the process of concluding their bankruptcy proceedings. One of our largest defaulted bond investments is General Growth Properties (GGP). The company has a unique collection of properties and malls, but it was forced to file for Chapter 11 bankruptcy protection in April this year. About five years ago, it issued debt to buy The Rouse Company. The purchase was done just before the peak in the real estate market, came at a premium price, and proved to be terrible in its timing. GGP had approximately $25 billion of debt that was coming due and was unable able to get financing to roll over the maturing debt. We were able to buy the company’s defaulted convertible bonds at 75% of par value that now trade at 95%. GGP could be an acquisition target for a much larger REIT with an investment-grade credit rating.
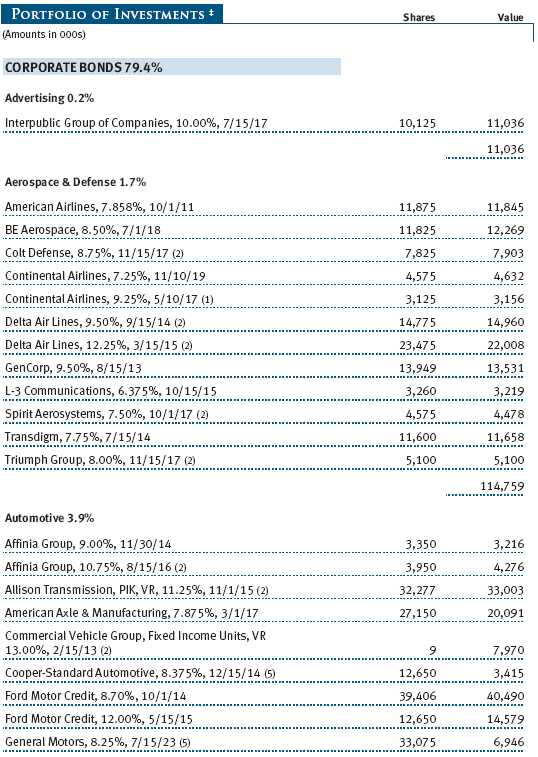
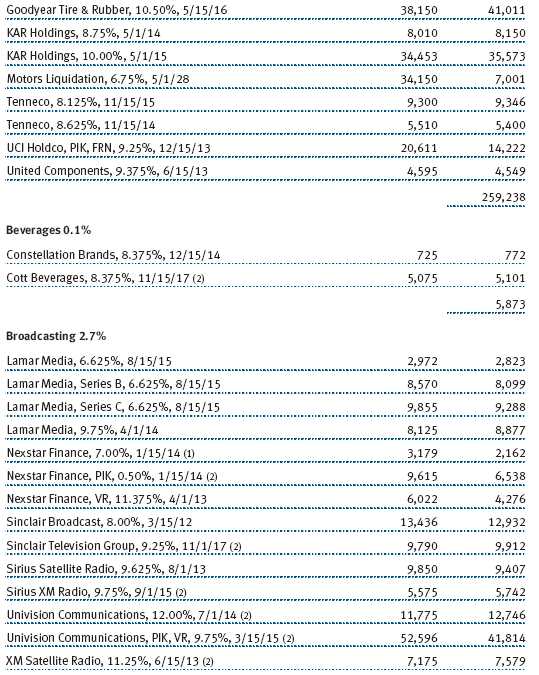
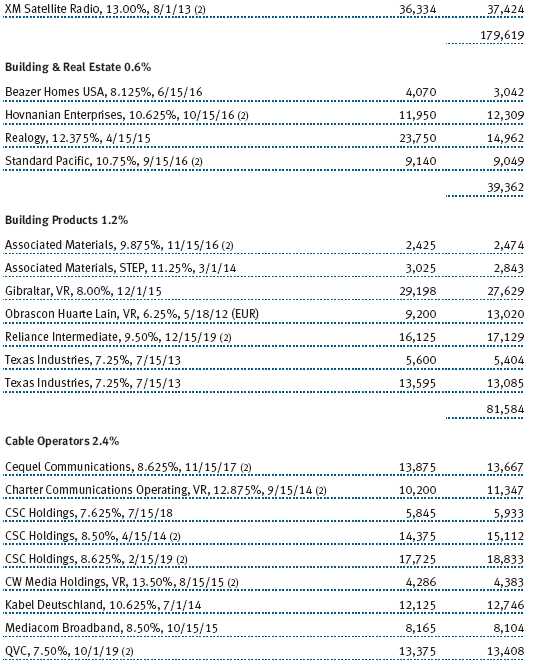
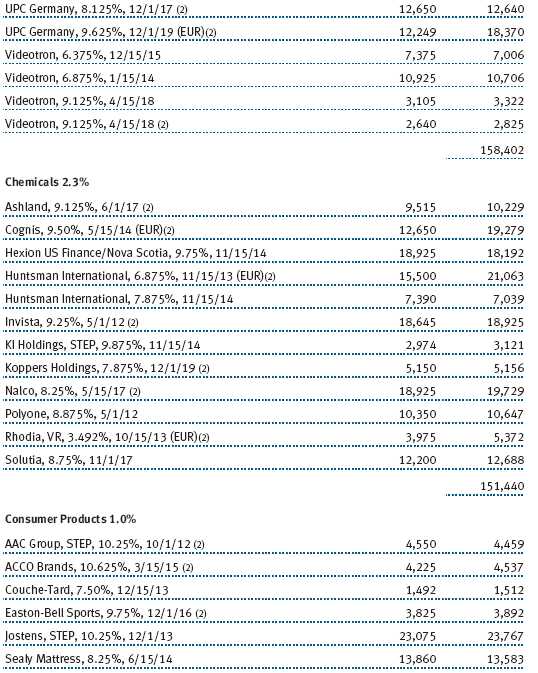
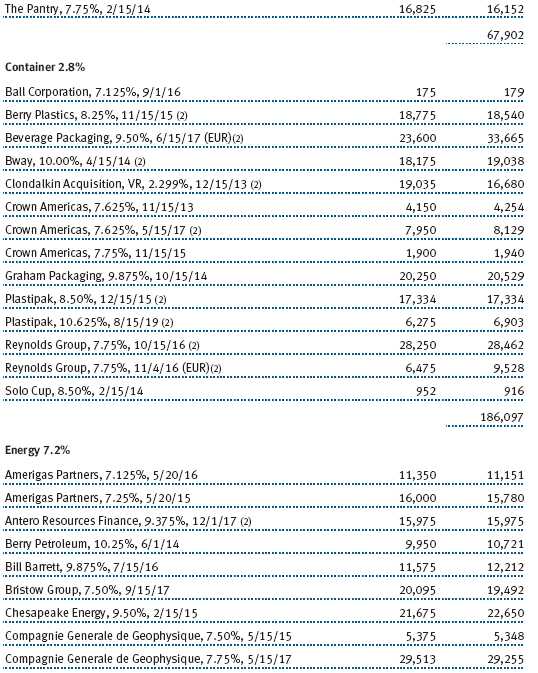
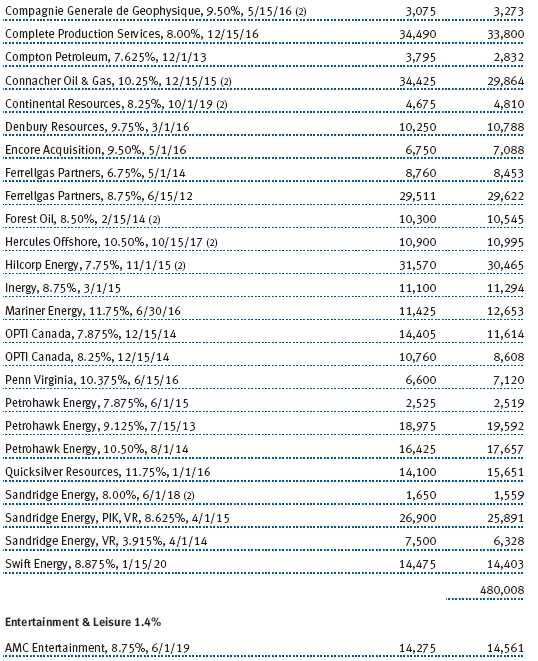
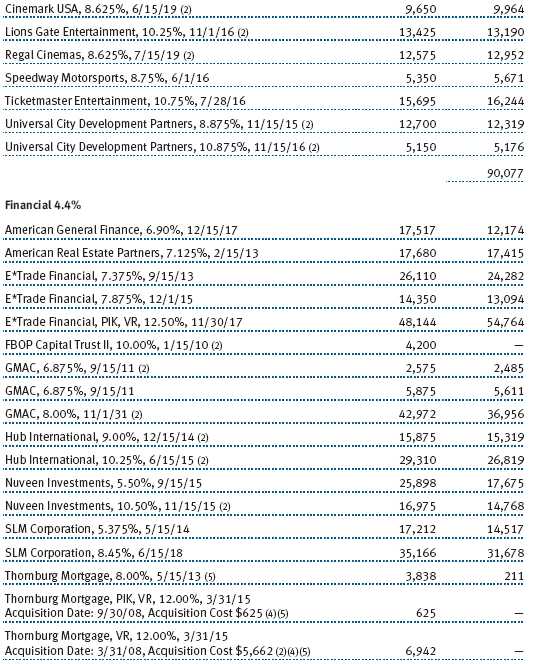
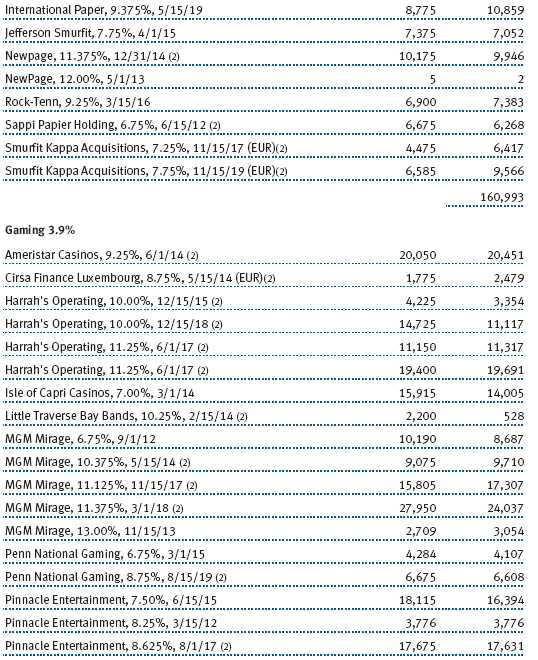
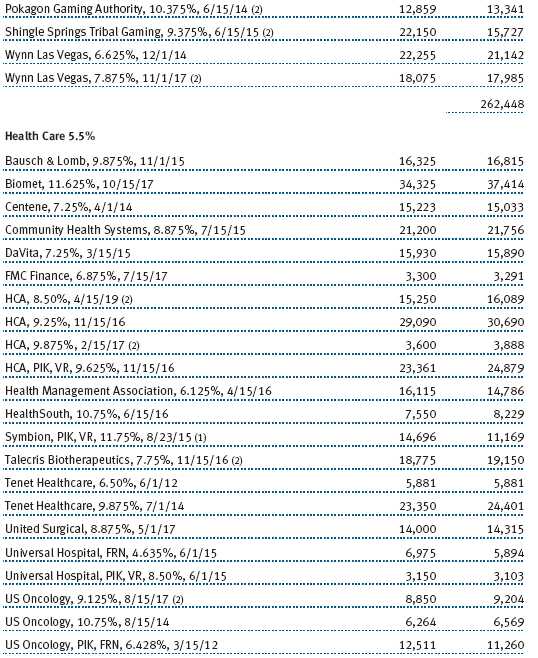
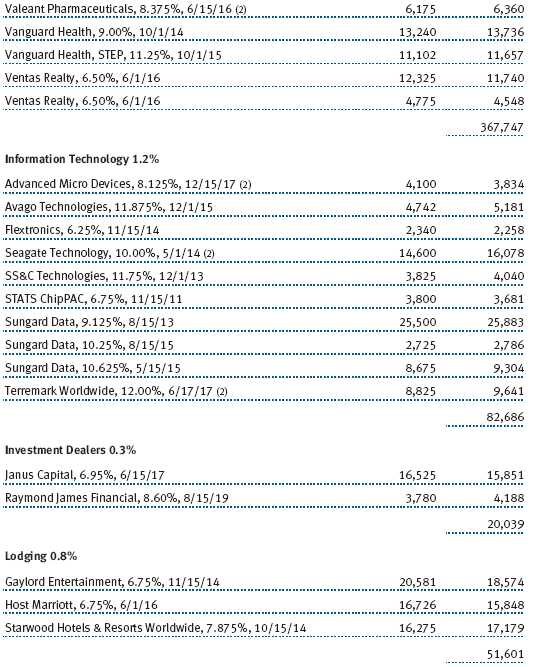
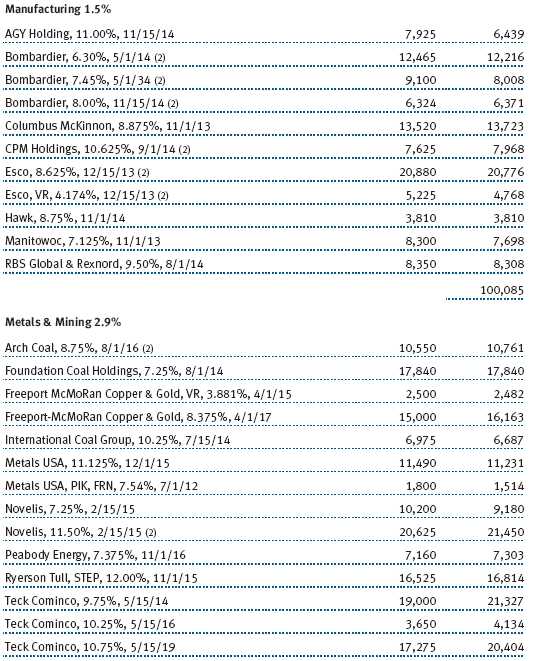
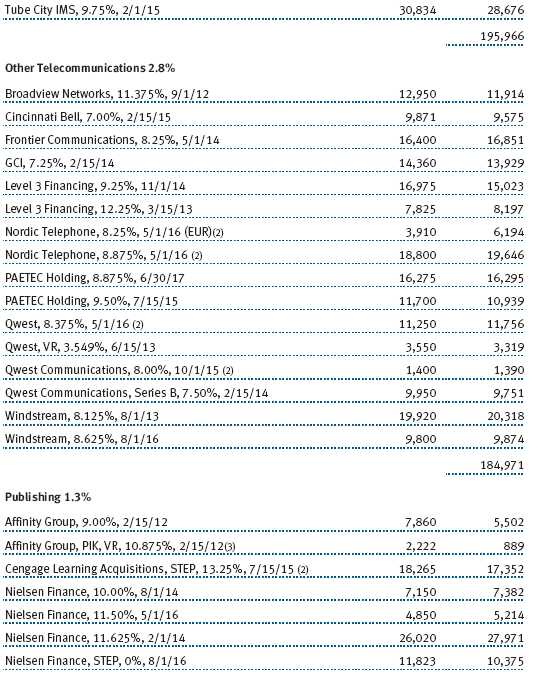
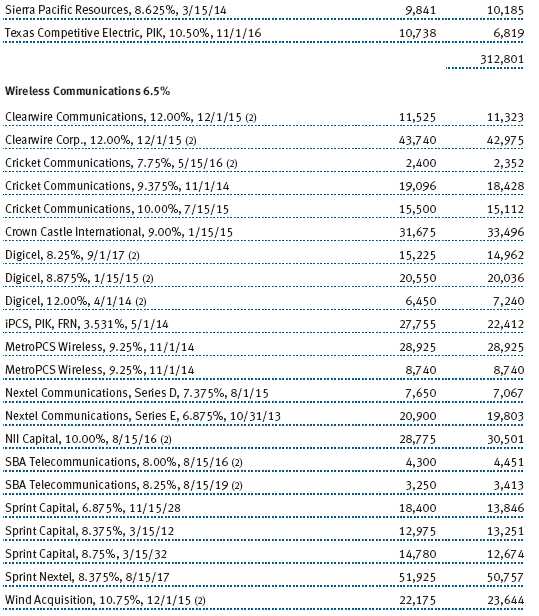
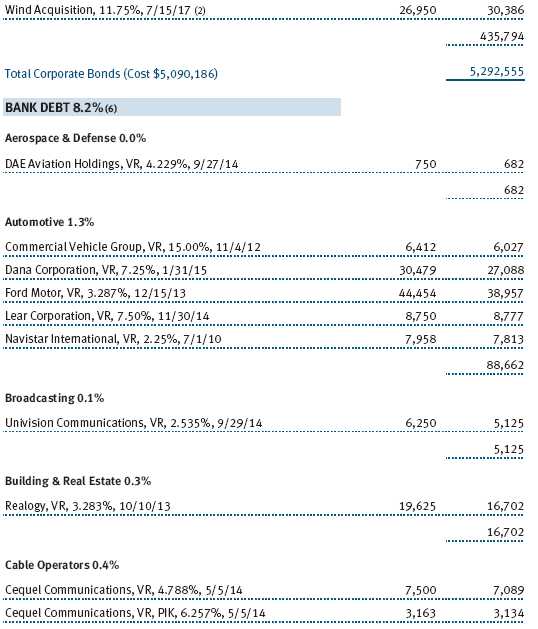
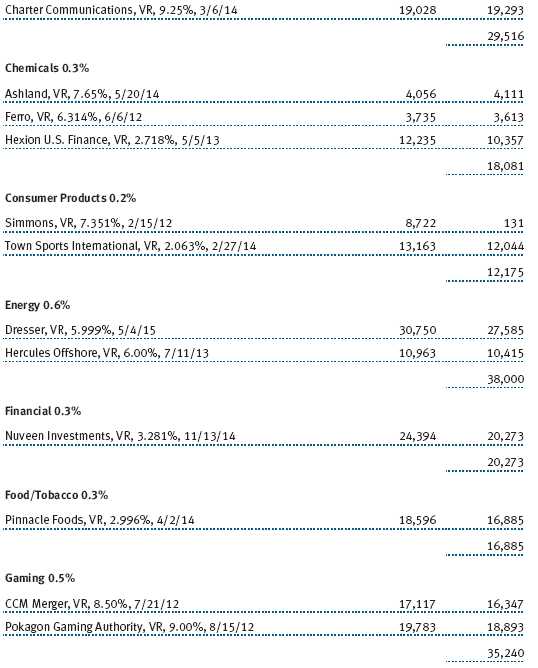
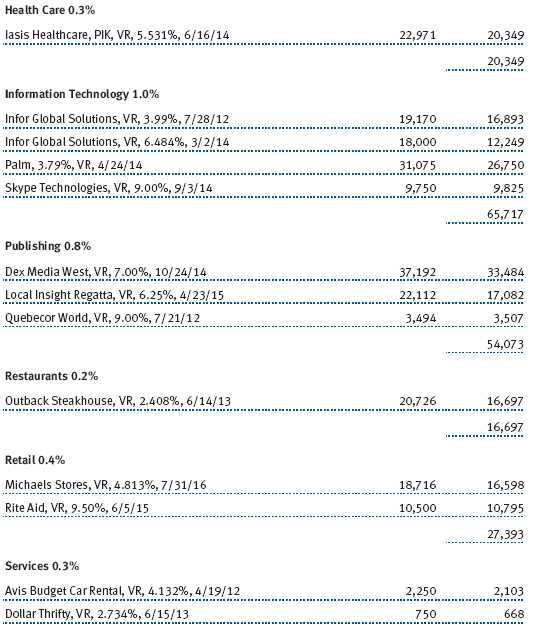
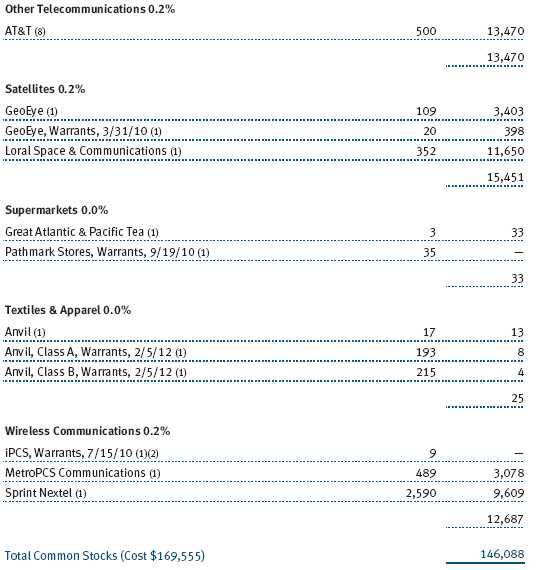
Although GGP bonds aren’t paying interest now, we expect to get full par value when the deal is completed or perhaps equity in the new capitalized company. (Please refer to the fund’s portfolio of investments for a complete listing of holdings and the amount each represents in the portfolio.)
We also own Stone Container bonds, purchased after its default, and we expect that they will be converted into equity through the bankruptcy process. We think that as the packaging/paperboard industry improves and pricing for containers gets better, the sector is poised for a strong rebound. We bought defaulted Charter Communication bonds earlier this year at 11 cents on the dollar. The company just emerged from bankruptcy and converted our bonds, which were trading at about twice what we paid, into common stock.
In the past six months, the fund’s 20 best holdings generated roughly one-third of our 19% gain for the six-month period. On the other side of the ledger, of our approximately 400 portfolio holdings, only six lost money. Our performance shortfall versus the benchmark index was almost entirely due to our lighter exposure to defaulted bonds, which generated about a 60% gain in the index.
SPECIAL SITUATIONS: CATERPILLARS THAT TURNED INTO BUTTERFLIES
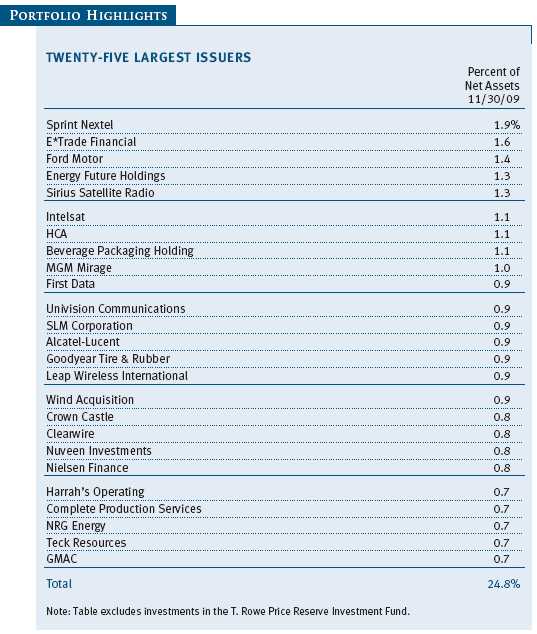
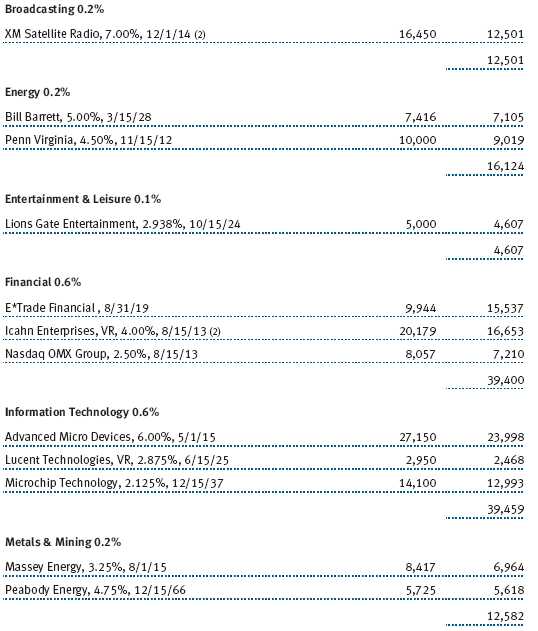
E*Trade Financial was far and away the portfolio’s best contributor for the past six months. The company operates as two divisions: the online brokerage business and a bank, which had massive subprime mortgage exposure. The bank was very distressed and the brokerage operation, which has a solid customer base and brand, was performing well. Our purchase of E*Trade 12.5% springing lien notes, which become senior to the company’s other debt under certain conditions, may be the best performer we have ever had in this fund. A portion of our position in the springing lien notes was subsequently converted into convertible securities. After the conversion, a lot of the cash flow pressure was removed from the company. We generated equity-like returns on the position—the E*Trade notes nearly tripled, and the convertibles almost doubled.
We worked extensively with T. Rowe Price’s equity analysts on E*Trade. We have already taken significant profits out of this position, which at one point represented more than 2% of the High Yield Fund’s portfolio. One of the factors in our decision to purchase the springing lien notes was that even if E*Trade went into bankruptcy, our investment likely would have been repaid at par because the springing lien covenant put us at the top of the company’s capitalization structure. The company’s banking operations are now much healthier, and there are rumors that E*Trade is an acquisition target for its valuable brokerage client base.
Information technology sector holdings also provided solid gains in the past six months, thanks largely to the performance of Advanced Micro Devices (AMD). AMD is the second-largest semiconductor manufacturer in the world behind Intel. However, a court ruling determined that Intel had engaged in anticompetitive practices in the industry. We bought the AMD convertible bonds, which had a 5.75% coupon, at about 45% of the face value for a current yield near 13%, while the two companies were doing battle in court. In October, Intel was found guilty of antitrust violations, and AMD was awarded a cash settlement of $1.2 billion. About one week later, AMD issued $500 million of new high yield bonds. The company decided to use its $1.7 billion cash stash to fund a tender offer for the convertible bonds. We bought the converts at 45% of par and sold at 99% for a 120% gain, and we earned a healthy 13% dividend while we waited.
OTHER NOTABLE CONTRIBUTORS AND DETRACTORS
Our holdings in the broadcasting segment performed well. Univision Communications was the portfolio’s second-best contributor. It is the leading Spanish-language broadcaster in Miami, Los Angeles, New York, and Chicago. The company, which owns a collection of premier TV and radio stations, was involved in a very aggressive leveraged buyout a couple of years ago. We think Univision has world-class assets and a deep and talented management team and can generate good growth and stable cash flow. We bought the bonds at 30% to 40% of par and they have approximately doubled. Additionally, we still hold some of the company’s bank debt.
Sirius Satellite Radio, which merged with XM Radio, was another strong performer. We believe that over the next 12 to 18 months the company’s cash flow is going to improve significantly. Although the bonds traded at about 20% of par value at one point, they are now trading above par. Not only do we own a large position in the bonds, we also bought nearly 15 million shares of the company’s common stock at prices averaging $0.45. At the end of the period, the stock traded at about $0.60 per share.
We will add equity exposure to the portfolio when we see a compelling opportunity. At the end of November, 3% of the fund was invested in common stocks and about 5% was invested in other equity-linked securities, mostly convertible bonds. Although modest, our equity exposure has generated large year-to-date gains for the portfolio—about an 80% return on common stock and about a 60% gain on our convertible bond holdings. Out-of-benchmark holdings, including equities, convertible bonds, bank debt, and floating rate notes are some of the ways we attempt to add extra performance and diversification to the portfolio.
CIT was among our largest detractors and one of only six issues that lost money in the six-month period. We took a small 0.25% position in CIT bonds maturing in 2010 at 75% of its par value in May. We thought the small business lender had sufficient liquidity, but it became clear, soon after we made the purchase, that the company’s fundamentals were much worse than we originally thought. We bit the bullet and sold the bonds at 60% of par in July, two months before the company went bankrupt. Our 20 largest detractors cost the fund 12 basis points of performance—the CIT purchase represented about 25% of the loss we incurred in the reporting period.
The team added two analysts over the past six months, one in Baltimore and another in London. We are investing in more European issues now than we have in the past. We want to be able to generate more in-depth analysis of global companies. We think that the European high yield market can grow and become another avenue for investment opportunities. For example, we have invested in a Polish vodka company, a South American meat processing business, and a British gaming operator. For the time being, they are smaller portfolio positions.
OUTLOOK
We did not think that the market would perform as well as it has since the end of May. The asset class surged in response to improving credit quality and rapidly declining default rate expectations. While investors remain concerned about the tepid economic recovery, high unemployment, excessive leverage on the part of consumers, and weak consumer spending, we think these fears are overblown as they relate to the high yield market. The majority of our companies are doing well, and many of them have taken strong measures to improve their financial positions. We believe the current trend is very powerful and will continue into 2010.
Why are we so bullish on high yield bonds? Here are a few of our reasons:
• There is ample funding for refinancing. Companies are able to extend the maturities on their debt coming due because the capital markets are again receptive to new lending. Earlier this year, only the highest-quality companies could borrow, but by midyear, lower-quality companies had access to new funds.
• Interest rates remain low. Most high yield companies are able to tap the bank debt markets and borrow at around Libor plus 3% (approximately 3.25%) and can issue bonds at 8% to 9%, which is a low rate.
• Companies have aggressively cut costs. That’s a double-edged sword because the unemployment rate is extremely high. However, existing workers have become much more productive, and it has led to significant improvement in operating margins.
• Companies have record amounts of cash on their balance sheets. We hold several companies, such as Alcatel-Lucent, that have more cash than debt. Abundant cash is a huge insurance policy for credit quality.
• Merger and acquisition activity is picking up. We expect to see several of our companies involved in takeovers, and generally the acquirers are investment-grade companies, which can lead to significant capital appreciation for the high yield bonds.
Another bullish factor is the strong cash flow into the high yield market. In the current low interest rate environment, investors are hungry for more income. This bodes well for our market because once the trend is in motion, it historically has lasted for several years. We expect additional refinancing activity, more new issuance, and the economic environment to slowly improve. The worry is that our market will overheat and run too far, too fast. However, we think that will not be a problem for the next six to nine months, and if the junk bond spread narrows considerably from here, we will start to shift the portfolio into more conservative, higher-quality investments.
The real wild card for the fund and the entire fixed income universe is rising interest rates. Most sophisticated investors believe that credit sectors are going to be the best place to invest in the fixed income market next year and that Treasuries and mortgages could face a tough stretch when rates move higher. Junk bonds have dramatically outperformed Treasuries in the last three rising interest rate cycles by an average of about 10 percentage points. In general, they tend to be a lot less sensitive to rate changes because they have shorter durations and are buttressed by higher coupons. (Of course, past performance does not guarantee future results.)
The high yield market has come a very long way in a rather short period of time. However, we expect your fund will continue to generate a strong income stream and can provide moderate capital appreciation. We believe the default risk in the portfolio remains low because of our conservative posturing and thorough research capabilities. As always, we pledge to continue to work diligently on your behalf.
Thank you for investing with T. Rowe Price.
Respectfully submitted,

Mark J. Vaselkiv
Chairman of the fund’s Investment Advisory Committee
December 10, 2009
The committee chairman has day-to-day responsibility for managing the portfolio and works with committee members in developing and executing the fund’s investment program.
RISKS OF BOND INVESTING
Bonds are subject to interest rate risk, the decline in bond prices that usually accompanies a rise in interest rates, and credit risk, the chance that any fund holding could have its credit rating downgraded or that a bond issuer will default (fail to make timely payments of interest or principal), potentially reducing the fund’s income level and share price. High yield corporate bonds could have greater price declines than funds that invest primarily in high-quality bonds. Companies issuing high yield bonds are not as strong financially as those with higher credit ratings, so the bonds are usually considered speculative investments.
GLOSSARY
30-day dividend yield: Dividends earned for the last 30 days of the period indicated are annualized and divided by the fund’s net asset value at the end of the period.
30-day SEC yield: A method of calculating a fund’s yield that assumes all portfolio securities are held until maturity. The Securities and Exchange Commission (SEC) requires all bond funds to calculate this yield. Yield will vary and is not guaranteed.
Credit Suisse High Yield Index: Tracks the performance of domestic noninvestment-grade corporate bonds.
Duration: The average time (expressed in years) needed for an investor to receive the present value of the future cash flows on a fixed income investment. It is used to measure a bond or bond fund’s sensitivity to interest rate changes. For example, a fund with a three-year duration would fall about 3% in price in response to a one-percentage-point increase in interest rates, and vice versa. Modified duration provides a more accurate estimate of the fund’s price sensitivity based solely on changes in real interest rates.
Lipper averages: Consist of all mutual funds in a particular category as tracked by Lipper Inc.
Weighted average maturity: The weighted average of the stated maturity dates of the portfolio’s securities. In general, the longer the average maturity, the greater the fund’s sensitivity to interest rate changes. A shorter average maturity usually means less interest rate sensitivity and therefore a less volatile portfolio.
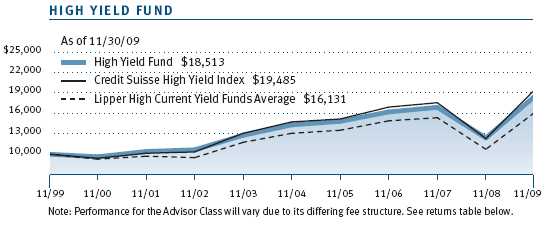
Performance and Expenses
This chart shows the value of a hypothetical $10,000 investment in the fund over the past 10 fiscal year periods or since inception (for funds lacking 10-year records). The result is compared with benchmarks, which may include a broad-based market index and a peer group average or index. Market indexes do not include expenses, which are deducted from fund returns as well as mutual fund averages and indexes.
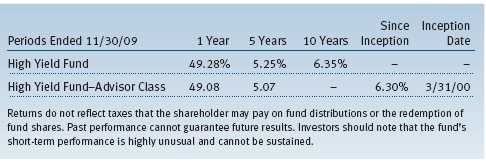
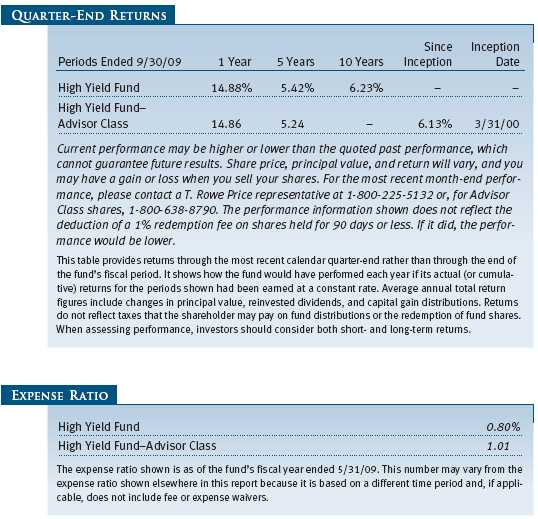
| AVERAGE ANNUAL COMPOUND TOTAL RETURN |
This table shows how the fund would have performed each year if its actual (or cumulative) returns for the periods shown had been earned at a constant rate.
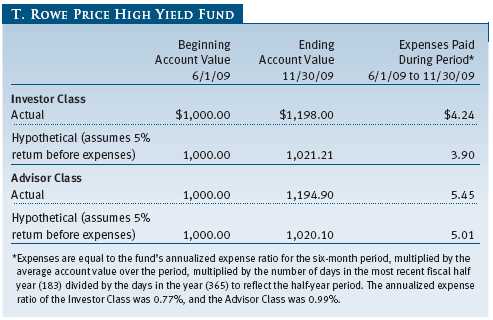
As a mutual fund shareholder, you may incur two types of costs: (1) transaction costs, such as redemption fees or sales loads, and (2) ongoing costs, including management fees, distribution and service (12b-1) fees, and other fund expenses. The following example is intended to help you understand your ongoing costs (in dollars) of investing in the fund and to compare these costs with the ongoing costs of investing in other mutual funds. The example is based on an investment of $1,000 invested at the beginning of the most recent six-month period and held for the entire period.
Please note that the fund has two share classes: The original share class (“investor class”) charges no distribution and service (12b-1) fee, and the Advisor Class shares are offered only through unaffiliated brokers and other financial intermediaries and charge a 0.25% 12b-1 fee. Each share class is presented separately in the table.
Actual Expenses
The first line of the following table (“Actual”) provides information about actual account values and expenses based on the fund’s actual returns. You may use the information in this line, together with your account balance, to estimate the expenses that you paid over the period. Simply divide your account value by $1,000 (for example, an $8,600 account value divided by $1,000 = 8.6), then multiply the result by the number in the first line under the heading “Expenses Paid During Period” to estimate the expenses you paid on your account during this period.
Hypothetical Example for Comparison Purposes
The information on the second line of the table (“Hypothetical”) is based on hypothetical account values and expenses derived from the fund’s actual expense ratio and an assumed 5% per year rate of return before expenses (not the fund’s actual return). You may compare the ongoing costs of investing in the fund with other funds by contrasting this 5% hypothetical example and the 5% hypothetical examples that appear in the shareholder reports of the other funds. The hypothetical account values and expenses may not be used to estimate the actual ending account balance or expenses you paid for the period.
Note: T. Rowe Price charges an annual small-account maintenance fee of $10, generally for accounts with less than $2,000 ($500 for UGMA/UTMA). The fee is waived for any investor whose T. Rowe Price mutual fund accounts total $25,000 or more, accounts employing automatic investing, and IRAs and other retirement plan accounts that utilize a prototype plan sponsored by T. Rowe Price (although a separate custodial or administrative fee may apply to such accounts). This fee is not included in the accompanying table. If you are subject to the fee, keep it in mind when you are estimating the ongoing expenses of investing in the fund and when comparing the expenses of this fund with other funds.
You should also be aware that the expenses shown in the table highlight only your ongoing costs and do not reflect any transaction costs, such as redemption fees or sales loads. Therefore, the second line of the table is useful in comparing ongoing costs only and will not help you determine the relative total costs of owning different funds. To the extent a fund charges transaction costs, however, the total cost of owning that fund is higher.
Unaudited
The accompanying notes are an integral part of these financial statements.
Unaudited
The accompanying notes are an integral part of these financial statements.
Unaudited

The accompanying notes are an integral part of these financial statements.
Unaudited
The accompanying notes are an integral part of these financial statements.
Unaudited
The accompanying notes are an integral part of these financial statements.
Unaudited
The accompanying notes are an integral part of these financial statements.
Unaudited
| NOTES TO FINANCIAL STATEMENTS |
T. Rowe Price High Yield Fund, Inc. (the fund), is registered under the Investment Company Act of 1940 (the 1940 Act) as a diversified, open-end management investment company. The fund seeks high current income and, secondarily, capital appreciation. The fund has two classes of shares: the High Yield Fund original share class, referred to in this report as the Investor Class, offered since December 31, 1984, and the High Yield Fund—Advisor Class (Advisor Class), offered since March 31, 2000. Advisor Class shares are sold only through unaffiliated brokers and other unaffiliated financial intermediaries that are compensated by the class for distribution, shareholder servicing, and/or certain administrative services under a Board-approved Rule 12b-1 plan. Each class has exclusive voting rights on matters related solely to that class; separate voting rights on matters that relate to both classes; and, in all other respects, the same rights and obligations as the other class.
NOTE 1 - SIGNIFICANT ACCOUNTING POLICIES
Basis of Preparation The accompanying financial statements were prepared in accordance with accounting principles generally accepted in the United States of America (GAAP), which require the use of estimates made by fund management. Fund management believes that estimates and security valuations are appropriate; however, actual results may differ from those estimates, and the security valuations reflected in the accompanying financial statements may differ from the value the fund ultimately realizes on the securities. Further, fund management believes that no events have occurred between November 30, 2009, the date of this report, and January 22, 2010, the date of issuance of the financial statements, that require adjustment of, or disclosure in, the accompanying financial statements.
Investment Transactions, Investment Income, and Distributions Income and expenses are recorded on the accrual basis. Premiums and discounts on debt securities are amortized for financial reporting purposes. Dividends received from mutual fund investments are reflected as dividend income; capital gain distributions are reflected as realized gain/loss. Dividend income and capital gain distributions are recorded on the ex-dividend date. Income tax-related interest and penalties, if incurred, would be recorded as income tax expense. Investment transactions are accounted for on the trade date. Realized gains and losses are reported on the identified cost basis. Paydown gains and losses are recorded as an adjustment to interest income. Distributions to shareholders are recorded on the ex-dividend date. Income distributions are declared by each class daily and paid monthly. Capital gain distributions, if any, are generally declared and paid by the fund, annually.
Currency Translation Assets, including investments, and liabilities denominated in foreign currencies are translated into U.S. dollar values each day at the prevailing exchange rate, using the mean of the bid and asked prices of such currencies against U.S. dollars as quoted by a major bank. Purchases and sales of securities, income, and expenses are translated into U.S. dollars at the prevailing exchange rate on the date of the transaction. The effect of changes in foreign currency exchange rates on realized and unrealized security gains and losses is reflected as a component of security gains and losses.
Class Accounting The Advisor Class pays distribution, shareholder servicing, and/or certain administrative expenses in the form of Rule 12b-1 fees, in an amount not exceeding 0.25% of the class’s average daily net assets. Shareholder servicing, prospectus, and shareholder report expenses incurred by each class are charged directly to the class to which they relate. Expenses common to both classes and investment income are allocated to the classes based upon the relative daily net assets of each class’s settled shares; realized and unrealized gains and losses are allocated based upon the relative daily net assets of each class’s outstanding shares.
Credits The fund earns credits on temporarily uninvested cash balances held at the custodian, which reduce the fund’s custody charges. Custody expense in the accompanying financial statements is presented before reduction for credits, which are reflected as expenses paid indirectly.
Redemption Fees A 1% fee is assessed on redemptions of fund shares held for 90 days or less to deter short-term trading and to protect the interests of long-term shareholders. Redemption fees are withheld from proceeds that shareholders receive from the sale or exchange of fund shares. The fees are paid to the fund and are recorded as an increase to paid-in capital. The fees may cause the redemption price per share to differ from the net asset value per share.
NOTE 2 - VALUATION
The fund’s investments are reported at fair value as defined under GAAP. The fund determines the values of its assets and liabilities and computes its net asset value per share at the close of the New York Stock Exchange (NYSE), normally 4 p.m. ET, each day that the NYSE is open for business.
Valuation Methods Debt securities are generally traded in the over-the-counter (OTC) market. Securities with remaining maturities of one year or more at the time of acquisition are valued at prices furnished by dealers who make markets in such securities or by an independent pricing service, which considers the yield or price of bonds of comparable quality, coupon, maturity, and type, as well as prices quoted by dealers who make markets in such securities. Securities with remaining maturities of less than one year at the time of acquisition generally use amortized cost in local currency to approximate fair value. However, if amortized cost is deemed not to reflect fair value or the fund holds a significant amount of such securities with remaining maturities of more than 60 days, the securities are valued at prices furnished by dealers who make markets in such securities or by an independent pricing service.
Equity securities listed or regularly traded on a securities exchange or in the OTC market are valued at the last quoted sale price or, for certain markets, the official closing price at the time the valuations are made, except for OTC Bulletin Board securities, which are valued at the mean of the latest bid and asked prices. A security that is listed or traded on more than one exchange is valued at the quotation on the exchange determined to be the primary market for such security. Listed securities not traded on a particular day are valued at the mean of the latest bid and asked prices for domestic securities and the last quoted sale price for international securities.
Investments in mutual funds are valued at the mutual fund’s closing net asset value per share on the day of valuation. Purchased and written options are valued at the mean of the closing bid and asked prices. Options on futures contracts are valued at the last sale price.
Other investments, including restricted securities, and those financial instruments for which the above valuation procedures are inappropriate or are deemed not to reflect fair value are stated at fair value as determined in good faith by the T. Rowe Price Valuation Committee, established by the fund’s Board of Directors.
Valuation Inputs Various inputs are used to determine the value of the fund’s financial instruments. These inputs are summarized in the three broad levels listed below:
Level 1 – quoted prices in active markets for identical securities
Level 2 – observable inputs other than Level 1 quoted prices (including, but not limited to, quoted prices for similar securities, interest rates, prepayment speeds, credit risk)
Level 3 – unobservable inputs
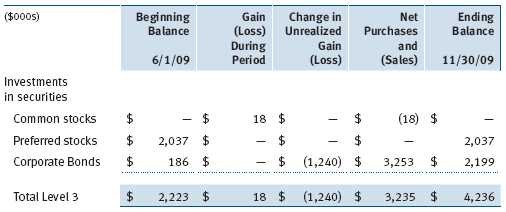
Observable inputs are those based on market data obtained from sources independent of the fund, and unobservable inputs reflect the fund’s own assumptions based on the best information available. The input levels are not necessarily an indication of the risk or liquidity associated with financial instruments at that level. The following table summarizes the financial instruments, based on the inputs used to determine their values on November 30, 2009:

Following is a reconciliation of the fund’s Level 3 holdings for the six months ended November 30, 2009. Gain (loss) reflects both realized and change in unrealized gain (loss) on Level 3 holdings during the period, if any, and is included on the accompanying Statement of Operations. The change in unrealized gain/loss on Level 3 instruments held at November 30, 2009, totaled $(1,240,000) for the six months ended November 30, 2009.
NOTE 3 - DERIVATIVE INSTRUMENTS
During the six months ended November 30, 2009, the fund invested in derivative instruments. As defined by GAAP, a derivative is a financial instrument whose value is derived from an underlying security price, foreign exchange rate, interest rate, index of prices or rates, or other variable; it requires little or no initial investment and permits or requires net settlement. The fund invests in derivatives only if the expected risks and rewards are consistent with its investment objectives, policies, and overall risk profile, as described in its prospectus and Statement of Additional Information. The fund may use derivatives for a variety of purposes, such as seeking to hedge against declines in principal value, increase yield, invest in an asset with greater efficiency and at a lower cost than is possible through direct investment, or to adjust portfolio duration and credit exposure. The risks associated with the use of derivatives are different from, and potentially much greater than, the risks associated with investing directly in the instruments on which the derivatives are based. Investments in derivatives can magnify returns positively or negatively; however, the fund at all times maintains sufficient cash reserves, liquid assets, or other SEC-permitted asset types to cover the settlement obligations under its open derivative contracts. During the six months ended November 30, 2009, the fund’s exposure to derivatives, based on underlying notional amounts, was generally between 0% and 1% of net assets.
The fund values its derivatives at fair value, as described below and in Note 2, and recognizes changes in fair value currently in its results of operations. Accordingly, the fund does not follow hedge accounting, even for derivatives employed as economic hedges.
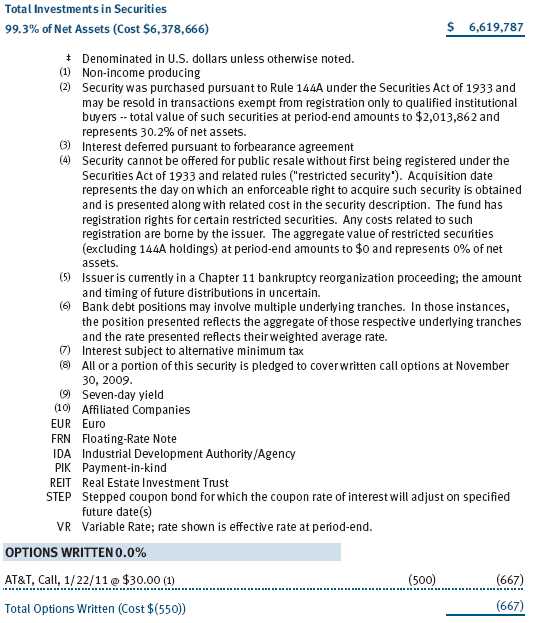
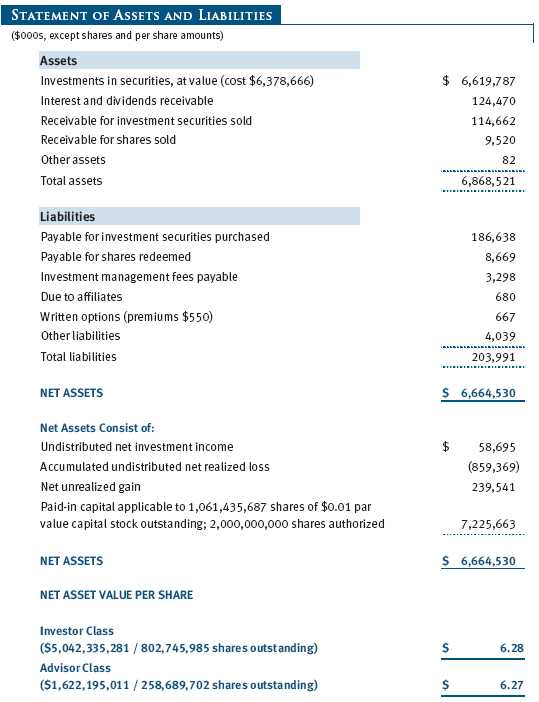
As of November 30, 2009, the fund held equity derivatives with a fair value of $667,000, included in Written Options, on the accompanying Statement of Assets and Liabilities.
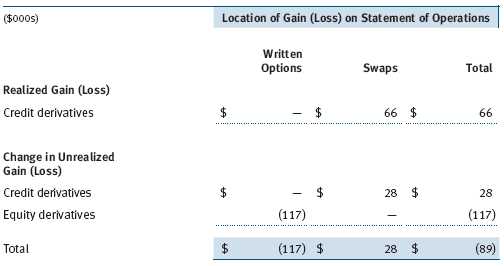
Additionally, the amount of gains and losses on derivative instruments recognized in fund earnings during the six months ended November 30, 2009 and the related location on the accompanying Statement of Operations is summarized in the following table by primary underlying risk exposure:
Counterparty risk related to exchange-traded derivatives, including futures and options contracts, is minimal because the exchange’s clearinghouse provides protection against defaults. Additionally, for exchange-traded derivatives, each broker, in its sole discretion, may change margin requirements applicable by the fund.
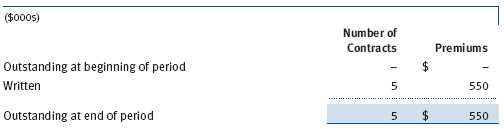
Options The fund is subject to equity price risk in the normal course of pursuing its investment objectives and uses options to help manage such risk. The fund may use call and put options to manage exposure to interest rates, security prices, foreign currencies, and credit quality; as an efficient means of adjusting exposure to all or a part of a target market; to enhance income; as a cash management tool; and/or to adjust portfolio duration and credit exposure. Call and put options give the holder the right, in return for a premium paid, to purchase or sell, respectively, a security at a specified exercise price at any time during the period of the option. Risks related to the use of options include possible illiquidity of the options markets; trading restrictions imposed by an exchange; movements in underlying security values; and for written options, potential losses in excess of the fund’s initial investment. Options are included in net assets at fair value; purchased options are included in Investments in Securities; and written options are separately reflected as a liability on the accompanying Statement of Assets and Liabilities. Premiums on unexercised, expired options are recorded as realized gains or losses; premiums on exercised options are recorded as an adjustment to the proceeds from the sale or cost of the purchase. The difference between the premium and the amount received or paid in a closing transaction is also treated as realized gain or loss. Risks related to the use of options include possible illiquidity of the options markets; trading restrictions imposed by an exchange; movements in underlying security values; and for written options, potential losses in excess of the fund’s initial investment. Transactions in written options and related premiums received during the six months ended November 30, 2009, were as follows:
Credit Default Swaps The fund is subject to credit risk in the normal course of pursuing its investment objectives and uses swap contracts to help manage such risk. The fund may use swaps in an effort to manage exposure to changes in interest rates and credit quality, to adjust overall exposure to certain markets, to enhance total return or protect the value of portfolio securities, to serve as a cash management tool, and/or to adjust portfolio duration or credit exposure. Credit default swaps are agreements where one party (the protection buyer) agrees to make periodic payments to another party (the protection seller) in exchange for protection against specified credit events, such as certain defaults and bankruptcies related to an underlying credit instrument, index, or issuer thereof. Upon occurrence of a specified credit event, the protection seller is required to pay the buyer the difference between the notional amount of the swap and the value of the underlying credit, either in the form of a net cash settlement or by paying the gross notional amount and accepting delivery of the relevant underlying credit. The value of a swap included in net assets is the unrealized gain or loss on the contract. Appreciated swaps are reflected as assets, and depreciated swaps are reflected as liabilities on the accompanying Statement of Assets and Liabilities. Net periodic receipts or payments required by swaps are accrued daily and are recorded as realized gain or loss for financial reporting purposes; fluctuations in the fair value of swaps are reflected in the change in net unrealized gain or loss and are reclassified to realized gain or loss upon termination prior to maturity or cash settlement. Risks related to the use of credit default swaps include the possible inability of the fund to accurately assess the current and future creditworthiness of underlying issuers, the possible failure of a counterparty to perform in accordance with the terms of the swap agreements, potential government regulation that could adversely affect the fund’s swap investments, and potential losses in excess of the fund’s initial investment.
Counterparty Risk and Collateral The fund has entered into collateral agreements with certain counterparties to mitigate counterparty risk associated with over-the-counter (OTC) derivatives, including swaps and forward currency exchange contracts. Subject to certain minimum exposure requirements (which range from $100,000 to $500,000), collateral generally is determined based on the net aggregate unrealized gain or loss on all OTC derivative contracts with a particular counterparty. Collateral, both pledged by and for the benefit of the fund, is held in a segregated account by a third-party agent and can be in the form of cash or debt securities issued by the U.S. government or related agencies. Securities posted as collateral by the fund are so noted in the accompanying Portfolio of Investments and remain in the fund’s net assets. As of November 30, 2009, no collateral was pledged by either the fund or counterparties.
The fund’s maximum risk of loss from counterparty credit risk on OTC derivatives is the aggregate unrealized gain on appreciated contracts in excess of any collateral pledged by the counterparty for the benefit of the fund. Counterparty risk related to exchange-traded futures and options contracts is minimal because the exchange’s clearinghouse provides protection against defaults. In accordance with standard derivatives agreements, counterparties to OTC derivatives may be able to terminate derivative contracts prior to maturity in the event the fund fails to maintain sufficient asset coverage; its net assets decline by stated percentages; or it otherwise fails to meet the terms of its agreements, which would cause the fund to accelerate payment of any net liability owed to the counterparty under the contract. For exchange-traded derivatives such as futures and options, each broker in its sole discretion may change margin requirements applicable to the fund.
NOTE 4 - OTHER INVESTMENT TRANSACTIONS
Consistent with its investment objective, the fund engages in the following practices to manage exposure to certain risks or to enhance performance. The investment objective, policies, program, and risk factors of the fund are described more fully in the fund’s prospectus and Statement of Additional Information.
Noninvestment-Grade Debt Securities At November 30, 2009, approximately 85% of the fund’s net assets were invested, either directly or through its investment in T. Rowe Price institutional funds, in noninvestment-grade debt securities, commonly referred to as “high yield” or “junk” bonds. The noninvestment-grade bond market may experience sudden and sharp price swings due to a variety of factors, including changes in economic forecasts, stock market activity, large sustained sales by major investors, a high-profile default, or a change in the market’s psychology. These events may decrease the ability of issuers to make principal and interest payments and adversely affect the liquidity or value, or both, of such securities.
Restricted Securities The fund may invest in securities that are subject to legal or contractual restrictions on resale. Prompt sale of such securities at an acceptable price may be difficult and may involve substantial delays and additional costs.
Bank Loans The fund may invest in bank loans, which represent interests in amounts owed by various borrowers to lenders or lending syndicates. A bank or other financial institution (lender) typically acts as agent for all holders and administers the bank loan in accordance with the credit agreement. Investments in bank loans may be in the form of loan assignments or loan participations. A loan assignment transfers direct ownership of all or a portion of specified third-party loans from the lender to the fund. Although loan assignments continue to be administered by the lender, the fund acquires direct rights against the borrower. In contrast, a loan participation generally entitles the fund to receive payments of principal, interest, and any fees that the lender is entitled to receive from the borrower; however, the lender continues to own and administer the loan. As a result, with loan participations, the fund generally has no right to enforce compliance with the terms of the credit agreement with the borrower, and the fund is subject to the credit risk of both the borrower and the lender.
Other Purchases and sales of portfolio securities other than short-term securities aggregated $2,550,059,000 and $2,536,564,000, respectively, for the six months ended November 30, 2009.
NOTE 5 - FEDERAL INCOME TAXES
No provision for federal income taxes is required since the fund intends to continue to qualify as a regulated investment company under Subchapter M of the Internal Revenue Code and distribute to shareholders all of its taxable income and gains. Distributions determined in accordance with federal income tax regulations may differ in amount or character from net investment income and realized gains for financial reporting purposes. Financial reporting records are adjusted for permanent book/tax differences to reflect tax character but are not adjusted for temporary differences. The amount and character of tax-basis distributions and composition of net assets are finalized at fiscal year-end; accordingly, tax-basis balances have not been determined as of November 30, 2009.
In accordance with federal tax regulations, the fund deferred recognition of certain capital loss amounts previously recognized in the prior fiscal year for financial reporting purposes until the current fiscal period for tax purposes. Such deferrals amounted to $408,711,000 and related to net capital losses realized between November 1 and the fund’s fiscal year-end date. Further, the fund intends to retain realized gains to the extent of available capital loss carryforwards. As of May 31, 2009, the fund had $614,856,000 of unused capital loss carryforwards, of which $138,022,000 expire in fiscal 2010, $108,310,000 expire in fiscal 2011, $20,540,000 expire in fiscal 2016, and $347,984,000 expire in fiscal 2017.
At November 30, 2009, the cost of investments for federal income tax purposes was $6,351,542,000. Net unrealized gain aggregated $266,665,000 at period-end, of which $472,420,000 related to appreciated investments and $205,755,000 related to depreciated investments.
NOTE 6 - RELATED PARTY TRANSACTIONS
The fund is managed by T. Rowe Price Associates, Inc. (the manager or Price Associates), a wholly owned subsidiary of T. Rowe Price Group, Inc. The investment management agreement between the fund and the manager provides for an annual investment management fee, which is computed daily and paid monthly. The fee consists of an individual fund fee, equal to 0.30% of the fund’s average daily net assets, and a group fee. The group fee rate is calculated based on the combined net assets of certain mutual funds sponsored by Price Associates (the group) applied to a graduated fee schedule, with rates ranging from 0.48% for the first $1 billion of assets to 0.285% for assets in excess of $220 billion. The fund’s group fee is determined by applying the group fee rate to the fund’s average daily net assets. At November 30, 2009, the effective annual group fee rate was 0.31%.
In addition, the fund has entered into service agreements with Price Associates and two wholly owned subsidiaries of Price Associates (collectively, Price). Price Associates computes the daily share prices and provides certain other administrative services to the fund. T. Rowe Price Services, Inc., provides shareholder and administrative services in its capacity as the fund’s transfer and dividend disbursing agent. T. Rowe Price Retirement Plan Services, Inc., provides subaccounting and recordkeeping services for certain retirement accounts invested in the Investor Class. For the six months ended November 30, 2009, expenses incurred pursuant to these service agreements were $73,000 for Price Associates; $555,000 for T. Rowe Price Services, Inc.; and $163,000 for T. Rowe Price Retirement Plan Services, Inc. The total amount payable at period-end pursuant to these service agreements is reflected as Due to Affiliates in the accompanying financial statements.
The fund is also one of several mutual funds sponsored by Price Associates (underlying Price funds) in which the T. Rowe Price Spectrum Funds (Spectrum Funds) and T. Rowe Price Retirement Funds (Retirement Funds) may invest. Neither the Spectrum Funds nor the Retirement Funds invest in the underlying Price funds for the purpose of exercising management or control. Pursuant to separate special servicing agreements, expenses associated with the operation of the Spectrum and Retirement Funds are borne by each underlying Price fund to the extent of estimated savings to it and in proportion to the average daily value of its shares owned by the Spectrum and Retirement Funds, respectively. Expenses allocated under these agreements are reflected as shareholder servicing expenses in the accompanying financial statements. For the six months ended November 30, 2009, the fund was allocated $803,000 of Spectrum Funds’ expenses and $1,506,000 of Retirement Funds’ expenses. Of these amounts, $1,535,000 related to services provided by Price. The amount payable at period-end pursuant to this agreement is reflected as Due to Affiliates in the accompanying financial statements. At November 30, 2009, approximately 20% of the outstanding shares of the Investor Class were held by the Spectrum Funds and 20% were held by the Retirement Funds.
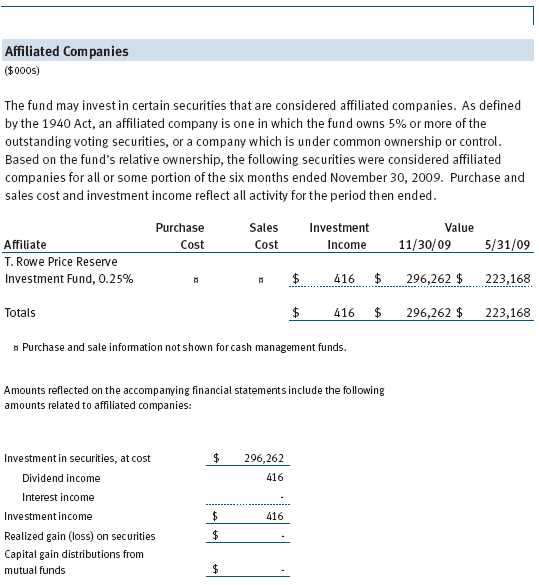
The fund may invest in the T. Rowe Price Reserve Investment Fund and the T. Rowe Price Government Reserve Investment Fund (collectively, the T. Rowe Price Reserve Investment Funds), open-end management investment companies managed by Price Associates and considered affiliates of the fund. The T. Rowe Price Reserve Investment Funds are offered as cash management options to mutual funds, trusts, and other accounts managed by Price Associates and/or its affiliates and are not available for direct purchase by members of the public. The T. Rowe Price Reserve Investment Funds pay no investment management fees.
| INFORMATION ON PROXY VOTING POLICIES, PROCEDURES, AND RECORDS |
A description of the policies and procedures used by T. Rowe Price funds and portfolios to determine how to vote proxies relating to portfolio securities is available in each fund’s Statement of Additional Information, which you may request by calling 1-800-225-5132 or by accessing the SEC’s Web site, www.sec.gov. The description of our proxy voting policies and procedures is also available on our Web site, www.troweprice.com. To access it, click on the words “Our Company” at the top of our corporate homepage. Then, when the next page appears, click on the words “Proxy Voting Policies” on the left side of the page.
Each fund’s most recent annual proxy voting record is available on our Web site and through the SEC’s Web site. To access it through our Web site, follow the directions above, then click on the words “Proxy Voting Records” on the right side of the Proxy Voting Policies page.
| HOW TO OBTAIN QUARTERLY PORTFOLIO HOLDINGS |
The fund files a complete schedule of portfolio holdings with the Securities and Exchange Commission for the first and third quarters of each fiscal year on Form N-Q. The fund’s Form N-Q is available electronically on the SEC’s Web site (www.sec.gov); hard copies may be reviewed and copied at the SEC’s Public Reference Room, 450 Fifth St. N.W., Washington, DC 20549. For more information on the Public Reference Room, call 1-800-SEC-0330.
Item 2. Code of Ethics.
A code of ethics, as defined in Item 2 of Form N-CSR, applicable to its principal executive officer, principal financial officer, principal accounting officer or controller, or persons performing similar functions is filed as an exhibit to the registrant’s annual Form N-CSR. No substantive amendments were approved or waivers were granted to this code of ethics during the registrant’s most recent fiscal half-year.
Item 3. Audit Committee Financial Expert.
Disclosure required in registrant’s annual Form N-CSR.
Item 4. Principal Accountant Fees and Services.
Disclosure required in registrant’s annual Form N-CSR.
Item 5. Audit Committee of Listed Registrants.
Not applicable.
Item 6. Investments.
(a) Not applicable. The complete schedule of investments is included in Item 1 of this Form N-CSR.
(b) Not applicable.
Item 7. Disclosure of Proxy Voting Policies and Procedures for Closed-End Management Investment Companies.
Not applicable.
Item 8. Portfolio Managers of Closed-End Management Investment Companies.
Not applicable.
Item 9. Purchases of Equity Securities by Closed-End Management Investment Company and Affiliated Purchasers.
Not applicable.
Item 10. Submission of Matters to a Vote of Security Holders.
Not applicable.
Item 11. Controls and Procedures.
(a) The registrant’s principal executive officer and principal financial officer have evaluated the registrant’s disclosure controls and procedures within 90 days of this filing and have concluded that the registrant’s disclosure controls and procedures were effective, as of that date, in ensuring that information required to be disclosed by the registrant in this Form N-CSR was recorded, processed, summarized, and reported timely.
(b) The registrant’s principal executive officer and principal financial officer are aware of no change in the registrant’s internal control over financial reporting that occurred during the registrant’s second fiscal quarter covered by this report that has materially affected, or is reasonably likely to materially affect, the registrant’s internal control over financial reporting.
Item 12. Exhibits.
(a)(1) The registrant’s code of ethics pursuant to Item 2 of Form N-CSR is filed with the registrant’s annual Form N-CSR.
(2) Separate certifications by the registrant's principal executive officer and principal financial officer, pursuant to Section 302 of the Sarbanes-Oxley Act of 2002 and required by Rule 30a-2(a) under the Investment Company Act of 1940, are attached.
(3) Written solicitation to repurchase securities issued by closed-end companies: not applicable.
(b) A certification by the registrant's principal executive officer and principal financial officer, pursuant to Section 906 of the Sarbanes-Oxley Act of 2002 and required by Rule 30a-2(b) under the Investment Company Act of 1940, is attached.
| | |
SIGNATURES |
| |
| | Pursuant to the requirements of the Securities Exchange Act of 1934 and the Investment |
| Company Act of 1940, the registrant has duly caused this report to be signed on its behalf by the |
| undersigned, thereunto duly authorized. |
| |
| T. Rowe Price High Yield Fund, Inc. |
| |
| |
| |
| By | /s/ Edward C. Bernard |
| | Edward C. Bernard |
| | Principal Executive Officer |
| |
| Date | January 22, 2010 |
| |
| |
| |
| | Pursuant to the requirements of the Securities Exchange Act of 1934 and the Investment |
| Company Act of 1940, this report has been signed below by the following persons on behalf of |
| the registrant and in the capacities and on the dates indicated. |
| |
| |
| By | /s/ Edward C. Bernard |
| | Edward C. Bernard |
| | Principal Executive Officer |
| |
| Date | January 22, 2010 |
| |
| |
| |
| By | /s/ Gregory K. Hinkle |
| | Gregory K. Hinkle |
| | Principal Financial Officer |
| |
| Date | January 22, 2010 |