UNITED STATES
SECURITIES AND EXCHANGE COMMISSION
Washington, D.C. 20549
FORM N-CSR
CERTIFIED SHAREHOLDER REPORT OF REGISTERED
MANAGEMENT INVESTMENT COMPANIES
Investment Company Act File Number: 811-4119
| T. Rowe Price High Yield Fund, Inc. |
| (Exact name of registrant as specified in charter) |
| 100 East Pratt Street, Baltimore, MD 21202 |
| (Address of principal executive offices) |
| David Oestreicher |
| 100 East Pratt Street, Baltimore, MD 21202 |
| (Name and address of agent for service) |
Registrant’s telephone number, including area code: (410) 345-2000
Date of fiscal year end: May 31
Date of reporting period: November 30, 2011
Item 1. Report to Shareholders
 |
| High Yield Fund | November 30, 2011 |
The views and opinions in this report were current as of November 30, 2011. They are not guarantees of performance or investment results and should not be taken as investment advice. Investment decisions reflect a variety of factors, and the managers reserve the right to change their views about individual stocks, sectors, and the markets at any time. As a result, the views expressed should not be relied upon as a forecast of the fund’s future investment intent. The report is certified under the Sarbanes-Oxley Act, which requires mutual funds and other public companies to affirm that, to the best of their knowledge, the information in their financial reports is fairly and accurately stated in all material respects.
REPORTS ON THE WEB
Sign up for our E-mail Program, and you can begin to receive updated fund reports and prospectuses online rather than through the mail. Log in to your account at troweprice.com for more information.
Manager’s Letter
Fellow Shareholders
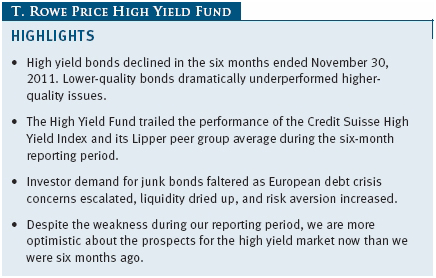
High yield bonds were volatile and sharply lower during the past six months in what several market pundits have called a “risk-on/risk-off” market environment. Riskier assets vacillated on every piece of news about the sovereign debt crisis, which threatens to destabilize markets around the globe. Below investment-grade companies declined despite generally favorable corporate earnings results, low default rate expectations, and improving balance sheet strength. We believe that the companies in our sector of the market are performing well and remain fundamentally strong.
PORTFOLIO PERFORMANCE
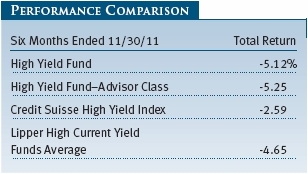
The High Yield Fund posted a loss for the six months ended November 30, 2011, underperforming its Credit Suisse benchmark and the Lipper peer group average. Junk bonds were among the weakest-performing fixed income asset classes, due in part to negative sentiment associated with risk assets, while long-maturity Treasuries generated the best returns. Our underperformance versus the Credit Suisse High Yield Index was largely due to credit selection, an overweight allocation to lower-quality bonds, and positions in equity-linked securities. From an industry perspective, the forest products and transportation segments generated good relative performance, while several of our largest sectors, including wireless communications, information technology, financials, and energy, were significant detractors. Results for the Advisor Class varied slightly, reflecting its different fee structure.
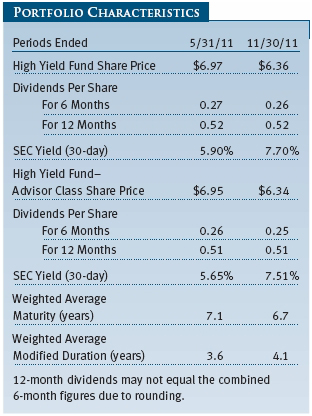
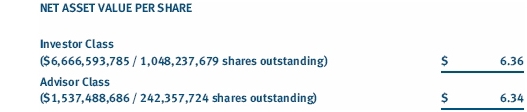
The fund’s share price fell over the past six months to $6.36 from $6.97 at the end of May. The portfolio generated $0.26 of dividend income since the end of May, a penny less than in the prior six-month period. However, because of the share price decline, the fund’s 30-day SEC yield climbed to 7.7% at the end of the reporting period from 5.9% at the end of May.
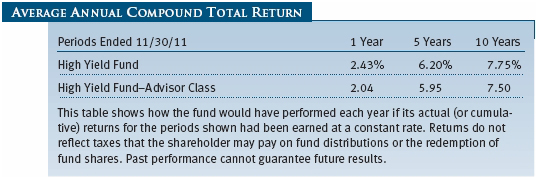
The High Yield Fund’s returns compare favorably with those of its peer group, especially over longer periods. Lipper ranked the fund in the top quartile of its high current yield funds universe for the 5- and 10-year periods ended November 30, 2011. (Based on cumulative total return, Lipper ranked the High Yield Fund 290 of 489, 80 of 349, and 50 of 236 funds in the high current yield bond funds category for the 1-, 5-, and 10-year periods ended November 30, 2011, respectively. Results will vary for other periods. Past performance cannot guarantee future results.)
MARKET ENVIRONMENT
We would describe the last six months as a “perfect storm” of three intense negative events converging on the high yield market, leading to the toughest environment for our asset class since the second half of 2008. These negative developments were unrelated to the high yield market but intensified simultaneously to create an unfavorable climate for junk bonds.
The first all-over-the-news event was the European sovereign debt crisis that threatens to destabilize markets around the globe. It is a much different and potentially more serious situation than we faced in 2008 after Lehman Brothers collapsed, which was largely a domestic debt issue. However, as headlines about the European debt crisis worsened, stocks and higher-risk assets worldwide sold off sharply. When good news emerged, these assets rallied. For example, in August, September, and November, riskier assets tumbled, referred to as a “risk-off” market. When the switch was flipped to “risk-on” in October, markets around the globe surged. The tug-of-war between fear and greed has created extreme volatility and caused investors to lose confidence in investing. Market participants remain worried that the sovereign debt crisis will spread from the peripheral nations to Europe’s larger “core” countries (including Italy and Spain) and could lead to a breakup of the eurozone or destabilize the U.S. financial system. Optimism again returned to credit markets at the end of the reporting period following the announcement of an agreement reached by several major central banks to provide liquidity to the European financial system by offering lower-cost, short-term lending.
The second unfavorable event was investor uncertainty stemming from U.S. political gridlock, the ballooning federal deficit, and raising the U.S. debt ceiling. The bipartisan inability to deal with the serious issues facing our nation reflects Washington’s lack of foresight, responsibility, and courage. In November, the Congressional deficit reduction “super committee” announced its failure to reach an agreement, seemingly setting the stage for drastic cuts to both military and domestic spending starting in January 2013. The only immediate repercussion, however, appeared to be a warning from Fitch Ratings that it would follow Standard & Poor’s lead in downgrading the U.S. government’s long-term credit rating if a budget deal was not forthcoming in 2012. In addition, a series of lackluster economic data were released, especially in the beginning of our reporting period. However, data in October showed improvements in job growth, and despite the turmoil and banking stresses in Europe, the U.S. economy has been fairly resilient.
The third circumstance was a lack of liquidity through the late summer months. August is typically characterized by thin trading volumes, but the reluctance of Wall Street dealers to commit capital to facilitate trading was particularly pronounced from the end of the summer through November. The broker-dealers who provide liquidity and maintain orderly trading flow in high yield securities, investment-grade bonds, and bank loans have trimmed their inventories due to uncertain market conditions and heightened regulations. Record high yield fund redemptions during the third quarter, followed by large inflows in October, made the market’s moves all-the-more dramatic and amplified the market’s volatility.
Despite these events, the vast majority of companies in our asset class now have stronger balance sheets and less leverage than they did in 2008. These companies have also made strides in extending their maturity profiles, resulting in less concern about debt coming due and refinancing in the next two years. The positive fundamentals are in stark contrast with how the high yield market actually traded during our reporting period.
PORTFOLIO REVIEW
Six months ago, we held a significant allocation in lower-quality positions. The decision hurt our absolute and relative returns because high-quality bonds vastly outperformed lower-rated securities. We positioned the fund believing the economy would strengthen and purchased lower-quality credits based on the improving fundamental characteristics. While we maintain a positive view on many of these companies, deteriorating investor sentiment and our overweight allocation hurt results.
WHAT WENT WRONG?
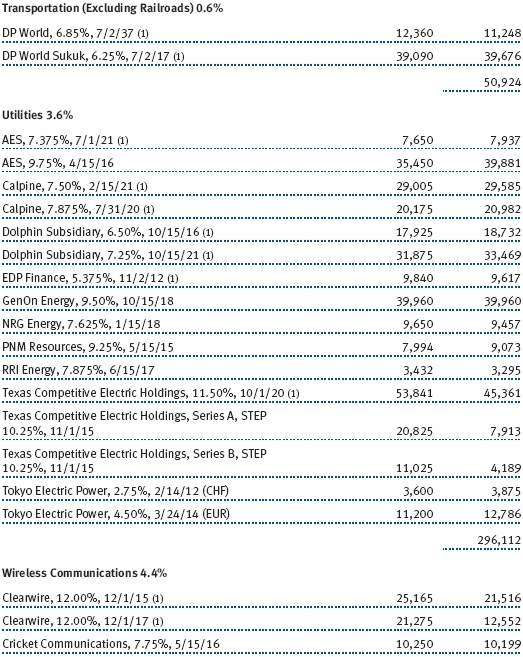
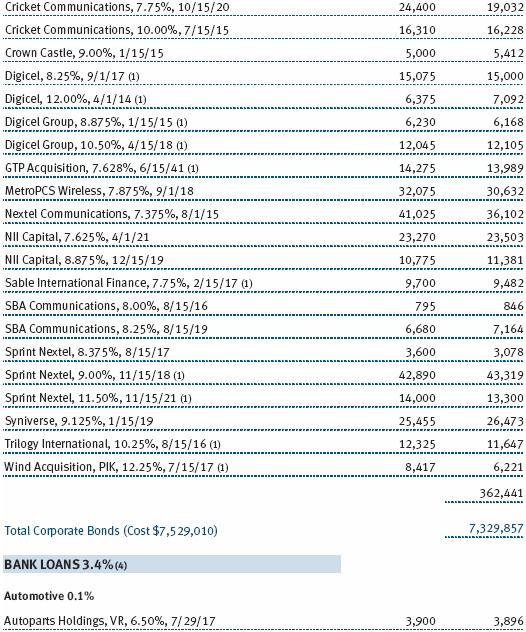
We have repeatedly asserted that we view the wireless communications industry as a stable, defensive segment because of its steady cash flow generation, but this period was an exception. The wireless segment was the fund’s largest detractor due to a combination of poor performance and our overweight allocation. Several of the fallen angels (formerly investment-grade rated companies) we addressed in our last letter endured a tough six-month stretch. Sprint Nextel, for example, unexpectedly signed an agreement with Apple to buy millions of iPhones. The deal represents a huge expenditure that will hurt profit margins and the company’s previously healthy cash flow. Sprint competes for market share with AT&T and Verizon and it is now gaining subscribers, but bondholders were not happy with the company’s new initiative. (Please refer to the fund’s portfolio of investments for a complete list of holdings and the amount each represents in the portfolio.)
A second factor that hurt our Sprint holdings was uncertainty surrounding its 50% ownership interest in Clearwire, which built the first 4G network in the U.S. The company’s mobile broadband network covers 70 of the top U.S. markets, and it owns valuable spectrum allowing wireless companies to offer enhanced capabilities such as high-speed data transmission and video. The pair had been involved in challenging negotiations regarding their future relationship and Clearwire’s need for additional funding, which came to a head late in the period. Clearwire’s bonds declined roughly 40 points when it appeared that Sprint was going to walk away from the partnership and investors feared that it might miss a December coupon payment. While an 11th-hour deal with Sprint allowed Clearwire to avoid defaulting, the bonds we held were among our largest detractors.
The situation with Sprint and Clearwire is improving, and the bonds have appreciated now that the negotiations have been resolved. Sprint raised several billion dollars from the sale of new debt securities, alleviating some of the immediate concerns about its cash flow and funding status. In previous shareholder letters, we touted Sprint as an upgrade candidate, but following the announcement of the additional capital expenditures, Sprint’s credit rating was downgraded to B from BB. We had not anticipated the aggressive growth strategy it unveiled in the fourth quarter. At this time, we are confident that Clearwire is not going to default on its bonds. The company was able to raise capital via an equity offering, and it will likely raise more capital from additional bond offerings in the near future.
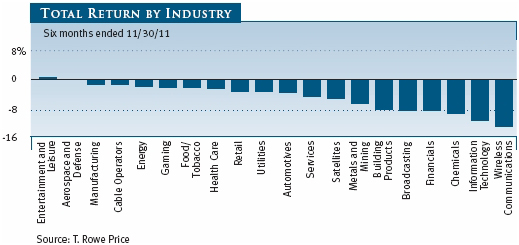
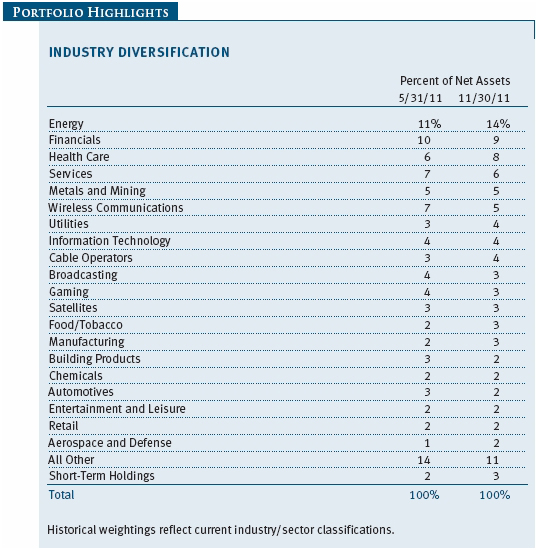
As shown in the Total Return by Industry chart, there were very few industries in the high yield universe that performed well during the past six months. Entertainment and leisure and the aerospace and defense segments were the only two positive performers among our 20 largest industry allocations. On the flip side, a handful of industry groups declined 8% or more. The size of our allocations to these segments is shown in the table on page 12.
The information technology (IT) sector was the portfolio’s second-largest detractor during the past six months. Alcatel-Lucent preferred stock traded like a security that would be refinanced for most of the year, but the shares sold off sharply when risk aversion took hold. Alcatel is a world-class technology solutions provider and a leader in wireless services and applications, which remains a healthy industry globally. European debt concerns hurt the French company, which had more cash than debt, but our shares traded down about 40% as if the company were going bankrupt. We held a large position because the economy and Alcatel’s business appeared to be growing, its fundamentals were solid, and we liked the appreciation potential in the equity-linked securities. However, yields across the high yield market rose in November, and our Alcatel holdings tumbled.
Avaya was another large detractor in the IT segment. Like Alcatel, Avaya has a good business model and was a leveraged buyout (LBO) in the technology services segment a few years ago. The company’s bonds traded near par for most of this year as an initial public offering seemed likely in the near future. However, when the high yield market cratered in the third quarter, the company’s CCC rated credits fell almost 30%. Although they recovered more than half of the loss by the end of our reporting period, the significant size of the position hurt our results.
Both IT and wireless communications were detractors in the past six months. We remain upbeat on the prospects for Alcatel and Avaya and maintain that Sprint will be a long-term winner. Our position in Clearwire was a special situation, and we have pared our exposure to its bonds. In reviewing our performance over the past six months, we note that many of our major detractors were large, lower-quality LBOs in recent years. Many of these credits drove the fund’s positive results in prior periods, but given the market environment, we should have decreased our exposure to these holdings earlier in the year.
We remain comfortable with the fundamental underpinnings for the vast majority of our holdings. However, we have right-sized many of our lower-quality positions due to the increased volatility. Six months ago, we were nearly as aggressively positioned as we had been all year. We had approximately 35% of the fund in bonds rated BB and above, and at the end of this reporting period, we had increased that allocation to almost 40%. On the other end of the spectrum, we have also reduced our most-aggressive holdings. In May 2011, we had more than 21% of the portfolio invested in CCC rated bonds and equities, and we systematically reduced that exposure to approximately 16% at the end of November. We were able to sell many of our lower-rated positions into strength during the risk-on strong periods, and we monitored cash levels so that we were not forced to sell when the market experienced sharp sell-offs.

WHAT WORKED WELL
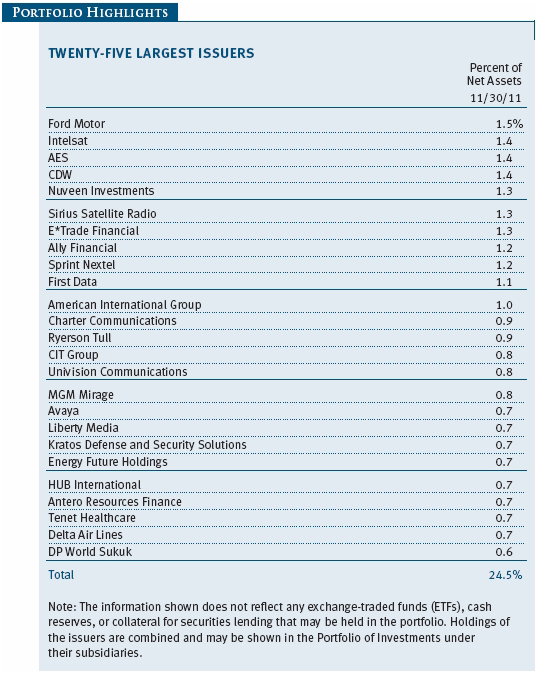
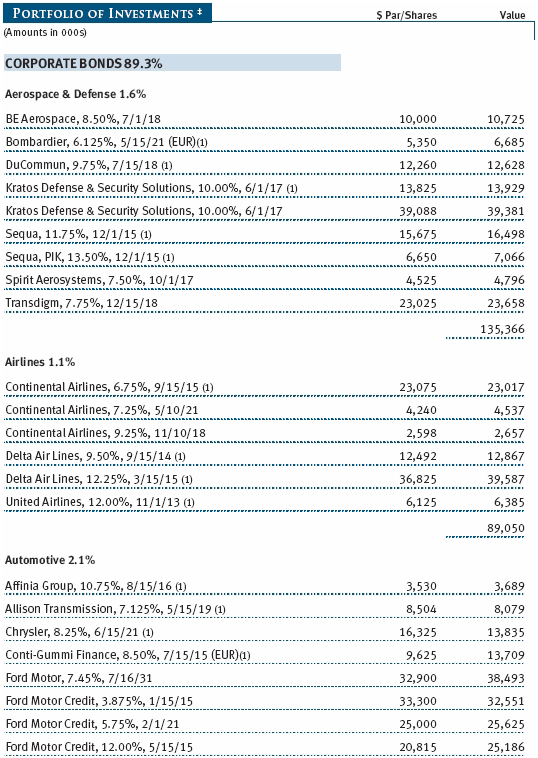
A negative overall high yield environment and our positioning resulted in fewer outstanding contributors than has been the case in recent reporting periods. Ford Motor continued to perform well, and its credit rating has increased to the cusp of investment grade. We believe that its bonds could be upgraded in the near term because the company now has more cash than debt. Sirius Satellite Radio was another standout performer and, like Ford, its BB rated bonds are positioned to get upgraded in the not-too-distant future. On every front, Sirius appears to be executing flawlessly. AES, also a top holding, is a global power company with generation and distribution businesses that performed well.
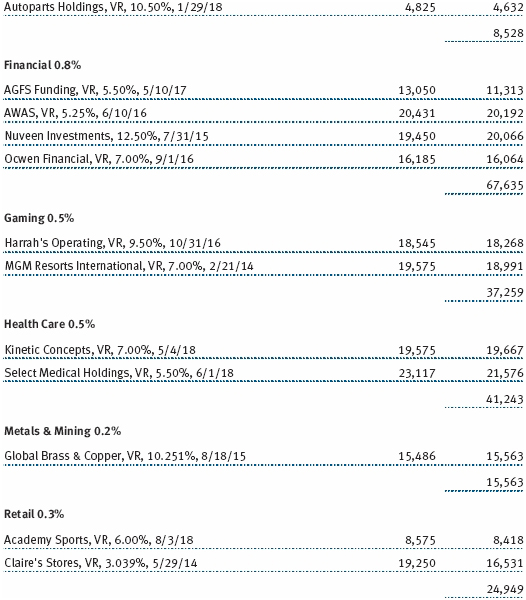
In several cases, what we didn’t own helped our comparison with the benchmark. For example, we sold our positions in Newpage and American Airlines before both companies filed for bankruptcy. We have generally avoided the deep cyclical segments such as forest products and the volatile transportation industry, although our credit selection within those segments aided our results. In the consumer-driven gaming sector, an underweight allocation and credit selection benefited relative performance. We have a position in MGM that is high in the capital structure and held up relatively well through the volatility.
We continue to spend a significant amount of time revisiting our thesis and rationale for owning companies, the themes we want to exploit, and where the companies are versus our expectations. Managing volatility is a top priority, and we have redoubled our effort in screening companies and right-sizing our larger positions that are less stable in a choppy market. In the case of Intelsat, for example, we trimmed our allocation from 1.8% six months ago to 1.4%. Similarly, Ally Financial comprises 1.2% of the fund, reduced from 2.0% at the end of May.
OUTLOOK
Six months ago, we said that we would not be surprised to see a pullback this summer, but we did not expect one of this magnitude. We are disappointed to report losses to our shareholders. In our last letter, we recommended that investors reduce their expectations because we felt the market was richly priced. Unfortunately, our worst fears were more than exceeded as volatility, investor uncertainty, and a lack of liquidity weighed heavily on our market. However, our outlook has become more positive after the pullback. Historically, when the high yield market trades with a spread—the yield above comparable-maturity Treasury bonds—exceeding 8%, it has been rewarding for our investors over the following 12 months. We actually hit a 9% spread in October, and it marked the recent low point for the fund’s share price during the reporting period. We have noticed over the past six months that every time concerns flare up about the European sovereign crisis, the high yield market declines significantly, and each time there is favorable news from across the pond, it has bounced back. Of course, past performance cannot guarantee future results.
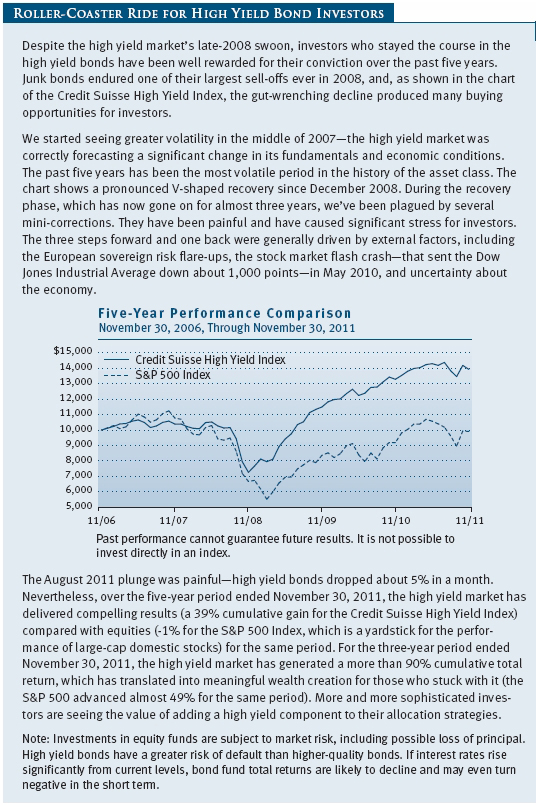
In closing, the message that we want to leave shareholders is depicted in the chart on page 2 of this letter. This sector of the market continues to generate high income, but above-average income can be accompanied by significant volatility. Investors who rode out the market’s heaves and troughs were well rewarded, and those who regularly dollar-cost-averaged have done even better. Many high yield strategists predict that the asset class can continue to generate good income and modest capital appreciation in 2012. We expect economic growth to slow in the first half of 2012 and then resume in the second half. We remain optimistic because the companies in our asset class generally have solid fundamental underpinnings, we are in a low default rate environment, and we view the market as somewhat oversold at these levels. That said, it is likely to continue to be a bumpy ride in the near term.
As always, our goal is to deliver high current income and attractive total returns over time while seeking to cushion the volatility inherent in this market. We will continue our commitment to research and diversification, which we believe is prudent for a fund that invests in a riskier area of the bond market.
Thank you for investing with T. Rowe Price.
Respectfully submitted,

Mark J. Vaselkiv
Chairman of the fund’s Investment Advisory Committee
December 13, 2011
The committee chairman has day-to-day responsibility for managing the portfolio and works with committee members in developing and executing the fund’s investment program.
YIELD DATA CORRECTION
Due to a systems error, the 30-day SEC yield published in the May 31, 2011, annual report for the High Yield Fund was incorrect.
The correct 30-day yield as of May 31, 2011, was 5.90%. We apologize for any inconvenience caused by this error.
RISKS OF BOND INVESTING
Bonds are subject to interest rate risk, the decline in bond prices that usually accompanies a rise in interest rates, and credit risk, the chance that any fund holding could have its credit rating downgraded or that a bond issuer will default (fail to make timely payments of interest or principal), potentially reducing the fund’s income level and share price. High yield corporate bonds could have greater price declines than funds that invest primarily in high-quality bonds. Companies issuing high yield bonds are not as strong financially as those with higher credit ratings, so the bonds are usually considered speculative investments.
GLOSSARY
Credit Suisse High Yield Index: An index that tracks the performance of domestic noninvestment-grade corporate bonds.
Duration: The average time (expressed in years) needed for an investor to receive the present value of the future cash flows on a fixed income investment. It is used to measure a bond or bond fund’s sensitivity to interest rate changes. For example, a fund with a three-year duration would fall about 3% in price in response to a one-percentage-point increase in interest rates, and vice versa. Modified duration provides a more accurate estimate of the fund’s price sensitivity based solely on changes in real interest rates.
Lipper averages: The averages of available mutual fund performance returns for specified time periods in categories defined by Lipper Inc.
SEC yield (30-day): A method of calculating a fund’s yield that assumes all portfolio securities are held until maturity. Yield will vary and is not guaranteed.
Weighted average maturity: A measure of a fund’s interest rate sensitivity. In general, the longer the average maturity, the greater the fund’s sensitivity to interest rate changes. The weighted average maturity may take into account the interest rate readjustment dates for certain securities.
Performance and Expenses
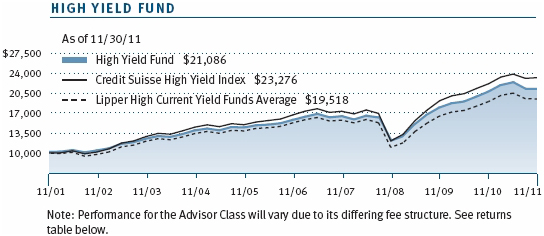
| Growth of $10,000 |
This chart shows the value of a hypothetical $10,000 investment in the fund over the past 10 fiscal year periods or since inception (for funds lacking 10-year records). The result is compared with benchmarks, which may include a broad-based market index and a peer group average or index. Market indexes do not include expenses, which are deducted from fund returns as well as mutual fund averages and indexes.
| Fund Expense Example |
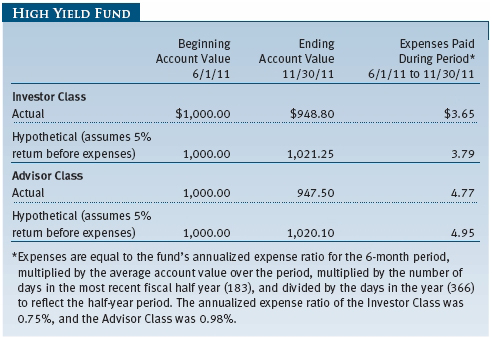
As a mutual fund shareholder, you may incur two types of costs: (1) transaction costs, such as redemption fees or sales loads, and (2) ongoing costs, including management fees, distribution and service (12b-1) fees, and other fund expenses. The following example is intended to help you understand your ongoing costs (in dollars) of investing in the fund and to compare these costs with the ongoing costs of investing in other mutual funds. The example is based on an investment of $1,000 invested at the beginning of the most recent six-month period and held for the entire period.
Actual Expenses
The first line of the following table (“Actual”) provides information about actual account values and expenses based on the fund’s actual returns. You may use the information on this line, together with your account balance, to estimate the expenses that you paid over the period. Simply divide your account value by $1,000 (for example, an $8,600 account value divided by $1,000 = 8.6), then multiply the result by the number on the first line under the heading “Expenses Paid During Period” to estimate the expenses you paid on your account during this period.
Hypothetical Example for Comparison Purposes
The information on the second line of the table (“Hypothetical”) is based on hypothetical account values and expenses derived from the fund’s actual expense ratio and an assumed 5% per year rate of return before expenses (not the fund’s actual return). You may compare the ongoing costs of investing in the fund with other funds by contrasting this 5% hypothetical example and the 5% hypothetical examples that appear in the shareholder reports of the other funds. The hypothetical account values and expenses may not be used to estimate the actual ending account balance or expenses you paid for the period.
Note: T. Rowe Price charges an annual account service fee of $20, generally for accounts with less than $10,000 ($1,000 for UGMA/UTMA). The fee is waived for any investor whose T. Rowe Price mutual fund accounts total $50,000 or more; accounts employing automatic investing; accounts electing to receive electronic delivery of account statements, transaction confirmations, prospectuses, and shareholder reports; accounts of an investor who is a T. Rowe Price Preferred Services, Personal Services, or Enhanced Personal Services client (enrollment in these programs generally requires T. Rowe Price assets of at least $100,000); and IRAs and other retirement plan accounts that utilize a prototype plan sponsored by T. Rowe Price (although a separate custodial or administrative fee may apply to such accounts). This fee is not included in the accompanying table. If you are subject to the fee, keep it in mind when you are estimating the ongoing expenses of investing in the fund and when comparing the expenses of this fund with other funds.
You should also be aware that the expenses shown in the table highlight only your ongoing costs and do not reflect any transaction costs, such as redemption fees or sales loads. Therefore, the second line of the table is useful in comparing ongoing costs only and will not help you determine the relative total costs of owning different funds. To the extent a fund charges transaction costs, however, the total cost of owning that fund is higher.
Unaudited

The accompanying notes are an integral part of these financial statements.
Unaudited
The accompanying notes are an integral part of these financial statements.
Unaudited


The accompanying notes are an integral part of these financial statements.
Unaudited
The accompanying notes are an integral part of these financial statements.
Unaudited
The accompanying notes are an integral part of these financial statements.
Unaudited
The accompanying notes are an integral part of these financial statements.
Unaudited
| Notes to Financial Statements |
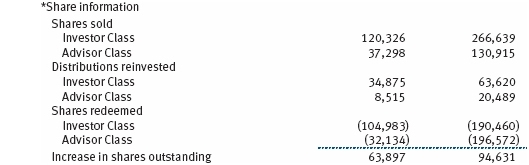
T. Rowe Price High Yield Fund, Inc. (the fund), is registered under the Investment Company Act of 1940 (the 1940 Act) as a diversified, open-end management investment company. The fund seeks high current income and, secondarily, capital appreciation. The fund has two classes of shares: the High Yield Fund original share class, referred to in this report as the Investor Class, offered since December 31, 1984, and the High Yield Fund–Advisor Class (Advisor Class), offered since March 31, 2000. Advisor Class shares are sold only through unaffiliated brokers and other unaffiliated financial intermediaries that are compensated by the class for distribution, shareholder servicing, and/or certain administrative services under a Board-approved Rule 12b-1 plan. Each class has exclusive voting rights on matters related solely to that class; separate voting rights on matters that relate to both classes; and, in all other respects, the same rights and obligations as the other class.
NOTE 1 - SIGNIFICANT ACCOUNTING POLICIES
Basis of Preparation The accompanying financial statements were prepared in accordance with accounting principles generally accepted in the United States of America (GAAP), which require the use of estimates made by management. Management believes that estimates and valuations are appropriate; however, actual results may differ from those estimates, and the valuations reflected in the accompanying financial statements may differ from the value ultimately realized upon sale or maturity.
Investment Transactions, Investment Income, and Distributions Income and expenses are recorded on the accrual basis. Premiums and discounts on debt securities are amortized for financial reporting purposes. Paydown gains and losses are recorded as an adjustment to interest income. Dividends received from mutual fund investments are reflected as dividend income; capital gain distributions are reflected as realized gain/loss. Dividend income and capital gain distributions are recorded on the ex-dividend date. Income tax-related interest and penalties, if incurred, would be recorded as income tax expense. Investment transactions are accounted for on the trade date. Realized gains and losses are reported on the identified cost basis. Distributions to shareholders are recorded on the ex-dividend date. Income distributions are declared by each class daily and paid monthly. Capital gain distributions, if any, are generally declared and paid by the fund annually.
Currency Translation Assets, including investments, and liabilities denominated in foreign currencies are translated into U.S. dollar values each day at the prevailing exchange rate, using the mean of the bid and asked prices of such currencies against U.S. dollars as quoted by a major bank. Purchases and sales of securities, income, and expenses are translated into U.S. dollars at the prevailing exchange rate on the date of the transaction. The effect of changes in foreign currency exchange rates on realized and unrealized security gains and losses is reflected as a component of security gains and losses.
Class Accounting The Advisor Class pays distribution, shareholder servicing, and/or certain administrative expenses in the form of Rule 12b-1 fees, in an amount not exceeding 0.25% of the class’s average daily net assets. Shareholder servicing, prospectus, and shareholder report expenses incurred by each class are charged directly to the class to which they relate. Expenses common to both classes and investment income are allocated to the classes based upon the relative daily net assets of each class’s settled shares; realized and unrealized gains and losses are allocated based upon the relative daily net assets of each class’s outstanding shares.
Credits The fund earns credits on temporarily uninvested cash balances held at the custodian, which reduce the fund’s custody charges. Custody expense in the accompanying financial statements is presented before reduction for credits, which are reflected as expenses paid indirectly.
Redemption Fees The fund assesses a fee on redemptions of fund shares held for 90 days or less to deter short-term trading and to protect the interests of long-term shareholders. For fund shares purchased through August 14, 2011, the redemption fee rate was 1%; for fund shares purchased thereafter, the redemption fee rate increased to 2%. Redemption fees are withheld from proceeds that shareholders receive from the sale or exchange of fund shares. The fees are paid to the fund and are recorded as an increase to paid-in capital. The fees may cause the redemption price per share to differ from the net asset value per share.
In-Kind Redemptions In accordance with guidelines described in the fund’s prospectus, the fund may distribute portfolio securities rather than cash as payment for a redemption of fund shares (in-kind redemption). For financial reporting purposes, the fund recognizes a gain on in-kind redemptions to the extent the value of the distributed securities on the date of redemption exceeds the cost of those securities. Gains and losses realized on in-kind redemptions are not recognized for tax purposes and are reclassified from undistributed realized gain (loss) to paid-in capital. During the six months ended November 30, 2011, the fund realized $8,639,000 of net gain on $75,977,000 of in-kind redemptions.
NOTE 2 - VALUATION
The fund’s financial instruments are reported at fair value as defined by GAAP. The fund determines the values of its assets and liabilities and computes each class’s net asset value per share at the close of the New York Stock Exchange (NYSE), normally 4 p.m. ET, each day that the NYSE is open for business.
Valuation Methods Debt securities are generally traded in the over-the-counter (OTC) market. Securities with remaining maturities of one year or more at the time of acquisition are valued at prices furnished by dealers who make markets in such securities or by an independent pricing service, which considers the yield or price of bonds of comparable quality, coupon, maturity, and type, as well as prices quoted by dealers who make markets in such securities. Securities with remaining maturities of less than one year at the time of acquisition generally use amortized cost in local currency to approximate fair value. However, if amortized cost is deemed not to reflect fair value or the fund holds a significant amount of such securities with remaining maturities of more than 60 days, the securities are valued at prices furnished by dealers who make markets in such securities or by an independent pricing service.
Equity securities listed or regularly traded on a securities exchange or in the OTC market are valued at the last quoted sale price or, for certain markets, the official closing price at the time the valuations are made, except for OTC Bulletin Board securities, which are valued at the mean of the latest bid and asked prices. A security that is listed or traded on more than one exchange is valued at the quotation on the exchange determined to be the primary market for such security. Listed securities not traded on a particular day are valued at the mean of the latest bid and asked prices for domestic securities and the last quoted sale price for international securities.
Investments in mutual funds are valued at the mutual fund’s closing net asset value per share on the day of valuation. Purchased and written options, and OTC options with a listed equivalent, are valued at the mean of the closing bid and asked prices. Options on futures contracts are valued at the closing settlement prices. Forward currency exchange contracts are valued using the prevailing forward exchange rate. Swaps are valued at prices furnished by independent swap dealers or by an independent pricing service.
Other investments, including restricted securities and private placements, and those financial instruments for which the above valuation procedures are inappropriate or are deemed not to reflect fair value, are stated at fair value as determined in good faith by the T. Rowe Price Valuation Committee, established by the fund’s Board of Directors (the Board). Subject to oversight by the Board, the Valuation Committee develops pricing-related policies and procedures and approves all fair-value determinations. The Valuation Committee regularly makes good faith judgments, using a wide variety of sources and information, to establish and adjust valuations of certain securities as events occur and circumstances warrant. For instance, in determining the fair value of private-equity instruments, the Valuation Committee considers a variety of factors, including the company’s business prospects, its financial performance, strategic events impacting the company, relevant valuations of similar companies, new rounds of financing, and any negotiated transactions of significant size between other investors in the company. Because any fair-value determination involves a significant amount of judgment, there is a degree of subjectivity inherent in such pricing decisions.
For valuation purposes, the last quoted prices of non-U.S. equity securities may be adjusted under the circumstances described below. If the fund determines that developments between the close of a foreign market and the close of the NYSE will, in its judgment, materially affect the value of some or all of its portfolio securities, the fund will adjust the previous closing prices to reflect what it believes to be the fair value of the securities as of the close of the NYSE. In deciding whether it is necessary to adjust closing prices to reflect fair value, the fund reviews a variety of factors, including developments in foreign markets, the performance of U.S. securities markets, and the performance of instruments trading in U.S. markets that represent foreign securities and baskets of foreign securities. A fund may also fair value securities in other situations, such as when a particular foreign market is closed but the fund is open. The fund uses outside pricing services to provide it with closing prices and information to evaluate and/or adjust those prices. The fund cannot predict how often it will use closing prices and how often it will determine it necessary to adjust those prices to reflect fair value. As a means of evaluating its security valuation process, the fund routinely compares closing prices, the next day’s opening prices in the same markets, and adjusted prices. Additionally, trading in the underlying securities of the fund may take place in various foreign markets on certain days when the fund is not open for business and does not calculate a net asset value. As a result, net asset values may be significantly affected on days when shareholders cannot make transactions.
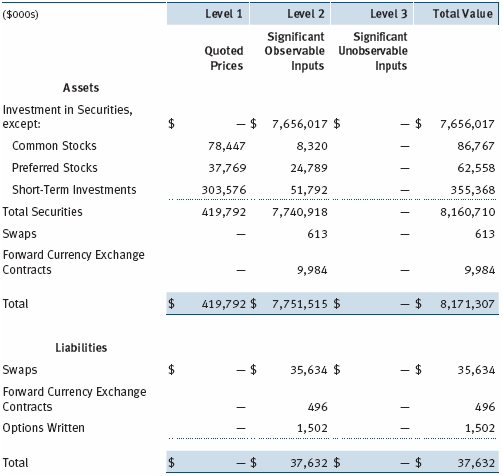
Valuation Inputs Various inputs are used to determine the value of the fund’s financial instruments. These inputs are summarized in the three broad levels listed below:
Level 1 – quoted prices in active markets for identical financial instruments
Level 2 – observable inputs other than Level 1 quoted prices (including, but not limited to, quoted prices for similar financial instruments, interest rates, prepayment speeds, and credit risk)
Level 3 – unobservable inputs
Observable inputs are those based on market data obtained from sources independent of the fund, and unobservable inputs reflect the fund’s own assumptions based on the best information available. The input levels are not necessarily an indication of the risk or liquidity associated with financial instruments at that level. For example, non-U.S. equity securities actively traded in foreign markets generally are reflected in Level 2 despite the availability of closing prices because the fund evaluates and determines whether those closing prices reflect fair value at the close of the NYSE or require adjustment, as described above. The following table summarizes the fund’s financial instruments, based on the inputs used to determine their values on November 30, 2011:
NOTE 3 - DERIVATIVE INSTRUMENTS
During the six months ended November 30, 2011, the fund invested in derivative instruments. As defined by GAAP, a derivative is a financial instrument whose value is derived from an underlying security price, foreign exchange rate, interest rate, index of prices or rates, or other variable; it requires little or no initial investment and permits or requires net settlement. The fund invests in derivatives only if the expected risks and rewards are consistent with its investment objectives, policies, and overall risk profile, as described in its prospectus and Statement of Additional Information. The fund may use derivatives for a variety of purposes, such as seeking to hedge against declines in principal value, increase yield, invest in an asset with greater efficiency and at a lower cost than is possible through direct investment, or to adjust portfolio duration and credit exposure. The risks associated with the use of derivatives are different from, and potentially much greater than, the risks associated with investing directly in the instruments on which the derivatives are based. Investments in derivatives can magnify returns positively or negatively; however, the fund at all times maintains sufficient cash reserves, liquid assets, or other SEC-permitted asset types to cover the settlement obligations under its open derivative contracts.
The fund values its derivatives at fair value, as described below and in Note 2, and recognizes changes in fair value currently in its results of operations. Accordingly, the fund does not follow hedge accounting, even for derivatives employed as economic hedges. The fund does not offset the fair value of derivative instruments against the right to reclaim or obligation to return collateral.
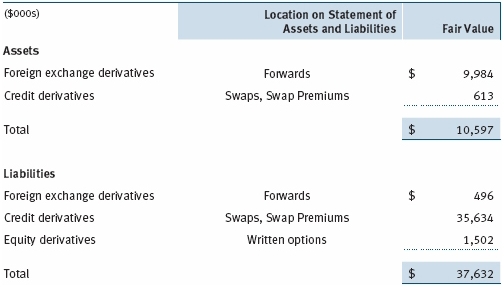
The following table summarizes the fair value of the fund’s derivative instruments held as of November 30, 2011, and the related location on the accompanying Statement of Assets and Liabilities, presented by primary underlying risk exposure:
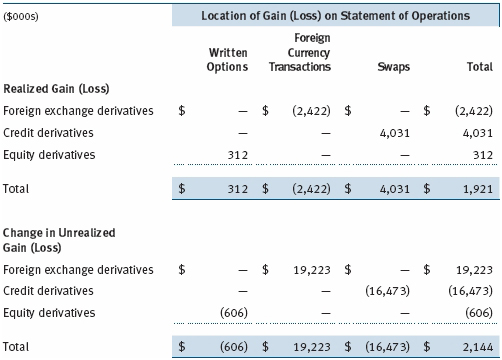
Additionally, the amount of gains and losses on derivative instruments recognized in fund earnings during the six months ended November 30, 2011, and the related location on the accompanying Statement of Operations is summarized in the following table by primary underlying risk exposure:
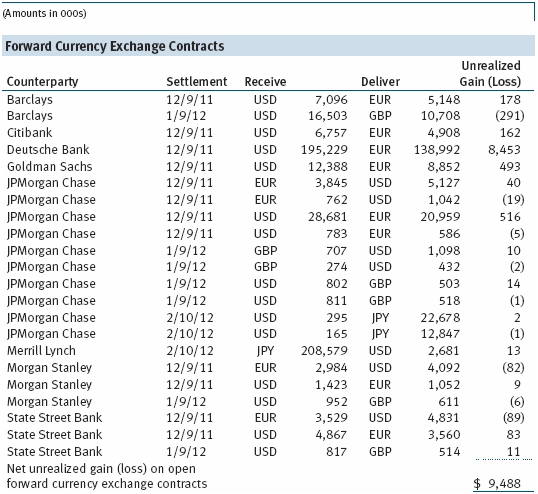
Forward Currency Exchange Contracts The fund is subject to foreign currency exchange rate risk in the normal course of pursuing its investment objectives. It uses forward currency exchange contracts (forwards) primarily to protect its non-U.S. dollar-denominated securities from adverse currency movements relative to the U.S. dollar. A forward involves an obligation to purchase or sell a fixed amount of a specific currency on a future date at a price set at the time of the contract. Although certain forwards may be settled by exchanging only the net gain or loss on the contract, most forwards are settled with the exchange of the underlying currencies in accordance with the specified terms. Forwards are valued at the unrealized gain or loss on the contract, which reflects the net amount the fund either is entitled to receive or obligated to deliver, as measured by the difference between the forward exchange rates at the date of entry into the contract and the forward rates at the reporting date. Appreciated forwards are reflected as assets, and depreciated forwards are reflected as liabilities on the accompanying Statement of Assets and Liabilities. Risks related to the use of forwards include the possible failure of counterparties to meet the terms of the agreements; that anticipated currency movements will not occur, thereby reducing the fund’s total return; and the potential for losses in excess of the fund’s initial investment. During the six months ended November 30, 2011, the fund’s exposure to forwards, based on underlying notional amounts, was generally between 2% and 6% of net assets.
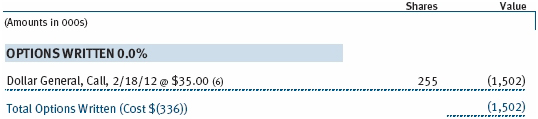
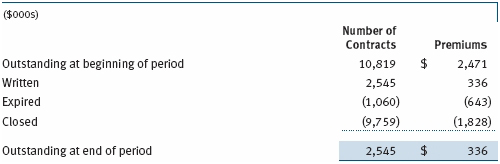
Options The fund is subject to equity price risk in the normal course of pursuing its investment objectives and uses options to help manage such risk. The fund may use call and put options to manage exposure to interest rates, security prices, foreign currencies, and credit quality; as an efficient means of adjusting exposure to all or a part of a target market; to enhance income; as a cash management tool; and/or to adjust portfolio duration and credit exposure. Call and put options give the holder the right, in return for a premium paid, to purchase or sell, respectively, a security at a specified exercise price at any time during the period of the option. Options are included in net assets at fair value; purchased options are included in Investments in Securities; and written options are separately reflected as a liability on the accompanying Statement of Assets and Liabilities. Premiums on unexercised, expired options are recorded as realized gains or losses; premiums on exercised options are recorded as an adjustment to the proceeds from the sale or cost of the purchase. The difference between the premium and the amount received or paid in a closing transaction is also treated as realized gain or loss. Risks related to the use of options include possible illiquidity of the options markets; trading restrictions imposed by an exchange; movements in underlying security values; and for written options, potential losses in excess of the fund’s initial investment. During the six months ended November 30, 2011, the fund’s exposure to options, based on underlying notional amounts, was generally less than 1% of net assets. Transactions in written options and related premiums received during the six months ended November 30, 2011, were as follows:
Credit Default Swaps The fund is subject to credit risk in the normal course of pursuing its investment objectives and uses swap contracts to help manage such risk. The fund may use swaps in an effort to manage exposure to changes in interest rates, inflation rates, and credit quality; to adjust overall exposure to certain markets; to enhance total return or protect the value of portfolio securities; to serve as a cash management tool; and/or to adjust portfolio duration or credit exposure. Credit default swaps are agreements where one party (the protection buyer) agrees to make periodic payments to another party (the protection seller) in exchange for protection against specified credit events, such as certain defaults and bankruptcies related to an underlying credit instrument, or issuer or index of such instruments. Upon occurrence of a specified credit event, the protection seller is required to pay the buyer the difference between the notional amount of the swap and the value of the underlying credit, either in the form of a net cash settlement or by paying the gross notional amount and accepting delivery of the relevant underlying credit. For credit default swaps where the underlying credit is an index, a specified credit event may affect all or individual underlying securities included in the index and will be settled based upon the relative weighting of the affected underlying security(s) within the index. Generally, the payment risk for the seller of protection is inversely related to the current market price of the underlying credit; or, in the case of an index swap, the market value of the contract relative to the notional amount. Therefore, the payment risk increases as the price of the relevant underlying credit, or market value of the index swap, declines due to market valuations of credit quality. As of November 30, 2011, the notional amount of protection sold by the fund totaled $1,268,800,000 (15.5% of net assets), which reflects the maximum potential amount the fund could be required to pay under such contracts. The value of a swap included in net assets is the unrealized gain or loss on the contract plus or minus any unamortized premiums paid or received, respectively. Appreciated swaps and premiums paid are reflected as assets, and depreciated swaps and premiums received are reflected as liabilities on the accompanying Statement of Assets and Liabilities. Net periodic receipts or payments required by swaps are accrued daily and are recorded as realized gain or loss for financial reporting purposes when settled; fluctuations in the fair value of swaps are reflected in the change in net unrealized gain or loss and are reclassified to realized gain or loss upon termination prior to maturity or cash settlement. Risks related to the use of credit default swaps include the possible inability of the fund to accurately assess the current and future creditworthiness of underlying issuers, the possible failure of a counterparty to perform in accordance with the terms of the swap agreements, potential government regulation that could adversely affect the fund’s swap investments, and potential losses in excess of the fund’s initial investment. During the six months ended November 30, 2011, the fund’s exposure to swaps, based on underlying notional amounts, was generally between 1% and 6% of net assets.
NOTE 4 - OTHER INVESTMENT TRANSACTIONS
Consistent with its investment objective, the fund engages in the following practices to manage exposure to certain risks and/or to enhance performance. The investment objective, policies, program, and risk factors of the fund are described more fully in the fund’s prospectus and Statement of Additional Information.
Noninvestment-Grade Debt Securities At November 30, 2011, approximately 90% of the fund’s net assets were invested, either directly or through its investment in T. Rowe Price institutional funds, in noninvestment-grade debt securities, commonly referred to as “high yield” or “junk” bonds. The noninvestment-grade bond market may experience sudden and sharp price swings due to a variety of factors, including changes in economic forecasts, stock market activity, large sustained sales by major investors, a high-profile default, or a change in the market’s psychology. These events may decrease the ability of issuers to make principal and interest payments and adversely affect the liquidity or value, or both, of such securities.
Restricted Securities The fund may invest in securities that are subject to legal or contractual restrictions on resale. Prompt sale of such securities at an acceptable price may be difficult and may involve substantial delays and additional costs.
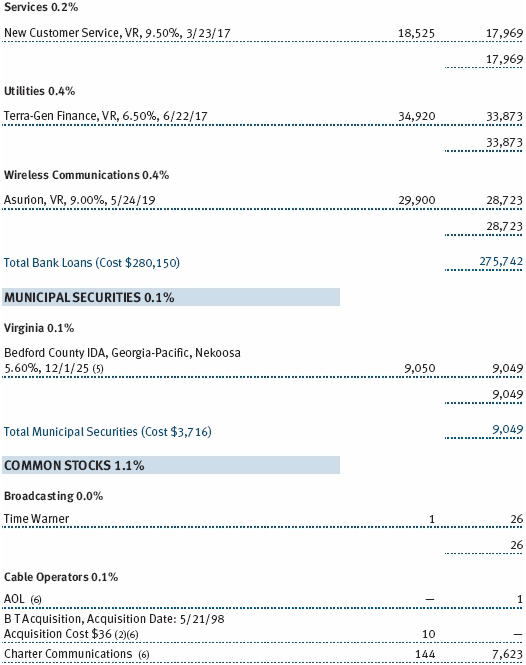
Bank Loans The fund may invest in bank loans, which represent an interest in amounts owed by a borrower to a syndication of lenders. Bank loans may involve multiple loans with the same borrower under a single credit agreement (each loan, a tranche), and each tranche may have different terms and associated risks. A bank or other financial institution typically acts as the agent and administers a bank loan in accordance with the associated credit agreement. Bank loans are generally noninvestment grade and often involve borrowers whose financial condition is troubled or uncertain and companies that are highly leveraged. The fund may buy and sell bank loans in the form of either loan assignments or loan participations. A loan assignment transfers all legal, beneficial, and economic rights to the buyer. Although loan assignments continue to be administered by the agent, the buyer acquires direct rights against the borrower. In many cases, a loan assignment requires the consent of both the borrower and the agent. In contrast, a loan participation generally entitles the buyer to receive the cash flows from principal, interest, and any fee payments that the seller is entitled to receive from the borrower; however, the seller continues to hold legal title to the loan. As a result, with loan participations, the buyer generally has no right to enforce compliance with the terms of the credit agreement against the borrower, and the buyer is subject to the credit risk of both the borrower and the seller. Bank loans often have extended settlement periods, during which the fund is subject to nonperformance by the counterparty. A portion of the fund’s bank loans may require additional principal to be funded at the borrowers’ discretion at a later date (unfunded commitments), and bank loans usually may be repaid any time at the option of the borrower. The fund reflects both the funded portion of the bank loan as well as any unfunded commitment on the loan in the Portfolio of Investments.
Counterparty Risk and Collateral The fund has entered into collateral agreements with certain counterparties to mitigate counterparty risk associated with certain over-the-counter (OTC) financial instruments, including swaps, forward currency exchange contracts, TBA purchase commitments, and OTC options (collectively, covered OTC instruments). Subject to certain minimum exposure requirements (which typically range from $100,000 to $500,000), collateral requirements generally are determined and transfers made based on the net aggregate unrealized gain or loss on all OTC instruments covered by a particular collateral agreement with a specified counterparty. Collateral, both pledged by the fund to a counterparty and pledged by a counterparty to the fund, is held in a segregated account by a third-party agent and can be in the form of cash or debt securities issued by the U.S. government or related agencies. Securities posted as collateral by the fund to a counterparty are so noted in the accompanying Portfolio of Investments and remain in the fund’s net assets. As of November 30, 2011, securities valued at $40,747,000 had been posted by the fund to counterparties. In accordance with GAAP, cash pledged by counterparties to the fund is included in the fund’s net assets; however, securities pledged by counterparties to the fund are not recorded by the fund. As of November 30, 2011, collateral pledged by counterparties to the fund consisted of securities valued at $8,669,000.
At any point in time, the fund’s risk of loss from counterparty credit risk on covered OTC instruments is the aggregate unrealized gain on appreciated covered OTC instruments in excess of collateral, if any, pledged by the counterparty to the fund. Counterparty risk related to exchange-traded futures and options contracts is minimal because the exchange’s clearinghouse provides protection against counterparty defaults. Generally, for exchange-traded derivatives such as futures and options, each broker, in its sole discretion, may change margin requirements applicable to the fund. In accordance with the terms of the relevant derivatives agreements, counterparties to OTC derivatives may be able to terminate derivative contracts prior to maturity after the occurrence of certain stated events, such as a decline in net assets above a certain percentage or a failure by the fund to perform its obligations under the contract. Upon termination, all transactions would typically be liquidated and a net amount would be owed by or payable to the fund.
Other Purchases and sales of portfolio securities other than short-term securities aggregated $2,707,752,000 and $2,396,982,000, respectively, for the six months ended November 30, 2011.
NOTE 5 - FEDERAL INCOME TAXES
No provision for federal income taxes is required since the fund intends to continue to qualify as a regulated investment company under Subchapter M of the Internal Revenue Code and distribute to shareholders all of its taxable income and gains. Distributions determined in accordance with federal income tax regulations may differ in amount or character from net investment income and realized gains for financial reporting purposes. Financial reporting records are adjusted for permanent book/tax differences to reflect tax character but are not adjusted for temporary differences. The amount and character of tax-basis distributions and composition of net assets are finalized at fiscal year-end; accordingly, tax-basis balances have not been determined as of the date of this report.
In accordance with federal tax regulations, the fund recognized capital losses in the current period for tax purposes that had been recognized in the prior fiscal year for financial reporting purposes. Such deferrals relate to net capital losses realized between November 1, 2010, and May 31, 2011, and totaled $5,738,000. The fund intends to retain realized gains to the extent of available capital loss carryforwards. As of May 31, 2011, the fund had $199,899,000 of available capital loss carryforwards, which expire as follows: $131,279,000 in fiscal 2017, and $68,620,000 in fiscal 2018. As a result of the Regulated Investment Company Modernization Act of 2010, net capital losses realized in future fiscal years may be carried forward for an unlimited period but must be used before capital loss carryforwards with expiration dates. It is possible that all or a portion of the fund’s current capital loss carryforwards could expire unused.
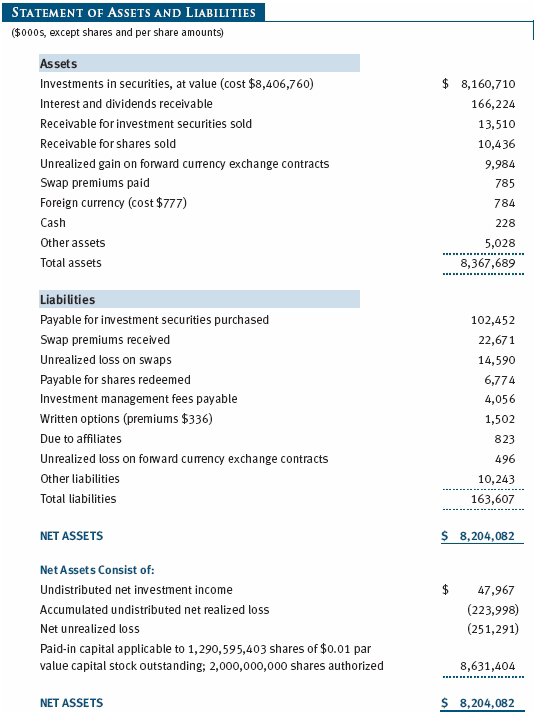
At November 30, 2011, the cost of investments for federal income tax purposes was $8,407,940,000. Net unrealized loss aggregated $252,471,000 at period-end, of which $197,123,000 related to appreciated investments and $449,594,000 related to depreciated investments.
NOTE 6 - RELATED PARTY TRANSACTIONS
The fund is managed by T. Rowe Price Associates, Inc. (Price Associates), a wholly owned subsidiary of T. Rowe Price Group, Inc. (Price Group). The investment management agreement between the fund and Price Associates provides for an annual investment management fee, which is computed daily and paid monthly. The fee consists of an individual fund fee, equal to 0.30% of the fund’s average daily net assets, and a group fee. The group fee rate is calculated based on the combined net assets of certain mutual funds sponsored by Price Associates (the group) applied to a graduated fee schedule, with rates ranging from 0.48% for the first $1 billion of assets to 0.28% for assets in excess of $300 billion. The fund’s group fee is determined by applying the group fee rate to the fund’s average daily net assets. At November 30, 2011, the effective annual group fee rate was 0.30%.
In addition, the fund has entered into service agreements with Price Associates and two wholly owned subsidiaries of Price Associates (collectively, Price). Price Associates computes the daily share prices and provides certain other administrative services to the fund. T. Rowe Price Services, Inc., provides shareholder and administrative services in its capacity as the fund’s transfer and dividend disbursing agent. T. Rowe Price Retirement Plan Services, Inc., provides subaccounting and recordkeeping services for certain retirement accounts invested in the Investor Class. For the six months ended November 30, 2011, expenses incurred pursuant to these service agreements were $103,000 for Price Associates; $762,000 for T. Rowe Price Services, Inc.; and $159,000 for T. Rowe Price Retirement Plan Services, Inc. The total amount payable at period-end pursuant to these service agreements is reflected as Due to Affiliates in the accompanying financial statements.
The fund is also one of several mutual funds sponsored by Price Associates (underlying Price funds) in which the T. Rowe Price Spectrum Funds (Spectrum Funds) and T. Rowe Price Retirement Funds (Retirement Funds) may invest. Neither the Spectrum Funds nor the Retirement Funds invest in the underlying Price funds for the purpose of exercising management or control. Pursuant to separate special servicing agreements, expenses associated with the operation of the Spectrum and Retirement Funds are borne by each underlying Price fund to the extent of estimated savings to it and in proportion to the average daily value of its shares owned by the Spectrum and Retirement Funds, respectively. Expenses allocated under these agreements are reflected as shareholder servicing expenses in the accompanying financial statements. For the six months ended November 30, 2011, the fund was allocated $876,000 of Spectrum Funds’ expenses and $1,520,000 of Retirement Funds’ expenses. Of these amounts, $1,475,000 related to services provided by Price. The amount payable at period-end pursuant to this agreement is reflected as Due to Affiliates in the accompanying financial statements. At November 30, 2011, approximately 19% of the outstanding shares of the Investor Class were held by the Spectrum Funds and 23% were held by the Retirement Funds.
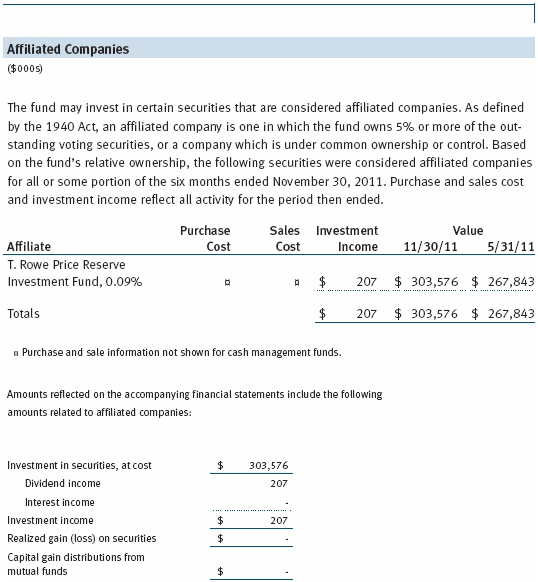
The fund may invest in the T. Rowe Price Reserve Investment Fund and the T. Rowe Price Government Reserve Investment Fund (collectively, the T. Rowe Price Reserve Investment Funds), open-end management investment companies managed by Price Associates and considered affiliates of the fund. The T. Rowe Price Reserve Investment Funds are offered as cash management options to mutual funds, trusts, and other accounts managed by Price Associates and/or its affiliates and are not available for direct purchase by members of the public. The T. Rowe Price Reserve Investment Funds pay no investment management fees.
| Information on Proxy Voting Policies, Procedures, and Records |
A description of the policies and procedures used by T. Rowe Price funds and portfolios to determine how to vote proxies relating to portfolio securities is available in each fund’s Statement of Additional Information, which you may request by calling 1-800-225-5132 or by accessing the SEC’s website, sec.gov. The description of our proxy voting policies and procedures is also available on our website, troweprice.com. To access it, click on the words “Our Company” at the top of our corporate homepage. Then, when the next page appears, click on the words “Proxy Voting Policies” on the left side of the page.
Each fund’s most recent annual proxy voting record is available on our website and through the SEC’s website. To access it through our website, follow the directions above, then click on the words “Proxy Voting Records” on the right side of the Proxy Voting Policies page.
| How to Obtain Quarterly Portfolio Holdings |
The fund files a complete schedule of portfolio holdings with the Securities and Exchange Commission for the first and third quarters of each fiscal year on Form N-Q. The fund’s Form N-Q is available electronically on the SEC’s website (sec.gov); hard copies may be reviewed and copied at the SEC’s Public Reference Room, 450 Fifth St. N.W., Washington, DC 20549. For more information on the Public Reference Room, call 1-800-SEC-0330.
Item 2. Code of Ethics.
A code of ethics, as defined in Item 2 of Form N-CSR, applicable to its principal executive officer, principal financial officer, principal accounting officer or controller, or persons performing similar functions is filed as an exhibit to the registrant’s annual Form N-CSR. No substantive amendments were approved or waivers were granted to this code of ethics during the registrant’s most recent fiscal half-year.
Item 3. Audit Committee Financial Expert.
Disclosure required in registrant’s annual Form N-CSR.
Item 4. Principal Accountant Fees and Services.
Disclosure required in registrant’s annual Form N-CSR.
Item 5. Audit Committee of Listed Registrants.
Not applicable.
Item 6. Investments.
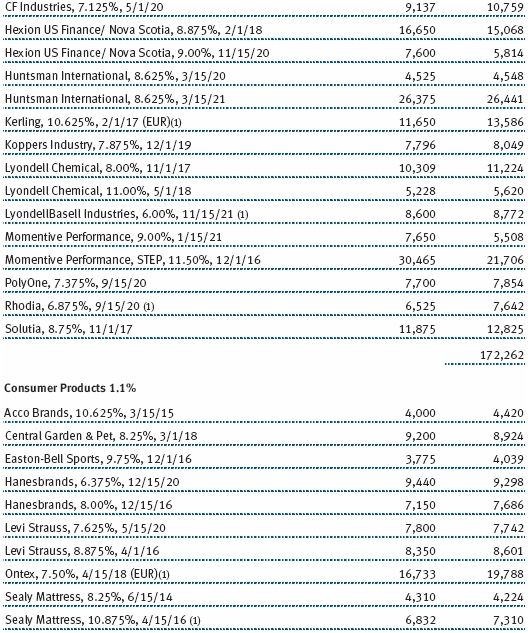
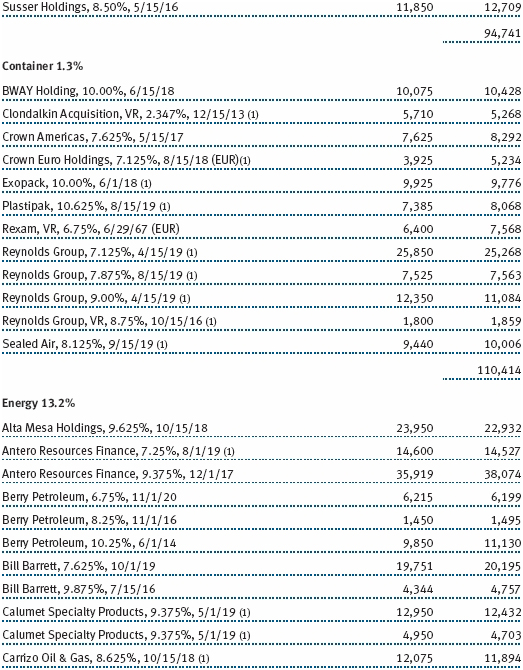
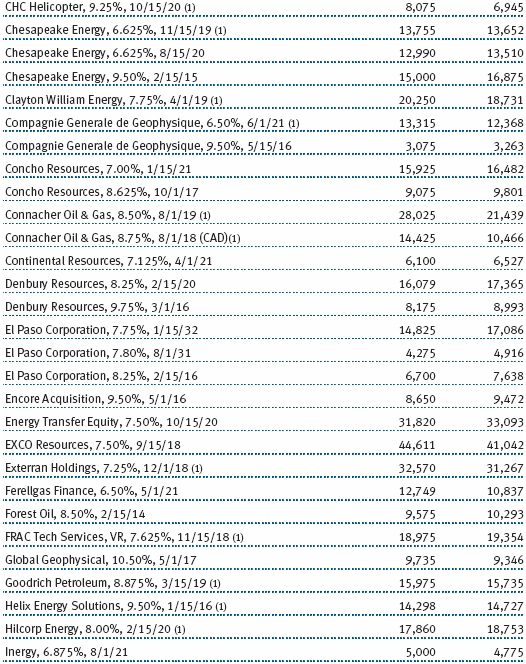
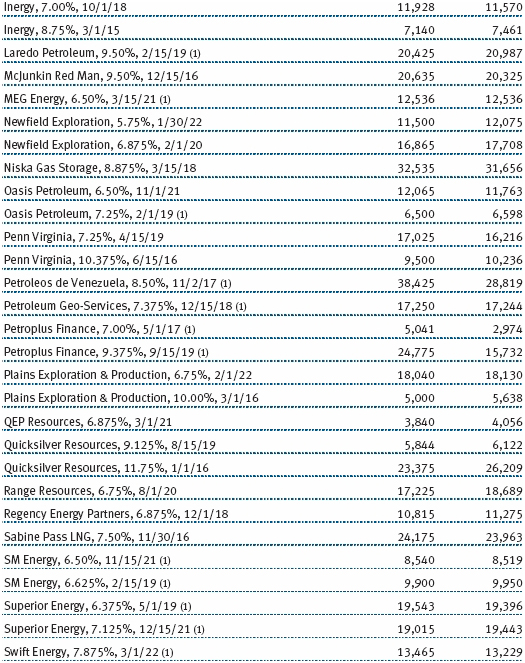
(a) Not applicable. The complete schedule of investments is included in Item 1 of this Form N-CSR.
(b) Not applicable.
Item 7. Disclosure of Proxy Voting Policies and Procedures for Closed-End Management Investment Companies.
Not applicable.
Item 8. Portfolio Managers of Closed-End Management Investment Companies.
Not applicable.
Item 9. Purchases of Equity Securities by Closed-End Management Investment Company and Affiliated Purchasers.
Not applicable.
Item 10. Submission of Matters to a Vote of Security Holders.
Not applicable.
Item 11. Controls and Procedures.
(a) The registrant’s principal executive officer and principal financial officer have evaluated the registrant’s disclosure controls and procedures within 90 days of this filing and have concluded that the registrant’s disclosure controls and procedures were effective, as of that date, in ensuring that information required to be disclosed by the registrant in this Form N-CSR was recorded, processed, summarized, and reported timely.
(b) The registrant’s principal executive officer and principal financial officer are aware of no change in the registrant’s internal control over financial reporting that occurred during the registrant’s second fiscal quarter covered by this report that has materially affected, or is reasonably likely to materially affect, the registrant’s internal control over financial reporting.
Item 12. Exhibits.
(a)(1) The registrant’s code of ethics pursuant to Item 2 of Form N-CSR is filed with the registrant’s annual Form N-CSR.
(2) Separate certifications by the registrant's principal executive officer and principal financial officer, pursuant to Section 302 of the Sarbanes-Oxley Act of 2002 and required by Rule 30a-2(a) under the Investment Company Act of 1940, are attached.
(3) Written solicitation to repurchase securities issued by closed-end companies: not applicable.
(b) A certification by the registrant's principal executive officer and principal financial officer, pursuant to Section 906 of the Sarbanes-Oxley Act of 2002 and required by Rule 30a-2(b) under the Investment Company Act of 1940, is attached.
SIGNATURES
Pursuant to the requirements of the Securities Exchange Act of 1934 and the Investment Company Act of 1940, the registrant has duly caused this report to be signed on its behalf by the undersigned, thereunto duly authorized.
T. Rowe Price High Yield Fund, Inc.
| By | /s/ Edward C. Bernard |
| Edward C. Bernard | |
| Principal Executive Officer | |
| Date | January 23, 2012 |
Pursuant to the requirements of the Securities Exchange Act of 1934 and the Investment Company Act of 1940, this report has been signed below by the following persons on behalf of the registrant and in the capacities and on the dates indicated.
| By | /s/ Edward C. Bernard |
| Edward C. Bernard | |
| Principal Executive Officer | |
| Date | January 23, 2012 |
| By | /s/ Gregory K. Hinkle |
| Gregory K. Hinkle | |
| Principal Financial Officer | |
| Date | January 23, 2012 |