UNITED STATES
SECURITIES AND EXCHANGE COMMISSION
Washington, D.C. 20549
FORM N-CSR
CERTIFIED SHAREHOLDER REPORT OF REGISTERED
MANAGEMENT INVESTMENT COMPANIES
Investment Company Act File Number: 811-04119
| T. Rowe Price High Yield Fund, Inc. |
|
| (Exact name of registrant as specified in charter) |
| |
| 100 East Pratt Street, Baltimore, MD 21202 |
|
| (Address of principal executive offices) |
| |
| David Oestreicher |
| 100 East Pratt Street, Baltimore, MD 21202 |
|
| (Name and address of agent for service) |
Registrant’s telephone number, including area code: (410) 345-2000
Date of fiscal year end: May 31
Date of reporting period: November 30, 2017
Item 1. Report to Shareholders
| U.S. High Yield Fund | November 30, 2017 |
The views and opinions in this report were current as of November 30, 2017. They are not guarantees of performance or investment results and should not be taken as investment advice. Investment decisions reflect a variety of factors, and the managers reserve the right to change their views about individual stocks, sectors, and the markets at any time. As a result, the views expressed should not be relied upon as a forecast of the fund’s future investment intent. The report is certified under the Sarbanes-Oxley Act, which requires mutual funds and other public companies to affirm that, to the best of their knowledge, the information in their financial reports is fairly and accurately stated in all material respects.
REPORTS ON THE WEB
Sign up for our Email Program, and you can begin to receive updated fund reports and prospectuses online rather than through the mail. Log in to your account at troweprice.com for more information.
Manager’s Letter
Fellow Shareholders
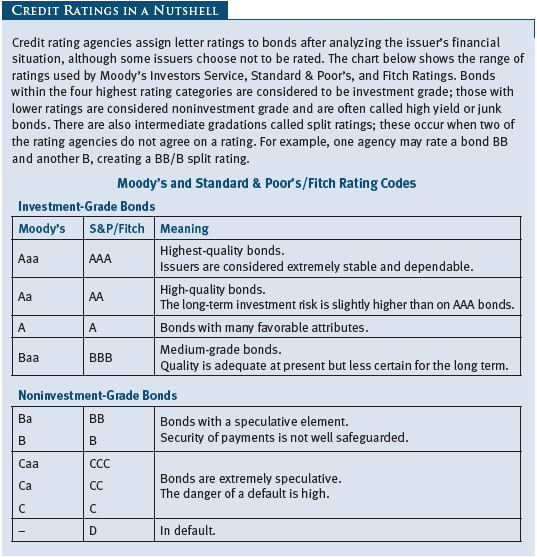
U.S. high yield bonds generated modest gains in the past six months that outperformed most other sectors of the global fixed income market, including leveraged loans. The high yield market benefited from strong economic growth and rising commodity and stock market prices. While high yield spreads remained tight, the asset class continued to deliver a combination of above-average income and below-average sensitivity to rising interest rates compared with investment-grade bonds.
PORTFOLIO PERFORMANCE
The portfolio returned 2.97% in the six-month period ended November 30, 2017. As shown in the Performance Comparison table, the fund outperformed the 2.27% gain for its benchmark, the BofA Merrill Lynch US High Yield Constrained Index. (Results for Advisor and I Class shares will vary, reflecting their different fee structures.)
The U.S. High Yield Fund compared favorably versus its Lipper high yield funds peer group since its inception on April 30, 2013. While the fund’s Investor Class has slightly more than six months of performance history, the U.S. High Yield Fund–Advisor Class and the U.S. High Yield Fund–I Class ranked in the top 10% of their high yield funds universe for the one- and three-year periods ended November 30, 2017, and in the top 1% of its peer group for the since-inception period ended November 30, 2017. (Based on cumulative total return, Lipper ranked the U.S. High Yield Fund–Advisor Class 64 of 671, 10 of 579, and 3 of 495 funds for the one-year, three-year, and since-inception periods ended November 30, 2017, respectively. Lipper ranked the U.S. High Yield Fund–I Class 47 of 671, 5 of 579, and 2 of 495 funds for the one-year, three-year, and since-inception periods ended November 30, 2017, respectively. Past performance cannot guarantee future results.)
INVESTMENT PHILOSOPHY
The U.S. High Yield Fund seeks to maximize total return with an emphasis on income by investing predominantly in the U.S. high yield bond market. The investment team has worked together for over 10 years and has managed this strategy since April 2013. We aim to generate alpha in all market environments and in different stages of credit cycles. We believe we can accomplish this by capturing market inefficiencies that often create attractive absolute and relative value opportunities across issuers due to size and credit quality.
The hallmarks of our investment strategy are concentration and conviction, as evidenced by a best-ideas portfolio of 75 to 200 holdings (within our universe of roughly 1,000 high yield companies). We allow for up to 200 holdings in order to maintain an appropriate level of diversification, recognizing the unique liquidity challenges of the high yield bond market. We seek to add value by being nimble and flexible while trading in the primary new issuance market and the secondary market. We believe that our strength is in credit selection and that we can structure the portfolio in a concentrated manner to generate alpha.
The team emphasizes proprietary, bottom-up credit research that enables us to formulate our own views on credit ratings as well as absolute and relative valuation. The key components of the idea generation process incorporate:
| ● | Weekly credit meetings and independent credit research
|
| ● | Analysis of market dynamics, including pricing, liquidity, and issuance
|
| ● | Consideration of opportunities across the full capital spectrum
|
| ● | Monthly performance and attribution review of the index universe
|
| ● | Meetings with company management, industry conferences, and market research |
MARKET ENVIRONMENT
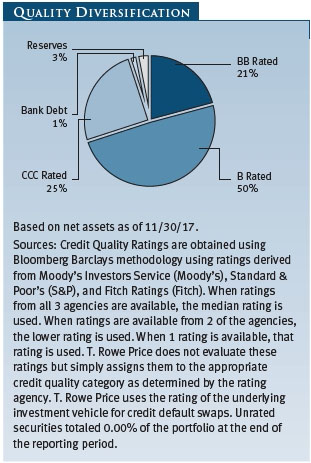
The strength in the high yield market during our reporting period was supported by double-digit returns in stocks, a light supply of new issuance, and a general search for yield in a historically low global rate environment. Within the high yield market, BB and B rated bonds outperformed CCC rated bonds during the period, indicating that investor demand was directed toward the higher credit quality tiers. A key return driver over this time period was the outsized performance of the commodity subsectors, namely energy and metals and mining. However, at this stage, the commodity subsectors trade at only a slight discount to the overall market on a valuation basis.
During the past six months, the U.S. high yield bond market outperformed bank loans, similar-maturity Treasuries, and investment-grade corporate bonds. However, the asset class underperformed European high yield and emerging market debt. High yield bond new issuance averaged $25 billion to $30 billion per month, which is historically moderate issuance activity. It is noteworthy that about two-thirds of the issuance was for refinancing activity, while only about 10% to 15% was used for acquisitions and leveraged buyouts. It is also instructive to note that higher-rated new issues enjoyed a warmer reception than low-rated deals—only about 10% to 15% of new issuance that came to market was split rated B or CCC, which was the lowest percentage since 2009.
The default rate was moderate over our reporting period, and defaults were concentrated in the energy and retail sectors. The J.P. Morgan trailing 12-month default rate stood at 1.2% (1.4%, including distressed debt exchanges) at the end of November. Your fund did not incur any defaults in the last six months. The upgrade/downgrade ratio rose to 1.7 at the end of November from 0.7 six months earlier, which compares with historical nadirs of around 0.3 during the past two credit crises (2000–2001 and 2008–2009). High yield mutual fund redemptions totaled over $5 billion during the reporting period. After recording strong inflows in 2016, flows were negative in 2017 through November as valuations became stretched and yields decreased.
PORTFOLIO REVIEW
The portfolio generated strong relative performance. Security selection within the CCC and B rated categories was particularly good. This primarily stemmed from our focus on the higher credit quality portion of the CCC segment. However, our relative returns suffered a bit from our credit tier positioning—an underweight to BB rated credits, which posted strong results, and overweights to B and CCC rated credits detracted.
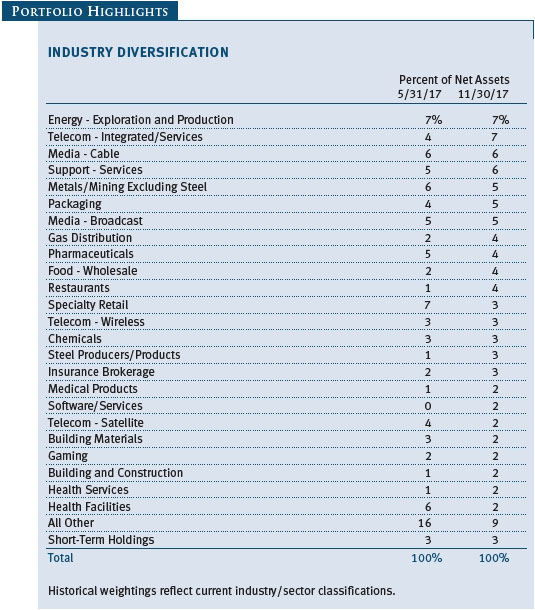
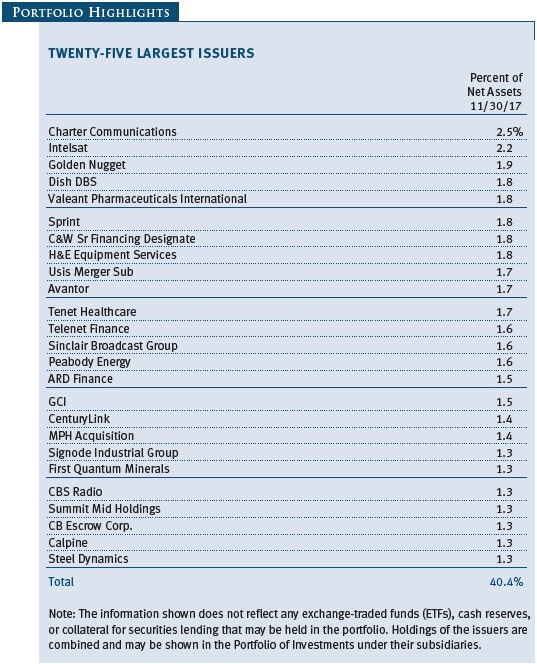
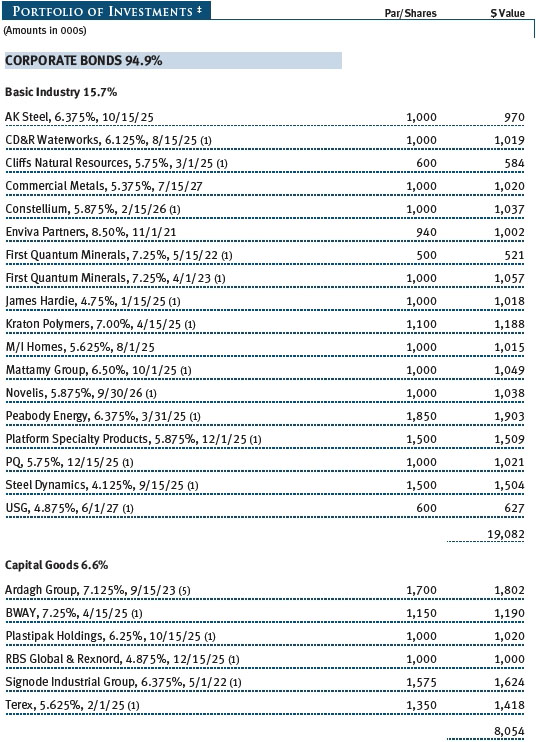
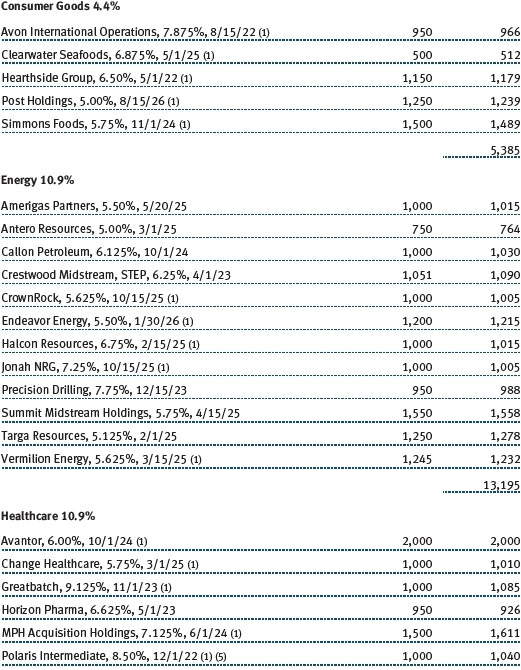
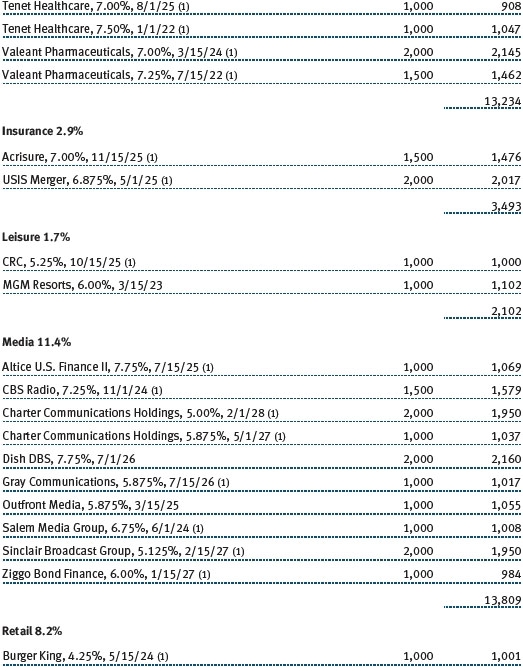
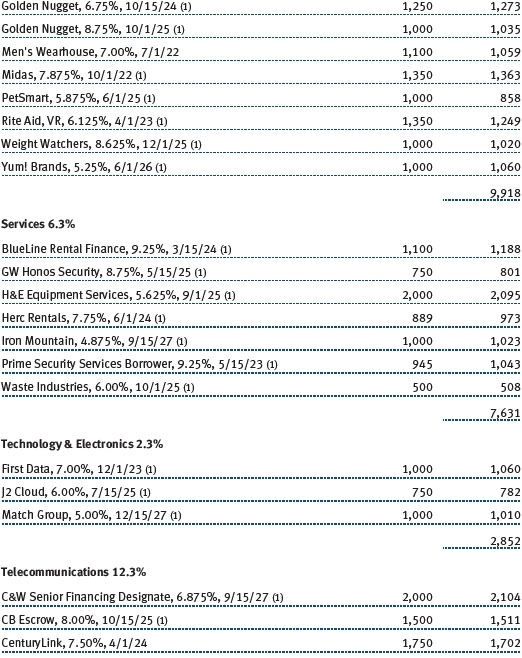
Our best industries for relative performance in the period were telecom, services, and basic industry. Our worst industries from a relative performance perspective were insurance, retail, and banking. Our best relative contributions from individual issuers came from Halcon Resources (energy), Cable and Wireless (telecom), and Tailored Brands (retail). Our worst relative performers during the period were PetSmart (retail), Endo (pharmaceuticals), and Dish DBS (media/satellite). Overall, credit selection and industry allocation decisions were relative performance contributors. The portfolio benefited from a gradual move to reduce credit risk, specifically in the commodity-related sectors. (Please refer to the fund’s portfolio of investments for a complete list of holdings and the amount each represents in the portfolio.)
OUTLOOK
We are positioned in line with the benchmark in terms of our credit risk as measured by yield, spread, and weighted average credit quality. We anticipate selectively adding to the energy segment, where we have steadily decreased our underweight position. Our holdings are focused in higher-quality oil and gas exploration and production companies and midstream energy companies. Our energy outlook has improved now that oil is in the $55 per barrel area. Furthermore, most of the defaults and distressed exchanges that we expected in the energy sector have already taken place. We remain selective in the new issue market and have maintained a higher-quality bias over the past few months because we see rich valuations in the primary and secondary markets.
We plan to keep the portfolio’s yield and credit spread slightly above the benchmark and, as always, to rely on credit selection as the main alpha generator. We expect defaults to be around the 2% range in 2018. Low global government bond yields should continue to drive demand for high yield bonds, both in the retail and institutional space. We are less excited about owning leveraged loans, as valuations appear more stretched than in high yield bonds. We expect the prospects for trade tariffs, changes in tax deductibility of interest, and potentially lower U.S. corporate tax rates to have a negligible impact on U.S. high yield companies versus investment-grade issuers.
As always, we will continue to work diligently on your behalf. Thank you for your support and confidence in T. Rowe Price.
Respectfully submitted,

Kevin Loome
Chairman of the fund’s Investment Advisory Committee
December 15, 2017
The committee chairman has day-to-day responsibility for managing the portfolio and executing the fund’s investment program.
RISKS OF BOND INVESTING
Bonds are subject to interest rate risk, the decline in bond prices that usually accompanies a rise in interest rates, and credit risk, the chance that any fund holding could have its credit rating downgraded or that a bond issuer will default (fail to make timely payments of interest or principal), potentially reducing the fund’s income level and share price. High yield corporate bonds could have greater price declines than funds that invest primarily in high-quality bonds. Companies issuing high yield bonds are not as strong financially as those with higher credit ratings, so the bonds are usually considered speculative investments.
RISK MANAGEMENT: A KEY COMPONENT OF OUR STRATEGY
We would like to remind shareholders about some fundamental changes that have occurred in the fixed income markets in recent years. The markets have been particularly volatile over the past 12 months. The volatility has highlighted the importance of sound risk management.
Bond fund assets have grown substantially over the past three decades, with much of the growth taking place since 2008. This has been beneficial in many ways, but like many positive events, it has side effects as well. The prospect of rising interest rates triggers concerns that some investors could change course and redeploy their assets into other financial markets. Net outflows during periods of rising rates are not new; indeed, such was the case in 1994 and 2000 when rates turned up. Because of this evolving environment, T. Rowe Price is taking steps to ensure that our funds are positioned to function smoothly during transitional periods as the Fed implements policy changes that are likely to affect the direction of interest rates. These measures include assessing the liquidity of our portfolios, conducting stress tests that take various market scenarios under consideration, and taking other steps to ensure successful implementation of our investment strategy. We want to reassure our shareholders that we are aware of the changing market environment and are monitoring it closely.
GLOSSARY
Basis point: One one-hundredth of one percentage point, or 0.01%.
BofA Merrill Lynch US High Yield Constrained Index: An index that tracks the performance of domestic below investment-grade corporate bonds.
Duration: The average time (expressed in years) needed for an investor to receive the present value of the future cash flows on a fixed income investment. It is used to measure a bond’s or bond fund’s sensitivity to interest rate changes. For example, a fund with a three-year duration would fall about 3% in price in response to a one-percentage-point increase in interest rates, and vice versa. Modified duration provides a more accurate estimate of the fund’s price sensitivity based solely on changes in real interest rates.
Lipper averages: The averages of available mutual fund performance returns for specified time periods in categories defined by Lipper Inc.
SEC yield (30-day): A method of calculating a fund’s yield that assumes all portfolio securities are held until maturity. Yield will vary and is not guaranteed.
Weighted average maturity: A measure of a fund’s interest rate sensitivity. In general, the longer the average maturity, the greater the fund’s sensitivity to interest rate changes. The weighted average maturity may take into account the interest rate readjustment dates for certain securities.
Performance and Expenses
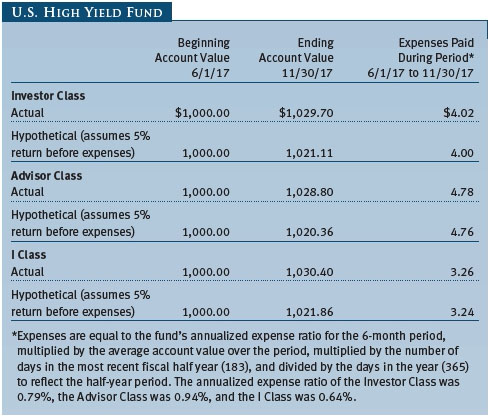
As a mutual fund shareholder, you may incur two types of costs: (1) transaction costs, such as redemption fees or sales loads, and (2) ongoing costs, including management fees, distribution and service (12b-1) fees, and other fund expenses. The following example is intended to help you understand your ongoing costs (in dollars) of investing in the fund and to compare these costs with the ongoing costs of investing in other mutual funds. The example is based on an investment of $1,000 invested at the beginning of the most recent six-month period and held for the entire period.
Please note that the fund has three share classes: The original share class (Investor Class) charges no distribution and service (12b-1) fee, the Advisor Class shares are offered only through unaffiliated brokers and other financial intermediaries and charge a 0.25% 12b-1 fee, and I Class shares are available to institutionally oriented clients and impose no 12b-1 or administrative fee payment. Each share class is presented separately in the table.
Actual Expenses
The first line of the following table (Actual) provides information about actual account values and expenses based on the fund’s actual returns. You may use the information on this line, together with your account balance, to estimate the expenses that you paid over the period. Simply divide your account value by $1,000 (for example, an $8,600 account value divided by $1,000 = 8.6), then multiply the result by the number on the first line under the heading “Expenses Paid During Period” to estimate the expenses you paid on your account during this period.
Hypothetical Example for Comparison Purposes
The information on the second line of the table (Hypothetical) is based on hypothetical account values and expenses derived from the fund’s actual expense ratio and an assumed 5% per year rate of return before expenses (not the fund’s actual return). You may compare the ongoing costs of investing in the fund with other funds by contrasting this 5% hypothetical example and the 5% hypothetical examples that appear in the shareholder reports of the other funds. The hypothetical account values and expenses may not be used to estimate the actual ending account balance or expenses you paid for the period.
Note: T. Rowe Price charges an annual account service fee of $20, generally for accounts with less than $10,000. The fee is waived for any investor whose T. Rowe Price mutual fund accounts total $50,000 or more; accounts electing to receive electronic delivery of account statements, transaction confirmations, prospectuses, and shareholder reports; or accounts of an investor who is a T. Rowe Price Personal Services or Enhanced Personal Services client (enrollment in these programs generally requires T. Rowe Price assets of at least $250,000). This fee is not included in the accompanying table. If you are subject to the fee, keep it in mind when you are estimating the ongoing expenses of investing in the fund and when comparing the expenses of this fund with other funds.
You should also be aware that the expenses shown in the table highlight only your ongoing costs and do not reflect any transaction costs, such as redemption fees or sales loads. Therefore, the second line of the table is useful in comparing ongoing costs only and will not help you determine the relative total costs of owning different funds. To the extent a fund charges transaction costs, however, the total cost of owning that fund is higher.
Unaudited
The accompanying notes are an integral part of these financial statements.
Unaudited
The accompanying notes are an integral part of these financial statements.
Unaudited

The accompanying notes are an integral part of these financial statements.
Unaudited
The accompanying notes are an integral part of these financial statements.
Unaudited
The accompanying notes are an integral part of these financial statements.
Unaudited
The accompanying notes are an integral part of these financial statements.
Unaudited
The accompanying notes are an integral part of these financial statements.
Unaudited
| Notes to Financial Statements |
T. Rowe Price High Yield Fund, Inc. (the corporation) is registered under the Investment Company Act of 1940 (the 1940 Act). The U.S. High Yield Fund (the fund) is a diversified, open-end management investment company established by the corporation. The fund incepted on May 19, 2017. The fund seeks total return, and secondarily, current income. The fund has three classes of shares: the U.S. High Yield Fund (Investor Class), the U.S. High Yield Fund–Advisor Class (Advisor Class), and the U.S. High Yield Fund–I Class (I Class). Advisor Class shares are sold only through unaffiliated brokers and other unaffiliated financial intermediaries. I Class shares generally are available only to investors meeting a $1,000,000 minimum investment or certain other criteria. The Advisor Class operates under a Board-approved Rule 12b-1 plan pursuant to which the class compensates financial intermediaries for distribution, shareholder servicing, and/or certain administrative services; the Investor and I Classes do not pay Rule 12b-1 fees. Each class has exclusive voting rights on matters related solely to that class; separate voting rights on matters that relate to all classes; and, in all other respects, the same rights and obligations as the other classes.
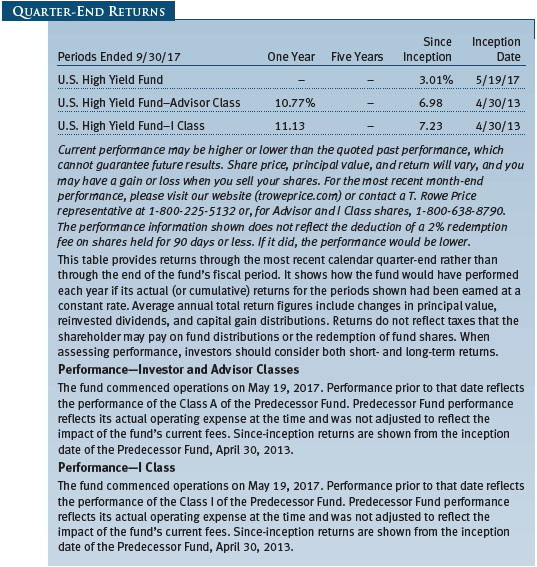
On May 22, 2017 (the Reorganization Date), the fund, a newly organized series with no investment operations prior to the Reorganization Date, acquired all of the assets of the Henderson High Yield Opportunities Fund (the Predecessor Fund) in exchange for shares of the fund and assumption by the fund of substantially all of the Predecessor Fund’s liabilities. The exchange was accomplished as a tax-free reorganization (the Reorganization) in accordance with the Amended Agreement and Plan of Reorganization (the Reorganization Agreement), which was approved by the shareholders of the Predecessor Fund on May 15, 2017. Under the Reorganization, all outstanding shares of the Predecessor Fund were exchanged for shares of the fund. The exchange was based on values of the Predecessor Fund as of the close of business on the immediately preceding business day, May 19, 2017 (the Valuation Date). The fund has substantially similar investment objectives, principal investment strategies, and risks as the Predecessor Fund, and the portfolio management team of the Predecessor Fund has transitioned to the fund.
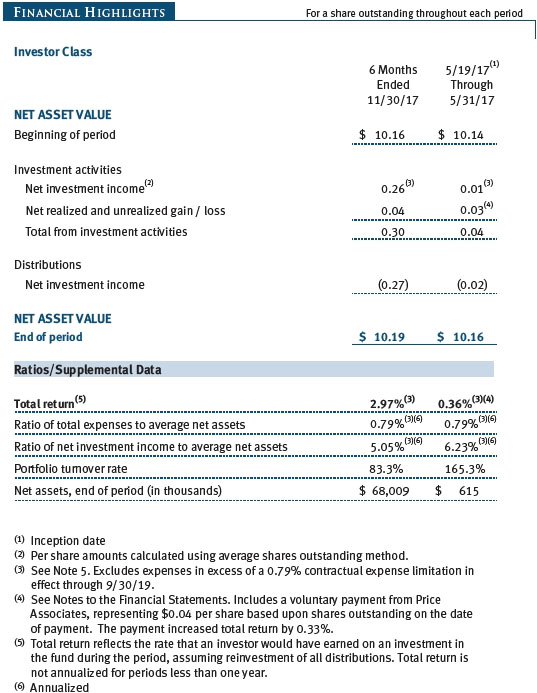
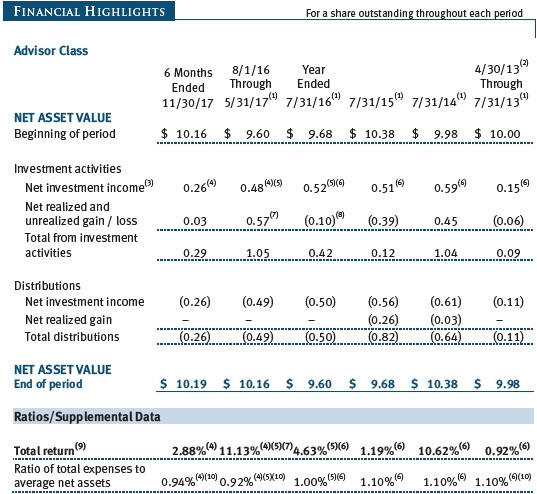
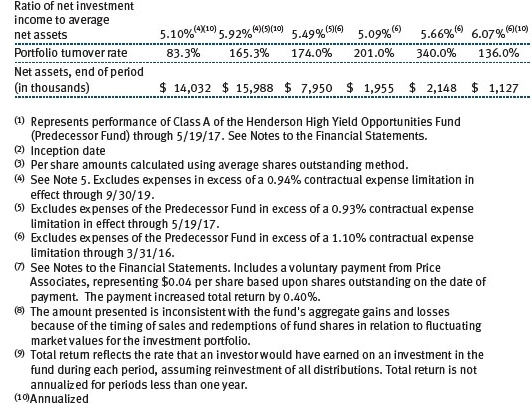
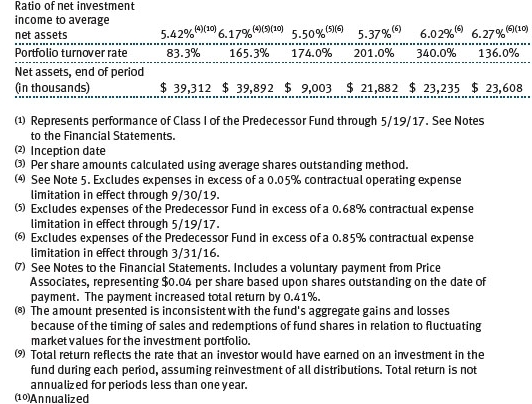
On May 22, 2017, Price Associates made a voluntary payment to the fund of $207,710 (the payment) to fully reimburse the fund for the effect of differences in valuation techniques between the fund and the Predecessor Fund. The payment from Price Associates was received in cash on May 23, 2017. The payment increased total return for the period ended May 31, 2017, by 0.33%, 0.40%, and 0.41% for the Investor Class, Advisor Class, and I Class, respectively.
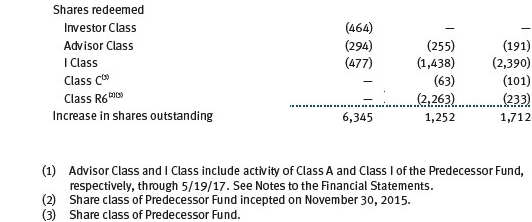
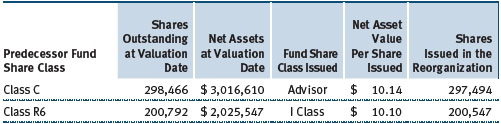
The fund is the surviving legal entity, but has adopted the performance and financial history of the Predecessor Fund, which is included in these financial statements. Class A and Class I of the Predecessor Fund became the Advisor Class and I Class, respectively, of the fund. In addition, Class C shareholders of the Predecessor Fund received Advisor Class shares of the fund and Class R6 shareholders of the Predecessor Fund received I Class shares of the fund. After inclusion of the payment from Price Associates, the value of shares received was equal in value to the shares of the respective class of the Predecessor Fund on the Valuation Date.
The following is a summary of the shares issued to Class C and Class R6 of the Predecessor Fund in the Reorganization:
NOTE 1 - SIGNIFICANT ACCOUNTING POLICIES
Basis of Preparation The fund is an investment company and follows accounting and reporting guidance in the Financial Accounting Standards Board (FASB) Accounting Standards Codification Topic 946 (ASC 946). The accompanying financial statements were prepared in accordance with accounting principles generally accepted in the United States of America (GAAP), including, but not limited to, ASC 946. GAAP requires the use of estimates made by management. Management believes that estimates and valuations are appropriate; however, actual results may differ from those estimates, and the valuations reflected in the accompanying financial statements may differ from the value ultimately realized upon sale or maturity. A short-period annual report for the 10-month period from August 1, 2016 through May 31, 2017 is presented, reflecting the change from the Predecessor Fund’s fiscal year-end of July 31 to the fund’s fiscal year of May 31.
Investment Transactions, Investment Income, and Distributions Investment transactions are accounted for on the trade date basis. Income and expenses are recorded on the accrual basis. Realized gains and losses are reported on the identified cost basis. Premiums and discounts on debt securities are amortized for financial reporting purposes. Dividends received from mutual fund investments are reflected as dividend income; capital gain distributions are reflected as realized gain/loss. Dividend income and capital gain distributions are recorded on the ex-dividend date. Income tax-related interest and penalties, if incurred, are recorded as income tax expense. Income distributions are declared by each class daily and paid monthly. Prior to the Reorganization, income distributions of the Predecessor Fund were declared and paid monthly. Distributions to shareholders are recorded on the ex-dividend date. A capital gain distribution may also be declared and paid by the fund annually.
Class Accounting Shareholder servicing, prospectus, and shareholder report expenses incurred by each class are charged directly to the class to which they relate. Expenses common to all classes and investment income are allocated to the classes based upon the relative daily net assets of each class’s settled shares; realized and unrealized gains and losses are allocated based upon the relative daily net assets of each class’s outstanding shares. To the extent any expenses are waived or reimbursed in accordance with an expense limitation (see Note 5), the waiver or reimbursement is charged to the applicable class or allocated across the classes in the same manner as the related expense. The Advisor Class pays Rule 12b-1 fees, in an amount not exceeding 0.25% of the class’s average daily net assets.
Redemption Fees A 2% fee is assessed on redemptions of fund shares held for 90 days or less to deter short-term trading and to protect the interests of long-term shareholders. However, all shares of the fund received in connection with the Reorganization will not be subject to the redemption fee. Any fund shares purchased after the Reorganization and any shares exchanged from the fund to another fund that charges a redemption fee will be subject to the redemption fee, if applicable, upon redemption. Redemption fees are withheld from proceeds that shareholders receive from the sale or exchange of fund shares. The fees are paid to the fund and are recorded as an increase to paid-in capital. The fees may cause the redemption price per share to differ from the net asset value per share.
New Accounting Guidance In March 2017, the FASB issued amended guidance to shorten the amortization period for certain callable debt securities, held at a premium. The guidance is effective for fiscal years and interim periods beginning after December 15, 2018. Adoption will have no effect on the fund’s net assets or results of operations.
On August 1, 2017, the fund implemented amendments to Regulation S-X, issued by the Securities and Exchange Commission, which require standardized, enhanced disclosures, particularly related to derivatives, in investment company financial statements. Adoption had no effect on the fund’s net assets or results of operations.
Indemnification In the normal course of business, the fund may provide indemnification in connection with its officers and directors, service providers, and/or private company investments. The fund’s maximum exposure under these arrangements is unknown; however, the risk of material loss is currently considered to be remote.
NOTE 2 - VALUATION
The fund’s financial instruments are valued and each class’s net asset value (NAV) per share is computed at the close of the New York Stock Exchange (NYSE), normally 4 p.m. ET, each day the NYSE is open for business. However, the NAV per share may be calculated at a time other than the normal close of the NYSE if trading on the NYSE is restricted, if the NYSE closes earlier, or as may be permitted by the SEC.
Fair Value The fund’s financial instruments are reported at fair value, which GAAP defines as the price that would be received to sell an asset or paid to transfer a liability in an orderly transaction between market participants at the measurement date. The T. Rowe Price Valuation Committee (the Valuation Committee) is an internal committee that has been delegated certain responsibilities by the fund’s Board of Directors (the Board) to ensure that financial instruments are appropriately priced at fair value in accordance with GAAP and the 1940 Act. Subject to oversight by the Board, the Valuation Committee develops and oversees pricing-related policies and procedures and approves all fair value determinations. Specifically, the Valuation Committee establishes procedures to value securities; determines pricing techniques, sources, and persons eligible to effect fair value pricing actions; oversees the selection, services, and performance of pricing vendors; oversees valuation-related business continuity practices; and provides guidance on internal controls and valuation-related matters. The Valuation Committee reports to the Board and has representation from legal, portfolio management and trading, operations, risk management, and the fund’s treasurer.
Various valuation techniques and inputs are used to determine the fair value of financial instruments. GAAP establishes the following fair value hierarchy that categorizes the inputs used to measure fair value:
Level 1 – quoted prices (unadjusted) in active markets for identical financial instruments that the fund can access at the reporting date
Level 2 – inputs other than Level 1 quoted prices that are observable, either directly or indirectly (including, but not limited to, quoted prices for similar financial instruments in active markets, quoted prices for identical or similar financial instruments in inactive markets, interest rates and yield curves, implied volatilities, and credit spreads)
Level 3 – unobservable inputs
Observable inputs are developed using market data, such as publicly available information about actual events or transactions, and reflect the assumptions that market participants would use to price the financial instrument. Unobservable inputs are those for which market data are not available and are developed using the best information available about the assumptions that market participants would use to price the financial instrument. GAAP requires valuation techniques to maximize the use of relevant observable inputs and minimize the use of unobservable inputs. When multiple inputs are used to derive fair value, the financial instrument is assigned to the level within the fair value hierarchy based on the lowest-level input that is significant to the fair value of the financial instrument. Input levels are not necessarily an indication of the risk or liquidity associated with financial instruments at that level but rather the degree of judgment used in determining those values.
Valuation Techniques Debt securities generally are traded in the over-the-counter (OTC) market. Securities with remaining maturities of one year or more at the time of acquisition are valued at prices furnished by dealers who make markets in such securities or by an independent pricing service, which considers the yield or price of bonds of comparable quality, coupon, maturity, and type, as well as prices quoted by dealers who make markets in such securities. Securities with remaining maturities of less than one year at the time of acquisition generally use amortized cost in local currency to approximate fair value. However, if amortized cost is deemed not to reflect fair value or the fund holds a significant amount of such securities with remaining maturities of more than 60 days, the securities are valued at prices furnished by dealers who make markets in such securities or by an independent pricing service. Generally, debt securities are categorized in Level 2 of the fair value hierarchy; however, to the extent the valuations include significant unobservable inputs, the securities would be categorized in Level 3.
Investments in mutual funds are valued at the mutual fund’s closing NAV per share on the day of valuation and are categorized in Level 1 of the fair value hierarchy. Assets and liabilities other than financial instruments, including short-term receivables and payables, are carried at cost, or estimated realizable value, if less, which approximates fair value.
Thinly traded financial instruments and those for which the above valuation procedures are inappropriate or are deemed not to reflect fair value are stated at fair value as determined in good faith by the Valuation Committee. The objective of any fair value pricing determination is to arrive at a price that could reasonably be expected from a current sale. Financial instruments fair valued by the Valuation Committee are primarily private placements, restricted securities, warrants, rights, and other securities that are not publicly traded.
Subject to oversight by the Board, the Valuation Committee regularly makes good faith judgments to establish and adjust the fair valuations of certain securities as events occur and circumstances warrant. For instance, in determining the fair value of troubled or thinly traded debt instruments, the Valuation Committee considers a variety of factors, which may include, but are not limited to, the issuer’s business prospects, its financial standing and performance, recent investment transactions in the issuer, strategic events affecting the company, market liquidity for the issuer, and general economic conditions and events. In consultation with the investment and pricing teams, the Valuation Committee will determine an appropriate valuation technique based on available information, which may include both observable and unobservable inputs. The Valuation Committee typically will afford greatest weight to actual prices in arm’s length transactions, to the extent they represent orderly transactions between market participants, transaction information can be reliably obtained, and prices are deemed representative of fair value. However, the Valuation Committee may also consider other valuation methods such as a discount or premium from market value of a similar, freely traded security of the same issuer; discounted cash flows; yield to maturity; or some combination. Fair value determinations are reviewed on a regular basis and updated as information becomes available, including actual purchase and sale transactions of the issue. Because any fair value determination involves a significant amount of judgment, there is a degree of subjectivity inherent in such pricing decisions, and fair value prices determined by the Valuation Committee could differ from those of other market participants. Depending on the relative significance of unobservable inputs, including the valuation technique(s) used, fair valued securities may be categorized in Level 2 or 3 of the fair value hierarchy.
Valuation Inputs The following table summarizes the fund’s financial instruments, based on the inputs used to determine their fair values on November 30, 2017:
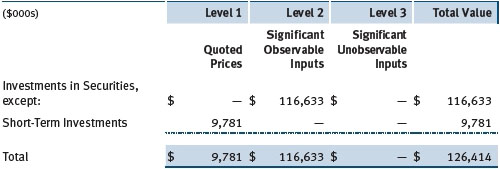
There were no material transfers between Levels 1 and 2 during the six months ended November 30, 2017.
NOTE 3 - OTHER INVESTMENT TRANSACTIONS
Consistent with its investment objective, the fund engages in the following practices to manage exposure to certain risks and/or to enhance performance. The investment objective, policies, program, and risk factors of the fund are described more fully in the fund’s prospectus and Statement of Additional Information.
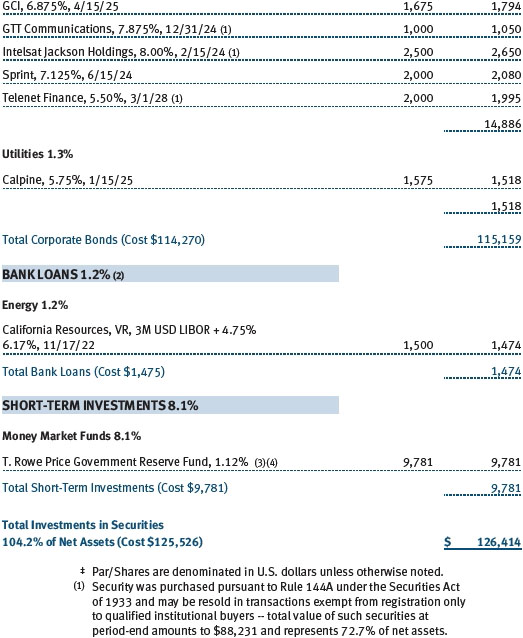
Noninvestment-Grade Debt At November 30, 2017, approximately 71% of the fund’s net assets were invested, either directly or through its investment in T. Rowe Price institutional funds, in noninvestment-grade debt, including “high yield” or “junk” bonds or leveraged loans. The noninvestment-grade debt market may experience sudden and sharp price swings due to a variety of factors, including changes in economic forecasts, stock market activity, large sustained sales by major investors, a high-profile default, or a change in market sentiment. These events may decrease the ability of issuers to make principal and interest payments and adversely affect the liquidity or value, or both, of such securities. Investments in noninvestment-grade holdings may be considered speculative.
Restricted Securities The fund may invest in securities that are subject to legal or contractual restrictions on resale. Prompt sale of such securities at an acceptable price may be difficult and may involve substantial delays and additional costs.
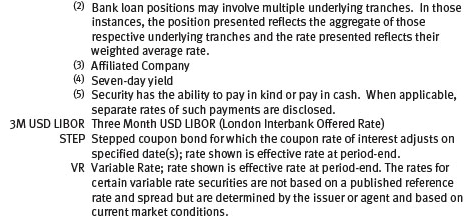
Bank Loans The fund may invest in bank loans, which represent an interest in amounts owed by a borrower to a syndicate of lenders. Bank loans are generally noninvestment grade and often involve borrowers whose financial condition is highly leveraged. Bank loans may be in the form of either assignments or participations. A loan assignment transfers all legal, beneficial, and economic rights to the buyer, and transfer typically requires consent of both the borrower and agent. In contrast, a loan participation generally entitles the buyer to receive the cash flows from principal, interest, and any fee payments on a portion of a loan; however, the seller continues to hold legal title to that portion of the loan. As a result, the buyer of a loan participation generally has no direct recourse against the borrower and is exposed to credit risk of both the borrower and seller of the participation. Bank loans often have extended settlement periods, generally may be repaid at any time at the option of the borrower, and may require additional principal to be funded at the borrowers’ discretion at a later date (e.g., unfunded commitments and revolving debt instruments). Until settlement, the fund maintains liquid assets sufficient to settle its unfunded loan commitments. The fund reflects both the funded portion of a bank loan as well as its unfunded commitment in the Portfolio of Investments. However, if a credit agreement provides no initial funding of a tranche, and funding of the full commitment at a future date(s) is at the borrower’s discretion and considered uncertain, a loan is reflected in the Portfolio of Investments only if, and only to the extent that, the fund has actually settled a funding commitment.
Other Purchases and sales of portfolio securities other than short-term securities aggregated $135,729,000 and $72,861,000, respectively, for the six months ended November 30, 2017.
NOTE 4 - FEDERAL INCOME TAXES
No provision for federal income taxes is required since the fund intends to continue to qualify as a regulated investment company under Subchapter M of the Internal Revenue Code and distribute to shareholders all of its taxable income and gains. Distributions determined in accordance with federal income tax regulations may differ in amount or character from net investment income and realized gains for financial reporting purposes. Financial reporting records are adjusted for permanent book/tax differences to reflect tax character but are not adjusted for temporary differences. The amount and character of tax-basis distributions and composition of net assets are finalized at fiscal year-end; accordingly, tax-basis balances have not been determined as of the date of this report.
At November 30, 2017, the cost of investments for federal income tax purposes was $125,563,000. Net unrealized gain aggregated $851,000 at period-end, of which $1,557,000 related to appreciated investments and $706,000 related to depreciated investments.
NOTE 5 - RELATED PARTY TRANSACTIONS
The fund is managed by T. Rowe Price Associates, Inc. (Price Associates), a wholly owned subsidiary of T. Rowe Price Group, Inc. (Price Group). The investment management agreement between the fund and Price Associates provides for an annual investment management fee, which is computed daily and paid monthly. The fee consists of an individual fund fee, equal to 0.30% of the fund’s average daily net assets, and a group fee. The group fee rate is calculated based on the combined net assets of certain mutual funds sponsored by Price Associates (the group) applied to a graduated fee schedule, with rates ranging from 0.48% for the first $1 billion of assets to 0.265% for assets in excess of $650 billion. The fund’s group fee is determined by applying the group fee rate to the fund’s average daily net assets. At November 30, 2017, the effective annual group fee rate was 0.29%.
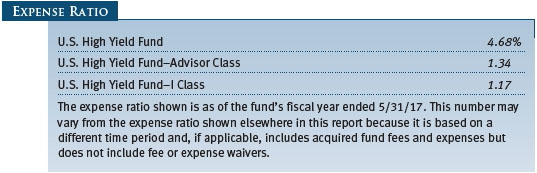
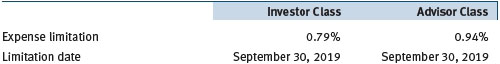
The Investor Class and Advisor Class are each subject to a contractual expense limitation through the limitation dates indicated in the table below. During the limitation period, Price Associates is required to waive its management fee or pay any expenses (excluding interest, expenses related to borrowings, taxes, brokerage, and other non-recurring expenses permitted by the investment management agreement) that would otherwise cause the class’s ratio of annualized total expenses to average net assets (expense ratio) to exceed its expense limitation. Each class is required to repay Price Associates for expenses previously waived/paid to the extent the class’s net assets grow or expenses decline sufficiently to allow repayment without causing the class’s expense ratio (after the repayment is taken into account) to exceed both: (1) the expense limitation in place at the time such amounts were waived; and (2) the class’s current expense limitation. However, no repayment will be made more than three years after the date of a payment or waiver.
The I Class is also subject to an operating expense limitation (I Class limit) pursuant to which Price Associates is contractually required to pay all operating expenses of the I Class, excluding management fees, interest, expenses related to borrowings, taxes, brokerage, and other non-recurring expenses permitted by the investment management agreement, to the extent such operating expenses, on an annualized basis, exceed 0.05% of average net assets. This agreement will continue until September 30, 2019, and may be renewed, revised, or revoked only with approval of the fund’s Board. The I Class is required to repay Price Associates for expenses previously paid to the extent the class’s net assets grow or expenses decline sufficiently to allow repayment without causing the class’s operating expenses (after the repayment is taken into account) to exceed both: (1) the expense limitation in place at the time such amounts were paid; and (2) the class’s current expense limitation. However, no repayment will be made more than three years after the date of a payment or waiver.
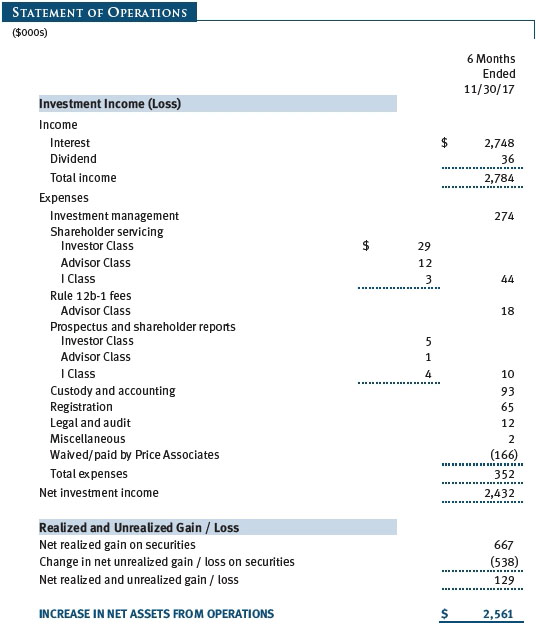
Pursuant to these agreements, $166,000 of expenses were waived/paid by Price Associates during the six months ended November 30, 2017. Including this amount, expenses previously waived/paid by Price Associates in the amount of $230,000 remain subject to repayment by the fund at November 30, 2017.
In addition, the fund has entered into service agreements with Price Associates and a wholly owned subsidiary of Price Associates (collectively, Price). Price Associates provides certain accounting and administrative services to the fund. T. Rowe Price Services, Inc. provides shareholder and administrative services in its capacity as the fund’s transfer and dividend-disbursing agent. For the six months ended November 30, 2017, expenses incurred pursuant to these service agreements were $44,000 for Price Associates and $22,000 for T. Rowe Price Services, Inc. The total amount payable at period-end pursuant to these service agreements is reflected as Due to Affiliates in the accompanying financial statements.
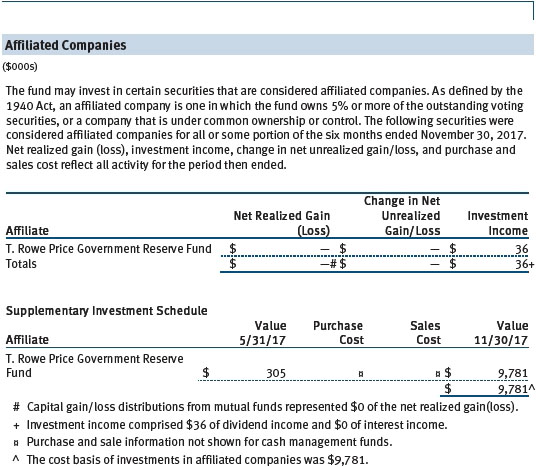
The fund may invest in certain open-end management investment companies managed by Price Associates and considered affiliates of the fund: the T. Rowe Price Government Reserve Fund or the T. Rowe Price Treasury Reserve Fund, organized as money market funds, or the T. Rowe Price Short-Term Fund, a short-term bond fund (collectively, the Price Reserve Funds). The Price Reserve Funds are offered as short-term investment options to mutual funds, trusts, and other accounts managed by Price Associates or its affiliates and are not available for direct purchase by members of the public. The Price Reserve Funds pay no investment management fees.
As of November 30, 2017, T. Rowe Price Group, Inc., or its wholly owned subsidiaries owned 24,655 shares of the Investor Class, representing less than 1% of the Investor Class’s net assets and 2,147,205 shares of the I Class, representing 55% of the I Class’s net assets.
The fund may participate in securities purchase and sale transactions with other funds or accounts advised by Price Associates (cross trades), in accordance with procedures adopted by the fund’s Board and Securities and Exchange Commission rules, which require, among other things, that such purchase and sale cross trades be effected at the independent current market price of the security. During the six months ended November 30, 2017, the fund had no purchases or sales cross trades with other funds or accounts advised by Price Associates.
| Information on Proxy Voting Policies, Procedures, and Records |
A description of the policies and procedures used by T. Rowe Price funds and portfolios to determine how to vote proxies relating to portfolio securities is available in each fund’s Statement of Additional Information. You may request this document by calling 1-800-225-5132 or by accessing the SEC’s website, sec.gov.
The description of our proxy voting policies and procedures is also available on our corporate website. To access it, please visit the following Web page:
https://www3.troweprice.com/usis/corporate/en/utility/policies.html
Scroll down to the section near the bottom of the page that says, “Proxy Voting Policies.” Click on the Proxy Voting Policies link in the shaded box.
Each fund’s most recent annual proxy voting record is available on our website and through the SEC’s website. To access it through T. Rowe Price, visit the website location shown above, and scroll down to the section near the bottom of the page that says, “Proxy Voting Records.” Click on the Proxy Voting Records link in the shaded box.
| How to Obtain Quarterly Portfolio Holdings |
The fund files a complete schedule of portfolio holdings with the Securities and Exchange Commission for the first and third quarters of each fiscal year on Form N-Q. The fund’s Form N-Q is available electronically on the SEC’s website (sec.gov); hard copies may be reviewed and copied at the SEC’s Public Reference Room, 100 F St. N.E., Washington, DC 20549. For more information on the Public Reference Room, call 1-800-SEC-0330.
Item 2. Code of Ethics.
A code of ethics, as defined in Item 2 of Form N-CSR, applicable to its principal executive officer, principal financial officer, principal accounting officer or controller, or persons performing similar functions is filed as an exhibit to the registrant’s annual Form N-CSR. No substantive amendments were approved or waivers were granted to this code of ethics during the registrant’s most recent fiscal half-year.
Item 3. Audit Committee Financial Expert.
Disclosure required in registrant’s annual Form N-CSR.
Item 4. Principal Accountant Fees and Services.
Disclosure required in registrant’s annual Form N-CSR.
Item 5. Audit Committee of Listed Registrants.
Not applicable.
Item 6. Investments.
(a) Not applicable. The complete schedule of investments is included in Item 1 of this Form N-CSR.
(b) Not applicable.
Item 7. Disclosure of Proxy Voting Policies and Procedures for Closed-End Management Investment Companies.
Not applicable.
Item 8. Portfolio Managers of Closed-End Management Investment Companies.
Not applicable.
Item 9. Purchases of Equity Securities by Closed-End Management Investment Company and Affiliated Purchasers.
Not applicable.
Item 10. Submission of Matters to a Vote of Security Holders.
Not applicable.
Item 11. Controls and Procedures.
(a) The registrant’s principal executive officer and principal financial officer have evaluated the registrant’s disclosure controls and procedures within 90 days of this filing and have concluded that the registrant’s disclosure controls and procedures were effective, as of that date, in ensuring that information required to be disclosed by the registrant in this Form N-CSR was recorded, processed, summarized, and reported timely.
(b) The registrant’s principal executive officer and principal financial officer are aware of no change in the registrant’s internal control over financial reporting that occurred during the registrant’s second fiscal quarter covered by this report that has materially affected, or is reasonably likely to materially affect, the registrant’s internal control over financial reporting.
Item 12. Exhibits.
(a)(1) The registrant’s code of ethics pursuant to Item 2 of Form N-CSR is filed with the registrant’s annual Form N-CSR.
(2) Separate certifications by the registrant's principal executive officer and principal financial officer, pursuant to Section 302 of the Sarbanes-Oxley Act of 2002 and required by Rule 30a-2(a) under the Investment Company Act of 1940, are attached.
(3) Written solicitation to repurchase securities issued by closed-end companies: not applicable.
(b) A certification by the registrant's principal executive officer and principal financial officer, pursuant to Section 906 of the Sarbanes-Oxley Act of 2002 and required by Rule 30a-2(b) under the Investment Company Act of 1940, is attached.
SIGNATURES
Pursuant to the requirements of the Securities Exchange Act of 1934 and the Investment Company Act of 1940, the registrant has duly caused this report to be signed on its behalf by the undersigned, thereunto duly authorized.
T. Rowe Price High Yield Fund, Inc.
| By | | /s/ Edward C. Bernard |
| | | Edward C. Bernard |
| | | Principal Executive Officer |
| |
| Date | | January 19, 2018 | | | | |
Pursuant to the requirements of the Securities Exchange Act of 1934 and the Investment Company Act of 1940, this report has been signed below by the following persons on behalf of the registrant and in the capacities and on the dates indicated.
| By | | /s/ Edward C. Bernard |
| | | Edward C. Bernard |
| | | Principal Executive Officer |
| |
| Date | | January 19, 2018 | | | | |
| |
| |
| By | | /s/ Catherine D. Mathews |
| | | Catherine D. Mathews |
| | | Principal Financial Officer |
| |
| Date | | January 19, 2018 | | | | |