UNITED STATES
SECURITIES AND EXCHANGE COMMISSION
Washington, D.C. 20549
FORM N-CSR
CERTIFIED SHAREHOLDER REPORT OF REGISTERED
MANAGEMENT INVESTMENT COMPANIES
Investment Company Act File Number: 811-04119
| T. Rowe Price High Yield Fund, Inc. |
|
| (Exact name of registrant as specified in charter) |
| |
| 100 East Pratt Street, Baltimore, MD 21202 |
|
| (Address of principal executive offices) |
| |
| David Oestreicher |
| 100 East Pratt Street, Baltimore, MD 21202 |
|
| (Name and address of agent for service) |
Registrant’s telephone number, including area code: (410) 345-2000
Date of fiscal year end: May 31
Date of reporting period: November 30, 2018
Item 1. Report to Shareholders
| High Yield Fund | November 30, 2018 |
Beginning on January 1, 2021, as permitted by SEC regulations, paper copies of the T. Rowe Price funds’ annual and semiannual shareholder reports will no longer be mailed, unless you specifically request them. Instead, shareholder reports will be made available on the funds’ website (troweprice.com/prospectus), and you will be notified by mail with a website link to access the reports each time a report is posted to the site.
If you already elected to receive reports electronically, you will not be affected by this change and need not take any action. At any time, shareholders who invest directly in T. Rowe Price funds may generally elect to receive reports or other communications electronically by enrolling attroweprice.com/paperlessor, if you are a retirement plan sponsor or invest in the funds through a financial intermediary (such as an investment advisor, broker-dealer, insurance company, or bank), by contacting your representative or your financial intermediary.
You may elect to continue receiving paper copies of future shareholder reports free of charge. To do so, if you invest directly with T. Rowe Price, please call T. Rowe Price as follows: IRA, nonretirement account holders, and institutional investors,1-800-225-5132; small business retirement accounts,1-800-492-7670. If you are a retirement plan sponsor or invest in the T. Rowe Price funds through a financial intermediary, please contact your representative or financial intermediary or follow additional instructions if included with this document. Your election to receive paper copies of reports will apply to all funds held in your account with your financial intermediary or, if you invest directly in the T. Rowe Price funds, with T. Rowe Price. Your election can be changed at any time in the future.
| T. ROWE PRICE HIGH YIELD FUND |
|
HIGHLIGHTS
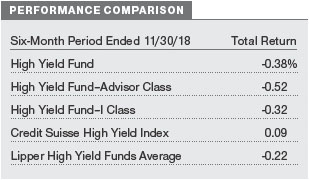
| ■ | The High Yield Fund posted a loss during our reporting period, underperforming the benchmark Credit Suisse High Yield Index and modestly lagging its Lipper peer group average. |
| |
| ■ | European high yield market losses were the primary factor that detracted from the fund’s performance over the past six months. |
| |
| ■ | We have been harvesting some gains in the loan segment and are redeploying those assets into discounted, higher-quality BB rated bonds. |
| |
| ■ | We are moving into a more challenging macroeconomic environment, and market volatility is likely to persist. |

Log in to your account attroweprice.comfor more information.
*Certain mutual fund accounts that are assessed an annual account service fee can also save money by switching to e-delivery.
CIO Market Commentary
Dear Shareholder
Financial markets were challenging for both bond and stock investors in the six months ended November 30, 2018, the first half of your fund’s fiscal year. Longer-term Treasury yields rose through most of the period, providing a general headwind to fixed income returns. The prospect of higher interest rates also weighed on stock prices, and investors faced additional tests from deepening U.S.-China trade tensions, a strengthening U.S. dollar, and signs of slowing global growth.
The weak performance of most asset classes over the past six months stood in stark contrast to solid fundamentals, particularly in the U.S. Thanks in part to recent fiscal stimulus, U.S. gross domestic product expanded at an annualized rate of 4.2% in the second quarter of the year and 3.5% in the third—the best back-to-back performance in four years. Profit growth in the two quarters was even more impressive, with earnings for the S&P 500 as a whole rising at the fastest pace since the recovery from the financial crisis nearly a decade ago.
As usual, the robust economy presented a mixed blessing for bond investors. The strong economic data—including signs that wage gains were finally taking root—fostered a rise in longer-term interest rates and weighed on bond prices. (Bond prices and yields move in opposite directions.) The yield on the benchmark 10-year Treasury note jumped from 2.83% at the end of May to 3.25% in intraday trading on October 5—its highest level since the summer of 2011.
On the positive side, healthy economic conditions also helped solidify borrowers’ balance sheets, bolstering corporate bonds and other credit-sensitive issues. Riskier bonds also typically sport higher coupons, which helped insulate total returns from a decline in bond prices. Indeed, asset-backed securities and better-rated (B and Ba) high yield corporate bonds were among the few fixed income sectors to record gains during the period. Leveraged loans, which feature floating interest rates, were also positive.
Solid economic data paired with tame overall inflation allowed the Federal Reserve to stick to its path of gradually raising short-term interest rates, boosting returns for those seeking current income. The Fed raised the federal funds rate again in June and September and, as of this writing, appears likely to do so again in December. The Fed’s rate increases and the strong U.S. economy attracted assets from overseas, where interest rates in most developed economies generally remained near zero. As a result, most currencies fell against the dollar, weighing on returns for U.S. investors in foreign markets.
The jump in interest rates eventually spilled over into U.S. equity markets, helping push the S&P 500 Index back into its second correction (down over 10% from its highs) for the year in the month of October. Rising trade tensions with China and slowing growth in Europe and Asia also contributed to the turn in sentiment.
In fact, worries about the U.S. economy overheating and sparking inflation dissipated in November, as investors grew more concerned that global growth would slow significantly in 2019. Some late disappointing economic data, along with investors shifting assets from stocks to bonds, caused longer-term bond yields to fall back sharply. In just a few weeks, the yield on the 10-year Treasury note retraced more than half of its advance since May and ended November just above 3%.
While a slowdown in the U.S. economy and corporate profit growth seems all but inevitable in 2019, it seems premature to conclude that the current expansion is coming to an end. Late-cycle markets such as this one tend to create challenges but also dislocations that savvy investors can exploit. You can be confident that your fund’s manager is drawing on the firm’s in-depth research and fundamental analysis in seeking to find opportunities in the coming year.
Thank you for your continued confidence in T. Rowe Price.
Sincerely,

Robert Sharps
Group Chief Investment Officer
Management’s Discussion of Fund Performance
INVESTMENT OBJECTIVE
The fund seeks high current income and, secondarily, capital appreciation.
FUND COMMENTARY
How did the fund perform in the past six months?
The High Yield Fund returned -0.38% in the six months ended November 30, 2018, underperforming its benchmark, the Credit Suisse High Yield Index, and modestly lagging its Lipper peer group average. (Returns for Advisor and I Class shares variedslightly, reflecting their different fee structures.Past performance cannot guarantee future results.)
What factors influenced the fund’s performance?
European high yield market losses were the primary factor that influenced the fund’sperformance over the last six months. The region struggled—particularly in the fourth quarter—after the resumption of Brexit uncertainty and due to concerns about slowing global economic growth. The general downward shift in economic momentum caused significant anxiety among investors about whether we are heading toward the next recession.
In terms of the fund’s regional performance, our European allocation declined sharply, while emerging markets were flat and the U.S. marginally advanced. Although we have reduced the fund’s holdings in Europe, we generally still maintain a greater exposure to the region than most traditional high yield mutual funds, which contributed to our underperformance versus the Lipper peer group average.
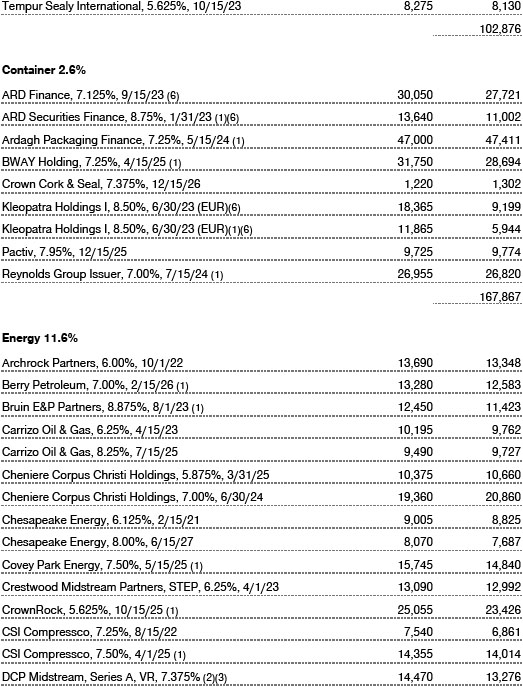
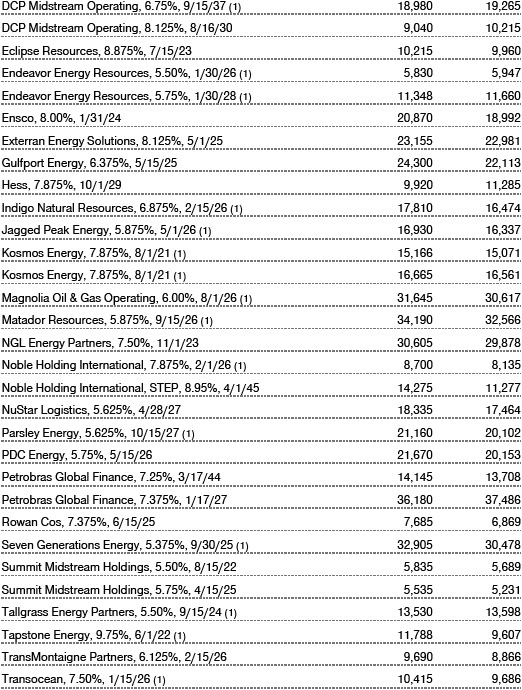
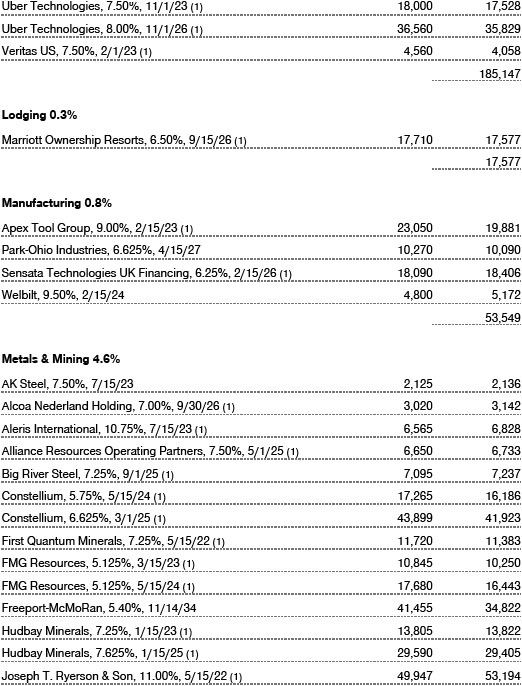
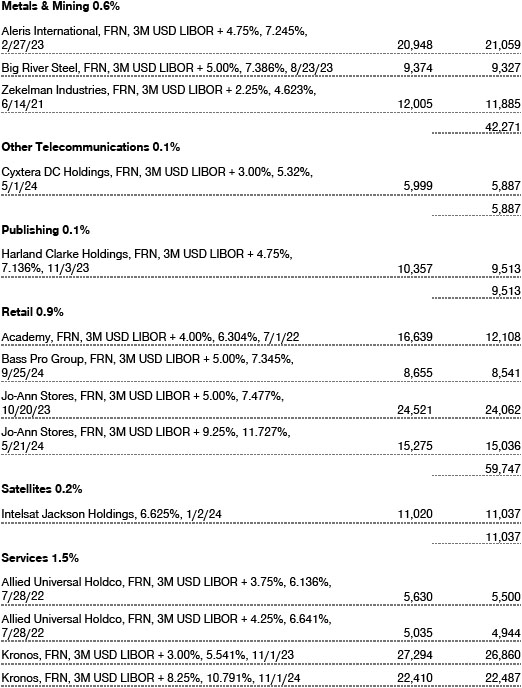
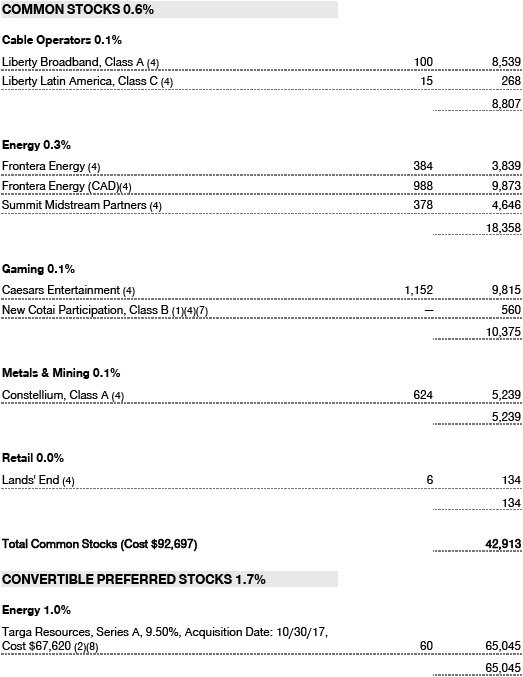
After benefiting during the first half of the year from operating under the strongest economic conditions since the global financial crisis, the economy pivoted to a slower pace of growth. Pockets of weakness began to emerge around key sectors that drive the economy, including commodities-relatedindustries. We witnessed a sharp sell-off in energy credits as oil prices tumbled late in the period to almost $50 per barrel. Similarly, the metals and mining segment experienced significant weakness, largely due to waning demand from China, the world’s biggest consumer of metal commodities.
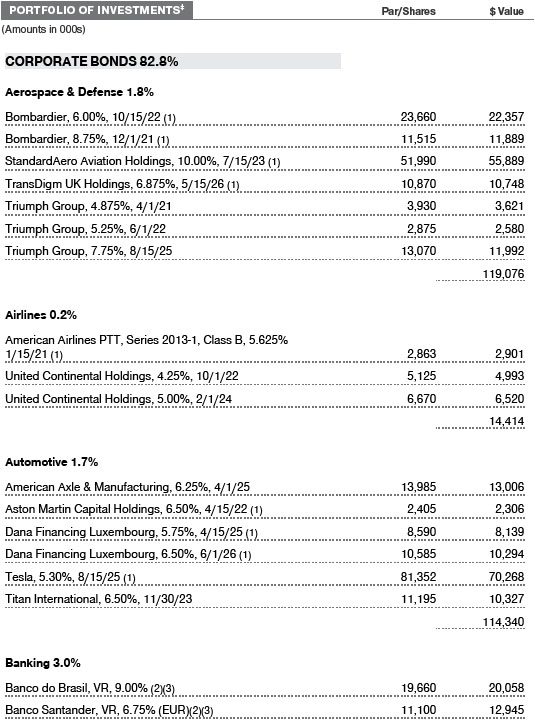
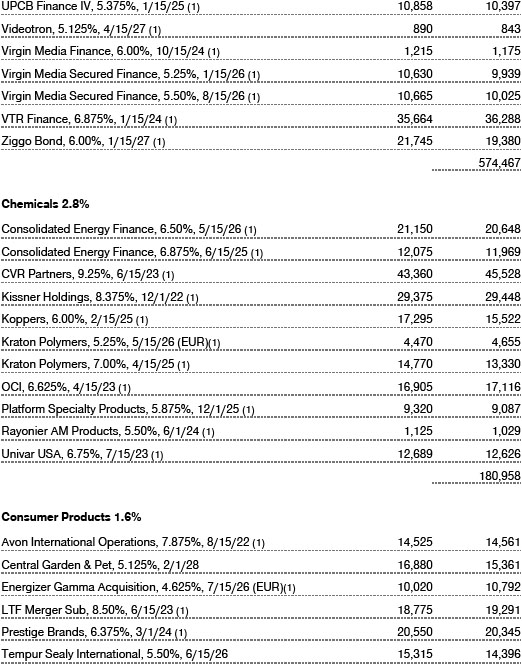
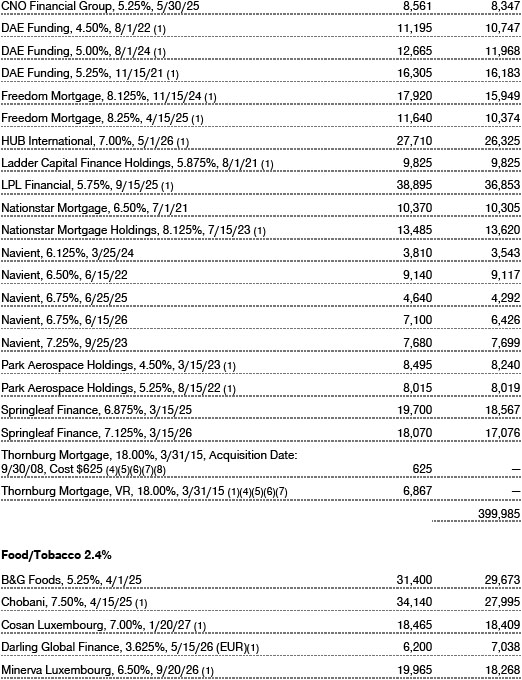
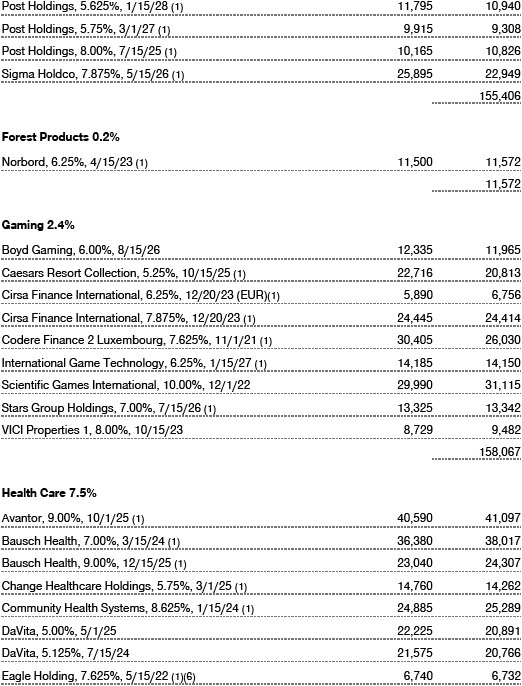
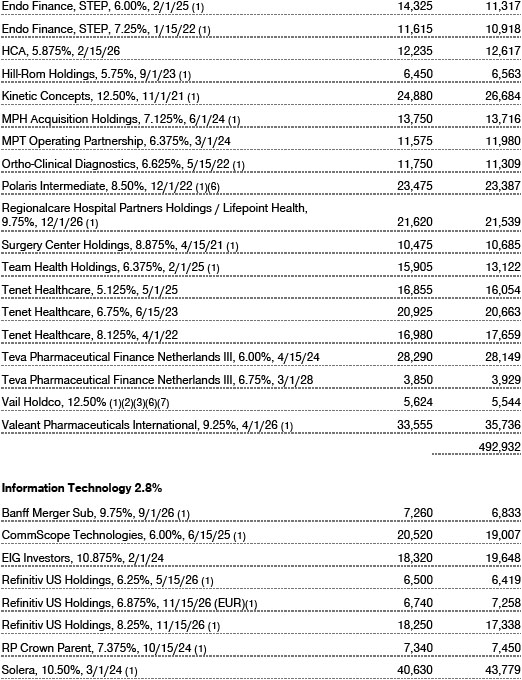
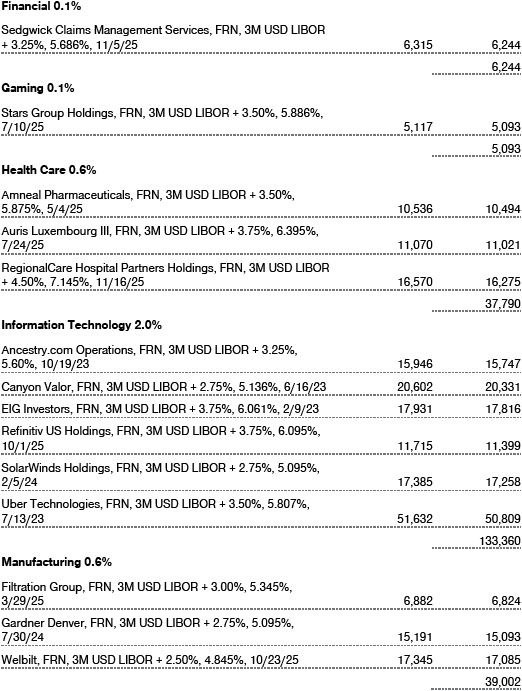
Credit selection in the containers and metals and mining segments weighed on relative performance during our reporting period. In the containers industry, our investment inKlöckner Pentaplast, a Germany-based leading global manufacturer of rigid plastic film solutions, was a notable detractor. These bonds traded significantly lower after the company reported disappointing third-quarter results, which revealed that it was unable to recover from the combination of a spike inraw materials costs and poor pricing decisions. (Please refer to the portfolio of investments for a complete list of holdings and the amount each represents in the portfolio.)
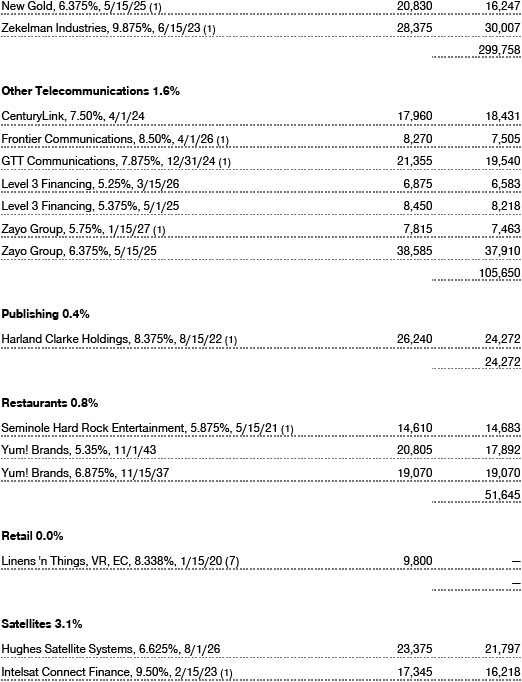
In the metals and mining industry, our investment inNew Gold, a Canadian natural resource company that acquires, explores, and develops gold properties, was a drag on relative performance. The bonds came under pressure due to significant delays at the company’s Rainy River project in northwestern Ontario and the increasing costs associated with production postponements. We have reduced our exposure to this issuer until at least next year when production is expected to improve.
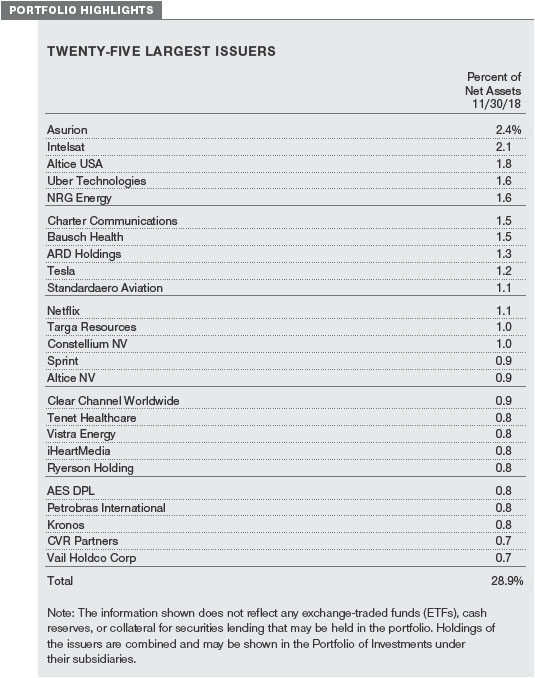
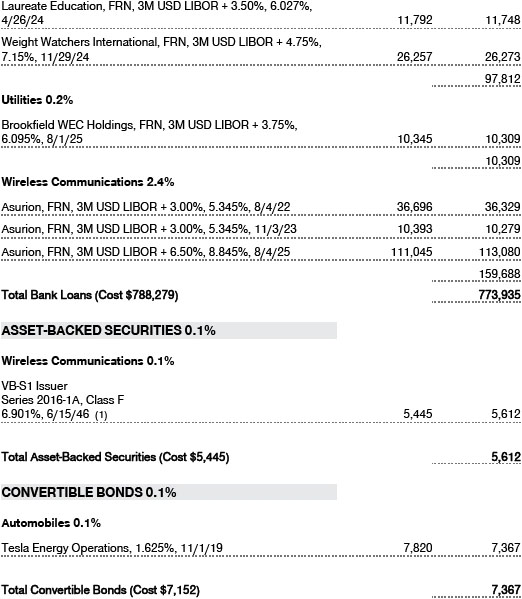
Floating rate bank loans—our largest off-index allocation—made a meaningful relative performance contribution. The loan asset class has historically performed well relative to other fixed income segments during periods of rising interest rates. Within the media/telecommunications segment, loan-only issuerAsurion—the fund’s largest position—was a notable outperformer. Asurion is a mobile phone insurance provider that benefits from smartphone sales without depending on the execution of one specific carrier, meaning that it’s well positioned to benefit from the evolution of the wireless industry. Asurion’s scale acts as a significant barrier to entry, allowing the issuer to provide more valuable services to its carrier customers at a lower cost than its competitors.
In the transportation segment, our investment in leading electric vehicle manufacturerTeslagenerated strong results. For much of the year, negative press weighed on Tesla’s performance. However, our analysts’ visits with the company reaffirmed their conviction in the issuer, which became one of the portfolio’s noteworthy turnaround stories of 2018. These bonds traded higher after Tesla reported recordthird-quarter profits on the back of the solid performance of its Model 3 sedan. The strong sales dramatically improved Tesla’s cash flow profile, and we expect the company to continue generating significant free cash flow well into 2019.
How is the fund positioned?
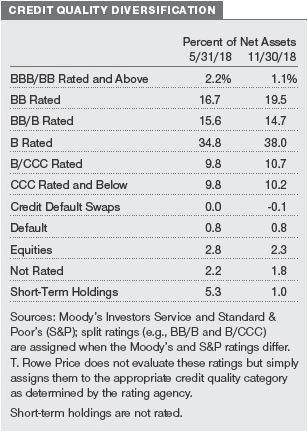
The fund is focused on bonds in the upper credit quality tiers of the high yield market. Bonds rated split B and higher (including reserves) accounted for 85% of the fund’s assets at the end of the reporting period; this includes our off-index allocation to bank loans, which offer risk-adjusted exposure to high yield issuers with less interest rate risk. Among the lower-qualitytiers, we favor bonds that are moving toward an upgrade or positions that we feel are misrated by the credit rating agencies. Bottom-up credit selection based on rigorous fundamental analysis by our global team of analysts is the primary determinant for inclusion in the fund.
Our bank loan holdings have performed extremely well in 2018. We have been harvesting some gains in the loan segment and are redeploying those assets into discounted, higher-quality BB rated bonds. As the Federal Reserve approaches the end of its tightening cycle due to moderating economic conditions, we may begin to see interest rates trending lower. In our view, this is an opportune time to increase the portfolio’s holdings of BB rated lower-coupon bonds in which we are finding value.
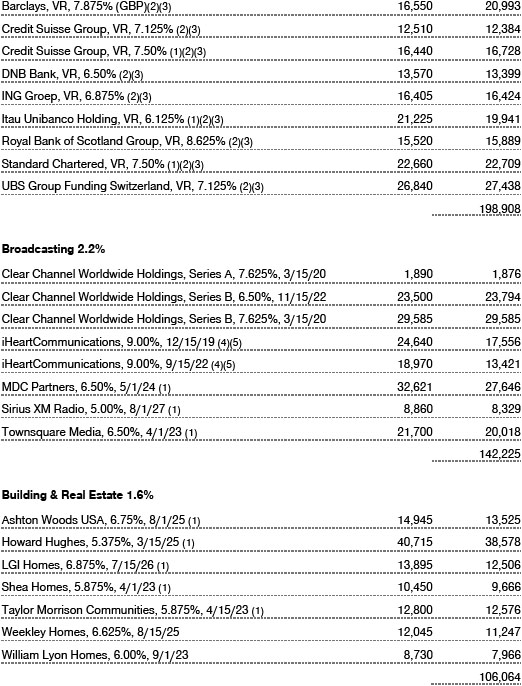
In the last three months, we witnessed some stabilization in emerging markets credits and believe developing regions are a relatively attractive investment option. We expect emerging markets to increasingly benefit from more favorable secular trends relative to the developed world, especially as the U.S. economy begins to pull back from peak levels. We have recently added to our holdings in Brazil. Investors have been exhibiting greater optimism due to the potential for Brazil’s new administration to implement important political and economic reforms that could spark a return to stronger growth.
What is portfolio management’s outlook?
We believe that we have reached the point in the credit cycle where growth, corporate earnings, central bank stimulus, and liquidity have peaked, and we are clearly moving into a more challenging macroeconomic environment. Whether policymakers will be able to orchestrate a “soft landing” and sustain the economy’s momentum at lower levels of growth while avoiding a recession is a key issue for 2019. There is some uncertainty surrounding the Fed’s interest rate strategy for next year. Given the recent volatility, the central bank may attempt to stabilize financial markets by slowing the pace of rate hikes.
Fundamental conditions are supportive for high yield issuers, and we expect the default rate in 2019 to remain below the historical average. Nevertheless, we have tempered our near-term performance expectations for the high yield asset class. Trade disputes with China are creating geopolitical challenges, and private corporations could get caught in the crossfire. Market volatility is likely to persist as investors try to resolve the basic question of supportive fundamentals versus macroeconomic conditions that have introduced considerable uncertainty.
The views expressed reflect the opinions of T. Rowe Price as of the date of this report and are subject to change based on changes in market, economic, or other conditions. These views are not intended to be a forecast of future events and are no guarantee of future results.
RISKS OF BOND INVESTING
Bonds are subject to interest rate risk, the decline in bond prices that usually accompanies a rise in interest rates, and credit risk, the chance that any fund holding could have its credit rating downgraded or that a bond issuer will default (fail to make timely payments of interest or principal), potentially reducing the fund’s income level and share price. High yield corporate bonds could have greater price declines than funds that invest primarily in high-quality bonds. Companies issuing high yield bonds are not as strong financially as those with higher credit ratings, so the bonds are usually considered to be speculative investments. Bank loans may at times become difficult to value and highly illiquid; they are subject to credit risk such as nonpayment of principal or interest, and risks of bankruptcy and insolvency.
Investing in the securities of non-U.S. issuers involves special risks not typically associated with investing in U.S. issuers. Foreign securities tend to be more volatile and less liquid than investments in U.S. securities and may lose value because of adverse local, political, social, or economic developments overseas or due to changes in the exchange rates between foreign currencies and the U.S. dollar. In addition, foreign investments are subject to settlement practices and regulatory and financial reporting standards that differ from those of the U.S. These risks are heightened for the fund’s investments in emerging markets, which are more susceptible to governmental interference, less efficient trading markets, and the imposition of local taxes or restrictions on gaining access to sales proceeds for foreign investors.
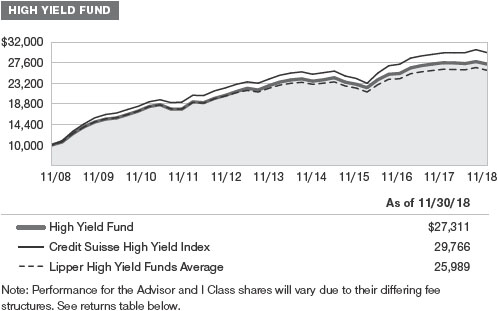
GROWTH OF $10,000
This chart shows the value of a hypothetical $10,000 investment in the fund over the past 10 fiscal year periods or since inception (for funds lacking 10-year records). The result is compared with benchmarks, which include a broad-based market index and may also include a peer group average or index. Market indexes do not include expenses, which are deducted from fund returns as well as mutual fund averages and indexes.
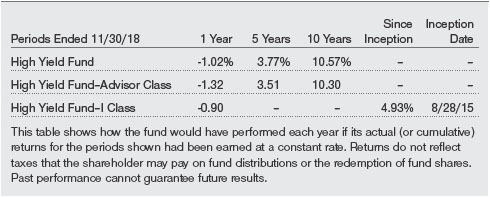
AVERAGE ANNUAL COMPOUND TOTAL RETURN
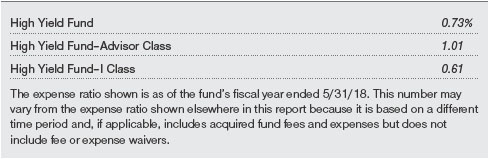
EXPENSE RATIO
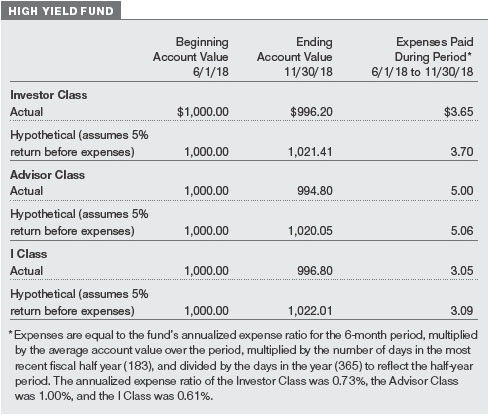
FUND EXPENSE EXAMPLE
As a mutual fund shareholder, you may incur two types of costs: (1) transaction costs, such as redemption fees or sales loads, and (2) ongoing costs, including management fees, distribution and service (12b-1) fees, and other fund expenses. The following example is intended to help you understand your ongoing costs (in dollars) of investing in the fund and to compare these costs with the ongoing costs of investing in other mutual funds. The example is based on an investment of $1,000 invested at the beginning of the most recent six-month period and held for the entire period.
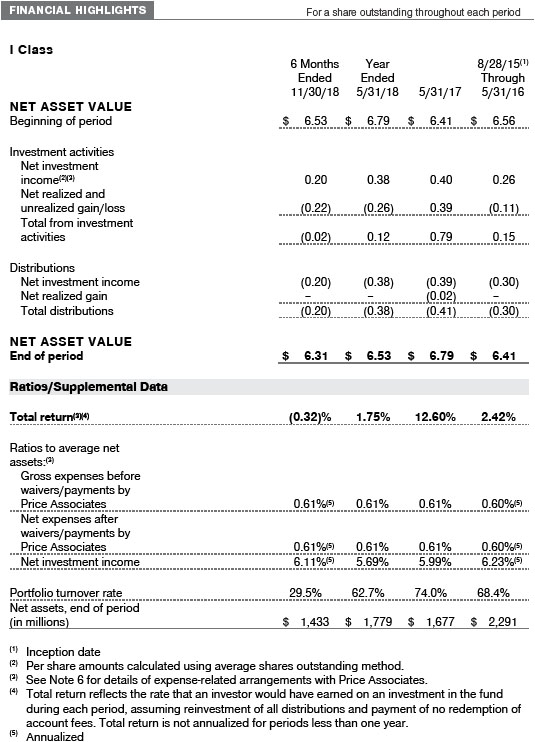
Please note that the fund has three share classes: The original share class (Investor Class) charges no distribution and service (12b-1) fee, the Advisor Class shares are offered only through unaffiliated brokers and other financial intermediaries and charge a 0.25% 12b-1 fee, and I Class shares are available to institutionally oriented clients and impose no 12b-1 or administrative fee payment. Each share class is presented separately in the table.
Actual Expenses
The first line of the following table (Actual) provides information about actual account values and expenses based on the fund’s actual returns. You may use the information on this line, together with your account balance, to estimate the expenses that you paid over the period. Simply divide your account value by $1,000 (for example, an $8,600 account value divided by $1,000 = 8.6), then multiply the result by the number on the first line under the heading “Expenses Paid During Period” to estimate the expenses you paid on your account during this period.
Hypothetical Example for Comparison Purposes
The information on the second line of the table (Hypothetical) is based on hypothetical account values and expenses derived from the fund’s actual expense ratio and an assumed 5% per year rate of return before expenses (not the fund’s actual return). You may compare the ongoing costs of investing in the fund with other funds by contrasting this 5% hypothetical example and the 5% hypothetical examples that appear in the shareholder reports of the other funds. The hypothetical account values and expenses may not be used to estimate the actual ending account balance or expenses you paid for the period.
Note:T. Rowe Price charges an annual account service fee of $20, generally for accounts with less than $10,000. The fee is waived for any investor whose T. Rowe Price mutual fund accounts total $50,000 or more; accounts electing to receive electronic delivery of account statements, transaction confirmations, prospectuses, and shareholder reports; or accounts of an investor who is a T. Rowe Price Personal Services or Enhanced Personal Services client (enrollment in these programs generally requires T. Rowe Price assets of at least $250,000). This fee is not included in the accompanying table. If you are subject to the fee, keep it in mind when you are estimating the ongoing expenses of investing in the fund and when comparing the expenses of this fund with other funds.
You should also be aware that the expenses shown in the table highlight only your ongoing costs and do not reflect any transaction costs, such as redemption fees or sales loads. Therefore, the second line of the table is useful in comparing ongoing costs only and will not help you determine the relative total costs of owning different funds. To the extent a fund charges transaction costs, however, the total cost of owning that fund is higher.
QUARTER-END RETURNS
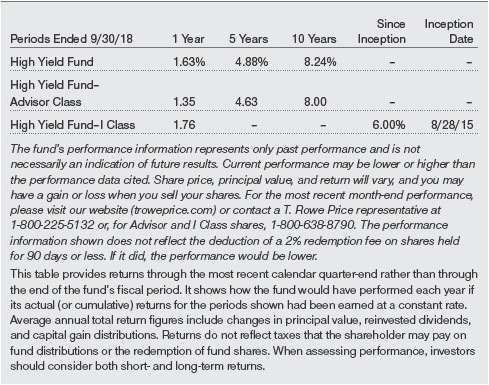
Unaudited
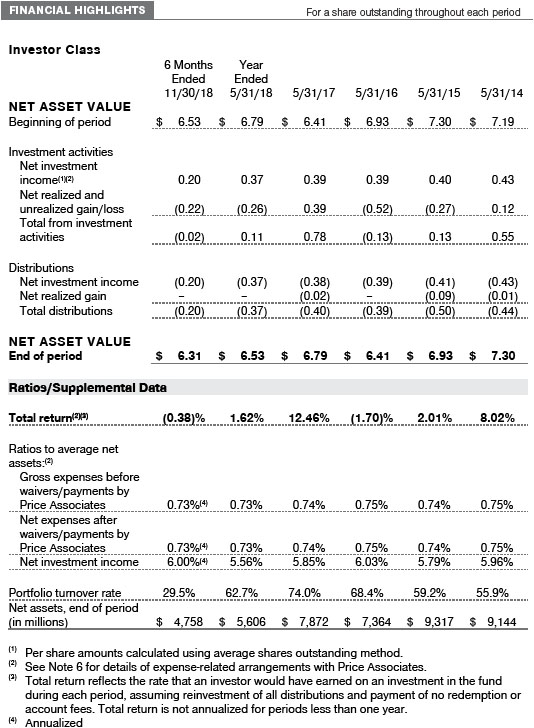
The accompanying notes are an integral part of these financial statements.
Unaudited
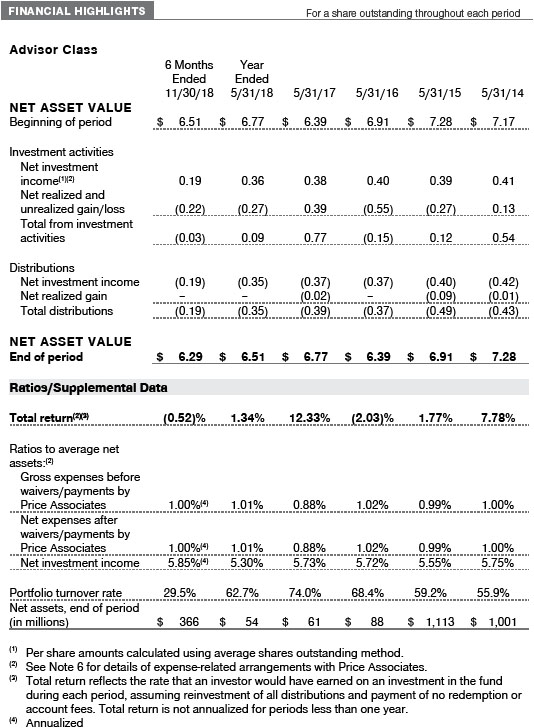
The accompanying notes are an integral part of these financial statements.
Unaudited
The accompanying notes are an integral part of these financial statements.
Unaudited
The accompanying notes are an integral part of these financial statements.
Unaudited
The accompanying notes are an integral part of these financial statements.
Unaudited
The accompanying notes are an integral part of these financial statements.
Unaudited
The accompanying notes are an integral part of these financial statements.
Unaudited
| NOTES TO FINANCIAL STATEMENTS |
T. Rowe Price High Yield Fund, Inc. (the corporation) is registered under the Investment Company Act of 1940 (the 1940 Act). The High Yield Fund (the fund) is a diversified, open-end management investment company established by the corporation. The fund seeks high current income and, secondarily, capital appreciation. The fund has three classes of shares: the High Yield Fund (Investor Class), the High Yield Fund–Advisor Class (Advisor Class), and the High Yield Fund–I Class (I Class). Advisor Class shares are sold only through unaffiliated brokers and other unaffiliated financial intermediaries. I Class shares generally are available only to investors meeting a $1,000,000 minimum investment, although the minimum is generally waived for certain client accounts. The Advisor Class operates under a Board-approved Rule 12b-1 plan pursuant to which the class compensates financial intermediaries for distribution, shareholder servicing, and/or certain administrative services; the Investor and I Classes do not pay Rule 12b-1 fees. Each class has exclusive voting rights on matters related solely to that class; separate voting rights on matters that relate to all classes; and, in all other respects, the same rights and obligations as the other classes.
NOTE 1 - SIGNIFICANT ACCOUNTING POLICIES
Basis of PreparationThe fund is an investment company and follows accounting and reporting guidance in the Financial Accounting Standards Board (FASB)Accounting Standards CodificationTopic 946 (ASC 946). The accompanying financial statements were prepared in accordance with accounting principles generally accepted in the United States of America (GAAP), including, but not limited to, ASC 946. GAAP requires the use of estimates made by management. Management believes that estimates and valuations are appropriate; however, actual results may differ from those estimates, and the valuations reflected in the accompanying financial statements may differ from the value ultimately realized upon sale or maturity. Certain ratios in the accompanying Financial Highlights have been included to conform to the current year presentation.
Investment Transactions, Investment Income, and DistributionsInvestment transactions are accounted for on the trade date basis. Income and expenses are recorded on the accrual basis. Realized gains and losses are reported on the identified cost basis. Premiums and discounts on debt securities are amortized for financial reporting purposes. Paydown gains and losses are recorded as an adjustment to interest income. Income tax-related interest and penalties, if incurred, are recorded as income tax expense. Dividends received from mutual fund investments are reflected as dividend income; capital gain distributions are reflected as realized gain/loss. Dividend income and capitalgain distributions are recorded on the ex-dividend date. Distributions to shareholders are recorded on the ex-dividend date. Income distributions are declared by each class daily and paid monthly. A capital gain distribution may also be declared and paid by the fund annually.
Currency TranslationAssets, including investments, and liabilities denominated in foreign currencies are translated into U.S. dollar values each day at the prevailing exchange rate, using the mean of the bid and asked prices of such currencies against U.S. dollars as quoted by a major bank. Purchases and sales of securities, income, and expenses are translated into U.S. dollars at the prevailing exchange rate on the respective date of such transaction. The effect of changes in foreign currency exchange rates on realized and unrealized security gains and losses is not bifurcated from the portion attributable to changes in market prices.
Class AccountingShareholder servicing, prospectus, and shareholder report expenses incurred by each class are charged directly to the class to which they relate. Expenses common to all classes and investment income are allocated to the classes based upon the relative daily net assets of each class’s settled shares; realized and unrealized gains and losses are allocated based upon the relative daily net assets of each class’s outstanding shares. To the extent any expenses are waived or reimbursed in accordance with an expense limitation (see Note 6), the waiver or reimbursement is charged to the applicable class or allocated across the classes in the same manner as the related expense. The Advisor Class pays Rule 12b-1 fees, in an amount not exceeding 0.25% of the class’s average daily net assets.
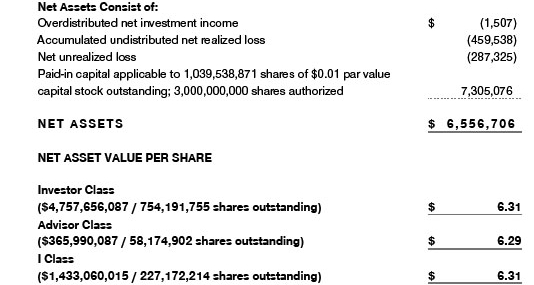
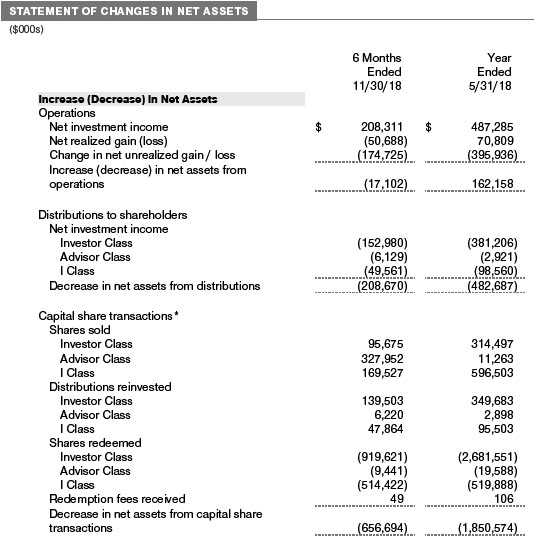
Redemption FeesA 2% fee is assessed on redemptions of fund shares held for 90 days or less to deter short-term trading and to protect the interests of long-term shareholders. Redemption fees are withheld from proceeds that shareholders receive from the sale or exchange of fund shares. The fees are paid to the fund and are recorded as an increase to paid-in capital. The fees may cause the redemption price per share to differ from the net asset value per share.
New Accounting GuidanceIn March 2017, the FASB issued amended guidance to shorten the amortization period for certain callable debt securities held at a premium. The guidance is effective for fiscal years and interim periods beginning after December 15, 2018. Adoption will have no effect on the fund’s net assets or results of operations.
IndemnificationIn the normal course of business, the fund may provide indemnification in connection with its officers and directors, service providers, and/or private company investments. The fund’s maximum exposure under these arrangements is unknown; however, the risk of material loss is currently considered to be remote.
NOTE 2 - VALUATION
The fund’s financial instruments are valued and each class’s net asset value (NAV) per share is computed at the close of the New York Stock Exchange (NYSE), normally 4 p.m. ET, each day the NYSE is open for business. However, the NAV per share may be calculated at a time other than the normal close of the NYSE if trading on the NYSE is restricted, if the NYSE closes earlier, or as may be permitted by the SEC.
Fair ValueThe fund’s financial instruments are reported at fair value, which GAAP defines as the price that would be received to sell an asset or paid to transfer a liability in an orderly transaction between market participants at the measurement date. The T. Rowe Price Valuation Committee (the Valuation Committee) is an internal committee that has been delegated certain responsibilities by the fund’s Board of Directors (the Board) to ensure that financial instruments are appropriately priced at fair value in accordance with GAAP and the 1940 Act. Subject to oversight by the Board, the Valuation Committee develops and oversees pricing-related policies and procedures and approves all fair value determinations. Specifically, the Valuation Committee establishes procedures to value securities; determines pricing techniques, sources, and persons eligible to effect fair value pricing actions; oversees the selection, services, and performance of pricing vendors; oversees valuation-related business continuity practices; and provides guidance on internal controls and valuation-related matters. The Valuation Committee reports to the Board and has representation from legal, portfolio management and trading, operations, risk management, and the fund’s treasurer.
Various valuation techniques and inputs are used to determine the fair value of financial instruments. GAAP establishes the following fair value hierarchy that categorizes the inputs used to measure fair value:
Level 1 – quoted prices (unadjusted) in active markets for identical financial instruments that the fund can access at the reporting date
Level 2 – inputs other than Level 1 quoted prices that are observable, either directly or indirectly (including, but not limited to, quoted prices for similar financial instruments in active markets, quoted prices for identical or similar financial instruments in inactive markets, interest rates and yield curves, implied volatilities, and credit spreads)
Level 3 – unobservable inputs
Observable inputs are developed using market data, such as publicly available information about actual events or transactions, and reflect the assumptions that market participants would use to price the financial instrument. Unobservable inputs are those for which market data are not available and are developed using the best informationavailable about the assumptions that market participants would use to price the financial instrument. GAAP requires valuation techniques to maximize the use of relevant observable inputs and minimize the use of unobservable inputs. When multiple inputs are used to derive fair value, the financial instrument is assigned to the level within the fair value hierarchy based on the lowest-level input that is significant to the fair value of the financial instrument. Input levels are not necessarily an indication of the risk or liquidity associated with financial instruments at that level but rather the degree of judgment used in determining those values.
Valuation TechniquesDebt securities generally are traded in the over-the-counter (OTC) market and are valued at prices furnished by dealers who make markets in such securities or by an independent pricing service, which considers the yield or price of bonds of comparable quality, coupon, maturity, and type, as well as prices quoted by dealers who make markets in such securities. Generally, debt securities are categorized in Level 2 of the fair value hierarchy; however, to the extent the valuations include significant unobservable inputs, the securities would be categorized in Level 3.
Equity securities listed or regularly traded on a securities exchange or in the OTC market are valued at the last quoted sale price or, for certain markets, the official closing price at the time the valuations are made. OTC Bulletin Board securities are valued at the mean of the closing bid and asked prices. A security that is listed or traded on more than one exchange is valued at the quotation on the exchange determined to be the primary market for such security. Listed securities not traded on a particular day are valued at the mean of the closing bid and asked prices for domestic securities and the last quoted sale or closing price for international securities.
For valuation purposes, the last quoted prices of non-U.S. equity securities may be adjusted to reflect the fair value of such securities at the close of the NYSE. If the fund determines that developments between the close of a foreign market and the close of the NYSE will, affect the value of some or all of its portfolio securities, the fund will adjust the previous quoted prices to reflect what it believes to be the fair value of the securities as of the close of the NYSE. In deciding whether it is necessary to adjust quoted prices to reflect fair value, the fund reviews a variety of factors, including developments in foreign markets, the performance of U.S. securities markets, and the performance of instruments trading in U.S. markets that represent foreign securities and baskets of foreign securities. The fund may also fair value securities in other situations, such as when a particular foreign market is closed but the fund is open. The fund uses outside pricing services to provide it with quoted prices and information to evaluate or adjust those prices. The fund cannot predict how often it will use quoted prices and how often it will determine it necessary to adjust those prices to reflect fair value. As a means of evaluating its security valuation process, the fund routinely compares quoted prices, the next day’s opening prices in the same markets, and adjusted prices.
Actively traded equity securities listed on a domestic exchange generally are categorized in Level 1 of the fair value hierarchy. Non-U.S. equity securities generally are categorized in Level 2 of the fair value hierarchy despite the availability of quoted prices because, as described above, the fund evaluates and determines whether those quoted prices reflect fair value at the close of the NYSE or require adjustment. OTC Bulletin Board securities, certain preferred securities, and equity securities traded in inactive markets generally are categorized in Level 2 of the fair value hierarchy.
Investments in mutual funds are valued at the mutual fund’s closing NAV per share on the day of valuation and are categorized in Level 1 of the fair value hierarchy. Forward currency exchange contracts are valued using the prevailing forward exchange rate and are categorized in Level 2 of the fair value hierarchy. Swaps are valued at prices furnished by an independent pricing service or independent swap dealers and generally are categorized in Level 2 of the fair value hierarchy; however, if unobservable inputs are significant to the valuation, the swap would be categorized in Level 3. Assets and liabilities other than financial instruments, including short-term receivables and payables, are carried at cost, or estimated realizable value, if less, which approximates fair value.
Thinly traded financial instruments and those for which the above valuation procedures are inappropriate or are deemed not to reflect fair value are stated at fair value as determined in good faith by the Valuation Committee. The objective of any fair value pricing determination is to arrive at a price that could reasonably be expected from a current sale. Financial instruments fair valued by the Valuation Committee are primarily private placements, restricted securities, warrants, rights, and other securities that are not publicly traded.
Subject to oversight by the Board, the Valuation Committee regularly makes good faith judgments to establish and adjust the fair valuations of certain securities as events occur and circumstances warrant. For instance, in determining the fair value of troubled or thinly traded debt instruments, the Valuation Committee considers a variety of factors, which may include, but are not limited to, the issuer’s business prospects, its financial standing and performance, recent investment transactions in the issuer, strategic events affecting the company, market liquidity for the issuer, and general economic conditions and events. In consultation with the investment and pricing teams, the Valuation Committee will determine an appropriate valuation technique based on available information, which may include both observable and unobservable inputs. The Valuation Committee typically will afford greatest weight to actual prices in arm’s length transactions, to the extent they represent orderly transactions between market participants, transaction information can be reliably obtained, and prices are deemed representative of fair value. However, the Valuation Committee may also consider other valuation methods such as a discount or premium from market value of a similar, freelytraded security of the same issuer; discounted cash flows; yield to maturity; or some combination. Fair value determinations are reviewed on a regular basis and updated as information becomes available, including actual purchase and sale transactions of the issue. Because any fair value determination involves a significant amount of judgment, there is a degree of subjectivity inherent in such pricing decisions, and fair value prices determined by the Valuation Committee could differ from those of other market participants. Depending on the relative significance of unobservable inputs, including the valuation technique(s) used, fair valued securities may be categorized in Level 2 or 3 of the fair value hierarchy.
Valuation InputsThe following table summarizes the fund’s financial instruments, based on the inputs used to determine their fair values on November 30, 2018 (for further detail by category, please refer to the accompanying Portfolio of Investments):
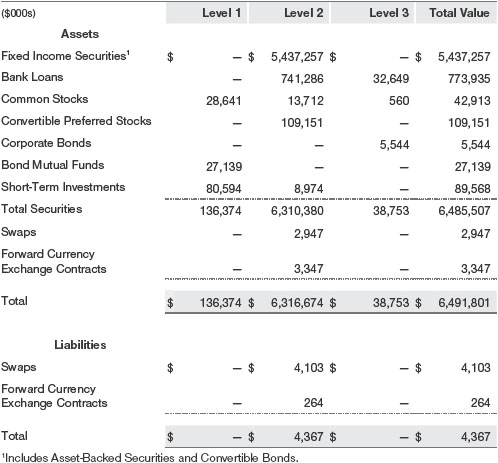
There were no material transfers between Levels 1 and 2 during the six months ended November 30, 2018.
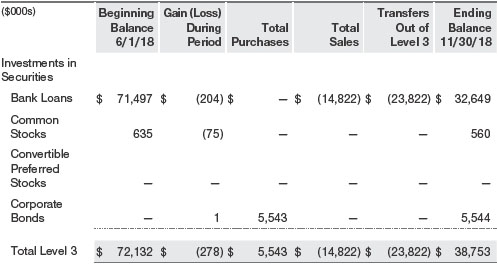
Following is a reconciliation of the fund’s Level 3 holdings for the six months ended November 30, 2018. Gain (loss) reflects both realized and change in unrealized gain/loss on Level 3 holdings during the period, if any, and is included on the accompanying Statement of Operations. The change in unrealized gain/loss on Level 3 instruments held at November 30, 2018, totaled $(327,000) for the six months ended November 30, 2018. Transfers into and out of Level 3 are reflected at the value of the financial instrument at the beginning of the period. During the six months, transfers out of Level 3 were because observable market data became available for the security.
NOTE 3 - DERIVATIVE INSTRUMENTS
During the six months ended November 30, 2018, the fund invested in derivative instruments. As defined by GAAP, a derivative is a financial instrument whose value is derived from an underlying security price, foreign exchange rate, interest rate, index of prices or rates, or other variable; it requires little or no initial investment and permits or requires net settlement. The fund invests in derivatives only if the expected risks and rewards are consistent with its investment objectives, policies, and overall risk profile, as described in its prospectus and Statement of Additional Information. The fund mayuse derivatives for a variety of purposes, such as seeking to hedge against declines in principal value, increase yield, invest in an asset with greater efficiency and at a lower cost than is possible through direct investment, to enhance return, or to adjust portfolio duration and credit exposure. The risks associated with the use of derivatives are different from, and potentially much greater than, the risks associated with investing directly in the instruments on which the derivatives are based. The fund at all times maintains sufficient cash reserves, liquid assets, or other SEC-permitted asset types to cover its settlement obligations under open derivative contracts.
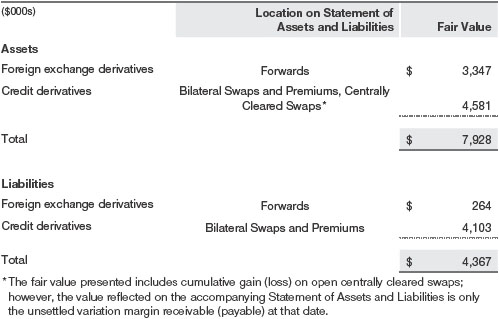
The fund values its derivatives at fair value and recognizes changes in fair value currently in its results of operations. Accordingly, the fund does not follow hedge accounting, even for derivatives employed as economic hedges. Generally, the fund accounts for its derivatives on a gross basis. It does not offset the fair value of derivative liabilities against the fair value of derivative assets on its financial statements, nor does it offset the fair value of derivative instruments against the right to reclaim or obligation to return collateral. The following table summarizes the fair value of the fund’s derivative instruments held as of November 30, 2018, and the related location on the accompanying Statement of Assets and Liabilities, presented by primary underlying risk exposure:
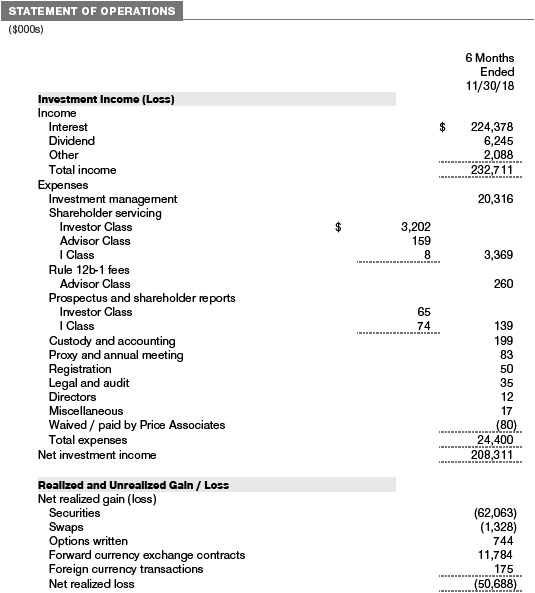
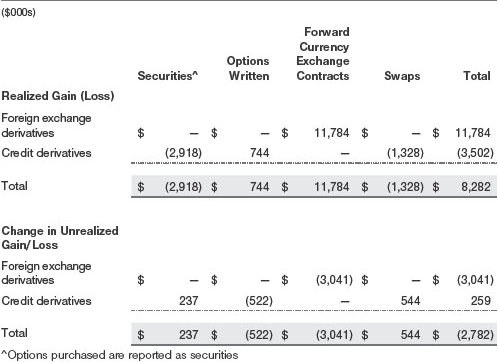
Additionally, the amount of gains and losses on derivative instruments recognized in fund earnings during the six months ended November 30, 2018, and the related location on the accompanying Statement of Operations is summarized in the following table by primary underlying risk exposure:
Counterparty Risk and CollateralThe fund invests in derivatives in various markets, which expose it to differing levels of counterparty risk. Counterparty risk on exchange-traded and centrally cleared derivative contracts, such as futures, exchange-traded options, and centrally cleared swaps, is minimal because the clearinghouse provides protection against counterparty defaults. For futures and centrally cleared swaps, the fund is required to deposit collateral in an amount specified by the clearinghouse and the clearing firm (margin requirement), and the margin requirement must be maintained over the life of the contract. Each clearinghouse and clearing firm, in its sole discretion, may adjust the margin requirements applicable to the fund.
Derivatives, such as bilateral swaps, forward currency exchange contracts, and OTC options that are transacted and settle directly with a counterparty (bilateral derivatives) may expose the fund to greater counterparty risk. To mitigate this risk, the fund hasentered into master netting arrangements (MNAs) with certain counterparties that permit net settlement under specified conditions and, for certain counterparties, also require the exchange of collateral to cover mark-to-market exposure. MNAs may be in the form of International Swaps and Derivatives Association master agreements (ISDAs) or foreign exchange letter agreements (FX letters).
MNAs provide the ability to offset amounts the fund owes a counterparty against amounts the counterparty owes the fund (net settlement). Both ISDAs and FX letters generally allow termination of transactions and net settlement upon the occurrence of contractually specified events, such as failure to pay or bankruptcy. In addition, ISDAs specify other events, the occurrence of which would allow one of the parties to terminate. For example, a downgrade in credit rating of a counterparty below a specified rating would allow the fund to terminate, while a decline in the fund’s net assets of more than a specified percentage would allow the counterparty to terminate. Upon termination, all transactions with that counterparty would be liquidated and a net termination amount settled. ISDAs include collateral agreements whereas FX letters do not. Collateral requirements are determined daily based on the net aggregate unrealized gain or loss on all bilateral derivatives with a counterparty, subject to minimum transfer amounts that typically range from $100,000 to $250,000. Any additional collateral required due to changes in security values is typically transferred the same business day.
Collateral may be in the form of cash or debt securities issued by the U.S. government or related agencies. Cash posted by the fund is reflected as cash deposits in the accompanying financial statements and generally is restricted from withdrawal by the fund; securities posted by the fund are so noted in the accompanying Portfolio of Investments; both remain in the fund’s assets. Collateral pledged by counterparties is not included in the fund’s assets because the fund does not obtain effective control over those assets. For bilateral derivatives, collateral posted or received by the fund is held in a segregated account at the fund’s custodian. While typically not sold in the same manner as equity or fixed income securities, exchange-traded or centrally cleared derivatives may be closed out only on the exchange or clearinghouse where the contracts were traded, and OTC and bilateral derivatives may be unwound with counterparties or transactions assigned to other counterparties to allow the fund to exit the transaction. This ability is subject to the liquidity of underlying positions. As of November 30, 2018, securities valued at $4,126,000 had been posted by the fund to counterparties for bilateral derivatives. As of November 30, 2018, collateral pledged by counterparties to the fund for bilateral derivatives consisted of $2,600,000 cash and securities valued at $3,147,000. As of November 30, 2018, securities valued at $3,181,000 had been posted by the fund for exchange-traded and/or centrally cleared derivatives.
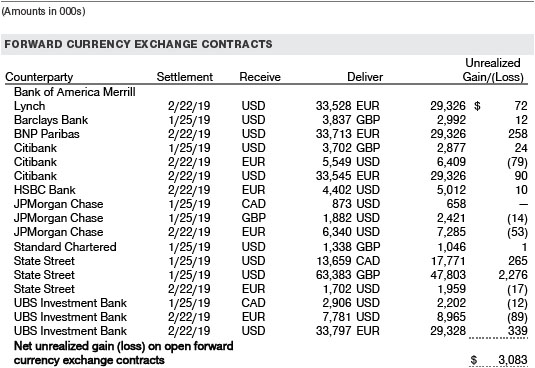
Forward Currency Exchange ContractsThe fund is subject to foreign currency exchange rate risk in the normal course of pursuing its investment objectives. It uses forward currency exchange contracts (forwards) primarily to protect its non-U.S. dollar-denominated securities from adverse currency movements. A forward involves an obligation to purchase or sell a fixed amount of a specific currency on a future date at a price set at the time of the contract. Although certain forwards may be settled by exchanging only the net gain or loss on the contract, most forwards are settled with the exchange of the underlying currencies in accordance with the specified terms. Forwards are valued at the unrealized gain or loss on the contract, which reflects the net amount the fund either is entitled to receive or obligated to deliver, as measured by the difference between the forward exchange rates at the date of entry into the contract and the forward rates at the reporting date. Appreciated forwards are reflected as assets and depreciated forwards are reflected as liabilities on the accompanying Statement of Assets and Liabilities. Risks related to the use of forwards include the possible failure of counterparties to meet the terms of the agreements; that anticipated currency movements will not occur, thereby reducing the fund’s total return; and the potential for losses in excess of the fund’s initial investment. During the six months ended November 30, 2018, the volume of the fund’s activity in forwards, based on underlying notional amounts, was generally between 1% and 3% of net assets.
OptionsThe fund is subject to credit risk in the normal course of pursuing its investment objectives and uses options to help manage such risk. The fund may use options to manage exposure to security prices, interest rates, foreign currencies, and credit quality; as an efficient means of adjusting exposure to all or a part of a target market; to enhance income; as a cash management tool; or to adjust credit exposure. Options are included in net assets at fair value, options purchased are included in Investments in Securities, and Options written are separately reflected as a liability on the accompanying Statement of Assets and Liabilities. Premiums on unexercised, expired options are recorded as realized gains or losses; premiums on exercised options are recorded as an adjustment to the proceeds from the sale or cost of the purchase. The difference between the premium and the amount received or paid in a closing transaction is also treated as realized gain or loss. In return for a premium paid, options on swaps give the holder the right, but not the obligation, to enter a specified swap contract on predefined terms. The exercise price of an option on a credit default swap is stated in terms of a specified spread that represents the cost of credit protection on the reference asset, including both the upfront premium to open the position and future periodic payments. The exercise price of an interest rate swap is stated in terms of a fixed interest rate; generally, there is no upfront payment to open the position. Risks related to the useof options include possible illiquidity of the options markets; trading restrictions imposed by an exchange or counterparty; movements in the underlying asset values and credit ratings; and, for Options written, potential losses in excess of the fund’s initial investment. During the six months ended November 30, 2018, the volume of the fund’s activity in options, based on underlying notional amounts, was generally between 0% and 5% of net assets.
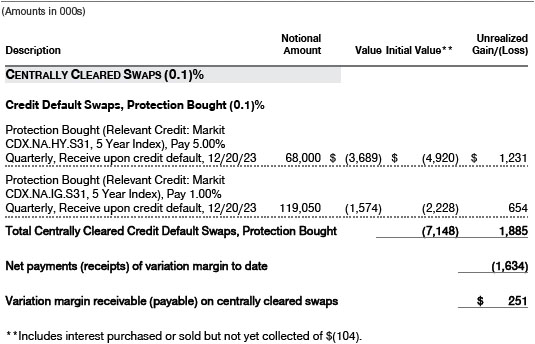
SwapsThe fund is subject to credit risk in the normal course of pursuing its investment objectives and uses swap contracts to help manage such risk. The fund may use swaps in an effort to manage both long and short exposure to changes in interest rates, inflation rates, and credit quality; to adjust overall exposure to certain markets; to enhance total return or protect the value of portfolio securities; to serve as a cash management tool; or to adjust portfolio duration and credit exposure. Swap agreements can be settled either directly with the counterparty (bilateral swap) or through a central clearinghouse (centrally cleared swap). Fluctuations in the fair value of a contract are reflected in unrealized gain or loss and are reclassified to realized gain or loss upon contract termination or cash settlement. Net periodic receipts or payments required by a contract increase or decrease, respectively, the value of the contract until the contractual payment date, at which time such amounts are reclassified from unrealized to realized gain or loss. For bilateral swaps, cash payments are made or received by the fund on a periodic basis in accordance with contract terms; unrealized gain on contracts and premiums paid are reflected as assets and unrealized loss on contracts and premiums received are reflected as liabilities on the accompanying Statement of Assets and Liabilities. For bilateral swaps, premiums paid or received are amortized over the life of the swap and are recognized as realized gain or loss in the Statement of Operations. For centrally cleared swaps, payments are made or received by the fund each day to settle the daily fluctuation in the value of the contract (variation margin). Accordingly, the value of a centrally cleared swap included in net assets is the unsettled variation margin; net variation margin receivable is reflected as an asset and net variation margin payable is reflected as a liability on the accompanying Statement of Assets and Liabilities.
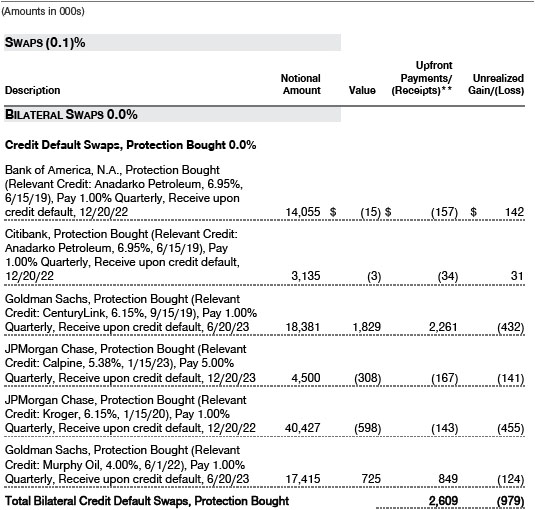
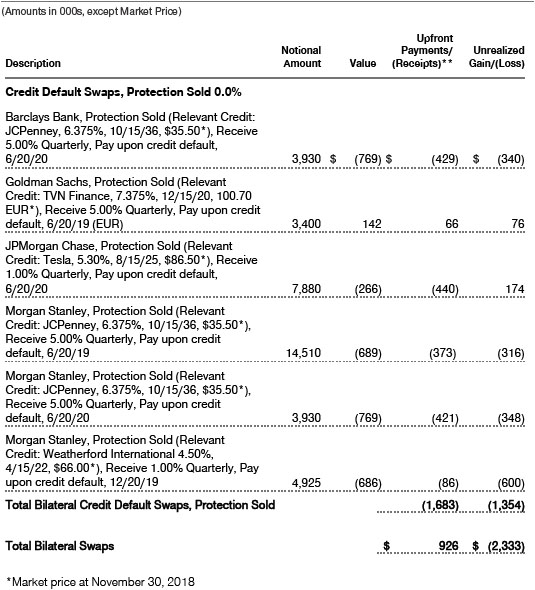
Credit default swaps are agreements where one party (the protection buyer) agrees to make periodic payments to another party (the protection seller) in exchange for protection against specified credit events, such as certain defaults and bankruptcies related to an underlying credit instrument, or issuer or index of such instruments. Upon occurrence of a specified credit event, the protection seller is required to pay the buyer the difference between the notional amount of the swap and the value of the underlying credit, either in the form of a net cash settlement or by paying the gross notionalamount and accepting delivery of the relevant underlying credit. For credit default swaps where the underlying credit is an index, a specified credit event may affect all or individual underlying securities included in the index and will be settled based upon the relative weighting of the affected underlying securities within the index. Generally, the payment risk for the seller of protection is inversely related to the current market price or credit rating of the underlying credit or the market value of the contract relative to the notional amount, which are indicators of the markets’ valuation of credit quality. As of November 30, 2018, the notional amount of protection sold by the fund totaled $38,575,000 (0.6% of net assets), which reflects the maximum potential amount the fund could be required to pay under such contracts. Risks related to the use of credit default swaps include the possible inability of the fund to accurately assess the current and future creditworthiness of underlying issuers, the possible failure of a counterparty to perform in accordance with the terms of the swap agreements, potential government regulation that could adversely affect the fund’s swap investments, and potential losses in excess of the fund’s initial investment.
During the six months ended November 30, 2018, the volume of the fund’s activity in swaps, based on underlying notional amounts, was generally between 2% and 5% of net assets.
NOTE 4 - OTHER INVESTMENT TRANSACTIONS
Consistent with its investment objective, the fund engages in the following practices to manage exposure to certain risks and/or to enhance performance. The investment objective, policies, program, and risk factors of the fund are described more fully in the fund’s prospectus and Statement of Additional Information.
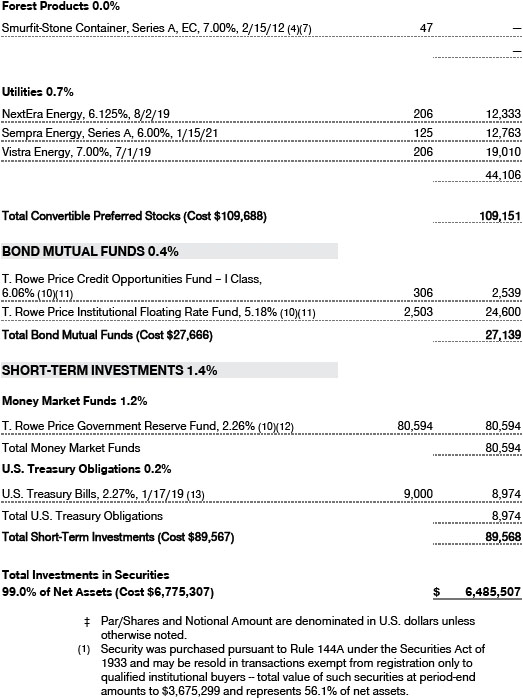
Noninvestment-Grade DebtAt November 30, 2018, approximately 94% of the fund’s net assets were invested, either directly or through its investment in T. Rowe Price institutional funds, in noninvestment-grade debt including “high yield” or “junk” bonds or leveraged loans. Noninvestment-grade debt issuers are more likely to suffer an adverse change in financial condition that would result in the inability to meet a financial obligation. The noninvestment-grade debt market may experience sudden and sharp price swings due to a variety of factors, including changes in economic forecasts, stock market activity, large sustained sales by major investors, a high-profile default, or a change in market sentiment. These events may decrease the ability of issuers to make principal and interest payments and adversely affect the liquidity or value, or both, of such securities. Accordingly, securities issued by such companies carry a higher risk of default and should be considered speculative.
Restricted SecuritiesThe fund may invest in securities that are subject to legal or contractual restrictions on resale. Prompt sale of such securities at an acceptable price may be difficult and may involve substantial delays and additional costs.
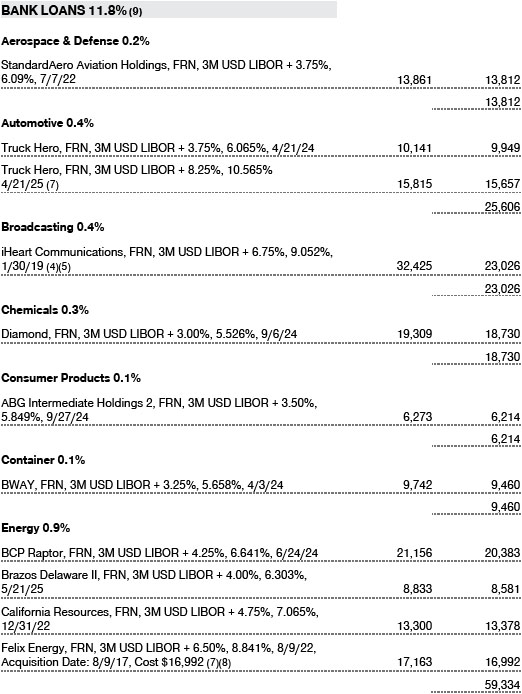
Bank LoansThe fund may invest in bank loans, which represent an interest in amounts owed by a borrower to a syndicate of lenders. Bank loans are generally noninvestment grade and often involve borrowers whose financial condition is highly leveraged. Bank loans may be in the form of either assignments or participations. A loan assignment transfers all legal, beneficial, and economic rights to the buyer, and transfer typically requires consent of both the borrower and agent. In contrast, a loan participation generally entitles the buyer to receive the cash flows from principal, interest, and any fee payments on a portion of a loan; however, the seller continues to hold legal title to that portion of the loan. As a result, the buyer of a loan participation generally has no direct recourse against the borrower and is exposed to credit risk of both the borrower and seller of the participation. Bank loans often have extended settlement periods, generally may be repaid at any time at the option of the borrower, and may require additional principal to be funded at the borrowers’ discretion at a later date (e.g. unfunded commitments and revolving debt instruments). Until settlement, the fund maintains liquid assets sufficient to settle its unfunded loan commitments. The fund reflects both the funded portion of a bank loan as well as its unfunded commitment in the Portfolio of Investments. However, if a credit agreement provides no initial funding of a tranche and funding of the full commitment at a future date(s) is at the borrower’s discretion and considered uncertain, a loan is reflected in the Portfolio of Investments only if, and only to the extent that, the fund has actually settled a funding commitment. At November 30, 2018, the fund’s total unfunded commitments not included in the Portfolio of Investments were $45,455,000.
OtherPurchases and sales of portfolio securities other than short-term securities aggregated $1,950,474,000 and $2,267,973,000, respectively, for the six months ended November 30, 2018.
NOTE 5 - FEDERAL INCOME TAXES
No provision for federal income taxes is required since the fund intends to continue to qualify as a regulated investment company under Subchapter M of the Internal Revenue Code and distribute to shareholders all of its taxable income and gains. Distributions determined in accordance with federal income tax regulations may differ in amount or character from net investment income and realized gains for financial reporting purposes. Financial reporting records are adjusted for permanent book/tax differencesto reflect tax character but are not adjusted for temporary differences. The amount and character of tax-basis distributions and composition of net assets are finalized at fiscal year-end; accordingly, tax-basis balances have not been determined as of the date of this report.
The fund intends to retain realized gains to the extent of available capital loss carryforwards. Net realized capital losses may be carried forward indefinitely to offset future realized capital gains. As of May 31, 2018, the fund had $403,365,000 of available capital loss carryforwards.
At November 30, 2018, the cost of investments for federal income tax purposes was $6,769,871,000. Net unrealized loss aggregated $288,111,000 at period-end, of which $54,118,000 related to appreciated investments and $342,229,000 related to depreciated investments.
NOTE 6 - RELATED PARTY TRANSACTIONS
The fund is managed by T. Rowe Price Associates, Inc. (Price Associates), a wholly owned subsidiary of T. Rowe Price Group, Inc. (Price Group). The investment management agreement between the fund and Price Associates provides for an annual investment management fee, which is computed daily and paid monthly. The fee consists of an individual fund fee, equal to 0.30% of the fund’s average daily net assets, and a group fee. The group fee rate is calculated based on the combined net assets of certain mutual funds sponsored by Price Associates (the group) applied to a graduated fee schedule, with rates ranging from 0.48% for the first $1 billion of assets to 0.265% for assets in excess of $650 billion. The fund’s group fee is determined by applying the group fee rate to the fund’s average daily net assets. At November 30, 2018, the effective annual group fee rate was 0.29%.
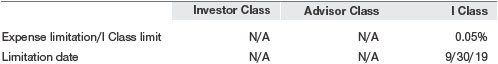
The I Class is subject to an operating expense limitation (I Class limit) pursuant to which Price Associates is contractually required to pay all operating expenses of the I Class, excluding management fees, interest, expenses related to borrowings, taxes, brokerage, and other non-recurring expenses permitted by the investment management agreement, to the extent such operating expenses, on an annualized basis, exceed the I Class limit. This agreement will continue through the limitation date indicated in the table below, and may be renewed, revised, or revoked only with approval of the fund’s Board. The I Class is required to repay Price Associates for expenses previously paid to the extent the class’s net assets grow or expenses decline sufficiently to allow repayment without causing the class’s operating expenses (after the repayment is taken into account) to exceed both:(1) the I Class limit in place at the time such amounts were paid; and (2) the current I Class limit. However, no repayment will be made more than three years after the date of a payment or waiver. For the six months ended November 30, 2018, the I Class operated below its expense limitation.
In addition, the fund has entered into service agreements with Price Associates and two wholly owned subsidiaries of Price Associates, each an affiliate of the fund (collectively, Price). Price Associates provides certain accounting and administrative services to the fund. T. Rowe Price Services, Inc. provides shareholder and administrative services in its capacity as the fund’s transfer and dividend-disbursing agent. T. Rowe Price Retirement Plan Services, Inc. provides subaccounting and recordkeeping services for certain retirement accounts invested in the Investor Class and I Class. For the six months ended November 30, 2018, expenses incurred pursuant to these service agreements were $34,000 for Price Associates; $742,000 for T. Rowe Price Services, Inc.; and $82,000 for T. Rowe Price Retirement Plan Services, Inc. All amounts due to and due from Price, exclusive of investment management fees payable, are presented net on the accompanying Statement of Assets and Liabilities.
Additionally, the fund is one of several mutual funds in which certain college savings plans managed by Price Associates may invest. As approved by the fund’s Board of Directors, shareholder servicing costs associated with each college savings plan are borne by the fund in proportion to the average daily value of its shares owned by the college savings plan. For the six months ended November 30, 2018, the fund was charged $13,000 for shareholder servicing costs related to the college savings plans, of which $11,000 was for services provided by Price. All amounts due to and due from Price, exclusive of investment management fees payable, are presented net on the Statement of Assets and Liabilities. At November 30, 2018, less than 1% of the outstanding shares of the Investor Class were held by college savings plans.
The fund is also one of several mutual funds sponsored by Price Associates (underlying Price Funds) in which the T. Rowe Price Spectrum Funds (Spectrum Funds) and T. Rowe Price Retirement Funds (Retirement Funds) may invest. None of the Spectrum Funds or Retirement Funds invest in the underlying Price Funds for the purpose of exercising management or control. Pursuant to special servicing agreements, expenses associatedwith the operation of the Spectrum Funds and Retirement Funds are borne by each underlying Price Fund to the extent of estimated savings to it and in proportion to the average daily value of its shares owned by the Spectrum Funds and Retirement Funds.
Expenses allocated under these special servicing agreements are reflected as shareholder servicing expense in the accompanying financial statements. For the six months ended November 30, 2018, the fund was allocated $600,000 of Spectrum Funds’ expenses and $1,000,000 of Retirement Funds’ expenses. Of these amounts, $729,000 related to services provided by Price. All amounts due to and due from Price, exclusive of investment management fees payable, are presented net on the accompanying Statement of Assets and Liabilities. At November 30, 2018, approximately 45% of the outstanding shares of the Investor Class were held by the Spectrum Funds and Retirement Funds.
In addition, other mutual funds, trusts, and other accounts managed by Price Associates or its affiliates (collectively, Price Funds and accounts) may invest in the fund and are not subject to the special servicing agreements disclosed above. No Price Fund or account may invest for the purpose of exercising management or control over the fund. At November 30, 2018, approximately 20% of the I Class’s outstanding shares were held by Price Funds and accounts.
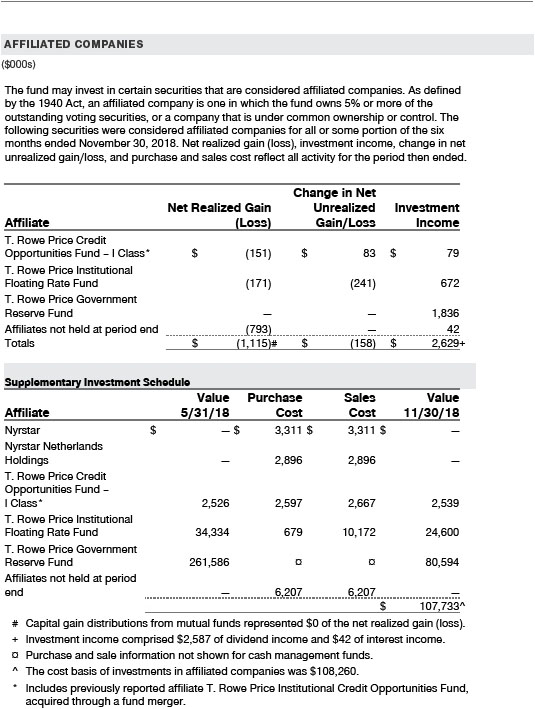
The fund may invest its cash reserves in certain open-end management investment companies managed by Price Associates and considered affiliates of the fund: the T. Rowe Price Government Reserve Fund or the T. Rowe Price Treasury Reserve Fund, organized as money market funds, or the T. Rowe Price Short-Term Fund, a short-term bond fund (collectively, the Price Reserve Funds). The Price Reserve Funds are offered as short-term investment options to mutual funds, trusts, and other accounts managed by Price Associates or its affiliates and are not available for direct purchase by members of the public. Cash collateral from securities lending is invested in the T. Rowe Price Short-Term Fund. The Price Reserve Funds pay no investment management fees.
The fund may also invest in certain other T. Rowe Price funds (Price Funds) as a means of gaining efficient and cost-effective exposure to certain markets. The fund does not invest for the purpose of exercising management or control; however, investments by the fund may represent a significant portion of an underlying Price Fund’s net assets. Each underlying Price Fund is an open-end management investment company managed by Price Associates and is considered an affiliate of the fund. To ensure that the fund does not incur duplicate management fees (paid by the underlying Price Fund(s) and the fund), Price Associates has agreed to permanently waive a portion of its management fee charged to the fund in an amount sufficient to fully offset that portion of managementfees paid by each underlying Price Fund related to the fund’s investment therein. Annual management fee rates and amounts waived related to investments in the underlying Price Fund(s) for the six months ended November 30, 2018, are as follows:
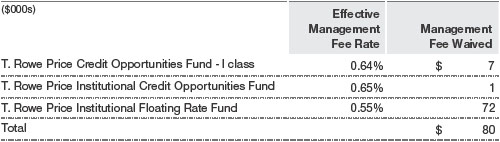
Total management fee waived was $59,000, $2,000 and $19,000 for the Investor Class, Advisor Class and I Class, respectively, for the six months ended November 30, 2018.
The fund may participate in securities purchase and sale transactions with other funds or accounts advised by Price Associates (cross trades), in accordance with procedures adopted by the fund’s Board and Securities and Exchange Commission rules, which require, among other things, that such purchase and sale cross trades be effected at the independent current market price of the security. During the six months ended November 30, 2018, the fund had no purchases or sales cross trades with other funds or accounts advised by Price Associates.
INFORMATION ON PROXY VOTING POLICIES, PROCEDURES, AND RECORDS
A description of the policies and procedures used by T. Rowe Price funds and portfolios to determine how to vote proxies relating to portfolio securities is available in each fund’s Statement of Additional Information. You may request this document by calling 1-800-225-5132 or by accessing the SEC’s website, sec.gov.
The description of our proxy voting policies and procedures is also available on our corporate website. To access it, please visit the following Web page:
https://www3.troweprice.com/usis/corporate/en/utility/policies.html
Scroll down to the section near the bottom of the page that says, “Proxy Voting Policies.” Click on the Proxy Voting Policies link in the shaded box.
Each fund’s most recent annual proxy voting record is available on our website and through the SEC’s website. To access it through T. Rowe Price, visit the website location shown above, and scroll down to the section near the bottom of the page that says, “Proxy Voting Records.” Click on the Proxy Voting Records link in the shaded box.
HOW TO OBTAIN QUARTERLY PORTFOLIO HOLDINGS
The fund files a complete schedule of portfolio holdings with the Securities and Exchange Commission for the first and third quarters of each fiscal year on Form N-Q. The fund’s Form N-Q is available electronically on the SEC’s website (sec.gov); hard copies may be reviewed and copied at the SEC’s Public Reference Room, 100 F St. N.E., Washington, DC 20549. For more information on the Public Reference Room, call 1-800-SEC-0330.
Item 2. Code of Ethics.
A code of ethics, as defined in Item 2 of Form N-CSR, applicable to its principal executive officer, principal financial officer, principal accounting officer or controller, or persons performing similar functions is filed as an exhibit to the registrant’s annual Form N-CSR. No substantive amendments were approved or waivers were granted to this code of ethics during the registrant’s most recent fiscal half-year.
Item 3. Audit Committee Financial Expert.
Disclosure required in registrant’s annual Form N-CSR.
Item 4. Principal Accountant Fees and Services.
Disclosure required in registrant’s annual Form N-CSR.
Item 5. Audit Committee of Listed Registrants.
Not applicable.
Item 6. Investments.
(a) Not applicable. The complete schedule of investments is included in Item 1 of this Form N-CSR.
(b) Not applicable.
Item 7. Disclosure of Proxy Voting Policies and Procedures for Closed-End Management Investment Companies.
Not applicable.
Item 8. Portfolio Managers of Closed-End Management Investment Companies.
Not applicable.
Item 9. Purchases of Equity Securities by Closed-End Management Investment Company and Affiliated Purchasers.
Not applicable.
Item 10. Submission of Matters to a Vote of Security Holders.
Not applicable.
Item 11. Controls and Procedures.
(a) The registrant’s principal executive officer and principal financial officer have evaluated the registrant’s disclosure controls and procedures within 90 days of this filing and have concluded that the registrant’s disclosure controls and procedures were effective, as of that date, in ensuring that information required to be disclosed by the registrant in this Form N-CSR was recorded, processed, summarized, and reported timely.
(b) The registrant’s principal executive officer and principal financial officer are aware of no change in the registrant’s internal control over financial reporting that occurred during the registrant’s second fiscal quarter covered by this report that has materially affected, or is reasonably likely to materially affect, the registrant’s internal control over financial reporting.
Item 12. Exhibits.
(a)(1) The registrant’s code of ethics pursuant to Item 2 of Form N-CSR is filed with the registrant’s annual Form N-CSR.
(2) Separate certifications by the registrant's principal executive officer and principal financial officer, pursuant to Section 302 of the Sarbanes-Oxley Act of 2002 and required by Rule 30a-2(a) under the Investment Company Act of 1940, are attached.
(3) Written solicitation to repurchase securities issued by closed-end companies: not applicable.
(b) A certification by the registrant's principal executive officer and principal financial officer, pursuant to Section 906 of the Sarbanes-Oxley Act of 2002 and required by Rule 30a-2(b) under the Investment Company Act of 1940, is attached.
SIGNATURES
Pursuant to the requirements of the Securities Exchange Act of 1934 and the Investment Company Act of 1940, the registrant has duly caused this report to be signed on its behalf by the undersigned, thereunto duly authorized.
T. Rowe Price High Yield Fund, Inc.
| By | | /s/ David Oestreicher |
| | | David Oestreicher |
| | | Principal Executive Officer |
| |
| Date | | January 18, 2019 | | | | |
Pursuant to the requirements of the Securities Exchange Act of 1934 and the Investment Company Act of 1940, this report has been signed below by the following persons on behalf of the registrant and in the capacities and on the dates indicated.
| By | | /s/ David Oestreicher |
| | | David Oestreicher |
| | | Principal Executive Officer |
| |
| Date | | January 18, 2019 | | | | |
| |
| |
| By | | /s/ Catherine D. Mathews |
| | | Catherine D. Mathews |
| | | Principal Financial Officer |
| |
| Date | | January 18, 2019 | | | | |