UNITED STATES
SECURITIES AND EXCHANGE COMMISSION
Washington, D.C. 20549
FORM N-CSR
CERTIFIED SHAREHOLDER REPORT OF REGISTERED
MANAGEMENT INVESTMENT COMPANIES
Investment Company Act File Number: 811-04119
| T. Rowe Price High Yield Fund, Inc. |
|
| (Exact name of registrant as specified in charter) |
| |
| 100 East Pratt Street, Baltimore, MD 21202 |
|
| (Address of principal executive offices) |
| |
| David Oestreicher |
| 100 East Pratt Street, Baltimore, MD 21202 |
|
| (Name and address of agent for service) |
Registrant’s telephone number, including area code: (410) 345-2000
Date of fiscal year end: May 31
Date of reporting period: November 30, 2019
Item 1. Reports to Shareholders
(a) Report pursuant to Rule 30e-1.
| U.S. High Yield Fund | November 30, 2019 |
| TUHYX | Investor Class |
| TUHAX | Advisor Class |
| TUHIX | I Class |
Beginning on January 1, 2021, as permitted by SEC regulations, paper copies of the T. Rowe Price funds’ annual and semiannual shareholder reports will no longer be mailed, unless you specifically request them. Instead, shareholder reports will be made available on the funds’ website (troweprice.com/prospectus), and you will be notified by mail with a website link to access the reports each time a report is posted to the site.
If you already elected to receive reports electronically, you will not be affected by this change and need not take any action. At any time, shareholders who invest directly in T. Rowe Price funds may generally elect to receive reports or other communications electronically by enrolling attroweprice.com/paperlessor, if you are a retirement plan sponsor or invest in the funds through a financial intermediary (such as an investment advisor, broker-dealer, insurance company, or bank), by contacting your representative or your financial intermediary.
You may elect to continue receiving paper copies of future shareholder reports free of charge. To do so, if you invest directly with T. Rowe Price, please call T. Rowe Price as follows: IRA, nonretirement account holders, and institutional investors,1-800-225-5132; small business retirement accounts,1-800-492-7670. If you are a retirement plan sponsor or invest in the T. Rowe Price funds through a financial intermediary, please contact your representative or financial intermediary or follow additional instructions if included with this document. Your election to receive paper copies of reports will apply to all funds held in your account with your financial intermediary or, if you invest directly in the T. Rowe Price funds, with T. Rowe Price. Your election can be changed at any time in the future.
| T. ROWE PRICE U.S. HIGH YIELD FUND |
|
HIGHLIGHTS
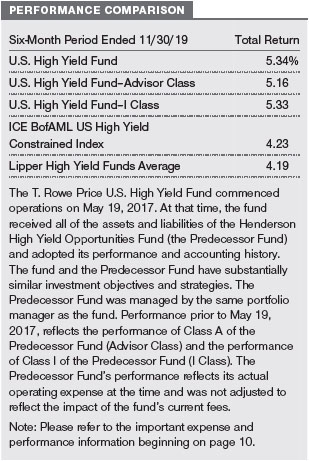
| ■ | The U.S. High Yield Fund posted a solid gain in the six months ended November 30, 2019. The fund outperformed both the ICE BofAML US High Yield Constrained Index and its Lipper peer group average.
|
| ■ | Overall, credit selection and allocation decisions contributed to the portfolio’s strong relative results, although an underweight in BB rated bonds detracted.
|
| ■ | As yields declined in the reporting period, we benefited from appreciation. However, the fund maintained a yield similar to the benchmark.
|
| ■ | Our outlook for the high yield market remains constructive, although we expect slowing economic growth and volatility due to potential inflation and persistent trade disputes.
|

Log in to your account attroweprice.comfor more information.
*Certain mutual fund accounts that are assessed an annual account service fee can also save money by switching to e-delivery.
CIO Market Commentary
Dear Shareholder
Global markets recorded solid results in the first half of your fund’s fiscal year, the six-month period ended November 30, 2019. Both stock and bond indexes advanced as the Federal Reserve and other key central banks took action to address a slowing global economy.
In the U.S., the large-cap Dow Jones Industrial Average and S&P 500 Index reached record highs, as did the technology-heavy Nasdaq Composite Index. The smaller-cap benchmarks recorded double-digit gains but remained below their 2018 peaks. At the sector level, technology stocks produced the strongest gains. International stocks generally performed well, although there were pockets of weakness in some emerging markets. The U.S. dollar finished with mixed results versus other currencies, but a relatively strong greenback versus the euro and yen weighed modestly on returns for U.S. investors in European and Japanese securities.
Fixed income securities also produced solid gains during the period—with corporate bonds leading the way—as yields fell. The yield on the 30-year Treasury bond hit a record low in August, falling below the 2% mark for the first time, and the benchmark 10-year Treasury note’s yield dipped to its lowest level since 2016. Outside the U.S., yields on government bonds issued by certain countries were in negative territory. (Bond prices and yields move in opposite directions.)
Worries had grown in May that an escalating trade dispute between the U.S. and China could lead to a recession. However, Fed Chair Jerome Powell sparked a rebound in investor sentiment in early June, at the start of your fund’s fiscal year, with his comments that central bank policymakers were paying close attention to the impact of trade tensions on the economy and would “act as appropriate to sustain the expansion.”
Fed policymakers followed through with quarter-percentage-point rate cuts in July, September, and October and took steps to maintain liquidity in short-term lending markets. Other central banks also acted to address flagging growth. The European Central Bank lowered its benchmark deposit rate deeper into negative territory and announced that it was restarting its quantitative easing program.
The shift in global central bank policies was a marked change from 2018, when there were approximately two interest rate hikes for every cut. In 2019, central bank rate cuts have outnumbered hikes by a more than five-to-one margin and appear to be succeeding in their goal of stimulating economic growth. After contracting earlier in the period, key manufacturing and export indicators showed signs of stabilizing by November, and the Treasury yield curve returned to a more normal positive slope, easing recession fears.
The U.S. economy was sustained by consumer spending and remained relatively strong compared with other developed markets. While corporate earnings experienced a year-over-year decline through the third quarter, slightly more companies than usual surpassed earnings expectations, providing further market support.
Besides monetary policy, investors also closely followed developments in the U.S.-China trade dispute. Stocks suffered their biggest sell-off during the six-month period in early August after President Donald Trump announced that the U.S. would impose a 10% tariff on Chinese imports, and China retaliated with new tariffs of its own. However, investors generally took an optimistic view of trade negotiations, which limited the trade war’s toll on markets.
Looking ahead, we believe that further progress in U.S.-China trade talks will be a key factor in sustaining positive market sentiment. A reduction in trade barriers could help corporate earnings rebound and provide a lift to the manufacturing sector.
Our investment teams will also be closely following the U.S. presidential election, Brexit, and other developments that could influence markets in 2020. In an uncertain environment, with a wide dispersion of returns possible, we believe that in-depth fundamental research will be particularly critical for identifying potential opportunities and risks.
Thank you for your continued confidence in T. Rowe Price.
Sincerely,

Robert Sharps
Group Chief Investment Officer
Management’s Discussion of Fund Performance
INVESTMENT OBJECTIVE
The fund seeks total return and, secondarily, current income.
FUND COMMENTARY
How did the fund perform in the past six months?
The U.S. High Yield Fund returned 5.34% in the six months ended November 30, 2019. The fund outperformed its benchmark, the ICE BofAML US High Yield Constrained Index, and the Lipper peer group average. (Returns for Advisor and I Class shares varied slightly, reflecting their different fee structures.Past performance cannot guarantee future results.)
What factors influenced the fund’s performance?
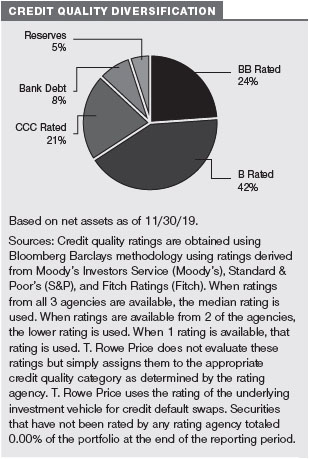
The positive relative performance drivers were credit selection, an underweight position in the energy sector, and our emphasis on higher-quality holdings within the CCCtier. Security selection was particularly good among bonds rated B and CCC, which account for nearly two-thirds of the fund’s assets. While it is late in the credit cycle, we have benefited from owning higher-quality credits within the lower-quality tiers.
Our leveraged loan (also known as bank debt) holdings generated positive returns during the period but underperformed the overall high yield bond market. Our allocation to leveraged loans, which ranged from 5% to 12% of assets during the period, ended November at 8%. It is important to note thatbank debt is an out-of-benchmark asset class. Leveraged loans have floating rates that are tied to the very shortest part of the yield curve, so they benefit directly when the Federal Reserve raises rates. When we uncover attractive risk/reward opportunities, we are willing to invest in other out-of-benchmark areas, such as U.S. dollar-denominated European high yield bonds and emerging markets debt. The fund benefited from good credit selection within these modest positions. Both of those asset classes slightly outperformed the U.S. high yield bond market during the period.
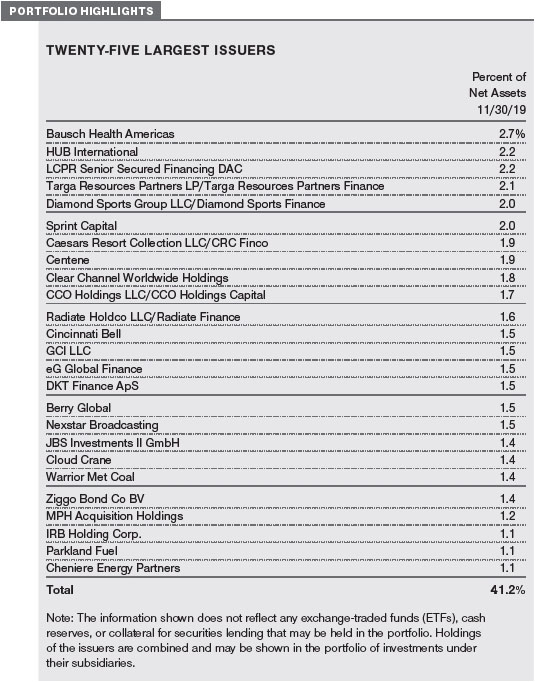
On an industry basis, the fund’s top relative performance contributors were energy, telecommunications, and media. Our best individual company contributors came from a cross section of industries.Weight Watchers Internationalperformed well after a recovery from a branding strategy change.Ziggo, another top contributor, is a quad play consumer broadband company in Europe that should benefit from consolidation among higher credit quality companies.Bausch Health Americasis a turnaround story in the pharmaceutical space. The current management team inherited an overleveraged balance sheet following an aggressive acquisition spree and has been prudently diverting all free cash flow to paying down debt. (Please refer to the portfolio of investments for a complete list of holdings and the amount each represents in the portfolio.)
Despite good credit selection, the portfolio’s underweight in BB rated bonds detracted from relative performance. The industries that hurt our relative results included financial services, banking, and technology.The underperformance in financial services and banking was due to our underweight, and at this stage of the credit cycle, we believe it is prudent to remain underweight. Many of the high yield issuers in consumer finance rely heavily on wholesale (non-deposit) funding to finance their business models.
While our relative performance in energy was strong, the industry was a significant absolute detractor. Energy exploration and production companyBruin E&P Partnerswas among our largest detractors. We added value by avoiding several other poor-performing energy issuers in the benchmark, which spotlights the importance of our independent credit research. Other significant detractors includedParty City, a retailer that experienced issues related to inventory management, andMultiPlan, a health care cost management provider.
How is the fund positioned?
Over the past six months, our credit tier positioning was relatively unchanged. B rated bonds continued to represent the lion’s share of the fund. Within the CCC rated bucket, we are focused on owning the highest-quality bonds and have remained extremely selective. We hold approximately 20 of the 300 issues in the benchmark. We believe that many of these CCC rated bonds (21% of assets) have stable to improving credit metrics, and potentially, rating agencies may upgrade them in the next few years. We have attempted to avoid the distressed segments, especially within the energy industry. BB rated bonds, at 24% of assets, declined one percentage point sinceour last shareholder letter at the end of May. Although we remain constructive on leveraged loans, we are aware of the risks facing the asset class, including elevated valuations, lax covenants, and a trend toward higher leverage. Although bank debt is higher in the capital structure, we are just as selective in screening loan issuers as high yield bond issuers.
Our industry weights did not change materially in the six-month reporting period. We intend to remain underweight in banking and financial services. We are also underweight in technology, as many of the companies in that industry are highly leveraged software companies and leveraged buyouts. Energy is still the largest industry in the high yield market. Our underweight has been a longtime relative performance contributor. However, we added to our positioning at the end of the reporting period as U.S. oil prices settled in the $55 to $60 per barrel range—the subindustries we find most attractive arepipelines, distribution, and refiners. We don’t expect our industry weights to change much in the current market environment. However, we remain diligent and flexible in our positioning, and we intend to seize opportunities as they arise.
What is portfolio management’s outlook?
While we think that it is late in an already-extended credit cycle, we are constructive on valuation and fundamentals in the high yield space, and we believe that there is a low probability of a significant increase in defaults over the next 12 months. While BB rated bonds were the strongest rating tier during the six-month period, we remain skeptical that this segment can sustain this good relative performance, and, as such, we intend to remain underweight the BB credit tier heading into 2020. The absolute yield of the asset class has hovered around 6.5%, which makes it quite attractive versus other parts of the fixed income landscape. If rates start to rise again, we believe that the best two asset classes within fixed income will be leveraged loans and high yield bonds.
Although we are constructive on the corporate fundamentals of the high yield market, we should also highlight some of the risks that we see on the horizon. Many companies that issue leveraged loans have not hedged their floating rate exposure, which could hurt their cash flow profiles over time. Higher inflation, labor, and commodity costs—coupled with a potential simultaneous economic slowdown—could result in a combination of shrinking margins and declining sales. Weakness in equity markets also has a knock-on effect for many high yield issuers; it could remove their lifeline as far as raising capital to reduce leverage. As always, the most persistent risks when investing in high yield bonds are liquidity and volatility. We aim to combat these risks with prudent portfolio construction and rigorous credit selection.
The views expressed reflect the opinions of T. Rowe Price as of the date of this report and are subject to change based on changes in market, economic, or other conditions. These views are not intended to be a forecast of future events and are no guarantee of future results.
RISKS OF BOND INVESTING
Bonds are subject to interest rate risk, the decline in bond prices that usually accompanies a rise in interest rates, and credit risk, the chance that any fund holding could have its credit rating downgraded or that a bond issuer will default (fail to make timely payments of interest or principal), potentially reducing the fund’s income level and share price. High yield corporate bonds could have greater price declines than funds that invest primarily in high-quality bonds. Companies issuing high yield bonds are not as strong financially as those with higher credit ratings, so the bonds are usually considered to be speculative investments. Bank loans may at times become difficult to value and highly illiquid; they are subject to credit risk such as nonpayment of principal or interest and risks of bankruptcy and insolvency.
Investing in the securities of non-U.S. issuers involves special risks not typically associated with investing in U.S. issuers. Foreign securities tend to be more volatile and less liquid than investments in U.S. securities and may lose value because of adverse local, political, social, or economic developments overseas or due to changes in the exchange rates between foreign currencies and the U.S. dollar. In addition, foreign investments are subject to settlement practices and regulatory and financial reporting standards that differ from those of the U.S. These risks are heightened for the fund’s investments in emerging markets, which are more susceptible to governmental interference, less efficient trading markets, and the imposition of local taxes or restrictions on gaining access to sales proceeds for foreign investors.
GROWTH OF $10,000
This chart shows the value of a hypothetical $10,000 investment in the fund over the past 10 fiscal year periods or since inception (for funds lacking 10-year records). The result is compared with benchmarks, which include a broad-based market index and may also include a peer group average or index. Market indexes do not include expenses, which are deducted from fund returns as well as mutual fund averages and indexes.

AVERAGE ANNUAL COMPOUND TOTAL RETURN
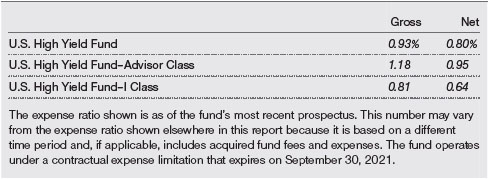
EXPENSE RATIO
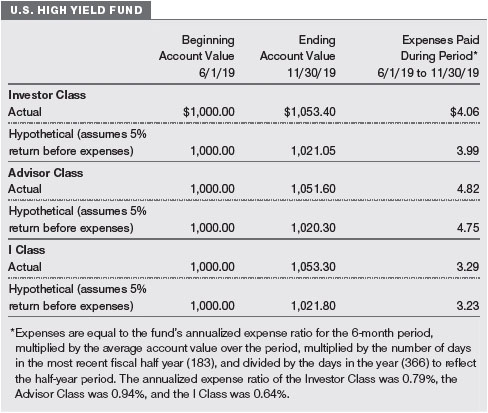
FUND EXPENSE EXAMPLE
As a mutual fund shareholder, you may incur two types of costs: (1) transaction costs, such as redemption fees or sales loads, and (2) ongoing costs, including management fees, distribution and service (12b-1) fees, and other fund expenses. The following example is intended to help you understand your ongoing costs (in dollars) of investing in the fund and to compare these costs with the ongoing costs of investing in other mutual funds. The example is based on an investment of $1,000 invested at the beginning of the most recent six-month period and held for the entire period.
Please note that the fund has three share classes: The original share class (Investor Class) charges no distribution and service (12b-1) fee, the Advisor Class shares are offered only through unaffiliated brokers and other financial intermediaries and charge a 0.25% 12b-1 fee, and I Class shares are available to institutionally oriented clients and impose no 12b-1 or administrative fee payment. Each share class is presented separately in the table.
Actual Expenses
The first line of the following table (Actual) provides information about actual account values and expenses based on the fund’s actual returns. You may use the information on this line, together with your account balance, to estimate the expenses that you paid over the period. Simply divide your account value by $1,000 (for example, an $8,600 account value divided by $1,000 = 8.6), then multiply the result by the number on the first line under the heading “Expenses Paid During Period” to estimate the expenses you paid on your account during this period.
Hypothetical Example for Comparison Purposes
The information on the second line of the table (Hypothetical) is based on hypothetical account values and expenses derived from the fund’s actual expense ratio and an assumed 5% per year rate of return before expenses (not the fund’s actual return). You may compare the ongoing costs of investing in the fund with other funds by contrasting this 5% hypothetical example and the 5% hypothetical examples that appear in the shareholder reports of the other funds. The hypothetical account values and expenses may not be used to estimate the actual ending account balance or expenses you paid for the period.
Note:T. Rowe Price charges an annual account service fee of $20, generally for accounts with less than $10,000. The fee is waived for any investor whose T. Rowe Price mutual fund accounts total $50,000 or more; accounts electing to receive electronic delivery of account statements, transaction confirmations, prospectuses, and shareholder reports; or accounts of an investor who is a T. Rowe Price Personal Services or Enhanced Personal Services client (enrollment in these programs generally requires T. Rowe Price assets of at least $250,000). This fee is not included in the accompanying table. If you are subject to the fee, keep it in mind when you are estimating the ongoing expenses of investing in the fund and when comparing the expenses of this fund with other funds.
You should also be aware that the expenses shown in the table highlight only your ongoing costs and do not reflect any transaction costs, such as redemption fees or sales loads. Therefore, the second line of the table is useful in comparing ongoing costs only and will not help you determine the relative total costs of owning different funds. To the extent a fund charges transaction costs, however, the total cost of owning that fund is higher.
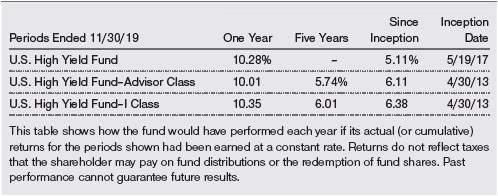
QUARTER-END RETURNS
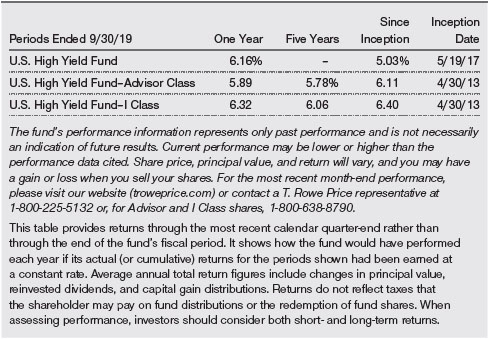
Unaudited
The accompanying notes are an integral part of these financial statements.
Unaudited

The accompanying notes are an integral part of these financial statements.
Unaudited
The accompanying notes are an integral part of these financial statements.
Unaudited
The accompanying notes are an integral part of these financial statements.
Unaudited

The accompanying notes are an integral part of these financial statements.
Unaudited
The accompanying notes are an integral part of these financial statements.
Unaudited
The accompanying notes are an integral part of these financial statements.
Unaudited
| NOTES TO FINANCIAL STATEMENTS |
T. Rowe Price High Yield Fund, Inc. (the corporation) is registered under the Investment Company Act of 1940 (the 1940 Act). The U.S. High Yield Fund (the fund) is a diversified, open-end management investment company established by the corporation. The fund seeks total return, and secondarily, current income. The fund has three classes of shares: the U.S. High Yield Fund (Investor Class), the U.S. High Yield Fund–Advisor Class (Advisor Class), and the U.S. High Yield Fund–I Class (I Class). Advisor Class shares are sold only through various brokers and other financial intermediaries. I Class shares require a $1 million initial investment minimum, although the minimum generally is waived for retirement plans, financial intermediaries, and certain other accounts. The Advisor Class operates under a Board-approved Rule 12b-1 plan pursuant to which the class compensates financial intermediaries for distribution, shareholder servicing, and/or certain administrative services; the Investor and I Classes do not pay Rule 12b-1 fees. Each class has exclusive voting rights on matters related solely to that class; separate voting rights on matters that relate to all classes; and, in all other respects, the same rights and obligations as the other classes.
NOTE 1 - SIGNIFICANT ACCOUNTING POLICIES
Basis of PreparationThe fund is an investment company and follows accounting and reporting guidance in the Financial Accounting Standards Board (FASB)Accounting Standards CodificationTopic 946 (ASC 946). The accompanying financial statements were prepared in accordance with accounting principles generally accepted in the United States of America (GAAP), including, but not limited to, ASC 946. GAAP requires the use of estimates made by management. Management believes that estimates and valuations are appropriate; however, actual results may differ from those estimates, and the valuations reflected in the accompanying financial statements may differ from the value ultimately realized upon sale or maturity. Certain prior year amounts in the accompanying financial statements and financial highlights have been restated to conform to current year presentation.
Investment Transactions, Investment Income, and Distributions Investment transactions are accounted for on the trade date basis. Income and expenses are recorded on the accrual basis. Realized gains and losses are reported on the identified cost basis. Premiums and discounts on debt securities are amortized for financial reporting purposes. Income tax-related interest and penalties, if incurred, are recorded as income tax expense. Dividends received from mutual fund investments are reflected as dividend income; capital gain distributions are reflected as realized gain/loss. Dividend incomeand capital gain distributions are recorded on the ex-dividend date. Non-cash dividends, if any, are recorded at the fair market value of the asset received. Distributions to shareholders are recorded on the ex-dividend date. Income distributions are declared by each class daily and paid monthly. A capital gain distribution may also be declared and paid by the fund annually.
Class Accounting Shareholder servicing, prospectus, and shareholder report expenses incurred by each class are charged directly to the class to which they relate. Expenses common to all classes and investment income are allocated to the classes based upon the relative daily net assets of each class’s settled shares; realized and unrealized gains and losses are allocated based upon the relative daily net assets of each class’s outstanding shares. The Advisor Class pays Rule 12b-1 fees, in an amount not exceeding 0.25% of the class’s average daily net assets.
Redemption FeesPrior to April 1, 2019, a 2% fee was assessed on redemptions of fund shares held for 90 days or less to deter short-term trading and to protect the interests of long-term shareholders. Redemption fees were withheld from proceeds that shareholders received from the sale or exchange of fund shares. The fees were paid to the fund and were recorded as an increase to paid-in capital. The fees may have caused the redemption price per share to differ from the net asset value per share.
New Accounting GuidanceIn March 2017, the FASB issued amended guidance to shorten the amortization period for certain callable debt securities held at a premium. The guidance is effective for fiscal years and interim periods beginning after December 15, 2018. Adoption will have no effect on the fund’s net assets or results of operations.
Indemnification In the normal course of business, the fund may provide indemnification in connection with its officers and directors, service providers, and/or private company investments. The fund’s maximum exposure under these arrangements is unknown; however, the risk of material loss is currently considered to be remote.
NOTE 2 - VALUATION
The fund’s financial instruments are valued and each class’s net asset value (NAV) per share is computed at the close of the New York Stock Exchange (NYSE), normally 4 p.m. ET, each day the NYSE is open for business. However, the NAV per share may be calculated at a time other than the normal close of the NYSE if trading on the NYSE is restricted, if the NYSE closes earlier, or as may be permitted by the SEC.
Fair Value The fund’s financial instruments are reported at fair value, which GAAP defines as the price that would be received to sell an asset or paid to transfer a liability in an orderly transaction between market participants at the measurement date. The T. Rowe Price Valuation Committee (the Valuation Committee) is an internal committee that has been delegated certain responsibilities by the fund’s Board of Directors (the Board) to ensure that financial instruments are appropriately priced at fair value in accordance with GAAP and the 1940 Act. Subject to oversight by the Board, the Valuation Committee develops and oversees pricing-related policies and procedures and approves all fair value determinations. Specifically, the Valuation Committee establishes procedures to value securities; determines pricing techniques, sources, and persons eligible to effect fair value pricing actions; oversees the selection, services, and performance of pricing vendors; oversees valuation-related business continuity practices; and provides guidance on internal controls and valuation-related matters. The Valuation Committee reports to the Board and has representation from legal, portfolio management and trading, operations, risk management, and the fund’s treasurer.
Various valuation techniques and inputs are used to determine the fair value of financial instruments. GAAP establishes the following fair value hierarchy that categorizes the inputs used to measure fair value:
Level 1 – quoted prices (unadjusted) in active markets for identical financial instruments that the fund can access at the reporting date
Level 2 – inputs other than Level 1 quoted prices that are observable, either directly or indirectly (including, but not limited to, quoted prices for similar financial instruments in active markets, quoted prices for identical or similar financial instruments in inactive markets, interest rates and yield curves, implied volatilities, and credit spreads)
Level 3 – unobservable inputs
Observable inputs are developed using market data, such as publicly available information about actual events or transactions, and reflect the assumptions that market participants would use to price the financial instrument. Unobservable inputs are those for which market data are not available and are developed using the best information available about the assumptions that market participants would use to price the financial instrument. GAAP requires valuation techniques to maximize the use of relevant observable inputs and minimize the use of unobservable inputs. When multiple inputs are used to derive fair value, the financial instrument is assigned to the level within the fair value hierarchy based on the lowest-level input that is significant to the fair value of the financial instrument. Input levels are not necessarily an indication of the risk or liquidity associated with financial instruments at that level but rather the degree of judgment used in determining those values.
Valuation Techniques Debt securities generally are traded in the over-the-counter (OTC) market and are valued at prices furnished by independent pricing services or by broker dealers who make markets in such securities. When valuing securities, the independent pricing services consider the yield or price of bonds of comparable quality, coupon, maturity, and type, as well as prices quoted by dealers who make markets in such securities. Generally, debt securities are categorized in Level 2 of the fair value hierarchy; however, to the extent the valuations include significant unobservable inputs, the securities would be categorized in Level 3.
Equity securities listed or regularly traded on a securities exchange or in the over-the-counter (OTC) market are valued at the last quoted sale price or, for certain markets, the official closing price at the time the valuations are made. OTC Bulletin Board securities are valued at the mean of the closing bid and asked prices. A security that is listed or traded on more than one exchange is valued at the quotation on the exchange determined to be the primary market for such security. Listed securities not traded on a particular day are valued at the mean of the closing bid and asked prices. Actively traded equity securities listed on a domestic exchange generally are categorized in Level 1 of the fair value hierarchy. OTC Bulletin Board securities, certain preferred securities, and equity securities traded in inactive markets generally are categorized in Level 2 of the fair value hierarchy.
Investments in mutual funds are valued at the mutual fund’s closing NAV per share on the day of valuation and are categorized in Level 1 of the fair value hierarchy. Assets and liabilities other than financial instruments, including short-term receivables and payables, are carried at cost, or estimated realizable value, if less, which approximates fair value.
Thinly traded financial instruments and those for which the above valuation procedures are inappropriate or are deemed not to reflect fair value are stated at fair value as determined in good faith by the Valuation Committee. The objective of any fair value pricing determination is to arrive at a price that could reasonably be expected from a current sale. Financial instruments fair valued by the Valuation Committee are primarily private placements, restricted securities, warrants, rights, and other securities that are not publicly traded.
Subject to oversight by the Board, the Valuation Committee regularly makes good faith judgments to establish and adjust the fair valuations of certain securities as events occur and circumstances warrant. For instance, in determining the fair value of troubled or thinly traded debt instruments, the Valuation Committee considers a variety of factors, which may include, but are not limited to, the issuer’s business prospects, its financial standing and performance, recent investment transactions in the issuer, strategicevents affecting the company, market liquidity for the issuer, and general economic conditions and events. In consultation with the investment and pricing teams, the Valuation Committee will determine an appropriate valuation technique based on available information, which may include both observable and unobservable inputs. The Valuation Committee typically will afford greatest weight to actual prices in arm’s length transactions, to the extent they represent orderly transactions between market participants, transaction information can be reliably obtained, and prices are deemed representative of fair value. However, the Valuation Committee may also consider other valuation methods such as a discount or premium from market value of a similar, freely traded security of the same issuer; discounted cash flows; yield to maturity; or some combination. Fair value determinations are reviewed on a regular basis and updated as information becomes available, including actual purchase and sale transactions of the issue. Because any fair value determination involves a significant amount of judgment, there is a degree of subjectivity inherent in such pricing decisions, and fair value prices determined by the Valuation Committee could differ from those of other market participants. Depending on the relative significance of unobservable inputs, including the valuation technique(s) used, fair valued securities may be categorized in Level 2 or 3 of the fair value hierarchy.
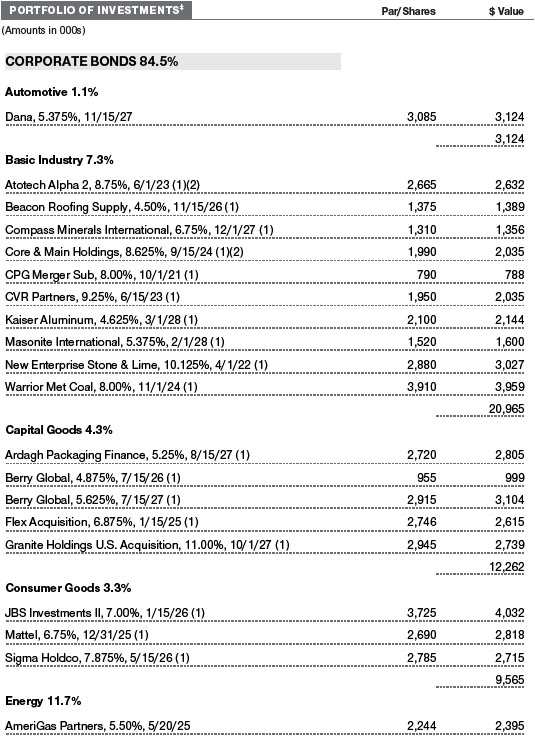
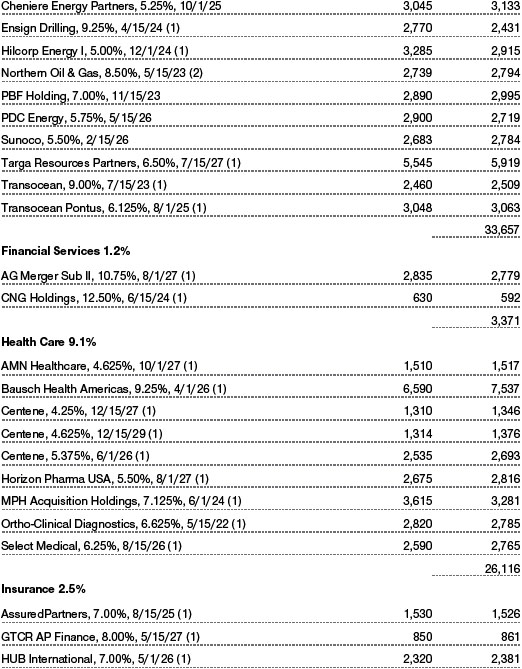
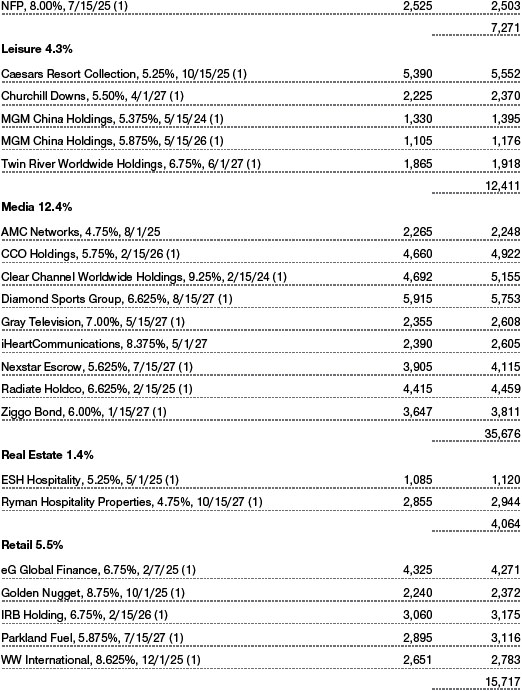
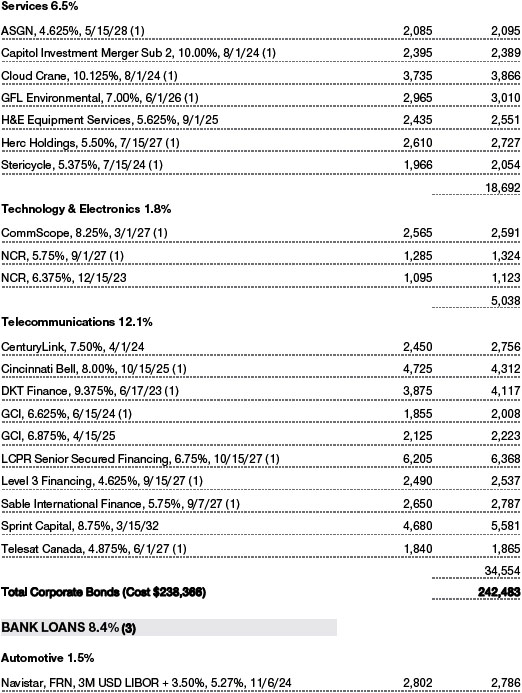
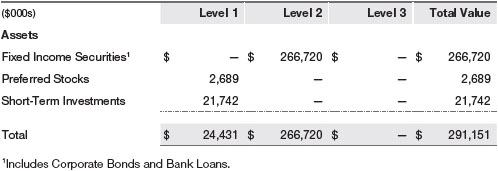
Valuation InputsThe following table summarizes the fund’s financial instruments, based on the inputs used to determine their fair values on November 30, 2019 (for further detail by category, please refer to the accompanying Portfolio of Investments):
NOTE 3 - OTHER INVESTMENT TRANSACTIONS
Consistent with its investment objective, the fund engages in the following practices to manage exposure to certain risks and/or to enhance performance. The investment objective, policies, program, and risk factors of the fund are described more fully in the fund’s prospectus and Statement of Additional Information.
Noninvestment-Grade DebtThe fund may invest, either directly or through its investment in other T. Rowe Price funds, in noninvestment-grade debt, including “high yield” or “junk” bonds or leveraged loans. Noninvestment-grade debt issuers are more likely to suffer an adverse change in financial condition that would result in the inability to meet a financial obligation. The noninvestment-grade debt market may experience sudden and sharp price swings due to a variety of factors that may decrease the ability of issuers to make principal and interest payments and adversely affect the liquidity or value, or both, of such securities. Accordingly, securities issued by such companies carry a higher risk of default and should be considered speculative.
Restricted SecuritiesThe fund may invest in securities that are subject to legal or contractual restrictions on resale. Prompt sale of such securities at an acceptable price may be difficult and may involve substantial delays and additional costs.
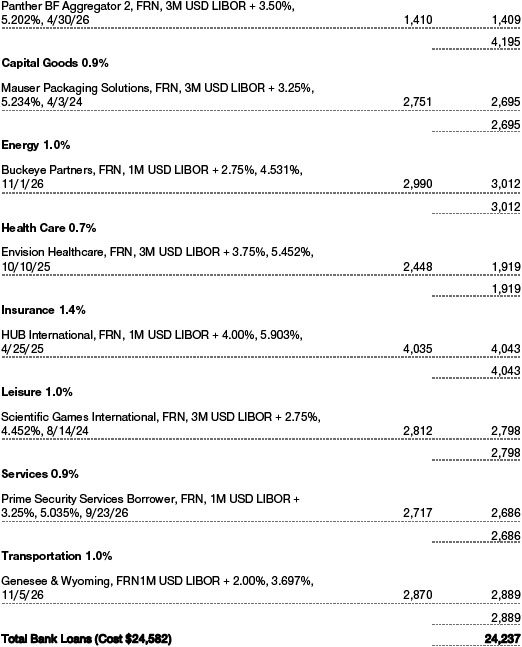
Bank LoansThe fund may invest in bank loans, which represent an interest in amounts owed by a borrower to a syndicate of lenders. Bank loans are generally noninvestment grade and often involve borrowers whose financial condition is highly leveraged. Bank loans may be in the form of either assignments or participations. A loan assignment transfers all legal, beneficial, and economic rights to the buyer, and transfer typically requires consent of both the borrower and agent. In contrast, a loan participation generally entitles the buyer to receive the cash flows from principal, interest, and any fee payments on a portion of a loan; however, the seller continues to hold legal title to that portion of the loan. As a result, the buyer of a loan participation generally has no direct recourse against the borrower and is exposed to credit risk of both the borrower and seller of the participation. Bank loans often have extended settlement periods, generally may be repaid at any time at the option of the borrower, and may require additional principal to be funded at the borrowers’ discretion at a later date (e.g. unfunded commitments and revolving debt instruments). Until settlement, the fund maintains liquid assets sufficient to settle its unfunded loan commitments. The fund reflects both the funded portion of a bank loan as well as its unfunded commitment in the Portfolio of Investments. However, if a credit agreement provides no initial funding of a tranche and funding of the full commitment at a future date(s) is at the borrower’s discretion and considered uncertain, a loan is reflected in the Portfolio of Investments only if, and only to the extent that, the fund has actually settled a funding commitment.
OtherPurchases and sales of portfolio securities other than short-term securities aggregated $218,177,000 and $156,677,000, respectively, for the six months ended November 30, 2019.
NOTE 4 - FEDERAL INCOME TAXES
No provision for federal income taxes is required since the fund intends to continue to qualify as a regulated investment company under Subchapter M of the Internal Revenue Code and distribute to shareholders all of its taxable income and gains. Distributions determined in accordance with federal income tax regulations may differ in amount or character from net investment income and realized gains for financial reporting purposes. Financial reporting records are adjusted for permanent book/tax differences to reflect tax character but are not adjusted for temporary differences. The amount and character of tax-basis distributions and composition of net assets are finalized at fiscal year-end; accordingly, tax-basis balances have not been determined as of the date of this report.
The fund intends to retain realized gains to the extent of available capital loss carryforwards. Net realized capital losses may be carried forward indefinitely to offset future realized capital gains. As of May 31, 2019, the fund had $4,803,000 of available capital loss carryforwards.
At November 30, 2019, the cost of investments for federal income tax purposes was $287,428,000. Net unrealized gain aggregated $3,723,000 at period-end, of which $6,021,000 related to appreciated investments and $2,298,000 related to depreciated investments.
NOTE 5 - RELATED PARTY TRANSACTIONS
The fund is managed by T. Rowe Price Associates, Inc. (Price Associates), a wholly owned subsidiary of T. Rowe Price Group, Inc. (Price Group). The investment management agreement between the fund and Price Associates provides for an annual investment management fee, which is computed daily and paid monthly. The fee consists of an individual fund fee, equal to 0.30% of the fund’s average daily net assets, and a group fee. The group fee rate is calculated based on the combined net assets of certain mutual funds sponsored by Price Associates (the group) applied to a graduated fee schedule, with rates ranging from 0.48% for the first $1 billion of assets to 0.265% for assets in excess of $650 billion. The fund’s group fee is determined by applying the group fee rate to the fund’s average daily net assets. At November 30, 2019, the effective annual group fee rate was 0.29%.
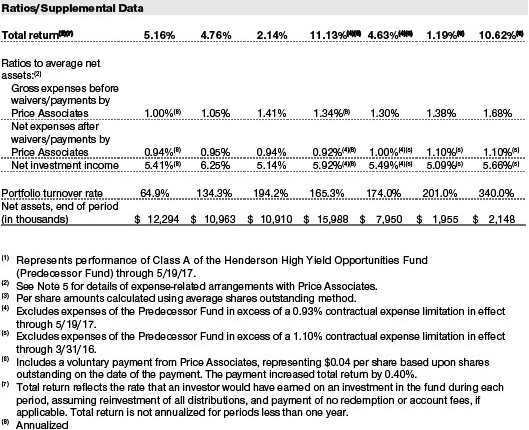
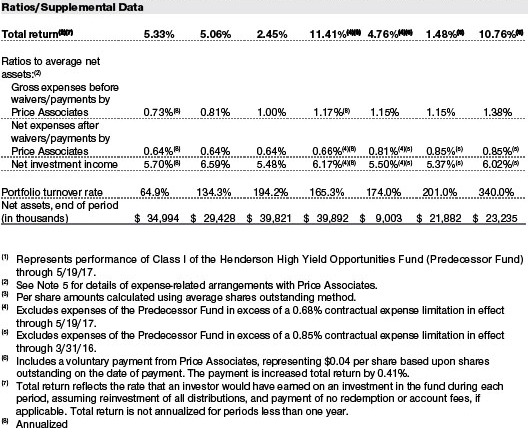
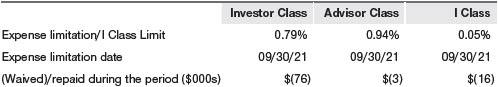
The Investor Class and Advisor Class are each subject to a contractual expense limitation through the expense limitation date indicated in the table below. During the limitation period, Price Associates is required to waive its management fee or pay any expenses (excluding interest; expenses related to borrowings, taxes, and brokerage; and othernon-recurring expenses permitted by the investment management agreement) that would otherwise cause the class’s ratio of annualized total expenses to average net assets (net expense ratio) to exceed its expense limitation. Each class is required to repay Price Associates for expenses previously waived/paid to the extent the class’s net assets grow or expenses decline sufficiently to allow repayment without causing the class’s net expense ratio (after the repayment is taken into account) to exceed the lesser of: (1) the expense limitation in place at the time such amounts were waived; or (2) the class’s current expense limitation. However, no repayment will be made more than three years after the date of a payment or waiver.
The I Class is also subject to an operating expense limitation (I Class Limit) pursuant to which Price Associates is contractually required to pay all operating expenses of the I Class, excluding management fees; interest; expenses related to borrowings, taxes, and brokerage; and other non-recurring expenses permitted by the investment management agreement, to the extent such operating expenses, on an annualized basis, exceed the I Class Limit. This agreement will continue through the expense limitation date indicated in the table below, and may be renewed, revised, or revoked only with approval of the fund’s Board. The I Class is required to repay Price Associates for expenses previously paid to the extent the class’s net assets grow or expenses decline sufficiently to allow repayment without causing the class’s operating expenses (after the repayment is taken into account) to exceed the lesser of: (1) the I Class Limit in place at the time such amounts were paid; or (2) the current I Class Limit. However, no repayment will be made more than three years after the date of a payment or waiver.
Pursuant to these agreements, expenses were waived/paid by and/or repaid to Price Associates during the six months ended November 30, 2019 as indicated in the table below. Including these amounts, expenses previously waived/paid by Price Associates in the amount of $70,000 remain subject to repayment by the fund at November 30, 2019. Any repayment of expenses previously waived/paid by Price Associates during the period would be included in the net investment income and expense ratios presented on the accompanying Financial Highlights.
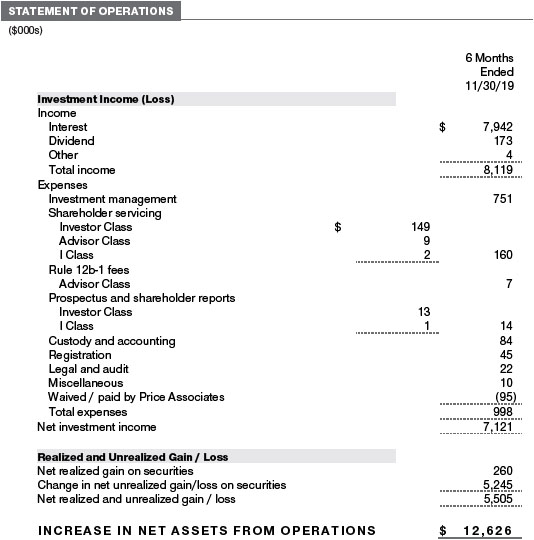
In addition, the fund has entered into service agreements with Price Associates and a wholly owned subsidiary of Price Associates, each an affiliate of the fund (collectively, Price). Price Associates provides certain accounting and administrative services to thefund. T. Rowe Price Services, Inc. provides shareholder and administrative services in its capacity as the fund’s transfer and dividend-disbursing agent. T. Rowe Price Retirement Plan Services, Inc. provides subaccounting and recordkeeping services for certain retirement accounts invested in the Investor Class and Advisor Class. For the six months ended November 30, 2019, expenses incurred pursuant to these service agreements were $37,000 for Price Associates; $104,000 for T. Rowe Price Services, Inc.; and less than $1,000 for T. Rowe Retirement Plan Services. All amounts due to and due from Price, exclusive of investment management fees payable, are presented net on the accompanying Statement of Assets and Liabilities.
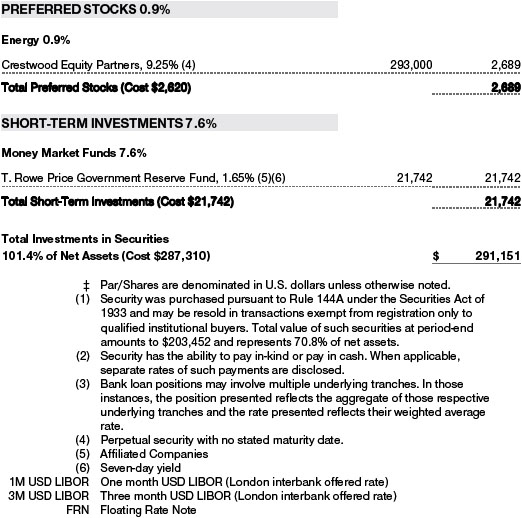
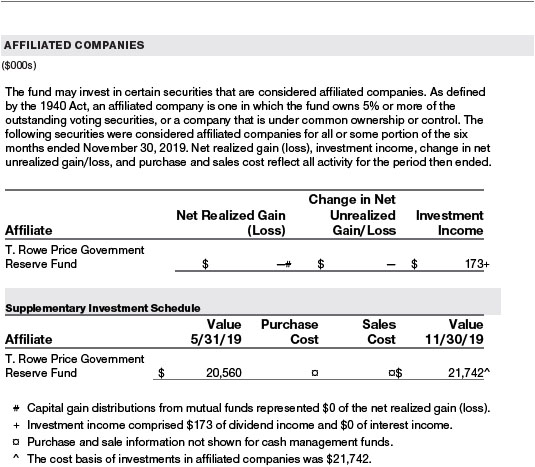
The fund may invest its cash reserves in certain open-end management investment companies managed by Price Associates and considered affiliates of the fund: the T. Rowe Price Government Reserve Fund or the T. Rowe Price Treasury Reserve Fund, organized as money market funds, or the T. Rowe Price Short-Term Fund, a short-term bond fund (collectively, the Price Reserve Funds). The Price Reserve Funds are offered as short-term investment options to mutual funds, trusts, and other accounts managed by Price Associates or its affiliates and are not available for direct purchase by members of the public. Cash collateral from securities lending is invested in the T. Rowe Price Short-Term Fund. The Price Reserve Funds pay no investment management fees.
The fund may participate in securities purchase and sale transactions with other funds or accounts advised by Price Associates (cross trades), in accordance with procedures adopted by the fund’s Board and Securities and Exchange Commission rules, which require, among other things, that such purchase and sale cross trades be effected at the independent current market price of the security. During the six months ended November 30, 2019, the fund had no purchases or sales cross trades with other funds or accounts advised by Price Associates.
INFORMATION ON PROXY VOTING POLICIES, PROCEDURES, AND RECORDS
A description of the policies and procedures used by T. Rowe Price funds and portfolios to determine how to vote proxies relating to portfolio securities is available in each fund’s Statement of Additional Information. You may request this document by calling 1-800-225-5132 or by accessing the SEC’s website, sec.gov.
The description of our proxy voting policies and procedures is also available on our corporate website. To access it, please visit the following Web page:
https://www.troweprice.com/corporate/en/utility/policies.html
Scroll down to the section near the bottom of the page that says, “Proxy Voting Policies.” Click on the Proxy Voting Policies link in the shaded box.
Each fund’s most recent annual proxy voting record is available on our website and through the SEC’s website. To access it through T. Rowe Price, visit the website location shown above, and scroll down to the section near the bottom of the page that says, “Proxy Voting Records.” Click on the Proxy Voting Records link in the shaded box.
HOW TO OBTAIN QUARTERLY PORTFOLIO HOLDINGS
Effective for reporting periods on or after March 1, 2019, a fund, except a money market fund, files a complete schedule of portfolio holdings with the Securities and Exchange Commission (SEC) for the first and third quarters of each fiscal year as an exhibit to its reports on Form N-PORT. Prior to March 1, 2019, a fund, including a money market fund, filed a complete schedule of portfolio holdings with the SEC for the first and third quarters of each fiscal year on Form N-Q. A money market fund files detailed month-end portfolio holdings information on Form N-MFP with the SEC each month and posts a complete schedule of portfolio holdings on its website (troweprice.com) as of each month-end for the previous six months. A fund’s Forms N-PORT, N-MFP, and N-Q are available electronically on the SEC’s website (sec.gov).
Item 1. (b) Notice pursuant to Rule 30e-3.
Not applicable.
Item 2. Code of Ethics.
A code of ethics, as defined in Item 2 of Form N-CSR, applicable to its principal executive officer, principal financial officer, principal accounting officer or controller, or persons performing similar functions is filed as an exhibit to the registrant’s annual Form N-CSR. No substantive amendments were approved or waivers were granted to this code of ethics during the registrant’s most recent fiscal half-year.
Item 3. Audit Committee Financial Expert.
Disclosure required in registrant’s annual Form N-CSR.
Item 4. Principal Accountant Fees and Services.
Disclosure required in registrant’s annual Form N-CSR.
Item 5. Audit Committee of Listed Registrants.
Not applicable.
Item 6. Investments.
(a) Not applicable. The complete schedule of investments is included in Item 1 of this Form N-CSR.
(b) Not applicable.
Item 7. Disclosure of Proxy Voting Policies and Procedures for Closed-End Management Investment Companies.
Not applicable.
Item 8. Portfolio Managers of Closed-End Management Investment Companies.
Not applicable.
Item 9. Purchases of Equity Securities by Closed-End Management Investment Company and Affiliated Purchasers.
Not applicable.
Item 10. Submission of Matters to a Vote of Security Holders.
Not applicable.
Item 11. Controls and Procedures.
(a) The registrant’s principal executive officer and principal financial officer have evaluated the registrant’s disclosure controls and procedures within 90 days of this filing and have concluded that the registrant’s disclosure controls and procedures were effective, as of that date, in ensuring that information required to be disclosed by the registrant in this Form N-CSR was recorded, processed, summarized, and reported timely.
(b) The registrant’s principal executive officer and principal financial officer are aware of no change in the registrant’s internal control over financial reporting that occurred during the period covered by this report that has materially affected, or is reasonably likely to materially affect, the registrant’s internal control over financial reporting.
Item 12. Disclosure of Securities Lending Activities for Closed-End Management Investment Companies.
Not applicable.
Item 13. Exhibits.
(a)(1) The registrant’s code of ethics pursuant to Item 2 of Form N-CSR is filed with the registrant’s annual Form N-CSR.
(2) Separate certifications by the registrant's principal executive officer and principal financial officer, pursuant to Section 302 of the Sarbanes-Oxley Act of 2002 and required by Rule 30a-2(a) under the Investment Company Act of 1940, are attached.
(3) Written solicitation to repurchase securities issued by closed-end companies: not applicable.
(b) A certification by the registrant's principal executive officer and principal financial officer, pursuant to Section 906 of the Sarbanes-Oxley Act of 2002 and required by Rule 30a-2(b) under the Investment Company Act of 1940, is attached.
SIGNATURES
Pursuant to the requirements of the Securities Exchange Act of 1934 and the Investment Company Act of 1940, the registrant has duly caused this report to be signed on its behalf by the undersigned, thereunto duly authorized.
T. Rowe Price High Yield Fund, Inc.
| By | | /s/ David Oestreicher |
| | | David Oestreicher |
| | | Principal Executive Officer |
| |
| Date | | January 16, 2020 | | | | |
Pursuant to the requirements of the Securities Exchange Act of 1934 and the Investment Company Act of 1940, this report has been signed below by the following persons on behalf of the registrant and in the capacities and on the dates indicated.
| By | | /s/ David Oestreicher |
| | | David Oestreicher |
| | | Principal Executive Officer |
| |
| Date | | January 16, 2020 | | | | |
| |
| |
| By | | /s/ Catherine D. Mathews |
| | | Catherine D. Mathews |
| | | Principal Financial Officer |
| |
| Date | | January 16, 2020 | | | | |